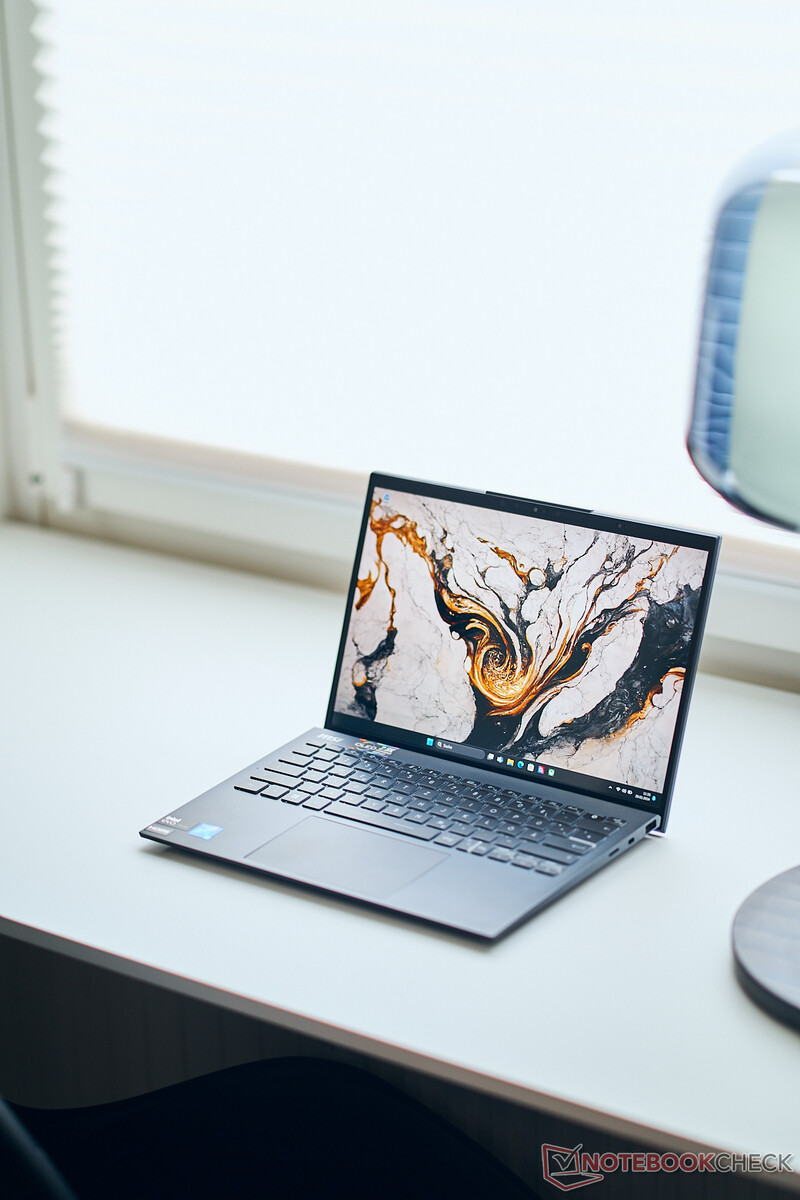
Test du MSI Prestige 13 AI Evo : Core Ultra 7 et OLED pour un poids inférieur à 1 kg
Le MSI Prestige 13 AI Evo est un subnotebook compact pesant moins d'un kilogramme. Le nouveau modèle 2024 a reçu un processeur Meteor Lake d'Intel ainsi qu'un module Wi-Fi 7. Notre appareil de test est la variante avec le Core Ultra 7 155H, Intel Arc Graphics, 32 Go de RAM, un SSD de 1 To et un écran OLED 2,8K pour environ 1 300 dollars.
Comparaison avec les concurrents potentiels
Note | Date | Modèle | Poids | Épaisseur | Taille | Résolution | Prix |
|---|---|---|---|---|---|---|---|
| 86.6 % v7 (old) | 03/24 | MSI Prestige 13 AI Evo Ultra 7 155H, Arc 8-Core | 967 g | 16.9 mm | 13.30" | 2880x1800 | |
| 89.5 % v7 (old) | 08/23 | Lenovo ThinkPad X1 Nano Gen 3 i7-1360P, Iris Xe G7 96EUs | 989 g | 14.8 mm | 13.00" | 2160x1350 | |
| 90.2 % v7 (old) | 10/23 | Dell Latitude 13 7340 i5-1345U i5-1345U, Iris Xe G7 80EUs | 1.1 kg | 18.2 mm | 13.30" | 1920x1200 | |
| 91.9 % v7 (old) | 07/23 | HP Dragonfly G4 i7-1365U, Iris Xe G7 96EUs | 1.1 kg | 16.3 mm | 13.50" | 1920x1280 | |
| 85.4 % v7 (old) | 05/23 | Asus ZenBook S13 OLED UX5304 i7-1355U, Iris Xe G7 96EUs | 1 kg | 11.8 mm | 13.30" | 2880x1800 |
Boîtier - Le Prestige 13 avec un boîtier en alliage de magnésium
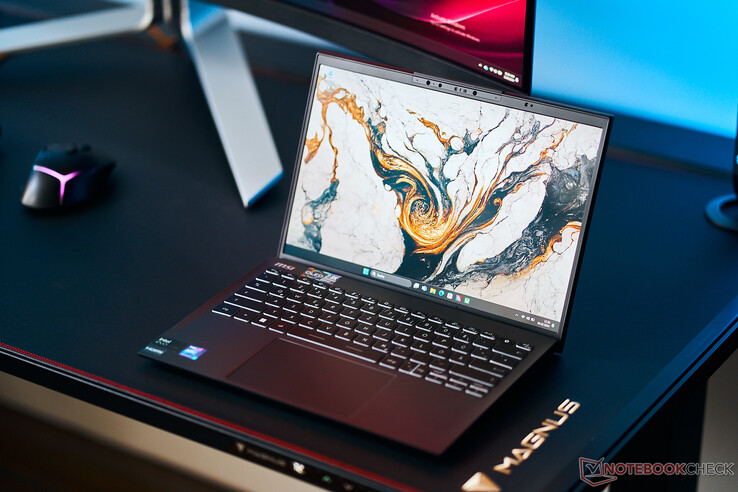
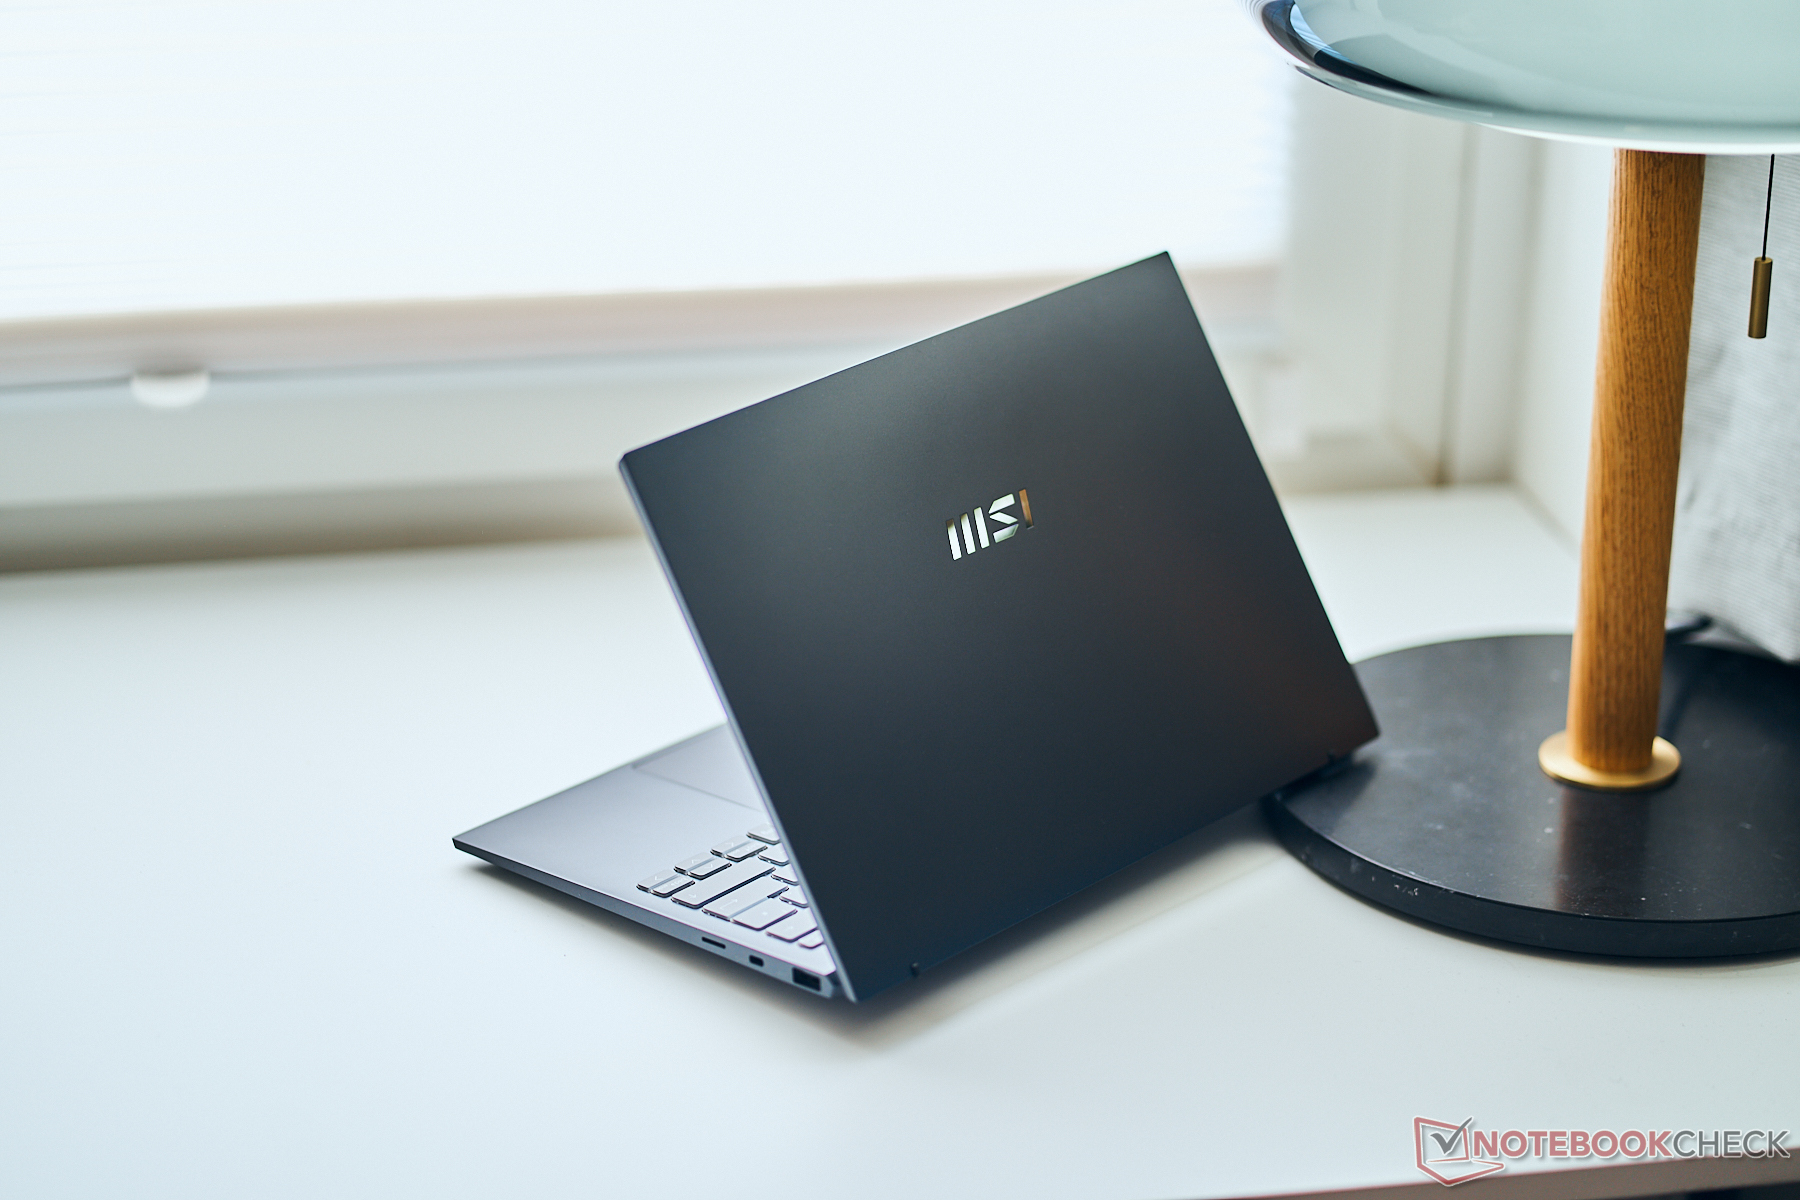
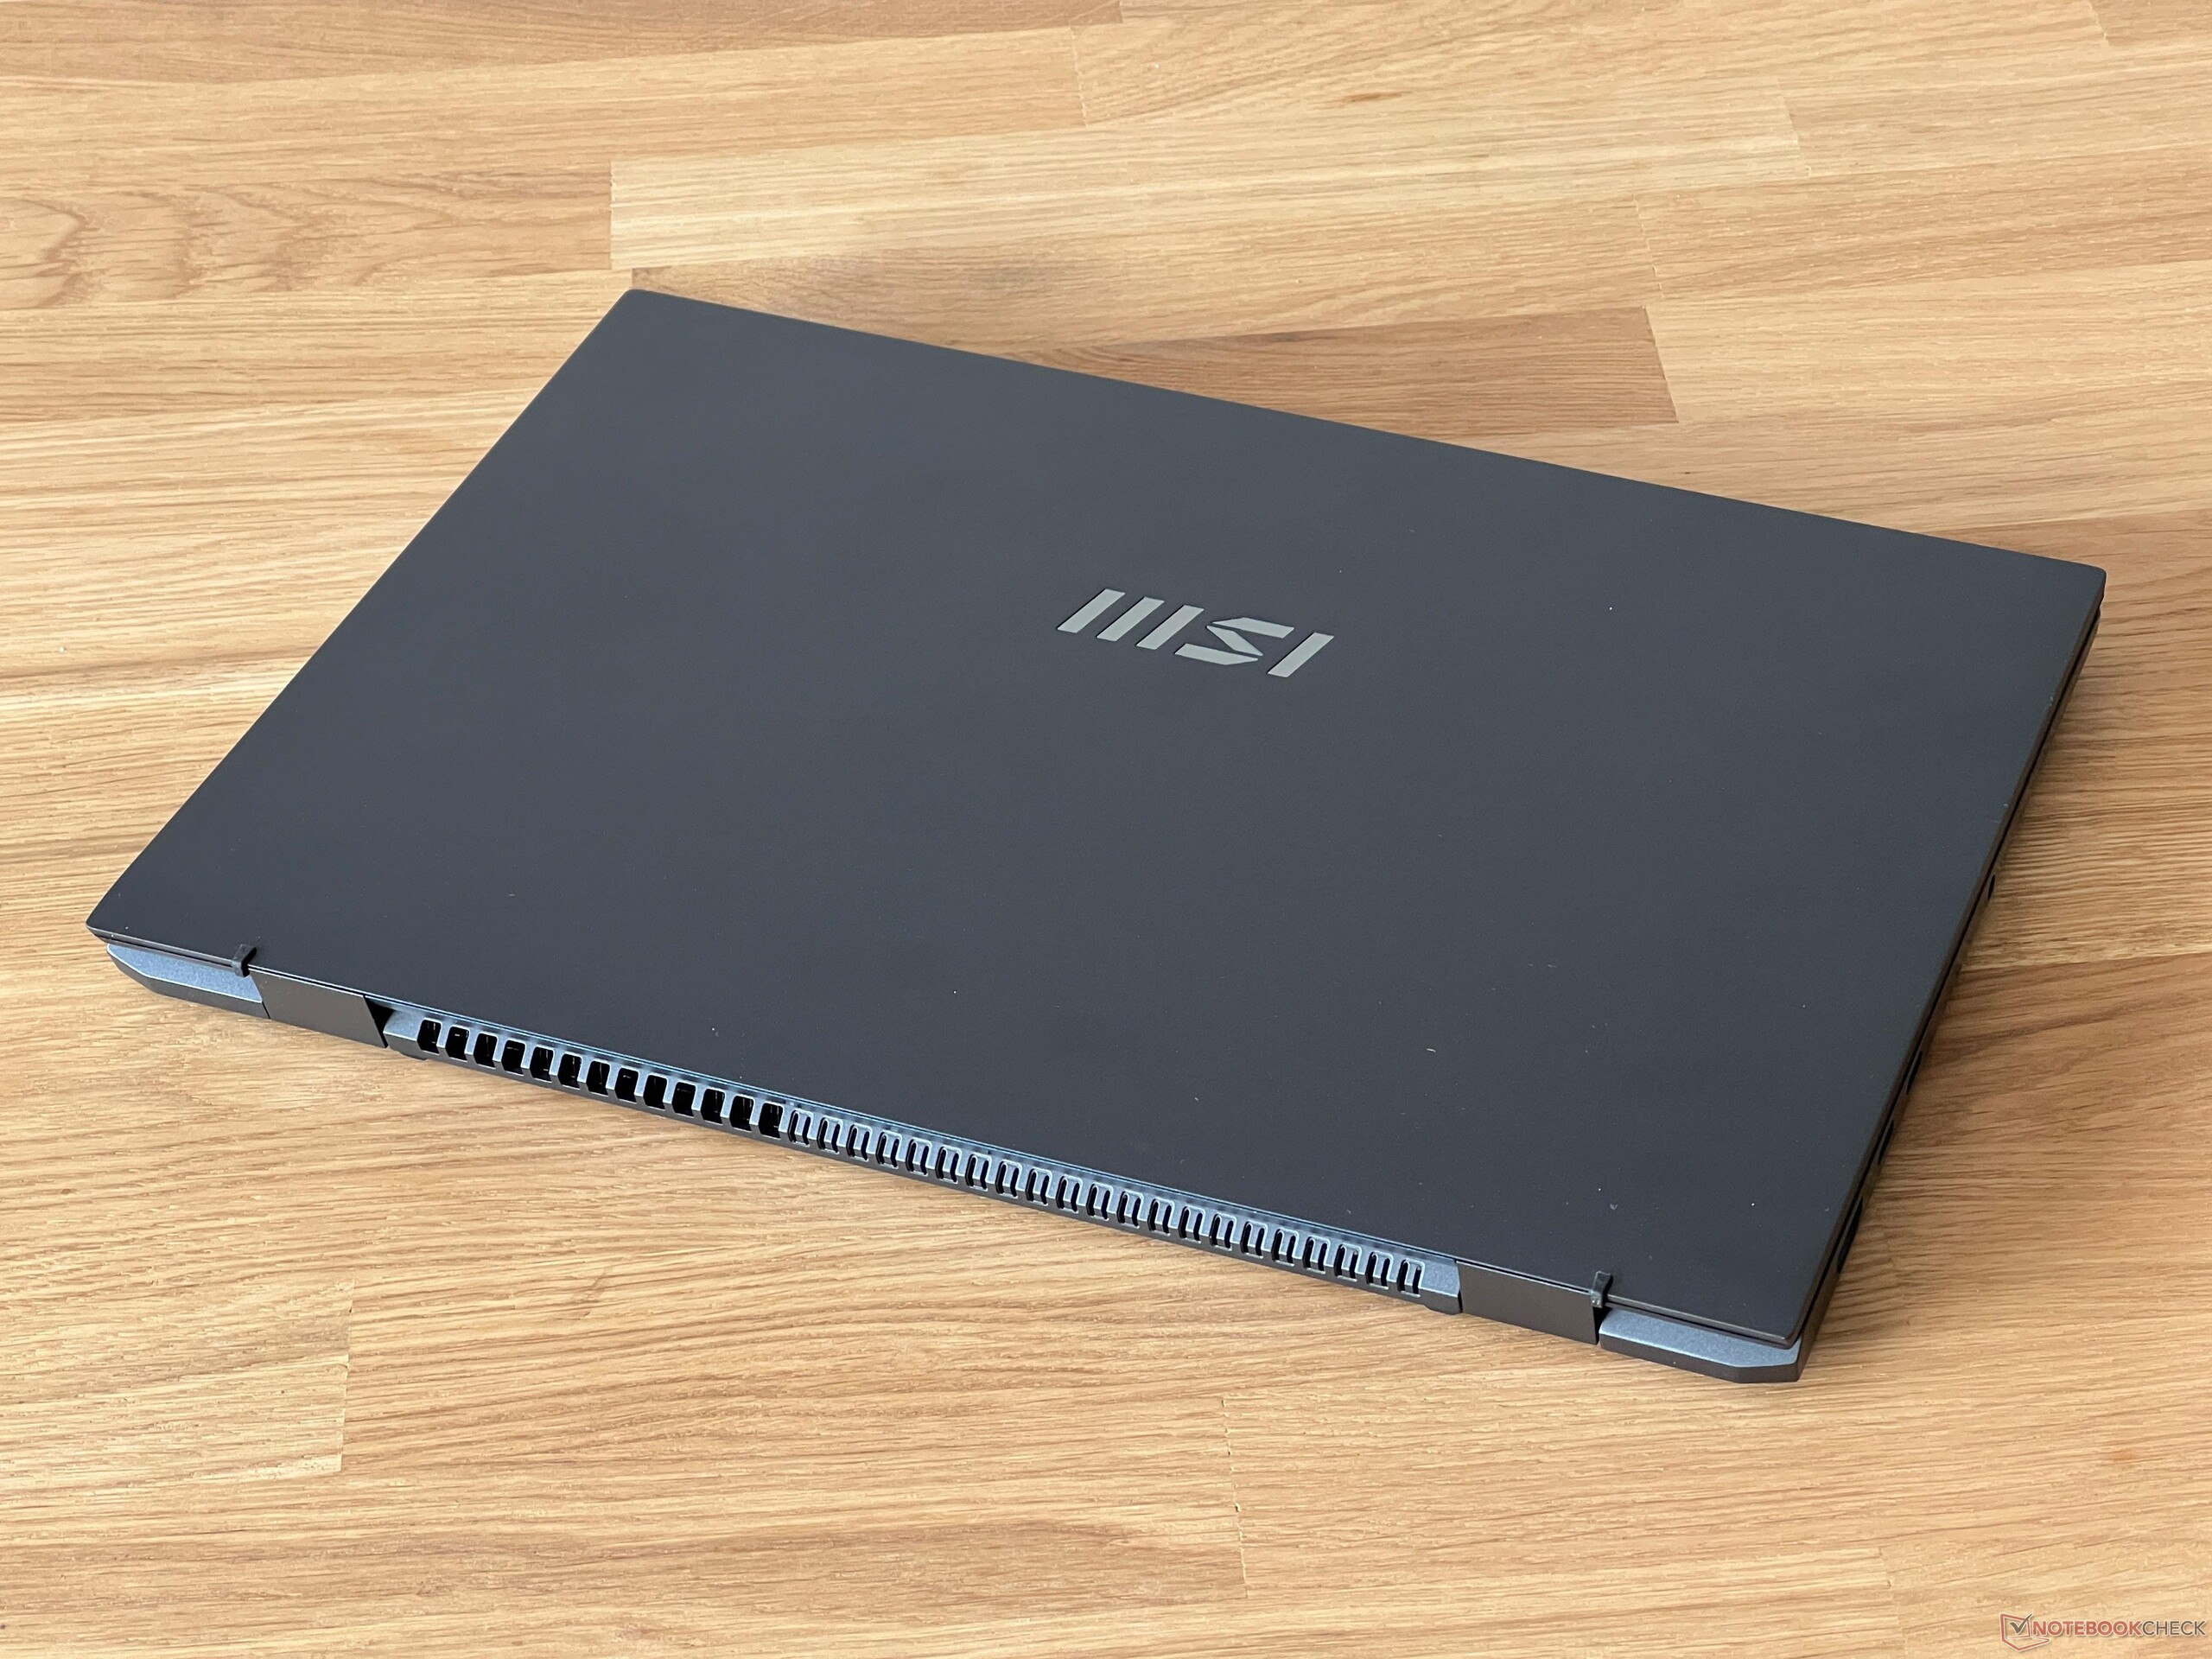
MSI propose le Prestige 13 soit en gris foncé (Stellar Gray) - le même que notre appareil de test - soit en blanc (Pure White). Les deux versions utilisent un alliage de magnésium et d'aluminium, ce qui contribue probablement aussi au faible poids de l'appareil (976 grammes). Lorsque vous entrez en contact avec l'ordinateur portable, vous êtes immédiatement surpris par sa légèreté. Les surfaces sont de haute qualité et même sur le modèle sombre, les traces d'empreintes digitales ne semblent pas être un problème. A part le logo MSI, la Prestige 13 ne présente pas d'autres éléments de design. Les bords sont assez fins des deux côtés, mais le cadre le long du bord supérieur est assez large en raison de la webcam installée.
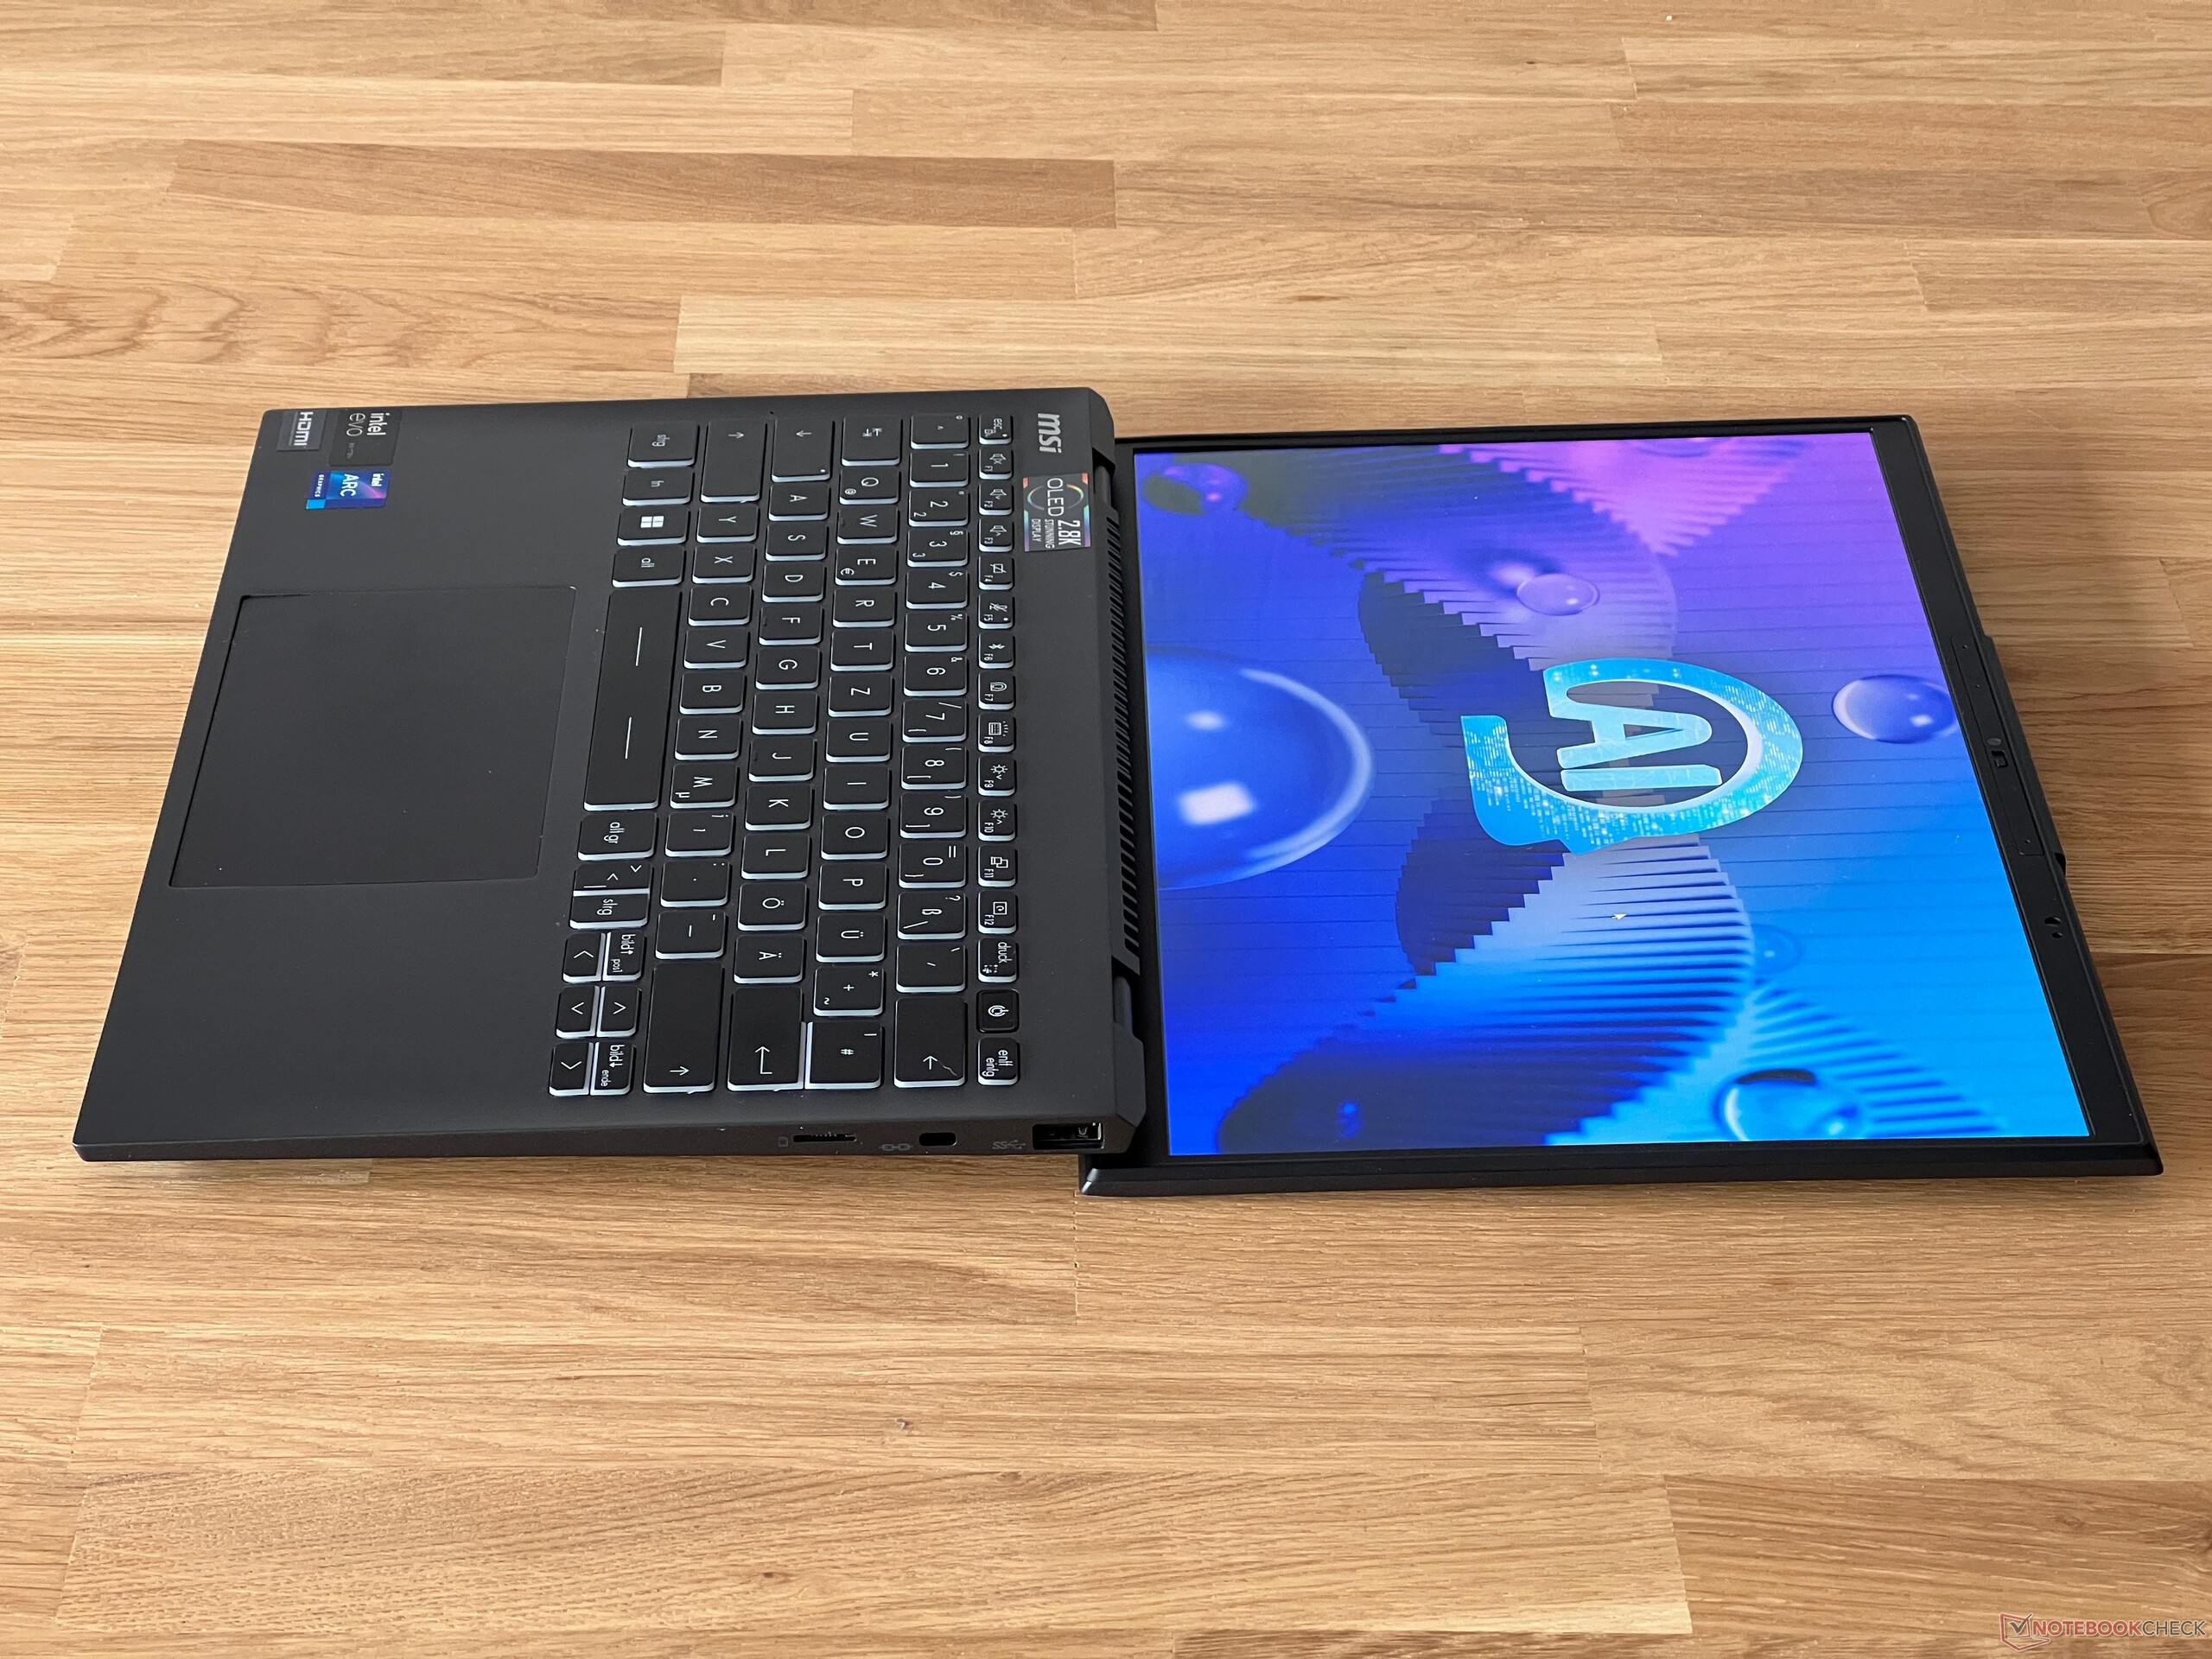
Il est bien construit, mais il souffre de quelques problèmes de stabilité. La partie arrière de l'unité de base se soulève légèrement lorsque vous ouvrez le couvercle et la partie centrale du clavier peut se déformer vers l'intérieur en exerçant une légère pression. Toutefois, lorsque vous tapez normalement, cela ne devrait pas poser trop de problèmes. Si vous tordez légèrement l'unité de base, l'ordinateur portable émet des grincements perceptibles. Les charnières de l'écran sont très serrées et empêchent efficacement le couvercle d'osciller, ce qui le rend juste un peu difficile à ouvrir d'une seule main. L'angle d'ouverture maximal est de 180 degrés et le couvercle lui-même est très stable.
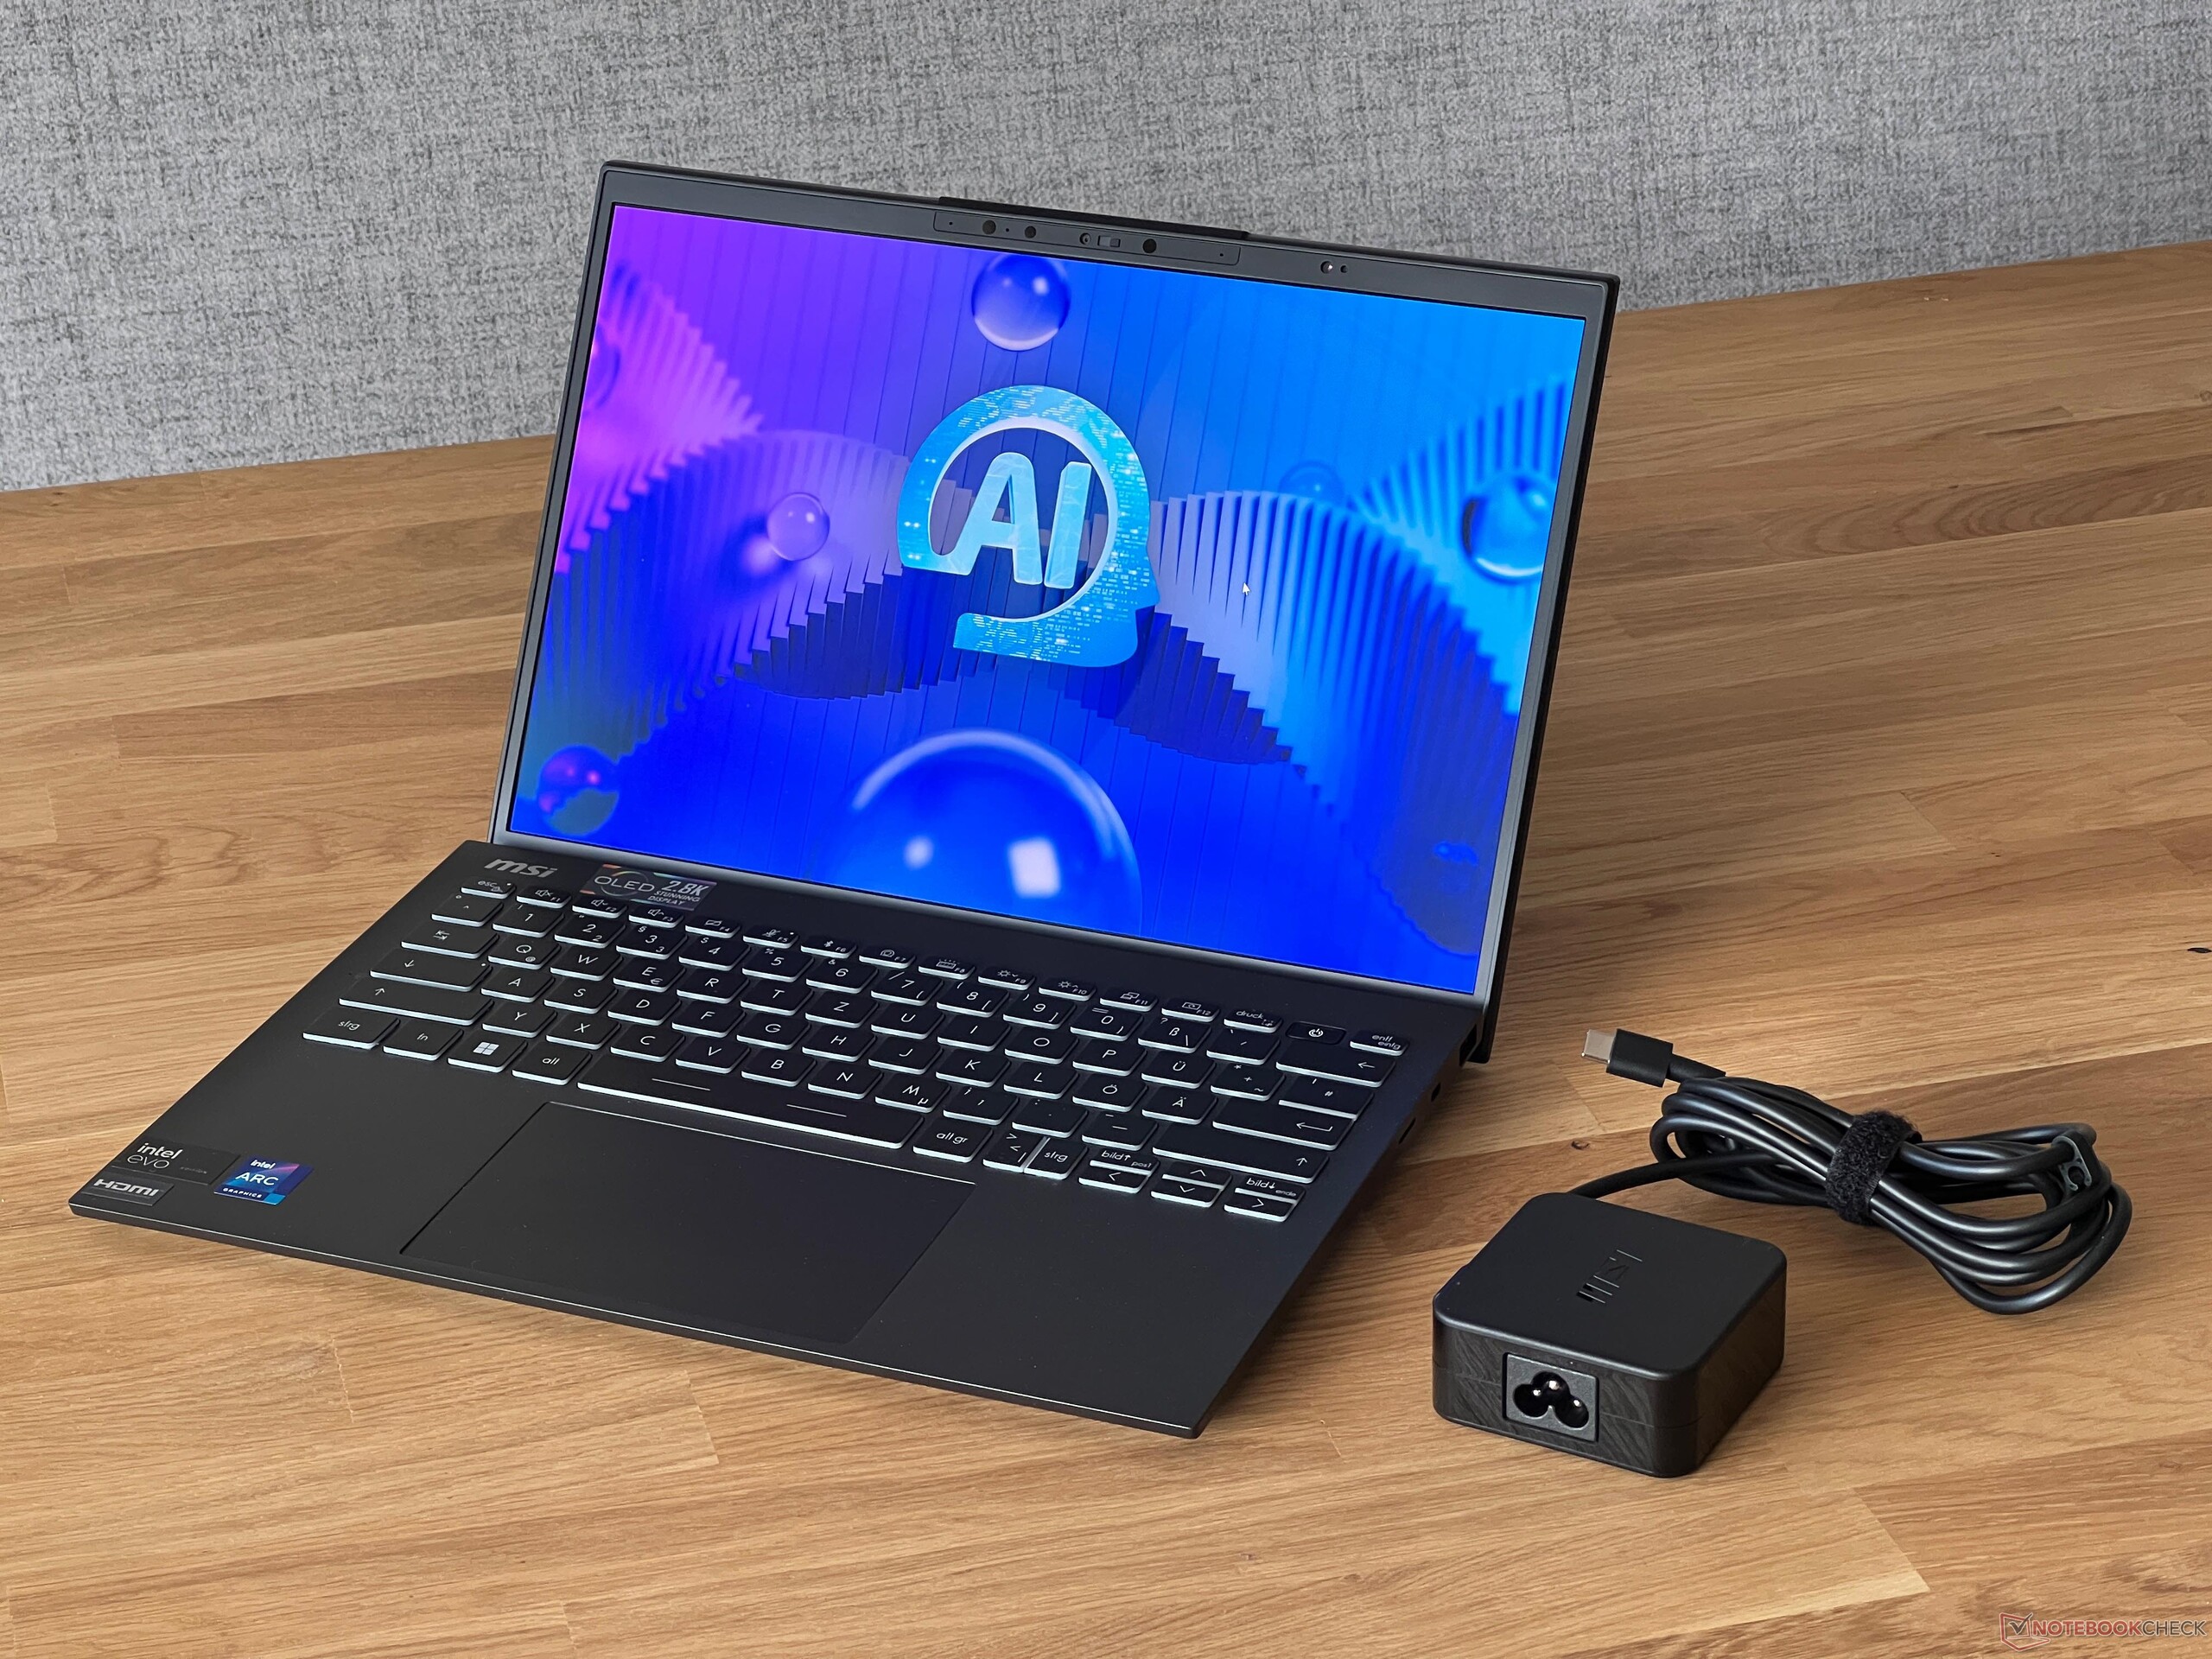
Avec moins d'un kilogramme, la Prestige 13 est extrêmement légère, mais on peut en dire autant des autres appareils de comparaison. En ce qui concerne l'encombrement, les concurrents ne prennent pas beaucoup de place non plus. La Prestige se range facilement dans n'importe quel sac. MSI utilise un bloc d'alimentation compact de 65 watts, mais il ne s'agit pas d'un bloc d'alimentation enfichable, ce qui explique son poids de 341 grammes.
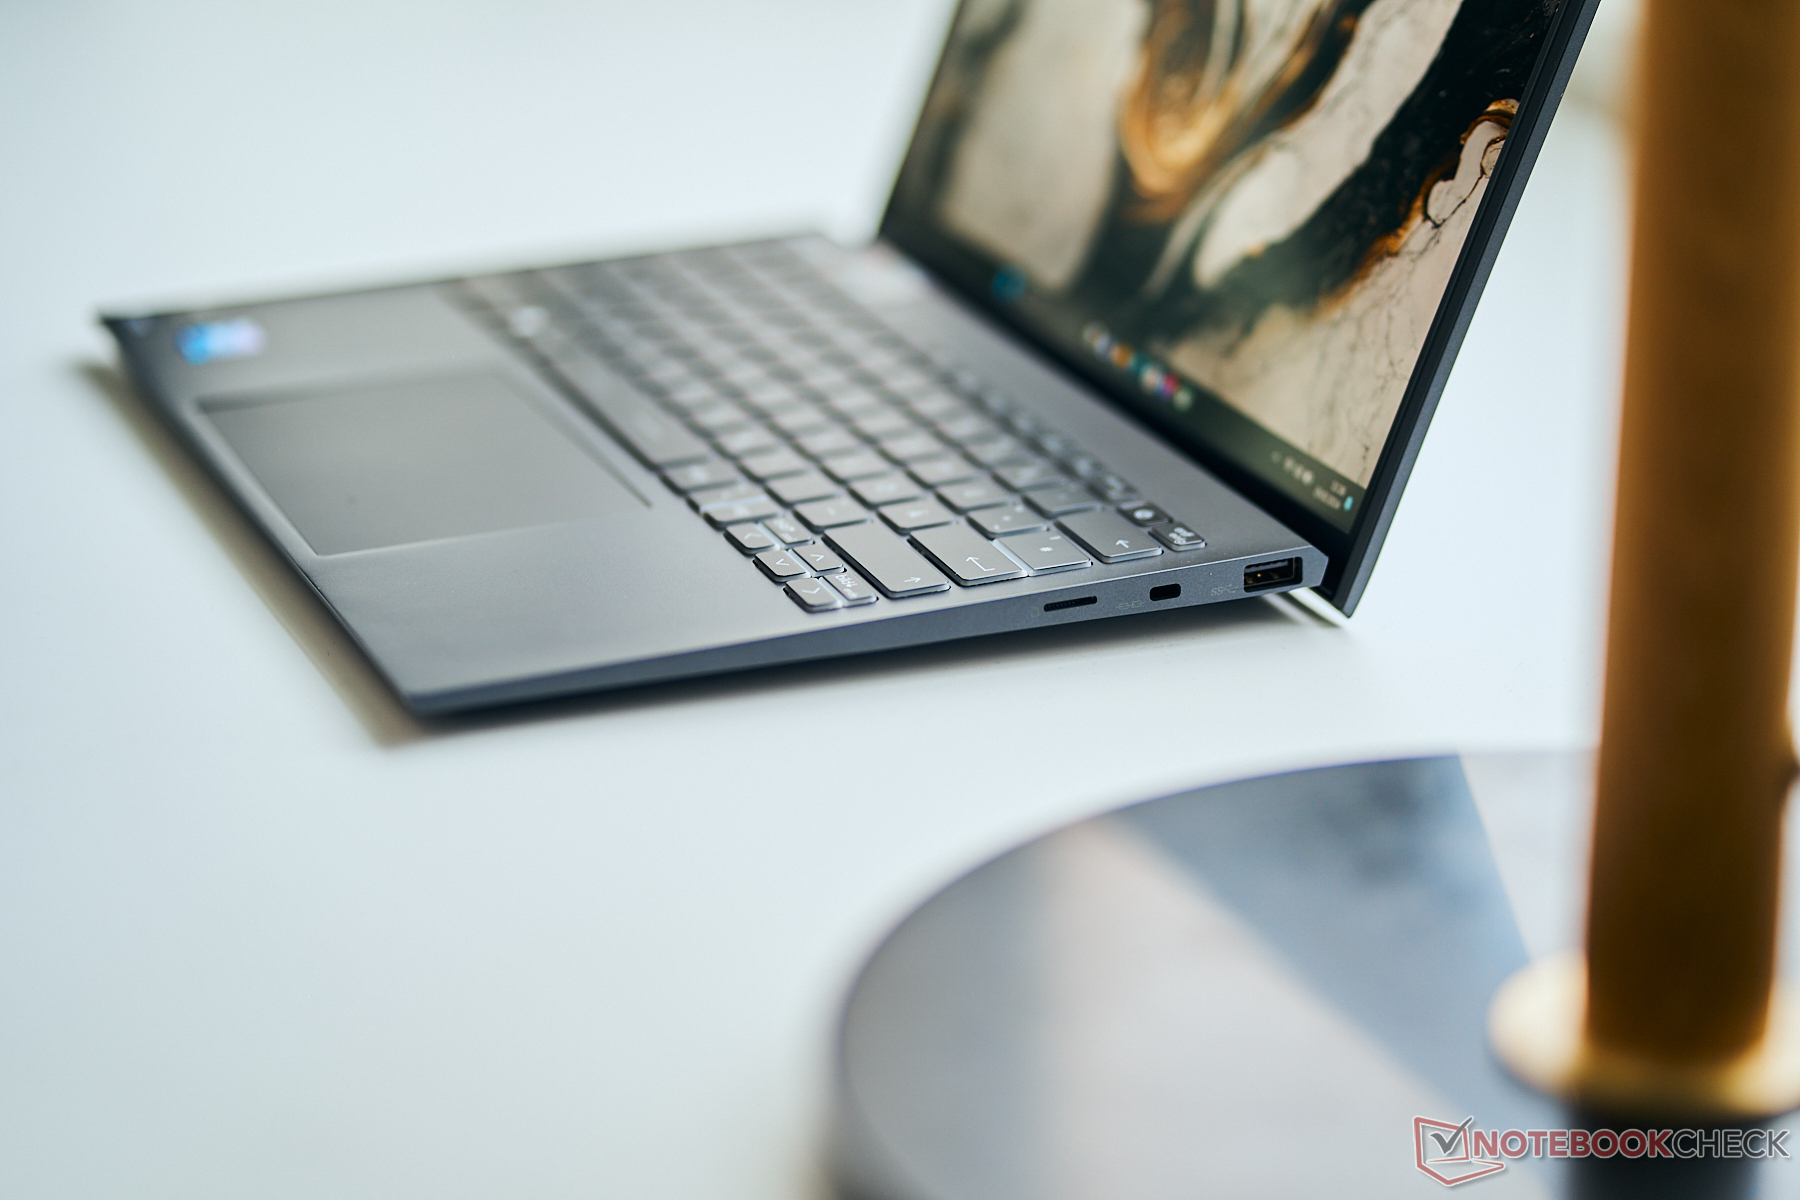
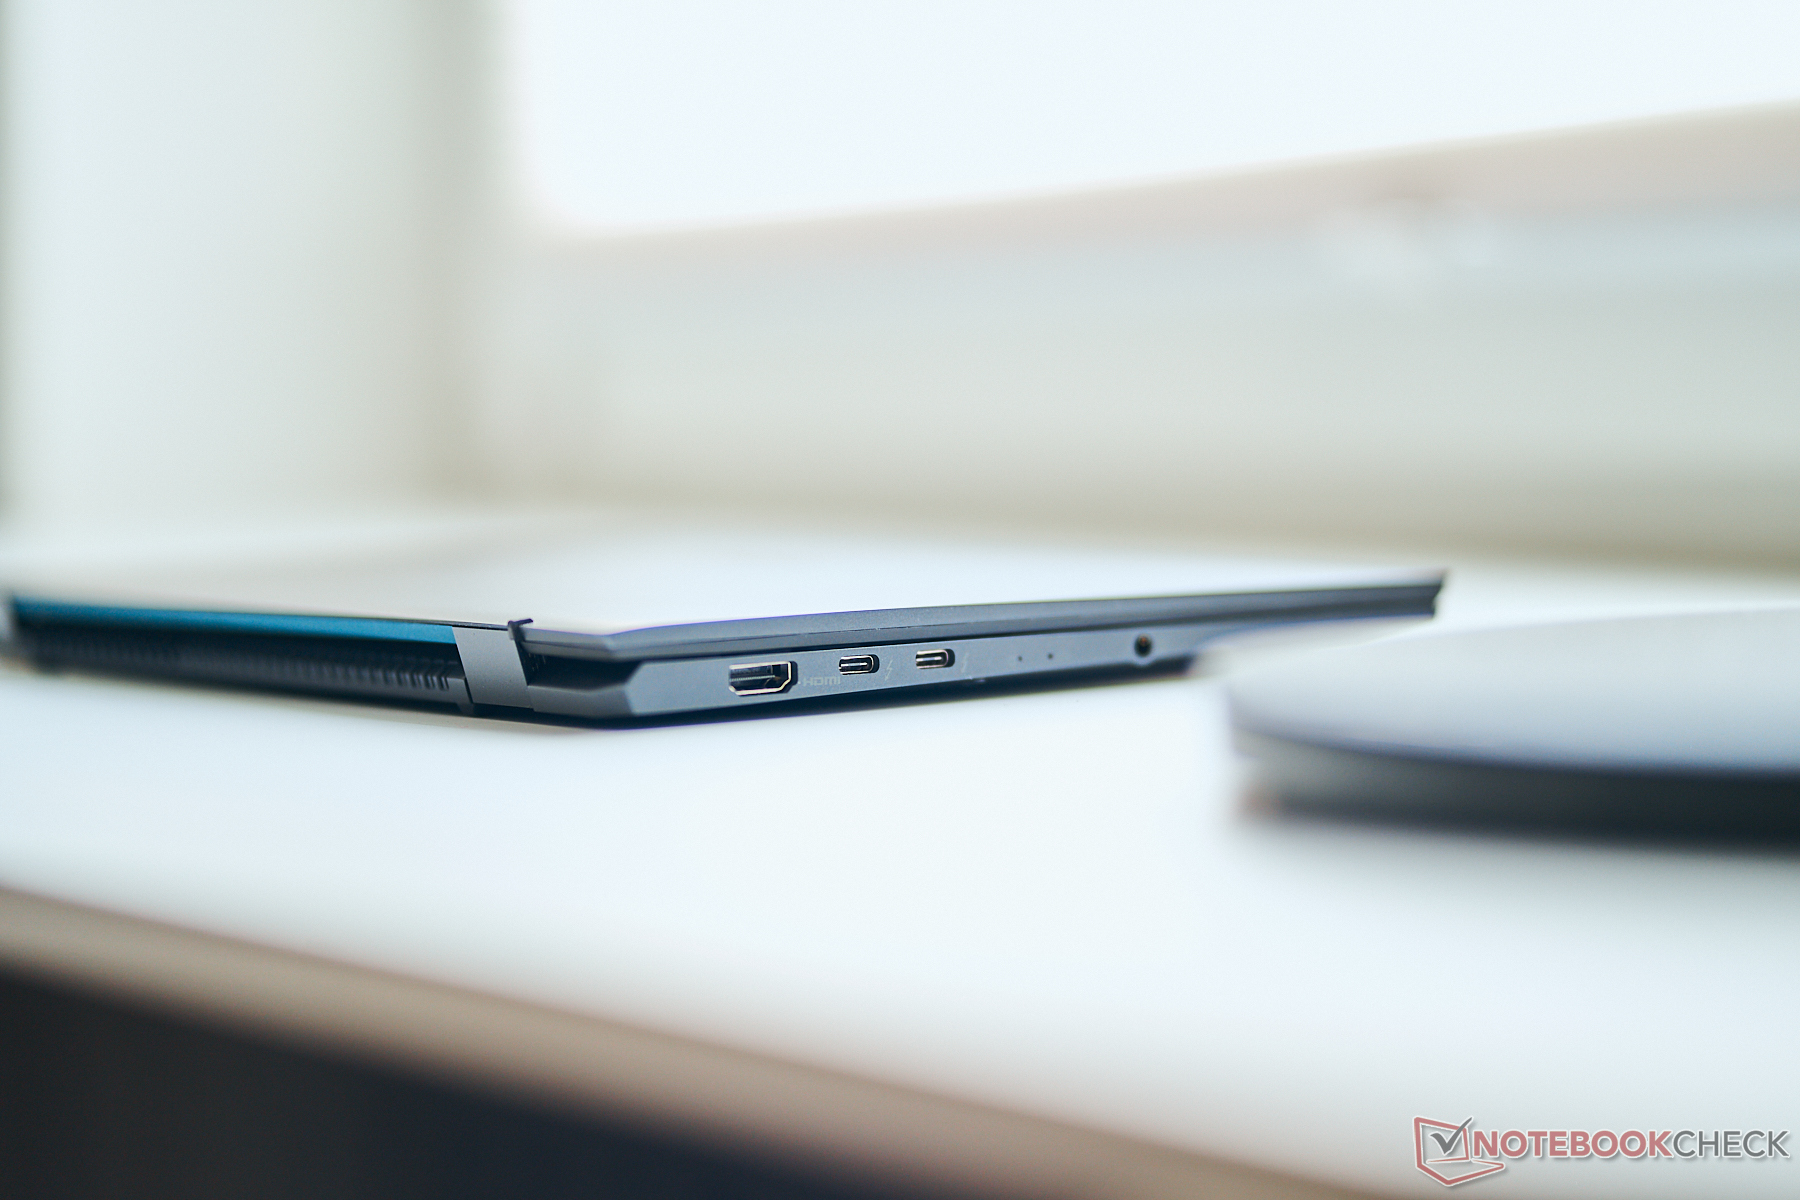
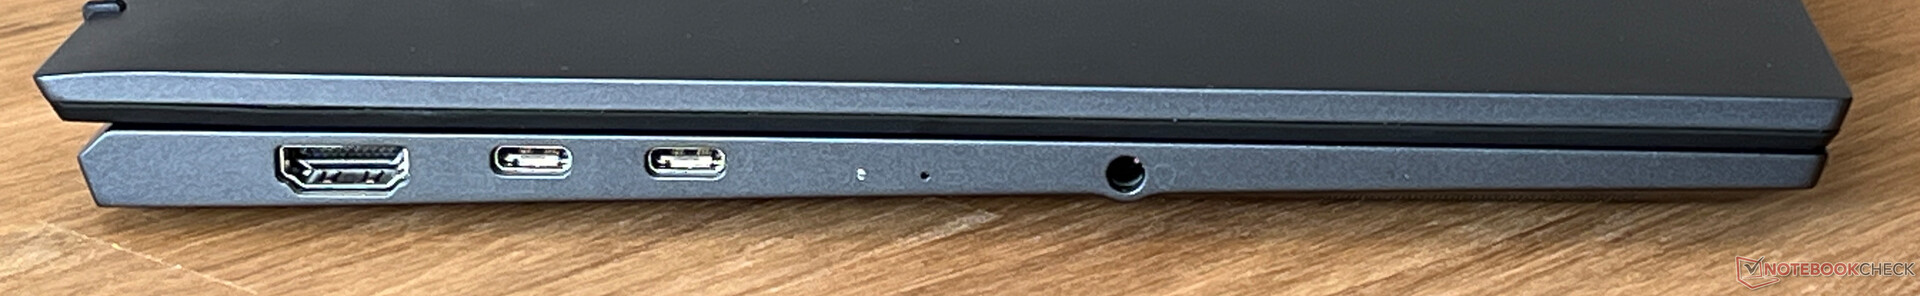
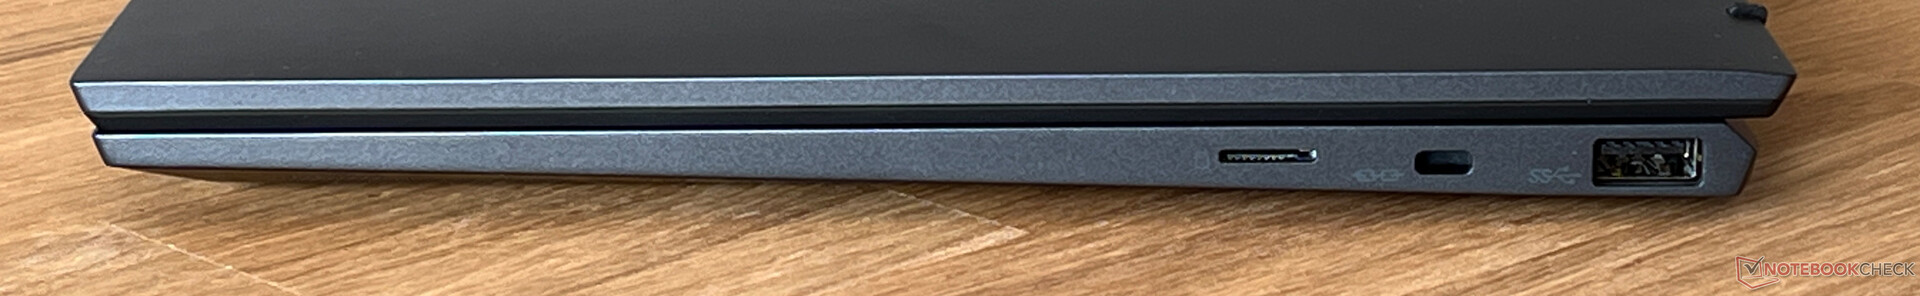
Connectivité - Le MSI avec Thunderbolt 4 et HDMI 2.1
Le Prestige 13 a beau être compact, il n'en est pas moins doté de toutes les connexions importantes, notamment l'USB-C, l'USB-A et une sortie HDMI complète. Nous apprécions également la façon dont les ports sont répartis sur l'ordinateur portable et n'avons pas grand-chose à critiquer.
Lecteur de carte SD
Le côté droit de l'appareil abrite un lecteur de carte microSD (mécanisme à ressort) qui, en combinaison avec notre carte de référence (Angelbird AV Pro V60), a permis d'obtenir de très bons taux de transfert. Lors de la copie d'images, nous avons constaté une moyenne de plus de 140 MB/s et un maximum de plus de 200 MB/s. Aucun des autres appareils de comparaison n'est équipé d'un lecteur de carte.
| SD Card Reader | |
| average JPG Copy Test (av. of 3 runs) | |
| MSI Prestige 13 AI Evo (Angelbird AV Pro V60) | |
| Moyenne de la classe Subnotebook (23.7 - 188, n=9, 2 dernières années) | |
| maximum AS SSD Seq Read Test (1GB) | |
| MSI Prestige 13 AI Evo (Angelbird AV Pro V60) | |
| Moyenne de la classe Subnotebook (24.9 - 195, n=8, 2 dernières années) | |
Communication
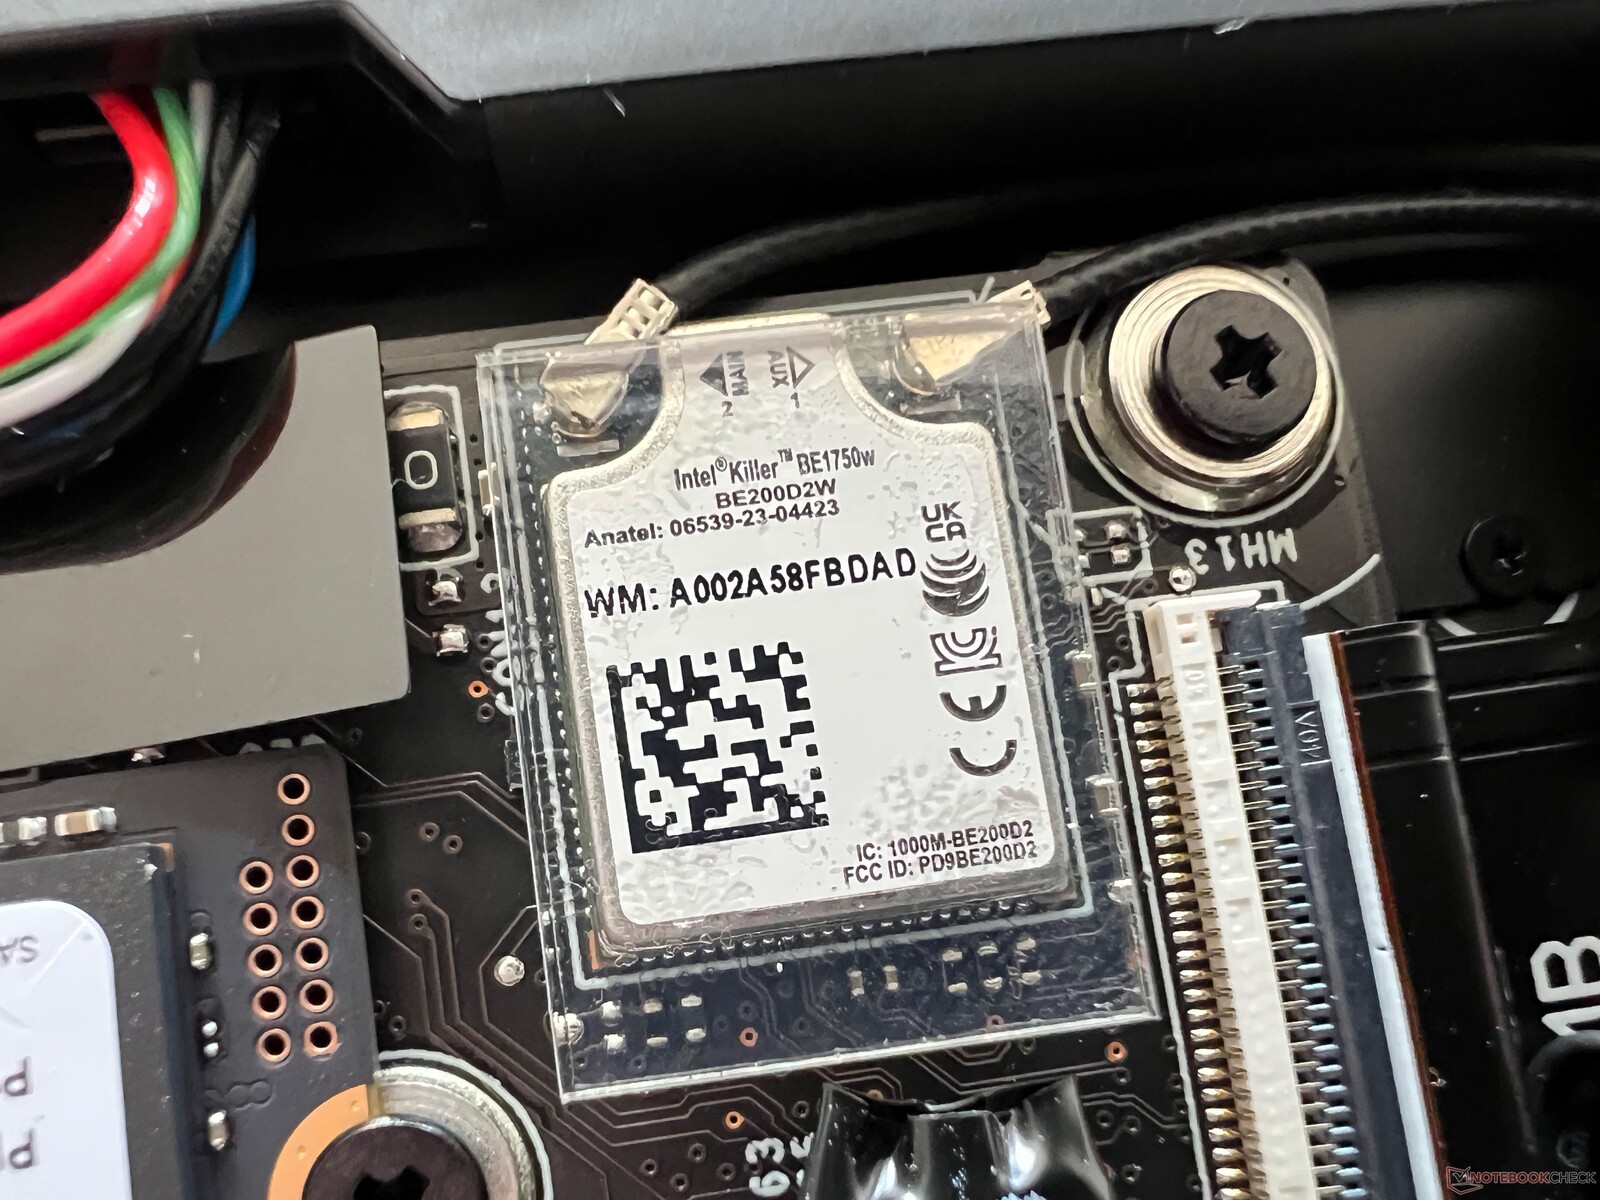
MSI a installé le nouveau module Wi-Fi 7 BE1750W (320 MHz) d'Intel dans l'ordinateur portable. Malheureusement, nous ne pouvons pas encore utiliser la nouvelle norme avec notre routeur de référence actuel. Cependant, les taux de transfert via le Wi-Fi 6 étaient très stables et élevés.
| Networking | |
| MSI Prestige 13 AI Evo | |
| iperf3 transmit AXE11000 | |
| iperf3 receive AXE11000 | |
| Lenovo ThinkPad X1 Nano Gen 3 | |
| iperf3 transmit AXE11000 | |
| iperf3 receive AXE11000 | |
| iperf3 transmit AXE11000 6GHz | |
| iperf3 receive AXE11000 6GHz | |
| Dell Latitude 13 7340 i5-1345U | |
| iperf3 transmit AXE11000 | |
| iperf3 receive AXE11000 | |
| iperf3 transmit AXE11000 6GHz | |
| iperf3 receive AXE11000 6GHz | |
| HP Dragonfly G4 | |
| iperf3 transmit AXE11000 | |
| iperf3 receive AXE11000 | |
| iperf3 transmit AXE11000 6GHz | |
| iperf3 receive AXE11000 6GHz | |
| Asus ZenBook S13 OLED UX5304 | |
| iperf3 transmit AXE11000 | |
| iperf3 receive AXE11000 | |
Webcam
La webcam 1080p offre une qualité d'image décente dans de bonnes conditions d'éclairage et ne comporte pas de couvercle mécanique. Elle prend également en charge les effets Windows Studio (arrière-plan flou, contact visuel, suivi). De plus, une caméra IR est installée pour la reconnaissance faciale via Windows Hello.


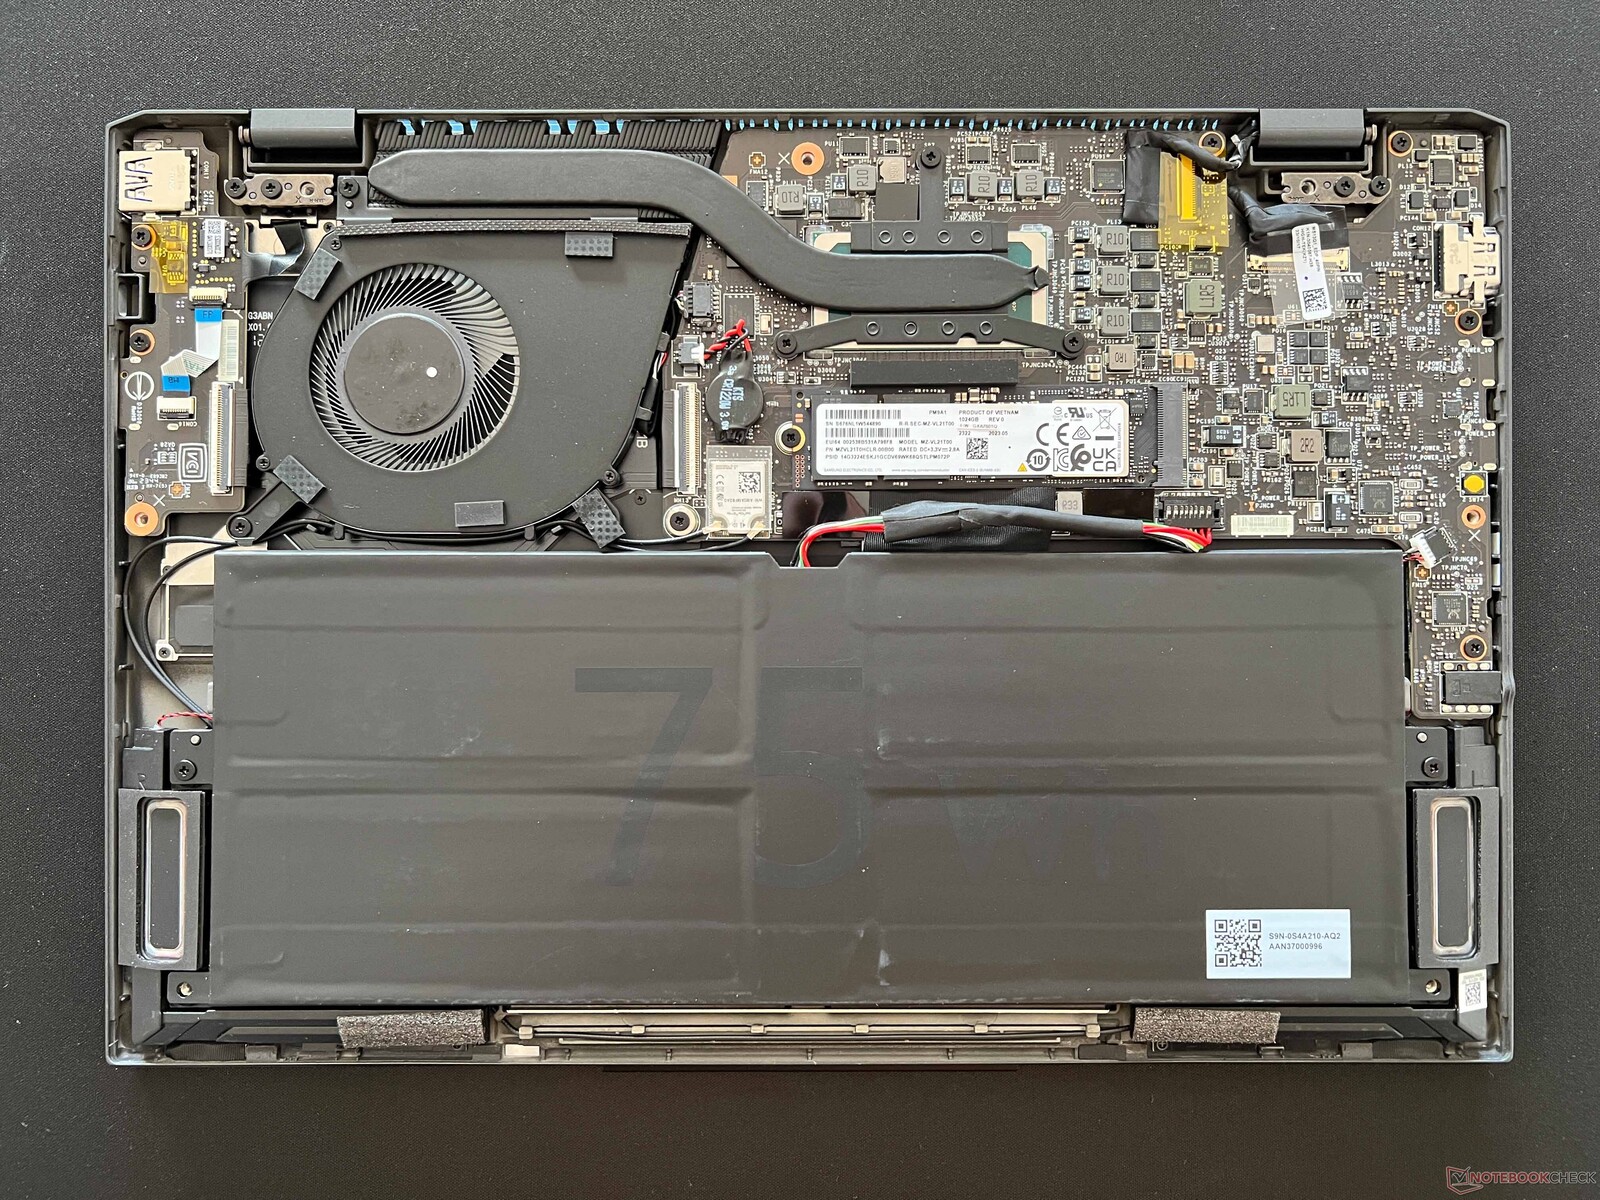
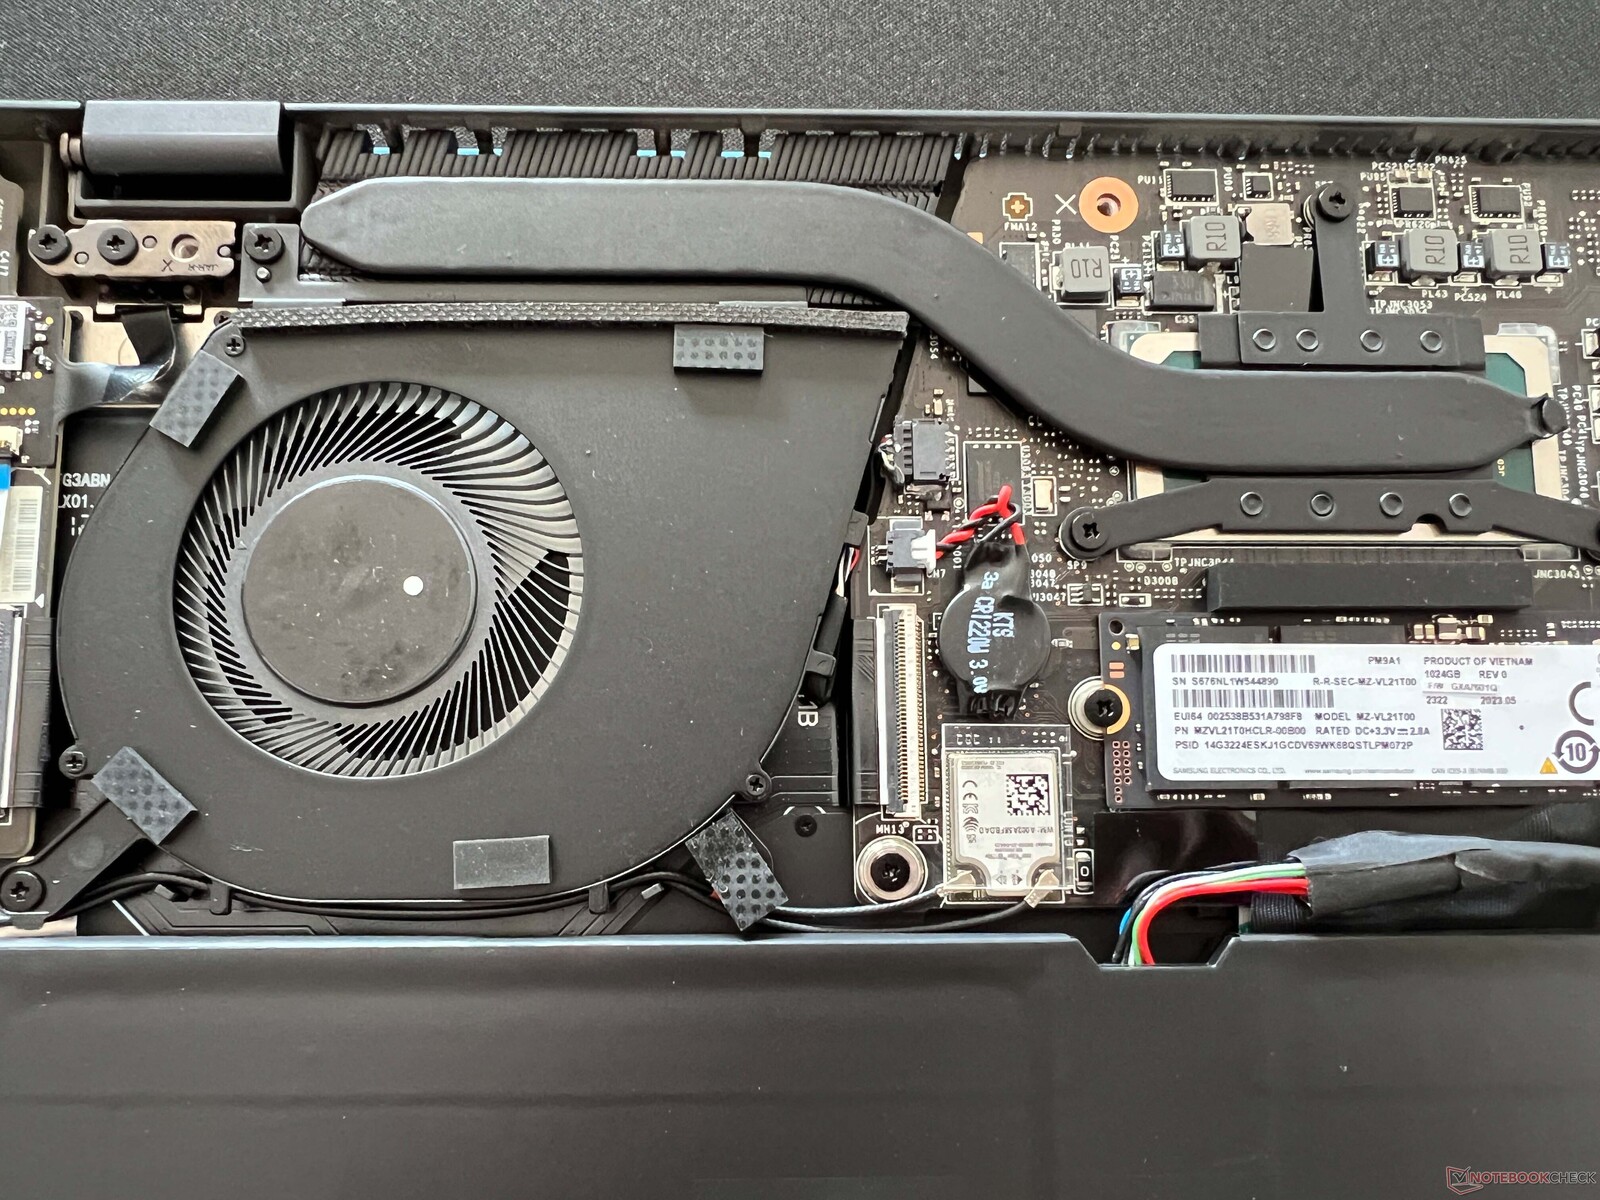
Maintenance
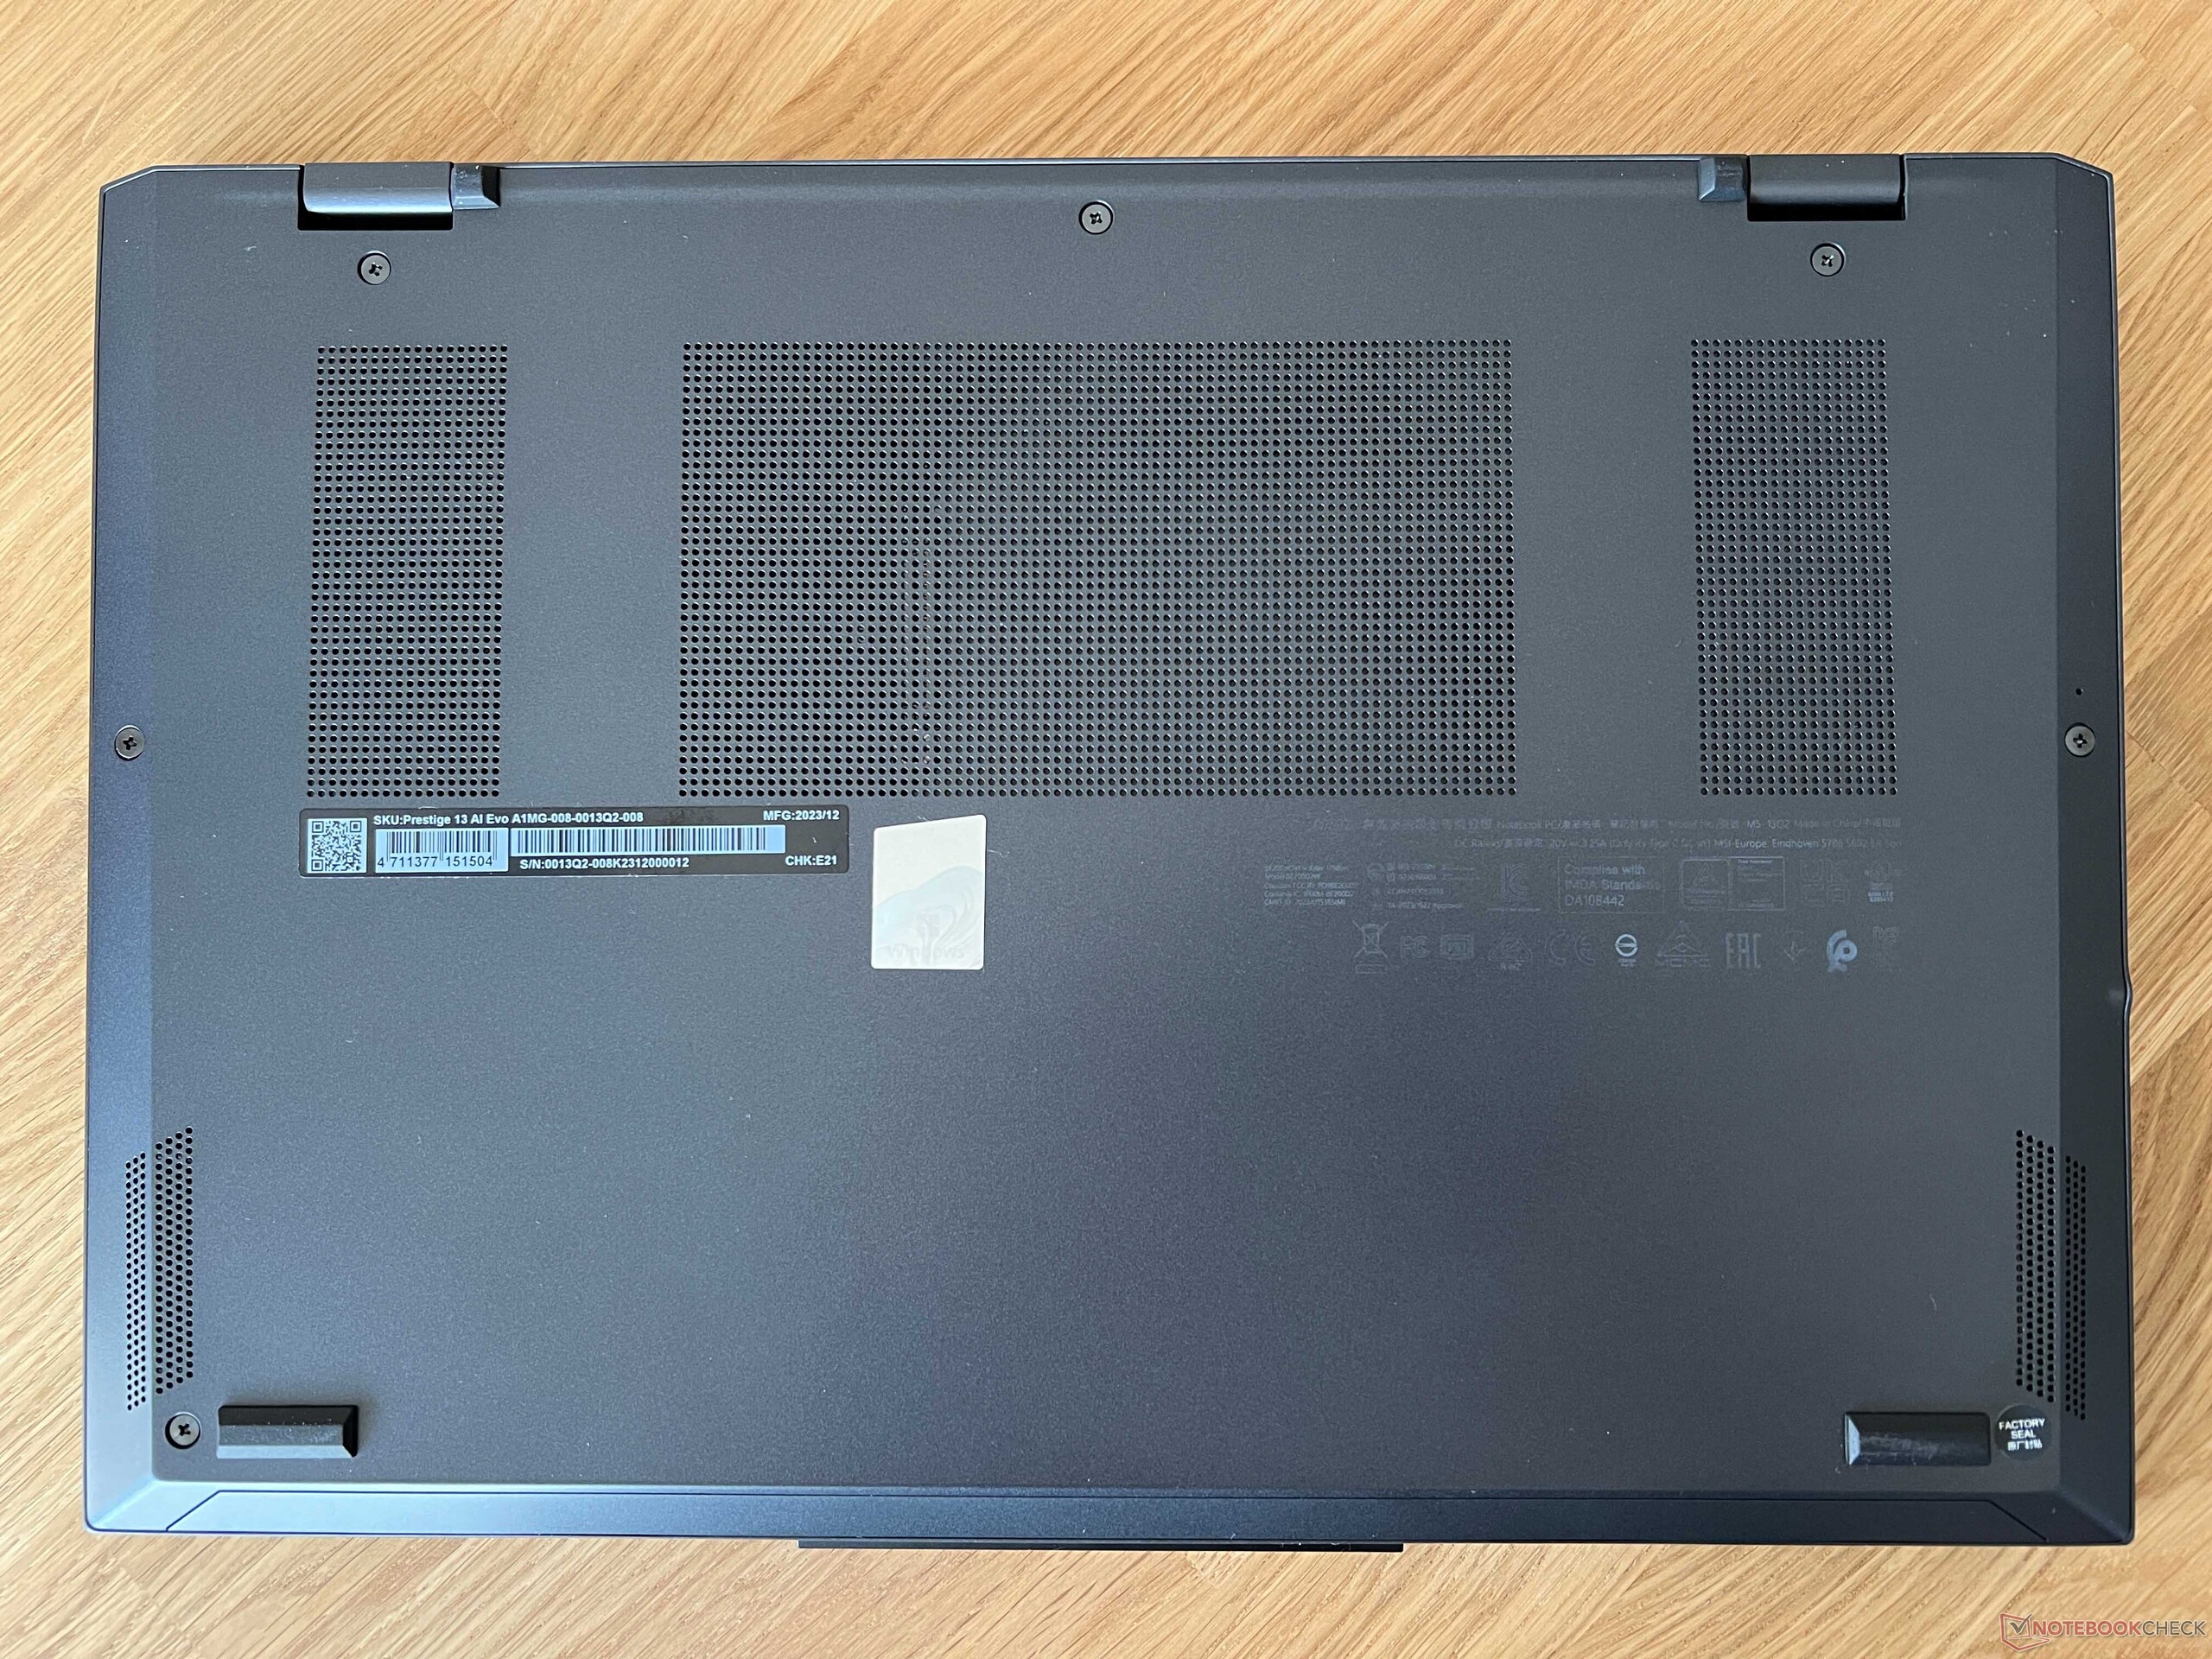
La partie inférieure du boîtier est fixée par des vis à tête cruciforme et peut être facilement retirée. Le ventilateur peut alors être nettoyé et le SSD et la batterie peuvent être remplacés. Tous les autres composants, en revanche, sont soudés. Il s'agit notamment des modules RAM et WLAN.
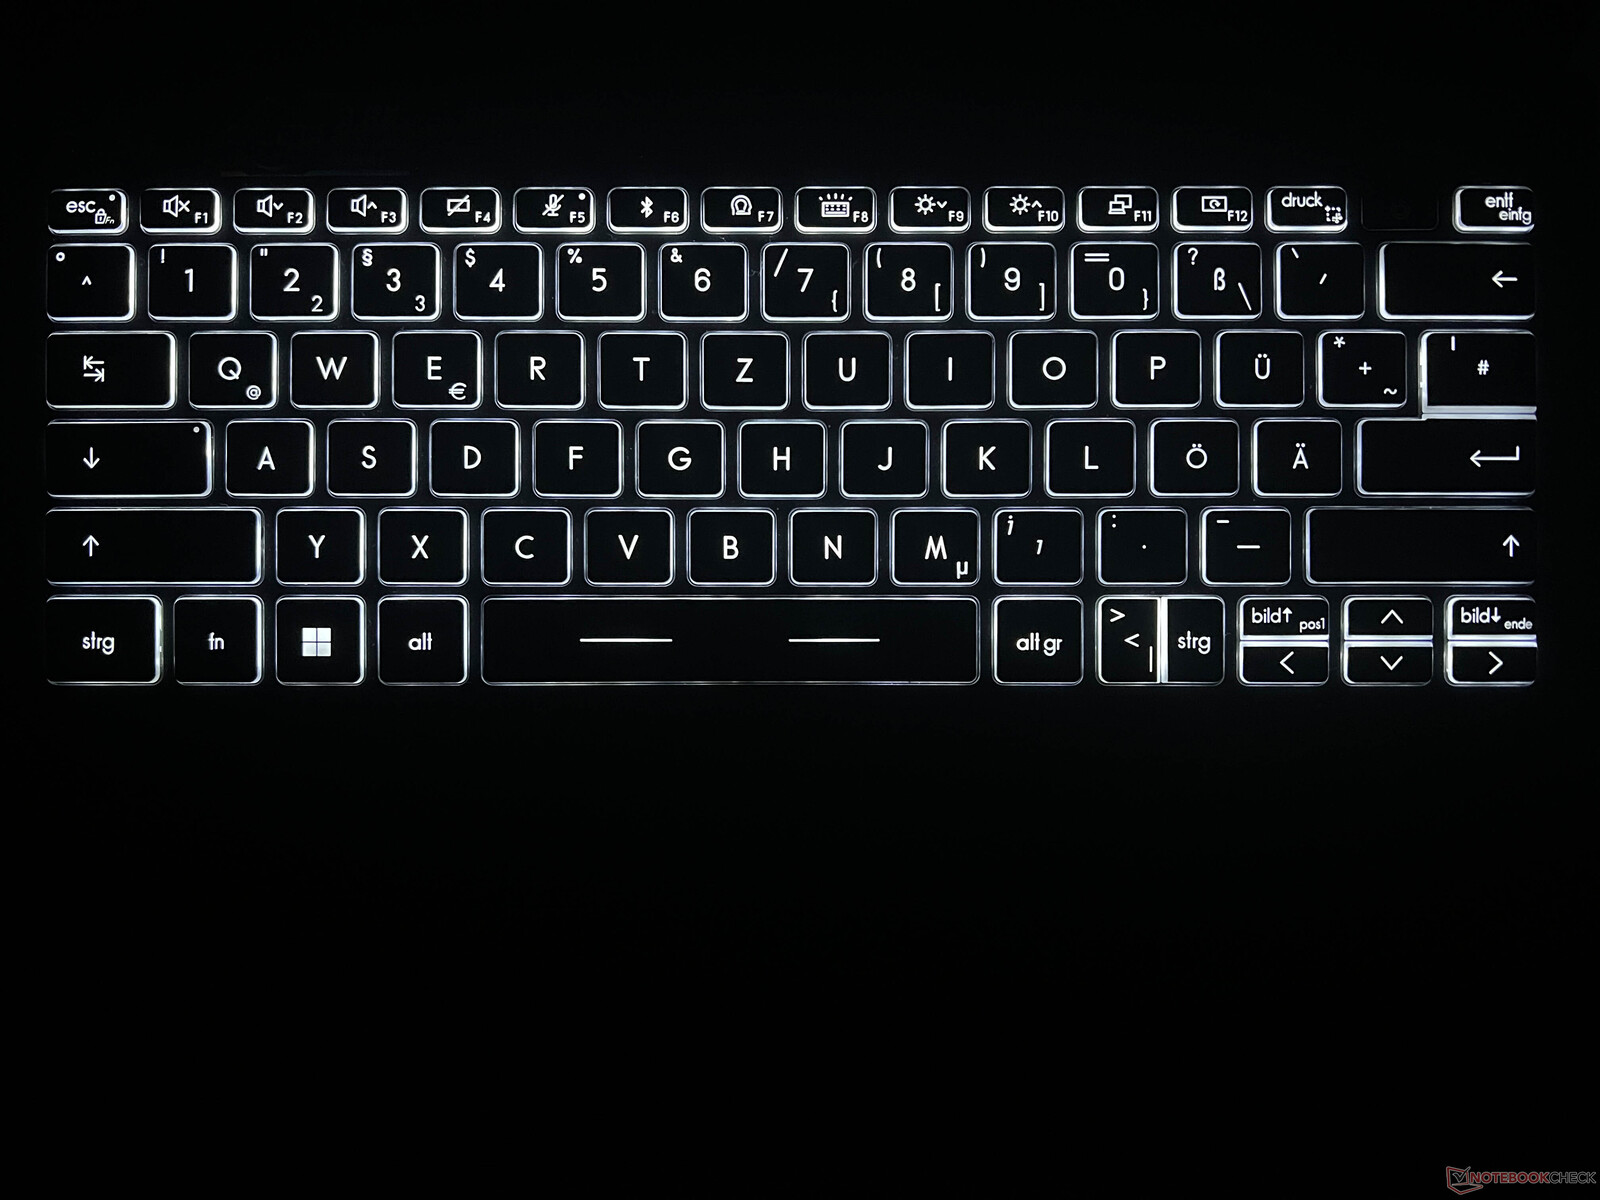
Dispositifs d'entrée - Clavier réduit
Le clavier noir est moyennement agréable à utiliser. La mécanique est précise mais les touches ne sont pas très hautes (17 mm de large, 1,4 mm de haut), ce à quoi il faut s'habituer au début. L'agencement général est assez étroit, mais MSI a au moins installé des touches dédiées à l'affichage de l'image vers le haut et vers le bas. Le bouton d'alimentation (incluant un scanner d'empreintes digitales) est situé en haut à droite et se trouve plus profondément dans le boîtier, ce qui signifie que vous pouvez le sentir facilement. La touche d'effacement se trouve à l'extrême droite. Le rétroéclairage blanc du clavier comporte trois niveaux d'intensité.
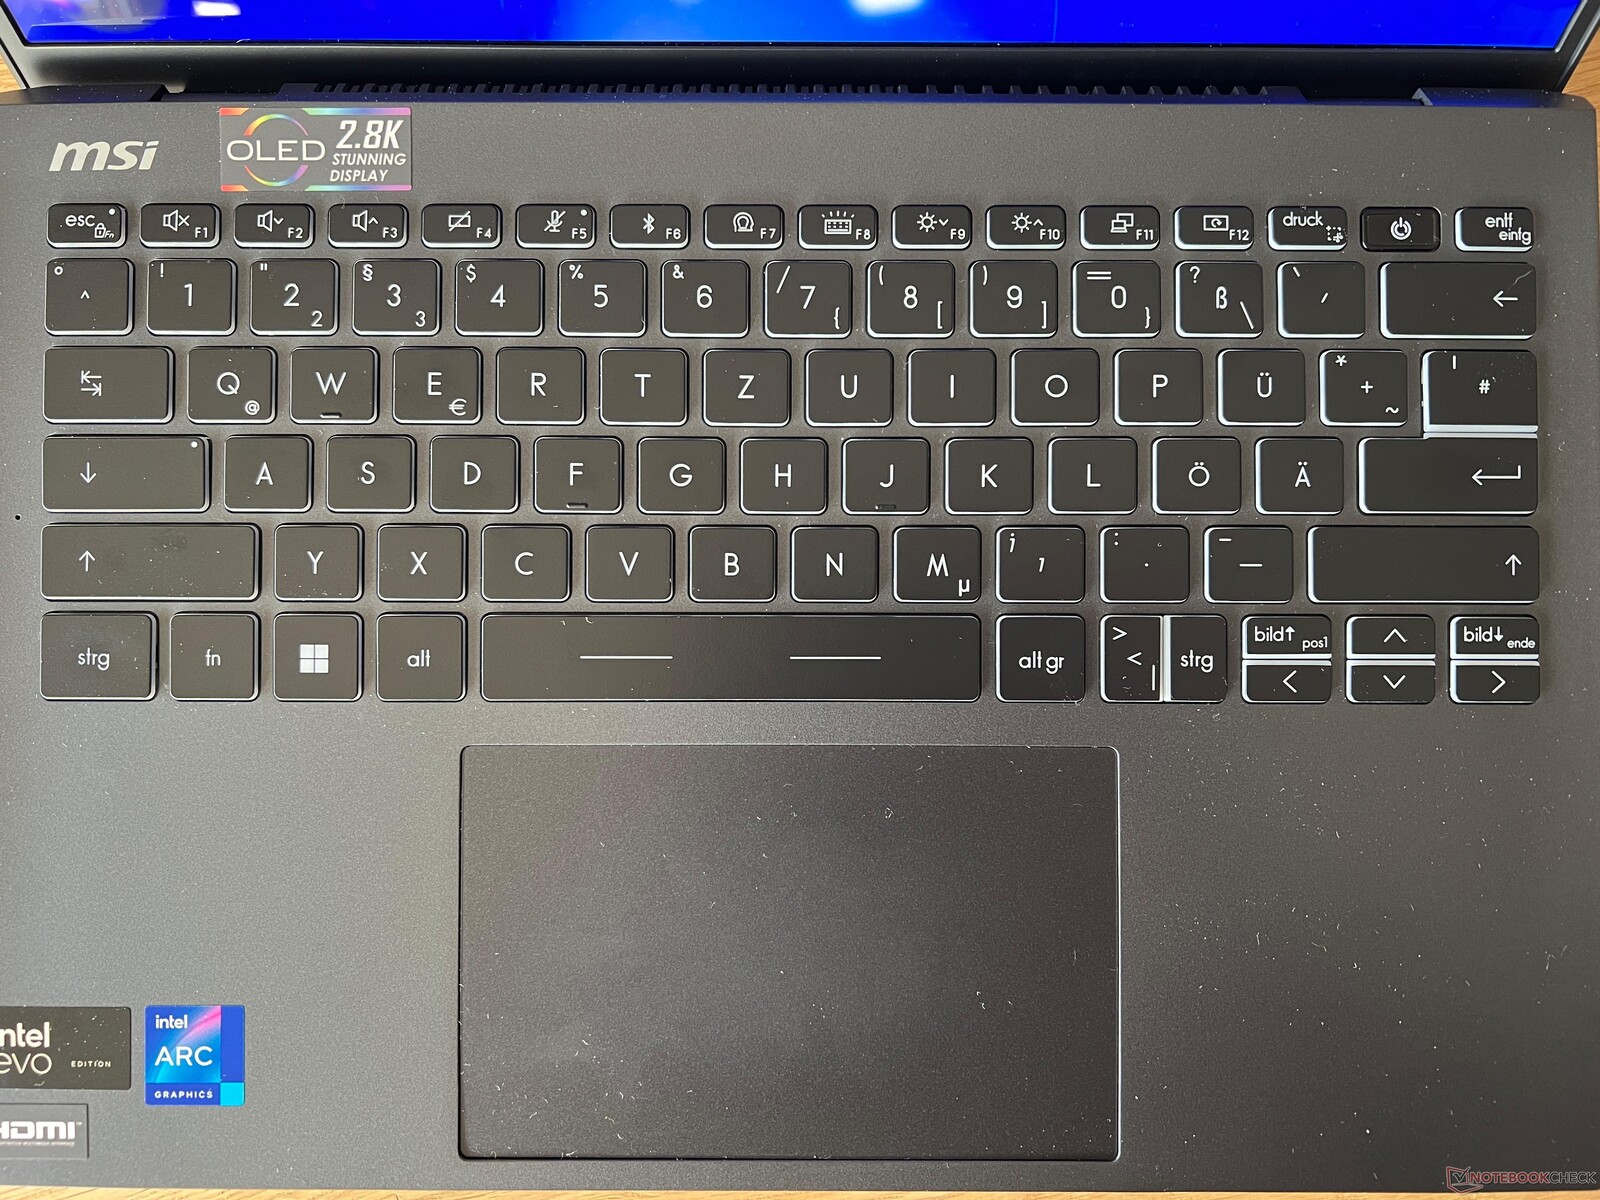
Le pavé tactile (12 x 7,5 cm) est agréable et lisse, et nous n'avons rencontré aucun problème lors de son utilisation. La moitié inférieure du pavé peut être enfoncée et le bruit de clic qu'elle produit est très régulier. Il pourrait être un peu plus silencieux, mais il ne s'agit en aucun cas d'un bruit bas de gamme.
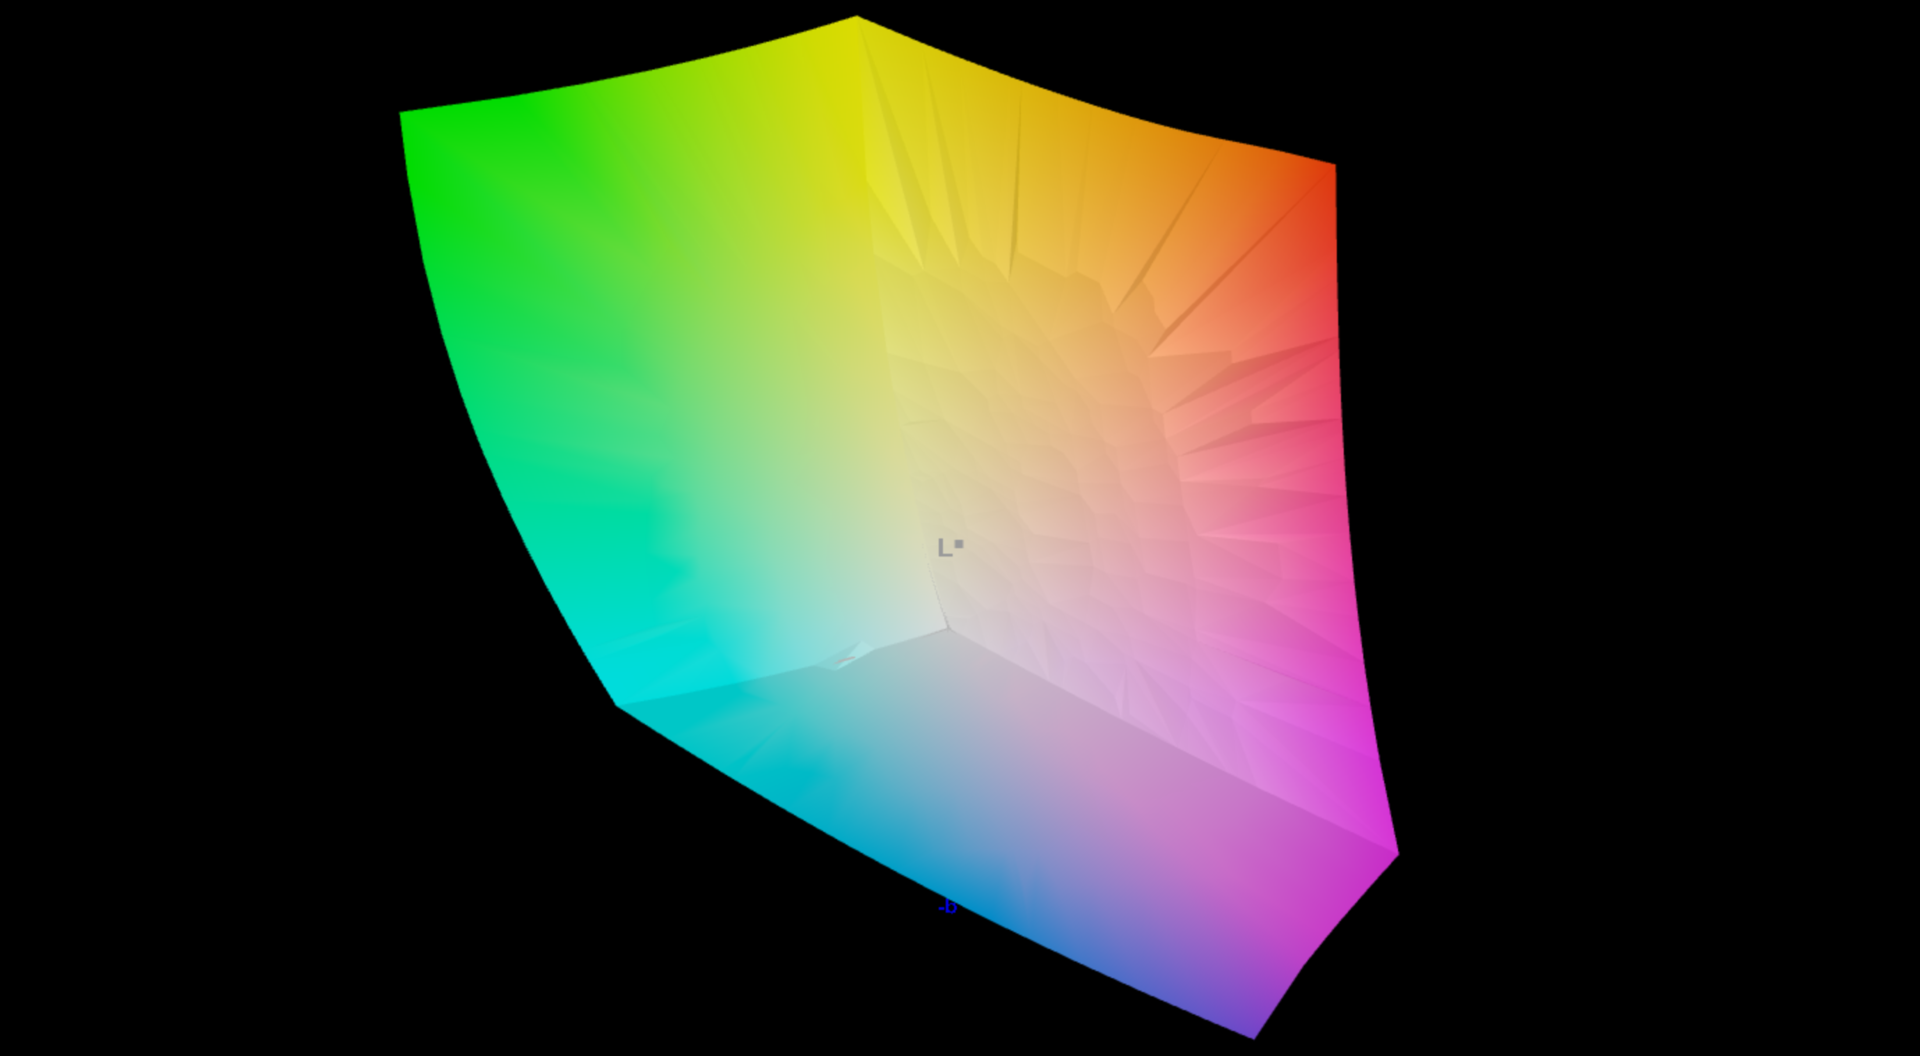
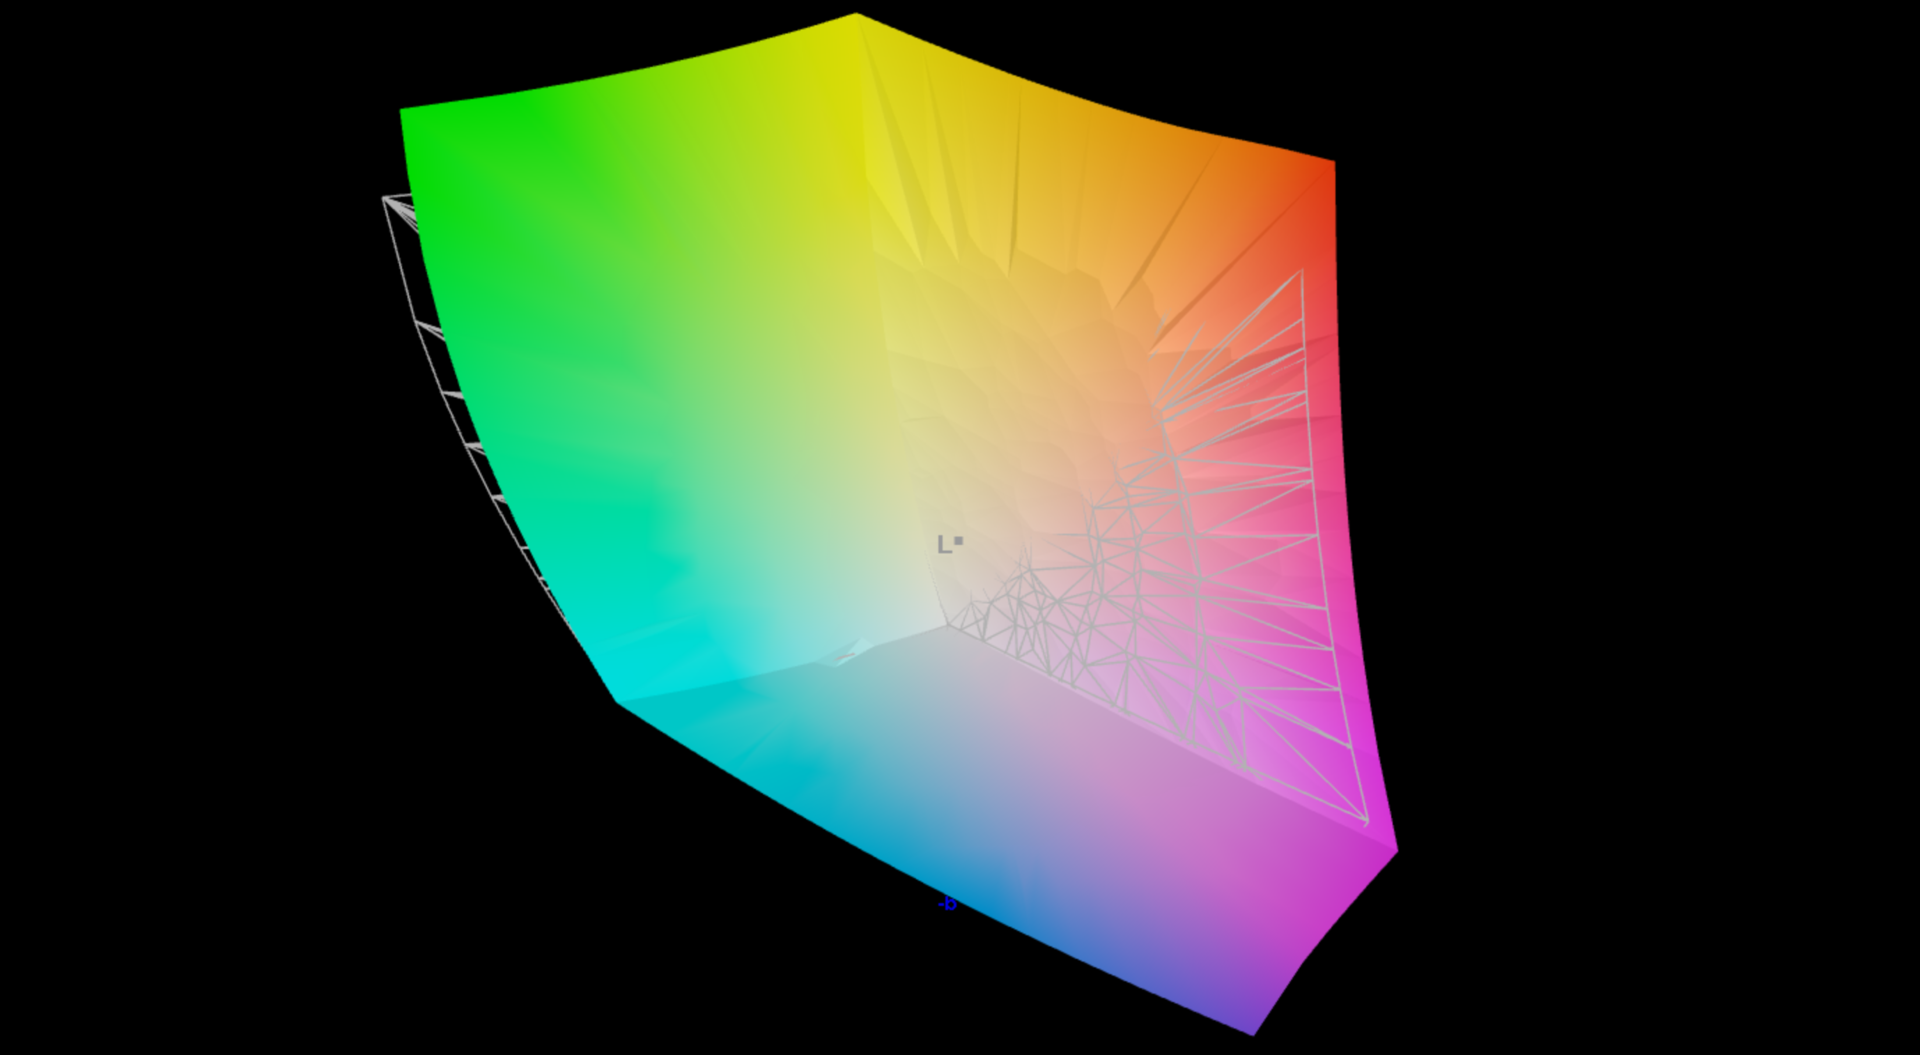
Écran - OLED 2,8K sans contact
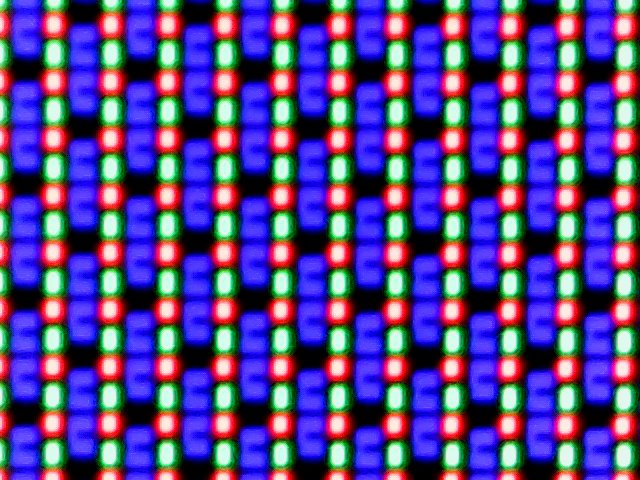
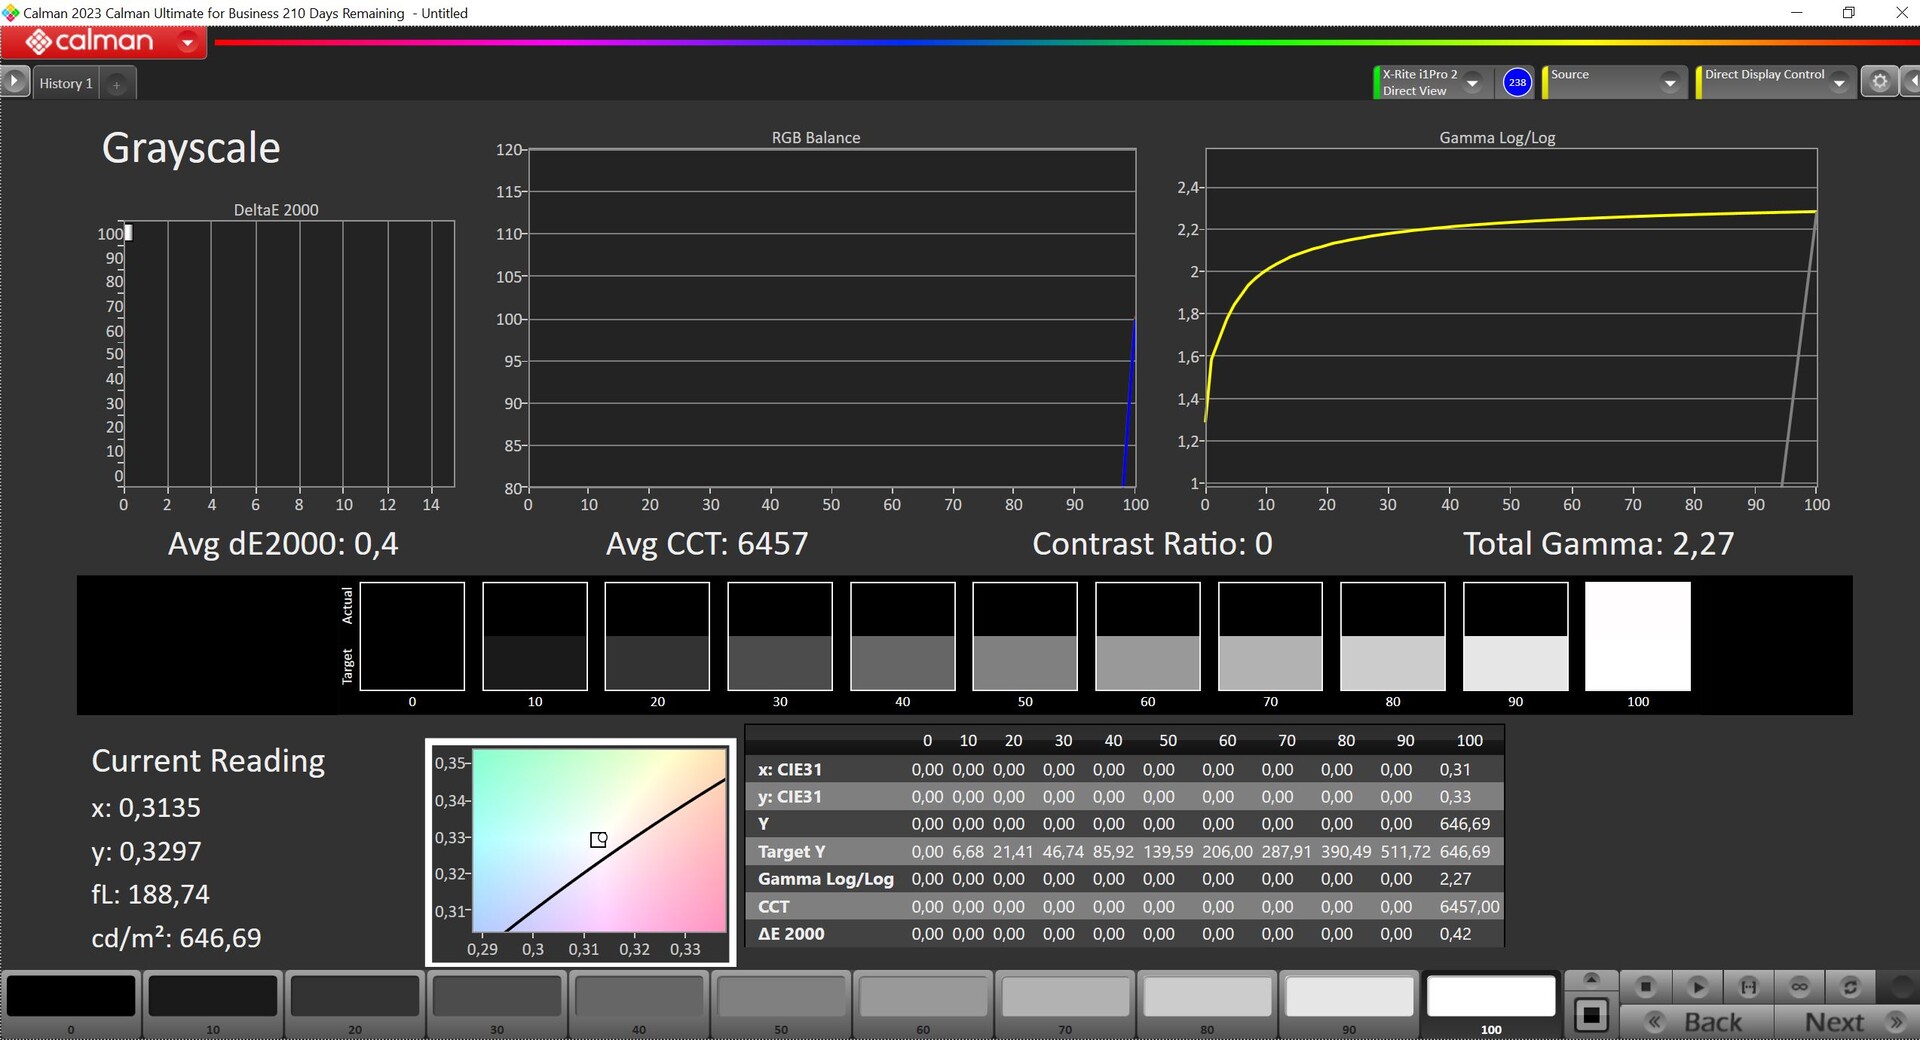
MSI a installé un panneau OLED réfléchissant 16:10 de 13,3 pouces avec une résolution de 2 880 x 1 800 pixels dans l'appareil. D'un point de vue subjectif, la qualité de l'image est impressionnante et les couleurs sont très vives. En outre, ses temps de réponse sont très courts. Sa luminosité SDR maximale est légèrement supérieure à 400 cd/m² et, grâce à sa faible valeur de noir, il présente un rapport de contraste élevé. Cela contribue également à la qualité de l'image. Les entrées tactiles ne sont pas prises en charge, mais sa luminosité peut être ajustée automatiquement en fonction des conditions d'éclairage ambiantes.
En utilisation HDR, sa luminosité maximale atteint jusqu'à 647 cd/m² lors de la représentation de petits extraits d'images et un peu plus de 500 cd/m² lors de la représentation d'une image presque entièrement blanche. Comme c'est le cas sur tous les autres ordinateurs portables Windows, vous devez d'abord activer le mode HDR manuellement pour empêcher la gestion des couleurs de fonctionner correctement.
| |||||||||||||||||||||||||
Homogénéité de la luminosité: 98 %
Valeur mesurée au centre, sur batterie: 405 cd/m²
Contraste: ∞:1 (Valeurs des noirs: 0 cd/m²)
ΔE ColorChecker Calman: 2.1 | ∀{0.5-29.43 Ø4.71}
ΔE Greyscale Calman: 1.2 | ∀{0.09-98 Ø4.96}
97.8% AdobeRGB 1998 (Argyll 3D)
100% sRGB (Argyll 3D)
99.9% Display P3 (Argyll 3D)
Gamma: 2.16
CCT: 6465 K
| MSI Prestige 13 AI Evo ATNA33AA07-0, OLED, 2880x1800, 13.3" | Lenovo ThinkPad X1 Nano Gen 3 MND007ZA1-3, IPS, 2160x1350, 13" | Dell Latitude 13 7340 i5-1345U Chi Mei 133JCG, IPS, 1920x1200, 13.3" | HP Dragonfly G4 Chi Mei CMN13C0, IPS, 1920x1280, 13.5" | Asus ZenBook S13 OLED UX5304 SDC417B, OLED, 2880x1800, 13.3" | |
|---|---|---|---|---|---|
| Display | -20% | -23% | -21% | -0% | |
| Display P3 Coverage (%) | 99.9 | 68.5 -31% | 65.9 -34% | 68.4 -32% | 99.7 0% |
| sRGB Coverage (%) | 100 | 99.5 0% | 96.8 -3% | 98.3 -2% | 100 0% |
| AdobeRGB 1998 Coverage (%) | 97.8 | 69.7 -29% | 67.8 -31% | 70.4 -28% | 96.9 -1% |
| Response Times | -2092% | -2565% | -2572% | -21% | |
| Response Time Grey 50% / Grey 80% * (ms) | 1.54 ? | 39.9 ? -2491% | 51 ? -3212% | 48.8 ? -3069% | 2 ? -30% |
| Response Time Black / White * (ms) | 1.44 ? | 25.8 ? -1692% | 29.04 ? -1917% | 31.3 ? -2074% | 1.6 ? -11% |
| PWM Frequency (Hz) | 240 ? | 240 ? | |||
| Screen | -1% | -65% | -14% | 13% | |
| Brightness middle (cd/m²) | 404 | 461.2 14% | 471 17% | 408.8 1% | 361 -11% |
| Brightness (cd/m²) | 407 | 428 5% | 437 7% | 399 -2% | 365 -10% |
| Brightness Distribution (%) | 98 | 86 -12% | 87 -11% | 90 -8% | 98 0% |
| Black Level * (cd/m²) | 0.29 | 0.2033 | 0.32 | ||
| Colorchecker dE 2000 * | 2.1 | 1.79 15% | 3.24 -54% | 2.02 4% | 1.2 43% |
| Colorchecker dE 2000 max. * | 4.3 | 3.3 23% | 7.19 -67% | 3.84 11% | 1.9 56% |
| Greyscale dE 2000 * | 1.2 | 1.8 -50% | 4.6 -283% | 2.3 -92% | 1.2 -0% |
| Gamma | 2.16 102% | 2.24 98% | 2.2 100% | 2.27 97% | |
| CCT | 6465 101% | 6588 99% | 6520 100% | 6203 105% | 6486 100% |
| Contrast (:1) | 1590 | 2317 | 1278 | ||
| Colorchecker dE 2000 calibrated * | 0.47 | 1.08 | 0.61 | ||
| Moyenne finale (programmes/paramètres) | -704% /
-386% | -884% /
-508% | -869% /
-481% | -3% /
3% |
* ... Moindre est la valeur, meilleures sont les performances
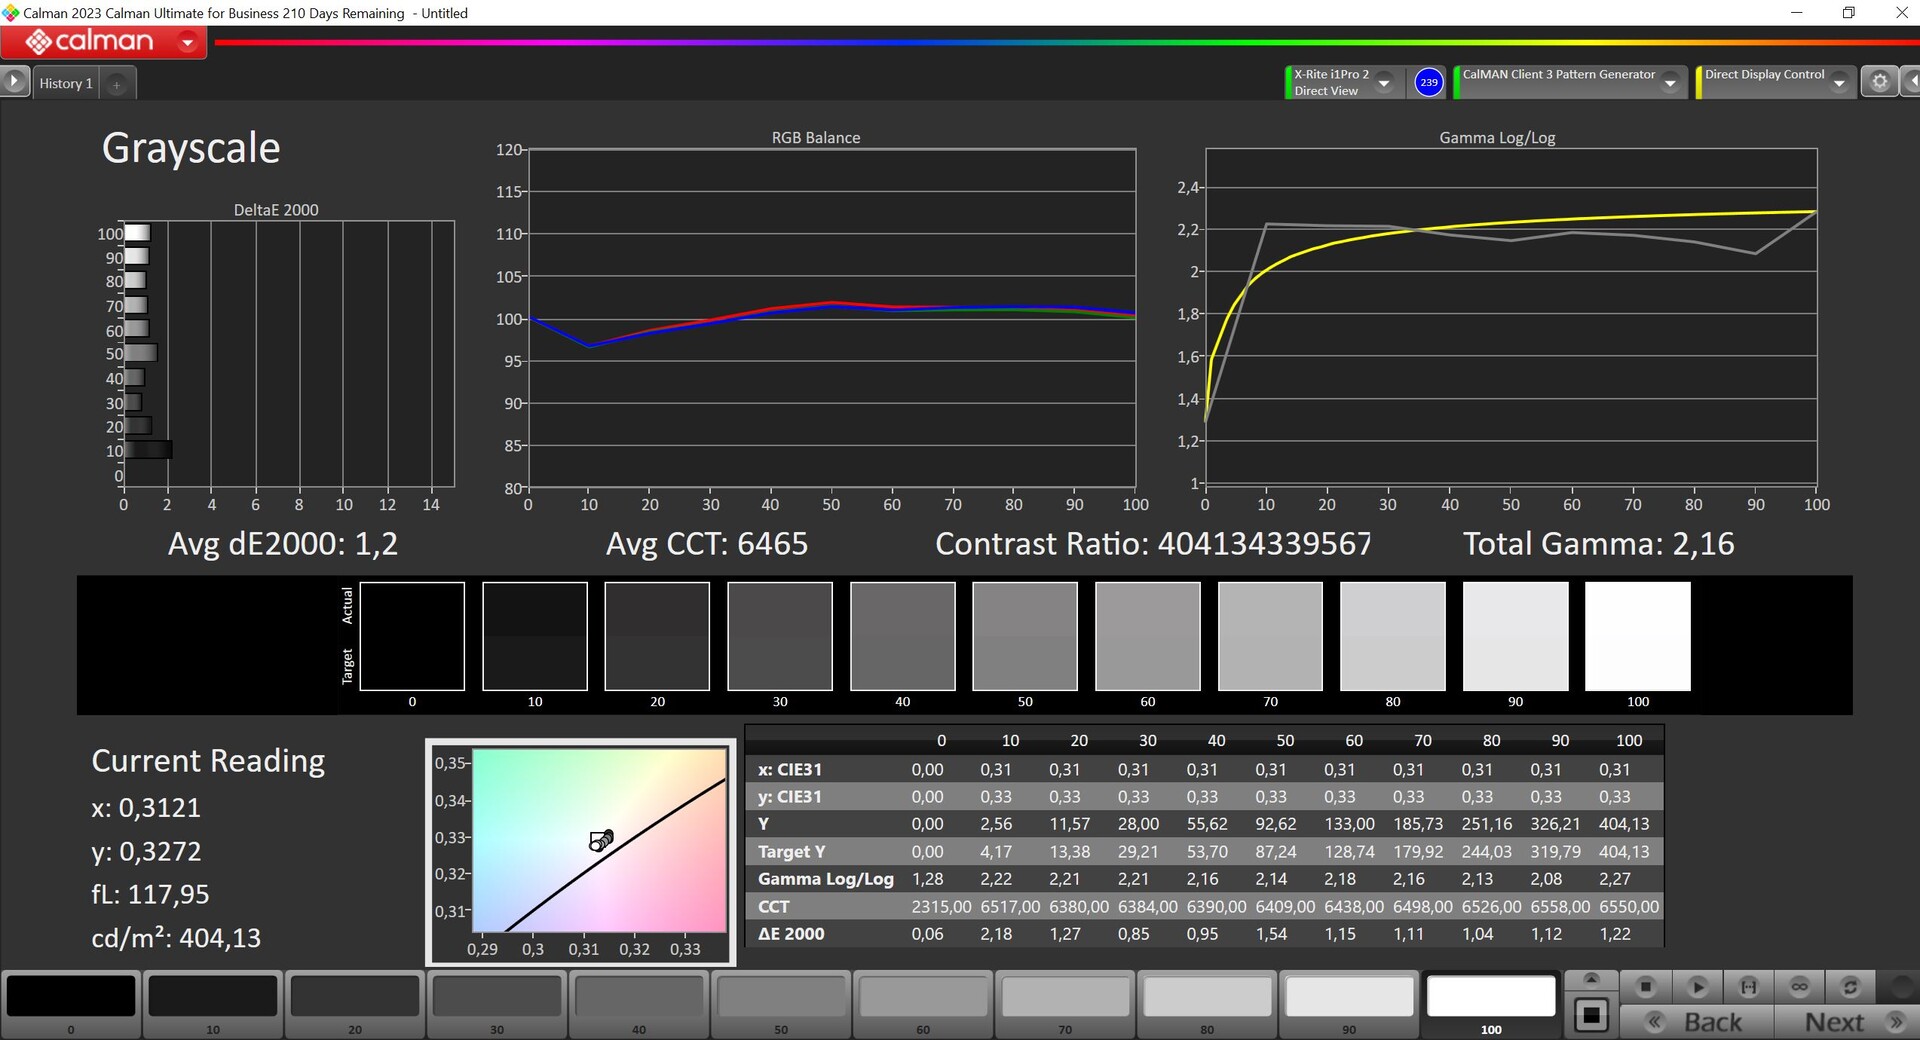
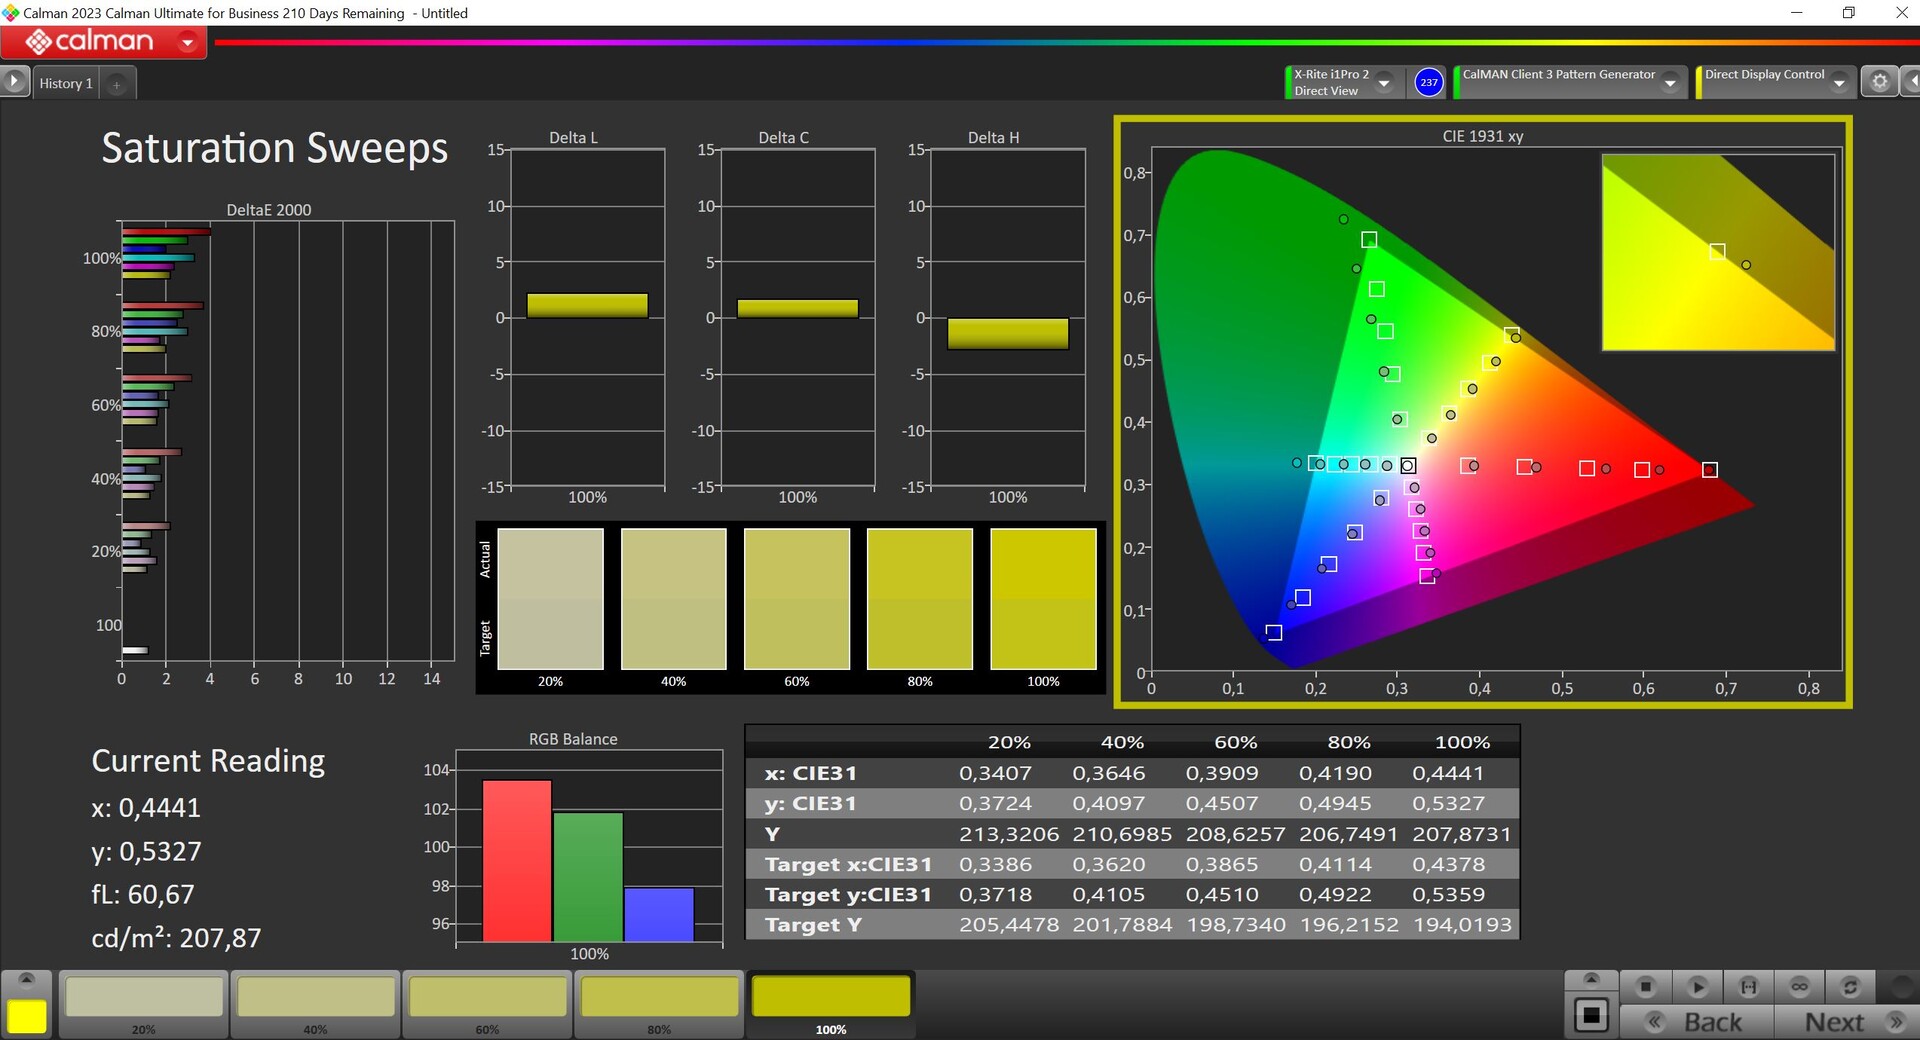
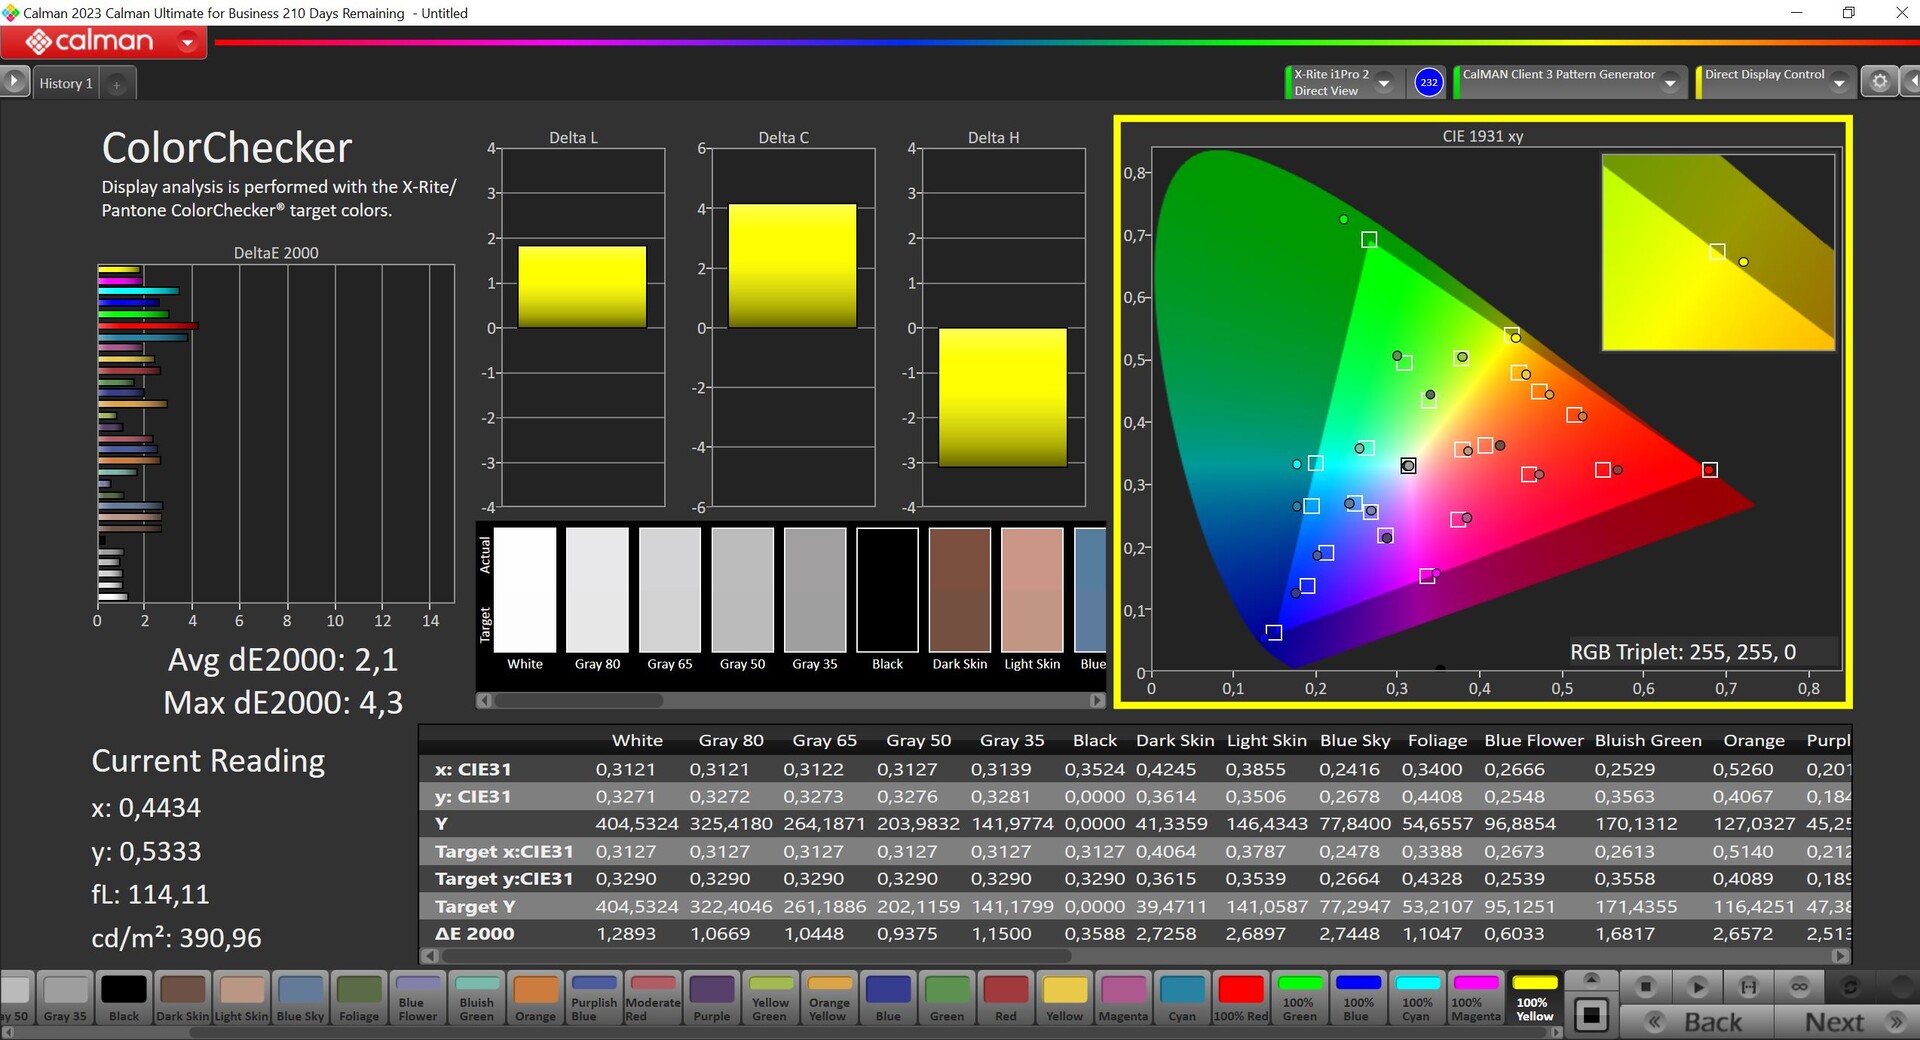
Nous avons analysé le panneau à l'aide du logiciel professionnel CalMAN (X-Rite i1 Pro2) et, dès sa sortie de la boîte, il a fourni une bonne représentation. Nous n'avons noté aucune teinte et sa température de couleur était également précise, à l'exception de quelques couleurs (100 %) qui dépassaient l'écart DeltaE-2000 important de 3 (par rapport à la référence P3). Nous n'avons pas été en mesure de corriger cela par le biais d'une calibration, et MSI ne propose pas de profil sRGB. Par conséquent, la Prestige 13 n'est pas la mieux adaptée à l'édition d'images.

Temps de réponse de l'écran
| ↔ Temps de réponse noir à blanc | ||
|---|---|---|
| 1.44 ms ... hausse ↗ et chute ↘ combinées | ↗ 0.73 ms hausse | 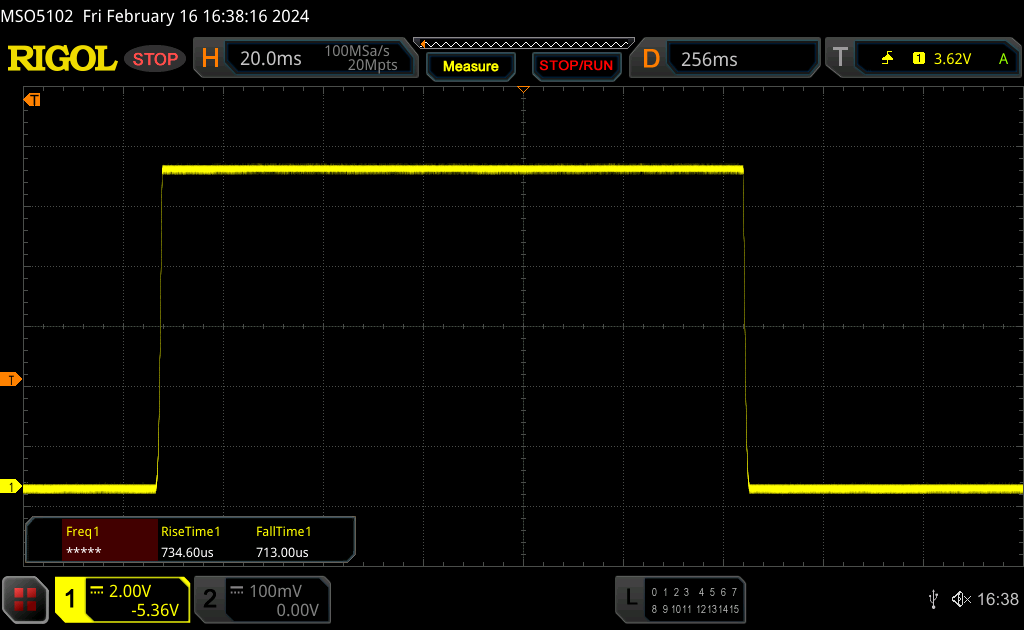 |
| ↘ 0.71 ms chute | ||
| L'écran montre de très faibles temps de réponse, parfait pour le jeu. En comparaison, tous les appareils testés affichent entre 0.1 (minimum) et 240 (maximum) ms. » 9 % des appareils testés affichent de meilleures performances. Cela signifie que les latences relevées sont meilleures que la moyenne (19.8 ms) de tous les appareils testés. | ||
| ↔ Temps de réponse gris 50% à gris 80% | ||
| 1.54 ms ... hausse ↗ et chute ↘ combinées | ↗ 0.79 ms hausse | 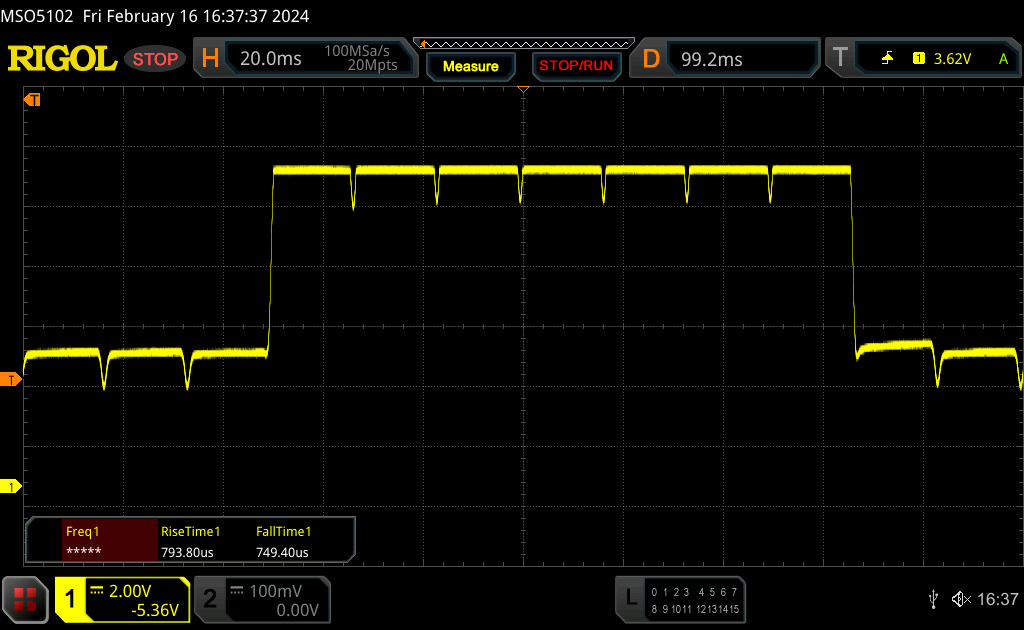 |
| ↘ 0.75 ms chute | ||
| L'écran montre de très faibles temps de réponse, parfait pour le jeu. En comparaison, tous les appareils testés affichent entre 0.165 (minimum) et 636 (maximum) ms. » 8 % des appareils testés affichent de meilleures performances. Cela signifie que les latences relevées sont meilleures que la moyenne (31 ms) de tous les appareils testés. | ||
Scintillement / MLI (Modulation de largeur d'impulsion)
| Scintillement / MLI (Modulation de largeur d'impulsion) décelé | 240 Hz | ≤ 42 Niveau de luminosité | 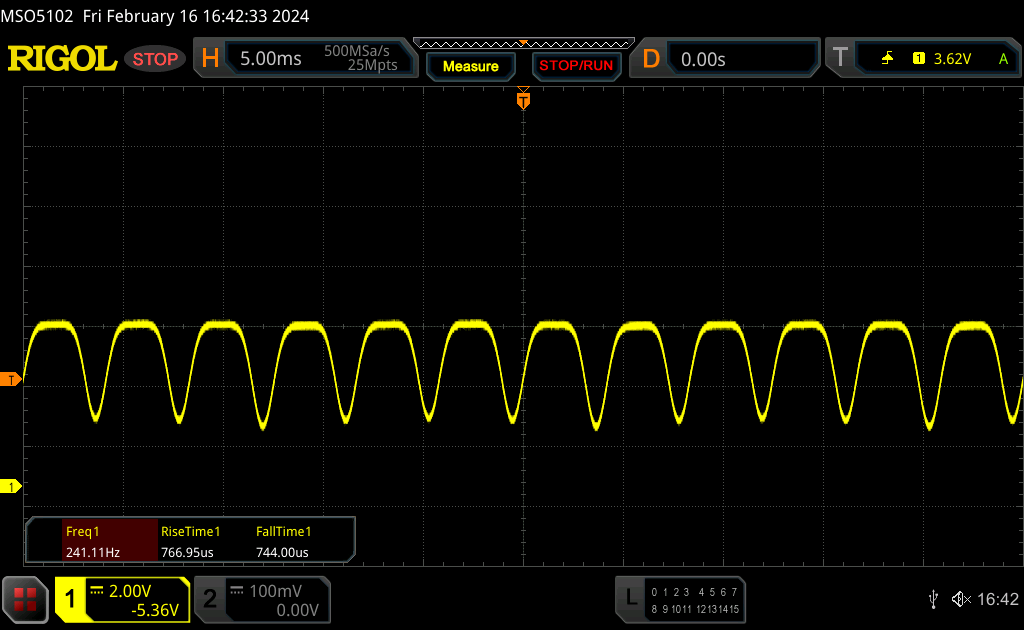 |
Le rétroéclairage de l'écran scintille à la fréquence de 240 Hz (certainement du fait de l'utilisation d'une MDI - Modulation de largeur d'impulsion) à un niveau de luminosité inférieur ou égal à 42 % . Aucun scintillement ne devrait être perceptible au-dessus de cette valeur. La fréquence de rafraîchissement de 240 Hz est relativement faible, les personnes les plus sensibles devraient percevoir un scintillement et être sujettes à une fatigue oculaire accrue (avec le niveau de luminosité indiqué) En comparaison, 52 % des appareils testés n'emploient pas MDI pour assombrir leur écran. Nous avons relevé une moyenne à 7757 (minimum : 5 - maximum : 343500) Hz dans le cas où une MDI était active. | |||
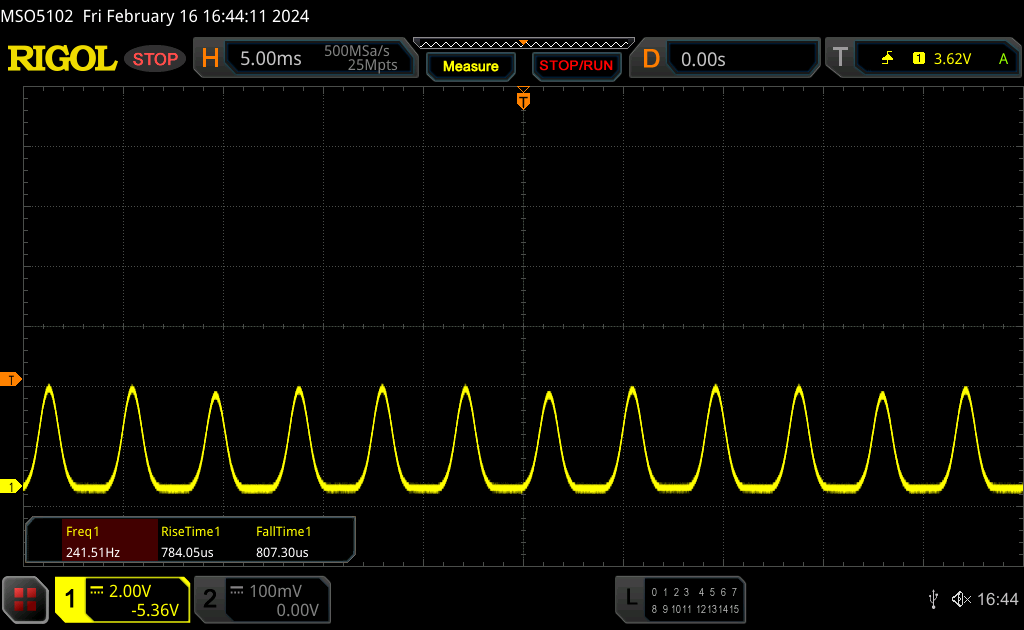
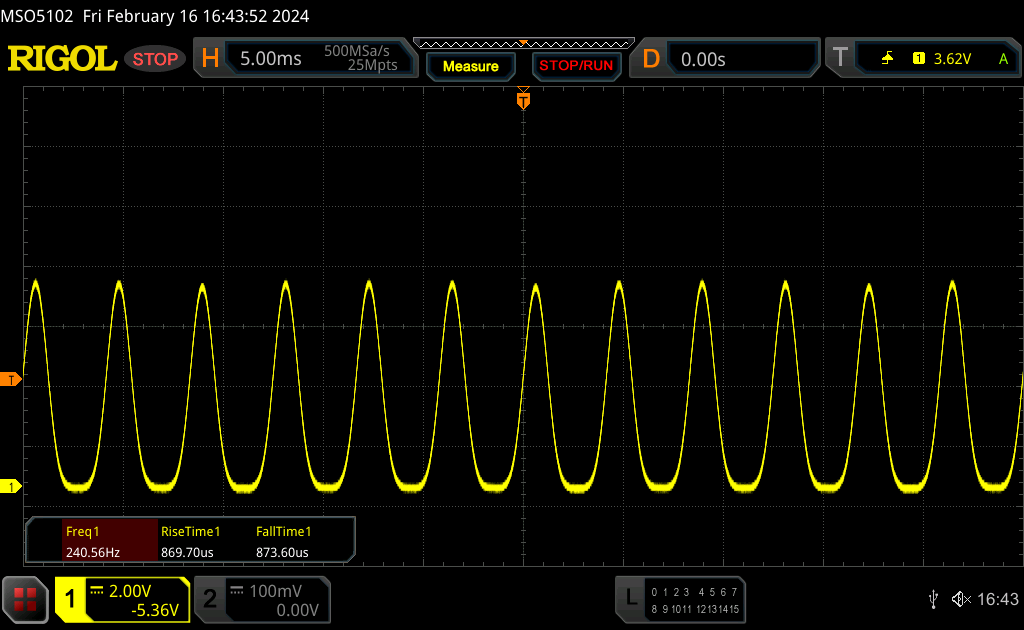
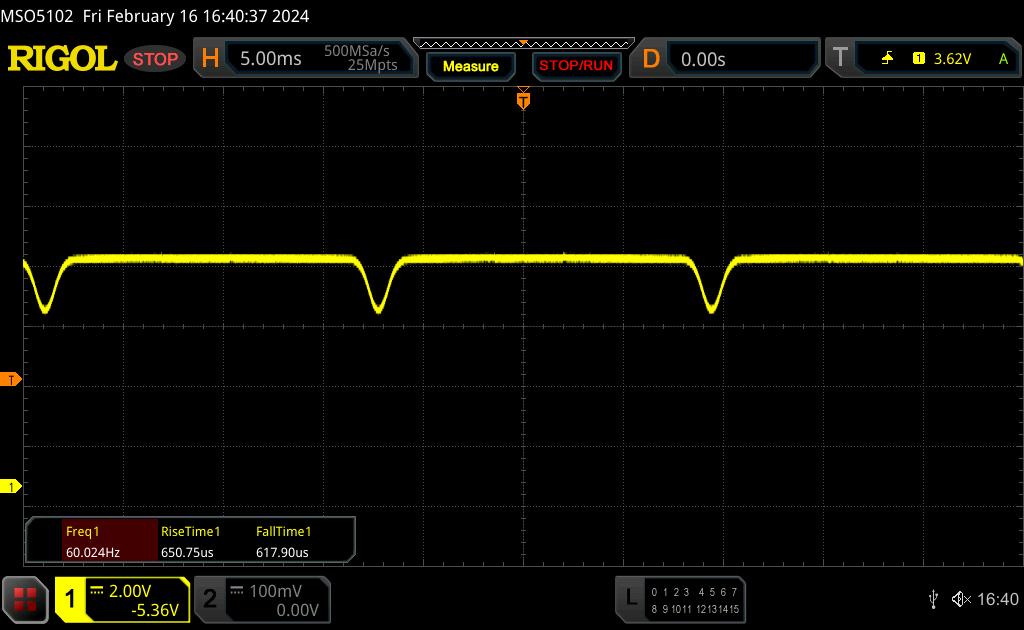
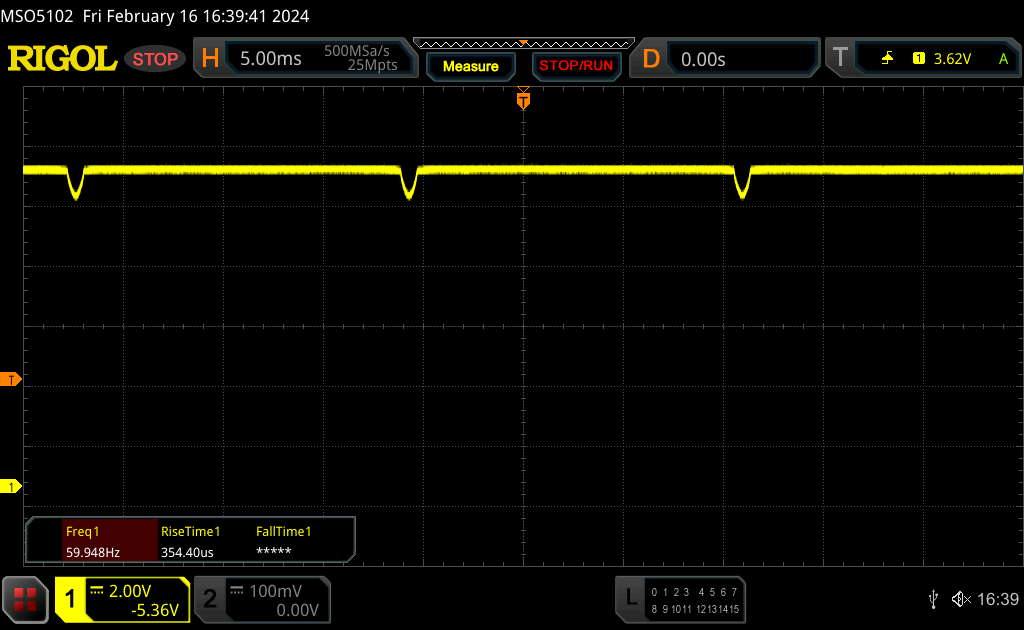
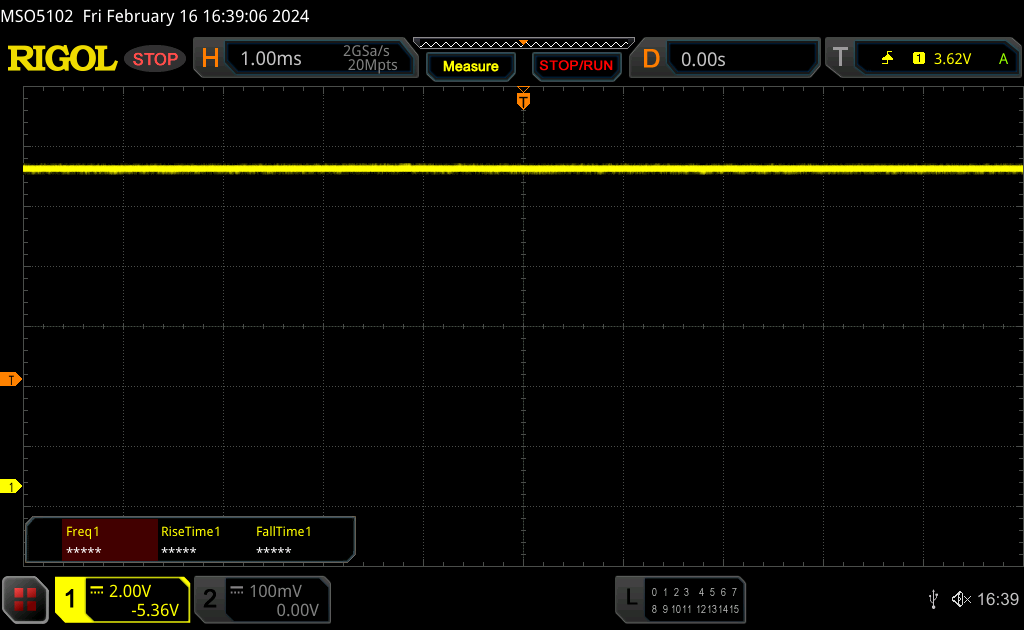
Avec le PWM utilisé, nous avons mesuré la gradation DC à 60 Hz dans la plage de luminosité de 43 à 84 % ; à 42 % ou moins, le scintillement PWM à 240 Hz, potentiellement plus nocif, entre en jeu.
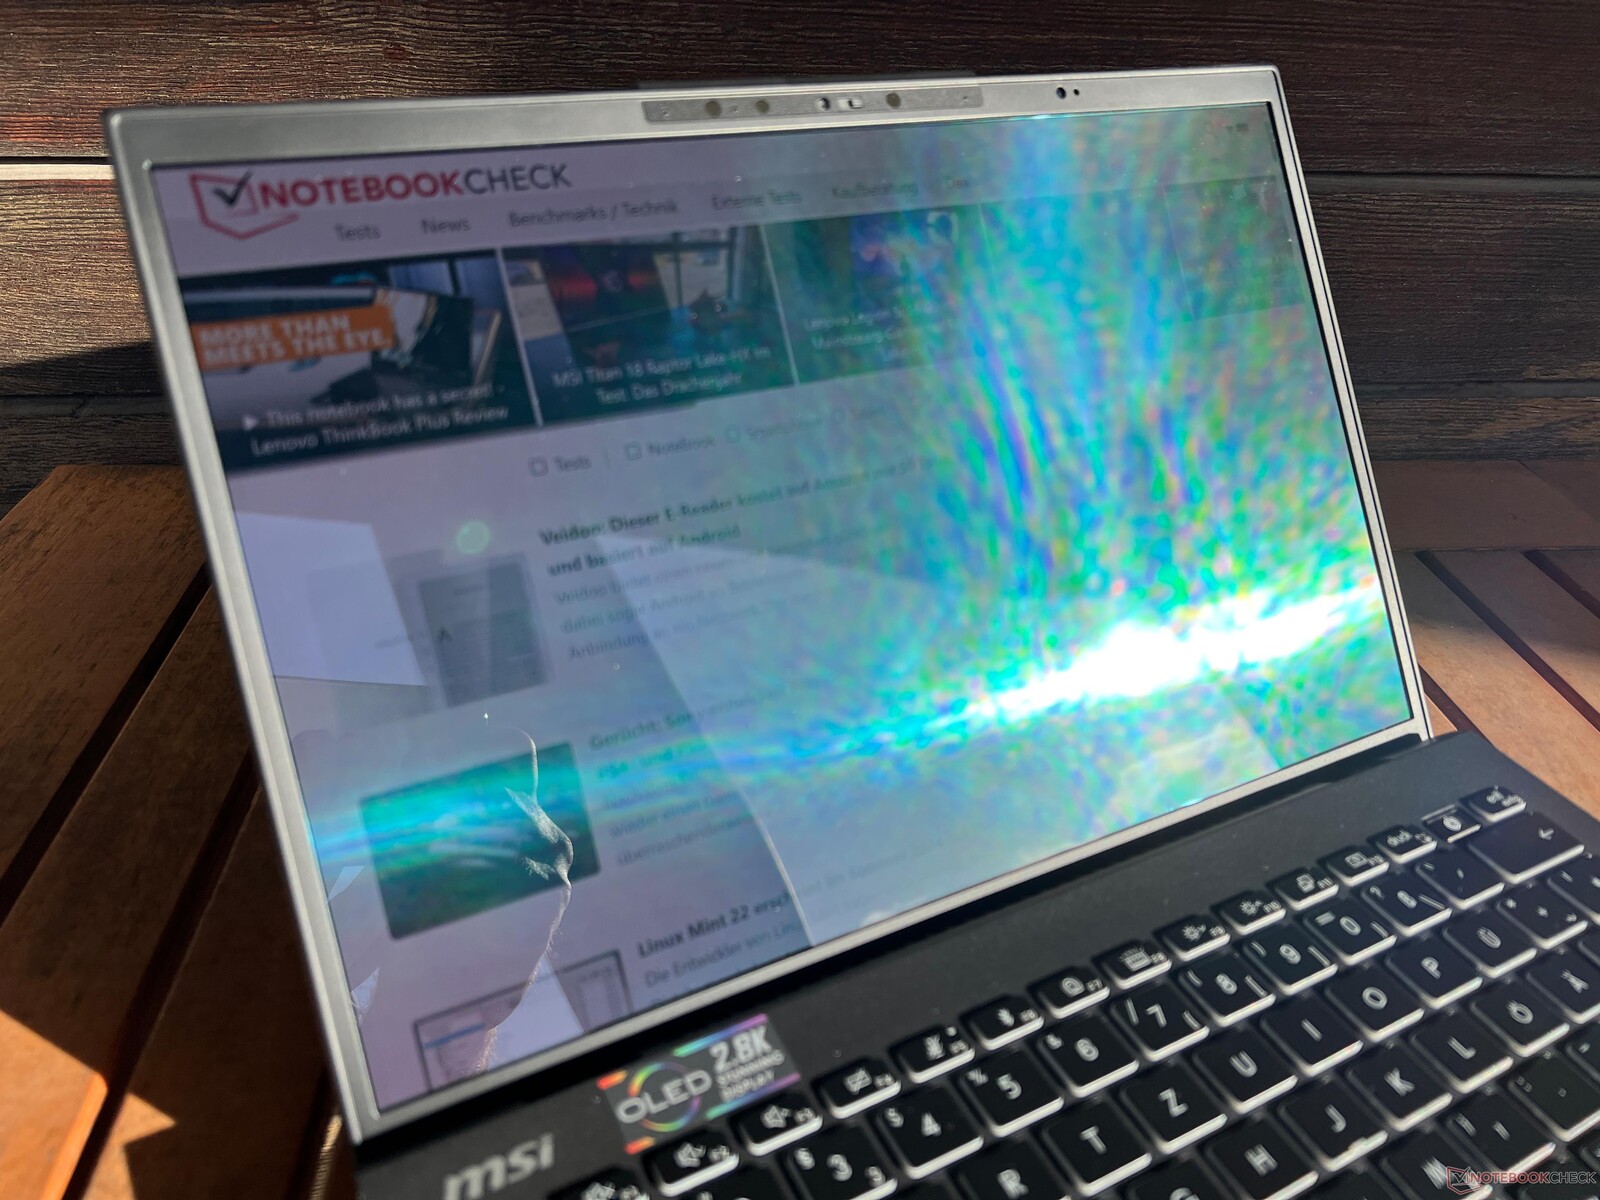
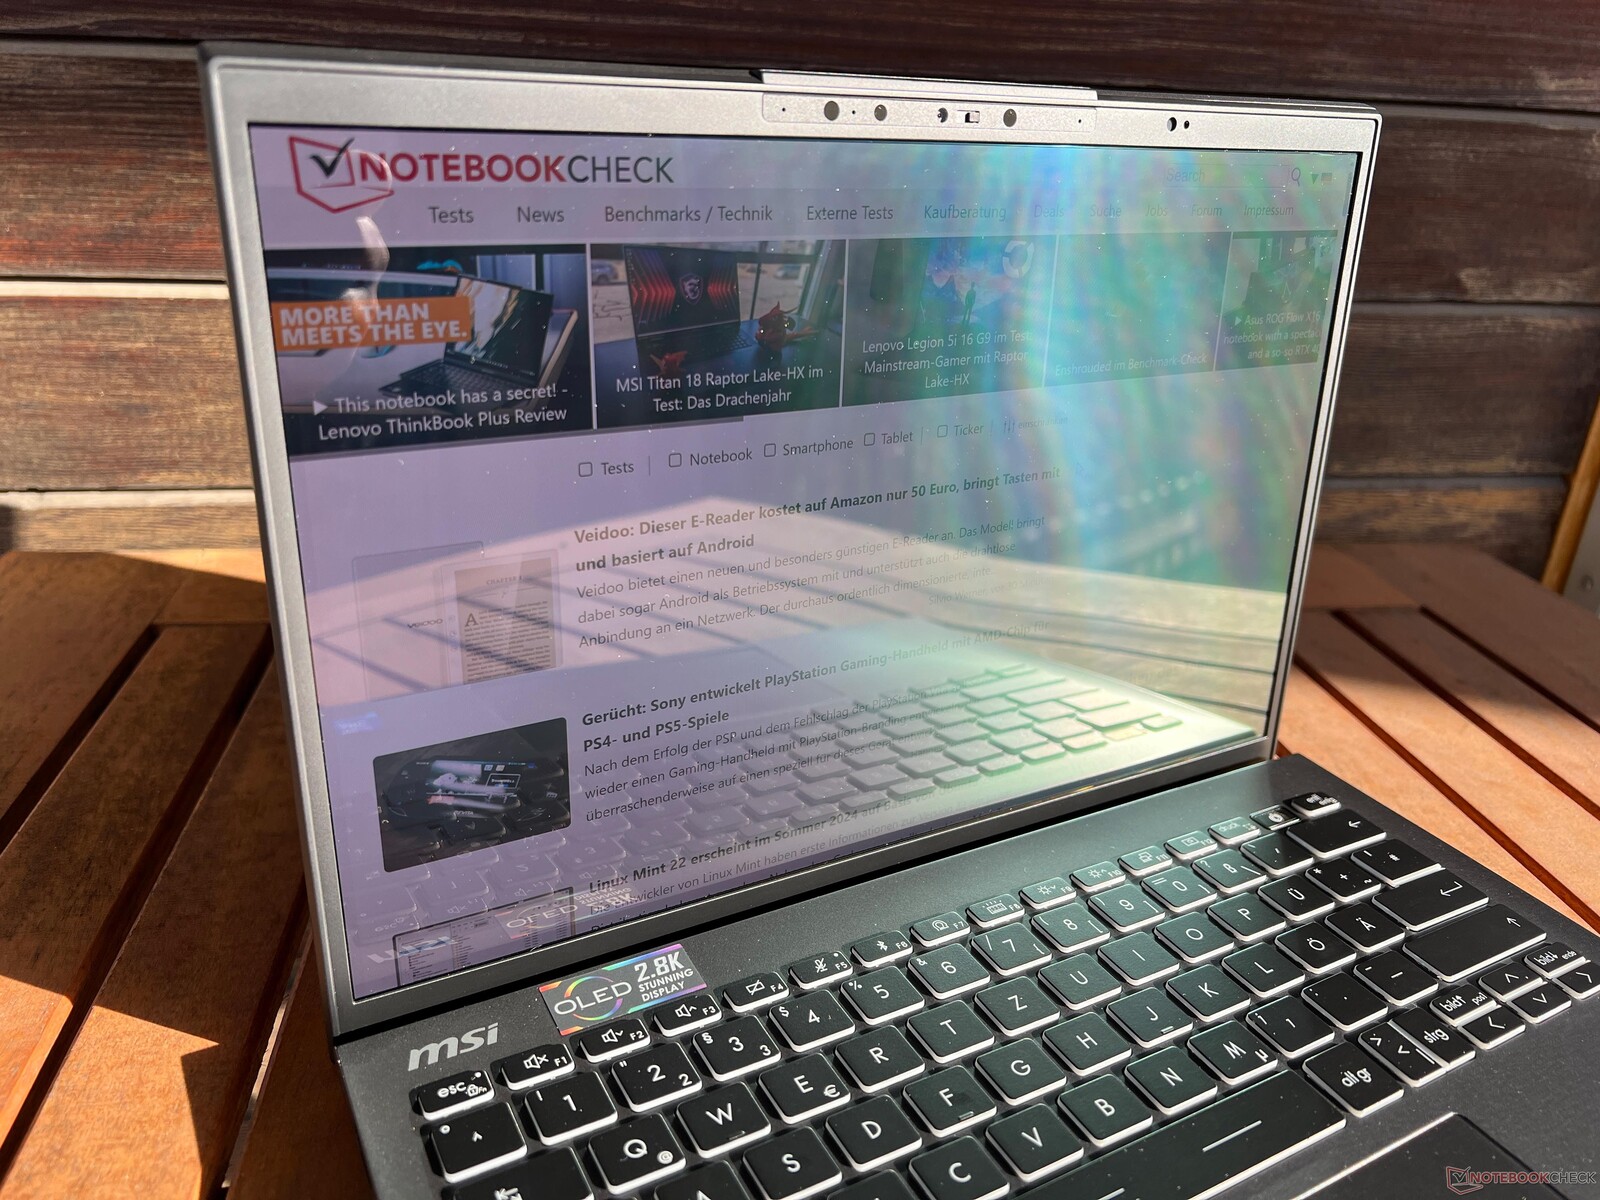

Dans un environnement lumineux, les reflets deviennent rapidement un problème sur l'écran brillant. La stabilité de l'angle de vue est excellente, seuls les angles extrêmes entraînent le scintillement bleu typique des OLED.

Performance - Meteor Lake-H à 20 watts
Conditions d'essai
Le MSI Center préinstallé propose plusieurs profils énergétiques, mais nous n'avons pas noté de grandes différences entre les différents profils (à l'exception du mode silencieux ). Nous avons ensuite effectué les tests et mesures suivants en utilisant le mode MSI AI Engine, qui est également installé en standard.
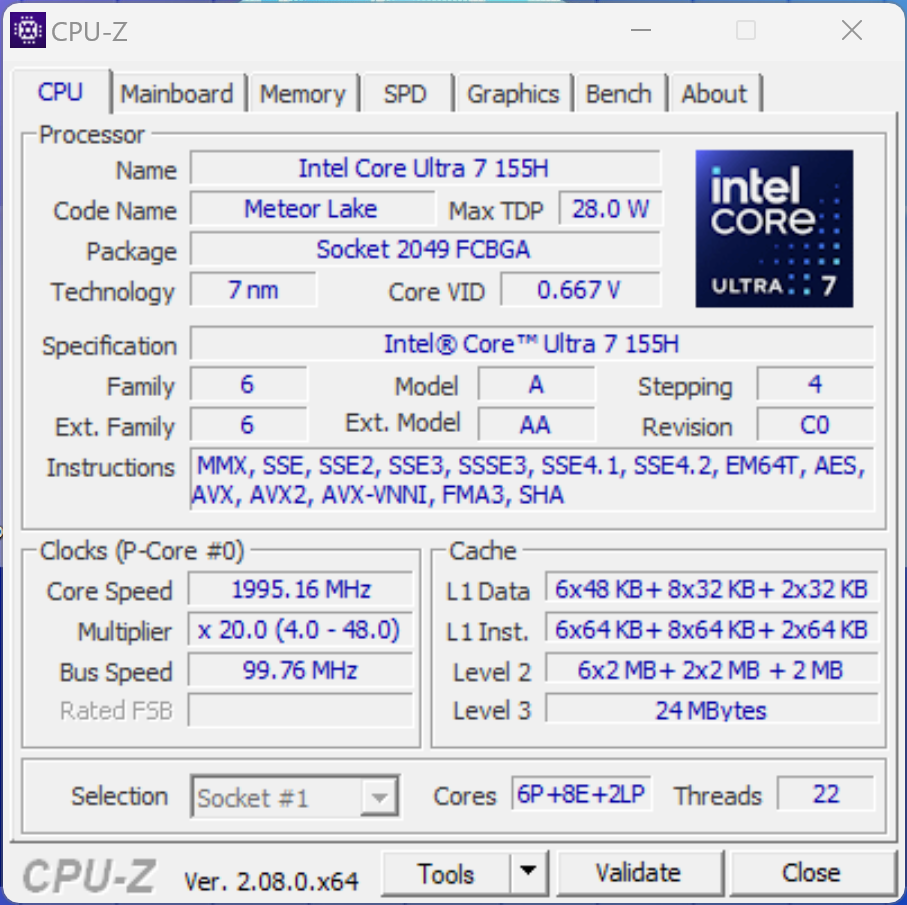
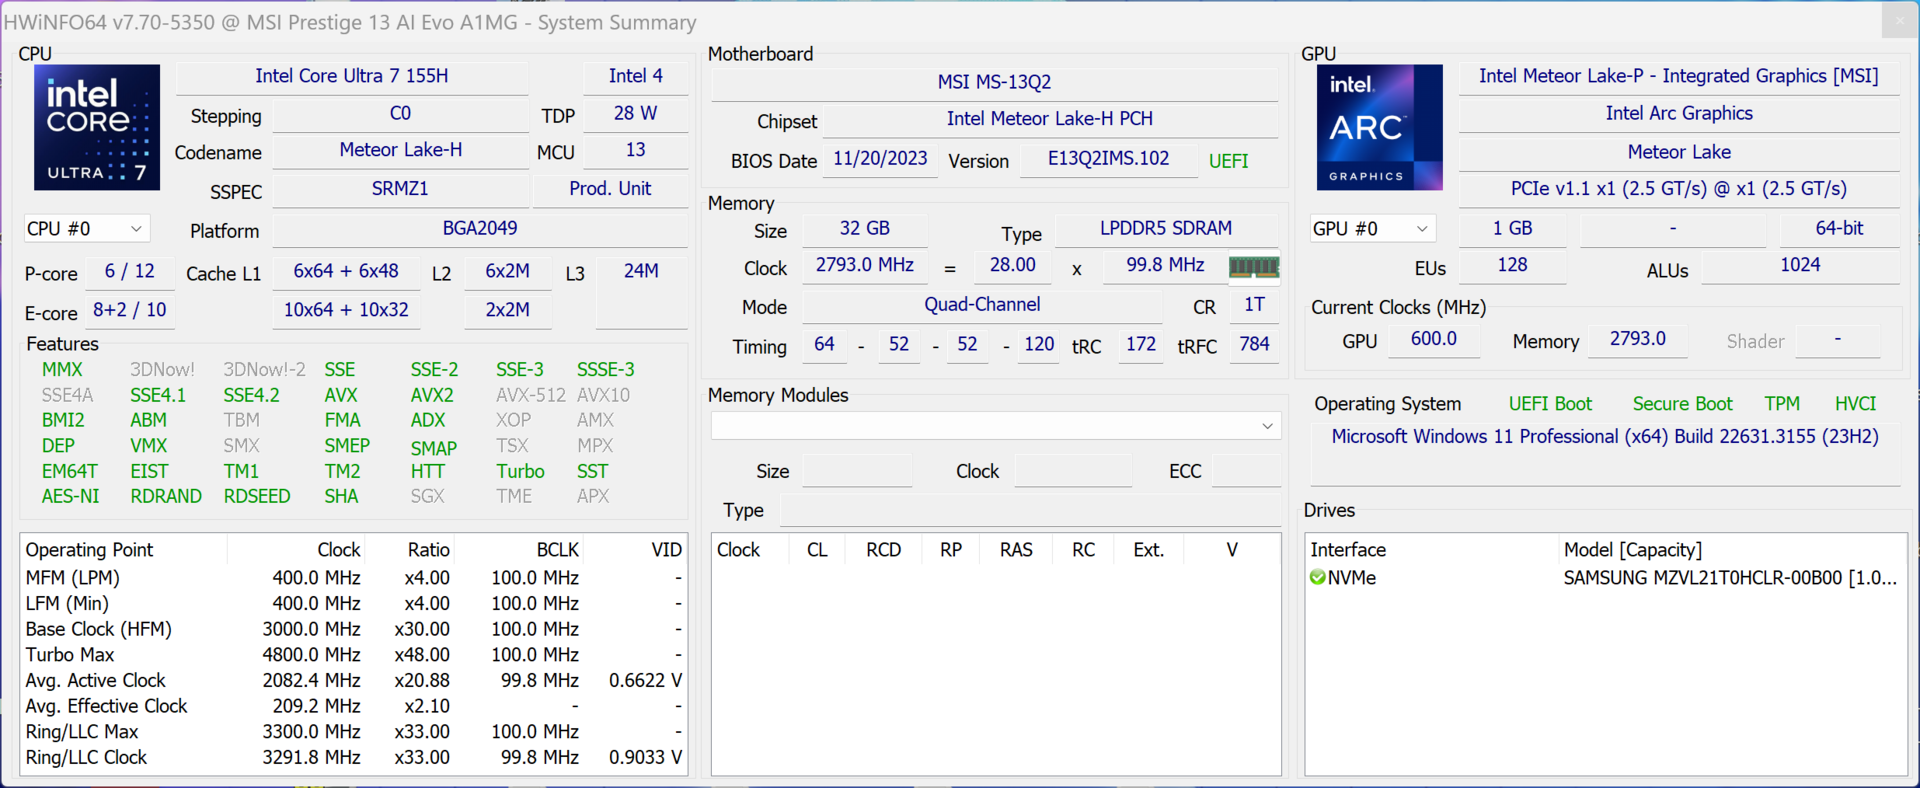
Processeur - Core Ultra 7 155H
MSI a équipé l'ordinateur portable du nouveau Meteor-Lake Core Ultra 7 155H d'Intel, qui peut être utilisée dans une zone de TDP comprise entre 28 et 115 watts. Dans le cas du Prestige 13, nous avons noté un maximum de 64 watts pendant environ 30 secondes lorsque l'appareil était froid, après quoi sa consommation a chuté à 20 watts. Un processeur de la série U aurait probablement été un meilleur choix, mais comme ces processeurs ne disposent que de 2 cœurs P rapides, leurs performances sont plutôt modestes. Sous une charge de courte durée (ce qui est beaucoup plus probable sur un subnotebook), sa performance multi-core est bien sûr très bonne. Sa performance monocore est correcte, mais dans ce domaine, les CPU Meteor-Lake ne montrent aucun avantage par rapport aux anciens modèles Raptor-Lake. En utilisation sur batterie, les performances du processeur restent constantes. Vous trouverez d'autres tests de performances du processeur ici.
Cinebench R15 Multi continuous test
Cinebench R23: Multi Core | Single Core
Cinebench R20: CPU (Multi Core) | CPU (Single Core)
Cinebench R15: CPU Multi 64Bit | CPU Single 64Bit
Blender: v2.79 BMW27 CPU
7-Zip 18.03: 7z b 4 | 7z b 4 -mmt1
Geekbench 6.7: Multi-Core | Single-Core
Geekbench 5.5: Multi-Core | Single-Core
HWBOT x265 Benchmark v2.2: 4k Preset
LibreOffice : 20 Documents To PDF
R Benchmark 2.5: Overall mean
| CPU Performance rating | |
| Moyenne Intel Core Ultra 7 155H | |
| Moyenne de la classe Subnotebook | |
| MSI Prestige 13 AI Evo | |
| Lenovo ThinkPad X1 Nano Gen 3 | |
| HP Dragonfly G4 -2! | |
| Asus ZenBook S13 OLED UX5304 -2! | |
| Dell Latitude 13 7340 i5-1345U -2! | |
| Cinebench R23 / Multi Core | |
| Moyenne Intel Core Ultra 7 155H (9769 - 19007, n=52) | |
| Moyenne de la classe Subnotebook (1555 - 21812, n=60, 2 dernières années) | |
| MSI Prestige 13 AI Evo | |
| Lenovo ThinkPad X1 Nano Gen 3 | |
| Dell Latitude 13 7340 i5-1345U | |
| HP Dragonfly G4 | |
| Asus ZenBook S13 OLED UX5304 | |
| Cinebench R23 / Single Core | |
| HP Dragonfly G4 | |
| Moyenne de la classe Subnotebook (358 - 2213, n=61, 2 dernières années) | |
| Asus ZenBook S13 OLED UX5304 | |
| Moyenne Intel Core Ultra 7 155H (1496 - 1815, n=52) | |
| Dell Latitude 13 7340 i5-1345U | |
| Lenovo ThinkPad X1 Nano Gen 3 | |
| MSI Prestige 13 AI Evo | |
| Cinebench R20 / CPU (Multi Core) | |
| Moyenne Intel Core Ultra 7 155H (3798 - 7409, n=50) | |
| Moyenne de la classe Subnotebook (579 - 8541, n=57, 2 dernières années) | |
| MSI Prestige 13 AI Evo | |
| Lenovo ThinkPad X1 Nano Gen 3 | |
| Dell Latitude 13 7340 i5-1345U | |
| HP Dragonfly G4 | |
| Asus ZenBook S13 OLED UX5304 | |
| Cinebench R20 / CPU (Single Core) | |
| HP Dragonfly G4 | |
| Asus ZenBook S13 OLED UX5304 | |
| Lenovo ThinkPad X1 Nano Gen 3 | |
| Moyenne Intel Core Ultra 7 155H (601 - 696, n=50) | |
| Dell Latitude 13 7340 i5-1345U | |
| Moyenne de la classe Subnotebook (128 - 832, n=57, 2 dernières années) | |
| MSI Prestige 13 AI Evo | |
| Cinebench R15 / CPU Multi 64Bit | |
| Moyenne Intel Core Ultra 7 155H (1932 - 2880, n=56) | |
| MSI Prestige 13 AI Evo | |
| Moyenne de la classe Subnotebook (327 - 3345, n=57, 2 dernières années) | |
| Lenovo ThinkPad X1 Nano Gen 3 | |
| Asus ZenBook S13 OLED UX5304 | |
| HP Dragonfly G4 | |
| Dell Latitude 13 7340 i5-1345U | |
| Cinebench R15 / CPU Single 64Bit | |
| Moyenne de la classe Subnotebook (72.4 - 322, n=57, 2 dernières années) | |
| HP Dragonfly G4 | |
| Moyenne Intel Core Ultra 7 155H (99.6 - 268, n=52) | |
| Asus ZenBook S13 OLED UX5304 | |
| MSI Prestige 13 AI Evo | |
| Dell Latitude 13 7340 i5-1345U | |
| Lenovo ThinkPad X1 Nano Gen 3 | |
| Blender / v2.79 BMW27 CPU | |
| Dell Latitude 13 7340 i5-1345U | |
| Asus ZenBook S13 OLED UX5304 | |
| Asus ZenBook S13 OLED UX5304 | |
| HP Dragonfly G4 | |
| Lenovo ThinkPad X1 Nano Gen 3 | |
| Moyenne de la classe Subnotebook (159 - 2271, n=58, 2 dernières années) | |
| MSI Prestige 13 AI Evo | |
| Moyenne Intel Core Ultra 7 155H (175 - 381, n=47) | |
| 7-Zip 18.03 / 7z b 4 | |
| Moyenne Intel Core Ultra 7 155H (41739 - 70254, n=50) | |
| Moyenne de la classe Subnotebook (11668 - 77867, n=57, 2 dernières années) | |
| MSI Prestige 13 AI Evo | |
| HP Dragonfly G4 | |
| Lenovo ThinkPad X1 Nano Gen 3 | |
| Asus ZenBook S13 OLED UX5304 | |
| Dell Latitude 13 7340 i5-1345U | |
| 7-Zip 18.03 / 7z b 4 -mmt1 | |
| HP Dragonfly G4 | |
| Lenovo ThinkPad X1 Nano Gen 3 | |
| Asus ZenBook S13 OLED UX5304 | |
| Moyenne de la classe Subnotebook (2643 - 6699, n=59, 2 dernières années) | |
| MSI Prestige 13 AI Evo | |
| Moyenne Intel Core Ultra 7 155H (4594 - 5621, n=50) | |
| Dell Latitude 13 7340 i5-1345U | |
| Geekbench 6.7 / Multi-Core | |
| Moyenne de la classe Subnotebook (2244 - 20325, n=63, 2 dernières années) | |
| Moyenne Intel Core Ultra 7 155H (7732 - 13656, n=55) | |
| Lenovo ThinkPad X1 Nano Gen 3 | |
| MSI Prestige 13 AI Evo | |
| Geekbench 6.7 / Single-Core | |
| Moyenne de la classe Subnotebook (960 - 4195, n=62, 2 dernières années) | |
| Lenovo ThinkPad X1 Nano Gen 3 | |
| MSI Prestige 13 AI Evo | |
| Moyenne Intel Core Ultra 7 155H (1901 - 2473, n=52) | |
| Geekbench 5.5 / Multi-Core | |
| Moyenne Intel Core Ultra 7 155H (10017 - 13556, n=52) | |
| Moyenne de la classe Subnotebook (2557 - 17218, n=48, 2 dernières années) | |
| MSI Prestige 13 AI Evo | |
| Lenovo ThinkPad X1 Nano Gen 3 | |
| HP Dragonfly G4 | |
| Asus ZenBook S13 OLED UX5304 | |
| Dell Latitude 13 7340 i5-1345U | |
| Geekbench 5.5 / Single-Core | |
| Moyenne de la classe Subnotebook (726 - 2224, n=48, 2 dernières années) | |
| HP Dragonfly G4 | |
| Lenovo ThinkPad X1 Nano Gen 3 | |
| Asus ZenBook S13 OLED UX5304 | |
| MSI Prestige 13 AI Evo | |
| Moyenne Intel Core Ultra 7 155H (1462 - 1824, n=52) | |
| Dell Latitude 13 7340 i5-1345U | |
| HWBOT x265 Benchmark v2.2 / 4k Preset | |
| Moyenne Intel Core Ultra 7 155H (9.93 - 21.2, n=50) | |
| Moyenne de la classe Subnotebook (0.97 - 25.1, n=57, 2 dernières années) | |
| MSI Prestige 13 AI Evo | |
| Lenovo ThinkPad X1 Nano Gen 3 | |
| HP Dragonfly G4 | |
| Asus ZenBook S13 OLED UX5304 | |
| Dell Latitude 13 7340 i5-1345U | |
| LibreOffice / 20 Documents To PDF | |
| Moyenne de la classe Subnotebook (39.9 - 220, n=56, 2 dernières années) | |
| Lenovo ThinkPad X1 Nano Gen 3 | |
| Moyenne Intel Core Ultra 7 155H (37.5 - 79.2, n=49) | |
| Asus ZenBook S13 OLED UX5304 | |
| HP Dragonfly G4 | |
| MSI Prestige 13 AI Evo | |
| Dell Latitude 13 7340 i5-1345U | |
| R Benchmark 2.5 / Overall mean | |
| Moyenne de la classe Subnotebook (0.4024 - 1.456, n=58, 2 dernières années) | |
| Dell Latitude 13 7340 i5-1345U | |
| Lenovo ThinkPad X1 Nano Gen 3 | |
| Moyenne Intel Core Ultra 7 155H (0.4457 - 0.53, n=49) | |
| Asus ZenBook S13 OLED UX5304 | |
| MSI Prestige 13 AI Evo | |
| HP Dragonfly G4 | |
* ... Moindre est la valeur, meilleures sont les performances
AIDA64: FP32 Ray-Trace | FPU Julia | CPU SHA3 | CPU Queen | FPU SinJulia | FPU Mandel | CPU AES | CPU ZLib | FP64 Ray-Trace | CPU PhotoWorxx
| Performance rating | |
| Moyenne Intel Core Ultra 7 155H | |
| Moyenne de la classe Subnotebook | |
| MSI Prestige 13 AI Evo | |
| Lenovo ThinkPad X1 Nano Gen 3 | |
| HP Dragonfly G4 | |
| Asus ZenBook S13 OLED UX5304 | |
| Dell Latitude 13 7340 i5-1345U | |
| AIDA64 / FP32 Ray-Trace | |
| Moyenne de la classe Subnotebook (1135 - 32888, n=58, 2 dernières années) | |
| Moyenne Intel Core Ultra 7 155H (6670 - 18470, n=50) | |
| Lenovo ThinkPad X1 Nano Gen 3 | |
| HP Dragonfly G4 | |
| MSI Prestige 13 AI Evo | |
| Asus ZenBook S13 OLED UX5304 | |
| Dell Latitude 13 7340 i5-1345U | |
| AIDA64 / FPU Julia | |
| Moyenne Intel Core Ultra 7 155H (40905 - 93181, n=50) | |
| Moyenne de la classe Subnotebook (5218 - 123315, n=58, 2 dernières années) | |
| MSI Prestige 13 AI Evo | |
| Lenovo ThinkPad X1 Nano Gen 3 | |
| HP Dragonfly G4 | |
| Asus ZenBook S13 OLED UX5304 | |
| Dell Latitude 13 7340 i5-1345U | |
| AIDA64 / CPU SHA3 | |
| Moyenne Intel Core Ultra 7 155H (1940 - 4436, n=50) | |
| Moyenne de la classe Subnotebook (444 - 5287, n=58, 2 dernières années) | |
| MSI Prestige 13 AI Evo | |
| Lenovo ThinkPad X1 Nano Gen 3 | |
| HP Dragonfly G4 | |
| Asus ZenBook S13 OLED UX5304 | |
| Dell Latitude 13 7340 i5-1345U | |
| AIDA64 / CPU Queen | |
| Lenovo ThinkPad X1 Nano Gen 3 | |
| Moyenne Intel Core Ultra 7 155H (64698 - 94181, n=50) | |
| HP Dragonfly G4 | |
| Asus ZenBook S13 OLED UX5304 | |
| MSI Prestige 13 AI Evo | |
| Dell Latitude 13 7340 i5-1345U | |
| Moyenne de la classe Subnotebook (10579 - 95002, n=49, 2 dernières années) | |
| AIDA64 / FPU SinJulia | |
| Moyenne Intel Core Ultra 7 155H (5639 - 10647, n=50) | |
| Moyenne de la classe Subnotebook (744 - 18418, n=58, 2 dernières années) | |
| MSI Prestige 13 AI Evo | |
| Lenovo ThinkPad X1 Nano Gen 3 | |
| HP Dragonfly G4 | |
| Asus ZenBook S13 OLED UX5304 | |
| Dell Latitude 13 7340 i5-1345U | |
| AIDA64 / FPU Mandel | |
| Moyenne Intel Core Ultra 7 155H (18236 - 47685, n=50) | |
| Moyenne de la classe Subnotebook (3341 - 65433, n=58, 2 dernières années) | |
| MSI Prestige 13 AI Evo | |
| Lenovo ThinkPad X1 Nano Gen 3 | |
| HP Dragonfly G4 | |
| Asus ZenBook S13 OLED UX5304 | |
| Dell Latitude 13 7340 i5-1345U | |
| AIDA64 / CPU AES | |
| Moyenne Intel Core Ultra 7 155H (45713 - 152179, n=50) | |
| Moyenne de la classe Subnotebook (638 - 96917, n=58, 2 dernières années) | |
| MSI Prestige 13 AI Evo | |
| Lenovo ThinkPad X1 Nano Gen 3 | |
| HP Dragonfly G4 | |
| Asus ZenBook S13 OLED UX5304 | |
| Dell Latitude 13 7340 i5-1345U | |
| AIDA64 / CPU ZLib | |
| Moyenne Intel Core Ultra 7 155H (557 - 1250, n=50) | |
| Moyenne de la classe Subnotebook (164.9 - 1379, n=58, 2 dernières années) | |
| MSI Prestige 13 AI Evo | |
| Lenovo ThinkPad X1 Nano Gen 3 | |
| HP Dragonfly G4 | |
| Asus ZenBook S13 OLED UX5304 | |
| Dell Latitude 13 7340 i5-1345U | |
| AIDA64 / FP64 Ray-Trace | |
| Moyenne de la classe Subnotebook (610 - 17495, n=58, 2 dernières années) | |
| Moyenne Intel Core Ultra 7 155H (3569 - 9802, n=50) | |
| Lenovo ThinkPad X1 Nano Gen 3 | |
| MSI Prestige 13 AI Evo | |
| HP Dragonfly G4 | |
| Asus ZenBook S13 OLED UX5304 | |
| Dell Latitude 13 7340 i5-1345U | |
| AIDA64 / CPU PhotoWorxx | |
| Moyenne de la classe Subnotebook (6569 - 85600, n=58, 2 dernières années) | |
| Moyenne Intel Core Ultra 7 155H (32719 - 54223, n=50) | |
| Lenovo ThinkPad X1 Nano Gen 3 | |
| MSI Prestige 13 AI Evo | |
| Asus ZenBook S13 OLED UX5304 | |
| HP Dragonfly G4 | |
| Dell Latitude 13 7340 i5-1345U | |
Performance du système
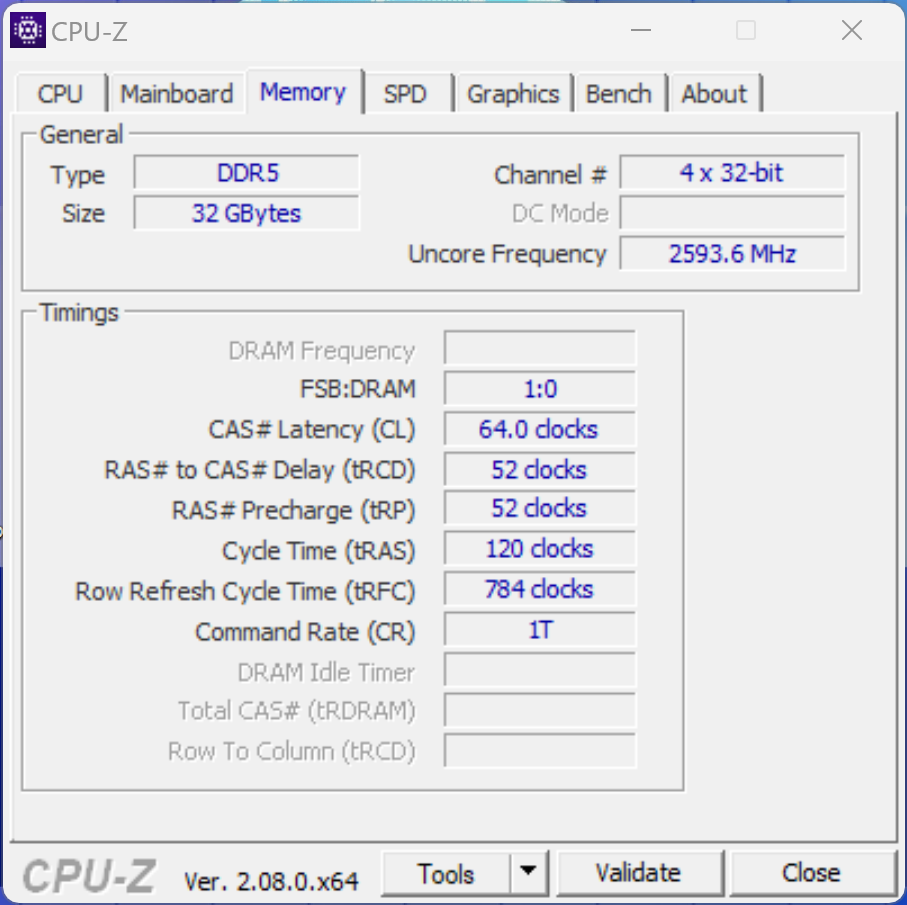
Au quotidien, le Prestige 13 compact est un compagnon rapide et réactif, en partie grâce à son stockage SSD. La configuration de la RAM de notre échantillon de test est de 32 Go, ce qui devrait être plus que suffisant pour les utilisateurs des années à venir. Au cours de nos tests, nous n'avons jamais eu de problèmes concernant la stabilité du système.
CrossMark: Overall | Productivity | Creativity | Responsiveness
WebXPRT 3: Overall
WebXPRT 4: Overall
Mozilla Kraken 1.1: Total
| PCMark 10 / Score | |
| Moyenne de la classe Subnotebook (4920 - 9939, n=45, 2 dernières années) | |
| Moyenne Intel Core Ultra 7 155H, Intel Arc 8-Core iGPU (4809 - 7529, n=34) | |
| MSI Prestige 13 AI Evo | |
| Lenovo ThinkPad X1 Nano Gen 3 | |
| HP Dragonfly G4 | |
| Asus ZenBook S13 OLED UX5304 | |
| Dell Latitude 13 7340 i5-1345U | |
| PCMark 10 / Essentials | |
| HP Dragonfly G4 | |
| Lenovo ThinkPad X1 Nano Gen 3 | |
| Asus ZenBook S13 OLED UX5304 | |
| Moyenne Intel Core Ultra 7 155H, Intel Arc 8-Core iGPU (7605 - 11289, n=34) | |
| Moyenne de la classe Subnotebook (8552 - 11646, n=45, 2 dernières années) | |
| Dell Latitude 13 7340 i5-1345U | |
| MSI Prestige 13 AI Evo | |
| PCMark 10 / Productivity | |
| Moyenne de la classe Subnotebook (5435 - 16606, n=45, 2 dernières années) | |
| Moyenne Intel Core Ultra 7 155H, Intel Arc 8-Core iGPU (6042 - 10591, n=34) | |
| MSI Prestige 13 AI Evo | |
| Lenovo ThinkPad X1 Nano Gen 3 | |
| HP Dragonfly G4 | |
| Asus ZenBook S13 OLED UX5304 | |
| Dell Latitude 13 7340 i5-1345U | |
| PCMark 10 / Digital Content Creation | |
| Moyenne de la classe Subnotebook (5722 - 13779, n=45, 2 dernières années) | |
| Moyenne Intel Core Ultra 7 155H, Intel Arc 8-Core iGPU (4985 - 10709, n=34) | |
| MSI Prestige 13 AI Evo | |
| Lenovo ThinkPad X1 Nano Gen 3 | |
| HP Dragonfly G4 | |
| Asus ZenBook S13 OLED UX5304 | |
| Dell Latitude 13 7340 i5-1345U | |
| CrossMark / Overall | |
| Lenovo ThinkPad X1 Nano Gen 3 | |
| Moyenne de la classe Subnotebook (365 - 2356, n=60, 2 dernières années) | |
| Moyenne Intel Core Ultra 7 155H, Intel Arc 8-Core iGPU (1366 - 1903, n=34) | |
| HP Dragonfly G4 | |
| Asus ZenBook S13 OLED UX5304 | |
| Dell Latitude 13 7340 i5-1345U | |
| MSI Prestige 13 AI Evo | |
| CrossMark / Productivity | |
| Lenovo ThinkPad X1 Nano Gen 3 | |
| HP Dragonfly G4 | |
| Moyenne Intel Core Ultra 7 155H, Intel Arc 8-Core iGPU (1291 - 1798, n=33) | |
| Moyenne de la classe Subnotebook (364 - 2277, n=60, 2 dernières années) | |
| Asus ZenBook S13 OLED UX5304 | |
| Dell Latitude 13 7340 i5-1345U | |
| MSI Prestige 13 AI Evo | |
| CrossMark / Creativity | |
| Lenovo ThinkPad X1 Nano Gen 3 | |
| Moyenne de la classe Subnotebook (372 - 2743, n=60, 2 dernières années) | |
| Moyenne Intel Core Ultra 7 155H, Intel Arc 8-Core iGPU (1519 - 1929, n=33) | |
| HP Dragonfly G4 | |
| Asus ZenBook S13 OLED UX5304 | |
| Dell Latitude 13 7340 i5-1345U | |
| MSI Prestige 13 AI Evo | |
| CrossMark / Responsiveness | |
| Lenovo ThinkPad X1 Nano Gen 3 | |
| Moyenne Intel Core Ultra 7 155H, Intel Arc 8-Core iGPU (939 - 1802, n=33) | |
| Asus ZenBook S13 OLED UX5304 | |
| HP Dragonfly G4 | |
| Moyenne de la classe Subnotebook (312 - 1854, n=60, 2 dernières années) | |
| Dell Latitude 13 7340 i5-1345U | |
| MSI Prestige 13 AI Evo | |
| WebXPRT 3 / Overall | |
| Moyenne de la classe Subnotebook (156 - 530, n=56, 2 dernières années) | |
| Lenovo ThinkPad X1 Nano Gen 3 | |
| HP Dragonfly G4 | |
| Asus ZenBook S13 OLED UX5304 | |
| Moyenne Intel Core Ultra 7 155H, Intel Arc 8-Core iGPU (252 - 299, n=34) | |
| MSI Prestige 13 AI Evo | |
| WebXPRT 4 / Overall | |
| Moyenne de la classe Subnotebook (132 - 378, n=61, 2 dernières années) | |
| Lenovo ThinkPad X1 Nano Gen 3 | |
| HP Dragonfly G4 | |
| Asus ZenBook S13 OLED UX5304 | |
| Moyenne Intel Core Ultra 7 155H, Intel Arc 8-Core iGPU (166.4 - 309, n=29) | |
| MSI Prestige 13 AI Evo | |
| Mozilla Kraken 1.1 / Total | |
| Dell Latitude 13 7340 i5-1345U | |
| MSI Prestige 13 AI Evo | |
| Moyenne Intel Core Ultra 7 155H, Intel Arc 8-Core iGPU (517 - 614, n=35) | |
| Asus ZenBook S13 OLED UX5304 | |
| Lenovo ThinkPad X1 Nano Gen 3 | |
| HP Dragonfly G4 | |
| Moyenne de la classe Subnotebook (234 - 1104, n=61, 2 dernières années) | |
* ... Moindre est la valeur, meilleures sont les performances
| PCMark 10 Score | 5952 points | |
Aide | ||
| AIDA64 / Memory Copy | |
| Moyenne de la classe Subnotebook (14554 - 131023, n=58, 2 dernières années) | |
| Moyenne Intel Core Ultra 7 155H (62397 - 96791, n=50) | |
| MSI Prestige 13 AI Evo | |
| Lenovo ThinkPad X1 Nano Gen 3 | |
| Asus ZenBook S13 OLED UX5304 | |
| HP Dragonfly G4 | |
| Dell Latitude 13 7340 i5-1345U | |
| AIDA64 / Memory Read | |
| Moyenne de la classe Subnotebook (15948 - 127174, n=58, 2 dernières années) | |
| Moyenne Intel Core Ultra 7 155H (60544 - 90647, n=50) | |
| MSI Prestige 13 AI Evo | |
| Lenovo ThinkPad X1 Nano Gen 3 | |
| Asus ZenBook S13 OLED UX5304 | |
| HP Dragonfly G4 | |
| Dell Latitude 13 7340 i5-1345U | |
| AIDA64 / Memory Write | |
| Lenovo ThinkPad X1 Nano Gen 3 | |
| Moyenne de la classe Subnotebook (15709 - 135141, n=58, 2 dernières années) | |
| MSI Prestige 13 AI Evo | |
| Moyenne Intel Core Ultra 7 155H (58692 - 93451, n=50) | |
| Asus ZenBook S13 OLED UX5304 | |
| Dell Latitude 13 7340 i5-1345U | |
| HP Dragonfly G4 | |
| AIDA64 / Memory Latency | |
| MSI Prestige 13 AI Evo | |
| Moyenne Intel Core Ultra 7 155H (116.2 - 233, n=50) | |
| Dell Latitude 13 7340 i5-1345U | |
| Moyenne de la classe Subnotebook (6.1 - 159.9, n=56, 2 dernières années) | |
| Lenovo ThinkPad X1 Nano Gen 3 | |
| HP Dragonfly G4 | |
| Asus ZenBook S13 OLED UX5304 | |
* ... Moindre est la valeur, meilleures sont les performances
Latence DPC
Lors de notre test de latence standardisé (surf sur le web, lecture YouTube en 4K, charge du CPU), l'appareil de test avec la version actuelle du BIOS a montré quelques limites lors de l'utilisation d'applications audio en temps réel.
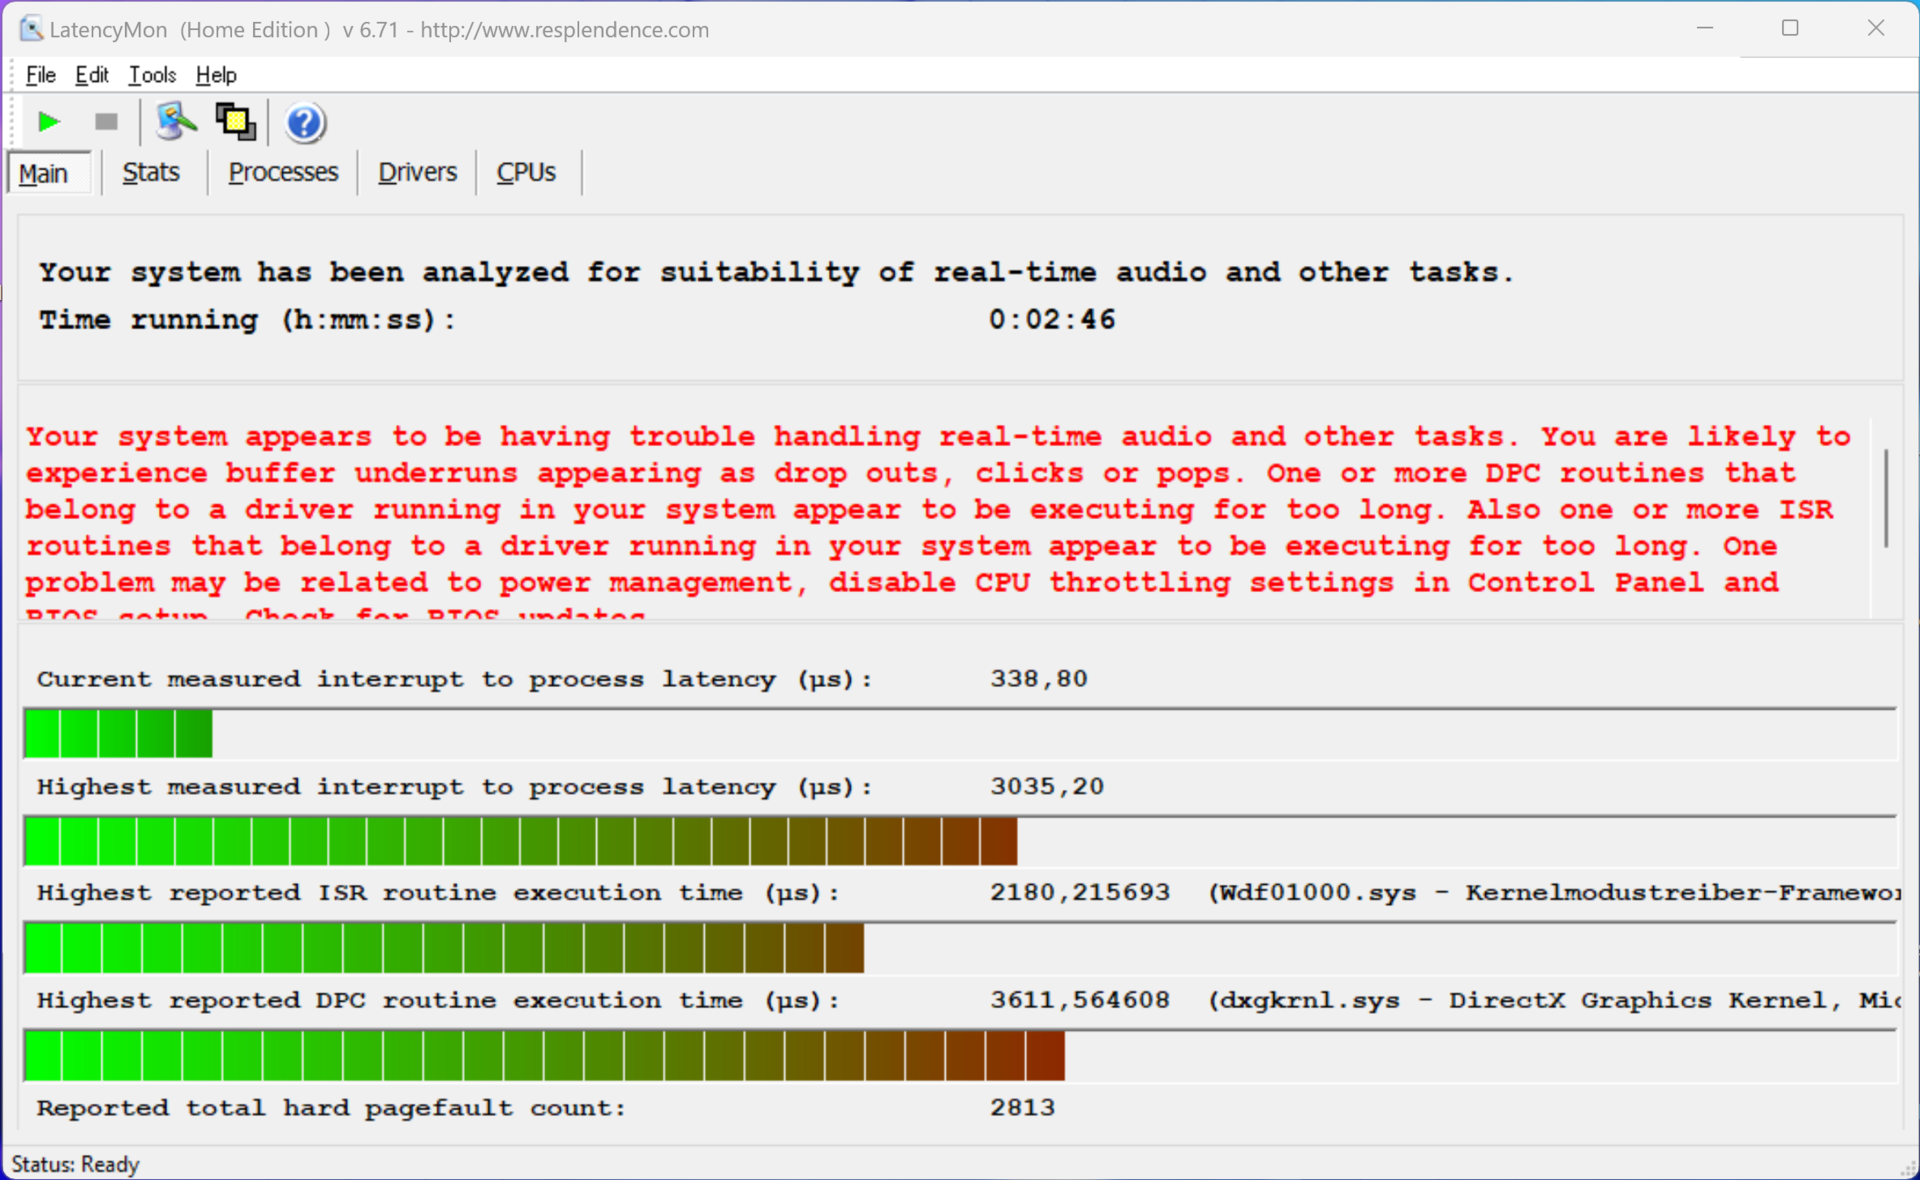
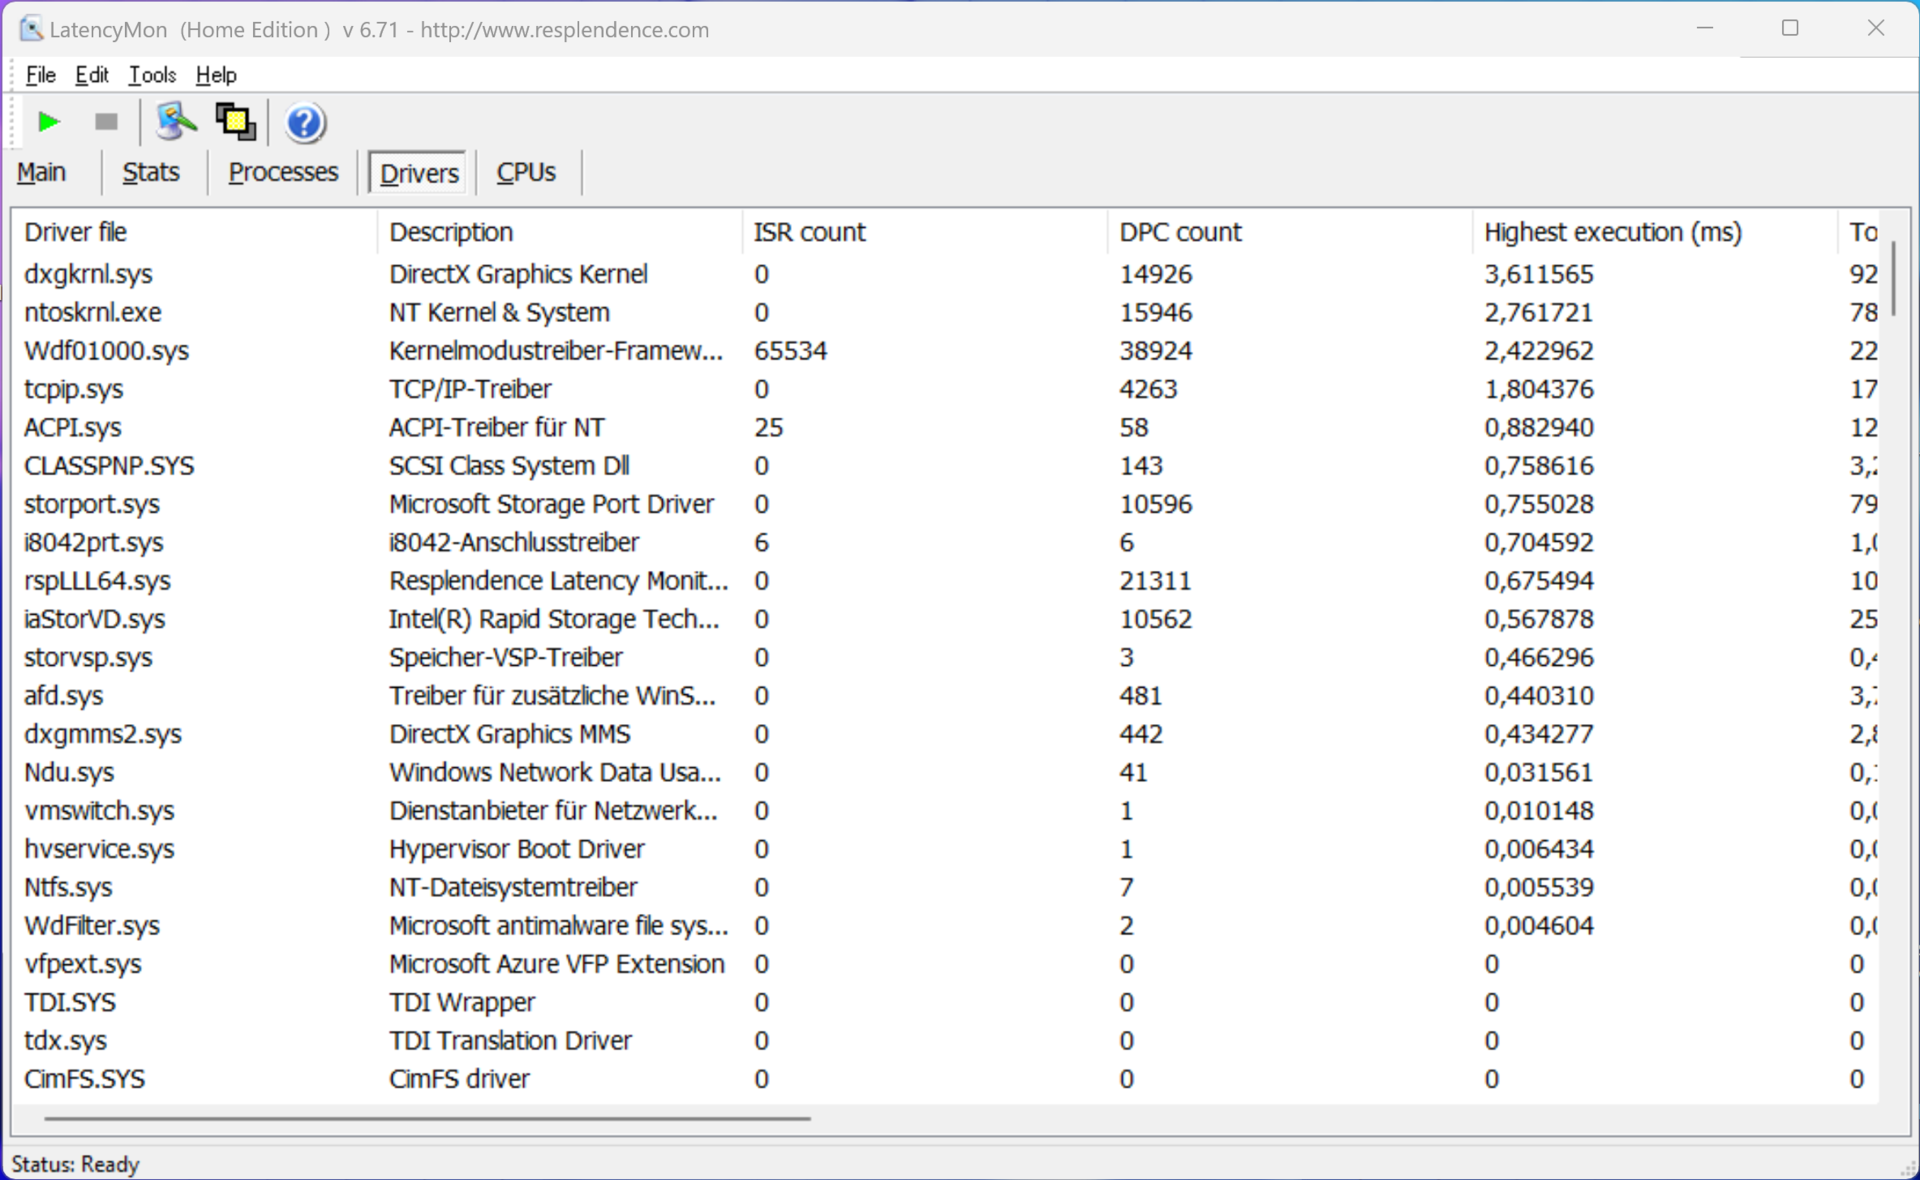
| DPC Latencies / LatencyMon - interrupt to process latency (max), Web, Youtube, Prime95 | |
| MSI Prestige 13 AI Evo | |
| Lenovo ThinkPad X1 Nano Gen 3 | |
| Dell Latitude 13 7340 i5-1345U | |
| Asus ZenBook S13 OLED UX5304 | |
| HP Dragonfly G4 | |
* ... Moindre est la valeur, meilleures sont les performances
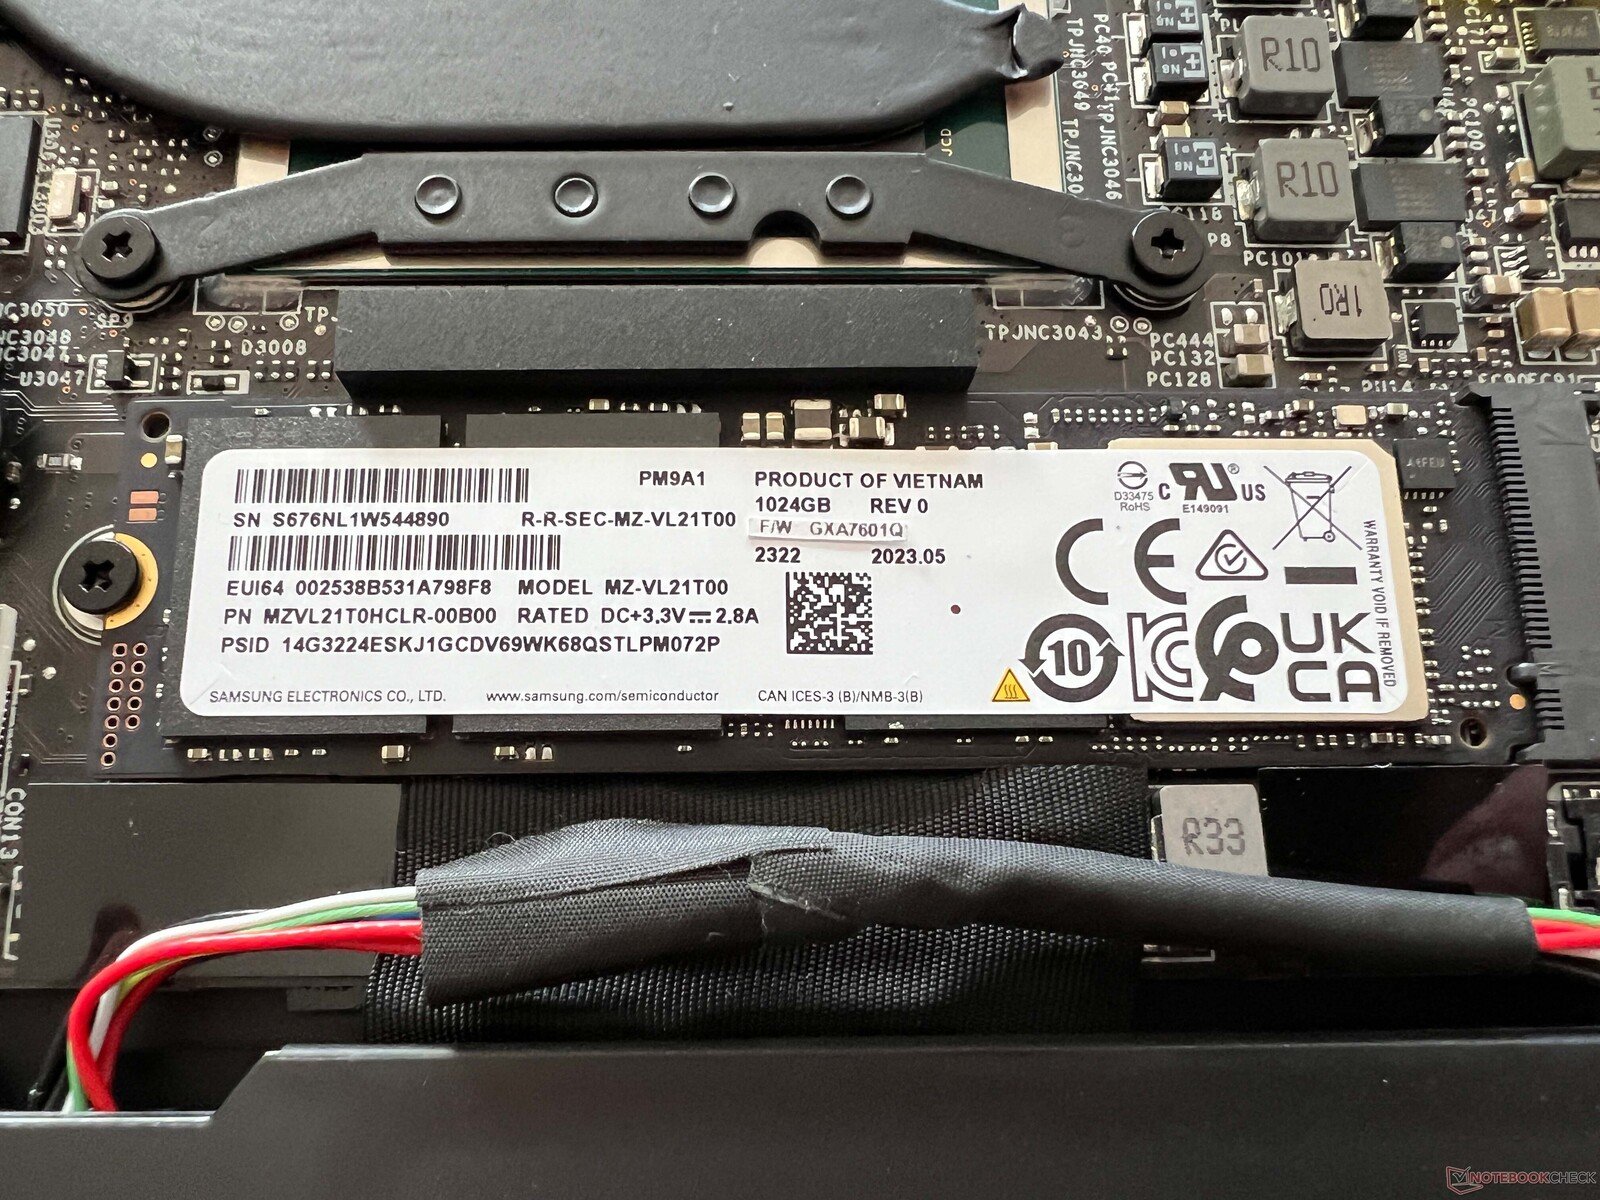
Dispositifs de stockage
Notre appareil de test est équipé de la version 1 To du Samsung PM9A1 (version OEM du 980 Pro), qui est un périphérique de stockage très rapide. Cependant, ses performances ne sont pas constantes en cas de charge permanente, mais cela ne devrait pas poser de problème dans le cadre d'une utilisation quotidienne. Après le premier démarrage de l'appareil, les utilisateurs disposent de 864 Go d'espace libre. Vous trouverez d'autres benchmarks SSD ici.

* ... Moindre est la valeur, meilleures sont les performances
Reading continuous performance: DiskSpd Read Loop, Queue Depth 8
Carte graphique
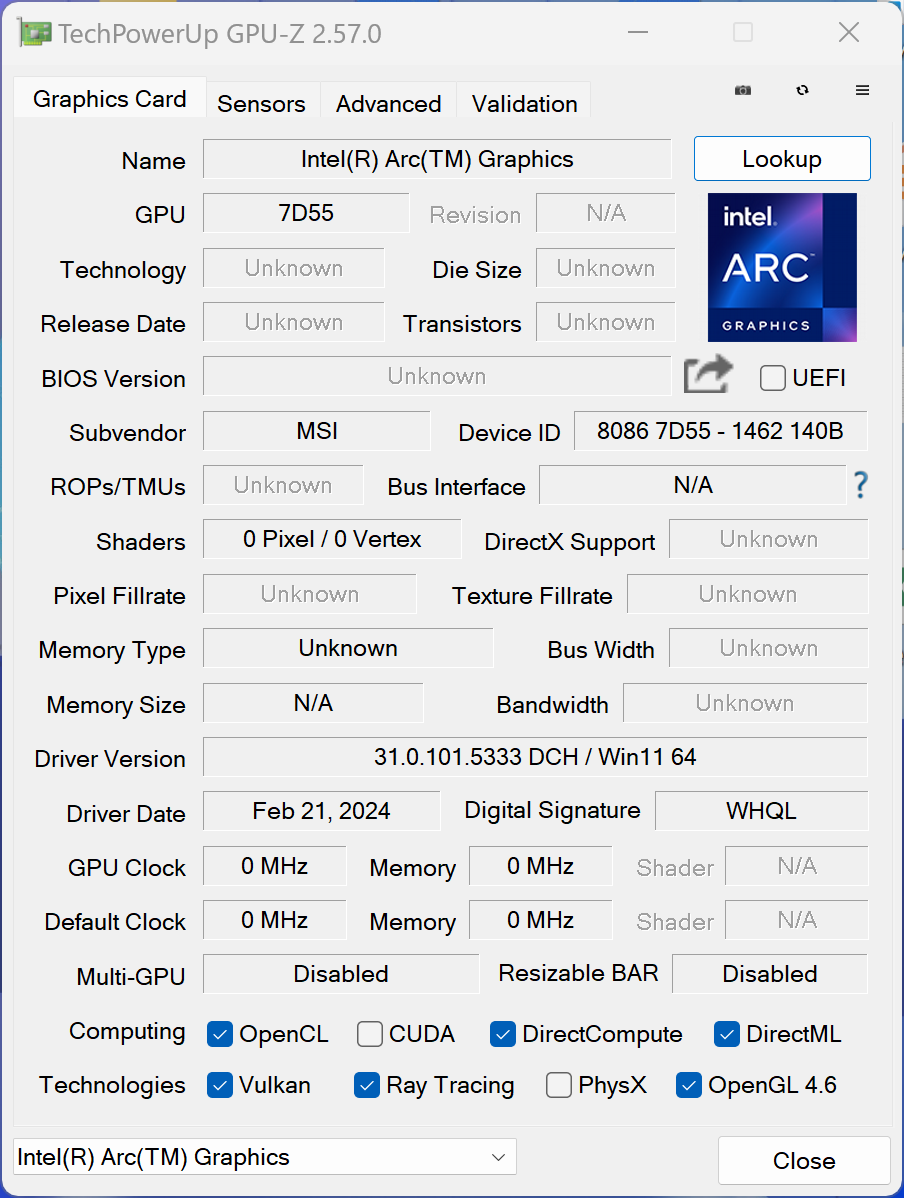
En combinaison avec le Core Ultra 7 155Hle nouveau Intel Arc Graphics offre 8 Xe-cores, mais la performance graphique totale du MSI Prestige 13 est la plus mauvaise de tous les nouveaux ordinateurs portables Meteor-Lake que nous avons testés jusqu'à présent (-32 % par rapport à la moyenne de notre base de données). Même lors des benchmarks synthétiques, le MSI n'est arrivé que légèrement devant l'ancienne carte graphique Iris Xe Graphics G7. Lorsqu'il s'agit de tâches quotidiennes telles que la lecture de vidéos en haute résolution, la MSI n'a aucun problème, mais elle ne peut tout simplement pas utiliser le nouveau iGPU à son plein potentiel.
Nous tenons à mentionner un point positif, à savoir que le MSI n'a pas subi les mêmes chutes d'images pendant les tests de jeu que le Zenbook 14 ou le HP Spectre x360 14, par exemple. Ses performances de jeu sont assez faibles en général, mais elles sont au moins stables. En ce qui concerne l'utilisation de la batterie, ses performances restent également constantes et vous trouverez d'autres tests de référence sur ici.
| 3DMark 11 Performance | 8505 points | |
| 3DMark Fire Strike Score | 5203 points | |
| 3DMark Time Spy Score | 2178 points | |
Aide | ||
| Blender / v3.3 Classroom CPU | |
| Dell Latitude 13 7340 i5-1345U | |
| Asus ZenBook S13 OLED UX5304 | |
| HP Dragonfly G4 | |
| Lenovo ThinkPad X1 Nano Gen 3 | |
| MSI Prestige 13 AI Evo | |
| Moyenne de la classe Subnotebook (241 - 861, n=60, 2 dernières années) | |
| Moyenne Intel Arc 8-Core iGPU (294 - 692, n=43) | |
* ... Moindre est la valeur, meilleures sont les performances
| Performance rating - Percent | |
| Moyenne de la classe Subnotebook | |
| MSI Prestige 13 AI Evo | |
| HP Dragonfly G4 | |
| Lenovo ThinkPad X1 Nano Gen 3 -1! | |
| Asus ZenBook S13 OLED UX5304 | |
| Dell Latitude 13 7340 i5-1345U | |
| The Witcher 3 - 1920x1080 Ultra Graphics & Postprocessing (HBAO+) | |
| Moyenne de la classe Subnotebook (13.9 - 34.6, n=13, 2 dernières années) | |
| HP Dragonfly G4 | |
| MSI Prestige 13 AI Evo | |
| Lenovo ThinkPad X1 Nano Gen 3 | |
| Asus ZenBook S13 OLED UX5304 | |
| Dell Latitude 13 7340 i5-1345U | |
| GTA V - 1920x1080 Highest AA:4xMSAA + FX AF:16x | |
| Moyenne de la classe Subnotebook (10.7 - 43.7, n=56, 2 dernières années) | |
| HP Dragonfly G4 | |
| MSI Prestige 13 AI Evo | |
| Asus ZenBook S13 OLED UX5304 | |
| Dell Latitude 13 7340 i5-1345U | |
| Final Fantasy XV Benchmark - 1920x1080 High Quality | |
| Moyenne de la classe Subnotebook (11.6 - 54.5, n=54, 2 dernières années) | |
| MSI Prestige 13 AI Evo | |
| HP Dragonfly G4 | |
| Asus ZenBook S13 OLED UX5304 | |
| Lenovo ThinkPad X1 Nano Gen 3 | |
| Dell Latitude 13 7340 i5-1345U | |
| Strange Brigade - 1920x1080 ultra AA:ultra AF:16 | |
| Moyenne de la classe Subnotebook (19 - 101.3, n=50, 2 dernières années) | |
| MSI Prestige 13 AI Evo | |
| HP Dragonfly G4 | |
| Asus ZenBook S13 OLED UX5304 | |
| Dell Latitude 13 7340 i5-1345U | |
| Lenovo ThinkPad X1 Nano Gen 3 | |
| Dota 2 Reborn - 1920x1080 ultra (3/3) best looking | |
| Moyenne de la classe Subnotebook (13 - 97, n=61, 2 dernières années) | |
| HP Dragonfly G4 | |
| MSI Prestige 13 AI Evo | |
| Asus ZenBook S13 OLED UX5304 | |
| Dell Latitude 13 7340 i5-1345U | |
| Lenovo ThinkPad X1 Nano Gen 3 | |
Witcher 3 FPS diagram
| Bas | Moyen | Élevé | Ultra | |
|---|---|---|---|---|
| GTA V (2015) | 99.1 | 93.8 | 26.2 | 9.97 |
| The Witcher 3 (2015) | 92 | 59 | 36 | 14.5 |
| Dota 2 Reborn (2015) | 89.9 | 75.9 | 57.7 | 53.3 |
| Final Fantasy XV Benchmark (2018) | 43.8 | 28 | 17 | |
| X-Plane 11.11 (2018) | 47.4 | 37.7 | 32.1 | |
| Far Cry 5 (2018) | 47 | 33 | 31 | 28 |
| Strange Brigade (2018) | 121 | 53 | 41 | 32 |
| F1 2021 (2021) | 94.8 | 50.8 | 41.3 | 20.3 |
| F1 22 (2022) | 59.1 | 49.6 | 36.8 | 9.33 |
| F1 23 (2023) | 44.1 | 36.3 | 27.1 | 7.45 |
Émissions - Des orateurs faibles
Émissions sonores
L'ordinateur portable MSI est équipé d'une unité de refroidissement composée d'un caloduc et d'un ventilateur qui, malheureusement, fonctionne souvent à faible vitesse, même lorsque l'appareil est au repos. Bien que le bruit de ronronnement ne soit pas gênant, vous pouvez certainement l'entendre dans un environnement plus calme. En charge, le ventilateur a rapidement atteint 32 dB(A) et pendant le test de stress, nous avons noté 40 dB(A). C'est tout sauf silencieux et il s'est avéré que notre échantillon de test était le plus bruyant dans le champ de comparaison. En utilisant la fonction CoolerBooster, le petit ventilateur a même atteint 51 dB(A). Nous n'avons pas noté de bruits électroniques supplémentaires.
Degré de la nuisance sonore
| Au repos |
| 23.4 / 26.9 / 26.9 dB(A) |
| Fortement sollicité |
| 32 / 40.3 dB(A) |
 | ||
30 dB silencieux 40 dB(A) audible 50 dB(A) bruyant |
||
min: | ||
| MSI Prestige 13 AI Evo Arc 8-Core, Ultra 7 155H, Samsung PM9A1 MZVL21T0HCLR | Lenovo ThinkPad X1 Nano Gen 3 Iris Xe G7 96EUs, i7-1360P, Lenovo UMIS AM6A0 RPJTJ512MKP1QDQ | Dell Latitude 13 7340 i5-1345U Iris Xe G7 80EUs, i5-1345U, Kioxia BG5 KBG50ZNS512G | HP Dragonfly G4 Iris Xe G7 96EUs, i7-1365U, Micron 3400 MTFDKBA512TFH 512GB | Asus ZenBook S13 OLED UX5304 Iris Xe G7 96EUs, i7-1355U, Samsung PM9A1 MZVL21T0HCLR | |
|---|---|---|---|---|---|
| Noise | 3% | -1% | 6% | -2% | |
| arrêt / environnement * (dB) | 23.4 | 22.9 2% | 25.02 -7% | 23.3 -0% | 23.3 -0% |
| Idle Minimum * (dB) | 23.4 | 23 2% | 25.02 -7% | 23.5 -0% | 23.3 -0% |
| Idle Average * (dB) | 26.9 | 23 14% | 25.02 7% | 23.5 13% | 23.3 13% |
| Idle Maximum * (dB) | 26.9 | 23 14% | 25.02 7% | 26.8 -0% | 23.3 13% |
| Load Average * (dB) | 32 | 32.8 -2% | 35.07 -10% | 27.2 15% | 37.7 -18% |
| Witcher 3 ultra * (dB) | 32 | 36.9 -15% | 32.7 -2% | 40.1 -25% | |
| Load Maximum * (dB) | 40.3 | 36.9 8% | 38.2 5% | 35 13% | 40.1 -0% |
* ... Moindre est la valeur, meilleures sont les performances
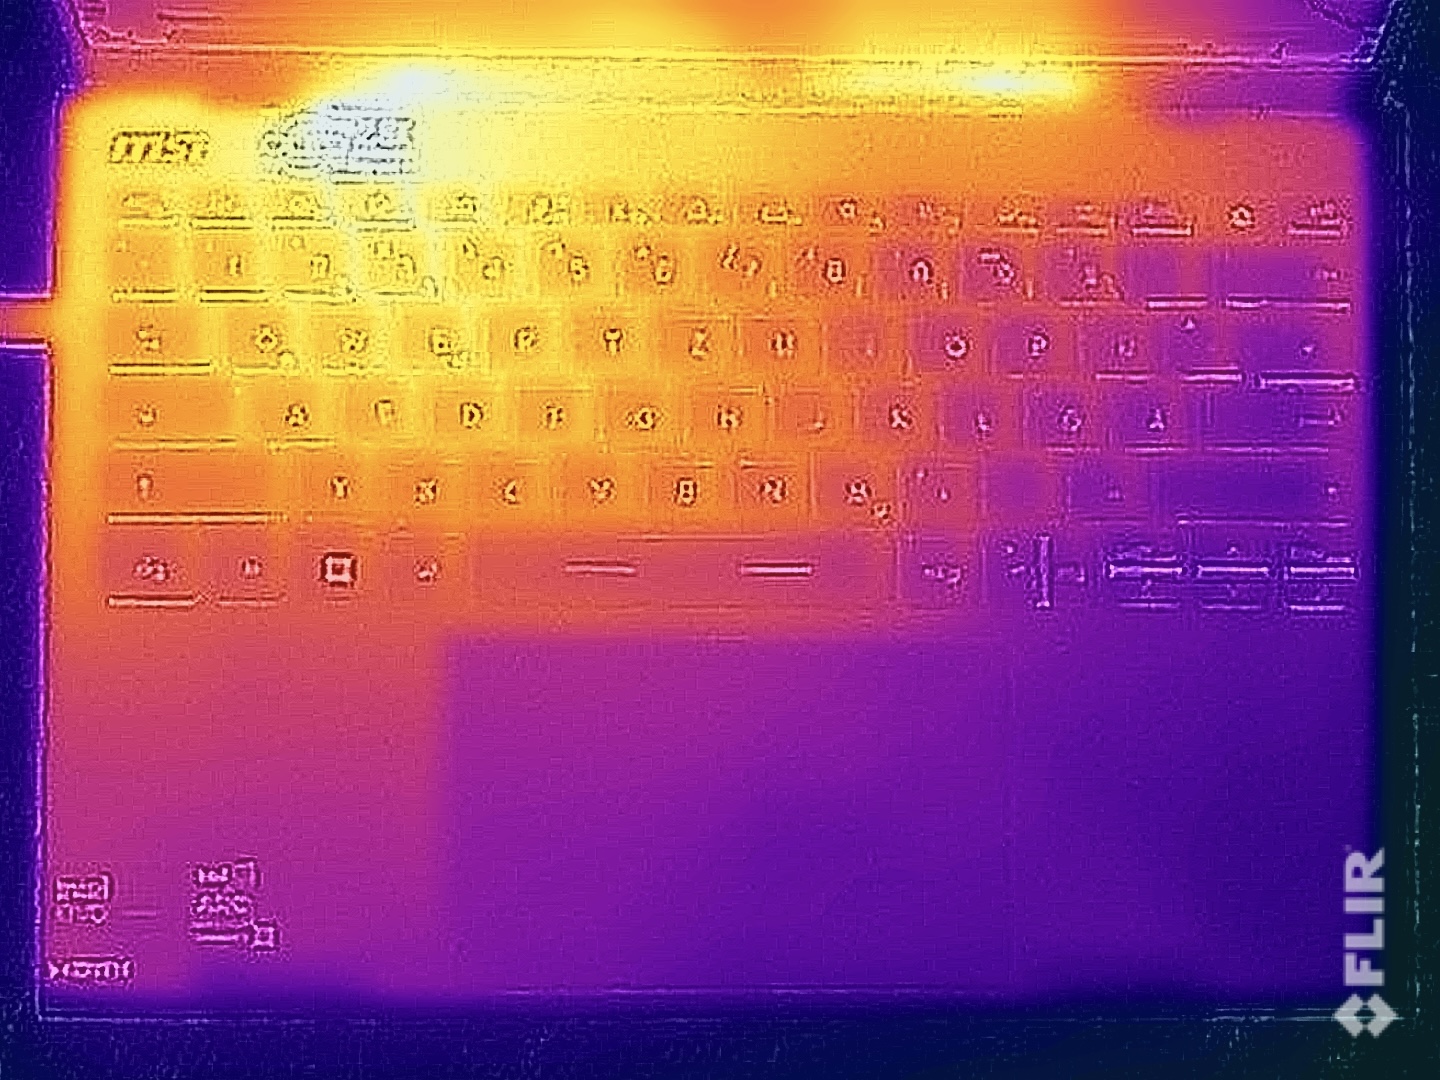
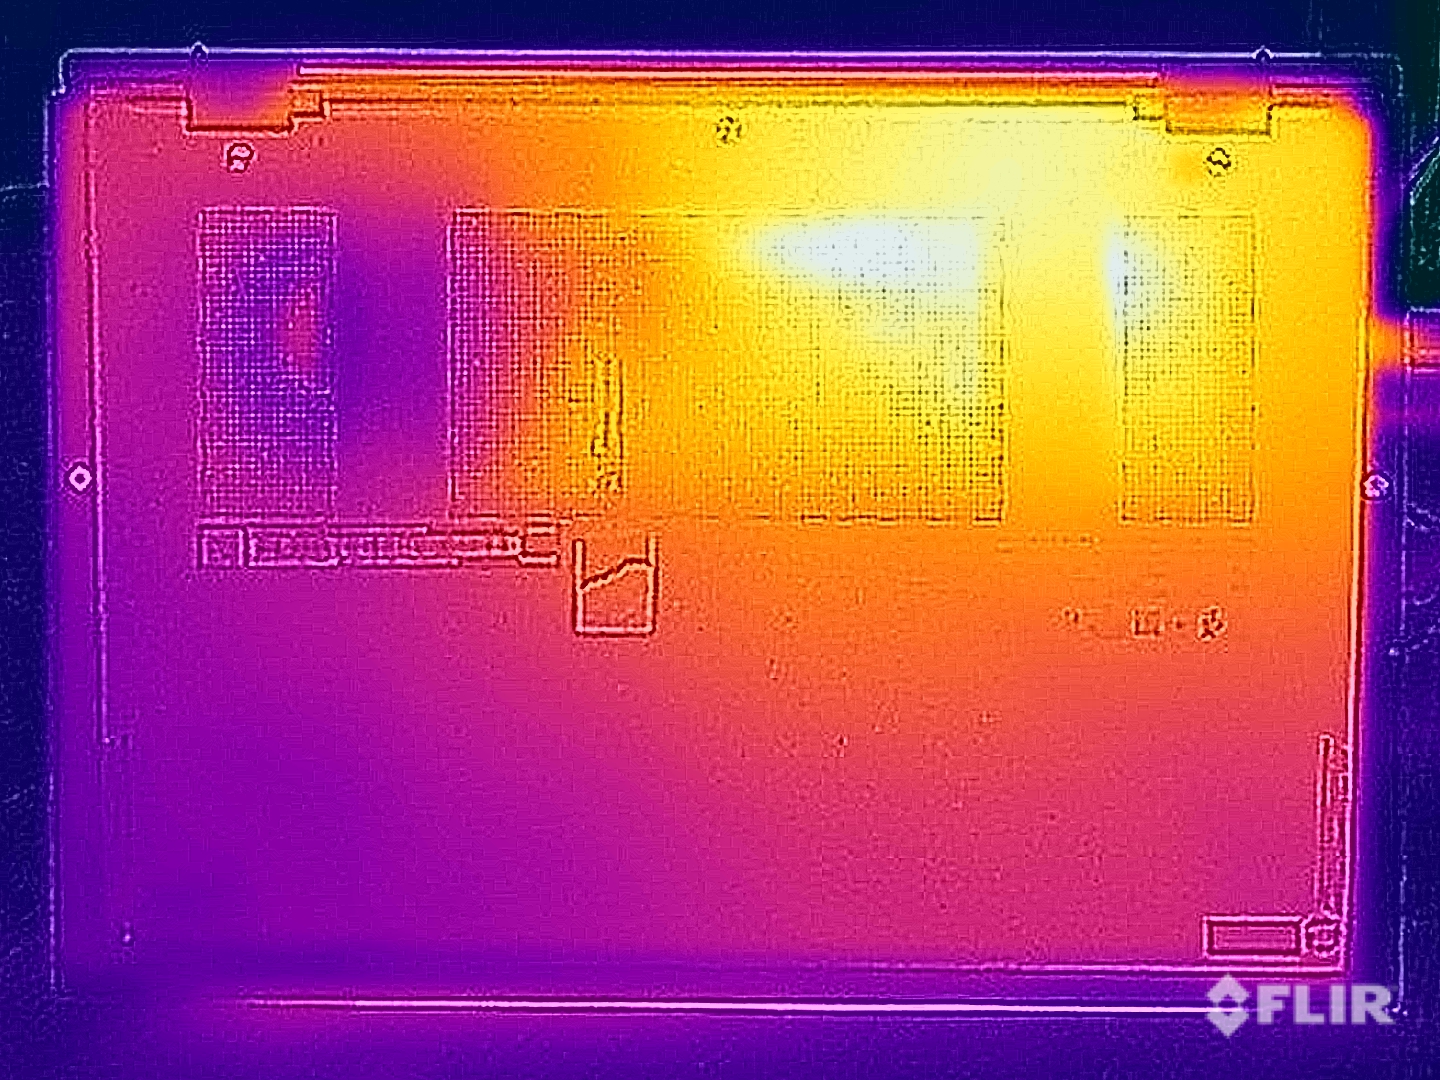
Température
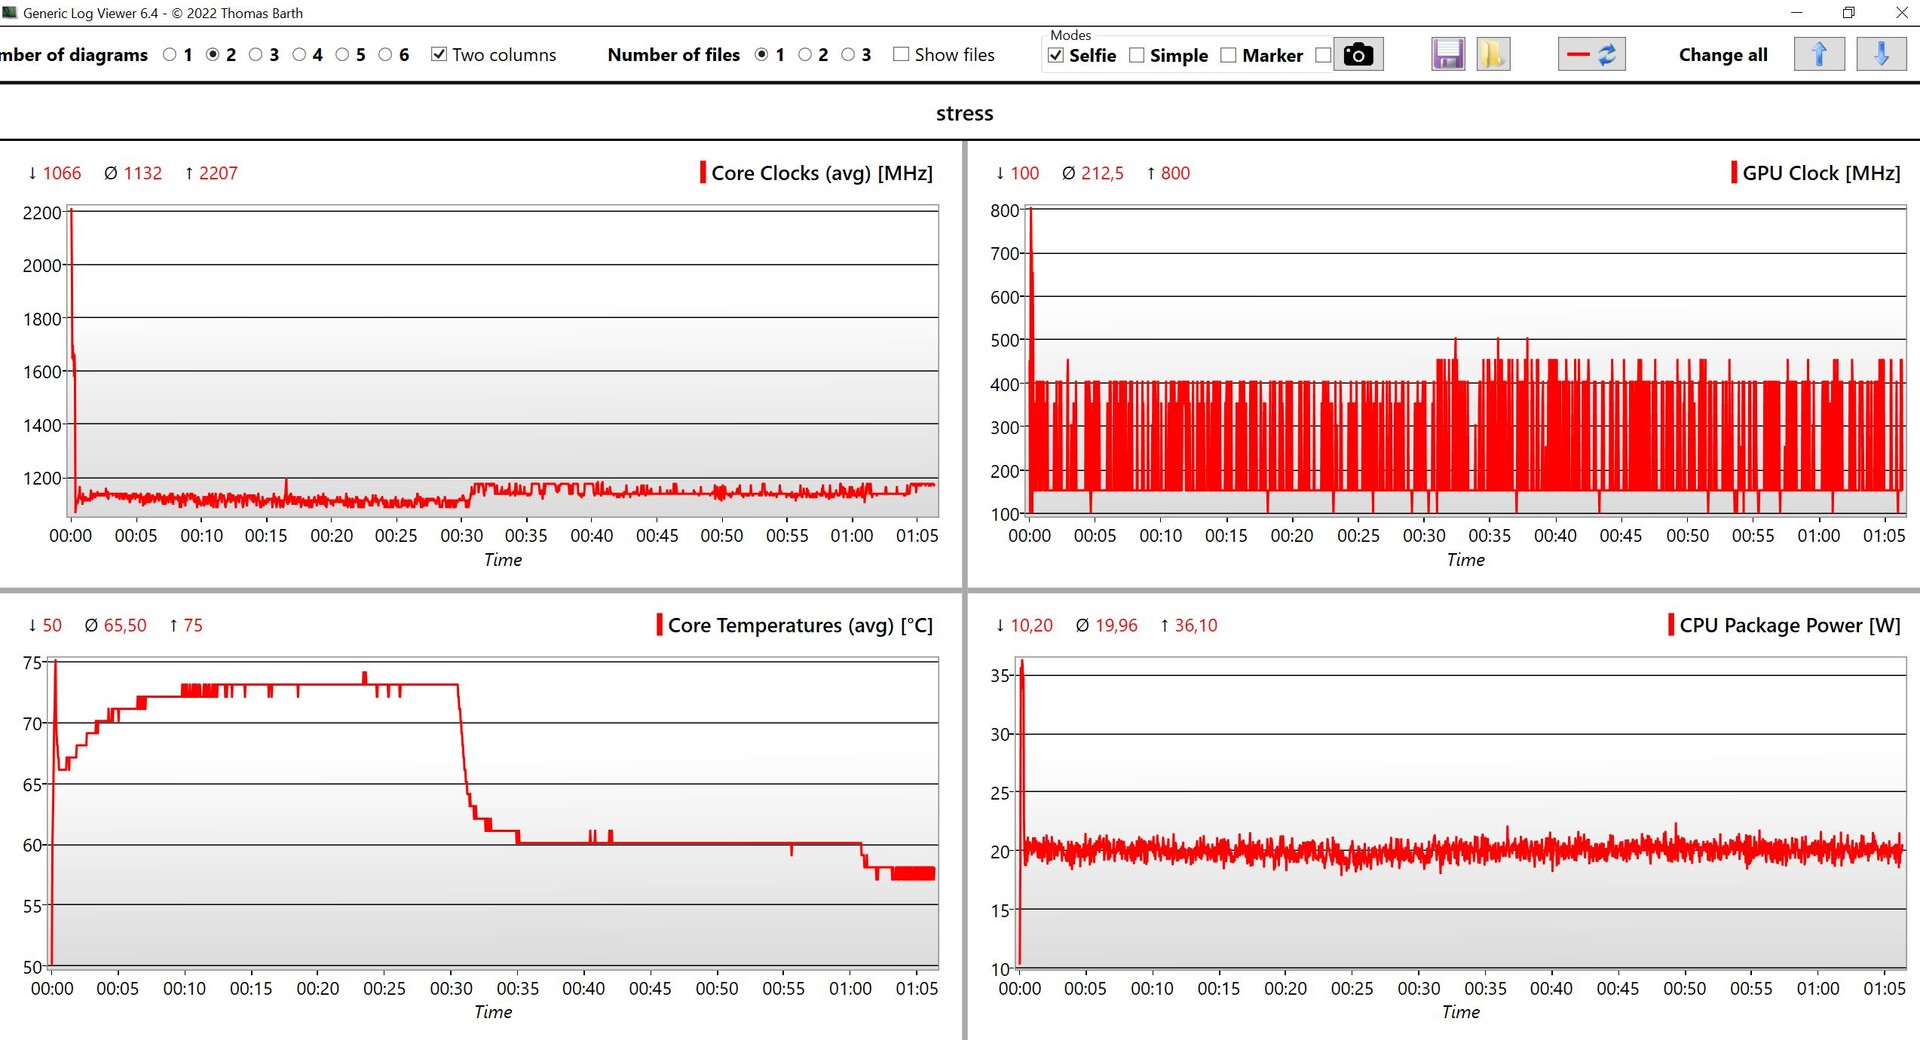
En utilisation quotidienne, la Prestige 13 reste généralement froide et même pendant le test de stress, nous avons mesuré un maximum de 40 °C sur le dessus et le dessous de l'unité de base. Le refroidisseur est situé sur le côté gauche, c'est pourquoi c'est cette zone qui chauffe le plus. Pendant le test de stress, la consommation d'énergie du processeur s'est rapidement équilibrée à 20 watts et est restée à ce niveau.
(±) La température maximale du côté supérieur est de 40.9 °C / 106 F, par rapport à la moyenne de 35.9 °C / 97 F, allant de 21.4 à 59 °C pour la classe Subnotebook.
(±) Le fond chauffe jusqu'à un maximum de 40.4 °C / 105 F, contre une moyenne de 39.2 °C / 103 F
(+) En utilisation inactive, la température moyenne du côté supérieur est de 23.3 °C / 74 F, par rapport à la moyenne du dispositif de 30.8 °C / 87 F.
(+) En jouant à The Witcher 3, la température moyenne du côté supérieur est de 30.9 °C / 88 F, alors que la moyenne de l'appareil est de 30.8 °C / 87 F.
(+) Les repose-poignets et le pavé tactile sont plus froids que la température de la peau avec un maximum de 27.9 °C / 82.2 F et sont donc froids au toucher.
(±) La température moyenne de la zone de l'appui-paume de dispositifs similaires était de 28.2 °C / 82.8 F (+0.3 °C / #0.6 F).
| MSI Prestige 13 AI Evo Intel Core Ultra 7 155H, Intel Arc 8-Core iGPU | Lenovo ThinkPad X1 Nano Gen 3 Intel Core i7-1360P, Intel Iris Xe Graphics G7 96EUs | Dell Latitude 13 7340 i5-1345U Intel Core i5-1345U, Intel Iris Xe Graphics G7 80EUs | HP Dragonfly G4 Intel Core i7-1365U, Intel Iris Xe Graphics G7 96EUs | Asus ZenBook S13 OLED UX5304 Intel Core i7-1355U, Intel Iris Xe Graphics G7 96EUs | |
|---|---|---|---|---|---|
| Heat | -4% | -1% | -5% | -9% | |
| Maximum Upper Side * (°C) | 40.9 | 44 -8% | 34.3 16% | 38.6 6% | 43.1 -5% |
| Maximum Bottom * (°C) | 40.4 | 43.2 -7% | 37.6 7% | 40.4 -0% | 45 -11% |
| Idle Upper Side * (°C) | 25 | 25.6 -2% | 28.4 -14% | 28.2 -13% | 27.3 -9% |
| Idle Bottom * (°C) | 25.5 | 25.6 -0% | 28.8 -13% | 29 -14% | 27.8 -9% |
* ... Moindre est la valeur, meilleures sont les performances
Intervenants
Les haut-parleurs stéréo font partie des aspects les plus faibles de cet ordinateur portable compact. Leur volume maximum peut être décent, mais le son lui-même n'a pas beaucoup de dimension et ils manquent clairement ce que beaucoup de concurrents de l'appareil sont capables d'offrir.
MSI Prestige 13 AI Evo analyse audio
(±) | le niveau sonore du haut-parleur est moyen mais bon (81.8# dB)
Basses 100 - 315 Hz
(-) | presque aucune basse - en moyenne 20.5% plus bas que la médiane
(±) | la linéarité des basses est moyenne (8.4% delta à la fréquence précédente)
Médiums 400 - 2000 Hz
(±) | médiane supérieure - en moyenne 6.1% supérieure à la médiane
(+) | les médiums sont linéaires (5.9% delta à la fréquence précédente)
Aiguës 2 - 16 kHz
(+) | des sommets équilibrés - à seulement 4.7% de la médiane
(+) | les aigus sont linéaires (5.4% delta à la fréquence précédente)
Globalement 100 - 16 000 Hz
(±) | la linéarité du son global est moyenne (19% de différence avec la médiane)
Par rapport à la même classe
» 58% de tous les appareils testés de cette catégorie étaient meilleurs, 6% similaires, 36% pires
» Le meilleur avait un delta de 5%, la moyenne était de 18%, le pire était de 53%.
Par rapport à tous les appareils testés
» 45% de tous les appareils testés étaient meilleurs, 7% similaires, 48% pires
» Le meilleur avait un delta de 4%, la moyenne était de 23%, le pire était de 134%.
Dell Latitude 13 7340 i5-1345U analyse audio
(+) | les haut-parleurs peuvent jouer relativement fort (83# dB)
Basses 100 - 315 Hz
(±) | basse réduite - en moyenne 6.2% inférieure à la médiane
(±) | la linéarité des basses est moyenne (9.6% delta à la fréquence précédente)
Médiums 400 - 2000 Hz
(+) | médiane équilibrée - seulement 2.3% de la médiane
(+) | les médiums sont linéaires (5.1% delta à la fréquence précédente)
Aiguës 2 - 16 kHz
(±) | sommets plus élevés - en moyenne 5.6% plus élevés que la médiane
(±) | la linéarité des aigus est moyenne (7.9% delta à la fréquence précédente)
Globalement 100 - 16 000 Hz
(+) | le son global est linéaire (9% différence à la médiane)
Par rapport à la même classe
» 4% de tous les appareils testés de cette catégorie étaient meilleurs, 1% similaires, 95% pires
» Le meilleur avait un delta de 5%, la moyenne était de 18%, le pire était de 53%.
Par rapport à tous les appareils testés
» 3% de tous les appareils testés étaient meilleurs, 1% similaires, 96% pires
» Le meilleur avait un delta de 4%, la moyenne était de 23%, le pire était de 134%.
HP Dragonfly G4 analyse audio
(+) | les haut-parleurs peuvent jouer relativement fort (84.4# dB)
Basses 100 - 315 Hz
(±) | basse réduite - en moyenne 8.4% inférieure à la médiane
(±) | la linéarité des basses est moyenne (11.6% delta à la fréquence précédente)
Médiums 400 - 2000 Hz
(+) | médiane équilibrée - seulement 2.3% de la médiane
(+) | les médiums sont linéaires (4.8% delta à la fréquence précédente)
Aiguës 2 - 16 kHz
(+) | des sommets équilibrés - à seulement 3.2% de la médiane
(+) | les aigus sont linéaires (4.6% delta à la fréquence précédente)
Globalement 100 - 16 000 Hz
(+) | le son global est linéaire (9.1% différence à la médiane)
Par rapport à la même classe
» 4% de tous les appareils testés de cette catégorie étaient meilleurs, 1% similaires, 95% pires
» Le meilleur avait un delta de 5%, la moyenne était de 18%, le pire était de 53%.
Par rapport à tous les appareils testés
» 3% de tous les appareils testés étaient meilleurs, 1% similaires, 96% pires
» Le meilleur avait un delta de 4%, la moyenne était de 23%, le pire était de 134%.
Gestion de l'énergie - Bonne endurance avec une batterie de 75 Wh
Consommation électrique
Nous n'avons noté aucune anomalie lors des mesures de consommation et la consommation maximale de l'ordinateur portable en veille est d'environ 9 watts. Comme c'est le cas avec toutes les dalles OLED, vous devez vous assurer de définir des images de fond plus sombres et d'utiliser le mode sombre de Windows pour aider à minimiser sa consommation d'énergie. En charge, l'alimentation atteint sa limite de 65 watts pendant une courte période, puis elle se rééquilibre rapidement à 33 watts et pendant le test de stress, elle est restée à ce niveau.
| Éteint/en veille | |
| Au repos | |
| Fortement sollicité |
|
Légende:
min: | |
| MSI Prestige 13 AI Evo Ultra 7 155H, Arc 8-Core, Samsung PM9A1 MZVL21T0HCLR, OLED, 2880x1800, 13.3" | Lenovo ThinkPad X1 Nano Gen 3 i7-1360P, Iris Xe G7 96EUs, Lenovo UMIS AM6A0 RPJTJ512MKP1QDQ, IPS, 2160x1350, 13" | Dell Latitude 13 7340 i5-1345U i5-1345U, Iris Xe G7 80EUs, Kioxia BG5 KBG50ZNS512G, IPS, 1920x1200, 13.3" | HP Dragonfly G4 i7-1365U, Iris Xe G7 96EUs, Micron 3400 MTFDKBA512TFH 512GB, IPS, 1920x1280, 13.5" | Asus ZenBook S13 OLED UX5304 i7-1355U, Iris Xe G7 96EUs, Samsung PM9A1 MZVL21T0HCLR, OLED, 2880x1800, 13.3" | Moyenne Intel Arc 8-Core iGPU | Moyenne de la classe Subnotebook | |
|---|---|---|---|---|---|---|---|
| Power Consumption | 6% | 3% | -1% | -3% | -28% | 5% | |
| Idle Minimum * (Watt) | 4.5 | 3.3 27% | 2.37 47% | 4.1 9% | 5.8 -29% | 5.31 ? -18% | 3.76 ? 16% |
| Idle Average * (Watt) | 8 | 6.5 19% | 6.19 23% | 7.5 6% | 8.5 -6% | 8.56 ? -7% | 6.54 ? 18% |
| Idle Maximum * (Watt) | 8.7 | 7.1 18% | 14.1 -62% | 8.2 6% | 8.8 -1% | 11.9 ? -37% | 7.89 ? 9% |
| Load Average * (Watt) | 36.1 | 40.7 -13% | 36.3 -1% | 35.5 2% | 35.1 3% | 53.6 ? -48% | 42 ? -16% |
| Witcher 3 ultra * (Watt) | 29.7 | 37 -25% | 24.9 16% | 37.5 -26% | 27.6 7% | ||
| Load Maximum * (Watt) | 65 | 58.6 10% | 69.13 -6% | 66.5 -2% | 59.5 8% | 84.2 ? -30% | 64.8 ? -0% |
* ... Moindre est la valeur, meilleures sont les performances
Power consumption Witcher 3 / stress test
Power consumption with external monitor
Délais d'exécution
Malgré son faible poids, MSI a installé une batterie de 75 Wh, qui offre une bonne autonomie malgré la dalle OLED de l'ordinateur portable. Bien que ses homologues IPS fonctionnent généralement plus longtemps, il a été en mesure de battre le Zenbook S13 OLED d'Asus d'une courte distance. Lors de notre test WLAN à 150 cd/m² (57 % de la luminosité SDR maximale de l'appareil), l'échantillon de test a fonctionné pendant environ 11,5 heures, et à pleine luminosité pendant environ 7,5 heures. Il est possible de lire des vidéos pendant 16,5 heures (150 cd/m²), tandis qu'une vidéo HDR à pleine luminosité peut fonctionner pendant 6 heures. Une charge complète prend 220 minutes lorsque l'appareil est allumé, tandis que 80 % de sa capacité est disponible après 114 minutes.
| MSI Prestige 13 AI Evo Ultra 7 155H, Arc 8-Core, 75 Wh | Lenovo ThinkPad X1 Nano Gen 3 i7-1360P, Iris Xe G7 96EUs, 49.5 Wh | Dell Latitude 13 7340 i5-1345U i5-1345U, Iris Xe G7 80EUs, 57 Wh | HP Dragonfly G4 i7-1365U, Iris Xe G7 96EUs, 68 Wh | Asus ZenBook S13 OLED UX5304 i7-1355U, Iris Xe G7 96EUs, 63 Wh | Moyenne de la classe Subnotebook | |
|---|---|---|---|---|---|---|
| Autonomie de la batterie | -33% | 17% | 26% | -11% | -6% | |
| H.264 (h) | 16.7 | 13.8 -17% | 15.4 ? -8% | |||
| WiFi v1.3 (h) | 11.6 | 7.8 -33% | 15 29% | 15.9 37% | 11.3 -3% | 14 ? 21% |
| Load (h) | 2.8 | 2.9 4% | 3.2 14% | 2.4 -14% | 1.969 ? -30% |
Points positifs
Points négatifs
Verdict - Le MSI Prestige 13 impressionne par son faible poids et sa dalle OLED

Le nouveau MSI Prestige 13 AI Evo est clairement axé sur la portabilité et, à cet égard, notre appareil de test, avec sa construction légère et ses bonnes durées d'exécution, s'avère être une réussite. De plus, sa dalle OLED offre une qualité d'image exceptionnelle et quelques avantages par rapport à de nombreux modèles IPS - cependant, elle est loin d'être parfaite si votre objectif est d'éditer des photos. Si vous travaillez souvent en déplacement, les reflets de la dalle brillante peuvent également vous gêner.
Ses caractéristiques techniques, sous la forme du nouveau Core Ultra 7 155H, promettent de nombreuses performances, mais en réalité, il s'agit du modèle Meteor-Lake-H le plus lent que nous ayons testé jusqu'à présent. Pour une utilisation quotidienne, il devrait être suffisant dans de nombreux cas, mais vous ne devez pas oublier à quel point l'appareil est loin de son potentiel de performance réel (CPU et GPU). Sa RAM ne peut pas être mise à niveau, mais même ainsi, 32 Go devraient être plus que suffisants pour la plupart des utilisateurs (après tout, il ne s'agit pas d'une station de travail).
Le MSI Prestige 13 AI Evo pèse moins d'un kilo et malgré cela, vous n'avez pas à vous priver d'excellentes durées d'exécution, de nombreux ports et d'un panneau OLED. Malgré son processeur Meteor Lake, les performances de l'appareil ne sont toujours pas les meilleures - de plus, son refroidisseur est presque toujours actif au quotidien.
En ce qui concerne les ports et la connectivité de l'ordinateur portable, y compris le Wi-Fi 7 et un lecteur de cartes rapide, nous n'avons pas grand-chose à redire, bien que son boîtier compact exige de faire quelques compromis. L'unité de refroidissement est composée d'un seul ventilateur qui est presque toujours actif, ce qui fait qu'un appareil vraiment silencieux est une rareté. En outre, son clavier semble un peu étroit, même si la mécanique elle-même est bonne. Enfin, la faiblesse de ses haut-parleurs laisse à désirer et la concurrence présente des avantages certains dans ce domaine.
Le HP Dragonfly G4 est probablement le plus grand concurrent de la Prestige 13 et, outre ses meilleurs haut-parleurs, il dispose également d'un meilleur clavier et d'une plus grande autonomie - mais en contrepartie, il dispose d'une dalle IPS (sans PWM) avec une résolution inférieure et une qualité d'image subjectivement moins bonne. Son prix de vente conseillé est plus élevé, mais vous pouvez peut-être le trouver à un prix inférieur en ligne.
Prix et disponibilité
La MSI Prestige 13 AI Evo est actuellement disponible sur Amazon au prix de 1 280,71 dollars.
MSI Prestige 13 AI Evo
- 03/06/2024 v7 (old)
Andreas Osthoff
Transparency
La sélection des appareils à examiner est effectuée par notre équipe éditoriale. L'échantillon de test a été prêté à l'auteur par le fabricant ou le détaillant pour les besoins de cet examen. Le prêteur n'a pas eu d'influence sur cette évaluation et le fabricant n'a pas reçu de copie de cette évaluation avant sa publication. Il n'y avait aucune obligation de publier cet article. En tant que média indépendant, Notebookcheck n'est pas soumis à l'autorité des fabricants, des détaillants ou des éditeurs.
Voici comment Notebookcheck teste
Chaque année, Notebookcheck examine de manière indépendante des centaines d'ordinateurs portables et de smartphones en utilisant des procédures standardisées afin de garantir que tous les résultats sont comparables. Nous avons continuellement développé nos méthodes de test depuis environ 20 ans et avons établi des normes industrielles dans le processus. Dans nos laboratoires de test, des équipements de mesure de haute qualité sont utilisés par des techniciens et des rédacteurs expérimentés. Ces tests impliquent un processus de validation en plusieurs étapes. Notre système d'évaluation complexe repose sur des centaines de mesures et de points de référence bien fondés, ce qui garantit l'objectivité.Price comparison

