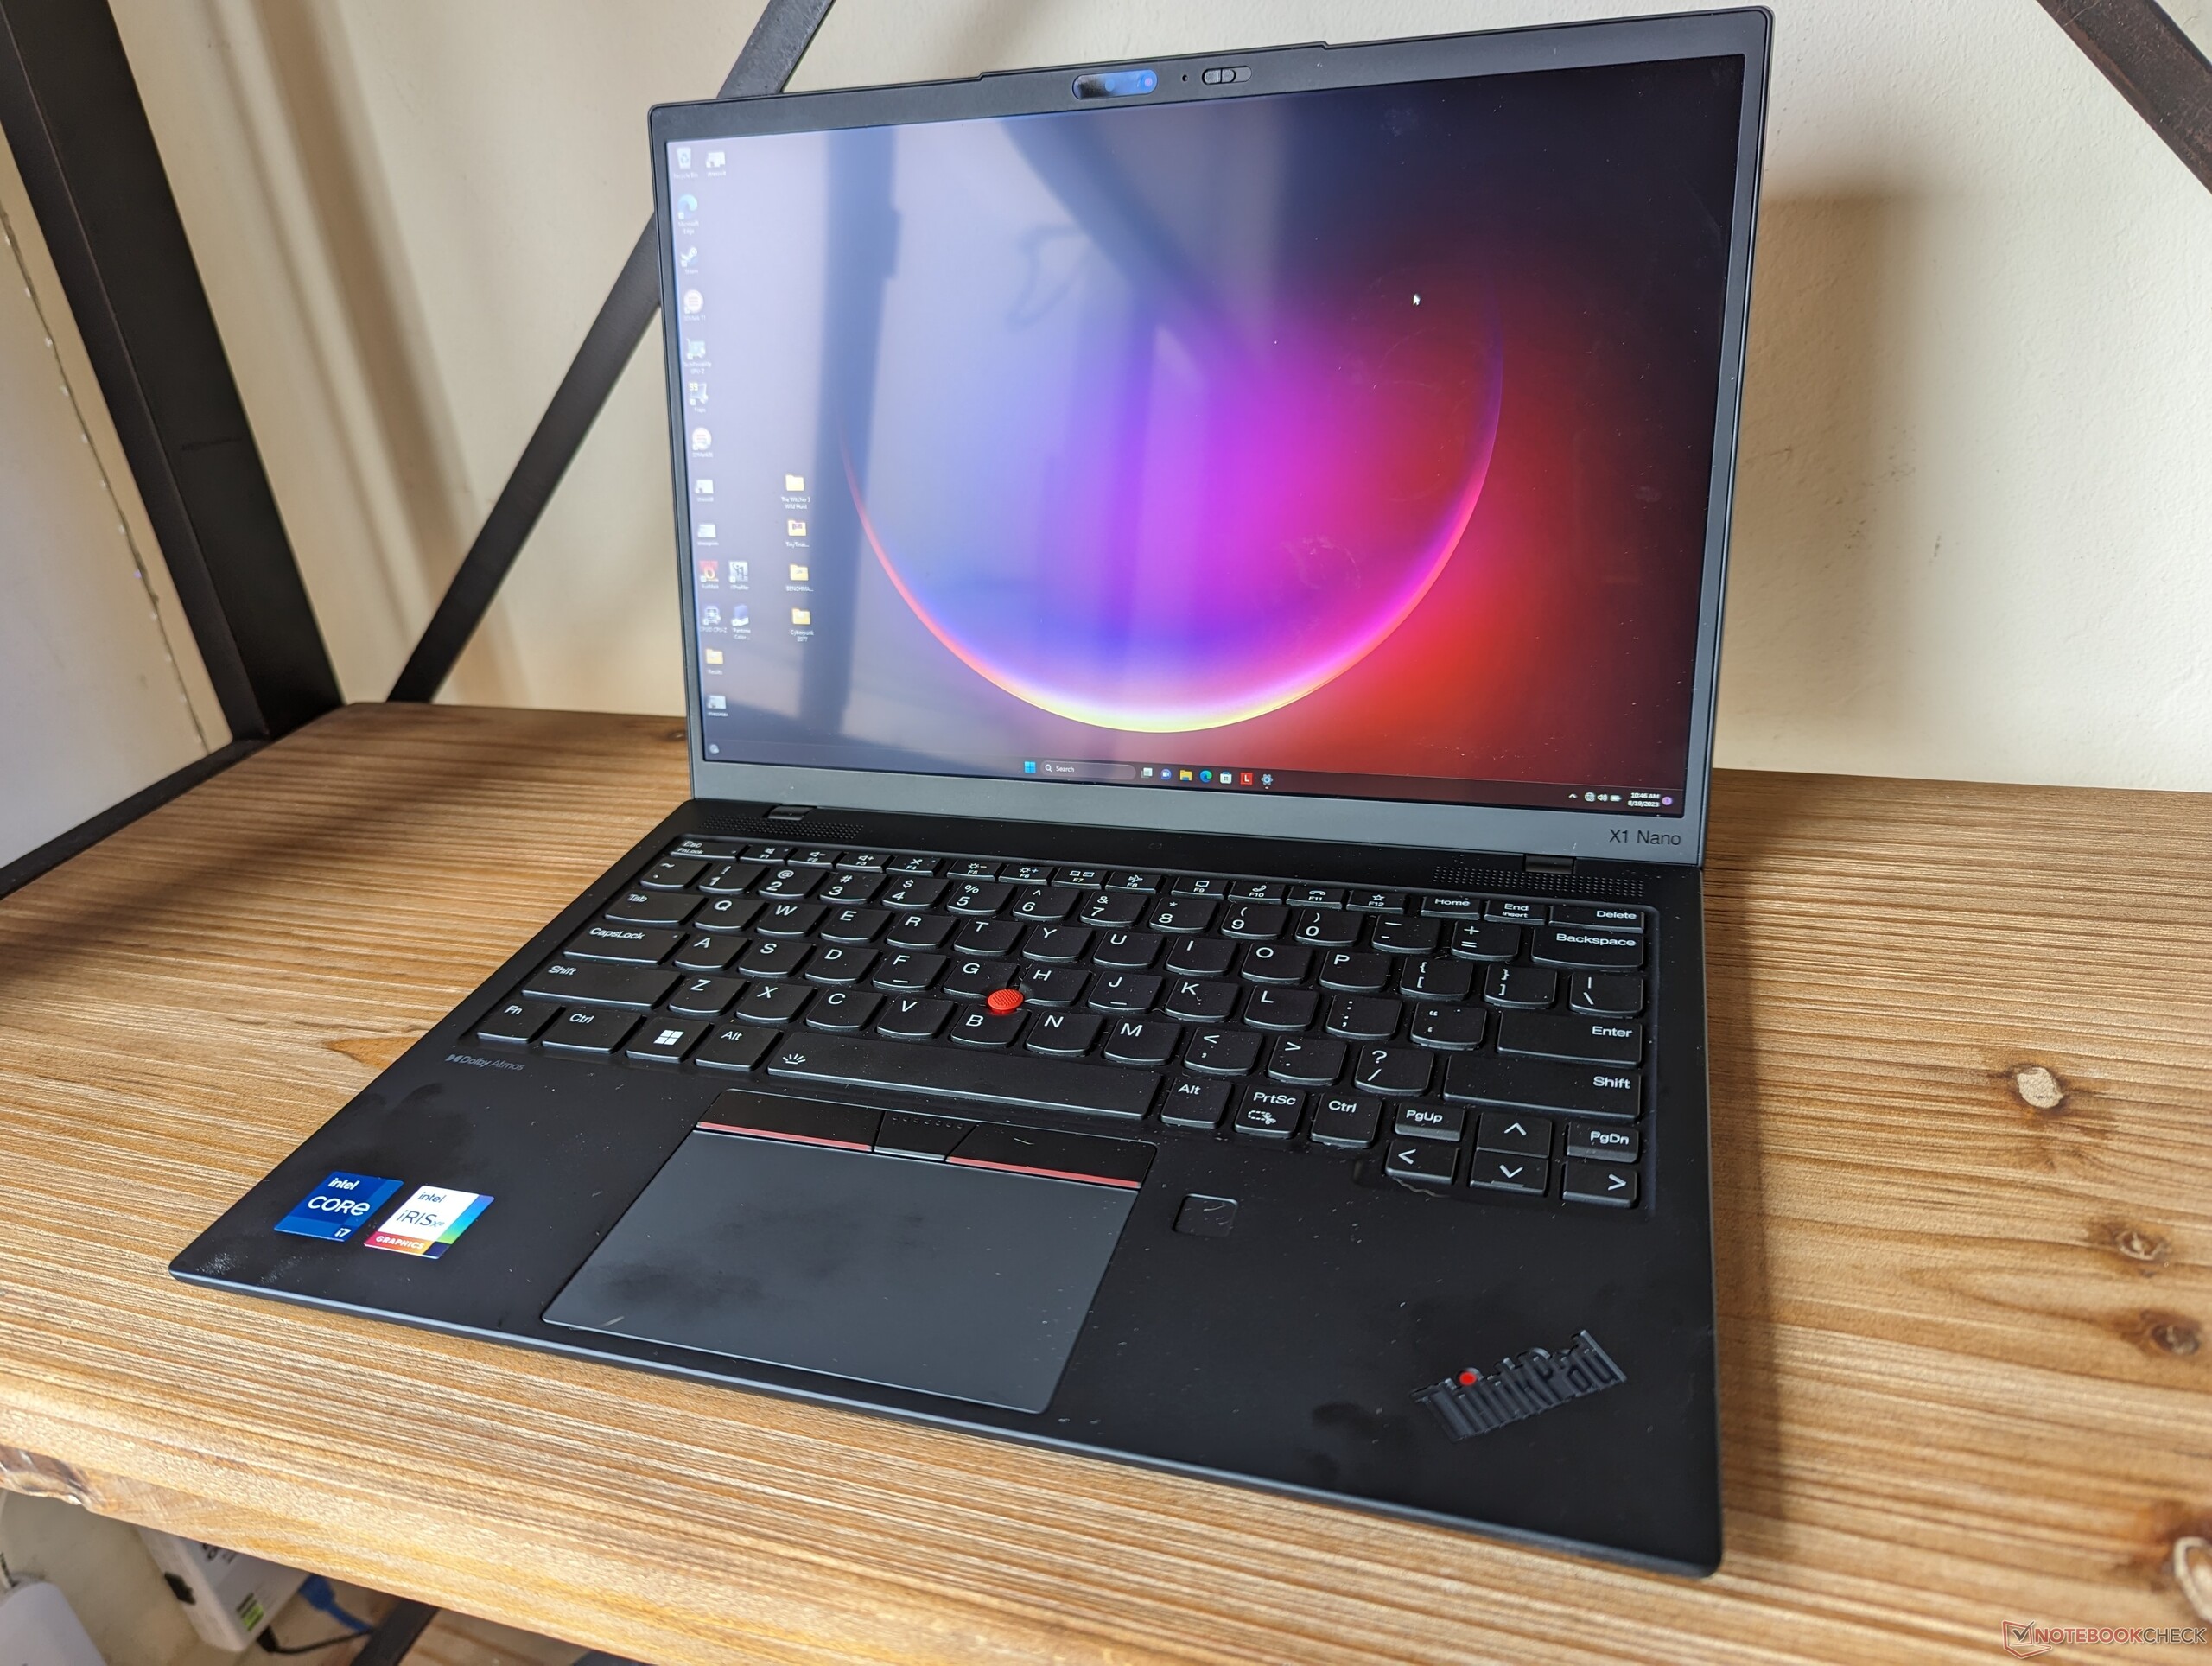
Test du Lenovo ThinkPad X1 Nano Gen 3 : Intel Core-P à moins de 1 kg

Le ThinkPad X1 Nano Gen 3 succède au ThinkPad X1 Nano Gen 2 de l'année dernière en remplaçant les processeurs Alder Lake de la 12e génération par des options Raptor Lake de la 13e génération. Outre le changement de processeur, le châssis ultra-léger reste identique, et c'est pourquoi nous avons décidé de ne pas le remplacer commentaires existants sur les ports et autres aspects physiques du X1 Nano Gen 2 s'appliquent toujours au X1 Nano Gen 3. Cette page se concentrera plutôt sur les différences de performances entre les deux modèles ainsi que sur les autres changements notables.
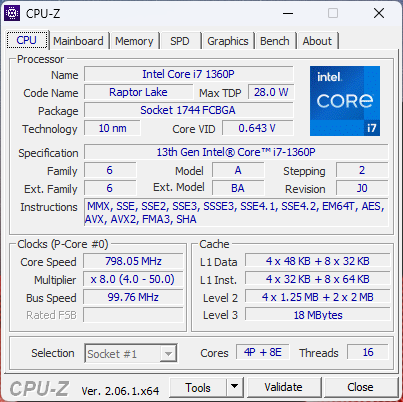
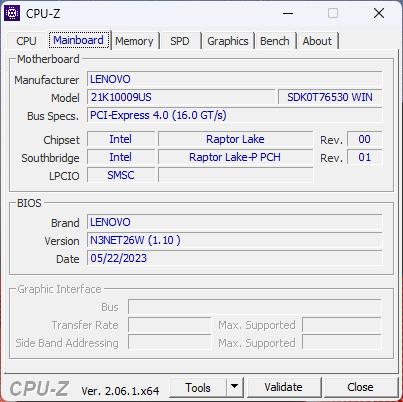
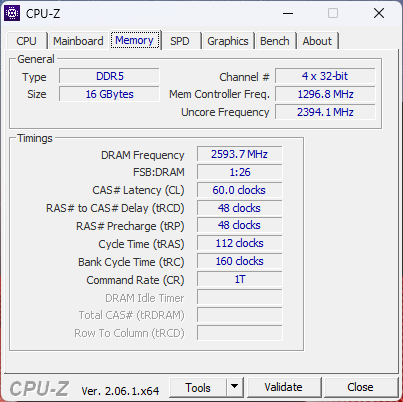
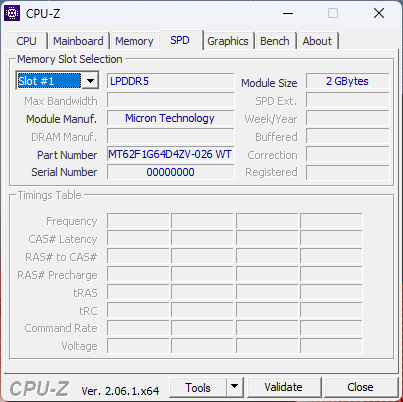
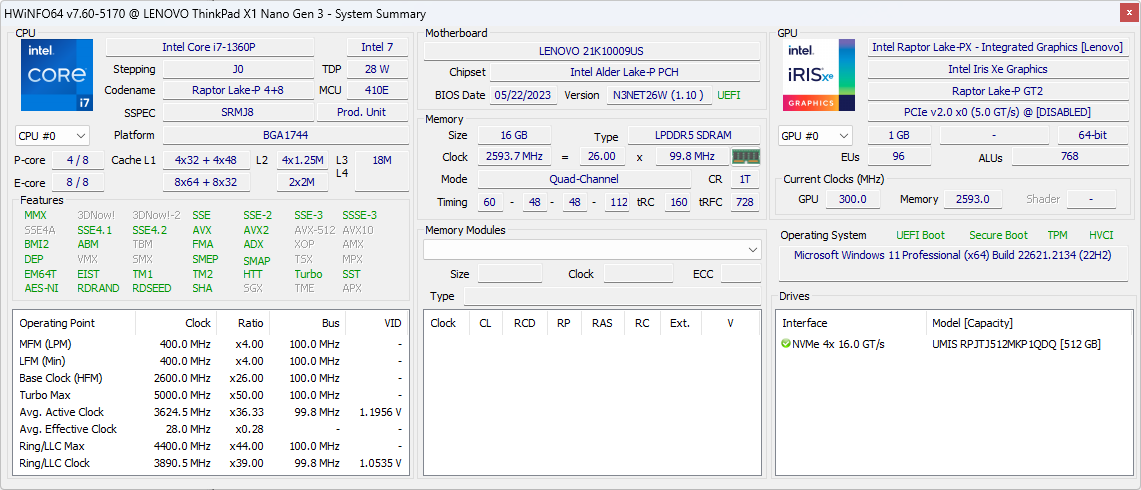
Notre unité de test a été configurée avec le Core i7-1360P pour environ $1400 USD au détail. Les autres UGS incluent le Core i5-1340P avec des options vPro et non-vPro jusqu'au i7-1370P, mais toutes les configurations actuelles incluent les mêmes 16 Go de RAM soudée et un écran IPS 13 pouces 2K (2160 x 1350) avec tactile en option.
Parmi les alternatives au ThinkPad X1 Nano Gen 3, on trouve d'autres ordinateurs portables ultralégers comme le LG Gram 13, Dynabook Portege X30L, Dell Latitude 9330ou HP Dragonfly G4.
Plus de commentaires sur Lenovo :
Comparaison avec les concurrents potentiels
Note | Date | Modèle | Poids | Épaisseur | Taille | Résolution | Prix |
|---|---|---|---|---|---|---|---|
| 89.5 % v7 (old) | 08/23 | Lenovo ThinkPad X1 Nano Gen 3 i7-1360P, Iris Xe G7 96EUs | 989 g | 14.8 mm | 13.00" | 2160x1350 | |
| 88.9 % v7 (old) | 09/22 | Lenovo ThinkPad X1 Nano Gen 2 Core i7-1280P i7-1280P, Iris Xe G7 96EUs | 958 g | 14.4 mm | 13.00" | 2160x1350 | |
| 91.9 % v7 (old) | 07/23 | HP Dragonfly G4 i7-1365U, Iris Xe G7 96EUs | 1.1 kg | 16.3 mm | 13.50" | 1920x1280 | |
| 86.2 % v7 (old) | 05/23 | Framework Laptop 13.5 13th Gen Intel i7-1370P, Iris Xe G7 96EUs | 1.3 kg | 15.85 mm | 13.50" | 2256x1504 | |
| 89 % v7 (old) | 11/22 | Dell Latitude 9330 i7-1260U, Iris Xe G7 96EUs | 1.2 kg | 14.1 mm | 13.30" | 2560x1600 | |
| 92 % v7 (old) | 08/22 | Apple MacBook Air M2 10C GPU M2, M2 10-Core GPU | 1.2 kg | 11.3 mm | 13.60" | 2560x1664 | |
| 86.6 % v7 (old) | 10/22 | LG Gram 14Z90Q i5-1240P, Iris Xe G7 80EUs | 980 g | 16.8 mm | 14.00" | 1920x1200 |
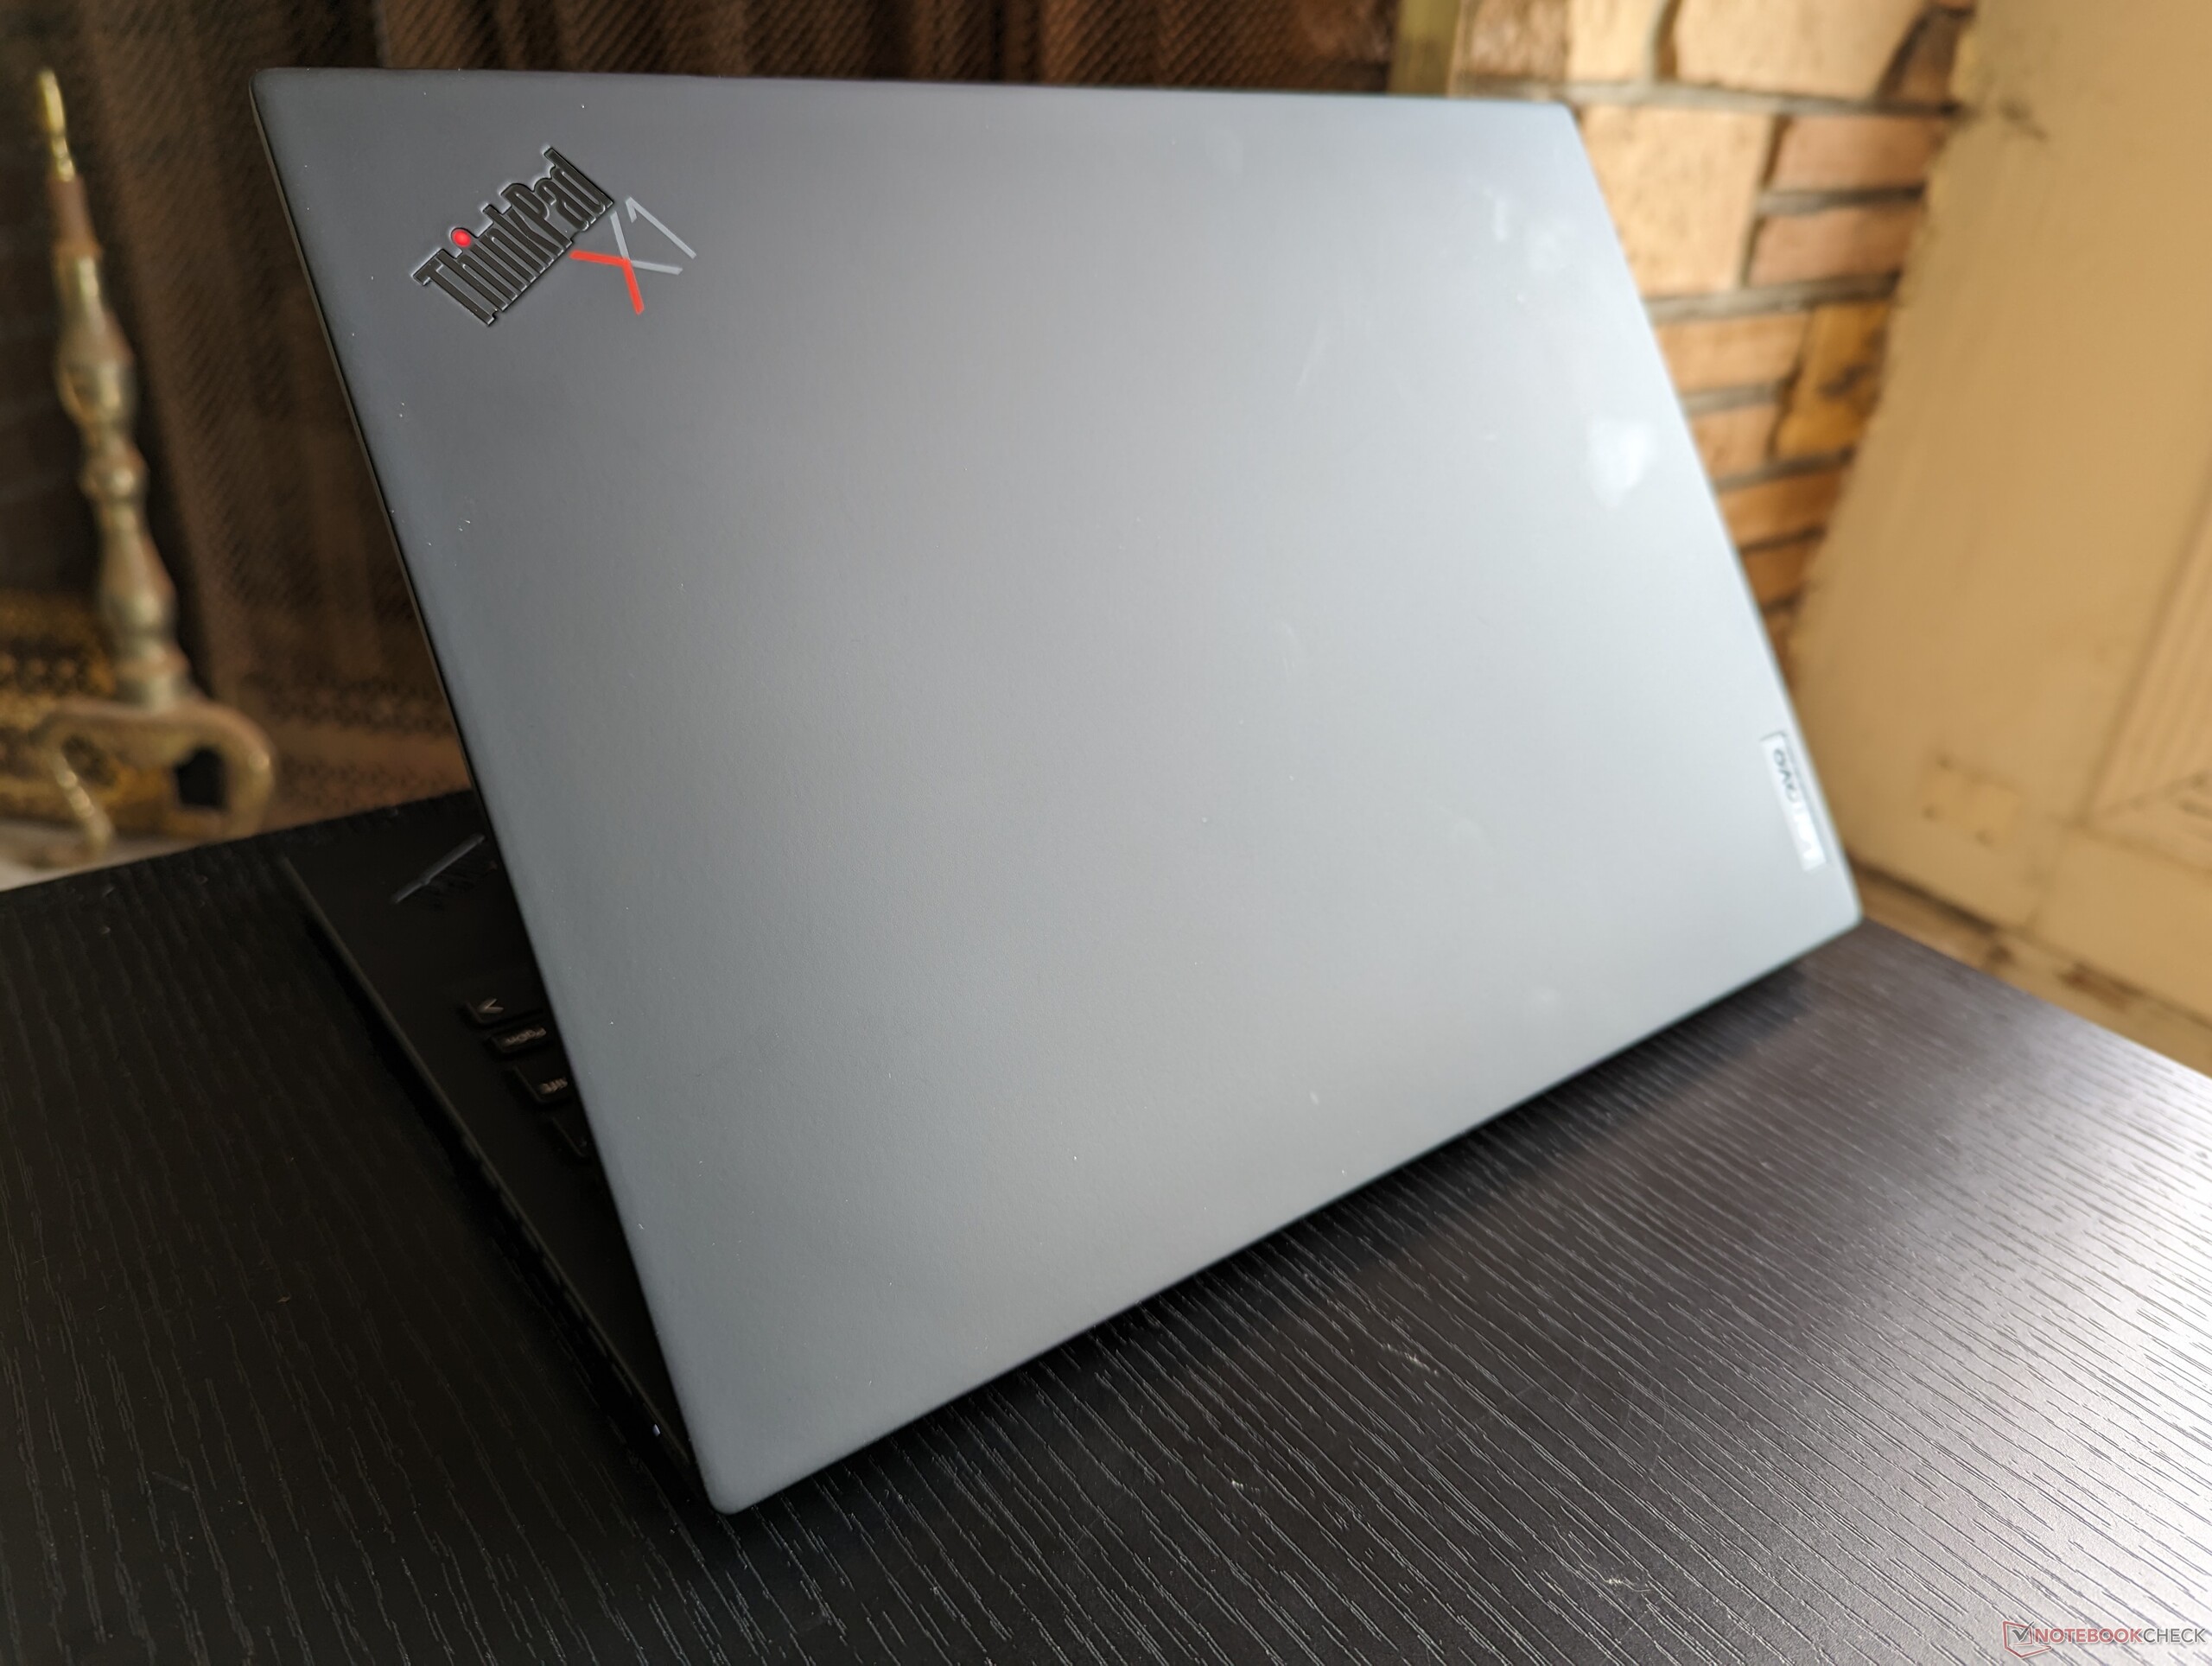
Etui - Toujours l'un des plus légers
Bien qu'il n'y ait pas de changement extérieur majeur par rapport à l'année précédente, il faut garder à l'esprit que la version à écran tactile est légèrement plus grande que la version sans écran tactile. L'épaisseur et le poids supplémentaires sont à peine perceptibles dans la pratique.
| Configuration de l'écran tactile | 208.1 mm (L) | 293.3 mm (L) | 14.8 mm (H) |
| Configuration non tactile | 208.0 mm (L) | 293.2 mm (l) | 14.4 mm (H) |
Communication
Webcam


Maintenance
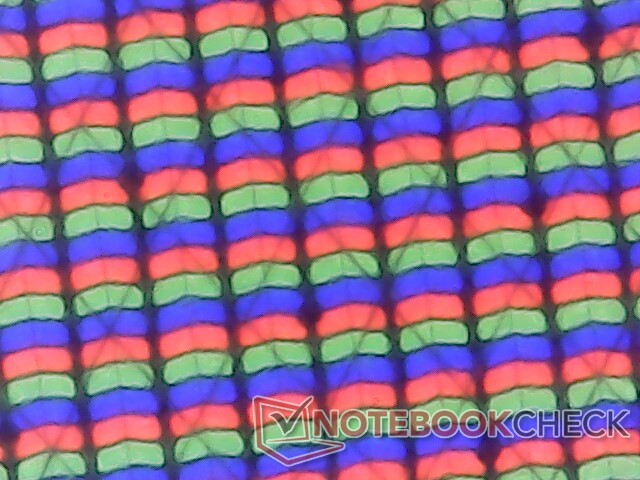
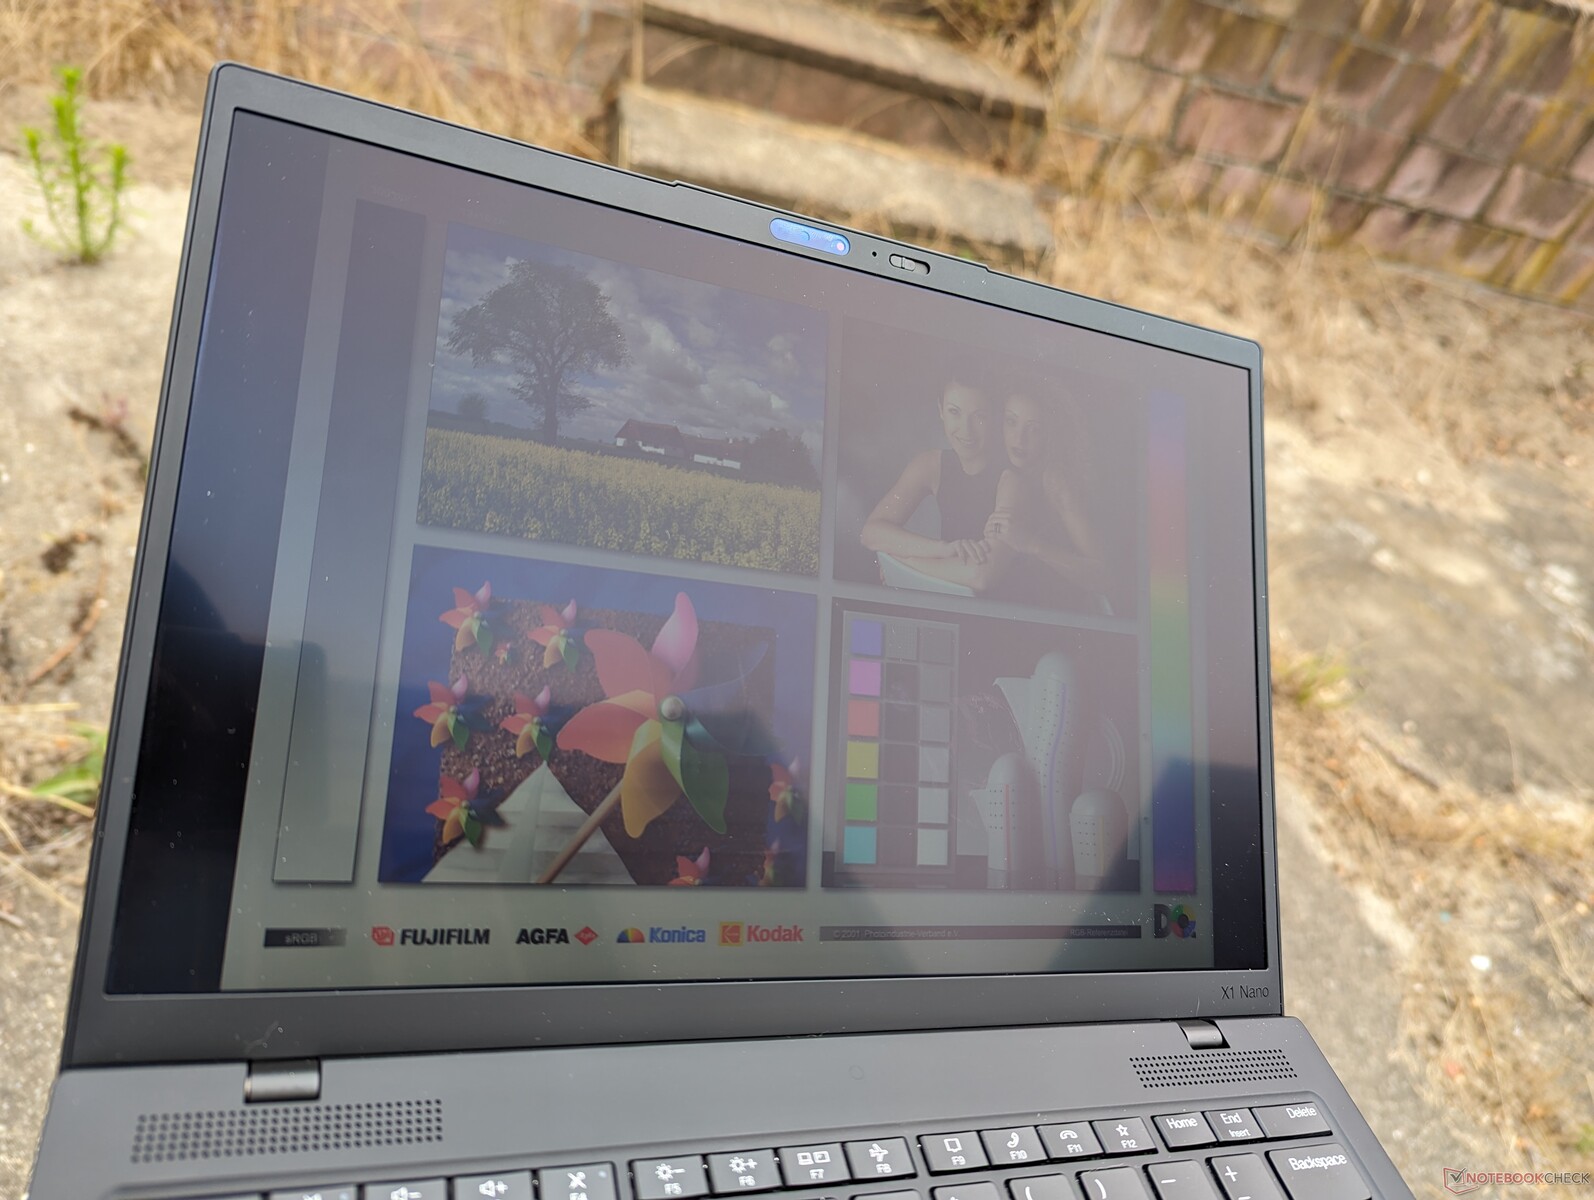
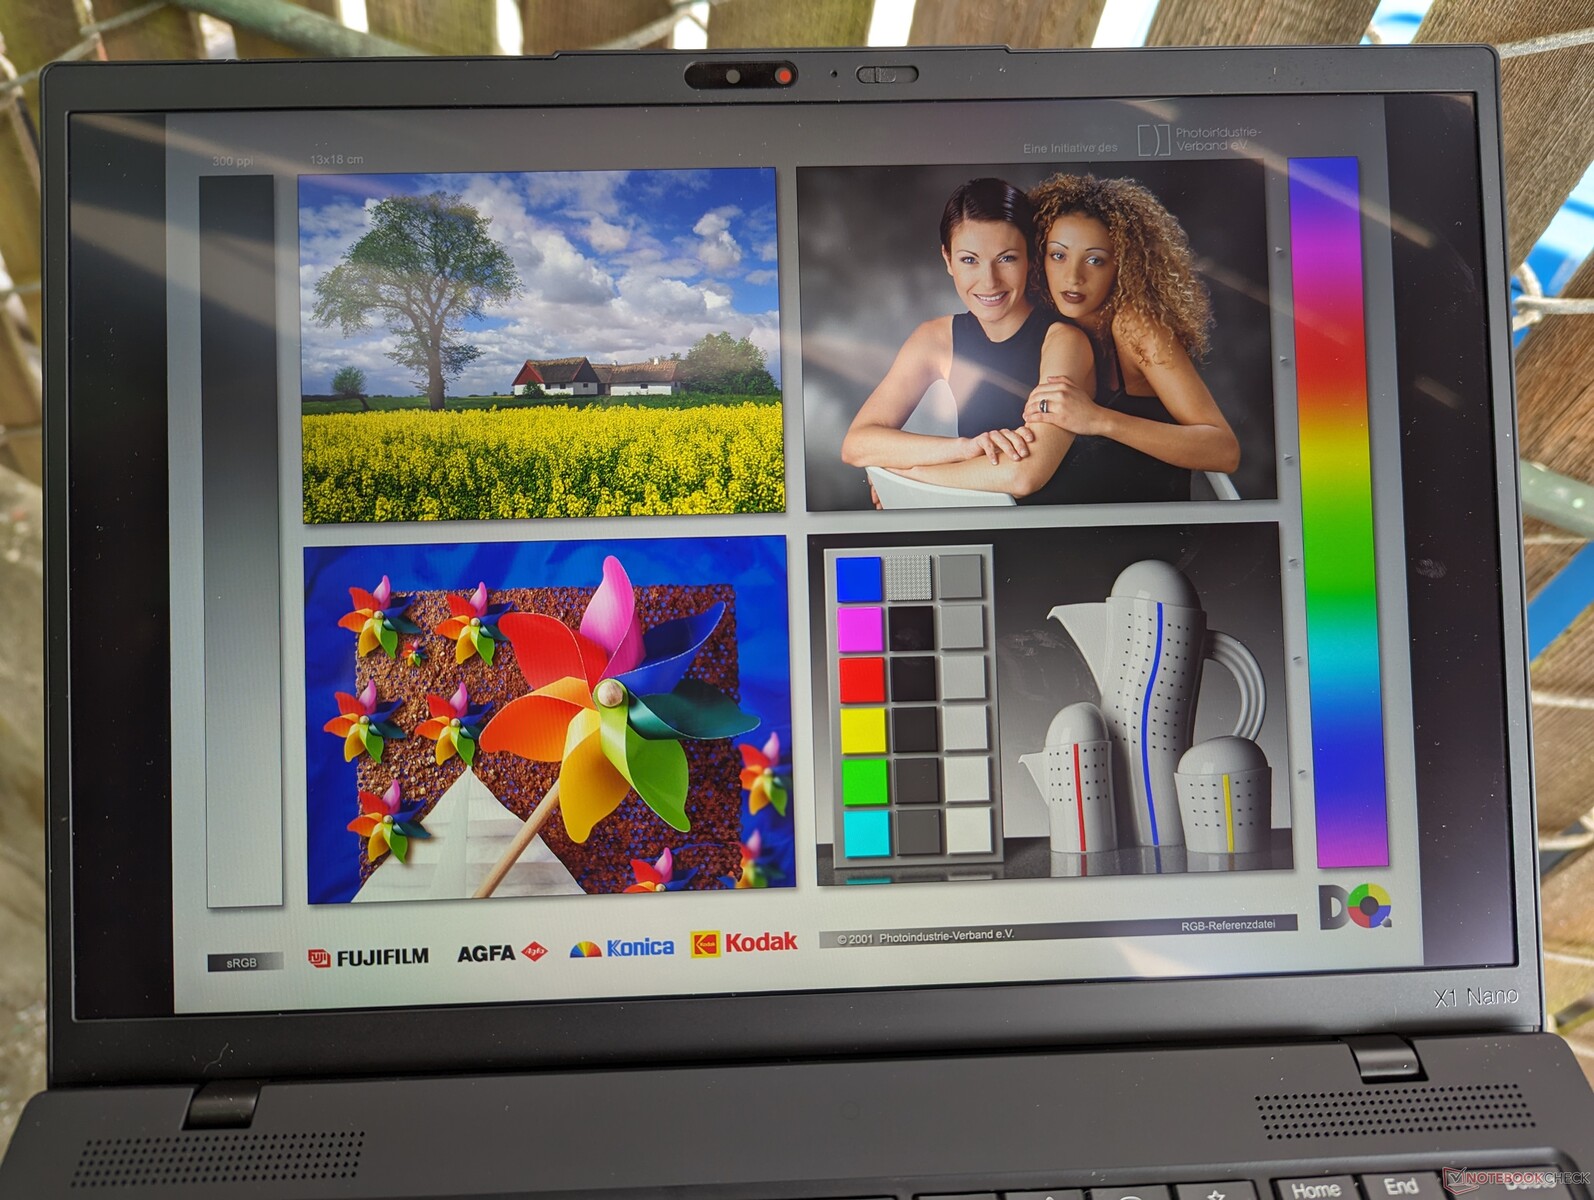
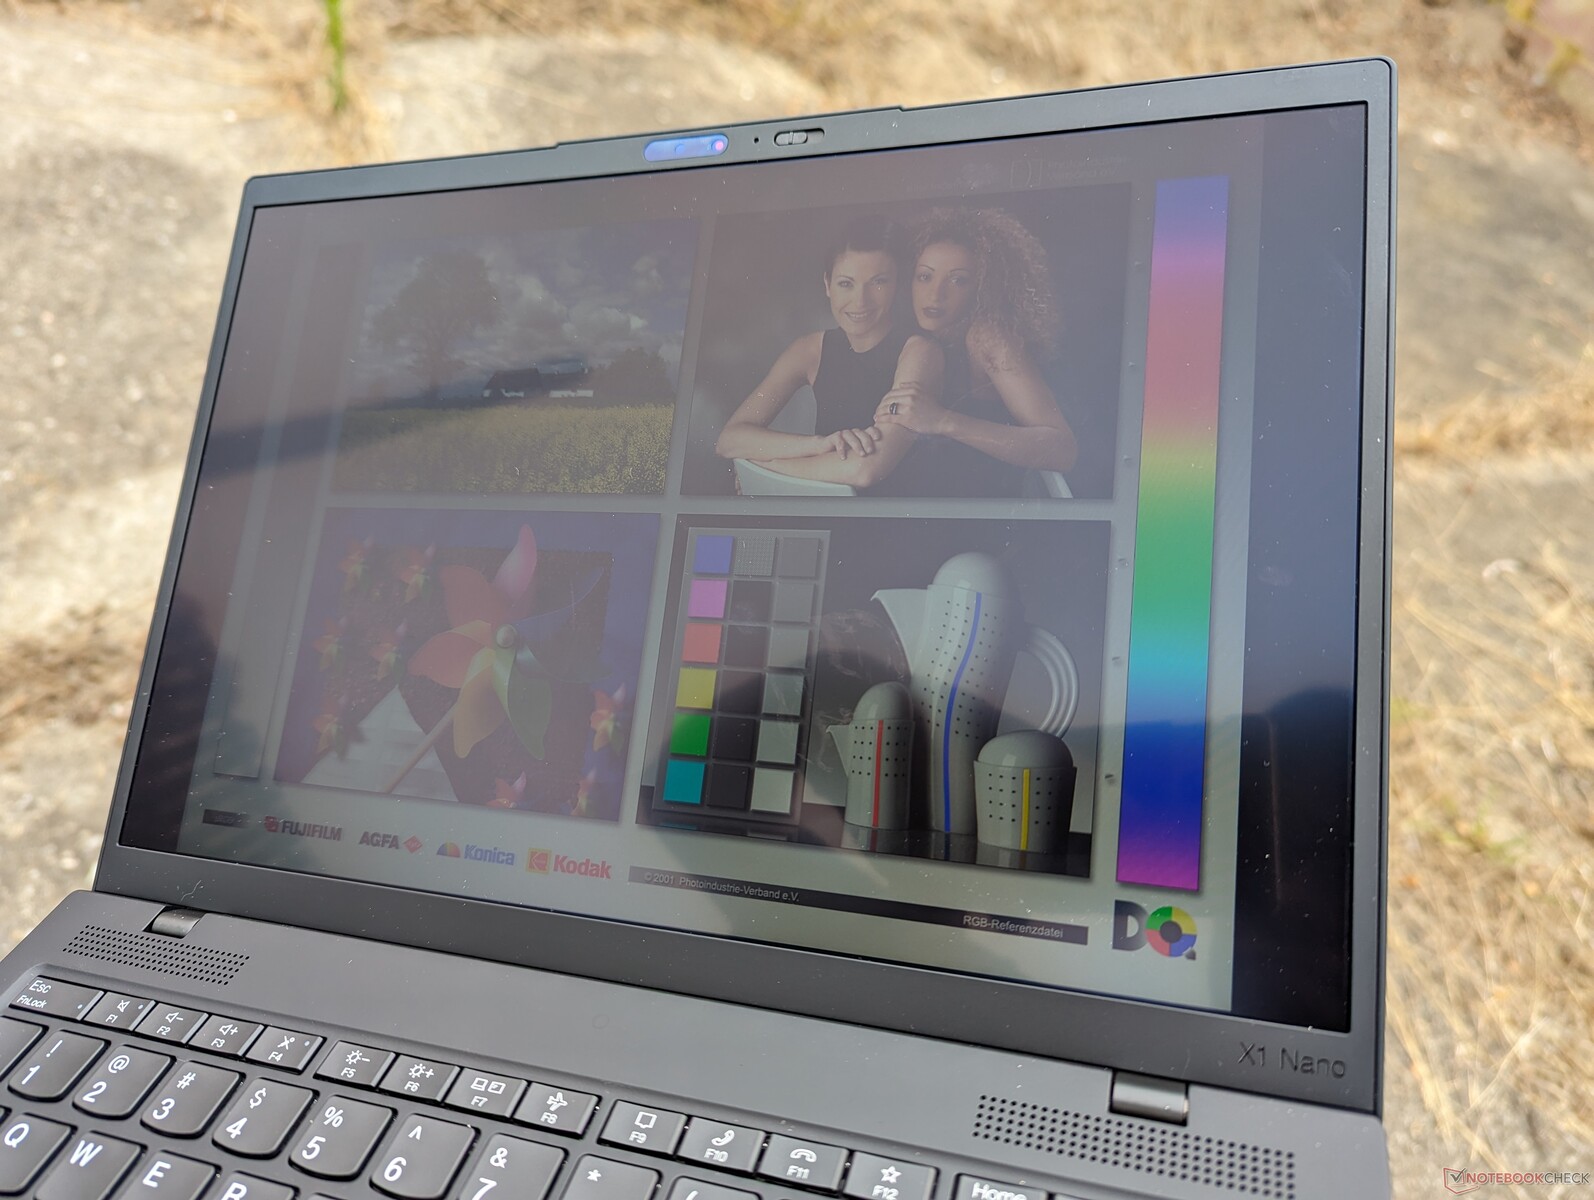
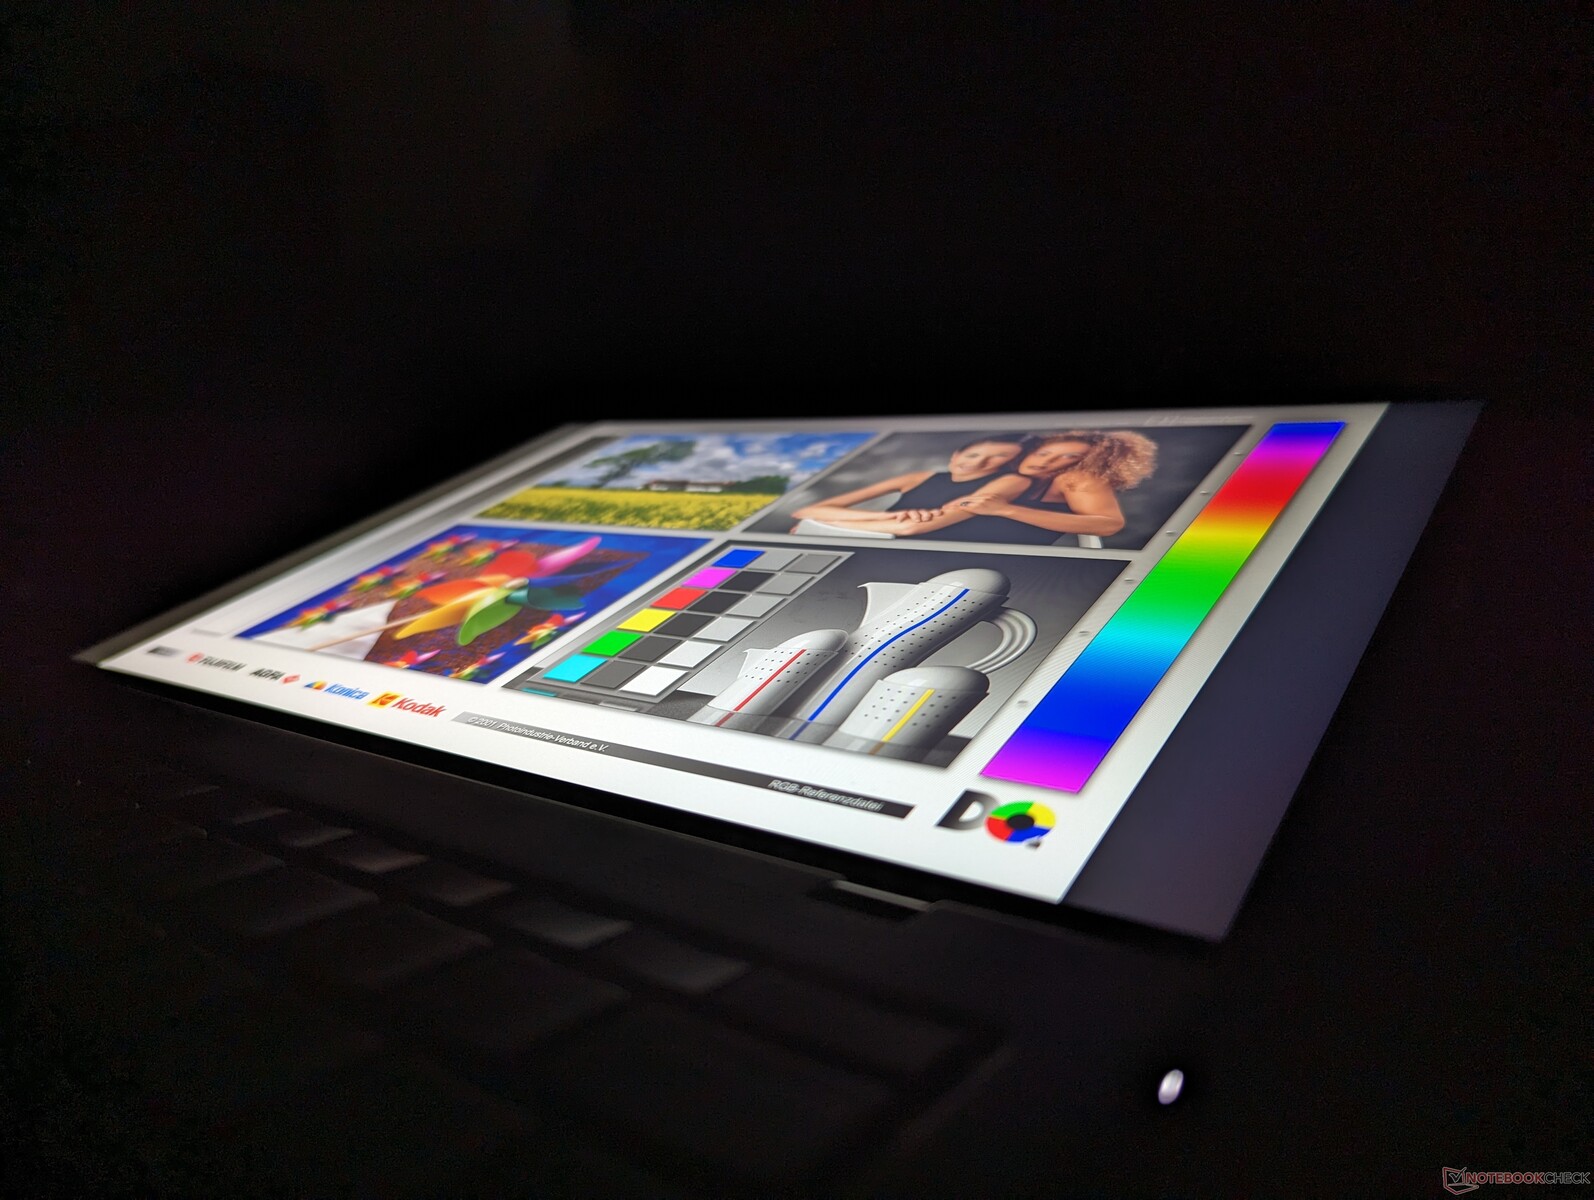
Affichage - Pas d'autres options
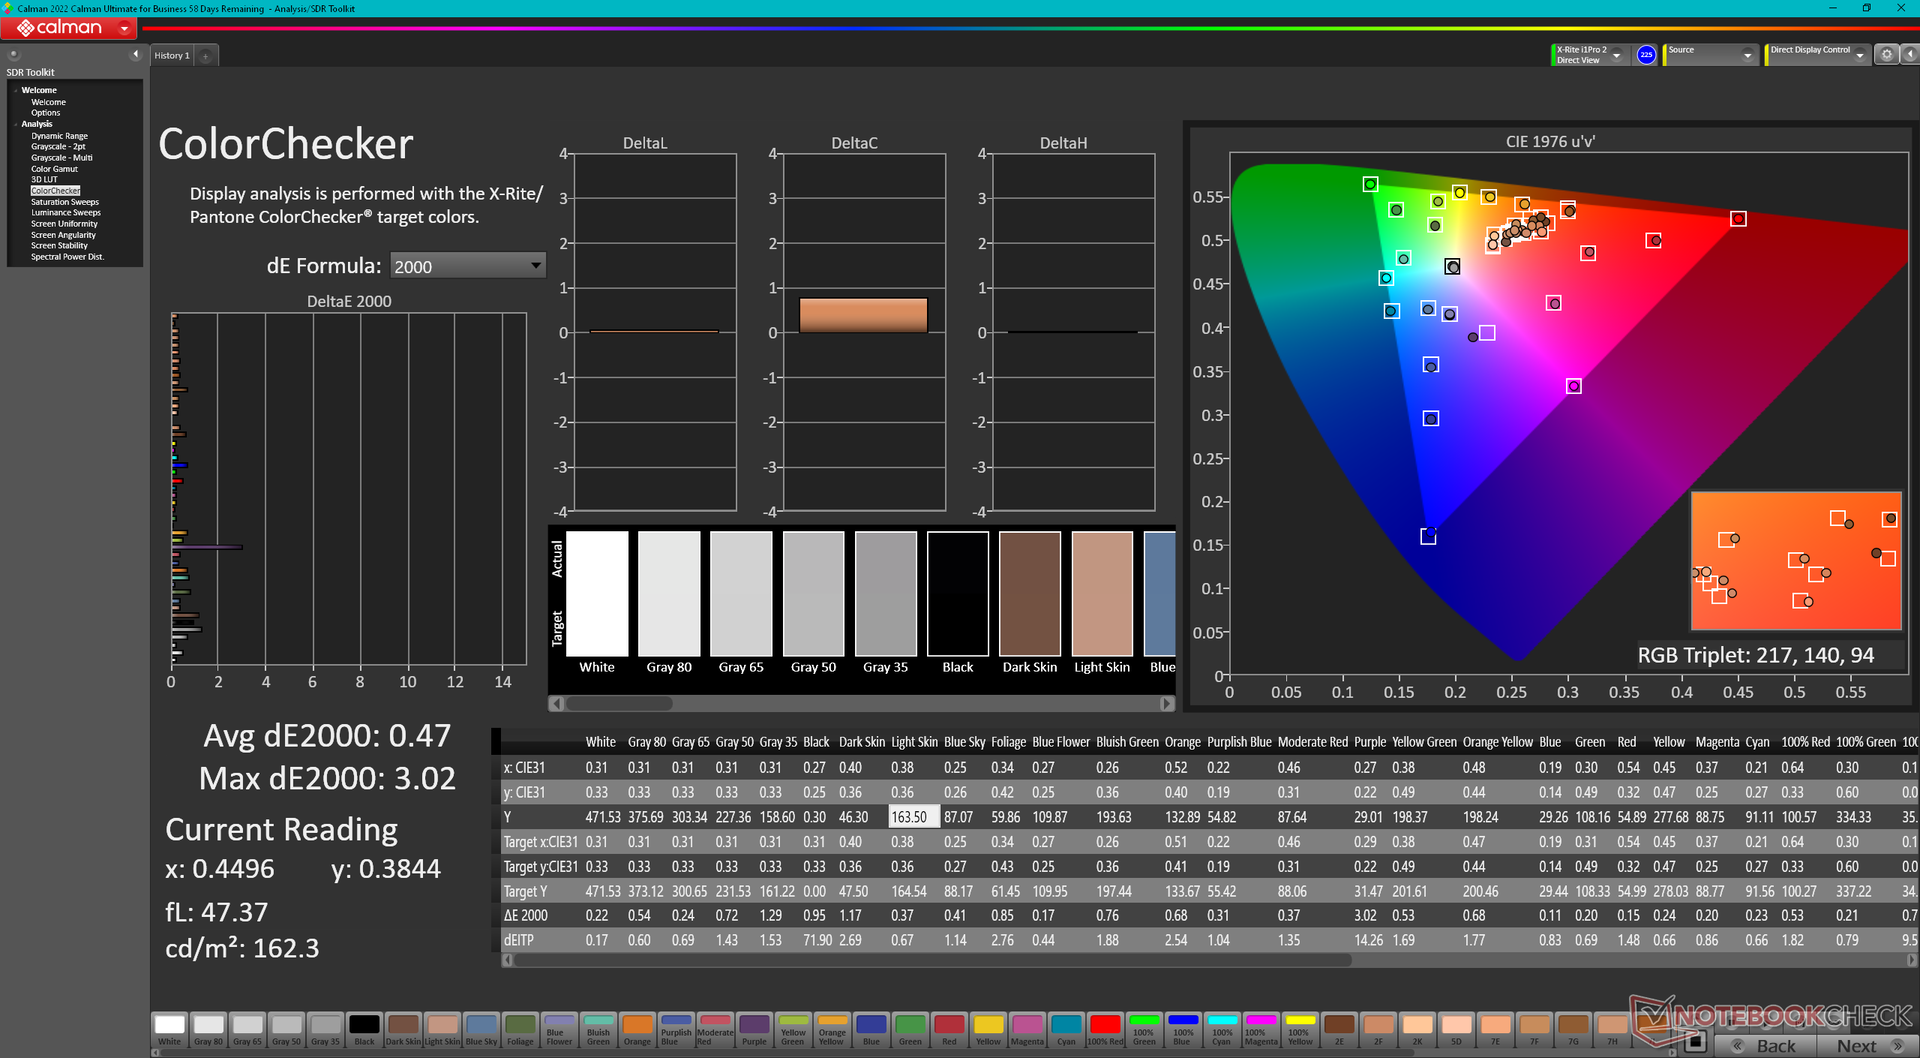
Il est intéressant de noter que la dalle IPS du modèle de cette année est différente de celle du modèle de l'année dernière (MND007ZA1-3 vs. P101ZFZ-BH2). Hormis le changement de nom, les deux écrans présentent des gammes de couleurs, des temps de réponse, des niveaux de luminosité et des taux de contraste similaires, pour une expérience visuelle similaire.

| |||||||||||||||||||||||||
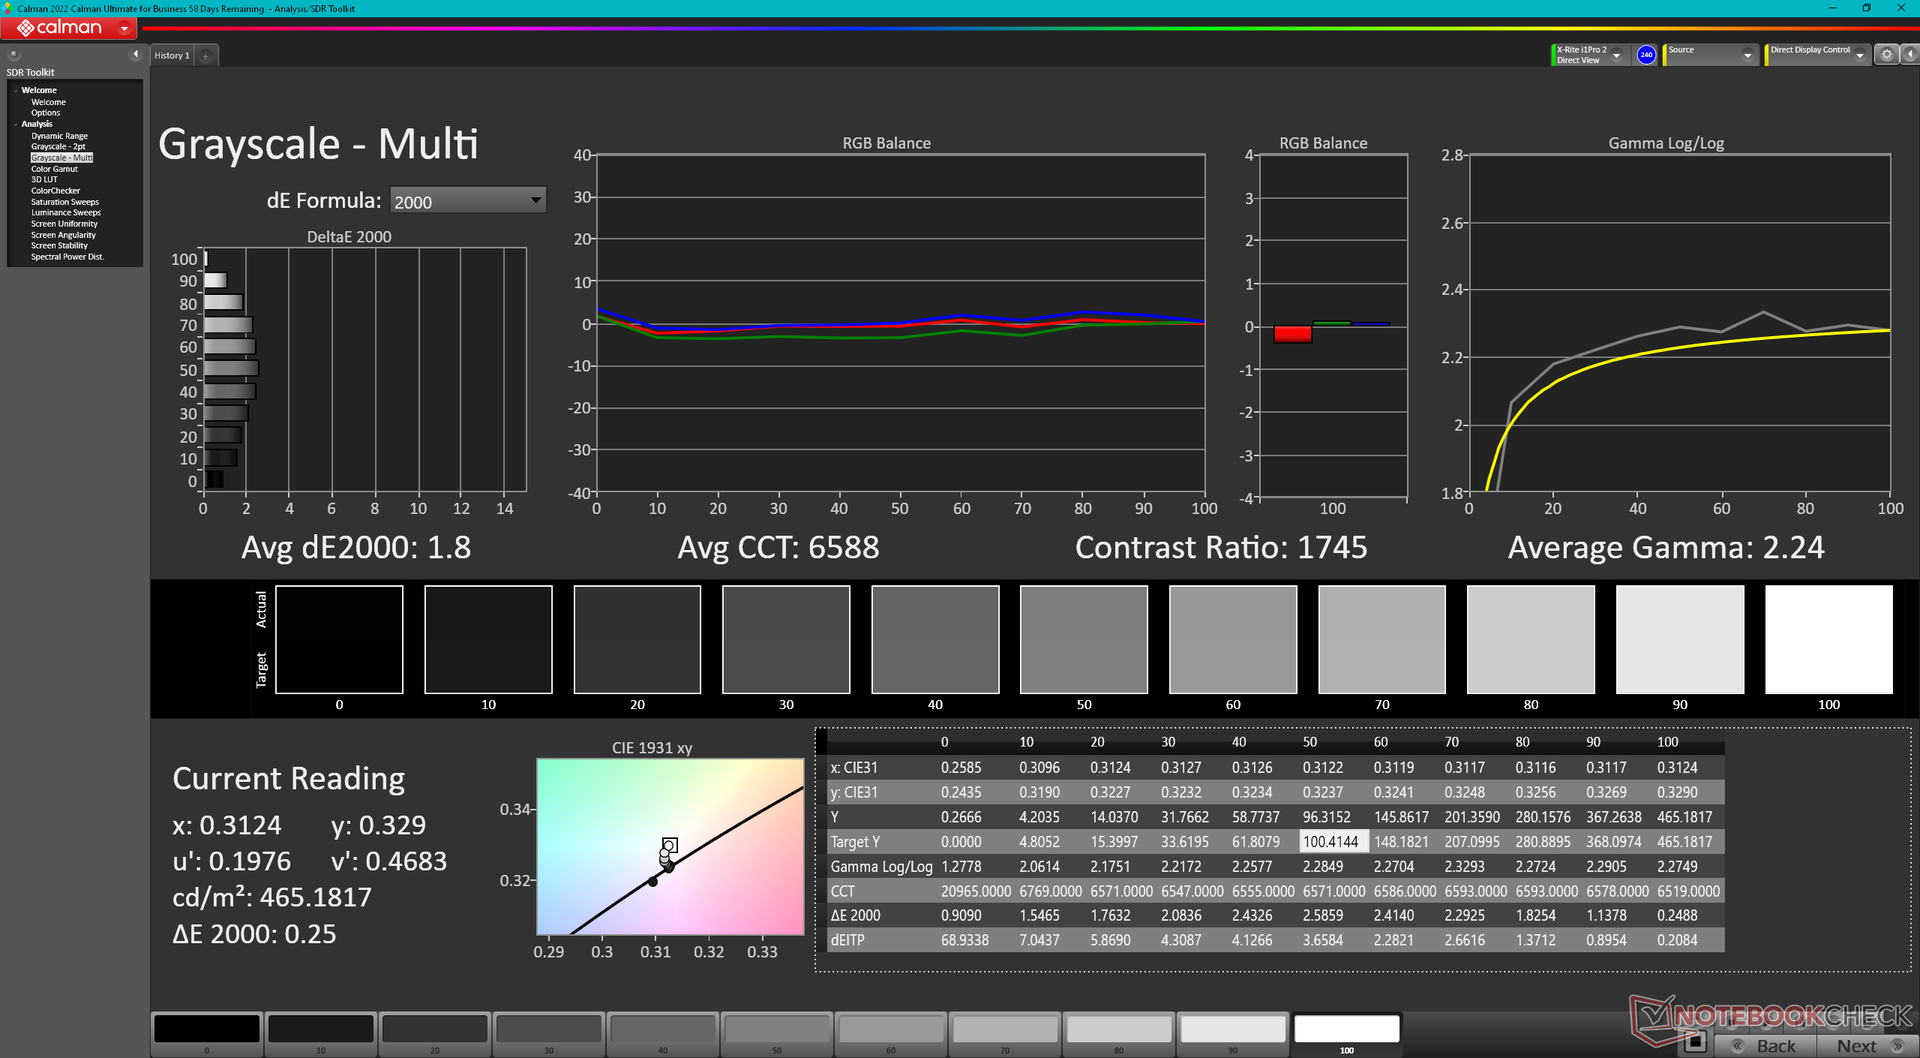
Homogénéité de la luminosité: 86 %
Valeur mesurée au centre, sur batterie: 461.2 cd/m²
Contraste: 1590:1 (Valeurs des noirs: 0.29 cd/m²)
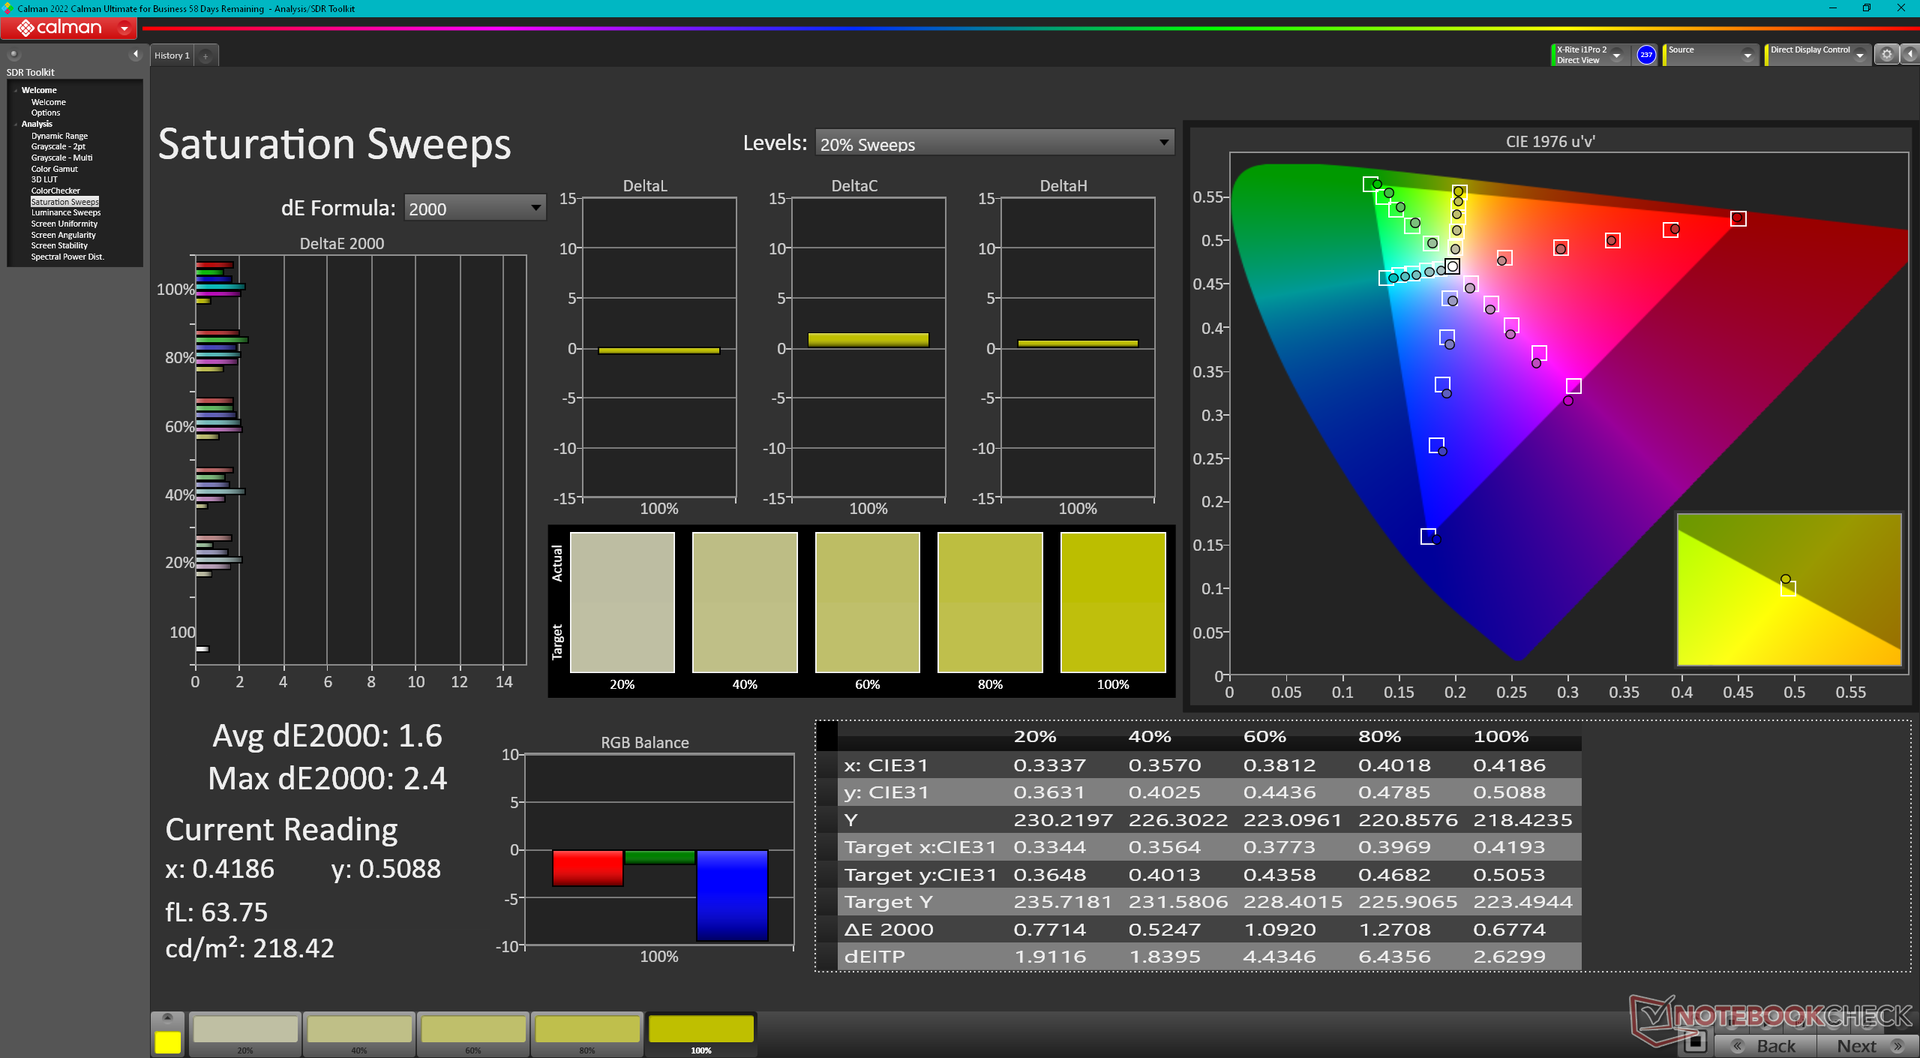
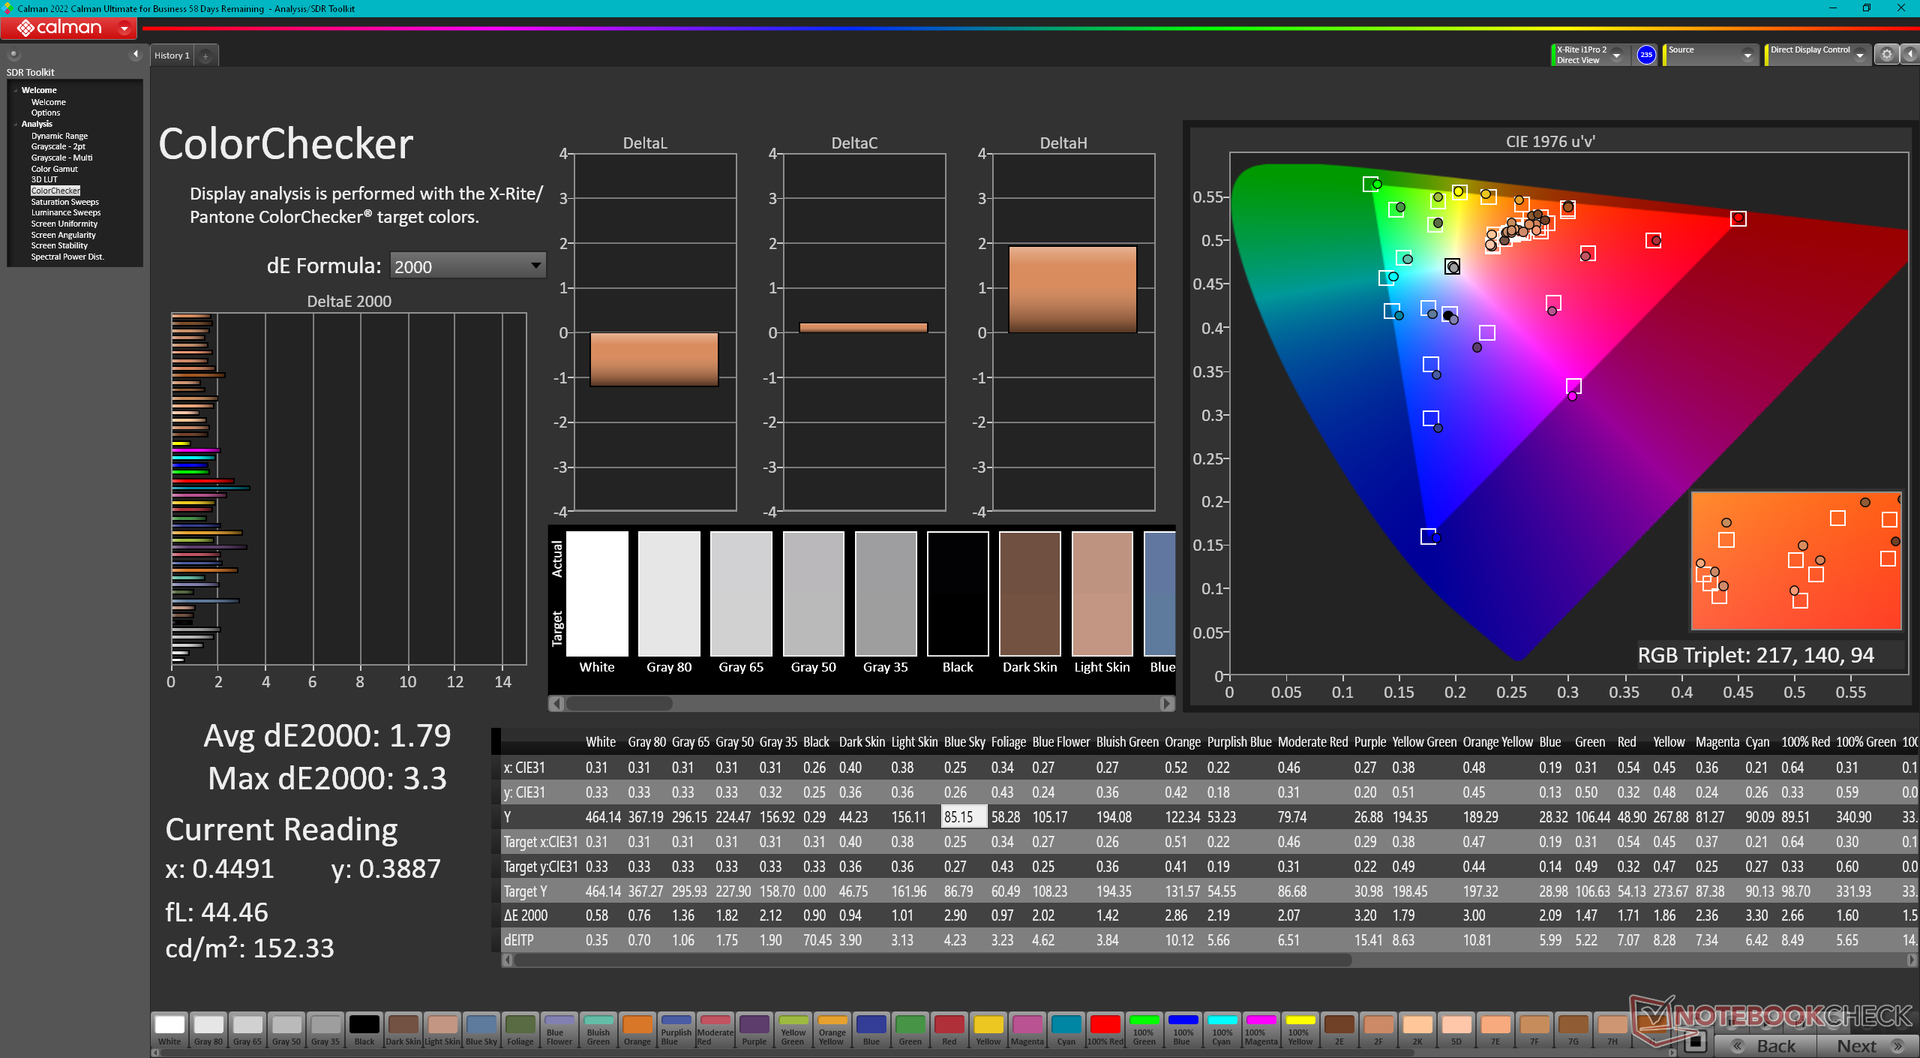
ΔE ColorChecker Calman: 1.79 | ∀{0.5-29.43 Ø4.73}
calibrated: 0.47
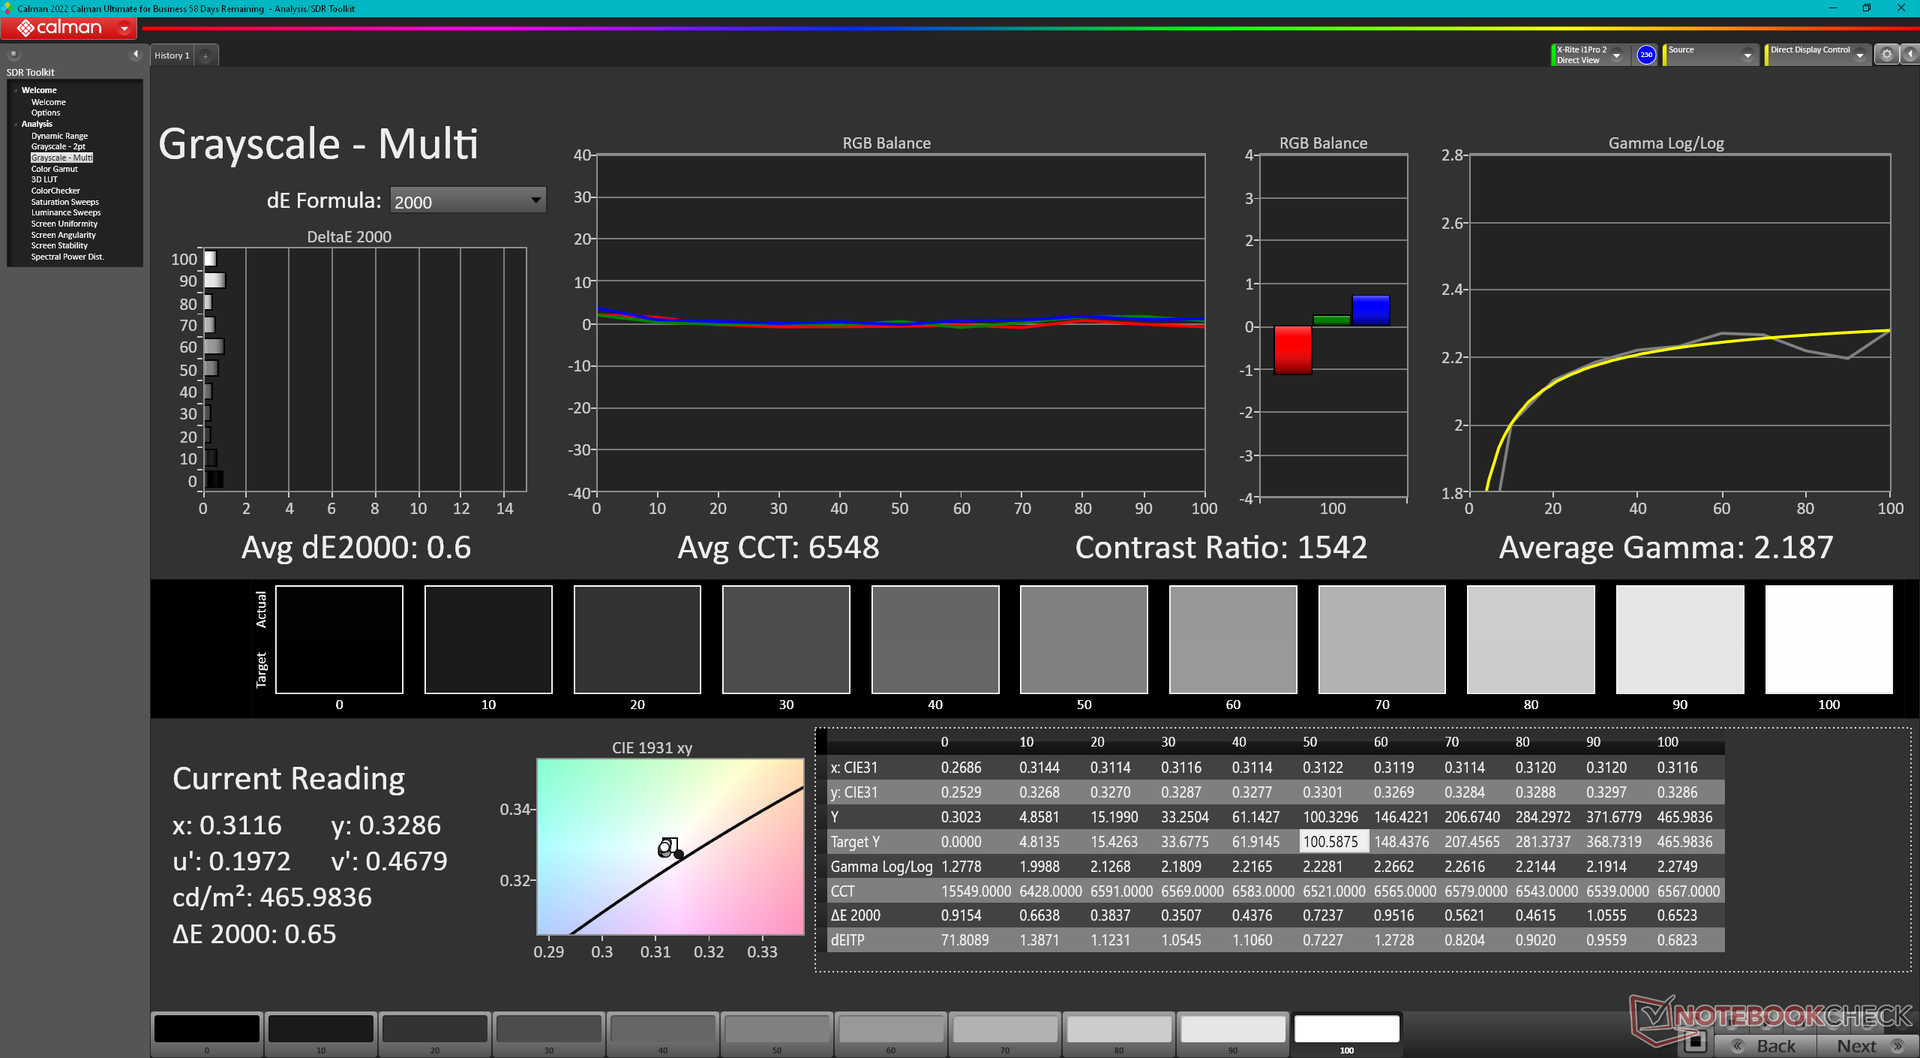
ΔE Greyscale Calman: 1.8 | ∀{0.09-98 Ø4.97}
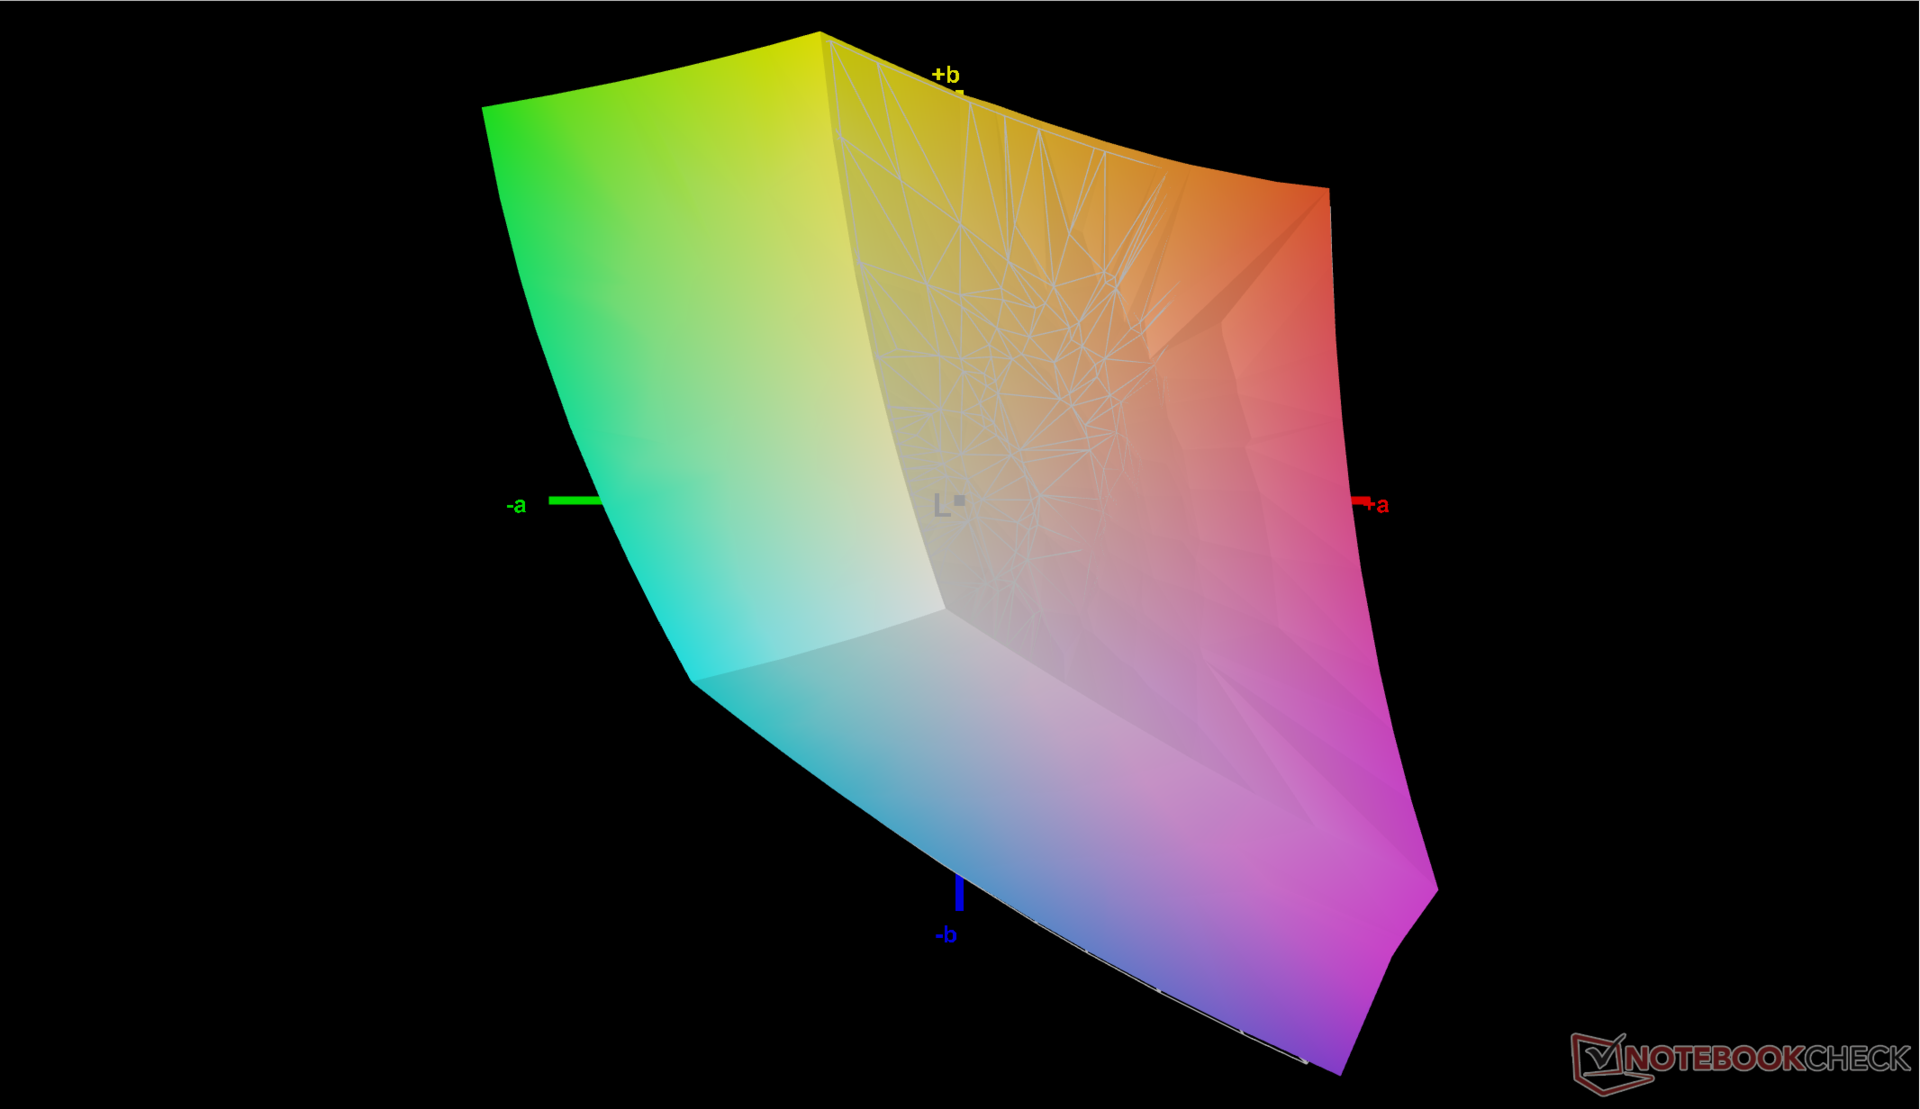
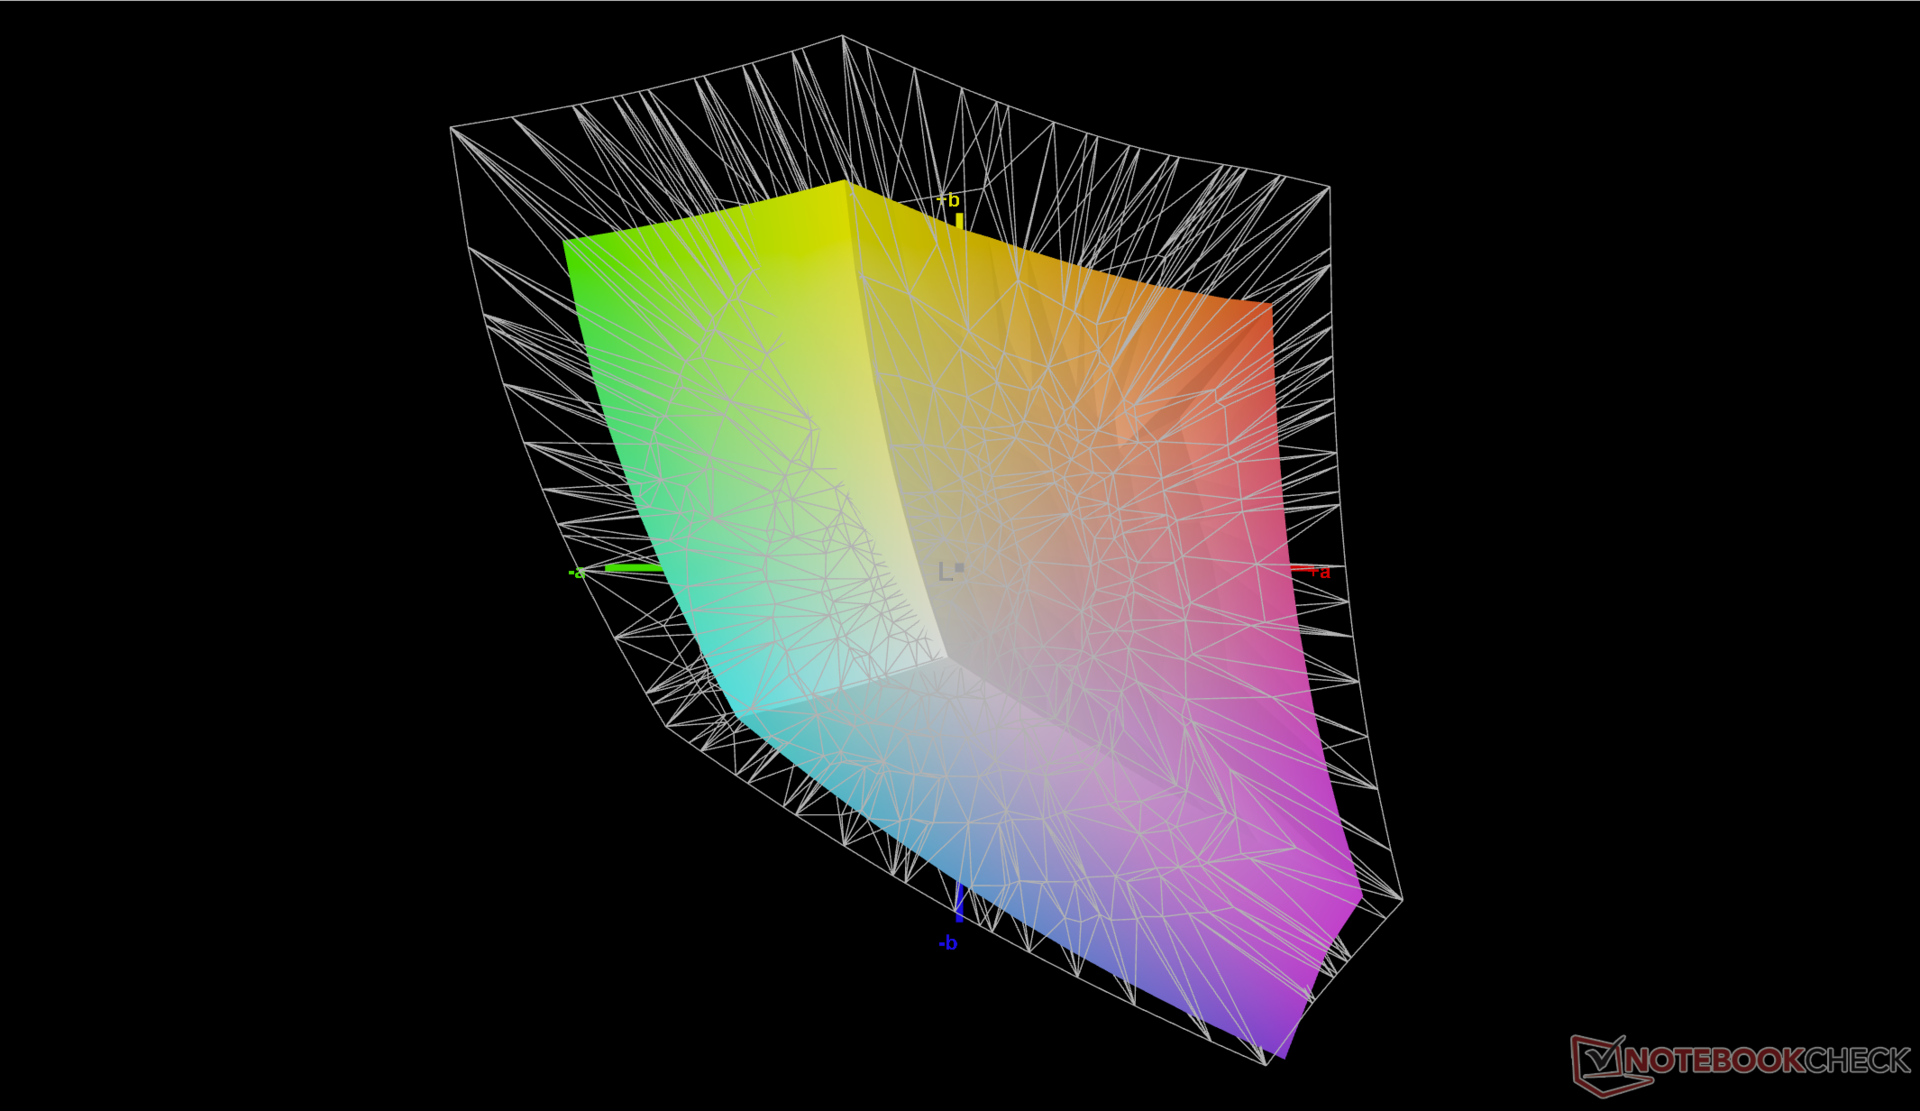
69.7% AdobeRGB 1998 (Argyll 3D)
99.5% sRGB (Argyll 3D)
68.5% Display P3 (Argyll 3D)
Gamma: 2.24
CCT: 6588 K
| Lenovo ThinkPad X1 Nano Gen 3 MND007ZA1-3, IPS, 2160x1350, 13" | Lenovo ThinkPad X1 Nano Gen 2 Core i7-1280P P101ZFZ-BH2, IPS, 2160x1350, 13" | HP Dragonfly G4 Chi Mei CMN13C0, IPS, 1920x1280, 13.5" | Framework Laptop 13.5 13th Gen Intel BOE CQ NE135FBM-N41, IPS, 2256x1504, 13.5" | Dell Latitude 9330 AU Optronics B133QAA, IPS, 2560x1600, 13.3" | LG Gram 14Z90Q LG LP140WU1-SPF1, IPS, 1920x1200, 14" | |
|---|---|---|---|---|---|---|
| Display | -3% | 0% | 0% | 8% | 22% | |
| Display P3 Coverage (%) | 68.5 | 66.2 -3% | 68.4 0% | 68.9 1% | 77.8 14% | 98.4 44% |
| sRGB Coverage (%) | 99.5 | 96.1 -3% | 98.3 -1% | 97.5 -2% | 99.9 0% | 99.9 0% |
| AdobeRGB 1998 Coverage (%) | 69.7 | 68.3 -2% | 70.4 1% | 71.1 2% | 77.5 11% | 85.9 23% |
| Response Times | -4% | -22% | -34% | -82% | -7% | |
| Response Time Grey 50% / Grey 80% * (ms) | 39.9 ? | 43.6 ? -9% | 48.8 ? -22% | 54.9 ? -38% | 67.6 ? -69% | 47.5 ? -19% |
| Response Time Black / White * (ms) | 25.8 ? | 25.6 ? 1% | 31.3 ? -21% | 33.5 ? -30% | 50.4 ? -95% | 24.5 ? 5% |
| PWM Frequency (Hz) | ||||||
| Screen | -79% | -14% | -60% | -31% | -62% | |
| Brightness middle (cd/m²) | 461.2 | 469.6 2% | 408.8 -11% | 503 9% | 542.3 18% | 341 -26% |
| Brightness (cd/m²) | 428 | 460 7% | 399 -7% | 472 10% | 516 21% | 305 -29% |
| Brightness Distribution (%) | 86 | 94 9% | 90 5% | 87 1% | 85 -1% | 87 1% |
| Black Level * (cd/m²) | 0.29 | 0.37 -28% | 0.32 -10% | 0.36 -24% | 0.38 -31% | 0.26 10% |
| Contrast (:1) | 1590 | 1269 -20% | 1278 -20% | 1397 -12% | 1427 -10% | 1312 -17% |
| Colorchecker dE 2000 * | 1.79 | 4.85 -171% | 2.02 -13% | 3.38 -89% | 3.18 -78% | 3.11 -74% |
| Colorchecker dE 2000 max. * | 3.3 | 7.62 -131% | 3.84 -16% | 7.08 -115% | 6.05 -83% | 8.29 -151% |
| Colorchecker dE 2000 calibrated * | 0.47 | 1.22 -160% | 0.61 -30% | 1.21 -157% | 0.67 -43% | 0.83 -77% |
| Greyscale dE 2000 * | 1.8 | 5.7 -217% | 2.3 -28% | 4.8 -167% | 3.1 -72% | 5.3 -194% |
| Gamma | 2.24 98% | 2.13 103% | 2.2 100% | 2.13 103% | 2.08 106% | 2.037 108% |
| CCT | 6588 99% | 6931 94% | 6203 105% | 6235 104% | 6140 106% | 7571 86% |
| Moyenne finale (programmes/paramètres) | -29% /
-52% | -12% /
-12% | -31% /
-44% | -35% /
-30% | -16% /
-36% |
* ... Moindre est la valeur, meilleures sont les performances
L'écran est mieux calibré dès sa sortie de l'emballage, ce qui améliore la précision des couleurs par rapport au modèle de l'année dernière. Les valeurs moyennes de deltaE en niveaux de gris et en couleurs ne seraient que de 1,8 et 1,79, respectivement, contre 5,7 et 4,85 sur le X1 Nano Gen 2. Cela signifie qu'un étalonnage par l'utilisateur final n'est pas aussi nécessaire cette fois-ci.
Temps de réponse de l'écran
| ↔ Temps de réponse noir à blanc | ||
|---|---|---|
| 25.8 ms ... hausse ↗ et chute ↘ combinées | ↗ 11.8 ms hausse | 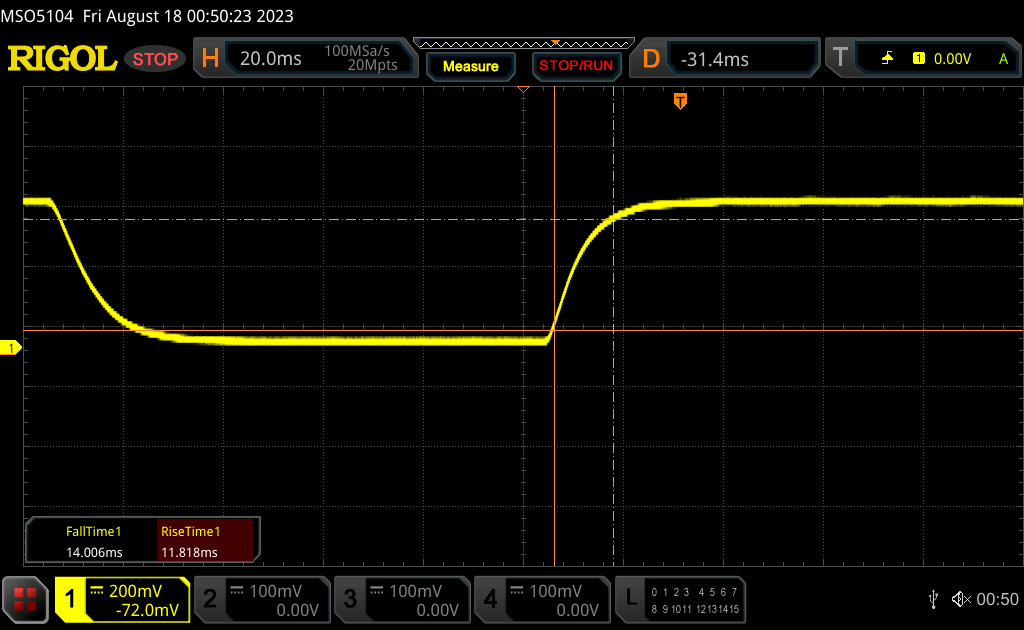 |
| ↘ 14 ms chute | ||
| L'écran souffre de latences relativement élevées, insuffisant pour le jeu. En comparaison, tous les appareils testés affichent entre 0.1 (minimum) et 240 (maximum) ms. » 62 % des appareils testés affichent de meilleures performances. Cela signifie que les latences relevées sont moins bonnes que la moyenne (19.9 ms) de tous les appareils testés. | ||
| ↔ Temps de réponse gris 50% à gris 80% | ||
| 39.9 ms ... hausse ↗ et chute ↘ combinées | ↗ 18.7 ms hausse | 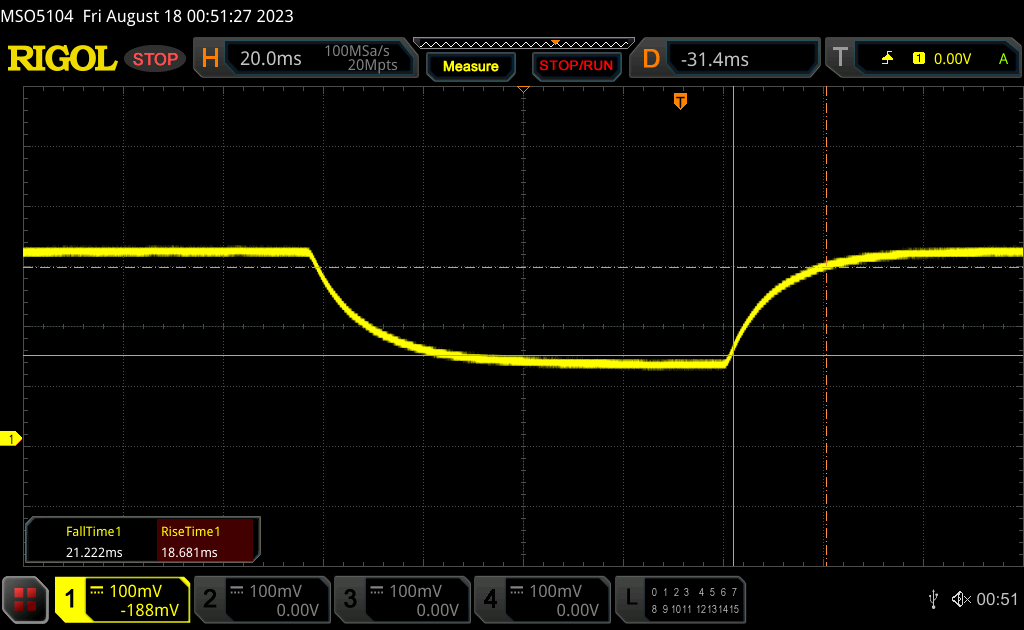 |
| ↘ 21.2 ms chute | ||
| L'écran souffre de latences très élevées, à éviter pour le jeu. En comparaison, tous les appareils testés affichent entre 0.165 (minimum) et 636 (maximum) ms. » 61 % des appareils testés affichent de meilleures performances. Cela signifie que les latences relevées sont moins bonnes que la moyenne (31.1 ms) de tous les appareils testés. | ||
Scintillement / MLI (Modulation de largeur d'impulsion)
| Scintillement / MLI (Modulation de largeur d'impulsion) non décelé | 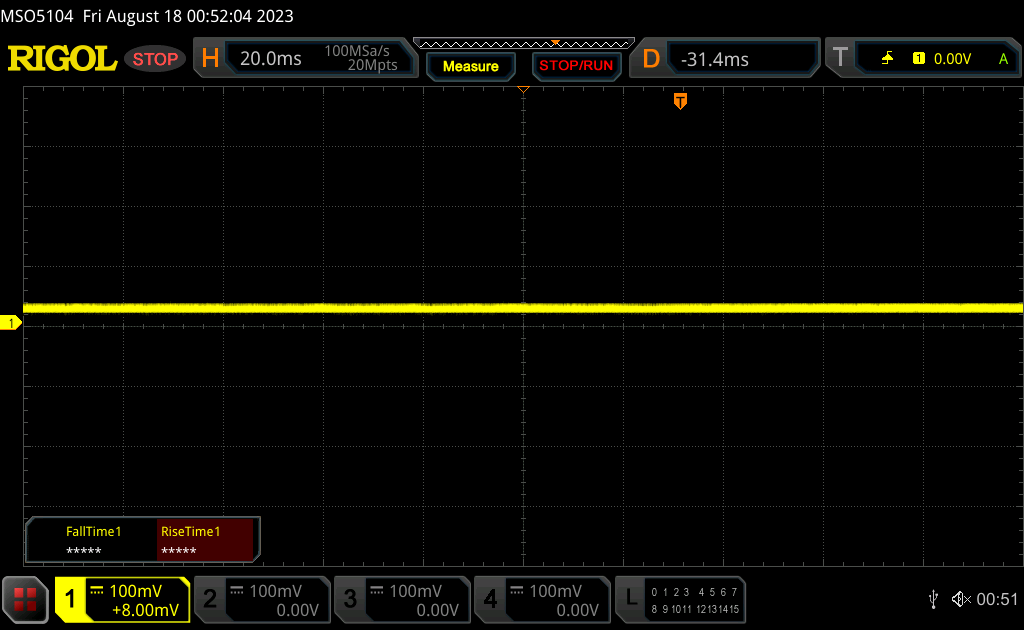 | ||
En comparaison, 52 % des appareils testés n'emploient pas MDI pour assombrir leur écran. Nous avons relevé une moyenne à 7794 (minimum : 5 - maximum : 343500) Hz dans le cas où une MDI était active. | |||

Performance - Mise à niveau Intel Raptor Lake
Conditions d'essai
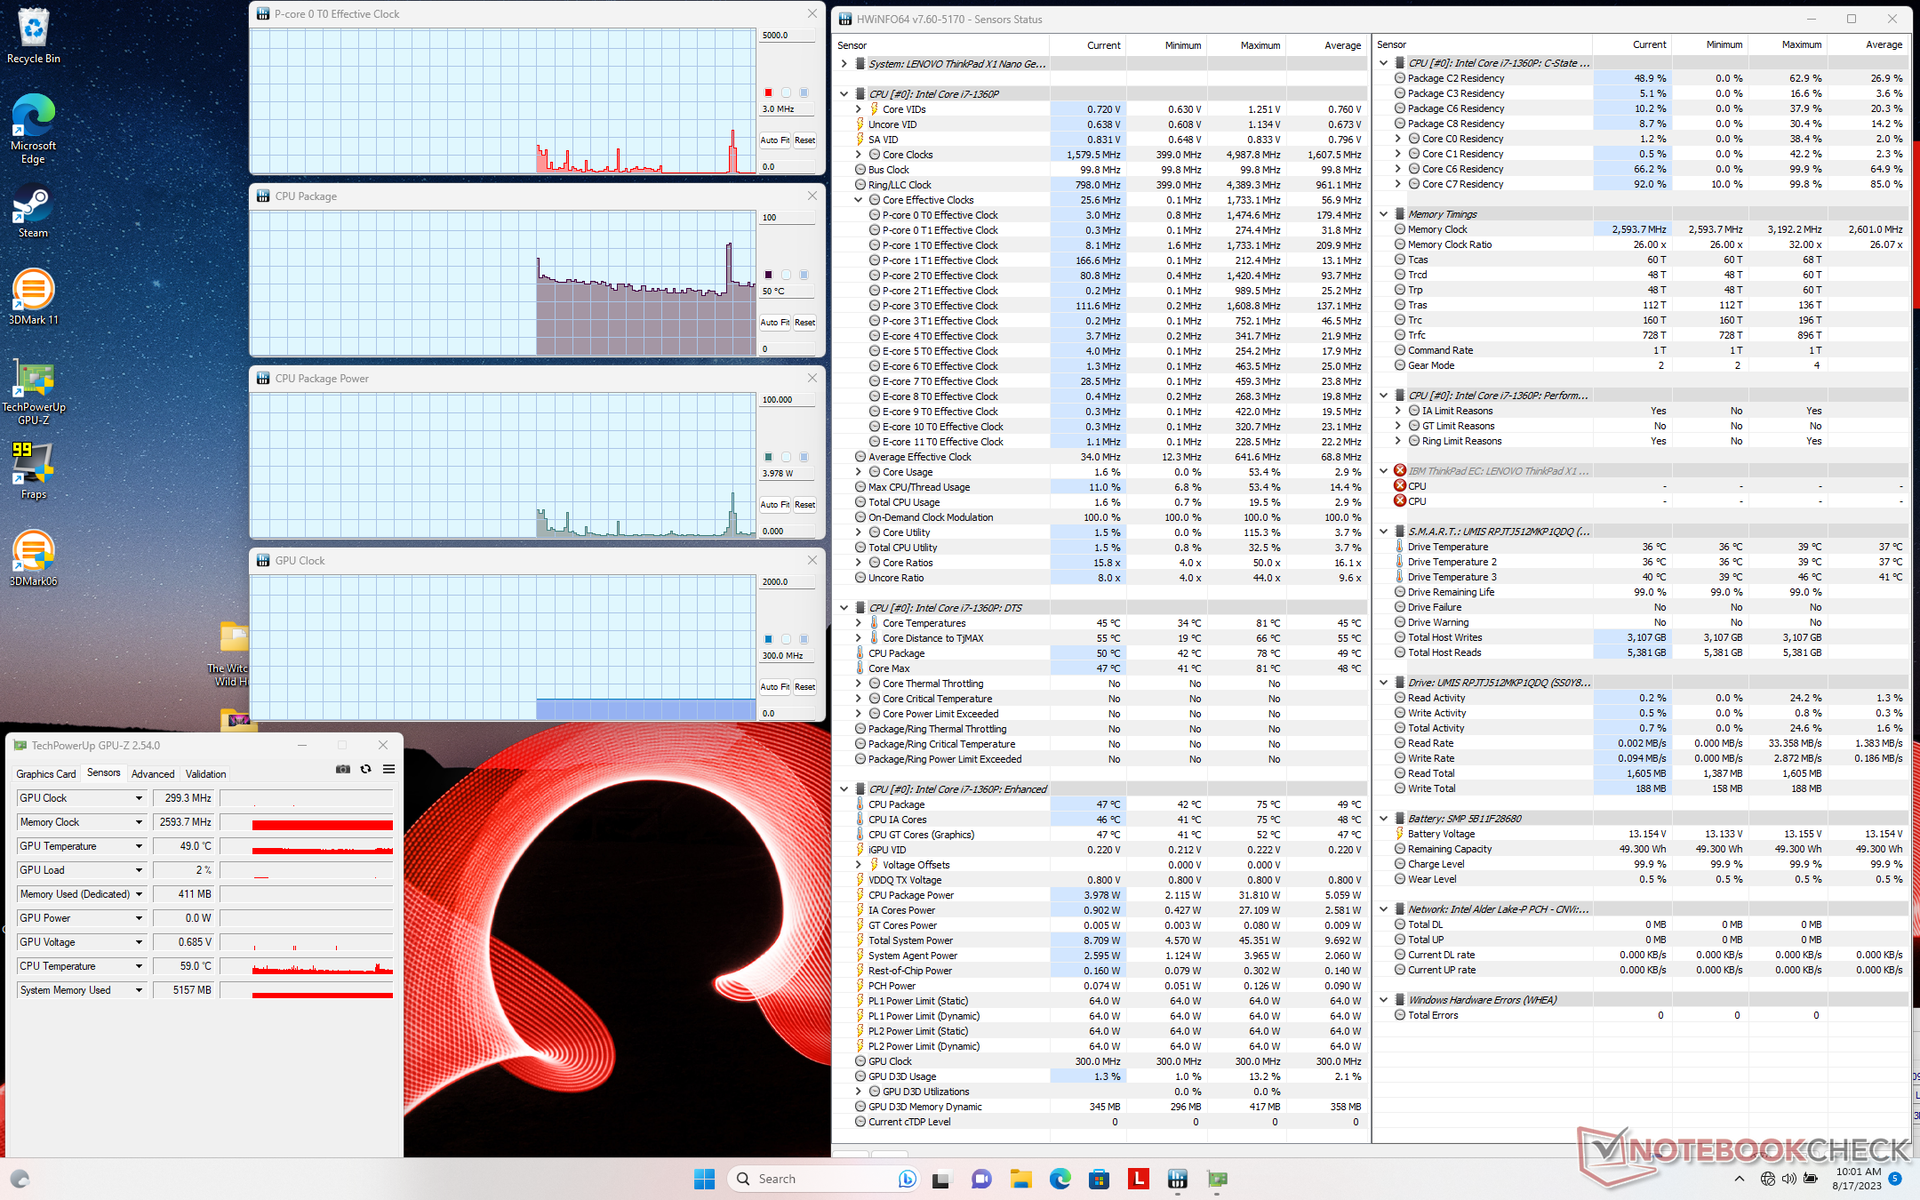
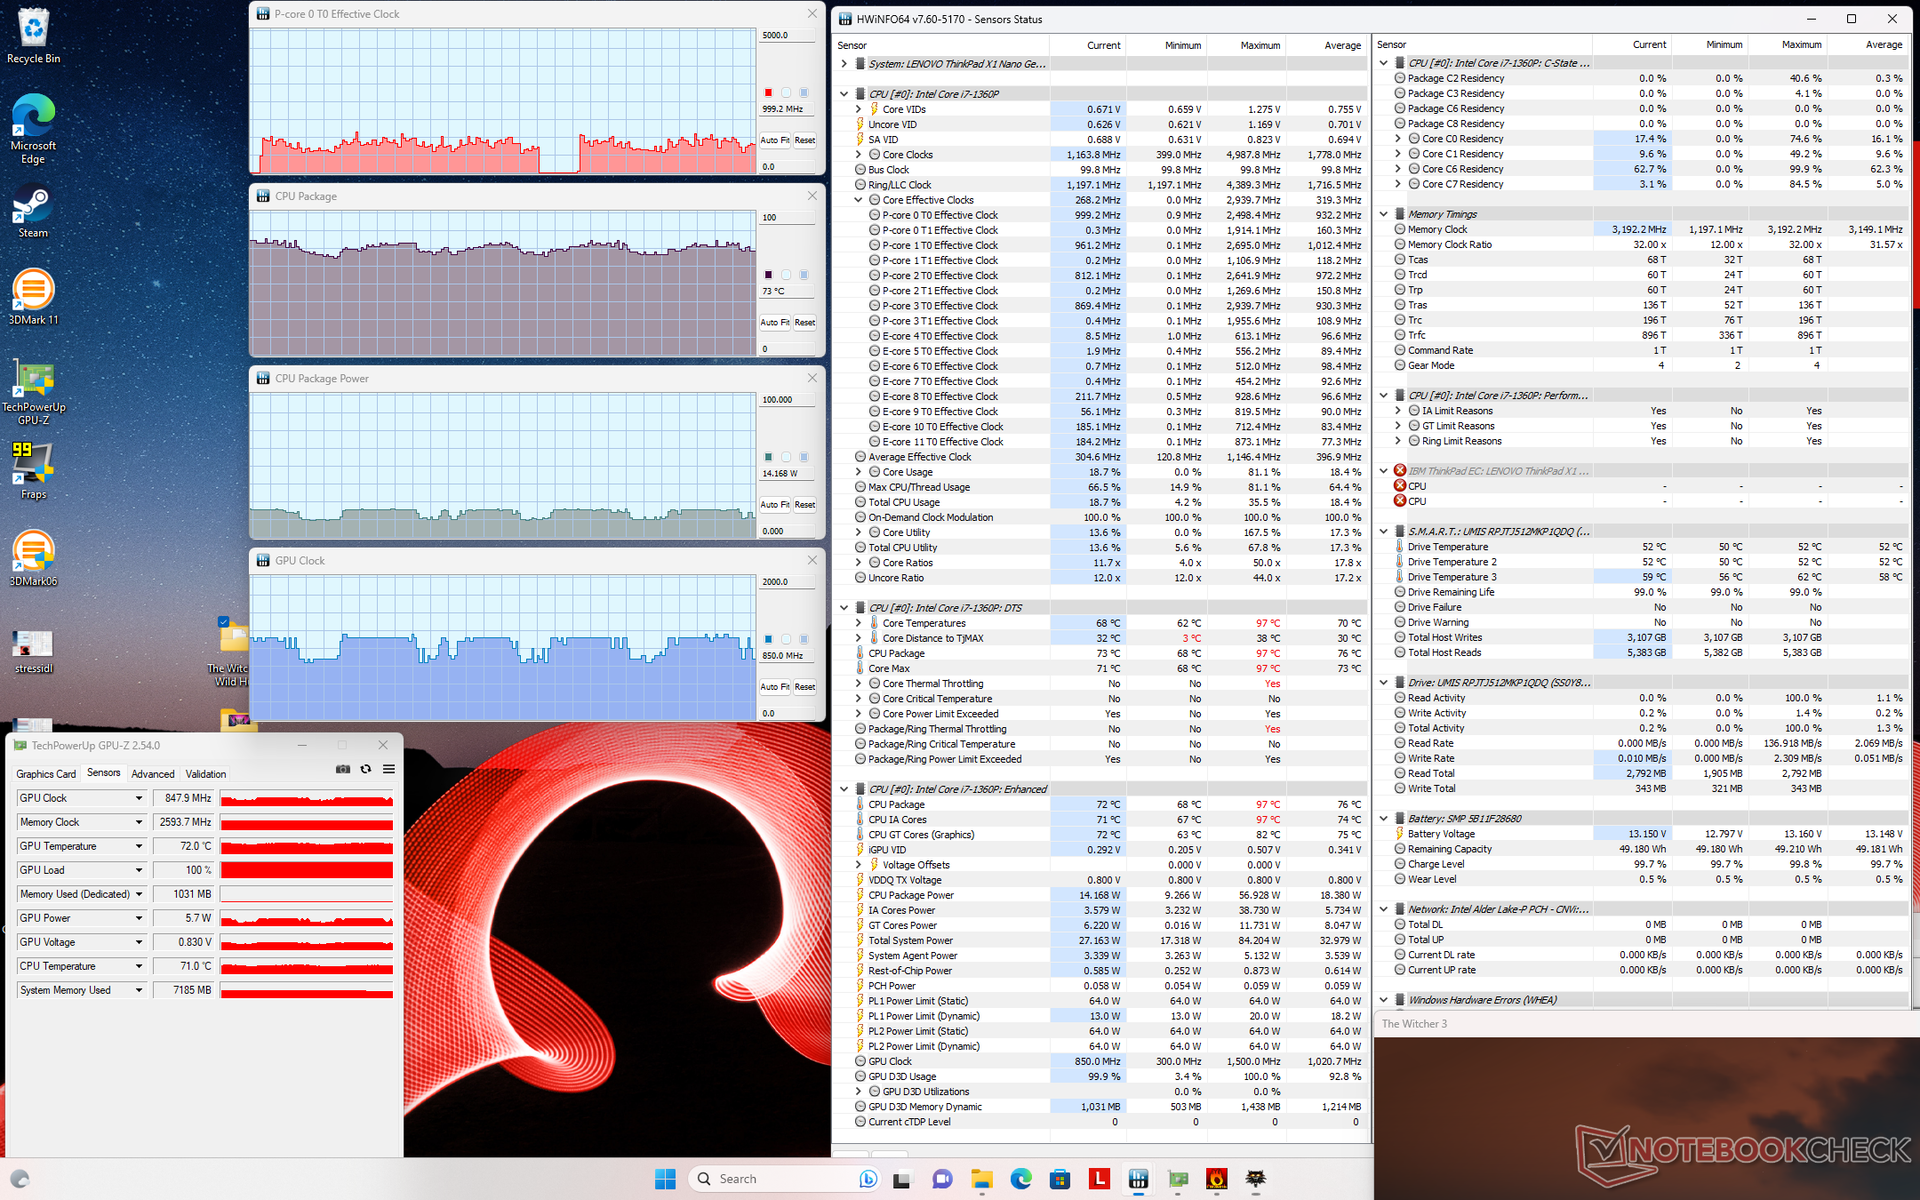
Nous avons réglé Windows sur le mode Performance avant d'effectuer les tests de référence ci-dessous. Sur la plupart des autres ordinateurs portables Lenovo, le logiciel Vantage dispose de paramètres d'alimentation spéciaux en plus des paramètres d'alimentation habituels de Windows. Sur le ThinkPad X1 Nano, cependant, Vantage n'a pas de paramètres d'alimentation spéciaux pour éviter toute confusion.
Processeur
Notre Core i7-1360P de 13e génération Core i7-1360P aurait des performances presque identiques à celles du Core i7-1280P de l'année dernière. Il est même parfois inférieur à l'ancien processeur en raison d'un étranglement plus prononcé, comme le montrent les résultats de la boucle CineBench R15 xT ci-dessous. Néanmoins, il est toujours plus rapide que les subnotebooks concurrents équipés de processeurs Core U-series comme leHP Dragonfly G4 ou leDell Latitude 9330 jusqu'à 20 %.
Cinebench R15 Multi Loop
Cinebench R23: Multi Core | Single Core
Cinebench R20: CPU (Multi Core) | CPU (Single Core)
Cinebench R15: CPU Multi 64Bit | CPU Single 64Bit
Blender: v2.79 BMW27 CPU
7-Zip 18.03: 7z b 4 | 7z b 4 -mmt1
Geekbench 5.5: Multi-Core | Single-Core
HWBOT x265 Benchmark v2.2: 4k Preset
LibreOffice : 20 Documents To PDF
R Benchmark 2.5: Overall mean
| CPU Performance rating | |
| Framework Laptop 13.5 13th Gen Intel | |
| Moyenne Intel Core i7-1360P | |
| Lenovo ThinkPad X1 Nano Gen 2 Core i7-1280P | |
| Asus Zenbook S 13 OLED | |
| Lenovo ThinkPad X1 Nano Gen 3 | |
| HP Dragonfly G4 | |
| Lenovo ThinkBook 13s G3 20YA0005GE | |
| Apple MacBook Air M2 10C GPU -5! | |
| Lenovo ThinkPad X13 Yoga G4 21F20017GE | |
| Dell Latitude 9330 | |
| Lenovo ThinkPad X13 G3 21BN0046GE | |
| Lenovo ThinkPad X13 G3 21CM002UGE | |
| Dell Inspiron 13 7306-6TYH5 | |
| LG Gram 14Z90Q | |
| Lenovo IdeaPad S540-13ARE-82DL000YGE -2! | |
| Cinebench R23 / Multi Core | |
| Framework Laptop 13.5 13th Gen Intel | |
| Moyenne Intel Core i7-1360P (6390 - 12637, n=16) | |
| Asus Zenbook S 13 OLED | |
| Lenovo ThinkPad X1 Nano Gen 2 Core i7-1280P | |
| Apple MacBook Air M2 10C GPU | |
| Lenovo ThinkPad X1 Nano Gen 3 | |
| Lenovo ThinkBook 13s G3 20YA0005GE | |
| Lenovo ThinkPad X13 G3 21CM002UGE | |
| HP Dragonfly G4 | |
| Dell Latitude 9330 | |
| Lenovo ThinkPad X13 Yoga G4 21F20017GE | |
| Dell Inspiron 13 7306-6TYH5 | |
| LG Gram 14Z90Q | |
| Lenovo ThinkPad X13 G3 21BN0046GE | |
| Cinebench R23 / Single Core | |
| Framework Laptop 13.5 13th Gen Intel | |
| HP Dragonfly G4 | |
| Moyenne Intel Core i7-1360P (1596 - 1909, n=16) | |
| Lenovo ThinkPad X1 Nano Gen 3 | |
| Lenovo ThinkPad X13 G3 21BN0046GE | |
| Lenovo ThinkPad X1 Nano Gen 2 Core i7-1280P | |
| Lenovo ThinkPad X13 Yoga G4 21F20017GE | |
| Apple MacBook Air M2 10C GPU | |
| Dell Latitude 9330 | |
| Asus Zenbook S 13 OLED | |
| Dell Inspiron 13 7306-6TYH5 | |
| Lenovo ThinkPad X13 G3 21CM002UGE | |
| Lenovo ThinkBook 13s G3 20YA0005GE | |
| LG Gram 14Z90Q | |
| Cinebench R20 / CPU (Single Core) | |
| Framework Laptop 13.5 13th Gen Intel | |
| HP Dragonfly G4 | |
| Moyenne Intel Core i7-1360P (611 - 736, n=16) | |
| Lenovo ThinkPad X1 Nano Gen 3 | |
| Lenovo ThinkPad X13 G3 21BN0046GE | |
| Lenovo ThinkPad X1 Nano Gen 2 Core i7-1280P | |
| Lenovo ThinkPad X13 Yoga G4 21F20017GE | |
| Dell Latitude 9330 | |
| Dell Inspiron 13 7306-6TYH5 | |
| Asus Zenbook S 13 OLED | |
| Lenovo ThinkBook 13s G3 20YA0005GE | |
| Lenovo ThinkPad X13 G3 21CM002UGE | |
| Lenovo IdeaPad S540-13ARE-82DL000YGE | |
| LG Gram 14Z90Q | |
| Apple MacBook Air M2 10C GPU | |
| Cinebench R15 / CPU Multi 64Bit | |
| Framework Laptop 13.5 13th Gen Intel | |
| Lenovo ThinkPad X1 Nano Gen 2 Core i7-1280P | |
| Lenovo ThinkBook 13s G3 20YA0005GE | |
| Lenovo ThinkBook 13s G3 20YA0005GE | |
| Moyenne Intel Core i7-1360P (1079 - 2214, n=16) | |
| Asus Zenbook S 13 OLED | |
| Lenovo ThinkPad X1 Nano Gen 3 | |
| Lenovo ThinkPad X13 Yoga G4 21F20017GE | |
| HP Dragonfly G4 | |
| Lenovo IdeaPad S540-13ARE-82DL000YGE | |
| Lenovo ThinkPad X13 G3 21CM002UGE | |
| Apple MacBook Air M2 10C GPU | |
| Dell Latitude 9330 | |
| Lenovo ThinkPad X13 G3 21BN0046GE | |
| LG Gram 14Z90Q | |
| Dell Inspiron 13 7306-6TYH5 | |
| Dell Inspiron 13 7306-6TYH5 | |
| 7-Zip 18.03 / 7z b 4 -mmt1 | |
| Framework Laptop 13.5 13th Gen Intel | |
| HP Dragonfly G4 | |
| Lenovo ThinkPad X1 Nano Gen 3 | |
| Moyenne Intel Core i7-1360P (4647 - 5973, n=16) | |
| Lenovo ThinkPad X1 Nano Gen 2 Core i7-1280P | |
| Asus Zenbook S 13 OLED | |
| Lenovo ThinkBook 13s G3 20YA0005GE | |
| Lenovo ThinkPad X13 G3 21BN0046GE | |
| Lenovo ThinkPad X13 G3 21CM002UGE | |
| Lenovo ThinkPad X13 Yoga G4 21F20017GE | |
| Dell Inspiron 13 7306-6TYH5 | |
| Dell Latitude 9330 | |
| LG Gram 14Z90Q | |
| Lenovo IdeaPad S540-13ARE-82DL000YGE | |
| HWBOT x265 Benchmark v2.2 / 4k Preset | |
| Framework Laptop 13.5 13th Gen Intel | |
| Asus Zenbook S 13 OLED | |
| Moyenne Intel Core i7-1360P (6.9 - 14.2, n=16) | |
| Lenovo ThinkPad X1 Nano Gen 3 | |
| Lenovo ThinkBook 13s G3 20YA0005GE | |
| Lenovo ThinkPad X1 Nano Gen 2 Core i7-1280P | |
| Lenovo ThinkPad X13 G3 21CM002UGE | |
| Lenovo ThinkPad X13 G3 21BN0046GE | |
| Lenovo IdeaPad S540-13ARE-82DL000YGE | |
| HP Dragonfly G4 | |
| Dell Latitude 9330 | |
| Lenovo ThinkPad X13 Yoga G4 21F20017GE | |
| LG Gram 14Z90Q | |
| Dell Inspiron 13 7306-6TYH5 | |
| LibreOffice / 20 Documents To PDF | |
| Lenovo IdeaPad S540-13ARE-82DL000YGE | |
| Lenovo ThinkPad X13 G3 21CM002UGE | |
| Asus Zenbook S 13 OLED | |
| LG Gram 14Z90Q | |
| Lenovo ThinkPad X13 Yoga G4 21F20017GE | |
| Dell Latitude 9330 | |
| Lenovo ThinkPad X1 Nano Gen 3 | |
| Lenovo ThinkBook 13s G3 20YA0005GE | |
| Dell Inspiron 13 7306-6TYH5 | |
| Moyenne Intel Core i7-1360P (40.3 - 57.2, n=16) | |
| Lenovo ThinkPad X1 Nano Gen 2 Core i7-1280P | |
| HP Dragonfly G4 | |
| Lenovo ThinkPad X13 G3 21BN0046GE | |
| Framework Laptop 13.5 13th Gen Intel | |
| R Benchmark 2.5 / Overall mean | |
| Lenovo IdeaPad S540-13ARE-82DL000YGE | |
| Lenovo ThinkPad X13 G3 21CM002UGE | |
| Dell Inspiron 13 7306-6TYH5 | |
| LG Gram 14Z90Q | |
| Lenovo ThinkBook 13s G3 20YA0005GE | |
| Dell Latitude 9330 | |
| Asus Zenbook S 13 OLED | |
| Lenovo ThinkPad X13 Yoga G4 21F20017GE | |
| Lenovo ThinkPad X13 G3 21BN0046GE | |
| Lenovo ThinkPad X1 Nano Gen 3 | |
| Moyenne Intel Core i7-1360P (0.445 - 0.583, n=16) | |
| Lenovo ThinkPad X1 Nano Gen 2 Core i7-1280P | |
| HP Dragonfly G4 | |
| Framework Laptop 13.5 13th Gen Intel | |
Cinebench R23: Multi Core | Single Core
Cinebench R20: CPU (Multi Core) | CPU (Single Core)
Cinebench R15: CPU Multi 64Bit | CPU Single 64Bit
Blender: v2.79 BMW27 CPU
7-Zip 18.03: 7z b 4 | 7z b 4 -mmt1
Geekbench 5.5: Multi-Core | Single-Core
HWBOT x265 Benchmark v2.2: 4k Preset
LibreOffice : 20 Documents To PDF
R Benchmark 2.5: Overall mean
* ... Moindre est la valeur, meilleures sont les performances
* ... Moindre est la valeur, meilleures sont les performances
AIDA64: FP32 Ray-Trace | FPU Julia | CPU SHA3 | CPU Queen | FPU SinJulia | FPU Mandel | CPU AES | CPU ZLib | FP64 Ray-Trace | CPU PhotoWorxx
| Performance rating | |
| Framework Laptop 13.5 13th Gen Intel | |
| Moyenne Intel Core i7-1360P | |
| Lenovo ThinkPad X1 Nano Gen 2 Core i7-1280P | |
| Lenovo ThinkPad X1 Nano Gen 3 | |
| HP Dragonfly G4 | |
| Dell Latitude 9330 | |
| LG Gram 14Z90Q | |
| AIDA64 / FP32 Ray-Trace | |
| Framework Laptop 13.5 13th Gen Intel | |
| Moyenne Intel Core i7-1360P (5610 - 11188, n=17) | |
| Lenovo ThinkPad X1 Nano Gen 3 | |
| Lenovo ThinkPad X1 Nano Gen 2 Core i7-1280P | |
| HP Dragonfly G4 | |
| Dell Latitude 9330 | |
| LG Gram 14Z90Q | |
| AIDA64 / FPU Julia | |
| Framework Laptop 13.5 13th Gen Intel | |
| Moyenne Intel Core i7-1360P (29251 - 56942, n=16) | |
| Lenovo ThinkPad X1 Nano Gen 2 Core i7-1280P | |
| Lenovo ThinkPad X1 Nano Gen 3 | |
| Dell Latitude 9330 | |
| HP Dragonfly G4 | |
| LG Gram 14Z90Q | |
| AIDA64 / CPU SHA3 | |
| Framework Laptop 13.5 13th Gen Intel | |
| Moyenne Intel Core i7-1360P (1444 - 2728, n=16) | |
| Lenovo ThinkPad X1 Nano Gen 2 Core i7-1280P | |
| Lenovo ThinkPad X1 Nano Gen 3 | |
| Dell Latitude 9330 | |
| HP Dragonfly G4 | |
| LG Gram 14Z90Q | |
| AIDA64 / CPU Queen | |
| Framework Laptop 13.5 13th Gen Intel | |
| Lenovo ThinkPad X1 Nano Gen 2 Core i7-1280P | |
| Lenovo ThinkPad X1 Nano Gen 3 | |
| Moyenne Intel Core i7-1360P (65324 - 89266, n=16) | |
| LG Gram 14Z90Q | |
| HP Dragonfly G4 | |
| Dell Latitude 9330 | |
| AIDA64 / FPU SinJulia | |
| Framework Laptop 13.5 13th Gen Intel | |
| Moyenne Intel Core i7-1360P (4370 - 7269, n=16) | |
| Lenovo ThinkPad X1 Nano Gen 2 Core i7-1280P | |
| Lenovo ThinkPad X1 Nano Gen 3 | |
| HP Dragonfly G4 | |
| LG Gram 14Z90Q | |
| Dell Latitude 9330 | |
| AIDA64 / FPU Mandel | |
| Framework Laptop 13.5 13th Gen Intel | |
| Moyenne Intel Core i7-1360P (14104 - 28019, n=16) | |
| Lenovo ThinkPad X1 Nano Gen 2 Core i7-1280P | |
| Lenovo ThinkPad X1 Nano Gen 3 | |
| Dell Latitude 9330 | |
| HP Dragonfly G4 | |
| LG Gram 14Z90Q | |
| AIDA64 / CPU AES | |
| Framework Laptop 13.5 13th Gen Intel | |
| Moyenne Intel Core i7-1360P (30391 - 99244, n=16) | |
| Lenovo ThinkPad X1 Nano Gen 2 Core i7-1280P | |
| Lenovo ThinkPad X1 Nano Gen 3 | |
| HP Dragonfly G4 | |
| Dell Latitude 9330 | |
| LG Gram 14Z90Q | |
| AIDA64 / CPU ZLib | |
| Framework Laptop 13.5 13th Gen Intel | |
| Moyenne Intel Core i7-1360P (420 - 807, n=16) | |
| Lenovo ThinkPad X1 Nano Gen 3 | |
| Lenovo ThinkPad X1 Nano Gen 2 Core i7-1280P | |
| HP Dragonfly G4 | |
| Dell Latitude 9330 | |
| LG Gram 14Z90Q | |
| AIDA64 / FP64 Ray-Trace | |
| Framework Laptop 13.5 13th Gen Intel | |
| Moyenne Intel Core i7-1360P (2906 - 5957, n=16) | |
| Lenovo ThinkPad X1 Nano Gen 2 Core i7-1280P | |
| Lenovo ThinkPad X1 Nano Gen 3 | |
| Dell Latitude 9330 | |
| HP Dragonfly G4 | |
| LG Gram 14Z90Q | |
| AIDA64 / CPU PhotoWorxx | |
| Lenovo ThinkPad X1 Nano Gen 3 | |
| Lenovo ThinkPad X1 Nano Gen 2 Core i7-1280P | |
| Moyenne Intel Core i7-1360P (29108 - 49328, n=16) | |
| HP Dragonfly G4 | |
| Dell Latitude 9330 | |
| Framework Laptop 13.5 13th Gen Intel | |
| LG Gram 14Z90Q | |
Performance du système
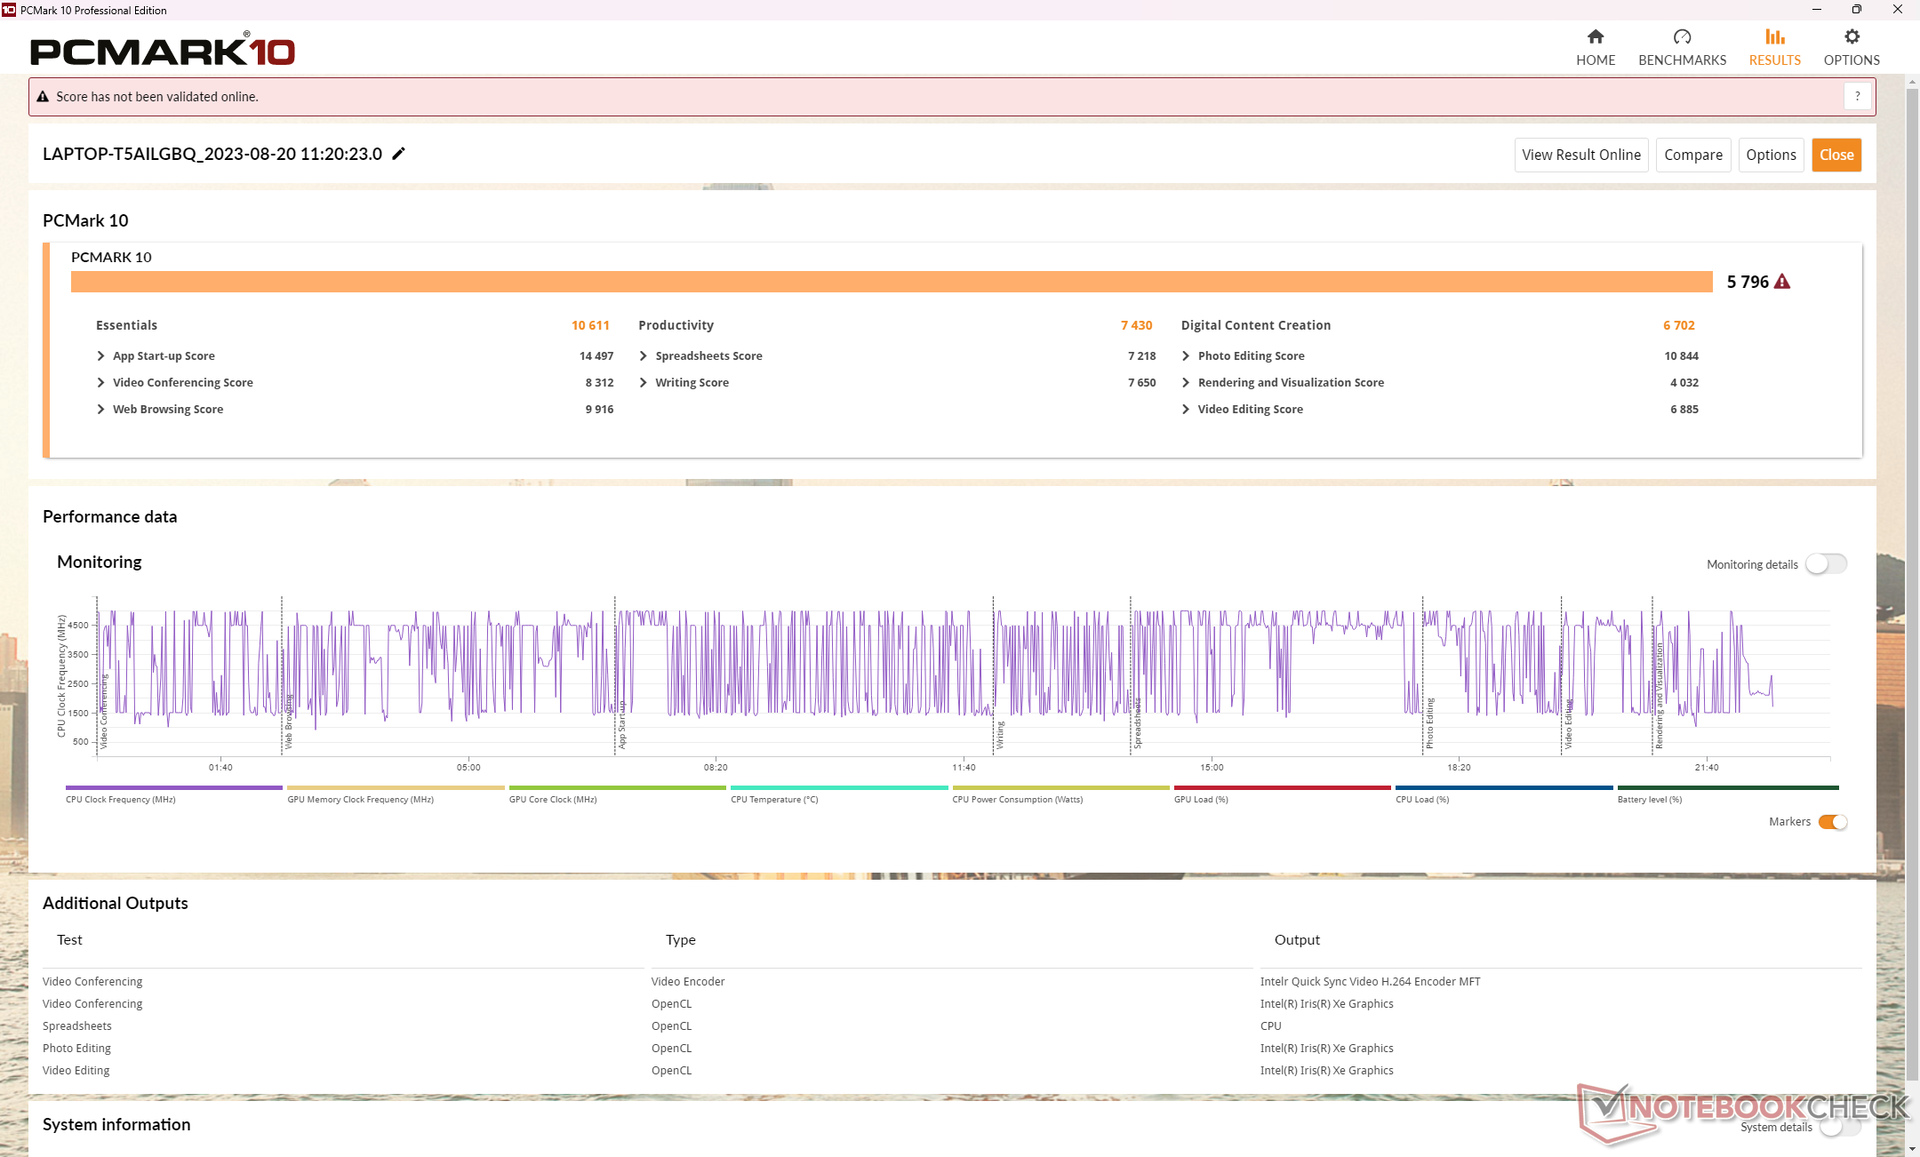
Les scores PCMark sont légèrement supérieurs à ceux du modèle de l'année dernière, malgré un processeur et un GPU intégrés qui ont tendance à s'essouffler. Cela peut être attribué au SSD de notre modèle 2023 qui est plus rapide que celui du modèle 2022, comme le montre la section Périphériques de stockage ci-dessous.
CrossMark: Overall | Productivity | Creativity | Responsiveness
| PCMark 10 / Score | |
| Framework Laptop 13.5 13th Gen Intel | |
| Moyenne Intel Core i7-1360P, Intel Iris Xe Graphics G7 96EUs (5360 - 6281, n=14) | |
| Lenovo ThinkPad X1 Nano Gen 3 | |
| HP Dragonfly G4 | |
| Lenovo ThinkPad X1 Nano Gen 2 Core i7-1280P | |
| Dell Latitude 9330 | |
| LG Gram 14Z90Q | |
| PCMark 10 / Essentials | |
| Framework Laptop 13.5 13th Gen Intel | |
| Moyenne Intel Core i7-1360P, Intel Iris Xe Graphics G7 96EUs (9883 - 12059, n=14) | |
| HP Dragonfly G4 | |
| Lenovo ThinkPad X1 Nano Gen 3 | |
| Dell Latitude 9330 | |
| Lenovo ThinkPad X1 Nano Gen 2 Core i7-1280P | |
| LG Gram 14Z90Q | |
| PCMark 10 / Productivity | |
| Framework Laptop 13.5 13th Gen Intel | |
| Lenovo ThinkPad X1 Nano Gen 3 | |
| Moyenne Intel Core i7-1360P, Intel Iris Xe Graphics G7 96EUs (6572 - 8161, n=14) | |
| HP Dragonfly G4 | |
| Dell Latitude 9330 | |
| Lenovo ThinkPad X1 Nano Gen 2 Core i7-1280P | |
| LG Gram 14Z90Q | |
| PCMark 10 / Digital Content Creation | |
| Framework Laptop 13.5 13th Gen Intel | |
| Moyenne Intel Core i7-1360P, Intel Iris Xe Graphics G7 96EUs (5723 - 7612, n=14) | |
| Lenovo ThinkPad X1 Nano Gen 3 | |
| Lenovo ThinkPad X1 Nano Gen 2 Core i7-1280P | |
| HP Dragonfly G4 | |
| LG Gram 14Z90Q | |
| Dell Latitude 9330 | |
| CrossMark / Overall | |
| Lenovo ThinkPad X1 Nano Gen 3 | |
| Framework Laptop 13.5 13th Gen Intel | |
| Moyenne Intel Core i7-1360P, Intel Iris Xe Graphics G7 96EUs (1527 - 1891, n=15) | |
| Lenovo ThinkPad X1 Nano Gen 2 Core i7-1280P | |
| HP Dragonfly G4 | |
| Apple MacBook Air M2 10C GPU | |
| CrossMark / Productivity | |
| Framework Laptop 13.5 13th Gen Intel | |
| Lenovo ThinkPad X1 Nano Gen 3 | |
| Moyenne Intel Core i7-1360P, Intel Iris Xe Graphics G7 96EUs (1503 - 1842, n=15) | |
| Lenovo ThinkPad X1 Nano Gen 2 Core i7-1280P | |
| HP Dragonfly G4 | |
| Apple MacBook Air M2 10C GPU | |
| CrossMark / Creativity | |
| Lenovo ThinkPad X1 Nano Gen 3 | |
| Lenovo ThinkPad X1 Nano Gen 2 Core i7-1280P | |
| Framework Laptop 13.5 13th Gen Intel | |
| Moyenne Intel Core i7-1360P, Intel Iris Xe Graphics G7 96EUs (1558 - 2003, n=15) | |
| Apple MacBook Air M2 10C GPU | |
| HP Dragonfly G4 | |
| CrossMark / Responsiveness | |
| Moyenne Intel Core i7-1360P, Intel Iris Xe Graphics G7 96EUs (1311 - 1899, n=15) | |
| Framework Laptop 13.5 13th Gen Intel | |
| Lenovo ThinkPad X1 Nano Gen 3 | |
| Lenovo ThinkPad X1 Nano Gen 2 Core i7-1280P | |
| HP Dragonfly G4 | |
| Apple MacBook Air M2 10C GPU | |
| PCMark 10 Score | 5796 points | |
Aide | ||
| AIDA64 / Memory Copy | |
| Lenovo ThinkPad X1 Nano Gen 3 | |
| Lenovo ThinkPad X1 Nano Gen 2 Core i7-1280P | |
| Dell Latitude 9330 | |
| Moyenne Intel Core i7-1360P (44299 - 72748, n=16) | |
| HP Dragonfly G4 | |
| LG Gram 14Z90Q | |
| Framework Laptop 13.5 13th Gen Intel | |
| AIDA64 / Memory Read | |
| Lenovo ThinkPad X1 Nano Gen 2 Core i7-1280P | |
| LG Gram 14Z90Q | |
| Lenovo ThinkPad X1 Nano Gen 3 | |
| Dell Latitude 9330 | |
| Moyenne Intel Core i7-1360P (44751 - 68945, n=16) | |
| Framework Laptop 13.5 13th Gen Intel | |
| HP Dragonfly G4 | |
| AIDA64 / Memory Write | |
| Lenovo ThinkPad X1 Nano Gen 3 | |
| Moyenne Intel Core i7-1360P (45887 - 93331, n=16) | |
| HP Dragonfly G4 | |
| Lenovo ThinkPad X1 Nano Gen 2 Core i7-1280P | |
| Dell Latitude 9330 | |
| LG Gram 14Z90Q | |
| Framework Laptop 13.5 13th Gen Intel | |
| AIDA64 / Memory Latency | |
| LG Gram 14Z90Q | |
| Dell Latitude 9330 | |
| Moyenne Intel Core i7-1360P (85 - 110.5, n=16) | |
| Lenovo ThinkPad X1 Nano Gen 3 | |
| Lenovo ThinkPad X1 Nano Gen 2 Core i7-1280P | |
| HP Dragonfly G4 | |
| Framework Laptop 13.5 13th Gen Intel | |
* ... Moindre est la valeur, meilleures sont les performances
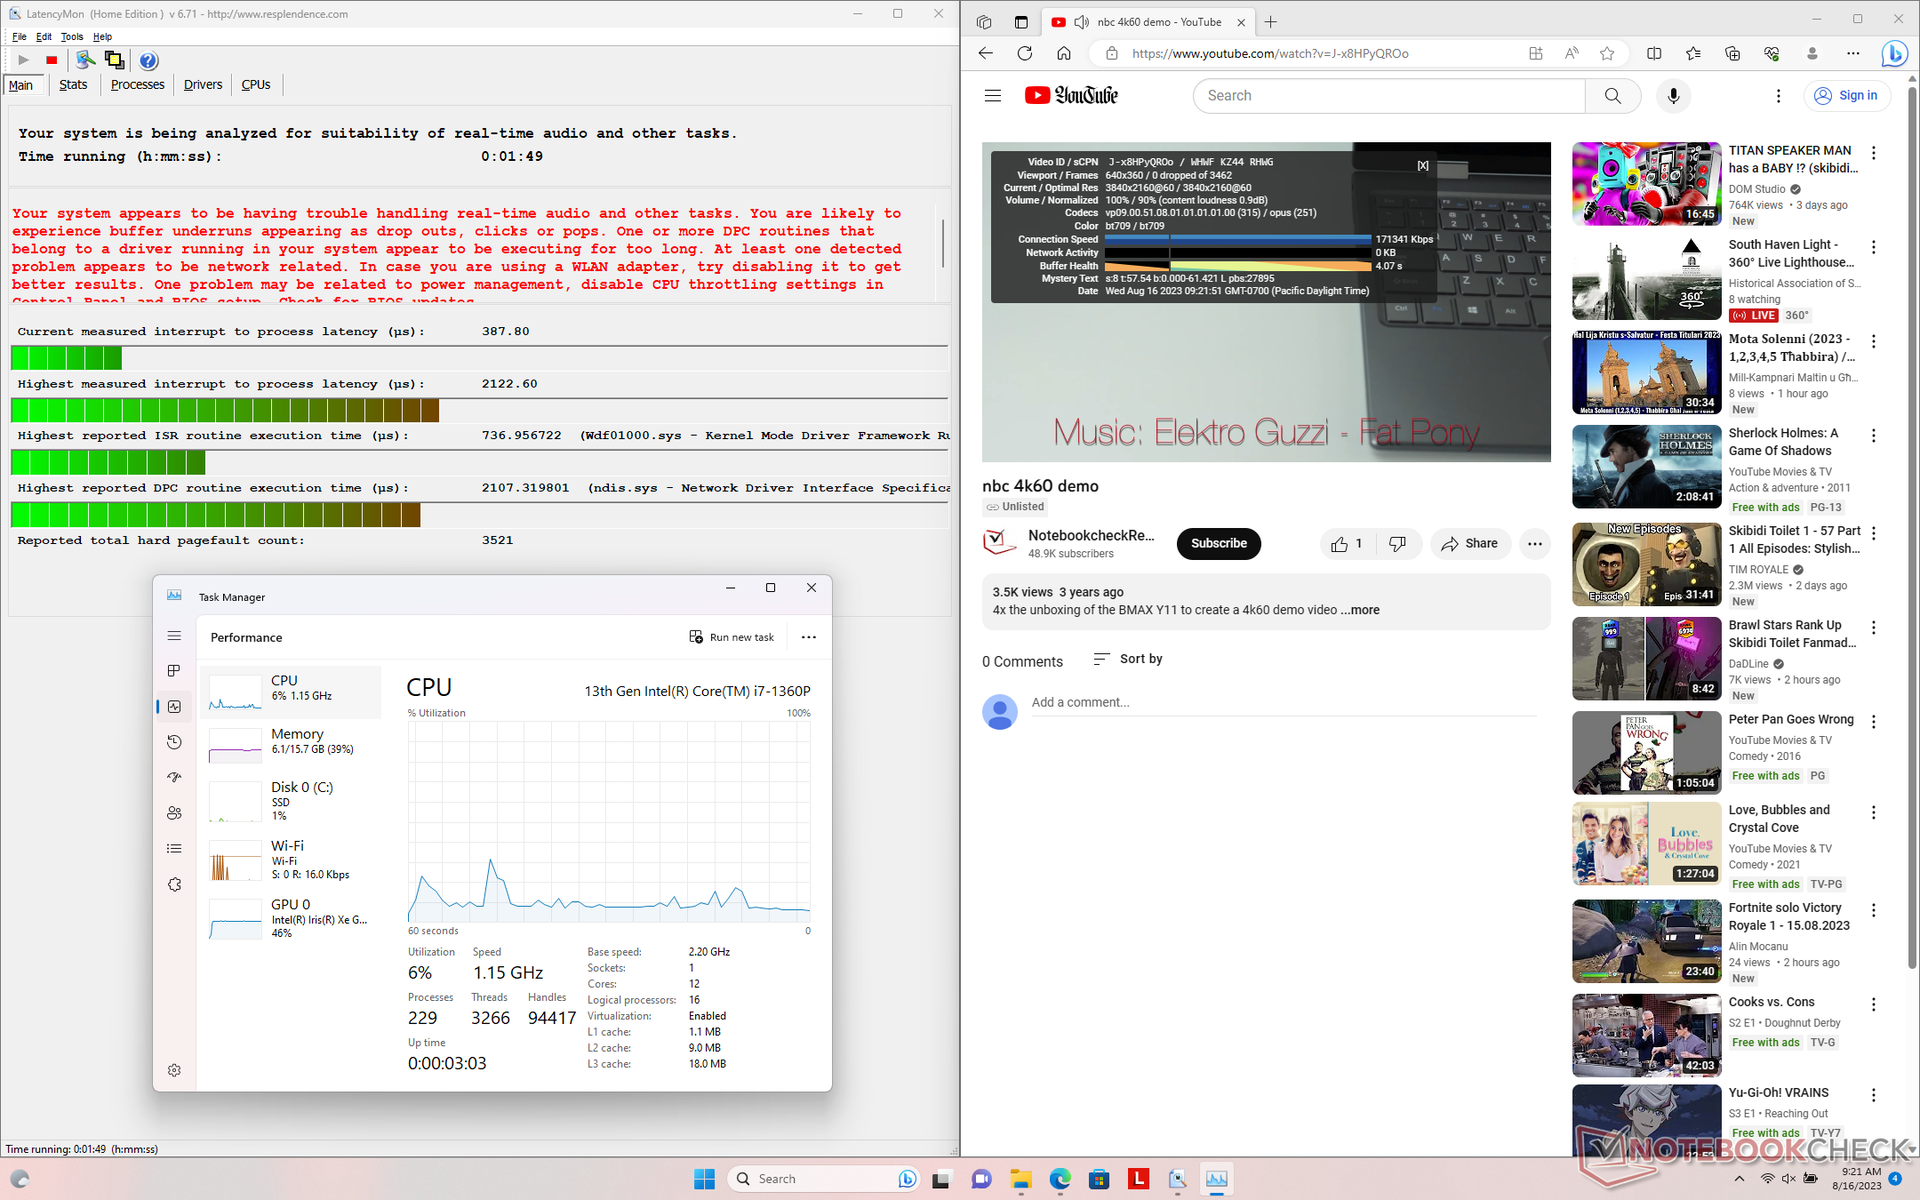
Latence DPC
LatencyMon révèle des problèmes mineurs de DPC lors de l'ouverture de plusieurs onglets de notre page d'accueil. la lecture de vidéos 4K à 60 FPS est par ailleurs fluide et ne présente aucune perte d'images.
| DPC Latencies / LatencyMon - interrupt to process latency (max), Web, Youtube, Prime95 | |
| Dell Latitude 9330 | |
| Lenovo ThinkPad X1 Nano Gen 3 | |
| HP Dragonfly G4 | |
| LG Gram 14Z90Q | |
| Lenovo ThinkPad X1 Nano Gen 2 Core i7-1280P | |
| Framework Laptop 13.5 13th Gen Intel | |
* ... Moindre est la valeur, meilleures sont les performances
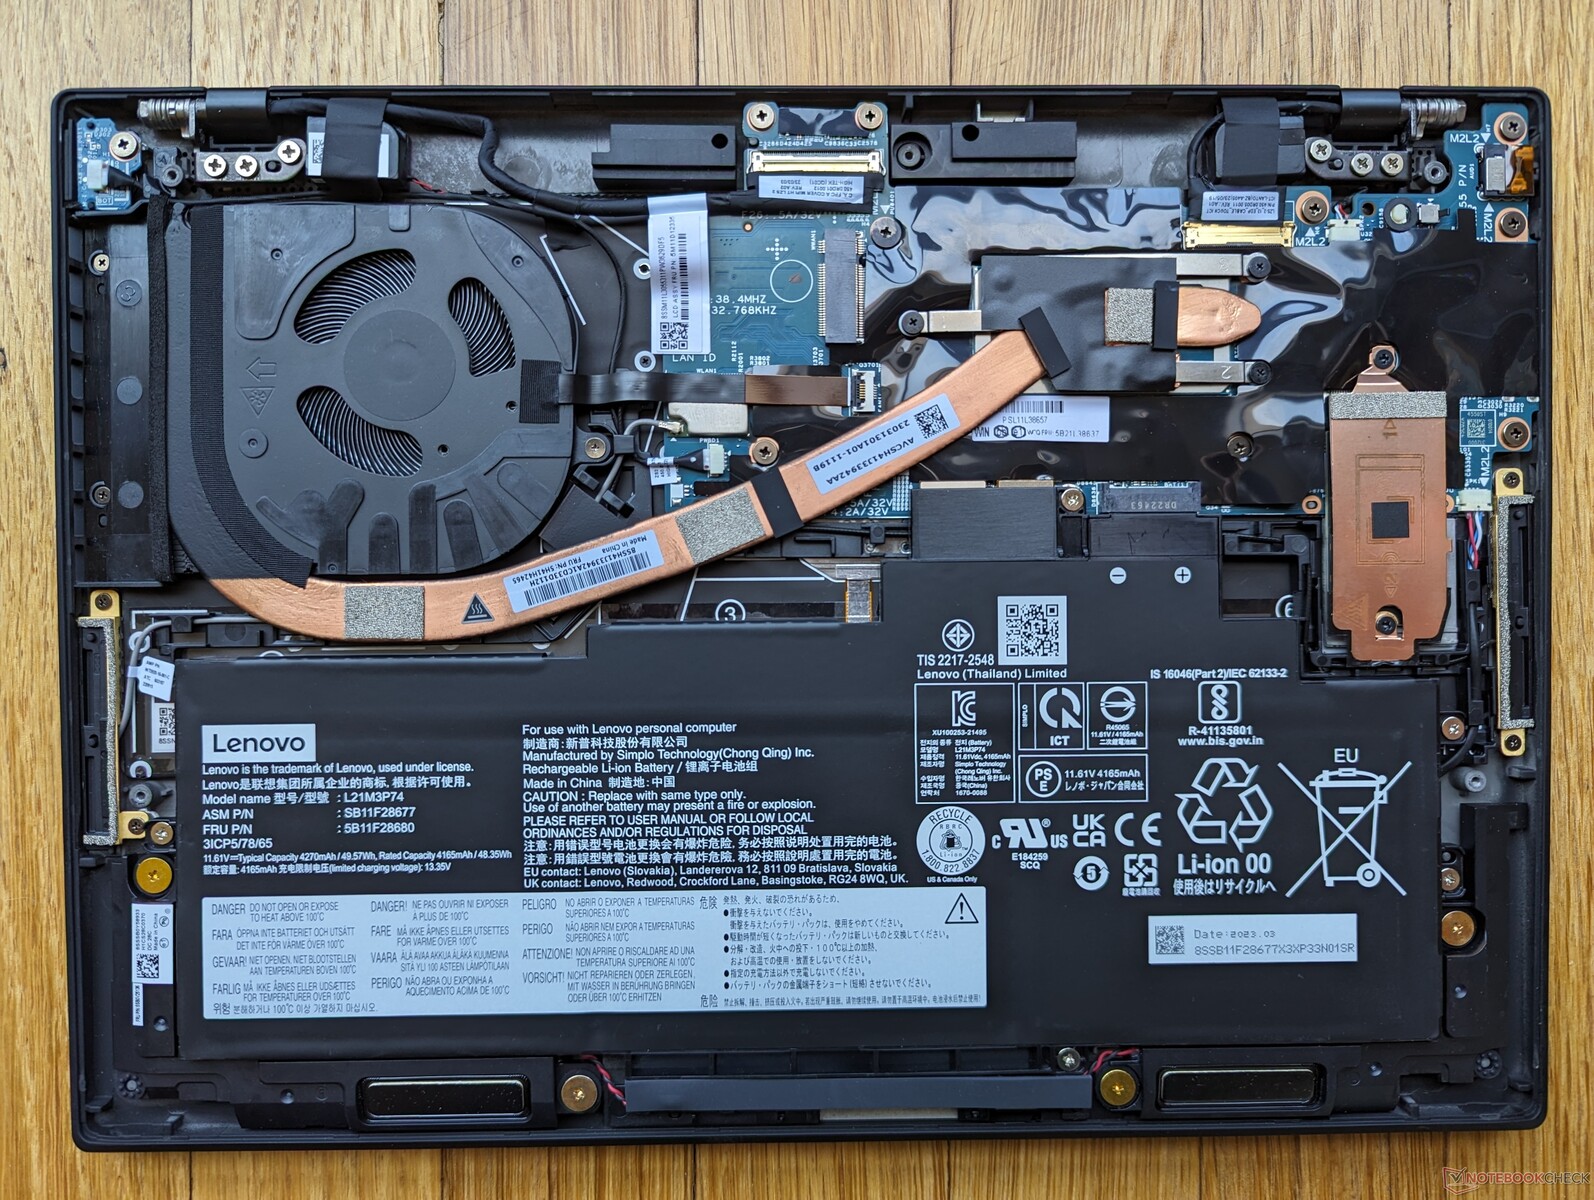
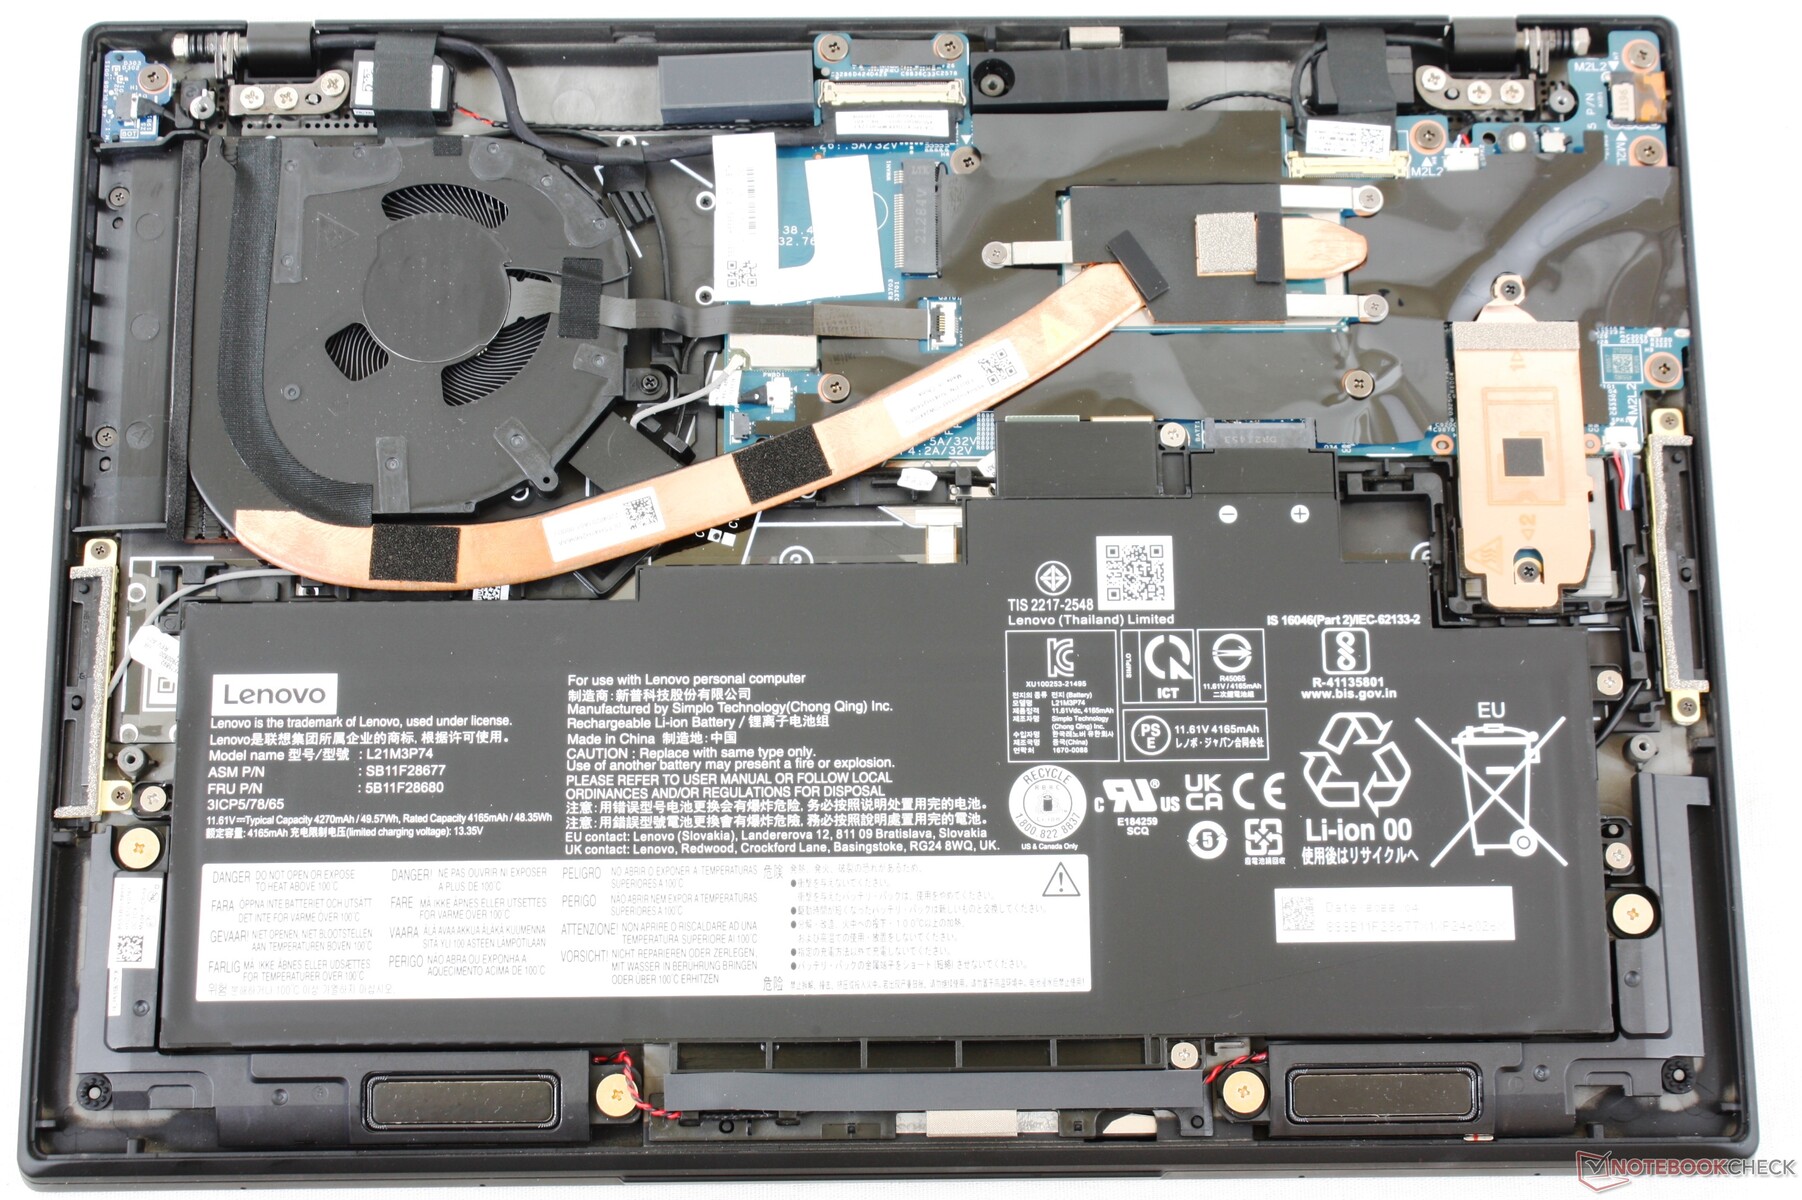
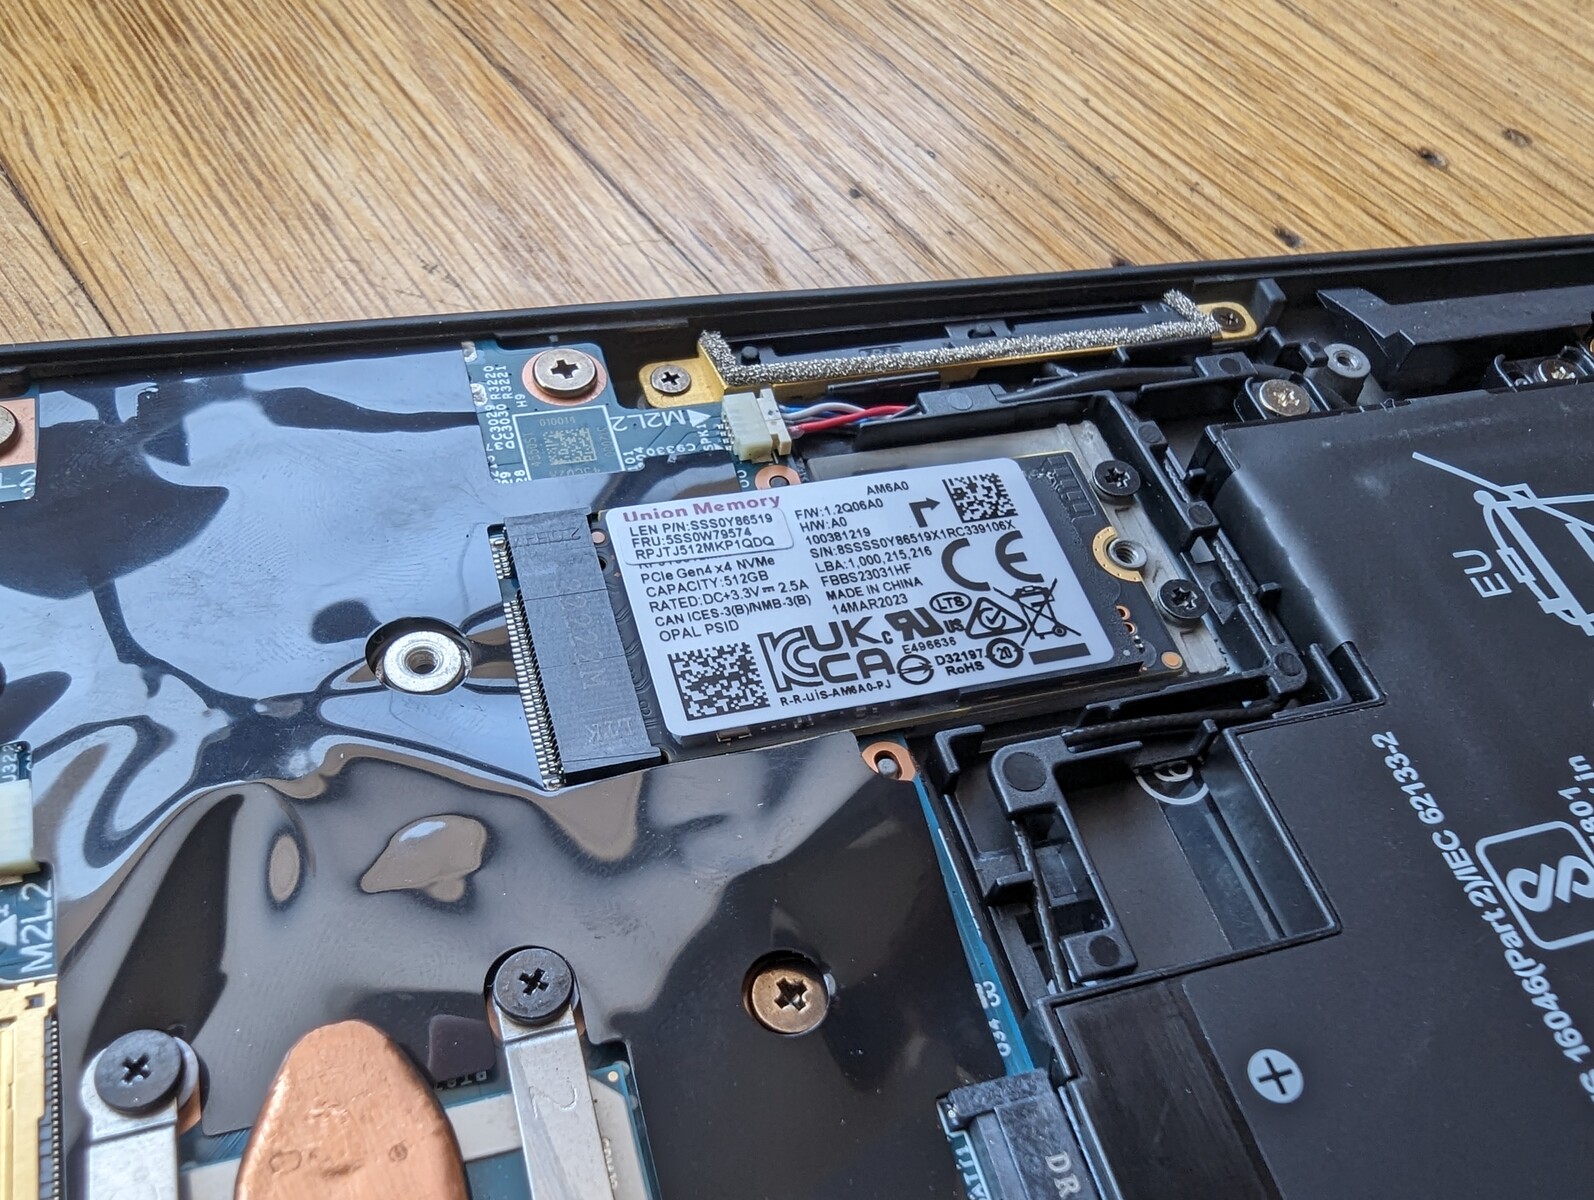
Périphériques de stockage - Prise en charge d'un seul disque SSD
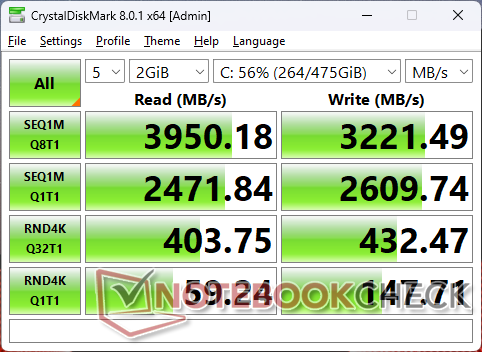
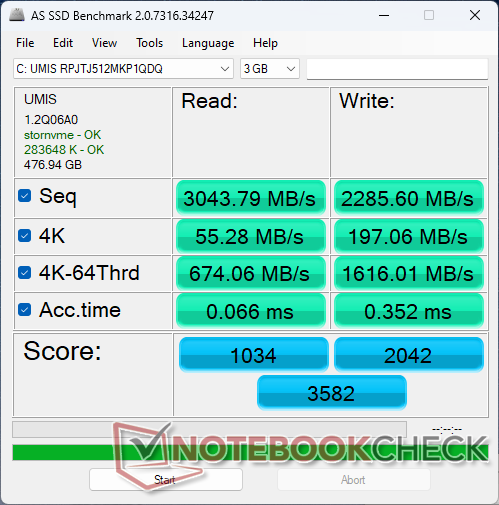
Lenovo a remplacé le SSD Kioxia KBG5AZNT1T02 de 1 To du modèle de l'année dernière par un SSD de 1 To Kioxia KXG80ZNV1T02 sur notre modèle 2023. Le nouveau disque peut atteindre jusqu'à 4000 Mo/s contre 3000 Mo/s pour l'ancien disque, mais les performances finissent par s'essouffler après environ une minute d'utilisation intensive.

| Drive Performance rating - Percent | |
| LG Gram 14Z90Q | |
| Framework Laptop 13.5 13th Gen Intel | |
| HP Dragonfly G4 | |
| Dell Latitude 9330 | |
| Lenovo ThinkPad X1 Nano Gen 3 | |
| Lenovo ThinkPad X1 Nano Gen 2 Core i7-1280P | |
* ... Moindre est la valeur, meilleures sont les performances
Disk Throttling: DiskSpd Read Loop, Queue Depth 8
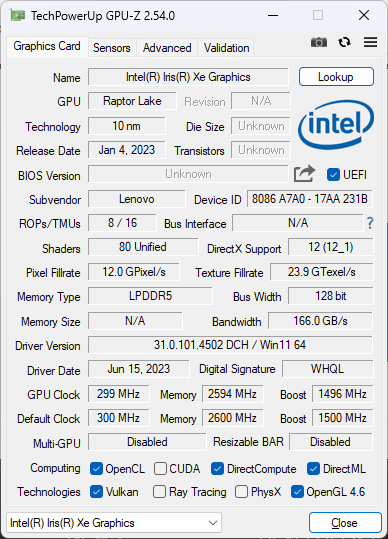
Performance du GPU
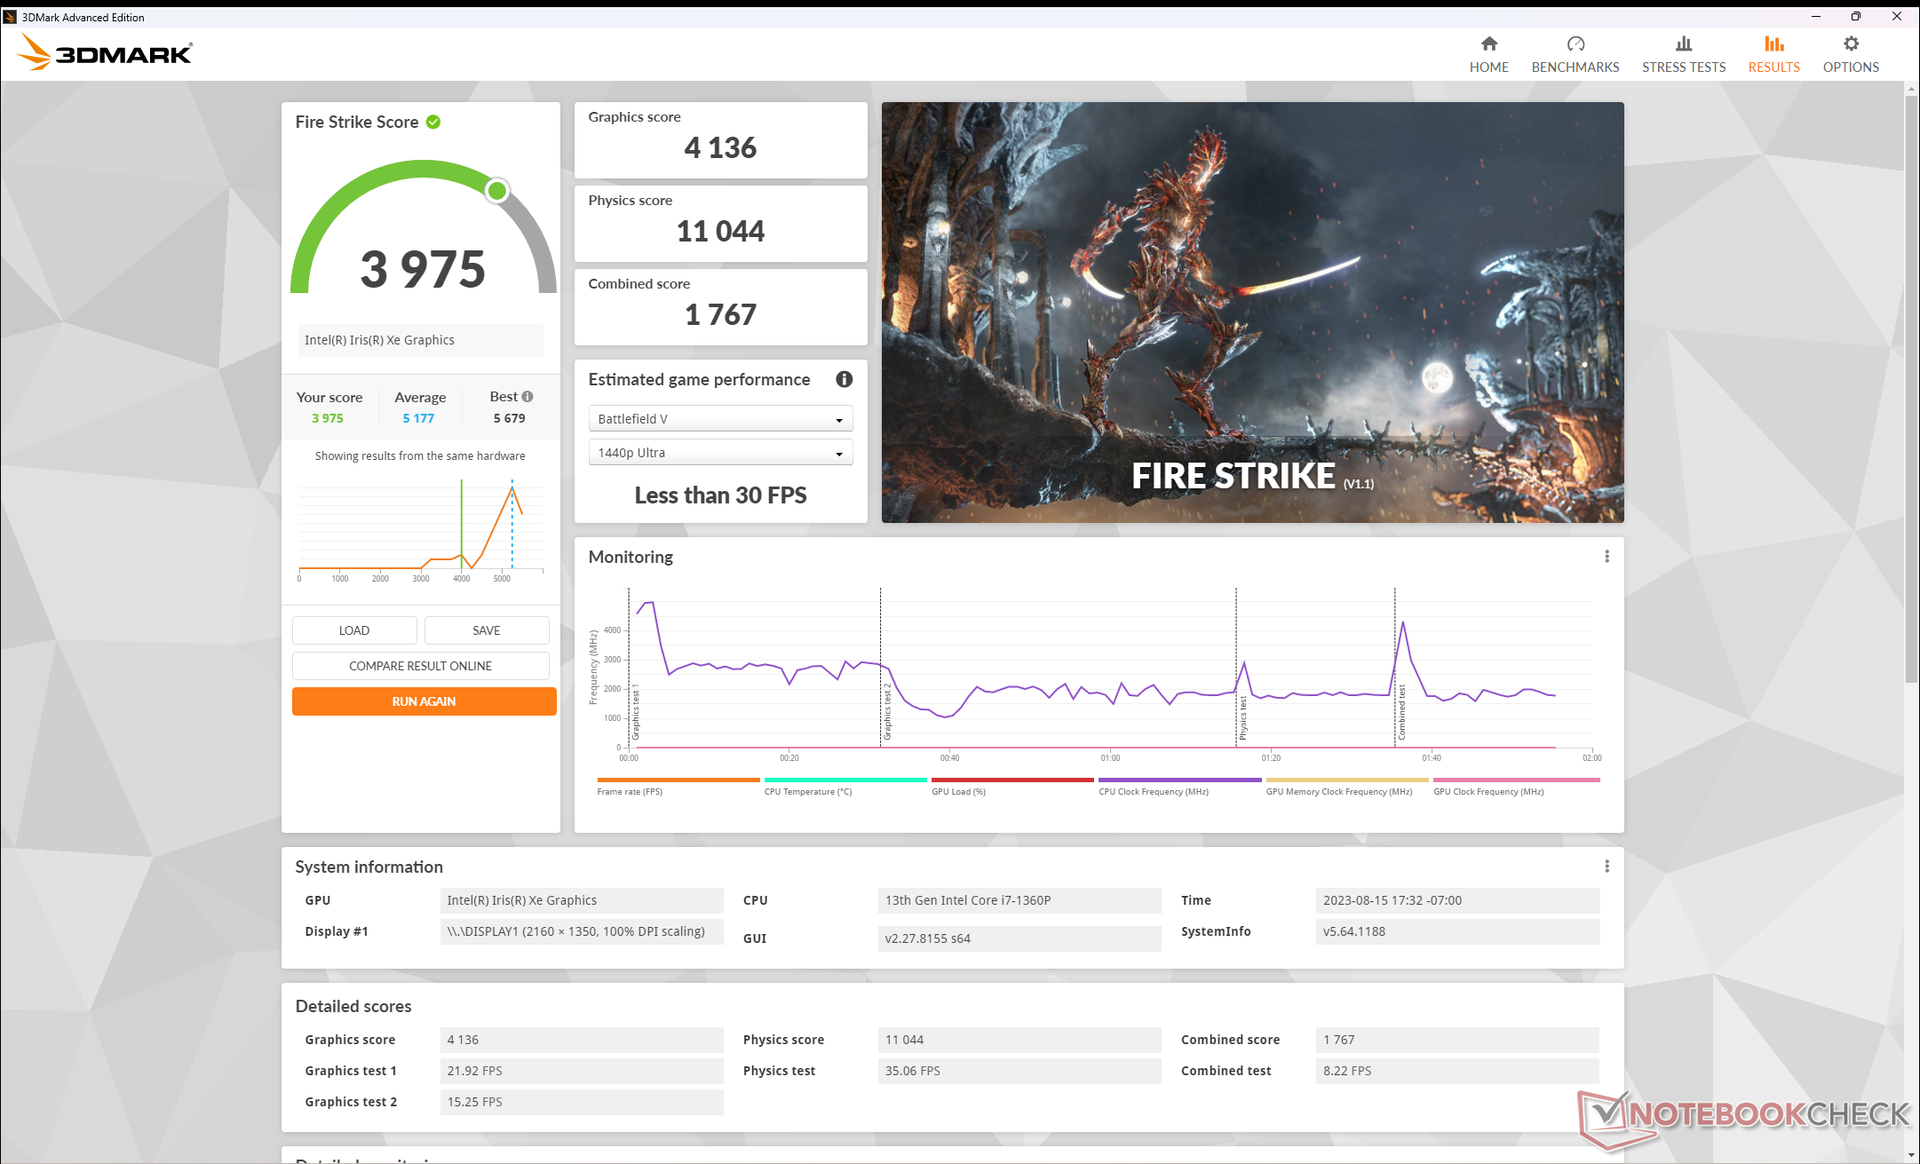
les résultats de 3DMark Fire Strike et Time Spy sont environ 25 % plus lents que ceux du modèle de l'année dernière, bien que les deux modèles soient équipés de la même carte Iris Xe 96 intégrée iris Xe 96 EUs. L'écart peut être attribué à une augmentation du comportement d'étranglement sur notre unité Gen 3.
Il est intéressant de noter que les scores de 3DMark 11 sont plus similaires d'une année sur l'autre. Cela peut suggérer qu'il y a une courte période de performance GPU stable sur le modèle Gen 3 lorsqu'il est refroidi avant que l'étranglement ne se produise inévitablement.
Il est regrettable que Lenovo ne propose pas d'options AMD pour sa série X1 Nano, car les dernières Radeon 680M ou 780M sont nettement plus performants que la série Iris Xe vieillissante.
| Profil de puissance | Score graphique | Score physique | Score combiné |
| Puissance de la batterie | 6525 (-0%) | 13950 (+25%) | 6222 (+7%) |
| Mode équilibré | 5316 (-19%) | 8919 (-20%) | 4336 (-25%) |
| Mode Performance | 6568 | 11143 | 5799 |
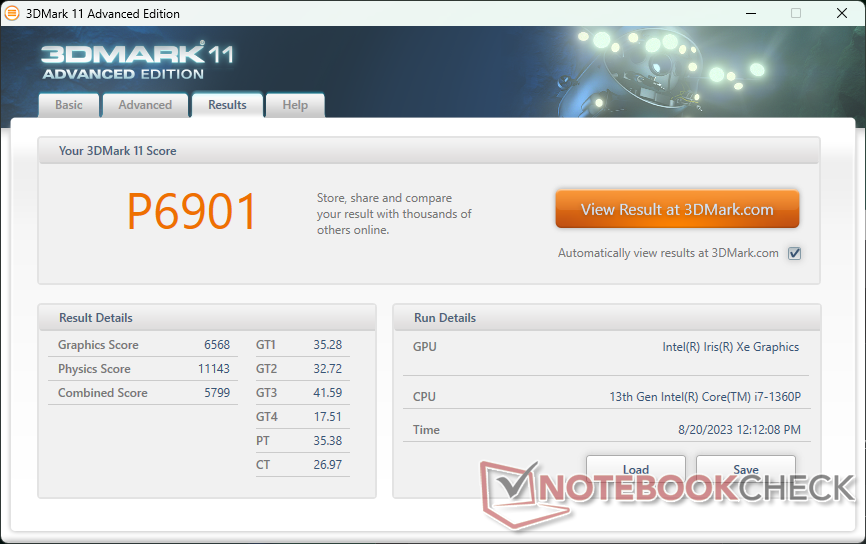
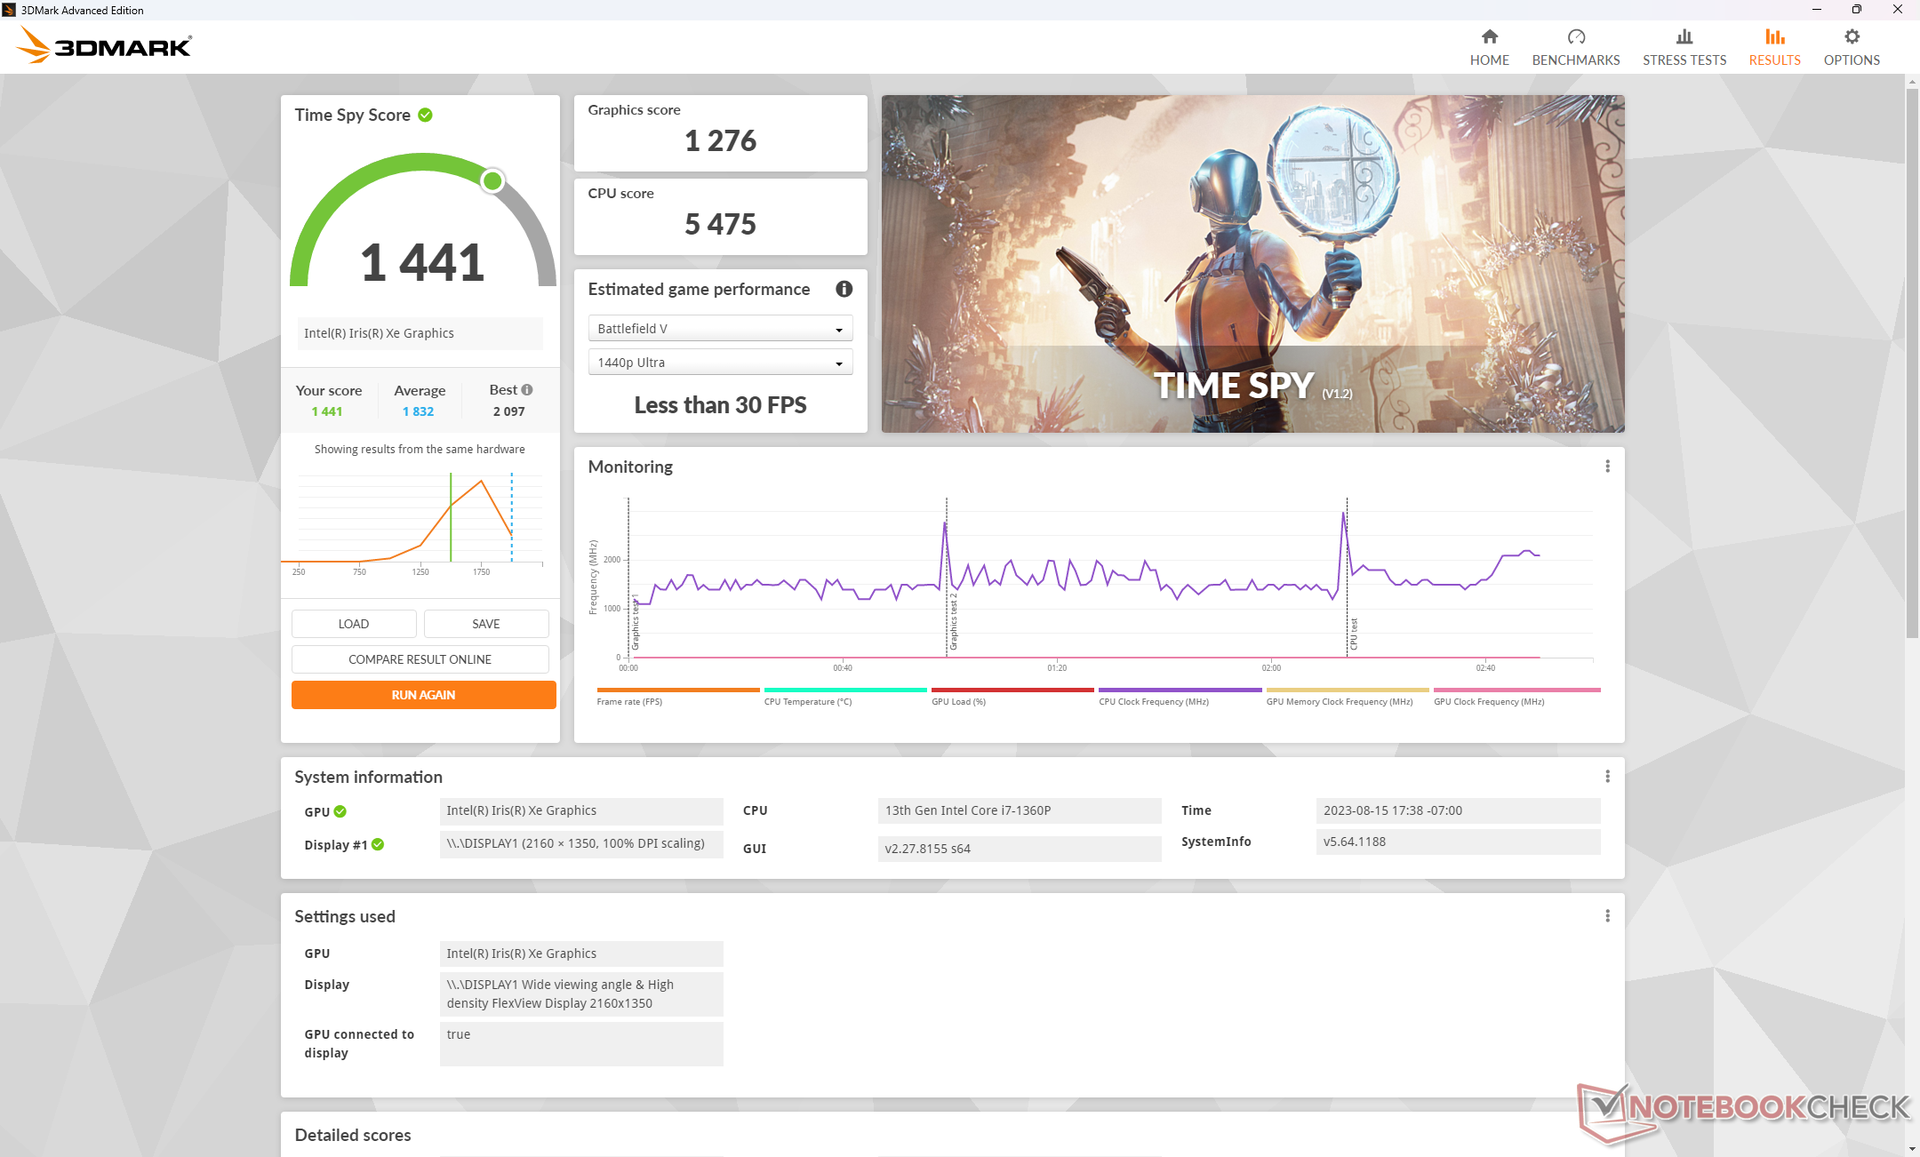
| 3DMark 11 Performance | 6901 points | |
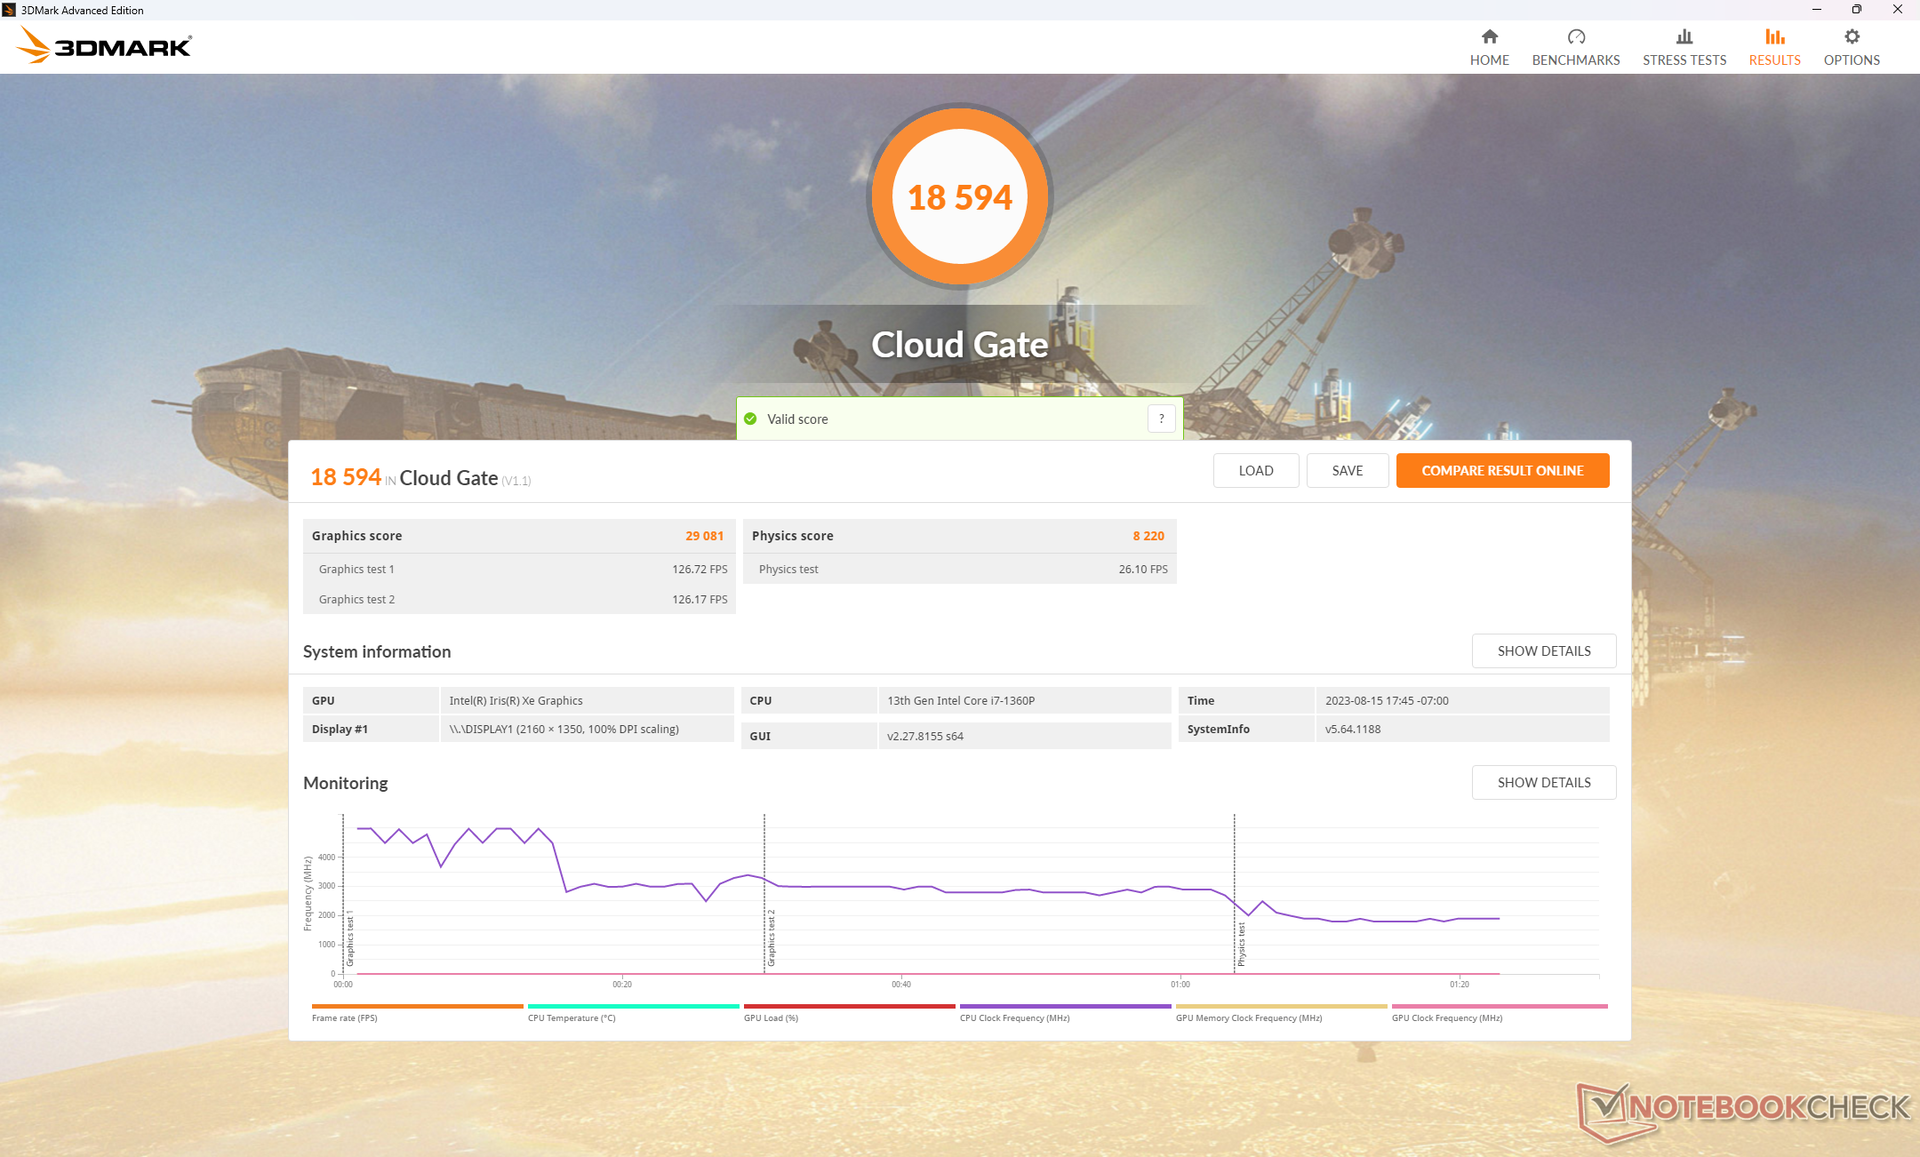
| 3DMark Cloud Gate Standard Score | 18594 points | |
| 3DMark Fire Strike Score | 3975 points | |
| 3DMark Time Spy Score | 1441 points | |
Aide | ||
| Tiny Tina's Wonderlands | |
| 1280x720 Lowest Preset (DX12) | |
| HP Dragonfly G4 | |
| Moyenne Intel Iris Xe Graphics G7 96EUs (25.9 - 67.3, n=32) | |
| Lenovo ThinkPad X1 Nano Gen 3 | |
| 1920x1080 Low Preset (DX12) | |
| Framework Laptop 13.5 13th Gen Intel | |
| Moyenne Intel Iris Xe Graphics G7 96EUs (22.3 - 53, n=32) | |
| HP Dragonfly G4 | |
| Lenovo ThinkPad X1 Nano Gen 3 | |
| 1920x1080 Medium Preset (DX12) | |
| Framework Laptop 13.5 13th Gen Intel | |
| Moyenne Intel Iris Xe Graphics G7 96EUs (17 - 40.1, n=30) | |
| HP Dragonfly G4 | |
| Lenovo ThinkPad X1 Nano Gen 3 | |
| 1920x1080 High Preset (DX12) | |
| Framework Laptop 13.5 13th Gen Intel | |
| Moyenne Intel Iris Xe Graphics G7 96EUs (10.6 - 24.1, n=29) | |
| HP Dragonfly G4 | |
| Lenovo ThinkPad X1 Nano Gen 3 | |
| 1920x1080 Badass Preset (DX12) | |
| Framework Laptop 13.5 13th Gen Intel | |
| Moyenne Intel Iris Xe Graphics G7 96EUs (8.4 - 18.4, n=26) | |
| HP Dragonfly G4 | |
| Lenovo ThinkPad X1 Nano Gen 3 | |
Les taux de rafraîchissement au ralenti sur Witcher 3 les taux d'images au ralenti sur le ThinkPad X1 Nano Gen 2 oscillent entre 62 et 88 FPS, alors que les taux d'images sur le ThinkPad X1 Nano Gen 2 de l'année dernière sont beaucoup plus stables, comme le montre le graphique ci-dessous. L'instabilité des taux de rafraîchissement n'est pas un problème majeur puisque la série ThinkPad X1 Nano n'est pas conçue pour les jeux et que les utilisateurs peuvent toujours diffuser des jeux en continu via le cloud, mais il est toujours préférable d'obtenir des performances régulières du GPU.
Witcher 3 FPS Chart
| Bas | Moyen | Élevé | Ultra | |
|---|---|---|---|---|
| The Witcher 3 (2015) | 90.7 | 60.9 | 32.4 | 12.6 |
| Dota 2 Reborn (2015) | 103.2 | 65.1 | 59 | 45.7 |
| Final Fantasy XV Benchmark (2018) | 35.2 | 20.6 | 14.6 | |
| X-Plane 11.11 (2018) | 40.1 | 32.6 | 30.2 | |
| Far Cry 5 (2018) | 41 | 24 | 22 | 22 |
| Strange Brigade (2018) | 78.5 | 35.1 | 27.3 | 21 |
| Cyberpunk 2077 1.6 (2022) | 13 | 10.8 | ||
| Tiny Tina's Wonderlands (2022) | 23.1 | 18.3 | 11.9 | 8.9 |
| F1 22 (2022) | 41.2 | 36.6 | 27.1 | 18.5 |
Émissions - Un peu plus silencieuses
Bruit du système
Le bruit du ventilateur est silencieux lorsqu'il est froid, mais il oscille généralement autour de 25,6 dB(A) dans des scénarios réalistes de navigation ou de streaming vidéo, ce qui reste pratiquement inaudible dans un bureau ou une salle de classe. Il est intéressant de noter que le nouveau modèle est plus silencieux que l'ancien lorsqu'il fonctionne à des charges plus élevées (37 dB(A) contre 41 dB(A)), ce qui est en corrélation avec les performances plus lentes mentionnées ci-dessus.
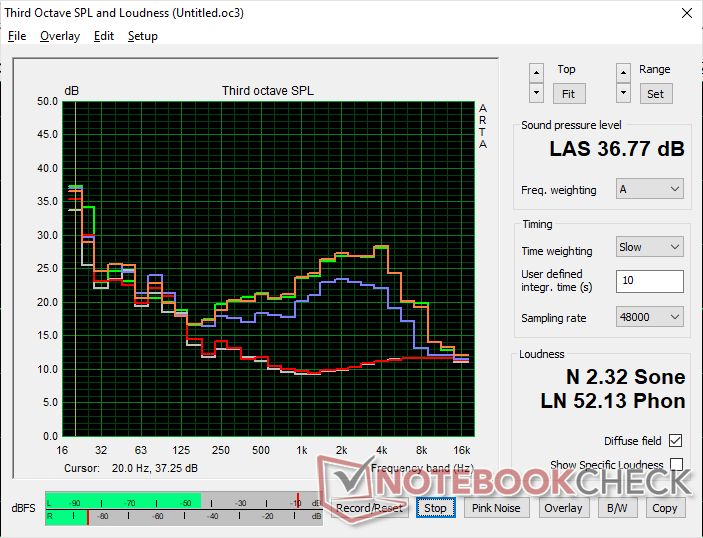
Degré de la nuisance sonore
| Au repos |
| 23 / 23 / 23 dB(A) |
| Fortement sollicité |
| 32.8 / 36.9 dB(A) |
 | ||
30 dB silencieux 40 dB(A) audible 50 dB(A) bruyant |
||
min: | ||
| Lenovo ThinkPad X1 Nano Gen 3 Iris Xe G7 96EUs, i7-1360P, Lenovo UMIS AM6A0 RPJTJ512MKP1QDQ | Lenovo ThinkPad X1 Nano Gen 2 Core i7-1280P Iris Xe G7 96EUs, i7-1280P, Kioxia BG5 KBG5AZNT1T02 | HP Dragonfly G4 Iris Xe G7 96EUs, i7-1365U, Micron 3400 MTFDKBA512TFH 512GB | Framework Laptop 13.5 13th Gen Intel Iris Xe G7 96EUs, i7-1370P, WD PC SN740 SDDPNQD-1T00 | Dell Latitude 9330 Iris Xe G7 96EUs, i7-1260U | Apple MacBook Air M2 10C GPU M2 10-Core GPU, M2, Apple SSD AP1024Z | LG Gram 14Z90Q Iris Xe G7 80EUs, i5-1240P, Samsung PM9A1 MZVL2512HCJQ | |
|---|---|---|---|---|---|---|---|
| Noise | -1% | 1% | -15% | -5% | -9% | ||
| arrêt / environnement * (dB) | 22.9 | 23.3 -2% | 23.3 -2% | 23.2 -1% | 23 -0% | 25 -9% | |
| Idle Minimum * (dB) | 23 | 23.9 -4% | 23.5 -2% | 23.2 -1% | 23 -0% | 26 -13% | |
| Idle Average * (dB) | 23 | 23.9 -4% | 23.5 -2% | 23.2 -1% | 23.1 -0% | 27 -17% | |
| Idle Maximum * (dB) | 23 | 23.9 -4% | 26.8 -17% | 23.2 -1% | 23.1 -0% | 28 -22% | |
| Load Average * (dB) | 32.8 | 23.3 29% | 27.2 17% | 45.3 -38% | 37.1 -13% | 35 -7% | |
| Witcher 3 ultra * (dB) | 36.9 | 40.9 -11% | 32.7 11% | 47.9 -30% | 40.6 -10% | 36 2% | |
| Load Maximum * (dB) | 36.9 | 40.9 -11% | 35 5% | 49.2 -33% | 40.5 -10% | 36 2% |
* ... Moindre est la valeur, meilleures sont les performances
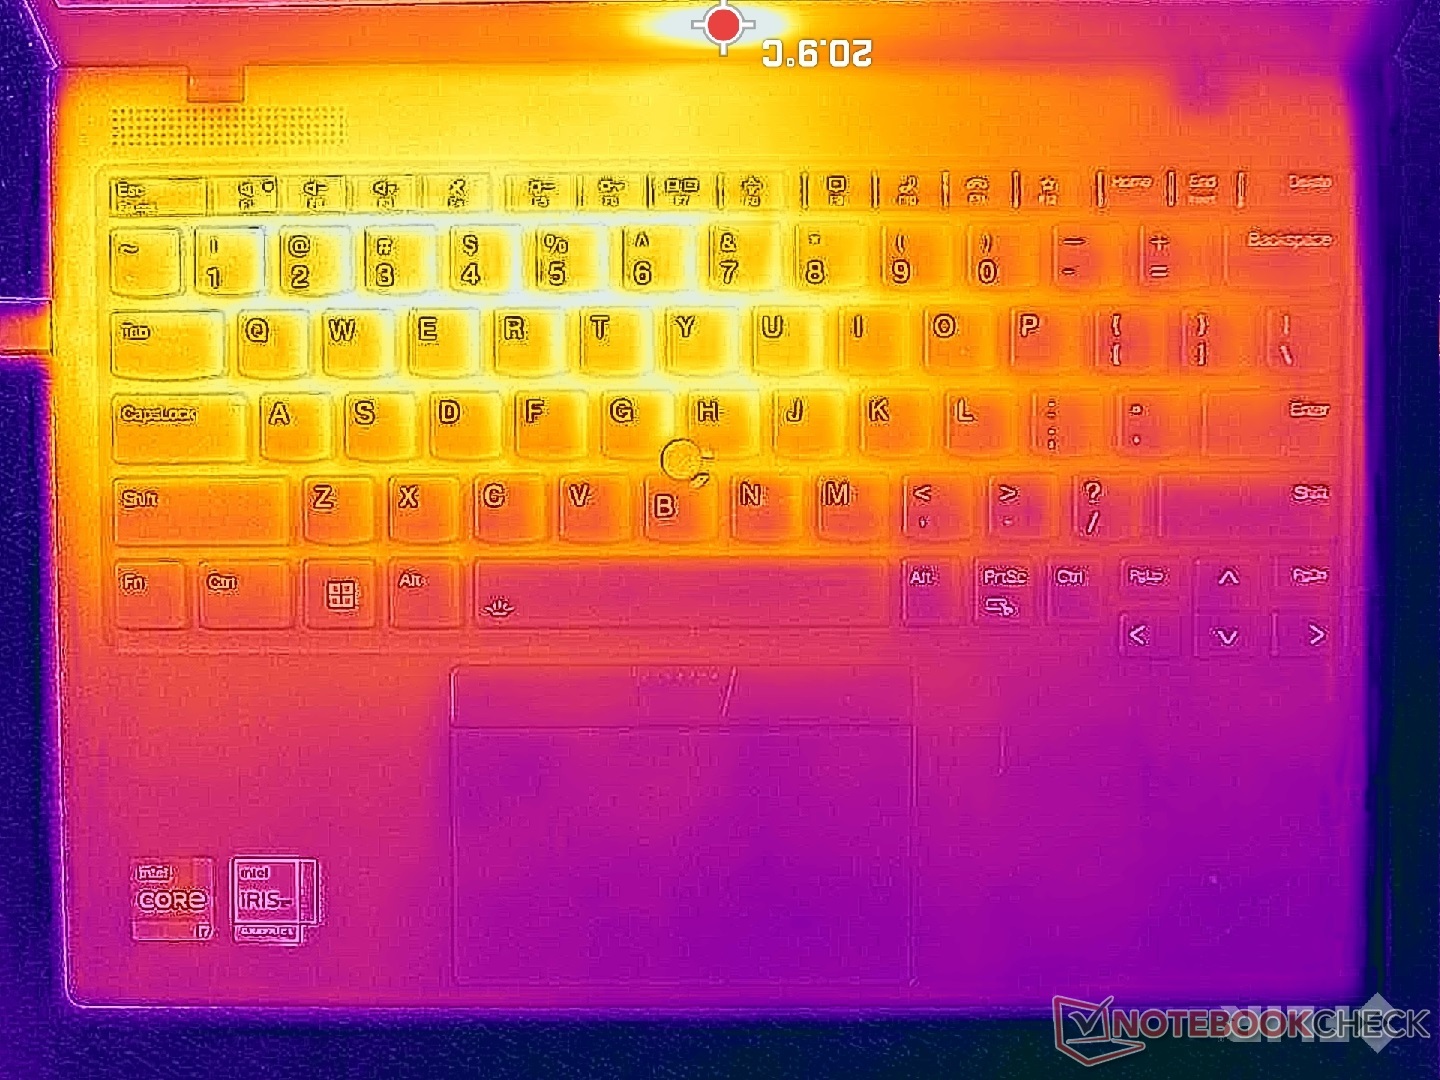
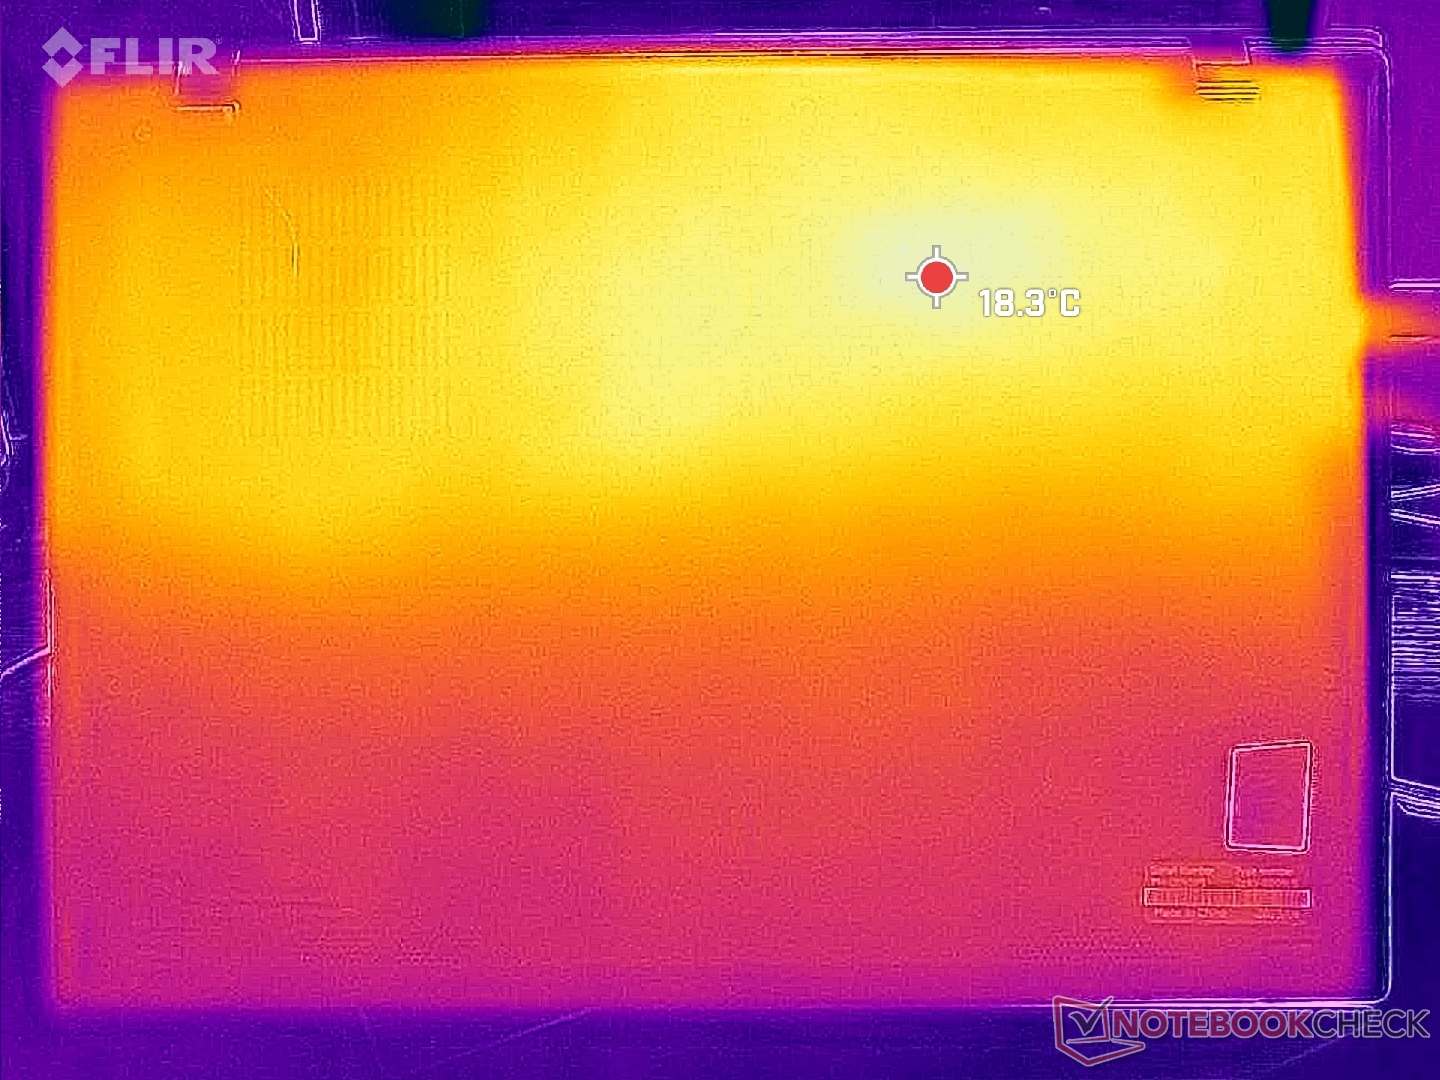
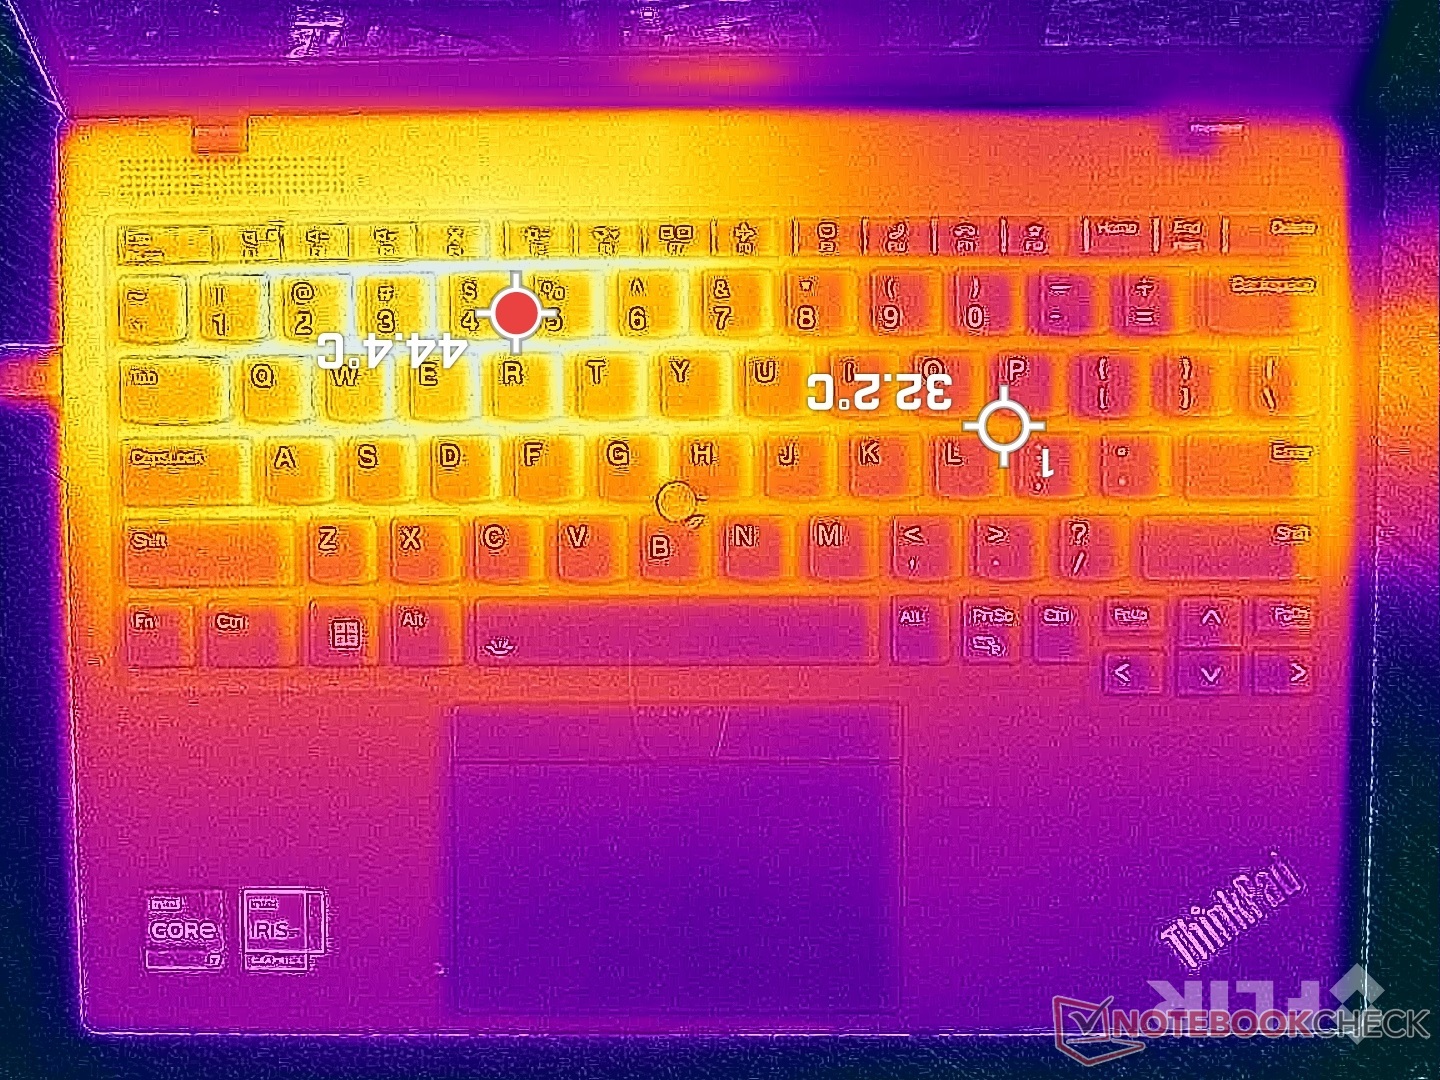
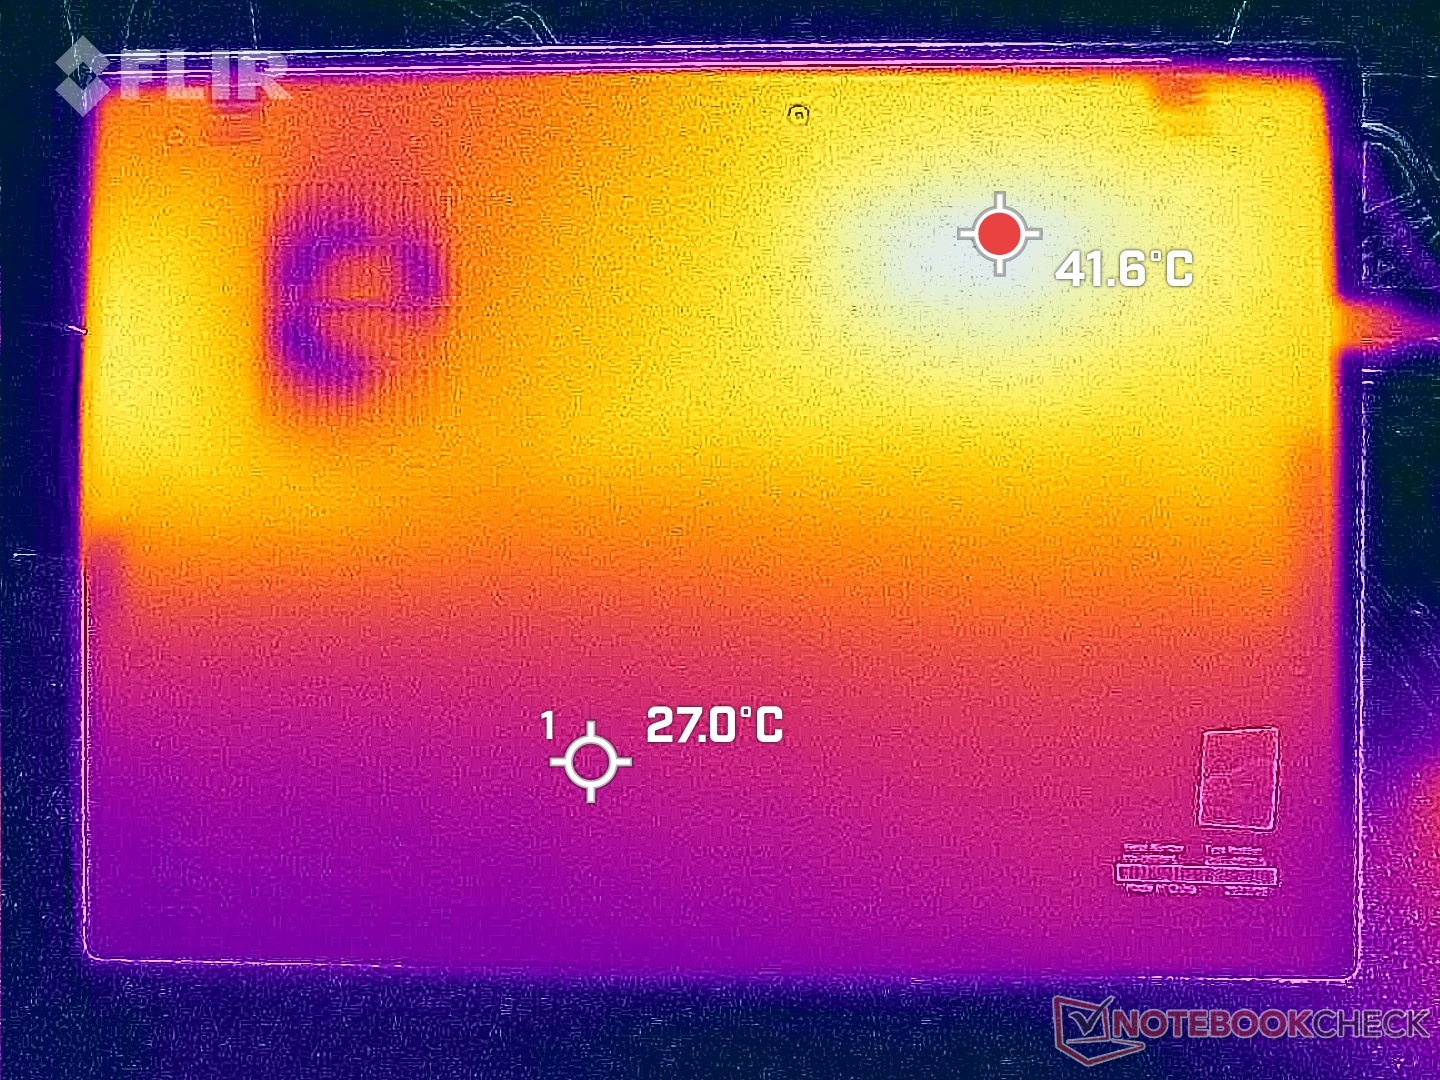
Température
Les températures de surface sont plus élevées que sur la plupart des autres ordinateurs portables, car la solution de refroidissement du ThinkPad X1 Nano est si petite. Le clavier et la surface inférieure peuvent atteindre une température de 38 à 43 °C, soit plusieurs degrés de plus que sur le ThinkPad X1 Nano HP Dragonfly G4 lorsqu'il est soumis à des charges lourdes similaires.
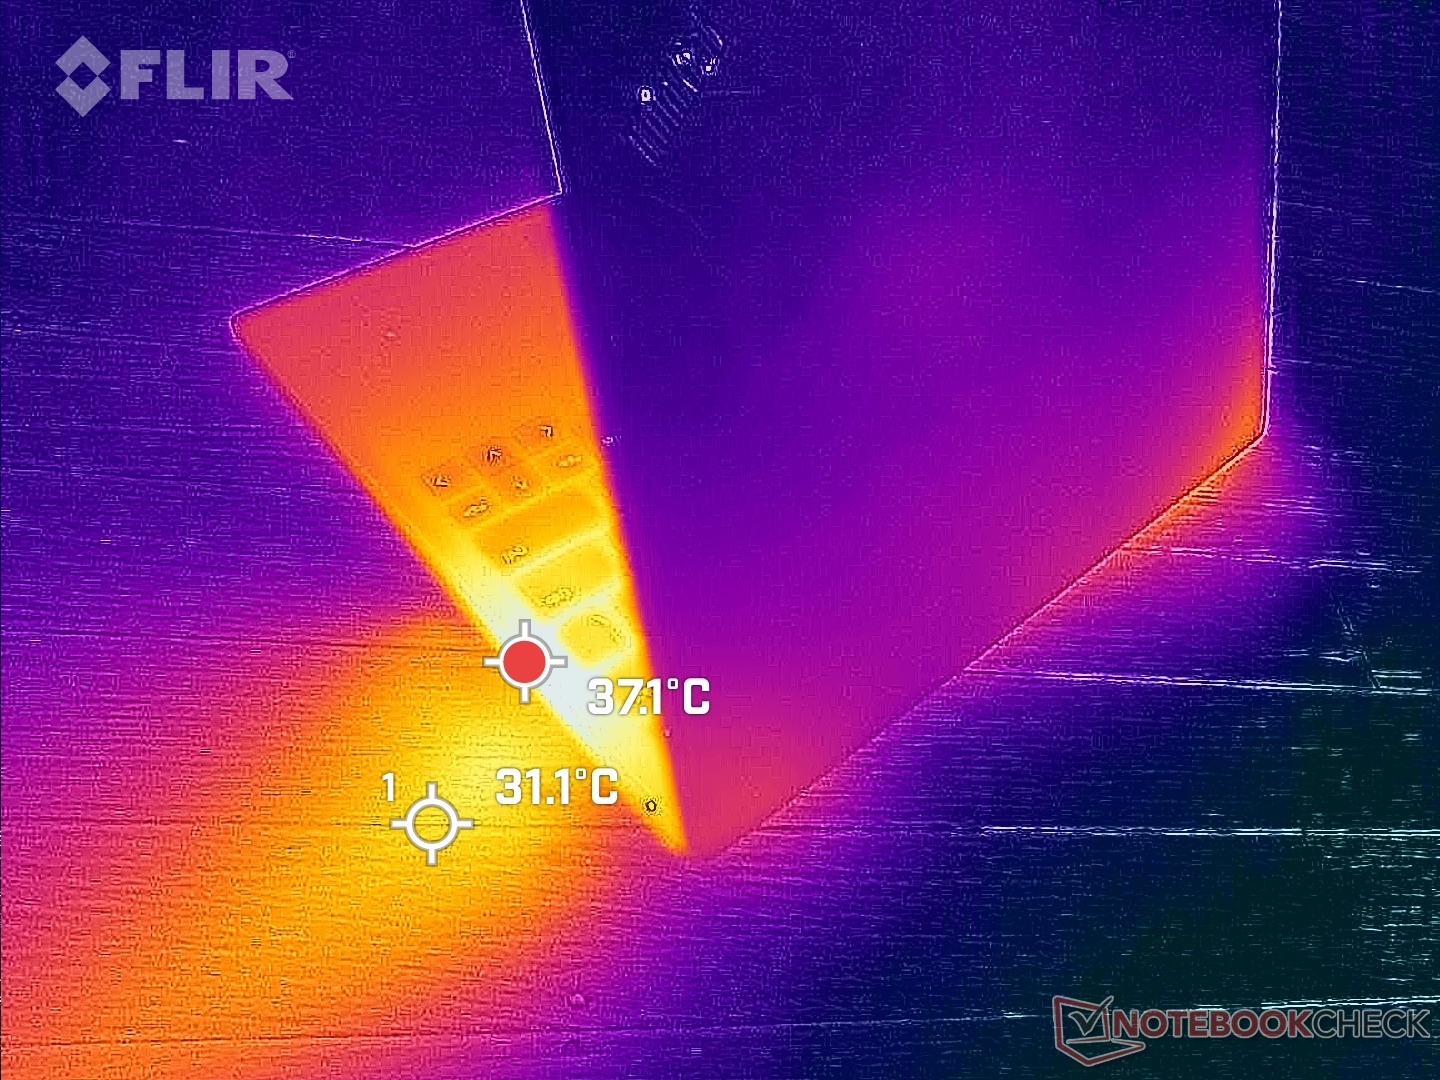
(±) La température maximale du côté supérieur est de 44 °C / 111 F, par rapport à la moyenne de 35.9 °C / 97 F, allant de 21.4 à 59 °C pour la classe Subnotebook.
(±) Le fond chauffe jusqu'à un maximum de 43.2 °C / 110 F, contre une moyenne de 39.2 °C / 103 F
(+) En utilisation inactive, la température moyenne du côté supérieur est de 24 °C / 75 F, par rapport à la moyenne du dispositif de 30.8 °C / 87 F.
(+) Les repose-poignets et le pavé tactile atteignent la température maximale de la peau (32 °C / 89.6 F) et ne sont donc pas chauds.
(-) La température moyenne de la zone de l'appui-paume de dispositifs similaires était de 28.2 °C / 82.8 F (-3.8 °C / #-6.8 F).
| Lenovo ThinkPad X1 Nano Gen 3 Intel Core i7-1360P, Intel Iris Xe Graphics G7 96EUs | Lenovo ThinkPad X1 Nano Gen 2 Core i7-1280P Intel Core i7-1280P, Intel Iris Xe Graphics G7 96EUs | HP Dragonfly G4 Intel Core i7-1365U, Intel Iris Xe Graphics G7 96EUs | Framework Laptop 13.5 13th Gen Intel Intel Core i7-1370P, Intel Iris Xe Graphics G7 96EUs | Dell Latitude 9330 Intel Core i7-1260U, Intel Iris Xe Graphics G7 96EUs | Apple MacBook Air M2 10C GPU Apple M2, Apple M2 10-Core GPU | LG Gram 14Z90Q Intel Core i5-1240P, Intel Iris Xe Graphics G7 80EUs | |
|---|---|---|---|---|---|---|---|
| Heat | -2% | -1% | 2% | -4% | -1% | -4% | |
| Maximum Upper Side * (°C) | 44 | 42.4 4% | 38.6 12% | 38.2 13% | 40.6 8% | 44.7 -2% | 43 2% |
| Maximum Bottom * (°C) | 43.2 | 40.2 7% | 40.4 6% | 41.4 4% | 50.2 -16% | 44.6 -3% | 45 -4% |
| Idle Upper Side * (°C) | 25.6 | 27.8 -9% | 28.2 -10% | 25.8 -1% | 25 2% | 25.1 2% | 27 -5% |
| Idle Bottom * (°C) | 25.6 | 27.8 -9% | 29 -13% | 27.6 -8% | 27.6 -8% | 25.3 1% | 28 -9% |
* ... Moindre est la valeur, meilleures sont les performances
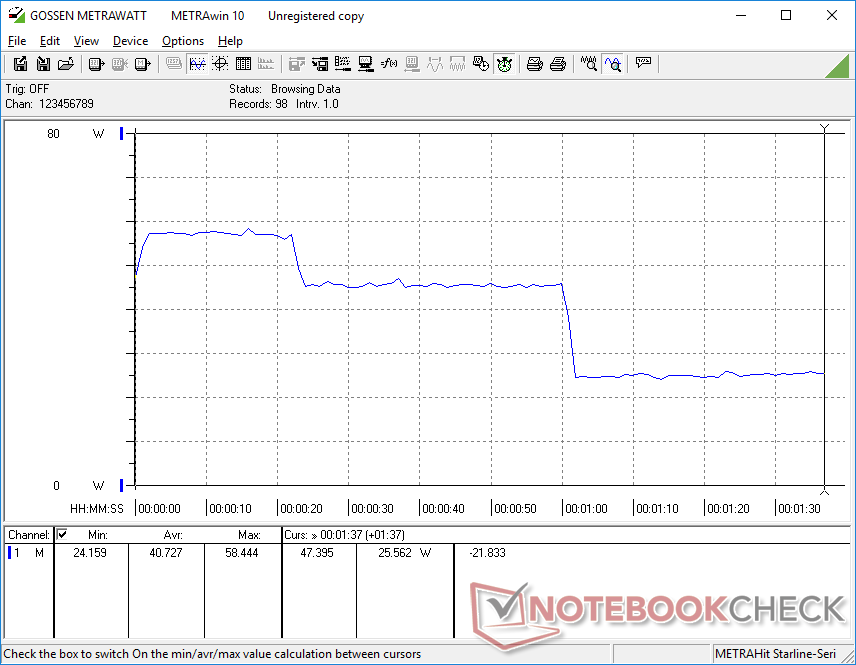
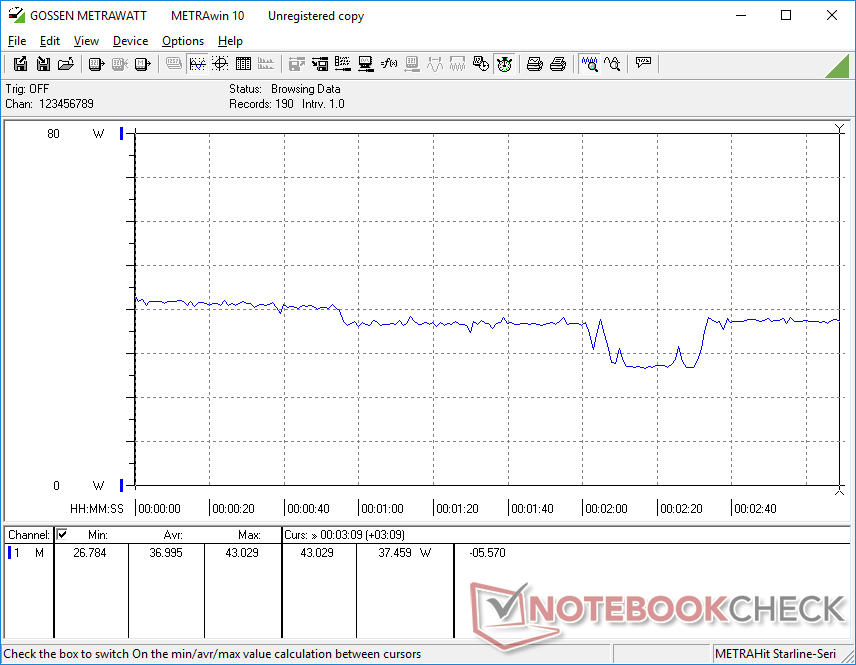
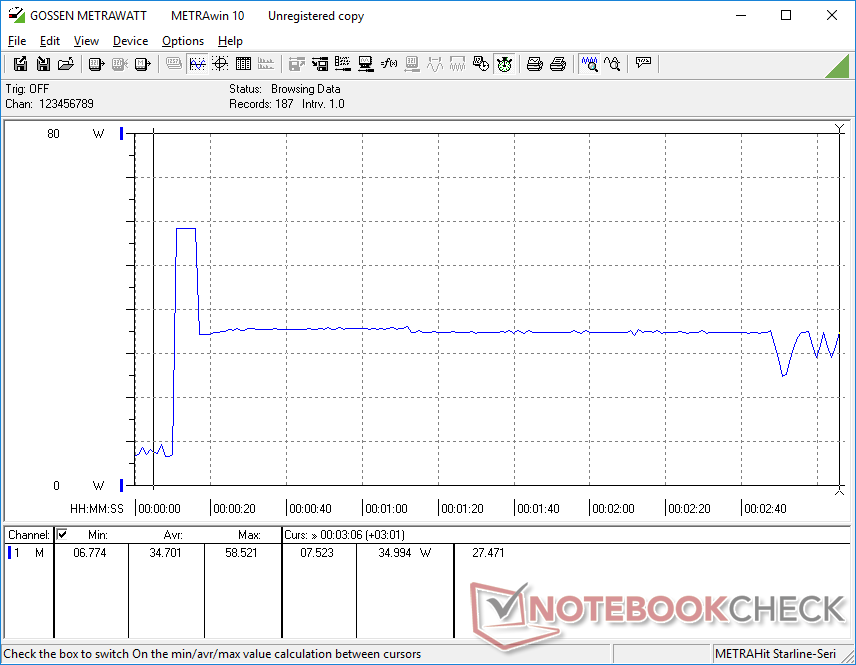
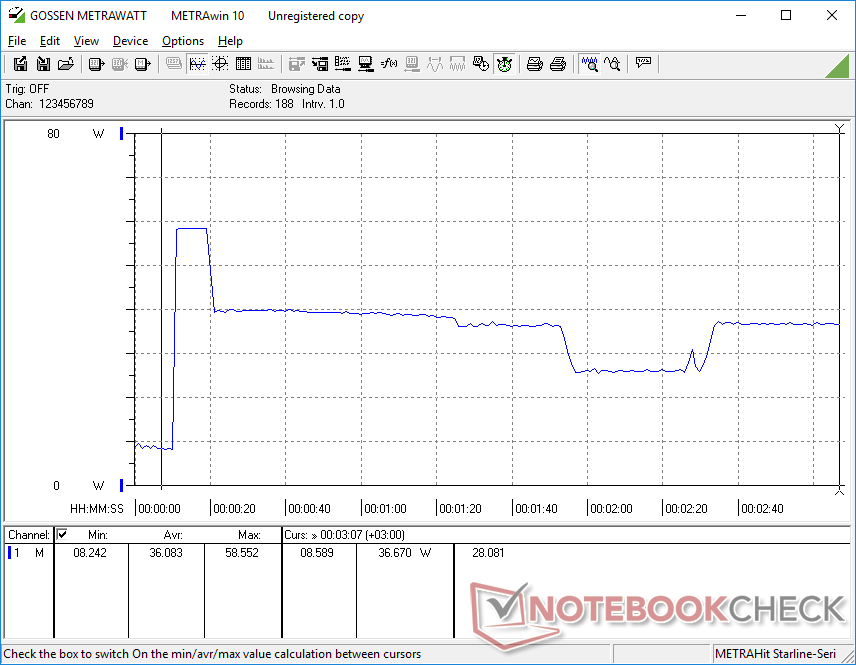
Test de stress
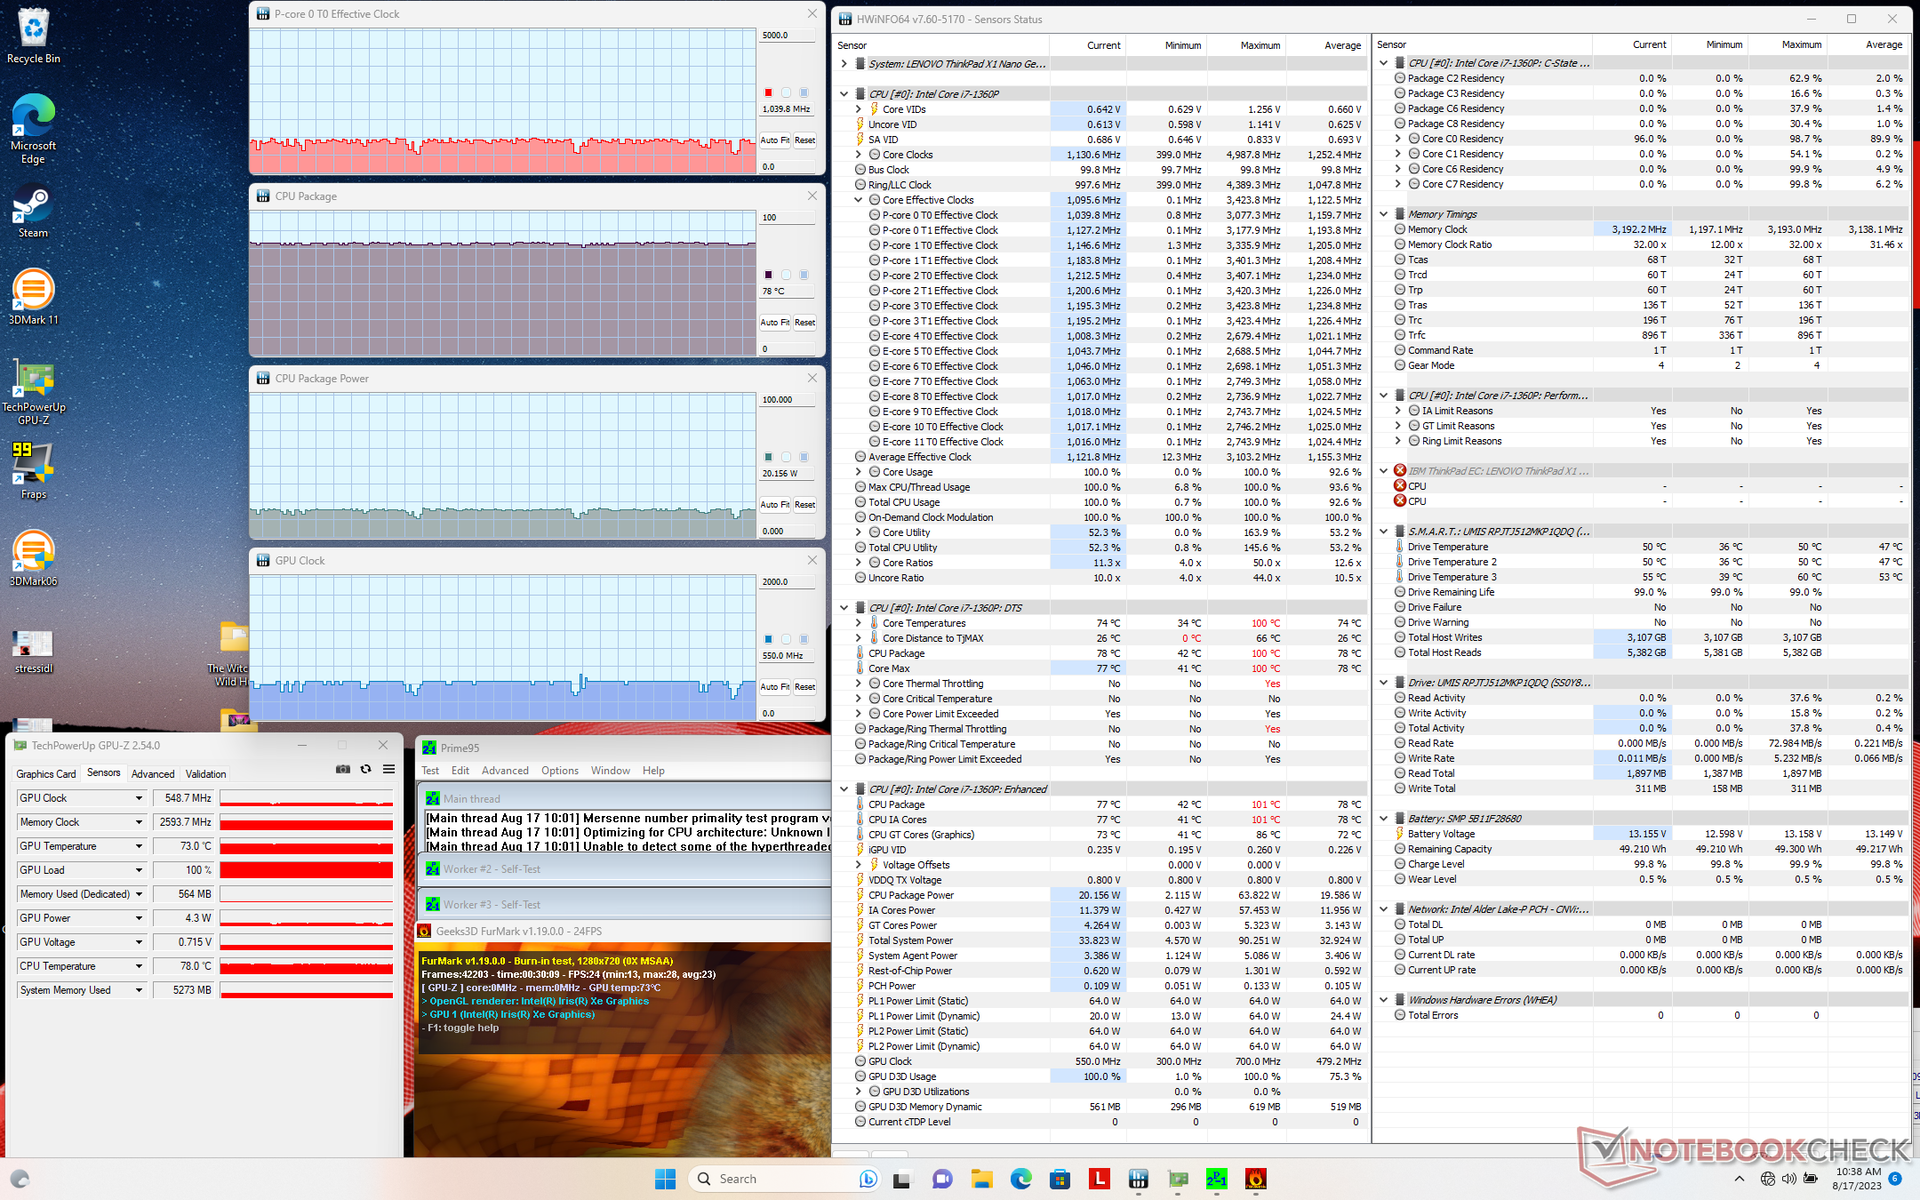
Lors de l'exécution de Prime95 pour stresser le CPU, les fréquences d'horloge et la consommation d'énergie de la carte ont atteint 3,1 GHz et 64 W, respectivement, pendant seulement quelques secondes en raison de la température du cœur de 100 C. Le CPU s'est ensuite stabilisé à 1,5 GHz et 23 W afin de maintenir une température plus gérable de 90 C. Le processeur se stabilise ensuite à 1,5 GHz et 23 W afin de maintenir une température plus gérable de 90 °C. Lenovo repousse sans aucun doute les limites du processeur Core-P étant donné le potentiel de refroidissement limité du modèle. Ces températures de cœur très élevées sont plus chaudes que sur le Dragonfly G4 et comparables à celles du Latitude 9330 dans des conditions similaires.
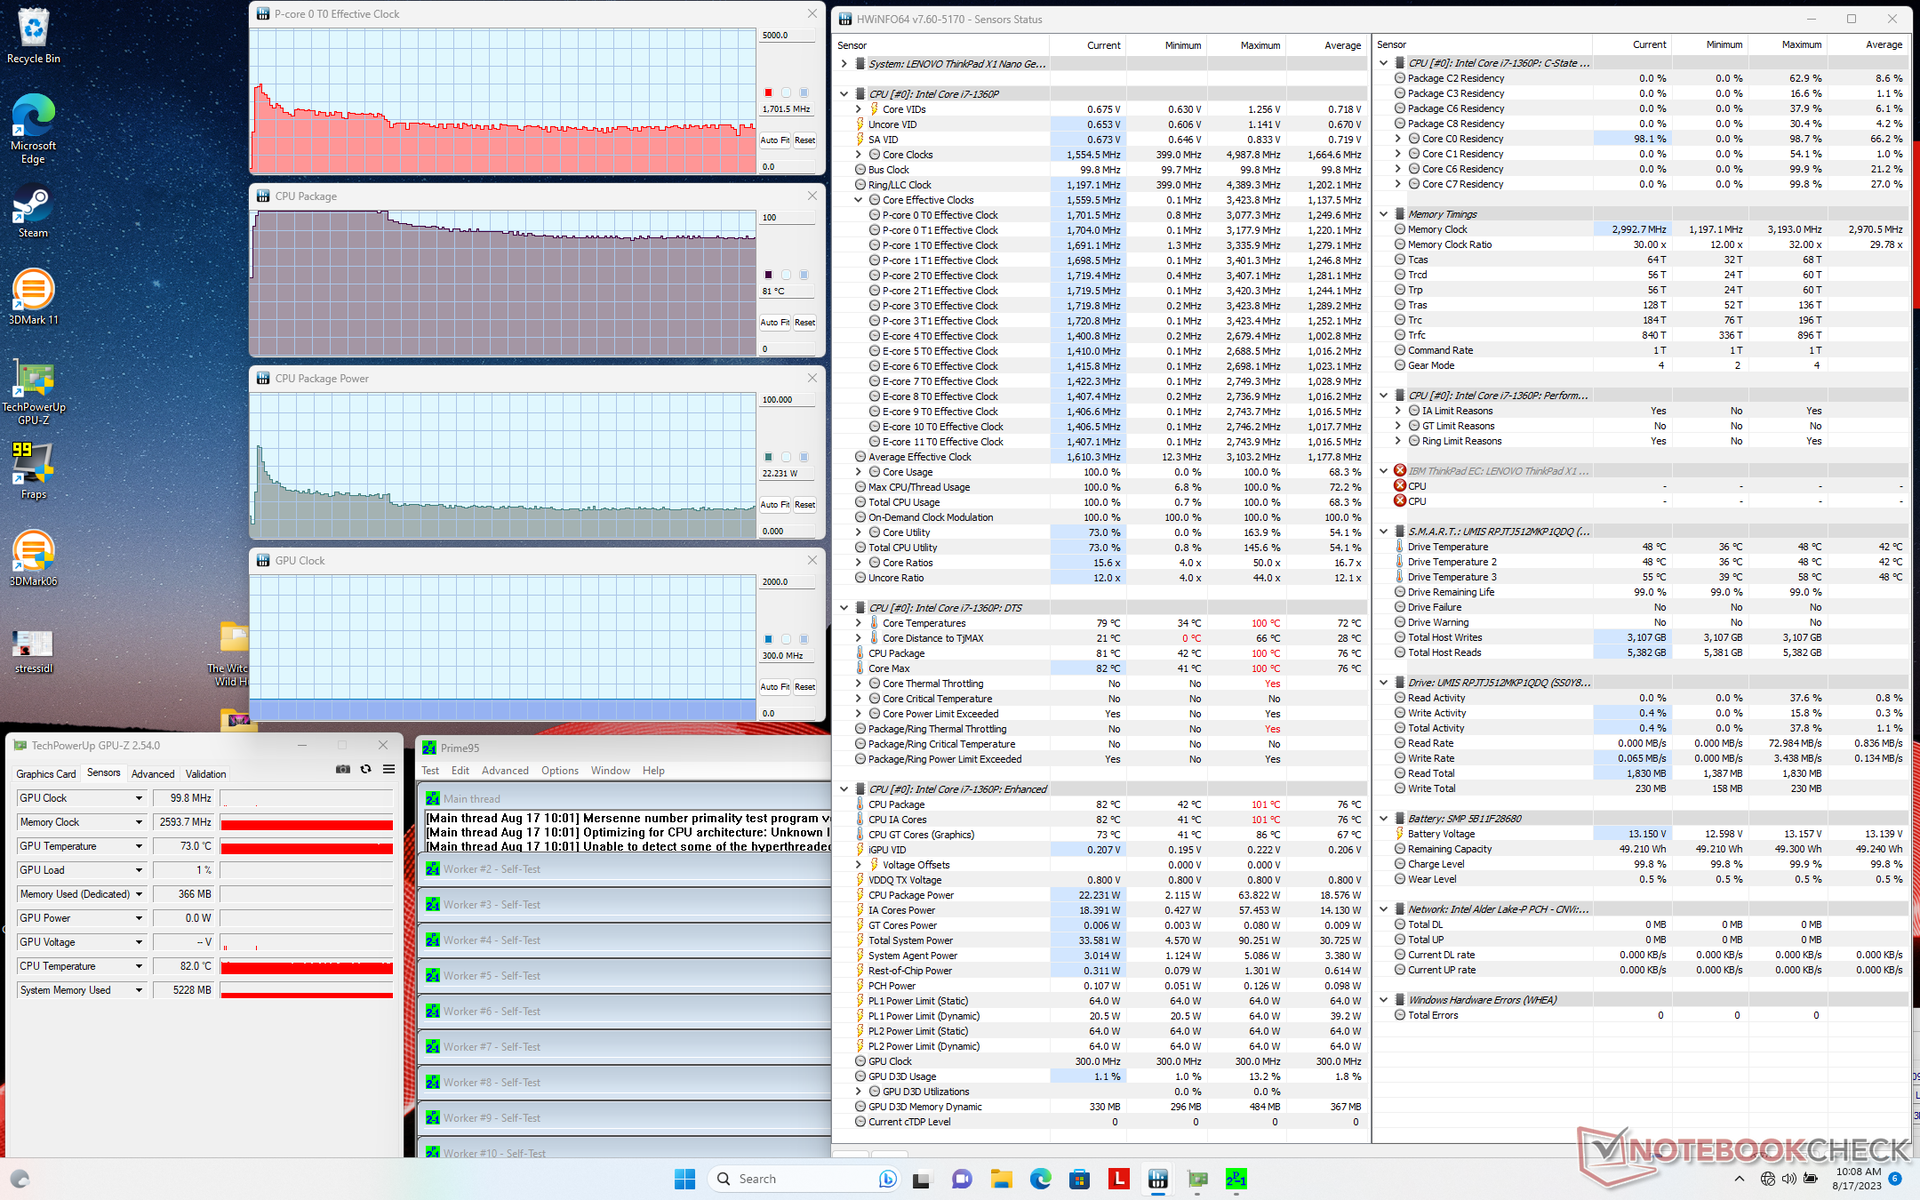
| Horloge du CPU (GHz) | Horloge du GPU (MHz) | Température moyenne du CPU (°C) | |
| Système au repos | -- | -- | 50 |
| Prime95 Stress | 1.7 | -- | 81 |
| Prime95 + FurMark Stress | ~1.0 | 549 | 78 |
| Witcher 3 Stress | ~1.0 | 850 - 1150 | 70 - 78 |
Intervenants
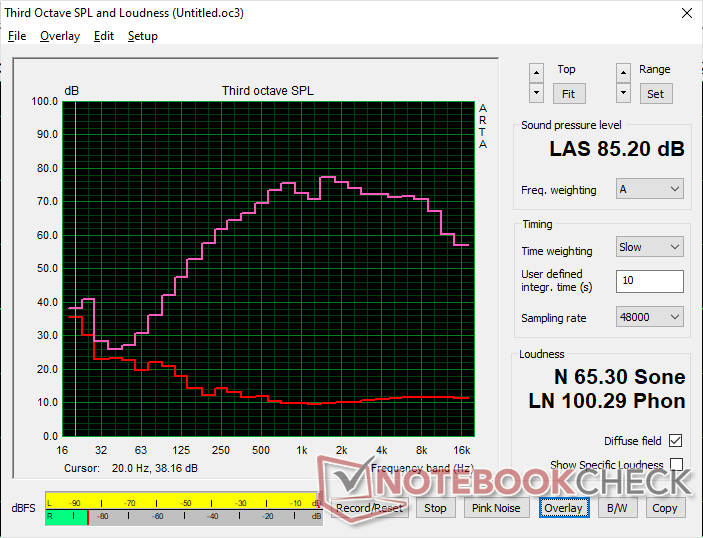
Lenovo ThinkPad X1 Nano Gen 3 analyse audio
(+) | les haut-parleurs peuvent jouer relativement fort (85.2# dB)
Basses 100 - 315 Hz
(-) | presque aucune basse - en moyenne 16.3% plus bas que la médiane
(±) | la linéarité des basses est moyenne (7.9% delta à la fréquence précédente)
Médiums 400 - 2000 Hz
(+) | médiane équilibrée - seulement 3.4% de la médiane
(+) | les médiums sont linéaires (5.1% delta à la fréquence précédente)
Aiguës 2 - 16 kHz
(+) | des sommets équilibrés - à seulement 1.6% de la médiane
(+) | les aigus sont linéaires (2.3% delta à la fréquence précédente)
Globalement 100 - 16 000 Hz
(+) | le son global est linéaire (12.2% différence à la médiane)
Par rapport à la même classe
» 15% de tous les appareils testés de cette catégorie étaient meilleurs, 4% similaires, 81% pires
» Le meilleur avait un delta de 5%, la moyenne était de 18%, le pire était de 53%.
Par rapport à tous les appareils testés
» 10% de tous les appareils testés étaient meilleurs, 2% similaires, 88% pires
» Le meilleur avait un delta de 4%, la moyenne était de 24%, le pire était de 134%.
Apple MacBook Pro 16 2021 M1 Pro analyse audio
(+) | les haut-parleurs peuvent jouer relativement fort (84.7# dB)
Basses 100 - 315 Hz
(+) | bonne basse - seulement 3.8% loin de la médiane
(+) | les basses sont linéaires (5.2% delta à la fréquence précédente)
Médiums 400 - 2000 Hz
(+) | médiane équilibrée - seulement 1.3% de la médiane
(+) | les médiums sont linéaires (2.1% delta à la fréquence précédente)
Aiguës 2 - 16 kHz
(+) | des sommets équilibrés - à seulement 1.9% de la médiane
(+) | les aigus sont linéaires (2.7% delta à la fréquence précédente)
Globalement 100 - 16 000 Hz
(+) | le son global est linéaire (4.6% différence à la médiane)
Par rapport à la même classe
» 0% de tous les appareils testés de cette catégorie étaient meilleurs, 0% similaires, 100% pires
» Le meilleur avait un delta de 5%, la moyenne était de 17%, le pire était de 45%.
Par rapport à tous les appareils testés
» 0% de tous les appareils testés étaient meilleurs, 0% similaires, 100% pires
» Le meilleur avait un delta de 4%, la moyenne était de 24%, le pire était de 134%.
Gestion de l'énergie - Le rendement énergétique élevé compense la petite taille de la batterie
Consommation électrique
Notre modèle Gen 3 est nettement plus économe en énergie que l'ancien modèle Gen 2, comme le montre le tableau ci-dessous. Ces économies sont probablement à l'origine de l'allongement de la durée de vie de la batterie.
Les économies d'énergie s'étendent aux charges plus élevées, comme les jeux, pour lesquels notre unité demande 25 % d'énergie en moins par rapport à l'année précédente. Ces résultats s'alignent sur les performances graphiques plus lentes de 25 % mentionnées plus haut et sur le comportement d'étranglement de notre système.
| Éteint/en veille | |
| Au repos | |
| Fortement sollicité |
|
Légende:
min: | |
| Lenovo ThinkPad X1 Nano Gen 3 i7-1360P, Iris Xe G7 96EUs, Lenovo UMIS AM6A0 RPJTJ512MKP1QDQ, IPS, 2160x1350, 13" | Lenovo ThinkPad X1 Nano Gen 2 Core i7-1280P i7-1280P, Iris Xe G7 96EUs, Kioxia BG5 KBG5AZNT1T02, IPS, 2160x1350, 13" | HP Dragonfly G4 i7-1365U, Iris Xe G7 96EUs, Micron 3400 MTFDKBA512TFH 512GB, IPS, 1920x1280, 13.5" | Framework Laptop 13.5 13th Gen Intel i7-1370P, Iris Xe G7 96EUs, WD PC SN740 SDDPNQD-1T00, IPS, 2256x1504, 13.5" | Dell Latitude 9330 i7-1260U, Iris Xe G7 96EUs, , IPS, 2560x1600, 13.3" | Apple MacBook Air M2 10C GPU M2, M2 10-Core GPU, Apple SSD AP1024Z, IPS, 2560x1664, 13.6" | LG Gram 14Z90Q i5-1240P, Iris Xe G7 80EUs, Samsung PM9A1 MZVL2512HCJQ, IPS, 1920x1200, 14" | |
|---|---|---|---|---|---|---|---|
| Power Consumption | -29% | -9% | -20% | -7% | 6% | -10% | |
| Idle Minimum * (Watt) | 3.3 | 3.4 -3% | 4.1 -24% | 2.9 12% | 4.7 -42% | 1.9 42% | 3 9% |
| Idle Average * (Watt) | 6.5 | 6.5 -0% | 7.5 -15% | 6.3 3% | 8.2 -26% | 9.6 -48% | 6 8% |
| Idle Maximum * (Watt) | 7.1 | 14.4 -103% | 8.2 -15% | 9.9 -39% | 8.4 -18% | 9.7 -37% | 12 -69% |
| Load Average * (Watt) | 40.7 | 54.5 -34% | 35.5 13% | 56.2 -38% | 36.8 10% | 32.4 20% | 40 2% |
| Witcher 3 ultra * (Watt) | 37 | 44 -19% | 37.5 -1% | 56.6 -53% | 30.4 18% | 30.8 17% | 36.5 1% |
| Load Maximum * (Watt) | 58.6 | 65.4 -12% | 66.5 -13% | 60.8 -4% | 49.9 15% | 35.7 39% | 63 -8% |
* ... Moindre est la valeur, meilleures sont les performances
Power Consumption Witcher 3 / Stresstest
Power Consumption external Monitor
Autonomie de la batterie
La capacité de la batterie est faible (moins de 50 Wh) afin de maintenir le poids très bas. Néanmoins, l'autonomie de la batterie reste très bonne avec près de 8 heures de navigation WLAN dans le monde réel, ce qui représente une amélioration de quelques heures par rapport au modèle de l'année dernière.
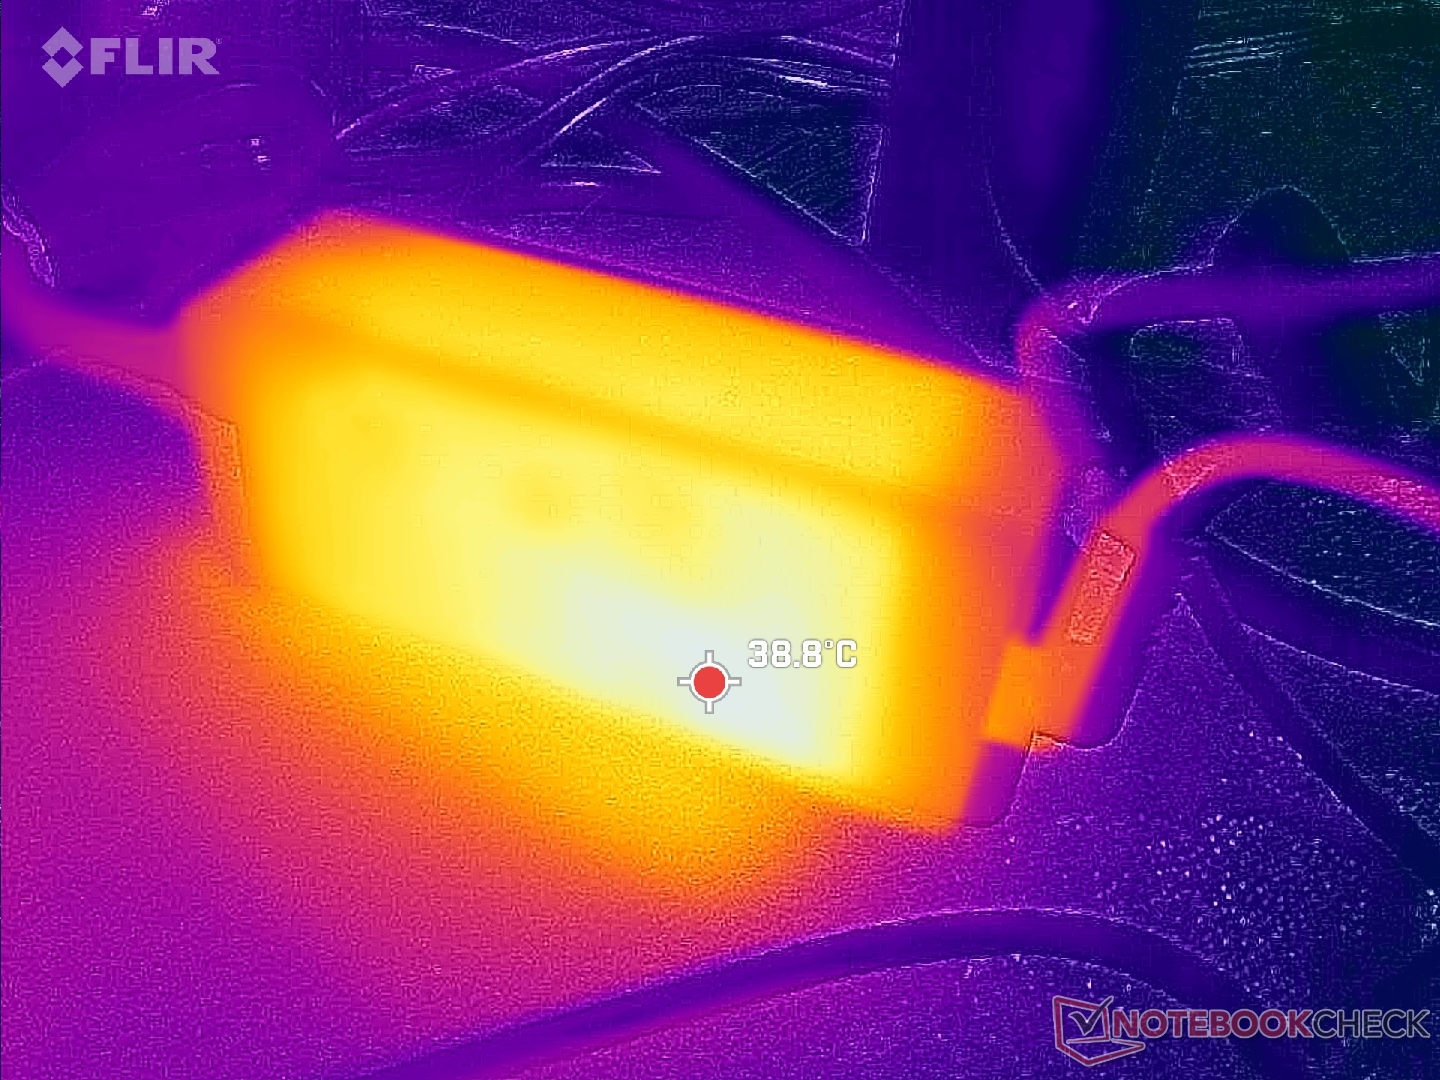
Le chargement d'une batterie vide à une batterie pleine prend environ 90 minutes avec l'adaptateur secteur fourni.
| Lenovo ThinkPad X1 Nano Gen 3 i7-1360P, Iris Xe G7 96EUs, 49.5 Wh | Lenovo ThinkPad X1 Nano Gen 2 Core i7-1280P i7-1280P, Iris Xe G7 96EUs, 49.5 Wh | HP Dragonfly G4 i7-1365U, Iris Xe G7 96EUs, 68 Wh | Framework Laptop 13.5 13th Gen Intel i7-1370P, Iris Xe G7 96EUs, 61 Wh | Dell Latitude 9330 i7-1260U, Iris Xe G7 96EUs, 50 Wh | Apple MacBook Air M2 10C GPU M2, M2 10-Core GPU, 52.6 Wh | LG Gram 14Z90Q i5-1240P, Iris Xe G7 80EUs, 72 Wh | |
|---|---|---|---|---|---|---|---|
| Autonomie de la batterie | -35% | 104% | 13% | 21% | 88% | 53% | |
| WiFi v1.3 (h) | 7.8 | 5.1 -35% | 15.9 104% | 8.8 13% | 9.4 21% | 14.7 88% | 11.9 53% |
| Reader / Idle (h) | 42.5 | 15.4 | 28.9 | ||||
| Load (h) | 3.2 | 2.3 | 2.8 | ||||
| H.264 (h) | 15.8 |
Points positifs
Points négatifs
Verdict - Des performances à la hauteur d'un poids inférieur à 1 kg
Le ThinkPad X1 Nano 2023 présente quelques améliorations par rapport à la version 2022. Le bruit du ventilateur, l'autonomie de la batterie et les performances du SSD ont tous été améliorés, ce qui devrait profiter aux utilisateurs qui sont constamment en déplacement et loin d'une source d'alimentation.
Gardez à l'esprit que toute amélioration des performances d'une année sur l'autre est au mieux marginale malgré la mise à jour vers la nouvelle plateforme Intel de 13ème génération. Cela ne veut pas dire que le Lenovo est lent, car son processeur Core P-series est plus performant que le Core U-series plus courant sur la plupart des autres ordinateurs portables, mais l'écart n'est pas aussi important qu'on pourrait le croire en raison des capacités de refroidissement limitées du design du ThinkPad X1 Nano. Après tout, des concessions sont inévitables lorsque l'on vise un poids final inférieur au kilogramme. Le processeur Core P est donc au mieux de sa forme lors de courtes périodes de performances Turbo Boost, par exemple lors du lancement d'applications ou de la retouche de photos.
Le ThinkPad X1 Nano Gen 3 est l'un des seuls ordinateurs portables de 13 pouces pesant moins de 1 kg à être équipé d'un processeur Core P. Les performances sont excellentes pour de courtes périodes avant le lancement d'applications ou la retouche de photos. Les performances sont excellentes pendant de courtes périodes avant que la chaleur et l'étranglement ne se fassent sentir.
Si vous essayez d'économiser un peu d'argent, vous pouvez obtenir essentiellement la même expérience utilisateur en optant pour l'ancien ThinkPad X1 Nano Gen 2, d'autant plus que Lenovo n'a apporté aucune modification à l'écran ou à d'autres aspects physiques du modèle.
Prix et disponibilité
Lenovo livre désormais son ThinkPad X1 Nano Gen 3 à partir de 1270 USD pour la configuration Core i5-1340P de base et jusqu'à 2000 USD pour la configuration Core i7-1370P la plus haut de gamme.
Lenovo ThinkPad X1 Nano Gen 3
- 08/25/2023 v7 (old)
Allen Ngo
Transparency
La sélection des appareils à examiner est effectuée par notre équipe éditoriale. L'échantillon de test a été prêté à l'auteur par le fabricant ou le détaillant pour les besoins de cet examen. Le prêteur n'a pas eu d'influence sur cette évaluation et le fabricant n'a pas reçu de copie de cette évaluation avant sa publication. Il n'y avait aucune obligation de publier cet article. En tant que média indépendant, Notebookcheck n'est pas soumis à l'autorité des fabricants, des détaillants ou des éditeurs.
Voici comment Notebookcheck teste
Chaque année, Notebookcheck examine de manière indépendante des centaines d'ordinateurs portables et de smartphones en utilisant des procédures standardisées afin de garantir que tous les résultats sont comparables. Nous avons continuellement développé nos méthodes de test depuis environ 20 ans et avons établi des normes industrielles dans le processus. Dans nos laboratoires de test, des équipements de mesure de haute qualité sont utilisés par des techniciens et des rédacteurs expérimentés. Ces tests impliquent un processus de validation en plusieurs étapes. Notre système d'évaluation complexe repose sur des centaines de mesures et de points de référence bien fondés, ce qui garantit l'objectivité.Price comparison

