Test du HP Dragonfly G4 : petites mises à jour par rapport au Dragonfly G3 déjà excellent

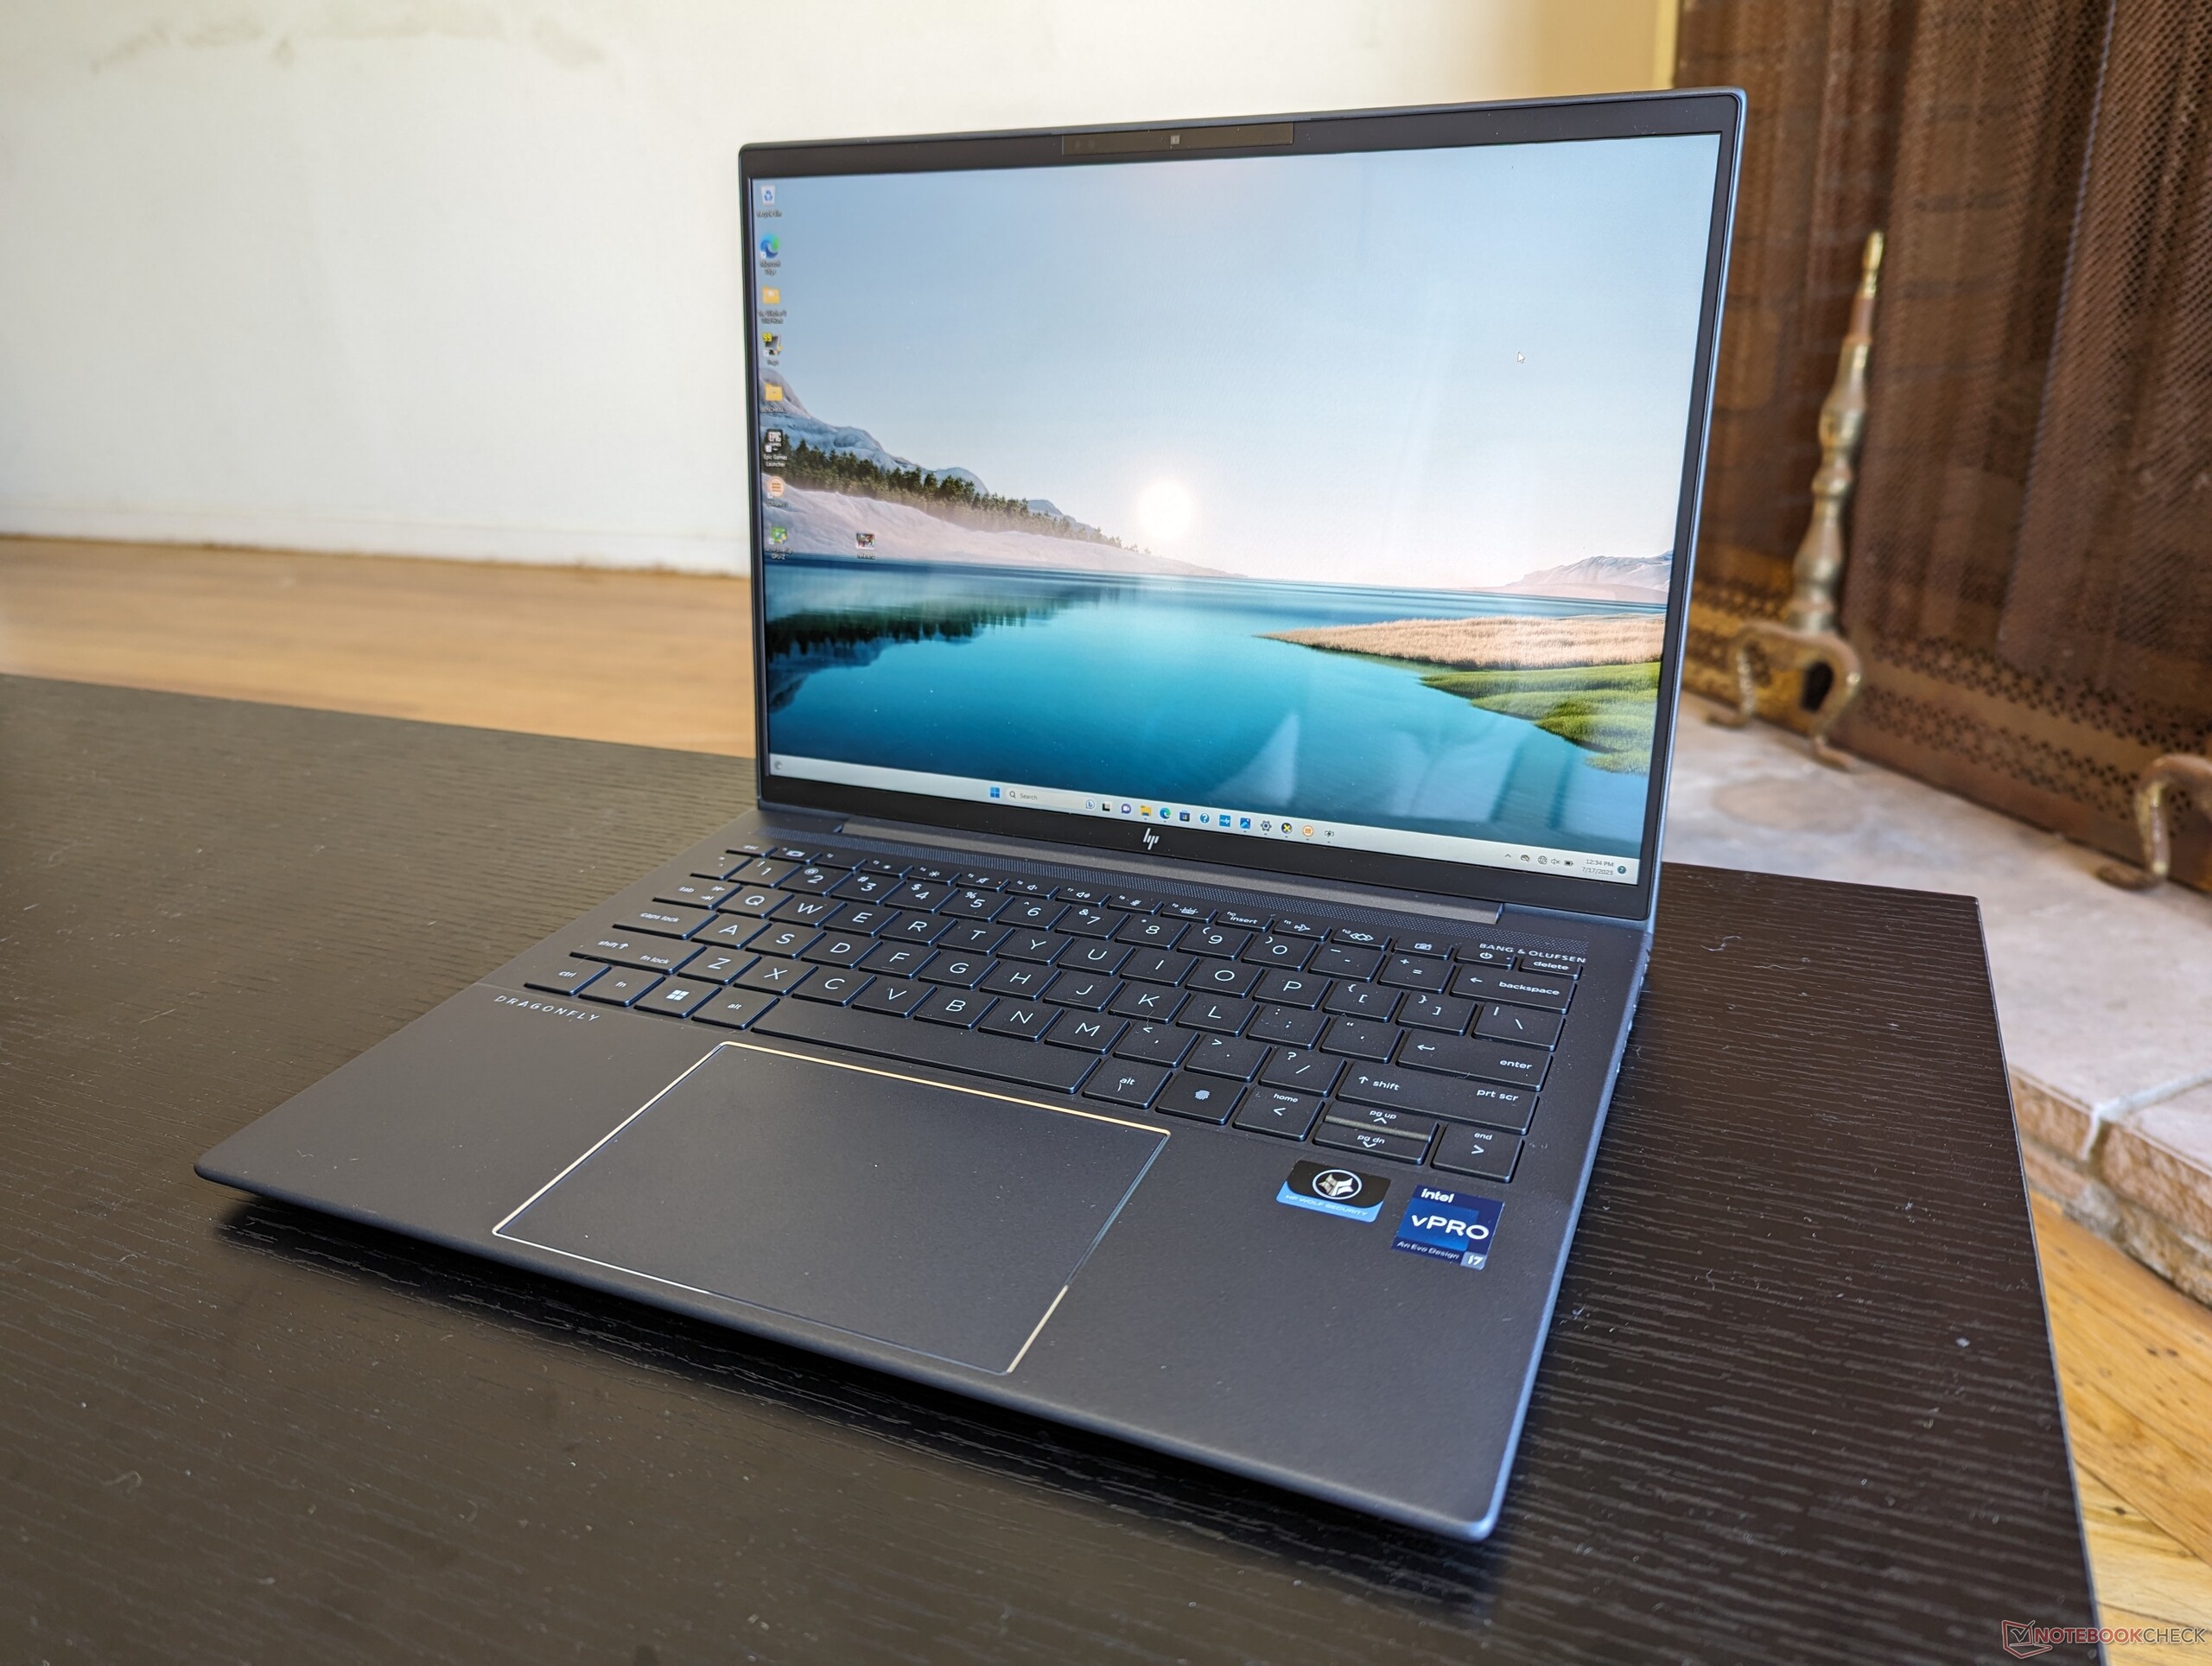
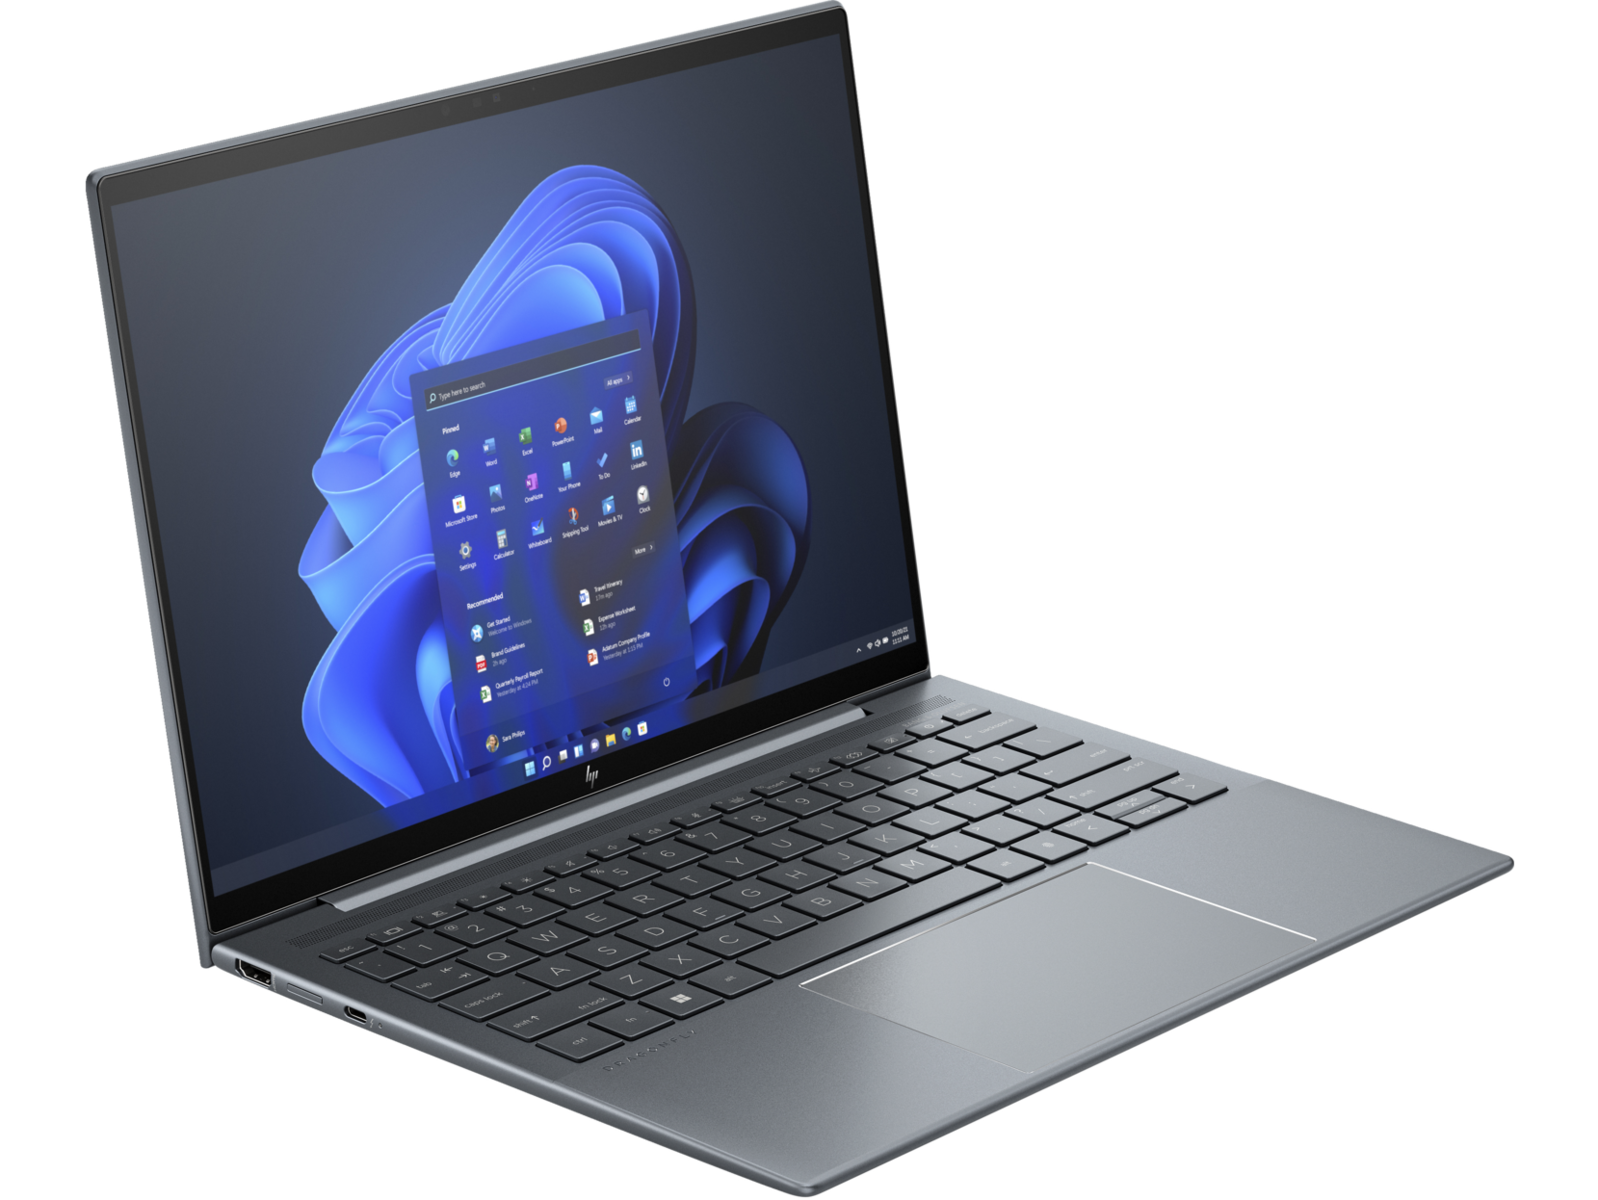
Le Dragonfly G4 succède directement au Dragonfly G3 Elite de l'année dernière en abandonnant officiellement le moniker "Elite" et en remplaçant les options Alder Lake-U de la 12ème génération par Raptor Lake-U de la 13ème génération. A part cela, le châssis externe reste identique d'une année sur l'autre et nous vous recommandons donc de consulter notre test de l'Elite Dragonfly G3 pour en savoir plus sur les caractéristiques physiques de l'ordinateur portable.
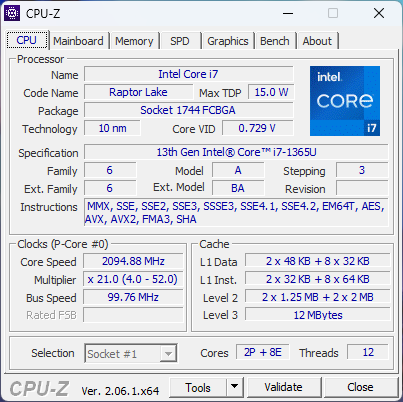
Notre unité de test est une configuration de milieu de gamme avec le CPU Core i7-1365U et un écran IPS 1280p 400-nit non tactile pour environ $1700 USD. Les autres modèles vont du Core i5-1335U à l'écran OLED 3000 x 2000 à partir de 1300 USD jusqu'à près de 2400 USD en fonction de la RAM et de l'espace de stockage.
Le Dragonfly G4 est en concurrence directe avec d'autres ordinateurs portables ultrasensibles haut de gamme destinés aux particuliers ou aux entreprises, tels que le Lenovo ThinkPad X13 G3, Dell Latitude 9330, Microsoft Surface seriesou le Asus ZenBook S 13.
Plus de commentaires sur HP :
Comparaison avec les concurrents potentiels
Note | Date | Modèle | Poids | Épaisseur | Taille | Résolution | Prix |
|---|---|---|---|---|---|---|---|
| 91.9 % v7 (old) | 07/23 | HP Dragonfly G4 i7-1365U, Iris Xe G7 96EUs | 1.1 kg | 16.3 mm | 13.50" | 1920x1280 | |
| 91 % v7 (old) | 08/22 | HP Elite Dragonfly G3 i7-1265U, Iris Xe G7 96EUs | 1.2 kg | 16.3 mm | 13.50" | 1920x1280 | |
| 86.2 % v7 (old) | 05/23 | Framework Laptop 13.5 13th Gen Intel i7-1370P, Iris Xe G7 96EUs | 1.3 kg | 15.85 mm | 13.50" | 2256x1504 | |
| 90.6 % v7 (old) | 06/23 | Lenovo ThinkPad X13 G3 21CM002UGE R5 PRO 6650U, Radeon 660M | 1.3 kg | 18.1 mm | 13.30" | 1920x1200 | |
| 89 % v7 (old) | 11/22 | Dell Latitude 9330 i7-1260U, Iris Xe G7 96EUs | 1.2 kg | 14.1 mm | 13.30" | 2560x1600 | |
| 92.3 % v7 (old) | 07/22 | Apple MacBook Air M2 Entry M2, M2 8-Core GPU | 1.2 kg | 11.3 mm | 13.60" | 2560x1664 |
Affaire - En partie prosommateur, en partie entreprise
Communication
Webcam
Les ordinateurs portables HP Spectre, EliteBook et Dragonfly sont toujours équipés de webcams de 5 MP ou plus pour des images nettement plus nettes que les webcams de la plupart des autres ordinateurs portables où les capteurs de 1 MP et 2 MP sont encore courants. La caméra est équipée en standard d'un obturateur à infrarouge et d'un obturateur de confidentialité.
Le logiciel de l'appareil photo HP prend désormais en charge la correction de la distorsion trapézoïdale pour recadrer ou aplatir un flux vidéo afin de partager des tableaux blancs ou des feuilles de papier, la caméra automatique alimentée par l'IA pour que vos yeux restent concentrés sur la caméra plutôt que sur l'écran, et la prise en charge de plusieurs caméras pour la diffusion simultanée de deux flux vidéo.


Maintenance
Contrairement à la plupart des autres fabricants, HP met en ligne des vidéos très pratiques sur la façon de réparer ou de démonter un grand nombre de ses ordinateurs portables, y compris le Dragonfly G4. Nous recommandons à de regarder la vidéoci-dessous pour un démontage complet.
Affichage
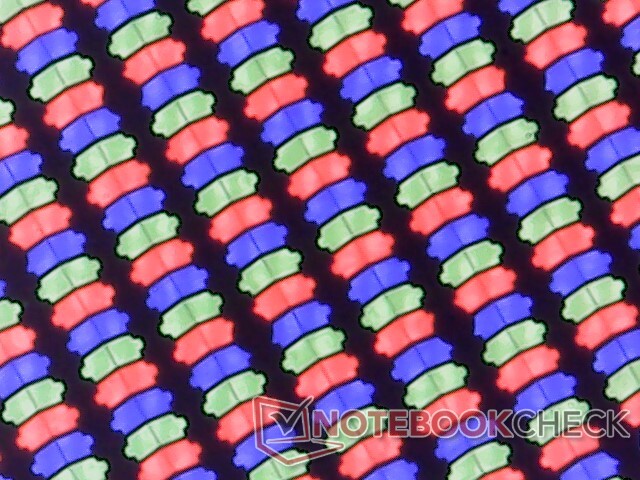
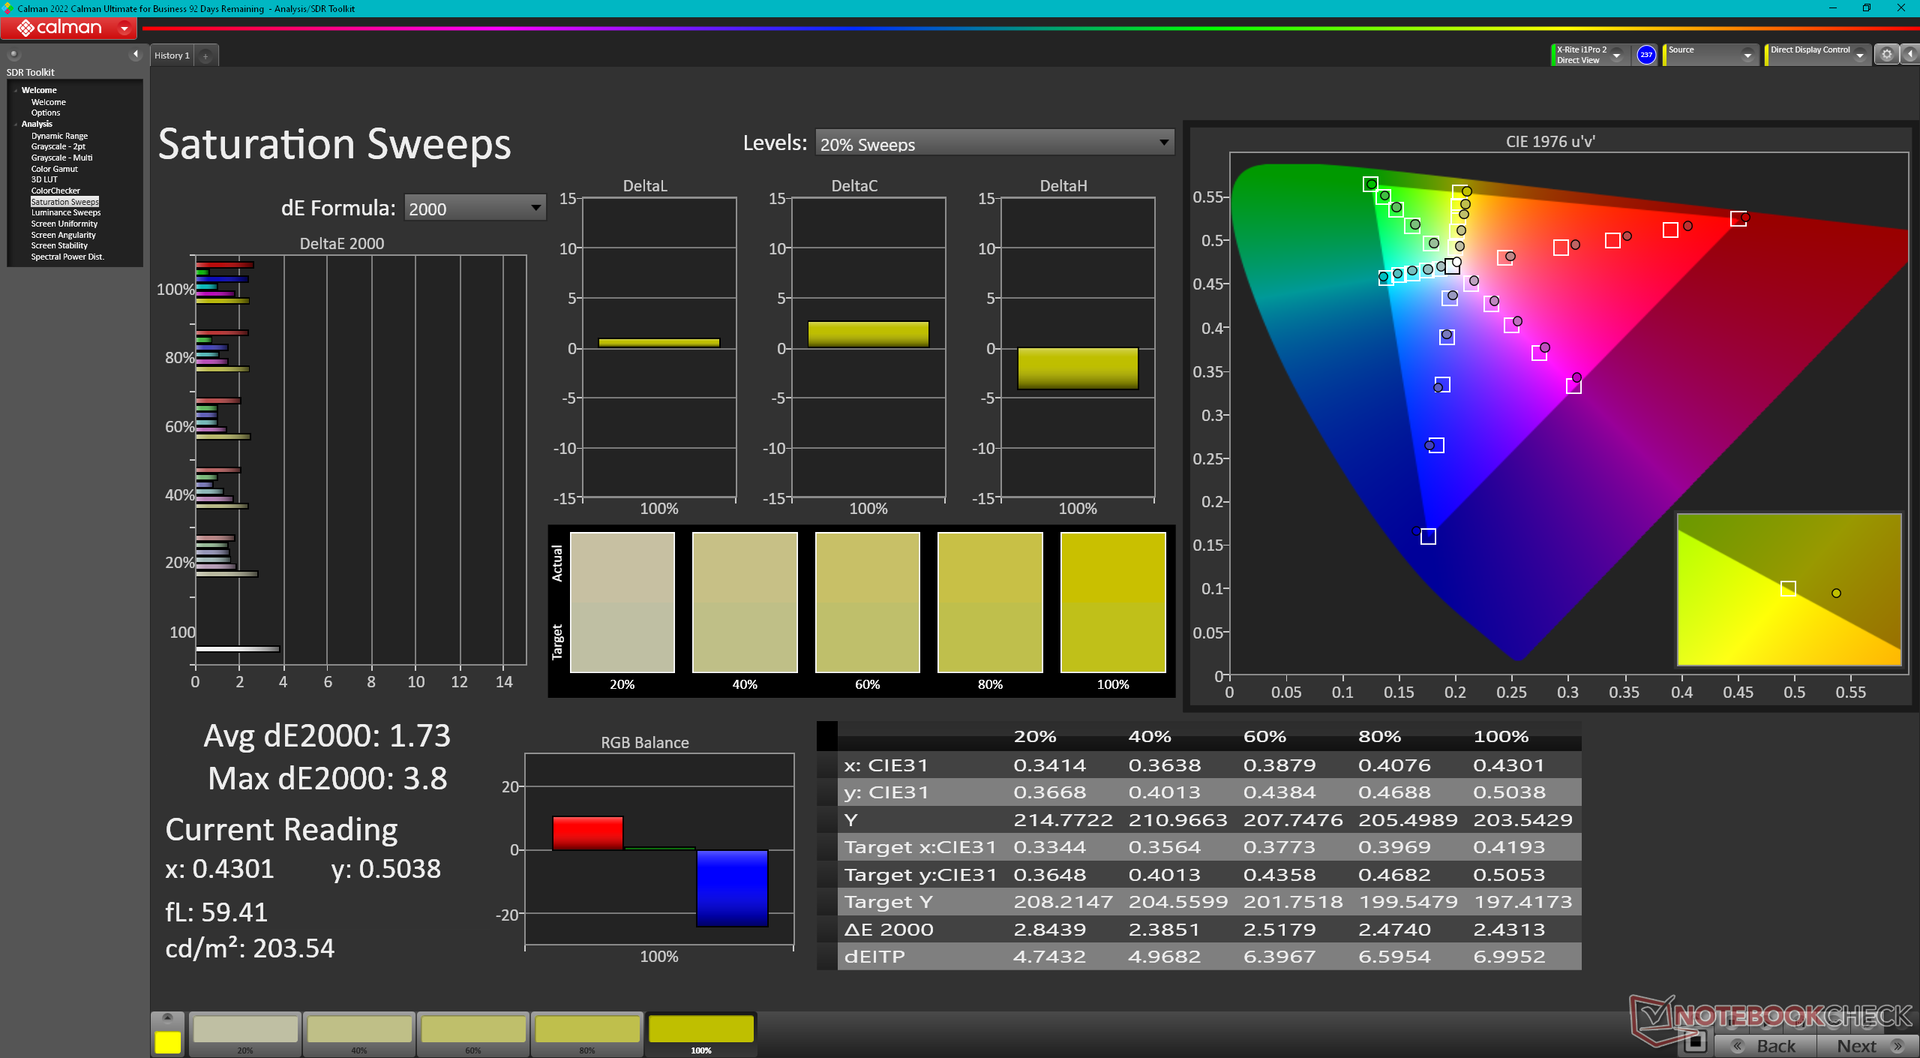
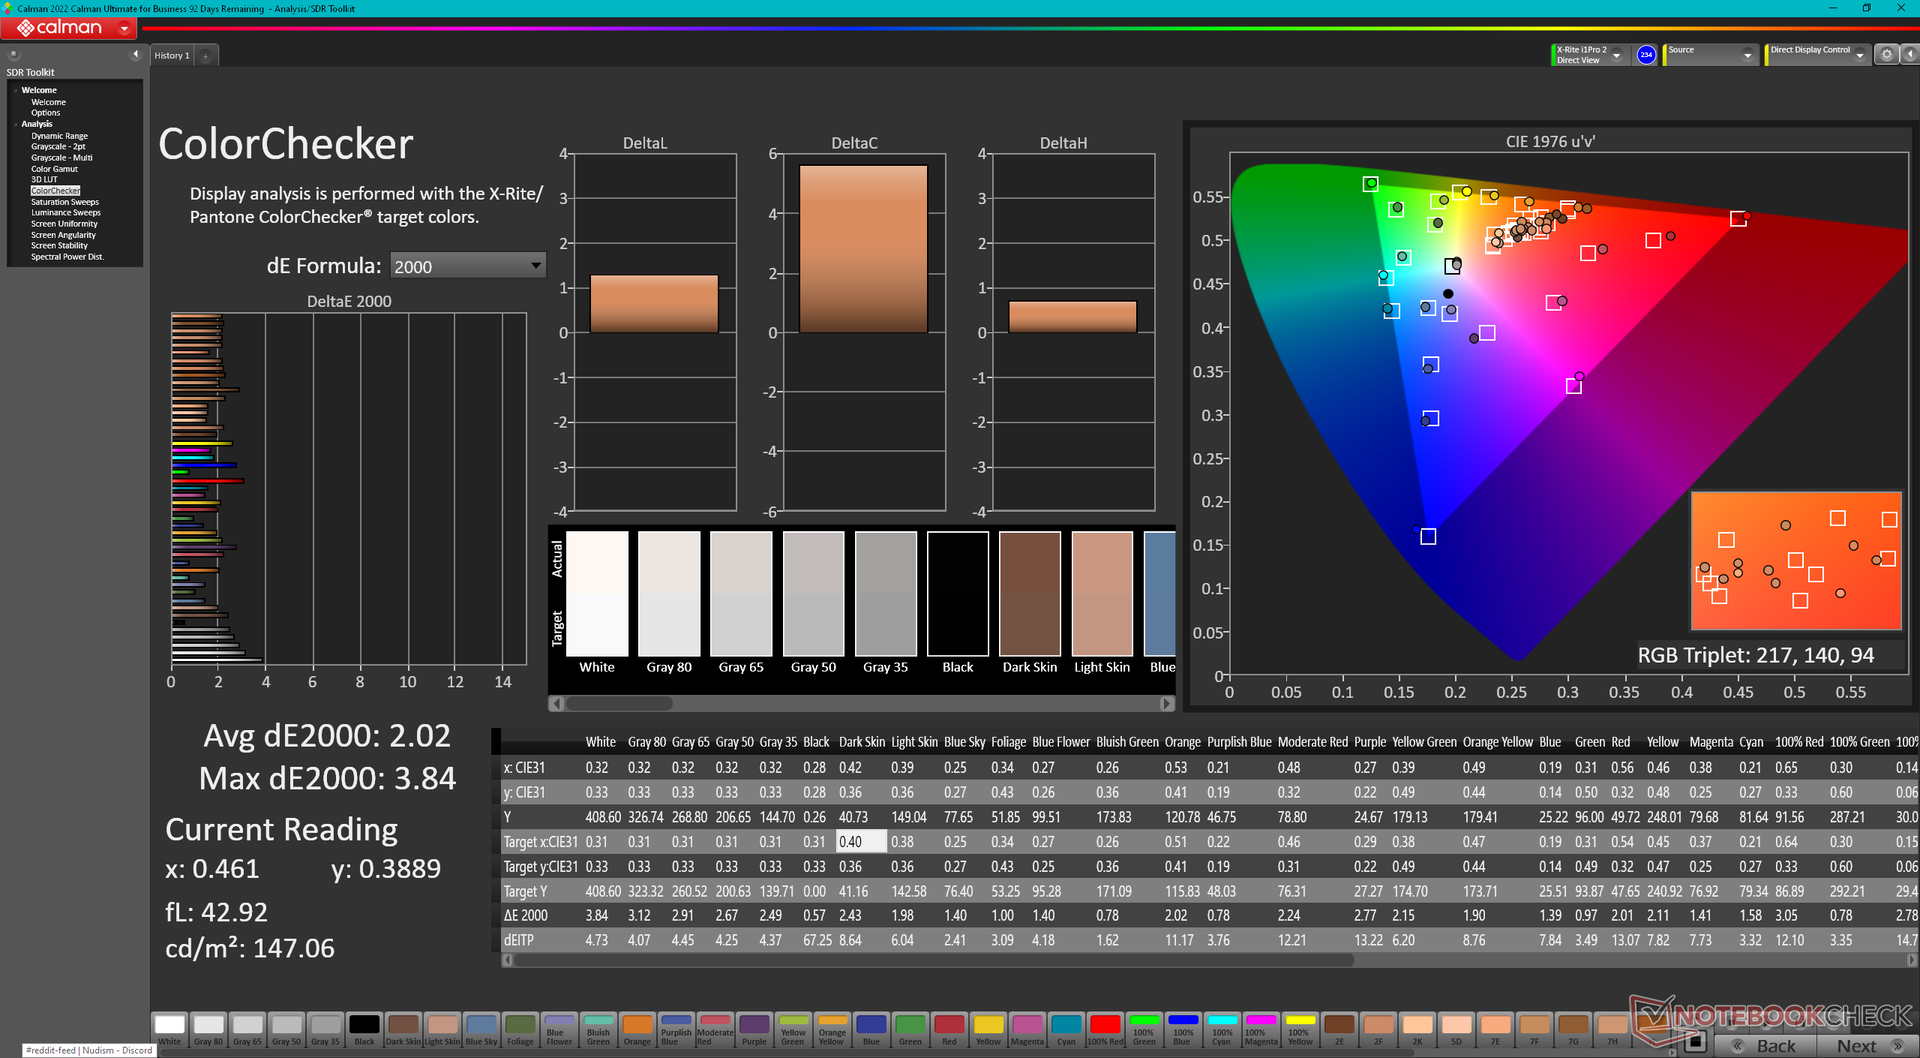
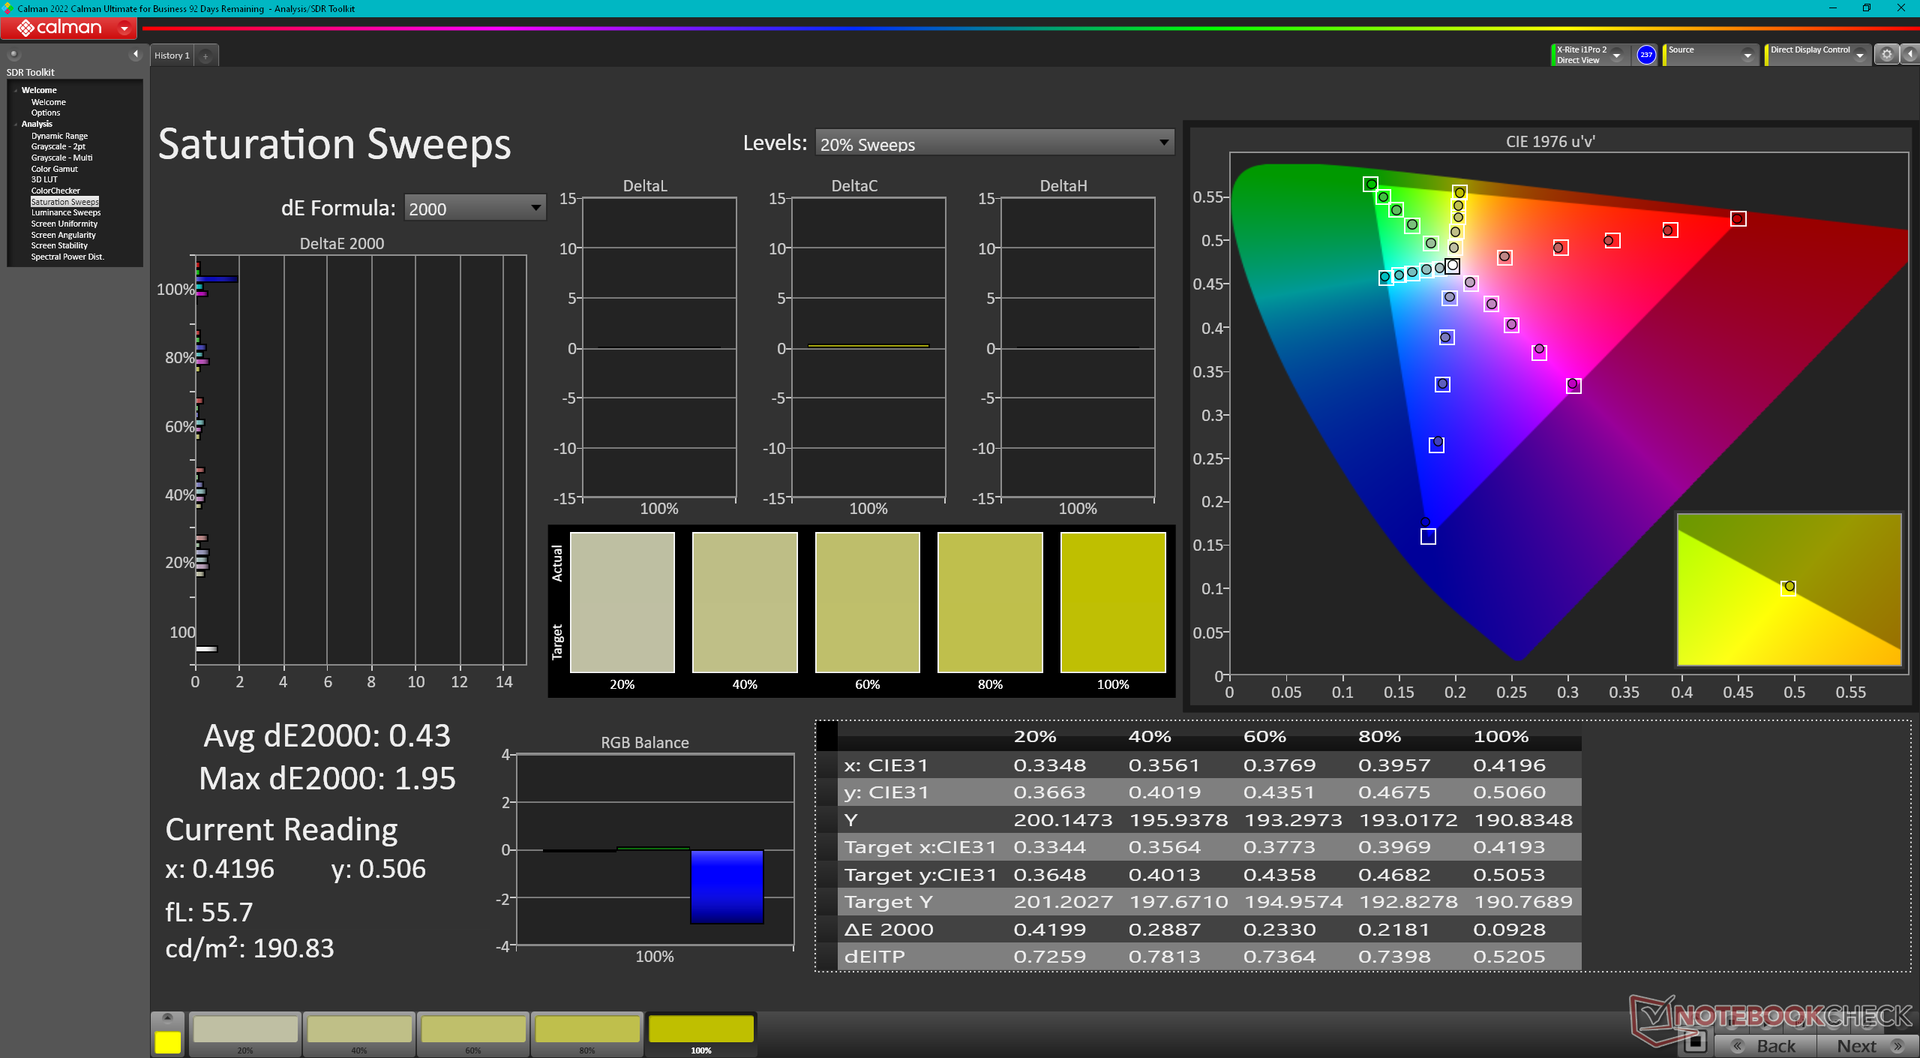
Le modèle offre six options d'affichage allant de l'IPS 1280p à l'OLED 2000p. Les options Touchscreen, Sure View et 1000-nit sont également disponibles, mais seulement pour certaines configurations IPS 1280p. Notre unité de test est livrée avec la dalle Chi Mei CMN13C0 1280p 400-nit de base, identique à celle proposée par HP sur le Dragonfly G3. L'expérience visuelle reste donc identique d'une année sur l'autre.
| |||||||||||||||||||||||||
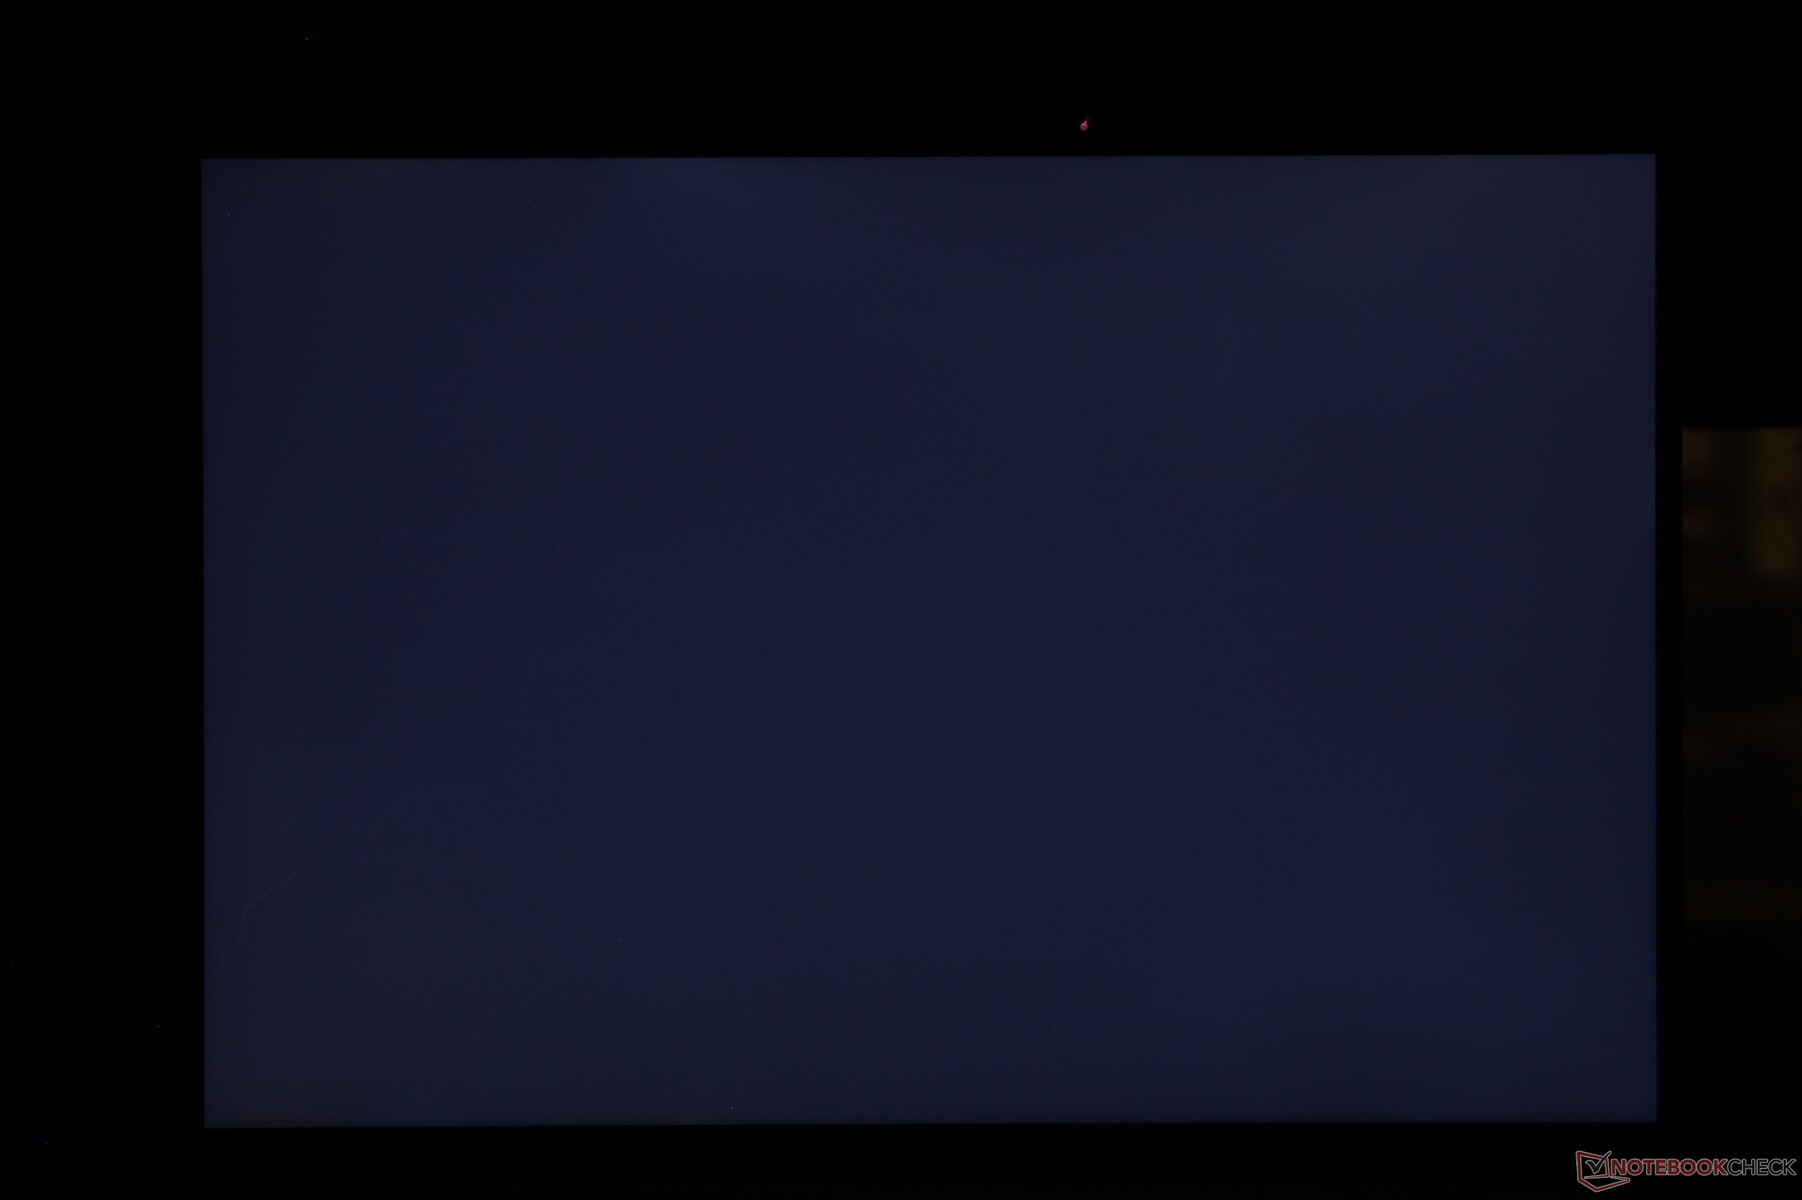
Homogénéité de la luminosité: 90 %
Valeur mesurée au centre, sur batterie: 408.8 cd/m²
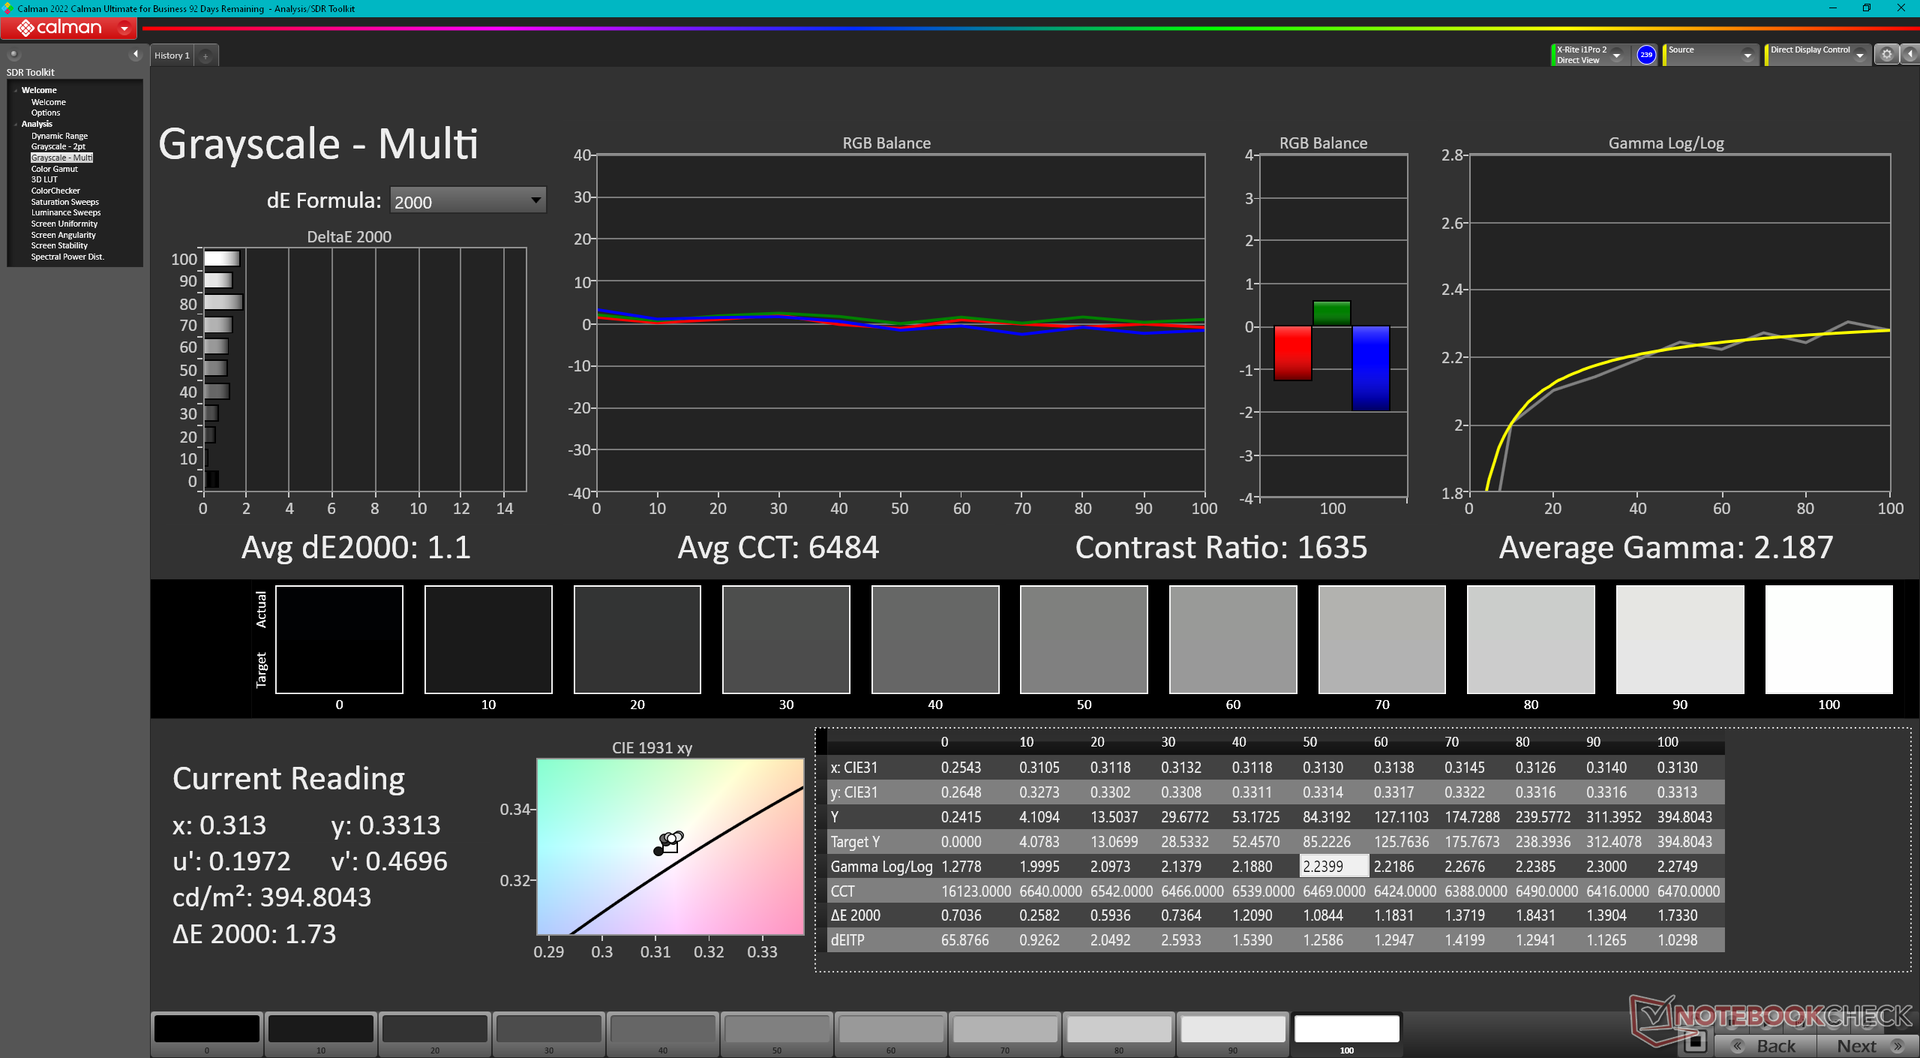
Contraste: 1278:1 (Valeurs des noirs: 0.32 cd/m²)
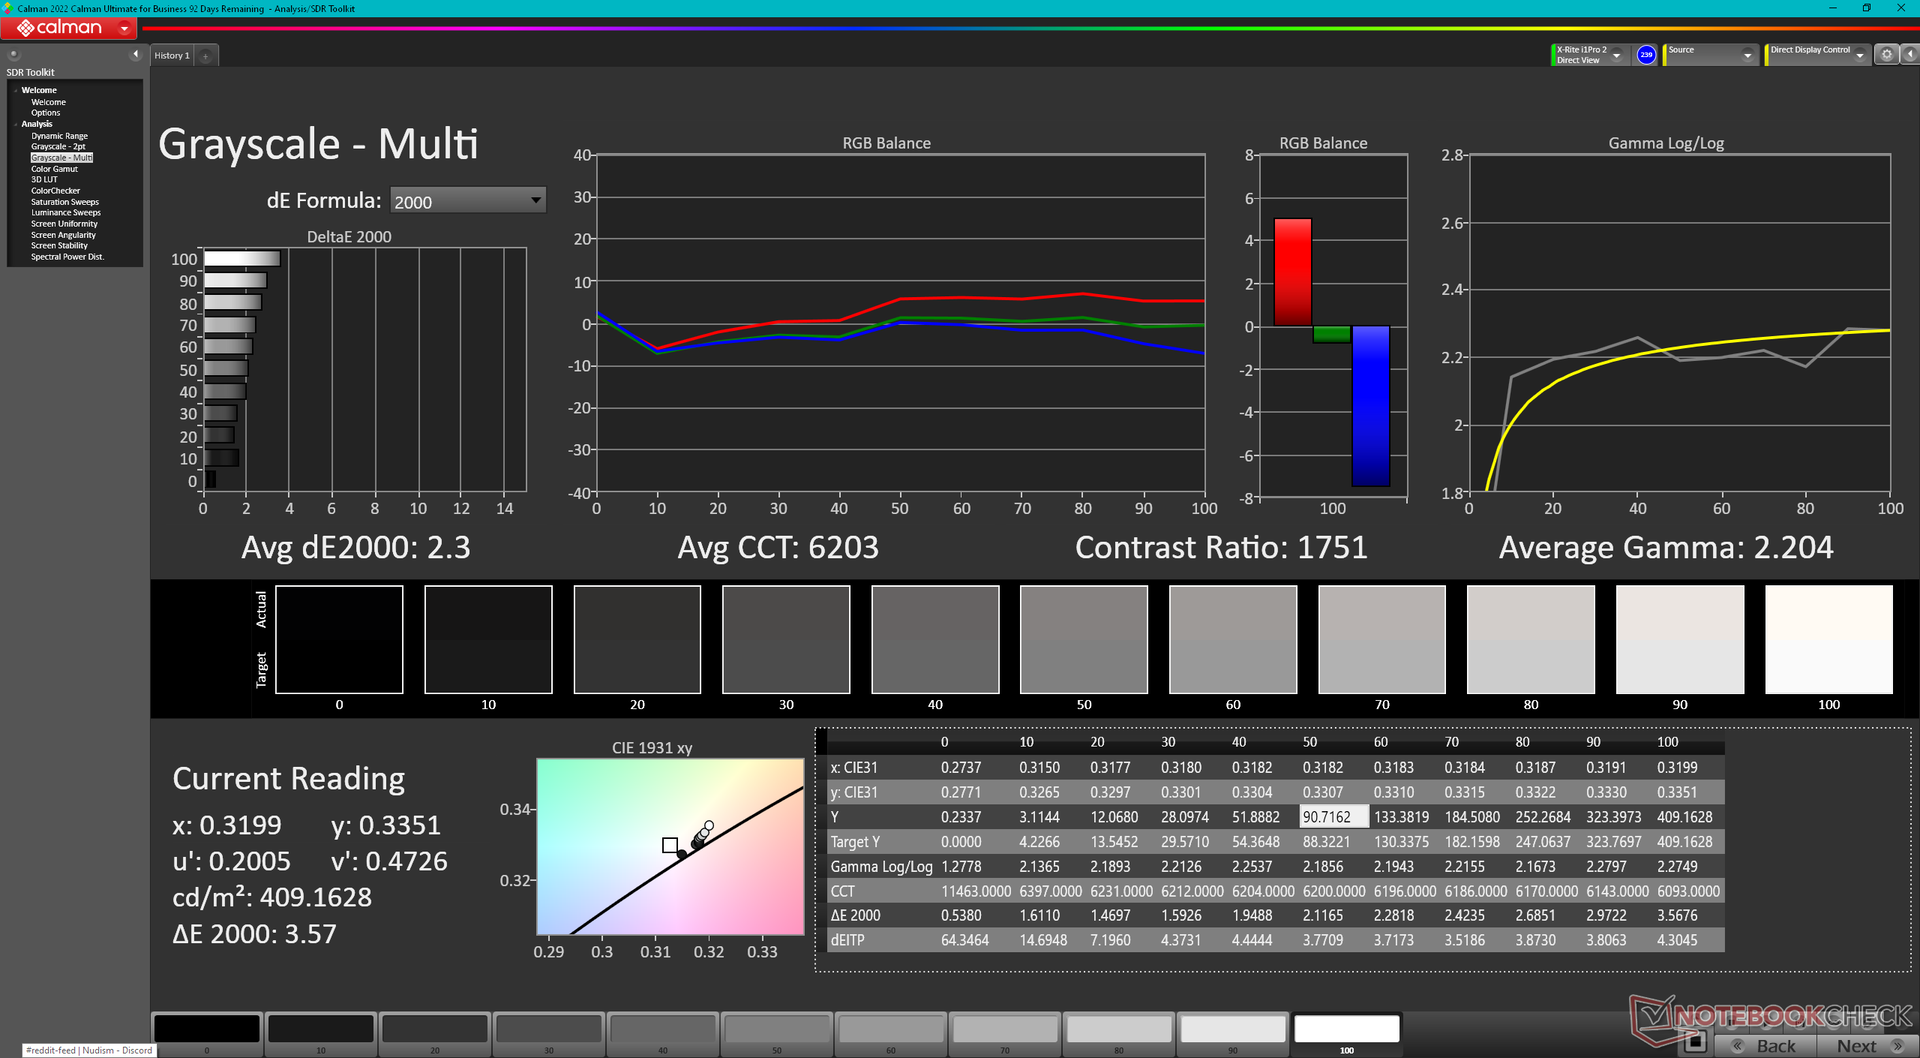
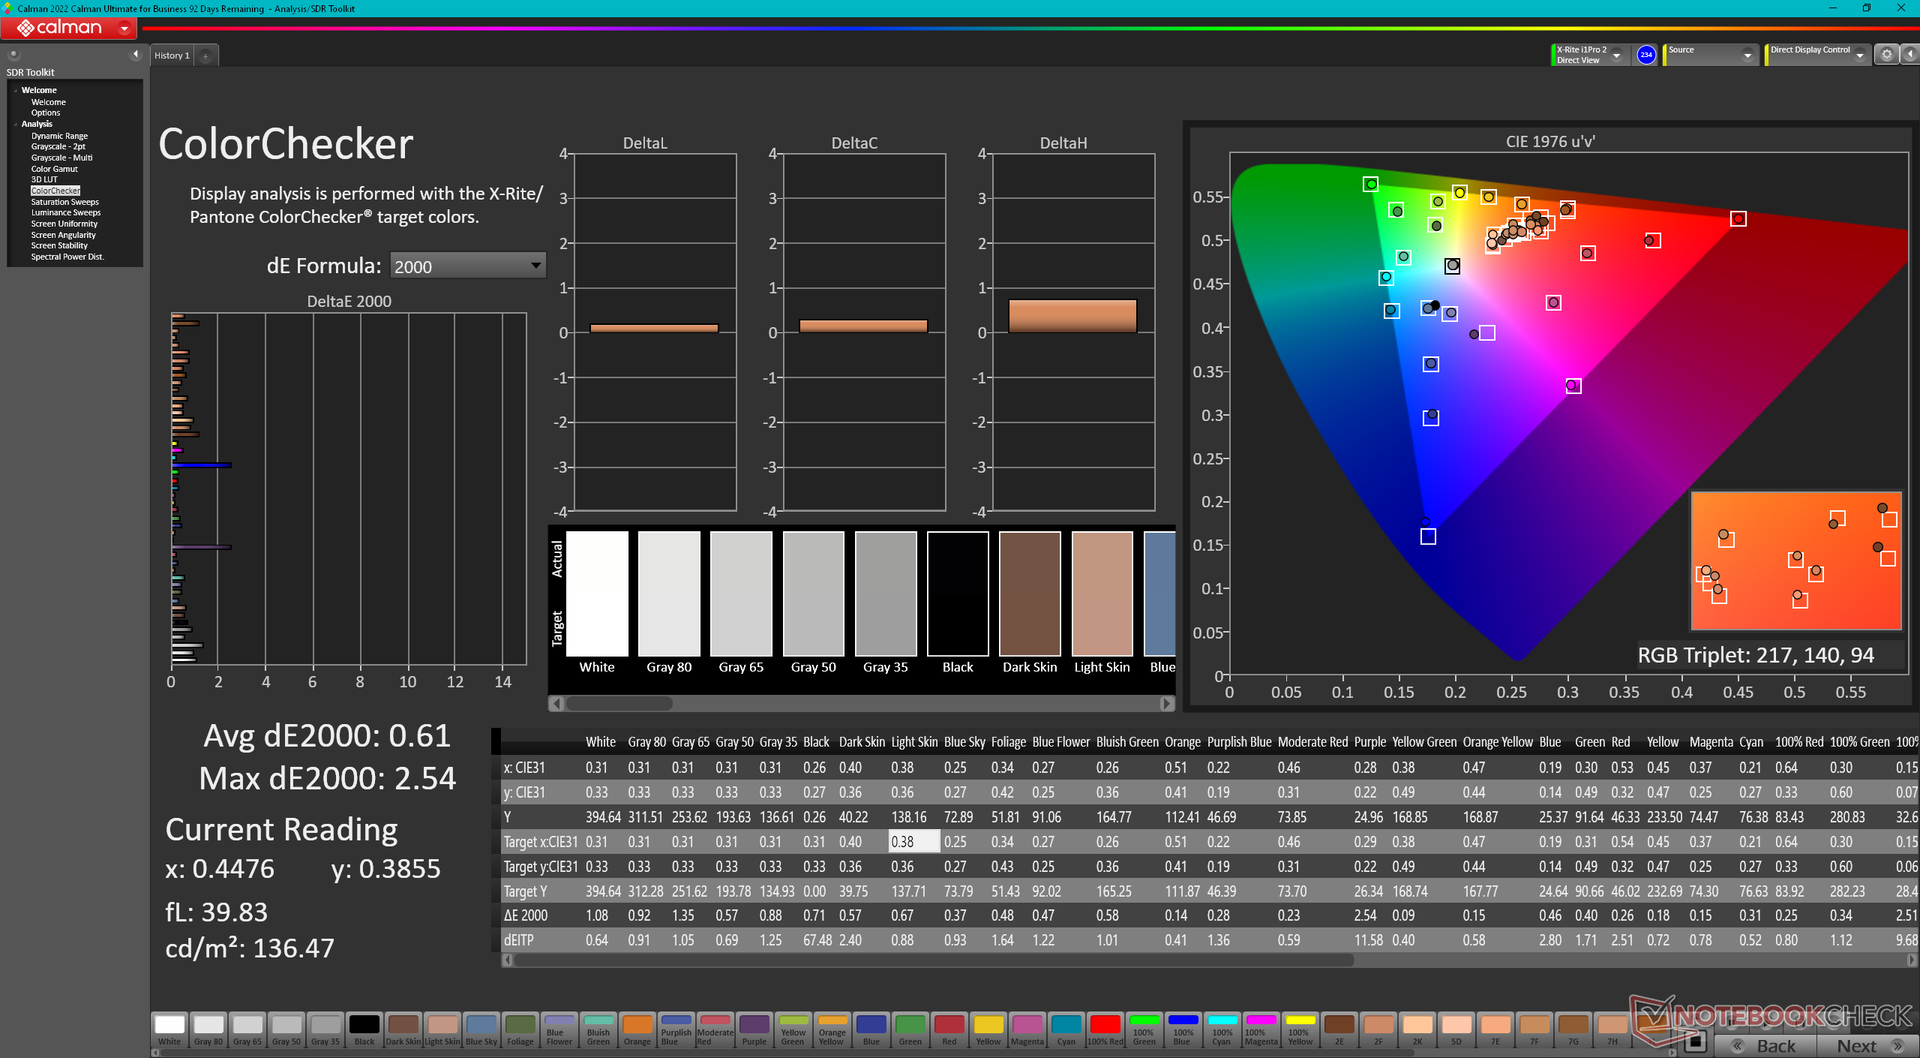
ΔE ColorChecker Calman: 2.02 | ∀{0.5-29.43 Ø4.71}
calibrated: 0.61
ΔE Greyscale Calman: 2.3 | ∀{0.09-98 Ø4.96}
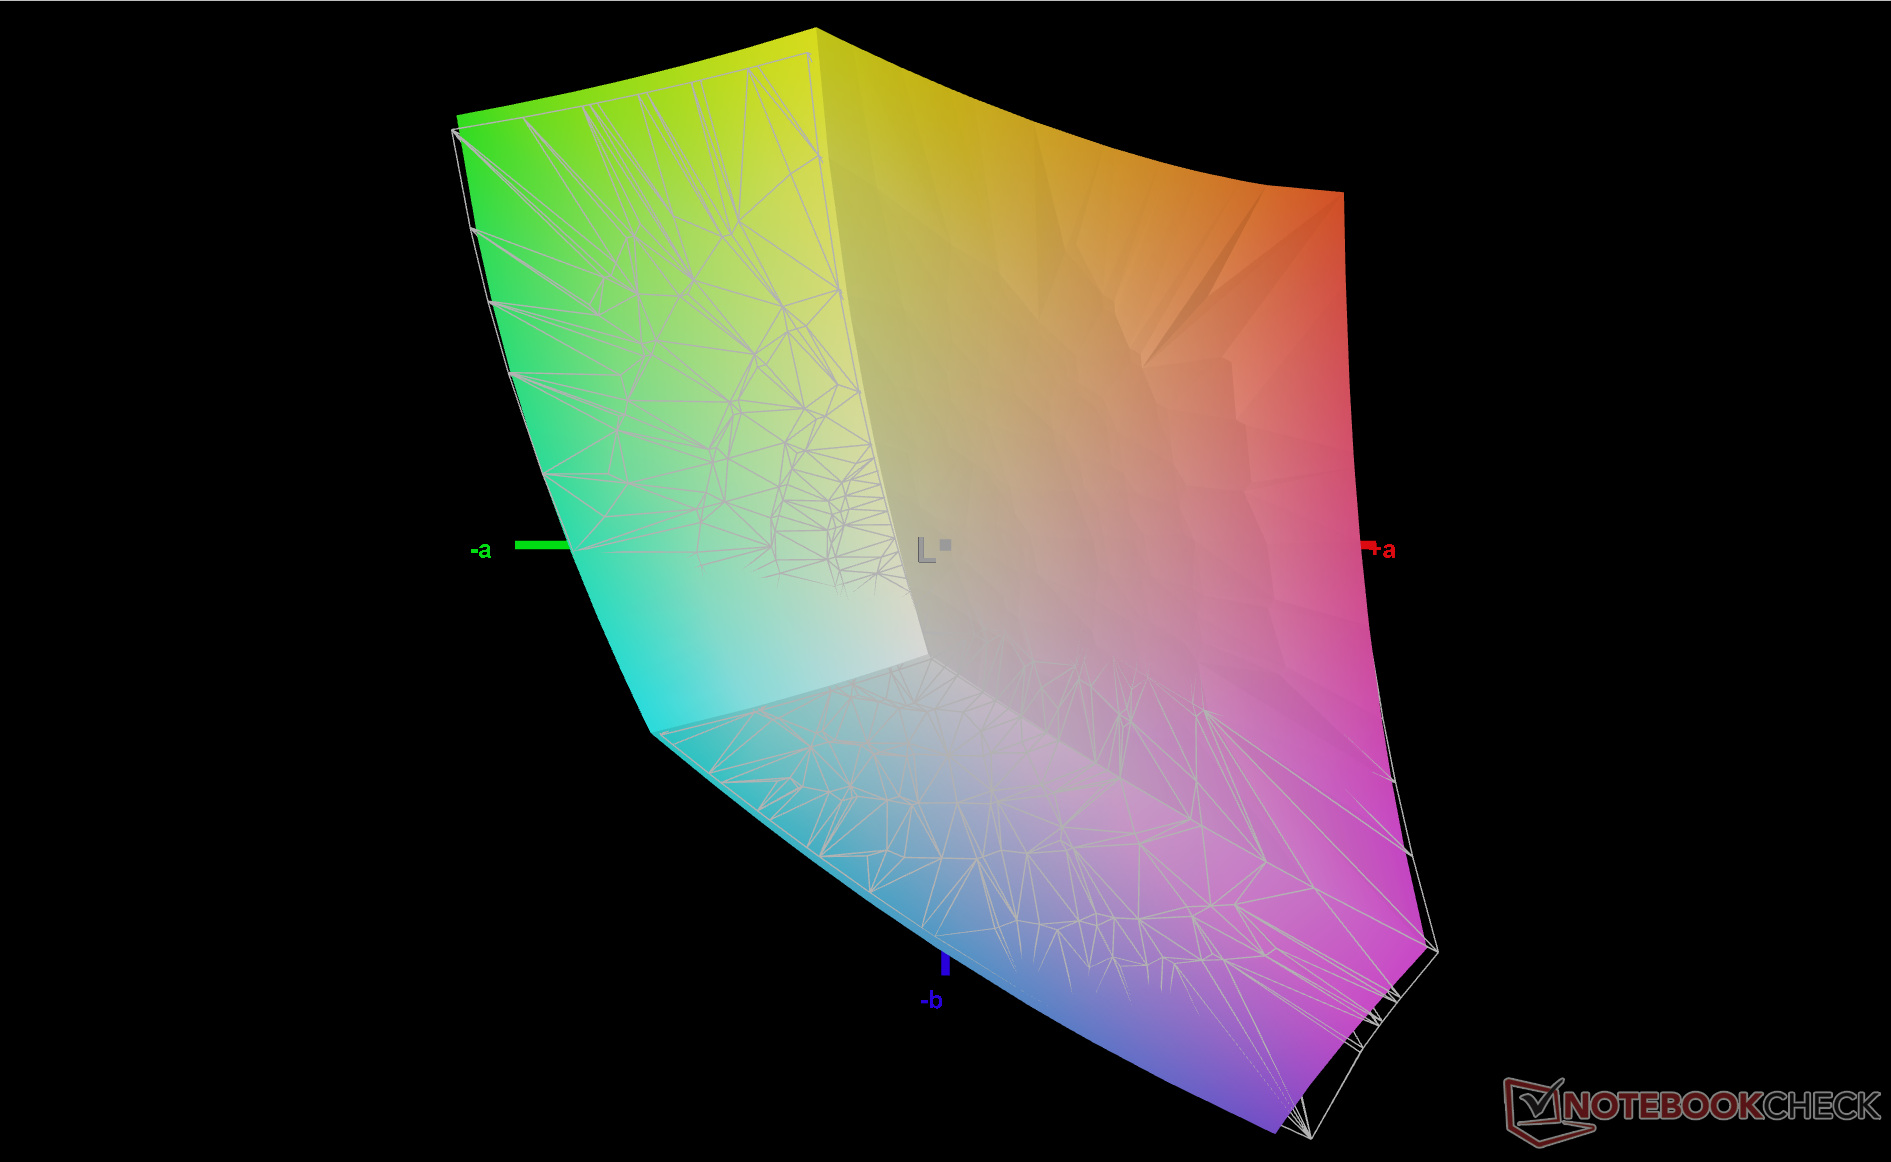
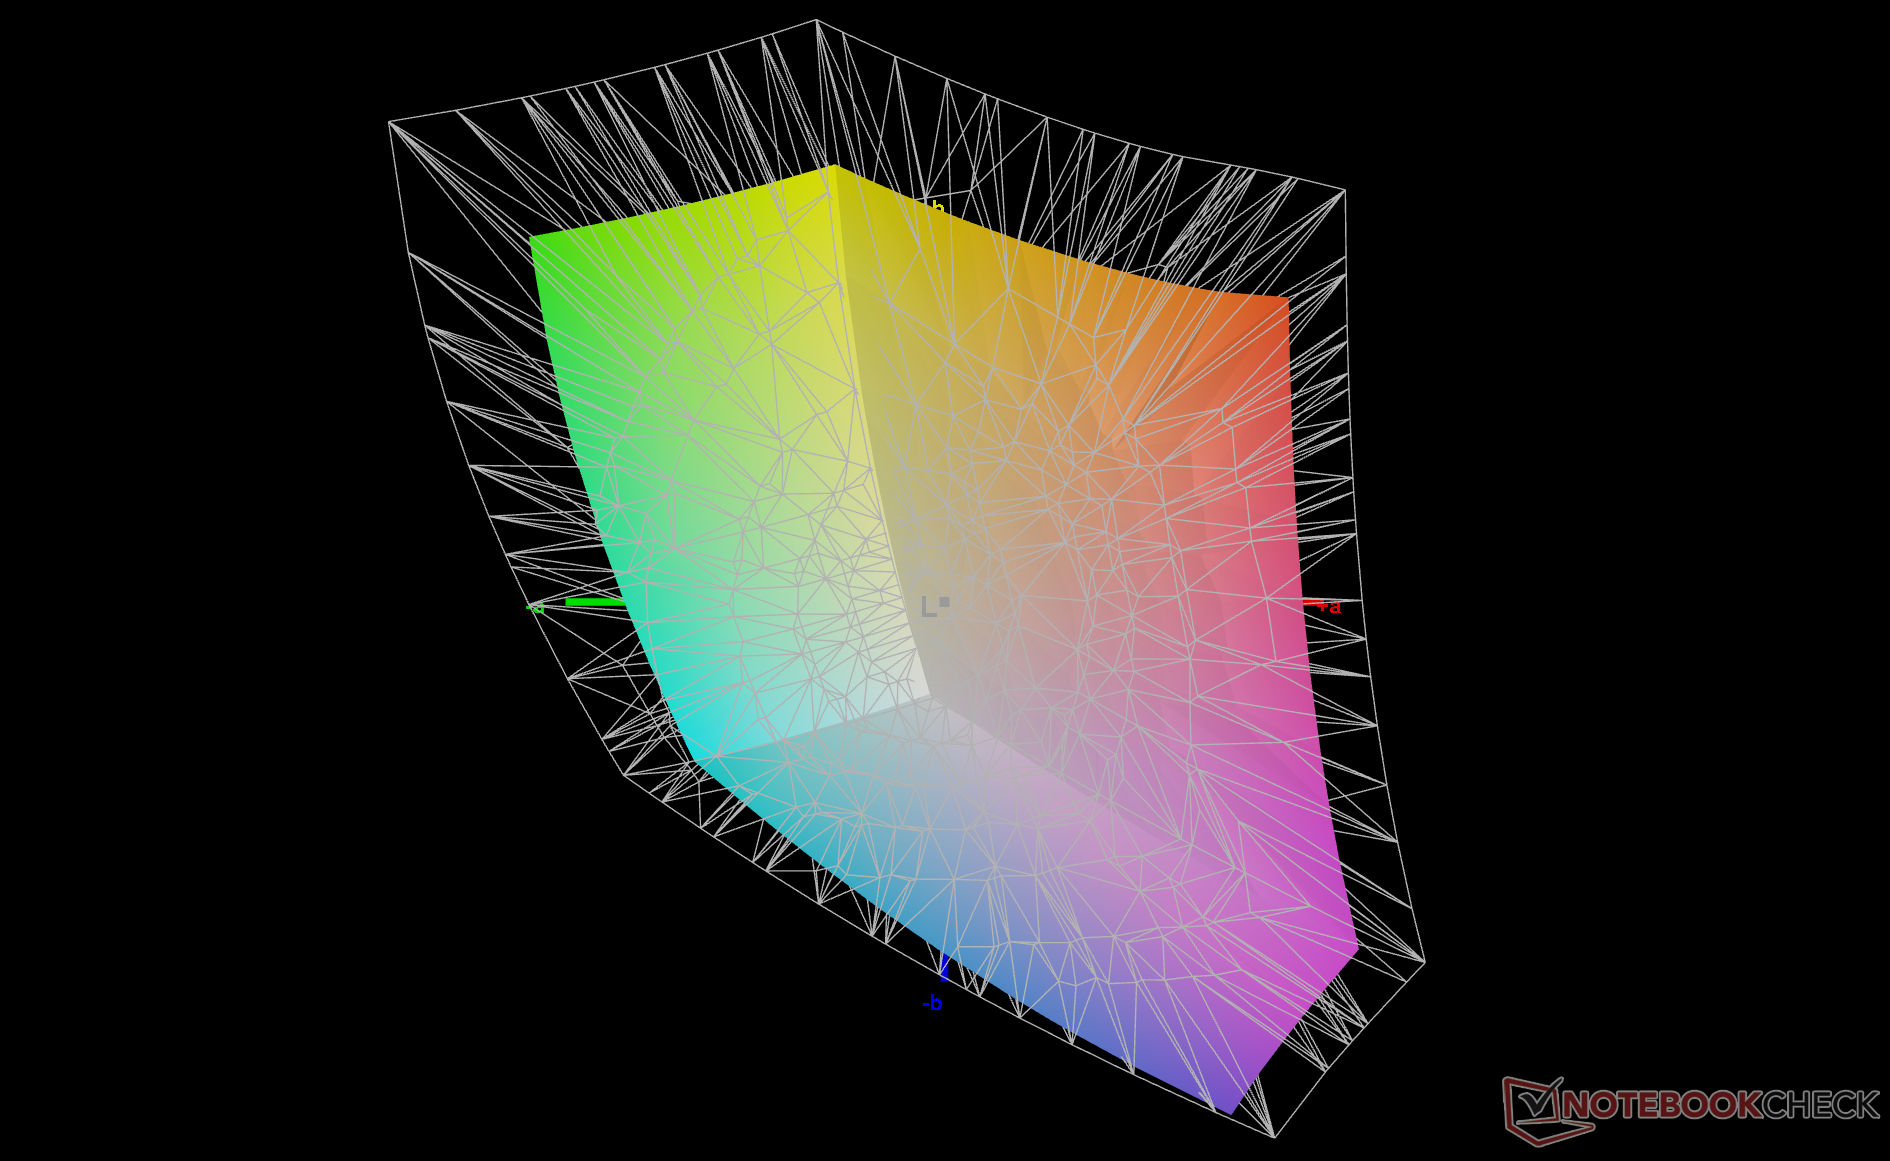
70.4% AdobeRGB 1998 (Argyll 3D)
98.3% sRGB (Argyll 3D)
68.4% Display P3 (Argyll 3D)
Gamma: 2.2
CCT: 6203 K
| HP Dragonfly G4 Chi Mei CMN13C0, IPS, 1920x1280, 13.5" | HP Elite Dragonfly G3 Chi Mei CMN13C0, IPS, 1920x1280, 13.5" | Framework Laptop 13.5 13th Gen Intel BOE CQ NE135FBM-N41, IPS, 2256x1504, 13.5" | Lenovo ThinkPad X13 G3 21CM002UGE M133NW4J R3, IPS LED, 1920x1200, 13.3" | Dell Latitude 9330 AU Optronics B133QAA, IPS, 2560x1600, 13.3" | Apple MacBook Air M2 Entry IPS, 2560x1664, 13.6" | |
|---|---|---|---|---|---|---|
| Display | -1% | 0% | 0% | 9% | 23% | |
| Display P3 Coverage (%) | 68.4 | 68 -1% | 68.9 1% | 69 1% | 77.8 14% | 98.4 44% |
| sRGB Coverage (%) | 98.3 | 98.3 0% | 97.5 -1% | 98.4 0% | 99.9 2% | 99.9 2% |
| AdobeRGB 1998 Coverage (%) | 70.4 | 69.9 -1% | 71.1 1% | 70.3 0% | 77.5 10% | 87.6 24% |
| Response Times | -8% | -10% | 10% | -50% | 27% | |
| Response Time Grey 50% / Grey 80% * (ms) | 48.8 ? | 50.8 ? -4% | 54.9 ? -13% | 44.2 ? 9% | 67.6 ? -39% | 32.9 ? 33% |
| Response Time Black / White * (ms) | 31.3 ? | 35.2 ? -12% | 33.5 ? -7% | 28.1 ? 10% | 50.4 ? -61% | 24.9 ? 20% |
| PWM Frequency (Hz) | ||||||
| Screen | -7% | -36% | 0% | -12% | 11% | |
| Brightness middle (cd/m²) | 408.8 | 387.2 -5% | 503 23% | 348 -15% | 542.3 33% | 526 29% |
| Brightness (cd/m²) | 399 | 360 -10% | 472 18% | 321 -20% | 516 29% | 486 22% |
| Brightness Distribution (%) | 90 | 80 -11% | 87 -3% | 85 -6% | 85 -6% | 87 -3% |
| Black Level * (cd/m²) | 0.32 | 0.26 19% | 0.36 -13% | 0.34 -6% | 0.38 -19% | 0.38 -19% |
| Contrast (:1) | 1278 | 1489 17% | 1397 9% | 1024 -20% | 1427 12% | 1384 8% |
| Colorchecker dE 2000 * | 2.02 | 2.36 -17% | 3.38 -67% | 1.3 36% | 3.18 -57% | 1.3 36% |
| Colorchecker dE 2000 max. * | 3.84 | 4.79 -25% | 7.08 -84% | 2.5 35% | 6.05 -58% | 2.7 30% |
| Colorchecker dE 2000 calibrated * | 0.61 | 0.63 -3% | 1.21 -98% | 1 -64% | 0.67 -10% | 0.7 -15% |
| Greyscale dE 2000 * | 2.3 | 3 -30% | 4.8 -109% | 0.9 61% | 3.1 -35% | 2 13% |
| Gamma | 2.2 100% | 2.17 101% | 2.13 103% | 2.16 102% | 2.08 106% | 2.25 98% |
| CCT | 6203 105% | 6137 106% | 6235 104% | 6431 101% | 6140 106% | 6858 95% |
| Moyenne finale (programmes/paramètres) | -5% /
-6% | -15% /
-25% | 3% /
2% | -18% /
-13% | 20% /
16% |
* ... Moindre est la valeur, meilleures sont les performances
L'écran est bien calibré dès sa sortie de l'emballage, même si HP n'annonce pas de calibrage en usine. L'étalonnage de l'écran à l'aide d'un colorimètre X-Rite améliorerait encore davantage les valeurs moyennes d'échelle de gris et de couleur deltaE, qui passeraient de 2,3 et 2,02 à seulement 1,1 et 0,61, respectivement. Les utilisateurs peuvent télécharger et appliquer notre profil ICM calibré ci-dessus.
Temps de réponse de l'écran
| ↔ Temps de réponse noir à blanc | ||
|---|---|---|
| 31.3 ms ... hausse ↗ et chute ↘ combinées | ↗ 16.3 ms hausse | 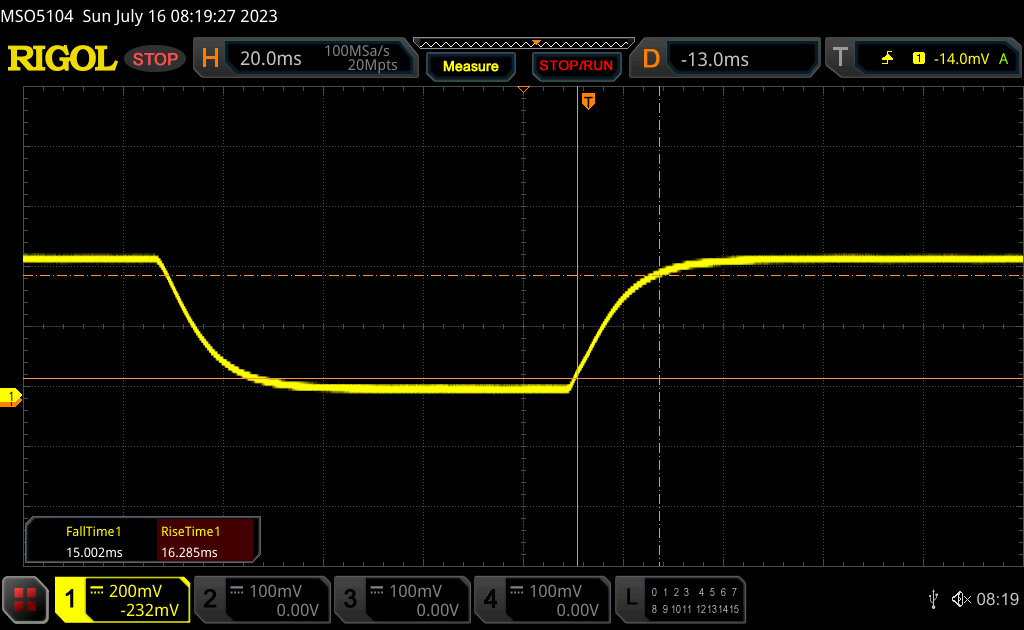 |
| ↘ 15 ms chute | ||
| L'écran souffre de latences très élevées, à éviter pour le jeu. En comparaison, tous les appareils testés affichent entre 0.1 (minimum) et 240 (maximum) ms. » 85 % des appareils testés affichent de meilleures performances. Cela signifie que les latences relevées sont moins bonnes que la moyenne (19.8 ms) de tous les appareils testés. | ||
| ↔ Temps de réponse gris 50% à gris 80% | ||
| 48.8 ms ... hausse ↗ et chute ↘ combinées | ↗ 22.9 ms hausse | 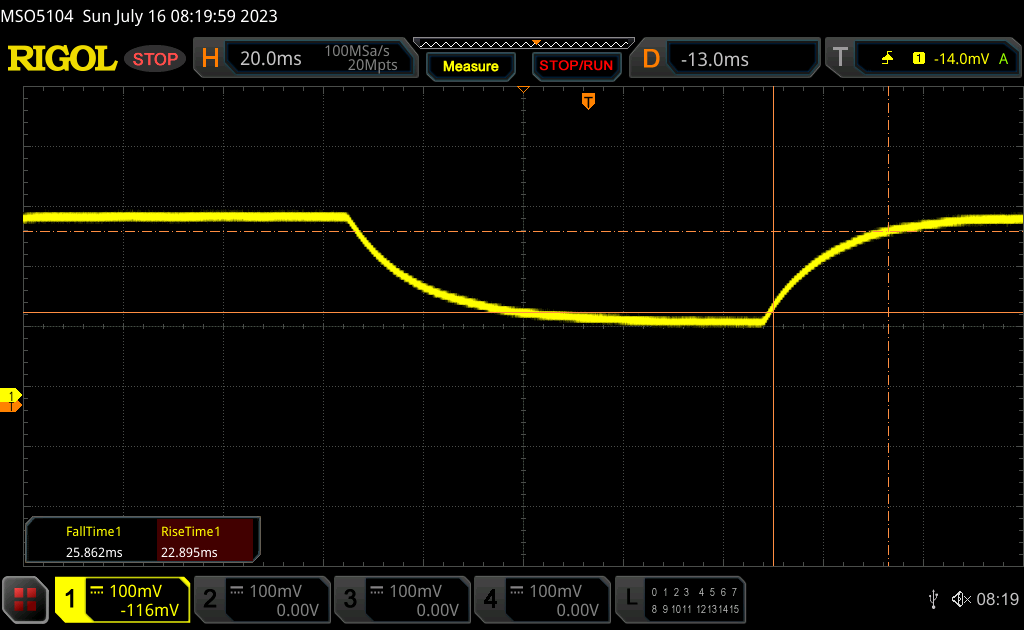 |
| ↘ 25.9 ms chute | ||
| L'écran souffre de latences très élevées, à éviter pour le jeu. En comparaison, tous les appareils testés affichent entre 0.165 (minimum) et 636 (maximum) ms. » 84 % des appareils testés affichent de meilleures performances. Cela signifie que les latences relevées sont moins bonnes que la moyenne (31 ms) de tous les appareils testés. | ||
Scintillement / MLI (Modulation de largeur d'impulsion)
| Scintillement / MLI (Modulation de largeur d'impulsion) non décelé | 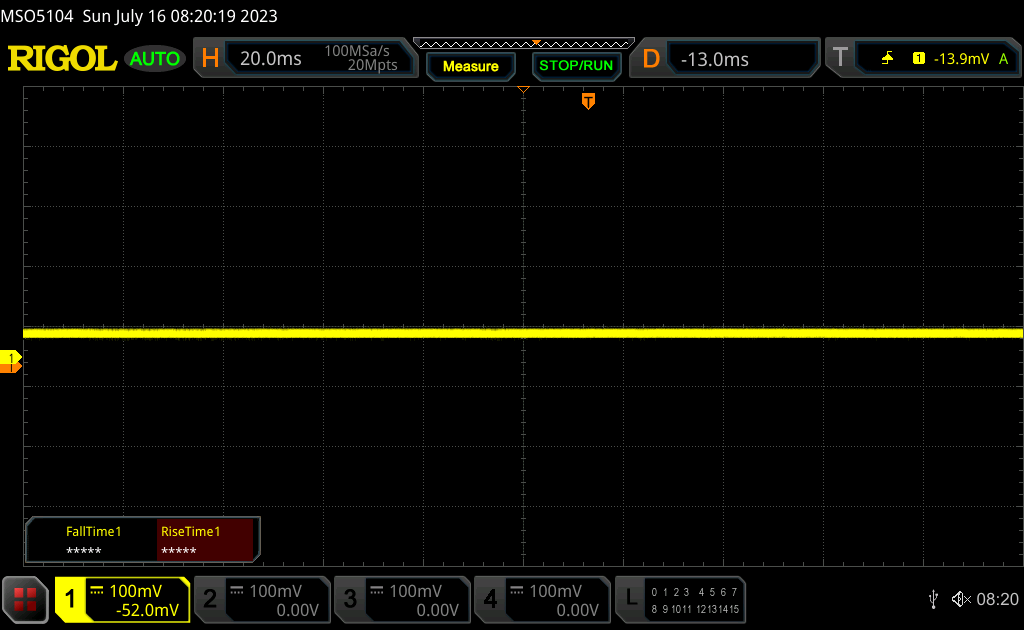 | ||
En comparaison, 52 % des appareils testés n'emploient pas MDI pour assombrir leur écran. Nous avons relevé une moyenne à 7754 (minimum : 5 - maximum : 343500) Hz dans le cas où une MDI était active. | |||
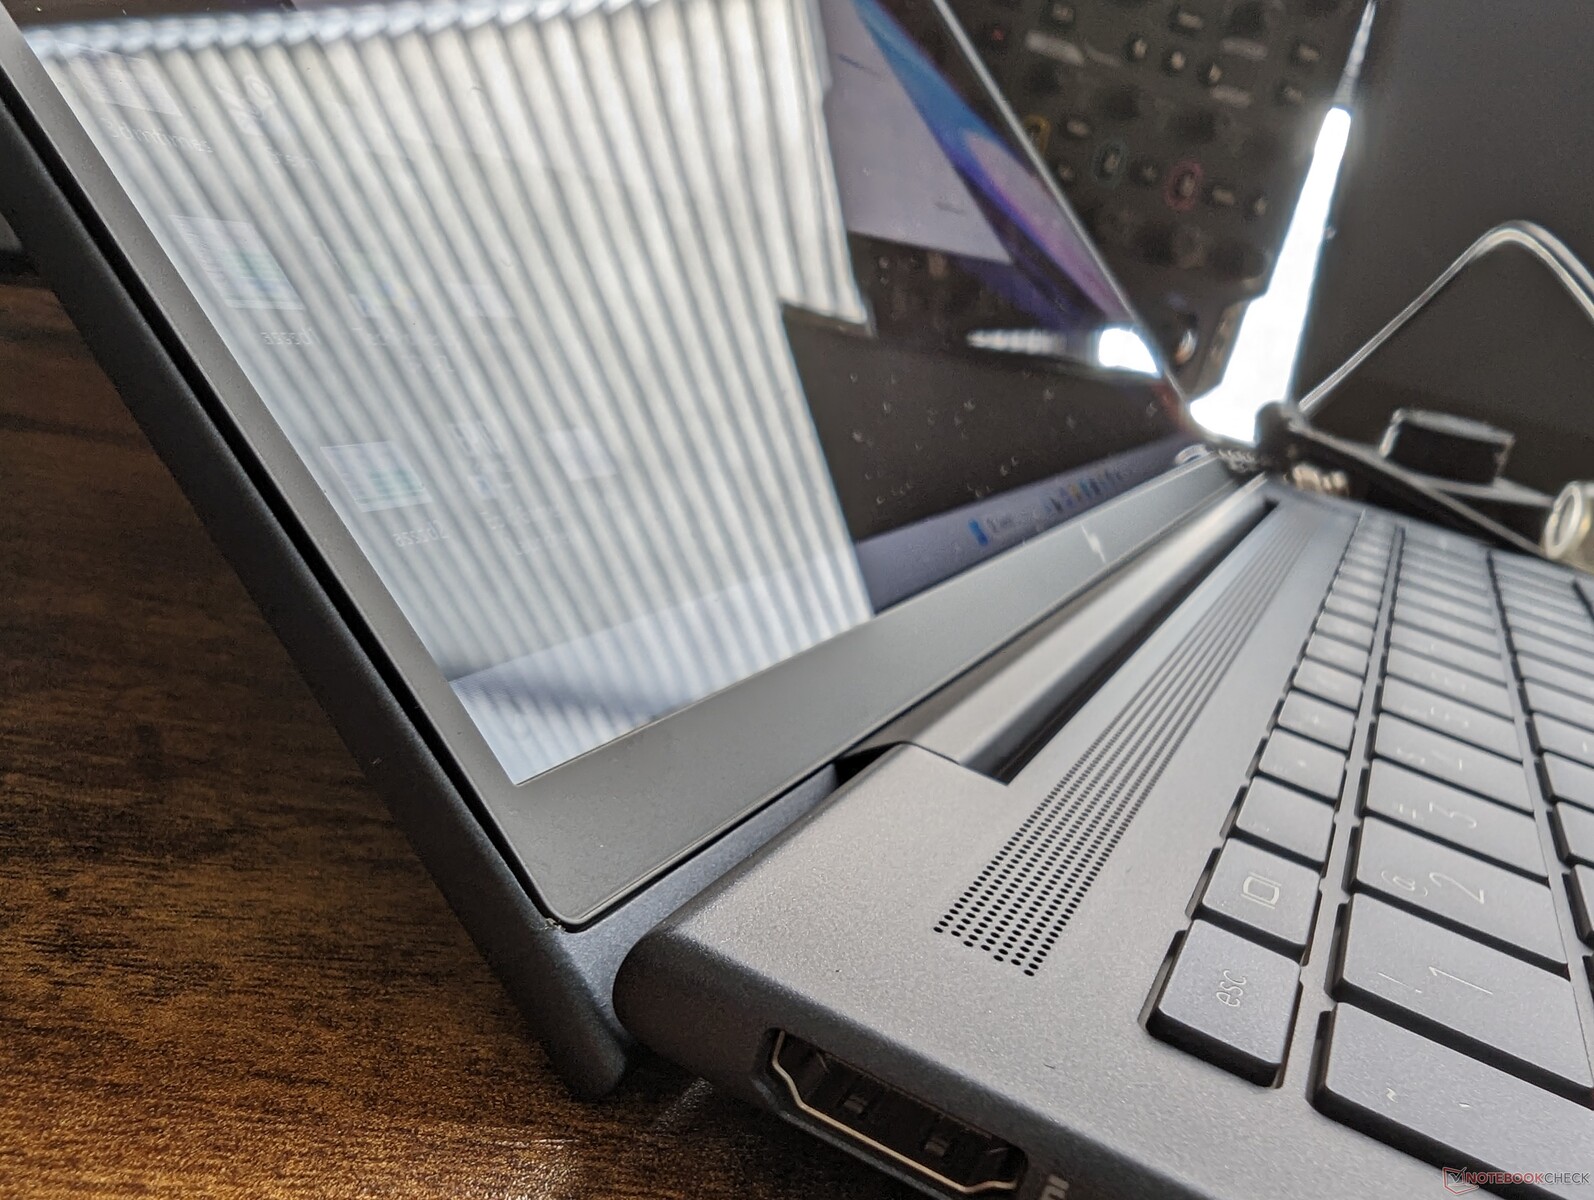
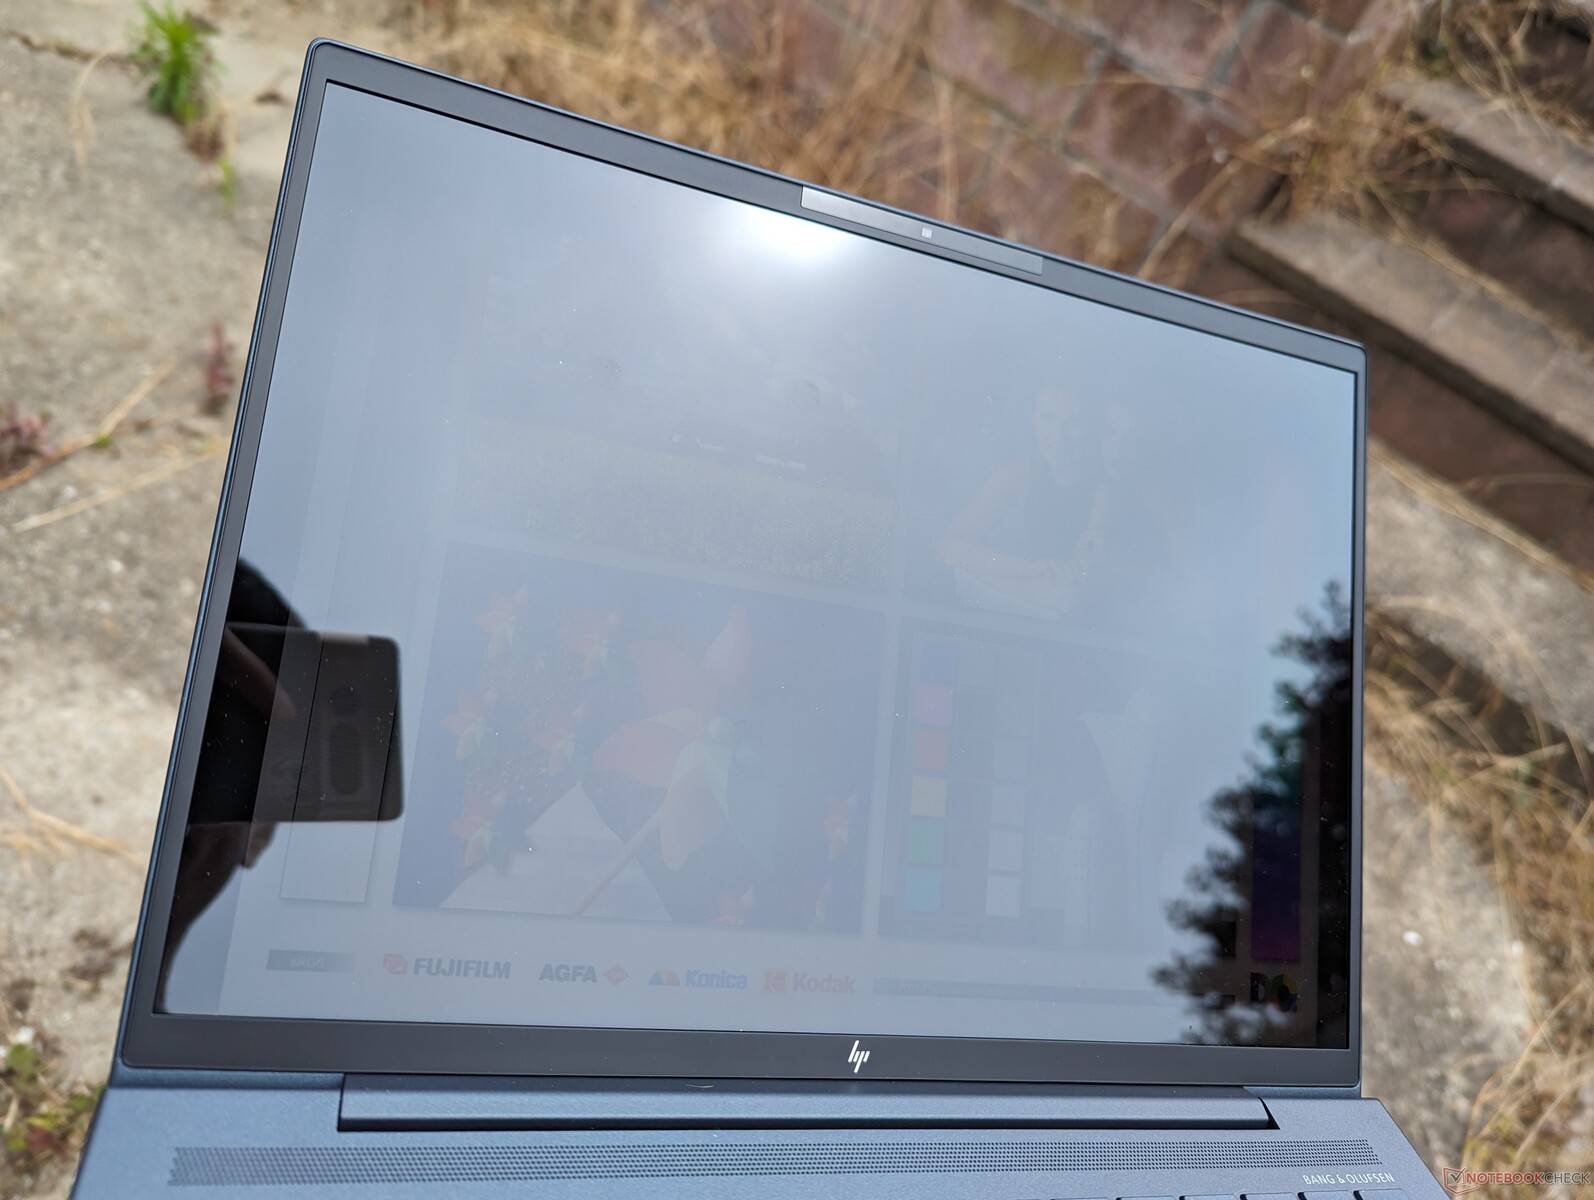
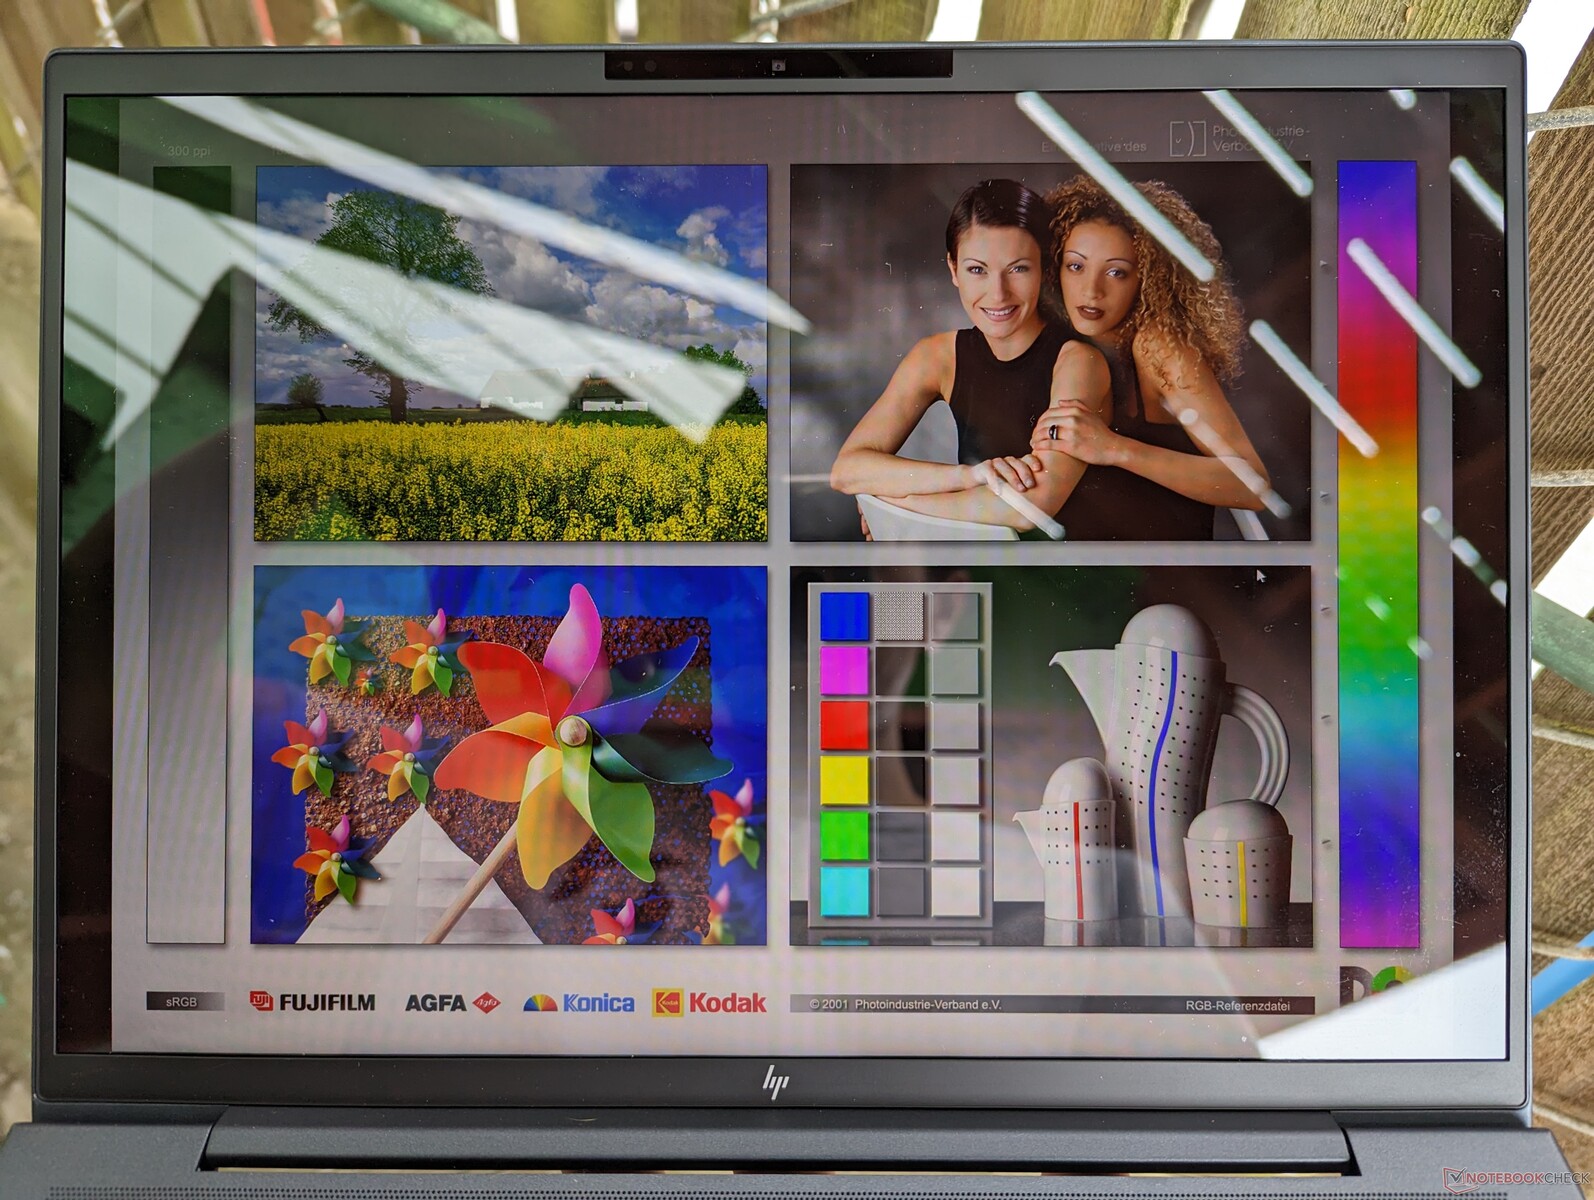
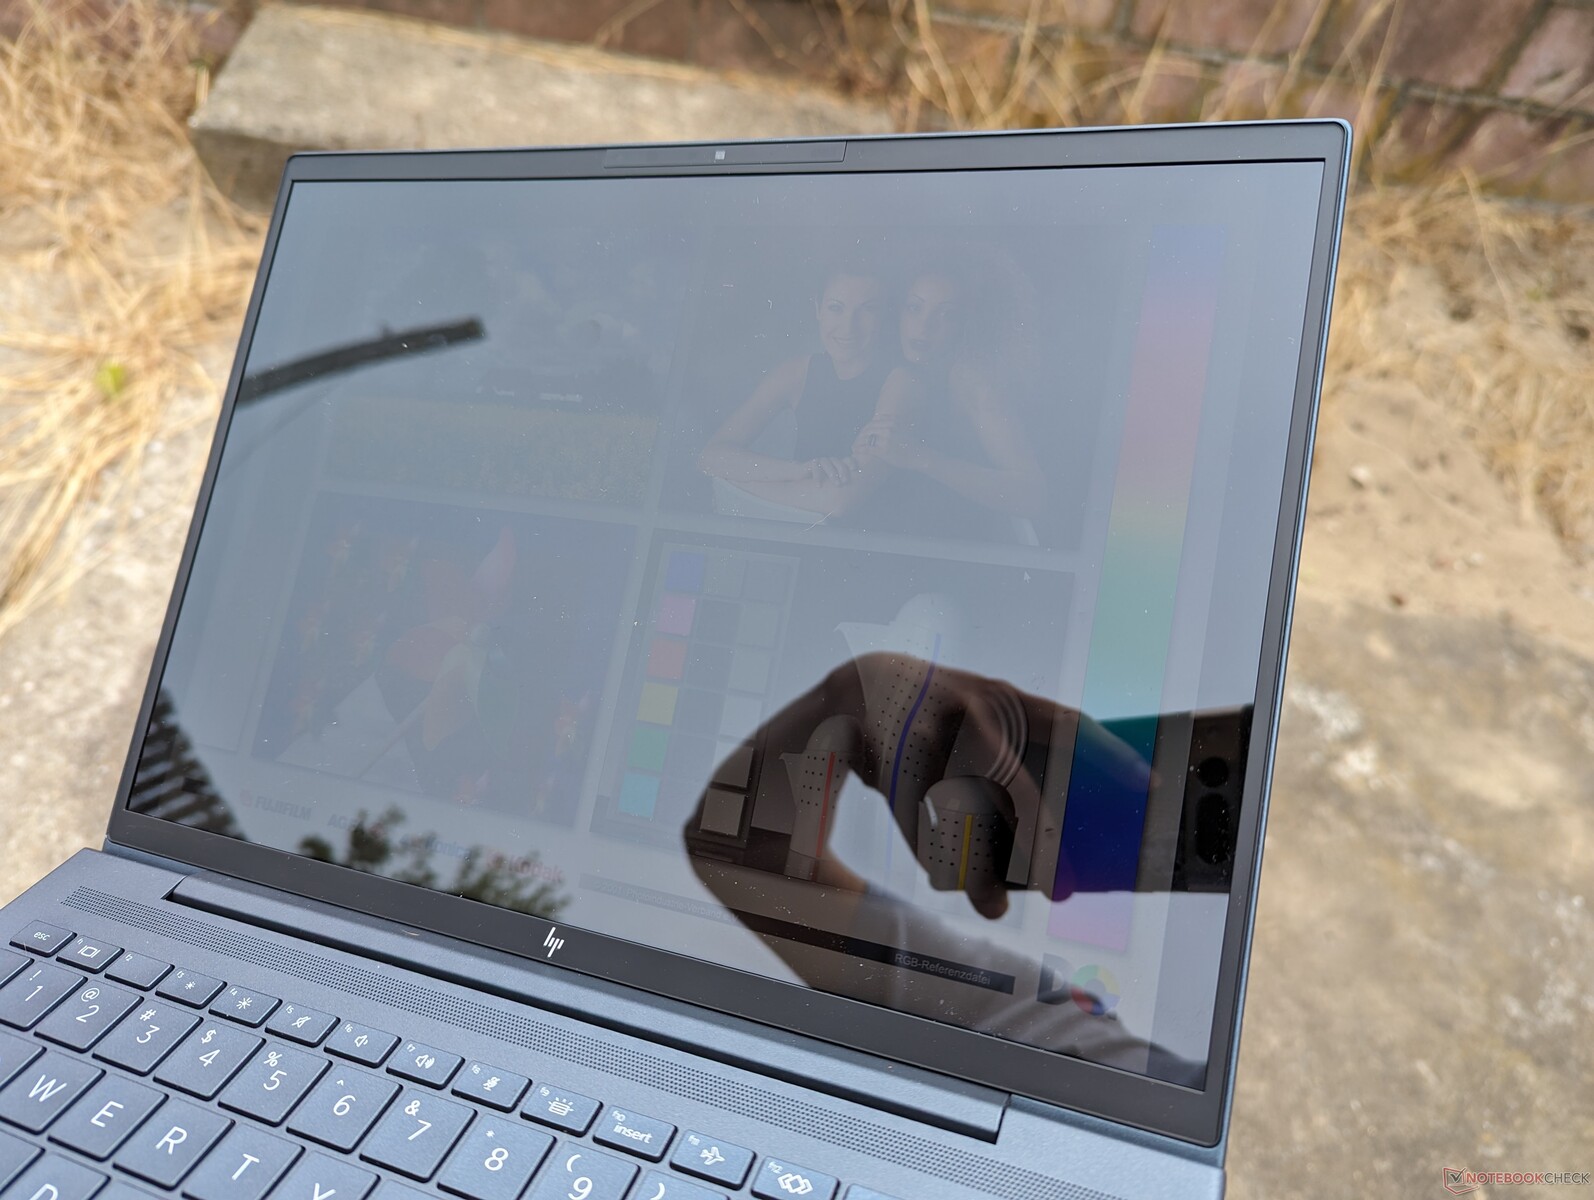
La surcouche super brillante et les reflets qui en découlent nuisent à la visibilité en extérieur. Heureusement, HP continue d'être l'un des seuls grands fabricants à proposer des options d'écran 1000 nits pour être jusqu'à deux fois plus lumineux que la plupart des autres sous-ordinateurs portables professionnels.
Performance
Conditions d'essai
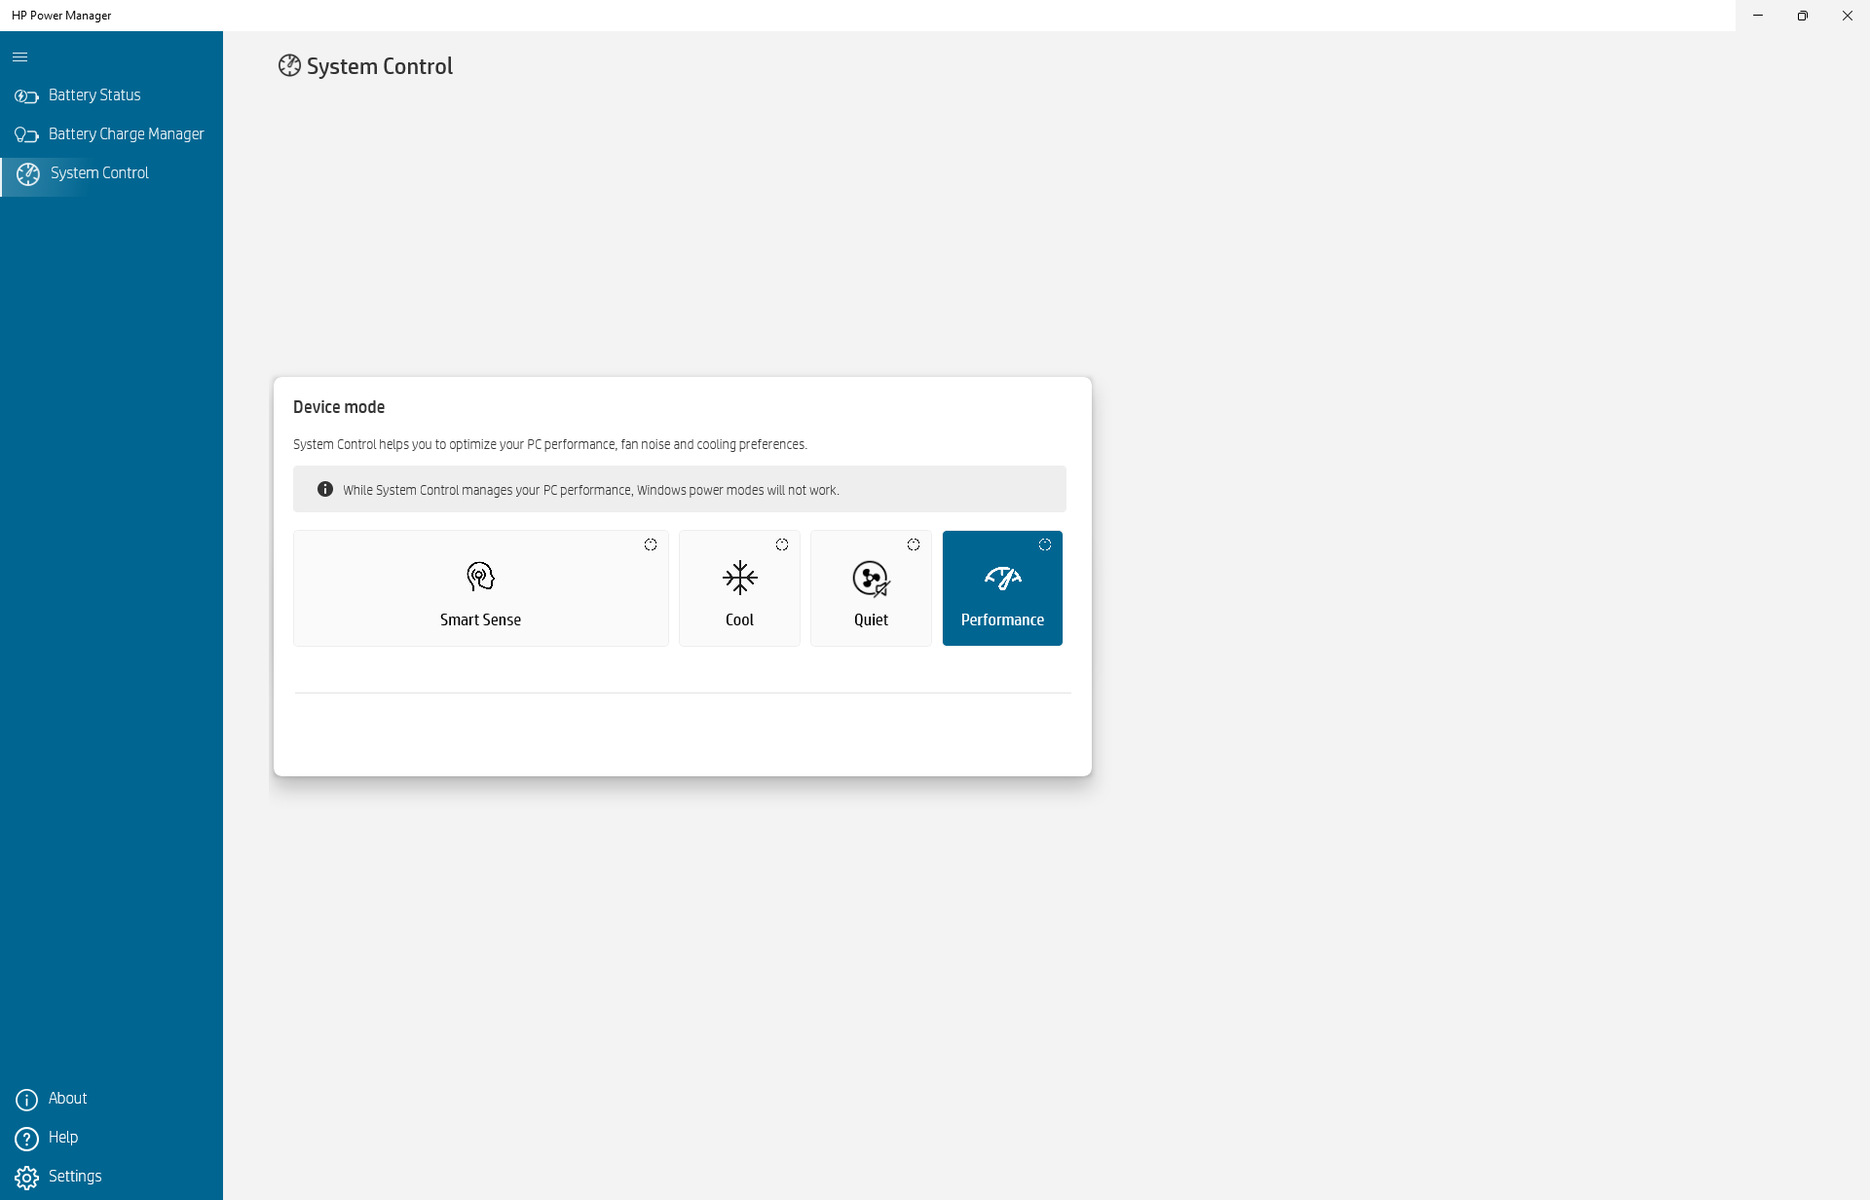
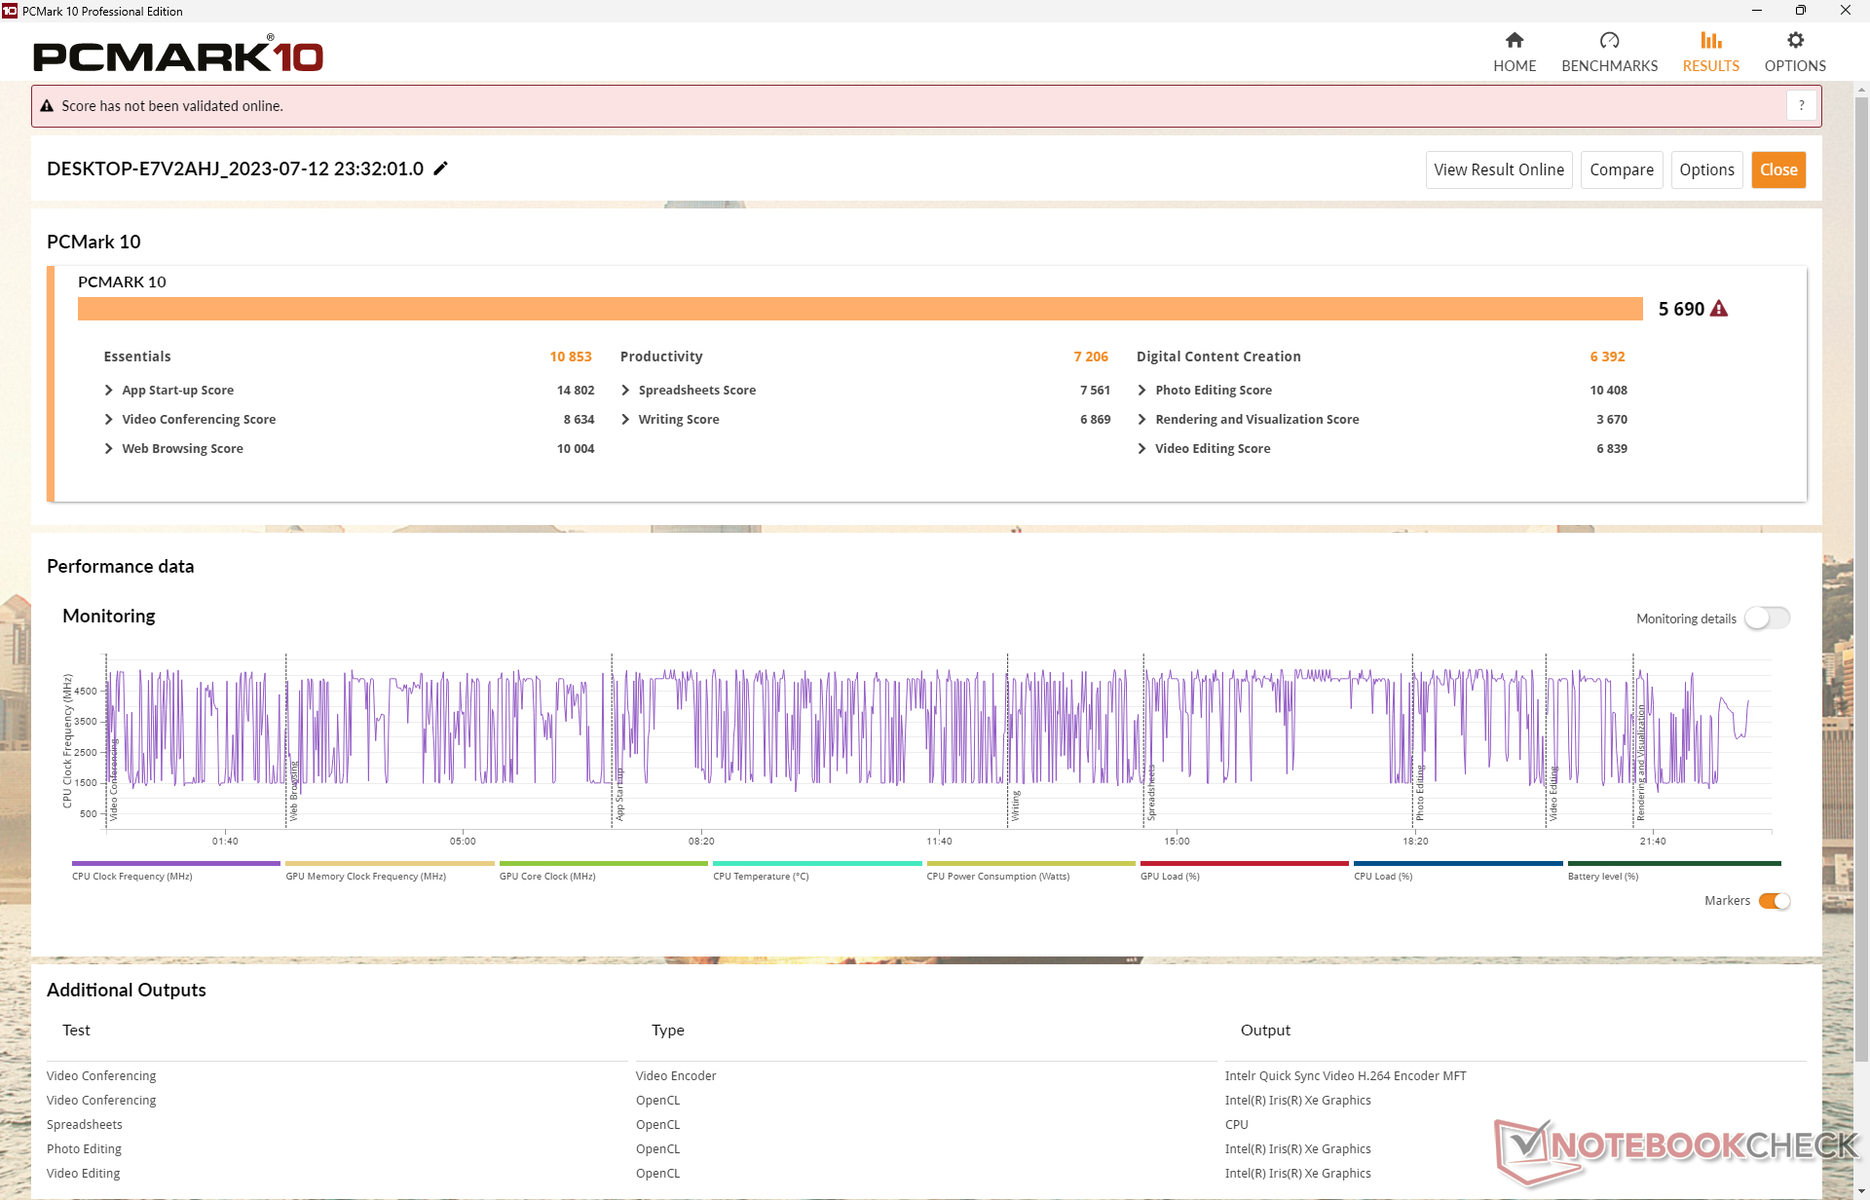
Nous avons réglé notre unité en mode Performance via le gestionnaire d'énergie HP avant de lancer les tests de référence ci-dessous. Le logiciel Power Manager est nouveau dans la série cette année et il indique commodément que ses paramètres de profil d'alimentation remplacent les profils d'alimentation par défaut de Windows, comme le montre la capture d'écran ci-dessous.

Processeur
Les performances multithread brutes sont jusqu'à 20 % plus rapides que celles du Core i7-1265U 12e génération Core i7-1265U du Dragonfly G3 de l'année dernière. Cependant, une fois que le Turbo Boost se stabilise, l'avantage en termes de performances entre le Core i7-1365U et le Dragonfly G3 se réduit i7-1365U et i7-1265U se réduit à 10 %, comme le montrent les résultats de notre test en boucle CineBench R15 xT ci-dessous. Le nouveau processeur est généralement considéré comme un rafraîchissement mineur ou un changement de marque des options Alder Lake-U de l'année dernière.
Les performances globales sont inférieures d'environ 15 % à celles de la plupart des autres ordinateurs portables équipés du même processeur Core i7-1365U. En fait, leSamsung Galaxy Book3 15de Samsung, qui est équipé d'un processeur Core i5-1335Umoins cher, est capable de surpasser régulièrement notre unité Core i7 Dragonfly G4 dans les charges de travail multithread. HP a l'habitude de faire fonctionner les CPU de sa série Dragonfly un peu plus lentement que la concurrence.
Il est dommage que la série n'offre pas d'options Core-P comme le Core i7-1370P aurait augmenté les performances multithread de manière significative, jusqu'à 75 %, d'après les résultats de notre essai du Framework 13.5.
Cinebench R15 Multi Loop
Cinebench R23: Multi Core | Single Core
Cinebench R20: CPU (Multi Core) | CPU (Single Core)
Cinebench R15: CPU Multi 64Bit | CPU Single 64Bit
Blender: v2.79 BMW27 CPU
7-Zip 18.03: 7z b 4 | 7z b 4 -mmt1
Geekbench 5.5: Multi-Core | Single-Core
HWBOT x265 Benchmark v2.2: 4k Preset
LibreOffice : 20 Documents To PDF
R Benchmark 2.5: Overall mean
| CPU Performance rating | |
| Framework Laptop 13.5 13th Gen Intel | |
| Dell XPS 13 Plus 9320 i7-1280P OLED | |
| Moyenne Intel Core i7-1365U | |
| Asus Zenbook S 13 OLED | |
| HP Dragonfly G4 | |
| Samsung Galaxy Book3 15, Core i5-1335U | |
| Lenovo ThinkBook 13s G3 20YA0005GE | |
| Apple MacBook Air M2 Entry -5! | |
| Dell Latitude 9330 | |
| Lenovo ThinkPad X13 G3 21CM002UGE | |
| HP Elite Dragonfly G3 | |
| Lenovo Yoga 6 13ALC6 -2! | |
| Dell XPS 13 7390 Core i7-10710U -6! | |
| Dell Inspiron 13 7306-6TYH5 | |
| Cinebench R23 / Multi Core | |
| Framework Laptop 13.5 13th Gen Intel | |
| Dell XPS 13 Plus 9320 i7-1280P OLED | |
| Asus Zenbook S 13 OLED | |
| Samsung Galaxy Book3 15, Core i5-1335U | |
| Moyenne Intel Core i7-1365U (7532 - 9576, n=4) | |
| Apple MacBook Air M2 Entry | |
| Lenovo ThinkBook 13s G3 20YA0005GE | |
| Lenovo ThinkPad X13 G3 21CM002UGE | |
| HP Dragonfly G4 | |
| Lenovo Yoga 6 13ALC6 | |
| Dell Latitude 9330 | |
| HP Elite Dragonfly G3 | |
| Dell Inspiron 13 7306-6TYH5 | |
| Cinebench R23 / Single Core | |
| Framework Laptop 13.5 13th Gen Intel | |
| HP Dragonfly G4 | |
| Moyenne Intel Core i7-1365U (1877 - 1891, n=4) | |
| Samsung Galaxy Book3 15, Core i5-1335U | |
| Dell XPS 13 Plus 9320 i7-1280P OLED | |
| Apple MacBook Air M2 Entry | |
| Dell Latitude 9330 | |
| HP Elite Dragonfly G3 | |
| Asus Zenbook S 13 OLED | |
| Dell Inspiron 13 7306-6TYH5 | |
| Lenovo ThinkPad X13 G3 21CM002UGE | |
| Lenovo ThinkBook 13s G3 20YA0005GE | |
| Lenovo Yoga 6 13ALC6 | |
| Cinebench R20 / CPU (Multi Core) | |
| Framework Laptop 13.5 13th Gen Intel | |
| Dell XPS 13 Plus 9320 i7-1280P OLED | |
| Asus Zenbook S 13 OLED | |
| Samsung Galaxy Book3 15, Core i5-1335U | |
| Moyenne Intel Core i7-1365U (2902 - 3669, n=4) | |
| Lenovo ThinkPad X13 G3 21CM002UGE | |
| Lenovo ThinkBook 13s G3 20YA0005GE | |
| Lenovo Yoga 6 13ALC6 | |
| HP Dragonfly G4 | |
| Dell Latitude 9330 | |
| Dell XPS 13 7390 Core i7-10710U | |
| HP Elite Dragonfly G3 | |
| Apple MacBook Air M2 Entry | |
| Dell Inspiron 13 7306-6TYH5 | |
| Cinebench R20 / CPU (Single Core) | |
| Framework Laptop 13.5 13th Gen Intel | |
| Moyenne Intel Core i7-1365U (703 - 741, n=4) | |
| HP Dragonfly G4 | |
| Samsung Galaxy Book3 15, Core i5-1335U | |
| Dell XPS 13 Plus 9320 i7-1280P OLED | |
| Dell Latitude 9330 | |
| HP Elite Dragonfly G3 | |
| Dell Inspiron 13 7306-6TYH5 | |
| Asus Zenbook S 13 OLED | |
| Lenovo ThinkBook 13s G3 20YA0005GE | |
| Lenovo ThinkPad X13 G3 21CM002UGE | |
| Lenovo Yoga 6 13ALC6 | |
| Dell XPS 13 7390 Core i7-10710U | |
| Apple MacBook Air M2 Entry | |
| Cinebench R15 / CPU Multi 64Bit | |
| Framework Laptop 13.5 13th Gen Intel | |
| Lenovo ThinkBook 13s G3 20YA0005GE | |
| Lenovo ThinkBook 13s G3 20YA0005GE | |
| Dell XPS 13 Plus 9320 i7-1280P OLED | |
| Asus Zenbook S 13 OLED | |
| Samsung Galaxy Book3 15, Core i5-1335U | |
| Moyenne Intel Core i7-1365U (1348 - 1604, n=4) | |
| HP Dragonfly G4 | |
| Lenovo ThinkPad X13 G3 21CM002UGE | |
| Apple MacBook Air M2 Entry | |
| HP Elite Dragonfly G3 | |
| Lenovo Yoga 6 13ALC6 | |
| Dell Latitude 9330 | |
| Dell XPS 13 7390 Core i7-10710U | |
| Dell Inspiron 13 7306-6TYH5 | |
| Dell Inspiron 13 7306-6TYH5 | |
| Cinebench R15 / CPU Single 64Bit | |
| Framework Laptop 13.5 13th Gen Intel | |
| Moyenne Intel Core i7-1365U (261 - 268, n=4) | |
| HP Dragonfly G4 | |
| Samsung Galaxy Book3 15, Core i5-1335U | |
| Asus Zenbook S 13 OLED | |
| Lenovo ThinkPad X13 G3 21CM002UGE | |
| Lenovo ThinkBook 13s G3 20YA0005GE | |
| Dell XPS 13 Plus 9320 i7-1280P OLED | |
| Dell Inspiron 13 7306-6TYH5 | |
| Dell Inspiron 13 7306-6TYH5 | |
| HP Elite Dragonfly G3 | |
| Apple MacBook Air M2 Entry | |
| Dell Latitude 9330 | |
| Lenovo Yoga 6 13ALC6 | |
| Dell XPS 13 7390 Core i7-10710U | |
| 7-Zip 18.03 / 7z b 4 | |
| Framework Laptop 13.5 13th Gen Intel | |
| Dell XPS 13 Plus 9320 i7-1280P OLED | |
| Asus Zenbook S 13 OLED | |
| Lenovo ThinkBook 13s G3 20YA0005GE | |
| Lenovo Yoga 6 13ALC6 | |
| Samsung Galaxy Book3 15, Core i5-1335U | |
| Moyenne Intel Core i7-1365U (33476 - 40424, n=4) | |
| Lenovo ThinkPad X13 G3 21CM002UGE | |
| HP Dragonfly G4 | |
| Dell Latitude 9330 | |
| HP Elite Dragonfly G3 | |
| Dell XPS 13 7390 Core i7-10710U | |
| Dell Inspiron 13 7306-6TYH5 | |
| 7-Zip 18.03 / 7z b 4 -mmt1 | |
| Framework Laptop 13.5 13th Gen Intel | |
| Moyenne Intel Core i7-1365U (5722 - 5941, n=4) | |
| HP Dragonfly G4 | |
| Asus Zenbook S 13 OLED | |
| Lenovo ThinkBook 13s G3 20YA0005GE | |
| Samsung Galaxy Book3 15, Core i5-1335U | |
| Lenovo ThinkPad X13 G3 21CM002UGE | |
| Dell Inspiron 13 7306-6TYH5 | |
| Dell XPS 13 Plus 9320 i7-1280P OLED | |
| HP Elite Dragonfly G3 | |
| Dell Latitude 9330 | |
| Lenovo Yoga 6 13ALC6 | |
| Dell XPS 13 7390 Core i7-10710U | |
| Geekbench 5.5 / Multi-Core | |
| Framework Laptop 13.5 13th Gen Intel | |
| Dell XPS 13 Plus 9320 i7-1280P OLED | |
| Apple MacBook Air M2 Entry | |
| HP Dragonfly G4 | |
| Moyenne Intel Core i7-1365U (8272 - 8778, n=4) | |
| HP Elite Dragonfly G3 | |
| Samsung Galaxy Book3 15, Core i5-1335U | |
| Asus Zenbook S 13 OLED | |
| Dell Latitude 9330 | |
| Lenovo ThinkBook 13s G3 20YA0005GE | |
| Lenovo ThinkPad X13 G3 21CM002UGE | |
| Dell Inspiron 13 7306-6TYH5 | |
| Geekbench 5.5 / Single-Core | |
| Framework Laptop 13.5 13th Gen Intel | |
| Apple MacBook Air M2 Entry | |
| HP Dragonfly G4 | |
| Moyenne Intel Core i7-1365U (1841 - 1938, n=4) | |
| Dell XPS 13 Plus 9320 i7-1280P OLED | |
| Samsung Galaxy Book3 15, Core i5-1335U | |
| Dell Latitude 9330 | |
| Dell Inspiron 13 7306-6TYH5 | |
| HP Elite Dragonfly G3 | |
| Asus Zenbook S 13 OLED | |
| Lenovo ThinkBook 13s G3 20YA0005GE | |
| Lenovo ThinkPad X13 G3 21CM002UGE | |
| HWBOT x265 Benchmark v2.2 / 4k Preset | |
| Framework Laptop 13.5 13th Gen Intel | |
| Dell XPS 13 Plus 9320 i7-1280P OLED | |
| Asus Zenbook S 13 OLED | |
| Samsung Galaxy Book3 15, Core i5-1335U | |
| Lenovo ThinkBook 13s G3 20YA0005GE | |
| Moyenne Intel Core i7-1365U (8.61 - 10.3, n=4) | |
| Lenovo ThinkPad X13 G3 21CM002UGE | |
| Lenovo Yoga 6 13ALC6 | |
| HP Dragonfly G4 | |
| Dell Latitude 9330 | |
| HP Elite Dragonfly G3 | |
| Dell XPS 13 7390 Core i7-10710U | |
| Dell Inspiron 13 7306-6TYH5 | |
| LibreOffice / 20 Documents To PDF | |
| Lenovo ThinkPad X13 G3 21CM002UGE | |
| Lenovo Yoga 6 13ALC6 | |
| HP Elite Dragonfly G3 | |
| Asus Zenbook S 13 OLED | |
| Dell Latitude 9330 | |
| Lenovo ThinkBook 13s G3 20YA0005GE | |
| Dell XPS 13 Plus 9320 i7-1280P OLED | |
| Samsung Galaxy Book3 15, Core i5-1335U | |
| Dell Inspiron 13 7306-6TYH5 | |
| HP Dragonfly G4 | |
| Moyenne Intel Core i7-1365U (42.2 - 47.5, n=4) | |
| Framework Laptop 13.5 13th Gen Intel | |
| R Benchmark 2.5 / Overall mean | |
| Lenovo ThinkPad X13 G3 21CM002UGE | |
| Lenovo Yoga 6 13ALC6 | |
| Dell Inspiron 13 7306-6TYH5 | |
| Lenovo ThinkBook 13s G3 20YA0005GE | |
| HP Elite Dragonfly G3 | |
| Dell Latitude 9330 | |
| Asus Zenbook S 13 OLED | |
| Samsung Galaxy Book3 15, Core i5-1335U | |
| Dell XPS 13 Plus 9320 i7-1280P OLED | |
| HP Dragonfly G4 | |
| Moyenne Intel Core i7-1365U (0.4504 - 0.4586, n=4) | |
| Framework Laptop 13.5 13th Gen Intel | |
Cinebench R23: Multi Core | Single Core
Cinebench R20: CPU (Multi Core) | CPU (Single Core)
Cinebench R15: CPU Multi 64Bit | CPU Single 64Bit
Blender: v2.79 BMW27 CPU
7-Zip 18.03: 7z b 4 | 7z b 4 -mmt1
Geekbench 5.5: Multi-Core | Single-Core
HWBOT x265 Benchmark v2.2: 4k Preset
LibreOffice : 20 Documents To PDF
R Benchmark 2.5: Overall mean
* ... Moindre est la valeur, meilleures sont les performances
AIDA64: FP32 Ray-Trace | FPU Julia | CPU SHA3 | CPU Queen | FPU SinJulia | FPU Mandel | CPU AES | CPU ZLib | FP64 Ray-Trace | CPU PhotoWorxx
| Performance rating | |
| Framework Laptop 13.5 13th Gen Intel | |
| Lenovo ThinkPad X13 G3 21CM002UGE | |
| Moyenne Intel Core i7-1365U | |
| HP Dragonfly G4 | |
| Dell Latitude 9330 | |
| HP Elite Dragonfly G3 | |
| AIDA64 / FP32 Ray-Trace | |
| Framework Laptop 13.5 13th Gen Intel | |
| Lenovo ThinkPad X13 G3 21CM002UGE | |
| Moyenne Intel Core i7-1365U (6720 - 8270, n=4) | |
| HP Dragonfly G4 | |
| Dell Latitude 9330 | |
| HP Elite Dragonfly G3 | |
| AIDA64 / FPU Julia | |
| Framework Laptop 13.5 13th Gen Intel | |
| Lenovo ThinkPad X13 G3 21CM002UGE | |
| Moyenne Intel Core i7-1365U (33777 - 41487, n=4) | |
| Dell Latitude 9330 | |
| HP Dragonfly G4 | |
| HP Elite Dragonfly G3 | |
| AIDA64 / CPU SHA3 | |
| Framework Laptop 13.5 13th Gen Intel | |
| Moyenne Intel Core i7-1365U (1754 - 2216, n=4) | |
| Lenovo ThinkPad X13 G3 21CM002UGE | |
| Dell Latitude 9330 | |
| HP Dragonfly G4 | |
| HP Elite Dragonfly G3 | |
| AIDA64 / CPU Queen | |
| Framework Laptop 13.5 13th Gen Intel | |
| HP Dragonfly G4 | |
| Lenovo ThinkPad X13 G3 21CM002UGE | |
| Moyenne Intel Core i7-1365U (67557 - 69991, n=4) | |
| HP Elite Dragonfly G3 | |
| Dell Latitude 9330 | |
| AIDA64 / FPU SinJulia | |
| Framework Laptop 13.5 13th Gen Intel | |
| Lenovo ThinkPad X13 G3 21CM002UGE | |
| Moyenne Intel Core i7-1365U (4589 - 5145, n=4) | |
| HP Dragonfly G4 | |
| HP Elite Dragonfly G3 | |
| Dell Latitude 9330 | |
| AIDA64 / FPU Mandel | |
| Lenovo ThinkPad X13 G3 21CM002UGE | |
| Framework Laptop 13.5 13th Gen Intel | |
| Moyenne Intel Core i7-1365U (16808 - 20668, n=4) | |
| Dell Latitude 9330 | |
| HP Dragonfly G4 | |
| HP Elite Dragonfly G3 | |
| AIDA64 / CPU AES | |
| Framework Laptop 13.5 13th Gen Intel | |
| Moyenne Intel Core i7-1365U (34968 - 41413, n=4) | |
| Lenovo ThinkPad X13 G3 21CM002UGE | |
| HP Dragonfly G4 | |
| Dell Latitude 9330 | |
| HP Elite Dragonfly G3 | |
| AIDA64 / CPU ZLib | |
| Framework Laptop 13.5 13th Gen Intel | |
| Moyenne Intel Core i7-1365U (519 - 650, n=4) | |
| HP Dragonfly G4 | |
| Dell Latitude 9330 | |
| Lenovo ThinkPad X13 G3 21CM002UGE | |
| HP Elite Dragonfly G3 | |
| AIDA64 / FP64 Ray-Trace | |
| Framework Laptop 13.5 13th Gen Intel | |
| Lenovo ThinkPad X13 G3 21CM002UGE | |
| Moyenne Intel Core i7-1365U (3513 - 4367, n=4) | |
| Dell Latitude 9330 | |
| HP Dragonfly G4 | |
| HP Elite Dragonfly G3 | |
| AIDA64 / CPU PhotoWorxx | |
| Moyenne Intel Core i7-1365U (37846 - 43780, n=4) | |
| HP Elite Dragonfly G3 | |
| HP Dragonfly G4 | |
| Dell Latitude 9330 | |
| Framework Laptop 13.5 13th Gen Intel | |
| Lenovo ThinkPad X13 G3 21CM002UGE | |
Performance du système
Les scores PCMark sont toujours plus élevés que ceux du modèle de l'année dernière, tout en étant juste en dessous du Framework 13.5 et de son processeur Core-P plus rapide. Les résultats sont comparables à ceux duDell Latitude 9440 2-en-1 équipé du même processeur Core i7-1365U.
CrossMark: Overall | Productivity | Creativity | Responsiveness
| PCMark 10 / Score | |
| Framework Laptop 13.5 13th Gen Intel | |
| Moyenne Intel Core i7-1365U, Intel Iris Xe Graphics G7 96EUs (5690 - 5980, n=4) | |
| HP Dragonfly G4 | |
| Lenovo ThinkPad X13 G3 21CM002UGE | |
| Dell Latitude 9330 | |
| HP Elite Dragonfly G3 | |
| PCMark 10 / Essentials | |
| Framework Laptop 13.5 13th Gen Intel | |
| Moyenne Intel Core i7-1365U, Intel Iris Xe Graphics G7 96EUs (10635 - 11827, n=4) | |
| HP Dragonfly G4 | |
| Dell Latitude 9330 | |
| Lenovo ThinkPad X13 G3 21CM002UGE | |
| HP Elite Dragonfly G3 | |
| PCMark 10 / Productivity | |
| Lenovo ThinkPad X13 G3 21CM002UGE | |
| Framework Laptop 13.5 13th Gen Intel | |
| Moyenne Intel Core i7-1365U, Intel Iris Xe Graphics G7 96EUs (7206 - 7708, n=4) | |
| HP Dragonfly G4 | |
| Dell Latitude 9330 | |
| HP Elite Dragonfly G3 | |
| PCMark 10 / Digital Content Creation | |
| Framework Laptop 13.5 13th Gen Intel | |
| Moyenne Intel Core i7-1365U, Intel Iris Xe Graphics G7 96EUs (6392 - 6735, n=4) | |
| HP Dragonfly G4 | |
| Lenovo ThinkPad X13 G3 21CM002UGE | |
| HP Elite Dragonfly G3 | |
| Dell Latitude 9330 | |
| CrossMark / Overall | |
| Framework Laptop 13.5 13th Gen Intel | |
| Moyenne Intel Core i7-1365U, Intel Iris Xe Graphics G7 96EUs (1605 - 1675, n=4) | |
| HP Dragonfly G4 | |
| Apple MacBook Air M2 Entry | |
| HP Elite Dragonfly G3 | |
| Lenovo ThinkPad X13 G3 21CM002UGE | |
| CrossMark / Productivity | |
| Framework Laptop 13.5 13th Gen Intel | |
| HP Dragonfly G4 | |
| Moyenne Intel Core i7-1365U, Intel Iris Xe Graphics G7 96EUs (1582 - 1650, n=4) | |
| HP Elite Dragonfly G3 | |
| Apple MacBook Air M2 Entry | |
| Lenovo ThinkPad X13 G3 21CM002UGE | |
| CrossMark / Creativity | |
| Framework Laptop 13.5 13th Gen Intel | |
| Apple MacBook Air M2 Entry | |
| Moyenne Intel Core i7-1365U, Intel Iris Xe Graphics G7 96EUs (1713 - 1797, n=4) | |
| HP Dragonfly G4 | |
| HP Elite Dragonfly G3 | |
| Lenovo ThinkPad X13 G3 21CM002UGE | |
| CrossMark / Responsiveness | |
| Framework Laptop 13.5 13th Gen Intel | |
| Moyenne Intel Core i7-1365U, Intel Iris Xe Graphics G7 96EUs (1373 - 1427, n=4) | |
| HP Dragonfly G4 | |
| HP Elite Dragonfly G3 | |
| Lenovo ThinkPad X13 G3 21CM002UGE | |
| Apple MacBook Air M2 Entry | |
| PCMark 10 Score | 5690 points | |
Aide | ||
| AIDA64 / Memory Copy | |
| Dell Latitude 9330 | |
| HP Elite Dragonfly G3 | |
| Moyenne Intel Core i7-1365U (57654 - 69736, n=4) | |
| HP Dragonfly G4 | |
| Lenovo ThinkPad X13 G3 21CM002UGE | |
| Framework Laptop 13.5 13th Gen Intel | |
| AIDA64 / Memory Read | |
| HP Elite Dragonfly G3 | |
| Dell Latitude 9330 | |
| Moyenne Intel Core i7-1365U (49203 - 54068, n=4) | |
| Framework Laptop 13.5 13th Gen Intel | |
| HP Dragonfly G4 | |
| Lenovo ThinkPad X13 G3 21CM002UGE | |
| AIDA64 / Memory Write | |
| Moyenne Intel Core i7-1365U (70434 - 85570, n=4) | |
| HP Dragonfly G4 | |
| Dell Latitude 9330 | |
| HP Elite Dragonfly G3 | |
| Lenovo ThinkPad X13 G3 21CM002UGE | |
| Framework Laptop 13.5 13th Gen Intel | |
| AIDA64 / Memory Latency | |
| Lenovo ThinkPad X13 G3 21CM002UGE | |
| Dell Latitude 9330 | |
| HP Elite Dragonfly G3 | |
| Moyenne Intel Core i7-1365U (90.2 - 102.2, n=4) | |
| HP Dragonfly G4 | |
| Framework Laptop 13.5 13th Gen Intel | |
* ... Moindre est la valeur, meilleures sont les performances
Latence DPC
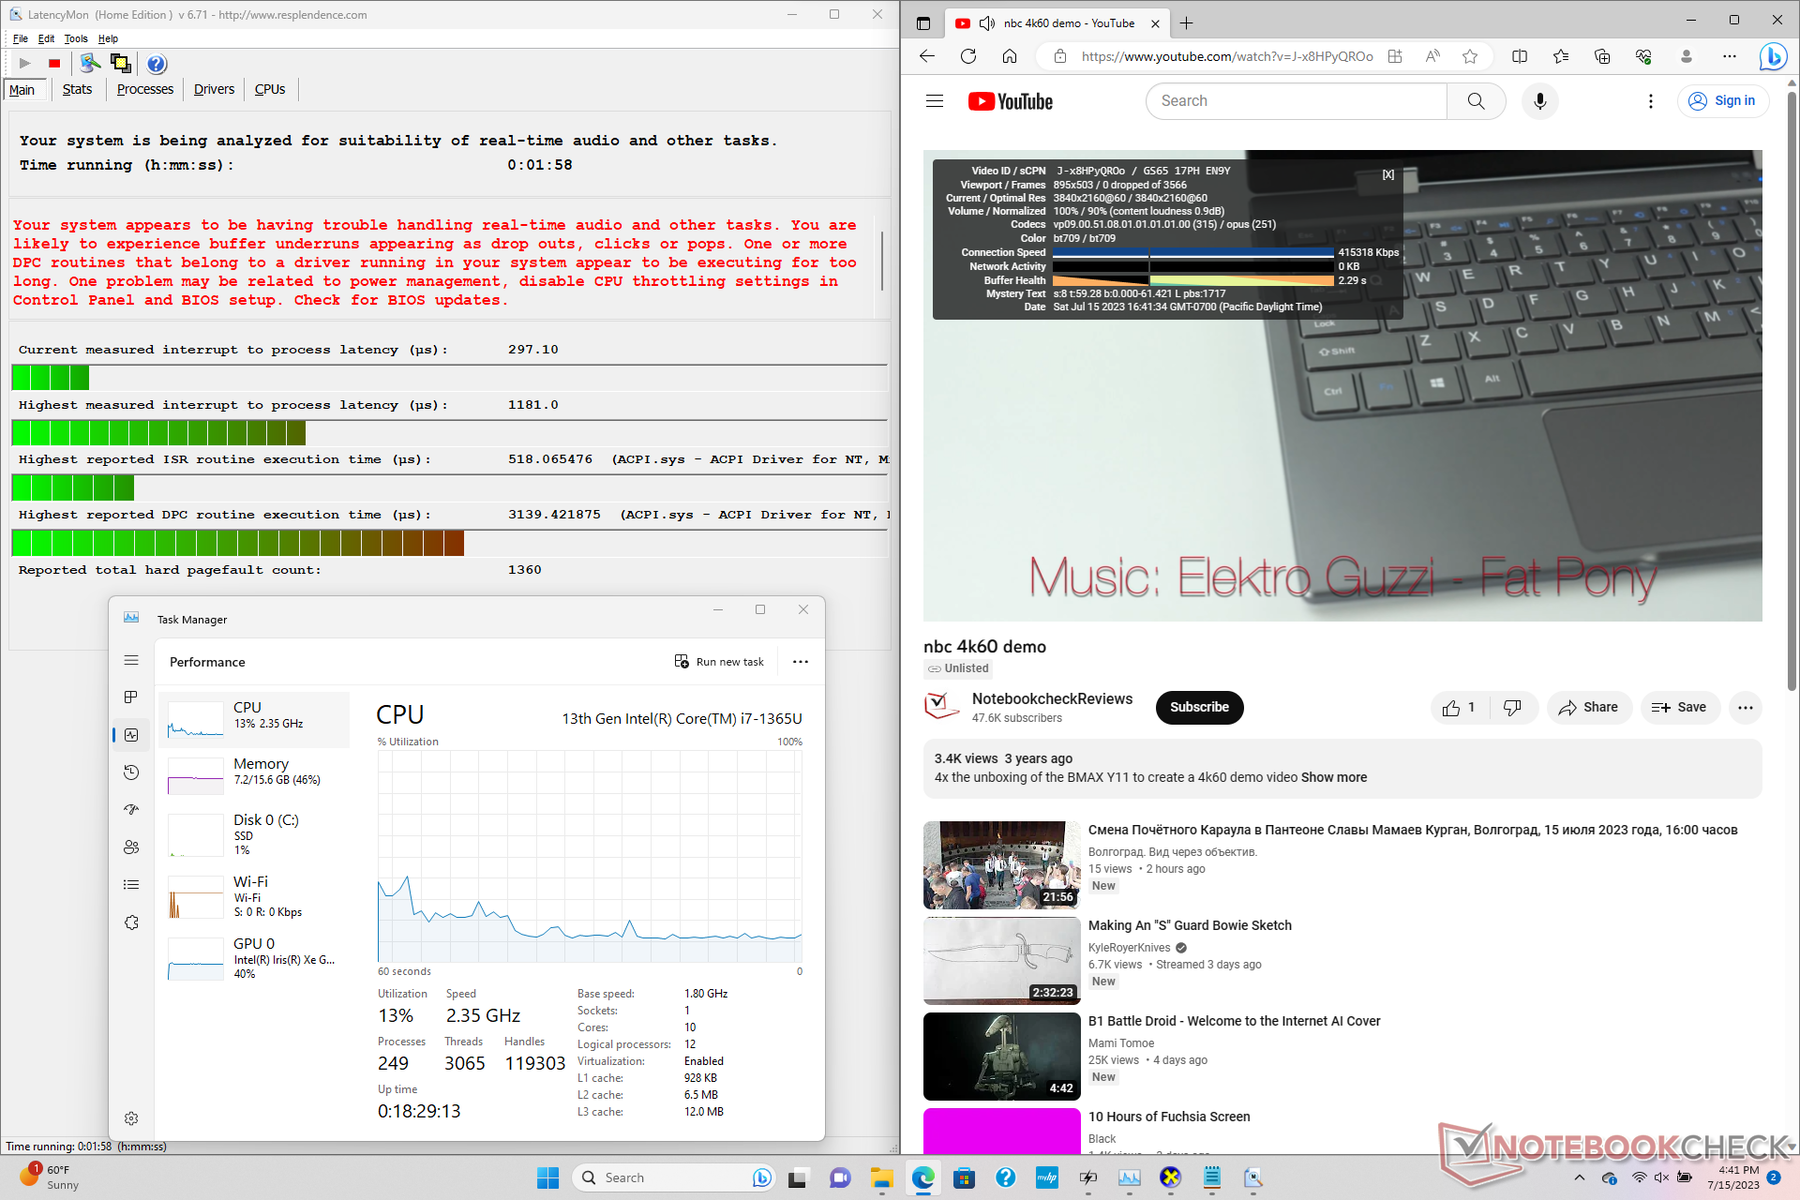
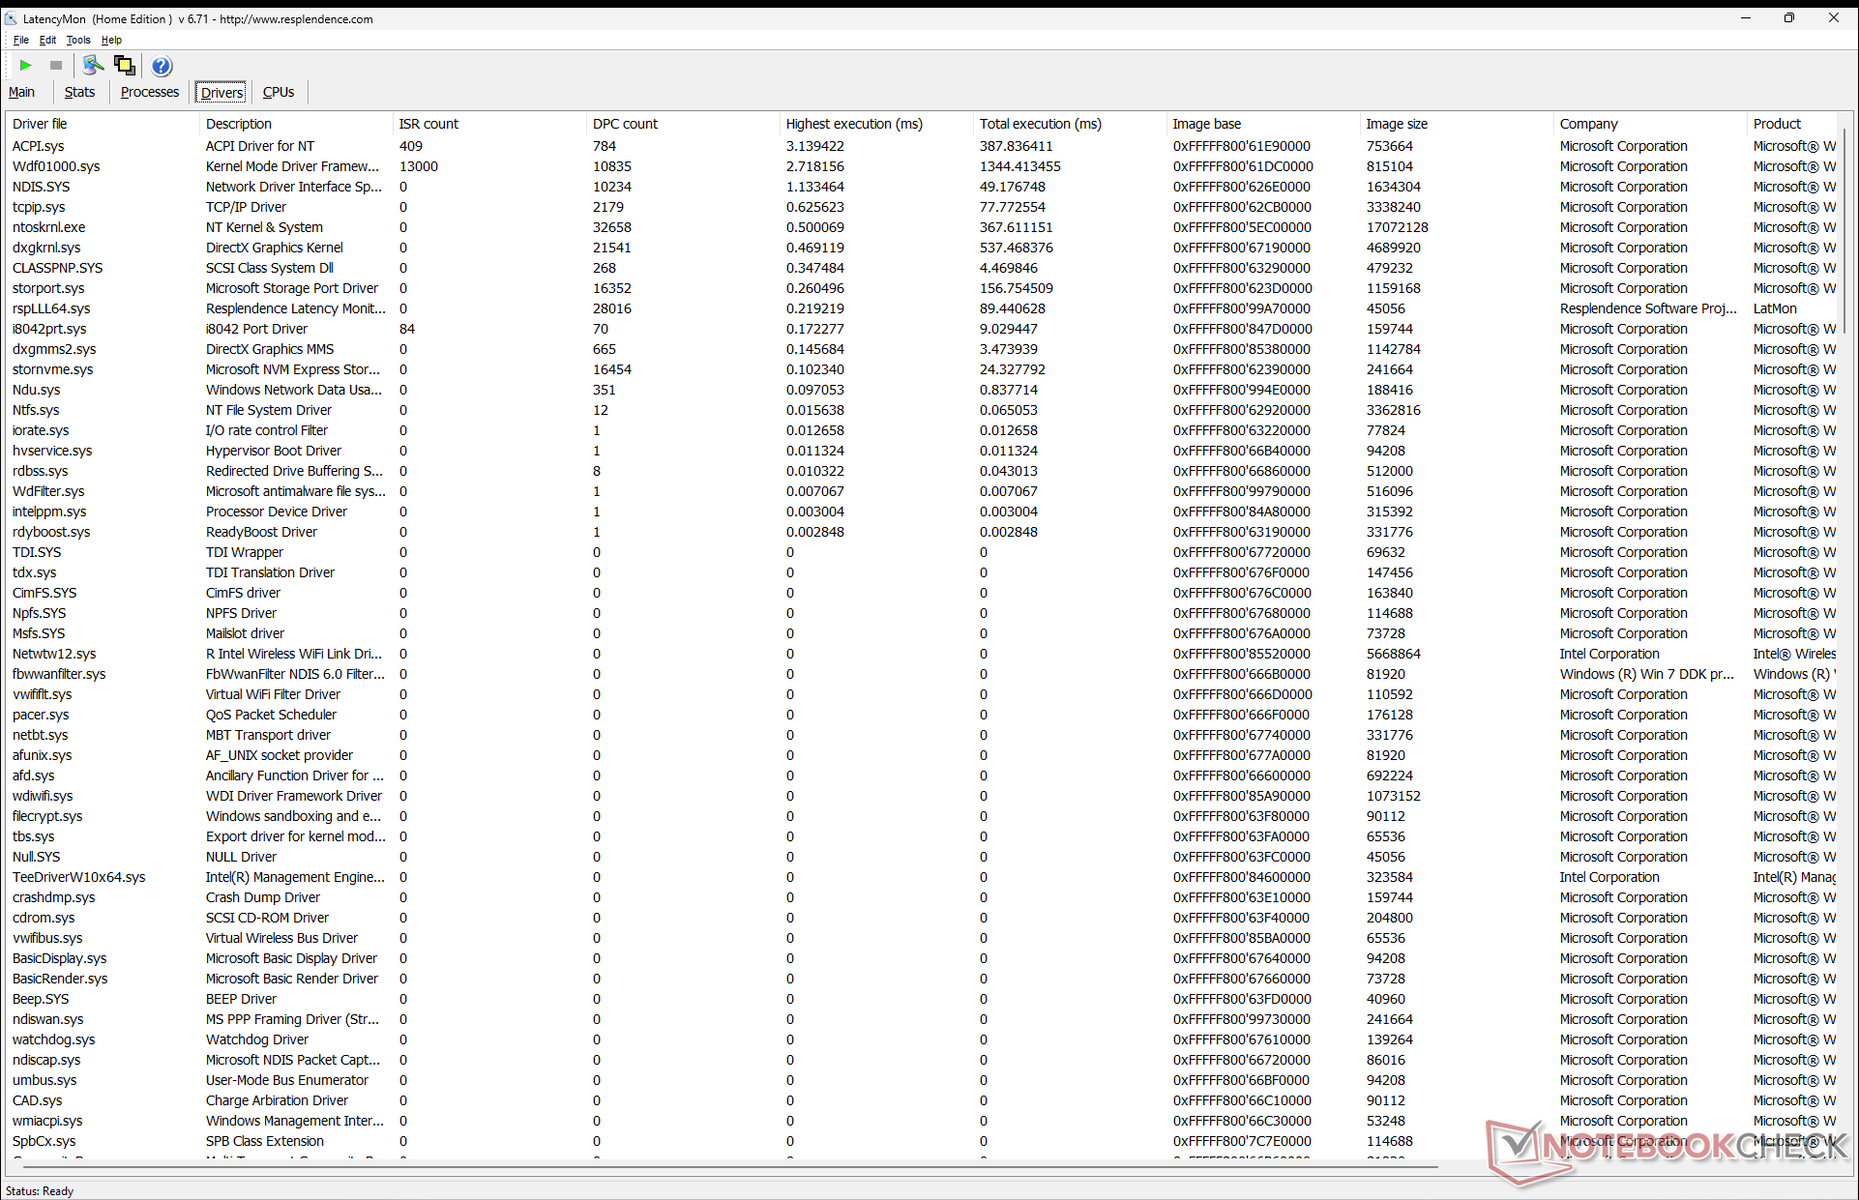
LatencyMon n'indique que des problèmes mineurs de DPC lors de l'ouverture de plusieurs onglets de notre page d'accueil. la lecture de vidéos 4K à 60 FPS est par ailleurs parfaite, sans aucune perte d'images.
| DPC Latencies / LatencyMon - interrupt to process latency (max), Web, Youtube, Prime95 | |
| Dell Latitude 9330 | |
| HP Dragonfly G4 | |
| HP Elite Dragonfly G3 | |
| Lenovo ThinkPad X13 G3 21CM002UGE | |
| Framework Laptop 13.5 13th Gen Intel | |
* ... Moindre est la valeur, meilleures sont les performances
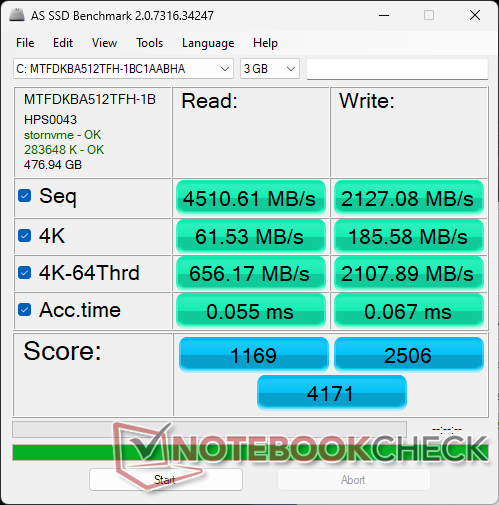
Dispositifs de stockage
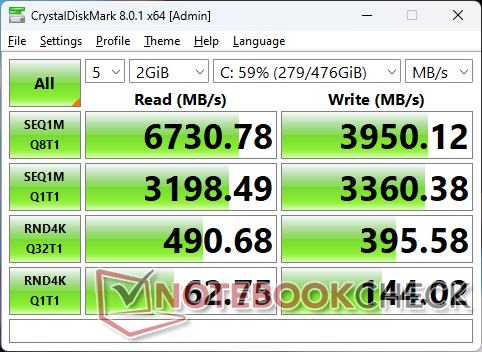
HP s'en tient au SSD NVMe Micron 3400 NVMe SSD pour la deuxième année consécutive, contrairement à la série XPS 13 de Dell qui peut inclure des SSD de Samsung, Micron ou Western Digital.

| Drive Performance rating - Percent | |
| Framework Laptop 13.5 13th Gen Intel | |
| HP Dragonfly G4 | |
| Lenovo ThinkPad X13 G3 21CM002UGE | |
| HP Elite Dragonfly G3 | |
| Dell Latitude 9330 | |
* ... Moindre est la valeur, meilleures sont les performances
Disk Throttling: DiskSpd Read Loop, Queue Depth 8
Performance du GPU
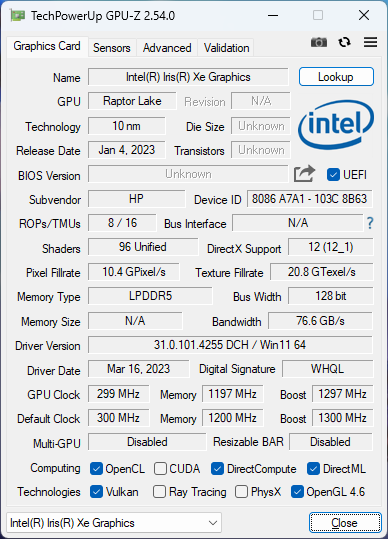
Les performances graphiques sont légèrement supérieures à celles du Dragonfly G3 de l'année dernière, principalement en raison d'un processeur légèrement plus rapide. Pour une amélioration plus significative, les acheteurs devront se tourner vers la AMD Radeon 680M ou 780M comme sur l'Asus Zenbook S 13Asus Zenbook S 13 ou Lenovo Yoga Pro 7 14.
L'exécution du système en mode équilibré au lieu du mode performance peut entraver les performances du CPU et du GPU jusqu'à 12 % et 6 %, respectivement, comme le montre le tableau de comparaison 3DMark 11 ci-dessous.
| Profil de puissance | Score graphique | Score physique | Score combiné |
| Mode équilibré | 6061 (-6%) | 10145 (-12%) | 4879 (-16%) |
| Mode Performance | 6440 | 11465 | 5780 |
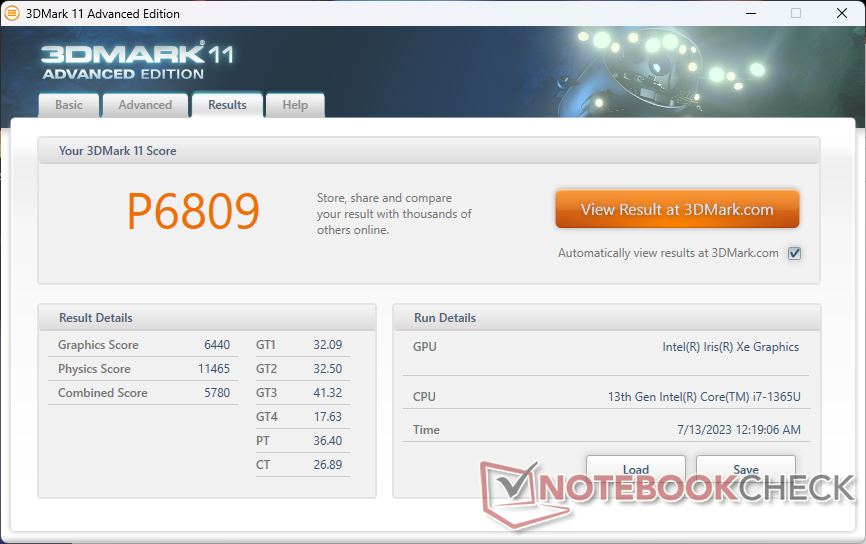
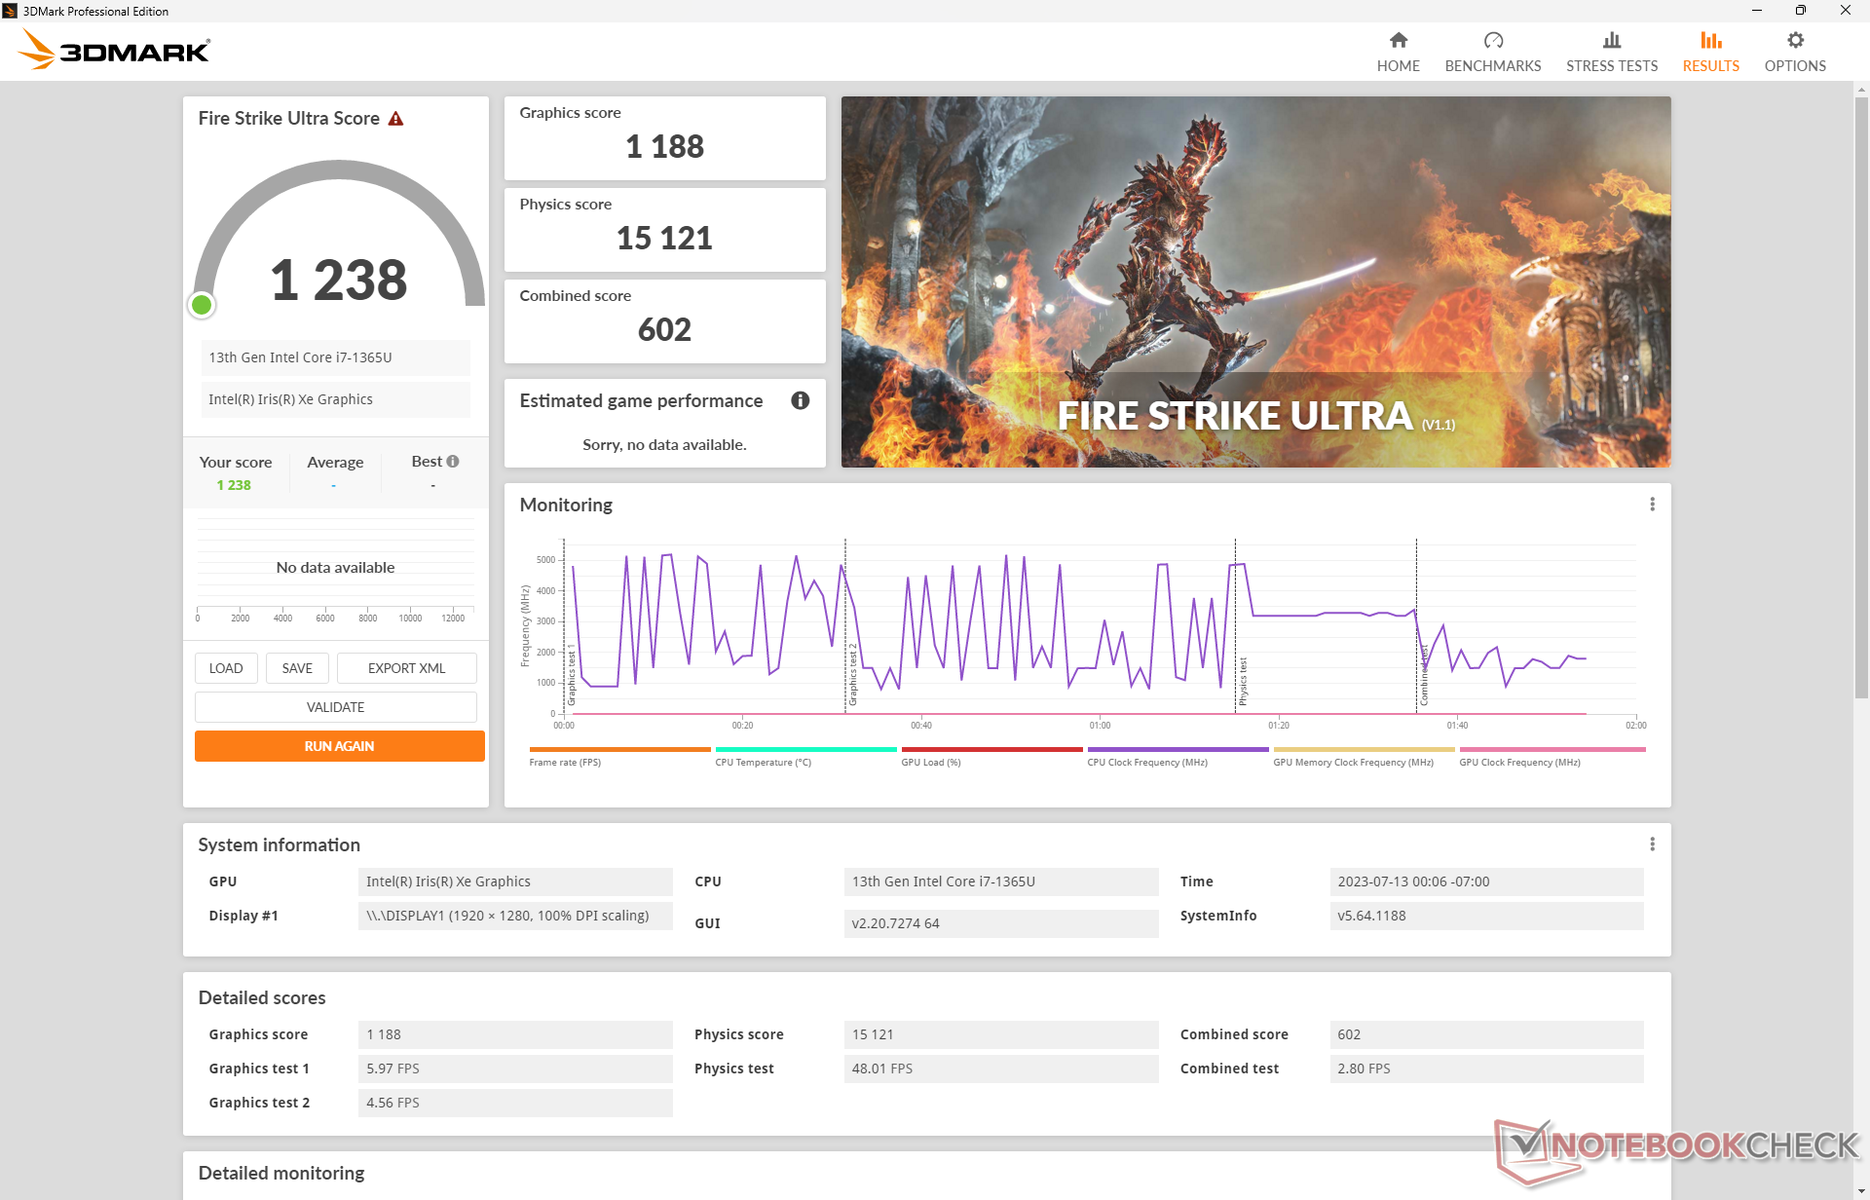
| 3DMark 11 Performance | 6809 points | |
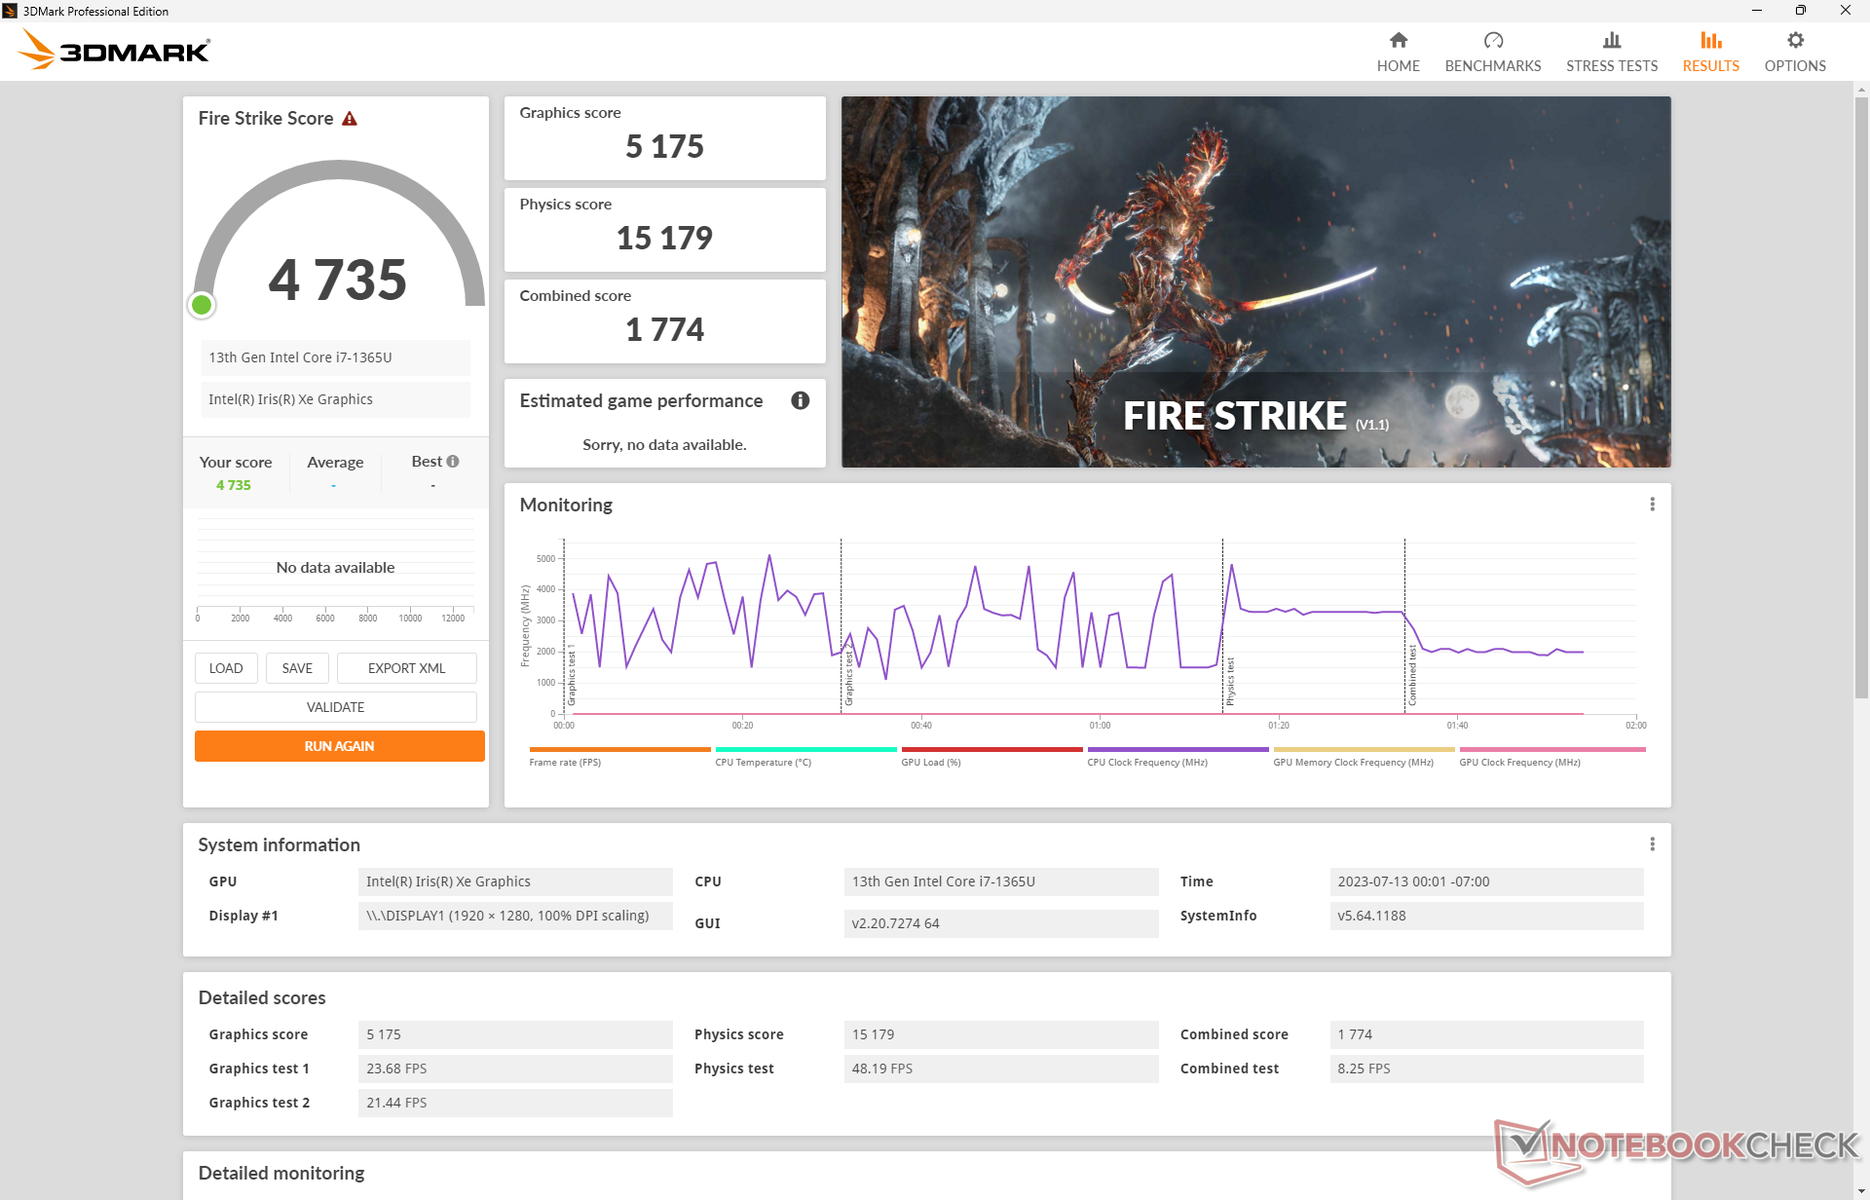
| 3DMark Fire Strike Score | 4735 points | |
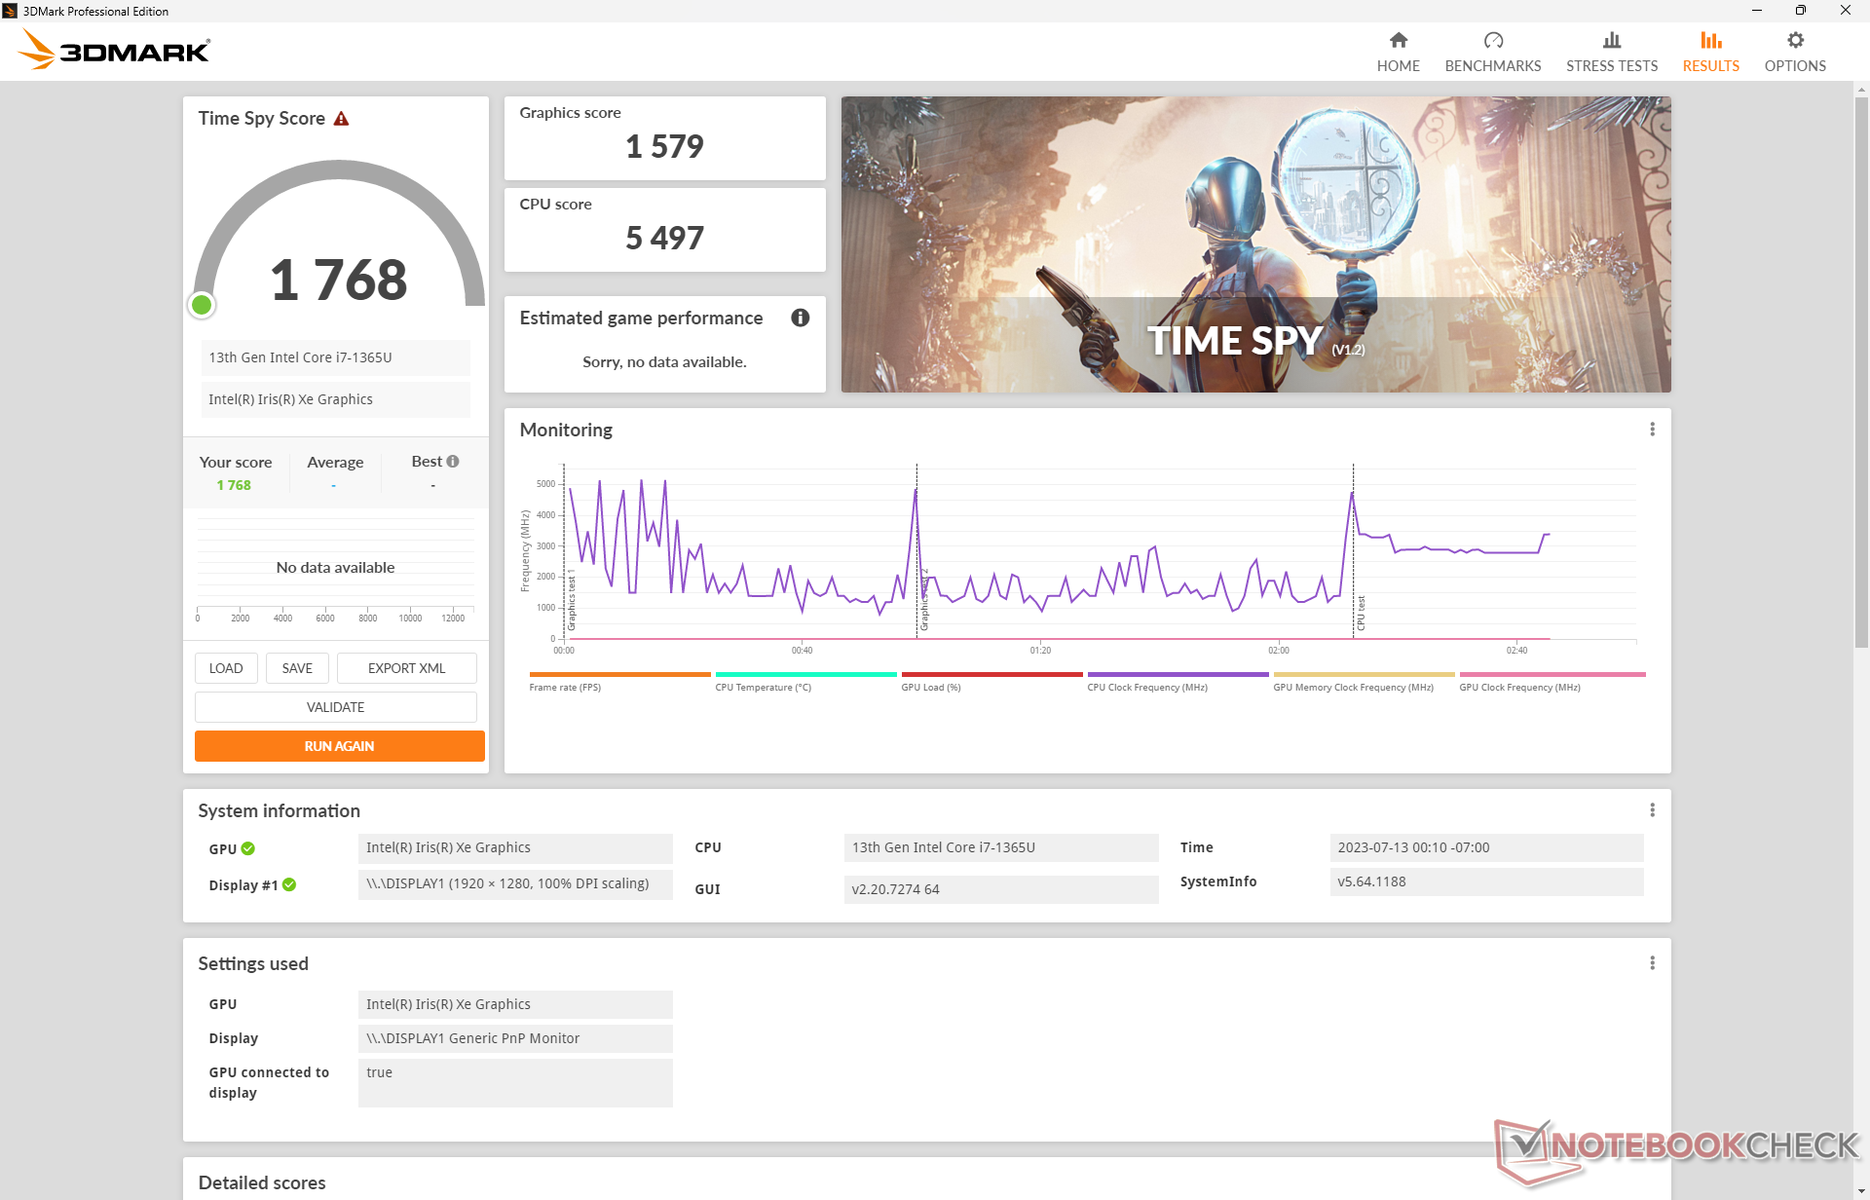
| 3DMark Time Spy Score | 1768 points | |
Aide | ||
* ... Moindre est la valeur, meilleures sont les performances
| Tiny Tina's Wonderlands | |
| 1280x720 Lowest Preset (DX12) | |
| HP Dragonfly G4 | |
| Moyenne Intel Iris Xe Graphics G7 96EUs (25.9 - 67.3, n=32) | |
| 1920x1080 Low Preset (DX12) | |
| Framework Laptop 13.5 13th Gen Intel | |
| Moyenne Intel Iris Xe Graphics G7 96EUs (22.3 - 53, n=32) | |
| HP Dragonfly G4 | |
| 1920x1080 Medium Preset (DX12) | |
| Framework Laptop 13.5 13th Gen Intel | |
| Moyenne Intel Iris Xe Graphics G7 96EUs (17 - 40.1, n=30) | |
| HP Dragonfly G4 | |
| 1920x1080 High Preset (DX12) | |
| Framework Laptop 13.5 13th Gen Intel | |
| Moyenne Intel Iris Xe Graphics G7 96EUs (10.6 - 24.1, n=29) | |
| HP Dragonfly G4 | |
| 1920x1080 Badass Preset (DX12) | |
| Framework Laptop 13.5 13th Gen Intel | |
| Moyenne Intel Iris Xe Graphics G7 96EUs (8.4 - 18.4, n=26) | |
| HP Dragonfly G4 | |
| F1 22 | |
| 1280x720 Ultra Low Preset AA:T AF:16x | |
| Framework Laptop 13.5 13th Gen Intel | |
| Moyenne Intel Iris Xe Graphics G7 96EUs (57.4 - 94.9, n=53) | |
| HP Dragonfly G4 | |
| Lenovo ThinkPad X13 G3 21CM002UGE | |
| 1920x1080 Low Preset AA:T AF:16x | |
| Framework Laptop 13.5 13th Gen Intel | |
| Moyenne Intel Iris Xe Graphics G7 96EUs (33.3 - 57.2, n=58) | |
| HP Dragonfly G4 | |
| Lenovo ThinkPad X13 G3 21CM002UGE | |
| 1920x1080 Medium Preset AA:T AF:16x | |
| Framework Laptop 13.5 13th Gen Intel | |
| Moyenne Intel Iris Xe Graphics G7 96EUs (28 - 52.3, n=58) | |
| HP Dragonfly G4 | |
| Lenovo ThinkPad X13 G3 21CM002UGE | |
| 1920x1080 High Preset AA:T AF:16x | |
| Framework Laptop 13.5 13th Gen Intel | |
| Moyenne Intel Iris Xe Graphics G7 96EUs (21.7 - 37.1, n=58) | |
| HP Dragonfly G4 | |
| Lenovo ThinkPad X13 G3 21CM002UGE | |
| 1920x1080 Ultra High Preset AA:T AF:16x | |
| Framework Laptop 13.5 13th Gen Intel | |
| Moyenne Intel Iris Xe Graphics G7 96EUs (16.1 - 28.2, n=49) | |
| HP Dragonfly G4 | |
| Lenovo ThinkPad X13 G3 21CM002UGE | |
Witcher 3 FPS Chart
| Bas | Moyen | Élevé | Ultra | |
|---|---|---|---|---|
| GTA V (2015) | 99.8 | 84.1 | 23.4 | 10.1 |
| The Witcher 3 (2015) | 78.9 | 54.2 | 31 | 14.7 |
| Dota 2 Reborn (2015) | 101.4 | 76.3 | 60.2 | 53.3 |
| Final Fantasy XV Benchmark (2018) | 40.9 | 23.2 | 16.4 | |
| X-Plane 11.11 (2018) | 37.6 | 31.8 | 29.1 | |
| Strange Brigade (2018) | 88.8 | 38.4 | 30.4 | 24.7 |
| Cyberpunk 2077 1.6 (2022) | 19.7 | 16.3 | 12.7 | 9.3 |
| Tiny Tina's Wonderlands (2022) | 25.9 | 21.2 | 14.1 | 11.1 |
| F1 22 (2022) | 43.6 | 39.4 | 27.4 | 22.2 |
Émissions
Bruit du système
Les ordinateurs portables HP Dragonfly sont généralement plus silencieux que la plupart des modèles concurrents, au prix d'une fréquence d'horloge du processeur plus lente que la moyenne. Nous avons pu mesurer un maximum de 35 dB(A) contre plus de 40 dB(A) sur le modèleLatitude 9330. Même dans ce cas, le maximum de 35 dB(A) n'est qu'un court instant avant de redescendre et de se stabiliser autour de 33 dB(A) lors de l'exécution de charges exigeantes.
Degré de la nuisance sonore
| Au repos |
| 23.5 / 23.5 / 26.8 dB(A) |
| Fortement sollicité |
| 27.2 / 35 dB(A) |
 | ||
30 dB silencieux 40 dB(A) audible 50 dB(A) bruyant |
||
min: | ||
| HP Dragonfly G4 Iris Xe G7 96EUs, i7-1365U, Micron 3400 MTFDKBA512TFH 512GB | HP Elite Dragonfly G3 Iris Xe G7 96EUs, i7-1265U, Micron 3400 MTFDKBA512TFH 512GB | Framework Laptop 13.5 13th Gen Intel Iris Xe G7 96EUs, i7-1370P, WD PC SN740 SDDPNQD-1T00 | Lenovo ThinkPad X13 G3 21CM002UGE Radeon 660M, R5 PRO 6650U, Samsung PM9A1 MZVL2512HCJQ | Dell Latitude 9330 Iris Xe G7 96EUs, i7-1260U | |
|---|---|---|---|---|---|
| Noise | 4% | -20% | 0% | -8% | |
| arrêt / environnement * (dB) | 23.3 | 22.8 2% | 23.2 -0% | 23.1 1% | 23 1% |
| Idle Minimum * (dB) | 23.5 | 23.2 1% | 23.2 1% | 23.1 2% | 23 2% |
| Idle Average * (dB) | 23.5 | 23.2 1% | 23.2 1% | 23.1 2% | 23.1 2% |
| Idle Maximum * (dB) | 26.8 | 23.2 13% | 23.2 13% | 23.1 14% | 23.1 14% |
| Load Average * (dB) | 27.2 | 25.1 8% | 45.3 -67% | 27 1% | 37.1 -36% |
| Witcher 3 ultra * (dB) | 32.7 | 32 2% | 47.9 -46% | 38.7 -18% | 40.6 -24% |
| Load Maximum * (dB) | 35 | 35.2 -1% | 49.2 -41% | 35.5 -1% | 40.5 -16% |
* ... Moindre est la valeur, meilleures sont les performances
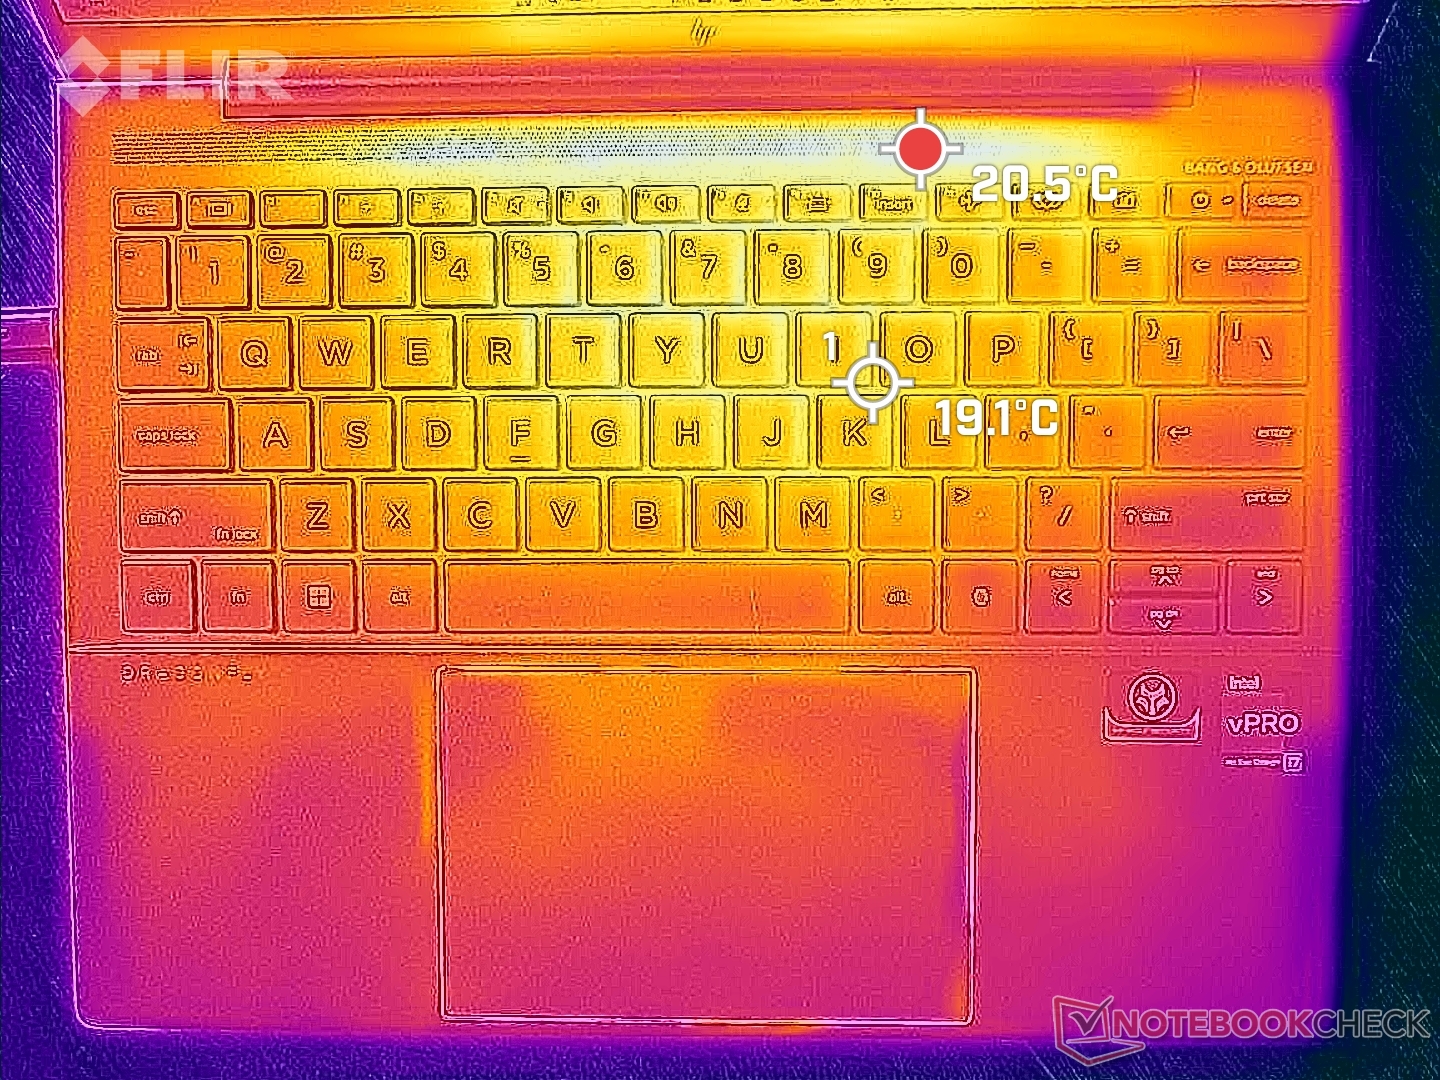
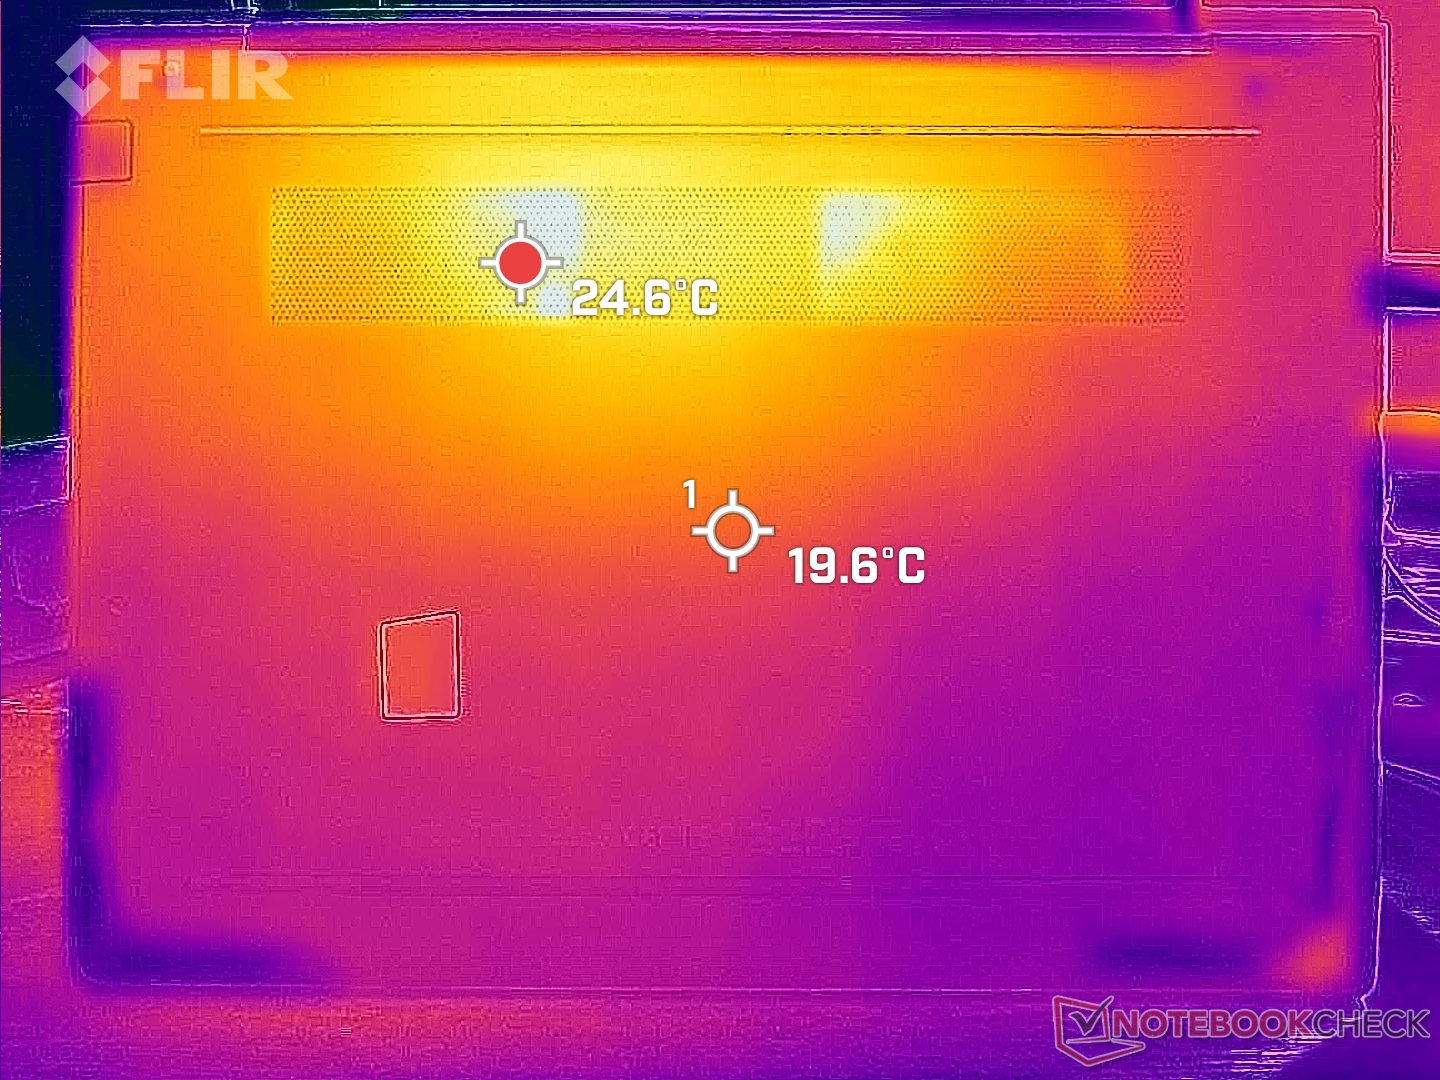
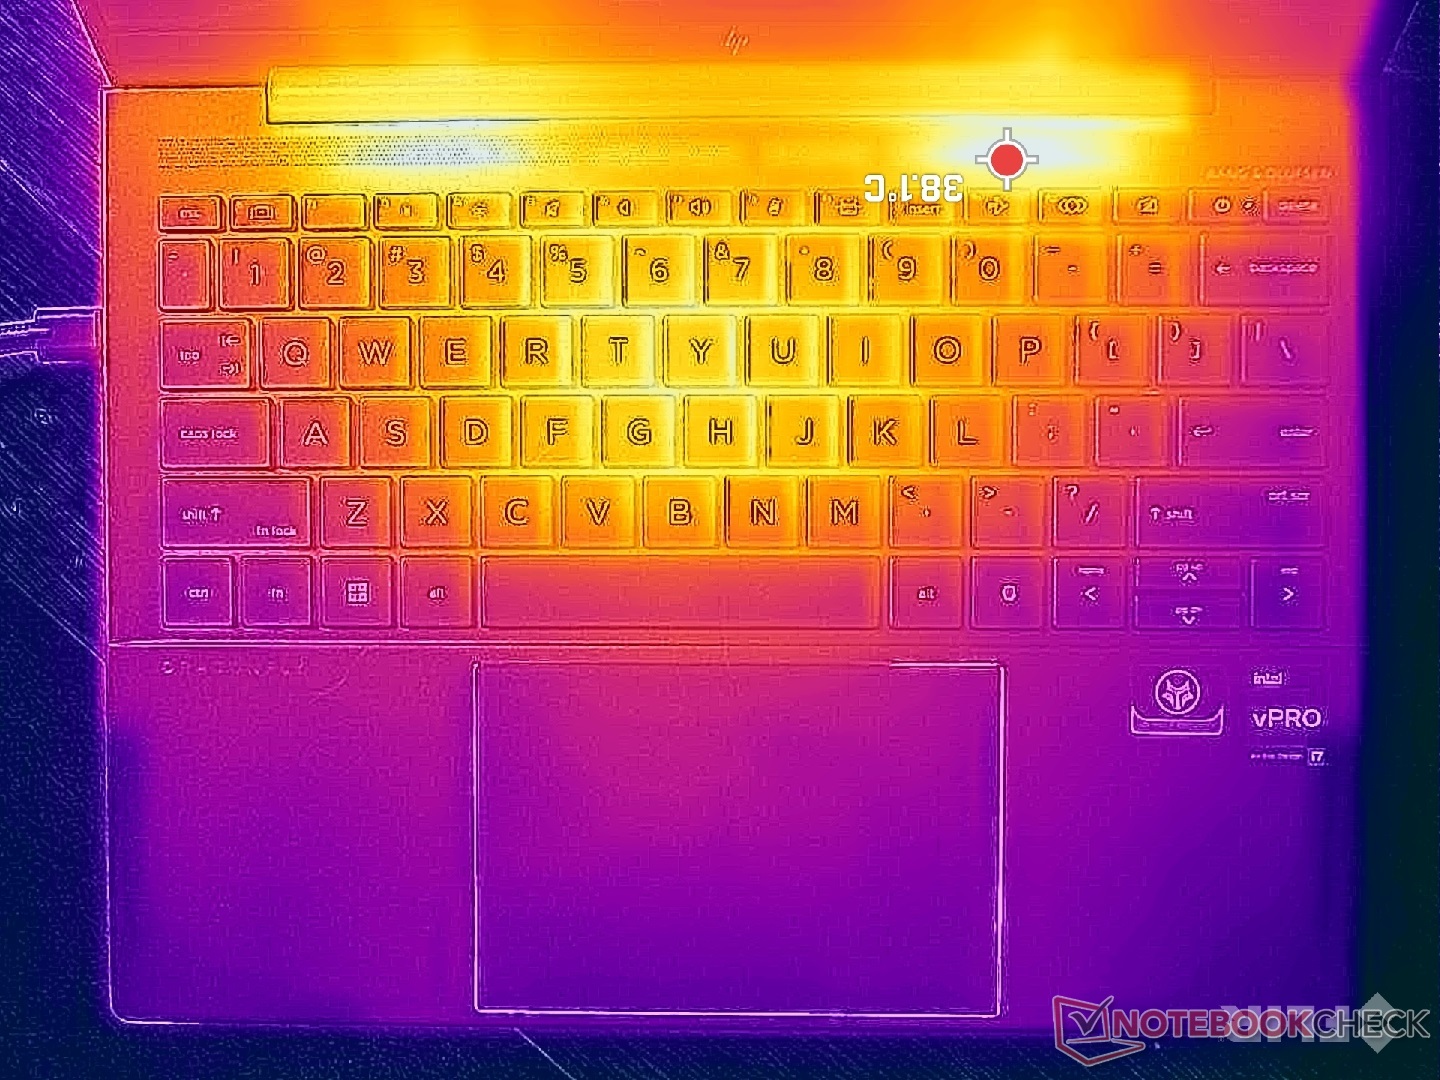
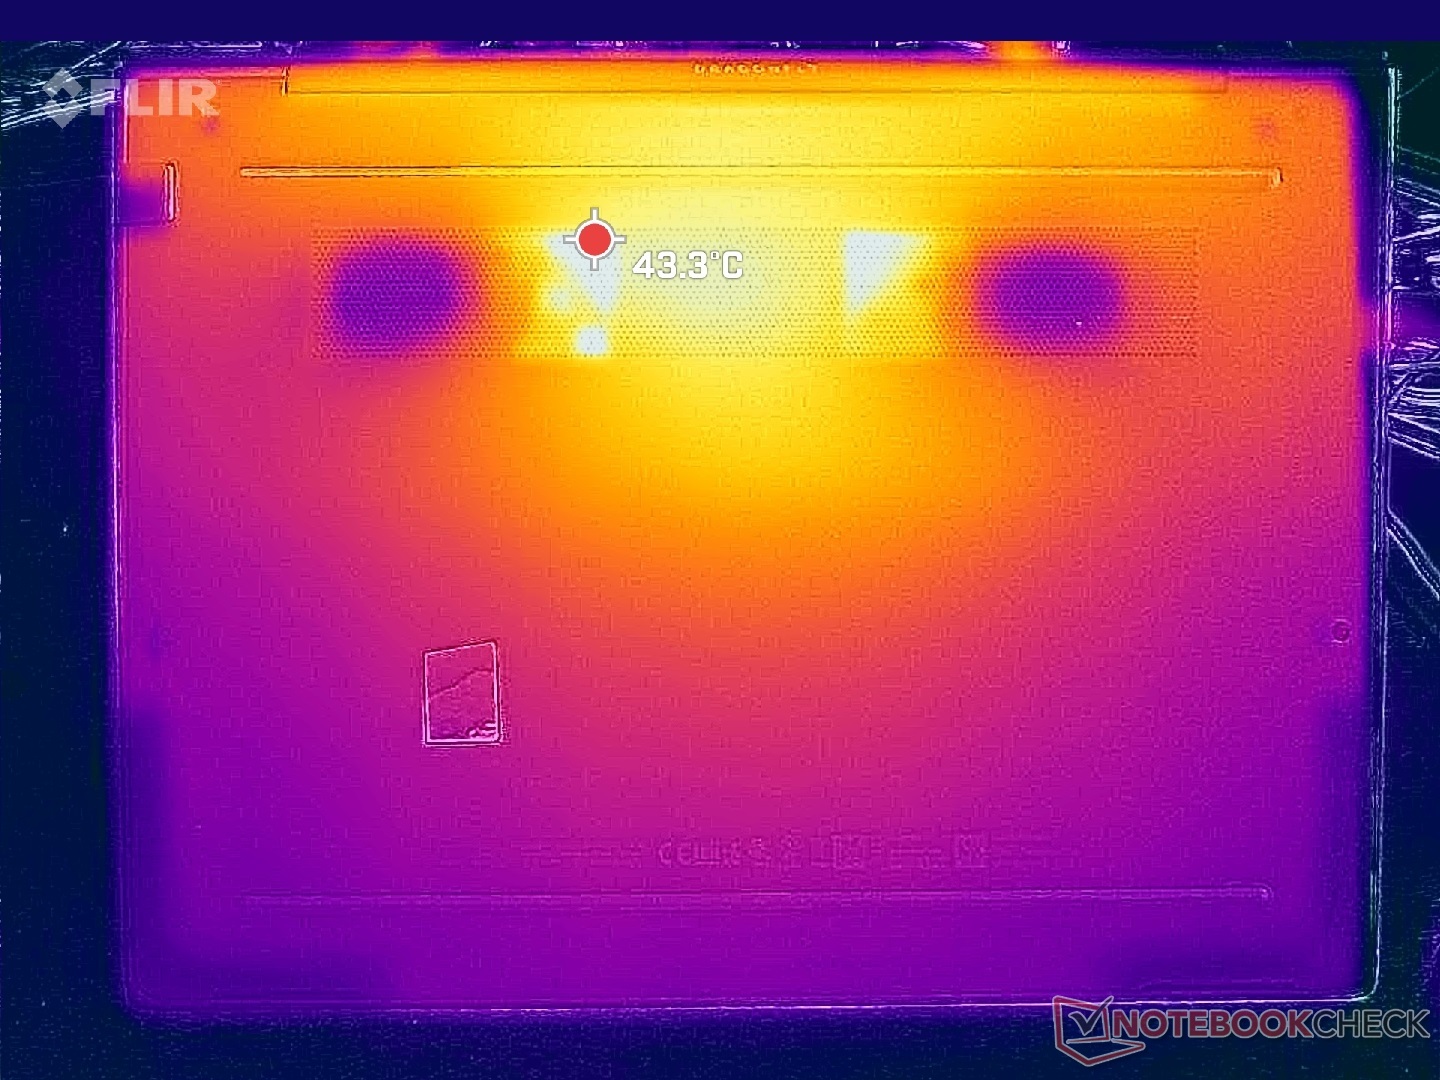
Température
Les températures de surface peuvent atteindre un peu plus de 40 °C en cas de forte charge, contre 45 °C sur le modèle plus rapide, leXPS 13 Plus ou même à 50°C sur le Latitude 13 9330. Les points chauds se situent à l'arrière du châssis, loin des repose-poignets et du pavé tactile.
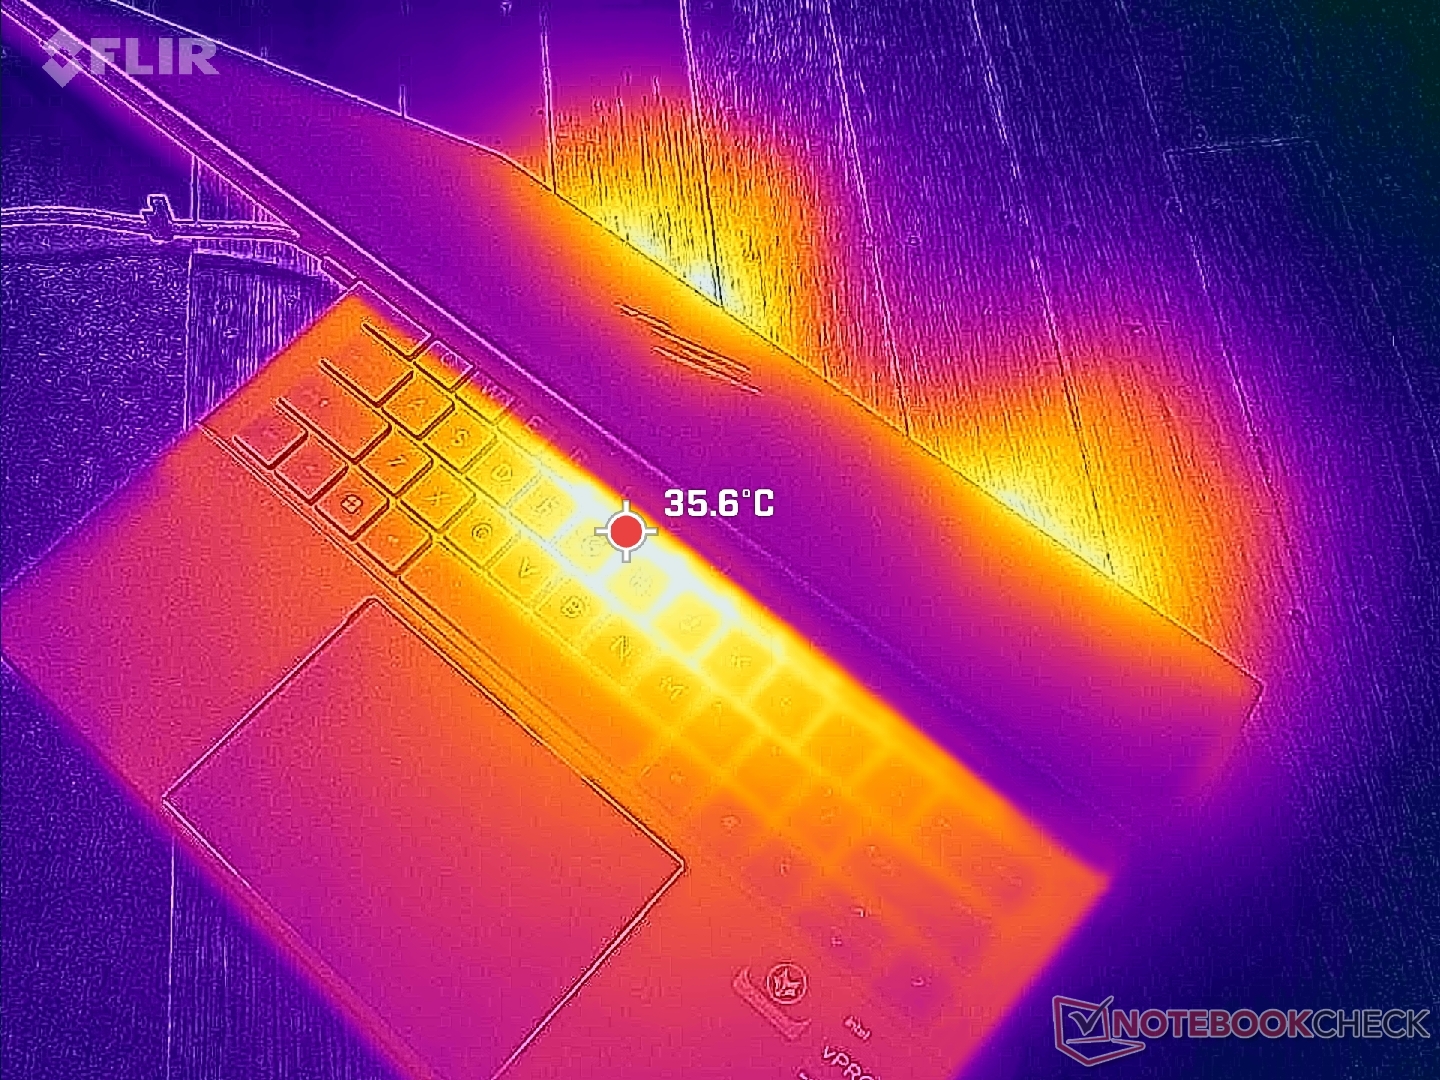
(+) La température maximale du côté supérieur est de 38.6 °C / 101 F, par rapport à la moyenne de 35.9 °C / 97 F, allant de 21.4 à 59 °C pour la classe Subnotebook.
(±) Le fond chauffe jusqu'à un maximum de 40.4 °C / 105 F, contre une moyenne de 39.2 °C / 103 F
(+) En utilisation inactive, la température moyenne du côté supérieur est de 26.5 °C / 80 F, par rapport à la moyenne du dispositif de 30.8 °C / 87 F.
(+) Les repose-poignets et le pavé tactile sont plus froids que la température de la peau avec un maximum de 27 °C / 80.6 F et sont donc froids au toucher.
(±) La température moyenne de la zone de l'appui-paume de dispositifs similaires était de 28.2 °C / 82.8 F (+1.2 °C / #2.2 F).
| HP Dragonfly G4 Intel Core i7-1365U, Intel Iris Xe Graphics G7 96EUs | HP Elite Dragonfly G3 Intel Core i7-1265U, Intel Iris Xe Graphics G7 96EUs | Framework Laptop 13.5 13th Gen Intel Intel Core i7-1370P, Intel Iris Xe Graphics G7 96EUs | Lenovo ThinkPad X13 G3 21CM002UGE AMD Ryzen 5 PRO 6650U, AMD Radeon 660M | Dell Latitude 9330 Intel Core i7-1260U, Intel Iris Xe Graphics G7 96EUs | Apple MacBook Air M2 Entry Apple M2, Apple M2 8-Core GPU | |
|---|---|---|---|---|---|---|
| Heat | 1% | 3% | -8% | -3% | 2% | |
| Maximum Upper Side * (°C) | 38.6 | 39 -1% | 38.2 1% | 38.1 1% | 40.6 -5% | 44.5 -15% |
| Maximum Bottom * (°C) | 40.4 | 42.2 -4% | 41.4 -2% | 40.1 1% | 50.2 -24% | 44.4 -10% |
| Idle Upper Side * (°C) | 28.2 | 26.8 5% | 25.8 9% | 33.6 -19% | 25 11% | 23.9 15% |
| Idle Bottom * (°C) | 29 | 28.2 3% | 27.6 5% | 33.4 -15% | 27.6 5% | 23.6 19% |
* ... Moindre est la valeur, meilleures sont les performances
Test de stress
Lors de l'exécution de Prime95 pour solliciter le CPU, les fréquences d'horloge et la consommation d'énergie de la carte atteignent respectivement 3,7 GHz et 51 W, tout en atteignant une température de 100 C. Une telle température n'est pas idéale pour la longévité du processeur et les fréquences d'horloge et la consommation d'énergie de la carte retombent rapidement à 2,3 GHz et 20 W afin de maintenir une température plus raisonnable de 76 C.
La fréquence d'horloge et la température du GPU Witcher 3 la fréquence d'horloge et la température du GPU se stabiliseraient à 1200 MHz et 69°C, respectivement, ce qui est similaire à ce que nous avons enregistré sur le récent ordinateur Dell Dell Latitude 7440.
L'utilisation de la batterie réduit légèrement les performances du processeur. Un test 3DMark 11 sur batterie donnerait des scores physiques et graphiques de 10619 et 5959 points, respectivement, contre 11465 et 5780 points sur secteur.
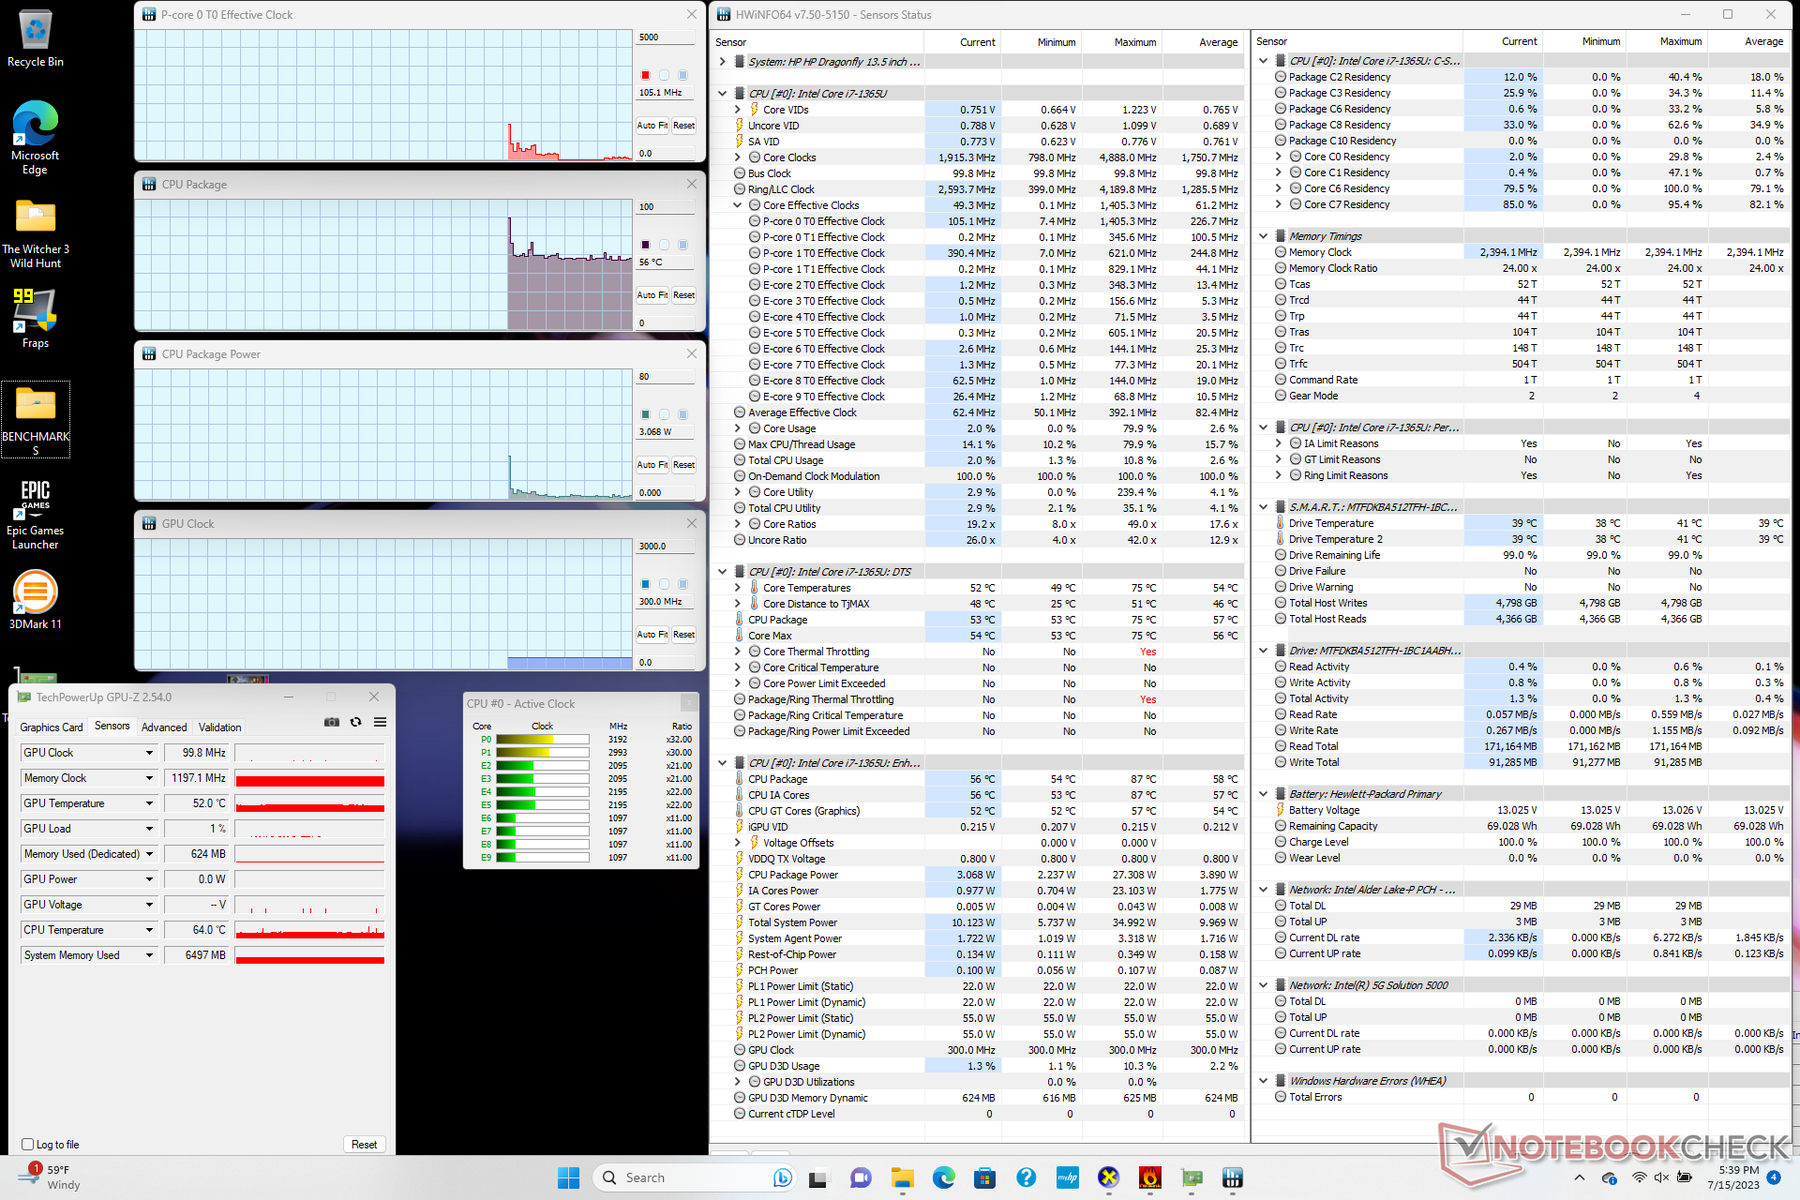
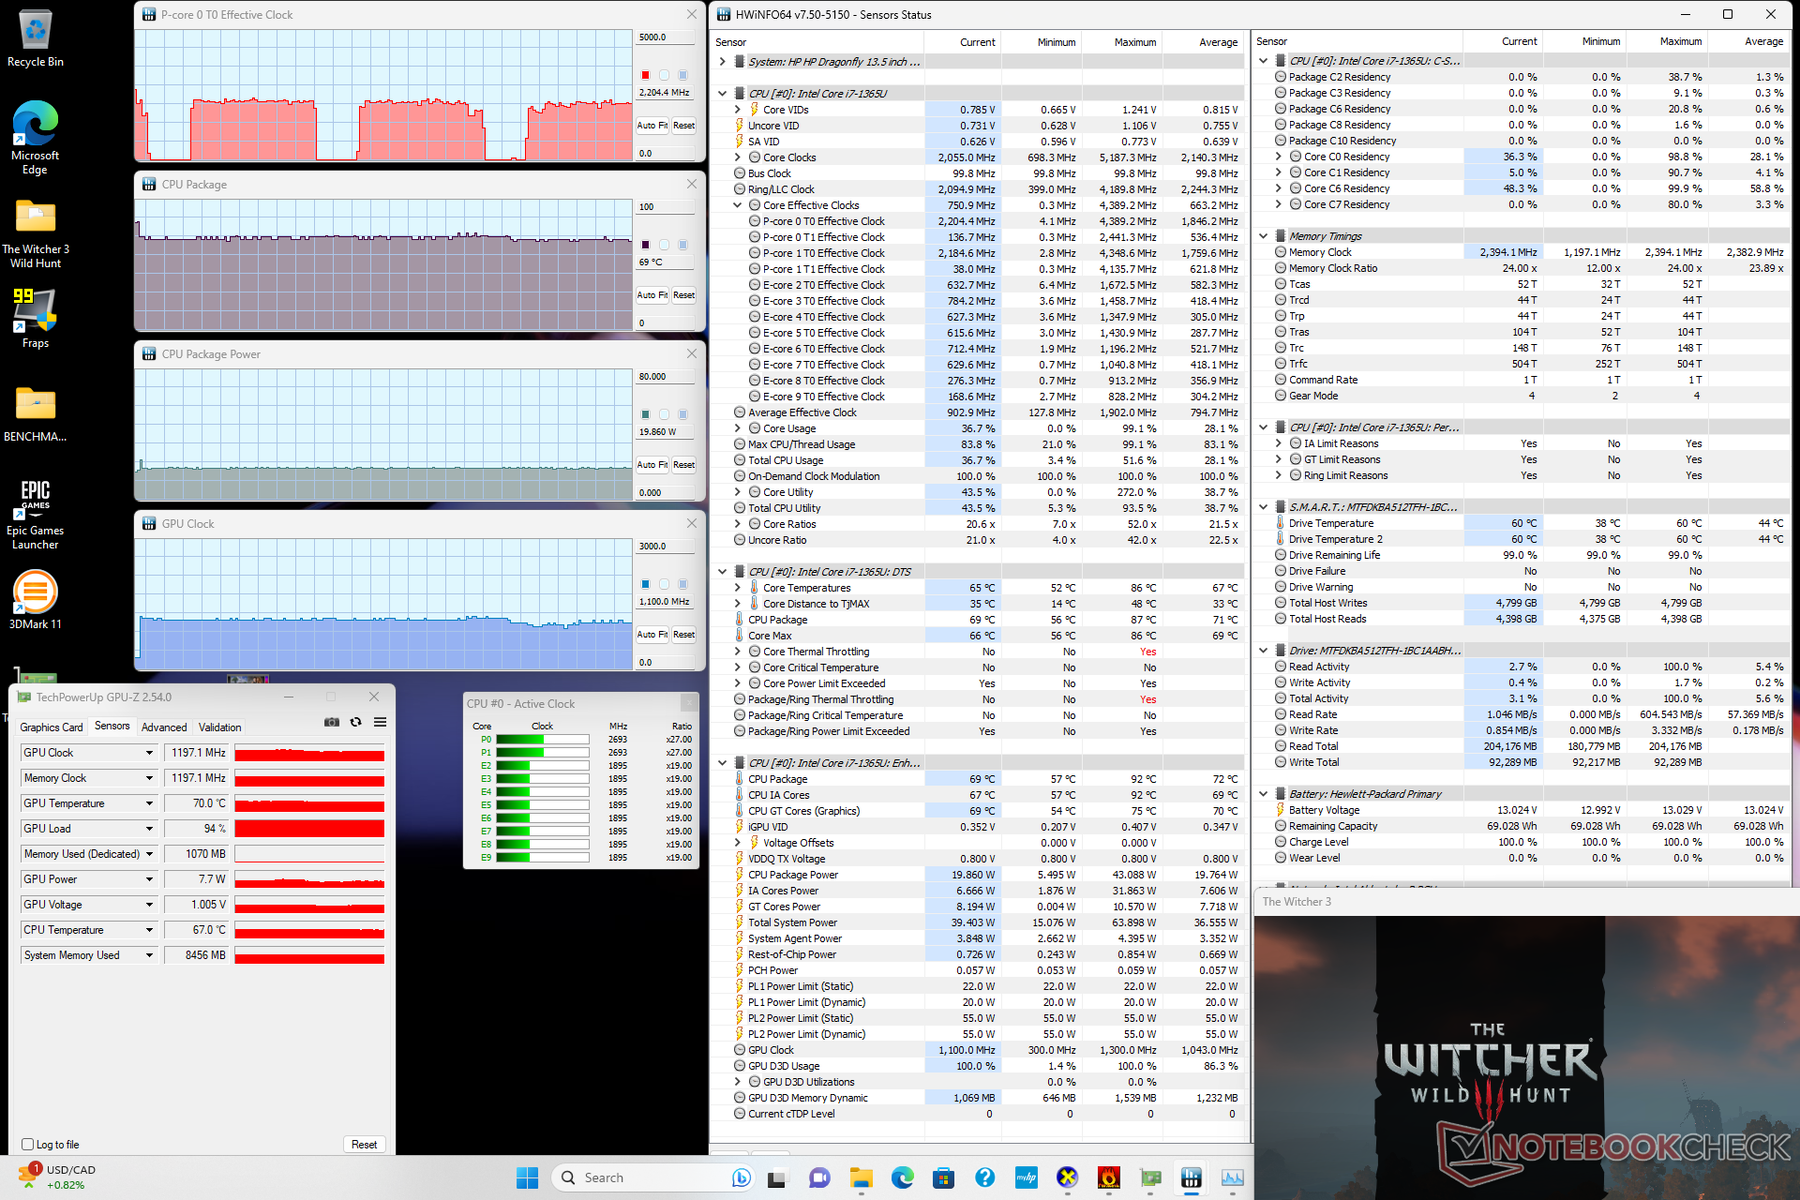
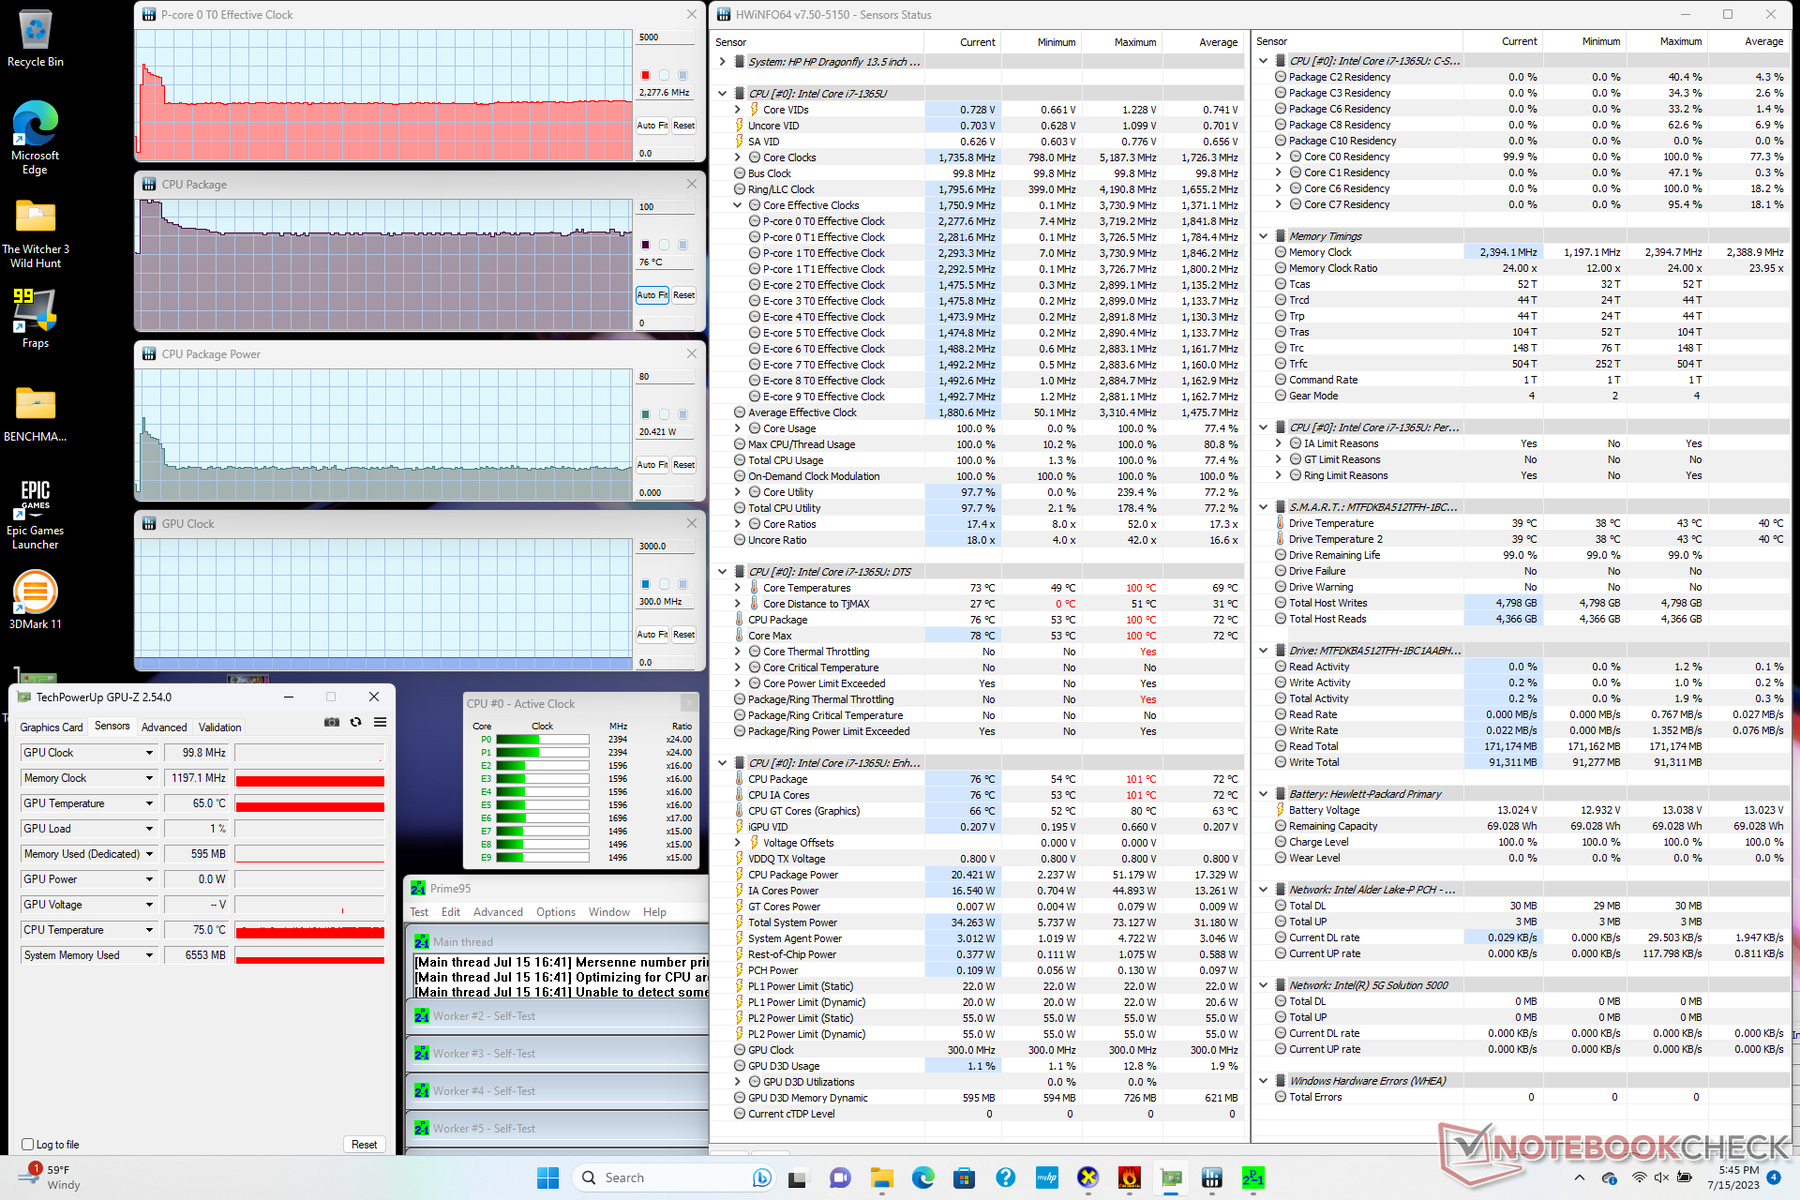
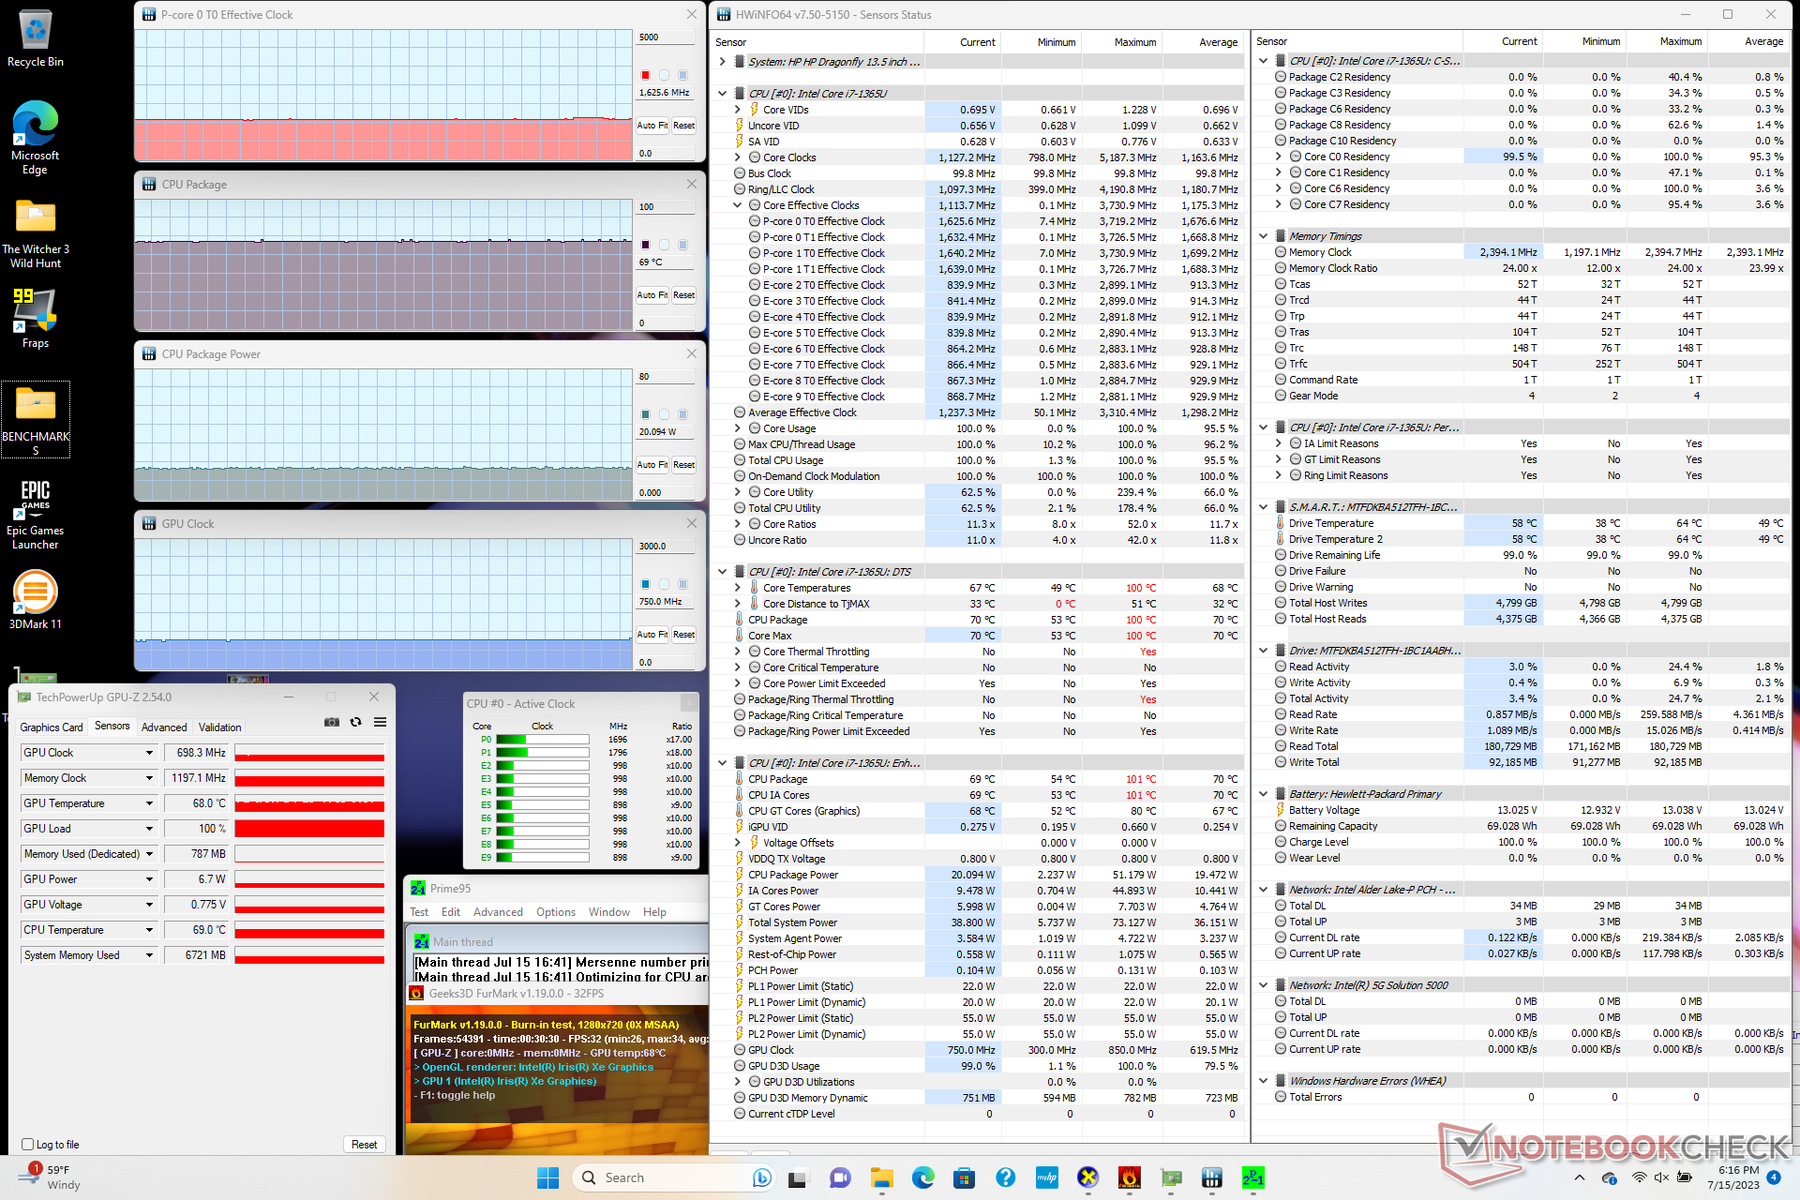
| Horloge du CPU (GHz) | Horloge du GPU (MHz) | Température moyenne du CPU (°C) | |
| Système au repos | -- | -- | 56 |
| Prime95 Stress | 2.3 | -- | 76 |
| Prime95 + FurMark Stress | 1.6 | 698 | 69 |
| Witcher 3 Stress | ~2.2 | 1197 | 69 |
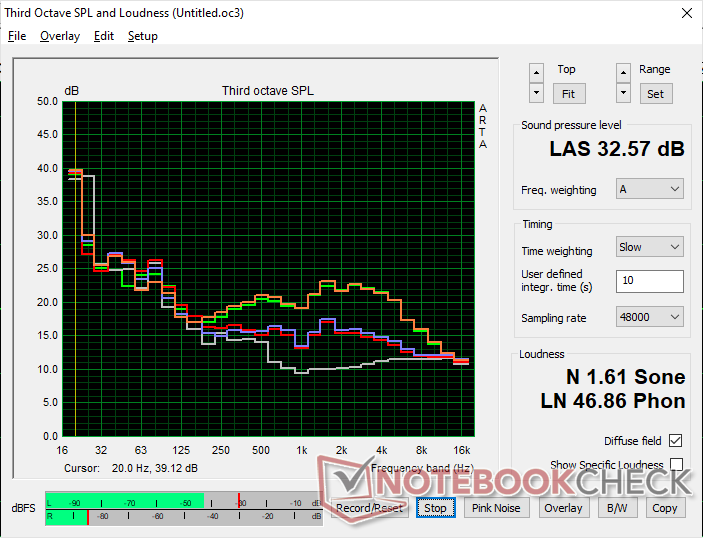
Intervenants
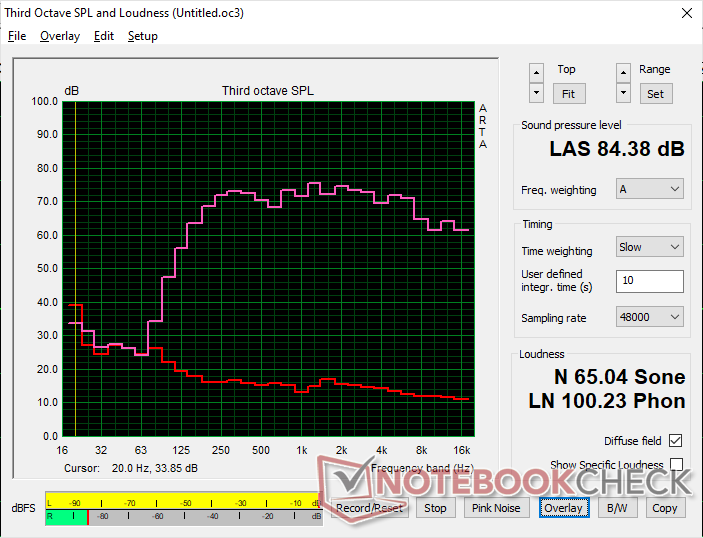
HP Dragonfly G4 analyse audio
(+) | les haut-parleurs peuvent jouer relativement fort (84.4# dB)
Basses 100 - 315 Hz
(±) | basse réduite - en moyenne 8.4% inférieure à la médiane
(±) | la linéarité des basses est moyenne (11.6% delta à la fréquence précédente)
Médiums 400 - 2000 Hz
(+) | médiane équilibrée - seulement 2.3% de la médiane
(+) | les médiums sont linéaires (4.8% delta à la fréquence précédente)
Aiguës 2 - 16 kHz
(+) | des sommets équilibrés - à seulement 3.2% de la médiane
(+) | les aigus sont linéaires (4.6% delta à la fréquence précédente)
Globalement 100 - 16 000 Hz
(+) | le son global est linéaire (9.1% différence à la médiane)
Par rapport à la même classe
» 4% de tous les appareils testés de cette catégorie étaient meilleurs, 1% similaires, 95% pires
» Le meilleur avait un delta de 5%, la moyenne était de 18%, le pire était de 53%.
Par rapport à tous les appareils testés
» 3% de tous les appareils testés étaient meilleurs, 1% similaires, 96% pires
» Le meilleur avait un delta de 4%, la moyenne était de 23%, le pire était de 134%.
Apple MacBook Pro 16 2021 M1 Pro analyse audio
(+) | les haut-parleurs peuvent jouer relativement fort (84.7# dB)
Basses 100 - 315 Hz
(+) | bonne basse - seulement 3.8% loin de la médiane
(+) | les basses sont linéaires (5.2% delta à la fréquence précédente)
Médiums 400 - 2000 Hz
(+) | médiane équilibrée - seulement 1.3% de la médiane
(+) | les médiums sont linéaires (2.1% delta à la fréquence précédente)
Aiguës 2 - 16 kHz
(+) | des sommets équilibrés - à seulement 1.9% de la médiane
(+) | les aigus sont linéaires (2.7% delta à la fréquence précédente)
Globalement 100 - 16 000 Hz
(+) | le son global est linéaire (4.6% différence à la médiane)
Par rapport à la même classe
» 0% de tous les appareils testés de cette catégorie étaient meilleurs, 0% similaires, 100% pires
» Le meilleur avait un delta de 5%, la moyenne était de 17%, le pire était de 45%.
Par rapport à tous les appareils testés
» 0% de tous les appareils testés étaient meilleurs, 0% similaires, 100% pires
» Le meilleur avait un delta de 4%, la moyenne était de 23%, le pire était de 134%.
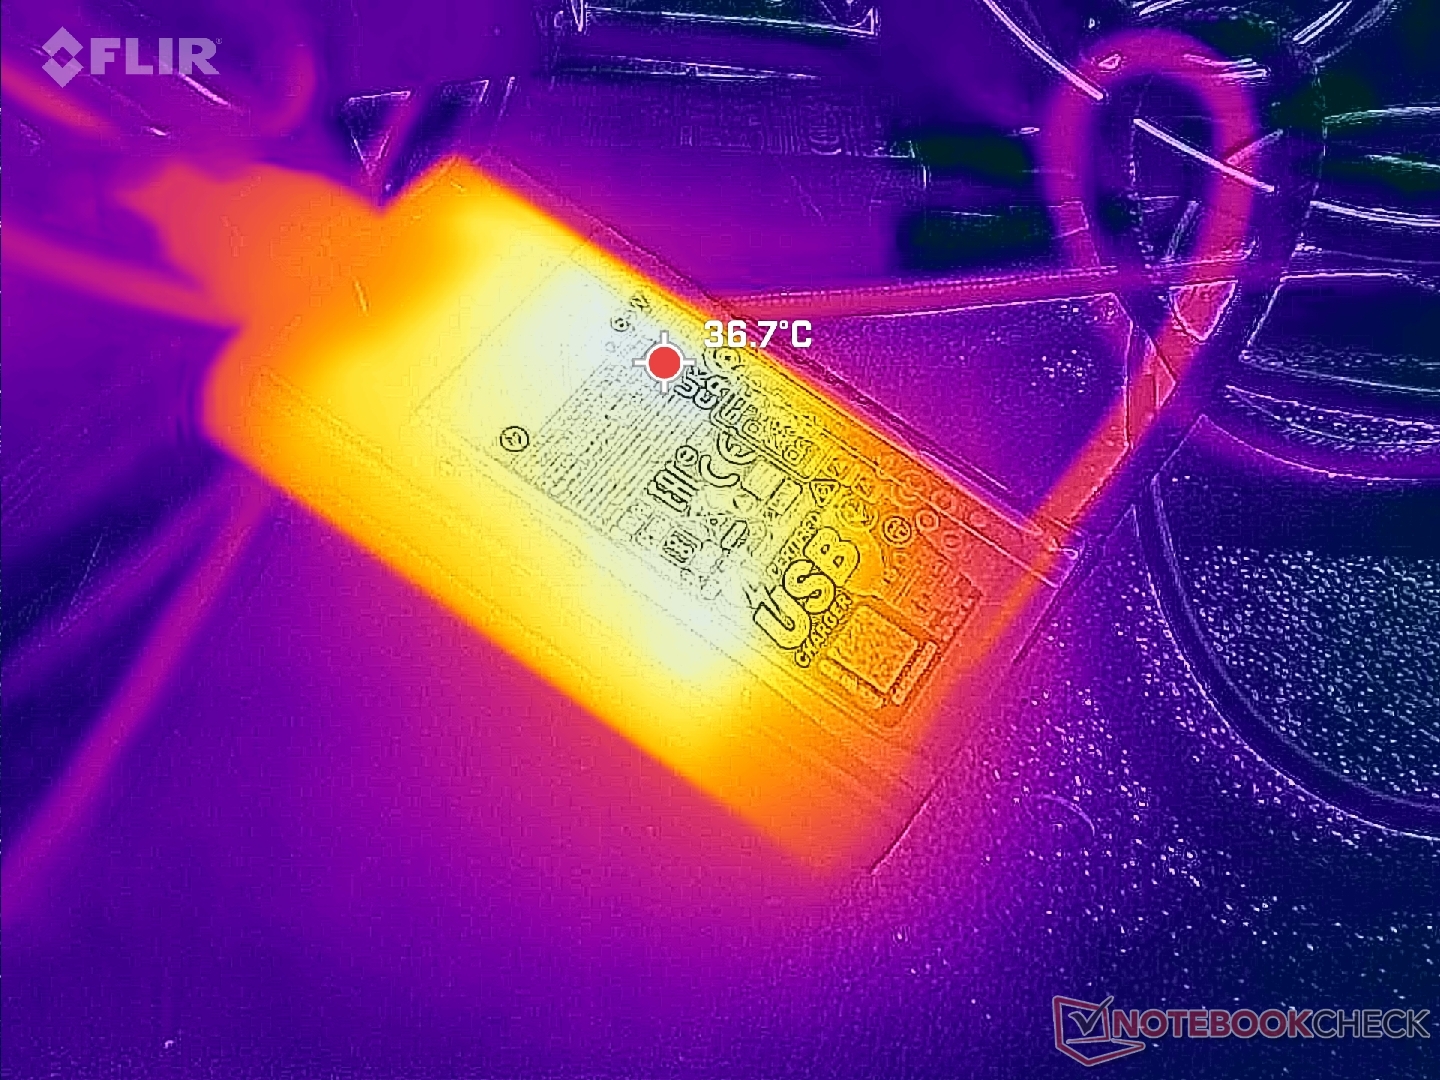
Gestion de l'énergie
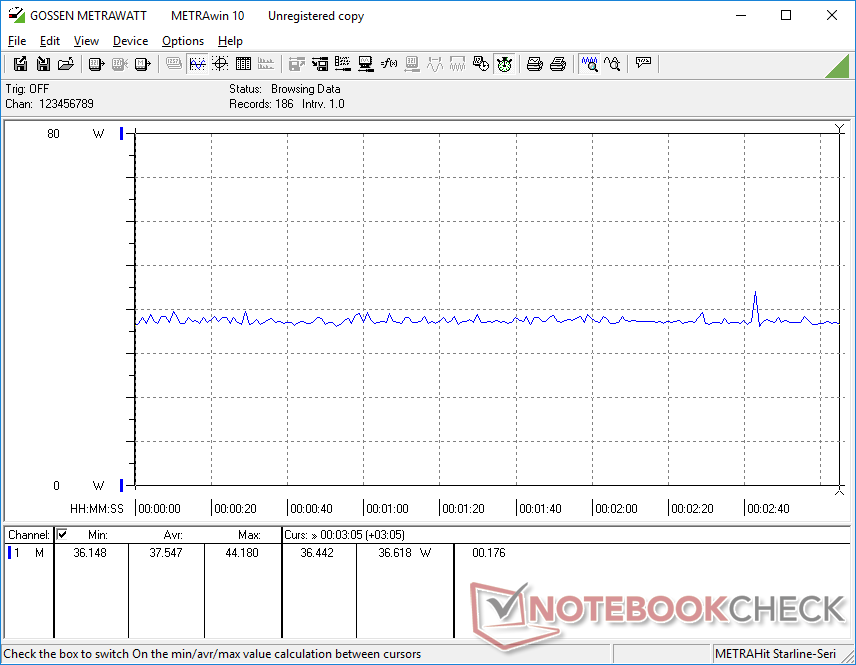
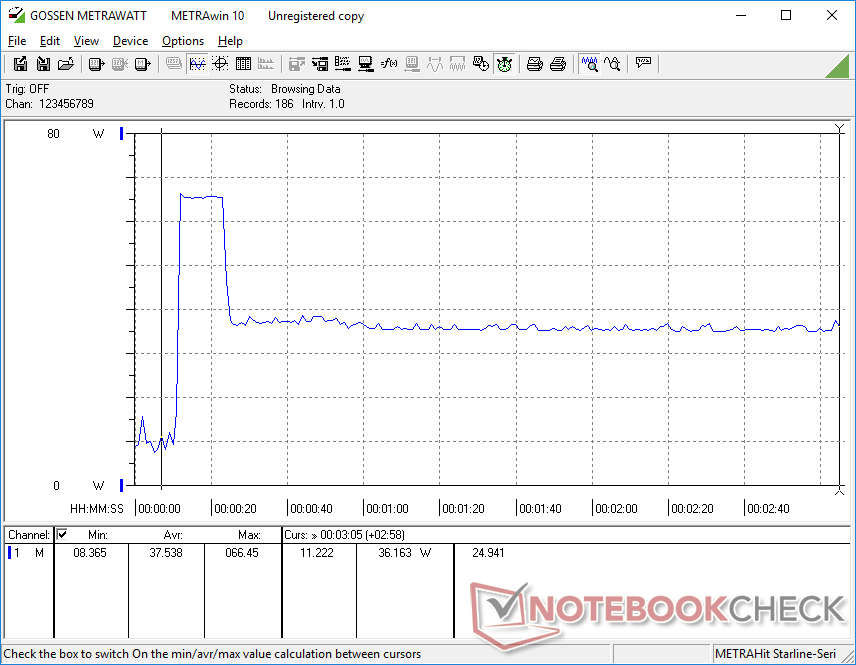
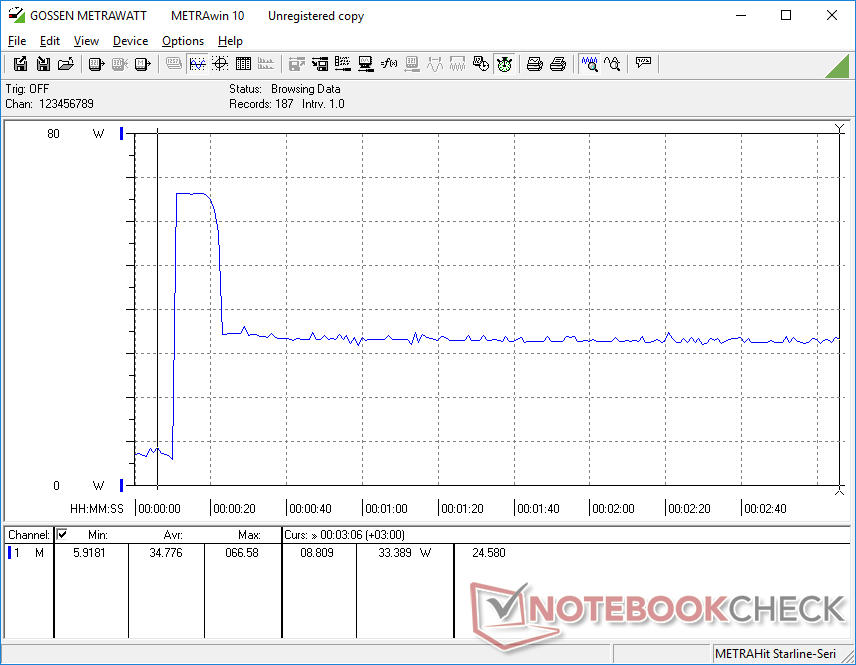
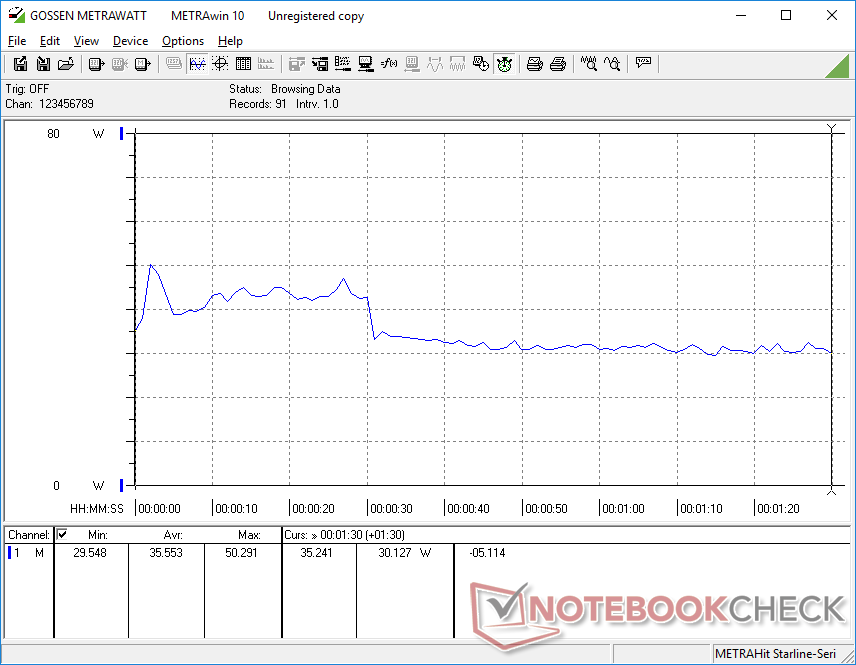
Consommation électrique
La consommation globale est presque identique à celle du Dragonfly G3, ce qui est normal puisque les deux modèles partagent le même écran, le même SSD, le même châssis, et même les mêmes cibles PL2 et PL1 selon les résultats de nos tests de stress ci-dessus. La performance par watt est donc à peu près la même, voire légèrement meilleure, quand on passe du Core i7-1265U au Core i7-1365U. Les ordinateurs portables équipés de la Radeon 680M concurrente, comme le Acer Swift Edge SFE16 consomment plus d'énergie en charge mais sont capables d'offrir des performances GPU beaucoup plus rapides pour compenser.
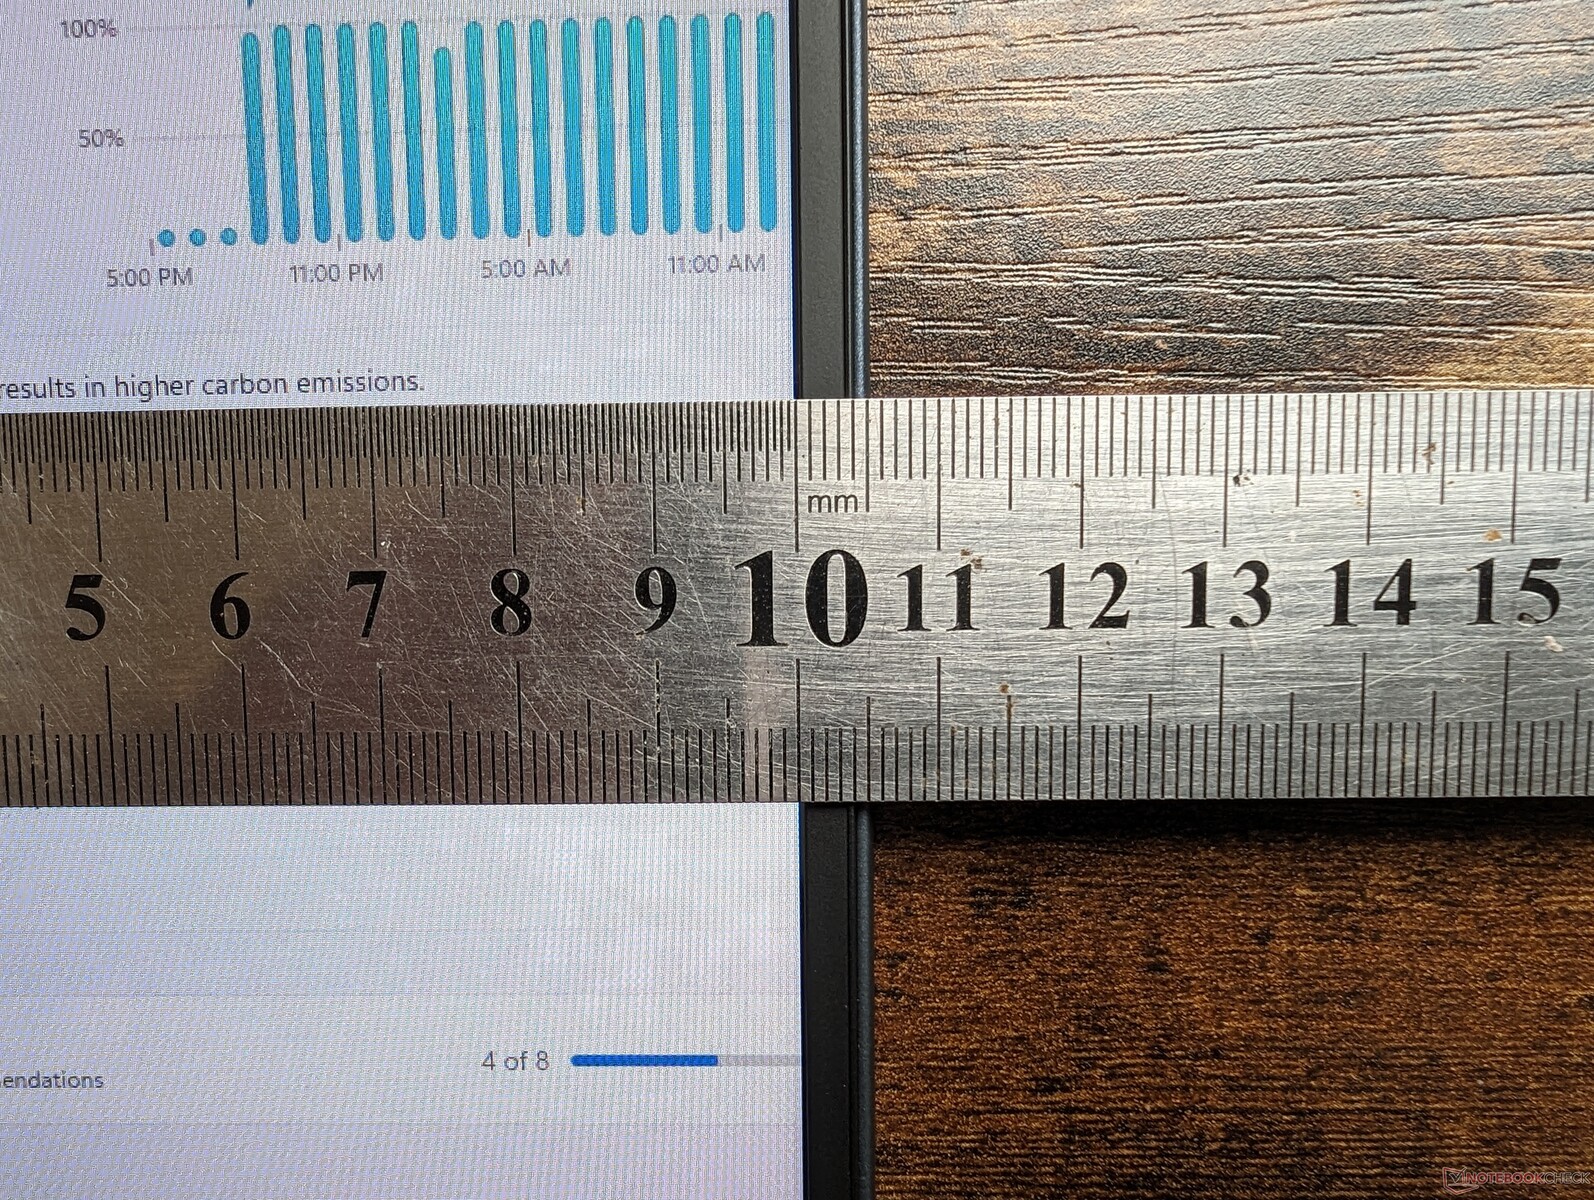
Nous sommes en mesure de mesurer une consommation maximale temporaire de 67 W à partir du petit (~9,8 x 5,3 x 2 cm) adaptateur secteur USB-C de 65 W.
| Éteint/en veille | |
| Au repos | |
| Fortement sollicité |
|
Légende:
min: | |
| HP Dragonfly G4 i7-1365U, Iris Xe G7 96EUs, Micron 3400 MTFDKBA512TFH 512GB, IPS, 1920x1280, 13.5" | HP Elite Dragonfly G3 i7-1265U, Iris Xe G7 96EUs, Micron 3400 MTFDKBA512TFH 512GB, IPS, 1920x1280, 13.5" | Framework Laptop 13.5 13th Gen Intel i7-1370P, Iris Xe G7 96EUs, WD PC SN740 SDDPNQD-1T00, IPS, 2256x1504, 13.5" | Lenovo ThinkPad X13 G3 21CM002UGE R5 PRO 6650U, Radeon 660M, Samsung PM9A1 MZVL2512HCJQ, IPS LED, 1920x1200, 13.3" | Dell Latitude 9330 i7-1260U, Iris Xe G7 96EUs, , IPS, 2560x1600, 13.3" | Apple MacBook Air M2 Entry M2, M2 8-Core GPU, Apple SSD AP0256Z, IPS, 2560x1664, 13.6" | |
|---|---|---|---|---|---|---|
| Power Consumption | 5% | -13% | 18% | 2% | 20% | |
| Idle Minimum * (Watt) | 4.1 | 3.4 17% | 2.9 29% | 3.2 22% | 4.7 -15% | 1.87 54% |
| Idle Average * (Watt) | 7.5 | 5.6 25% | 6.3 16% | 5.2 31% | 8.2 -9% | 9.2 -23% |
| Idle Maximum * (Watt) | 8.2 | 8.4 -2% | 9.9 -21% | 6.1 26% | 8.4 -2% | 9.3 -13% |
| Load Average * (Watt) | 35.5 | 40.8 -15% | 56.2 -58% | 33.6 5% | 36.8 -4% | 28.5 20% |
| Witcher 3 ultra * (Watt) | 37.5 | 35.5 5% | 56.6 -51% | 39.3 -5% | 30.4 19% | 27.4 27% |
| Load Maximum * (Watt) | 66.5 | 68.4 -3% | 60.8 9% | 49.1 26% | 49.9 25% | 31 53% |
* ... Moindre est la valeur, meilleures sont les performances
Power Consumption Witcher 3 / Stresstest
Power Consumption external Monitor
Autonomie de la batterie
La capacité de la batterie reste la même que sur le Dragonfly G3, à savoir 68 Wh. L'autonomie du réseau local sans fil est cependant plus longue sur le nouveau modèle, avec un total de près de 16 heures avant l'arrêt automatique. C'est plusieurs heures de plus que sur la plupart des autres ordinateurs portables Windows et c'est comparable au MacBook Air M2.
Il faut environ 90 minutes pour recharger l'appareil de sa capacité maximale.
| HP Dragonfly G4 i7-1365U, Iris Xe G7 96EUs, 68 Wh | HP Elite Dragonfly G3 i7-1265U, Iris Xe G7 96EUs, 68 Wh | Framework Laptop 13.5 13th Gen Intel i7-1370P, Iris Xe G7 96EUs, 61 Wh | Lenovo ThinkPad X13 G3 21CM002UGE R5 PRO 6650U, Radeon 660M, 54.7 Wh | Dell Latitude 9330 i7-1260U, Iris Xe G7 96EUs, 50 Wh | Apple MacBook Air M2 Entry M2, M2 8-Core GPU, 52.6 Wh | |
|---|---|---|---|---|---|---|
| Autonomie de la batterie | -9% | -45% | -37% | -44% | -15% | |
| Reader / Idle (h) | 42.5 | 37.8 -11% | 15.4 -64% | |||
| WiFi v1.3 (h) | 15.9 | 11.8 -26% | 8.8 -45% | 12.5 -21% | 9.4 -41% | 15.2 -4% |
| Load (h) | 3.2 | 3.5 9% | 1.5 -53% | 2.3 -28% | 2.4 -25% | |
| H.264 (h) | 16.5 |
Points positifs
Points négatifs
Verdict - La 13e génération d'Intel n'apporte qu'un petit coup de pouce
A l'instar de nos conclusions sur le 2023 Dell XPS 13 Plusle Dragonfly G4 2023 n'est qu'une mise à jour mineure par rapport à l'Elite Dragonfly G3 de l'année dernière Elite Dragonfly G3. Tellement mineure, en fait, que la plupart des utilisateurs ne remarqueront probablement pas le petit écart de performance entre les CPU de 12e génération du Dragonfly G3 et les options de 13e génération du Dragonfly G4. D'autres aspects du modèle, comme les options d'affichage, n'ont pas changé, tandis que le nouveau logiciel Power Manager ne change pas grand-chose à la donne.
Le Dragonfly G4 est une mise à jour mineure du déjà excellent Dragonfly G3. Si le nouveau processeur n'est pas attrayant, le Dragonfly G3 peut offrir essentiellement la même expérience.
Les petites mises à jour de cette année ne sont pas inattendues puisque le Dragonfly G3 a déjà été complètement redessiné et qu'il a à peine un an. Nous avons fait l'éloge du Dragonfly G3 pour ses fonctionnalités, ses caractéristiques et son apparence, et le Dragonfly G4 ne fait que renforcer ces points forts. Les acheteurs intéressés peuvent donc envisager le Dragonfly G3 2022, moins cher, car le Dragonfly G4 2023 n'apporte pas grand-chose de plus. Pour une augmentation plus importante des performances, les utilisateurs peuvent considérer leFramework 13.5 ou l'Asus Zenbook S 13.5Asus Zenbook S 13 qui offrent tous deux des options de CPU au-delà de la série Core-U.
Prix et disponibilité
HP livre maintenant le Dragonfly G4 à partir de 1300 USD pour la configuration de base Core i5 et 1280p jusqu'à 2400 USD lorsqu'il est entièrement configuré.
HP Dragonfly G4
- 07/18/2023 v7 (old)
Allen Ngo
Transparency
La sélection des appareils à examiner est effectuée par notre équipe éditoriale. L'échantillon de test a été prêté à l'auteur par le fabricant ou le détaillant pour les besoins de cet examen. Le prêteur n'a pas eu d'influence sur cette évaluation et le fabricant n'a pas reçu de copie de cette évaluation avant sa publication. Il n'y avait aucune obligation de publier cet article. En tant que média indépendant, Notebookcheck n'est pas soumis à l'autorité des fabricants, des détaillants ou des éditeurs.
Voici comment Notebookcheck teste
Chaque année, Notebookcheck examine de manière indépendante des centaines d'ordinateurs portables et de smartphones en utilisant des procédures standardisées afin de garantir que tous les résultats sont comparables. Nous avons continuellement développé nos méthodes de test depuis environ 20 ans et avons établi des normes industrielles dans le processus. Dans nos laboratoires de test, des équipements de mesure de haute qualité sont utilisés par des techniciens et des rédacteurs expérimentés. Ces tests impliquent un processus de validation en plusieurs étapes. Notre système d'évaluation complexe repose sur des centaines de mesures et de points de référence bien fondés, ce qui garantit l'objectivité.Price comparison

