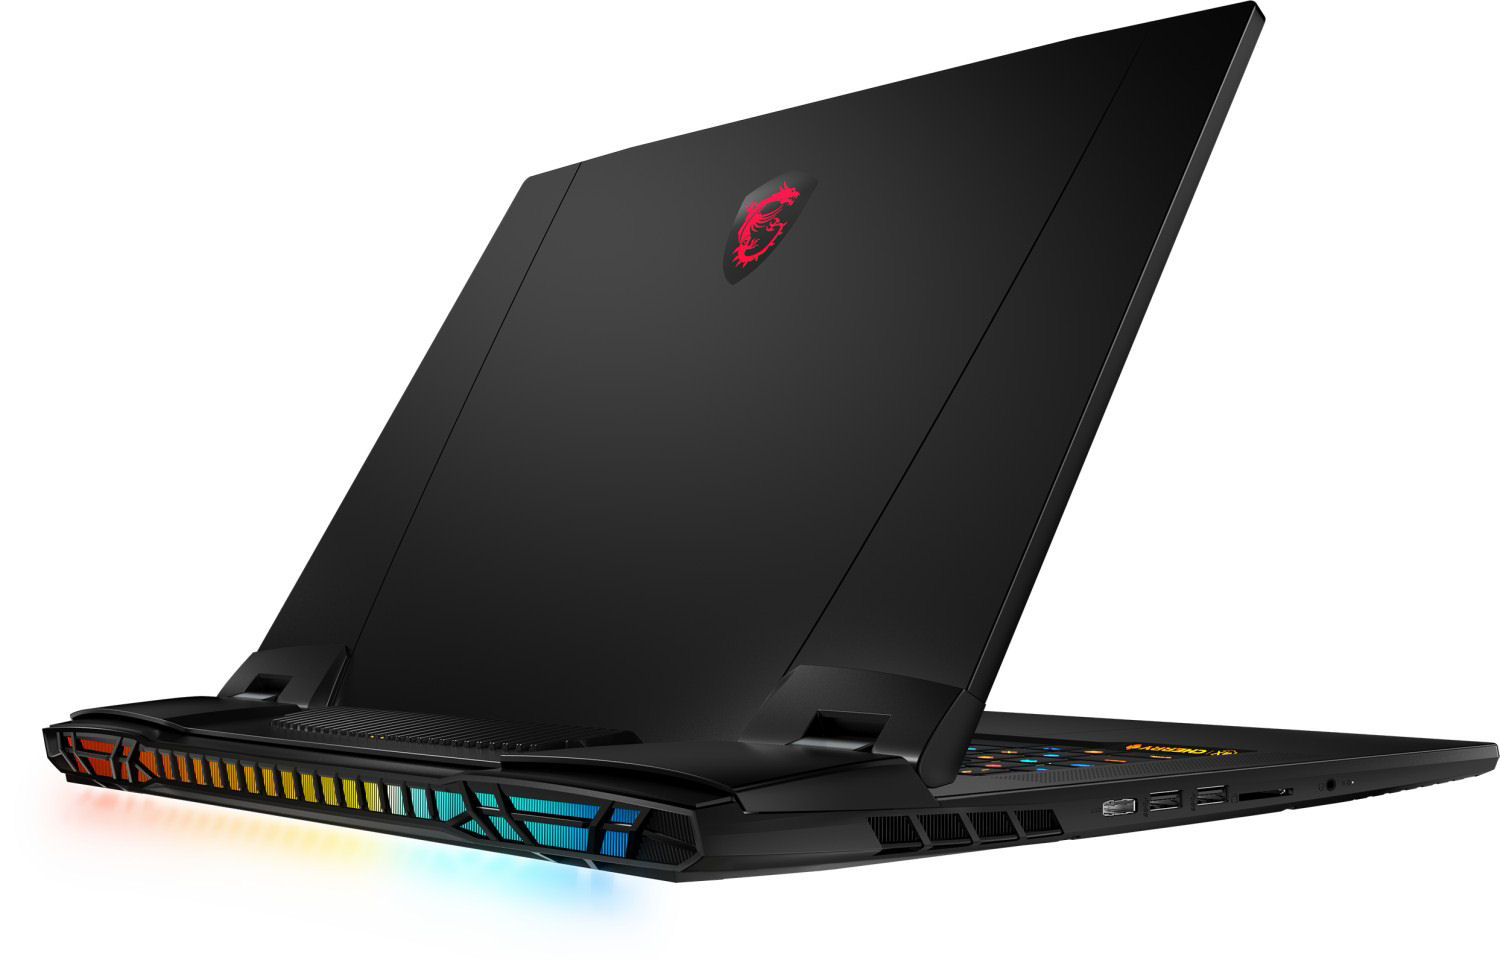
Test du MSI Titan GT77 12UHS 4K : l'élite des ordinateurs portables UHD DTR
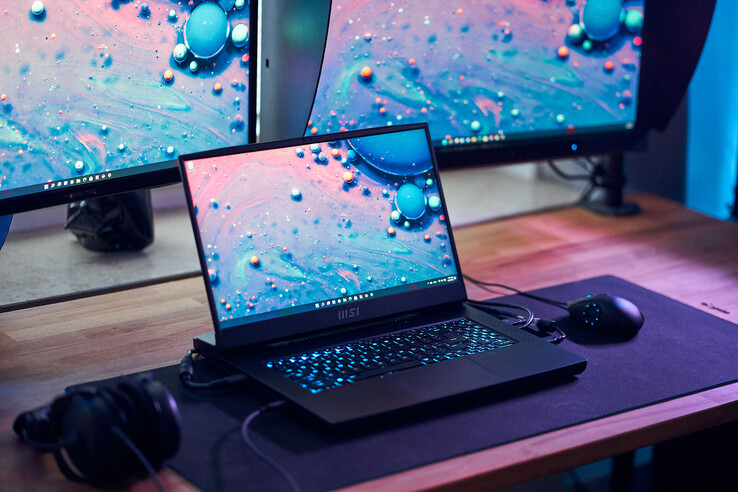
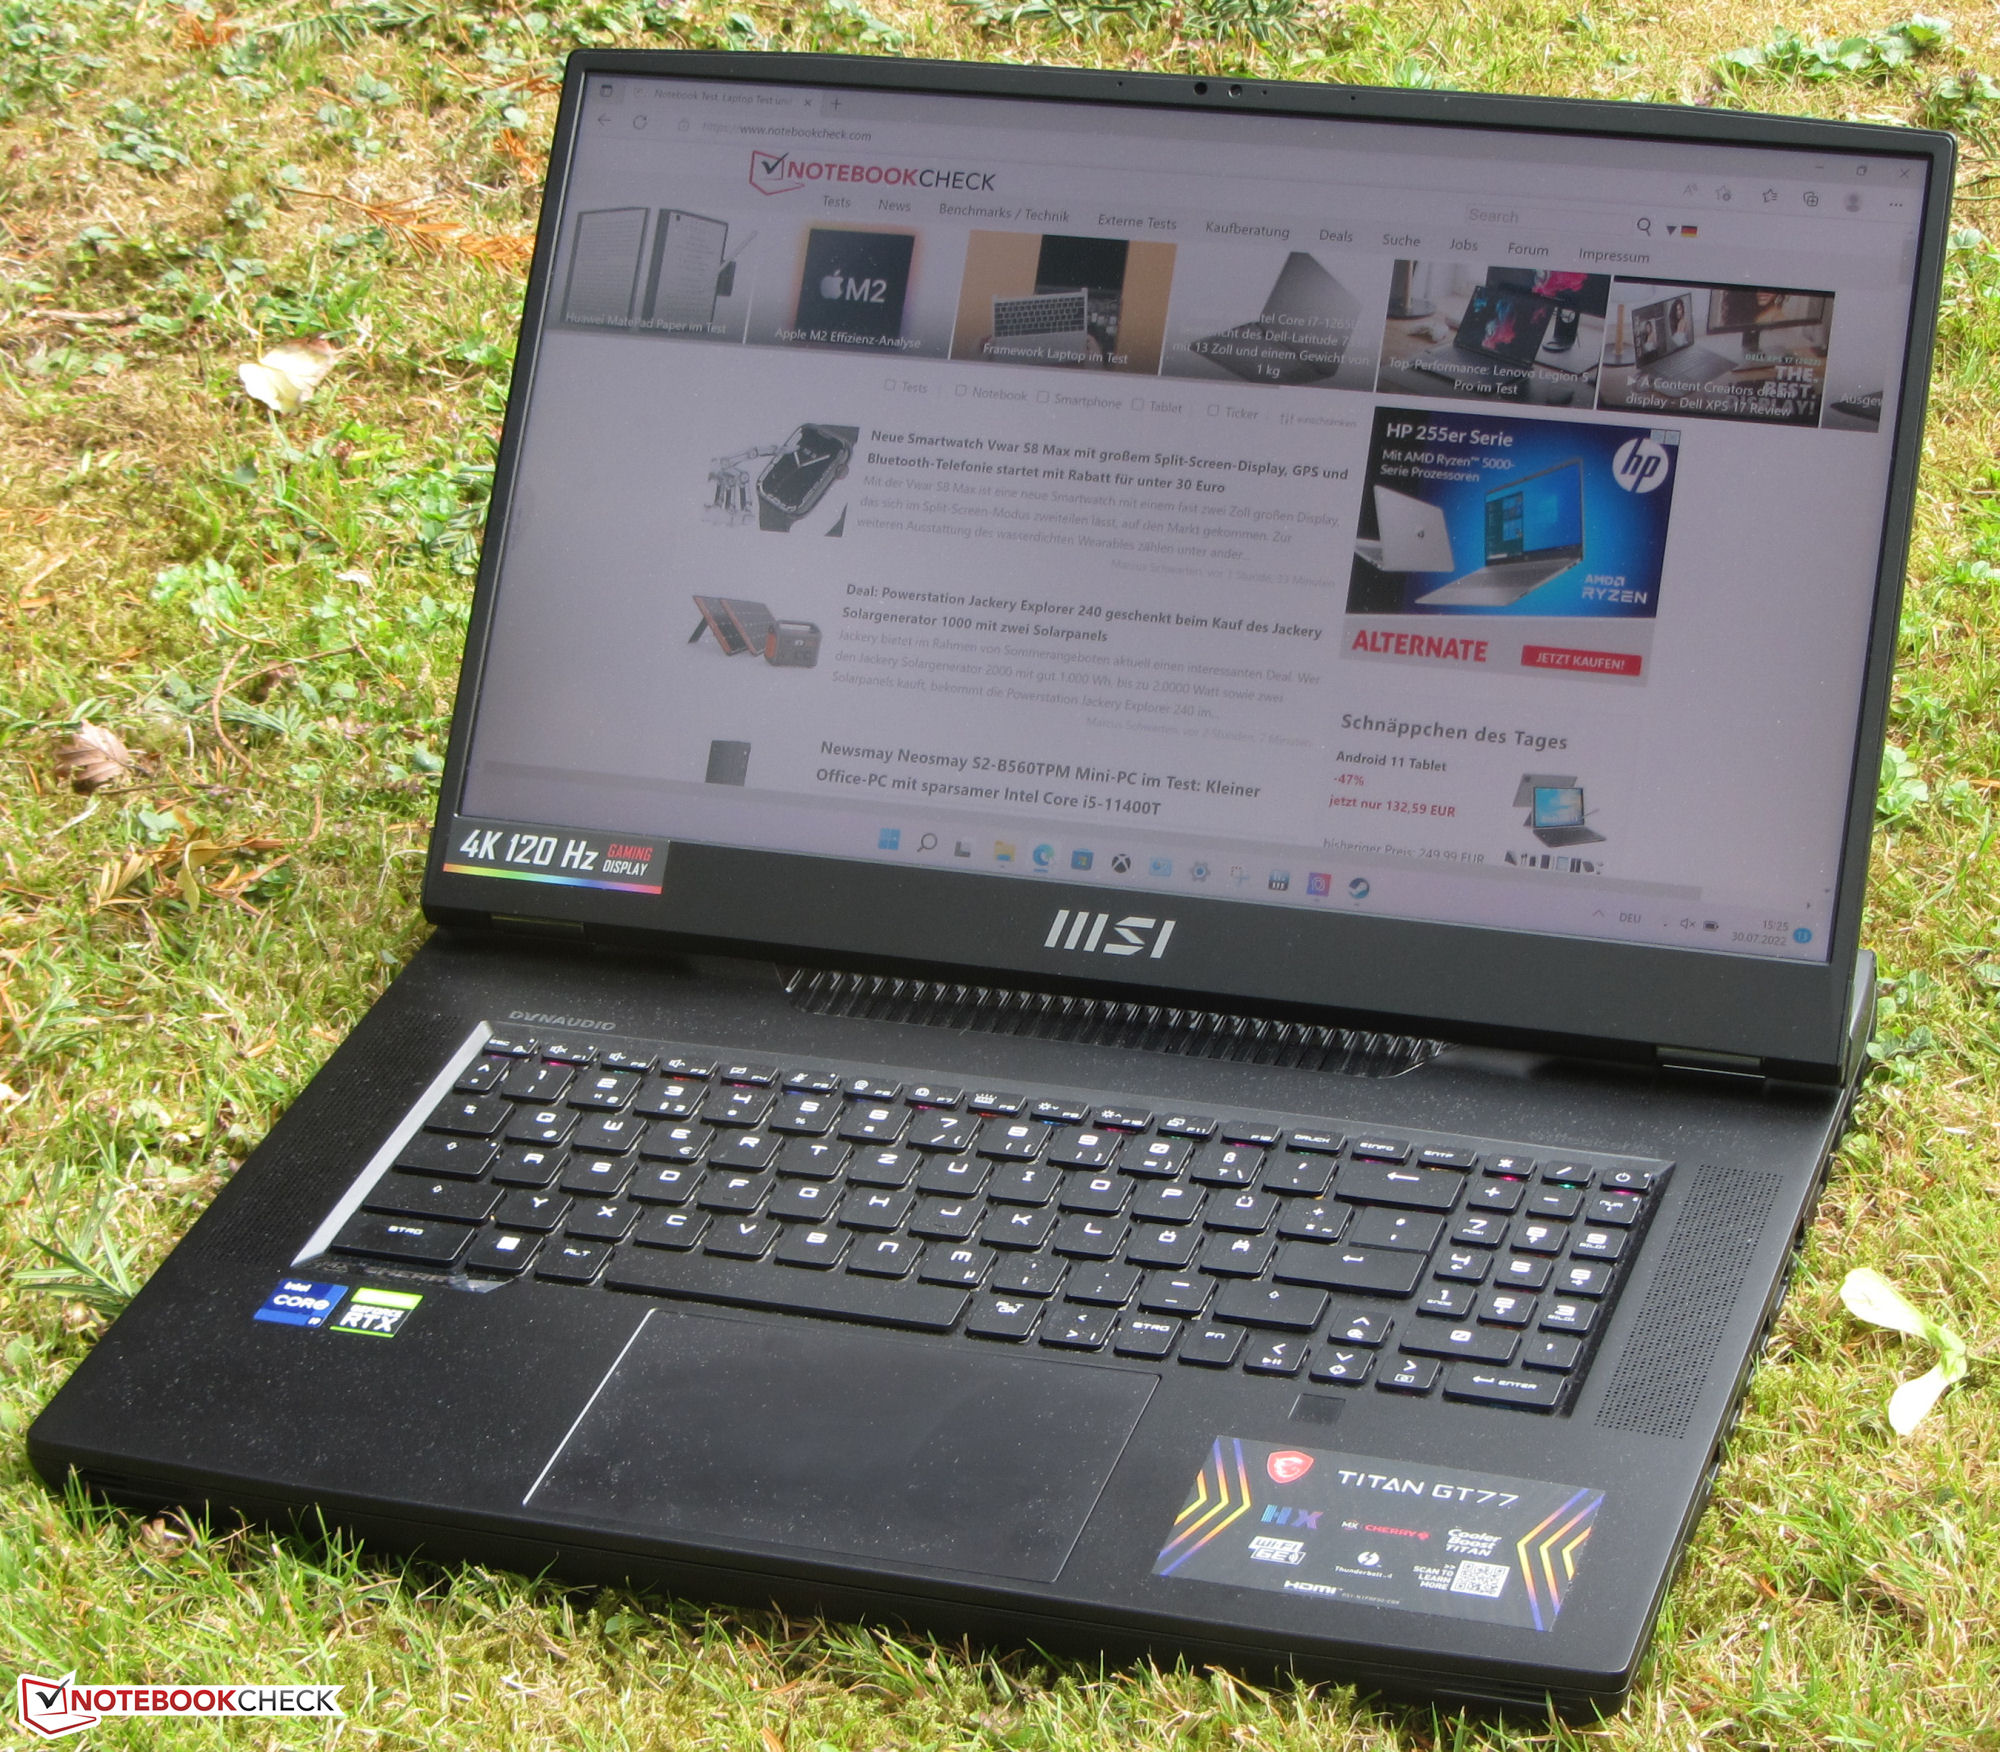
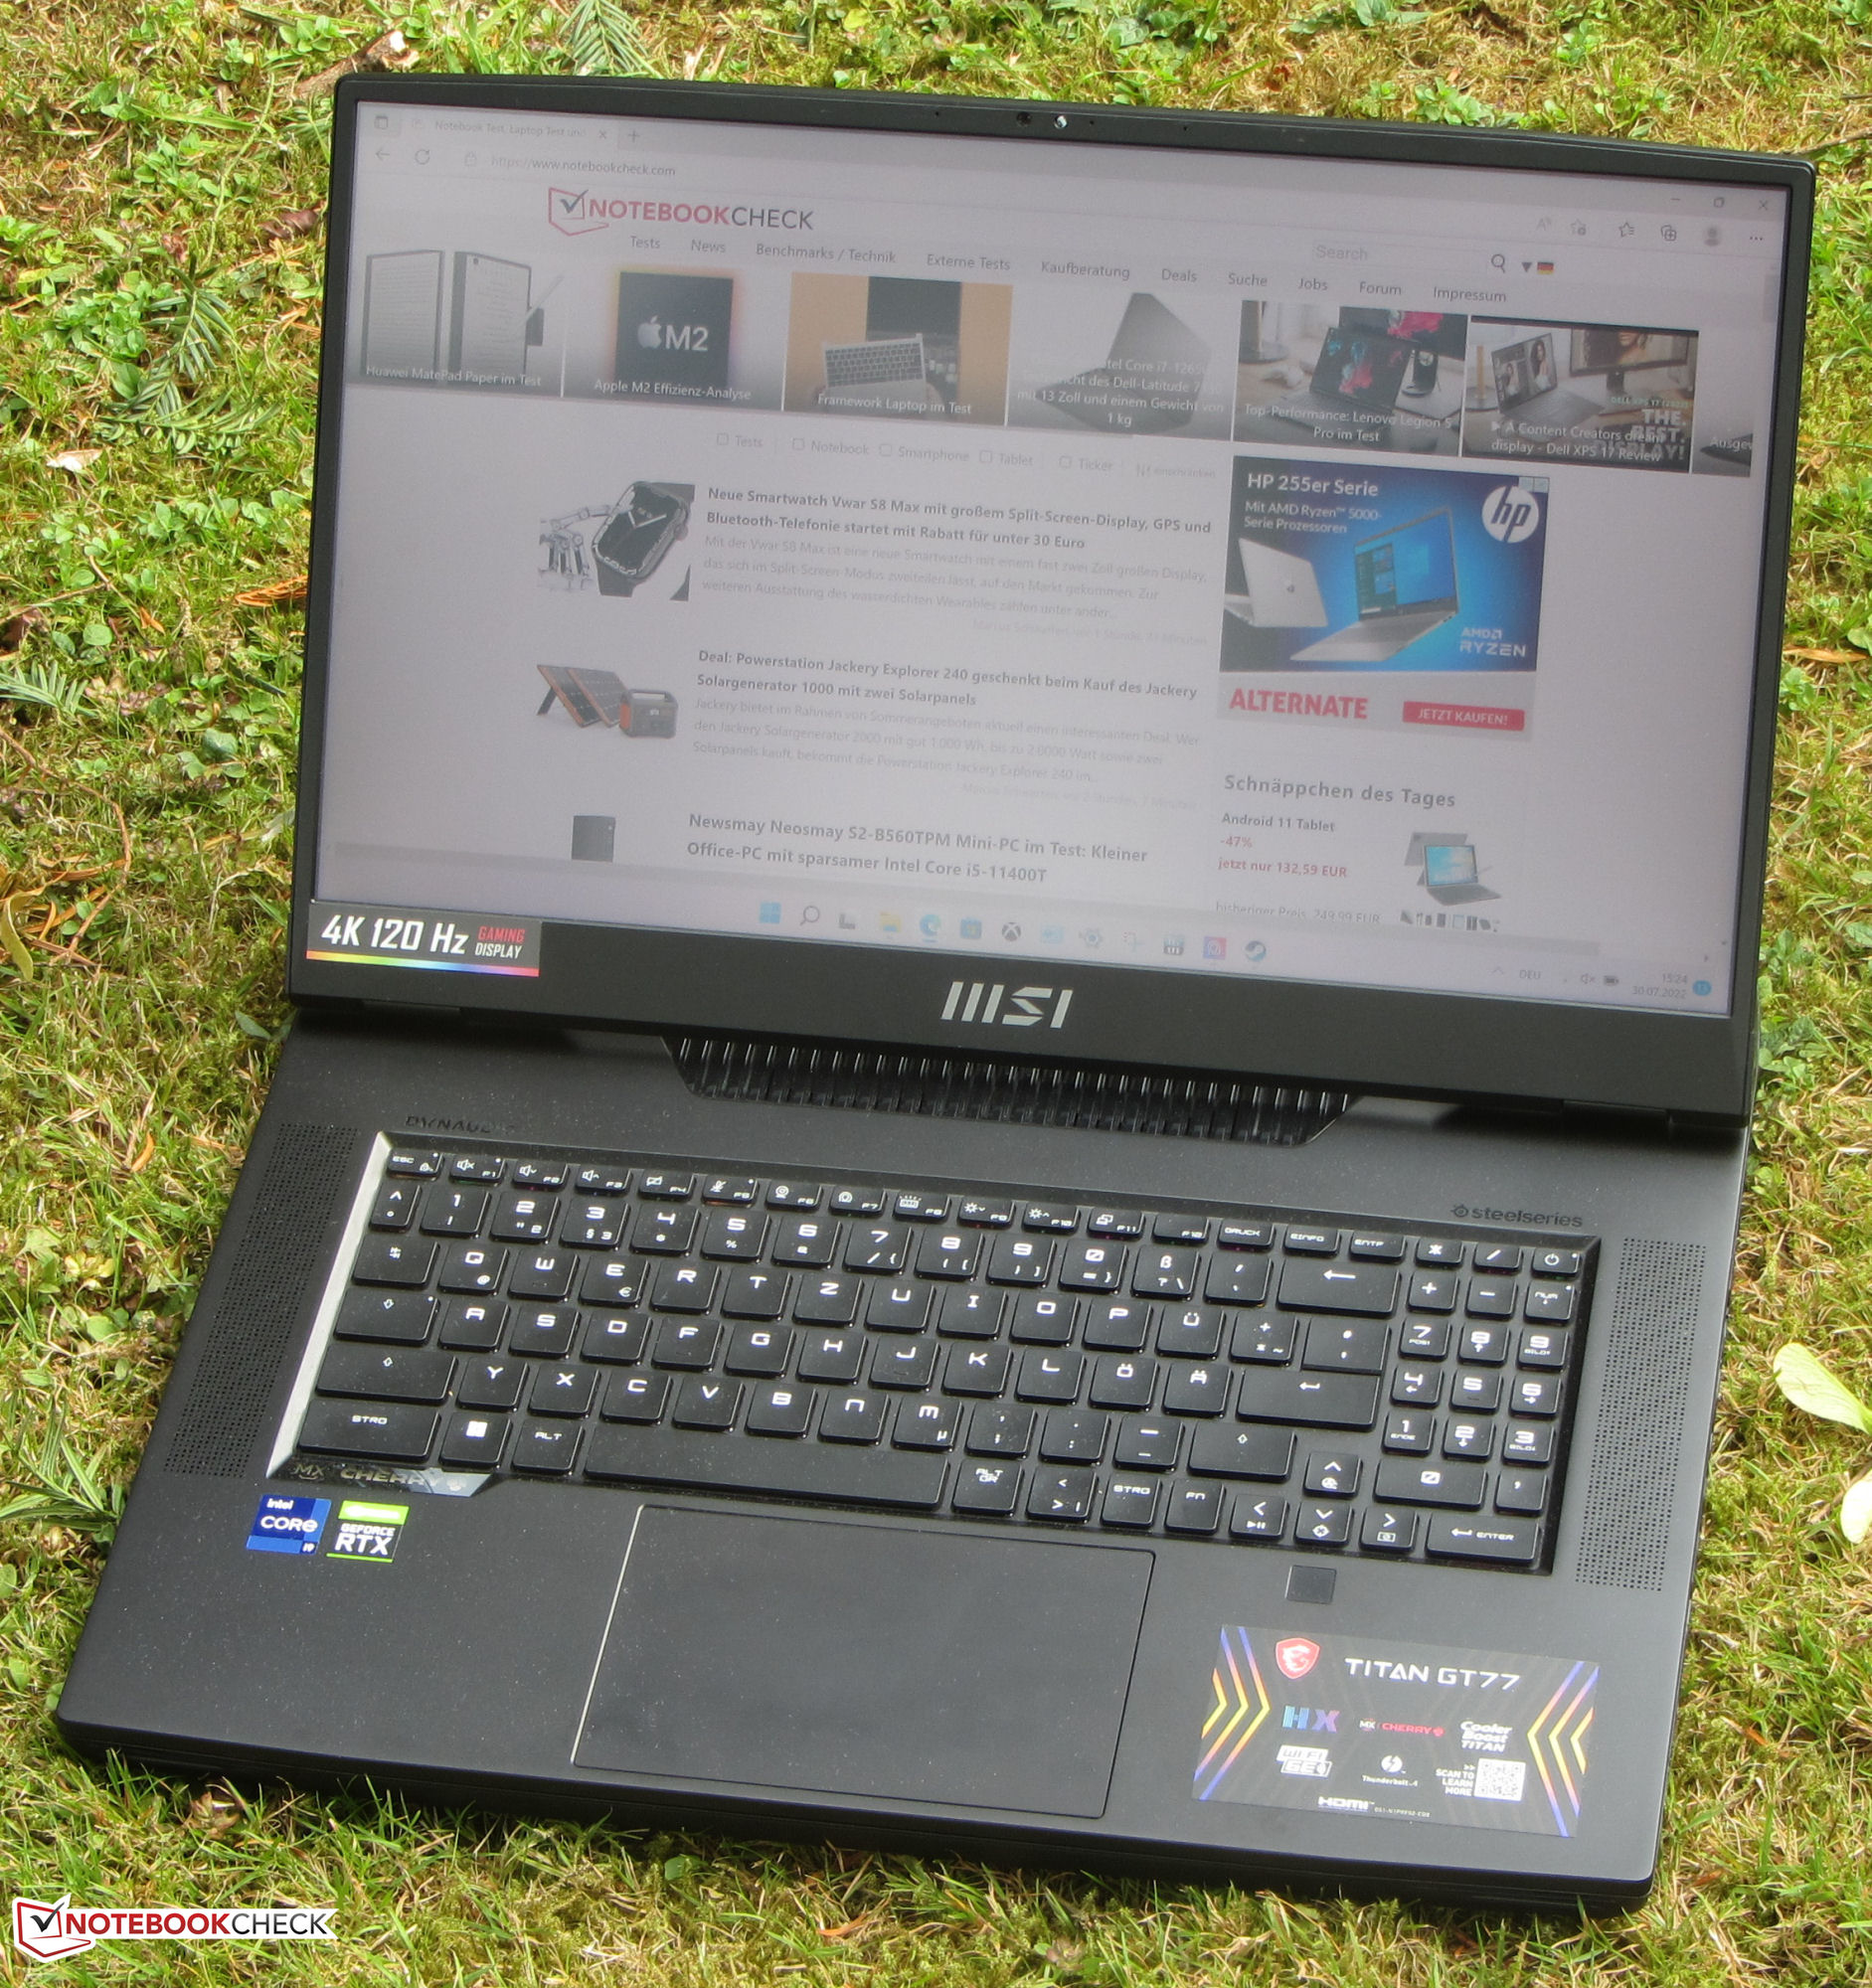
Les joueurs et les créatifs font partie du public cible du MSI Titan GT77 12UHS - un ordinateur portable de remplacement d'ordinateur de bureau (DTR). Les spécifications haut de gamme (Core i9-12900HX, GeForce RTX 3080 Ti Laptop et 64 Go de RAM) font grimper le prix de l'ordinateur portable à environ 5 600 euros (5 980 dollars). L'écran est la principale différence entre cet appareil et son Modèle frère FHDque nous avons récemment examiné : le modèle actuel est équipé d'un écran 4K. Parmi ses concurrents, citons Schenker XMG Ultra 17le Razer Blade 17 et le Alienware x17 R2.
Comme cet appareil et son homologue FHD sont construits de manière identique, vous pouvez lire notre critique du MSI Titan GT77 12UHS (Core i9, FHD)pour plus d'informations sur le châssis, les périphériques d'entrée et les haut-parleurs.
Comparaison avec les concurrents potentiels
Note | Date | Modèle | Poids | Épaisseur | Taille | Résolution | Prix |
|---|---|---|---|---|---|---|---|
| 87.8 % v7 (old) | 09/22 | MSI Titan GT77 12UHS i9-12900HX, GeForce RTX 3080 Ti Laptop GPU | 3.4 kg | 23 mm | 17.30" | 3840x2160 | |
| 89.9 % v7 (old) | 07/22 | Razer Blade 17 Early 2022 i9-12900H, GeForce RTX 3080 Ti Laptop GPU | 2.8 kg | 19.9 mm | 17.30" | 3840x2160 | |
| 89.2 % v7 (old) | 05/22 | Alienware x17 R2 P48E i9-12900HK, GeForce RTX 3080 Ti Laptop GPU | 3.1 kg | 20.9 mm | 17.30" | 1920x1080 | |
| 84.9 % v7 (old) | 04/21 | Schenker XMG Ultra 17 Rocket Lake i9-11900K, GeForce RTX 3080 Laptop GPU | 4.7 kg | 43.5 mm | 17.30" | 1920x1080 |

| SD Card Reader - average JPG Copy Test (av. of 3 runs) | |
| Schenker XMG Ultra 17 Rocket Lake | |
| Alienware x17 R2 P48E (AV Pro V60) | |
| Razer Blade 17 Early 2022 (AV PRO microSD 128 GB V60) | |
| Moyenne de la classe Gaming (20.9 - 210, n=54, 2 dernières années) | |
| MSI Titan GT77 12UHS (AV PRO microSD 128 GB V60) | |
| MSI Titan GT77 12UHS 4k (AV PRO microSD 128 GB V60) | |


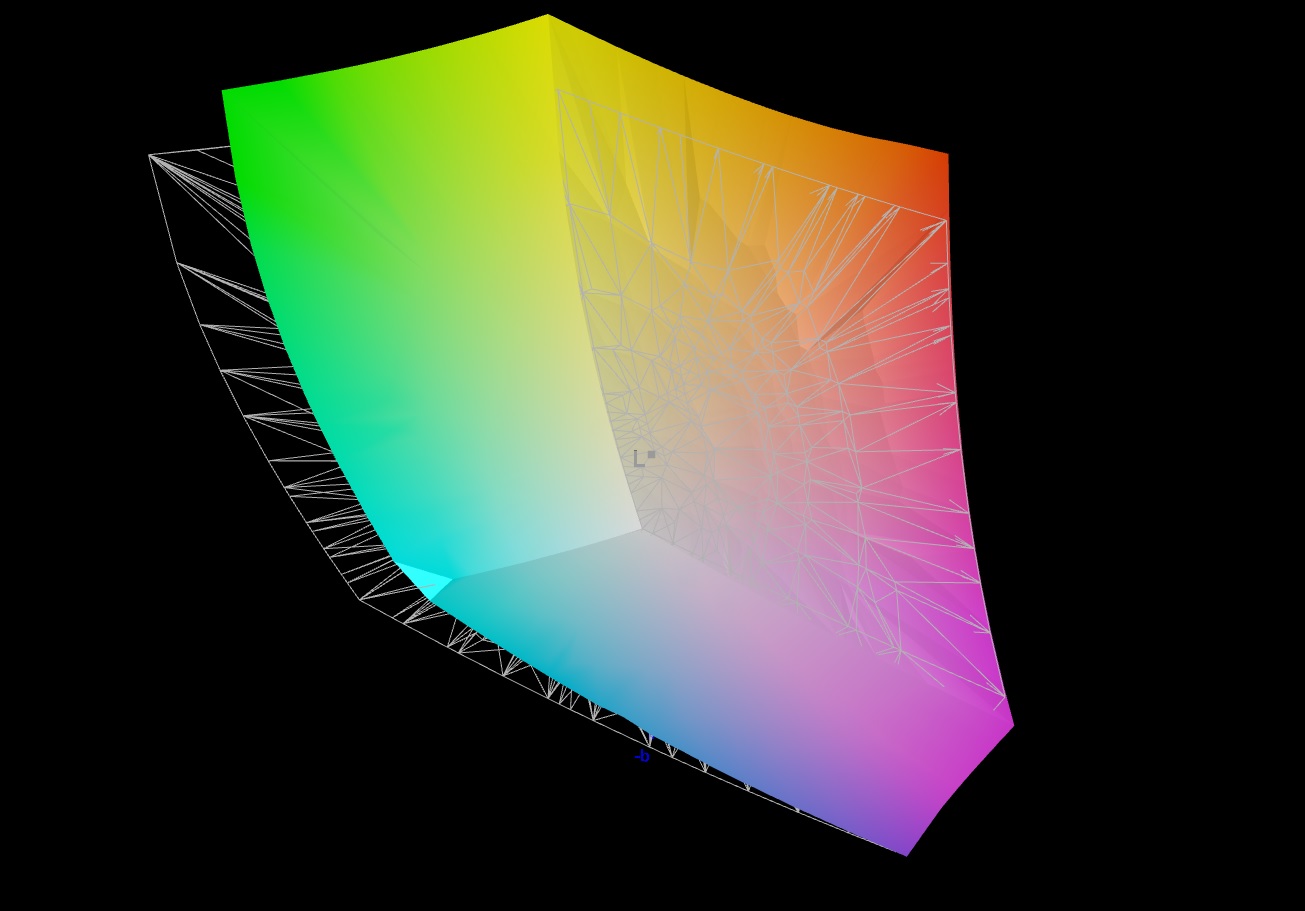
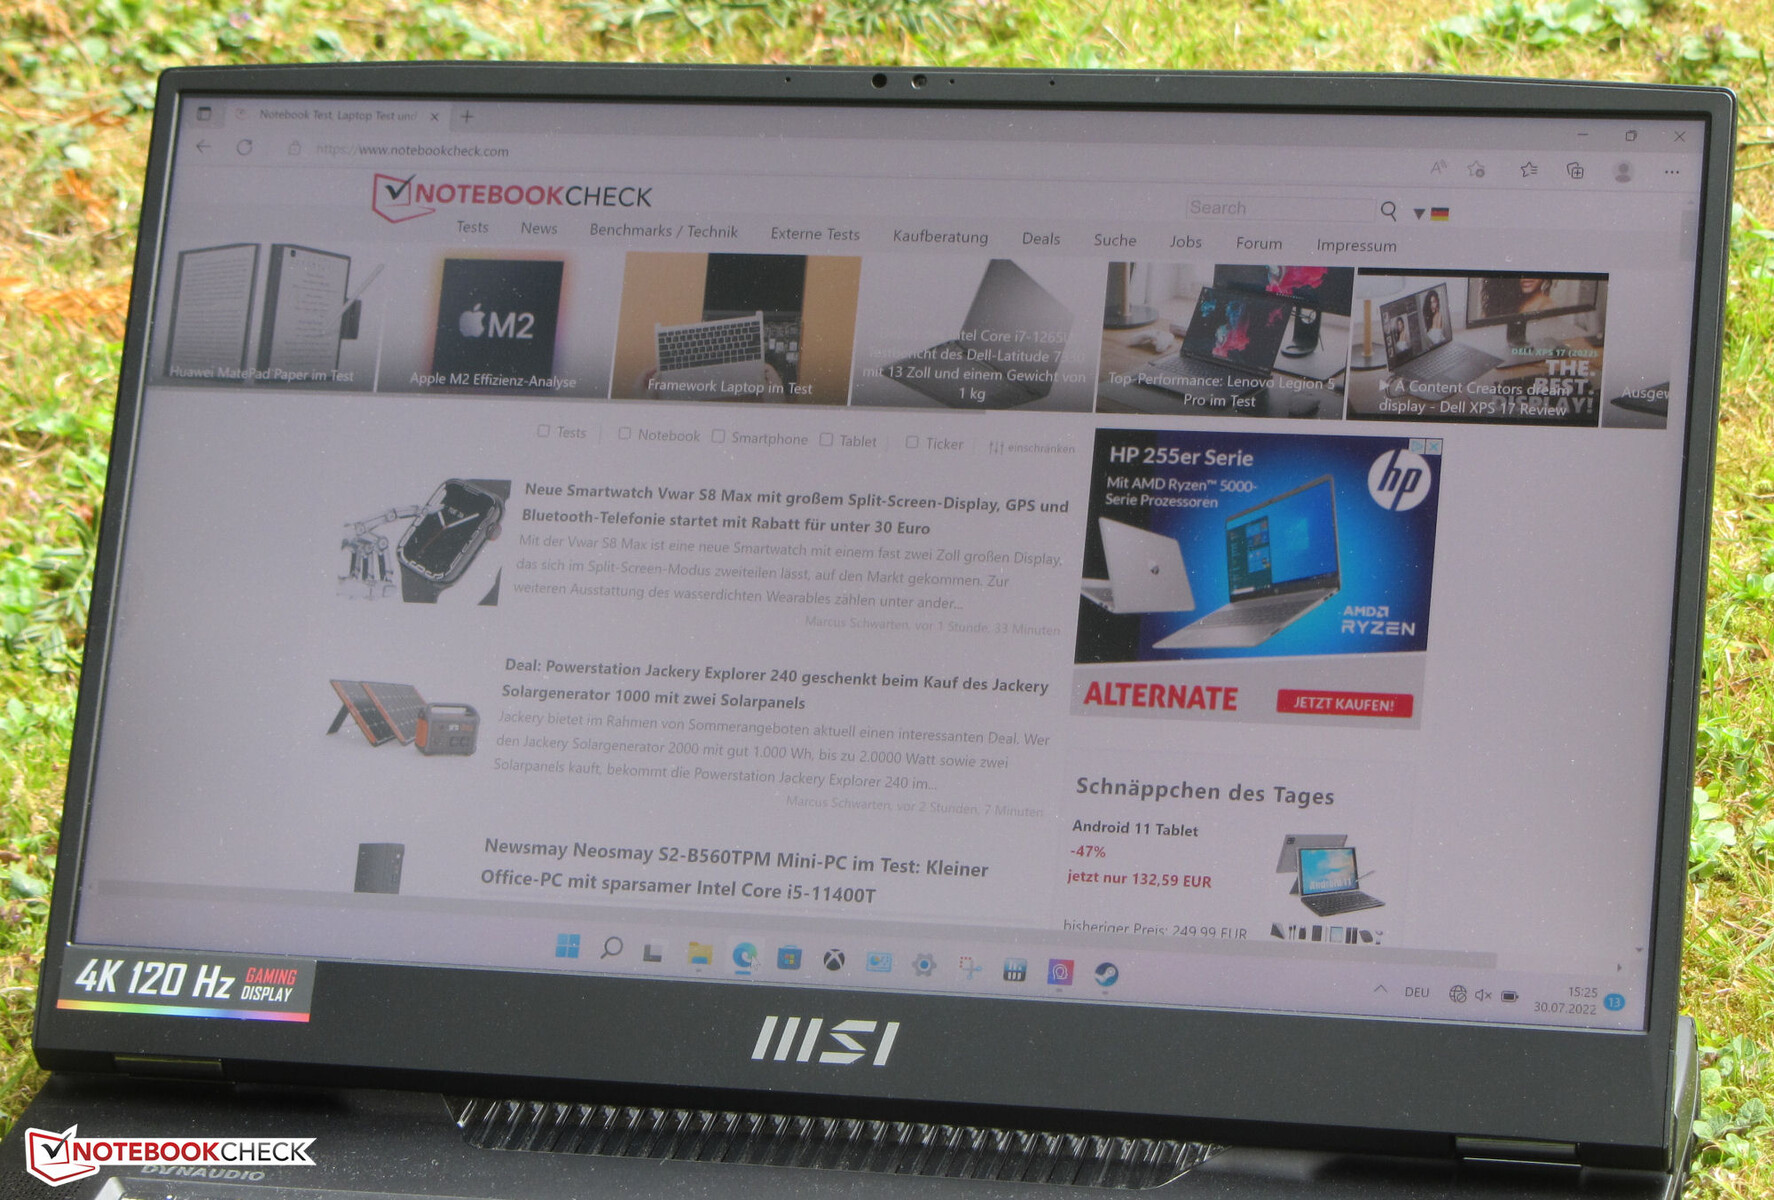
Écran - Panneau lumineux avec une couverture DCI-P3 élevée
L'écran mat 4K (3 840 x 2 160 pixels) de l'appareil actuellement testé offre une luminosité de pointe nettement supérieure à celle de l'écran FHD du modèle frère son modèle frère (401 cd/m² contre 275,1 cd/m²).
Néanmoins, il y a encore de la place pour des améliorations en termes de contraste (871:1 contre 700:1) : les deux écrans sont en deçà de ce que nous considérons comme de bonnes valeurs (> 1 000:1). Si les deux écrans sont très réactifs, le modèle FHD offre un taux de rafraîchissement nettement supérieur (120 Hz contre 360 Hz). Nous n'avons pas observé de scintillement PWM pendant nos mesures.
| |||||||||||||||||||||||||
Homogénéité de la luminosité: 91 %
Valeur mesurée au centre, sur batterie: 418 cd/m²
Contraste: 871:1 (Valeurs des noirs: 0.48 cd/m²)
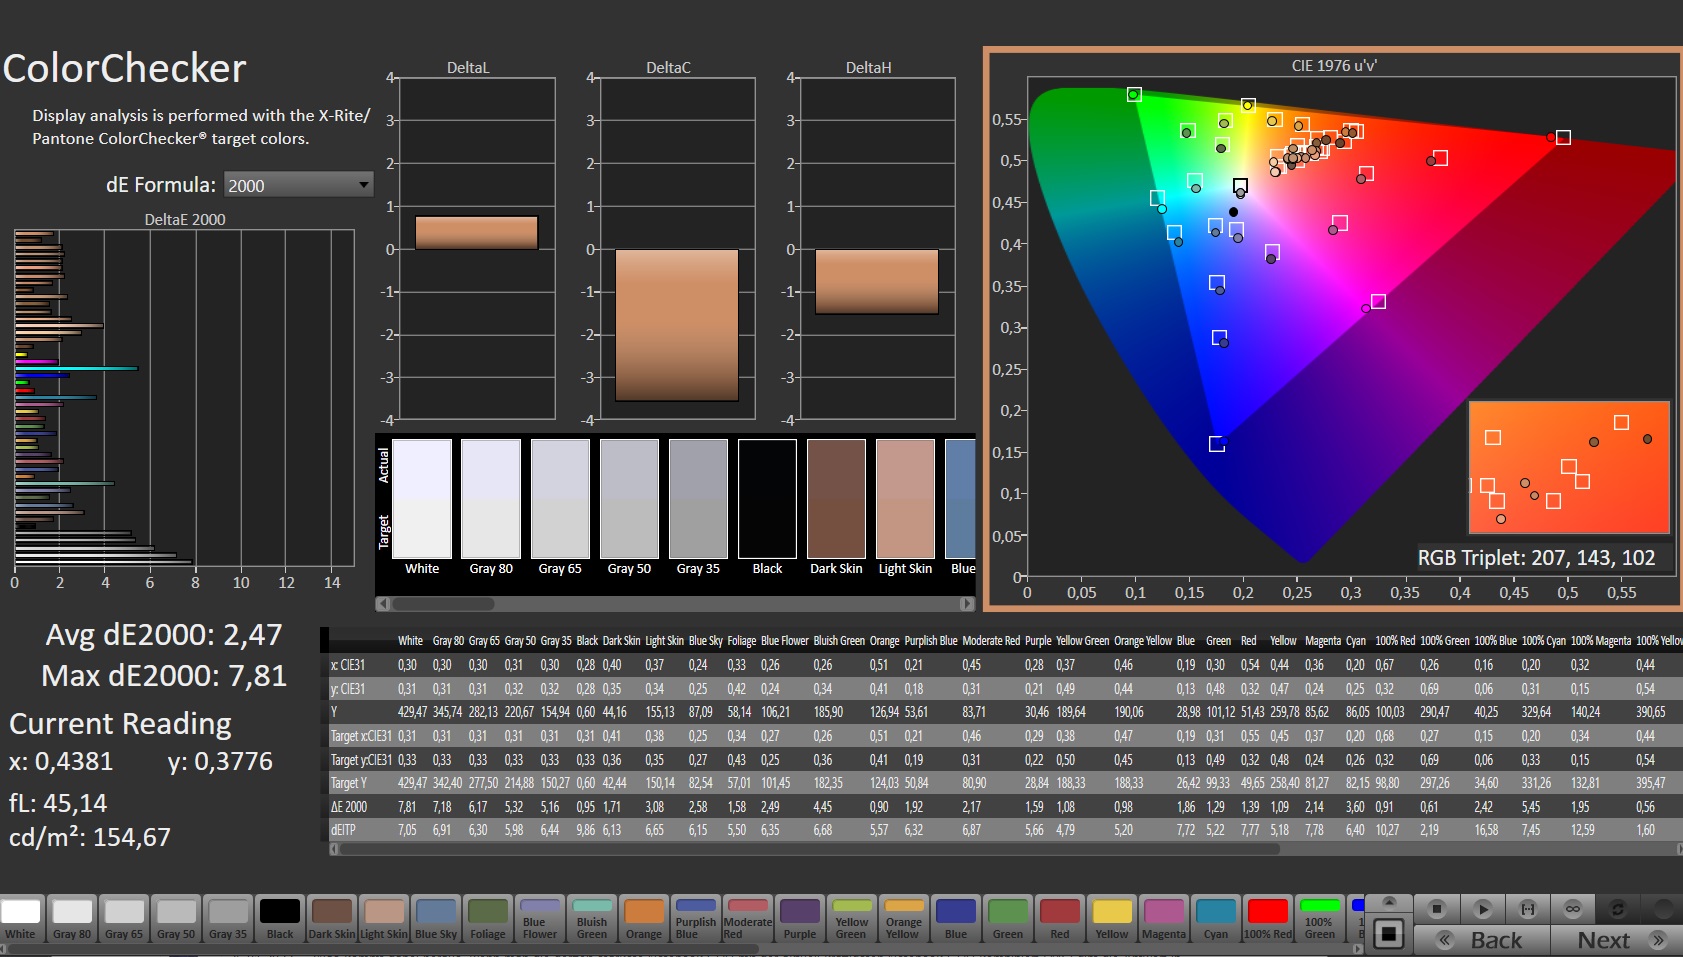
ΔE ColorChecker Calman: 2.47 | ∀{0.5-29.43 Ø4.71}
calibrated: 0.66
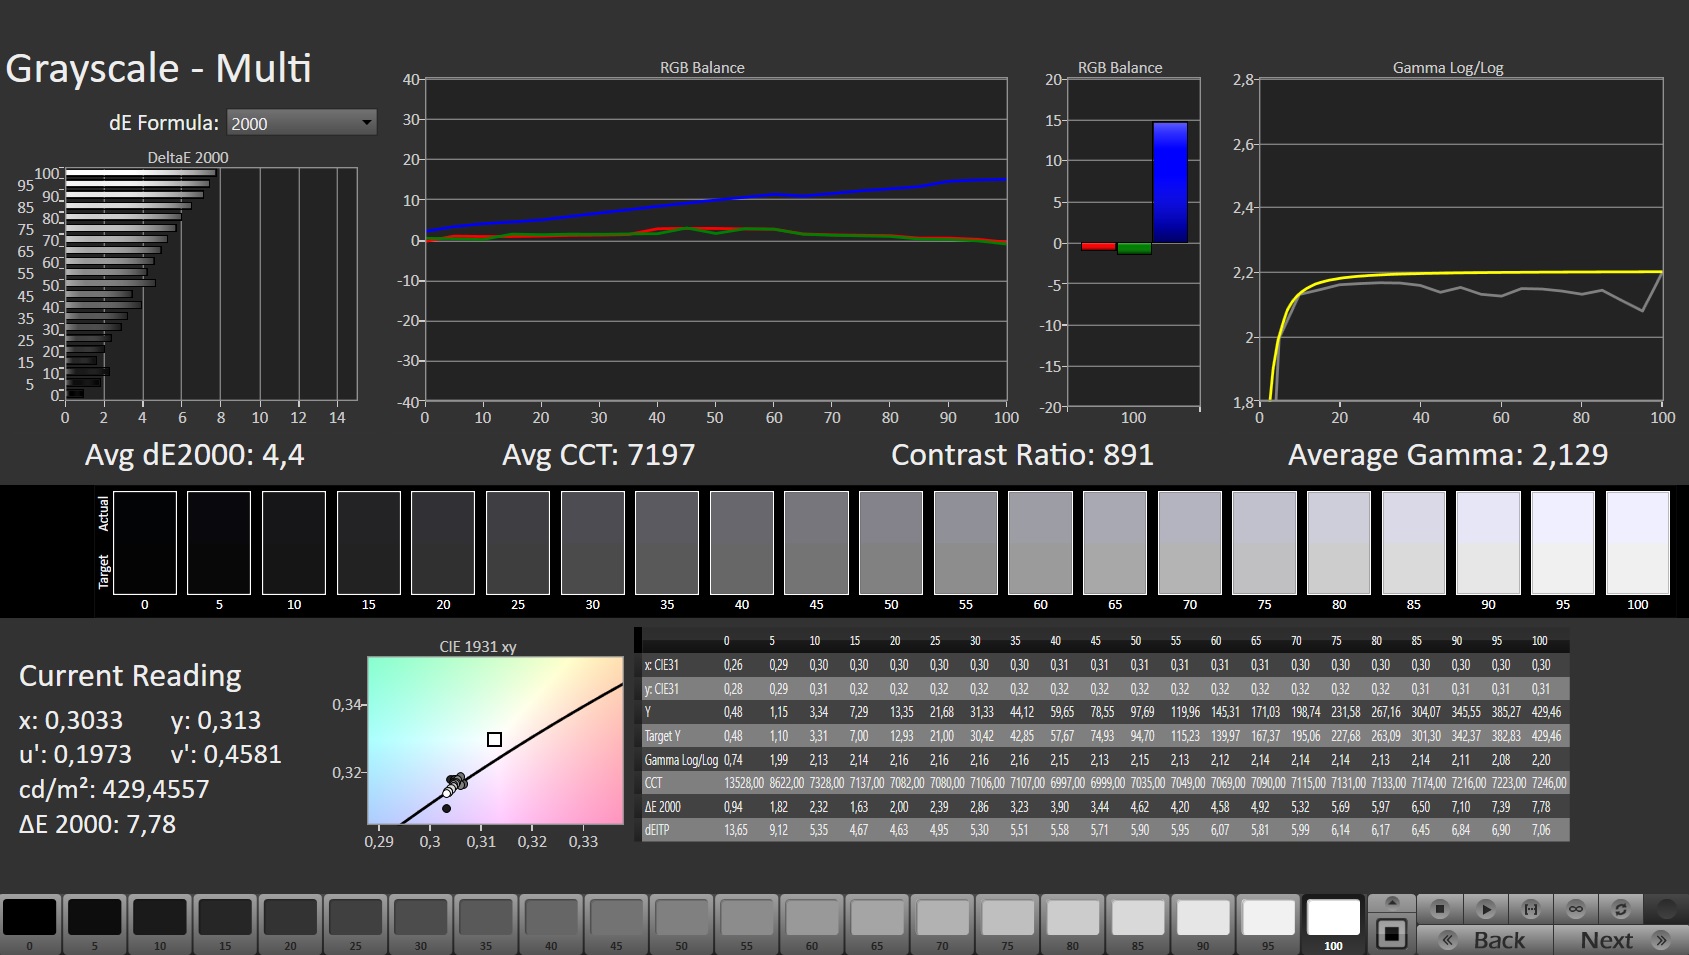
ΔE Greyscale Calman: 4.4 | ∀{0.09-98 Ø4.96}
86.2% AdobeRGB 1998 (Argyll 3D)
99.8% sRGB (Argyll 3D)
97% Display P3 (Argyll 3D)
Gamma: 2.129
CCT: 7197 K
| MSI Titan GT77 12UHS 4k AU Optronics B173ZAN06.1, IPS, 3840x2160, 17.3" | Razer Blade 17 Early 2022 AU Optronics B173ZAN06.9, IPS, 3840x2160, 17.3" | Alienware x17 R2 P48E AU Optronics B173HAN, IPS, 1920x1080, 17.3" | Schenker XMG Ultra 17 Rocket Lake AU Optronics B173HAN05.1, IPS, 1920x1080, 17.3" | MSI Titan GT77 12UHS Sharp SHP1544 LQ173M1JW08, IPS-Level, 1920x1080, 17.3" | |
|---|---|---|---|---|---|
| Display | 1% | -9% | -16% | -14% | |
| Display P3 Coverage (%) | 97 | 99.4 2% | 79.2 -18% | 69.8 -28% | 70.8 -27% |
| sRGB Coverage (%) | 99.8 | 100 0% | 99.8 0% | 97.2 -3% | 98.9 -1% |
| AdobeRGB 1998 Coverage (%) | 86.2 | 87.3 1% | 79.6 -8% | 72 -16% | 73 -15% |
| Response Times | -27% | -109% | -44% | 19% | |
| Response Time Grey 50% / Grey 80% * (ms) | 5.2 ? | 7.5 ? -44% | 12.4 ? -138% | 5.6 ? -8% | 3.03 ? 42% |
| Response Time Black / White * (ms) | 5.1 ? | 5.6 ? -10% | 9.2 ? -80% | 9.2 ? -80% | 5.28 ? -4% |
| PWM Frequency (Hz) | |||||
| Screen | 28% | 3% | 9% | -17% | |
| Brightness middle (cd/m²) | 418 | 503 20% | 365.4 -13% | 306 -27% | 280 -33% |
| Brightness (cd/m²) | 401 | 486 21% | 344 -14% | 299 -25% | 275 -31% |
| Brightness Distribution (%) | 91 | 84 -8% | 85 -7% | 93 2% | 79 -13% |
| Black Level * (cd/m²) | 0.48 | 0.44 8% | 0.29 40% | 0.22 54% | 0.4 17% |
| Contrast (:1) | 871 | 1143 31% | 1260 45% | 1391 60% | 700 -20% |
| Colorchecker dE 2000 * | 2.47 | 1.08 56% | 3.17 -28% | 1.92 22% | 2.1 15% |
| Colorchecker dE 2000 max. * | 7.81 | 4.54 42% | 7.69 2% | 4.78 39% | 5.83 25% |
| Colorchecker dE 2000 calibrated * | 0.66 | 0.6 9% | 0.51 23% | 1.34 -103% | 1.58 -139% |
| Greyscale dE 2000 * | 4.4 | 1.3 70% | 5.3 -20% | 2 55% | 3.3 25% |
| Gamma | 2.129 103% | 2.151 102% | 2.18 101% | 2.153 102% | 2.13 103% |
| CCT | 7197 90% | 6541 99% | 5879 111% | 6738 96% | 7060 92% |
| Color Space (Percent of AdobeRGB 1998) (%) | 72 | ||||
| Color Space (Percent of sRGB) (%) | 93 | ||||
| Moyenne finale (programmes/paramètres) | 1% /
14% | -38% /
-15% | -17% /
-4% | -4% /
-11% |
* ... Moindre est la valeur, meilleures sont les performances
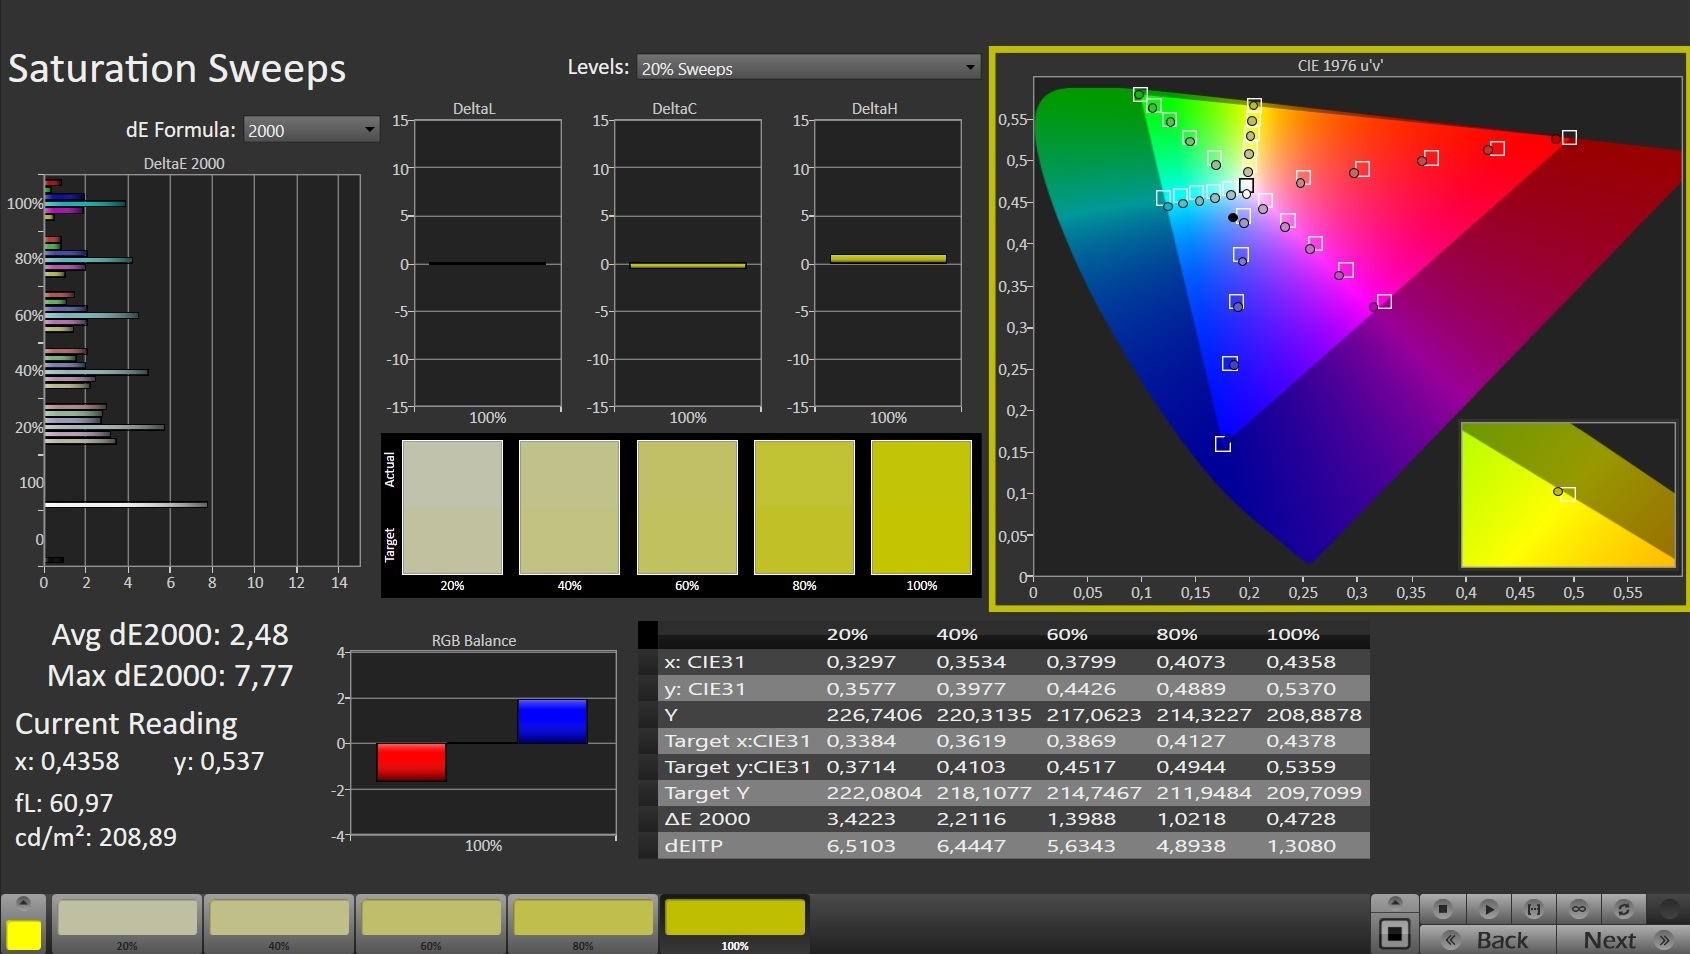
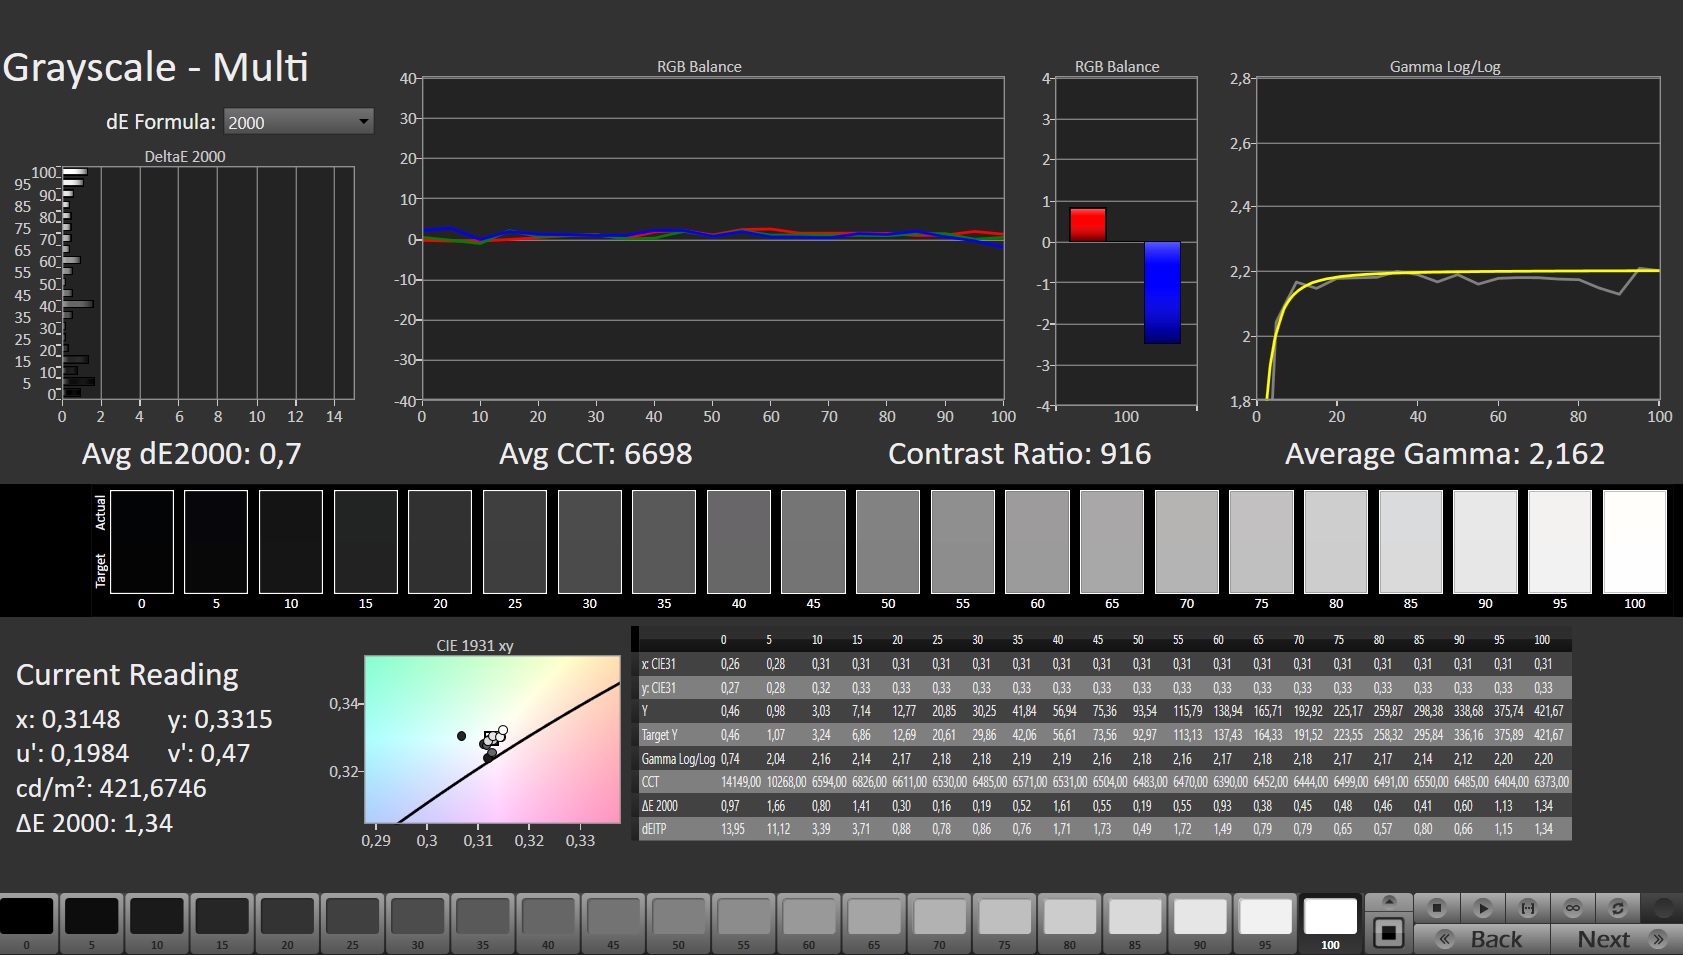
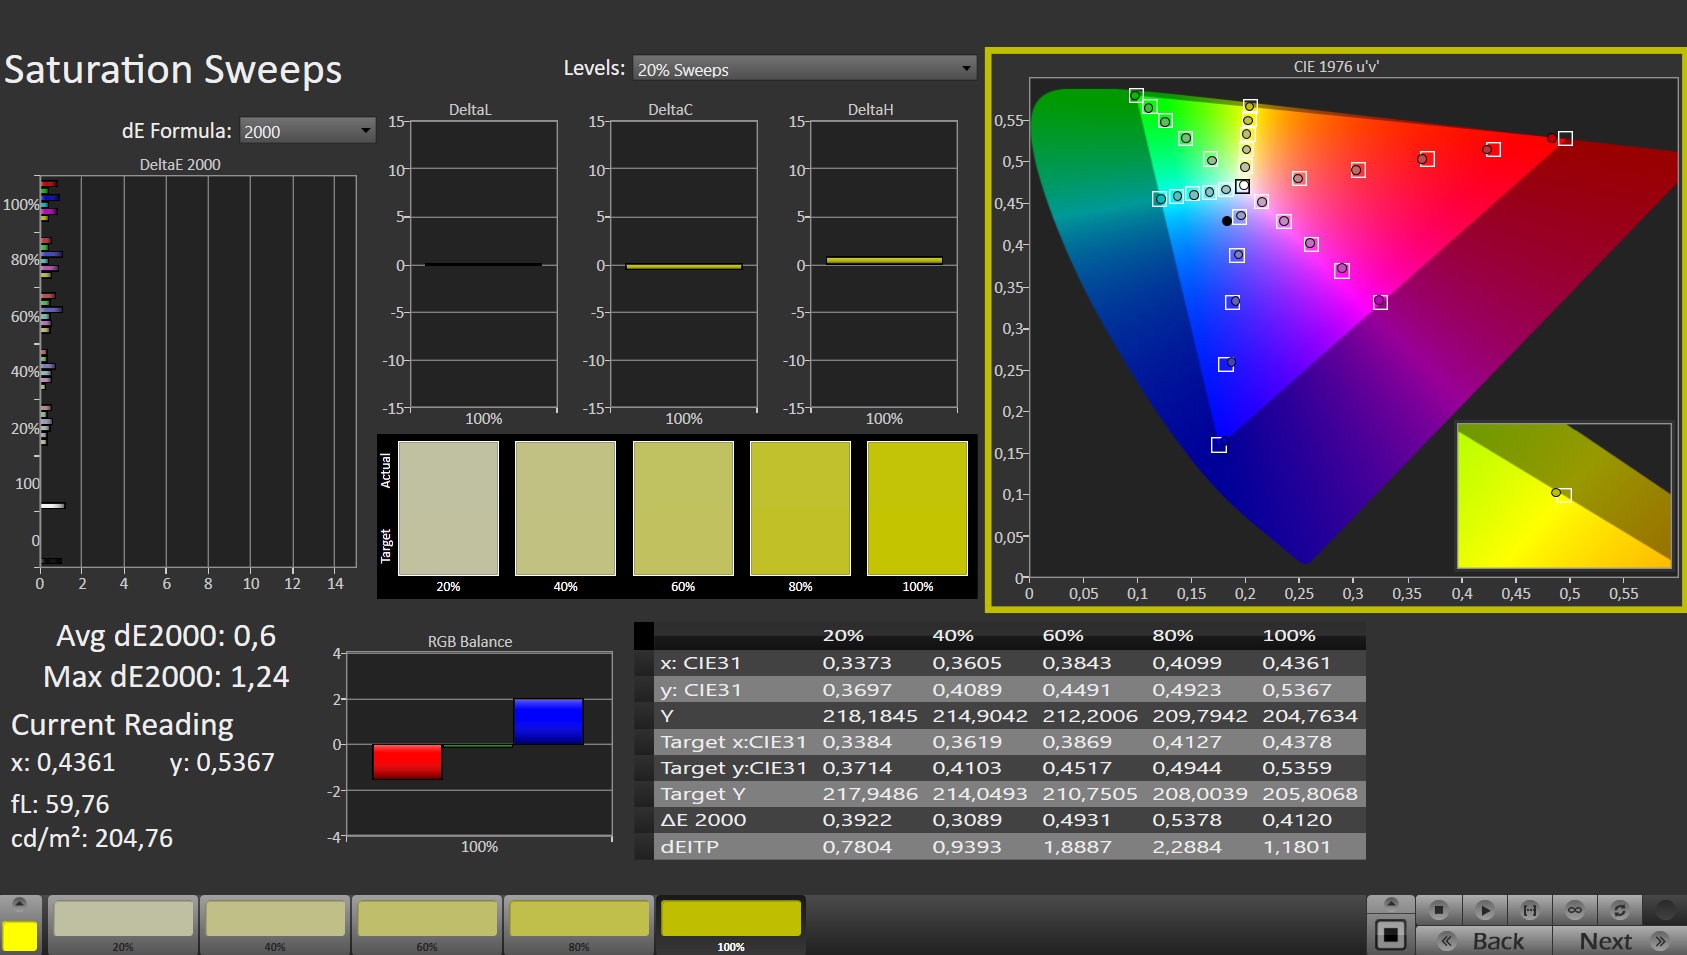
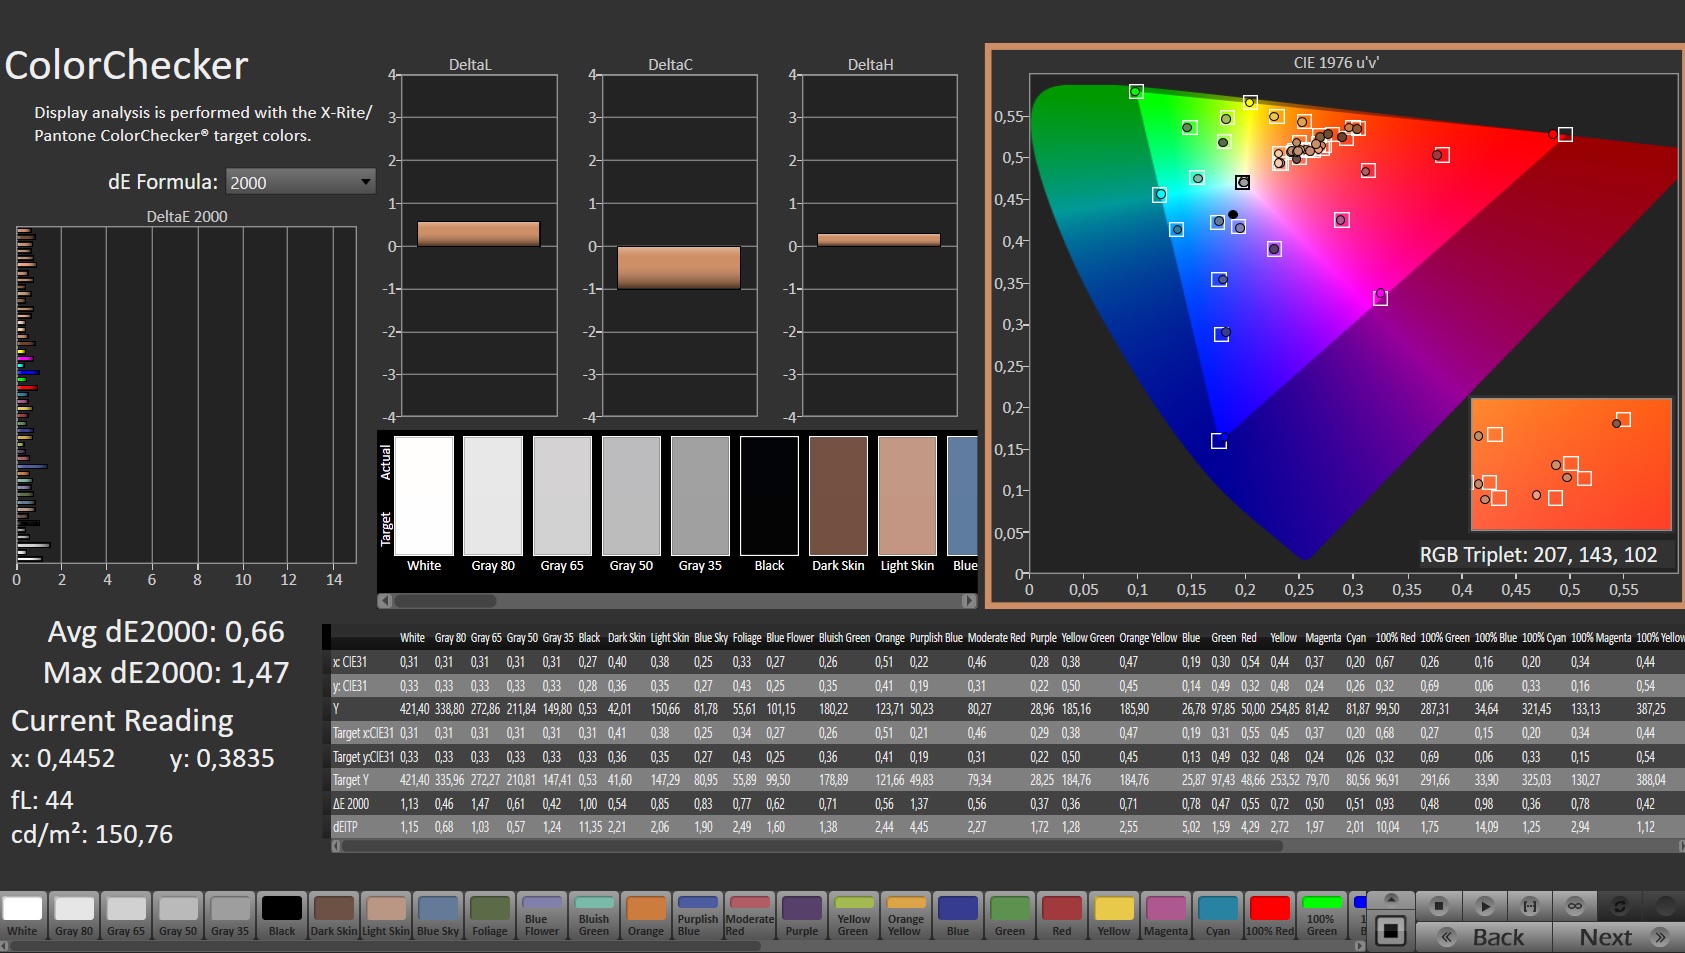
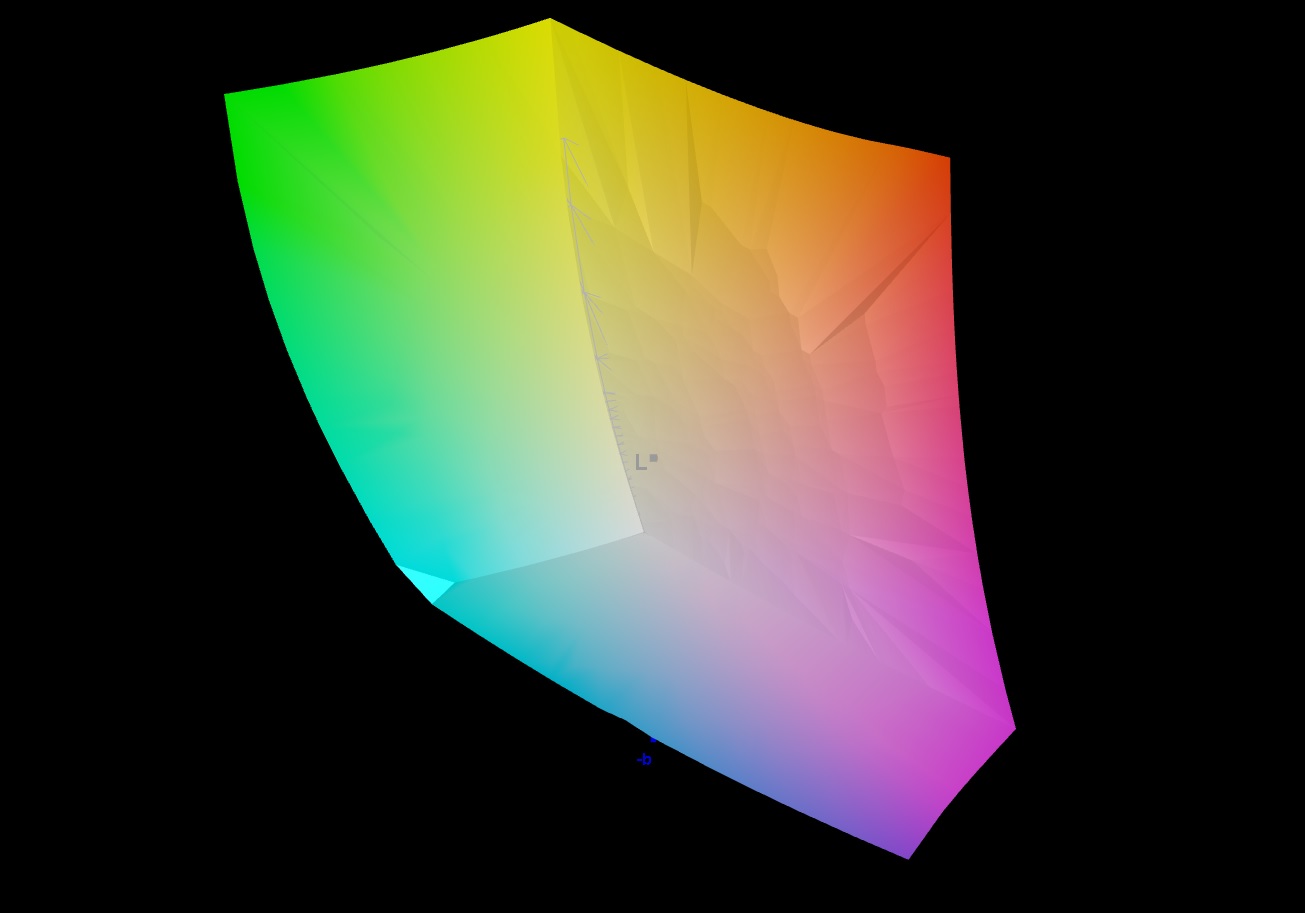
L'écran 4K couvre la quasi-totalité de l'espace colorimétrique sRGB (99,8 %) et DCI-P3 (97 %) et jusqu'à 86 % d'AdobeRGB. La dalle FHD du modèle, le frère de
, n'est pas à la hauteur (sRGB : 97%, AdobeRGB : 73%, DCI-P3 : 71%). Cela signifie que le panneau 4K est la meilleure option si la précision des couleurs est importante pour vous</p><br> Les écrans ont déjà une bonne reproduction des couleurs dès la sortie de la boîte : les écrans UHD et FHD respectent la valeur souhaitée (Delta E < 3) avec leurs différences de couleur non perceptibles de 2,47 et 2,1 respectivement. L'étalonnage des écrans a rendu leur reproduction des niveaux de gris plus équilibrée et a réduit les différences de couleur à 0,66 et 1,58 respectivement. Dans l'infobox de chaque écran, vous trouverez un lien pour télécharger gratuitement les profils de couleurs que nous avons créés. </p>
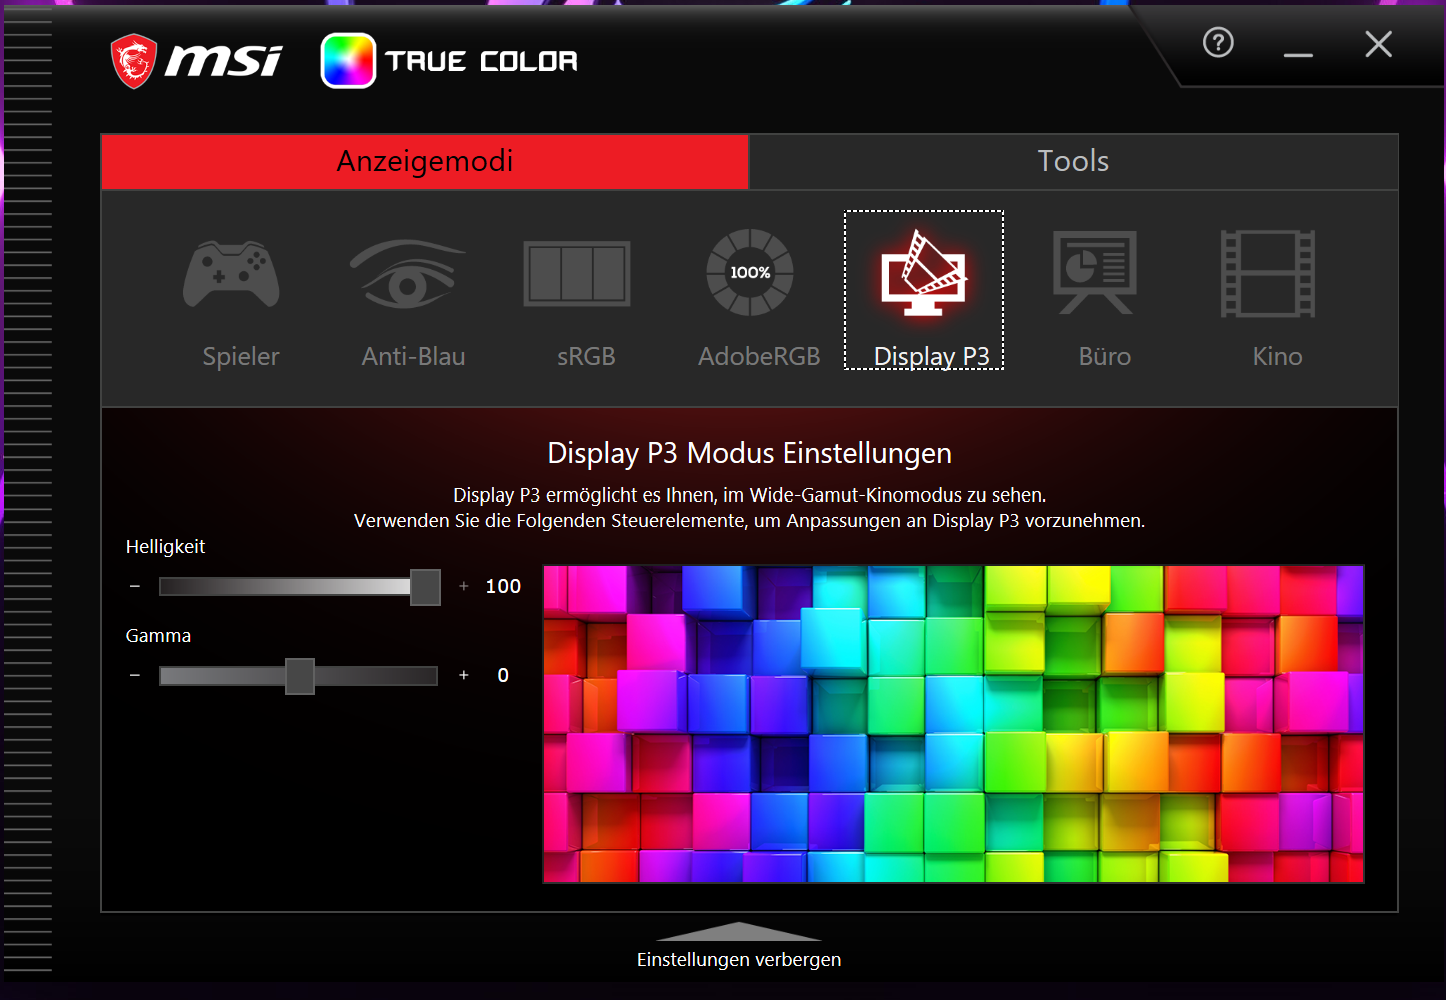
Remarque : Le logiciel True Color de MSI vous permet d'ajuster les couleurs pour mieux répondre à une gamme de couleurs ou à un scénario d'utilisation défini. Nous avons choisi le préréglage "Display P3".</i>

Temps de réponse de l'écran
| ↔ Temps de réponse noir à blanc | ||
|---|---|---|
| 5.1 ms ... hausse ↗ et chute ↘ combinées | ↗ 1.5 ms hausse | 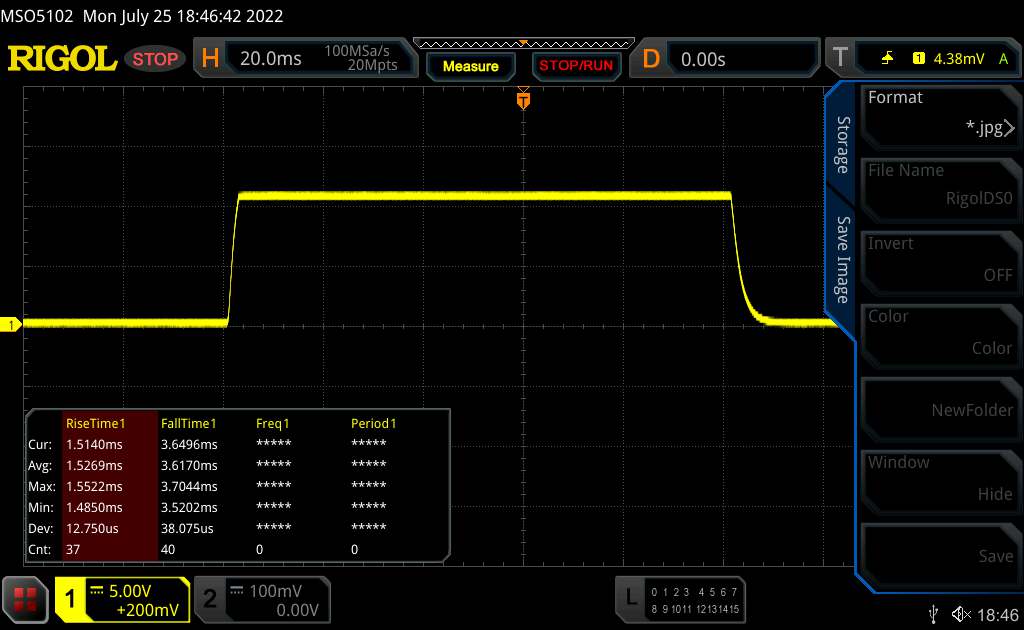 |
| ↘ 3.6 ms chute | ||
| L'écran montre de très faibles temps de réponse, parfait pour le jeu. En comparaison, tous les appareils testés affichent entre 0.1 (minimum) et 240 (maximum) ms. » 18 % des appareils testés affichent de meilleures performances. Cela signifie que les latences relevées sont meilleures que la moyenne (19.8 ms) de tous les appareils testés. | ||
| ↔ Temps de réponse gris 50% à gris 80% | ||
| 5.2 ms ... hausse ↗ et chute ↘ combinées | ↗ 1.2 ms hausse | 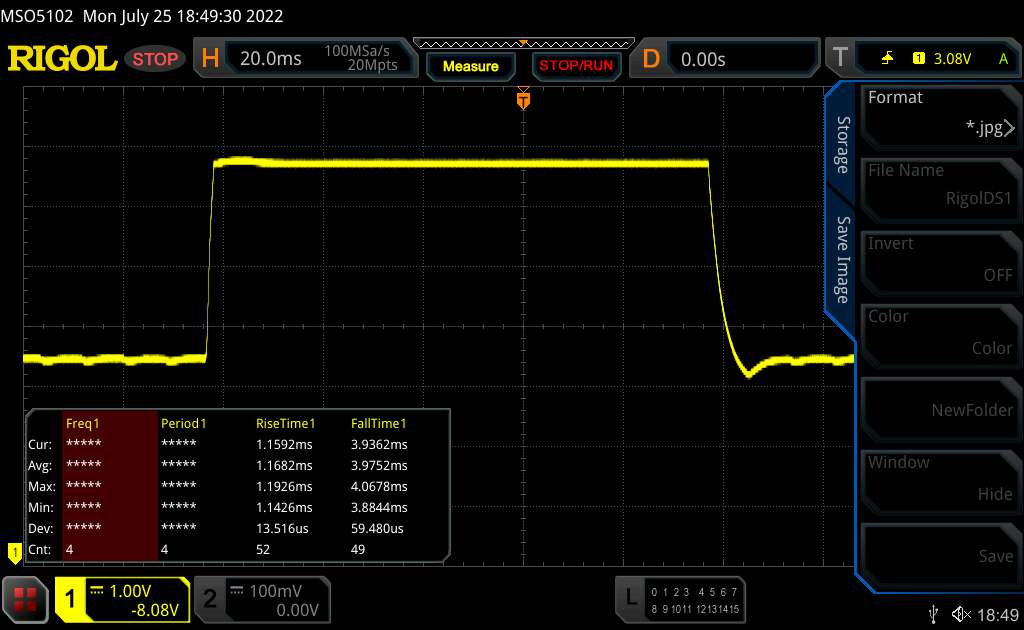 |
| ↘ 4 ms chute | ||
| L'écran montre de très faibles temps de réponse, parfait pour le jeu. En comparaison, tous les appareils testés affichent entre 0.165 (minimum) et 636 (maximum) ms. » 17 % des appareils testés affichent de meilleures performances. Cela signifie que les latences relevées sont meilleures que la moyenne (31 ms) de tous les appareils testés. | ||
Scintillement / MLI (Modulation de largeur d'impulsion)
| Scintillement / MLI (Modulation de largeur d'impulsion) non décelé | 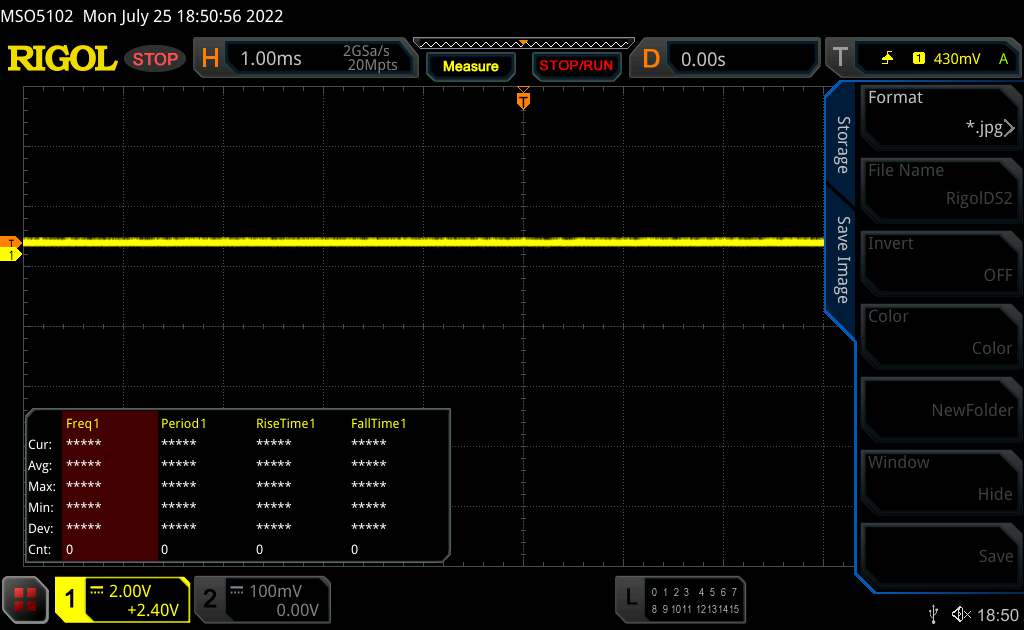 | ||
En comparaison, 52 % des appareils testés n'emploient pas MDI pour assombrir leur écran. Nous avons relevé une moyenne à 7757 (minimum : 5 - maximum : 343500) Hz dans le cas où une MDI était active. | |||
L'écran IPS offre un angle de vision stable et peut donc être facilement vu depuis n'importe quelle position. L'écran est également très lisible en extérieur.

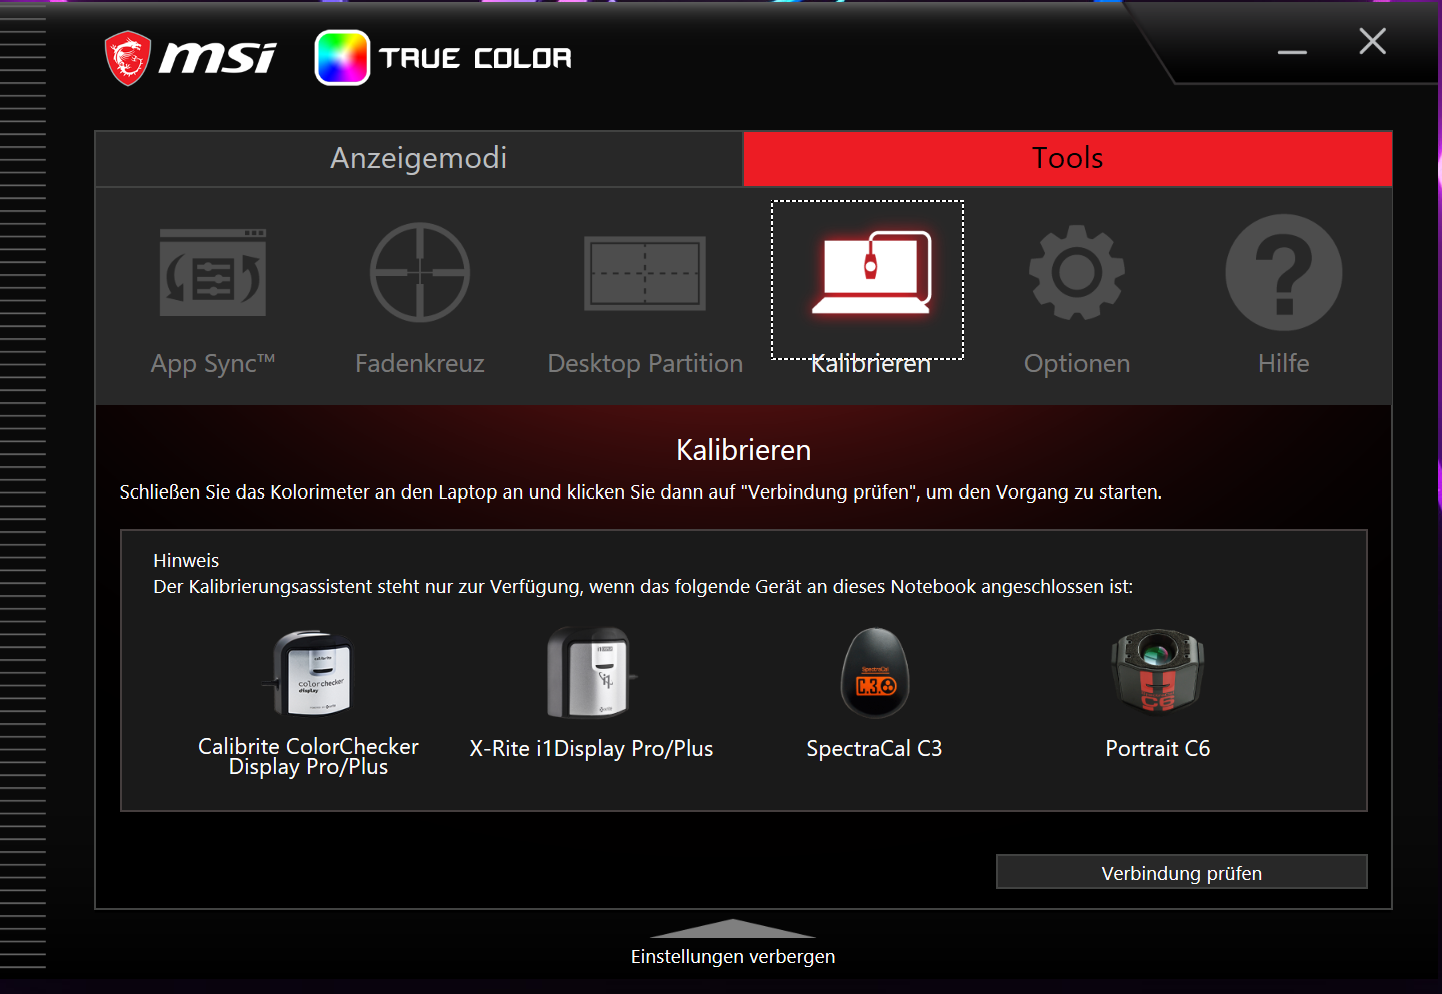
Reproduction imprécise des couleurs en raison de problèmes logiciels
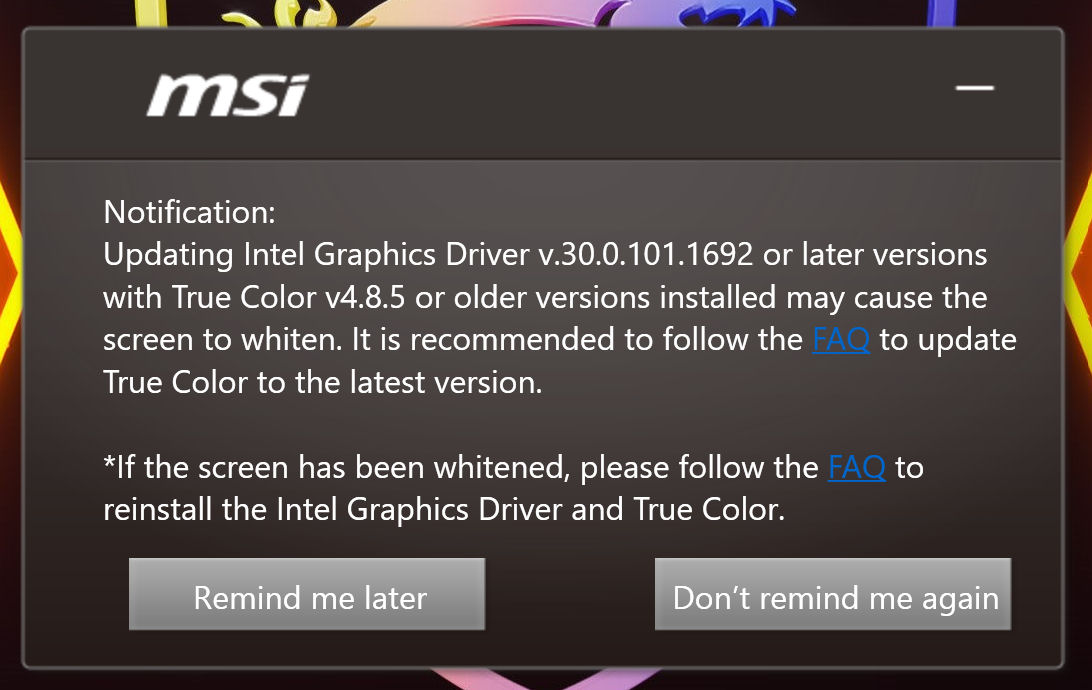
Certaines combinaisons du logiciel True Color et du pilote iGPU peuvent entraîner une reproduction inexacte des images. Lorsque cela se produit, toutes les couleurs affichées apparaissent déformées et blanchies. MSI recommande de désinstaller complètement puis de réinstaller les deux composants. Après avoir fait un essai, nous avons constaté que cette méthode permet de résoudre le problème.
Performance - Ampère et Alder Lake fournissent beaucoup d'énergie.
Avec le Titan GT77 12UHS, MSI propose dans sa gamme de produits un ordinateur portable très puissant de 17,3 pouces qui se comporte bien dans toutes sortes de scénarios d'utilisation exigeants.
Conditions d'essai
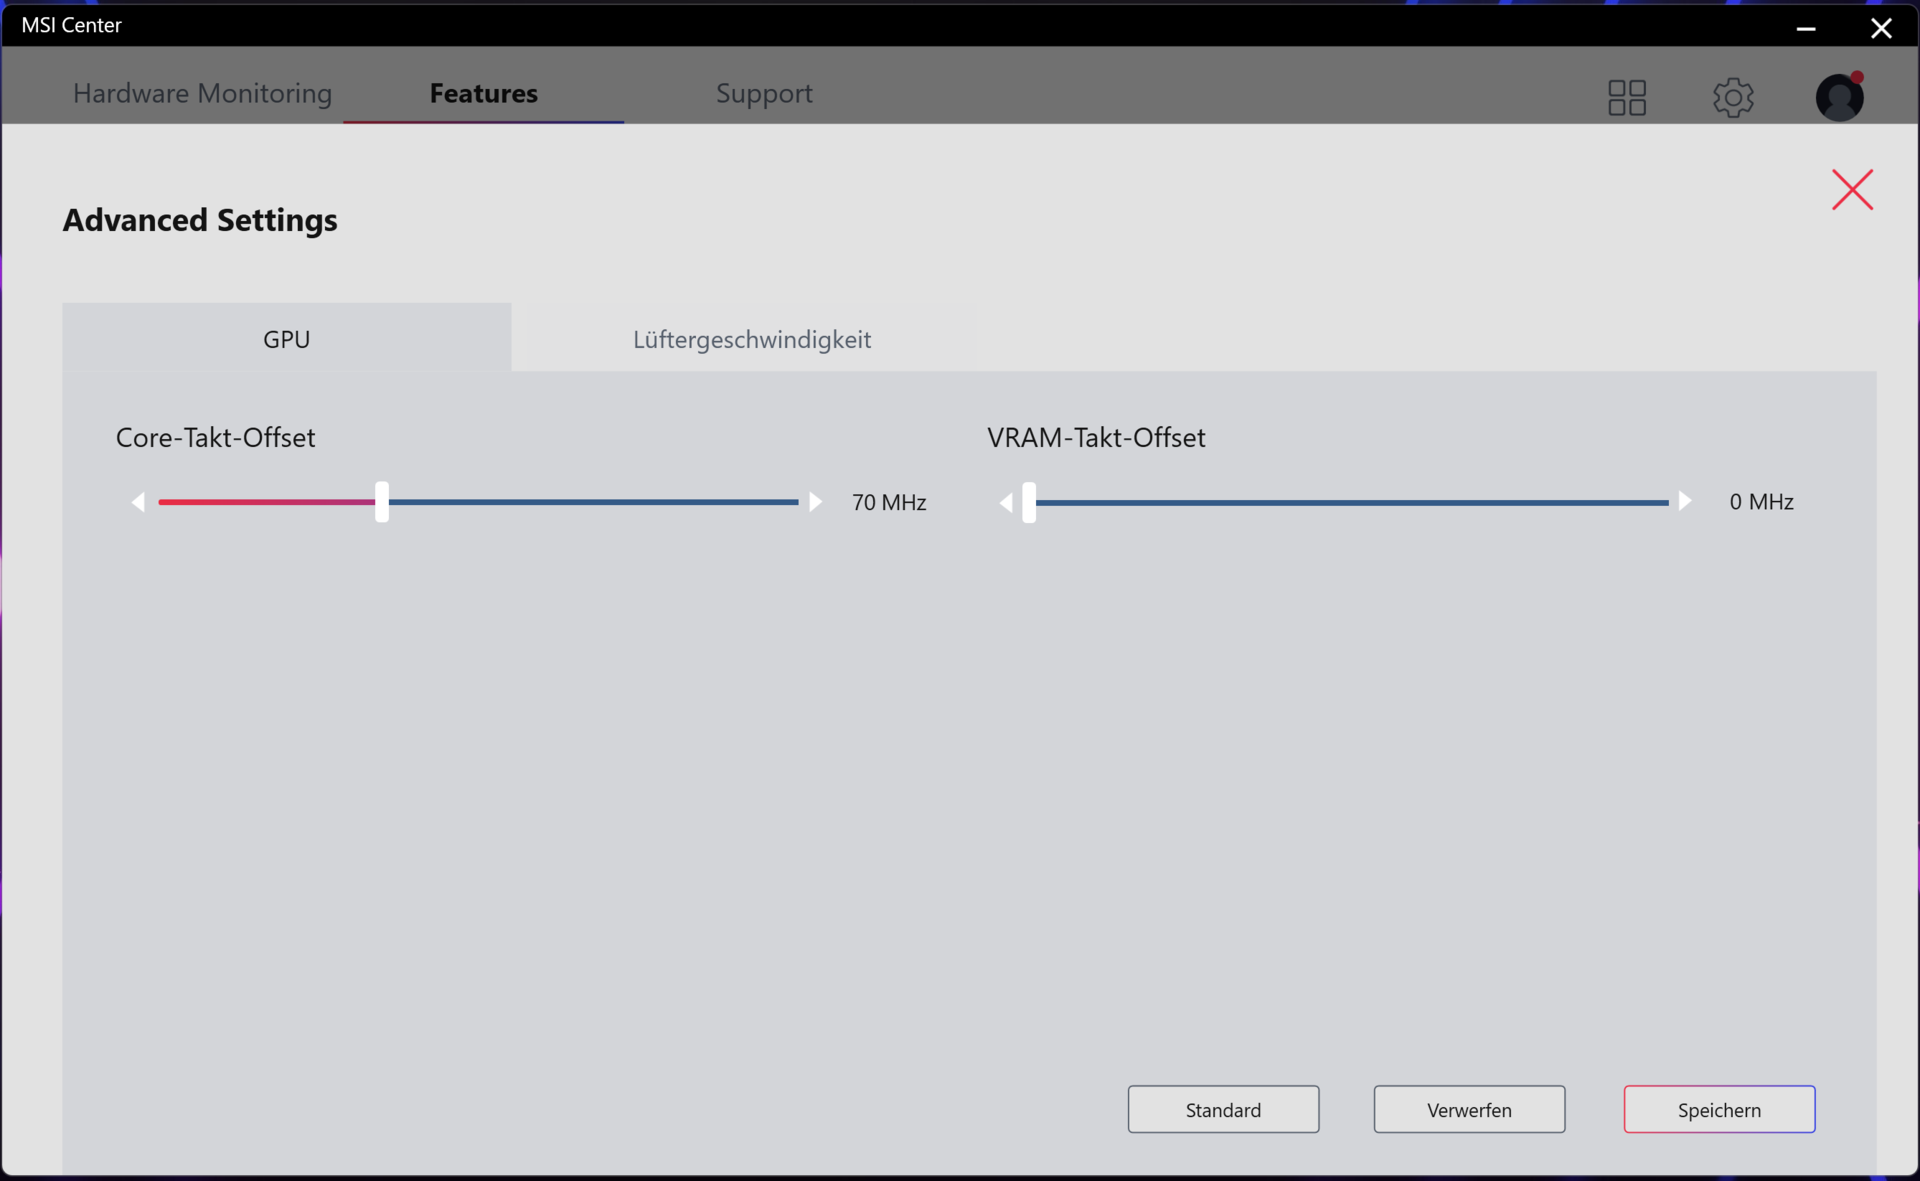
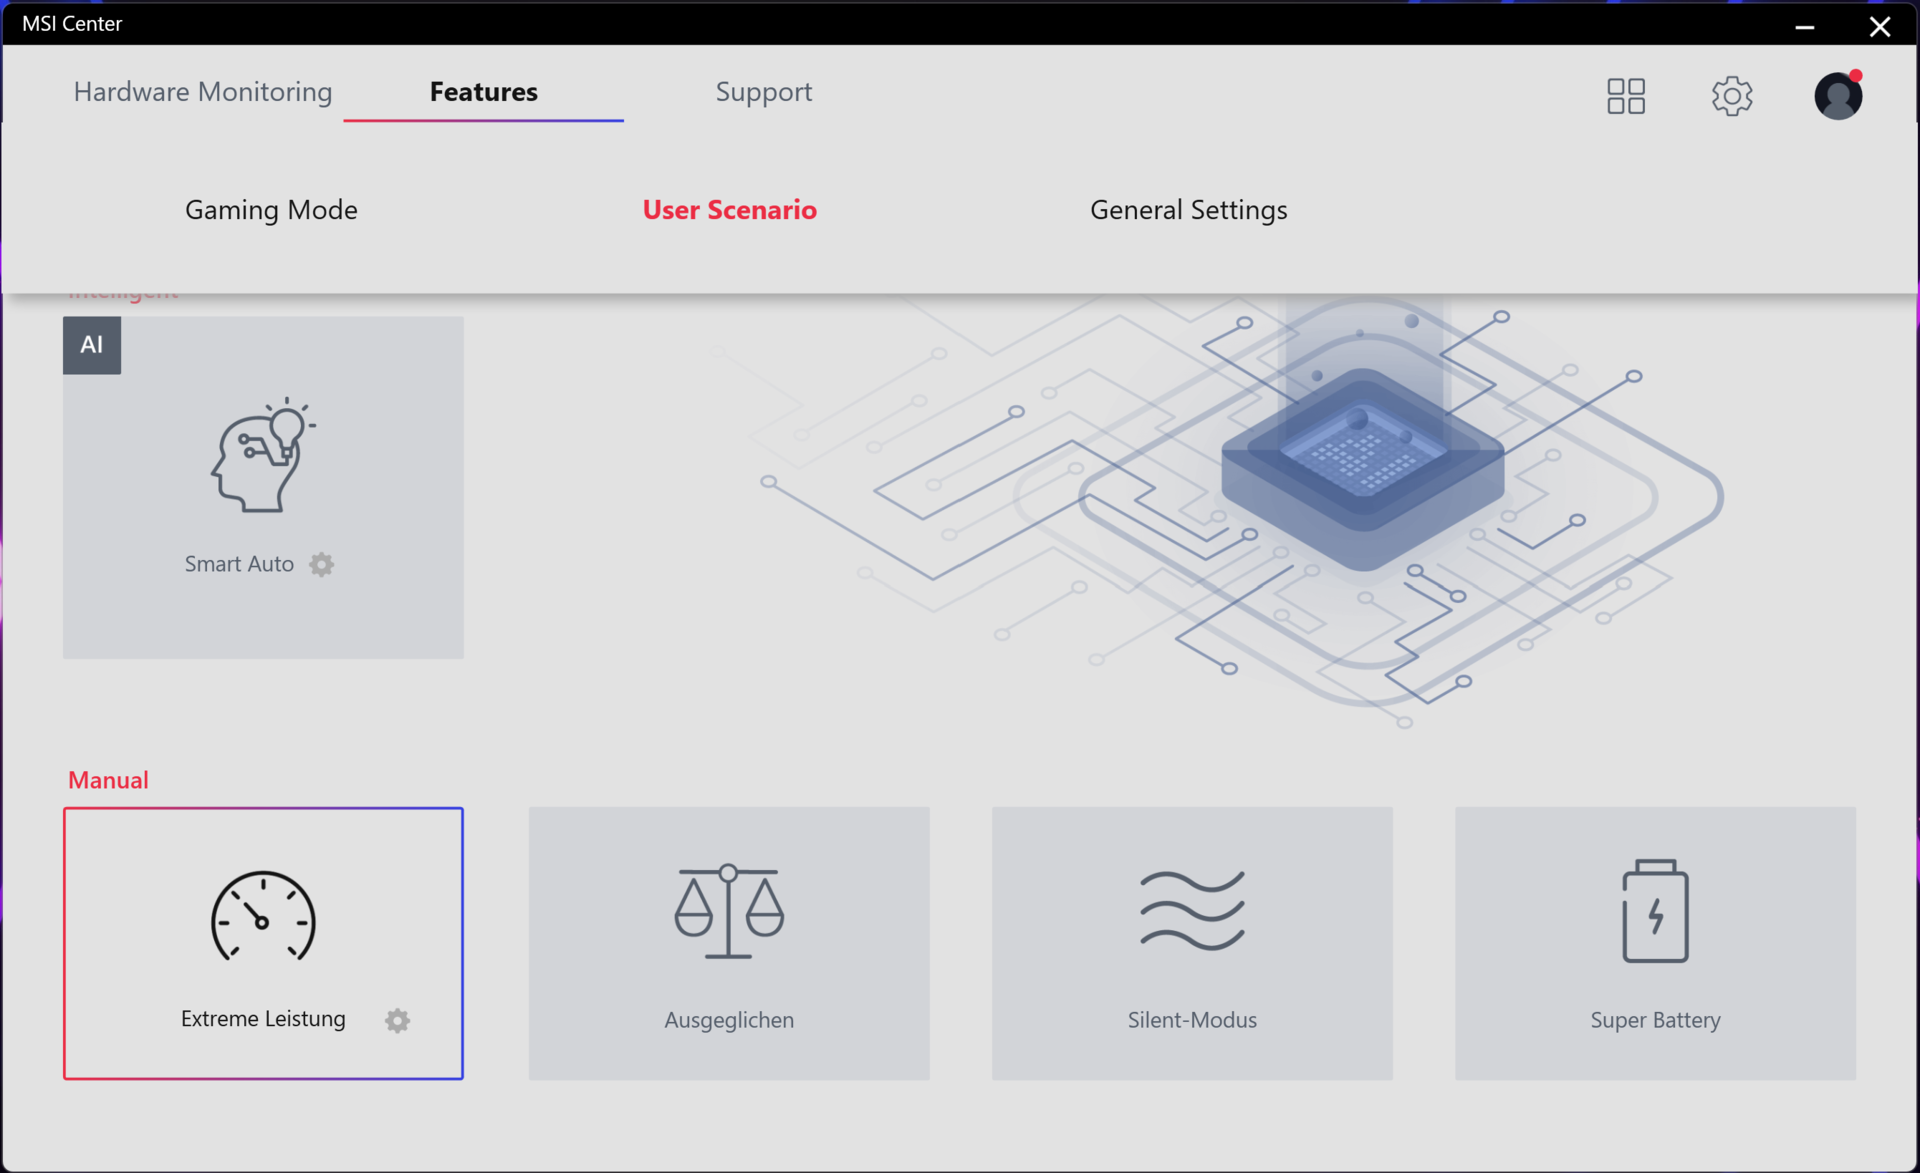
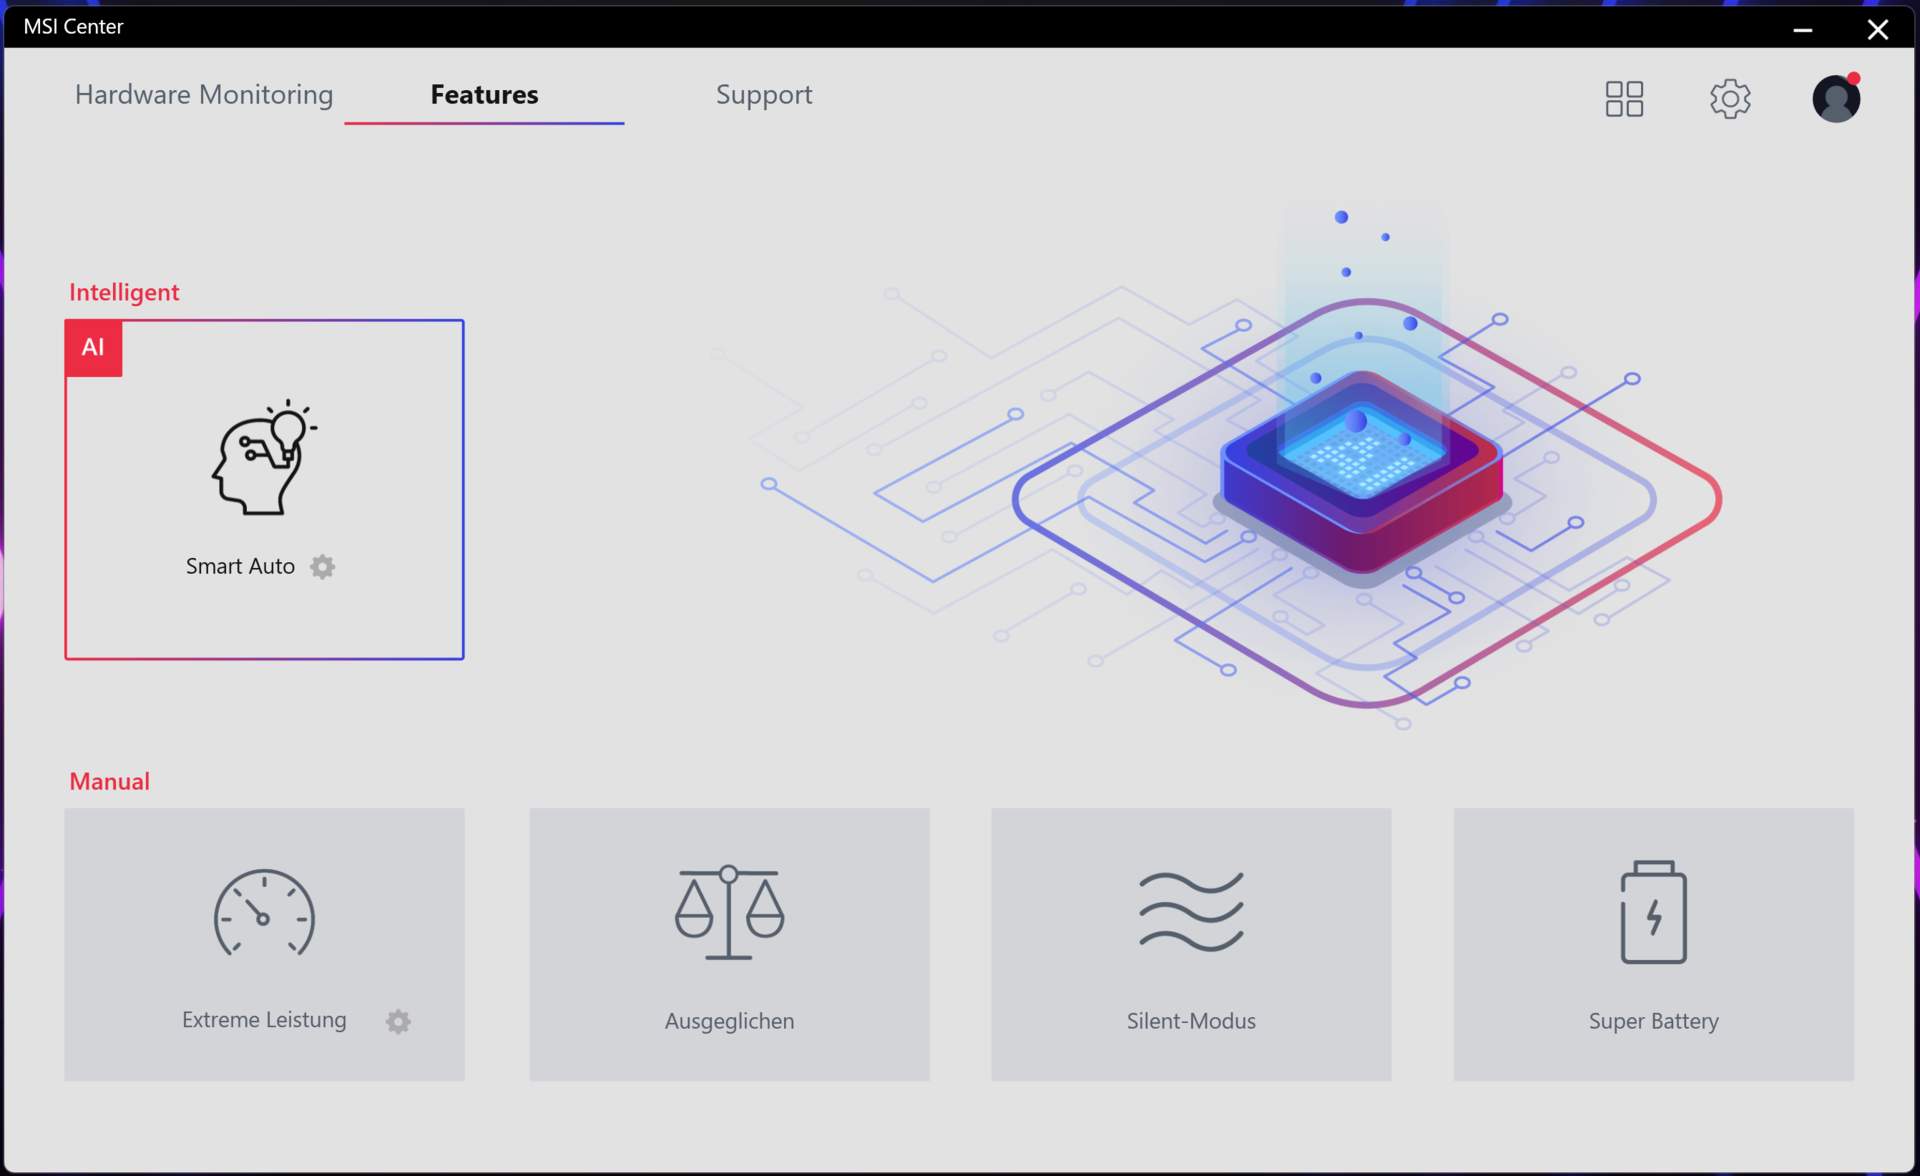
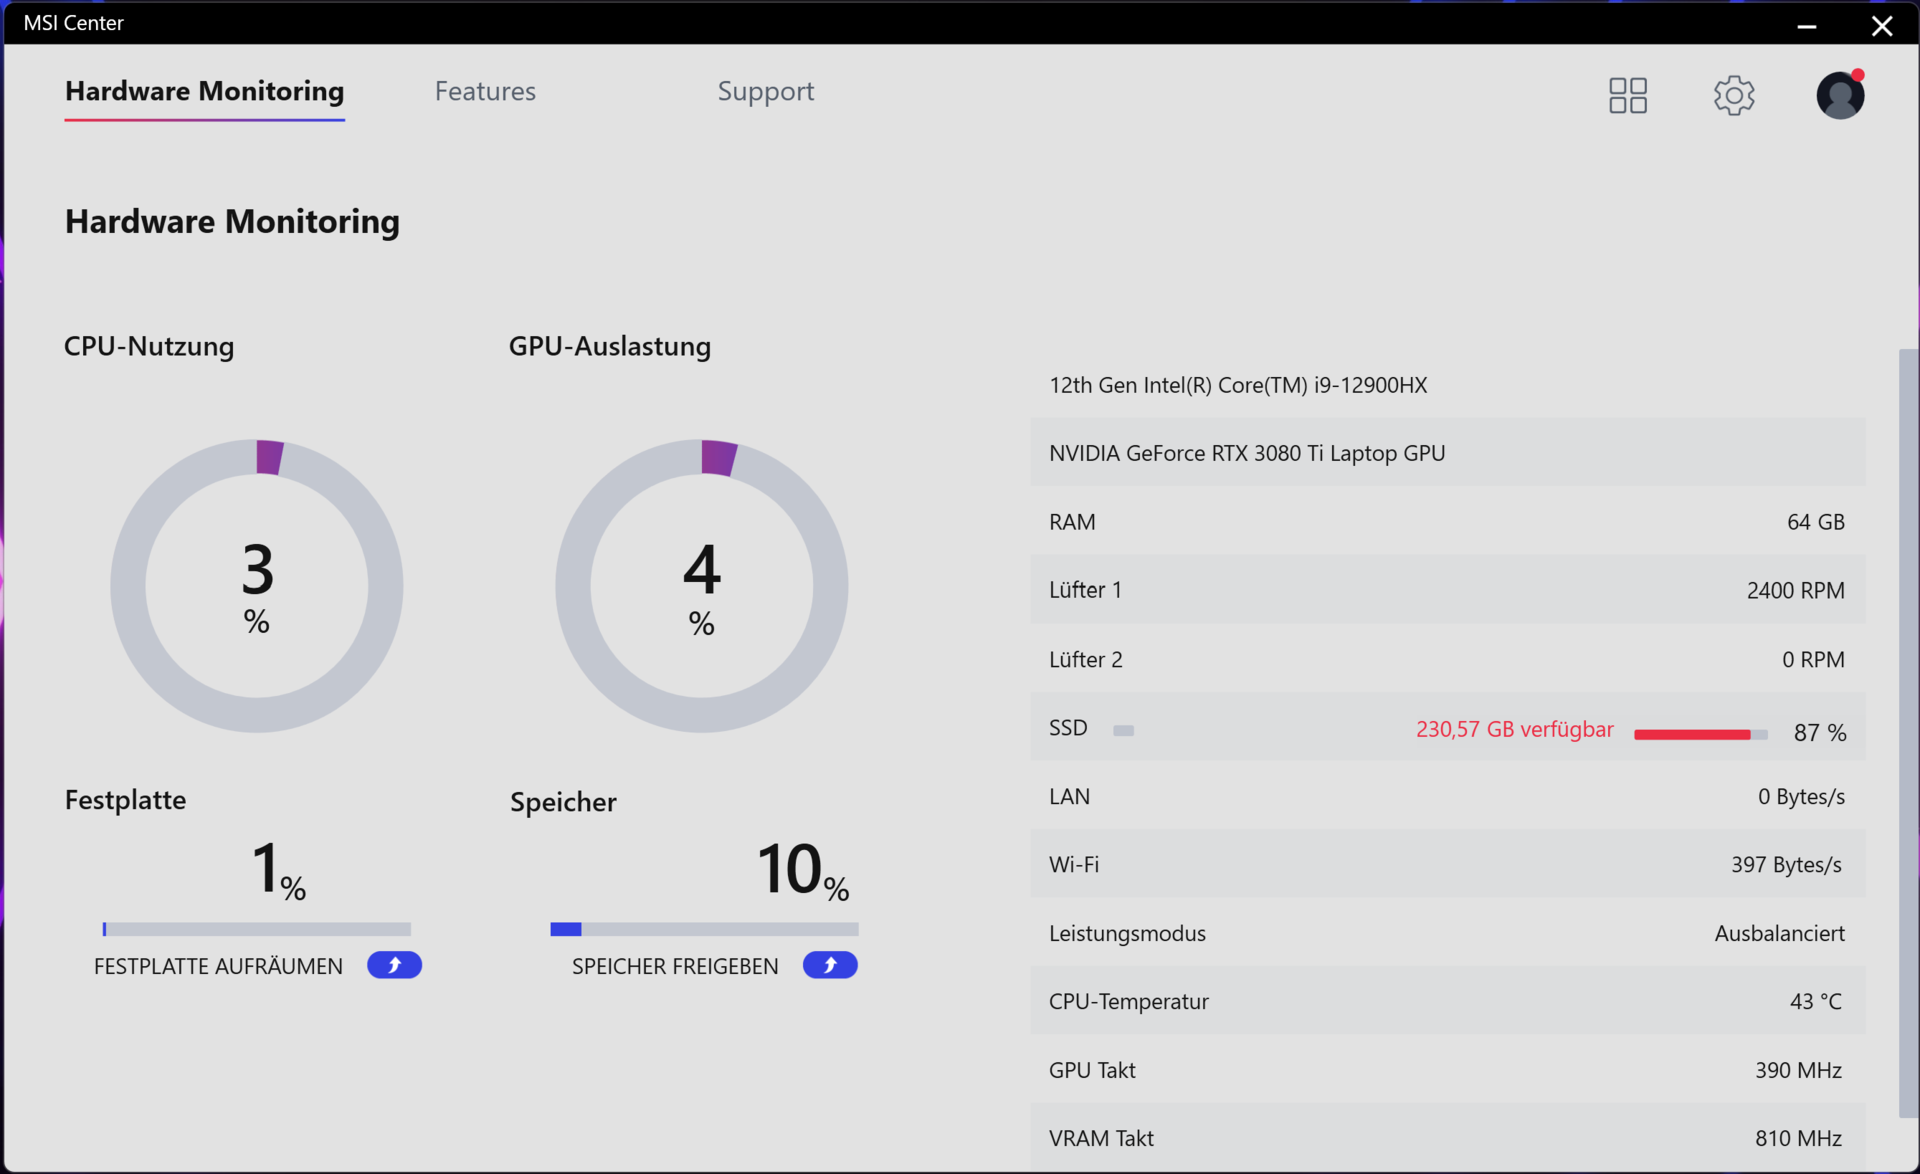
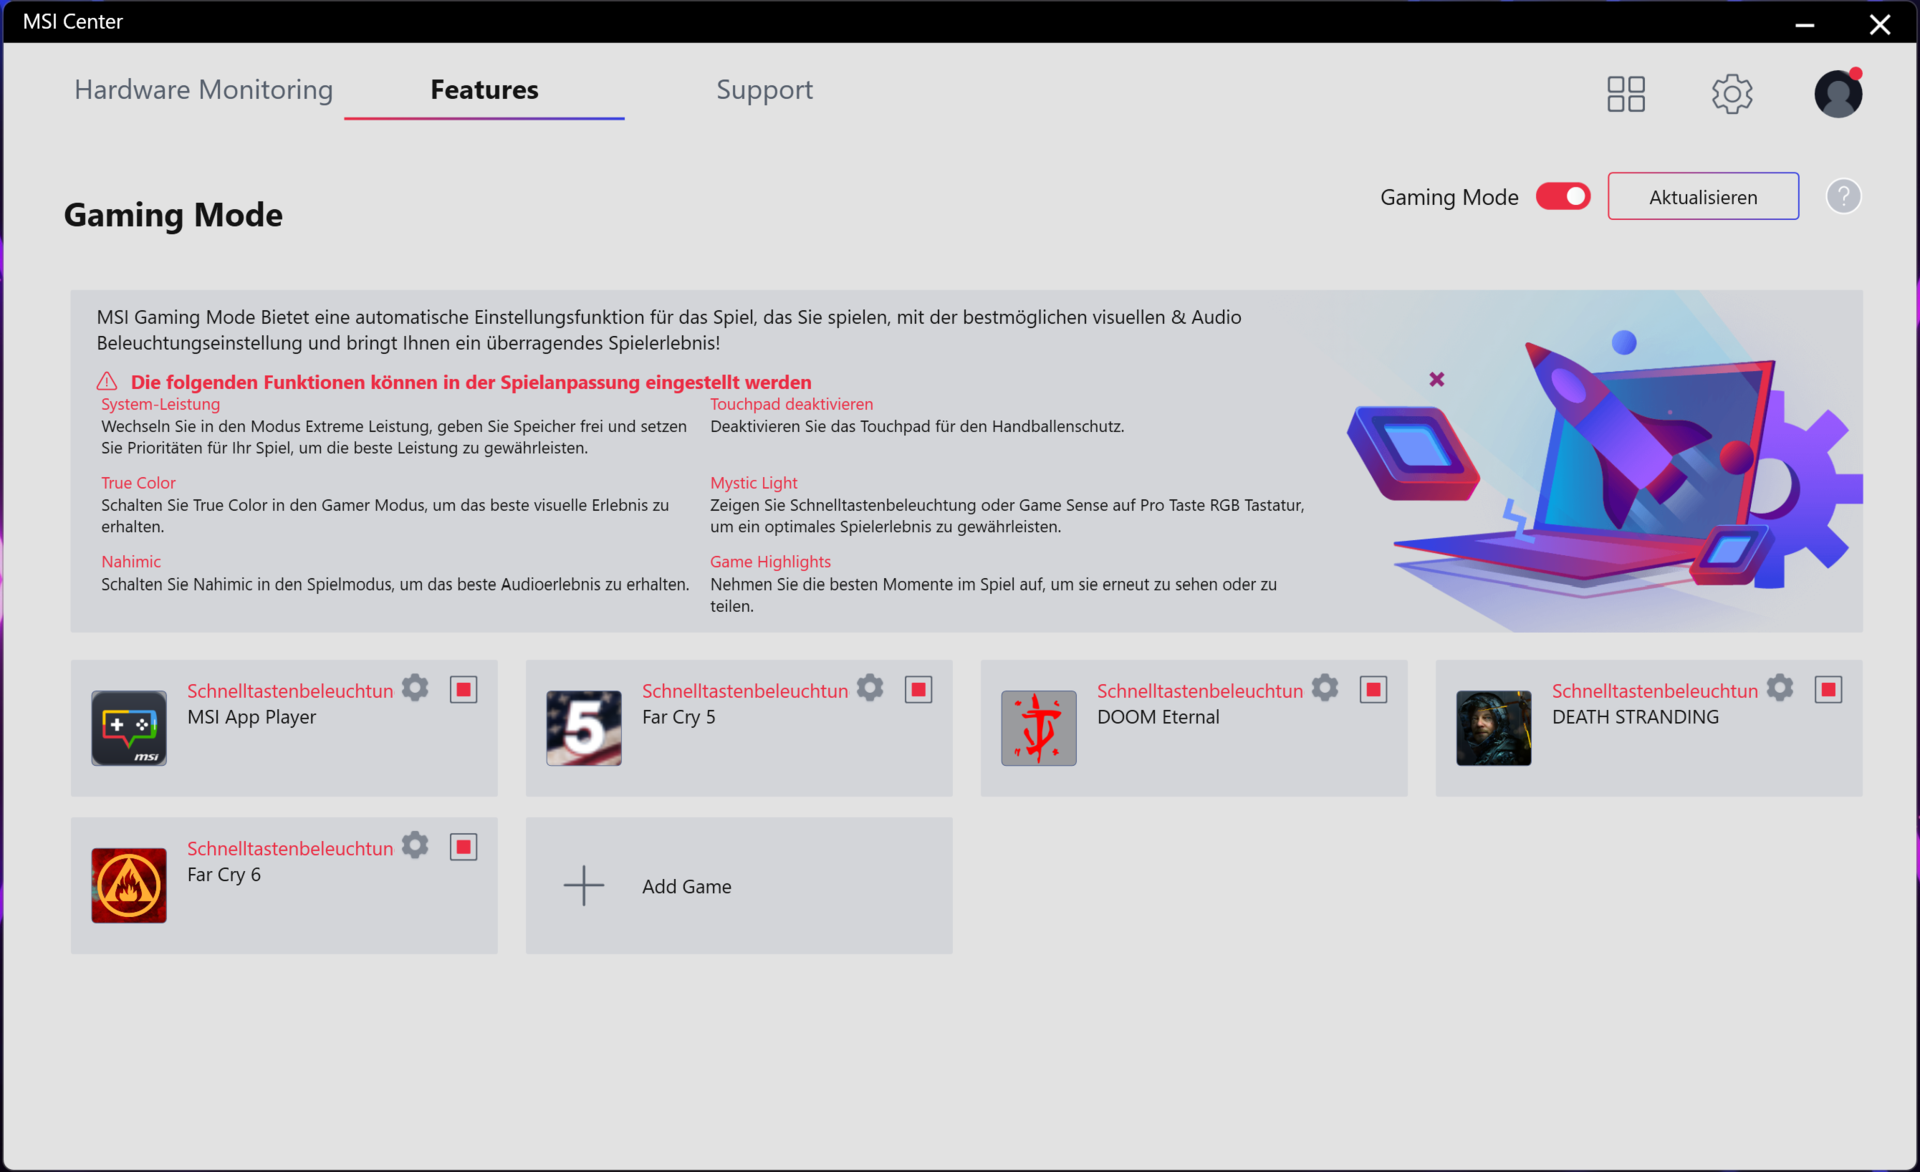
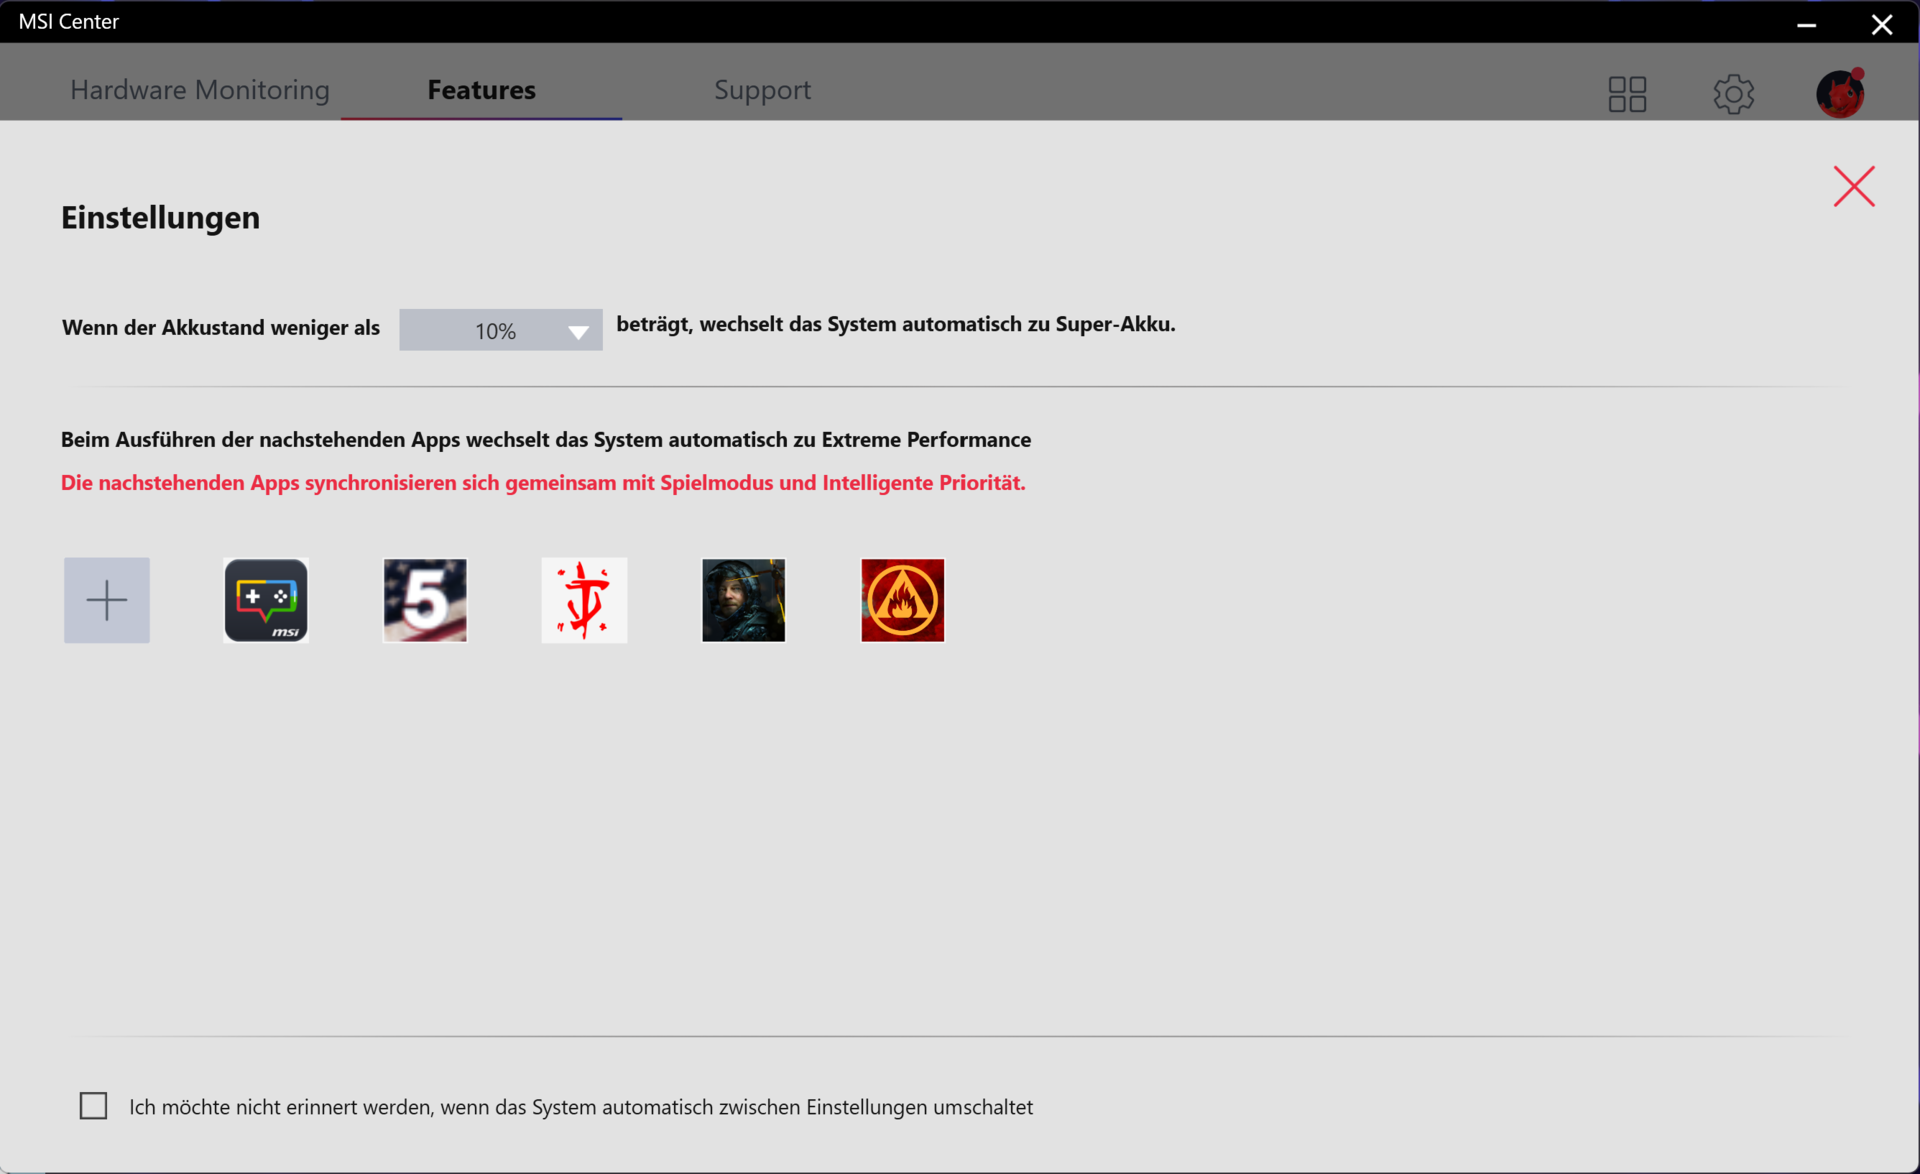
Vous pouvez basculer entre quatre profils de performance à l'aide du MSI Center préinstallé (voir images) ou en appuyant sur la combinaison de touches Fn+F7. Si la fonction supérieure "Smart Auto", basée sur l'intelligence artificielle, est activée (comme dans notre cas), le MSI Center choisira automatiquement le profil approprié à la situation actuelle.
Nous avons testé le modèle FHD avec le mode dGPU actif. En revanche, Nvidia Optimus était activé lors de notre examen de l'appareil actuel. Par conséquent, les résultats des mesures ne sont pas toujours directement comparables.
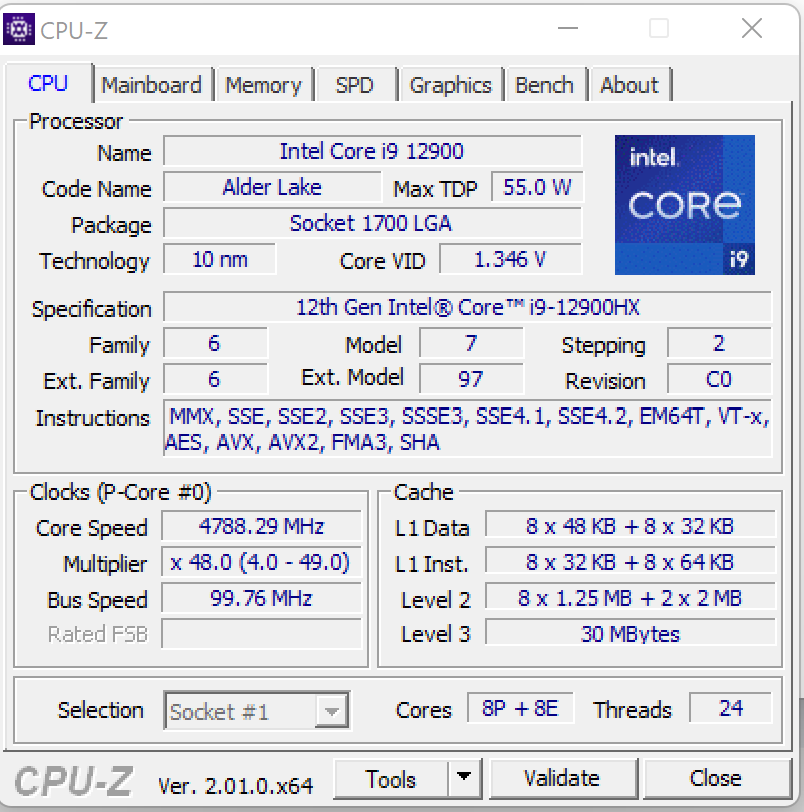
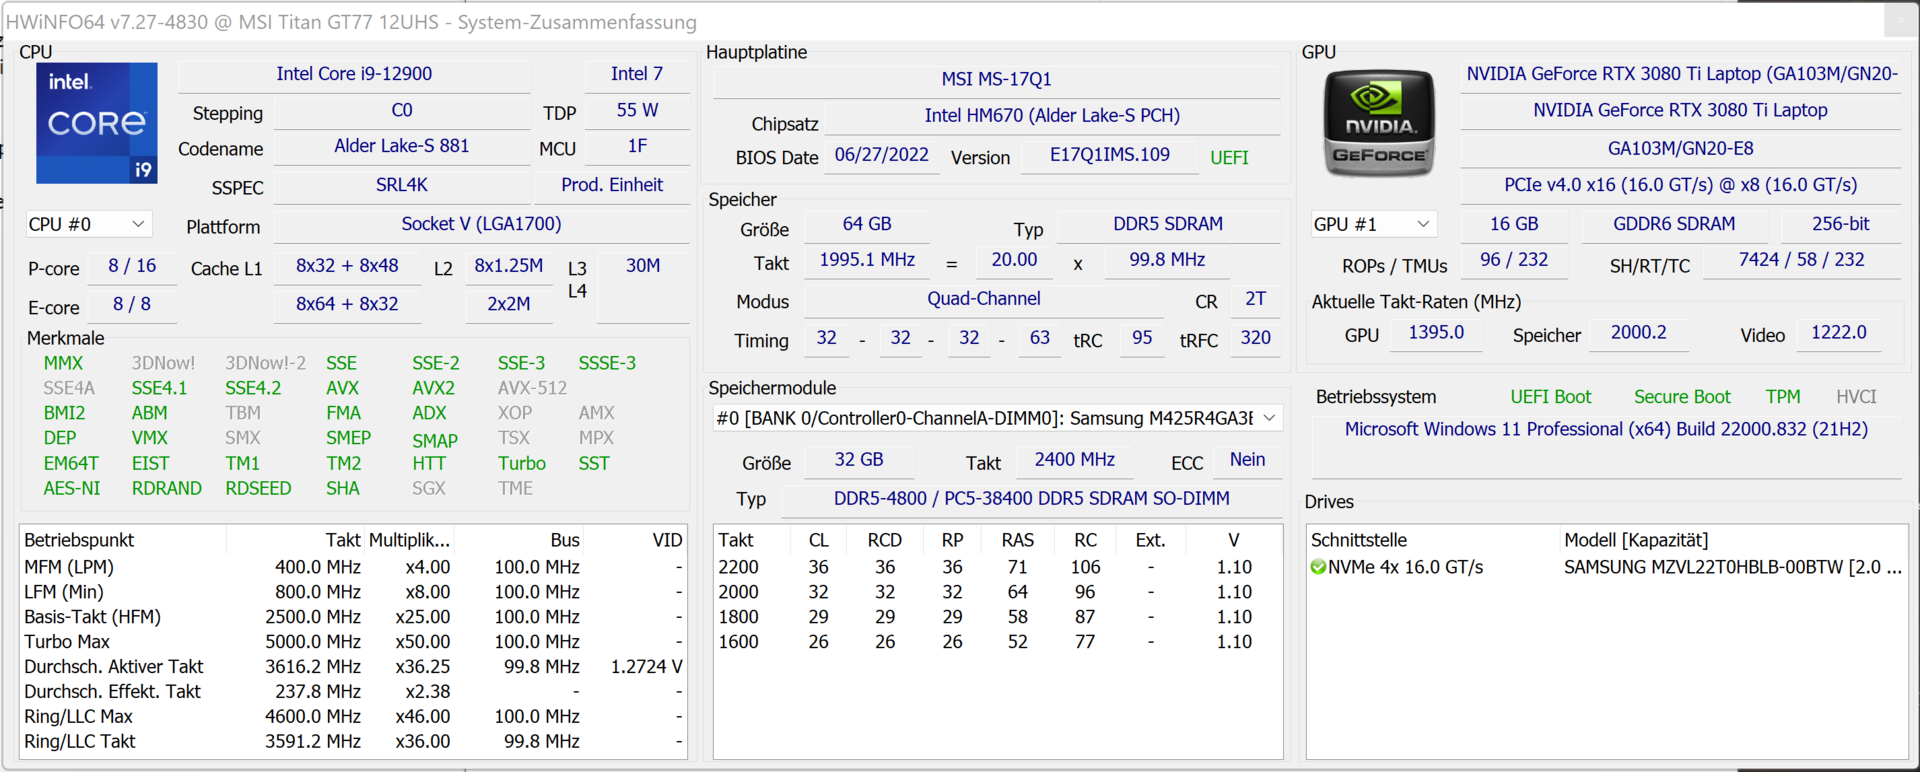
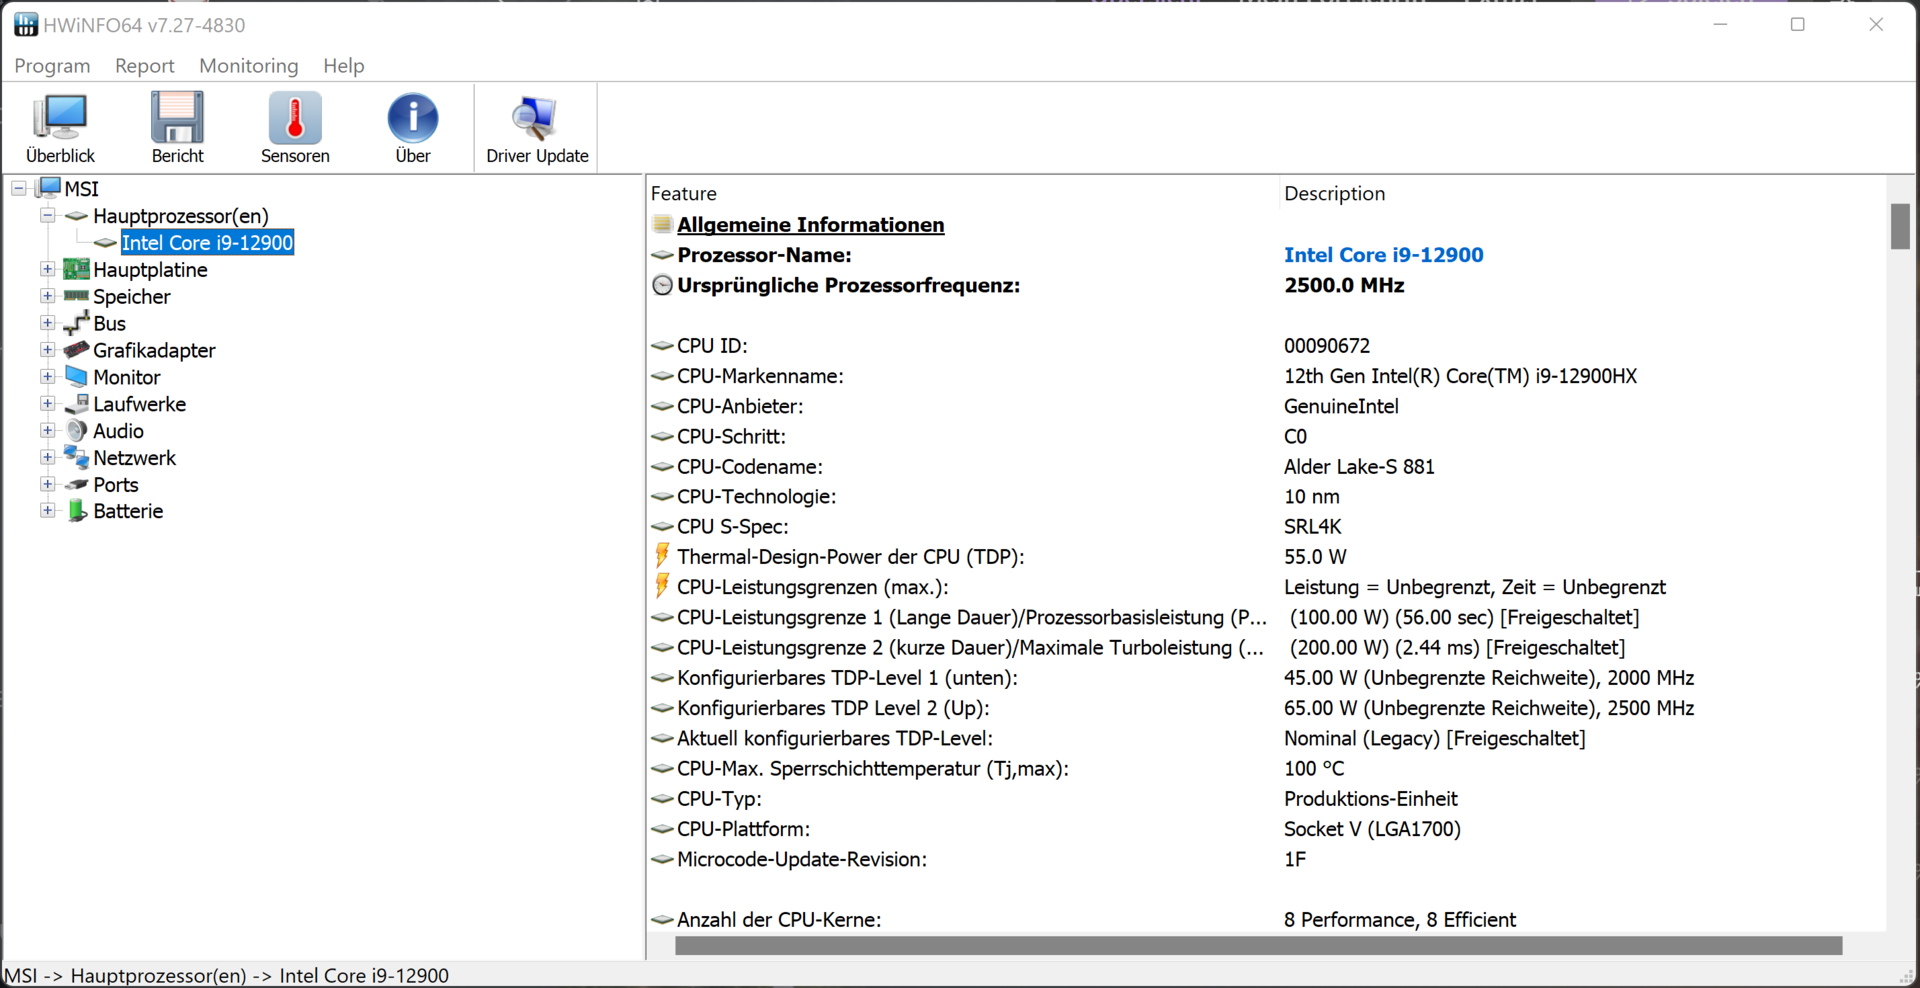
Processeur
Le processeur Core i9-12900HX (Alder Lake) se compose de huit cœurs de performance (Hyper-Threading, 2,3 à 5 GHz) et de huit cœurs d'efficacité (sans Hyper-Threading, 1,7 à 3,6 GHz), soit un total de 24 threads.
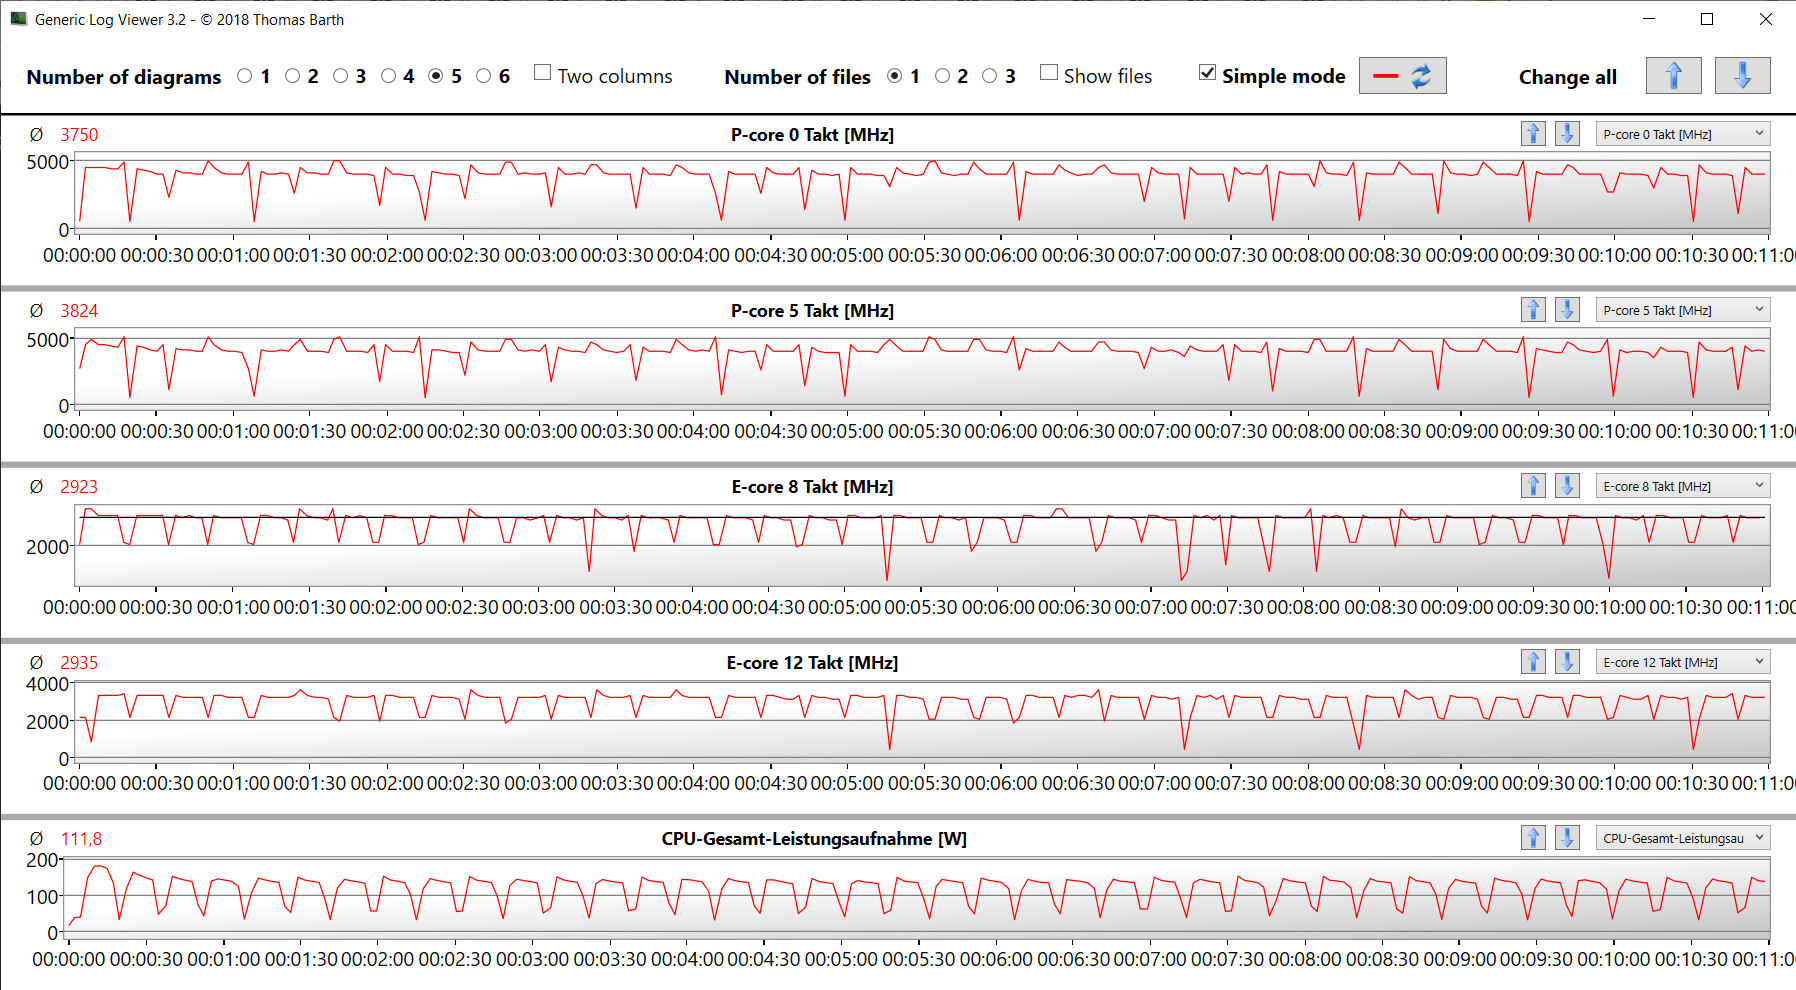
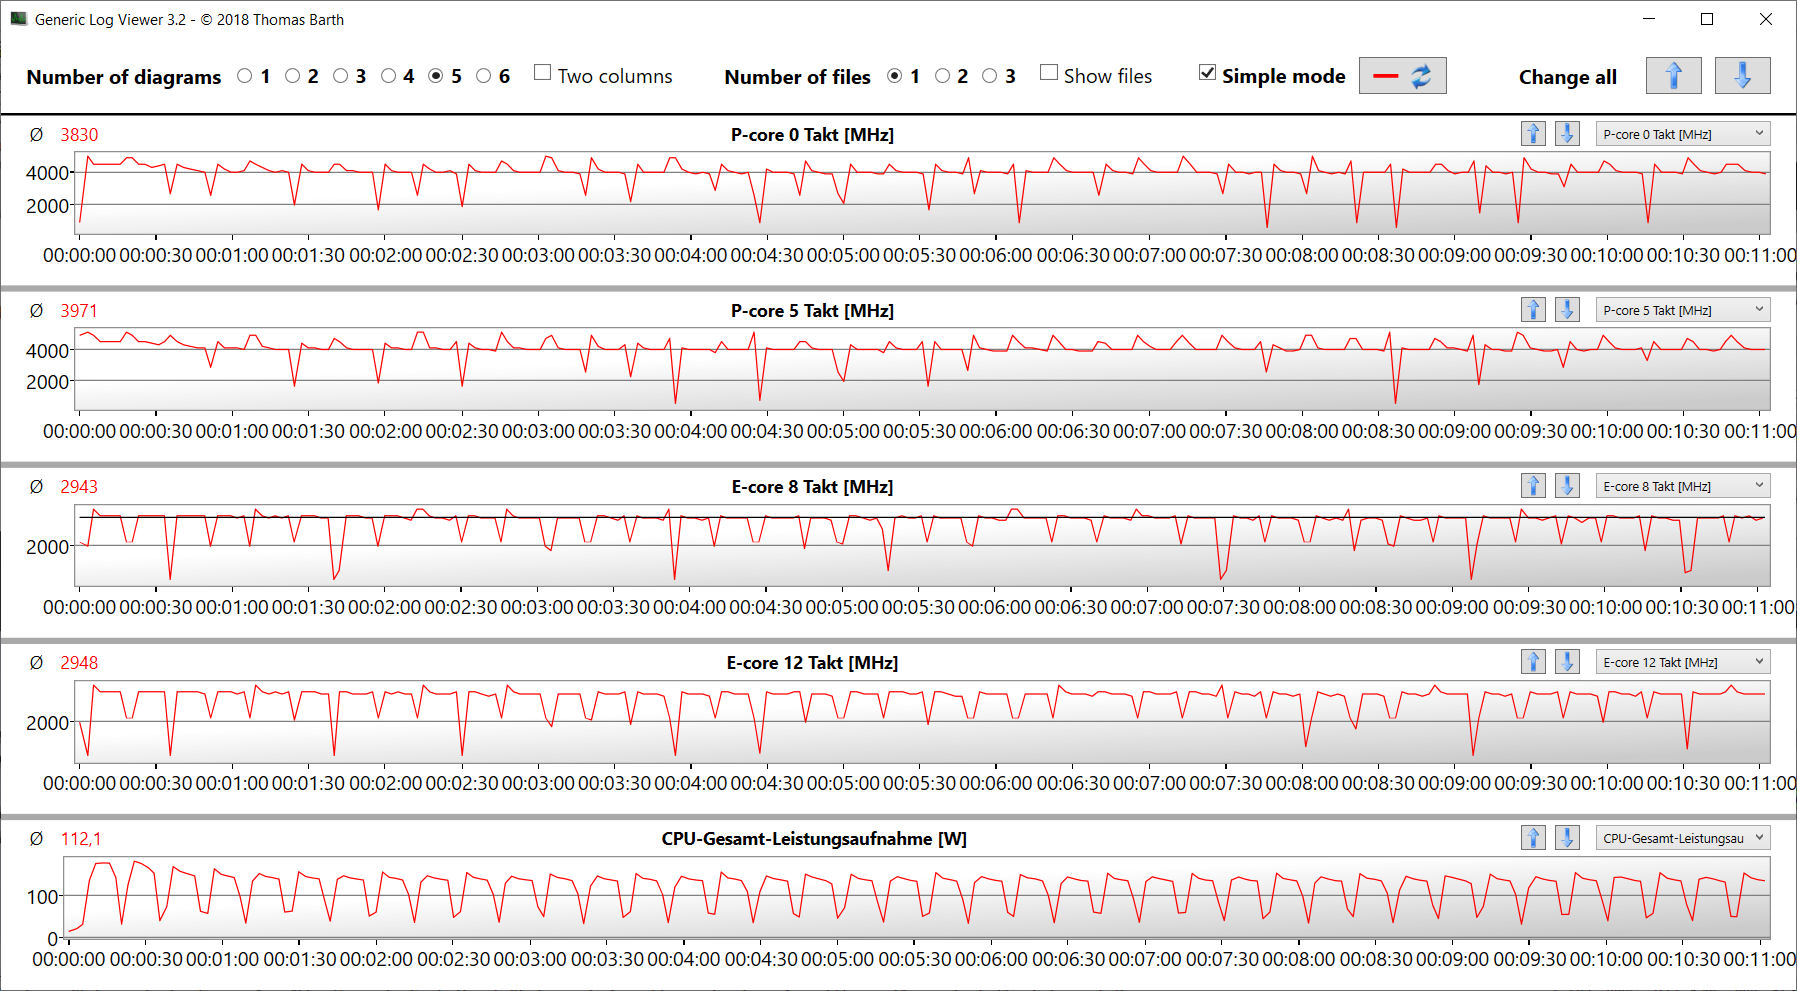
Dans Cinebench R15, le CPU a réussi le test multithread (P-cores : 4,4 GHz, E-cores : 3,3 GHz) et le test single-thread (P-cores : 500 MHz à 5 GHz, E-cores : 400 MHz à 3,6 GHz) à des vitesses d'horloge élevées. Ses performances sont légèrement inférieures sur batterie.
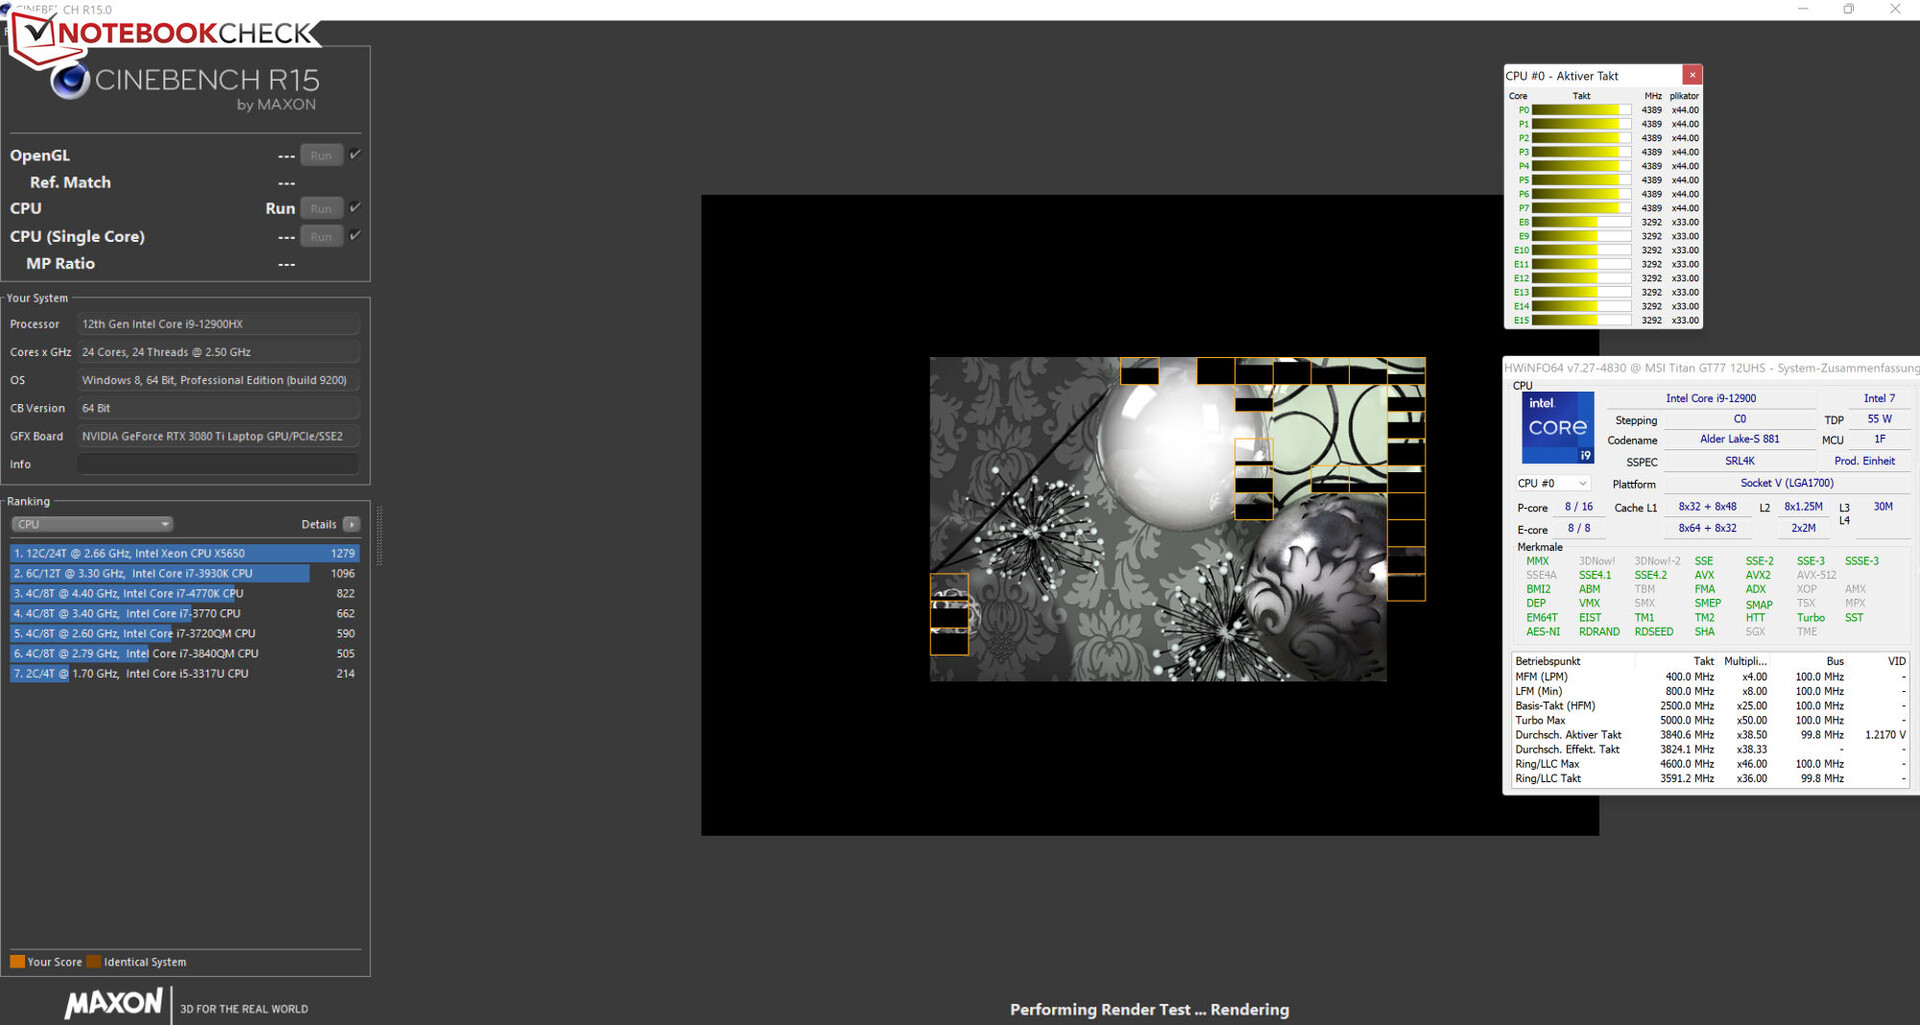
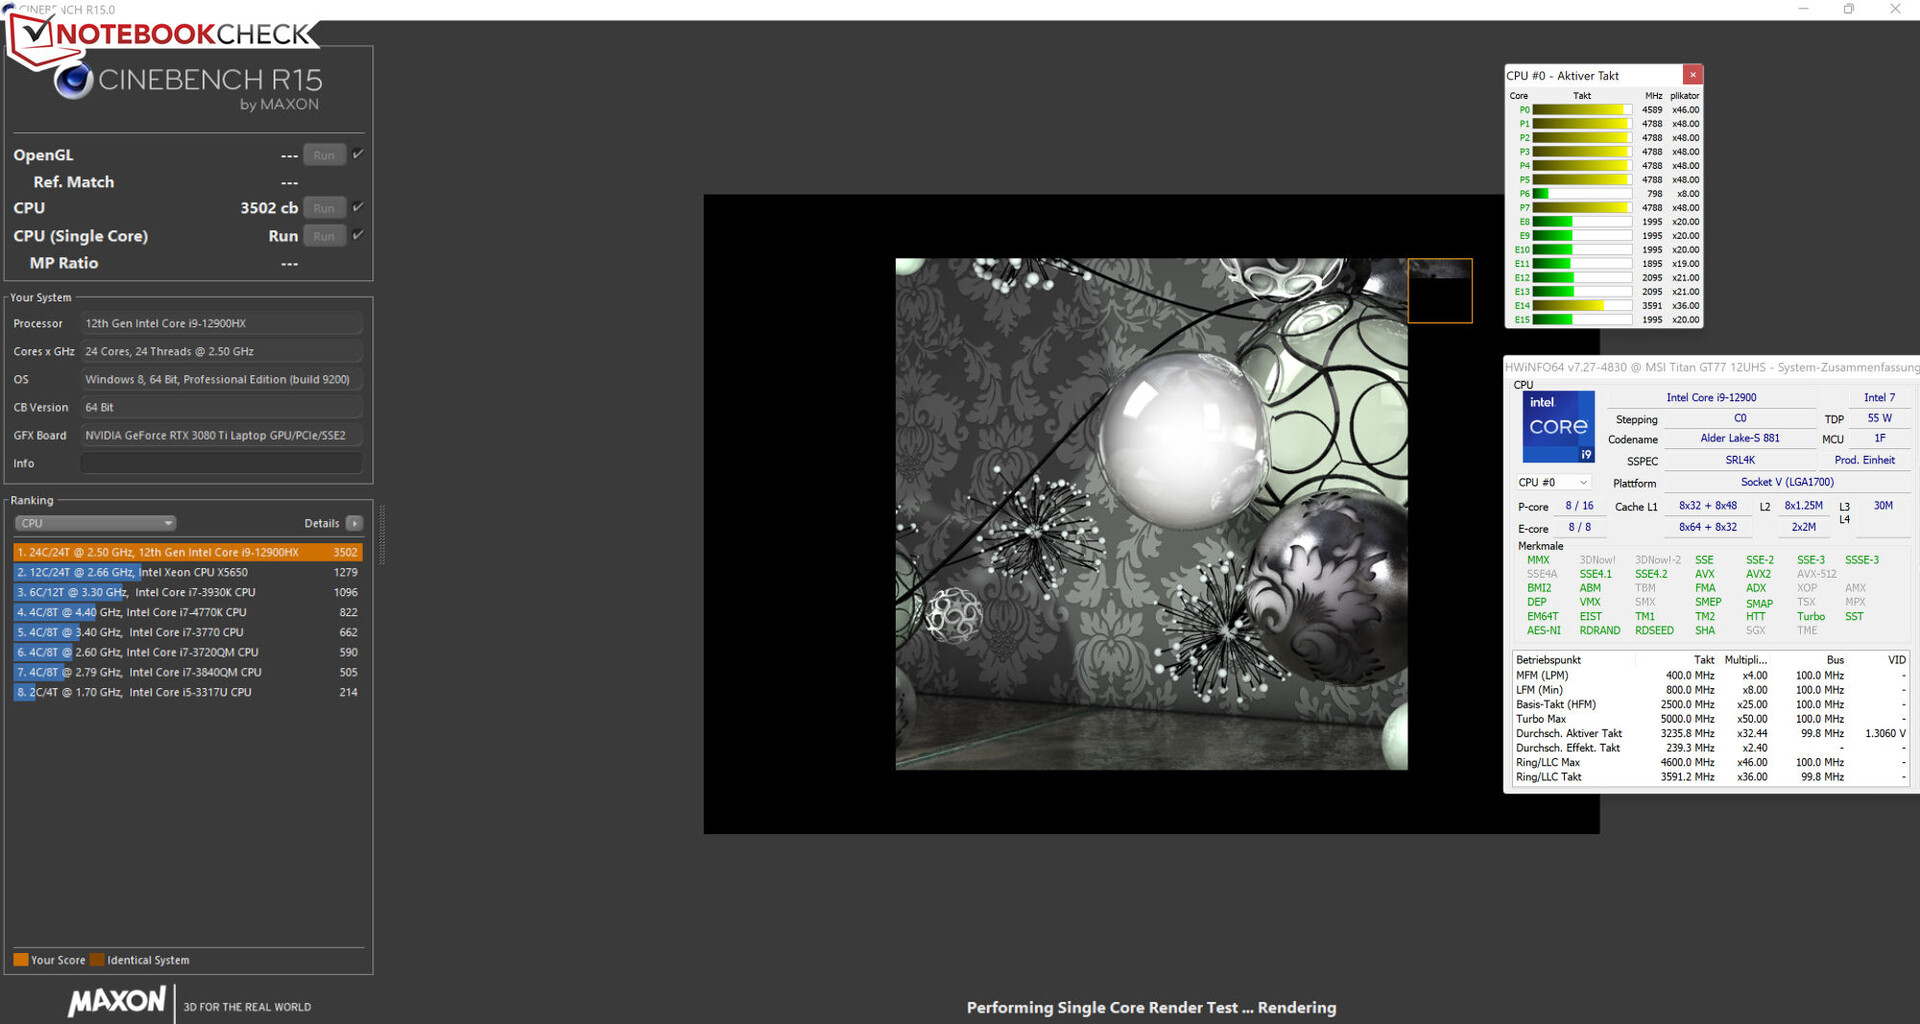
Le test en boucle Cinebench 15 a révélé que le processeur est capable de fonctionner à des vitesses d'horloge élevées en continu. L'utilisation du profil "Extreme Performance" a permis d'obtenir des performances légèrement plus stables.
Cinebench R15 Multi continuous test
| CPU Performance rating - Percent | |
| Moyenne de la classe Gaming | |
| MSI Titan GT77 12UHS 4k | |
| MSI Titan GT77 12UHS | |
| MSI Titan GT77 12UHS | |
| Moyenne Intel Core i9-12900HX | |
| Alienware x17 R2 P48E | |
| Schenker XMG Ultra 17 Rocket Lake | |
| Razer Blade 17 Early 2022 | |
| Cinebench R23 | |
| Multi Core | |
| Moyenne de la classe Gaming (10488 - 42661, n=107, 2 dernières années) | |
| MSI Titan GT77 12UHS 4k | |
| MSI Titan GT77 12UHS (4k, Extreme Leistung, Cooler Boost) | |
| MSI Titan GT77 12UHS | |
| Moyenne Intel Core i9-12900HX (18337 - 23482, n=8) | |
| Alienware x17 R2 P48E | |
| Schenker XMG Ultra 17 Rocket Lake | |
| Razer Blade 17 Early 2022 | |
| Single Core | |
| Moyenne de la classe Gaming (1166 - 2415, n=107, 2 dernières années) | |
| MSI Titan GT77 12UHS 4k | |
| Moyenne Intel Core i9-12900HX (1897 - 1936, n=8) | |
| MSI Titan GT77 12UHS | |
| MSI Titan GT77 12UHS (4k, Extreme Leistung, Cooler Boost) | |
| Razer Blade 17 Early 2022 | |
| Alienware x17 R2 P48E | |
| Schenker XMG Ultra 17 Rocket Lake | |
| Cinebench R20 | |
| CPU (Multi Core) | |
| Moyenne de la classe Gaming (4029 - 16433, n=106, 2 dernières années) | |
| MSI Titan GT77 12UHS 4k | |
| MSI Titan GT77 12UHS (4k, Extreme Leistung, Cooler Boost) | |
| MSI Titan GT77 12UHS | |
| Moyenne Intel Core i9-12900HX (7037 - 9042, n=8) | |
| Alienware x17 R2 P48E | |
| Schenker XMG Ultra 17 Rocket Lake | |
| Razer Blade 17 Early 2022 | |
| CPU (Single Core) | |
| Moyenne de la classe Gaming (442 - 913, n=106, 2 dernières années) | |
| MSI Titan GT77 12UHS 4k | |
| MSI Titan GT77 12UHS | |
| Moyenne Intel Core i9-12900HX (728 - 745, n=8) | |
| MSI Titan GT77 12UHS (4k, Extreme Leistung, Cooler Boost) | |
| Alienware x17 R2 P48E | |
| Razer Blade 17 Early 2022 | |
| Schenker XMG Ultra 17 Rocket Lake | |
| Cinebench R15 | |
| CPU Multi 64Bit | |
| Moyenne de la classe Gaming (1578 - 6330, n=105, 2 dernières années) | |
| MSI Titan GT77 12UHS 4k | |
| MSI Titan GT77 12UHS (4k, Extreme Leistung, Cooler Boost) | |
| MSI Titan GT77 12UHS | |
| Moyenne Intel Core i9-12900HX (2830 - 3652, n=8) | |
| Alienware x17 R2 P48E | |
| Schenker XMG Ultra 17 Rocket Lake | |
| Razer Blade 17 Early 2022 | |
| CPU Single 64Bit | |
| Moyenne de la classe Gaming (188.8 - 350, n=106, 2 dernières années) | |
| MSI Titan GT77 12UHS 4k | |
| MSI Titan GT77 12UHS | |
| MSI Titan GT77 12UHS (4k, Extreme Leistung, Cooler Boost) | |
| Moyenne Intel Core i9-12900HX (274 - 282, n=8) | |
| Alienware x17 R2 P48E | |
| Razer Blade 17 Early 2022 | |
| Schenker XMG Ultra 17 Rocket Lake | |
| Blender - v2.79 BMW27 CPU | |
| Razer Blade 17 Early 2022 | |
| Schenker XMG Ultra 17 Rocket Lake | |
| Alienware x17 R2 P48E | |
| Moyenne Intel Core i9-12900HX (144 - 201, n=8) | |
| Moyenne de la classe Gaming (79 - 330, n=104, 2 dernières années) | |
| MSI Titan GT77 12UHS 4k | |
| MSI Titan GT77 12UHS | |
| MSI Titan GT77 12UHS (4k, Extreme Leistung, Cooler Boost) | |
| 7-Zip 18.03 | |
| 7z b 4 | |
| Moyenne de la classe Gaming (33491 - 148086, n=105, 2 dernières années) | |
| MSI Titan GT77 12UHS 4k | |
| MSI Titan GT77 12UHS (4k, Extreme Leistung, Cooler Boost) | |
| MSI Titan GT77 12UHS | |
| Moyenne Intel Core i9-12900HX (69778 - 88128, n=7) | |
| Alienware x17 R2 P48E | |
| Schenker XMG Ultra 17 Rocket Lake | |
| Razer Blade 17 Early 2022 | |
| 7z b 4 -mmt1 | |
| Moyenne de la classe Gaming (4199 - 7436, n=105, 2 dernières années) | |
| MSI Titan GT77 12UHS 4k | |
| Moyenne Intel Core i9-12900HX (6165 - 6358, n=7) | |
| MSI Titan GT77 12UHS | |
| MSI Titan GT77 12UHS | |
| Schenker XMG Ultra 17 Rocket Lake | |
| Razer Blade 17 Early 2022 | |
| Alienware x17 R2 P48E | |
| Geekbench 5.5 | |
| Multi-Core | |
| Moyenne de la classe Gaming (6460 - 28263, n=105, 2 dernières années) | |
| MSI Titan GT77 12UHS 4k | |
| MSI Titan GT77 12UHS (4k, Extreme Leistung, Cooler Boost) | |
| MSI Titan GT77 12UHS | |
| Moyenne Intel Core i9-12900HX (15116 - 16925, n=8) | |
| Alienware x17 R2 P48E | |
| Schenker XMG Ultra 17 Rocket Lake | |
| Razer Blade 17 Early 2022 | |
| Single-Core | |
| Moyenne de la classe Gaming (986 - 2474, n=105, 2 dernières années) | |
| MSI Titan GT77 12UHS | |
| MSI Titan GT77 12UHS 4k | |
| MSI Titan GT77 12UHS (4k, Extreme Leistung, Cooler Boost) | |
| Moyenne Intel Core i9-12900HX (1874 - 1949, n=8) | |
| Alienware x17 R2 P48E | |
| Razer Blade 17 Early 2022 | |
| Schenker XMG Ultra 17 Rocket Lake | |
| HWBOT x265 Benchmark v2.2 - 4k Preset | |
| Moyenne de la classe Gaming (11.5 - 44.4, n=105, 2 dernières années) | |
| MSI Titan GT77 12UHS 4k | |
| MSI Titan GT77 12UHS (4k, Extreme Leistung, Cooler Boost) | |
| MSI Titan GT77 12UHS | |
| Moyenne Intel Core i9-12900HX (19.6 - 26.6, n=7) | |
| Alienware x17 R2 P48E | |
| Schenker XMG Ultra 17 Rocket Lake | |
| Razer Blade 17 Early 2022 | |
| LibreOffice - 20 Documents To PDF | |
| Moyenne de la classe Gaming (33.2 - 88.8, n=105, 2 dernières années) | |
| Alienware x17 R2 P48E | |
| Schenker XMG Ultra 17 Rocket Lake | |
| Razer Blade 17 Early 2022 | |
| MSI Titan GT77 12UHS | |
| MSI Titan GT77 12UHS 4k | |
| Moyenne Intel Core i9-12900HX (33.6 - 42.4, n=7) | |
| MSI Titan GT77 12UHS (4k, Extreme Leistung, Cooler Boost) | |
| R Benchmark 2.5 - Overall mean | |
| Schenker XMG Ultra 17 Rocket Lake | |
| Razer Blade 17 Early 2022 | |
| Alienware x17 R2 P48E | |
| Moyenne de la classe Gaming (0.3439 - 0.759, n=106, 2 dernières années) | |
| MSI Titan GT77 12UHS 4k | |
| MSI Titan GT77 12UHS (4k, Extreme Leistung, Cooler Boost) | |
| Moyenne Intel Core i9-12900HX (0.4159 - 0.4242, n=7) | |
| MSI Titan GT77 12UHS | |
* ... Moindre est la valeur, meilleures sont les performances
AIDA64: FP32 Ray-Trace | FPU Julia | CPU SHA3 | CPU Queen | FPU SinJulia | FPU Mandel | CPU AES | CPU ZLib | FP64 Ray-Trace | CPU PhotoWorxx
| Performance rating | |
| Moyenne de la classe Gaming | |
| MSI Titan GT77 12UHS 4k | |
| MSI Titan GT77 12UHS | |
| MSI Titan GT77 12UHS | |
| Moyenne Intel Core i9-12900HX | |
| Schenker XMG Ultra 17 Rocket Lake | |
| Alienware x17 R2 P48E | |
| Razer Blade 17 Early 2022 | |
| AIDA64 / FP32 Ray-Trace | |
| Moyenne de la classe Gaming (10227 - 85542, n=105, 2 dernières années) | |
| MSI Titan GT77 12UHS 4k (v6.70.6000) | |
| MSI Titan GT77 12UHS (v6.70.6000, 4k, Extreme Leistung, Cooler Boost) | |
| MSI Titan GT77 12UHS (v6.70.6000) | |
| Moyenne Intel Core i9-12900HX (11535 - 22183, n=7) | |
| Schenker XMG Ultra 17 Rocket Lake (v6.32.5600) | |
| Alienware x17 R2 P48E (v6.50.5800) | |
| Razer Blade 17 Early 2022 (v6.50.5800) | |
| AIDA64 / FPU Julia | |
| Moyenne de la classe Gaming (51376 - 238426, n=105, 2 dernières années) | |
| MSI Titan GT77 12UHS 4k (v6.70.6000) | |
| MSI Titan GT77 12UHS (v6.70.6000) | |
| MSI Titan GT77 12UHS (v6.70.6000, 4k, Extreme Leistung, Cooler Boost) | |
| Moyenne Intel Core i9-12900HX (52916 - 110093, n=7) | |
| Schenker XMG Ultra 17 Rocket Lake (v6.32.5600) | |
| Alienware x17 R2 P48E (v6.50.5800) | |
| Razer Blade 17 Early 2022 (v6.50.5800) | |
| AIDA64 / CPU SHA3 | |
| Moyenne de la classe Gaming (2180 - 10115, n=105, 2 dernières années) | |
| MSI Titan GT77 12UHS 4k (v6.70.6000) | |
| MSI Titan GT77 12UHS (v6.70.6000, 4k, Extreme Leistung, Cooler Boost) | |
| MSI Titan GT77 12UHS (v6.70.6000) | |
| Schenker XMG Ultra 17 Rocket Lake (v6.32.5600) | |
| Moyenne Intel Core i9-12900HX (3559 - 5123, n=7) | |
| Alienware x17 R2 P48E (v6.50.5800) | |
| Razer Blade 17 Early 2022 (v6.50.5800) | |
| AIDA64 / CPU Queen | |
| Moyenne de la classe Gaming (49785 - 173351, n=90, 2 dernières années) | |
| Alienware x17 R2 P48E (v6.50.5800) | |
| Schenker XMG Ultra 17 Rocket Lake (v6.32.5600) | |
| MSI Titan GT77 12UHS (v6.70.6000) | |
| MSI Titan GT77 12UHS 4k (v6.70.6000) | |
| MSI Titan GT77 12UHS (v6.70.6000, 4k, Extreme Leistung, Cooler Boost) | |
| Moyenne Intel Core i9-12900HX (101029 - 104457, n=7) | |
| Razer Blade 17 Early 2022 (v6.50.5800) | |
| AIDA64 / FPU SinJulia | |
| Moyenne de la classe Gaming (4424 - 33636, n=105, 2 dernières années) | |
| MSI Titan GT77 12UHS 4k (v6.70.6000) | |
| MSI Titan GT77 12UHS (v6.70.6000, 4k, Extreme Leistung, Cooler Boost) | |
| MSI Titan GT77 12UHS (v6.70.6000) | |
| Moyenne Intel Core i9-12900HX (10475 - 13062, n=7) | |
| Schenker XMG Ultra 17 Rocket Lake (v6.32.5600) | |
| Alienware x17 R2 P48E (v6.50.5800) | |
| Razer Blade 17 Early 2022 (v6.50.5800) | |
| AIDA64 / FPU Mandel | |
| Moyenne de la classe Gaming (25115 - 128721, n=105, 2 dernières années) | |
| MSI Titan GT77 12UHS 4k (v6.70.6000) | |
| MSI Titan GT77 12UHS (v6.70.6000, 4k, Extreme Leistung, Cooler Boost) | |
| MSI Titan GT77 12UHS (v6.70.6000) | |
| Moyenne Intel Core i9-12900HX (31779 - 53628, n=7) | |
| Schenker XMG Ultra 17 Rocket Lake (v6.32.5600) | |
| Alienware x17 R2 P48E (v6.50.5800) | |
| Razer Blade 17 Early 2022 (v6.50.5800) | |
| AIDA64 / CPU AES | |
| MSI Titan GT77 12UHS (v6.70.6000, 4k, Extreme Leistung, Cooler Boost) | |
| MSI Titan GT77 12UHS | |
| MSI Titan GT77 12UHS 4k (v6.70.6000) | |
| Moyenne Intel Core i9-12900HX (125268 - 183146, n=7) | |
| Schenker XMG Ultra 17 Rocket Lake (v6.32.5600) | |
| Moyenne de la classe Gaming (39258 - 247074, n=105, 2 dernières années) | |
| Alienware x17 R2 P48E (v6.50.5800) | |
| Razer Blade 17 Early 2022 (v6.50.5800) | |
| AIDA64 / CPU ZLib | |
| Moyenne de la classe Gaming (574 - 2531, n=105, 2 dernières années) | |
| MSI Titan GT77 12UHS 4k (v6.70.6000) | |
| MSI Titan GT77 12UHS (v6.70.6000, 4k, Extreme Leistung, Cooler Boost) | |
| MSI Titan GT77 12UHS (v6.70.6000) | |
| Moyenne Intel Core i9-12900HX (990 - 1408, n=7) | |
| Alienware x17 R2 P48E (v6.50.5800) | |
| Schenker XMG Ultra 17 Rocket Lake (v6.32.5600) | |
| Razer Blade 17 Early 2022 (v6.50.5800) | |
| AIDA64 / FP64 Ray-Trace | |
| Moyenne de la classe Gaming (5509 - 45446, n=105, 2 dernières années) | |
| MSI Titan GT77 12UHS 4k (v6.70.6000) | |
| MSI Titan GT77 12UHS (v6.70.6000, 4k, Extreme Leistung, Cooler Boost) | |
| MSI Titan GT77 12UHS (v6.70.6000) | |
| Moyenne Intel Core i9-12900HX (6663 - 11913, n=7) | |
| Schenker XMG Ultra 17 Rocket Lake (v6.32.5600) | |
| Alienware x17 R2 P48E (v6.50.5800) | |
| Razer Blade 17 Early 2022 (v6.50.5800) | |
| AIDA64 / CPU PhotoWorxx | |
| Moyenne de la classe Gaming (12271 - 89891, n=105, 2 dernières années) | |
| Moyenne Intel Core i9-12900HX (40239 - 47710, n=7) | |
| MSI Titan GT77 12UHS (v6.70.6000) | |
| MSI Titan GT77 12UHS 4k (v6.70.6000) | |
| MSI Titan GT77 12UHS (v6.70.6000, 4k, Extreme Leistung, Cooler Boost) | |
| Razer Blade 17 Early 2022 (v6.50.5800) | |
| Alienware x17 R2 P48E (v6.50.5800) | |
| Schenker XMG Ultra 17 Rocket Lake (v6.32.5600) | |
Performance du système
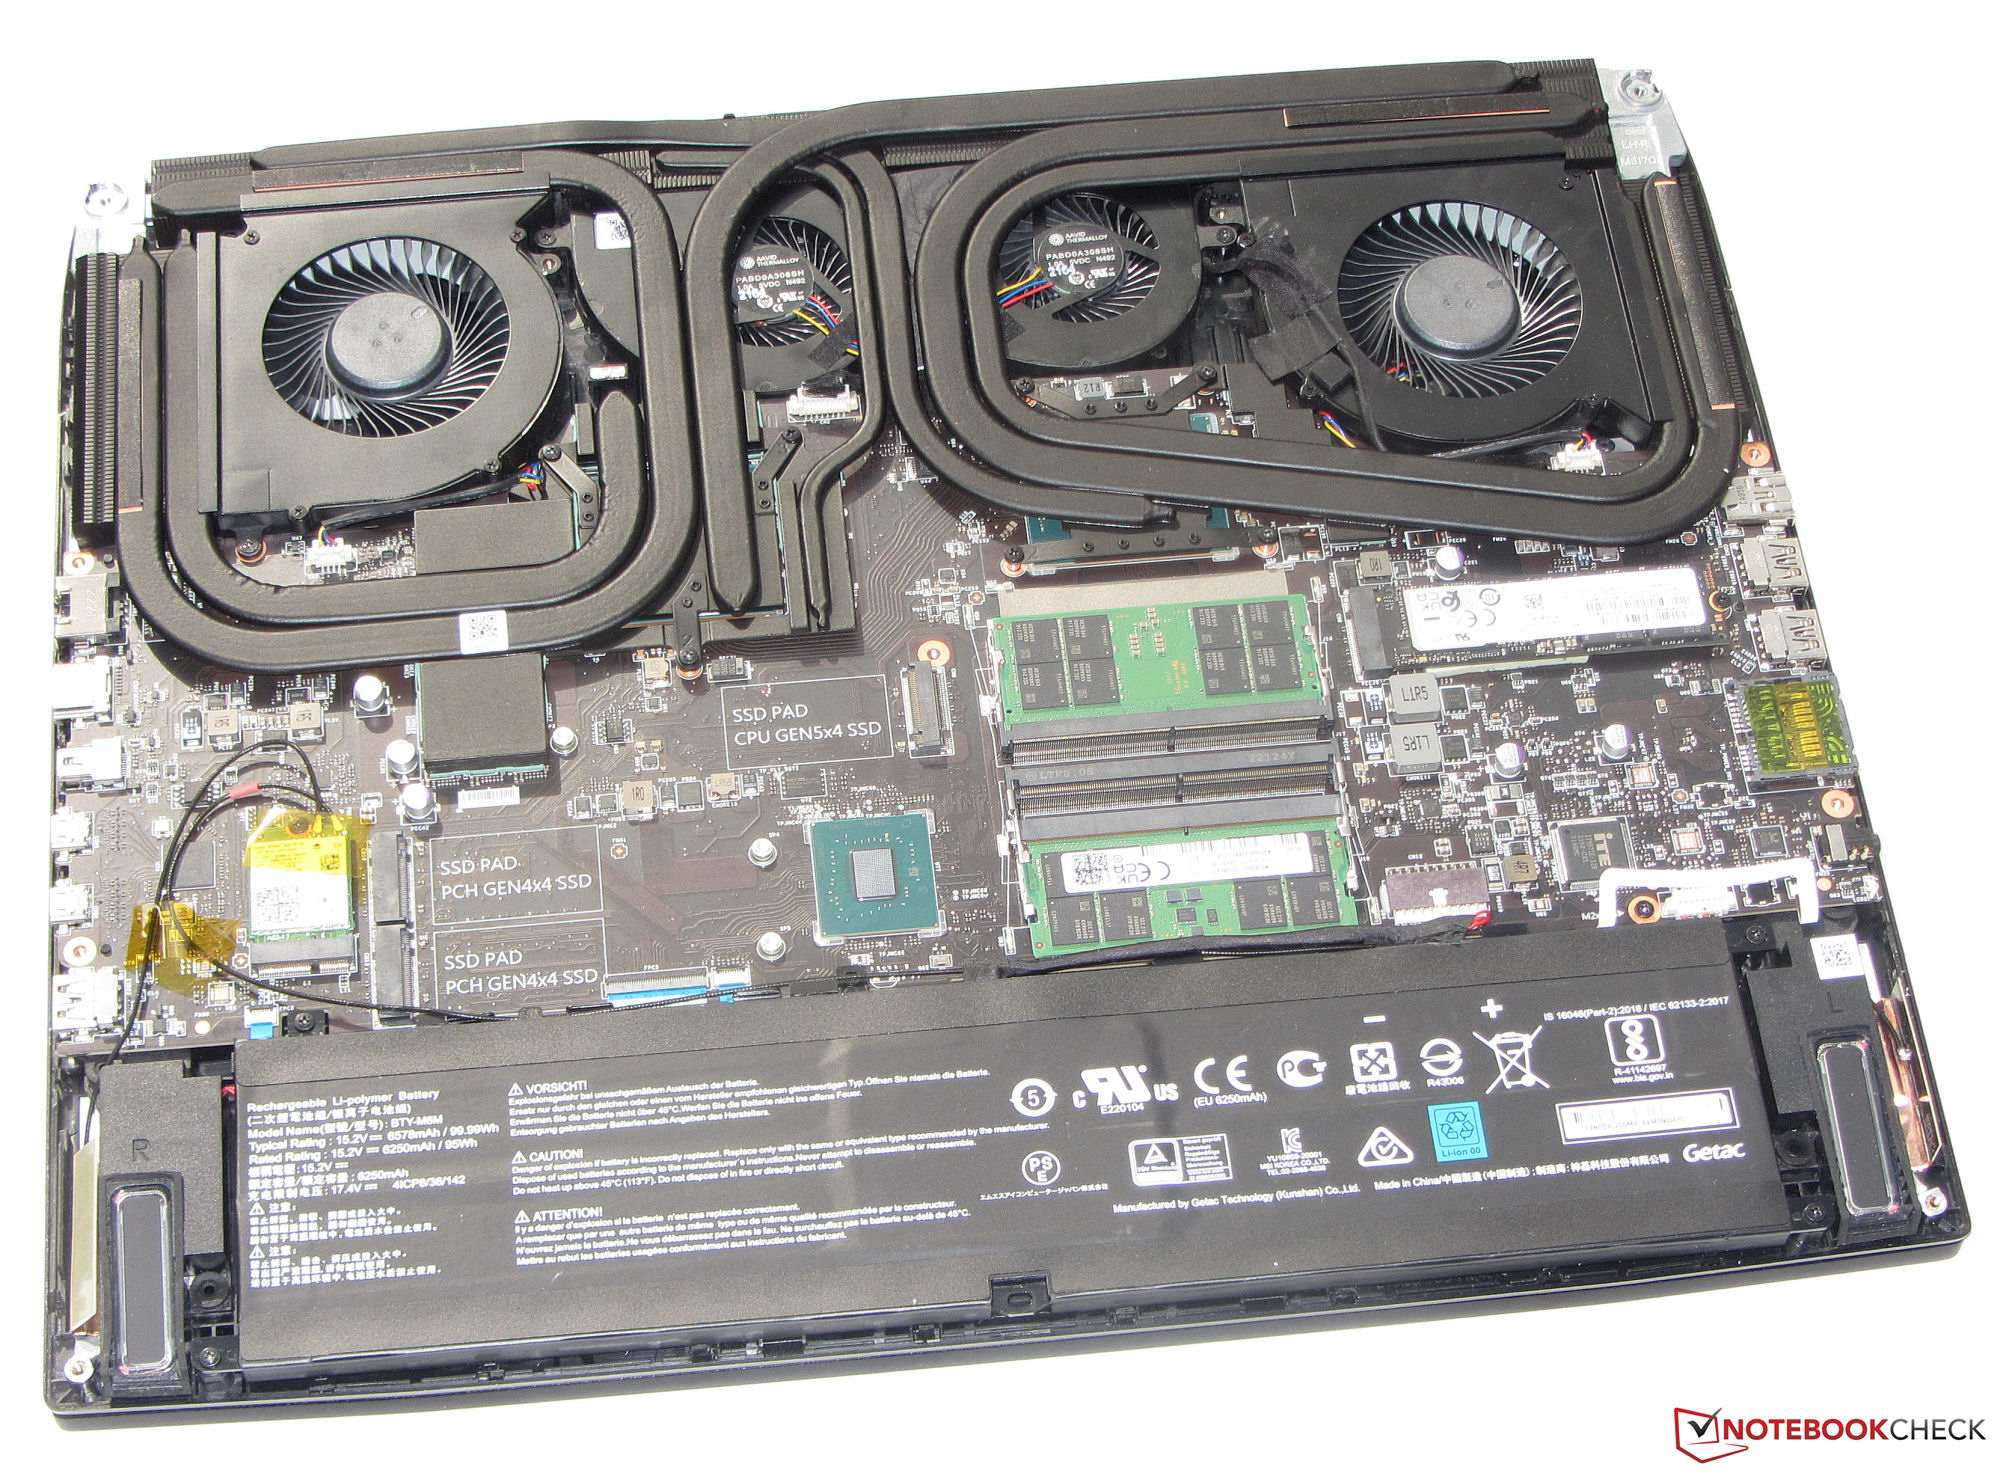
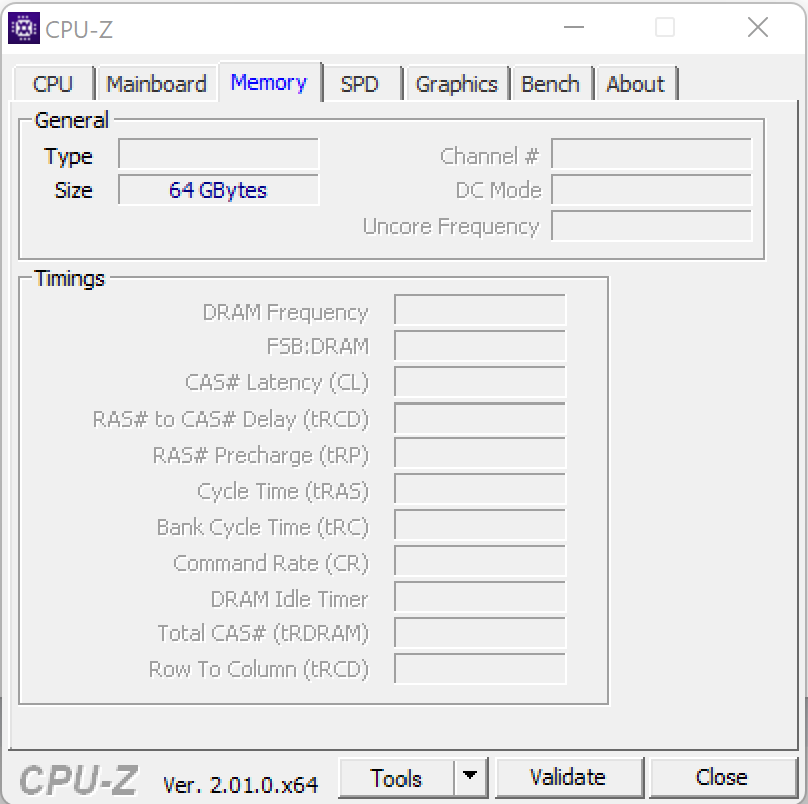
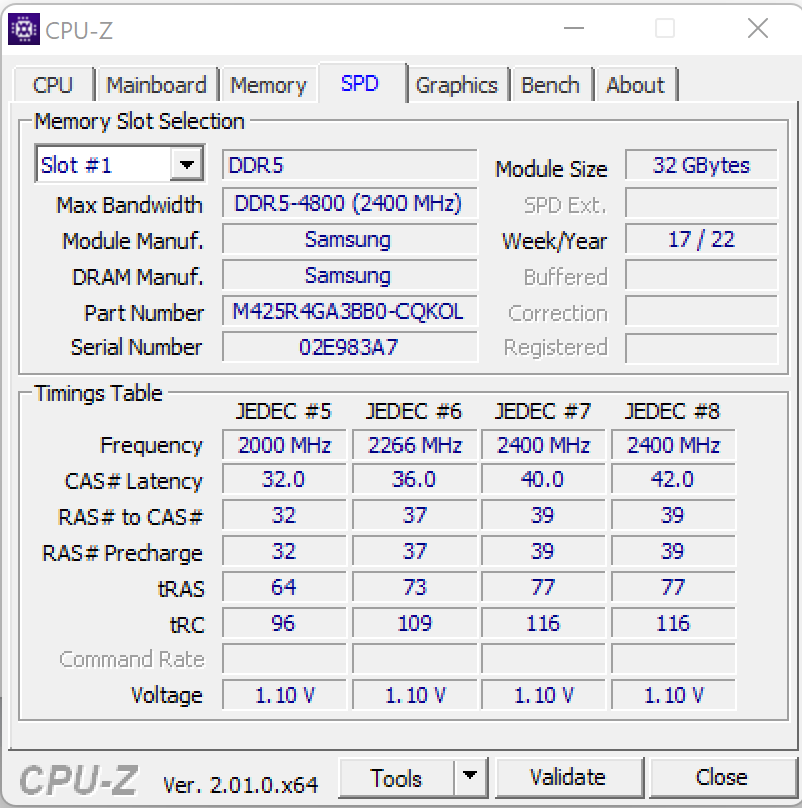
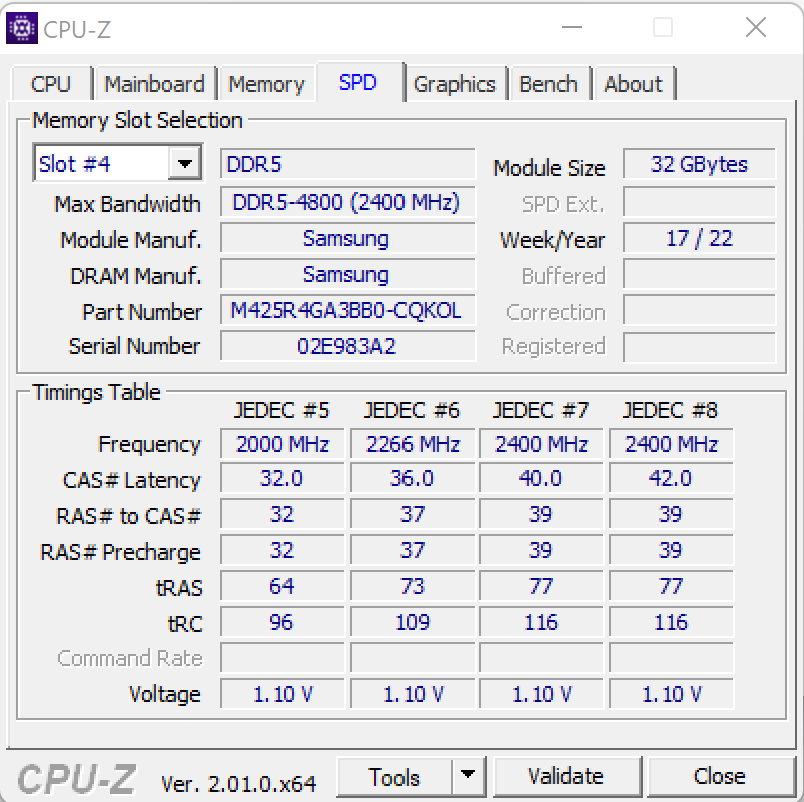
Le GT77 n'est pas dépourvu de puissance de calcul, ce qui est évident dès que l'on regarde ses spécifications. L'ordinateur portable de 17 pouces peut gérer les jeux, le rendu et bien d'autres choses encore avec facilité. Les taux de transfert de la RAM sont conformes au niveau de performance habituel de la mémoire DDR4-4800. Le système a également obtenu de bons résultats dans PCMark.
CrossMark: Overall | Productivity | Creativity | Responsiveness
| PCMark 10 / Score | |
| Moyenne de la classe Gaming (5828 - 12414, n=93, 2 dernières années) | |
| MSI Titan GT77 12UHS (dGPU, Extreme Leistung) | |
| MSI Titan GT77 12UHS | |
| Alienware x17 R2 P48E | |
| Moyenne Intel Core i9-12900HX, NVIDIA GeForce RTX 3080 Ti Laptop GPU (6812 - 8636, n=6) | |
| Schenker XMG Ultra 17 Rocket Lake | |
| Razer Blade 17 Early 2022 | |
| MSI Titan GT77 12UHS 4k | |
| PCMark 10 / Essentials | |
| Alienware x17 R2 P48E | |
| MSI Titan GT77 12UHS (dGPU, Extreme Leistung) | |
| MSI Titan GT77 12UHS | |
| Schenker XMG Ultra 17 Rocket Lake | |
| Moyenne de la classe Gaming (8810 - 11935, n=97, 2 dernières années) | |
| Moyenne Intel Core i9-12900HX, NVIDIA GeForce RTX 3080 Ti Laptop GPU (9598 - 11192, n=6) | |
| Razer Blade 17 Early 2022 | |
| MSI Titan GT77 12UHS 4k | |
| PCMark 10 / Productivity | |
| Moyenne de la classe Gaming (6845 - 25323, n=95, 2 dernières années) | |
| MSI Titan GT77 12UHS (dGPU, Extreme Leistung) | |
| Moyenne Intel Core i9-12900HX, NVIDIA GeForce RTX 3080 Ti Laptop GPU (9365 - 10932, n=6) | |
| MSI Titan GT77 12UHS | |
| Alienware x17 R2 P48E | |
| Schenker XMG Ultra 17 Rocket Lake | |
| MSI Titan GT77 12UHS 4k | |
| Razer Blade 17 Early 2022 | |
| PCMark 10 / Digital Content Creation | |
| Moyenne de la classe Gaming (7602 - 19954, n=95, 2 dernières années) | |
| MSI Titan GT77 12UHS (dGPU, Extreme Leistung) | |
| MSI Titan GT77 12UHS | |
| Alienware x17 R2 P48E | |
| Moyenne Intel Core i9-12900HX, NVIDIA GeForce RTX 3080 Ti Laptop GPU (9543 - 14291, n=6) | |
| Schenker XMG Ultra 17 Rocket Lake | |
| Razer Blade 17 Early 2022 | |
| MSI Titan GT77 12UHS 4k | |
| CrossMark / Overall | |
| MSI Titan GT77 12UHS 4k | |
| Moyenne Intel Core i9-12900HX, NVIDIA GeForce RTX 3080 Ti Laptop GPU (2108 - 2170, n=5) | |
| MSI Titan GT77 12UHS | |
| Moyenne de la classe Gaming (1366 - 2409, n=94, 2 dernières années) | |
| Alienware x17 R2 P48E | |
| Razer Blade 17 Early 2022 | |
| CrossMark / Productivity | |
| MSI Titan GT77 12UHS 4k | |
| Moyenne Intel Core i9-12900HX, NVIDIA GeForce RTX 3080 Ti Laptop GPU (1978 - 2047, n=5) | |
| MSI Titan GT77 12UHS | |
| Moyenne de la classe Gaming (1386 - 2254, n=94, 2 dernières années) | |
| Alienware x17 R2 P48E | |
| Razer Blade 17 Early 2022 | |
| CrossMark / Creativity | |
| MSI Titan GT77 12UHS 4k | |
| Moyenne Intel Core i9-12900HX, NVIDIA GeForce RTX 3080 Ti Laptop GPU (2288 - 2366, n=5) | |
| MSI Titan GT77 12UHS | |
| Moyenne de la classe Gaming (1343 - 2786, n=94, 2 dernières années) | |
| Alienware x17 R2 P48E | |
| Razer Blade 17 Early 2022 | |
| CrossMark / Responsiveness | |
| MSI Titan GT77 12UHS 4k | |
| Moyenne Intel Core i9-12900HX, NVIDIA GeForce RTX 3080 Ti Laptop GPU (1991 - 2090, n=5) | |
| MSI Titan GT77 12UHS | |
| Moyenne de la classe Gaming (1226 - 2334, n=94, 2 dernières années) | |
| Alienware x17 R2 P48E | |
| Razer Blade 17 Early 2022 | |
| PCMark 8 Home Score Accelerated v2 | 4166 points | |
| PCMark 8 Creative Score Accelerated v2 | 6677 points | |
| PCMark 8 Work Score Accelerated v2 | 5165 points | |
| PCMark 10 Score | 6812 points | |
Aide | ||
| AIDA64 / Memory Copy | |
| Moyenne de la classe Gaming (21750 - 129946, n=105, 2 dernières années) | |
| Moyenne Intel Core i9-12900HX (62852 - 70863, n=7) | |
| MSI Titan GT77 12UHS | |
| MSI Titan GT77 12UHS 4k | |
| Razer Blade 17 Early 2022 | |
| Alienware x17 R2 P48E | |
| Schenker XMG Ultra 17 Rocket Lake | |
| AIDA64 / Memory Read | |
| Moyenne de la classe Gaming (22956 - 118858, n=105, 2 dernières années) | |
| Moyenne Intel Core i9-12900HX (62140 - 72930, n=7) | |
| MSI Titan GT77 12UHS 4k | |
| Razer Blade 17 Early 2022 | |
| MSI Titan GT77 12UHS | |
| Alienware x17 R2 P48E | |
| Schenker XMG Ultra 17 Rocket Lake | |
| AIDA64 / Memory Write | |
| Moyenne de la classe Gaming (22297 - 135096, n=105, 2 dernières années) | |
| Moyenne Intel Core i9-12900HX (60001 - 68782, n=7) | |
| MSI Titan GT77 12UHS 4k | |
| MSI Titan GT77 12UHS | |
| Razer Blade 17 Early 2022 | |
| Alienware x17 R2 P48E | |
| Schenker XMG Ultra 17 Rocket Lake | |
| AIDA64 / Memory Latency | |
| Moyenne de la classe Gaming (75.3 - 259, n=105, 2 dernières années) | |
| Alienware x17 R2 P48E | |
| MSI Titan GT77 12UHS 4k | |
| MSI Titan GT77 12UHS | |
| Moyenne Intel Core i9-12900HX (83.9 - 93.4, n=7) | |
| Schenker XMG Ultra 17 Rocket Lake | |
* ... Moindre est la valeur, meilleures sont les performances
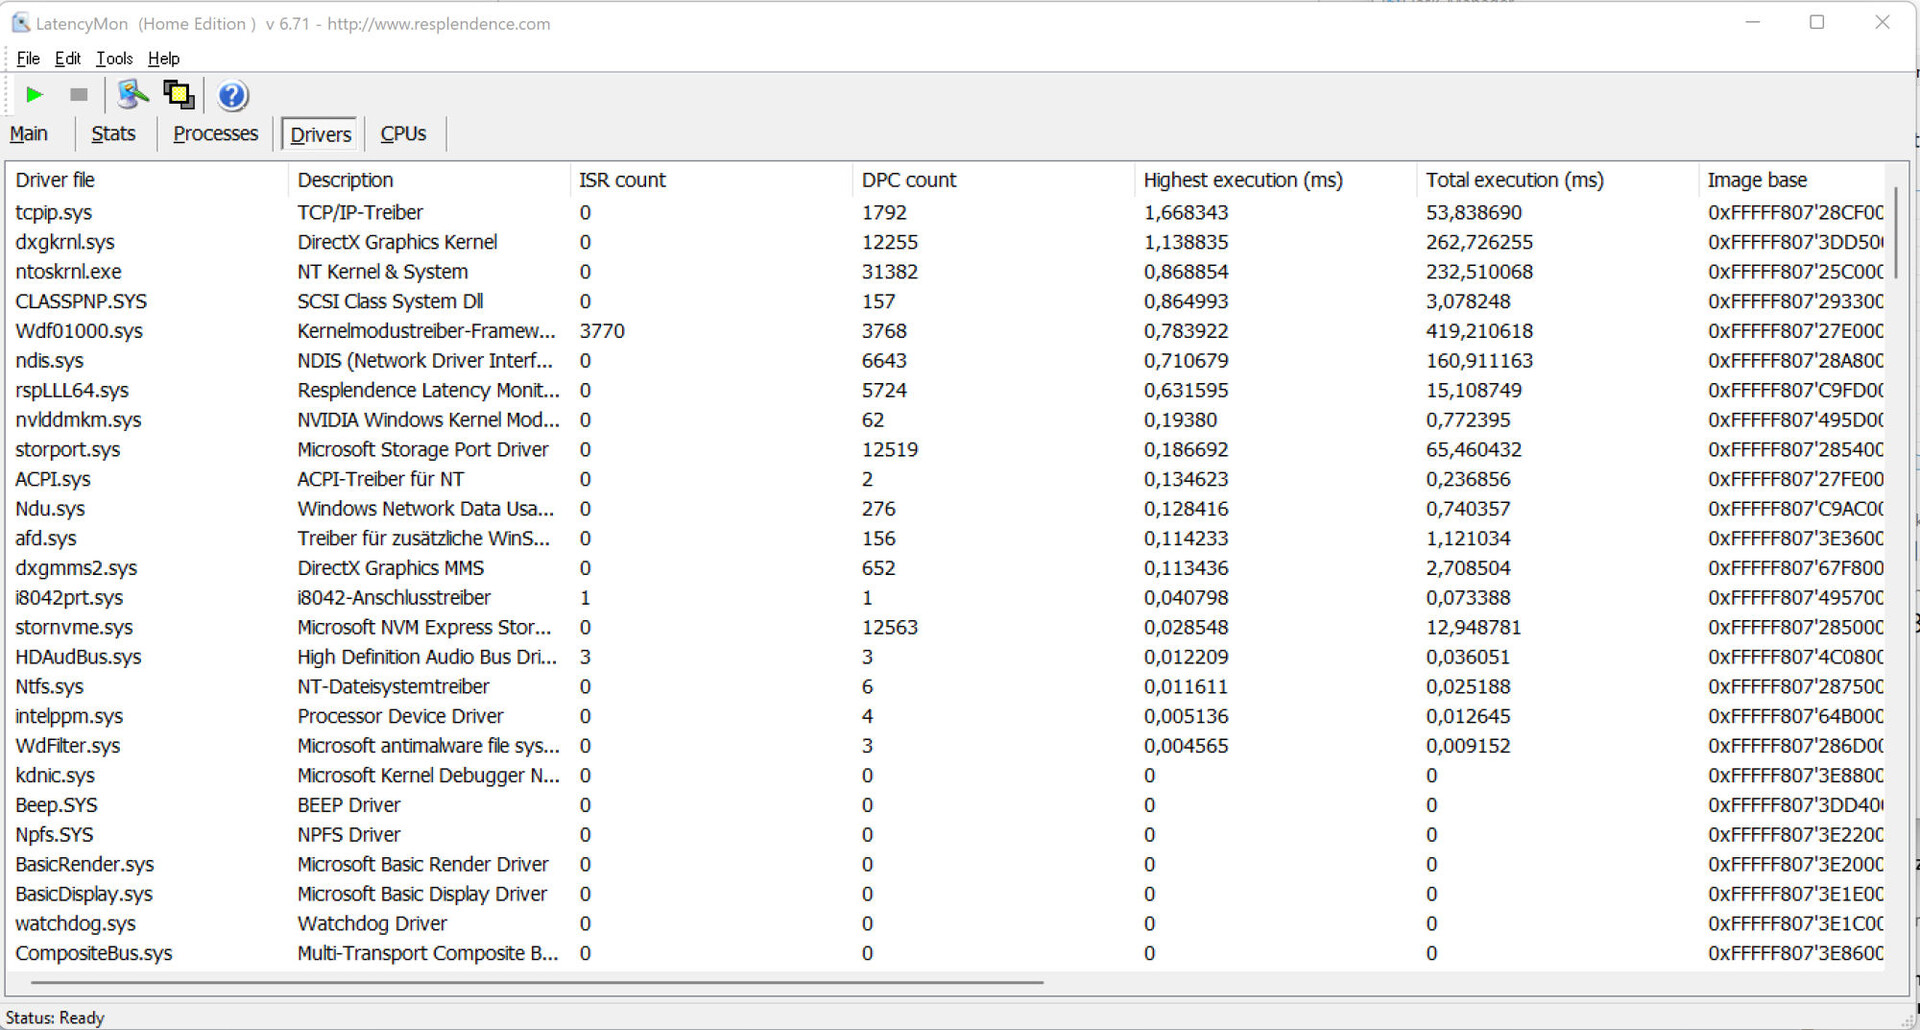
Latence DPC
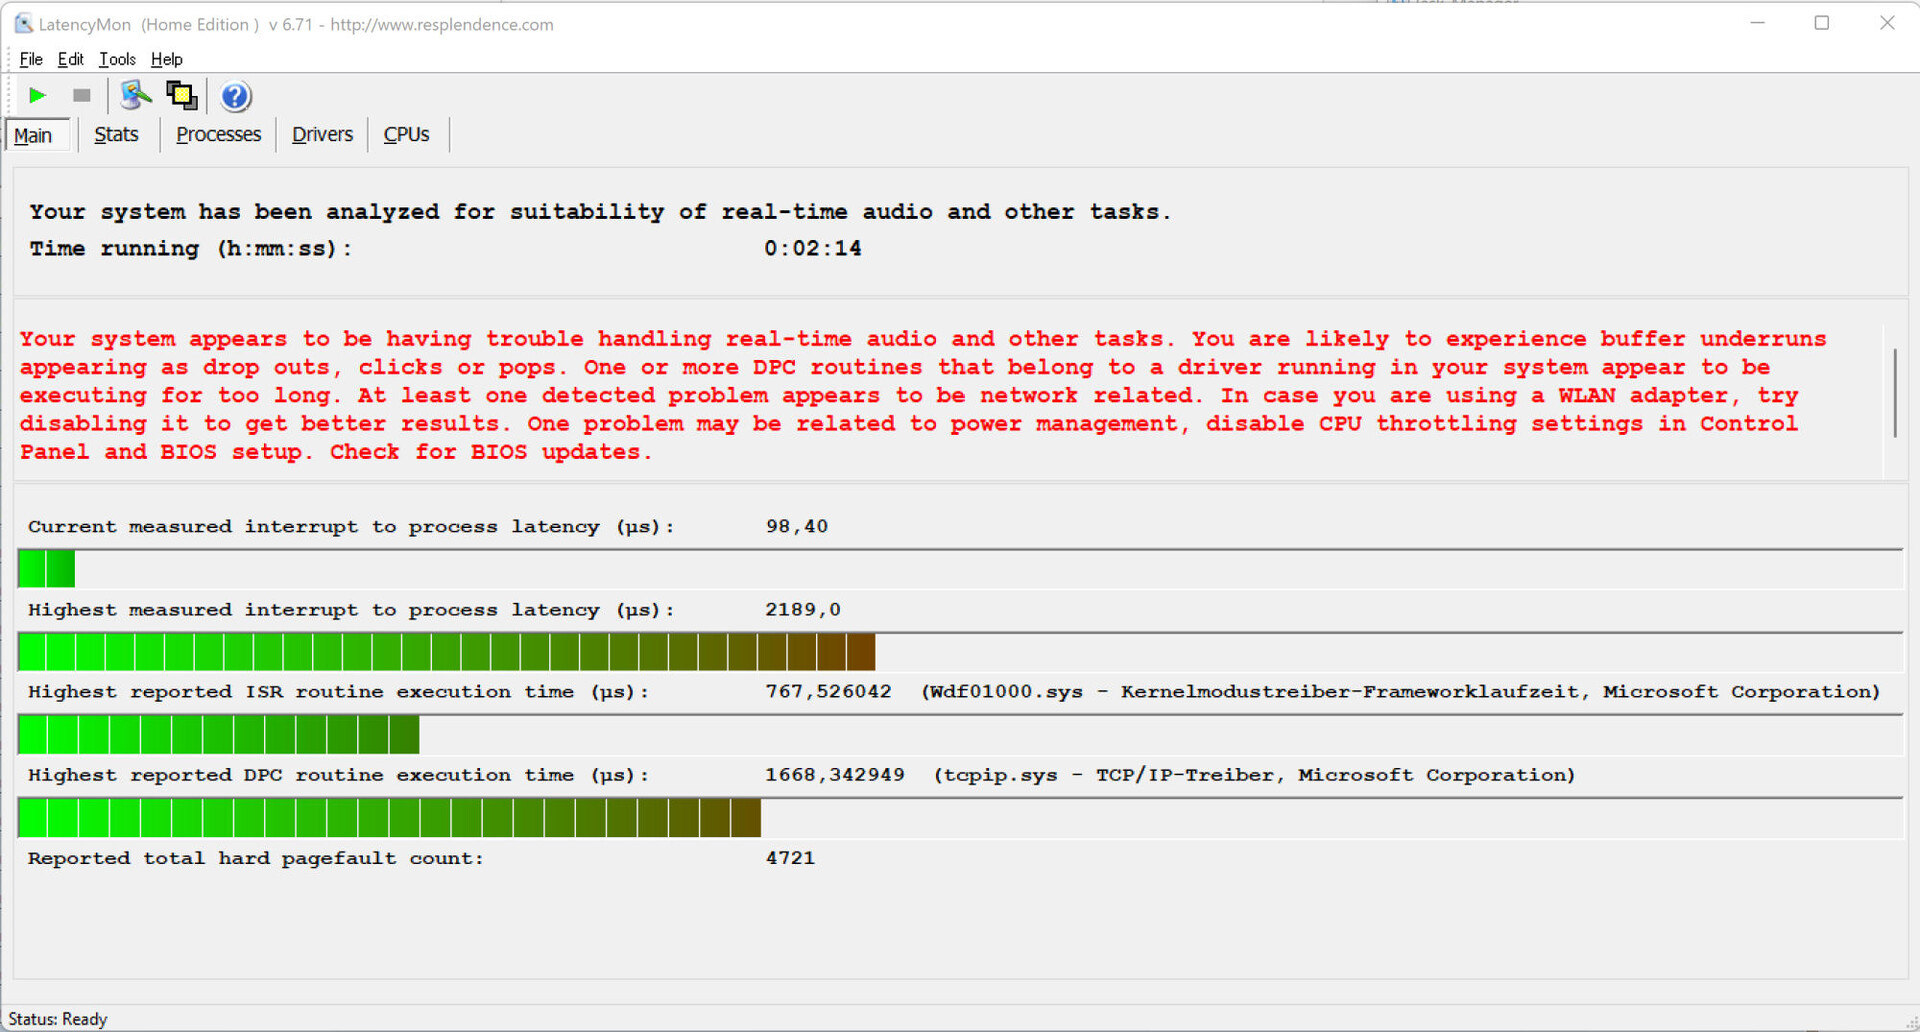
Notre test standardisé de contrôle de la latence (navigation sur Internet, lecture de vidéos 4K, charge élevée Prime95) a révélé quelques problèmes de latence du DPC. Le système ne semble pas être bien adapté au traitement vidéo et audio en temps réel. Les futures mises à jour logicielles pourraient améliorer, voire aggraver ce problème.
| DPC Latencies / LatencyMon - interrupt to process latency (max), Web, Youtube, Prime95 | |
| MSI Titan GT77 12UHS | |
| MSI Titan GT77 12UHS | |
| MSI Titan GT77 12UHS 4k | |
| Alienware x17 R2 P48E | |
| Schenker XMG Ultra 17 Rocket Lake | |
| Razer Blade 17 Early 2022 | |
* ... Moindre est la valeur, meilleures sont les performances
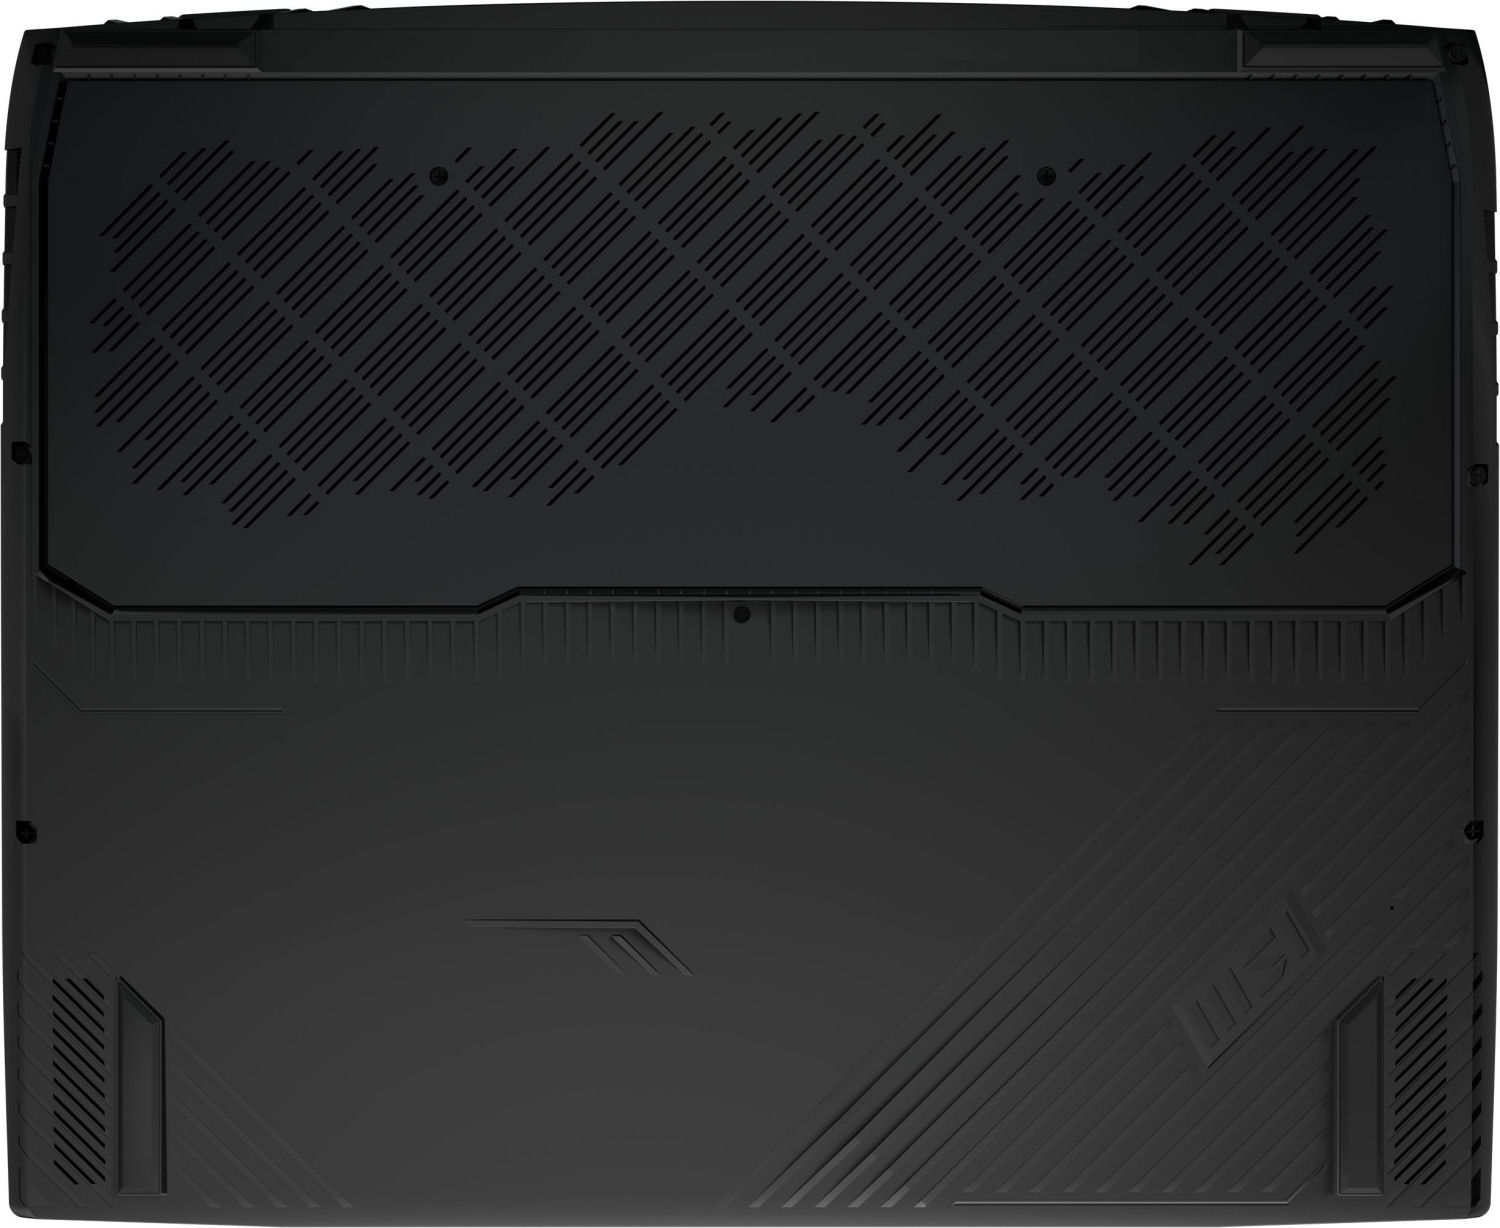
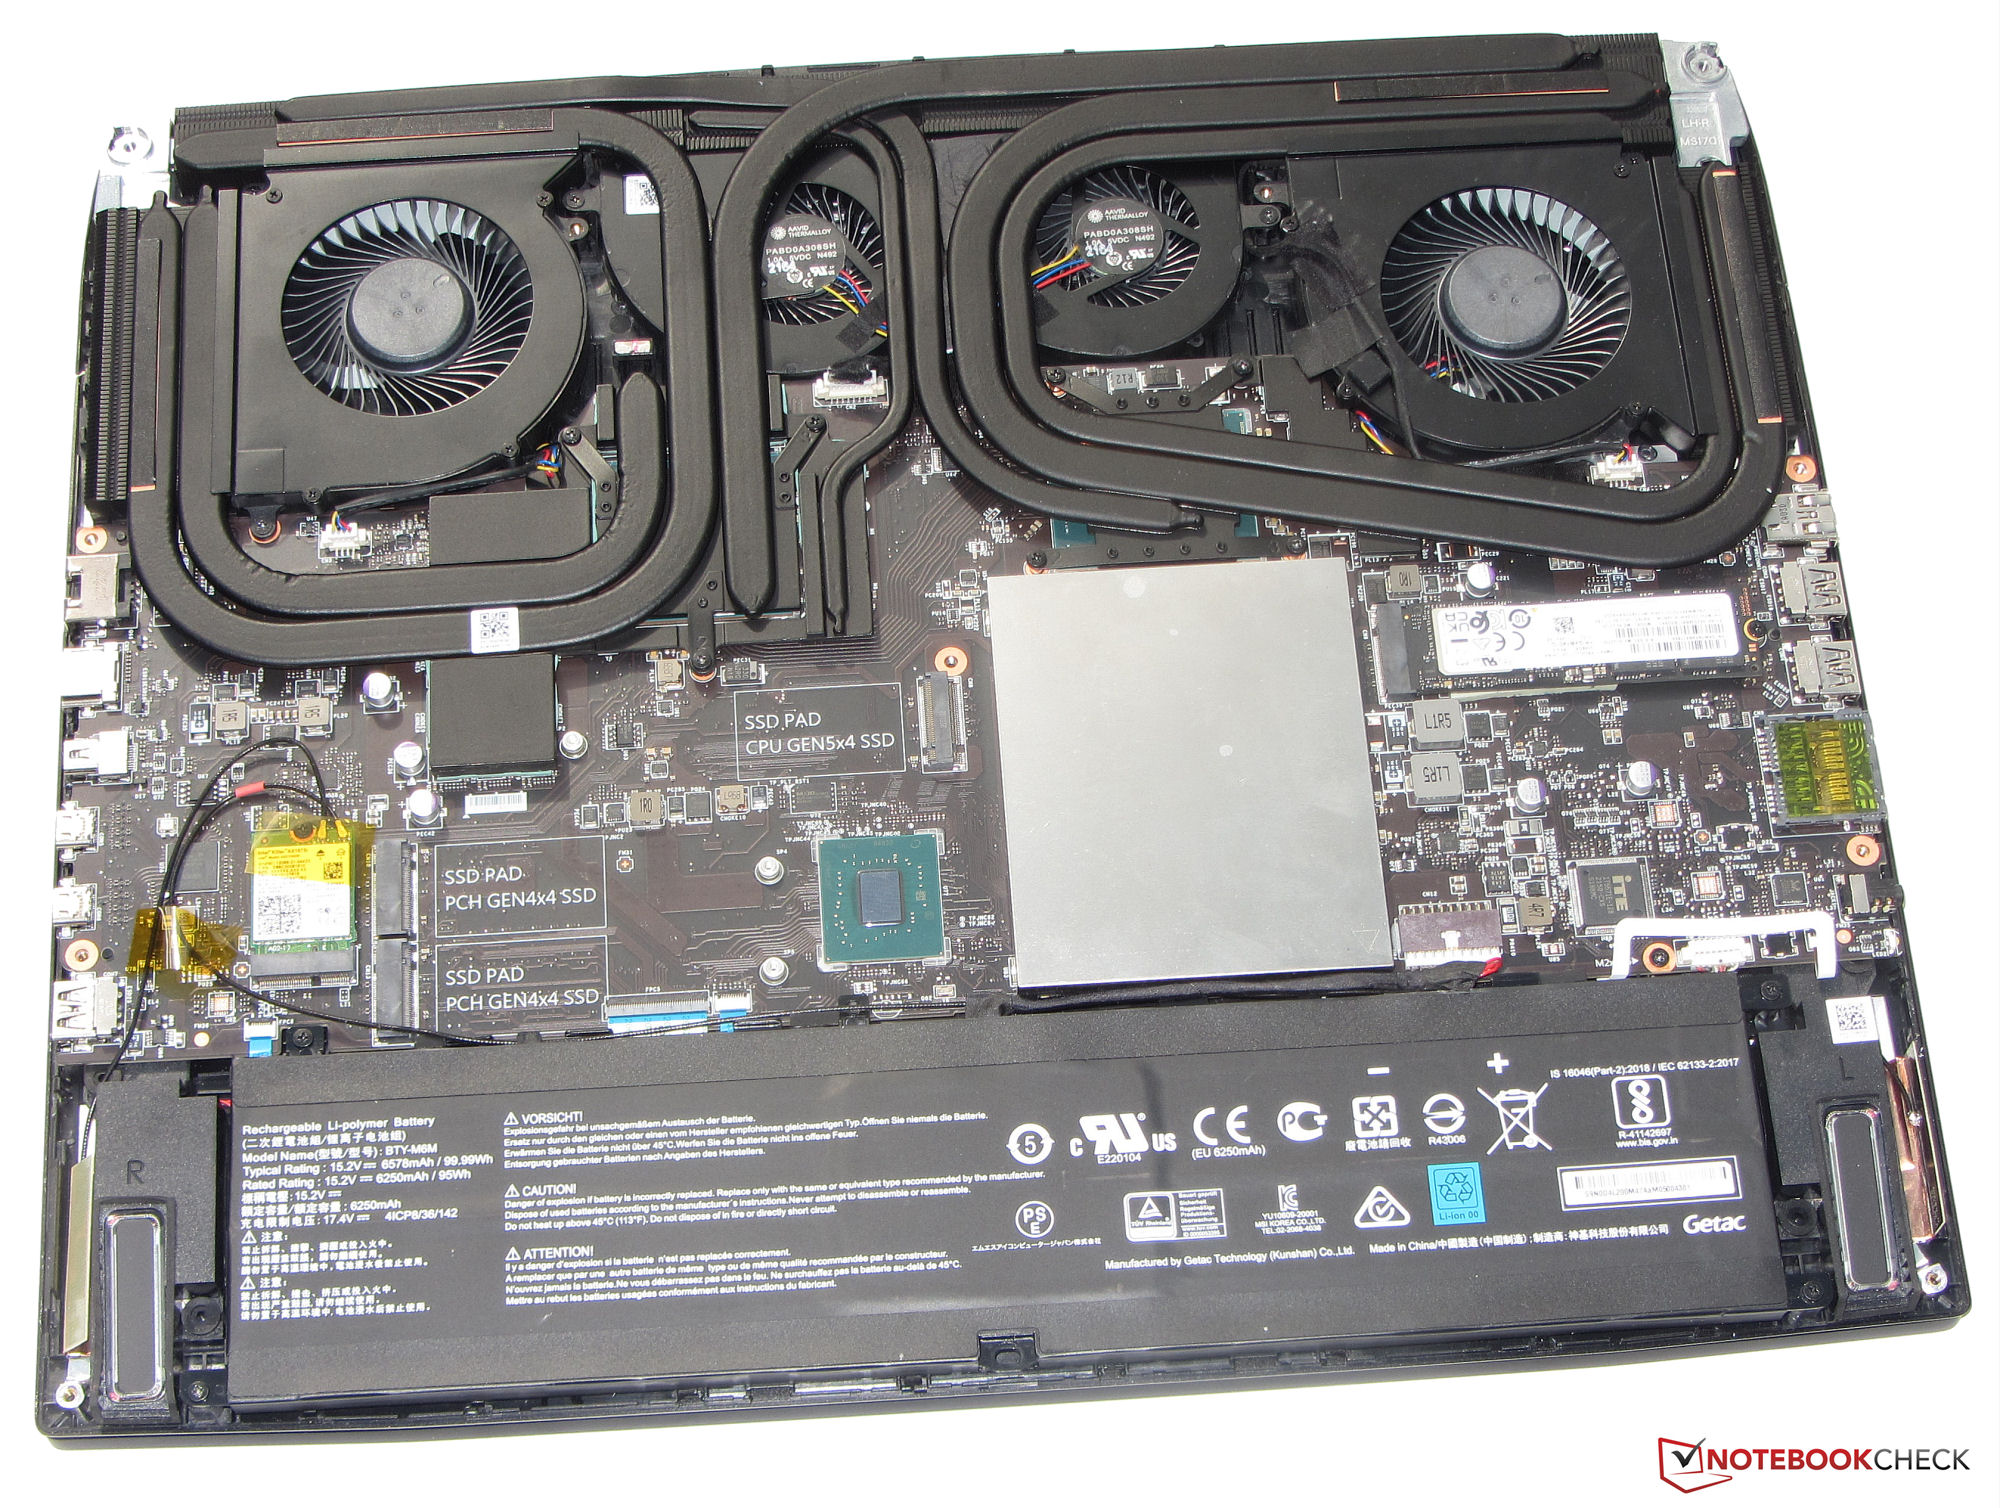
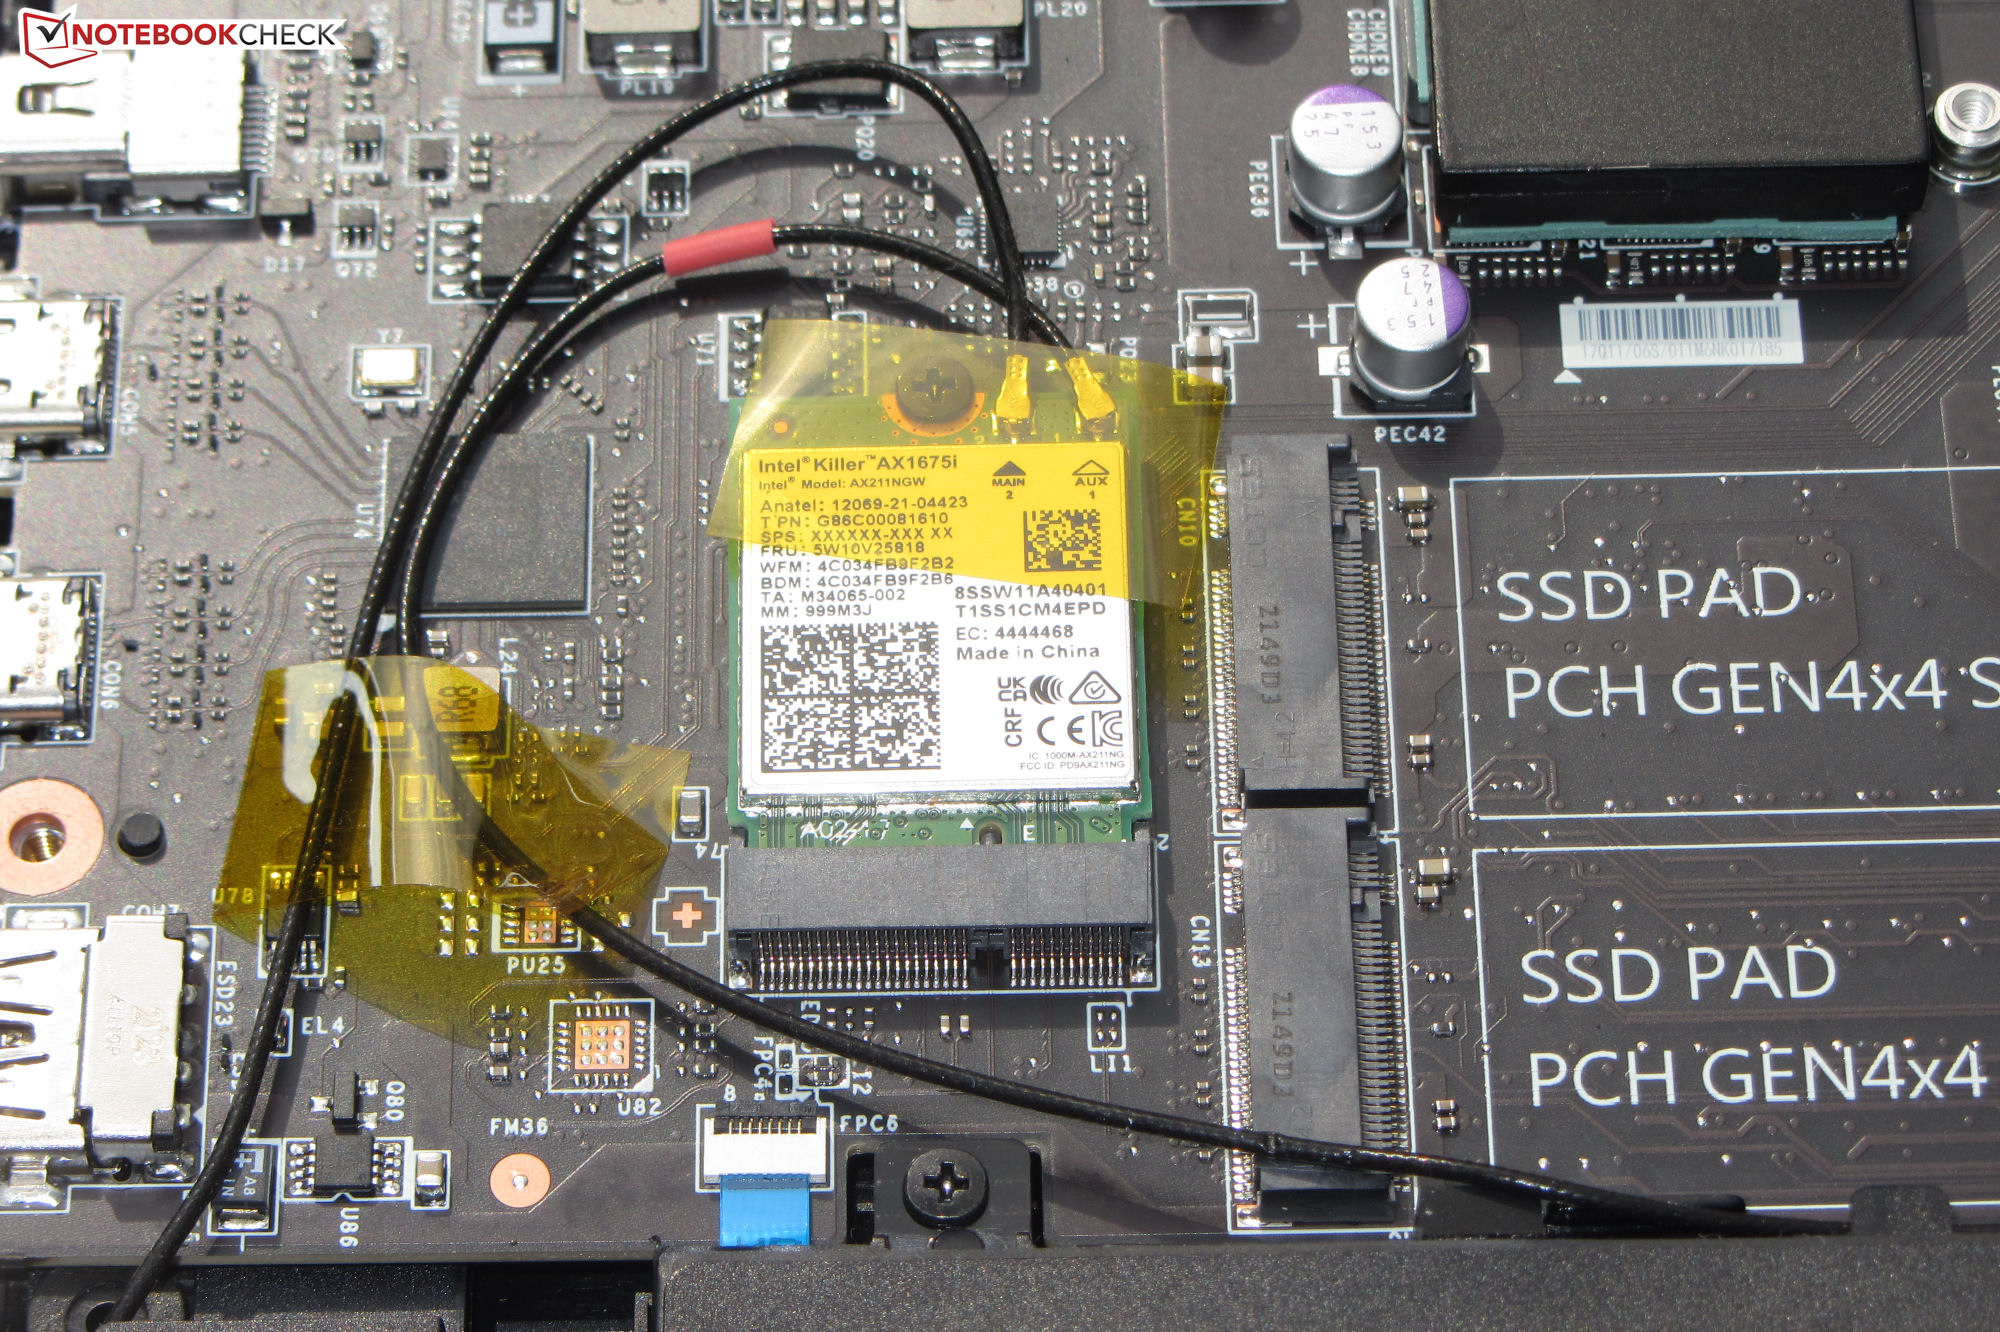
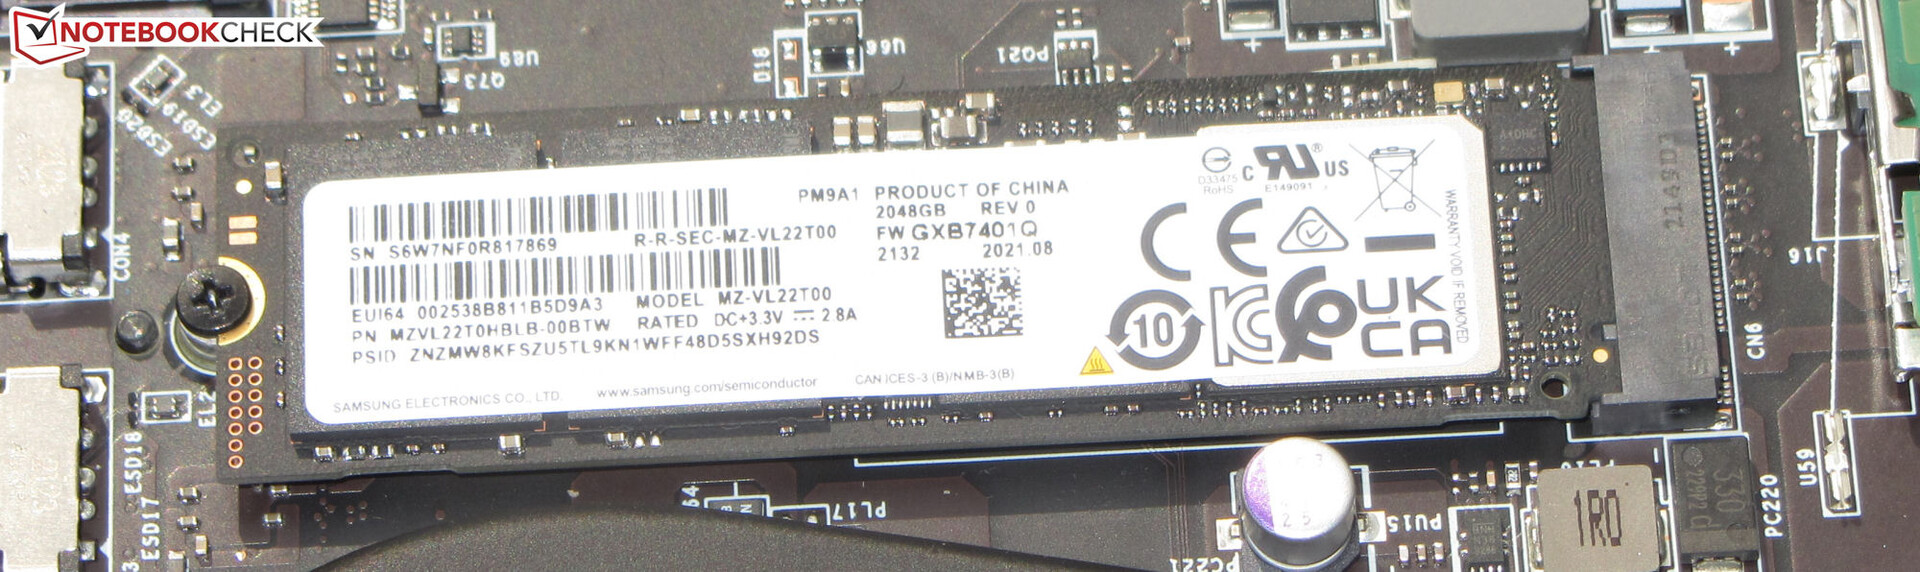
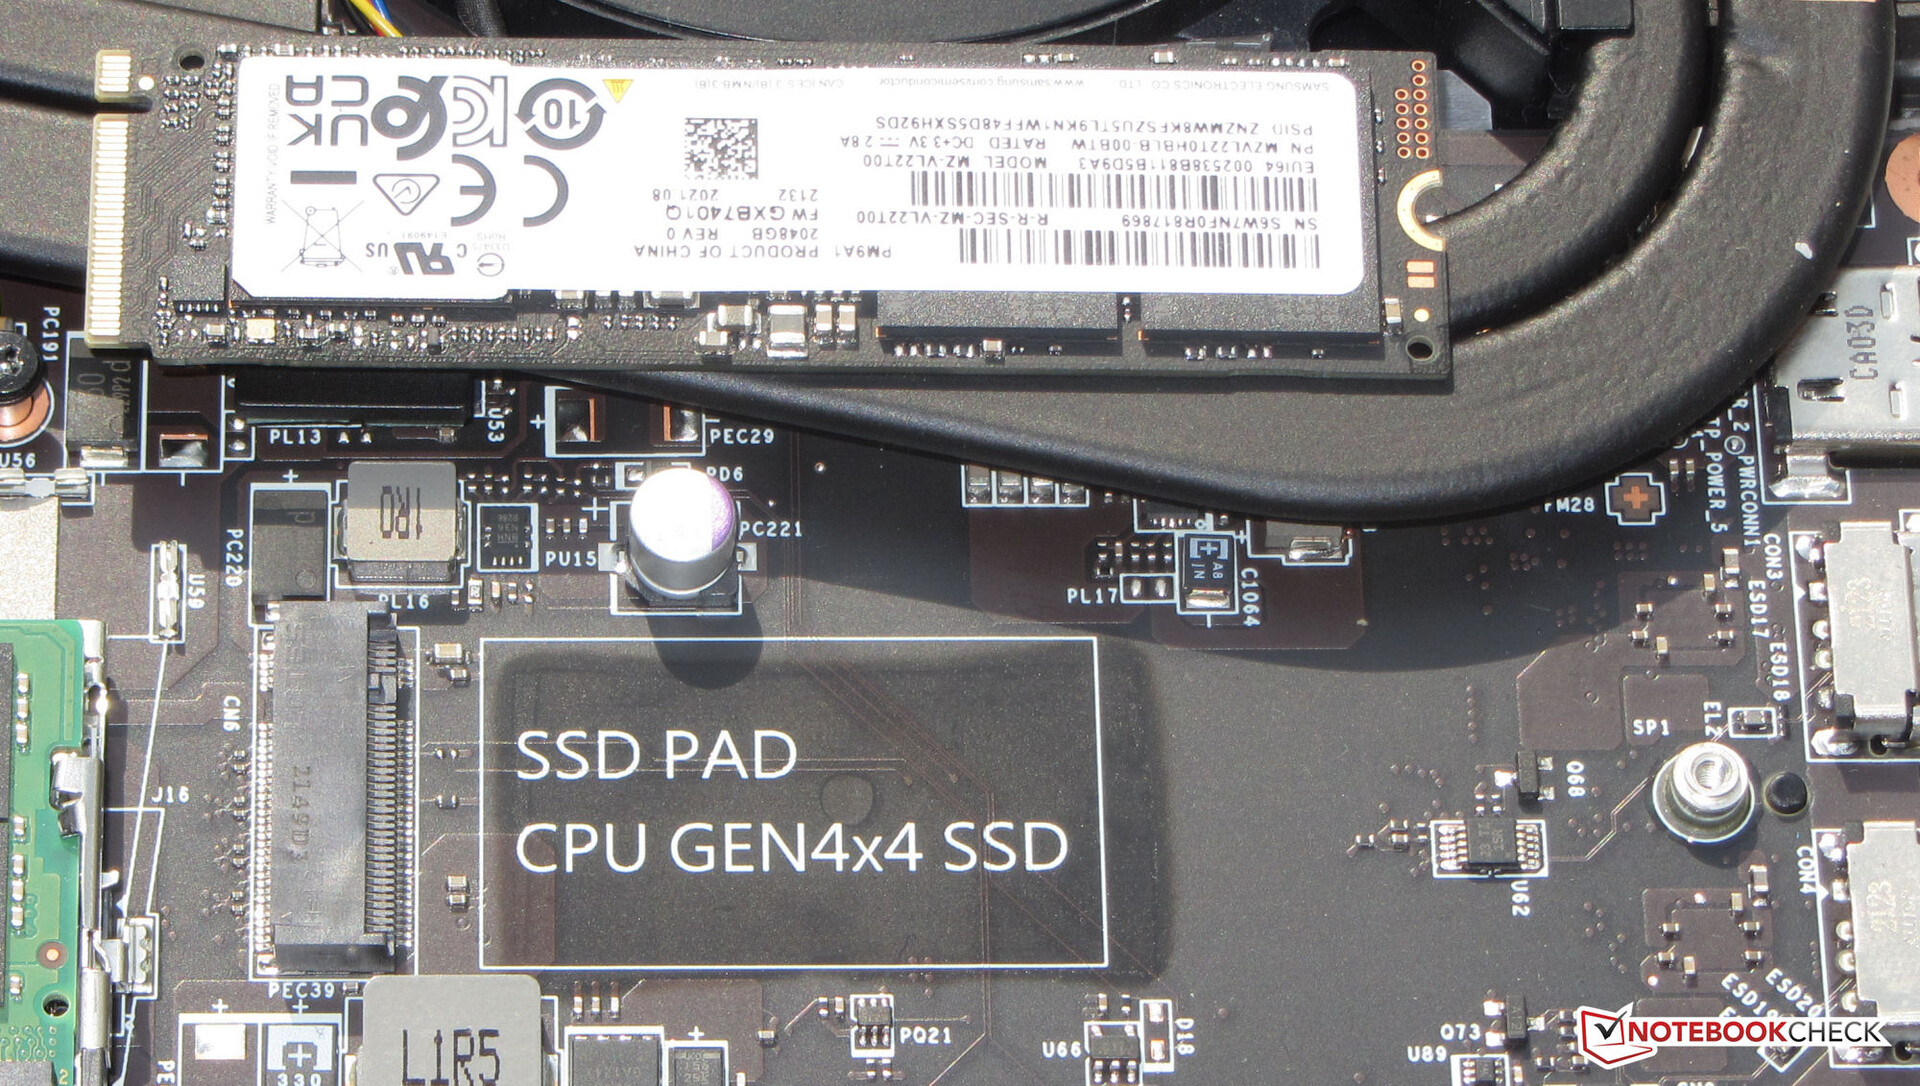
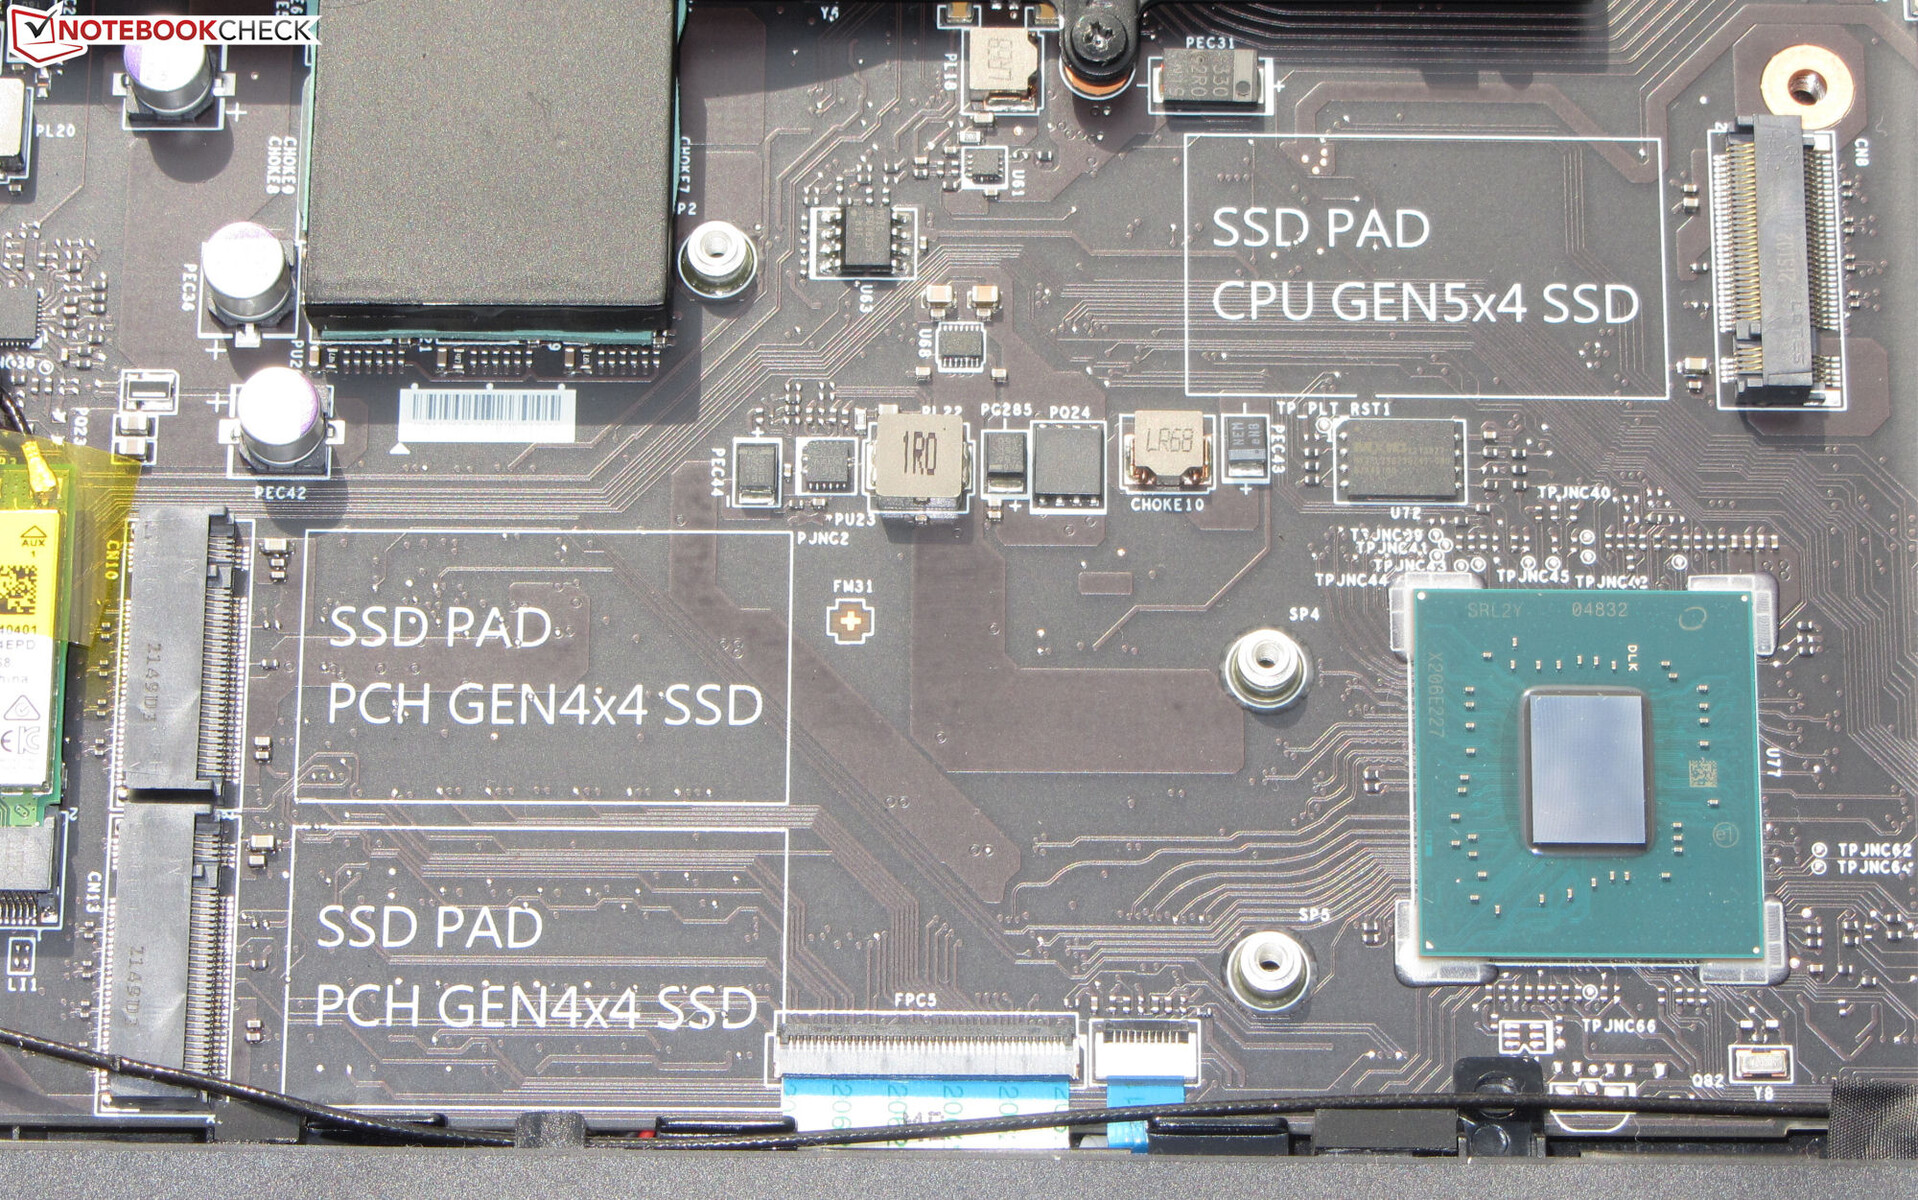
Mémoire de masse
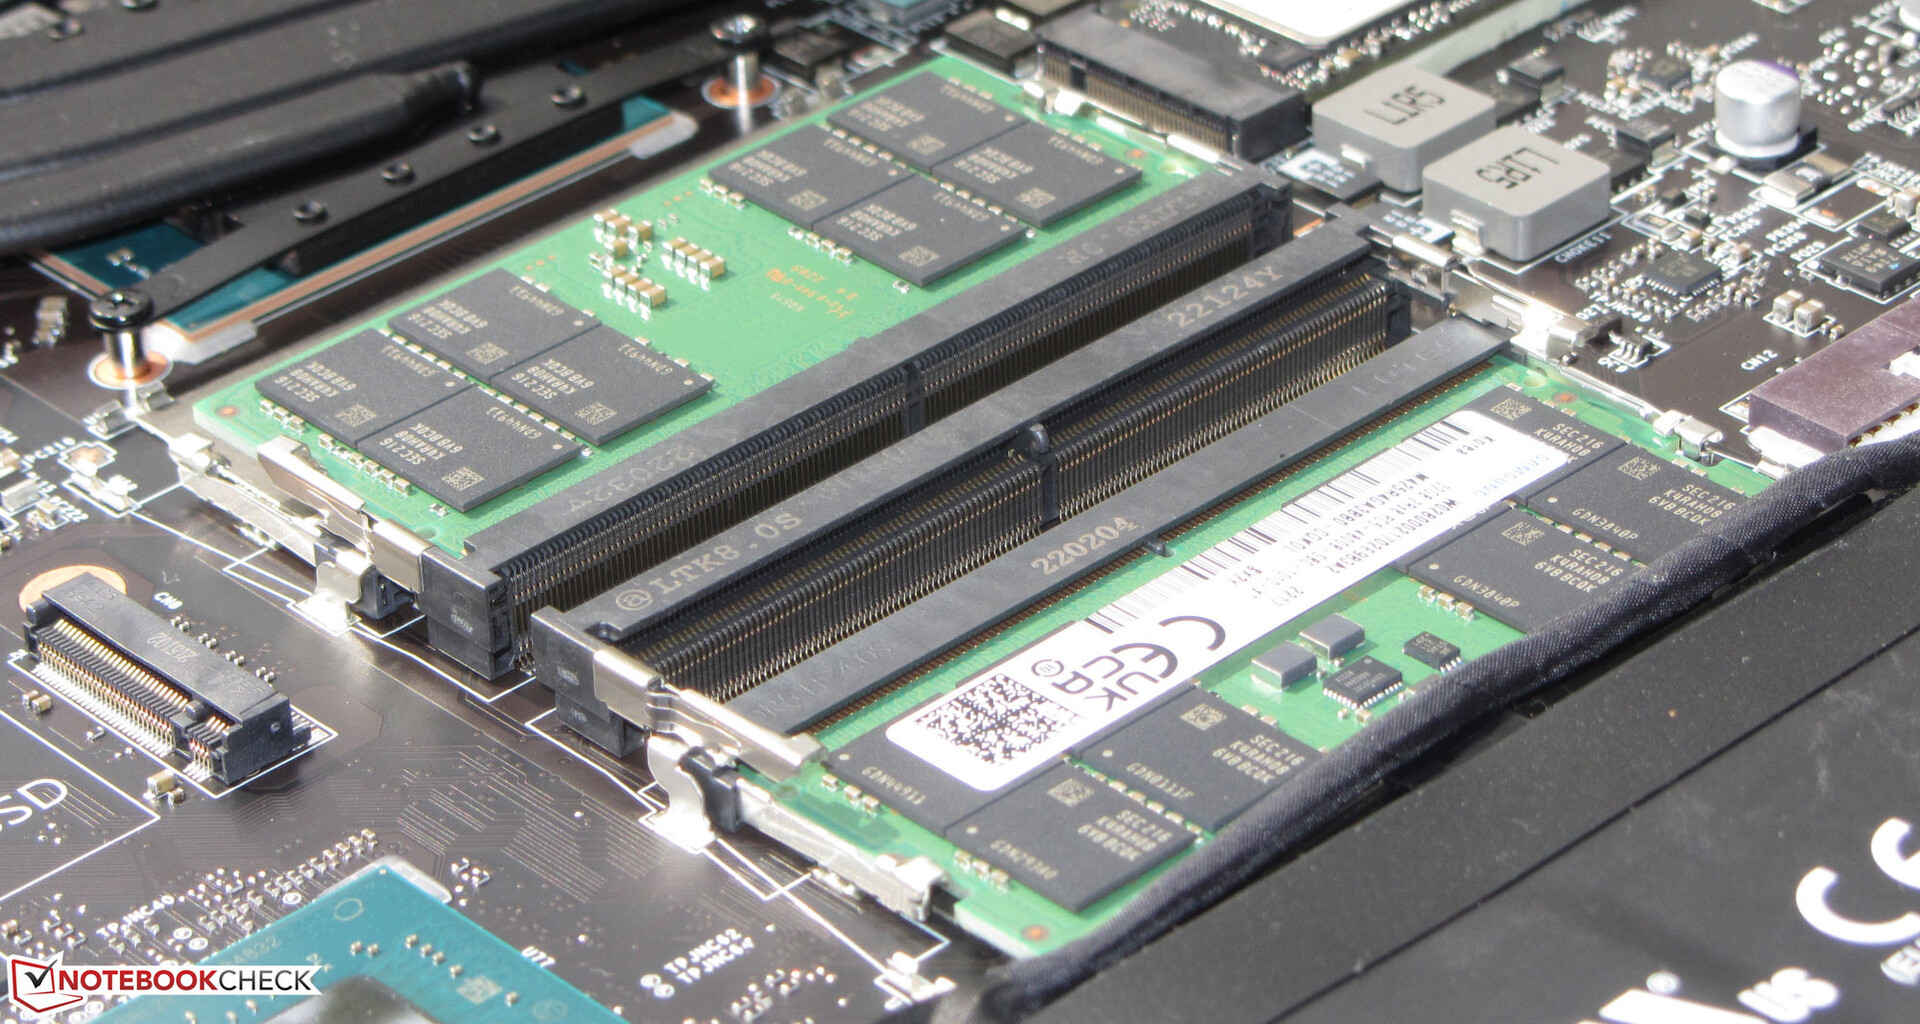
Le Titan peut accueillir jusqu'à quatre SSD M.2 2280 (3x PCIe 4, 1x PCIe 5). Le SSD Samsung de 2 To (PCIe 4) inclus est capable de fournir d'excellentes vitesses de transfert
Dans leModèle FHDle SSD contenant le système d'exploitation (également fabriqué par Samsung) souffre de baisses de performances dues à un étranglement thermique. Peut-être que les trois autres SSD installés dans l'ordinateur portable empêchent une circulation d'air optimale. Le SSD de notre unité de test actuelle ne présente aucune baisse de performance.

* ... Moindre est la valeur, meilleures sont les performances
Continuous read: DiskSpd Read Loop, Queue Depth 8
Carte graphique
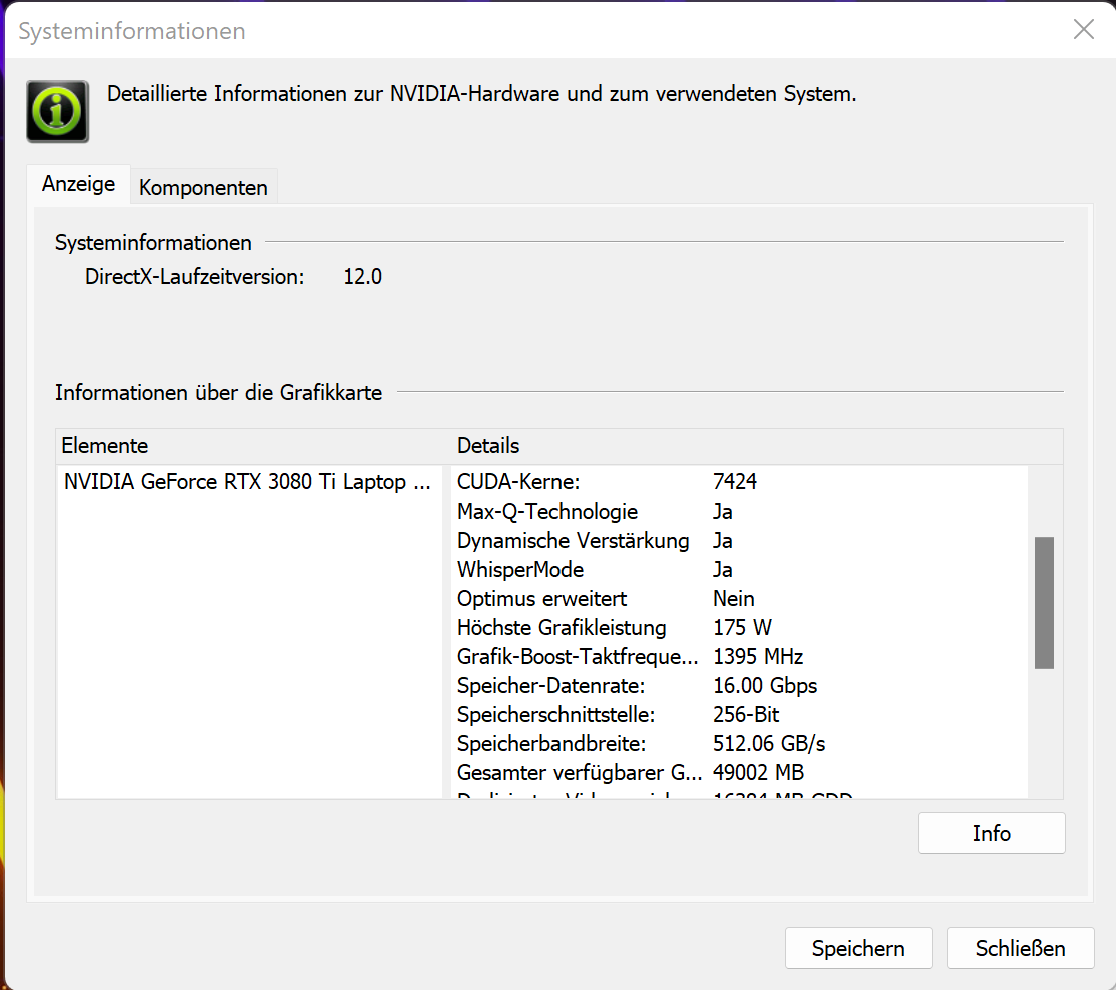
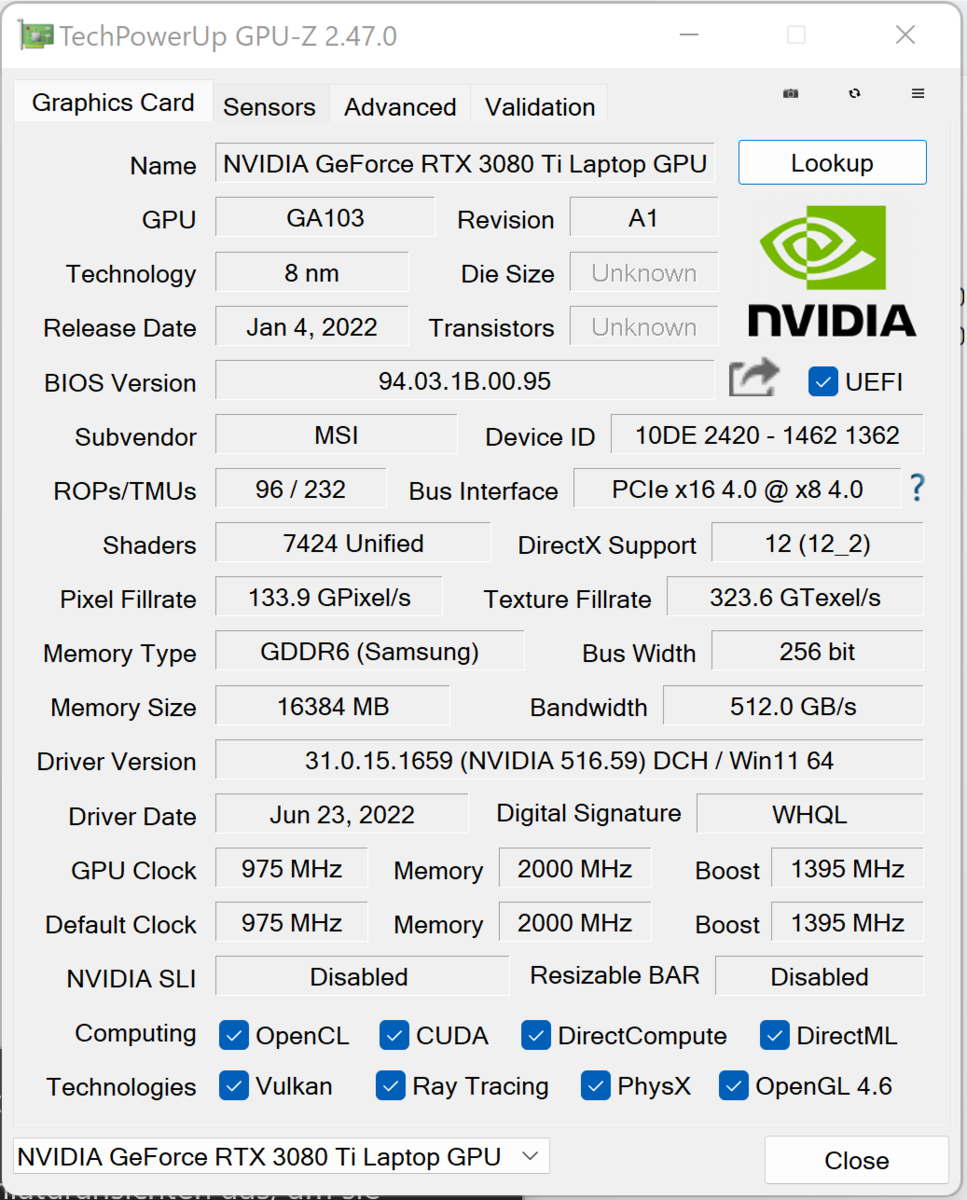
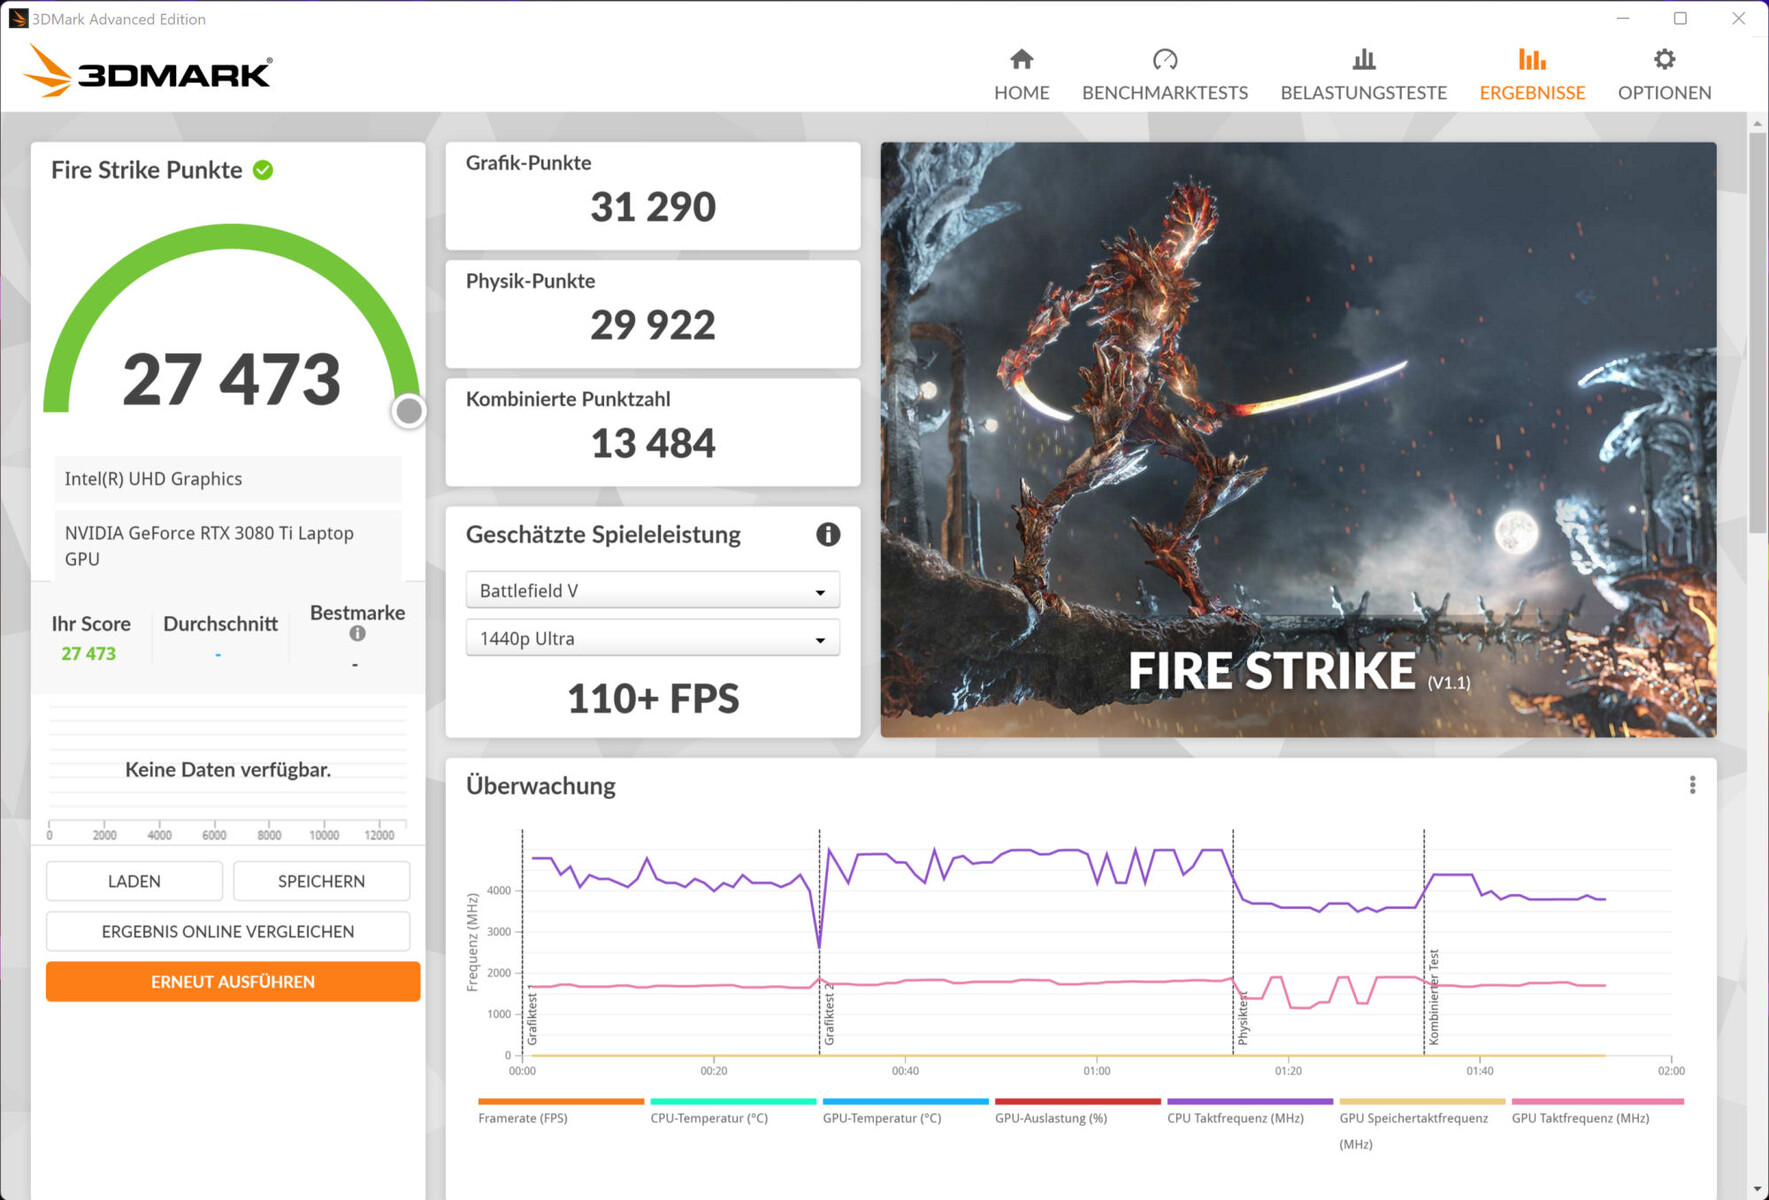
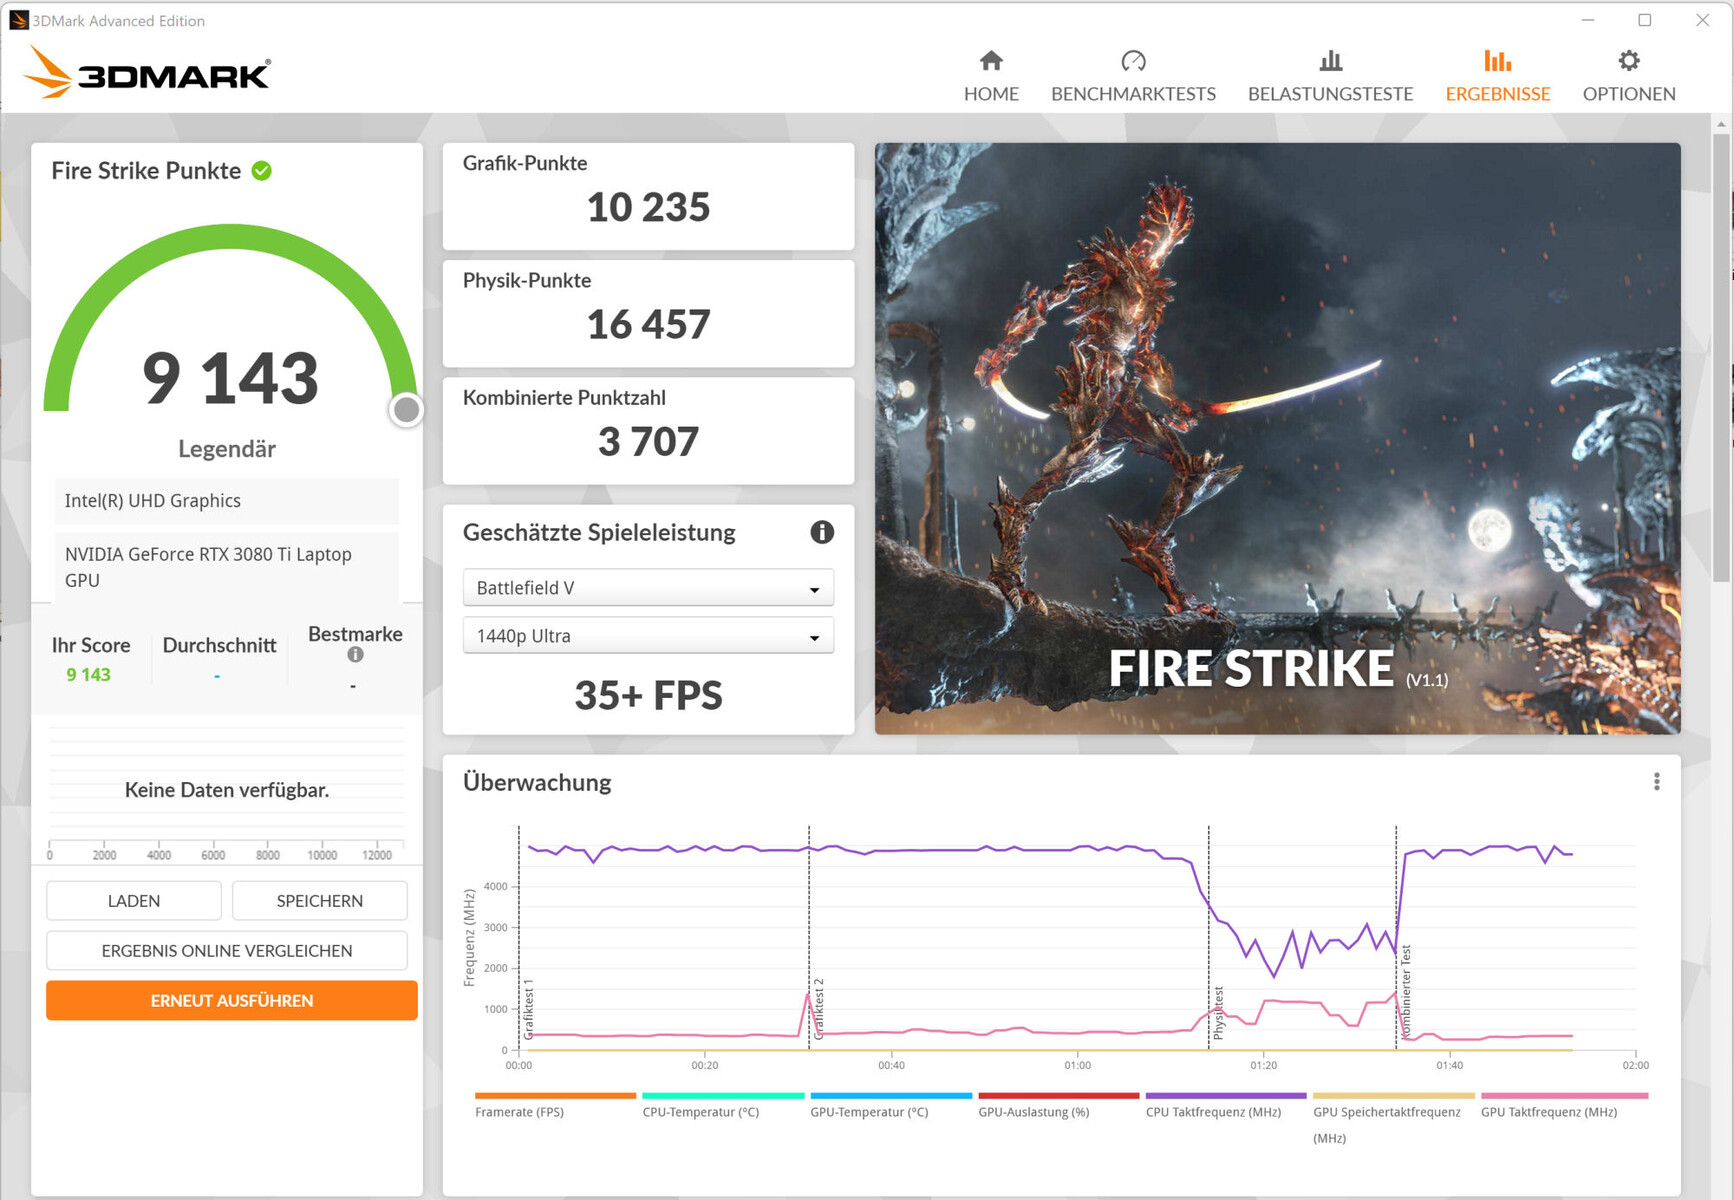
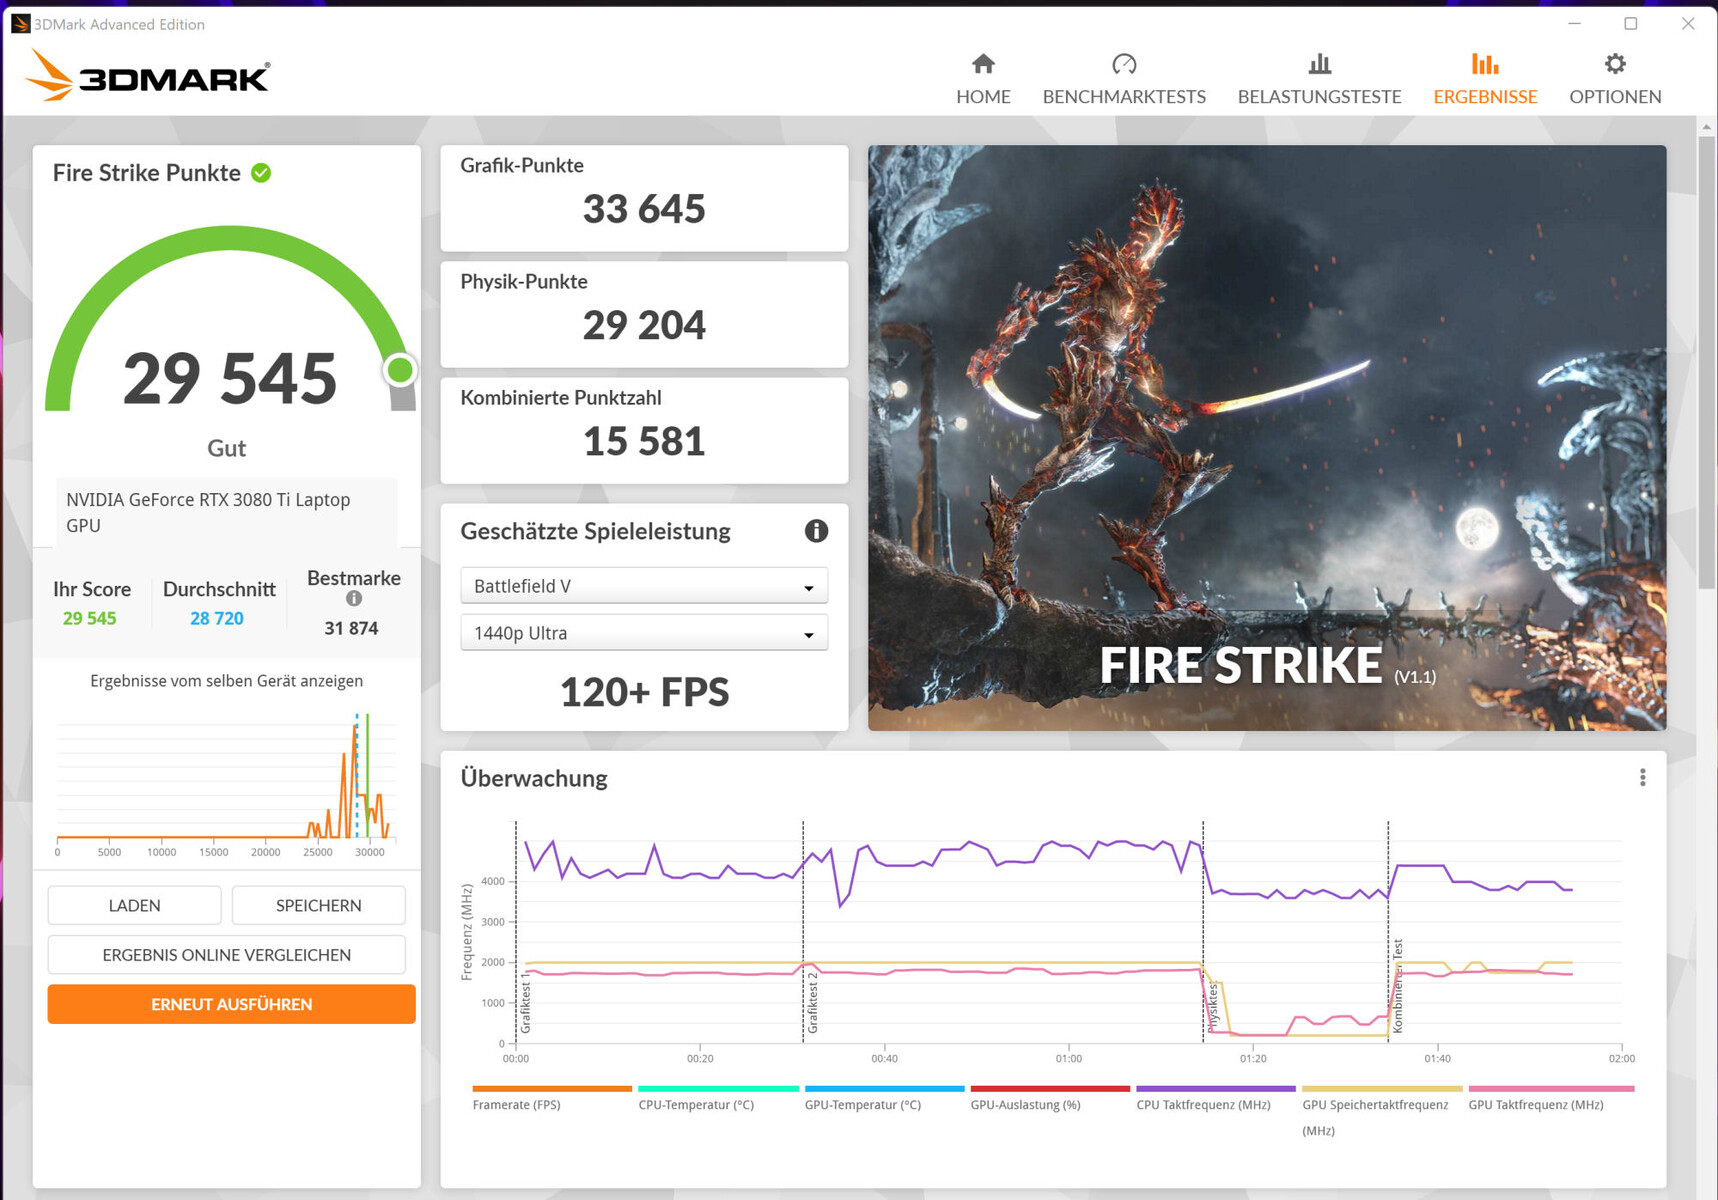
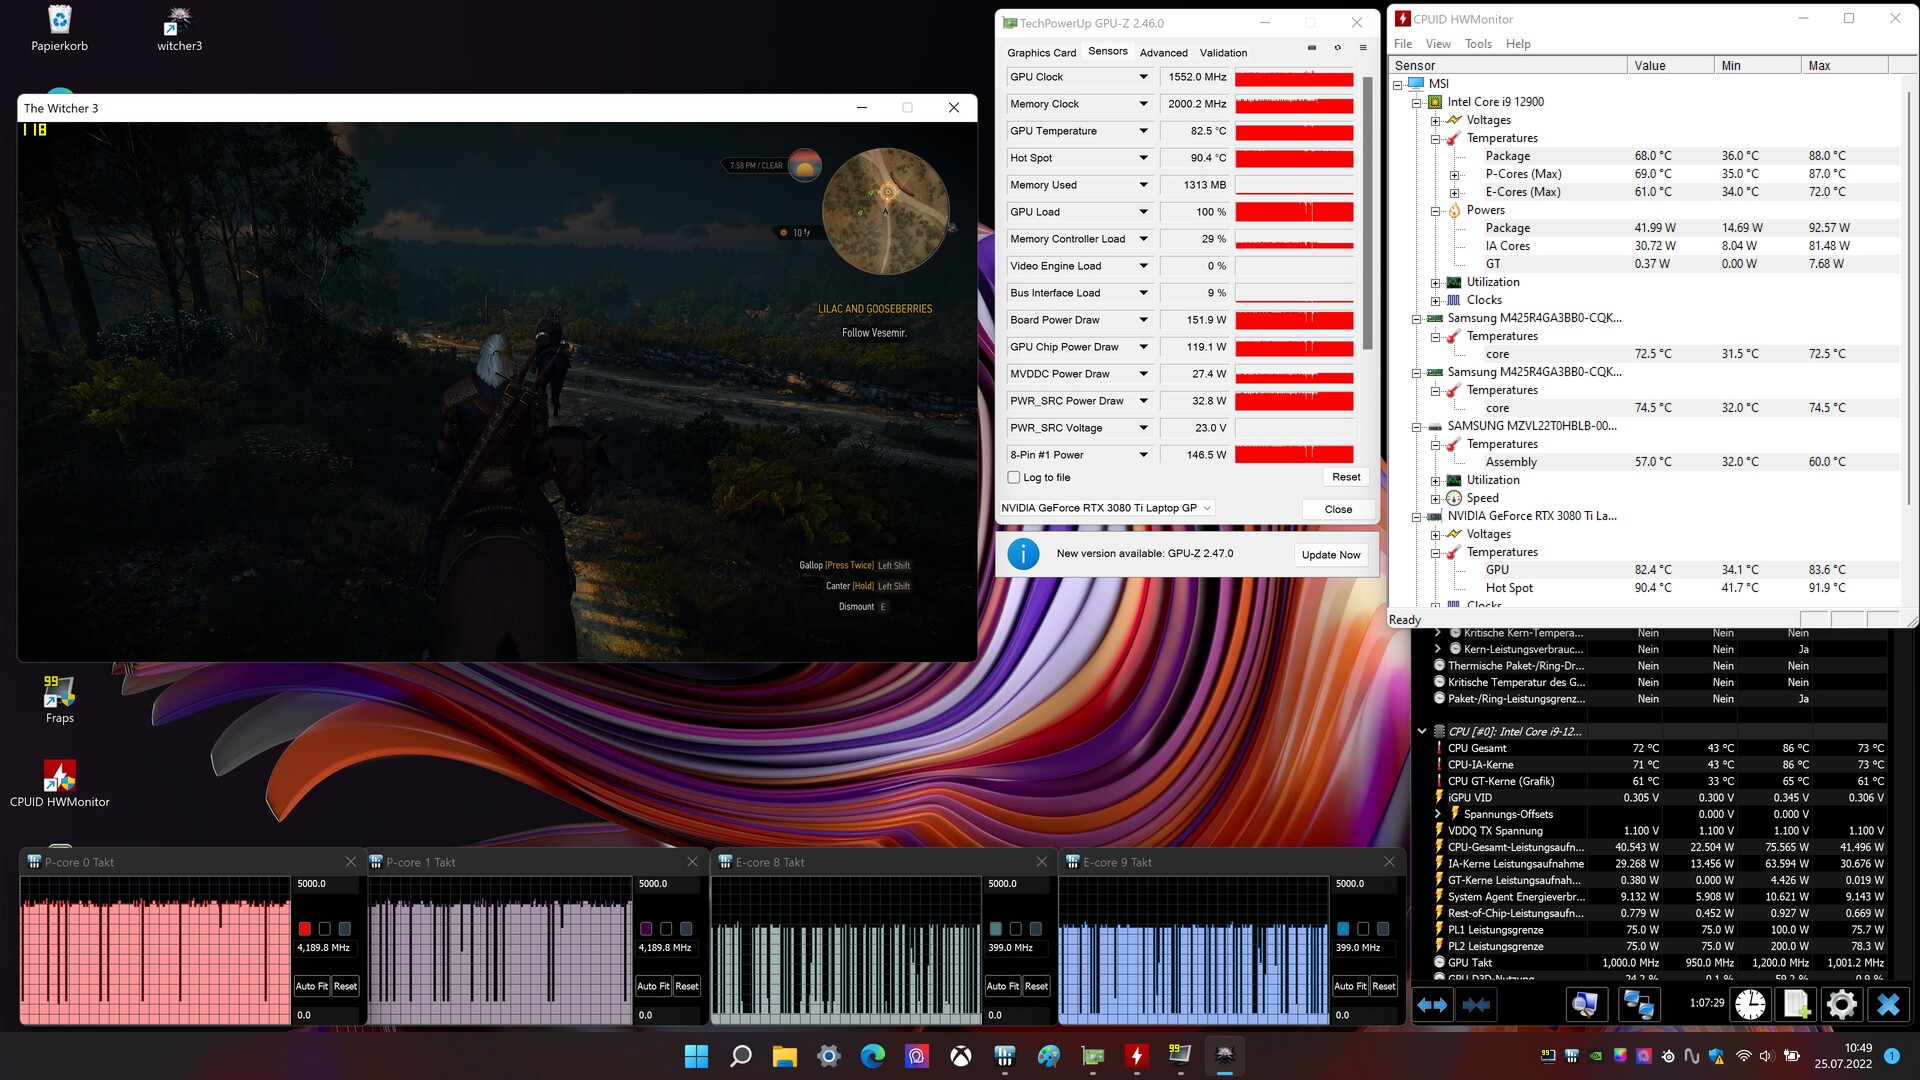
Le site GeForce Ordinateur portable RTX 3080 Ti (TGP : 175 watts, 16 GB de GDDR6 VRAM) dans le MSI Titan GT77 a produit certains des meilleurs scores que nous avons vu de ce GPU jusqu'à présent. Cependant, le TGP n'est pas pleinement utilisé, comme le montre le test Witcher 3. Le profil "Extreme Performance" offre des options d'overclocking du GPU et de la mémoire graphique. Advanced Optimus n'est pas pris en charge. La commutation entre le dGPU et Optimus nécessite toujours le redémarrage de l'ordinateur
| 3DMark Performance rating - Percent | |
| Moyenne de la classe Gaming | |
| MSI Titan GT77 12UHS | |
| Alienware x17 R2 P48E | |
| MSI Titan GT77 12UHS | |
| MSI Titan GT77 12UHS 4k -1! | |
| Razer Blade 17 Early 2022 | |
| Schenker XMG Ultra 17 Rocket Lake | |
| Moyenne NVIDIA GeForce RTX 3080 Ti Laptop GPU | |
| 3DMark 11 - 1280x720 Performance GPU | |
| Moyenne de la classe Gaming (21841 - 80022, n=104, 2 dernières années) | |
| MSI Titan GT77 12UHS | |
| Alienware x17 R2 P48E | |
| MSI Titan GT77 12UHS 4k | |
| Razer Blade 17 Early 2022 | |
| MSI Titan GT77 12UHS (dGPU, Extreme Leistung) | |
| Schenker XMG Ultra 17 Rocket Lake | |
| Moyenne NVIDIA GeForce RTX 3080 Ti Laptop GPU (13920 - 45841, n=45) | |
| 3DMark | |
| 1920x1080 Fire Strike Graphics | |
| Moyenne de la classe Gaming (12242 - 62849, n=115, 2 dernières années) | |
| MSI Titan GT77 12UHS | |
| MSI Titan GT77 12UHS (dGPU, Extreme Leistung) | |
| Alienware x17 R2 P48E | |
| MSI Titan GT77 12UHS 4k | |
| Razer Blade 17 Early 2022 | |
| Schenker XMG Ultra 17 Rocket Lake | |
| Moyenne NVIDIA GeForce RTX 3080 Ti Laptop GPU (6928 - 34439, n=43) | |
| 2560x1440 Time Spy Graphics | |
| Moyenne de la classe Gaming (5012 - 26212, n=115, 2 dernières années) | |
| MSI Titan GT77 12UHS | |
| Alienware x17 R2 P48E | |
| MSI Titan GT77 12UHS (dGPU, Extreme Leistung) | |
| Schenker XMG Ultra 17 Rocket Lake | |
| MSI Titan GT77 12UHS 4k | |
| Razer Blade 17 Early 2022 | |
| Moyenne NVIDIA GeForce RTX 3080 Ti Laptop GPU (4921 - 13835, n=43) | |
| 2560x1440 Port Royal Graphics | |
| Moyenne de la classe Gaming (4395 - 17286, n=71, 2 dernières années) | |
| Alienware x17 R2 P48E | |
| MSI Titan GT77 12UHS | |
| MSI Titan GT77 12UHS (dGPU, Extreme Leistung) | |
| Razer Blade 17 Early 2022 | |
| Schenker XMG Ultra 17 Rocket Lake | |
| Moyenne NVIDIA GeForce RTX 3080 Ti Laptop GPU (6423 - 8462, n=28) | |
| Geekbench 5.5 - OpenCL Score | |
| Moyenne de la classe Gaming (80702 - 277970, n=101, 2 dernières années) | |
| Alienware x17 R2 P48E | |
| MSI Titan GT77 12UHS (dGPU, Extreme Leistung) | |
| MSI Titan GT77 12UHS 4k | |
| Asus ROG Zephyrus Duo 16 GX650RX | |
| Schenker XMG Ultra 17 Rocket Lake | |
| Moyenne NVIDIA GeForce RTX 3080 Ti Laptop GPU (88580 - 151633, n=41) | |
| MSI Titan GT77 12UHS | |
| Razer Blade 17 Early 2022 | |
| Gigabyte Aero 16 YE5 | |
| V-Ray Benchmark Next 4.10 | |
| GPU | |
| Moyenne de la classe Gaming (427 - 1627, n=99, 2 dernières années) | |
| MSI Titan GT77 12UHS (v4.10.07, dGPU, Extreme Leistung) | |
| MSI Titan GT77 12UHS (v4.10.07 ) | |
| Asus ROG Zephyrus Duo 16 GX650RX (v4.10.07 ) | |
| MSI Titan GT77 12UHS 4k (v4.10.07 ) | |
| Moyenne NVIDIA GeForce RTX 3080 Ti Laptop GPU (311 - 552, n=35) | |
| Razer Blade 17 Early 2022 (v4.10.07 ) | |
| Gigabyte Aero 16 YE5 (v4.10.07 ) | |
| Schenker XMG Ultra 17 Rocket Lake (v4.10.07 ) | |
| CPU | |
| Moyenne de la classe Gaming (10048 - 45327, n=97, 2 dernières années) | |
| MSI Titan GT77 12UHS 4k (v4.10.07 ) | |
| MSI Titan GT77 12UHS (v4.10.07, dGPU, Extreme Leistung) | |
| MSI Titan GT77 12UHS (v4.10.07 ) | |
| Moyenne NVIDIA GeForce RTX 3080 Ti Laptop GPU (5564 - 23947, n=35) | |
| Gigabyte Aero 16 YE5 (v4.10.07 ) | |
| Schenker XMG Ultra 17 Rocket Lake (v4.10.07 ) | |
| Asus ROG Zephyrus Duo 16 GX650RX (v4.10.07 ) | |
| Razer Blade 17 Early 2022 (v4.10.07 ) | |
| Blender | |
| v3.3 Classroom CUDA | |
| MSI Titan GT77 12UHS 4k | |
| MSI Titan GT77 12UHS (dGPU, Extreme Leistung) | |
| Moyenne NVIDIA GeForce RTX 3080 Ti Laptop GPU (32 - 41, n=13) | |
| Moyenne de la classe Gaming (15 - 228, n=106, 2 dernières années) | |
| MSI Titan GT77 12UHS | |
| v3.3 Classroom OPTIX/RTX | |
| MSI Titan GT77 12UHS 4k | |
| Moyenne NVIDIA GeForce RTX 3080 Ti Laptop GPU (20 - 28, n=13) | |
| MSI Titan GT77 12UHS | |
| MSI Titan GT77 12UHS (dGPU, Extreme Leistung) | |
| Moyenne de la classe Gaming (9 - 32, n=106, 2 dernières années) | |
* ... Moindre est la valeur, meilleures sont les performances
| 3DMark 11 Performance | 35867 points | |
| 3DMark Cloud Gate Standard Score | 53629 points | |
| 3DMark Fire Strike Score | 27273 points | |
| 3DMark Fire Strike Extreme Score | 15613 points | |
| 3DMark Time Spy Score | 12865 points | |
Aide | ||
Performances de jeu
Le matériel est conçu pour le jeu en 4K avec des réglages élevés à maximaux. Les fréquences d'images sont supérieures à ce qu'une RTX 3080 Ti est capable de faire en moyenne. Lorsque le GPU GeForce pilotait directement l'écran, il produisait souvent les meilleurs taux d'images que nous ayons vus d'une RTX 3080 Ti jusqu'à présent. Quoi qu'il en soit, comme le démontre le test Witcher 3, l'ordinateur portable fournit des résultats bons et stables.
| The Witcher 3 | |
| 1920x1080 Ultra Graphics & Postprocessing (HBAO+) | |
| Moyenne de la classe Gaming (104.7 - 240, n=7, 2 dernières années) | |
| MSI Titan GT77 12UHS (dGPU, Extreme Leistung) | |
| MSI Titan GT77 12UHS | |
| Alienware x17 R2 P48E | |
| MSI Titan GT77 12UHS 4k | |
| Schenker XMG Ultra 17 Rocket Lake | |
| Razer Blade 17 Early 2022 | |
| Moyenne NVIDIA GeForce RTX 3080 Ti Laptop GPU (30 - 130.6, n=43) | |
| 3840x2160 Ultra Graphics & Postprocessing (HBAO+) | |
| Moyenne de la classe Gaming (112.4 - 114.8, n=2, 2 dernières années) | |
| MSI Titan GT77 12UHS (dGPU, Extreme Leistung) | |
| MSI Titan GT77 12UHS 4k | |
| Razer Blade 17 Early 2022 | |
| Moyenne NVIDIA GeForce RTX 3080 Ti Laptop GPU (44.8 - 62.7, n=5) | |
| Dota 2 Reborn | |
| 1920x1080 ultra (3/3) best looking | |
| MSI Titan GT77 12UHS | |
| MSI Titan GT77 12UHS (dGPU, Extreme Leistung) | |
| MSI Titan GT77 12UHS 4k | |
| Alienware x17 R2 P48E | |
| Schenker XMG Ultra 17 Rocket Lake | |
| Moyenne de la classe Gaming (84.8 - 248, n=107, 2 dernières années) | |
| Moyenne NVIDIA GeForce RTX 3080 Ti Laptop GPU (29.9 - 170.5, n=45) | |
| Razer Blade 17 Early 2022 | |
| 3840x2160 ultra (3/3) best looking | |
| Moyenne de la classe Gaming (114.9 - 199.2, n=32, 2 dernières années) | |
| MSI Titan GT77 12UHS (dGPU, Extreme Leistung) | |
| MSI Titan GT77 12UHS 4k | |
| Moyenne NVIDIA GeForce RTX 3080 Ti Laptop GPU (70.8 - 155.6, n=19) | |
| Razer Blade 17 Early 2022 | |
| X-Plane 11.11 | |
| 3840x2160 high (fps_test=3) | |
| MSI Titan GT77 12UHS (dGPU, Extreme Leistung) | |
| MSI Titan GT77 12UHS 4k | |
| Moyenne de la classe Gaming (60 - 124.1, n=32, 2 dernières années) | |
| Moyenne NVIDIA GeForce RTX 3080 Ti Laptop GPU (32.9 - 109.5, n=20) | |
| Razer Blade 17 Early 2022 | |
| 1920x1080 high (fps_test=3) | |
| MSI Titan GT77 12UHS | |
| MSI Titan GT77 12UHS (dGPU, Extreme Leistung) | |
| MSI Titan GT77 12UHS 4k | |
| Schenker XMG Ultra 17 Rocket Lake | |
| Alienware x17 R2 P48E | |
| Moyenne NVIDIA GeForce RTX 3080 Ti Laptop GPU (32.6 - 127, n=45) | |
| Moyenne de la classe Gaming (55.5 - 143.5, n=109, 2 dernières années) | |
| Razer Blade 17 Early 2022 | |
| Final Fantasy XV Benchmark | |
| 3840x2160 High Quality | |
| Moyenne de la classe Gaming (49.1 - 111.8, n=33, 2 dernières années) | |
| MSI Titan GT77 12UHS (1.3, dGPU, Extreme Leistung) | |
| MSI Titan GT77 12UHS 4k (1.3) | |
| Razer Blade 17 Early 2022 (1.3) | |
| Moyenne NVIDIA GeForce RTX 3080 Ti Laptop GPU (35.1 - 61.2, n=18) | |
| 1920x1080 High Quality | |
| Moyenne de la classe Gaming (41 - 215, n=95, 2 dernières années) | |
| MSI Titan GT77 12UHS (1.3, dGPU, Extreme Leistung) | |
| MSI Titan GT77 12UHS (1.3) | |
| MSI Titan GT77 12UHS 4k (1.3) | |
| Alienware x17 R2 P48E (1.3) | |
| Moyenne NVIDIA GeForce RTX 3080 Ti Laptop GPU (30.7 - 140.6, n=42) | |
| Razer Blade 17 Early 2022 (1.3) | |
| GTA V | |
| 3840x2160 Highest AA:4xMSAA + FX AF:16x | |
| Moyenne de la classe Gaming (53.9 - 123.2, n=25, 2 dernières années) | |
| MSI Titan GT77 12UHS (dGPU, Extreme Leistung) | |
| MSI Titan GT77 12UHS 4k | |
| Razer Blade 17 Early 2022 | |
| Moyenne NVIDIA GeForce RTX 3080 Ti Laptop GPU (37.7 - 67.2, n=14) | |
| 1920x1080 Highest AA:4xMSAA + FX AF:16x | |
| MSI Titan GT77 12UHS 4k | |
| MSI Titan GT77 12UHS (dGPU, Extreme Leistung) | |
| Moyenne de la classe Gaming (48.3 - 186.9, n=94, 2 dernières années) | |
| MSI Titan GT77 12UHS | |
| Alienware x17 R2 P48E | |
| Moyenne NVIDIA GeForce RTX 3080 Ti Laptop GPU (30 - 139.2, n=42) | |
| Razer Blade 17 Early 2022 | |
| Strange Brigade | |
| 3840x2160 ultra AA:ultra AF:16 | |
| Moyenne de la classe Gaming (83 - 187.2, n=34, 2 dernières années) | |
| MSI Titan GT77 12UHS (1.47.22.14 D3D12, dGPU, Extreme Leistung) | |
| MSI Titan GT77 12UHS 4k (1.47.22.14 D3D12) | |
| Razer Blade 17 Early 2022 (1.47.22.14 D3D12) | |
| Moyenne NVIDIA GeForce RTX 3080 Ti Laptop GPU (61.7 - 100.7, n=15) | |
| 1920x1080 ultra AA:ultra AF:16 | |
| Moyenne de la classe Gaming (76.3 - 458, n=87, 2 dernières années) | |
| MSI Titan GT77 12UHS (1.47.22.14 D3D12) | |
| MSI Titan GT77 12UHS (1.47.22.14 D3D12, dGPU, Extreme Leistung) | |
| Alienware x17 R2 P48E (1.47.22.14 D3D12) | |
| MSI Titan GT77 12UHS 4k (1.47.22.14 D3D12) | |
| Razer Blade 17 Early 2022 (1.47.22.14 D3D12) | |
| Moyenne NVIDIA GeForce RTX 3080 Ti Laptop GPU (42.3 - 224, n=41) | |
| F1 2021 | |
| 3840x2160 Ultra High Preset + Raytracing AA:T AF:16x | |
| MSI Titan GT77 12UHS (874931, dGPU, Extreme Leistung) | |
| MSI Titan GT77 12UHS 4k (874931) | |
| Razer Blade 17 Early 2022 (874931) | |
| Moyenne NVIDIA GeForce RTX 3080 Ti Laptop GPU (41.1 - 70.2, n=18) | |
| 1920x1080 Ultra High Preset + Raytracing AA:T AF:16x | |
| MSI Titan GT77 12UHS (874931) | |
| MSI Titan GT77 12UHS (874931, dGPU, Extreme Leistung) | |
| Razer Blade 17 Early 2022 (874931) | |
| MSI Titan GT77 12UHS 4k (874931) | |
| Moyenne NVIDIA GeForce RTX 3080 Ti Laptop GPU (30.2 - 160.6, n=30) | |
| Far Cry 5 | |
| 3840x2160 Ultra Preset AA:T | |
| Moyenne de la classe Gaming (n=12 dernières années) | |
| MSI Titan GT77 12UHS 4k | |
| MSI Titan GT77 12UHS (dGPU, Extreme Leistung) | |
| Razer Blade 17 Early 2022 | |
| Moyenne NVIDIA GeForce RTX 3080 Ti Laptop GPU (45 - 76, n=9) | |
| 1920x1080 Ultra Preset AA:T | |
| MSI Titan GT77 12UHS (dGPU, Extreme Leistung) | |
| MSI Titan GT77 12UHS | |
| MSI Titan GT77 12UHS 4k | |
| Schenker XMG Ultra 17 Rocket Lake | |
| Moyenne NVIDIA GeForce RTX 3080 Ti Laptop GPU (111 - 162, n=24) | |
| Razer Blade 17 Early 2022 | |
| Moyenne de la classe Gaming (70 - 151, n=6, 2 dernières années) | |
Witcher 3 FPS graph
| Bas | Moyen | Élevé | Ultra | QHD | 4K | |
|---|---|---|---|---|---|---|
| GTA V (2015) | 187.3 | 186.6 | 182.3 | 134.4 | 117.8 | 121.7 |
| The Witcher 3 (2015) | 480 | 379 | 240 | 123.7 | 91.9 | |
| Dota 2 Reborn (2015) | 199.9 | 180.7 | 169.7 | 162.7 | 139.9 | |
| Final Fantasy XV Benchmark (2018) | 220 | 174.1 | 131 | 100.3 | 58.3 | |
| X-Plane 11.11 (2018) | 170.8 | 150.8 | 118.3 | 100.9 | ||
| Far Cry 5 (2018) | 199 | 169 | 161 | 151 | 134 | 76 |
| Strange Brigade (2018) | 519 | 286 | 233 | 206 | 156.2 | 93.7 |
| F1 2021 (2021) | 348 | 237 | 205 | 130.4 | 103.4 | 62.8 |
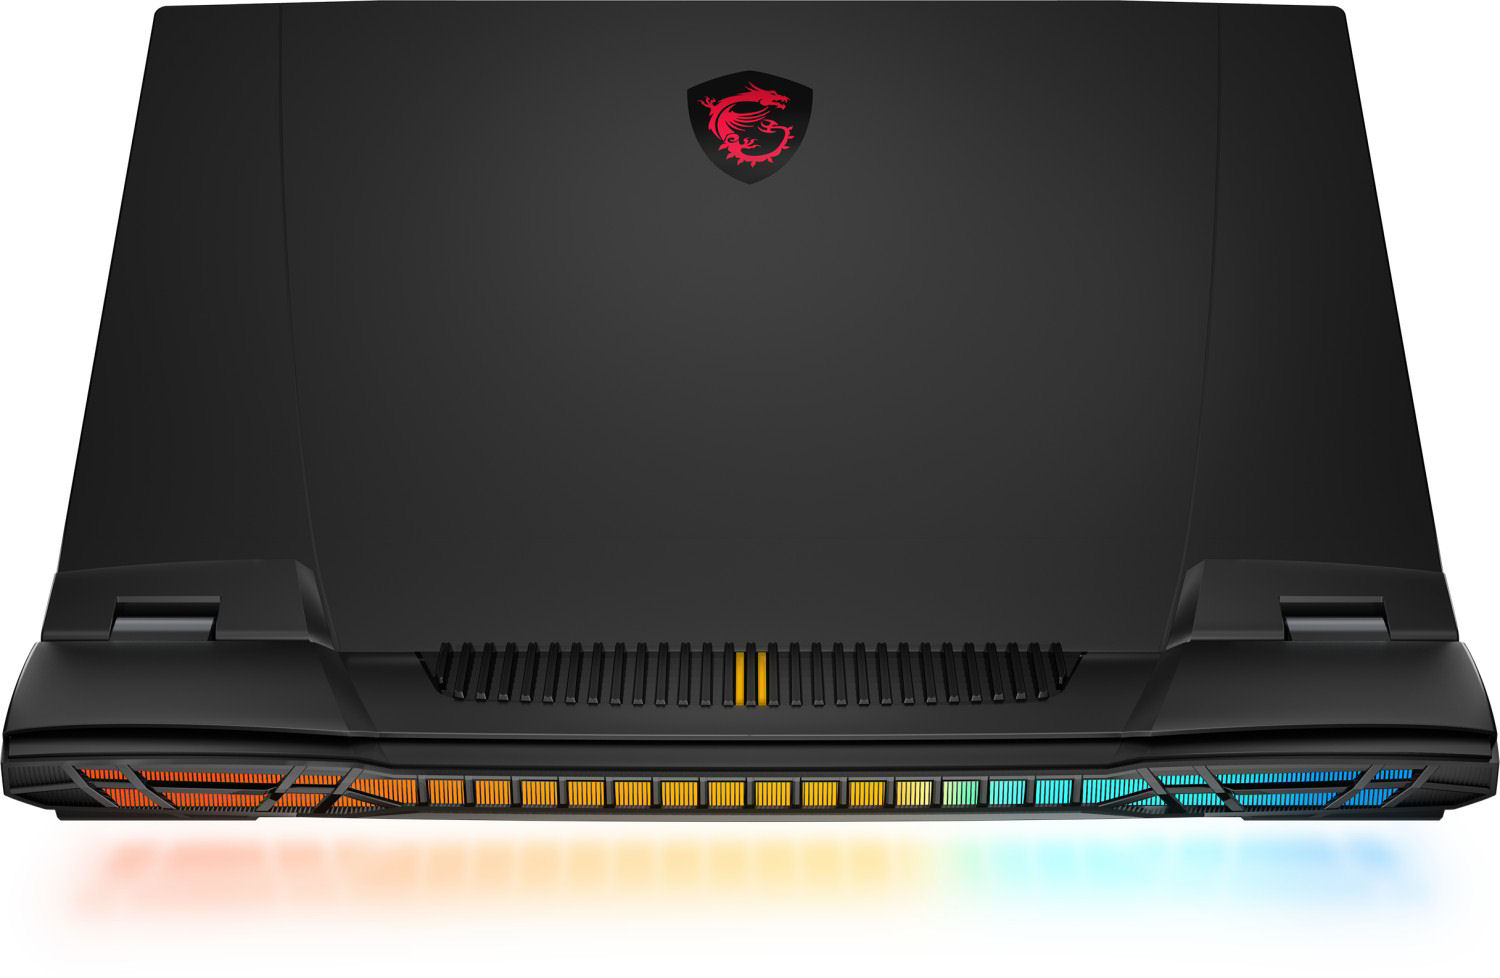
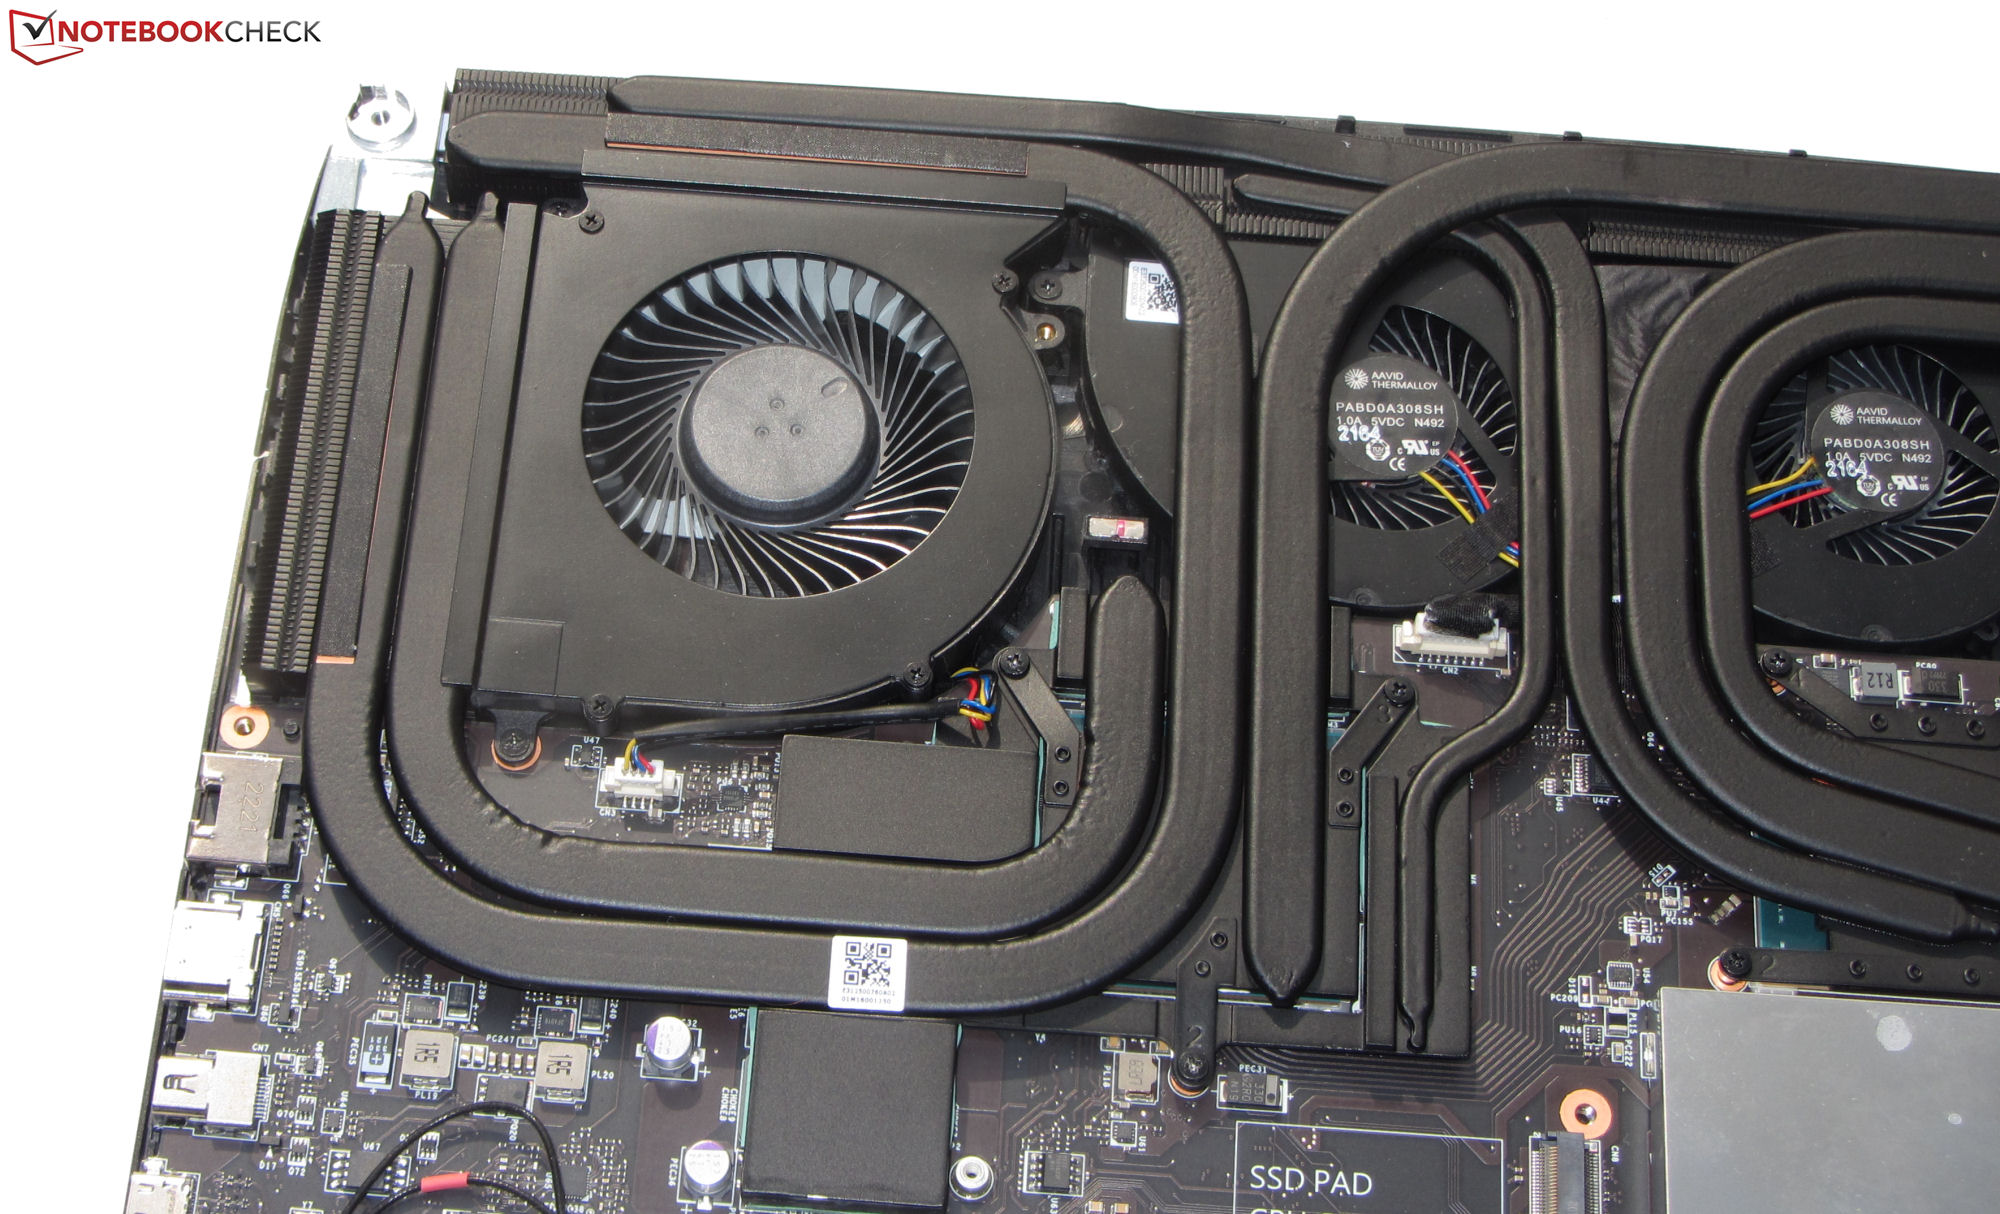
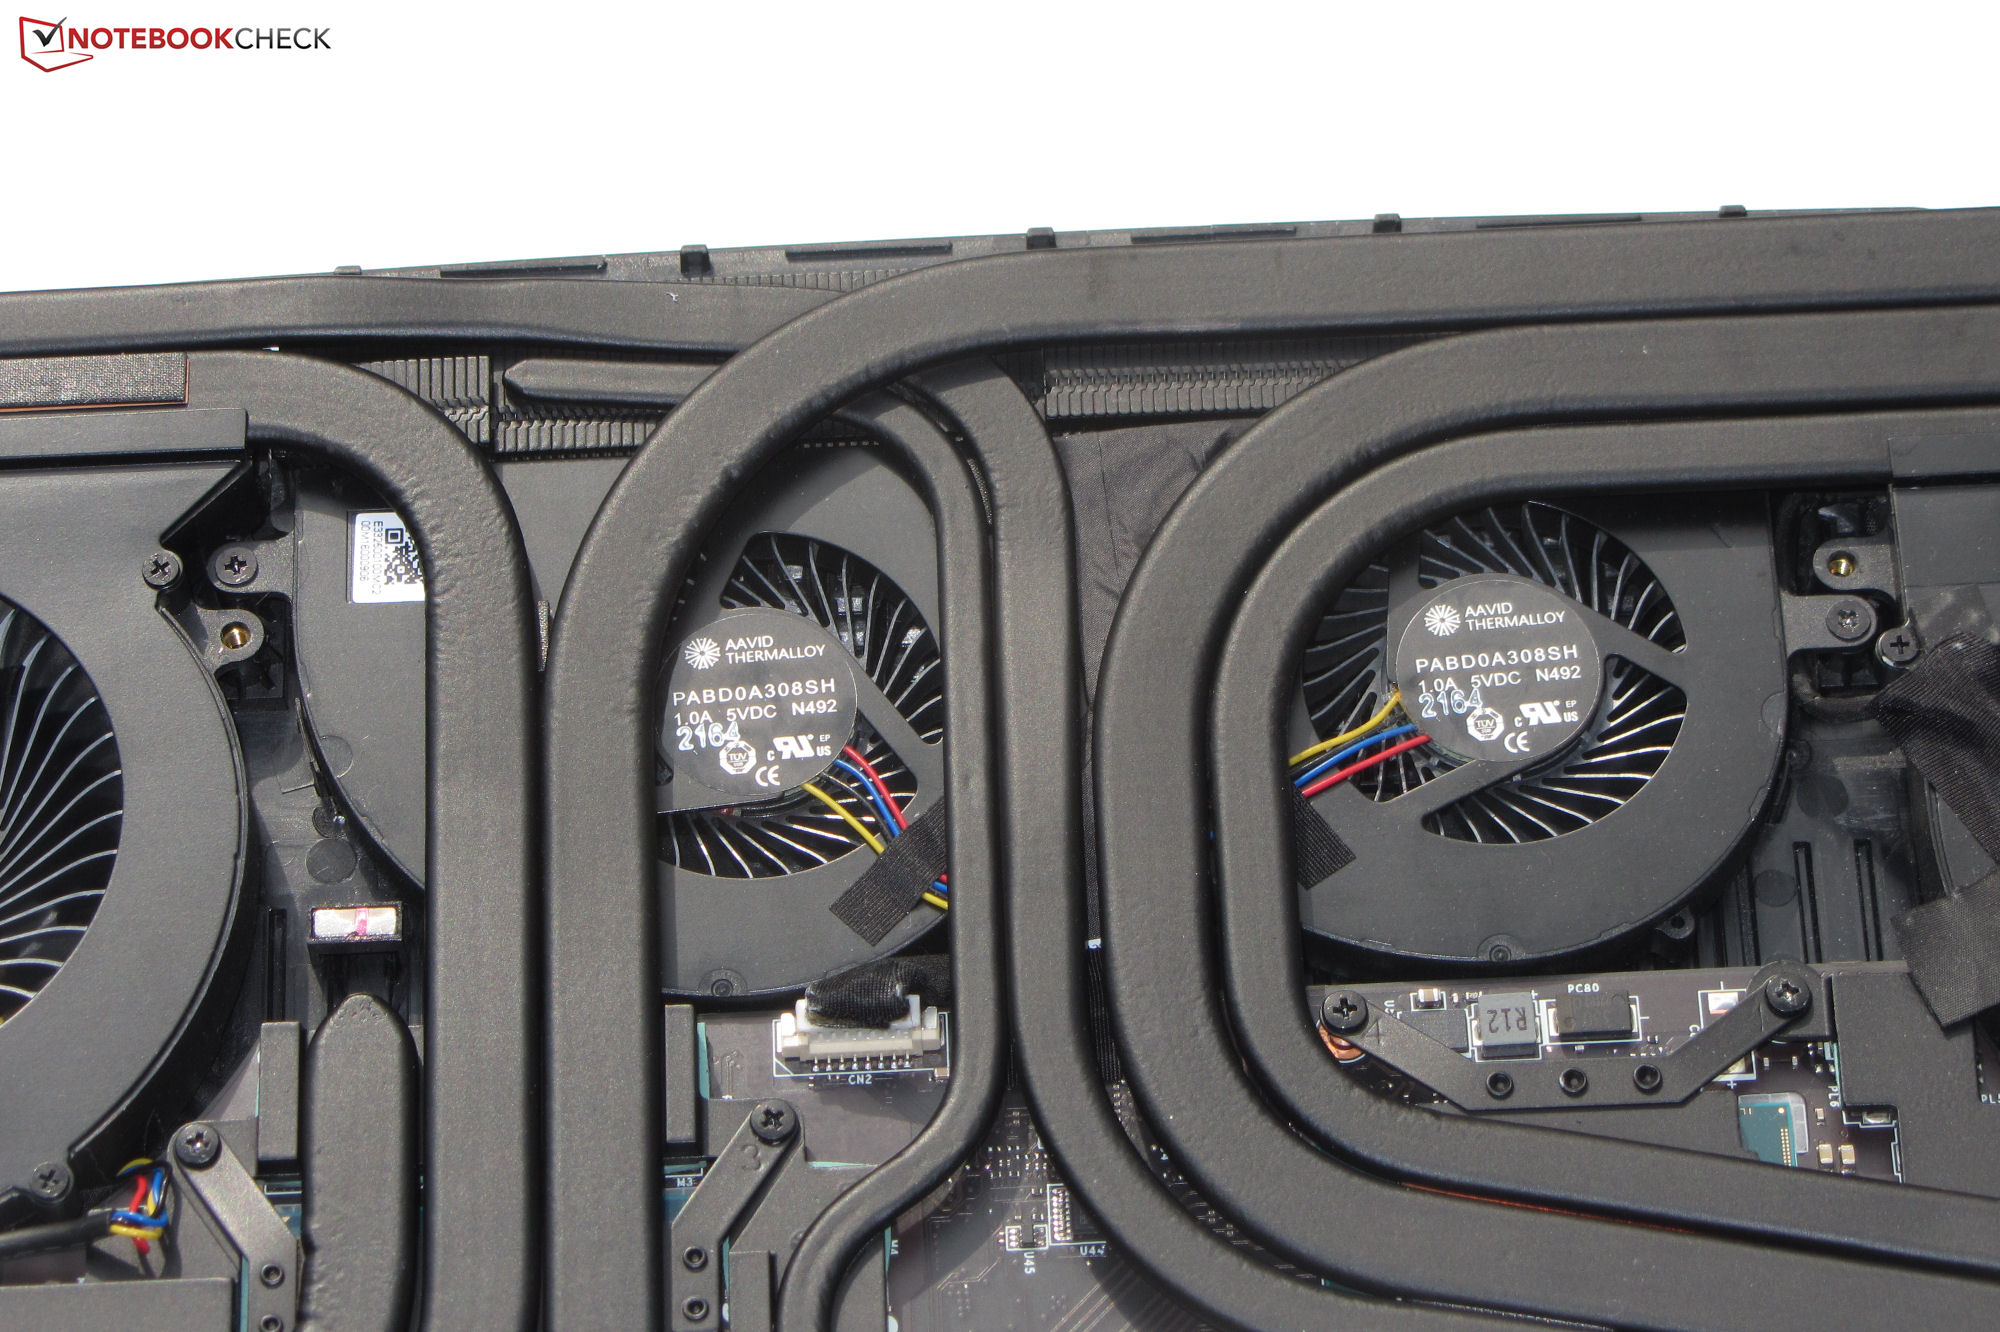
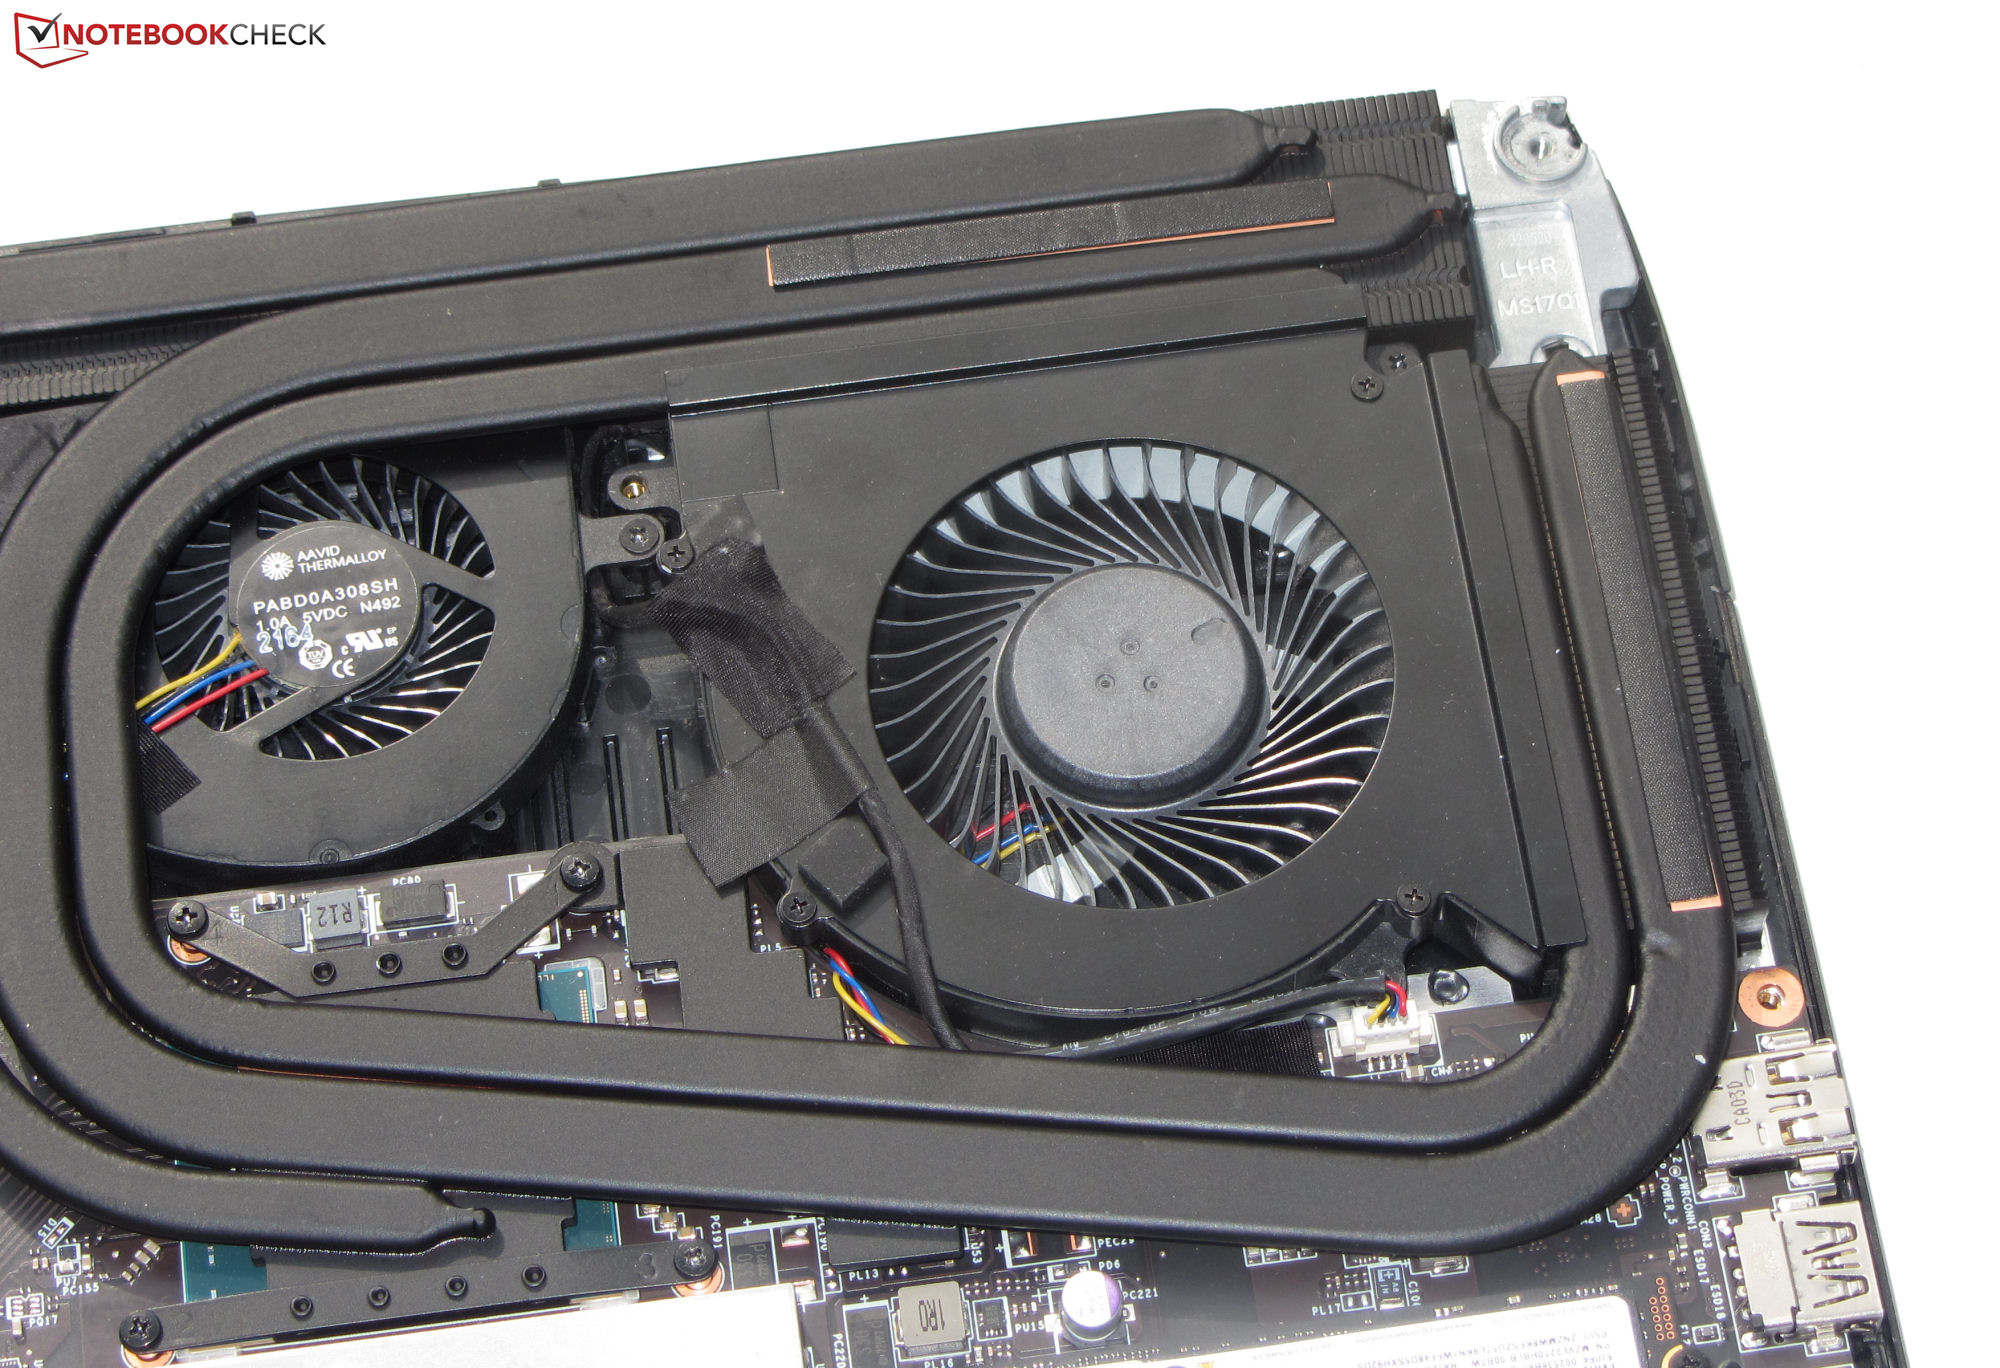
Emissions - Le MSI GT77 a quatre ventilateurs
Émissions sonores
Les quatre ventilateurs peuvent générer un bruit assez important : sous charge, les niveaux sonores ont atteint 53 dB(A) lors du test Witcher 3 et 56 dB(A) lors du test de stress. Au ralenti ou sous faible charge, au moins un des ventilateurs tourne généralement et le bruit du ventilateur peut atteindre 42 dB(A). Cependant, le FHD Titan n'est pas affecté par ce phénomène. Une explication possible est que le contrôle du ventilateur sur le modèle 4K pourrait être un peu plus agité en raison de la fonction "Smart Auto" active. Le profil "Silent Mode" permet de réduire le bruit lorsque le système est en marche, au détriment de la puissance de calcul
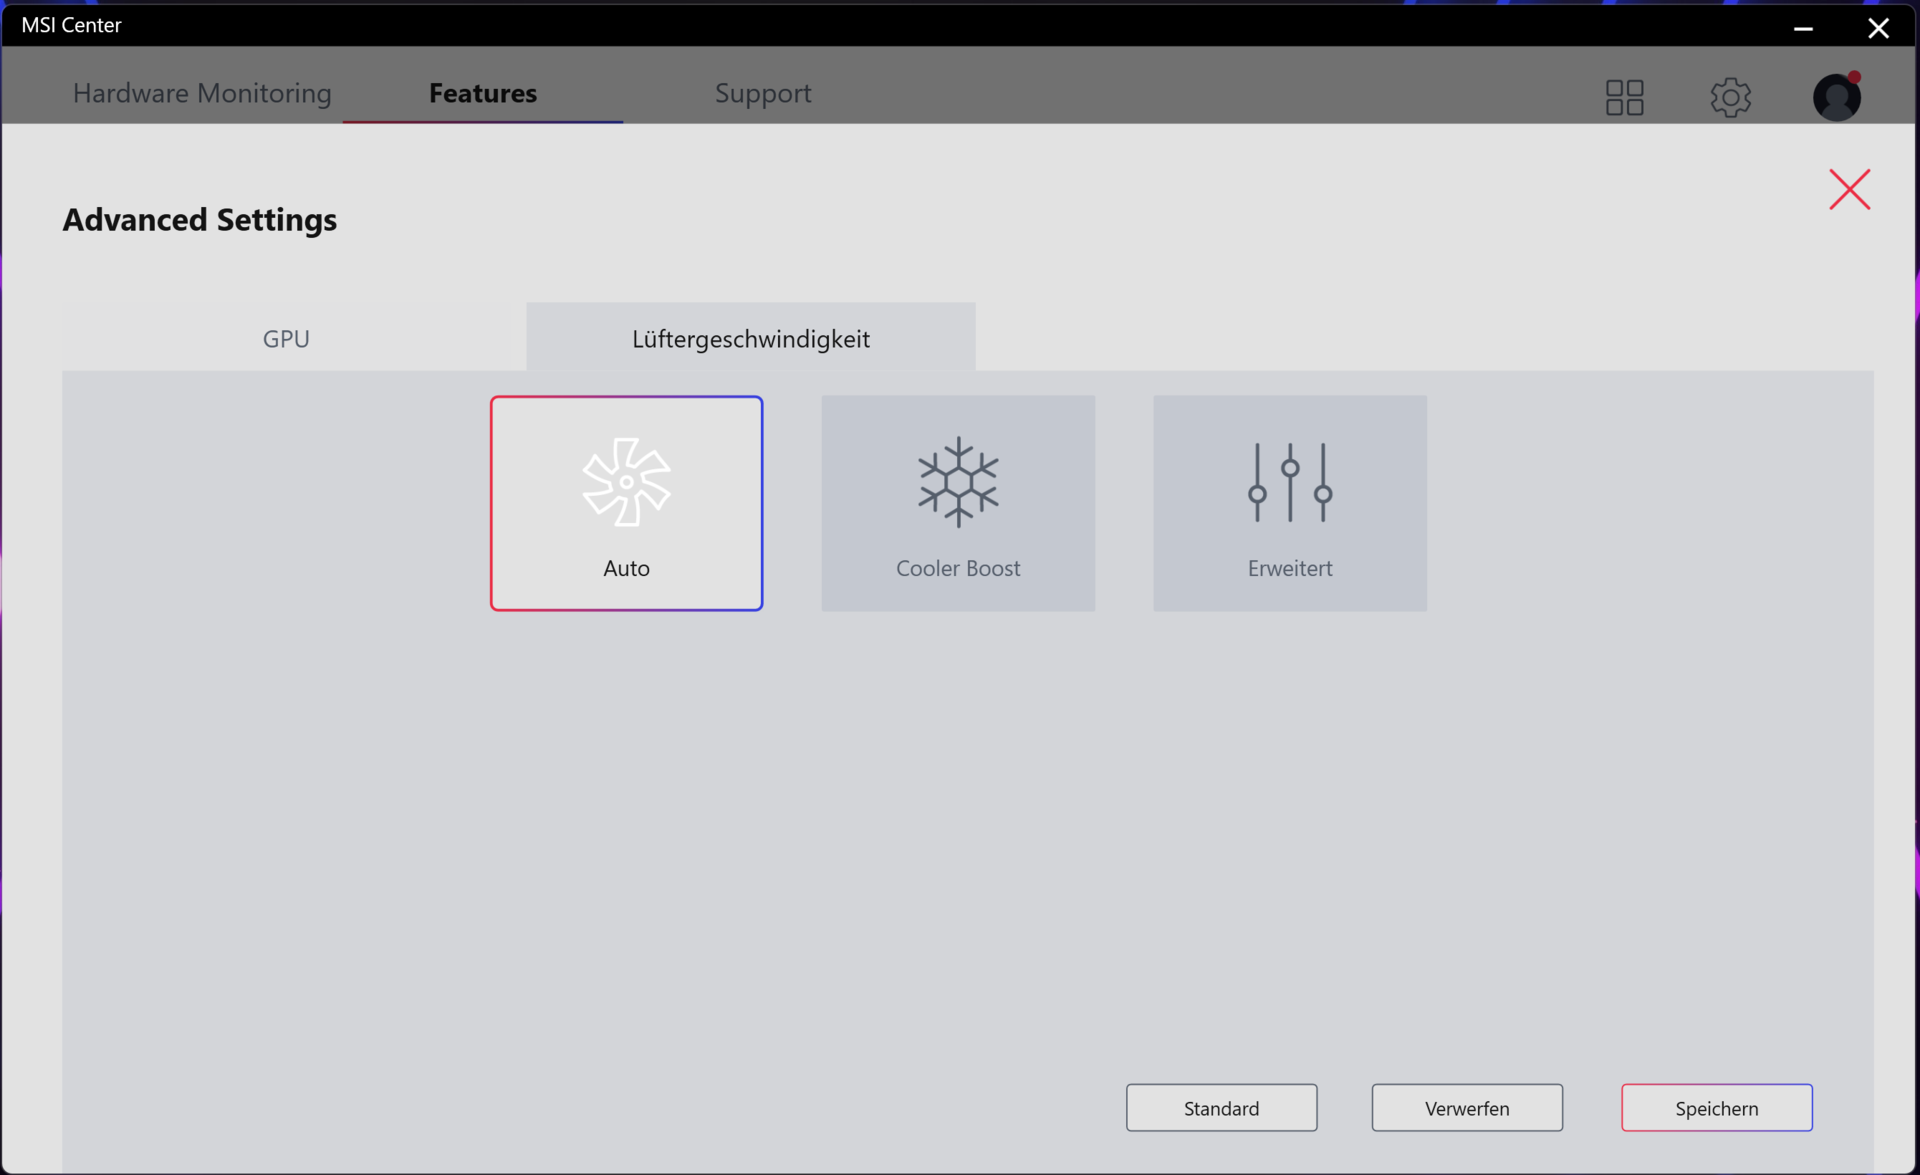
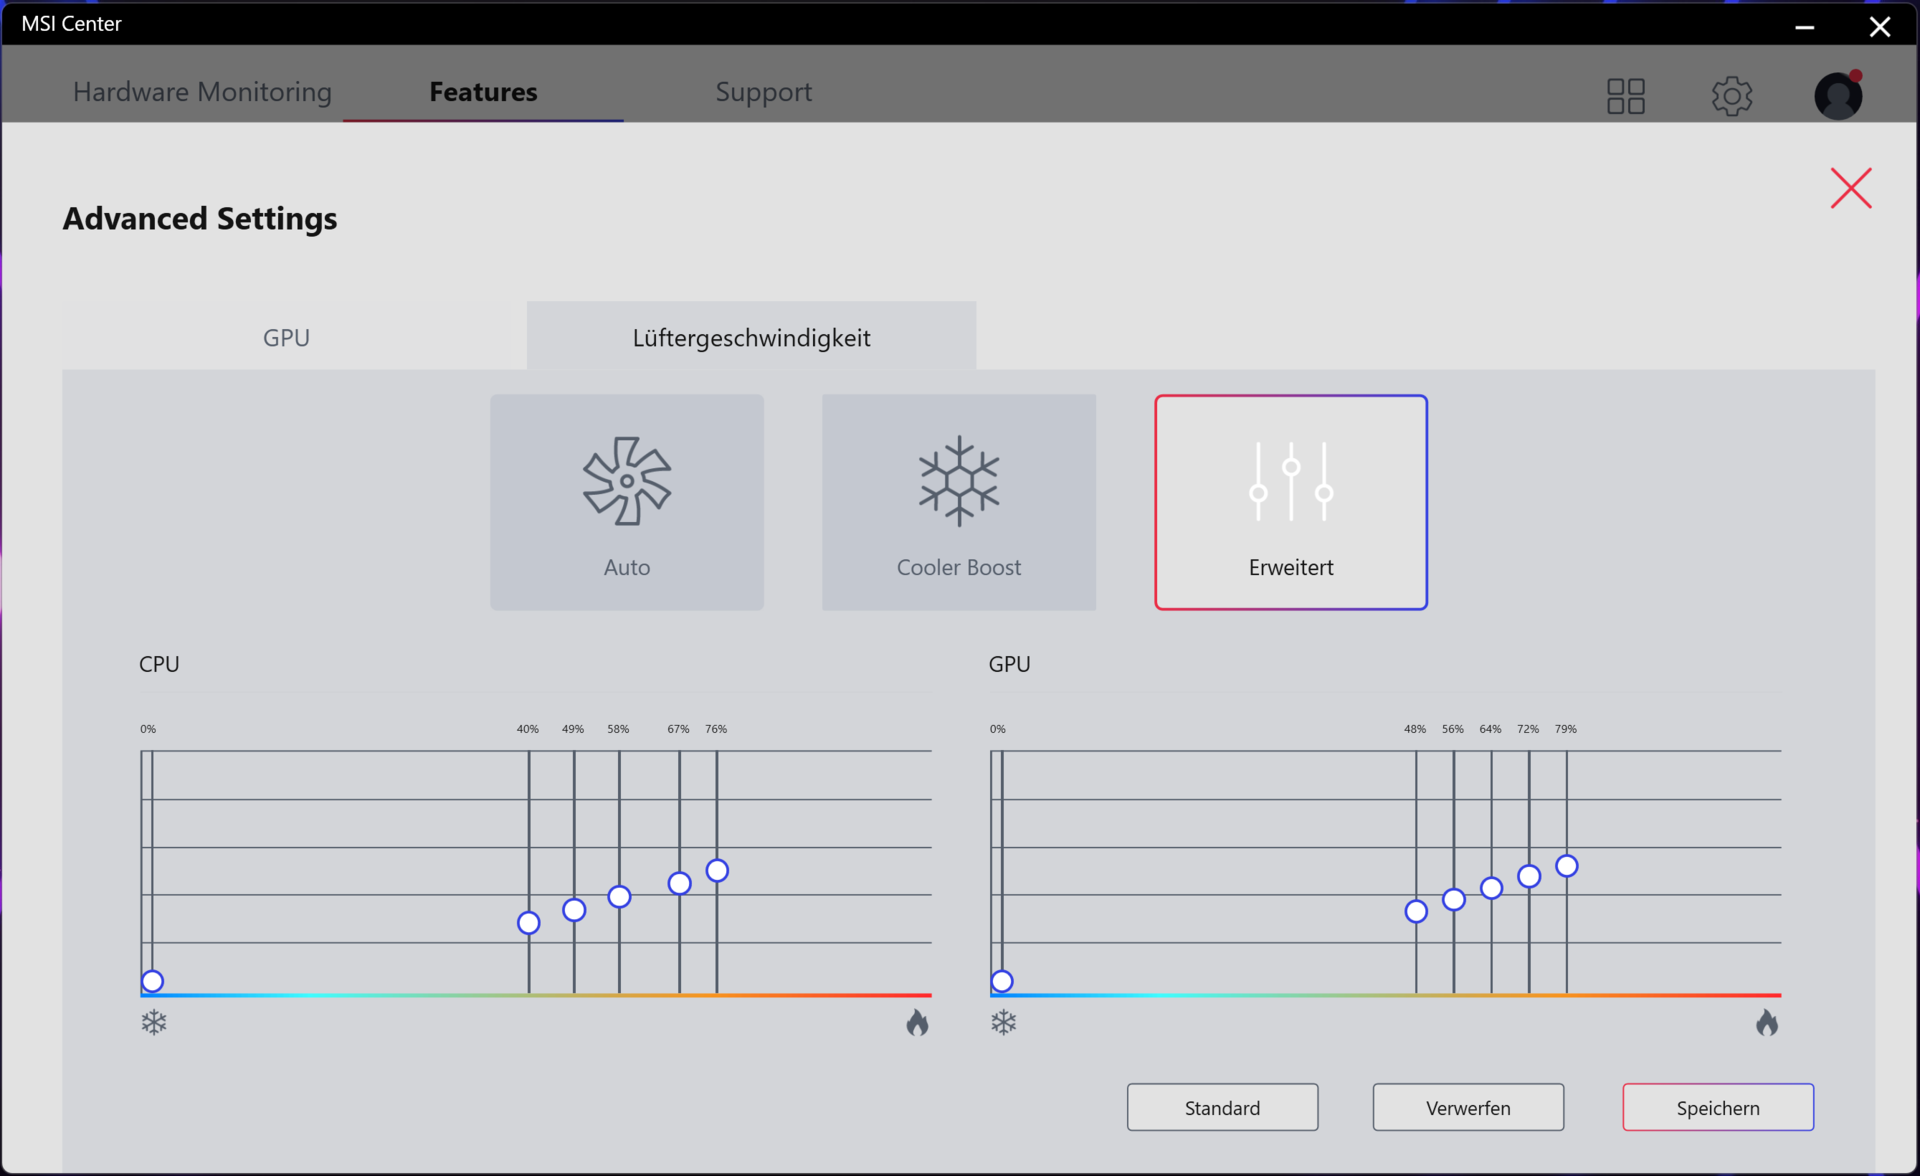
Le profil "Extreme Performance" vous permet de modifier le contrôle du ventilateur. Les options disponibles comprennent "Auto", "Cooler Boost" (les ventilateurs fonctionnent à la vitesse maximale) et "Advanced" (personnalisation des courbes des ventilateurs).
Degré de la nuisance sonore
| Au repos |
| 29 / 30 / 42 dB(A) |
| Fortement sollicité |
| 54 / 56 dB(A) |
 | ||
30 dB silencieux 40 dB(A) audible 50 dB(A) bruyant |
||
min: | ||
| MSI Titan GT77 12UHS 4k i9-12900HX, GeForce RTX 3080 Ti Laptop GPU | Razer Blade 17 Early 2022 i9-12900H, GeForce RTX 3080 Ti Laptop GPU | Alienware x17 R2 P48E i9-12900HK, GeForce RTX 3080 Ti Laptop GPU | Schenker XMG Ultra 17 Rocket Lake i9-11900K, GeForce RTX 3080 Laptop GPU | MSI Titan GT77 12UHS i9-12900HX, GeForce RTX 3080 Ti Laptop GPU | |
|---|---|---|---|---|---|
| Noise | 9% | 21% | -12% | 14% | |
| arrêt / environnement * (dB) | 26 | 26 -0% | 22.7 13% | 24 8% | 21.9 16% |
| Idle Minimum * (dB) | 29 | 26 10% | 23.1 20% | 30 -3% | 24.53 15% |
| Idle Average * (dB) | 30 | 27 10% | 23.1 23% | 31 -3% | 24.53 18% |
| Idle Maximum * (dB) | 42 | 32 24% | 23.1 45% | 57 -36% | 24.53 42% |
| Load Average * (dB) | 54 | 50 7% | 31.9 41% | 63 -17% | 46.25 14% |
| Witcher 3 ultra * (dB) | 52 | 51 2% | 52.5 -1% | 61 -17% | 56.86 -9% |
| Load Maximum * (dB) | 56 | 51 9% | 52.5 6% | 63 -13% | 54.25 3% |
* ... Moindre est la valeur, meilleures sont les performances
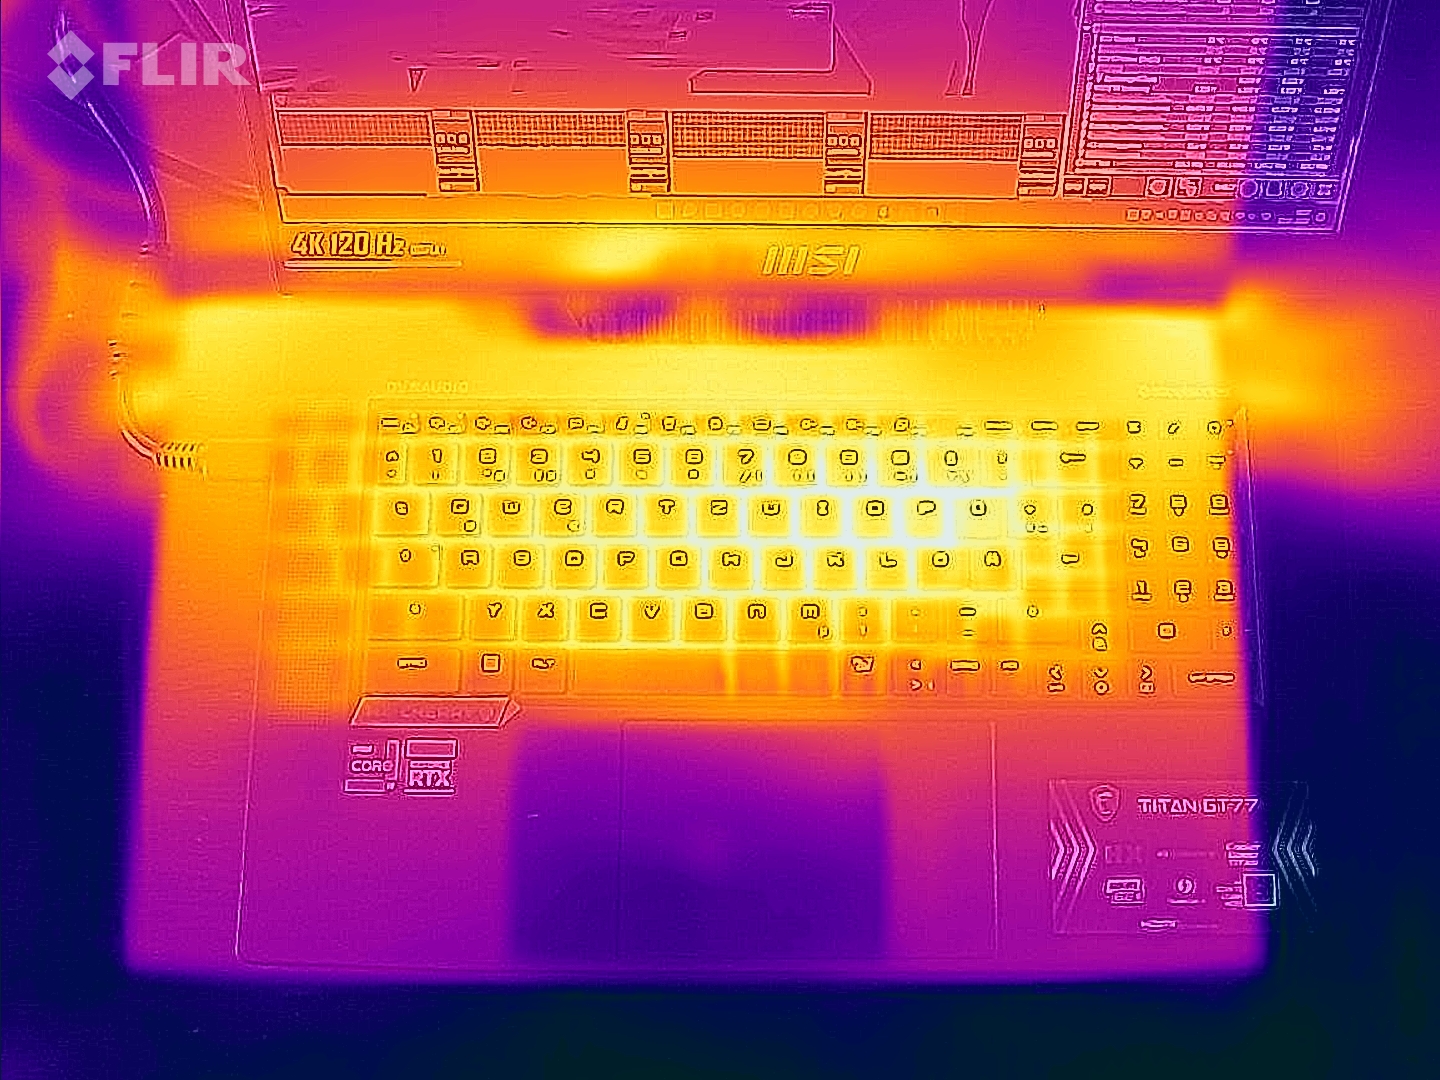
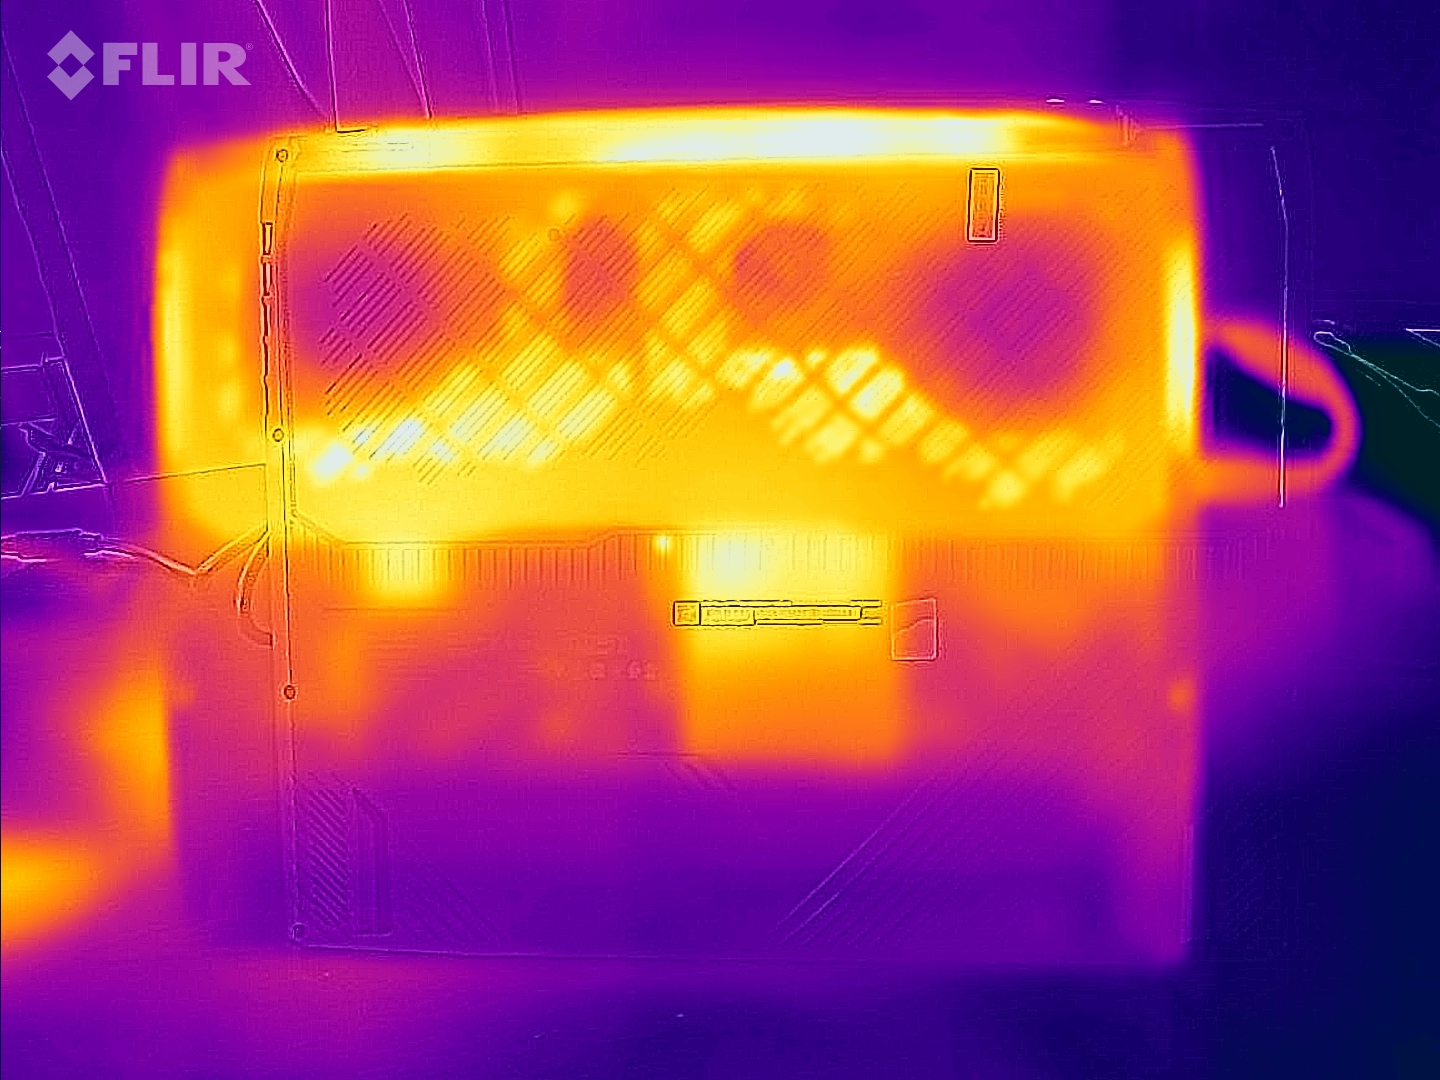
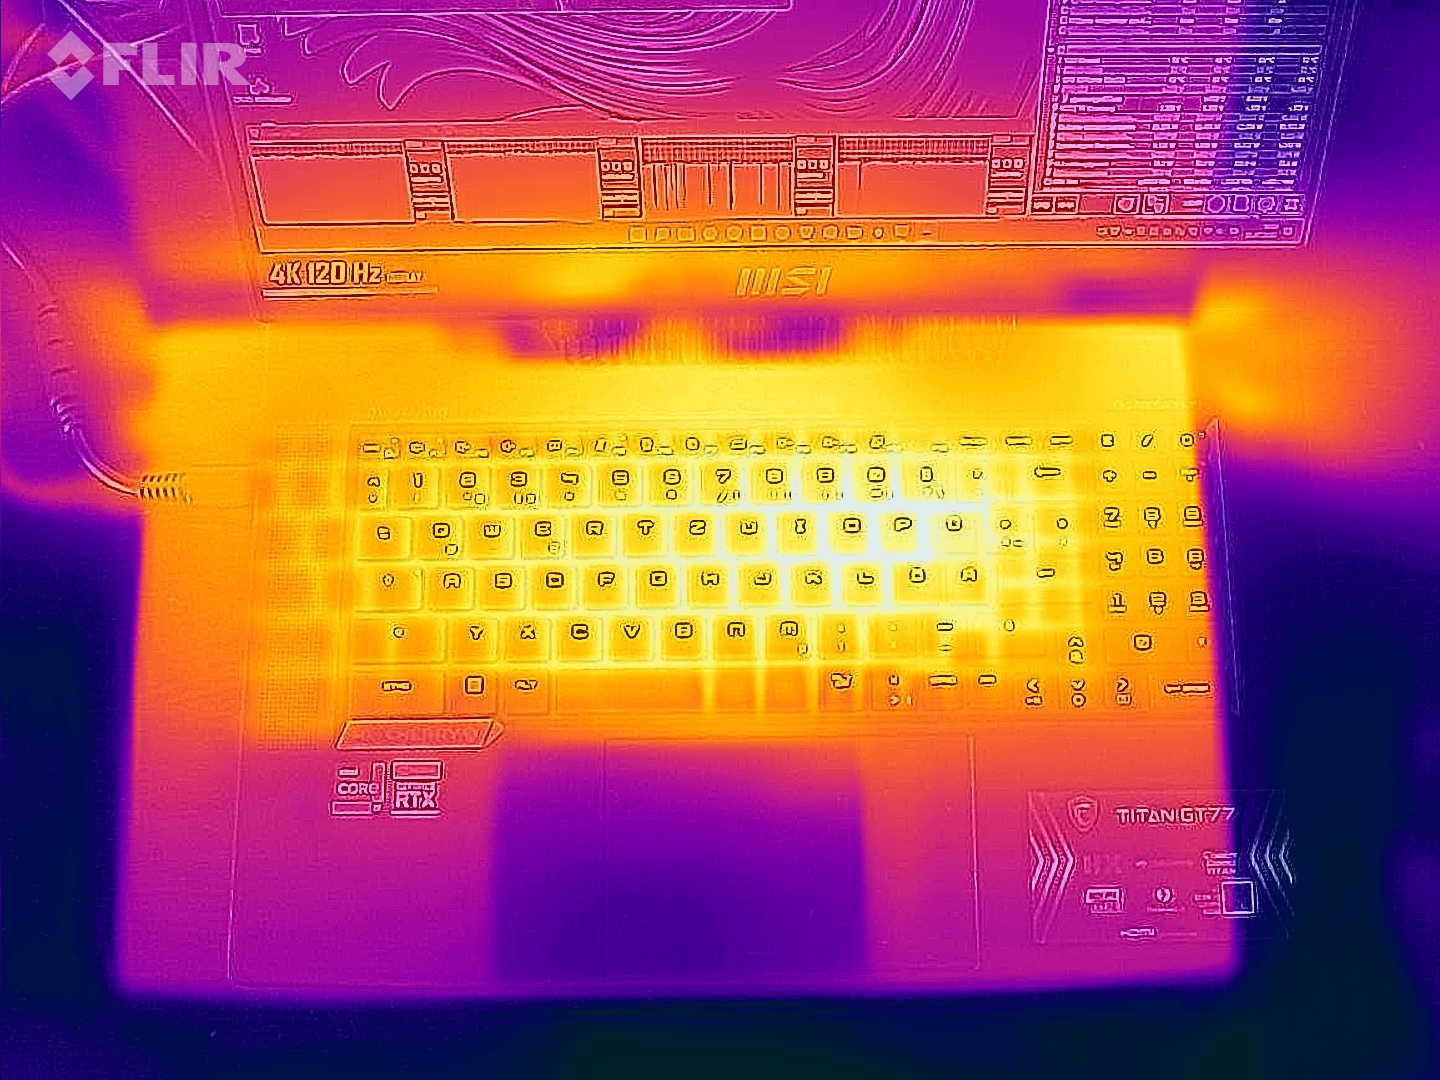
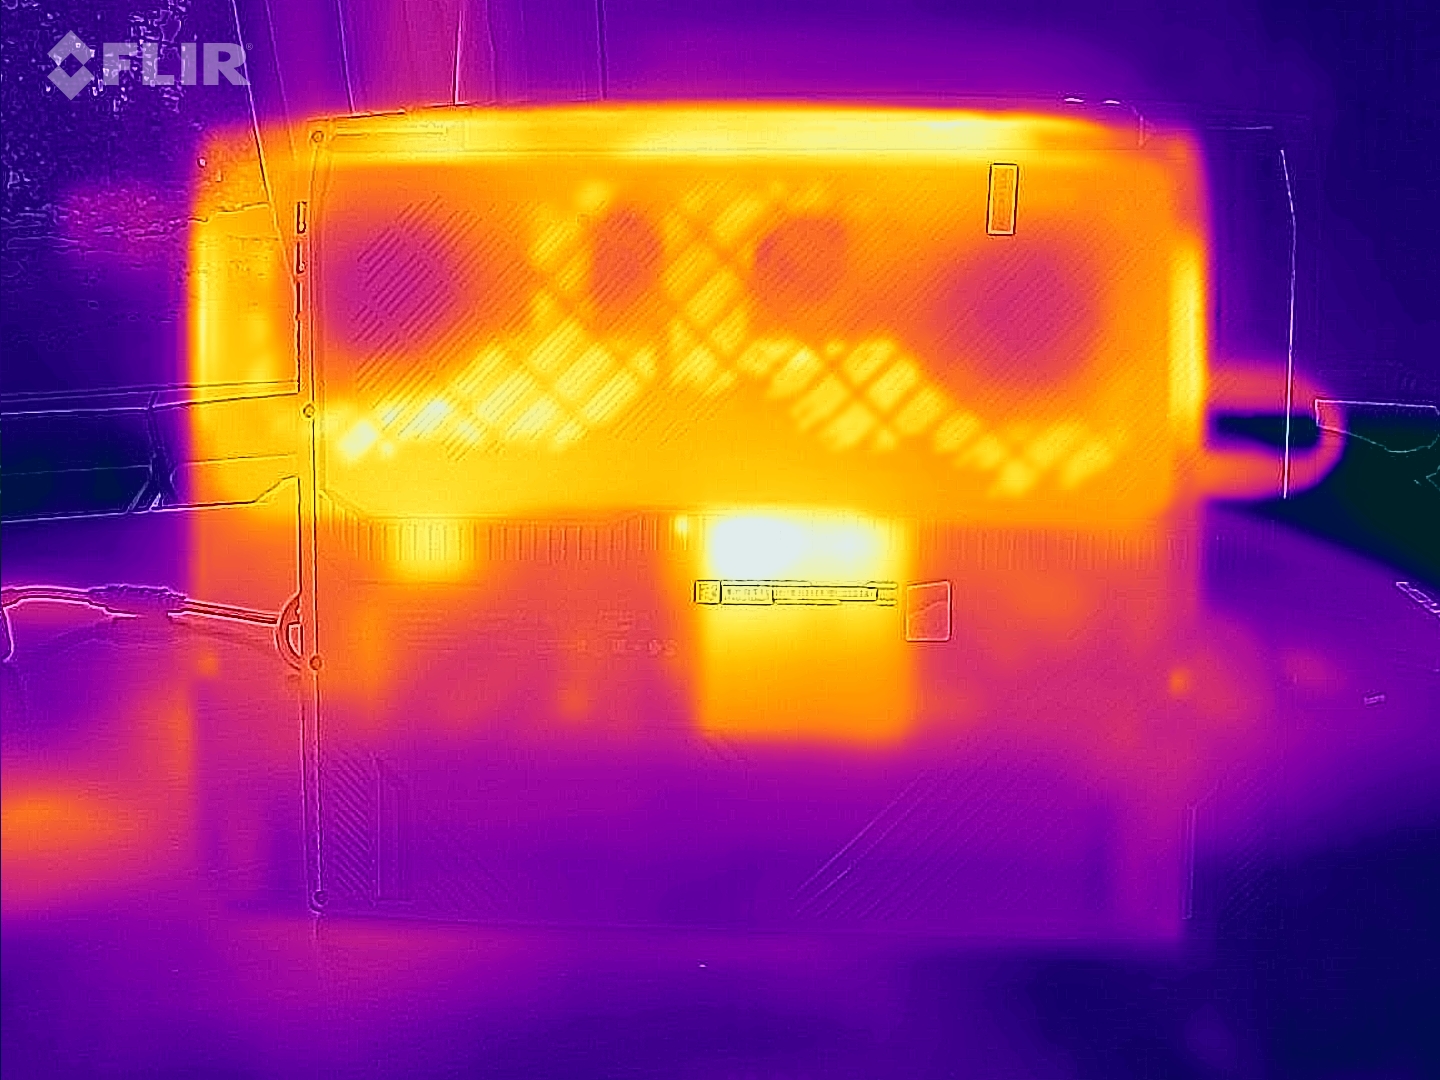
Température
En utilisation quotidienne (travail de bureau, navigation sur Internet), les températures du châssis sont restées dans une fourchette acceptable. Sous charge (test de stress, Witcher 3 test), l'ordinateur portable s'est réchauffé de manière significative mais pas trop. Il n'y a pas lieu de s'inquiéter en ce qui concerne les températures du processeur.
(-) La température maximale du côté supérieur est de 49 °C / 120 F, par rapport à la moyenne de 40.4 °C / 105 F, allant de 21.2 à 68.8 °C pour la classe Gaming.
(-) Le fond chauffe jusqu'à un maximum de 50 °C / 122 F, contre une moyenne de 43.2 °C / 110 F
(±) En utilisation inactive, la température moyenne du côté supérieur est de 33.2 °C / 92 F, par rapport à la moyenne du dispositif de 33.9 °C / 93 F.
(-) En jouant à The Witcher 3, la température moyenne du côté supérieur est de 48.1 °C / 119 F, alors que la moyenne de l'appareil est de 33.9 °C / 93 F.
(-) Les repose-poignets et le pavé tactile peuvent devenir très chauds au toucher, avec un maximum de 43 °C / 109.4# F.
(-) La température moyenne de la zone de l'appui-paume de dispositifs similaires était de 28.8 °C / 83.8 F (-14.2 °C / #-25.6 F).
| MSI Titan GT77 12UHS 4k Intel Core i9-12900HX, NVIDIA GeForce RTX 3080 Ti Laptop GPU | Razer Blade 17 Early 2022 Intel Core i9-12900H, NVIDIA GeForce RTX 3080 Ti Laptop GPU | Alienware x17 R2 P48E Intel Core i9-12900HK, NVIDIA GeForce RTX 3080 Ti Laptop GPU | Schenker XMG Ultra 17 Rocket Lake Intel Core i9-11900K, NVIDIA GeForce RTX 3080 Laptop GPU | MSI Titan GT77 12UHS Intel Core i9-12900HX, NVIDIA GeForce RTX 3080 Ti Laptop GPU | |
|---|---|---|---|---|---|
| Heat | -5% | 11% | 8% | 2% | |
| Maximum Upper Side * (°C) | 49 | 50 -2% | 49.6 -1% | 34 31% | 40.8 17% |
| Maximum Bottom * (°C) | 50 | 56 -12% | 42.4 15% | 43 14% | 52.4 -5% |
| Idle Upper Side * (°C) | 34 | 36 -6% | 29.2 14% | 38 -12% | 34.6 -2% |
| Idle Bottom * (°C) | 38 | 38 -0% | 32 16% | 39 -3% | 38.4 -1% |
* ... Moindre est la valeur, meilleures sont les performances
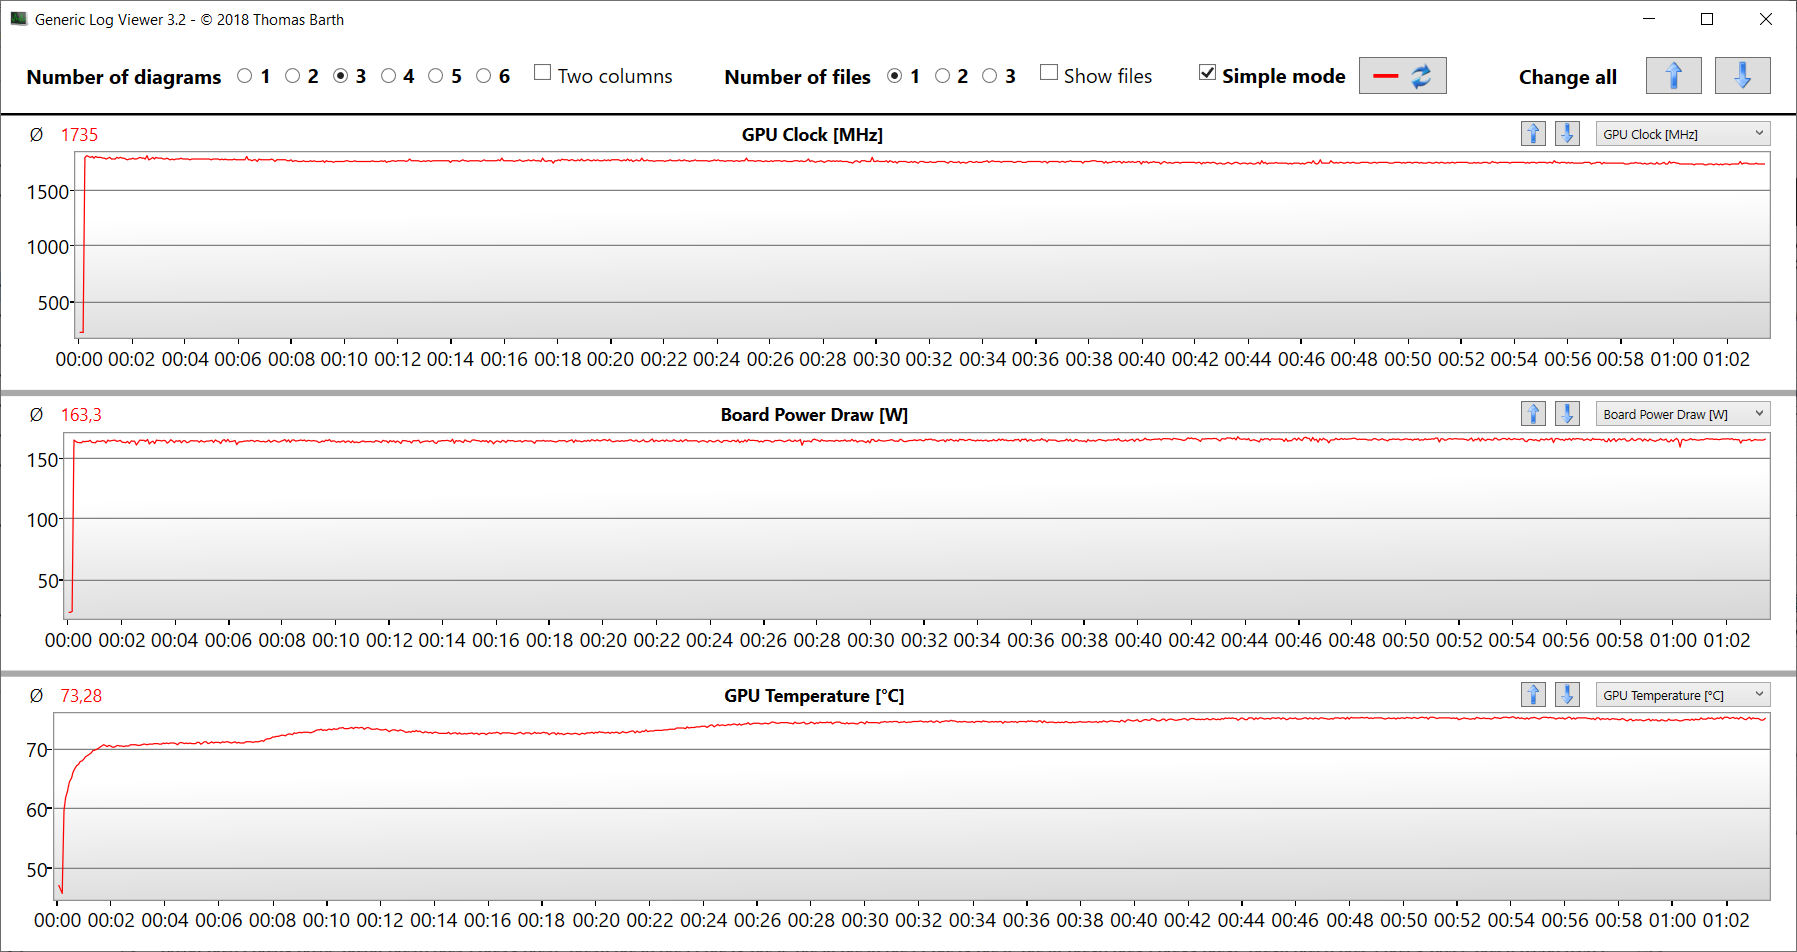
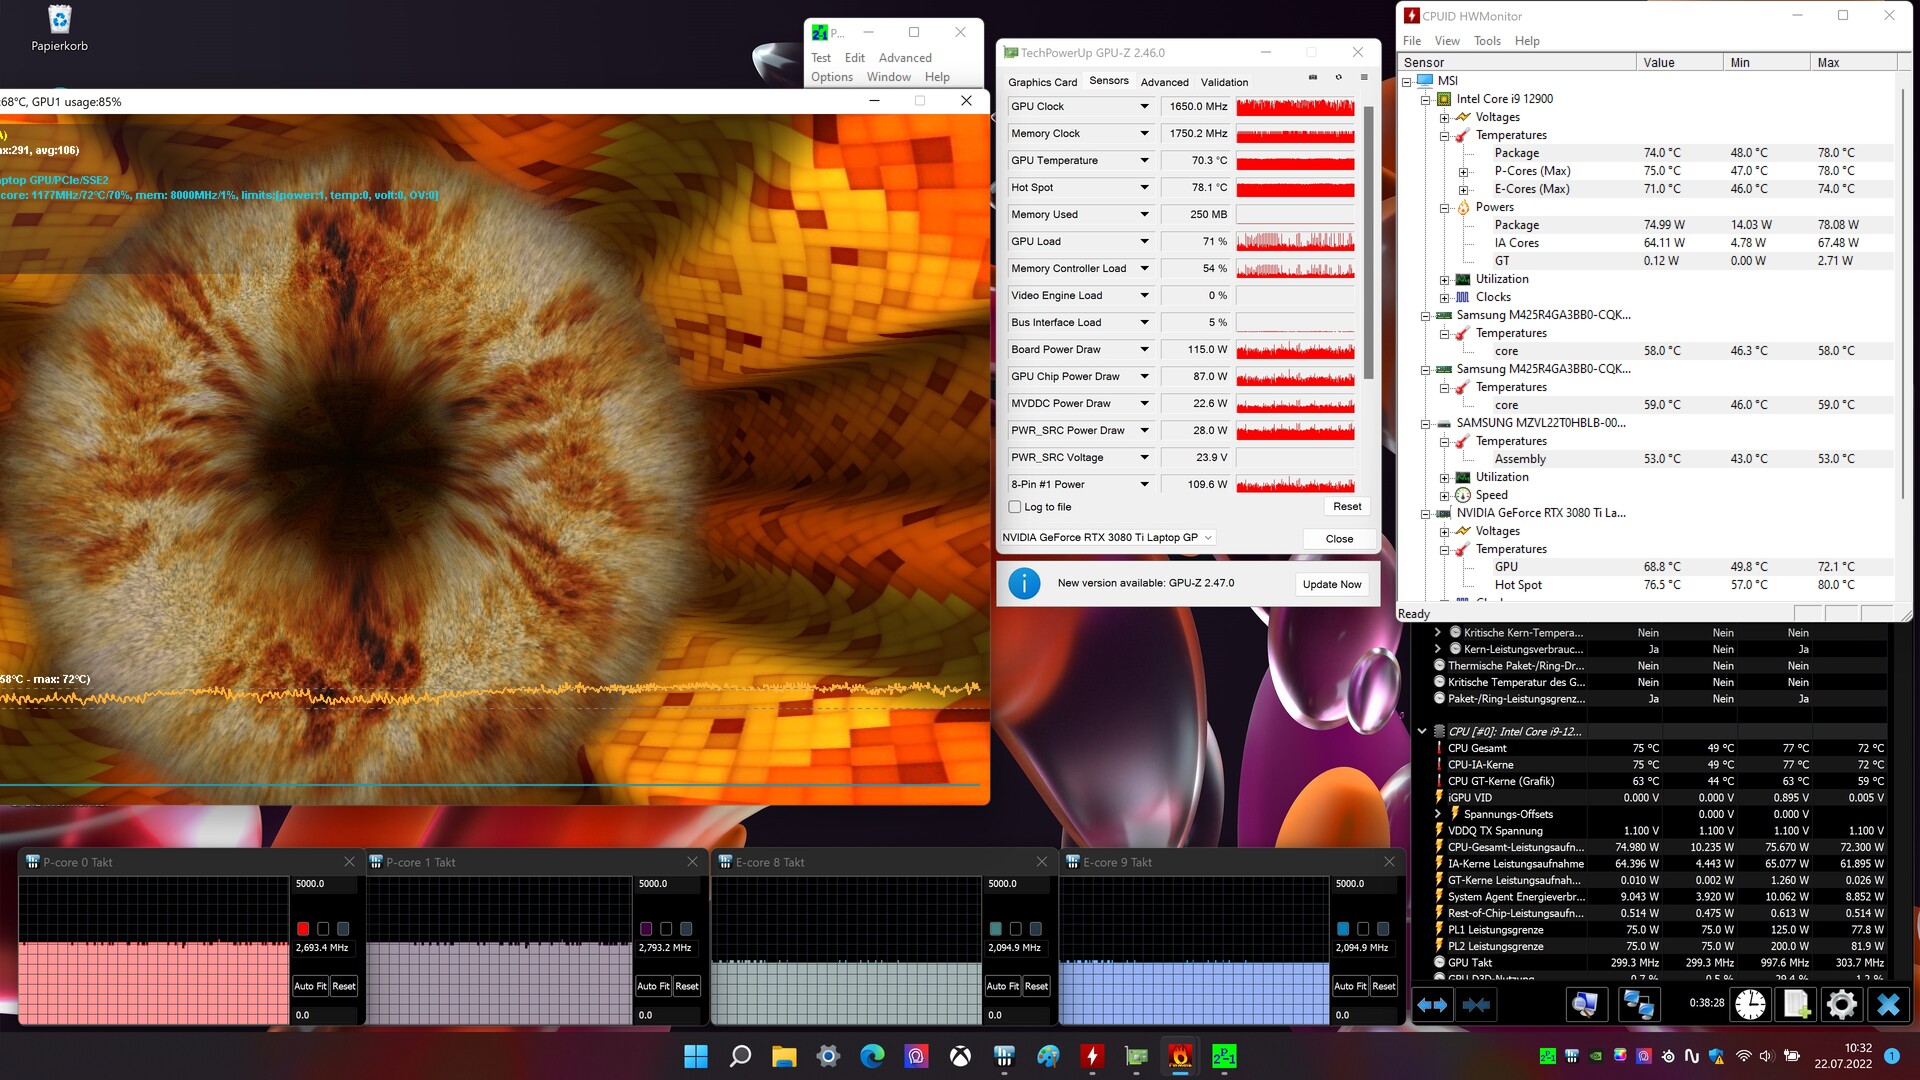
Test de stress
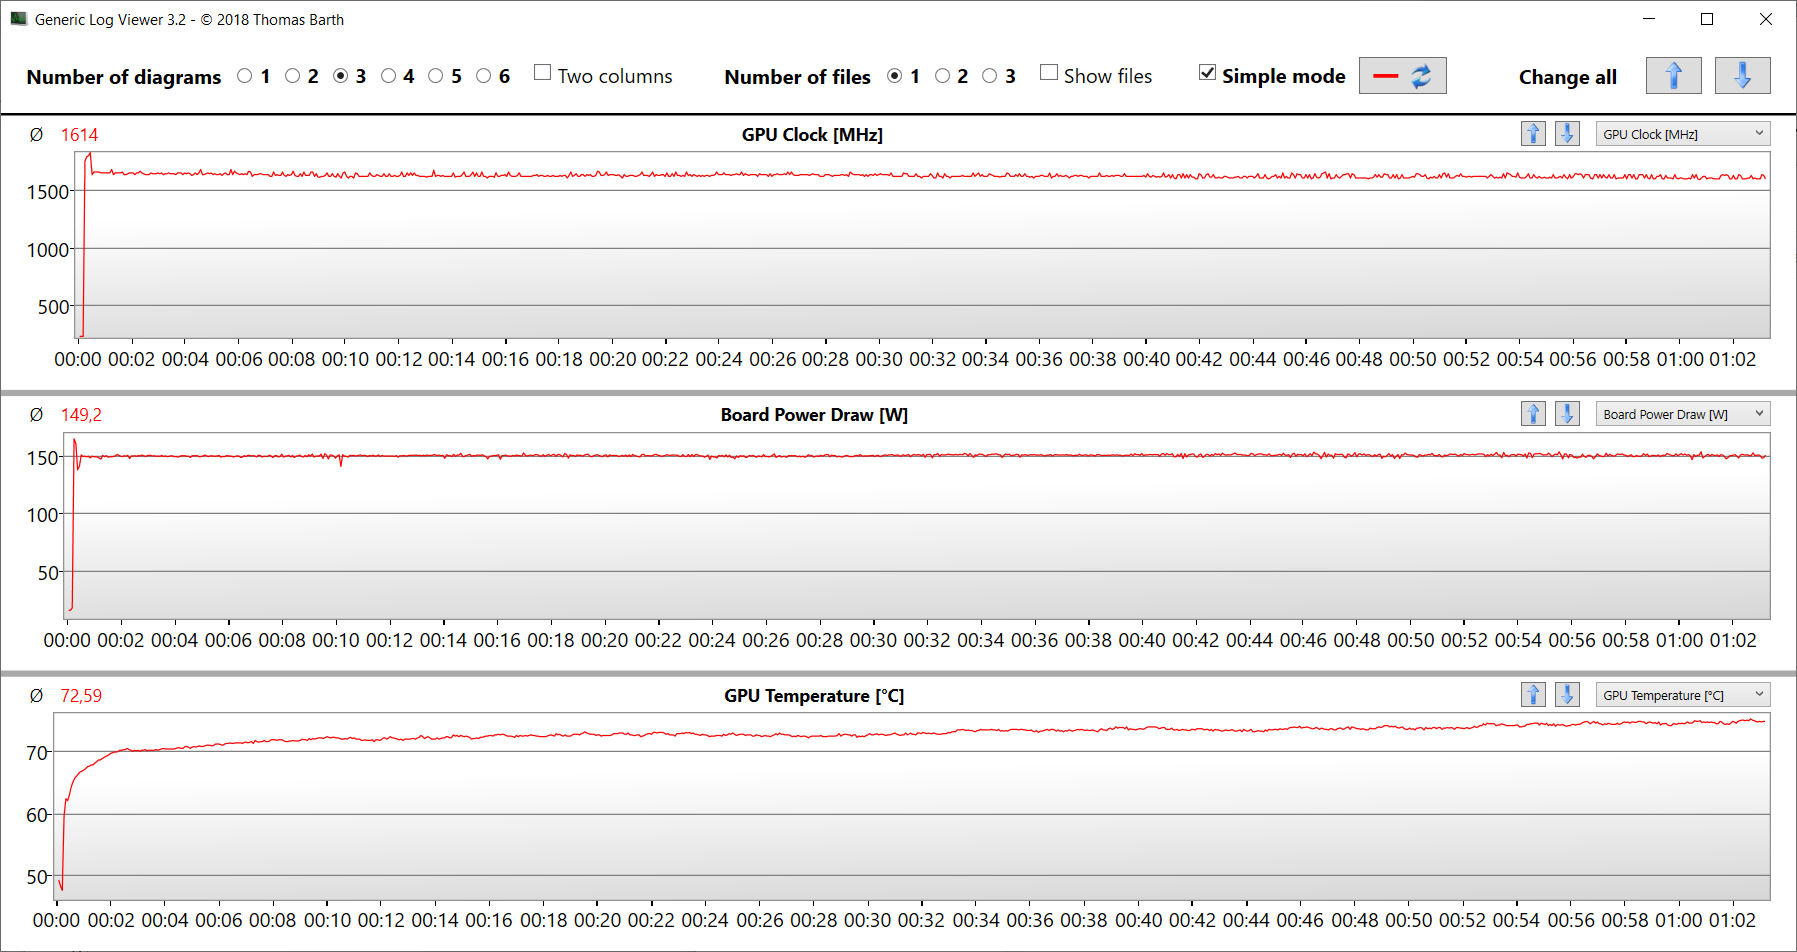
Le processeur a effectué le test de stress (Prime95 et FurMark pendant au moins une heure) à des vitesses de traitement moyennes, tandis que le GPU a pu atteindre sa vitesse d'horloge maximale. Le test de stress représente une situation extrême. Nous effectuons ce test pour vérifier si le système est stable lorsqu'il fonctionne à pleine charge.
Haut-parleurs
MSI Titan GT77 12UHS analyse audio
(+) | les haut-parleurs peuvent jouer relativement fort (91# dB)
Basses 100 - 315 Hz
(±) | basse réduite - en moyenne 13.9% inférieure à la médiane
(±) | la linéarité des basses est moyenne (9.7% delta à la fréquence précédente)
Médiums 400 - 2000 Hz
(+) | médiane équilibrée - seulement 4% de la médiane
(+) | les médiums sont linéaires (3.6% delta à la fréquence précédente)
Aiguës 2 - 16 kHz
(+) | des sommets équilibrés - à seulement 1.8% de la médiane
(+) | les aigus sont linéaires (3.9% delta à la fréquence précédente)
Globalement 100 - 16 000 Hz
(+) | le son global est linéaire (11.4% différence à la médiane)
Par rapport à la même classe
» 9% de tous les appareils testés de cette catégorie étaient meilleurs, 3% similaires, 88% pires
» Le meilleur avait un delta de 6%, la moyenne était de 18%, le pire était de 132%.
Par rapport à tous les appareils testés
» 7% de tous les appareils testés étaient meilleurs, 2% similaires, 90% pires
» Le meilleur avait un delta de 4%, la moyenne était de 23%, le pire était de 134%.
Alienware x17 R2 P48E analyse audio
(+) | les haut-parleurs peuvent jouer relativement fort (84.3# dB)
Basses 100 - 315 Hz
(±) | basse réduite - en moyenne 9.7% inférieure à la médiane
(+) | les basses sont linéaires (5.5% delta à la fréquence précédente)
Médiums 400 - 2000 Hz
(+) | médiane équilibrée - seulement 1.6% de la médiane
(+) | les médiums sont linéaires (3% delta à la fréquence précédente)
Aiguës 2 - 16 kHz
(±) | sommets plus élevés - en moyenne 5% plus élevés que la médiane
(±) | la linéarité des aigus est moyenne (7.6% delta à la fréquence précédente)
Globalement 100 - 16 000 Hz
(+) | le son global est linéaire (9.3% différence à la médiane)
Par rapport à la même classe
» 3% de tous les appareils testés de cette catégorie étaient meilleurs, 2% similaires, 95% pires
» Le meilleur avait un delta de 6%, la moyenne était de 18%, le pire était de 132%.
Par rapport à tous les appareils testés
» 3% de tous les appareils testés étaient meilleurs, 1% similaires, 96% pires
» Le meilleur avait un delta de 4%, la moyenne était de 23%, le pire était de 134%.
Gestion de l'énergie - L'ordinateur portable MSI offre une autonomie décente
Consommation électrique
La consommation d'énergie de l'ordinateur portable se situe dans la fourchette normale pour le matériel qu'il contient. Pendant le test Witcher 3 et le test de stress, sa consommation d'énergie a augmenté pour atteindre une moyenne de 236 watts et une pointe de 309 watts. L'appareil a utilisé une quantité constante d'énergie pendant les deux tests
Remarque : Le Modèle FHDa été testé avec le mode dGPU actif. Cela explique pourquoi il a consommé plus d'énergie en mode veille.
| Éteint/en veille | |
| Au repos | |
| Fortement sollicité |
|
Légende:
min: | |
| MSI Titan GT77 12UHS i9-12900HX, GeForce RTX 3080 Ti Laptop GPU | Razer Blade 17 Early 2022 i9-12900H, GeForce RTX 3080 Ti Laptop GPU | Alienware x17 R2 P48E i9-12900HK, GeForce RTX 3080 Ti Laptop GPU | Schenker XMG Ultra 17 Rocket Lake i9-11900K, GeForce RTX 3080 Laptop GPU | MSI Titan GT77 12UHS i9-12900HX, GeForce RTX 3080 Ti Laptop GPU | Moyenne NVIDIA GeForce RTX 3080 Ti Laptop GPU | Moyenne de la classe Gaming | |
|---|---|---|---|---|---|---|---|
| Power Consumption | -7% | -44% | -146% | -41% | -10% | 8% | |
| Idle Minimum * (Watt) | 12 | 17 -42% | 24.1 -101% | 62 -417% | 30.21 -152% | 17.2 ? -43% | 13 ? -8% |
| Idle Average * (Watt) | 18 | 23 -28% | 28.5 -58% | 64 -256% | 32.42 -80% | 23.3 ? -29% | 19 ? -6% |
| Idle Maximum * (Watt) | 30 | 34 -13% | 60 -100% | 69 -130% | 33.7 -12% | 30.8 ? -3% | 24.6 ? 18% |
| Load Average * (Watt) | 141 | 120 15% | 128.7 9% | 183 -30% | 125.09 11% | 121.2 ? 14% | 110.7 ? 21% |
| Witcher 3 ultra * (Watt) | 236 | 229 3% | 254 -8% | 297 -26% | 256 -8% | ||
| Load Maximum * (Watt) | 309 | 243 21% | 323 -5% | 368 -19% | 321.88 -4% | 276 ? 11% | 259 ? 16% |
* ... Moindre est la valeur, meilleures sont les performances
Power consumption Witcher 3 / stress test
Power consumption with external monitor
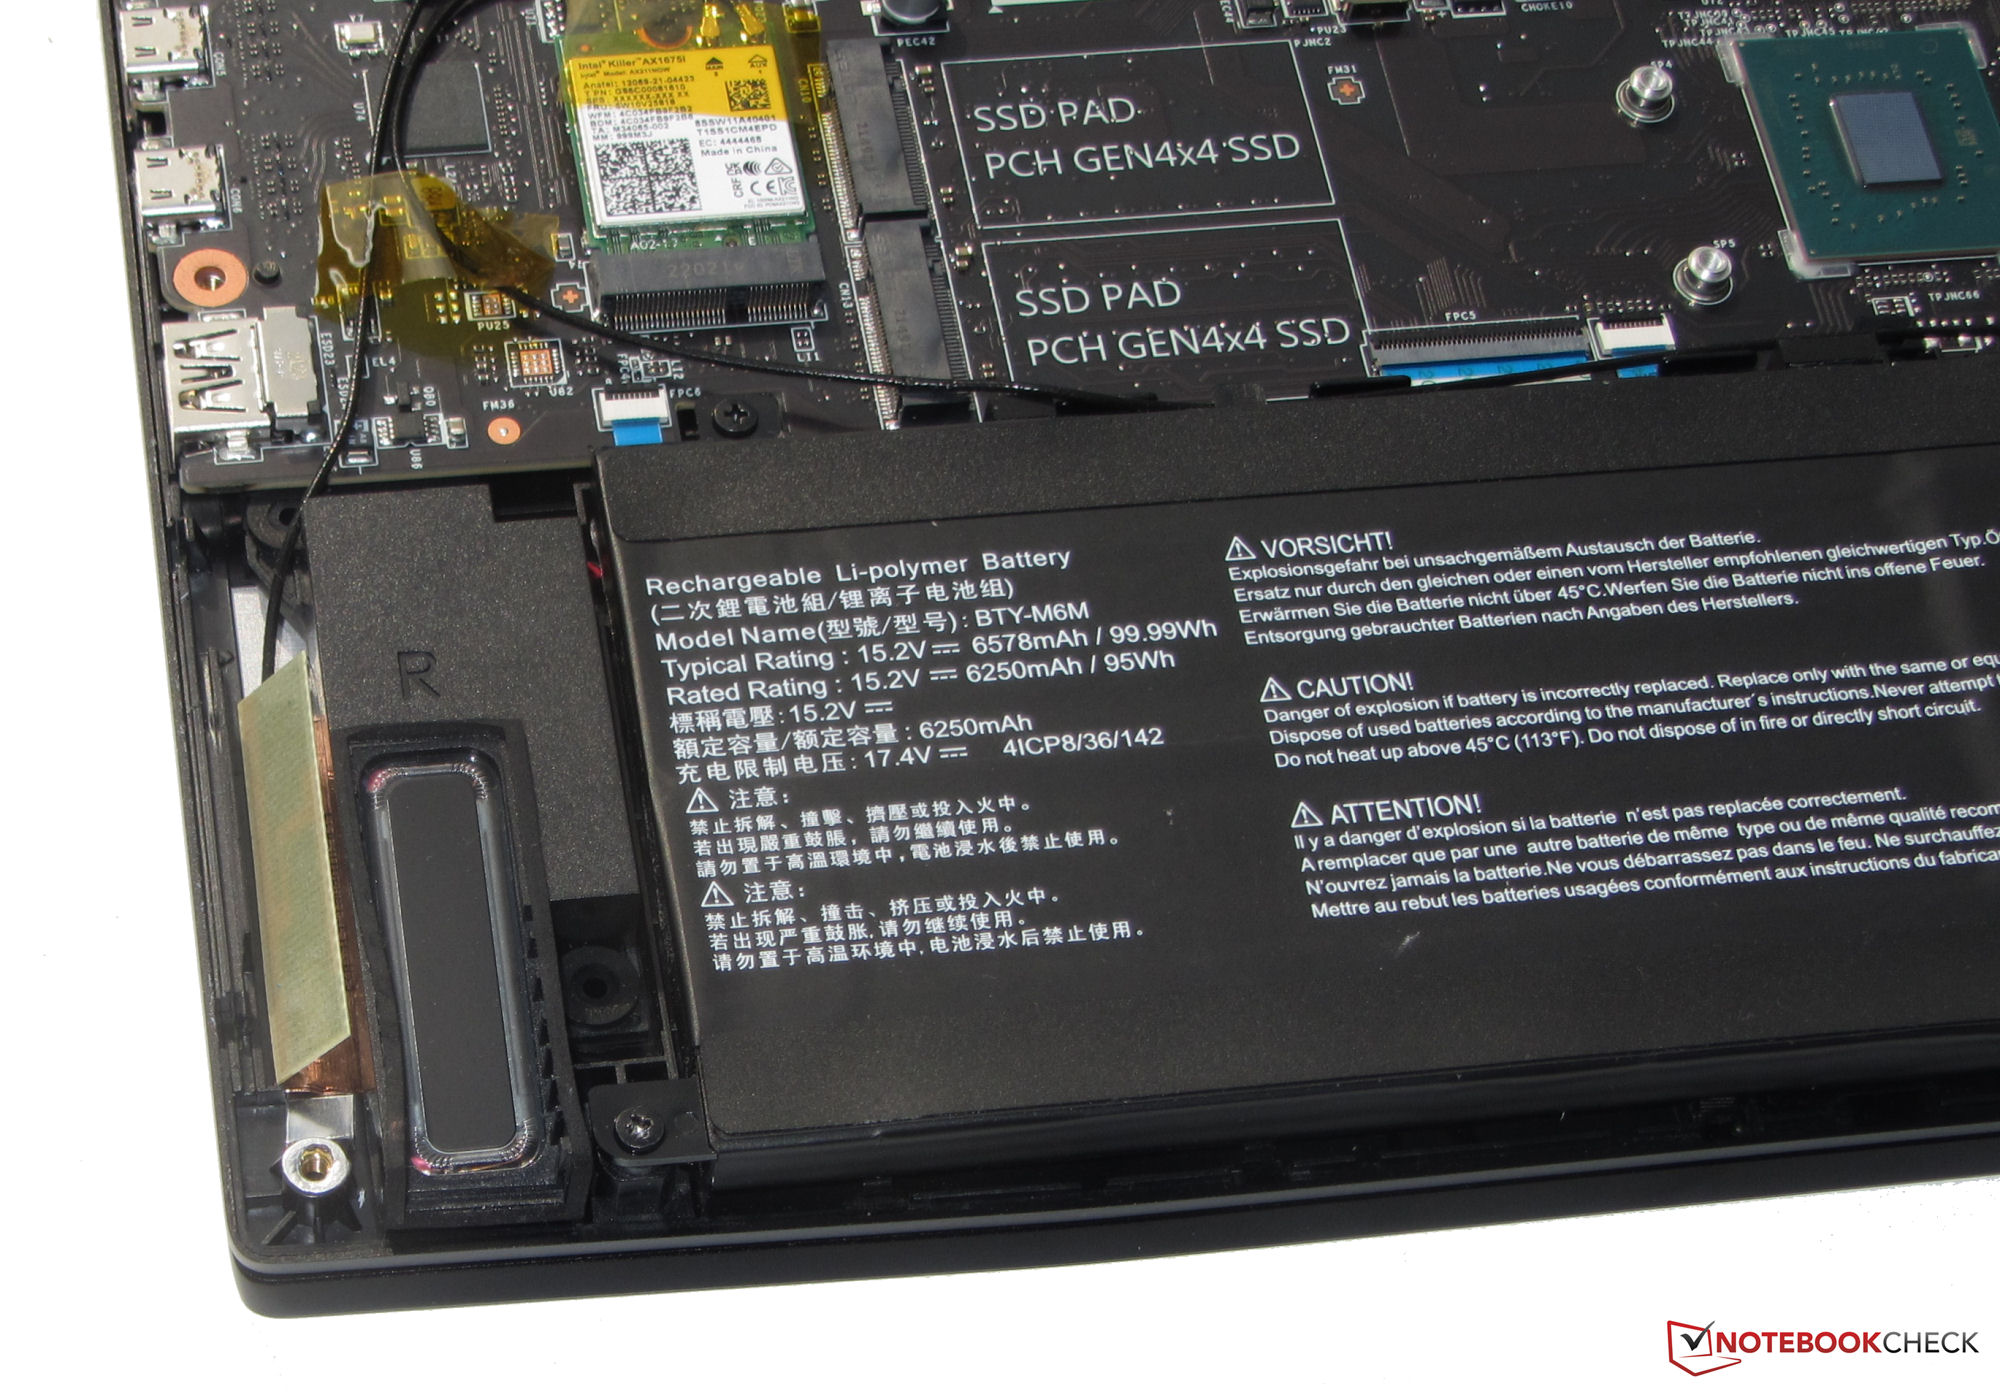
Durée de vie de la batterie
Pour notre test Wi-Fi (visite automatique de sites Web à l'aide d'un script) et notre test vidéo (lecture en boucle du court-métrage Big Buck Bunny (encodage H.264, FHD)), l'ordinateur portable de 17,3 pouces a réussi à fonctionner pendant 5 h 52 et 6 h 50 respectivement. Le site Modèle frère FHDa duré légèrement plus longtemps en raison de sa résolution d'écran inférieure.
| MSI Titan GT77 12UHS 4k i9-12900HX, GeForce RTX 3080 Ti Laptop GPU, 99.99 Wh | Razer Blade 17 Early 2022 i9-12900H, GeForce RTX 3080 Ti Laptop GPU, 82 Wh | Alienware x17 R2 P48E i9-12900HK, GeForce RTX 3080 Ti Laptop GPU, 87 Wh | Schenker XMG Ultra 17 Rocket Lake i9-11900K, GeForce RTX 3080 Laptop GPU, 97 Wh | MSI Titan GT77 12UHS i9-12900HX, GeForce RTX 3080 Ti Laptop GPU, 99.9 Wh | Moyenne de la classe Gaming | |
|---|---|---|---|---|---|---|
| Autonomie de la batterie | -16% | -55% | -58% | 5% | 11% | |
| Reader / Idle (h) | 8.2 | 7.1 -13% | 3.9 -52% | 3 -63% | 8.27 ? 1% | |
| H.264 (h) | 6.8 | 4.8 -29% | 1.9 -72% | 7.2 6% | 8.32 ? 22% | |
| WiFi v1.3 (h) | 5.9 | 3.8 -36% | 2 -66% | 1.8 -69% | 6.9 17% | 7.11 ? 21% |
| Load (h) | 1.5 | 1.7 13% | 0.8 -47% | 1.1 -27% | 1.4 -7% | 1.502 ? 0% |
| Witcher 3 ultra (h) | 1.5 |
Points positifs
Points négatifs
Verdict - Encore mieux avec un écran 4K
Avec le Titan GT77, MSI propose l'un des ordinateurs portables DTR les plus performants du moment. Il est conçu pour les scénarios d'utilisation qui nécessitent une puissance de calcul intensive et une grande quantité de RAM, comme le rendu et les jeux.
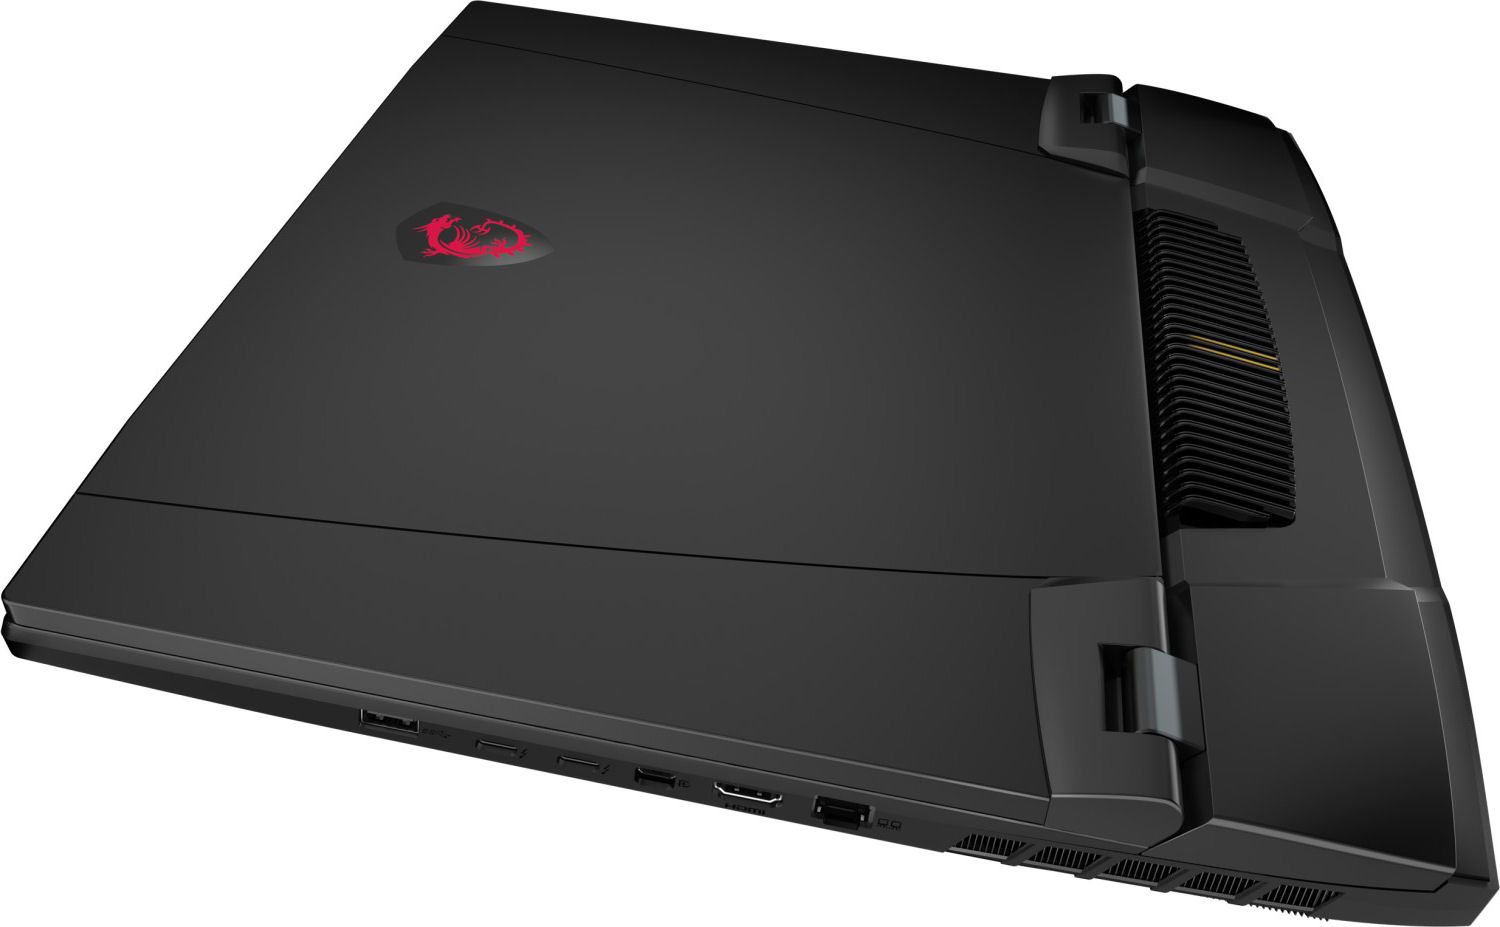
Le MSI Titan GT77 - l'un des ordinateurs portables les plus performants du moment.
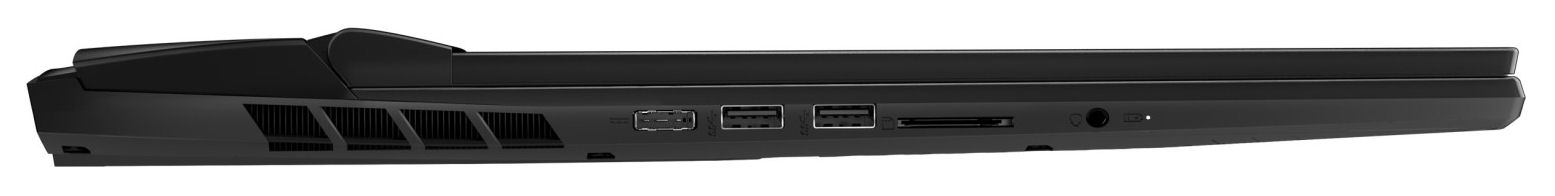
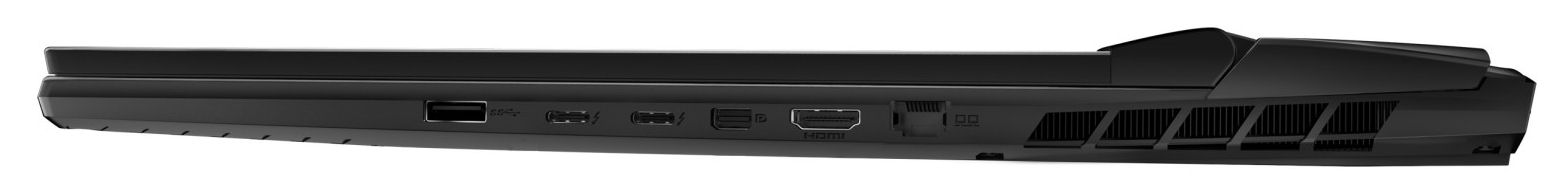
Le site Core i9-12900HX et GeForce Ordinateur portable RTX 3080 Ti (175 watts TGP, 16 Go de VRAM) sont capables de fonctionner de manière constante à des vitesses d'horloge élevées. L'ordinateur portable génère pas mal de chaleur et de bruit, ce qui est typique de cette catégorie de matériel. Les deux ports Thunderbolt 4 offrent des possibilités d'extension (par exemple, GPU externe, solutions d'accueil). En outre, l'ordinateur portable dispose d'un clavier mécanique bien conçu et d'une autonomie de batterie très décente. Ce sont toutes des choses que cette variante actuelle partage avec son modèle frère que nous avons examiné précédemment.
L'écran est la principale différence entre les deux modèles Titan : la dalle 4K (120 Hz) du modèle actuel est supérieure à la dalle FHD (360 Hz) de l'autre modèle en termes de résolution, de luminosité maximale et de couverture des couleurs (presque 100 % DCI-P3). Il s'agit donc de la meilleure option si la précision des couleurs est importante pour vous. L'écran FHD, quant à lui, offre un taux de rafraîchissement très élevé et devrait pouvoir faire le bonheur de nombreux joueurs. Malheureusement, les deux écrans manquent de contraste.
Le Alienware x17 R2 est une alternative valable à la Titan en termes de performances. Cependant, il propose moins d'options d'extension et offre une moins bonne autonomie
Prix et disponibilité
Le MSI Titan GT77 12UHS est disponible chez des détaillants tels que Amazon.com. La configuration que nous avons examinée est vendue à environ 5 600 euros (5 980 dollars).
MSI Titan GT77 12UHS
- 08/28/2022 v7 (old)
Sascha Mölck
Price comparison

