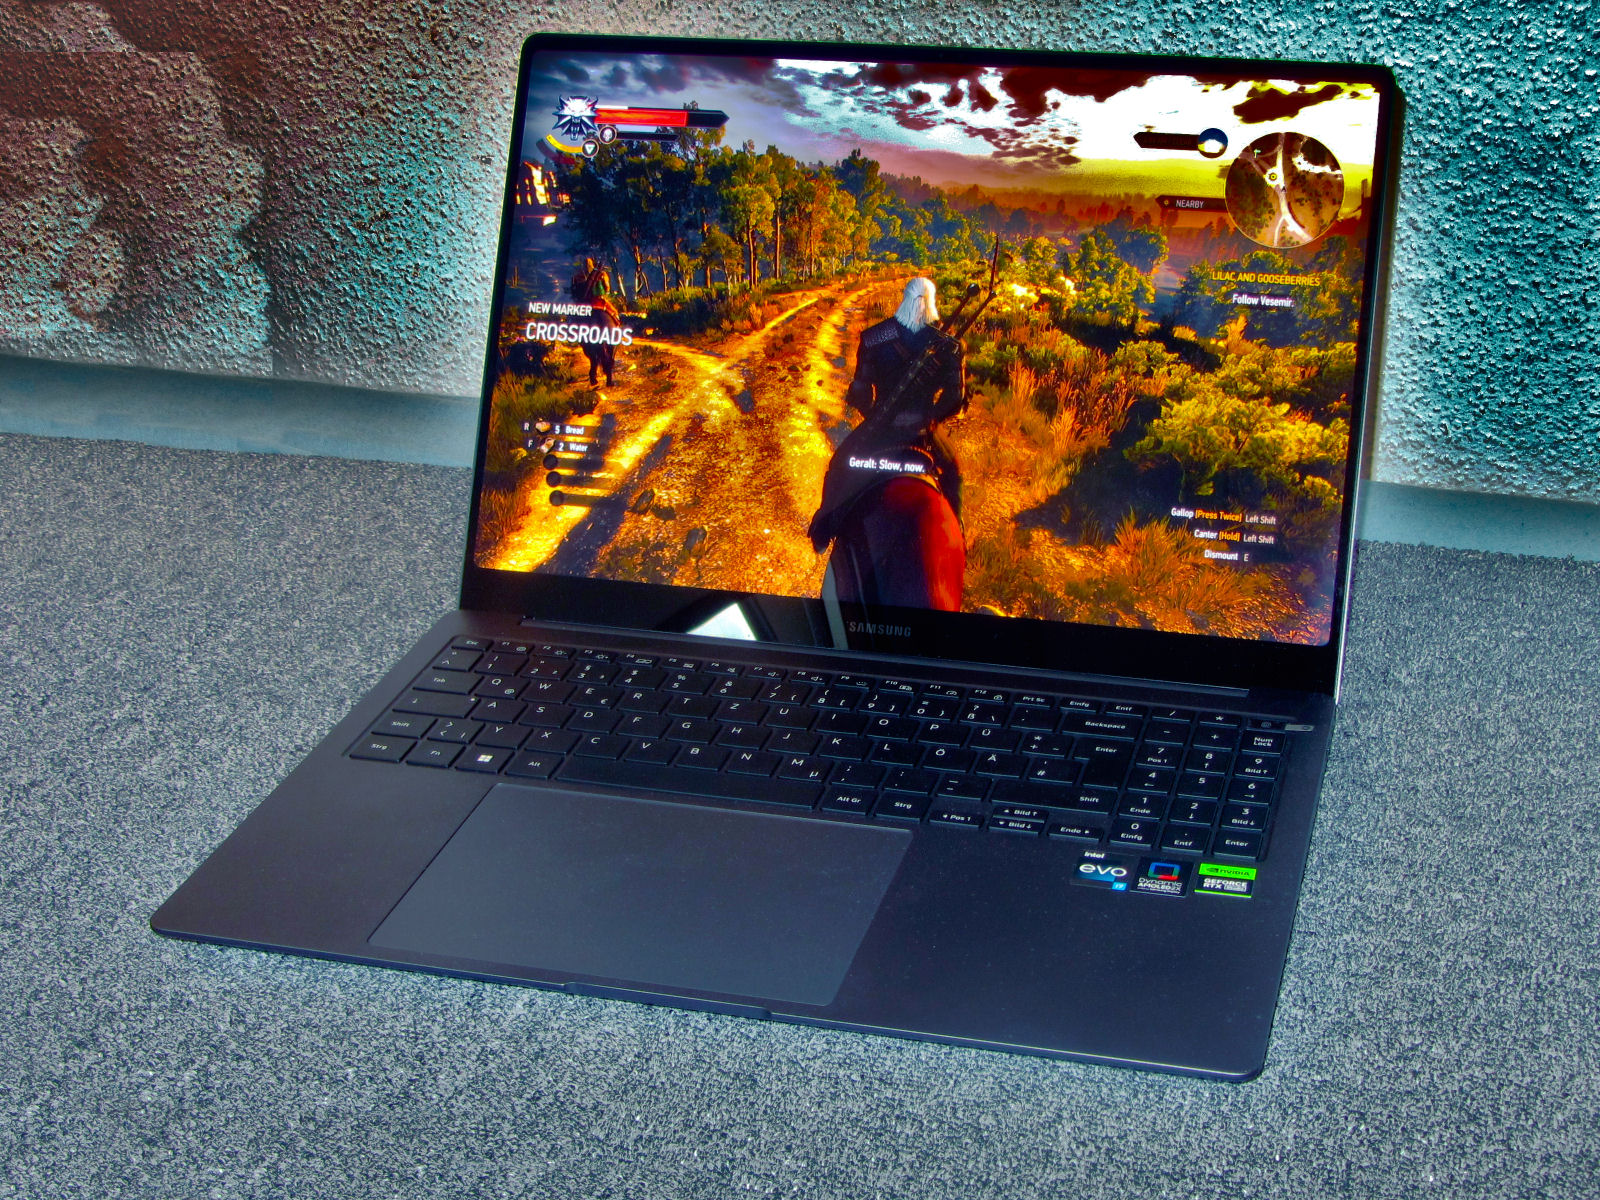
Test du Samsung Galaxy Book3 Ultra 16 : un ultrabook de 16 pouces endurant avec RTX 4050

Avec le Galaxy Book 3 Ultra 16, Samsung présente une combinaison d'ordinateur portable de jeu, de station de travail et d'ordinateur portable pour les travailleurs créatifs, en mettant l'accent sur la mobilité, l'ergonomie et la faible consommation d'énergie. Il n'est pas nécessaire d'avoir des performances élevées : leCore i7-13700H et la GeForce RTX 4050 sont ralenties par des limites de puissance conservatrices, à savoir un faible TGP (60 watts). Un bloc d'alimentation de 100 watts couvre toutes les exigences matérielles.
Parmi les concurrents, on trouve des appareils tels que leSchenker Vision 16 Prole LG Gram 17le Dell XPS 15 9520l'Asus VivoBook Pro 16X Asus VivoBook Pro 16X OLEDle Acer Swift X SFX16-52G et le Lenovo ThinkBook 16p G3 ARH.
Comparaison avec les concurrents potentiels
Note | Date | Modèle | Poids | Épaisseur | Taille | Résolution | Prix |
|---|---|---|---|---|---|---|---|
| 89.4 % v7 (old) | 04/23 | Samsung Galaxy Book3 Ultra 16 i7-13700H, GeForce RTX 4050 Laptop GPU | 1.8 kg | 16.5 mm | 16.00" | 2880x1800 | |
| 87.8 % v7 (old) | 11/22 | Schenker Vision 16 Pro RTX 3070 Ti i7-12700H, GeForce RTX 3070 Ti Laptop GPU | 1.7 kg | 17.1 mm | 16.00" | 2560x1600 | |
| 86.4 % v7 (old) | 03/23 | LG Gram 17Z90Q-E.AD78G i7-1260P, GeForce RTX 2050 Mobile | 1.4 kg | 17.8 mm | 17.00" | 2560x1600 | |
| 87.9 % v7 (old) | 10/22 | Lenovo ThinkBook 16p G3 ARH R9 6900HX, GeForce RTX 3060 Laptop GPU | 2.1 kg | 19.5 mm | 16.00" | 2560x1600 | |
| 89.5 % v7 (old) | 05/22 | Dell XPS 15 9520 RTX 3050 Ti i7-12700H, GeForce RTX 3050 Ti Laptop GPU | 1.9 kg | 18 mm | 15.60" | 3456x2160 | |
| 83.7 % v7 (old) | 11/22 | Asus VivoBook Pro 16X OLED N7600PC-L2026X i7-11370H, GeForce RTX 3050 4GB Laptop GPU | 2 kg | 18.9 mm | 16.00" | 3840x2400 | |
| 86.4 % v7 (old) | 11/22 | Acer Swift X SFX16-52G-77RX i7-1260P, A370M | 1.8 kg | 21.2 mm | 16.00" | 2560x1600 |
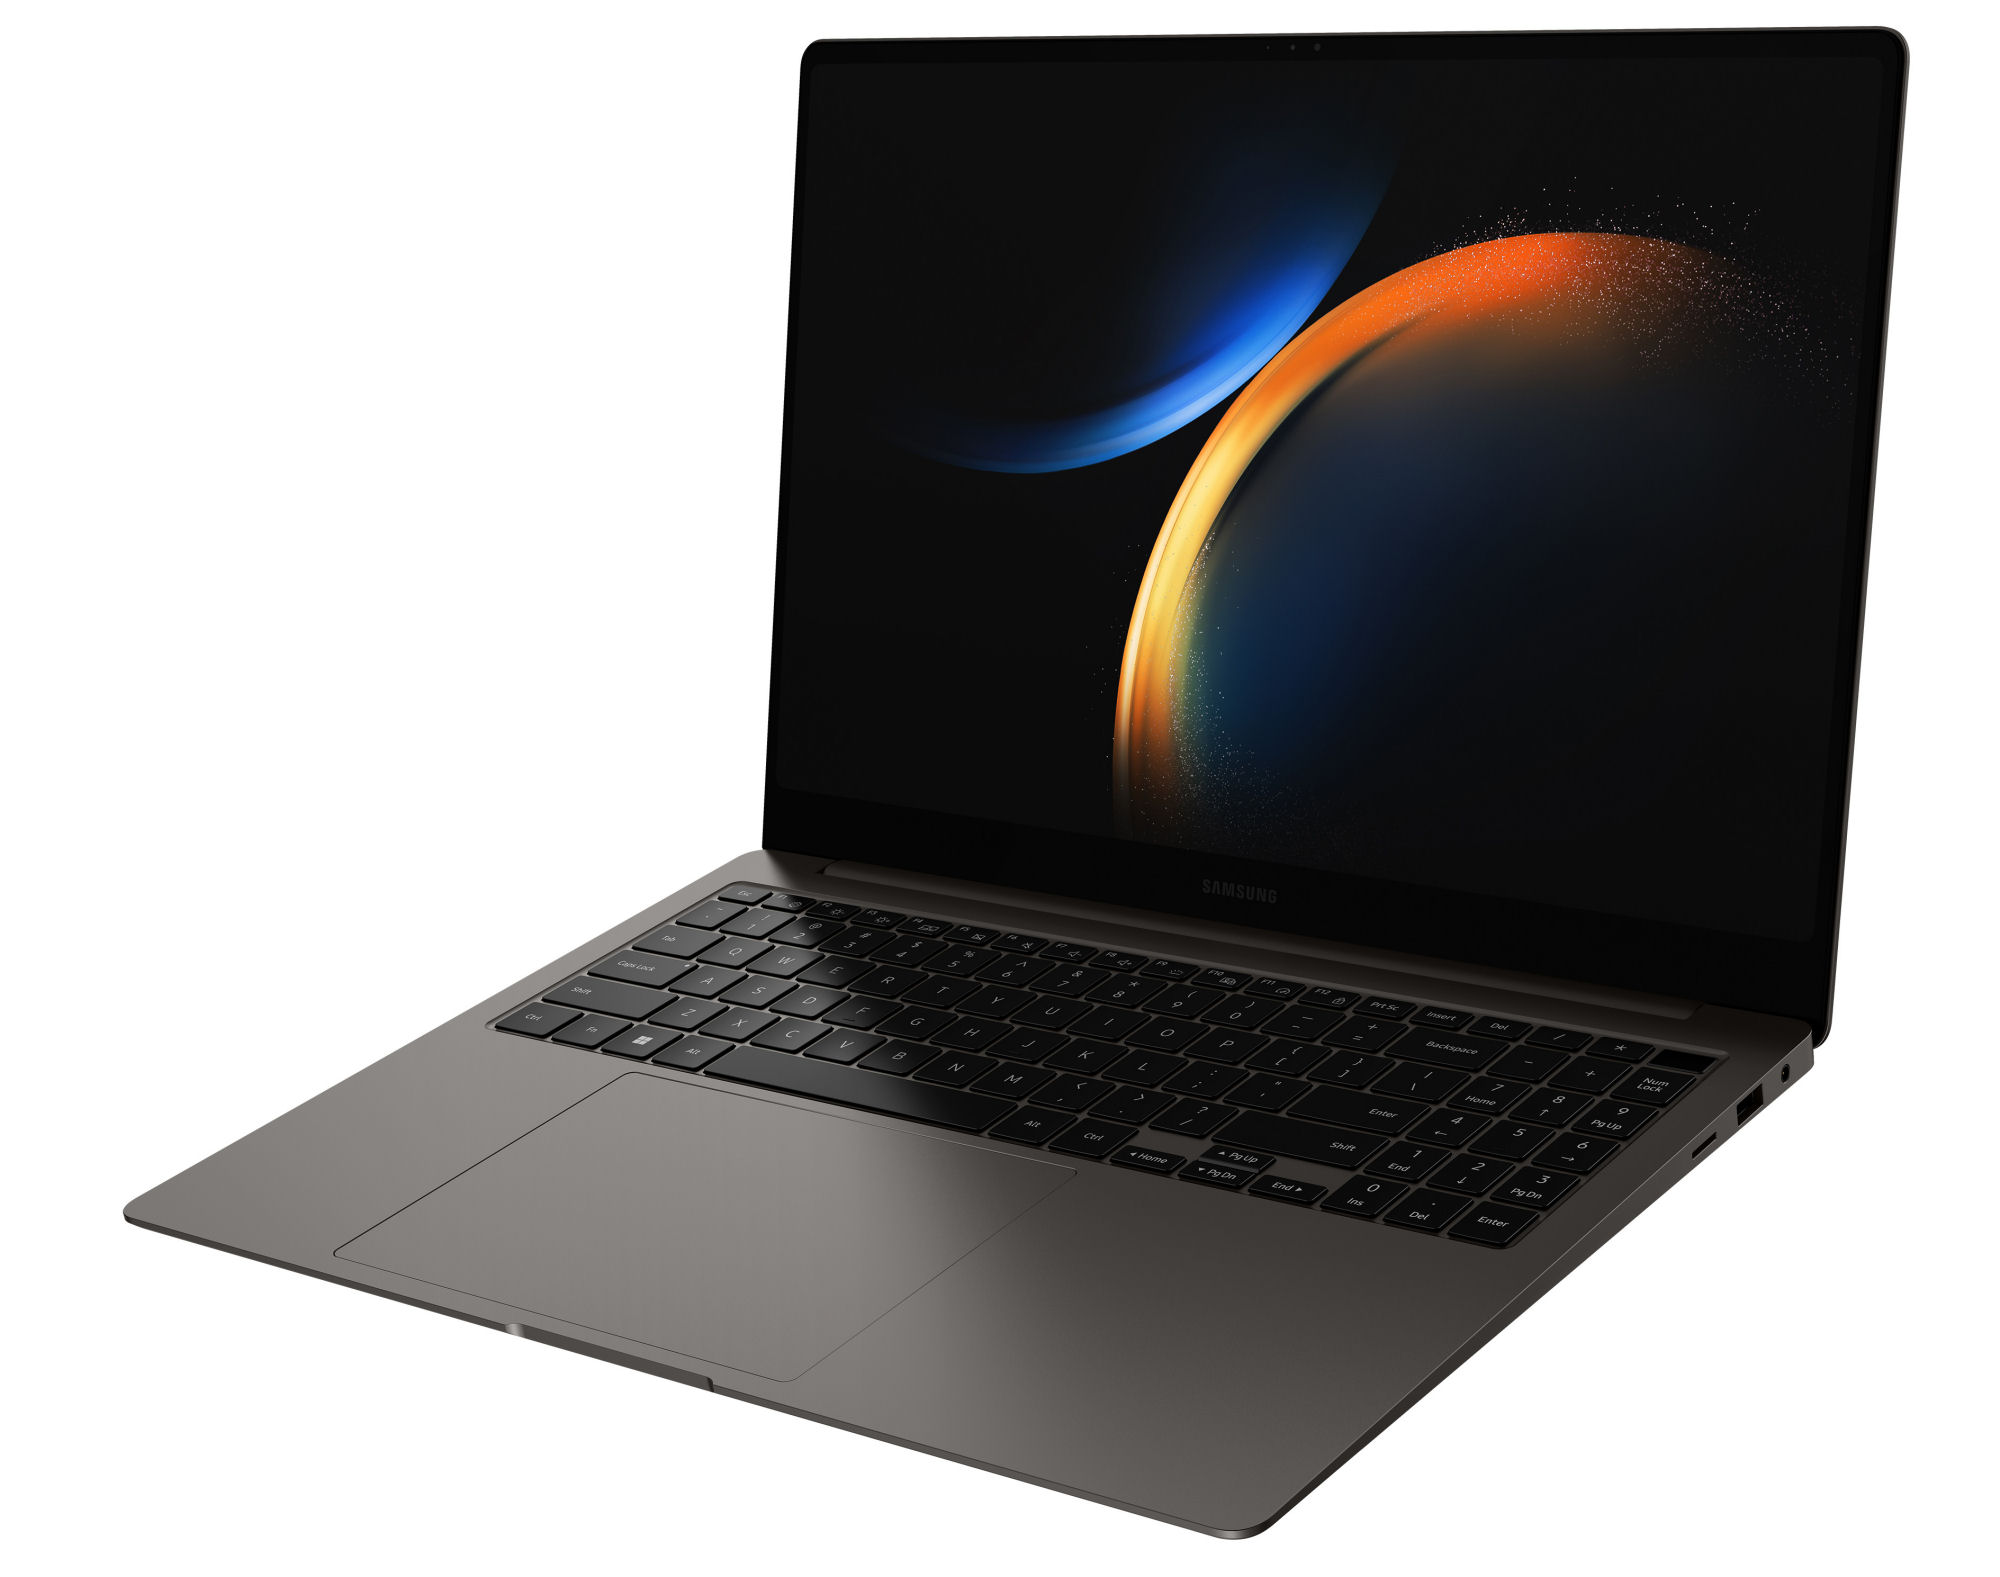
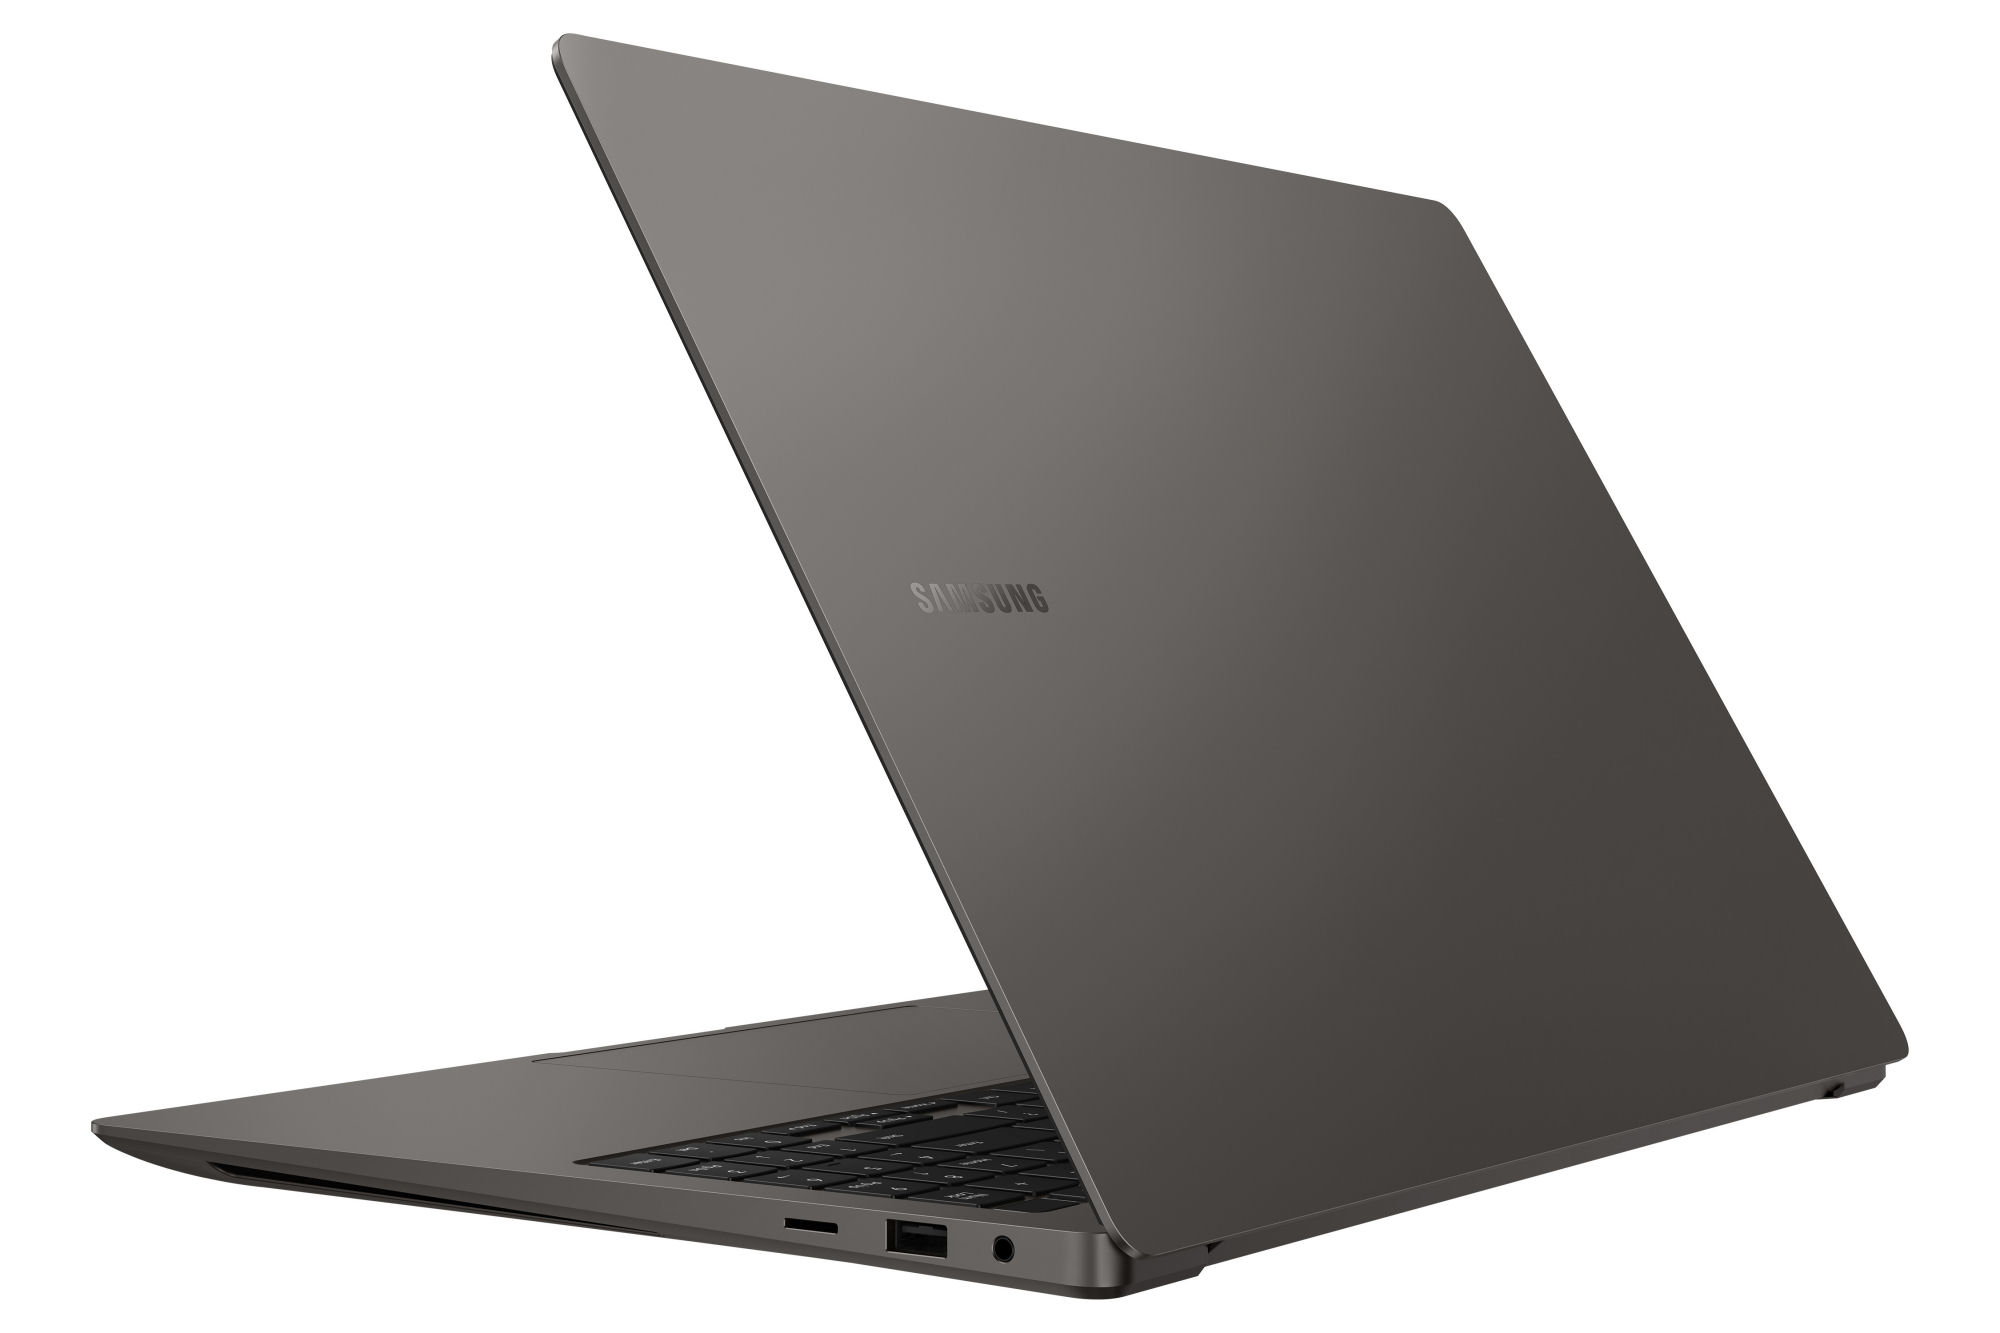
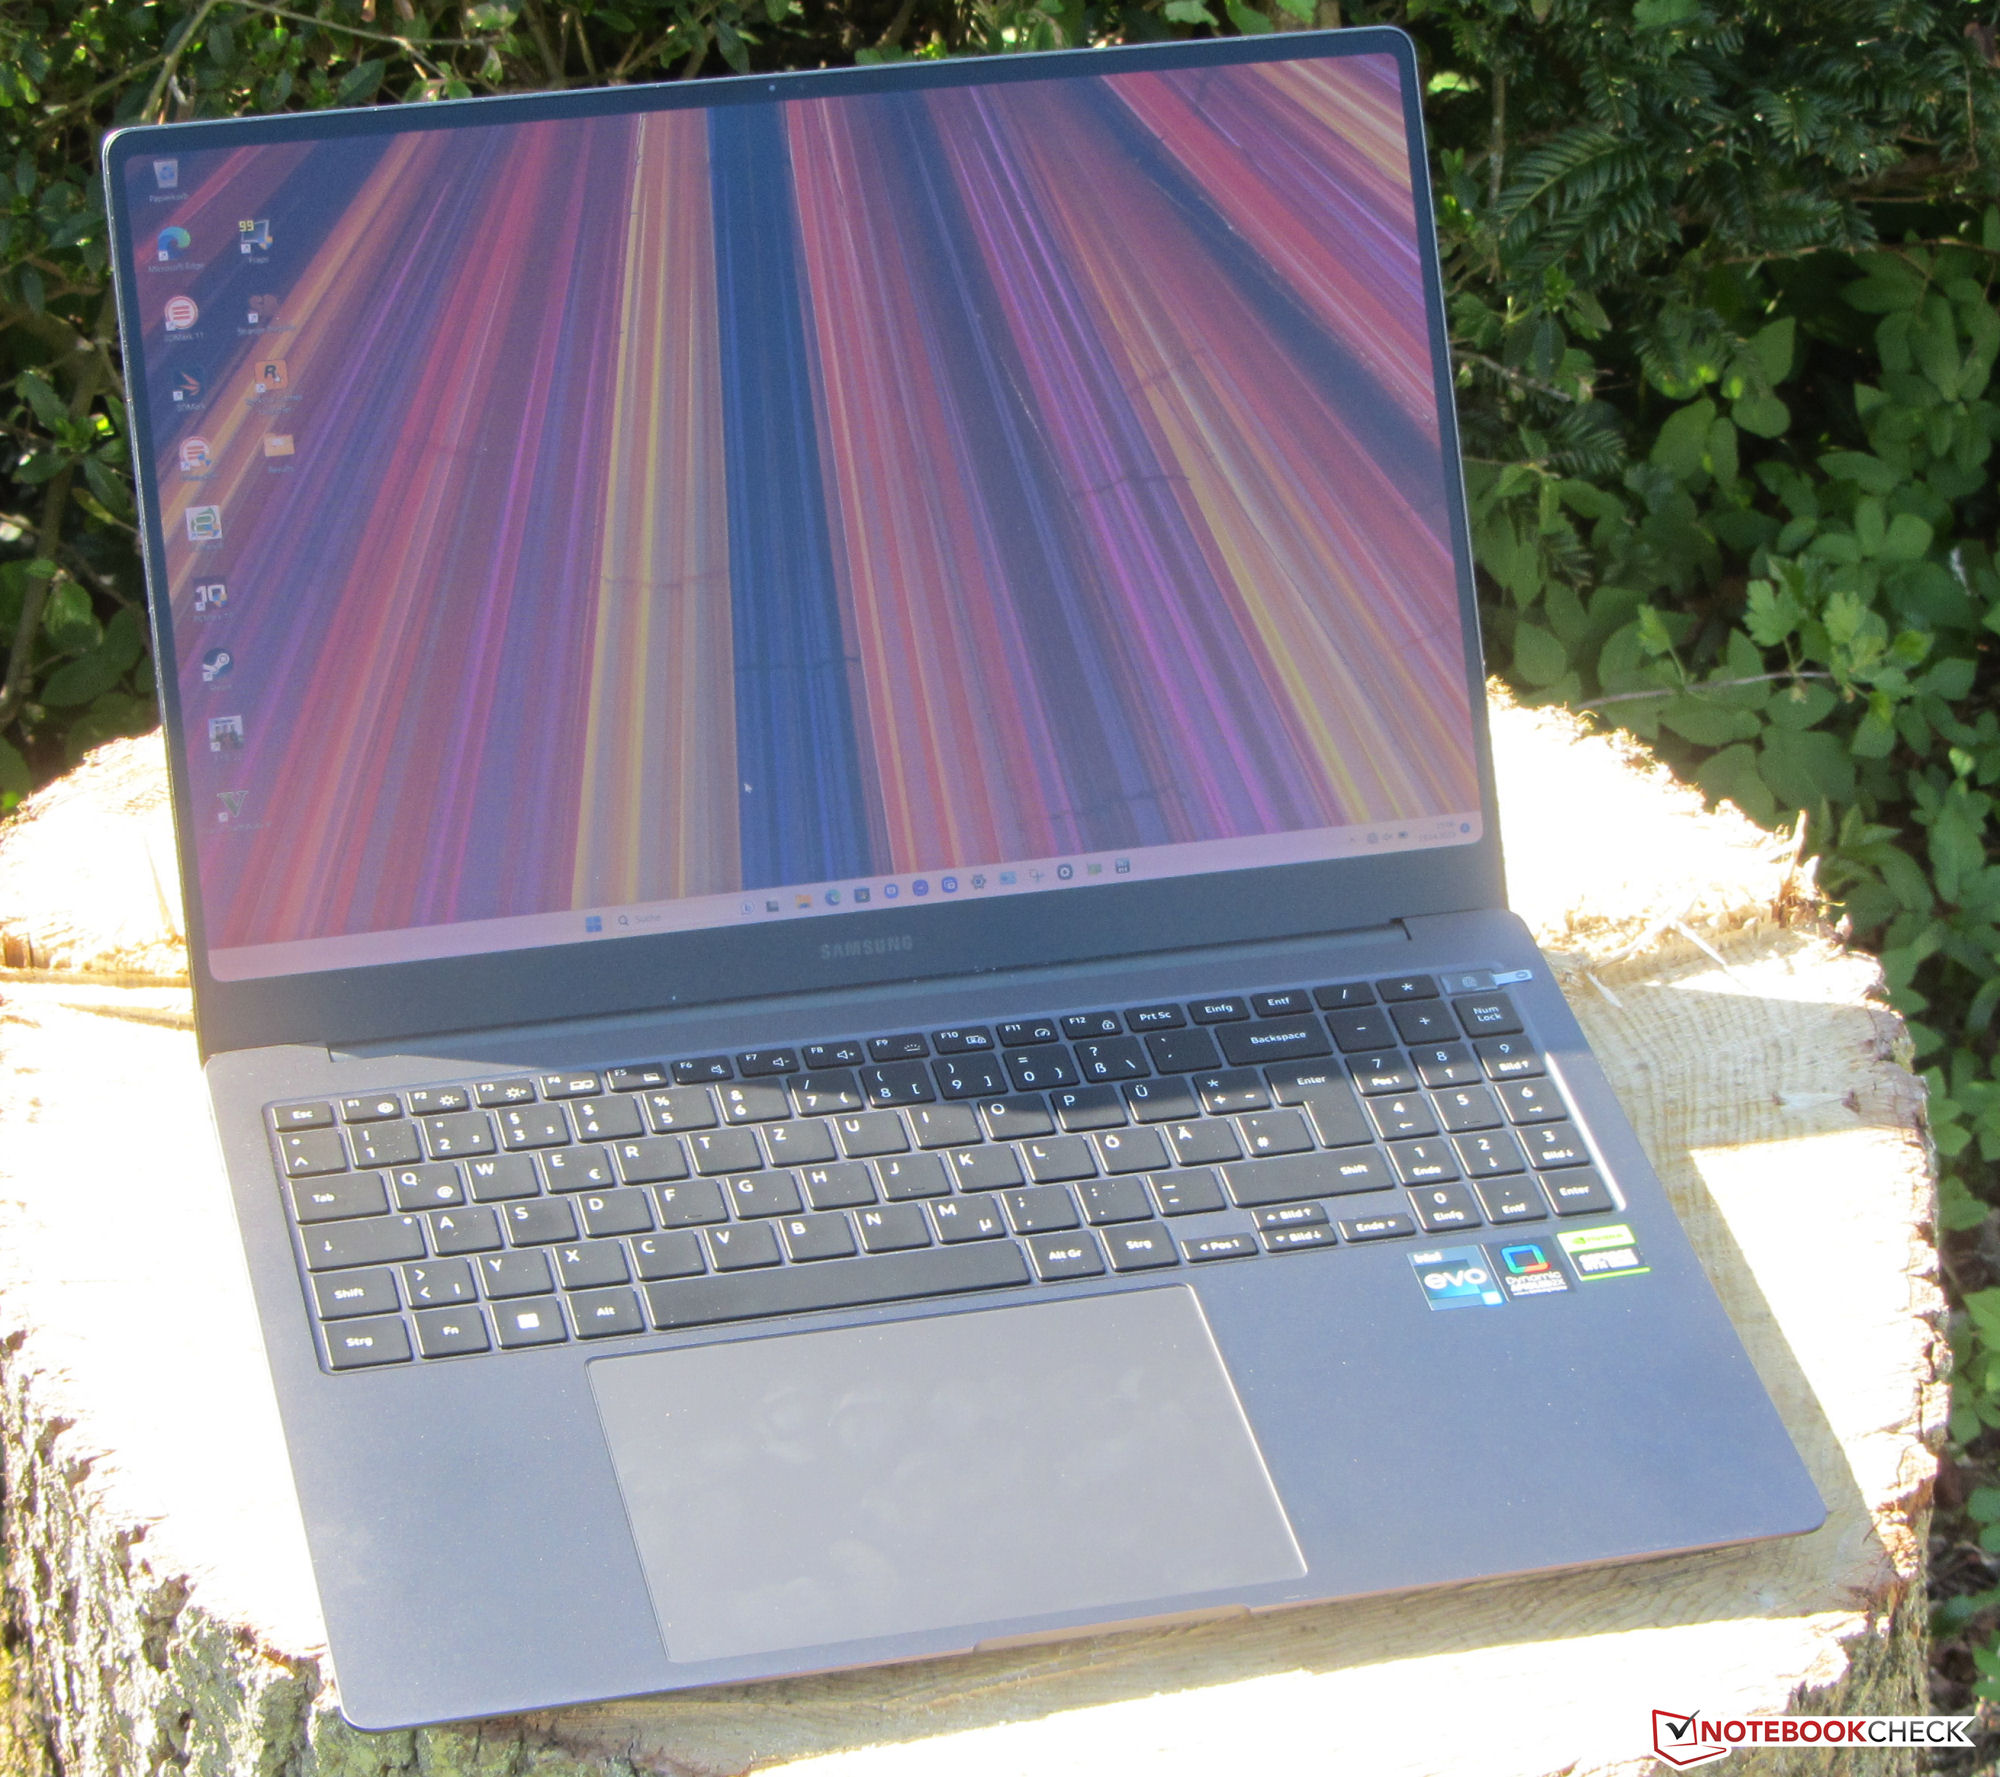
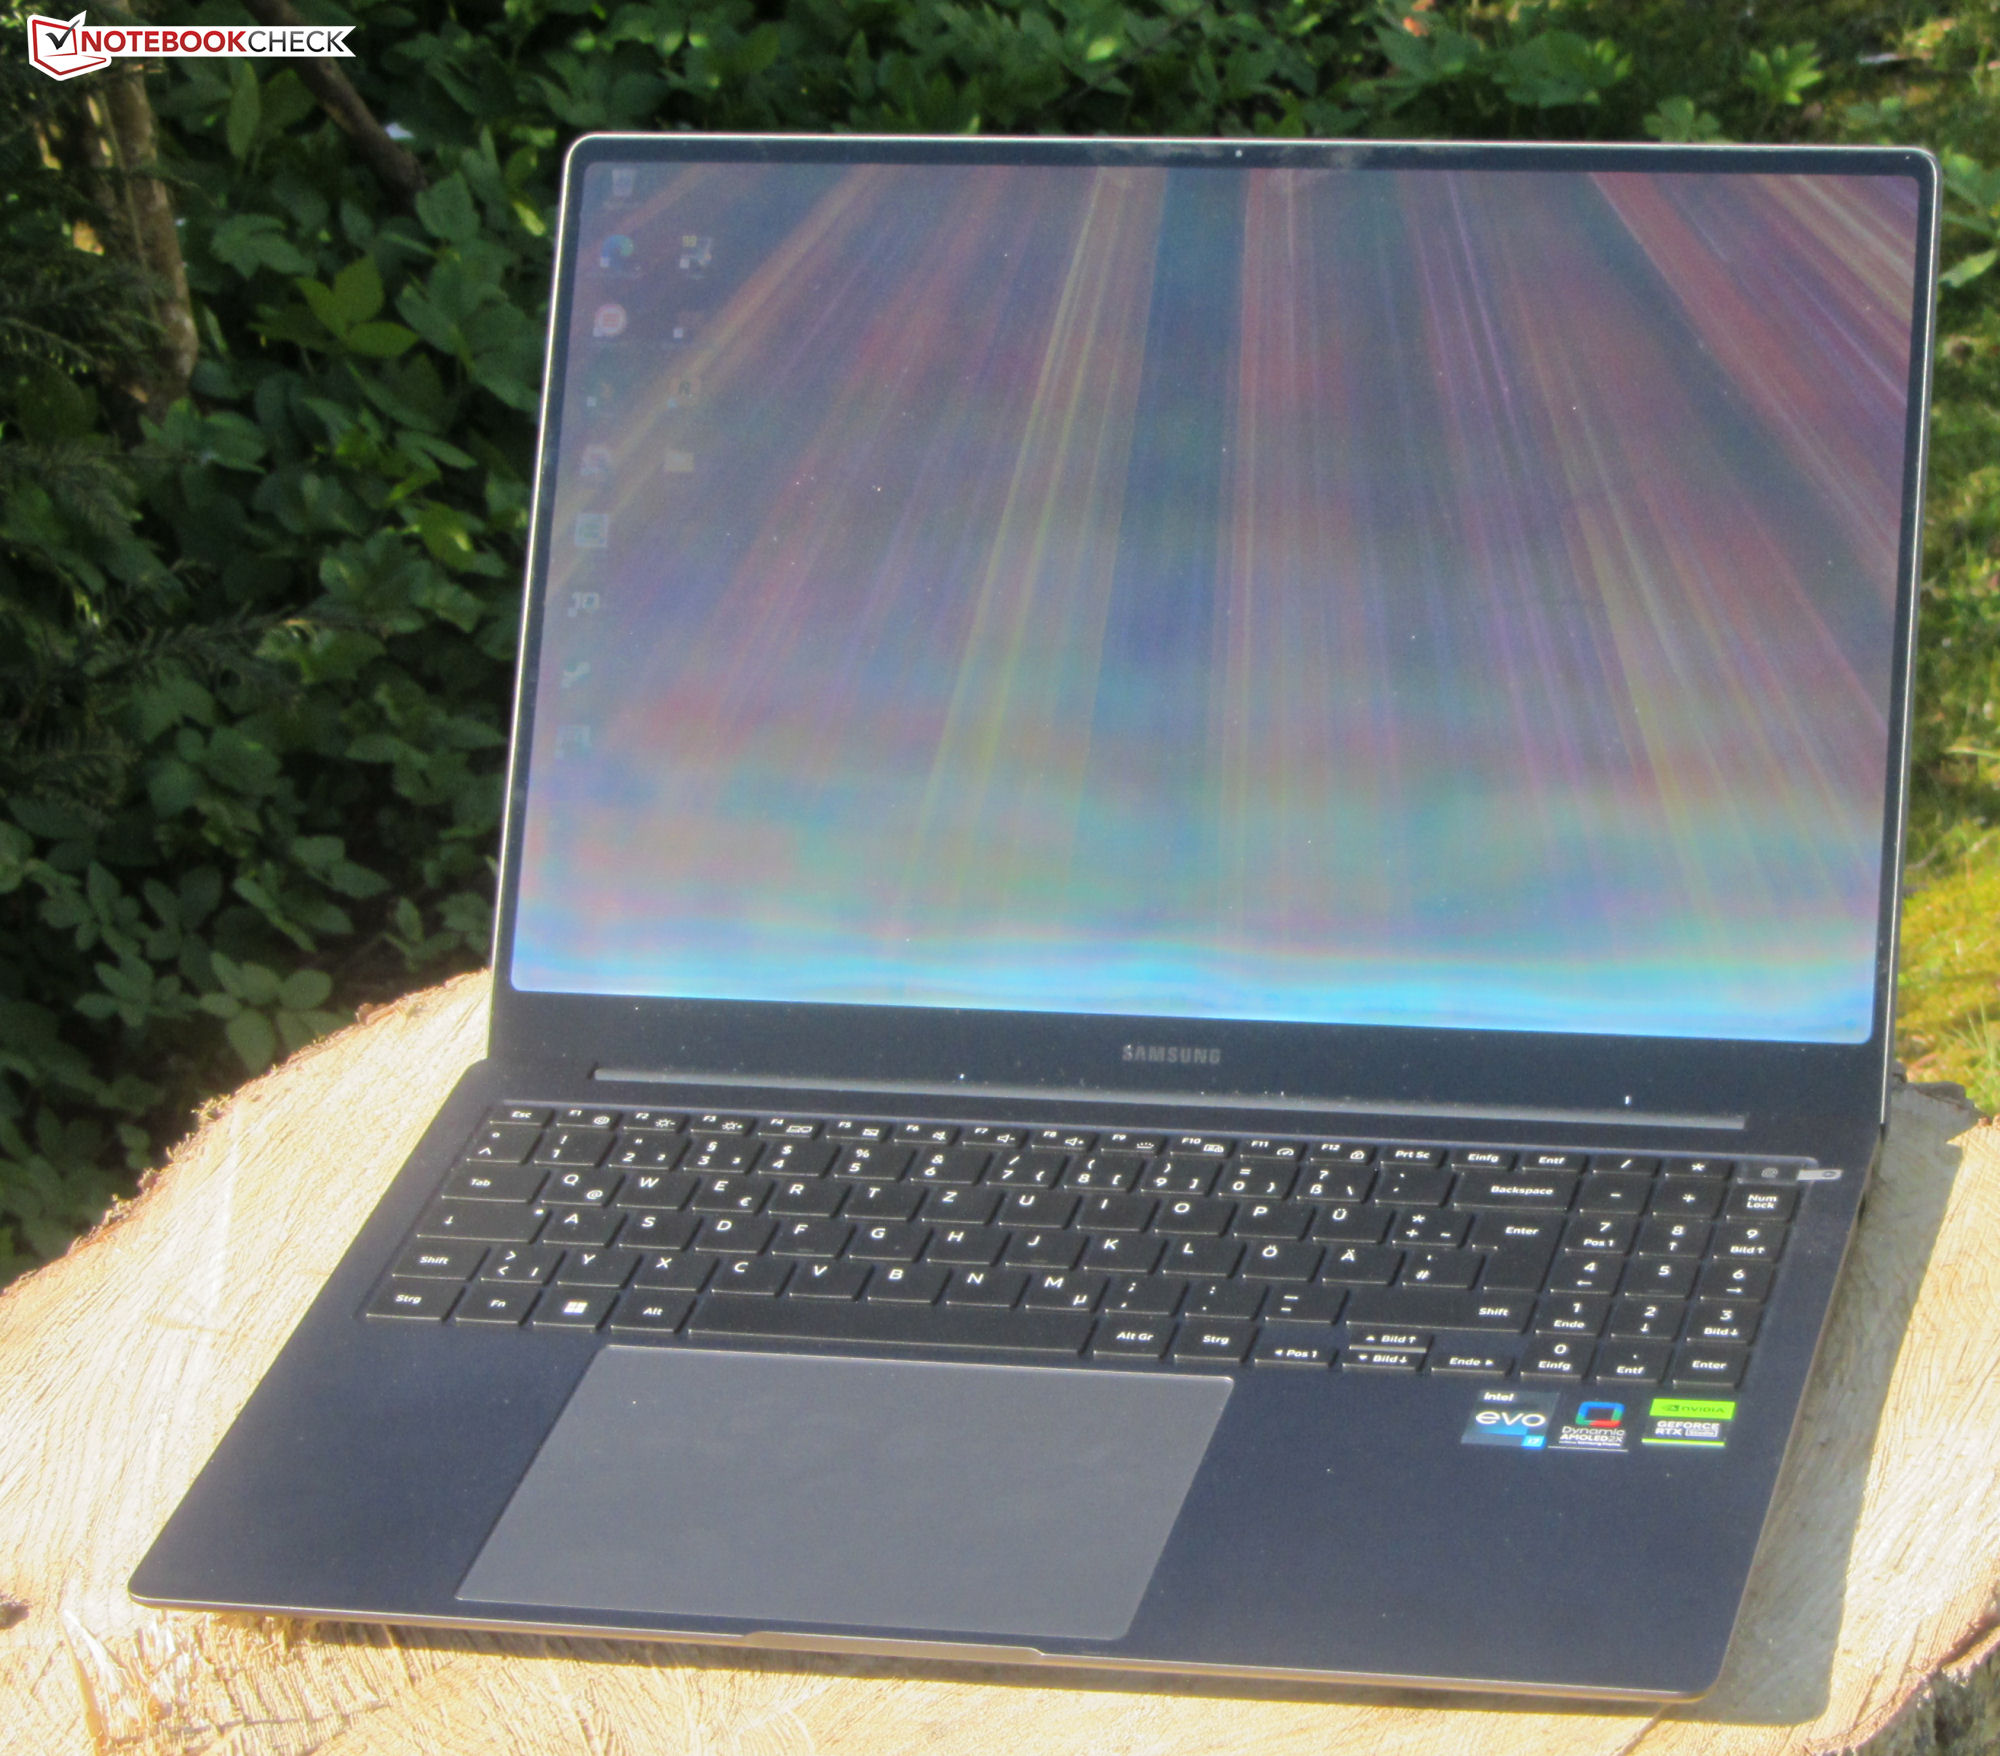
Boîtier - Un châssis en aluminium sophistiqué pour le Galaxy
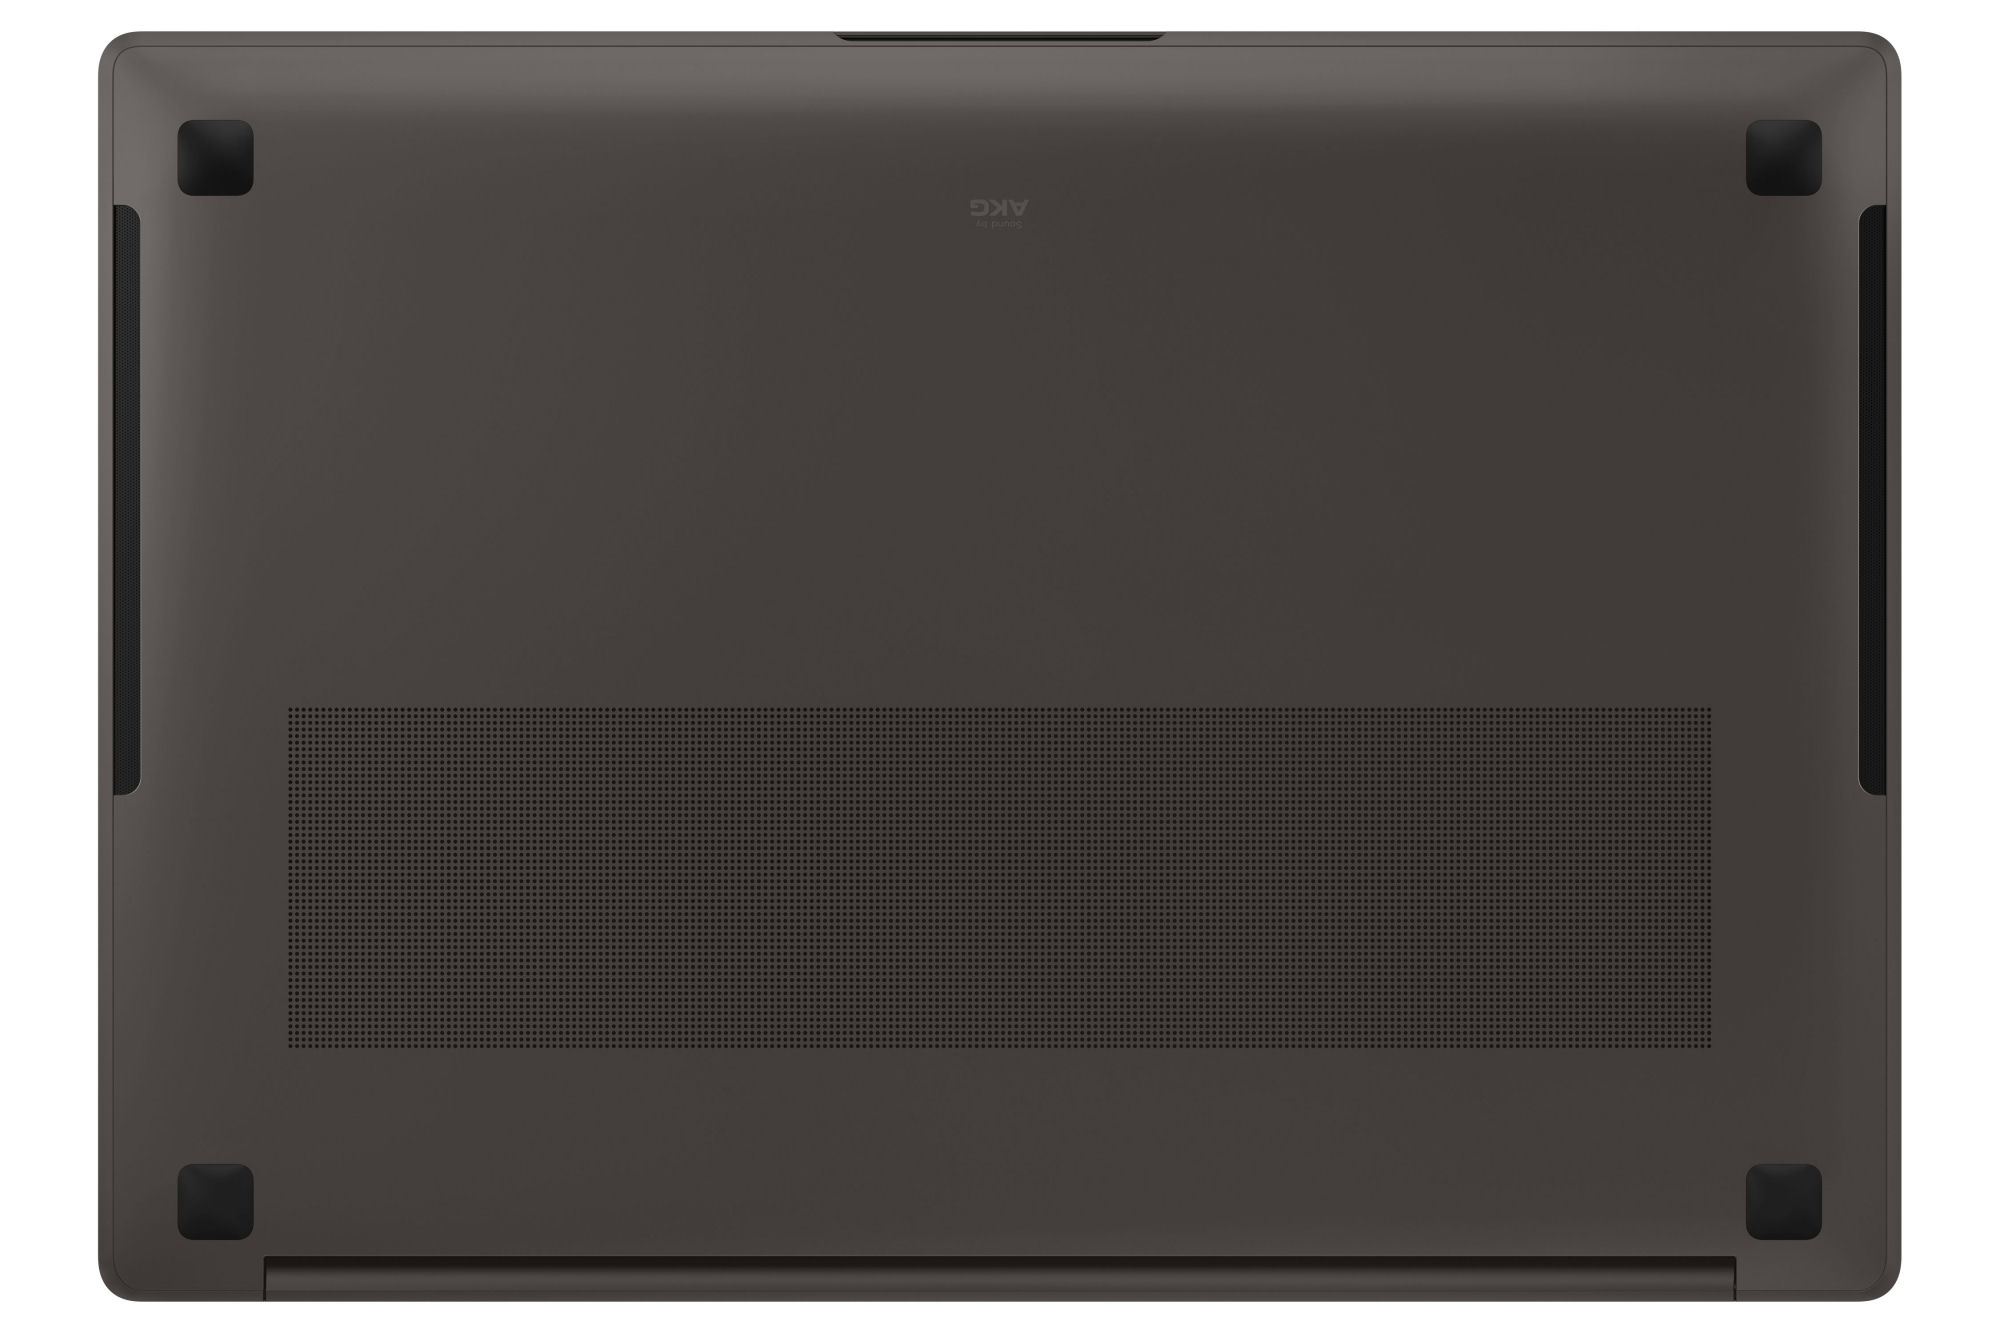
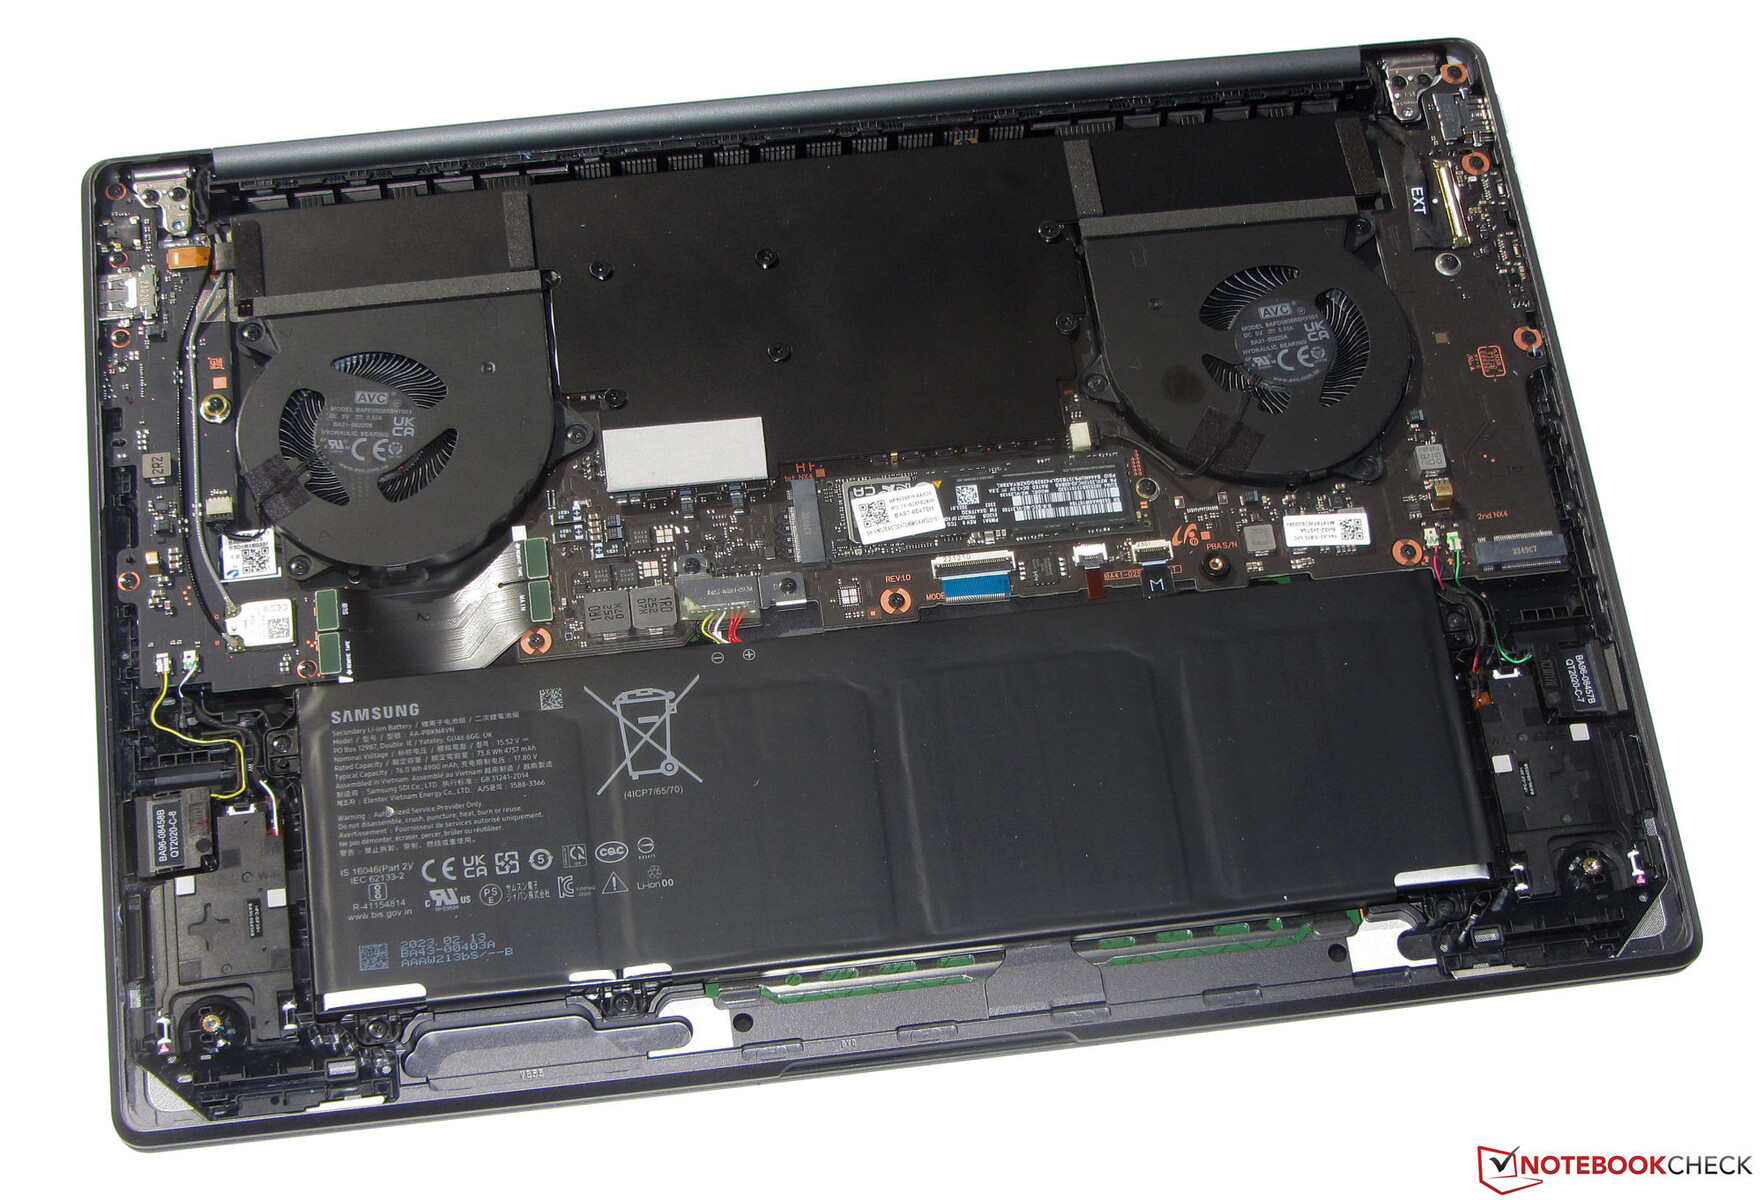
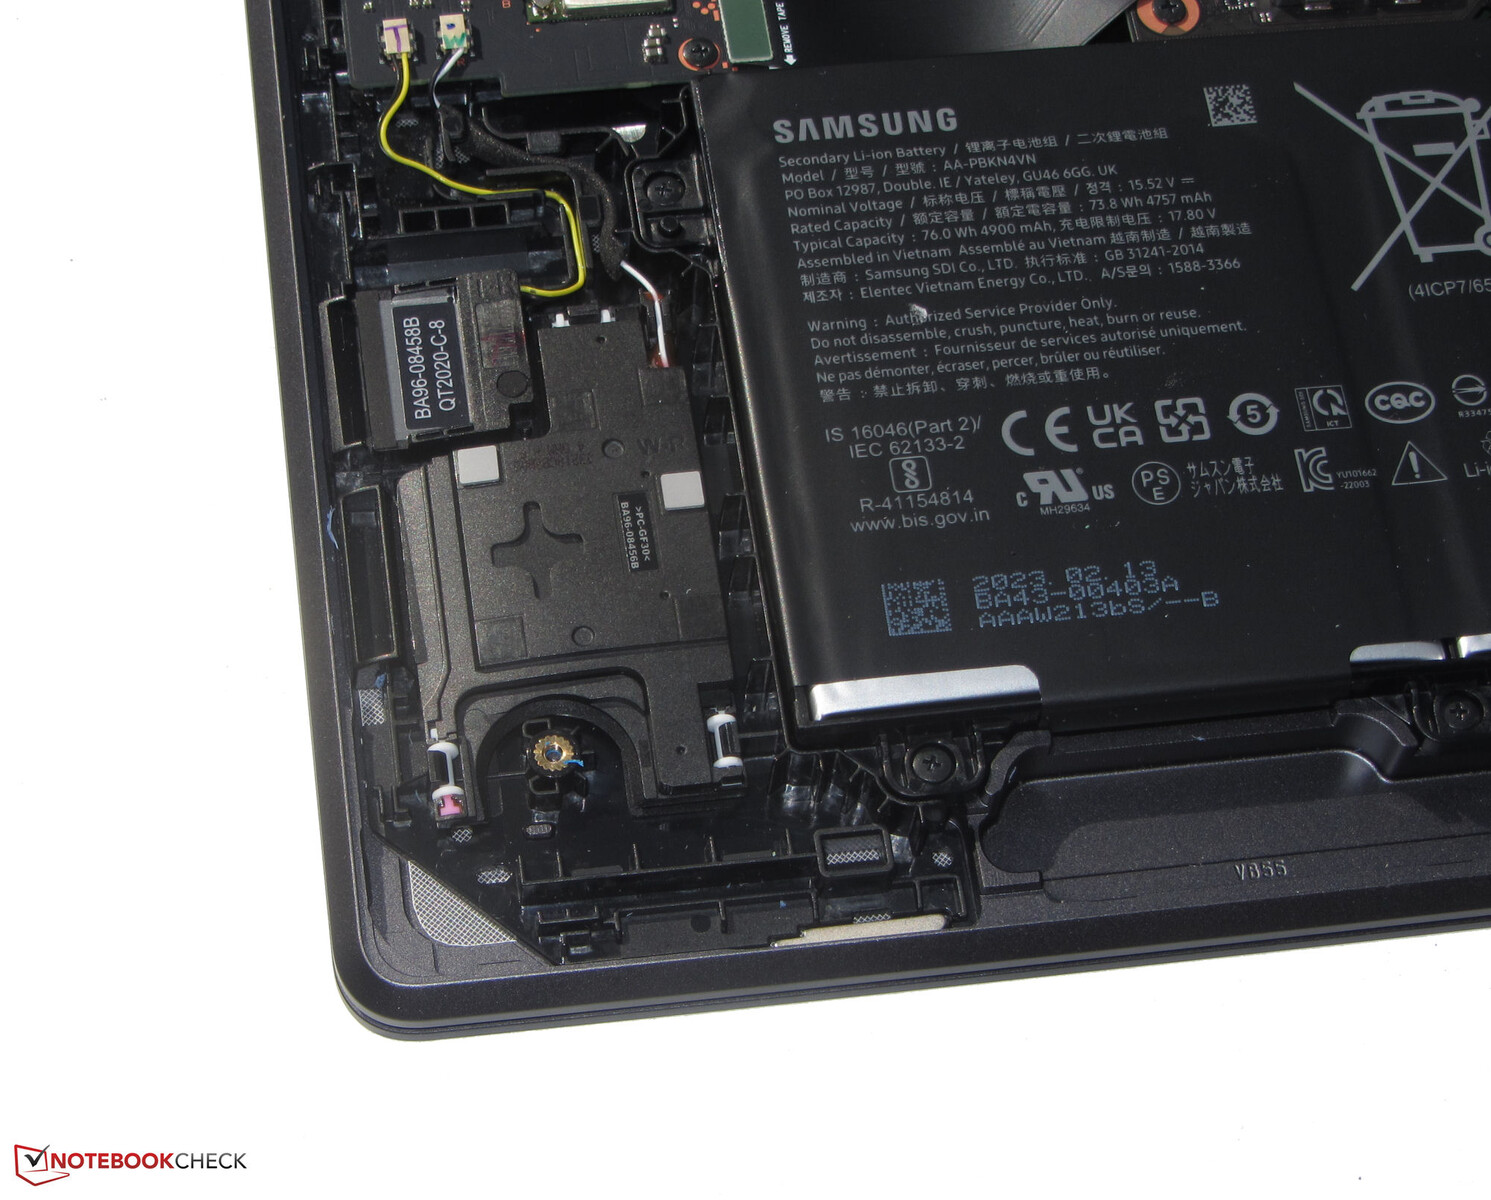
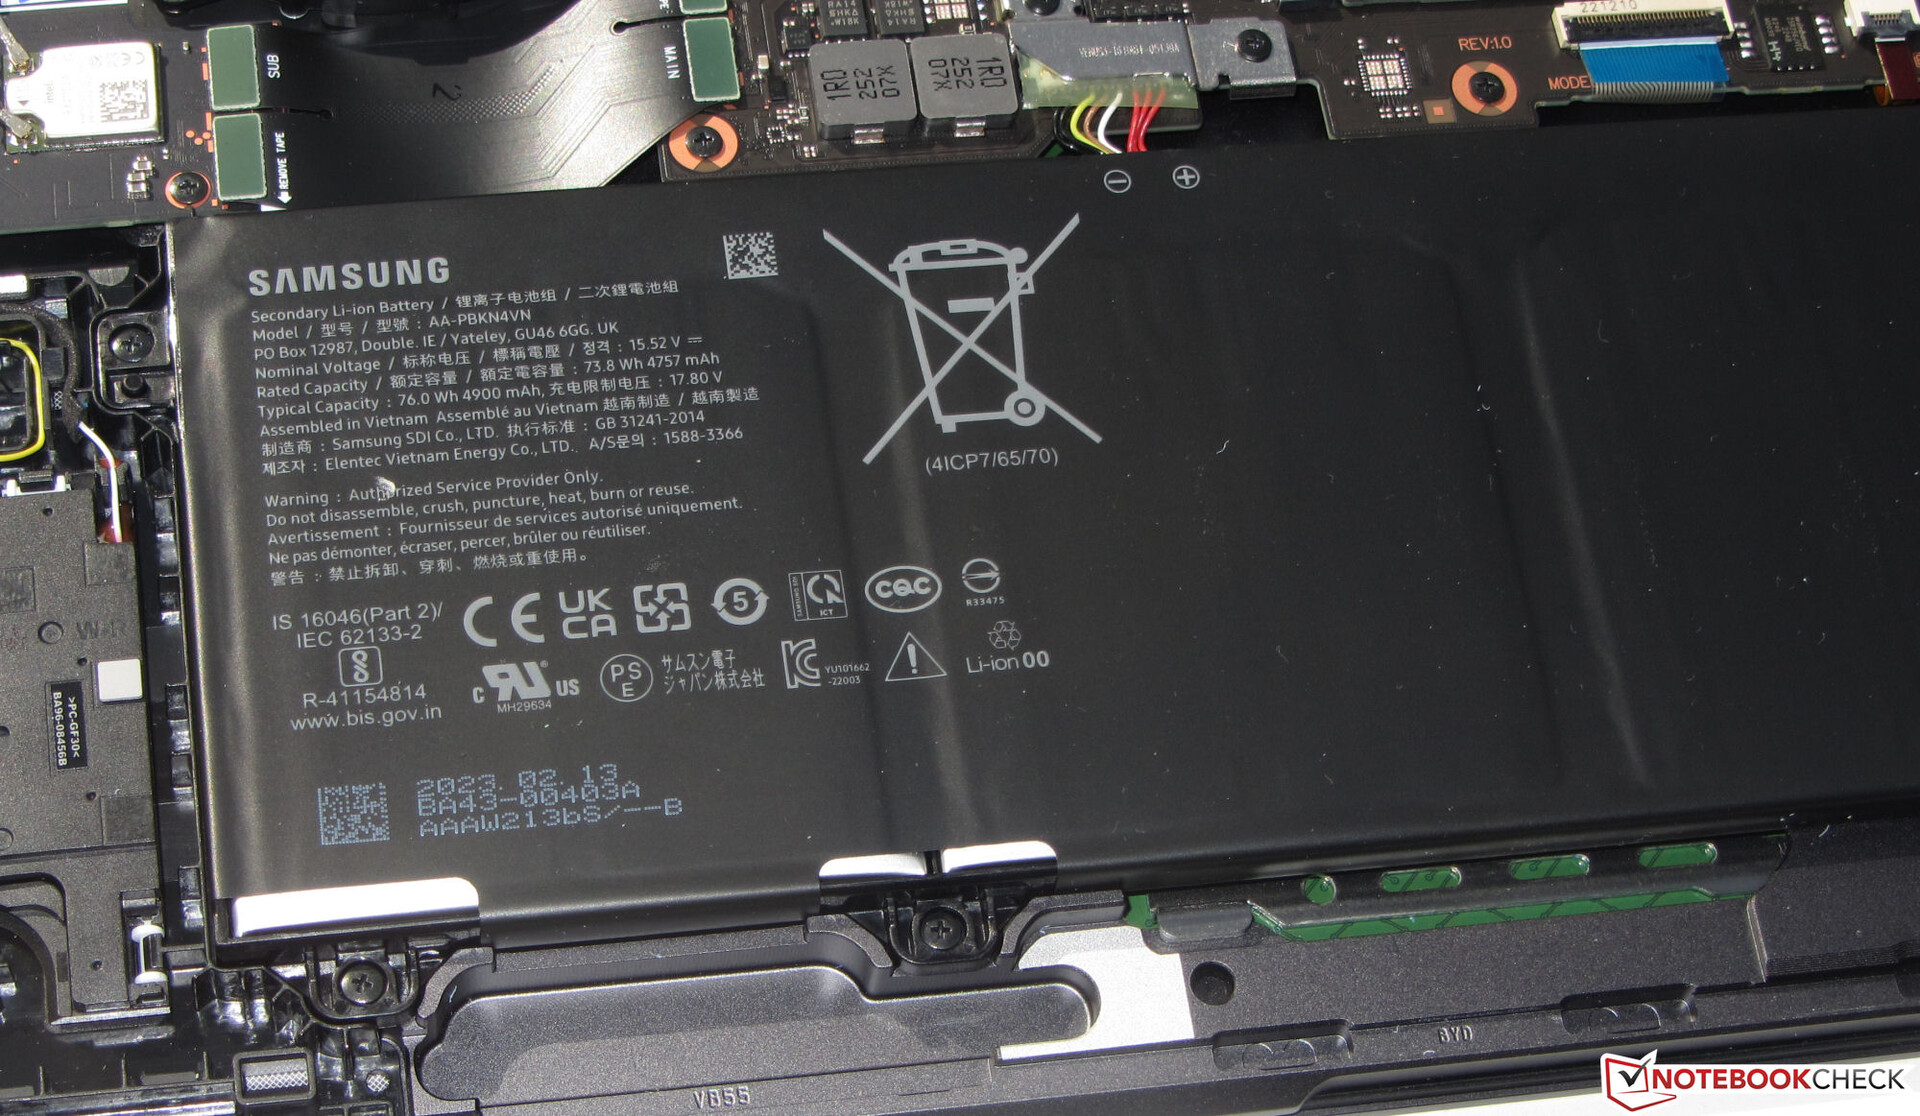
Samsung utilise un boîtier en aluminium gris-noir (graphite) avec des surfaces lisses et mates. L'ordinateur chic et élégant n'a pas de caractéristiques de design accrocheuses et n'en a pas besoin non plus. La batterie (vissée et non collée) et les autres composants internes sont accessibles après avoir retiré la coque inférieure.
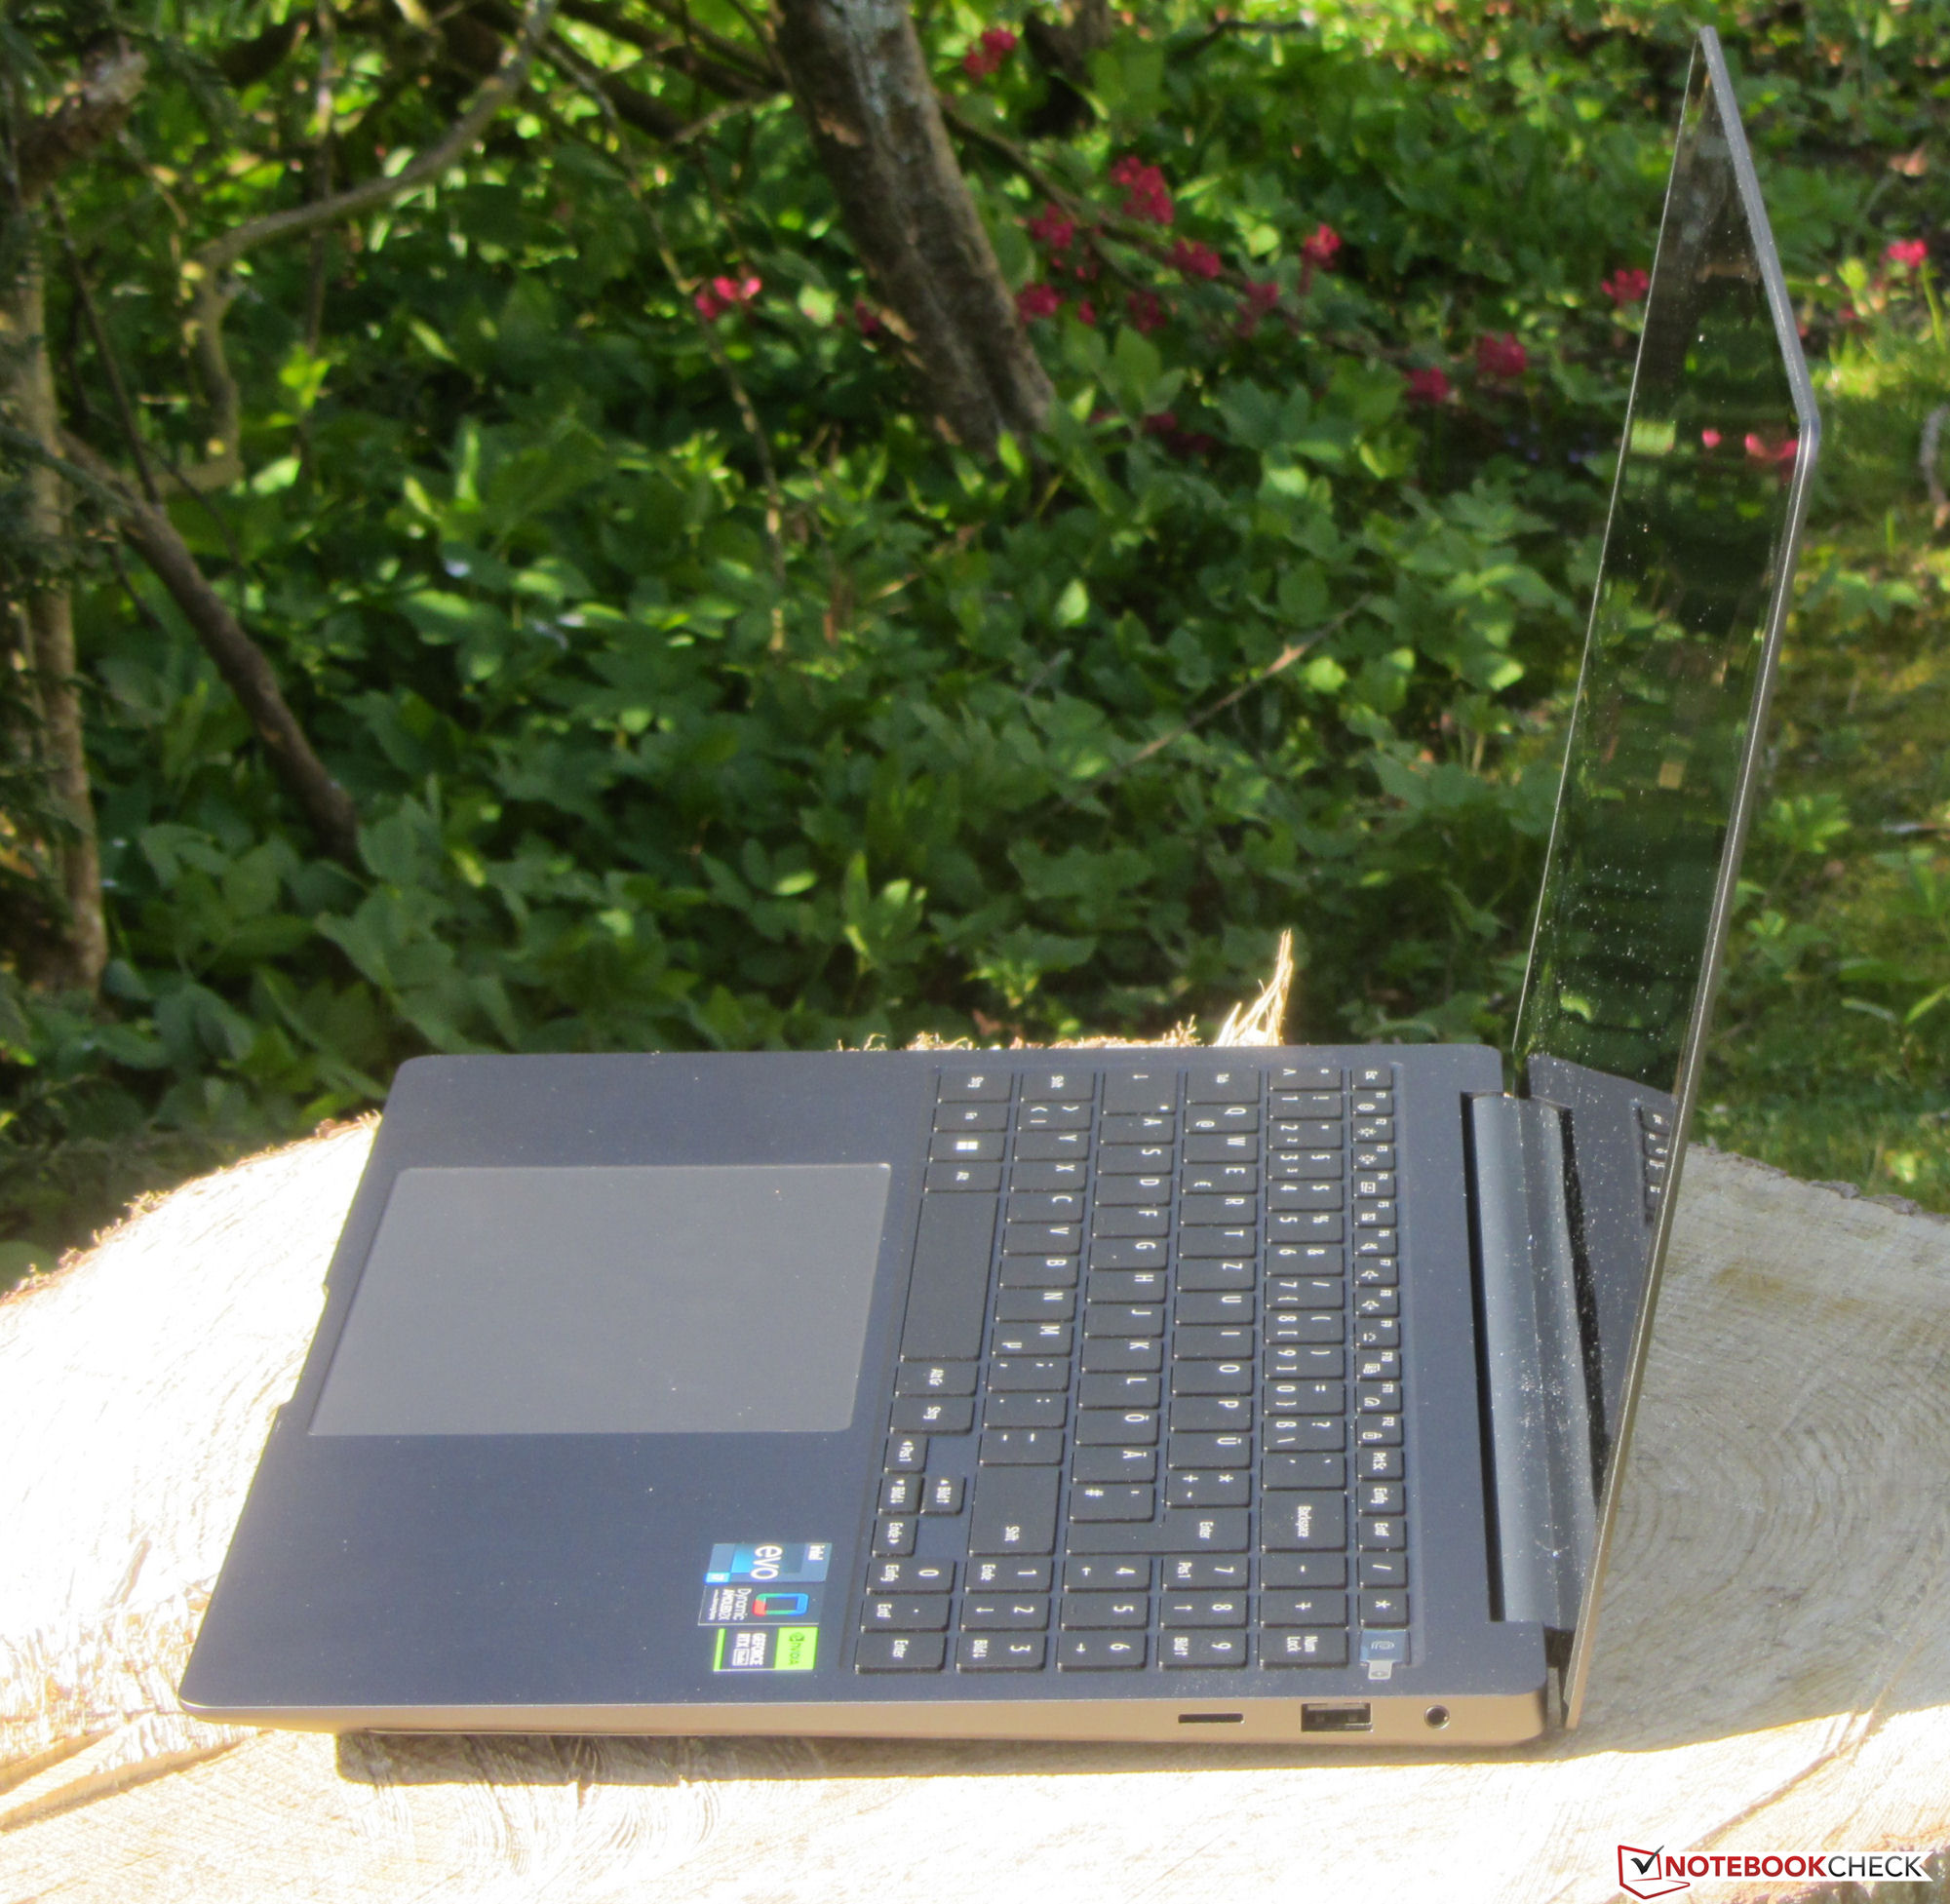
L'ordinateur portable est de bonne facture. Les dimensions de l'espace sont régulières et il n'y a pas d'aspérités matérielles. L'unité de base et le couvercle ne peuvent être tournés que dans une très faible mesure. Les charnières maintiennent le couvercle fermement en place et l'angle d'ouverture maximal est d'environ 125 degrés. L'ouverture d'une seule main est possible.
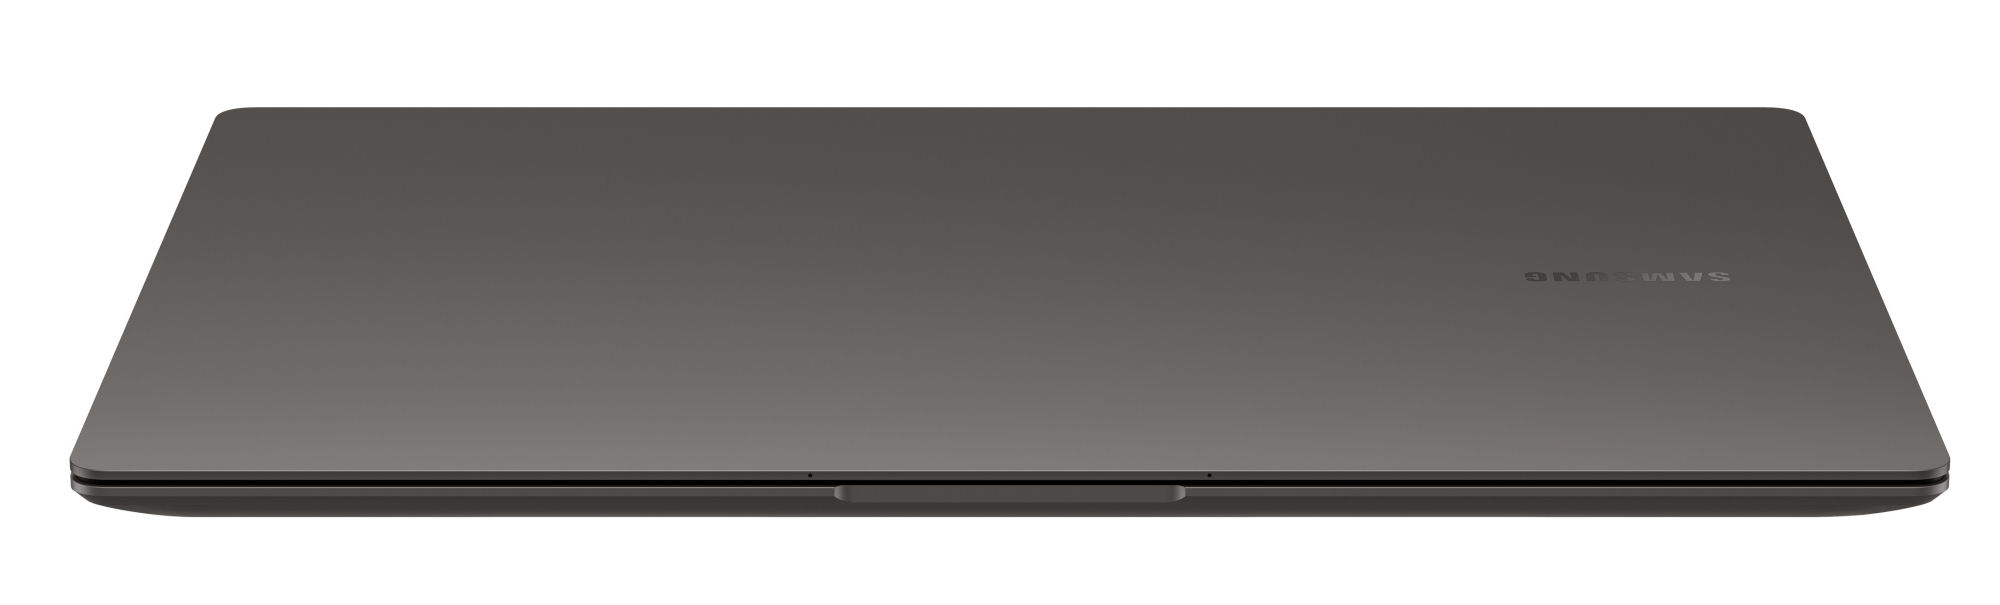

Le Galaxy Book3 appartient fondamentalement à la catégorie des ordinateurs portables compacts et légers. Cependant, il se situe au milieu du tableau de comparaison. Son concurrent direct, le Schenker Vision 16 Pro, est un peu plus compact et plus léger. Aucun ordinateur portable ne peut rivaliser avec le faible poids (1,4 kg) du LG Gram 17.
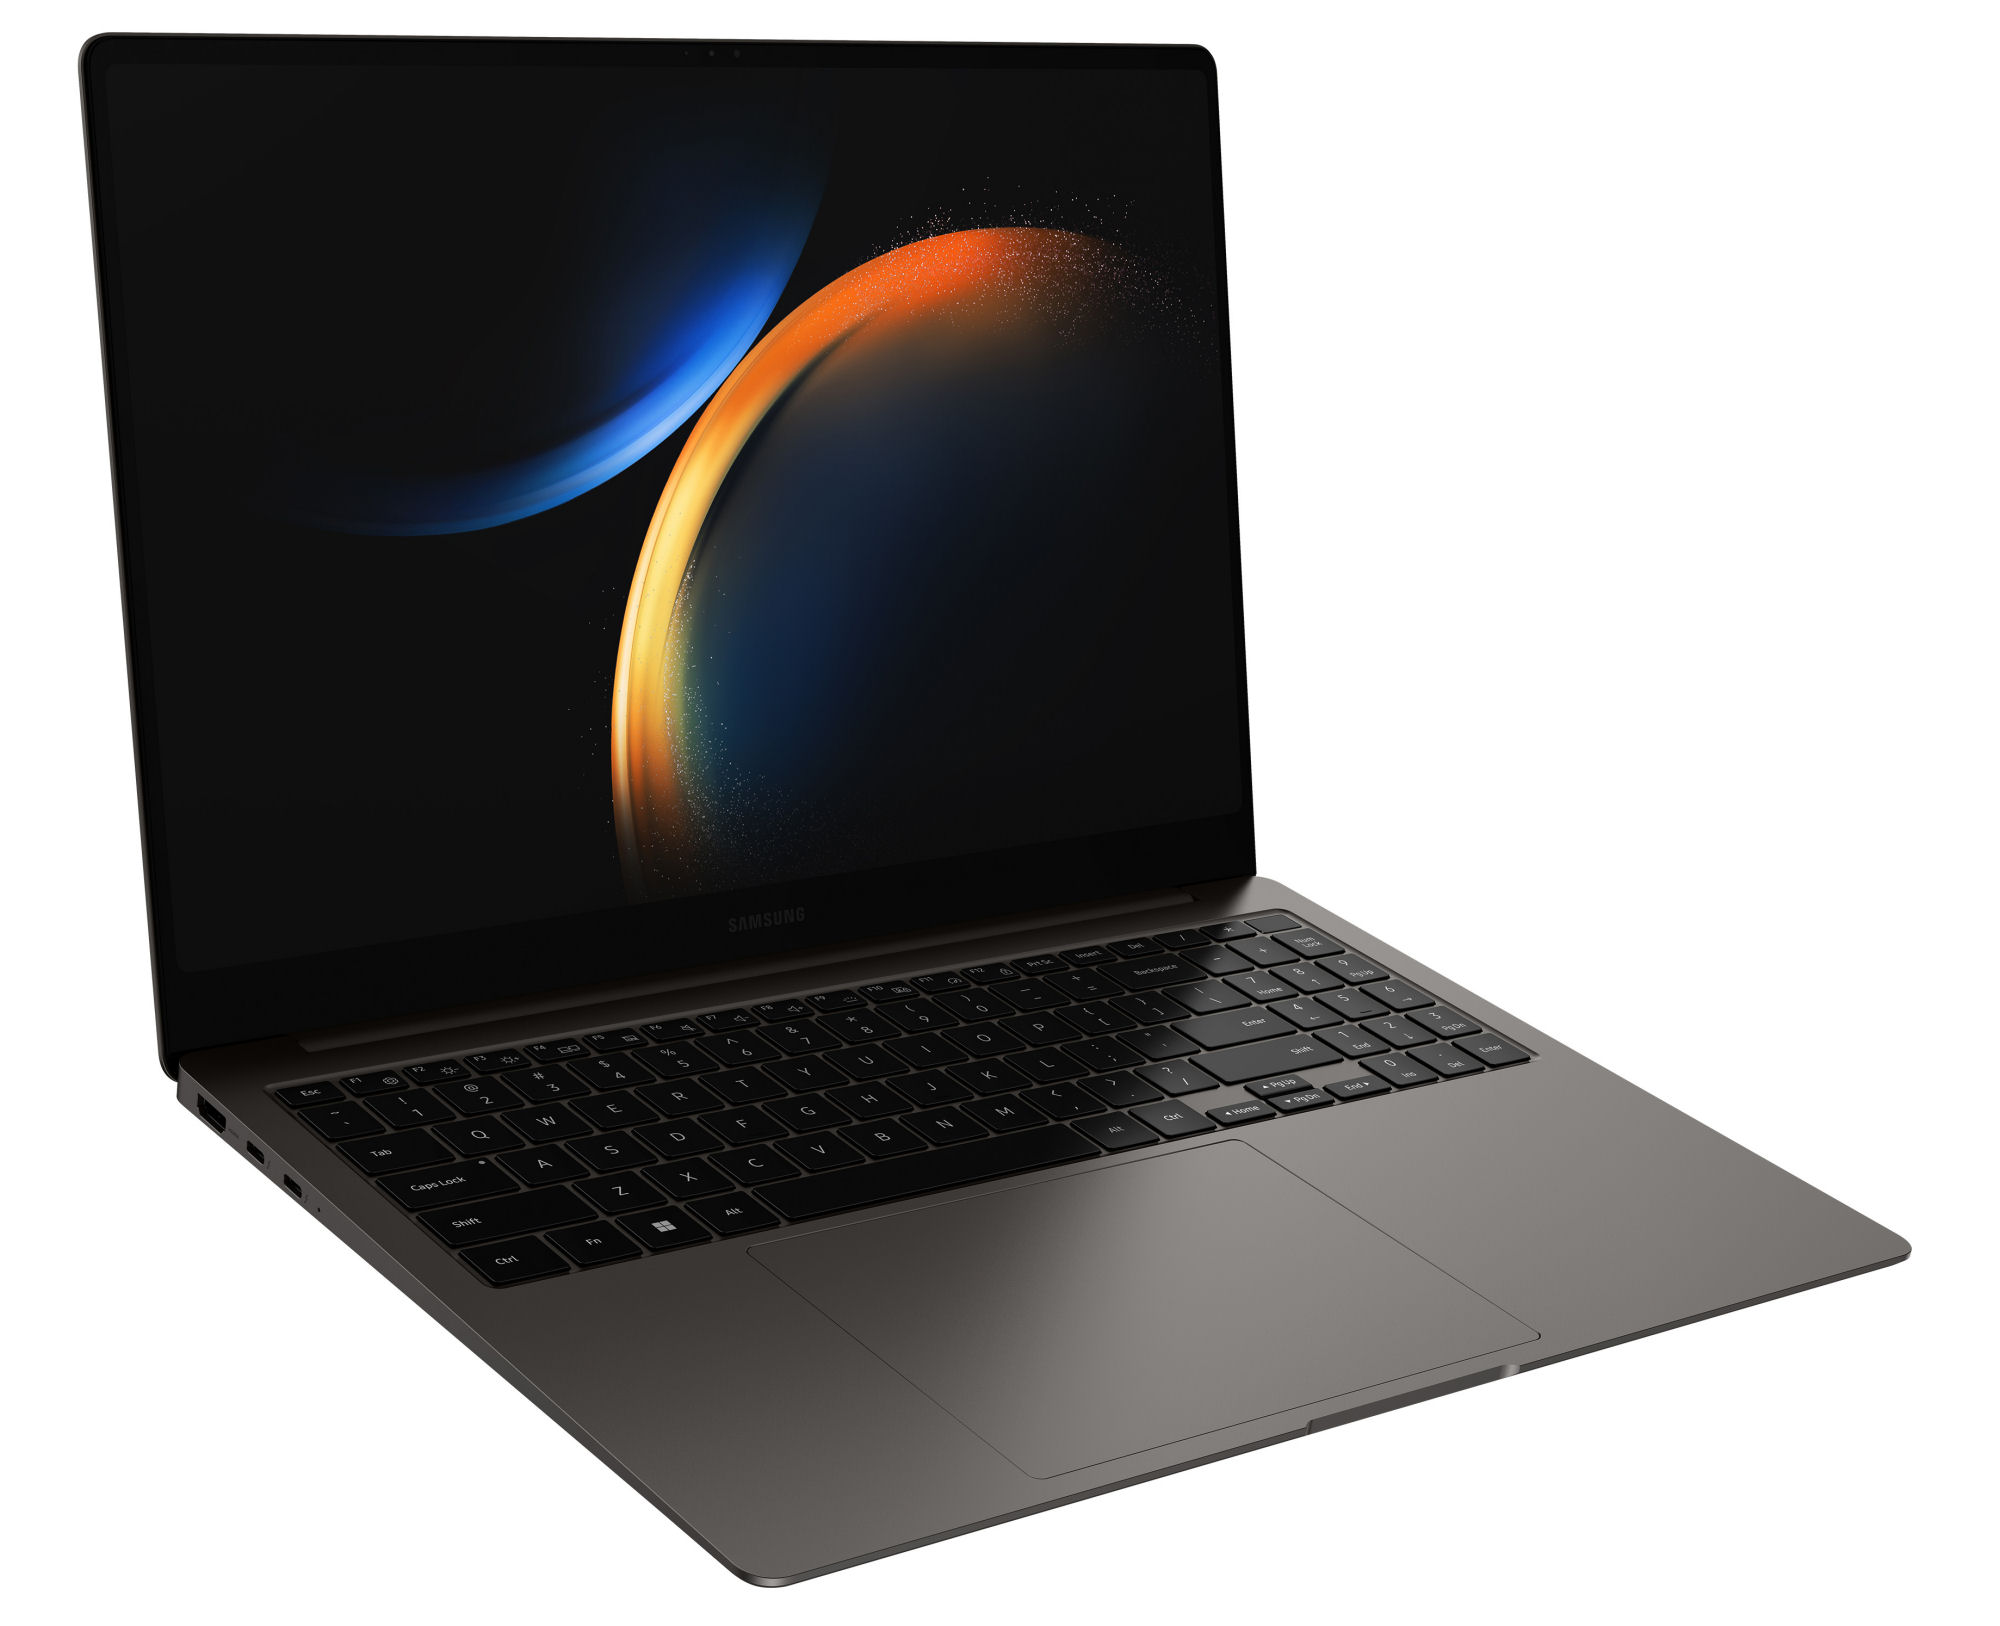
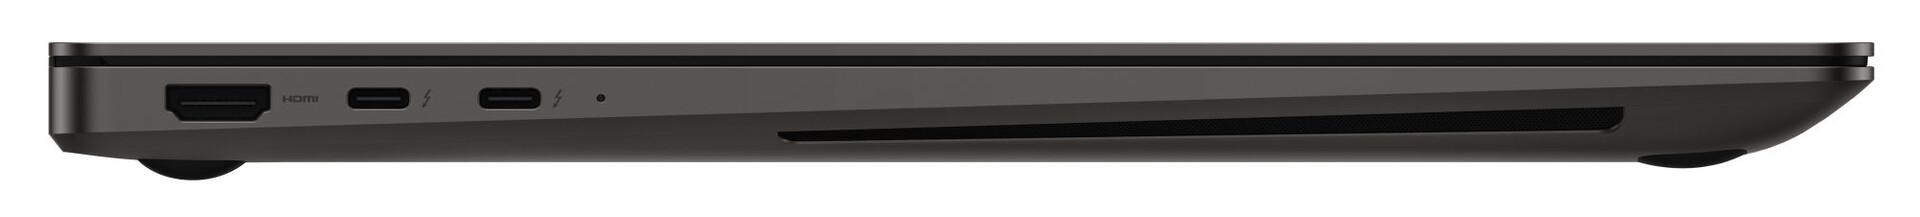
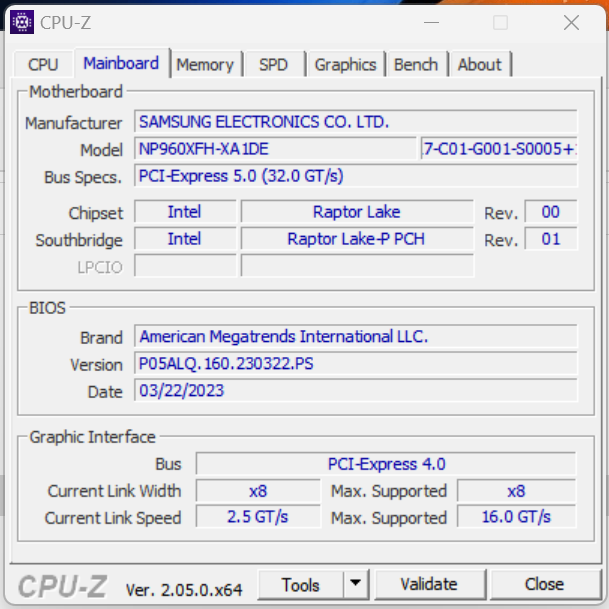
Équipement - Samsung installe Thunderbolt 4 dans l'Ultra 16
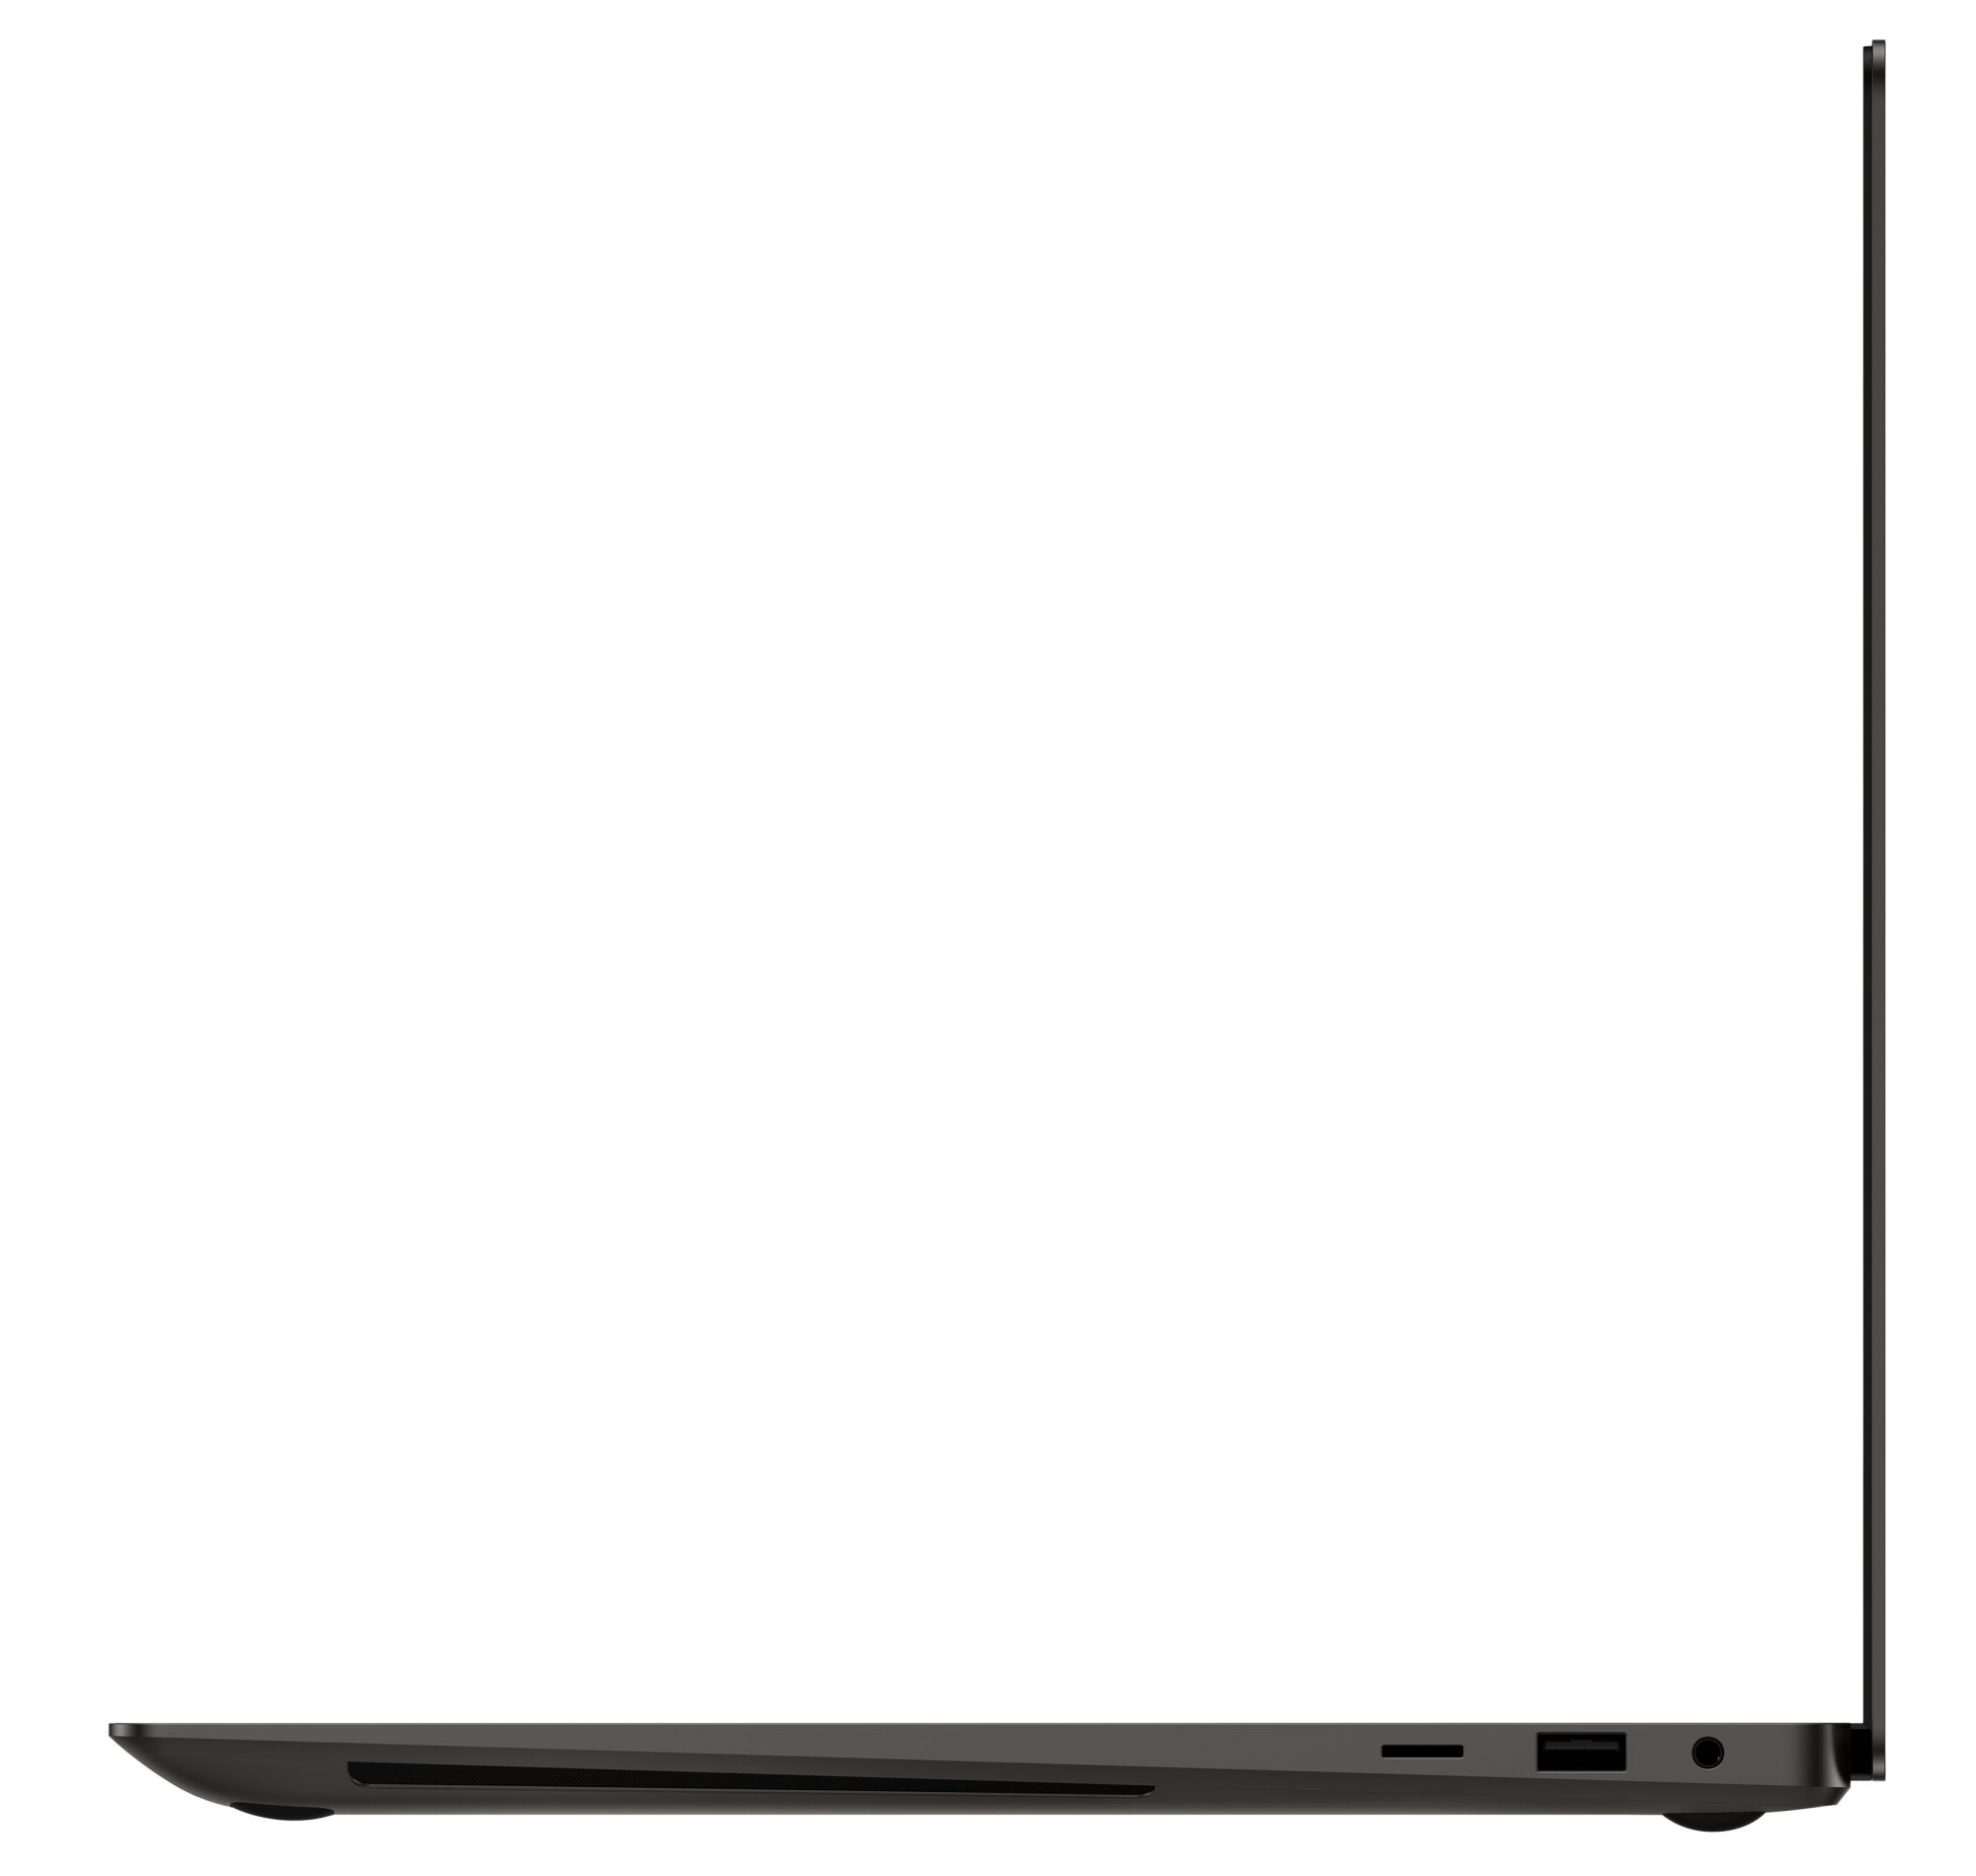
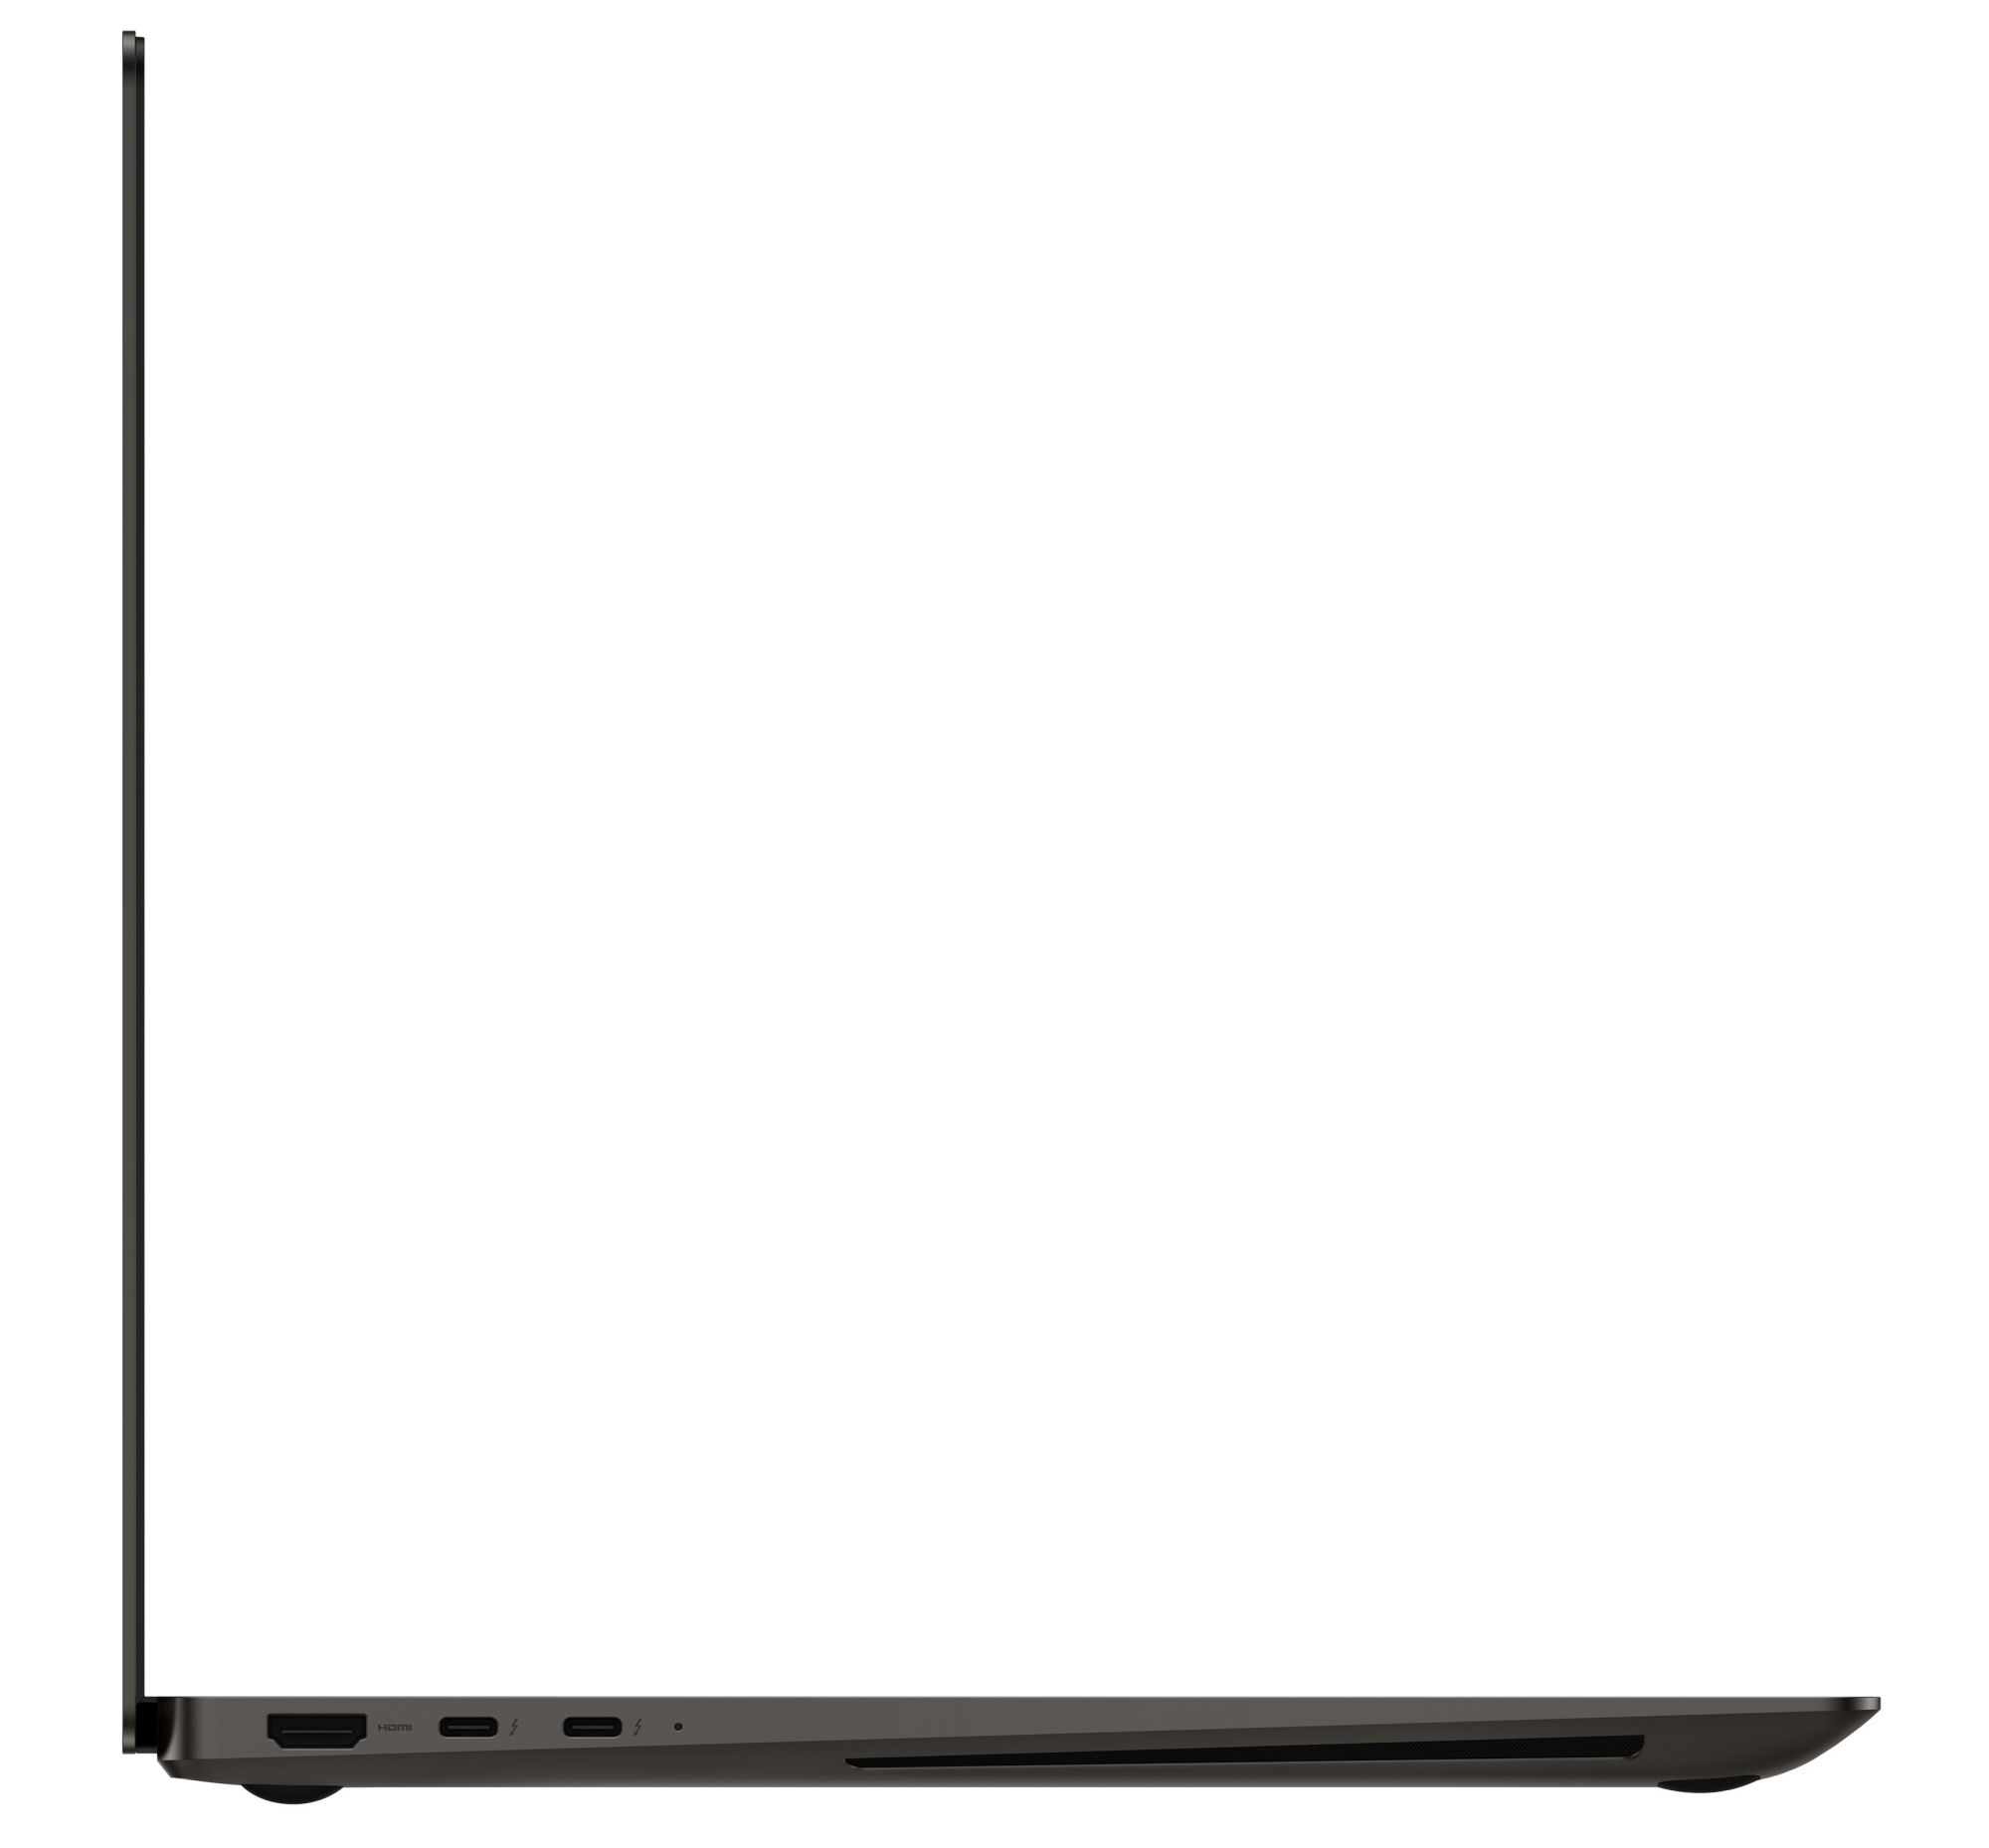
L'ordinateur portable dispose d'un port USB-A (USB 3.2 Gen 1) et de deux ports USB-C (Thunderbolt 4). Ces derniers peuvent alimenter l'ordinateur portable en électricité (Power Delivery) et également sortir DisplayPort. Il y a au total trois sorties vidéo (2x DP, 1x HDMI). Les ports manquants peuvent être ajoutés avec une station d'accueil.
Les ports sont situés dans les zones arrière des côtés droit et gauche, de sorte que l'espace à côté du repose-paume reste libre de tout câble. Seul bémol : toutes les sorties vidéo et les connexions d'alimentation se trouvent à gauche. Il aurait été judicieux d'installer Thunderbolt 4 des deux côtés.
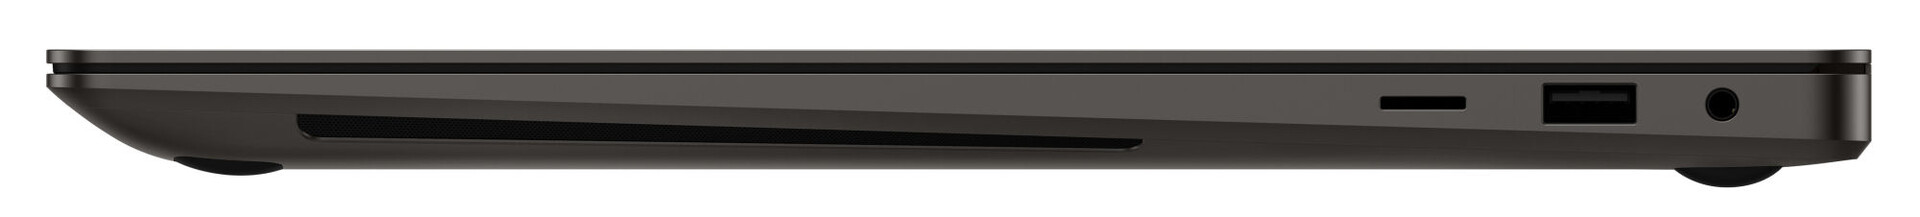
Lecteur de carte SD
Le lecteur de carte mémoire microSD (carte de référence : AV PRO microSD 128 GB V60) fait partie des modèles moyennement rapides avec des taux de transfert maximaux de 74 MB/s (transfert de 250 fichiers image jpg d'environ 5 MB chacun) et de 83 MB/s (copie de gros blocs de données).
| SD Card Reader | |
| average JPG Copy Test (av. of 3 runs) | |
| Dell XPS 15 9520 RTX 3050 Ti (Toshiba Exceria Pro SDXC 64 GB UHS-II) | |
| Moyenne de la classe Multimedia (23 - 531, n=36, 2 dernières années) | |
| Schenker Vision 16 Pro RTX 3070 Ti (AV Pro V60) | |
| Lenovo ThinkBook 16p G3 ARH (AV PRO microSD 128 GB V60) | |
| LG Gram 17Z90Q-E.AD78G (AV Pro SD microSD 128 GB V60) | |
| Samsung Galaxy Book3 Ultra 16 (AV PRO microSD 128 GB V60) | |
| Asus VivoBook Pro 16X OLED N7600PC-L2026X | |
| maximum AS SSD Seq Read Test (1GB) | |
| Moyenne de la classe Multimedia (37.3 - 1455, n=35, 2 dernières années) | |
| Dell XPS 15 9520 RTX 3050 Ti (Toshiba Exceria Pro SDXC 64 GB UHS-II) | |
| LG Gram 17Z90Q-E.AD78G (AV Pro SD microSD 128 GB V60) | |
| Lenovo ThinkBook 16p G3 ARH (AV PRO microSD 128 GB V60) | |
| Samsung Galaxy Book3 Ultra 16 (AV PRO microSD 128 GB V60) | |
| Schenker Vision 16 Pro RTX 3070 Ti (AV Pro V60) | |
| Asus VivoBook Pro 16X OLED N7600PC-L2026X | |
Communication
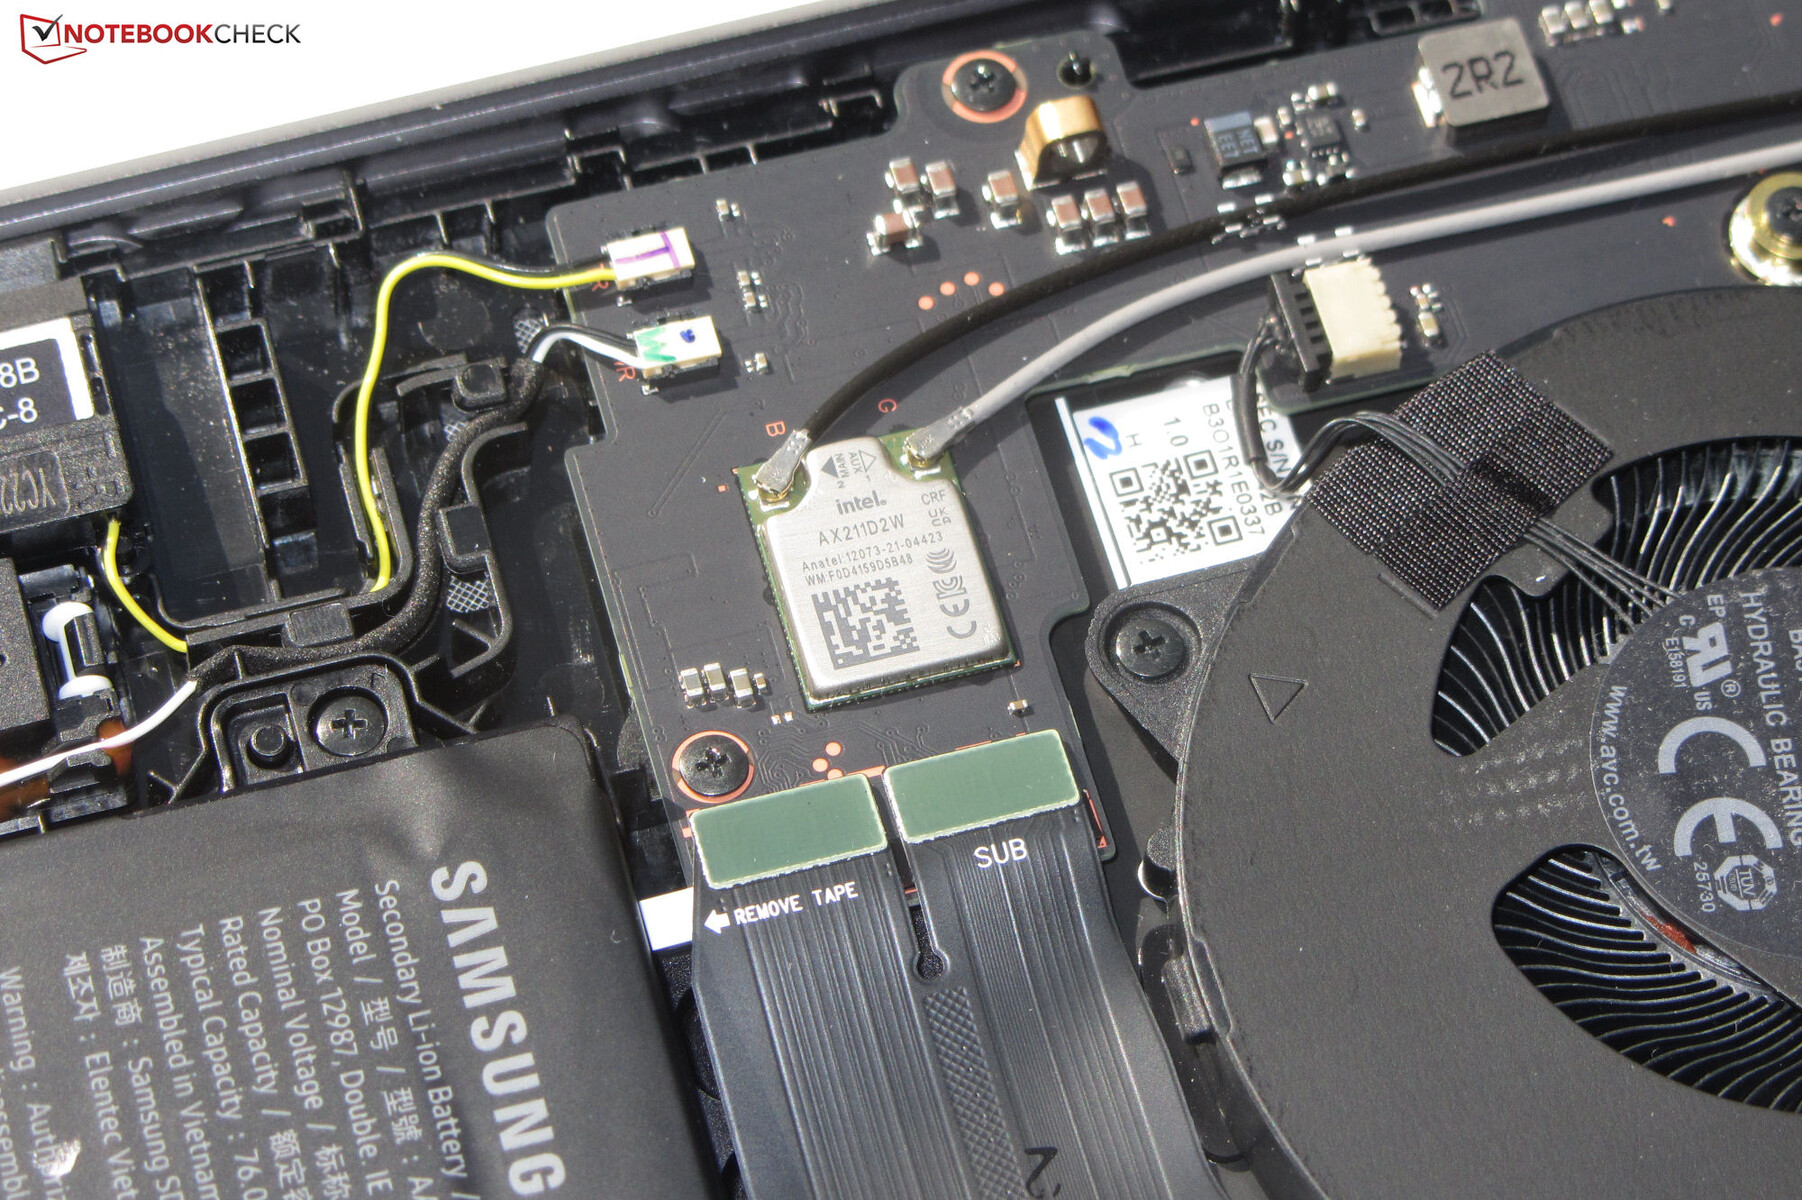
D'excellents débits de données WiFi sont obtenus dans des conditions optimales (pas d'appareils WLAN à proximité, faible distance entre l'ordinateur portable et le PC serveur). L'ordinateur portable Samsung est équipé d'une puce WiFi 6E (Intel AX211). Il n'y a pas d'emplacement Ethernet.
Webcam
La webcam (2,1 MP, max. 1 920 x 1 080) n'a pas d'obturateur mécanique. D'un point de vue qualitatif, elle offre une qualité standard. La précision des couleurs est un problème, car l'objectif (DeltaE inférieur à 3) n'est pas atteint avec une déviation des couleurs de près de 8.


Accessoires
Outre les documents habituels (informations sur la garantie, guide de démarrage rapide), l'ordinateur portable n'est accompagné d'aucun autre accessoire.
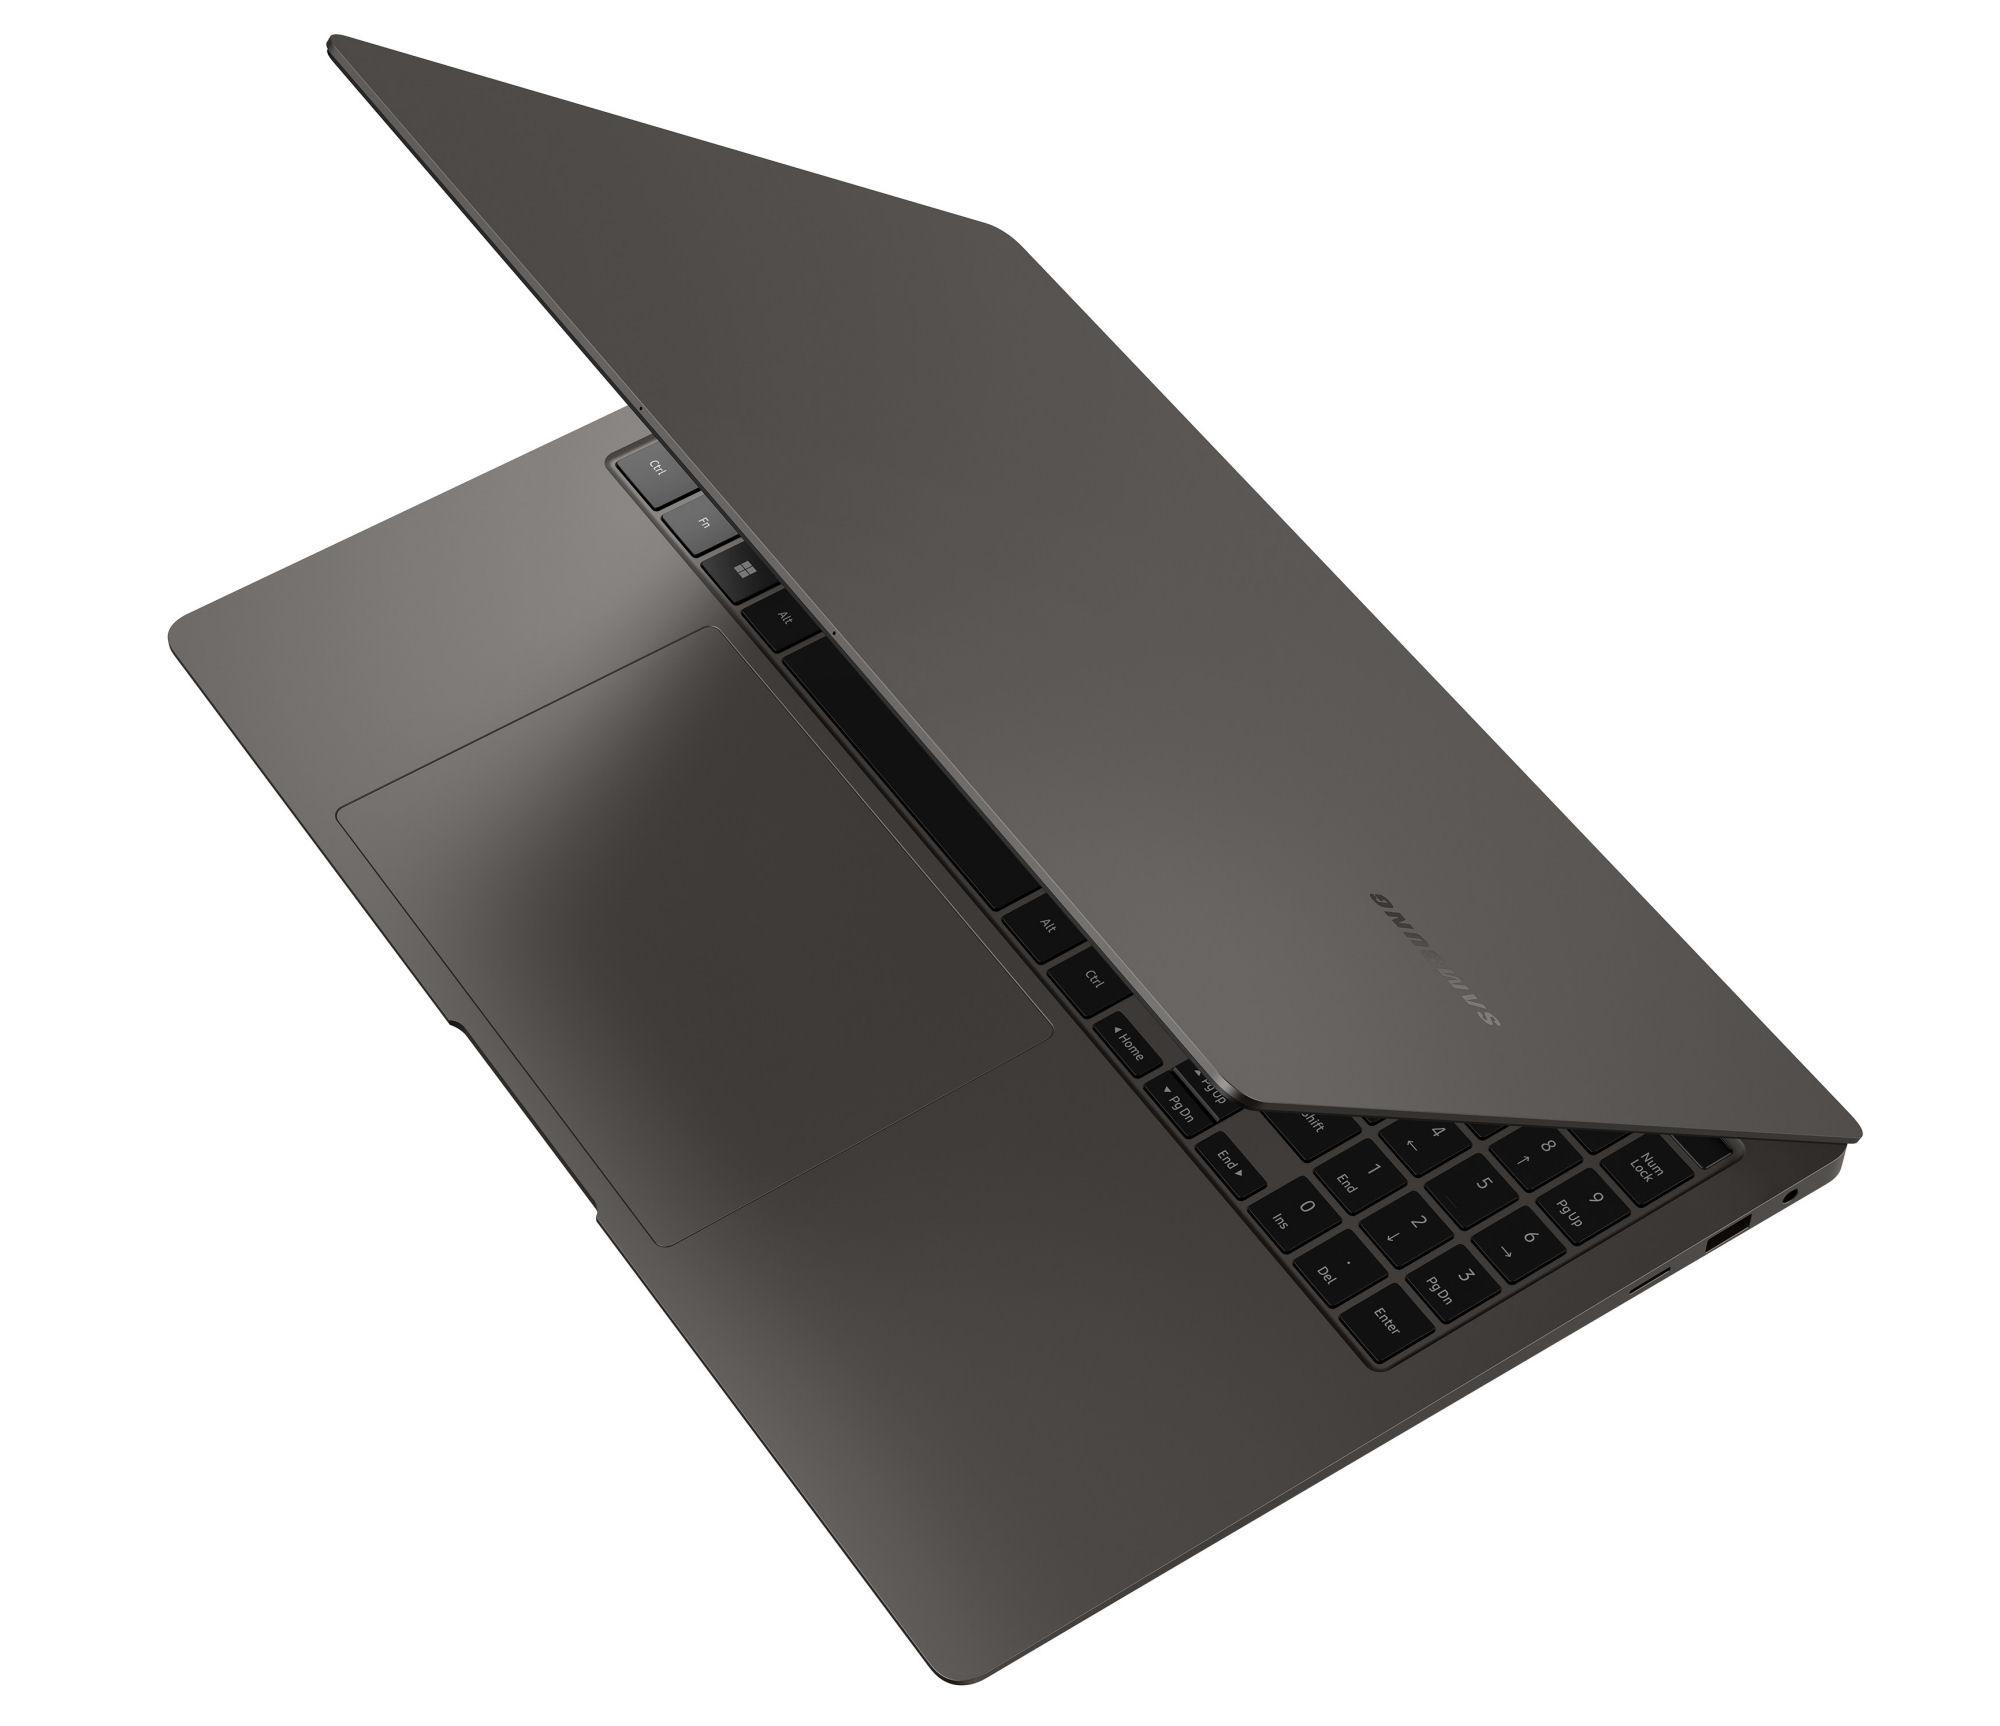
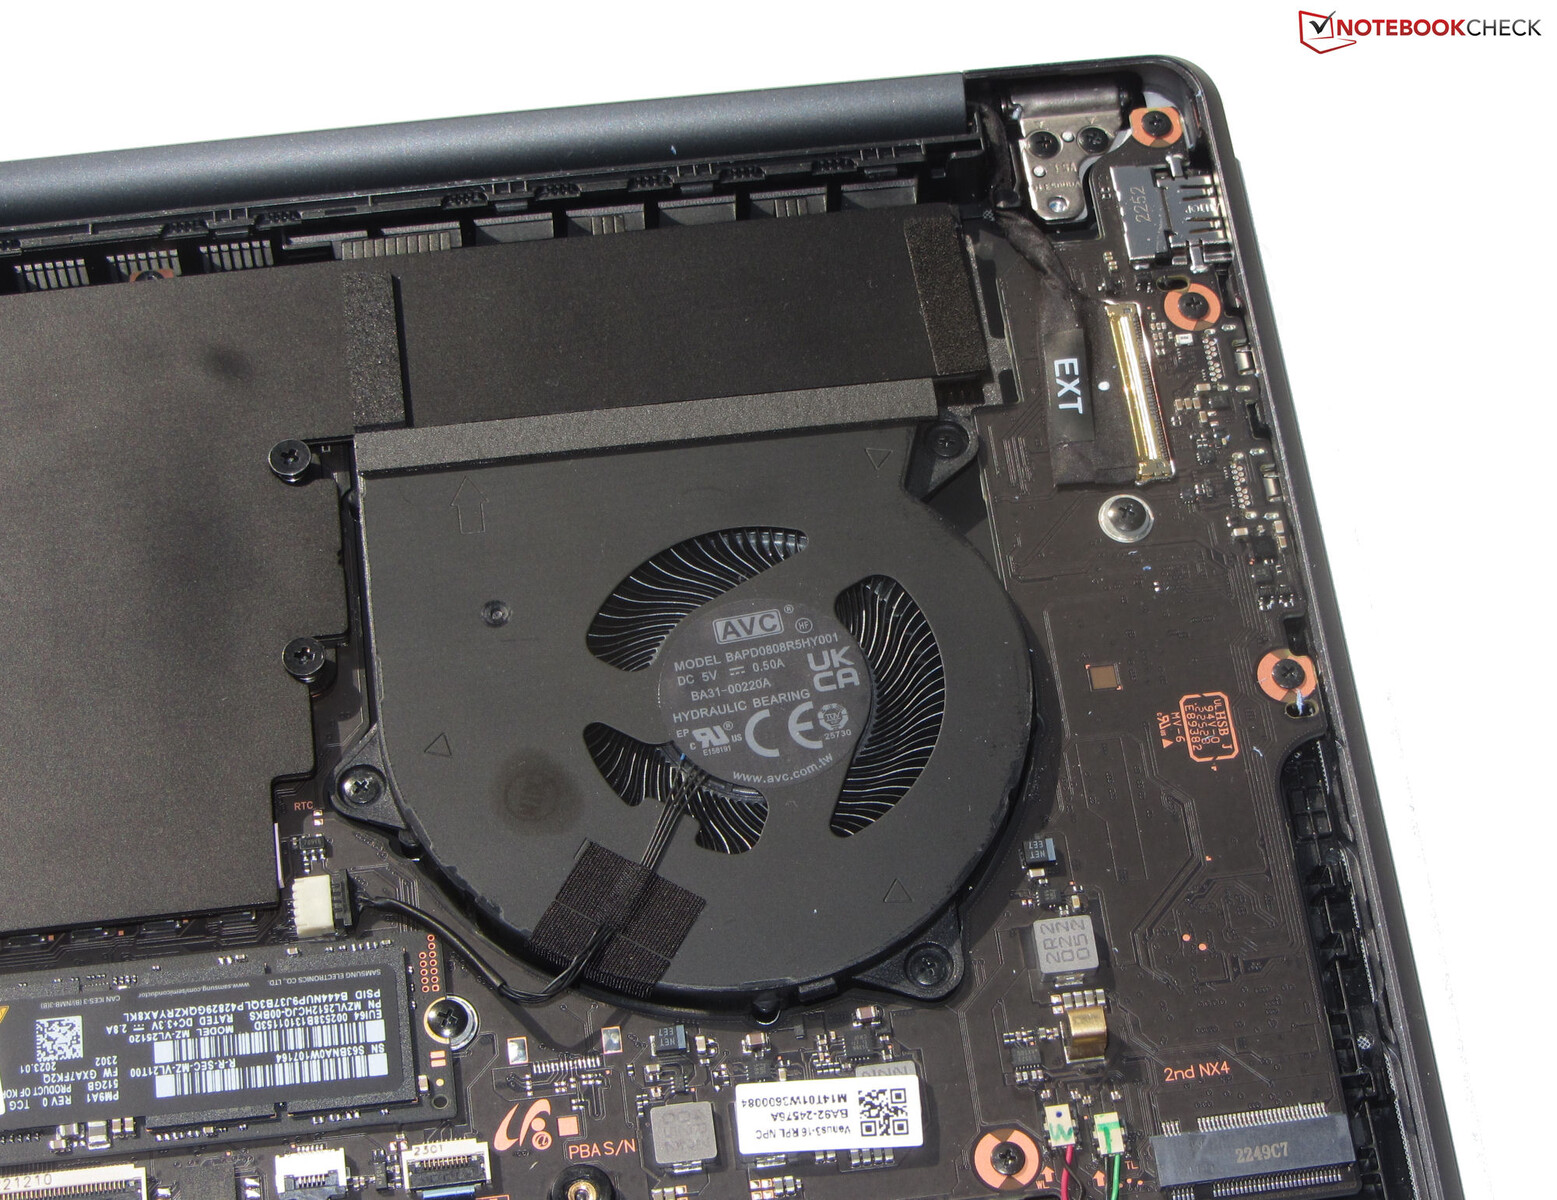
Maintenance
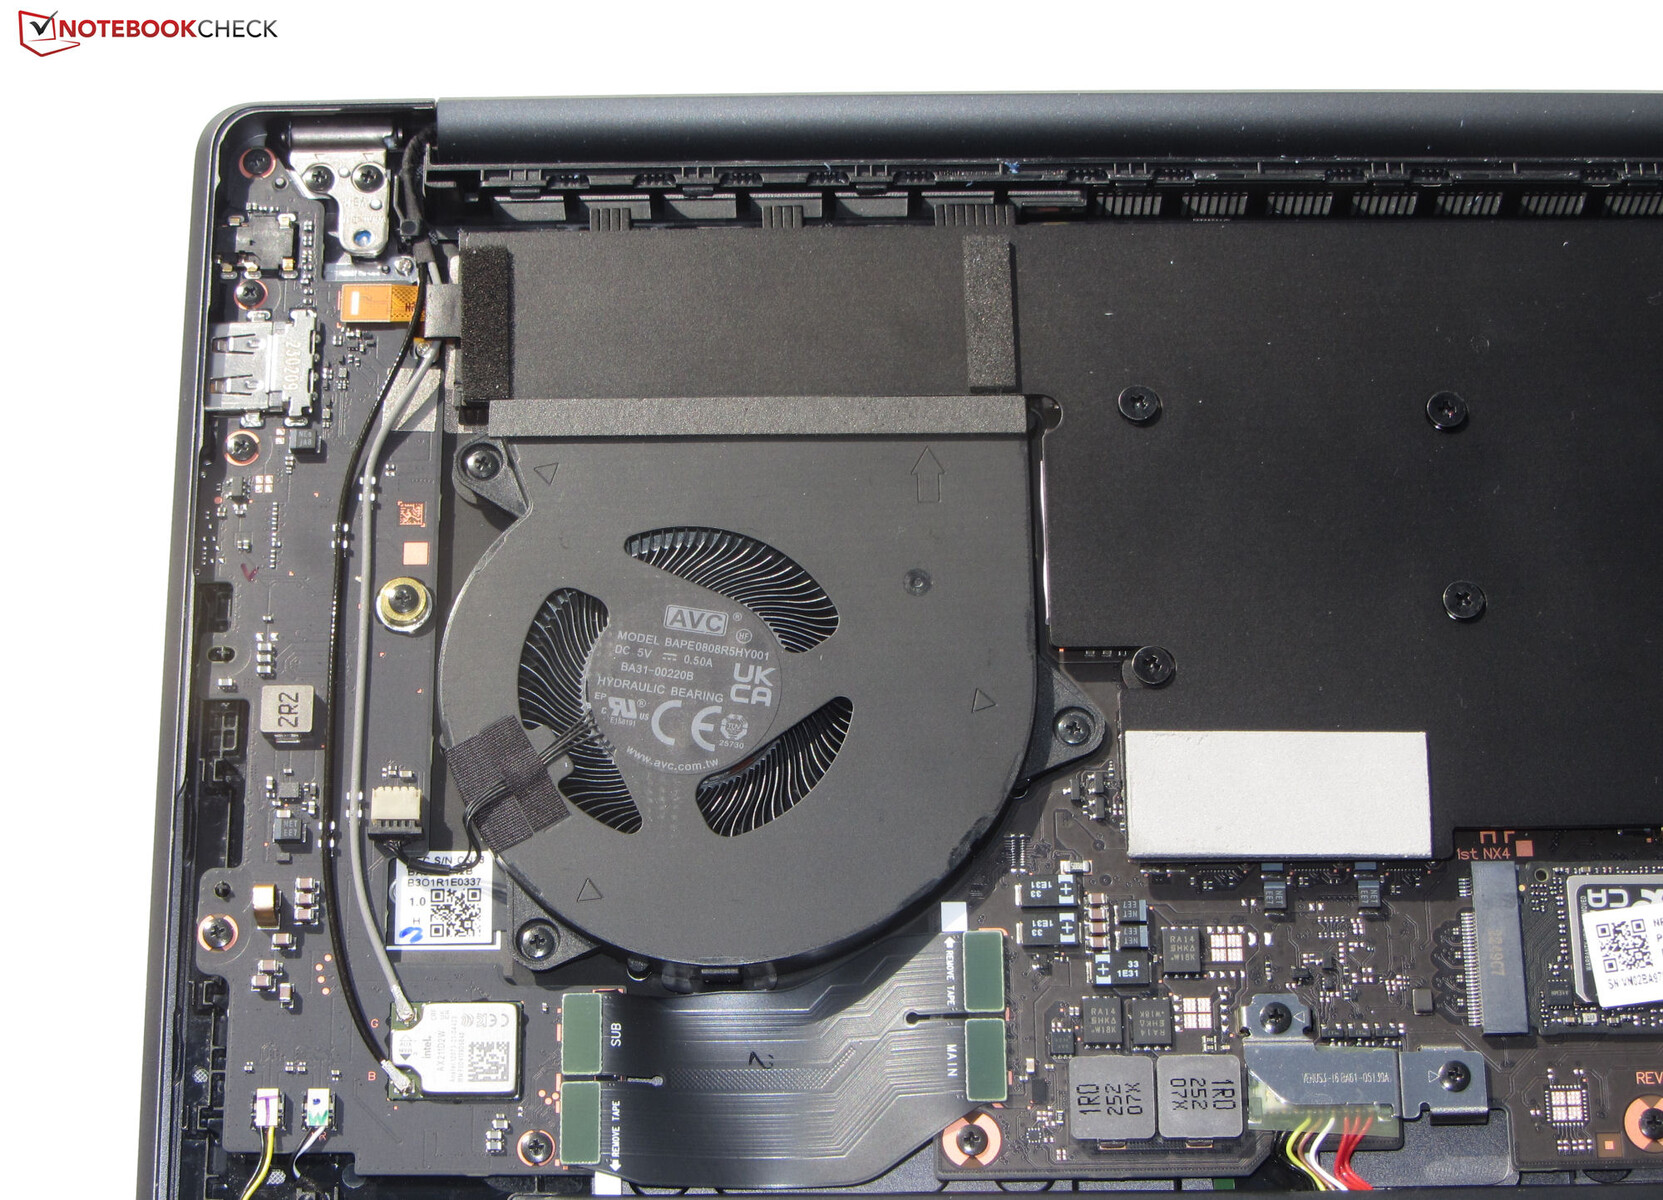
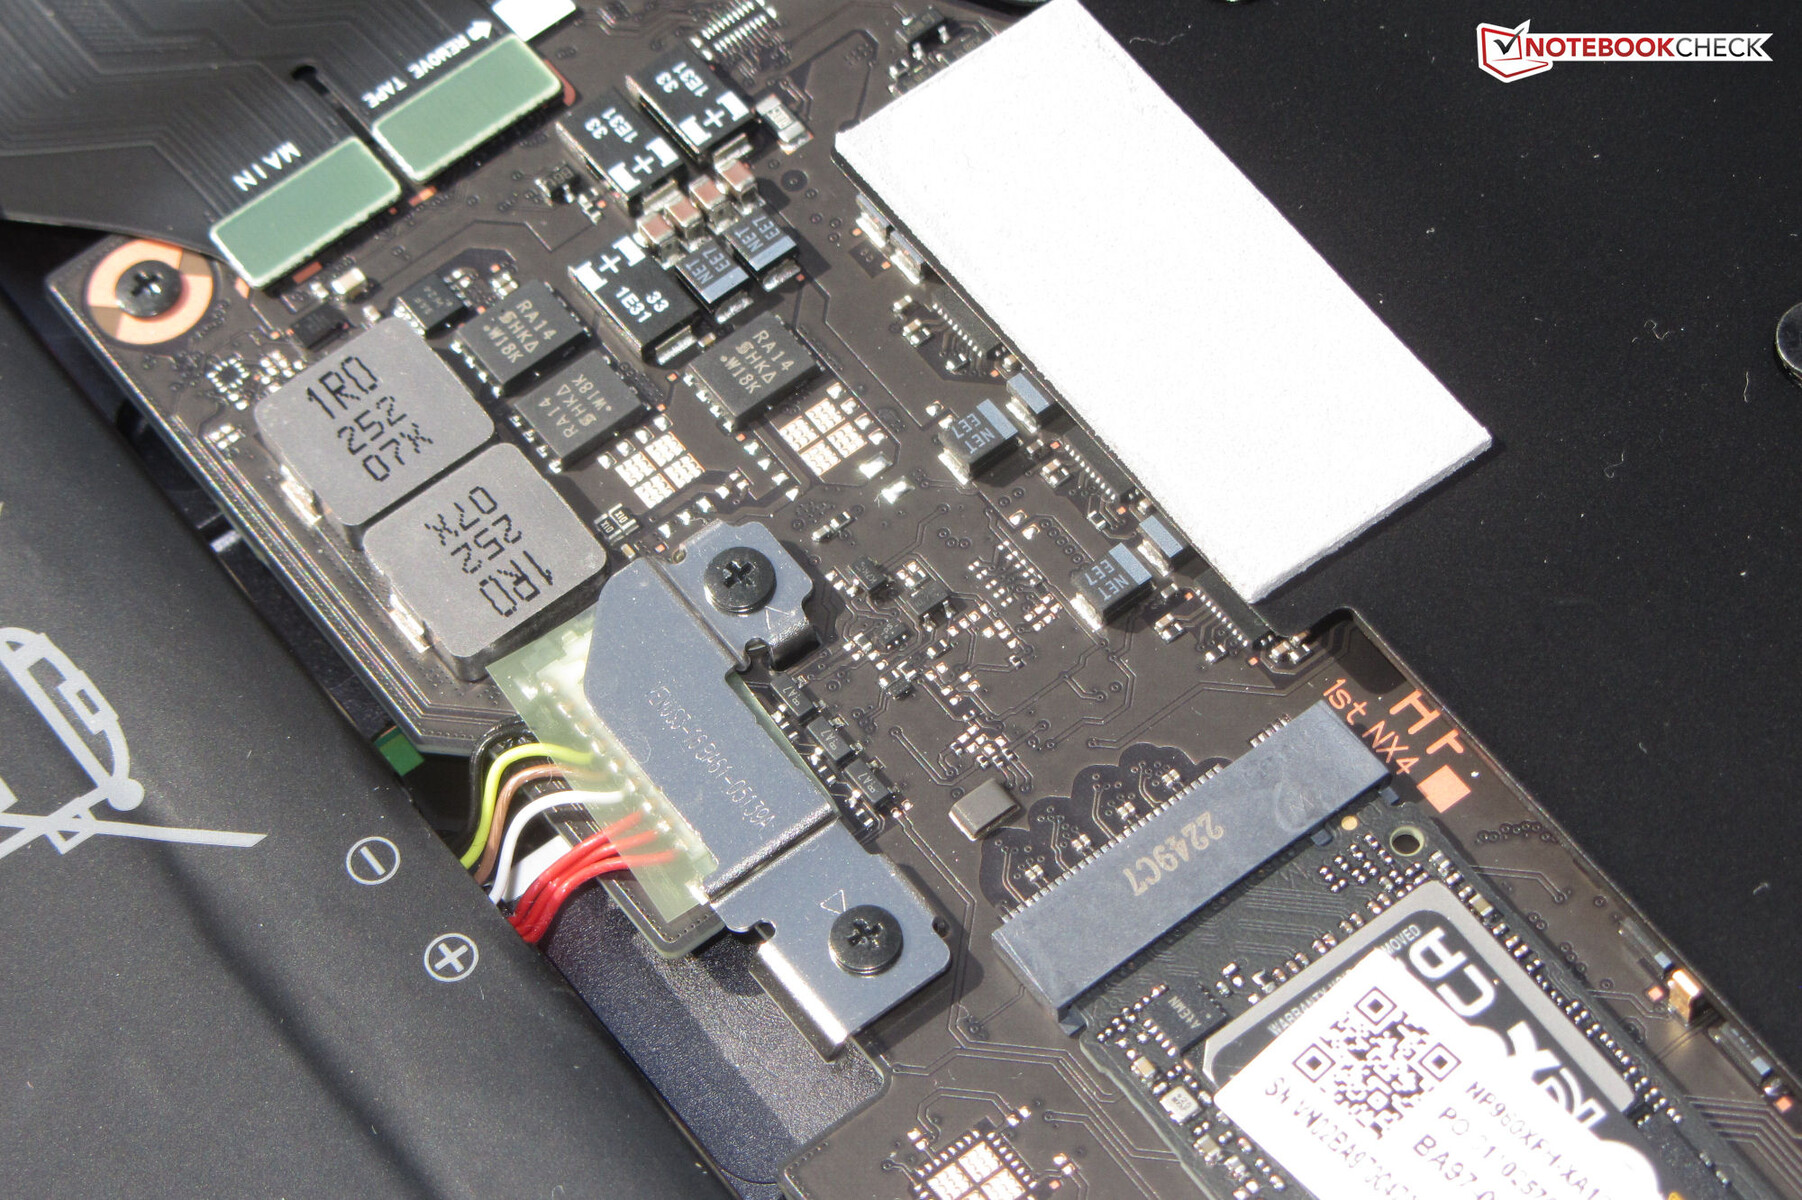
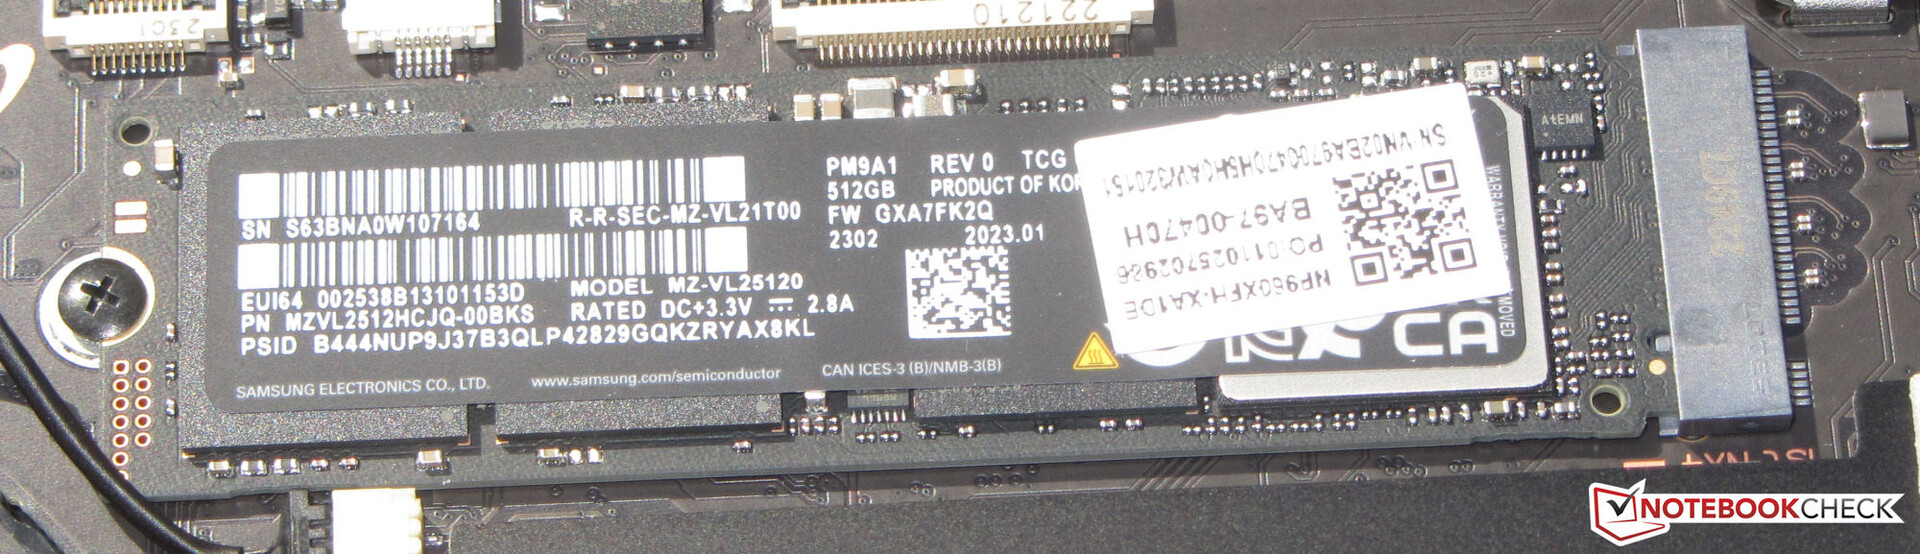
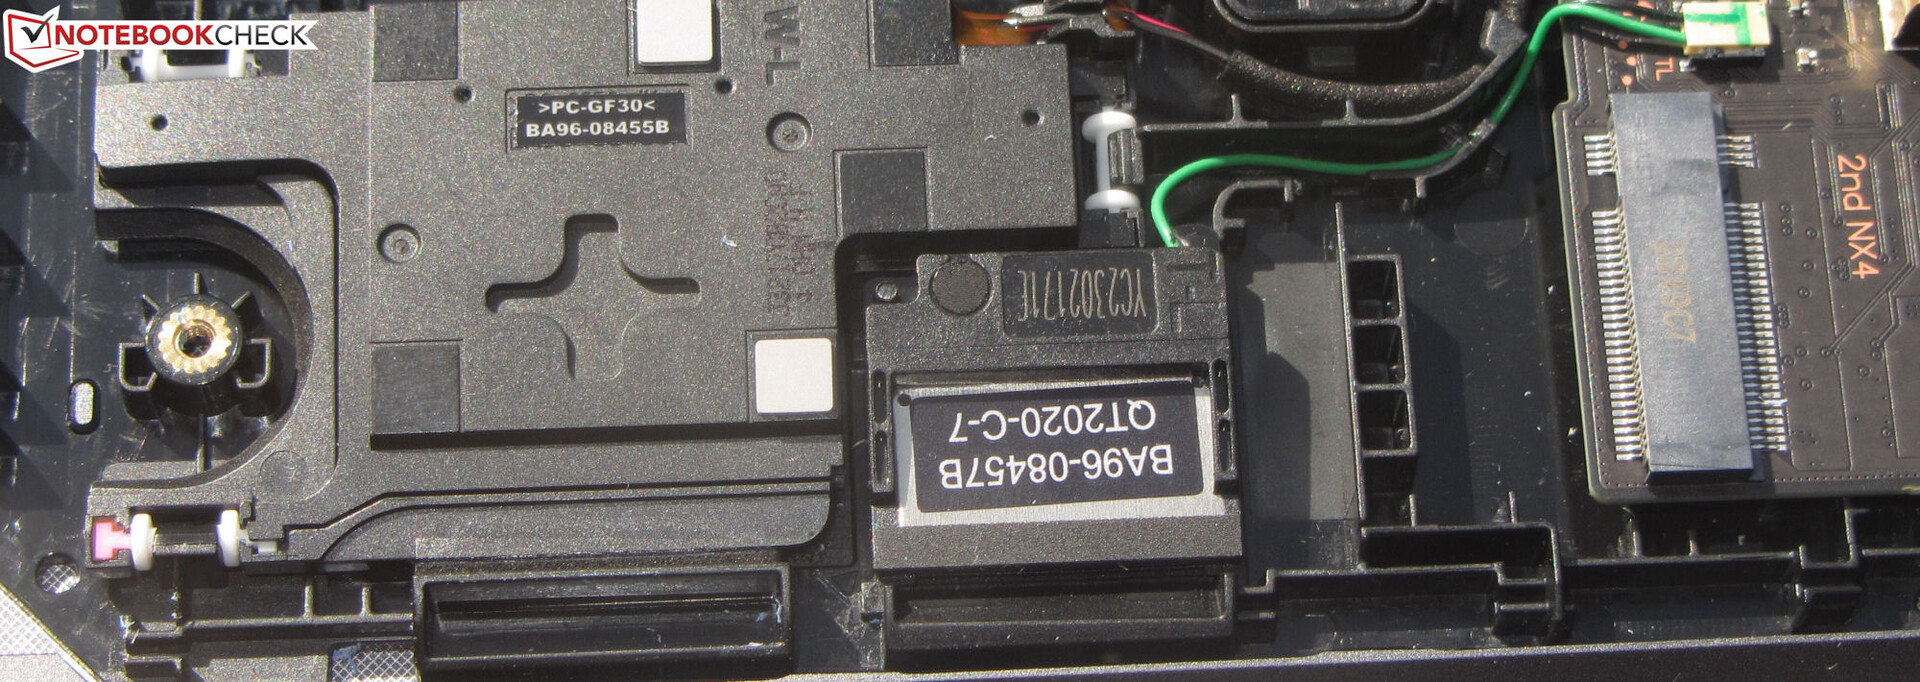
Pour démonter le couvercle inférieur, il faut retirer toutes les vis qui sont cachées sous les quatre pieds en caoutchouc (insérés, non collés). Ensuite, il faut faire attention ( !) en retirant le couvercle inférieur, qui est très serré et peut être endommagé. Nous recommandons d'utiliser une spatule plate. Ensuite, il est possible d'accéder au SSD (PCIe 4, M.2-2280), au deuxième emplacement SSD, aux ventilateurs, aux haut-parleurs et à la batterie.
Garantie
Samsung accorde au 16 pouces une garantie de deux ans en Allemagne. Une extension d'un ou deux ans coûte respectivement 79 et 149 euros. Ces conditions peuvent être différentes dans d'autres pays, les acheteurs doivent donc vérifier avant d'acheter.
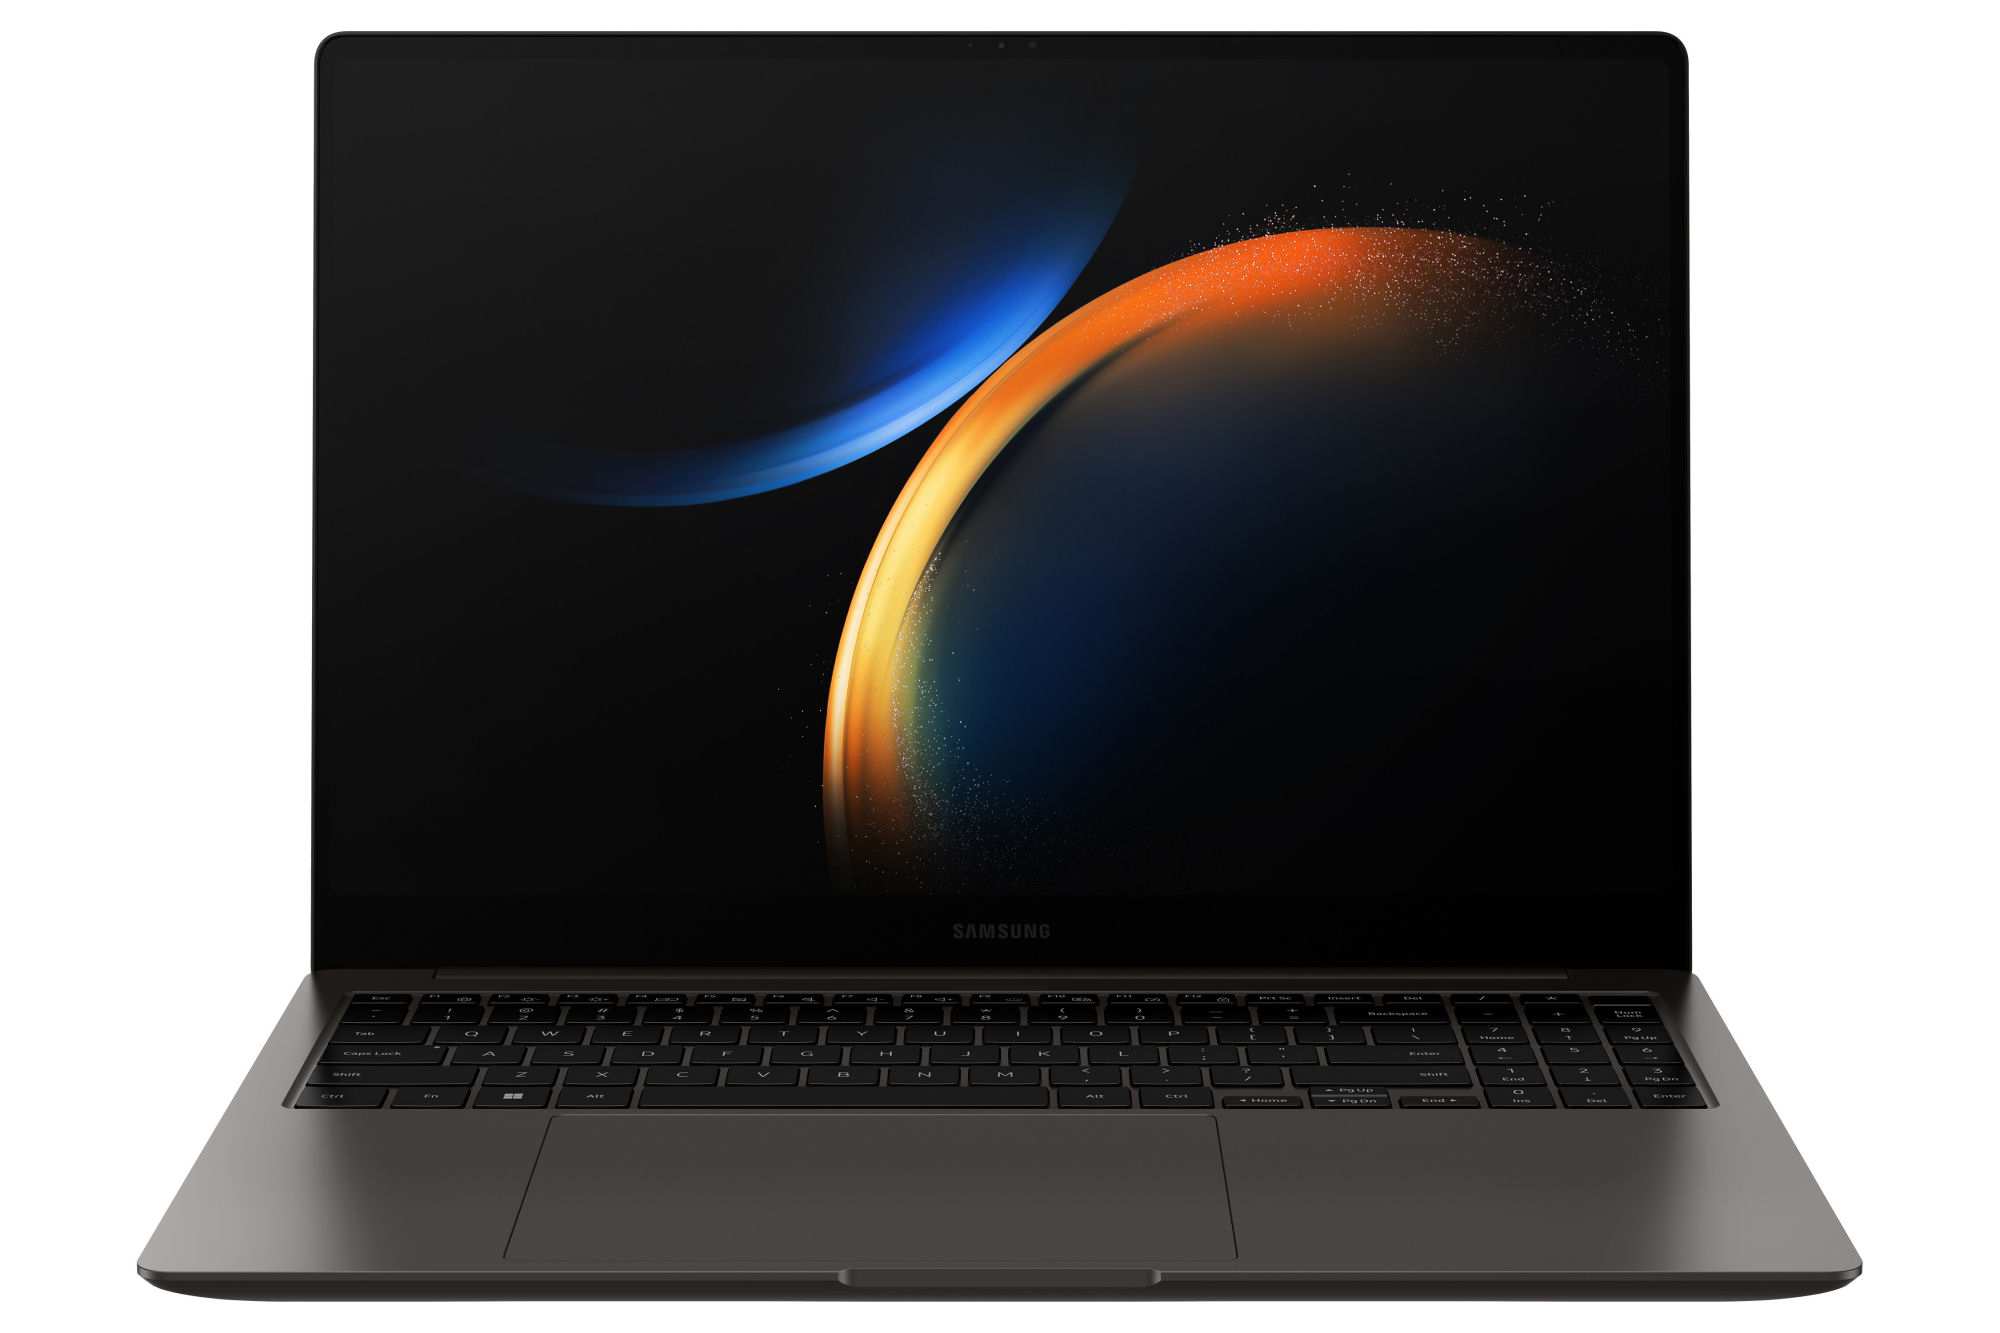
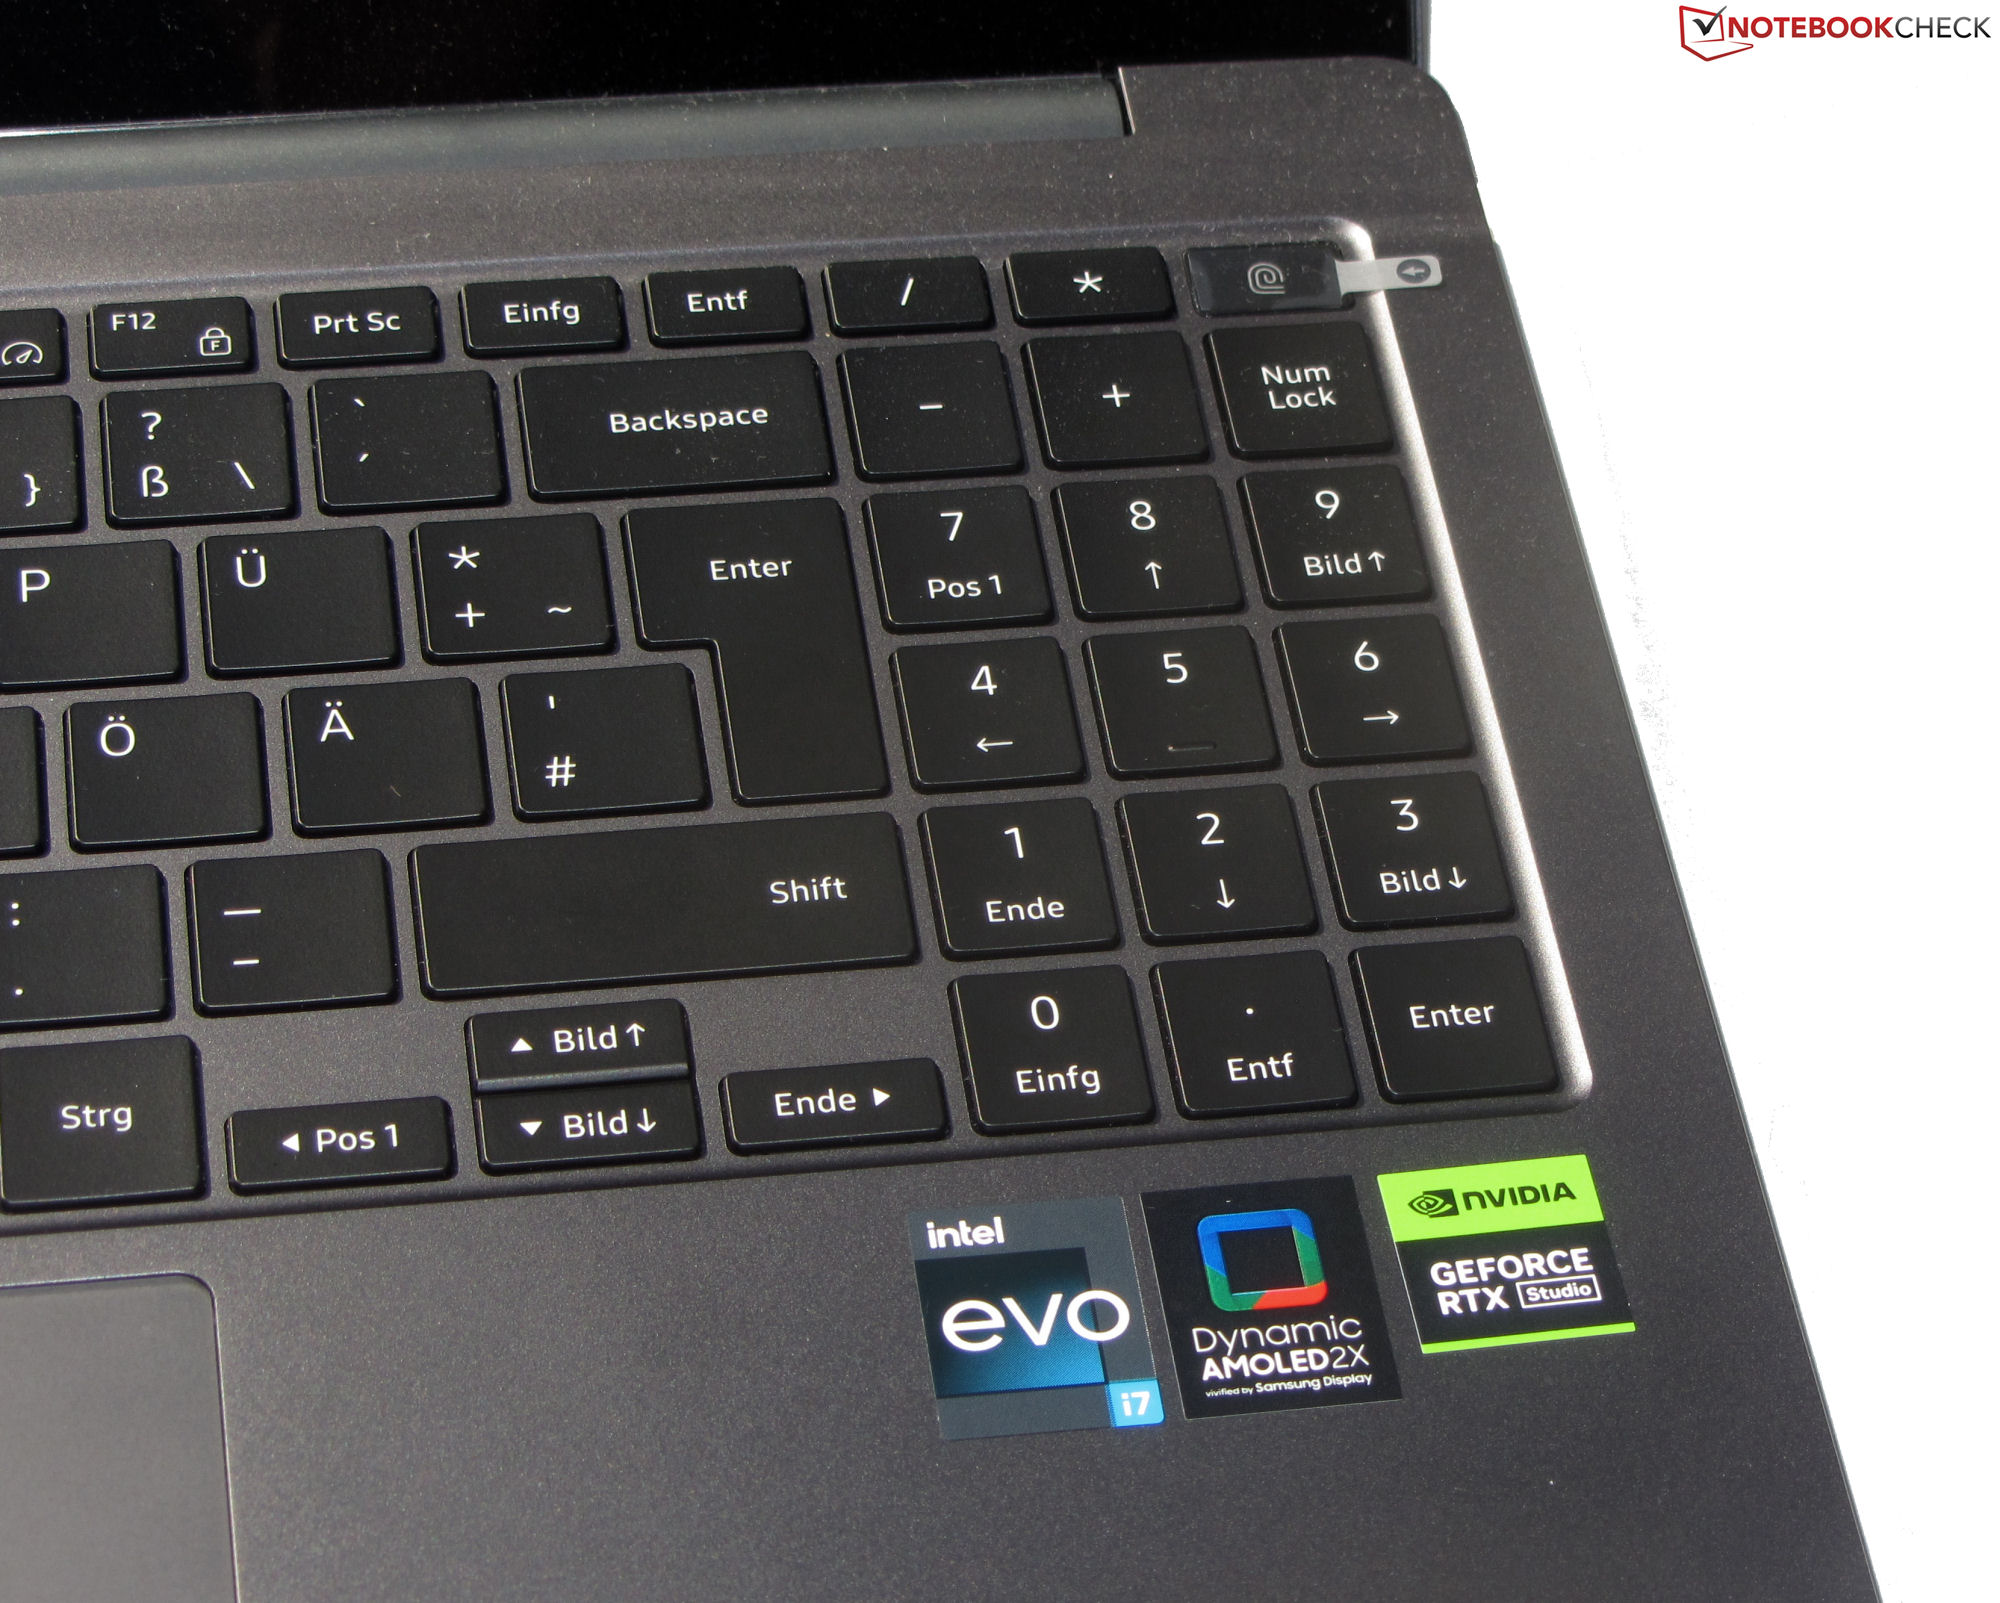
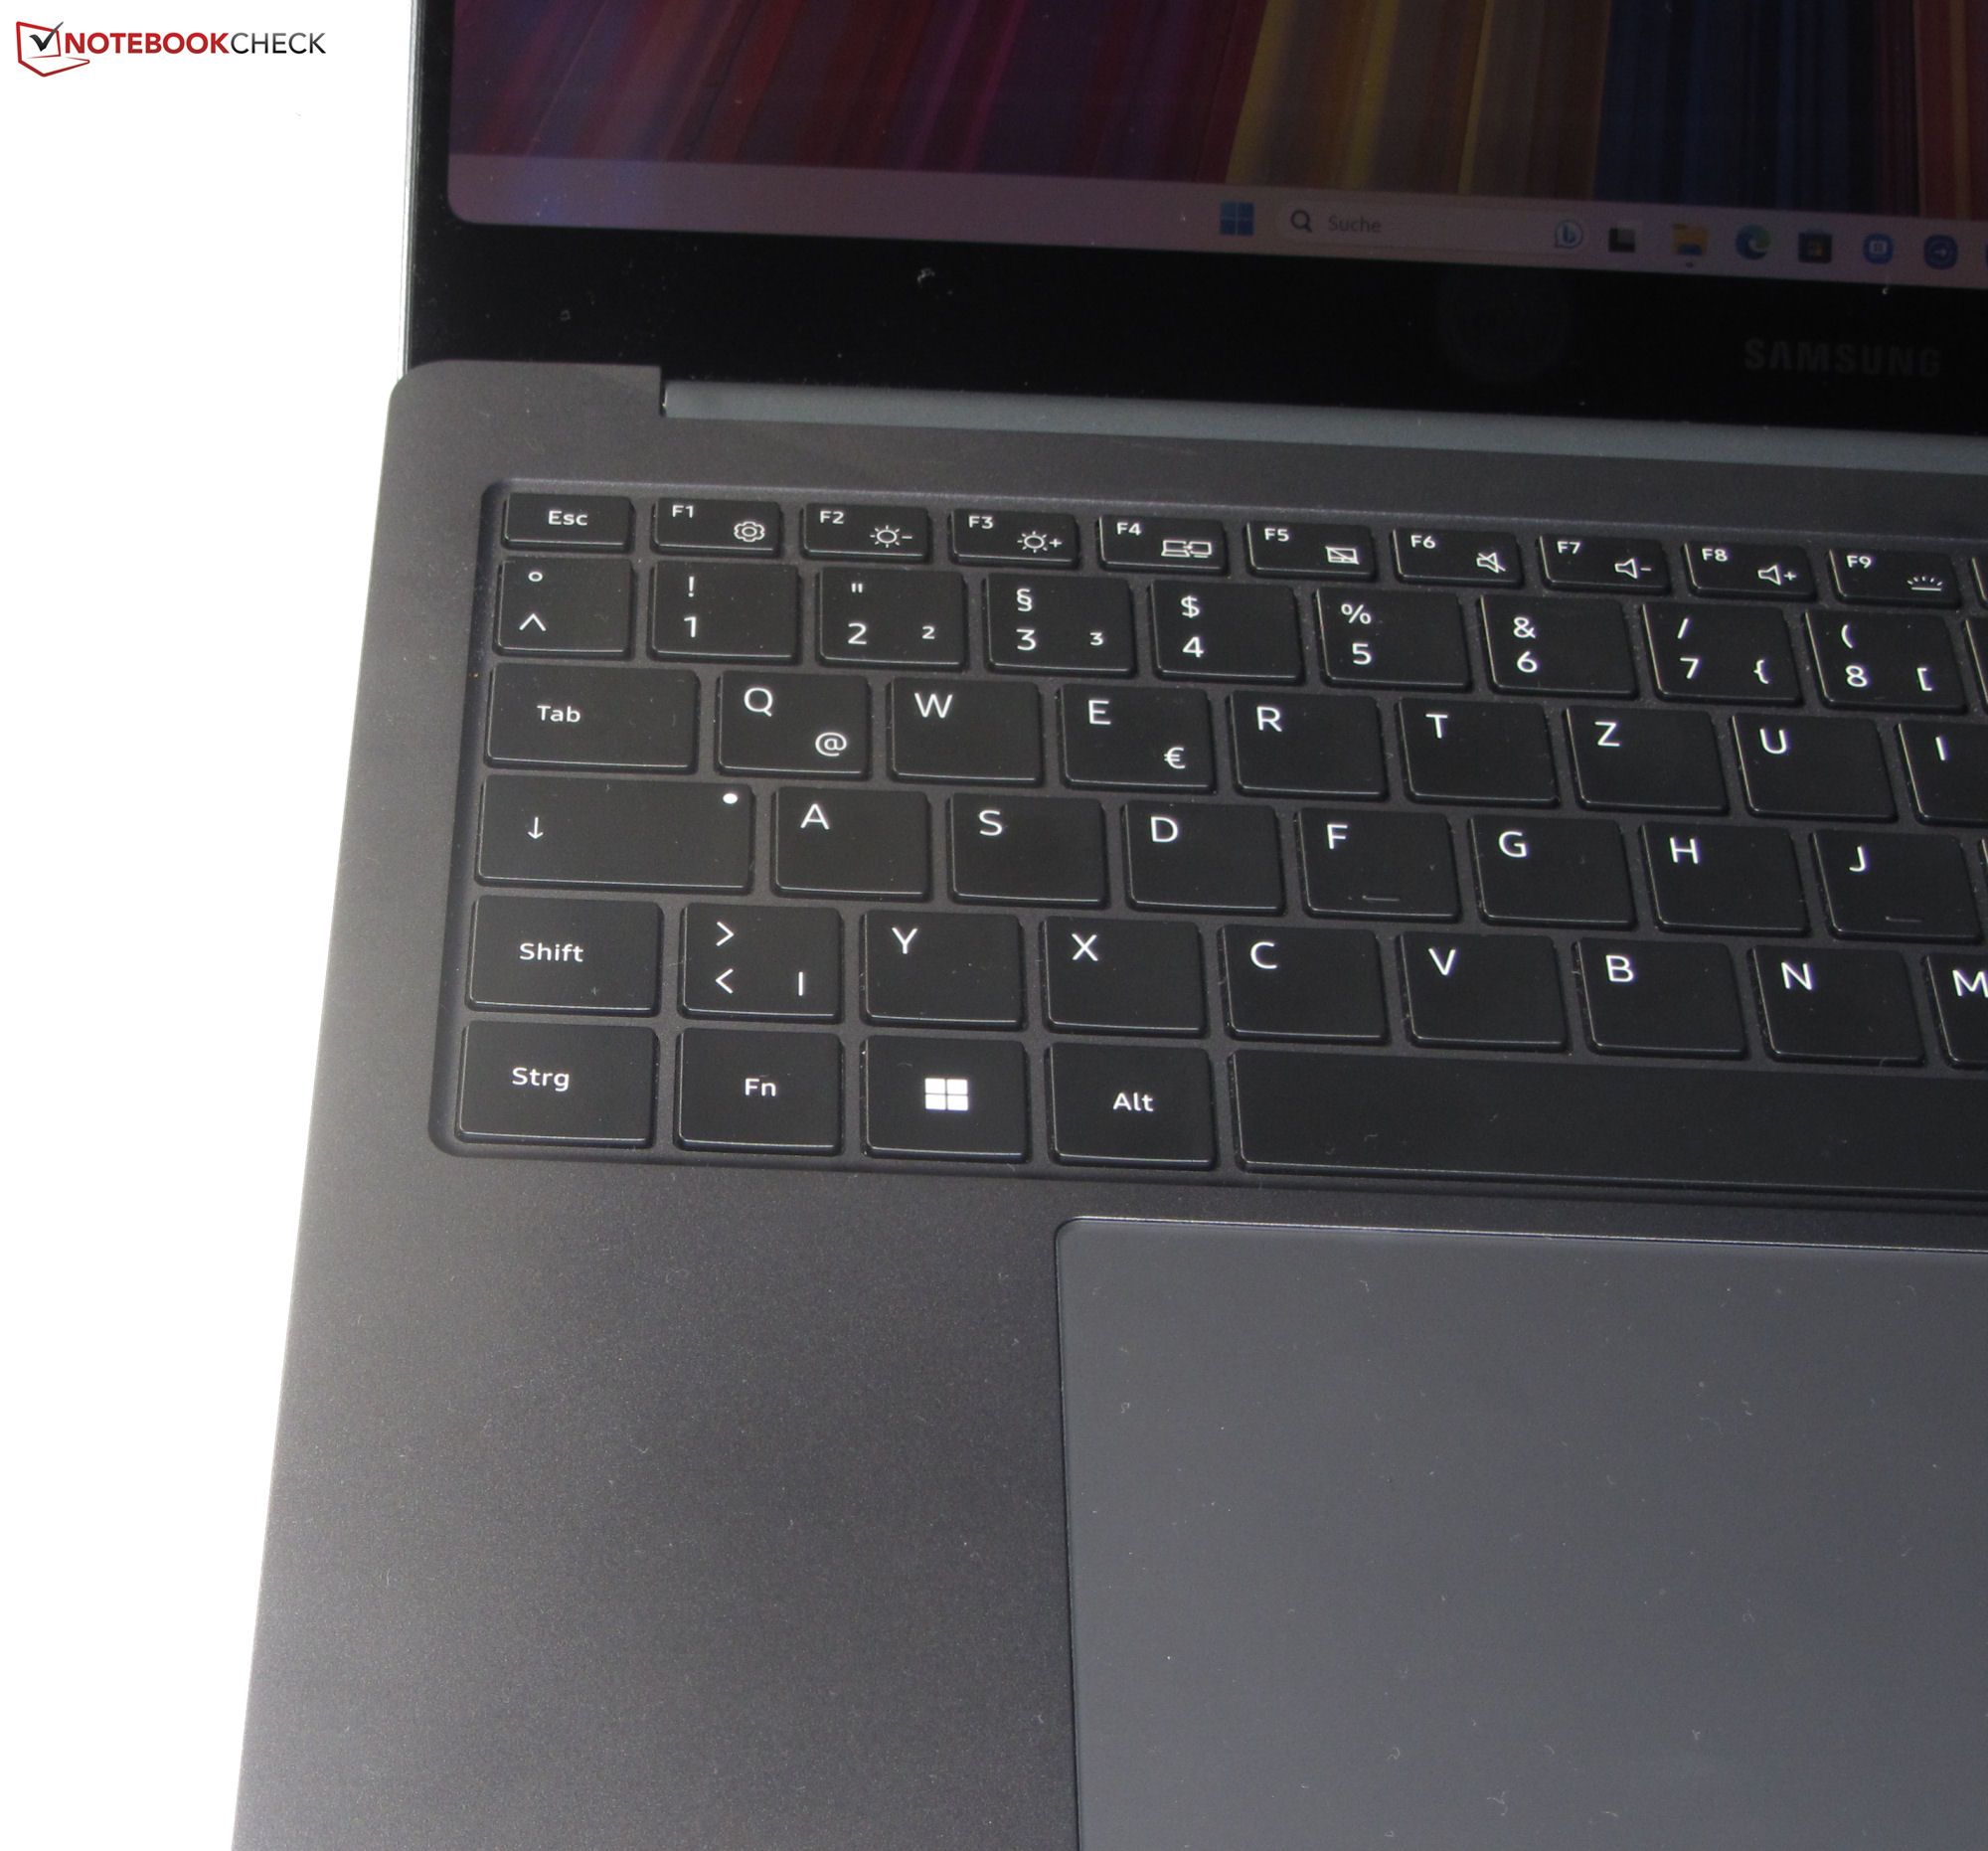
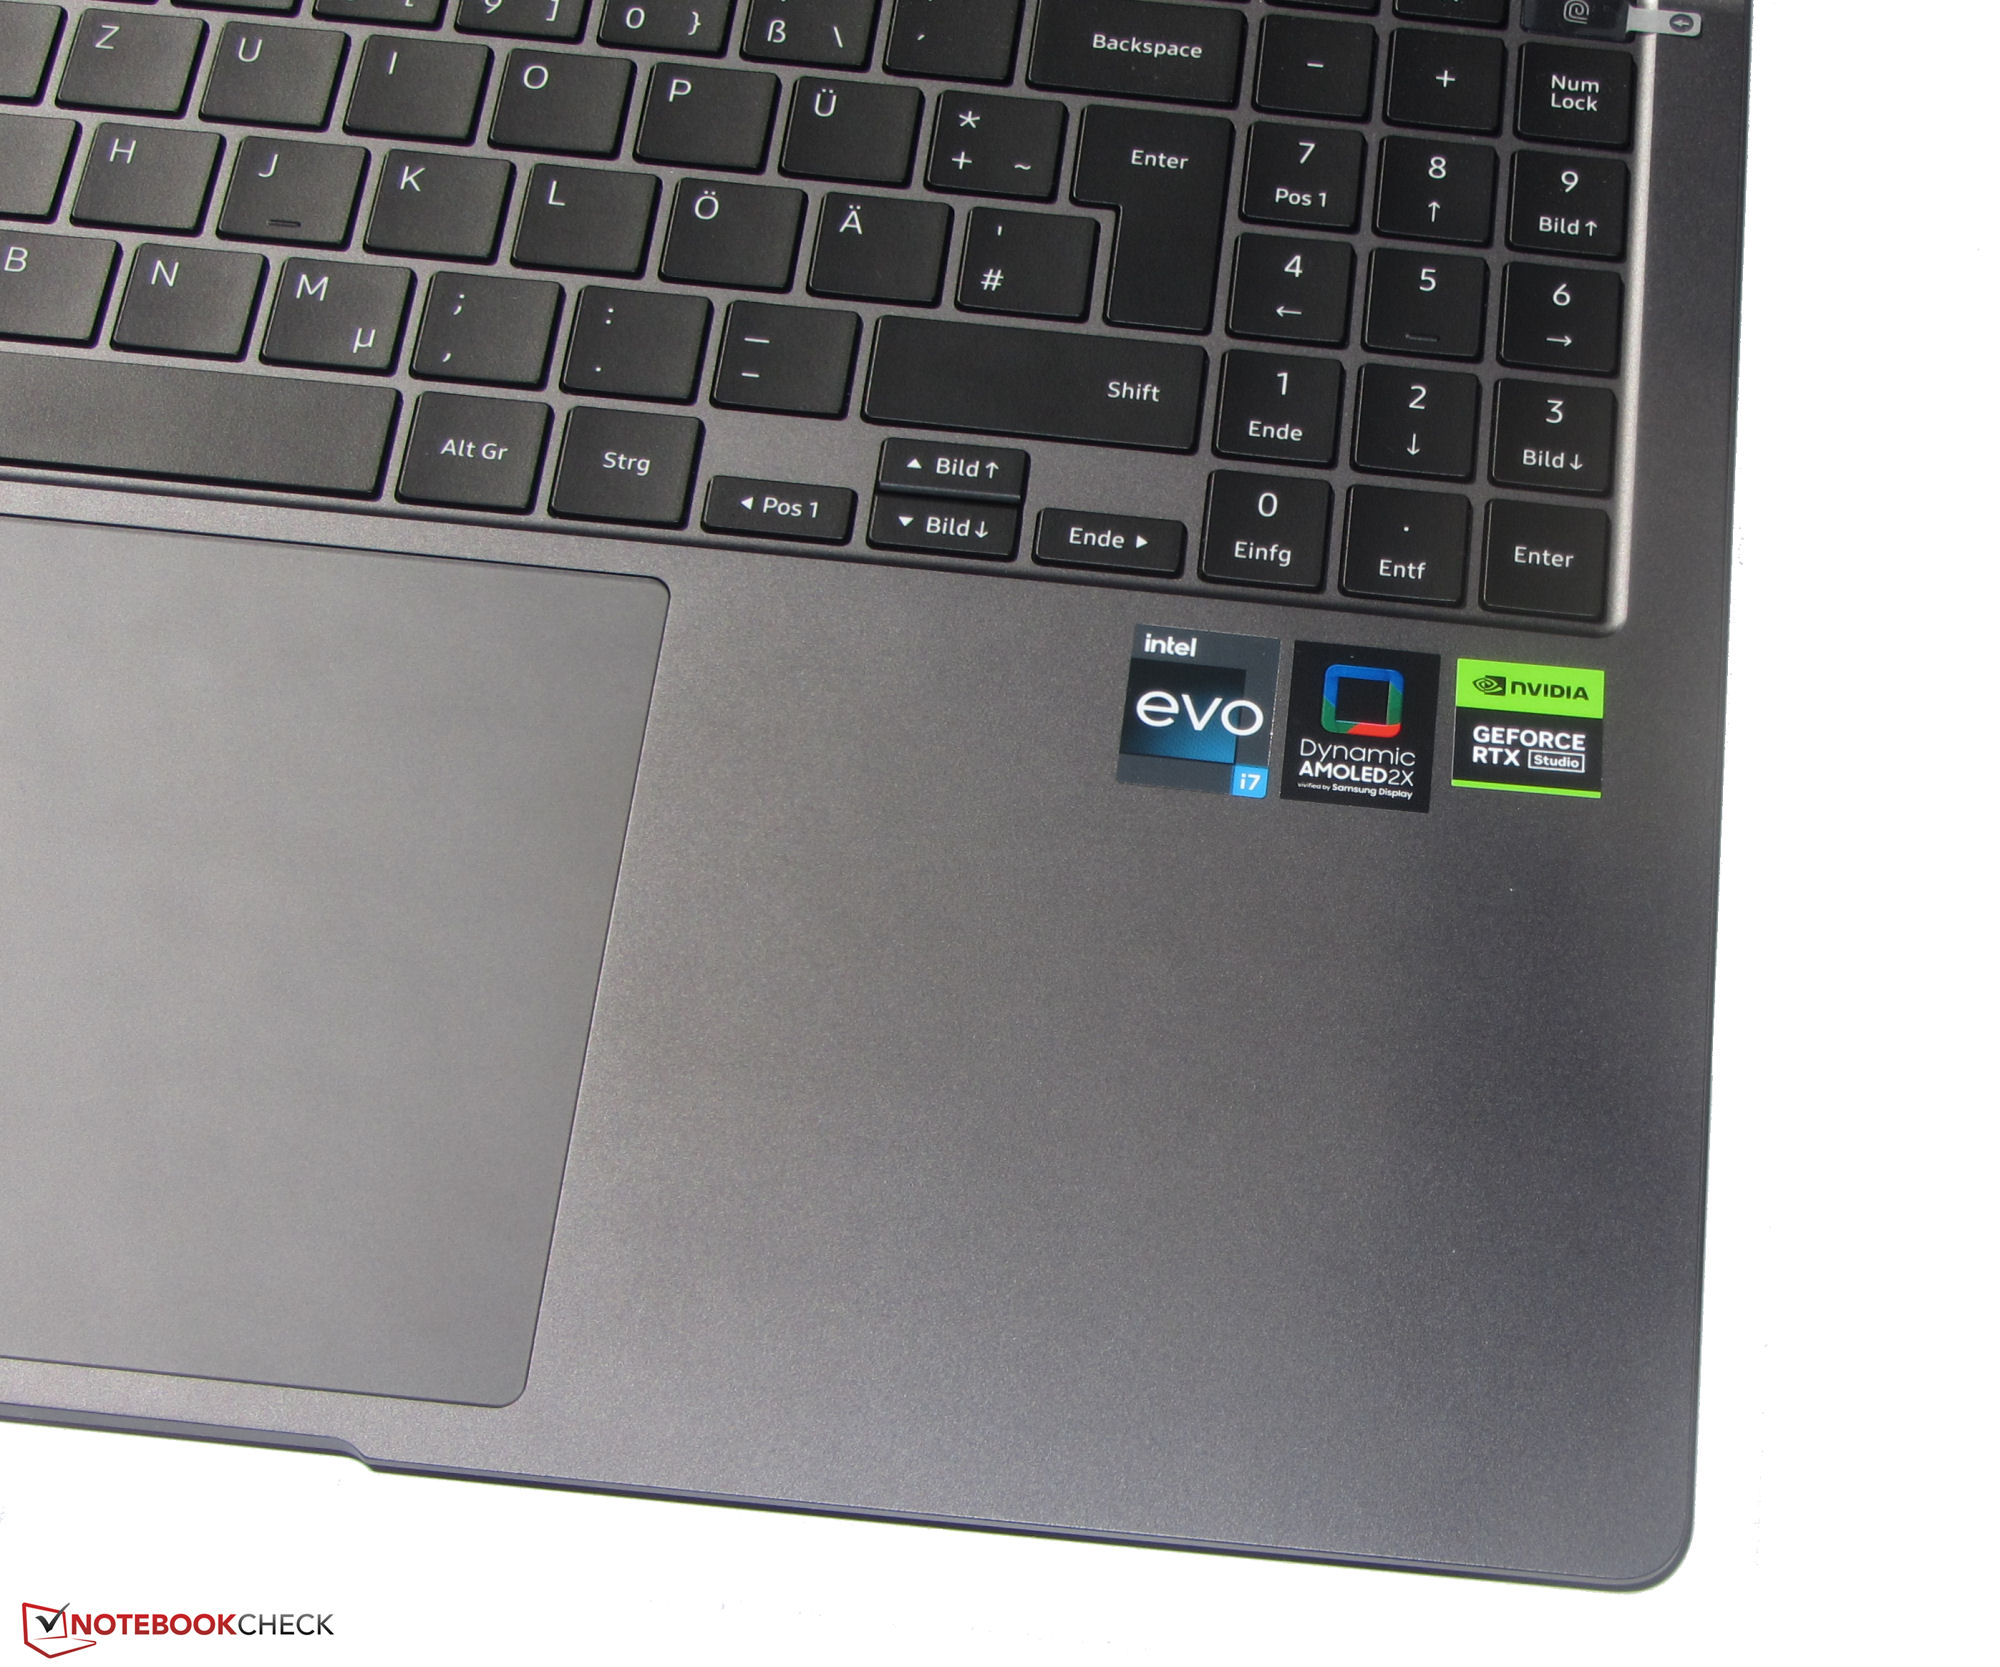
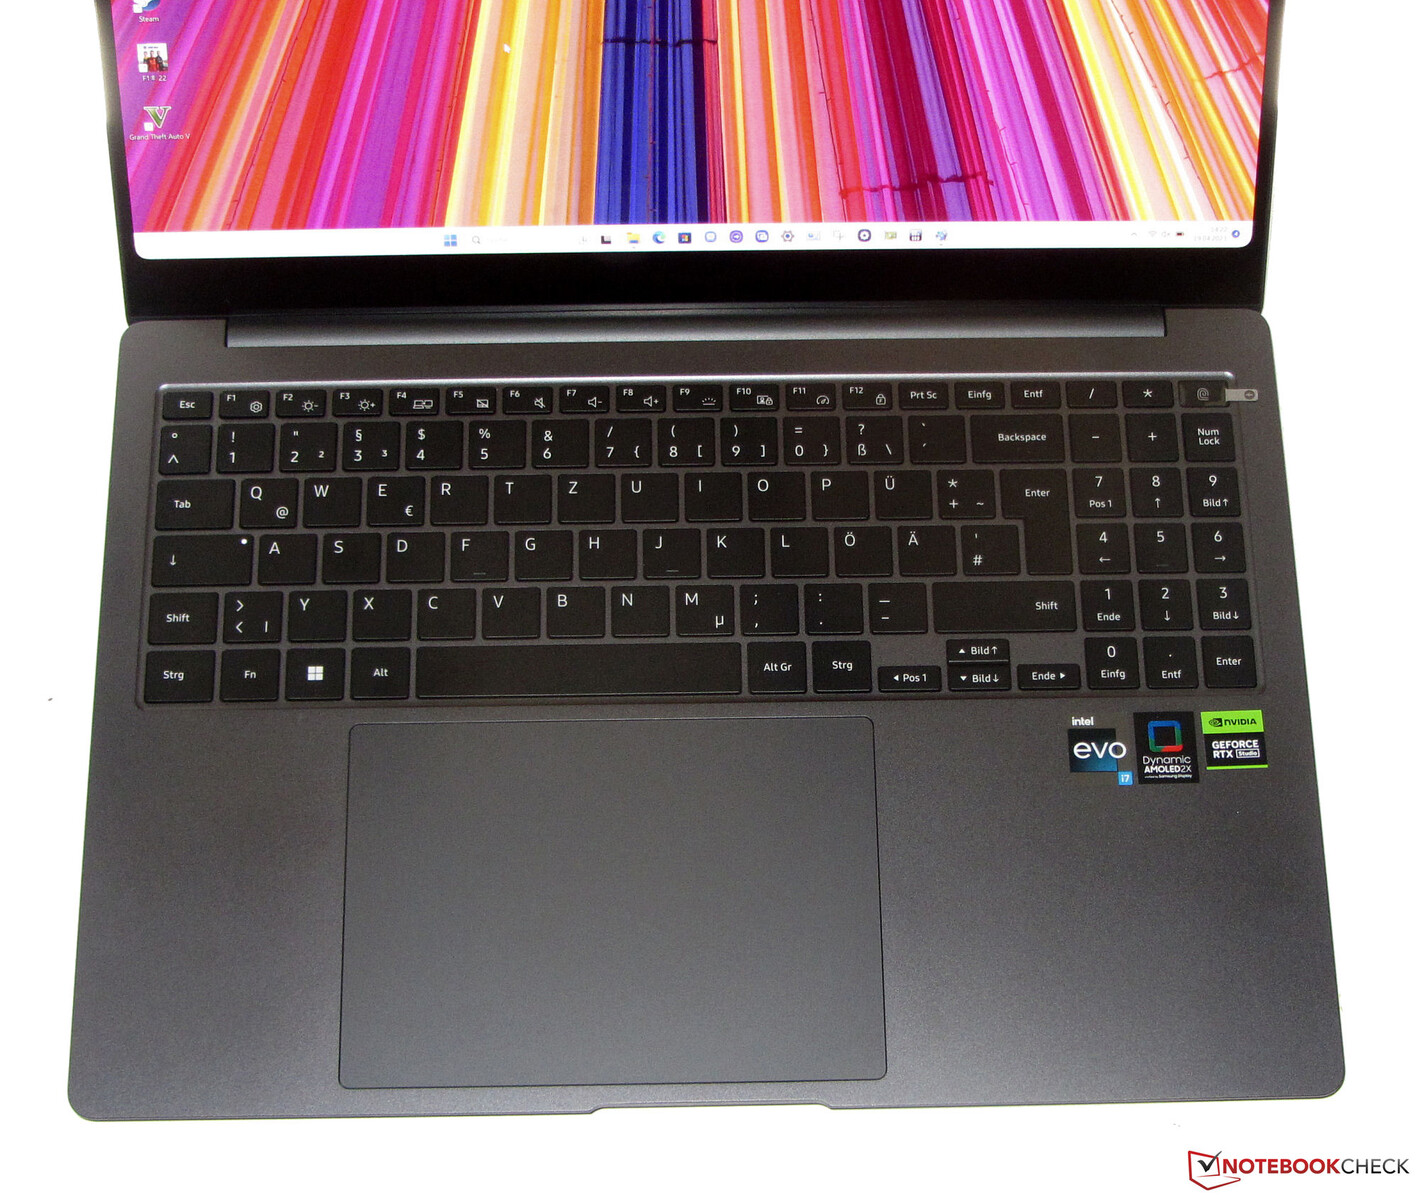
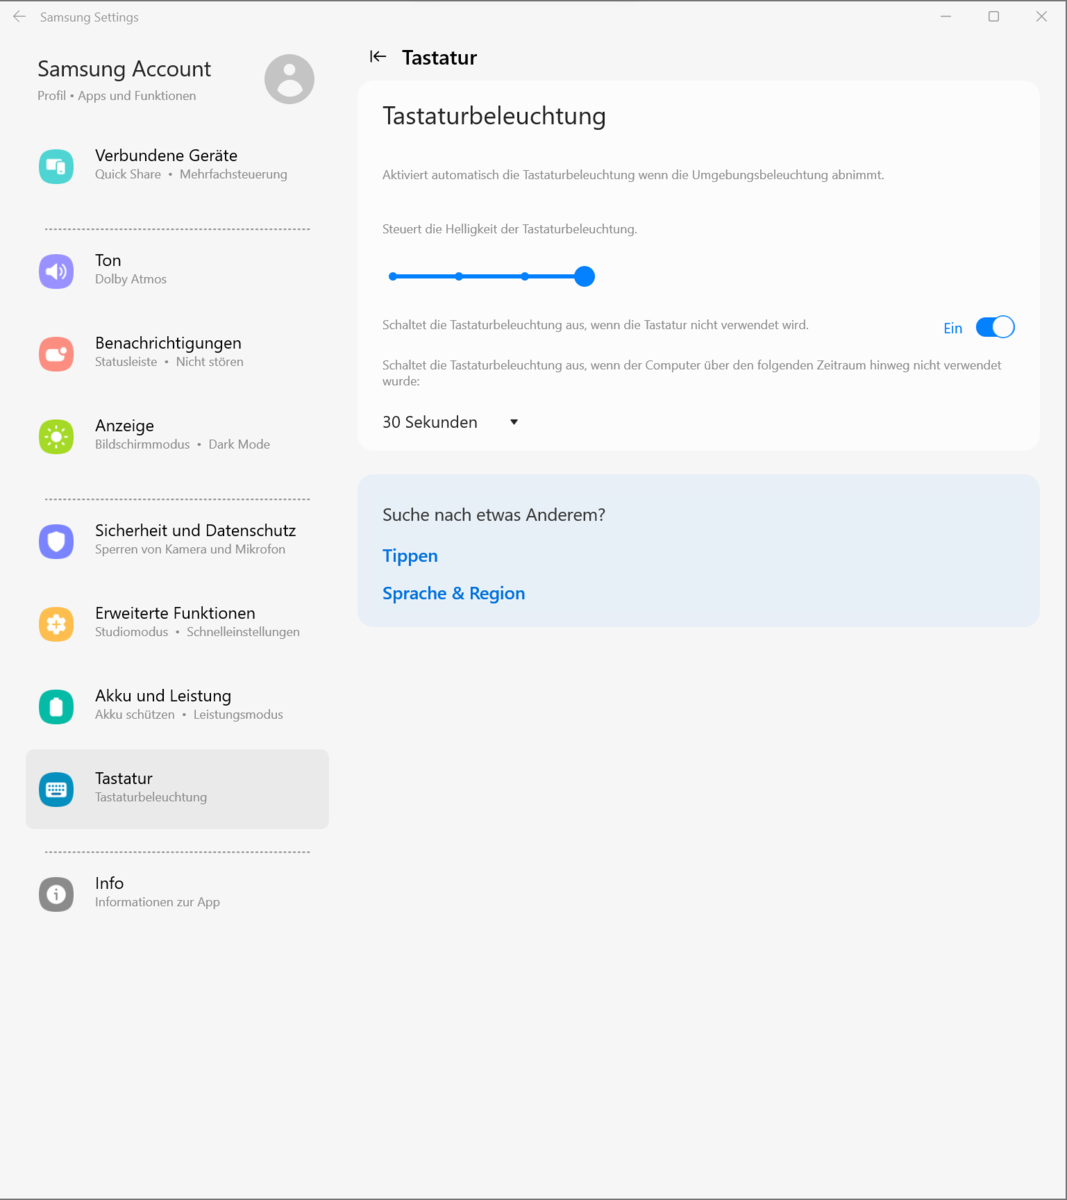
Périphériques d'entrée - Galaxy Book3 offre un clavier rétroéclairé
Clavier
Le NP960XFH est doté d'un clavier chiclet rétroéclairé et d'un pavé numérique. Les touches lisses et légèrement concaves offrent une faible course et un point de pression clair. La résistance des touches est acceptable. Le clavier cède légèrement sous la pression, mais ce n'est pas un motif d'inquiétude. Le rétroéclairage à trois niveaux est contrôlé par une touche de fonction. Dans l'ensemble, Samsung propose un clavier adapté à un usage quotidien.
Pavé tactile
Le ClickPad mesure environ 15,1 x 10,8 cm. Une taille inférieure aurait également suffi : Si les touches WASD sont utilisées de la main gauche, le pouce repose entièrement sur le pavé. Ce dernier doit donc être désactivé dans ce cas. Pour le reste, la surface lisse est très propice au glissement des doigts et au swipe. Il réagit aux saisies dans les coins, offre une course courte et un point de pression clair.
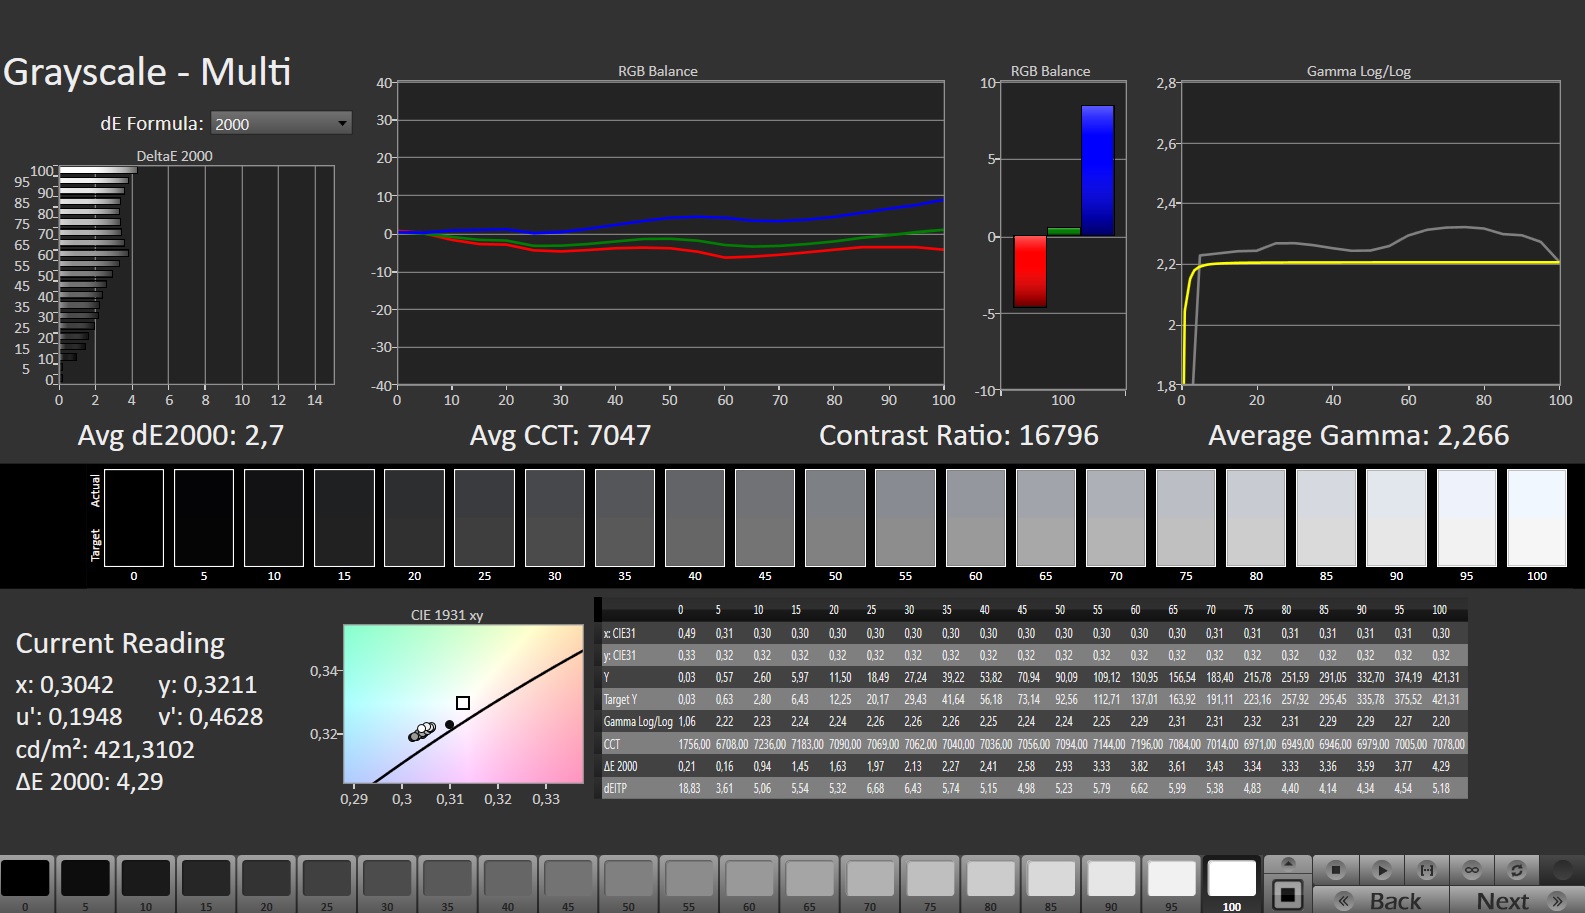
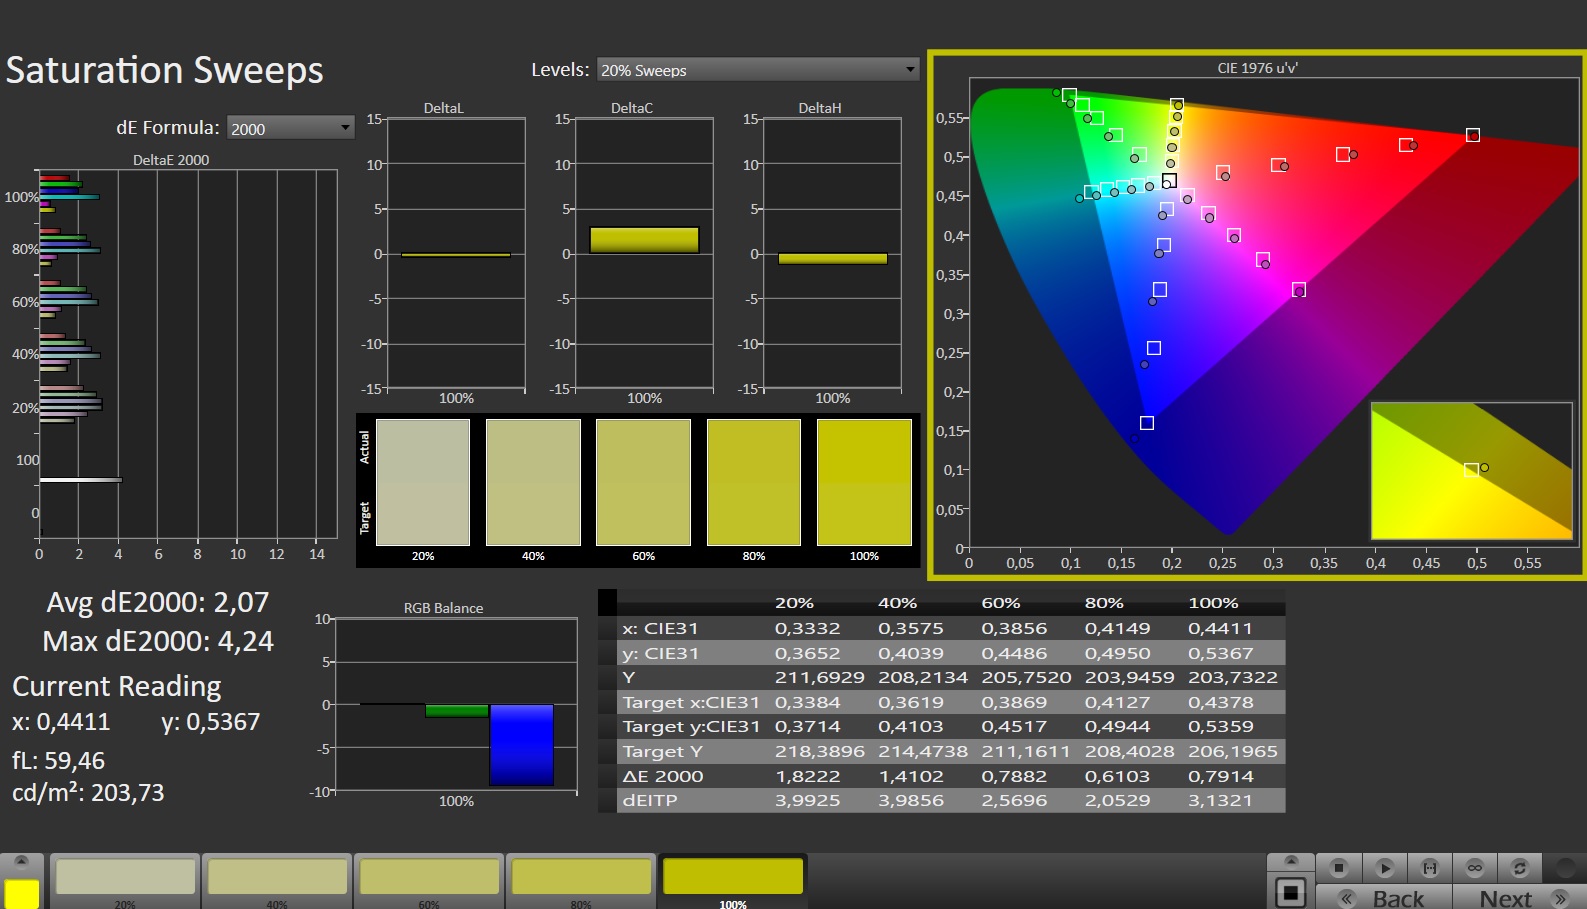
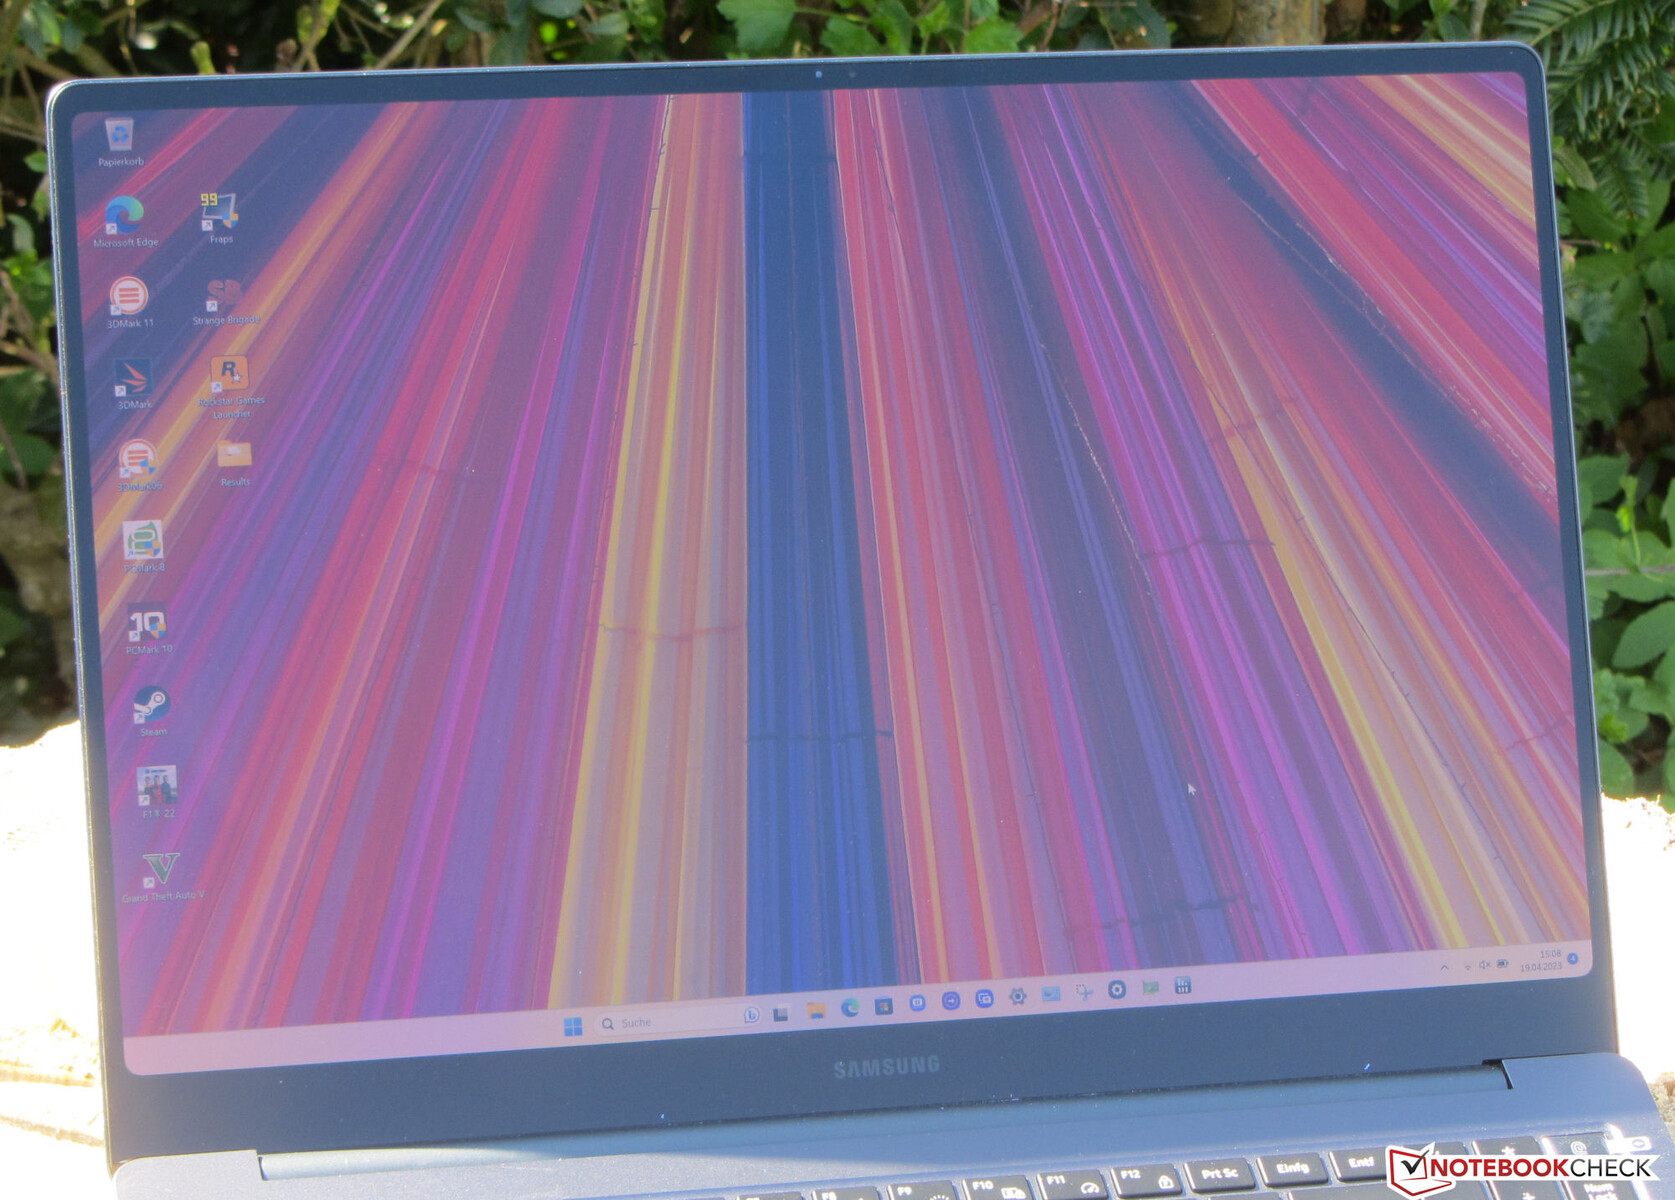
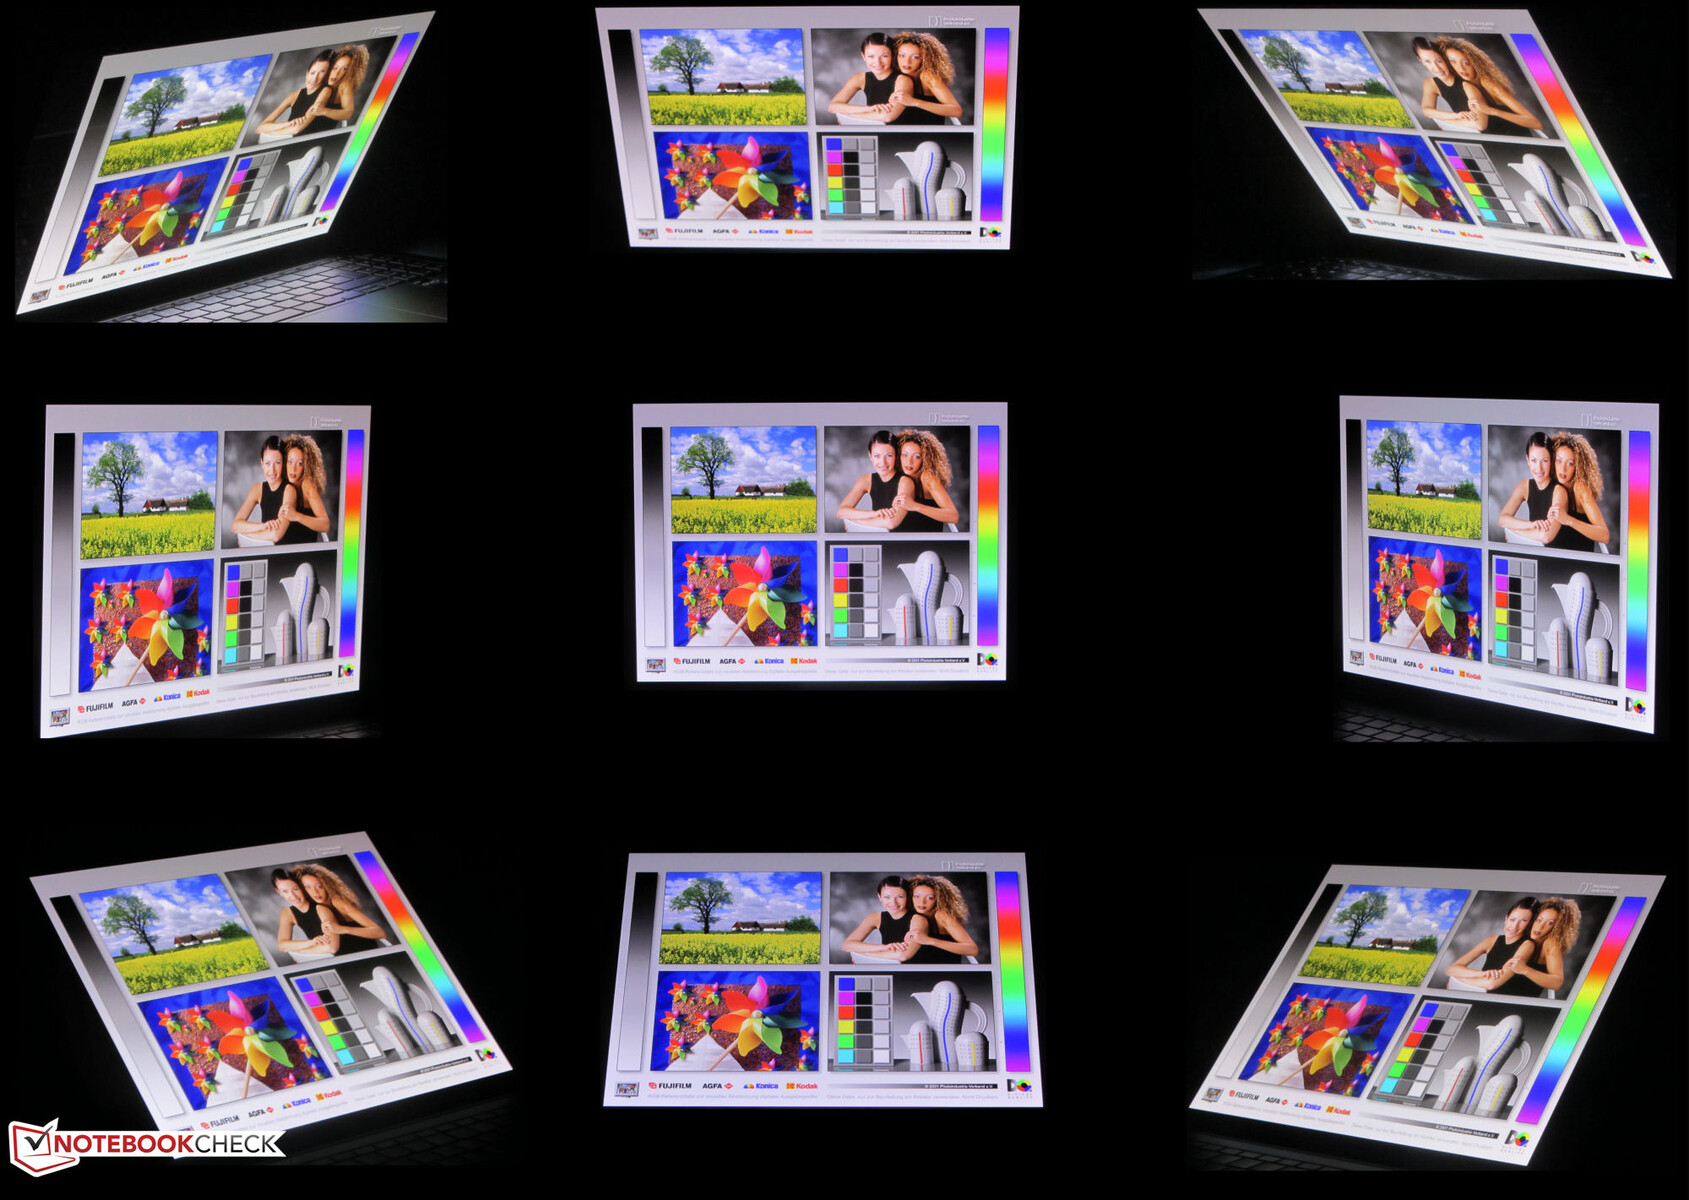
Écran - AMOLED au format 16:10
Le grand écran de 16 pouces (2880x1800) dans un format 16:10 convivial offre une excellente valeur de noir et des temps de réponse courts, ce qui est typique des OLED. La luminosité de l'écran dépasse l'objectif fixé, bien que leThinkBook 16p G3 ARH possède un écran beaucoup plus lumineux.
Les faiblesses du panneau OLED : il a une surface réfléchissante et scintille à un niveau de luminosité de ≤ 100 pour cent à une fréquence de 240 Hz. Le scintillement est lié au contrôle de la luminosité du panneau.
| |||||||||||||||||||||||||
Homogénéité de la luminosité: 93 %
Valeur mesurée au centre, sur batterie: 400 cd/m²
Contraste: 13333:1 (Valeurs des noirs: 0.03 cd/m²)
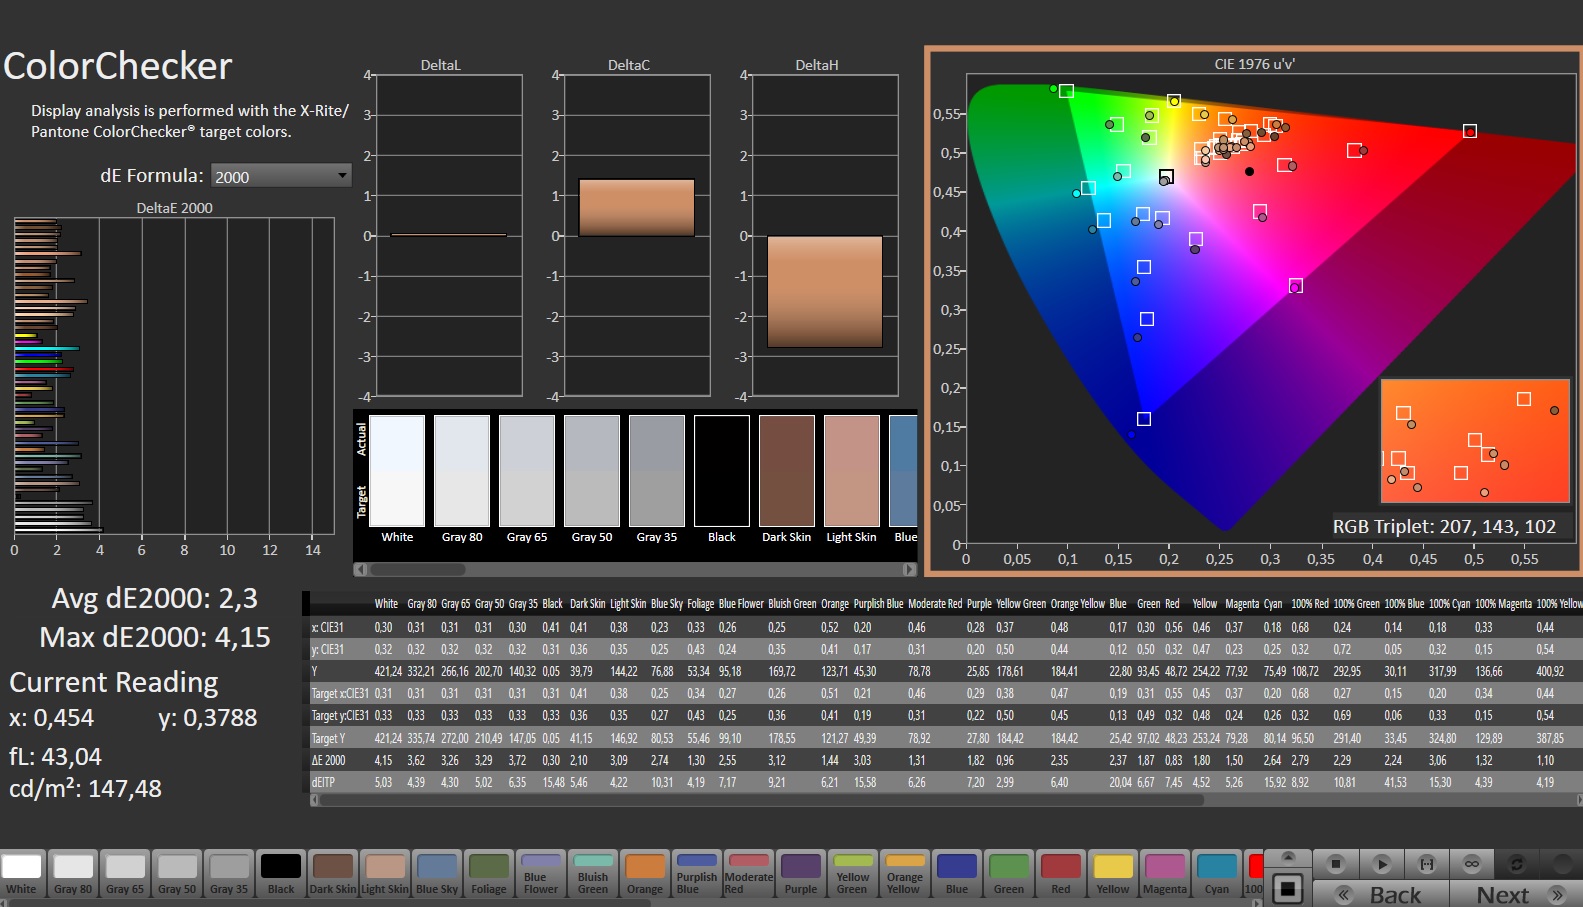
ΔE ColorChecker Calman: 2.3 | ∀{0.5-29.43 Ø4.71}
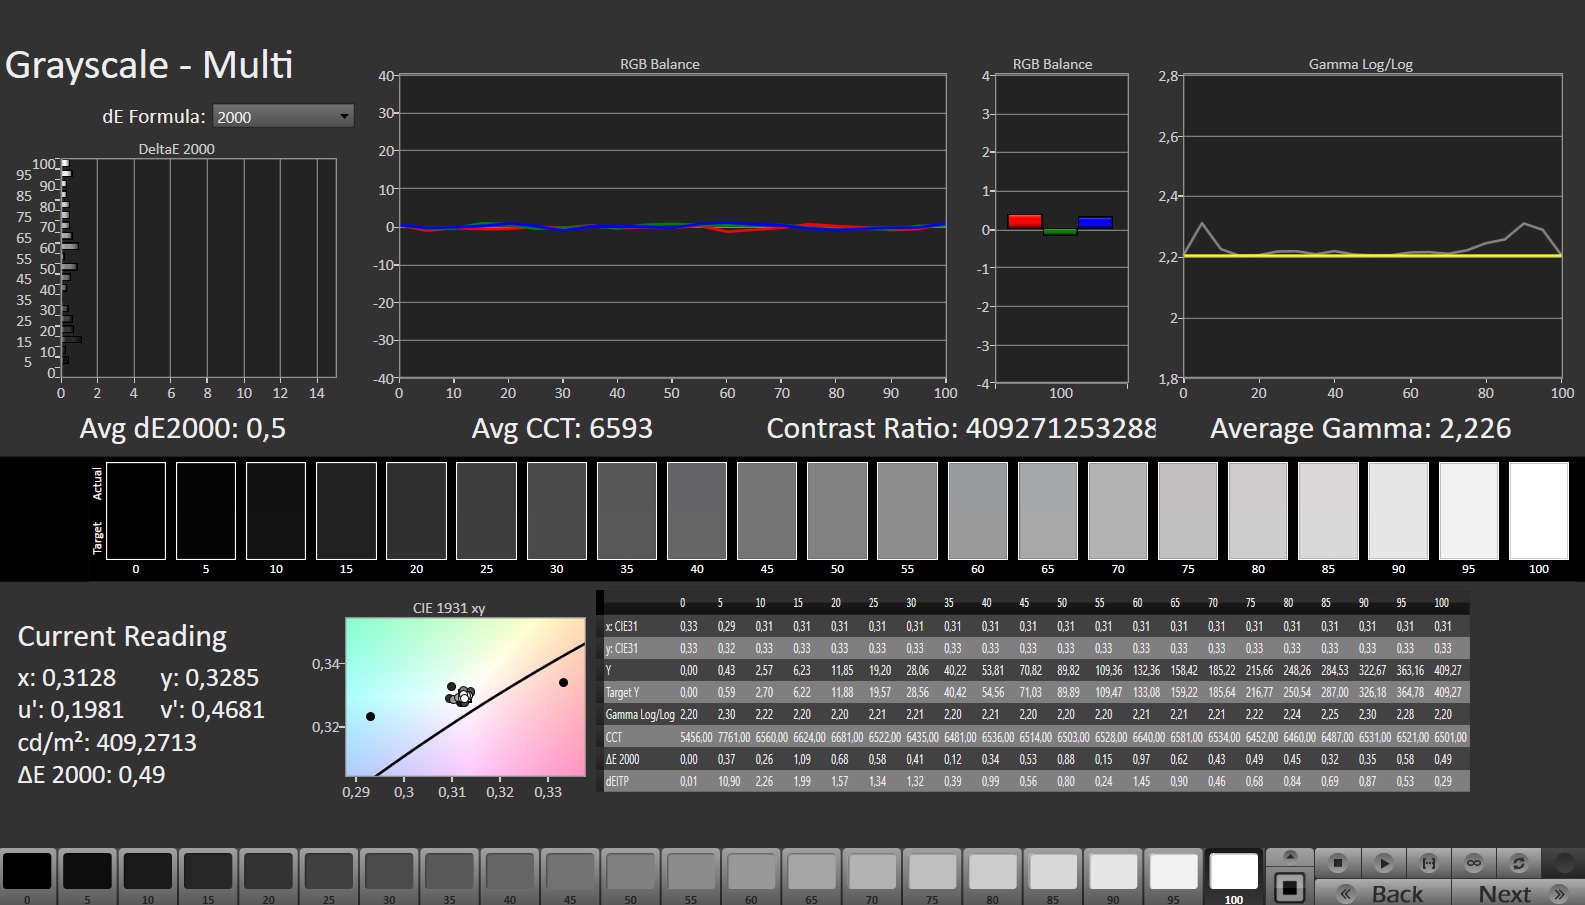
calibrated: 1.66
ΔE Greyscale Calman: 2.7 | ∀{0.09-98 Ø4.96}
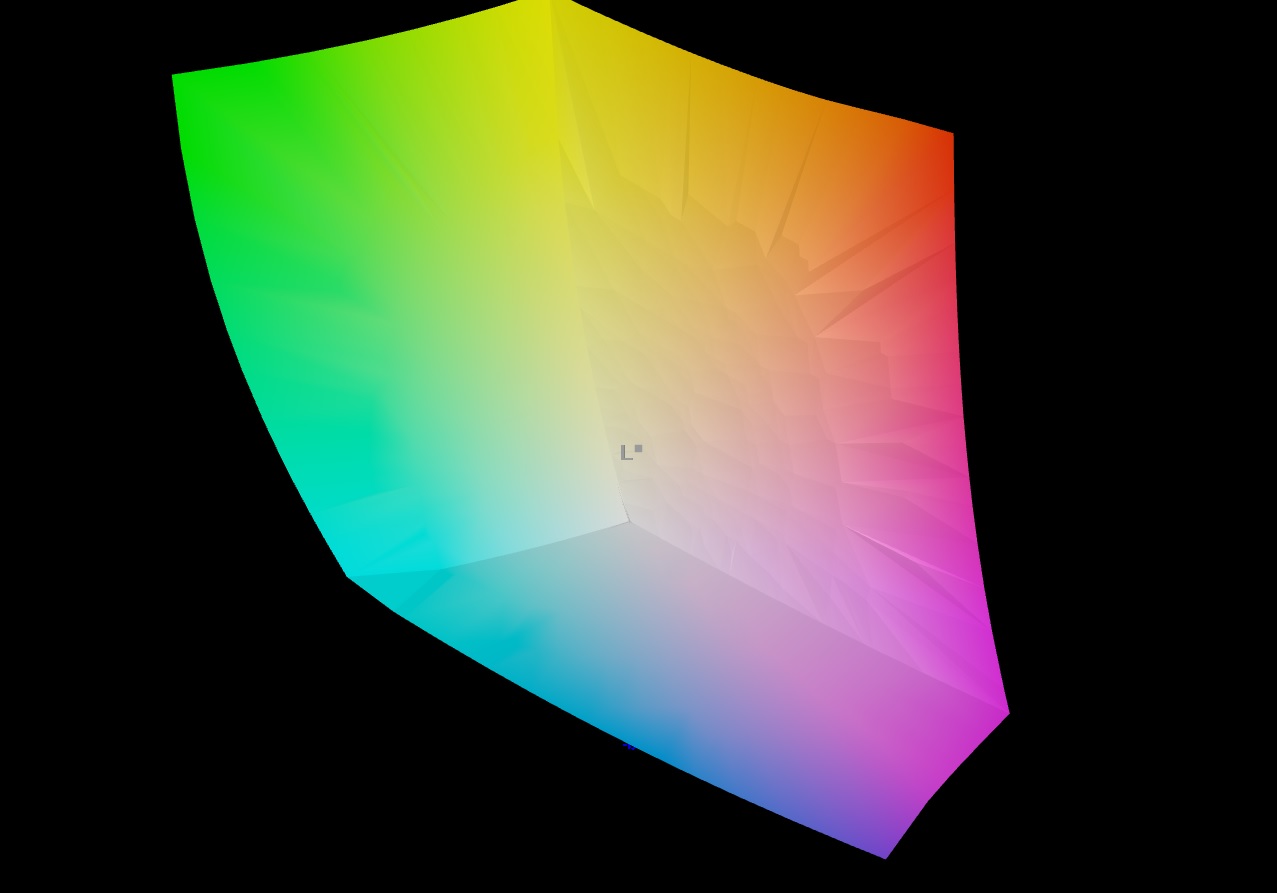
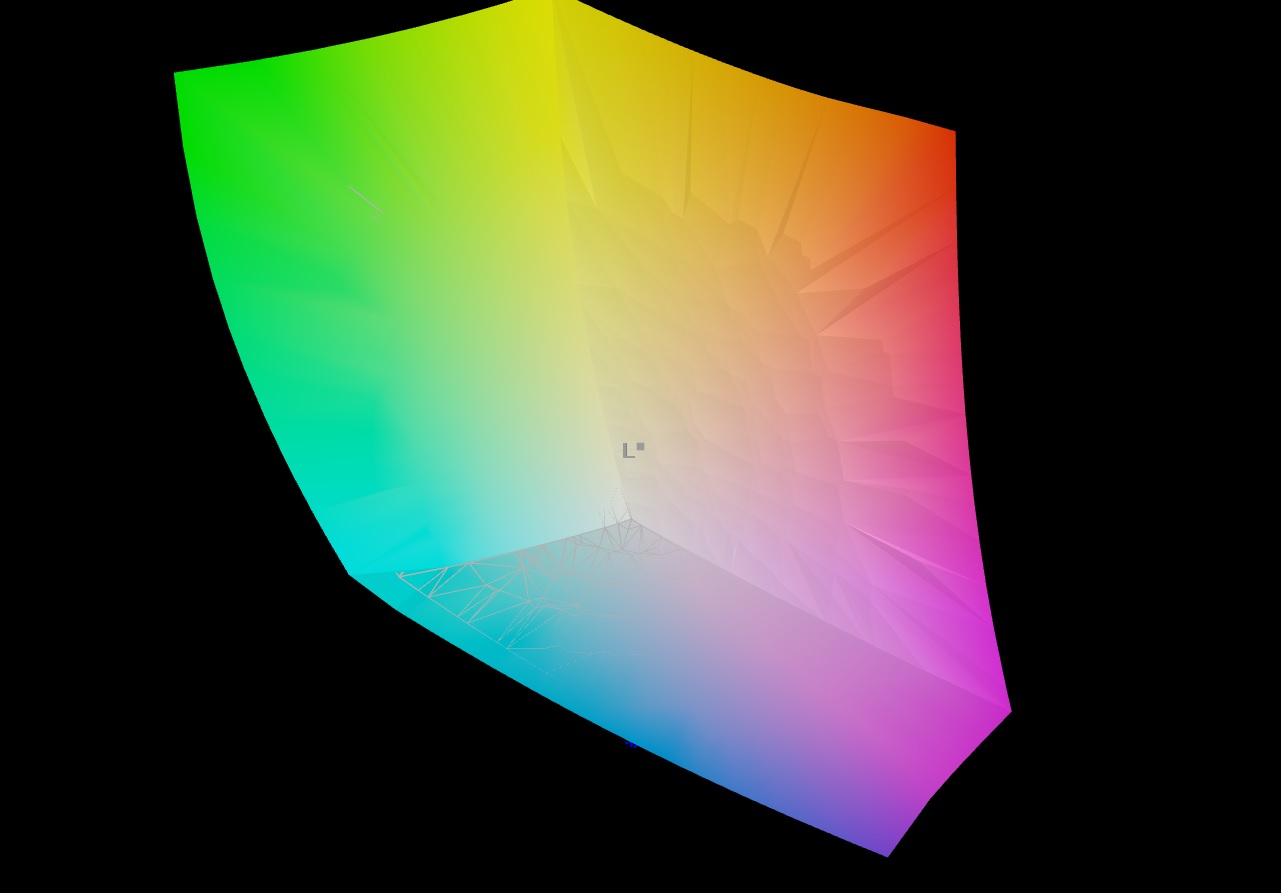
96.3% AdobeRGB 1998 (Argyll 3D)
100% sRGB (Argyll 3D)
99.9% Display P3 (Argyll 3D)
Gamma: 2.266
CCT: 7047 K
| Samsung Galaxy Book3 Ultra 16 Samsung ATNA60CL03-0, AMOLED, 2880x1800, 16" | Schenker Vision 16 Pro RTX 3070 Ti N160QDM-NZ1, IPS, 2560x1600, 16" | LG Gram 17Z90Q-E.AD78G LG Display LP170WQ1-SPF2, IPS, 2560x1600, 17" | Lenovo ThinkBook 16p G3 ARH BOE CQ NE160QDM-NY1, IPS, 2560x1600, 16" | Dell XPS 15 9520 RTX 3050 Ti Samsung 156XG01, OLED, 3456x2160, 15.6" | Asus VivoBook Pro 16X OLED N7600PC-L2026X Samsung ATNA60YV02-0, OLED, 3840x2400, 16" | Acer Swift X SFX16-52G-77RX B160QAN02.M, IPS-LED, 2560x1600, 16" | |
|---|---|---|---|---|---|---|---|
| Display | -20% | -8% | -19% | -4% | 1% | -15% | |
| Display P3 Coverage (%) | 99.9 | 68.7 -31% | 92.2 -8% | 69.8 -30% | 97.8 -2% | 99.9 0% | 76.4 -24% |
| sRGB Coverage (%) | 100 | 96.7 -3% | 98.66 -1% | 98.2 -2% | 99.9 0% | 100 0% | 100 0% |
| AdobeRGB 1998 Coverage (%) | 96.3 | 70 -27% | 82.98 -14% | 71.4 -26% | 86 -11% | 98.05 2% | 76.6 -20% |
| Response Times | -2021% | -3068% | -2354% | -240% | -156% | -4422% | |
| Response Time Grey 50% / Grey 80% * (ms) | 0.49 ? | 14.3 ? -2818% | 22 ? -4390% | 15.6 ? -3084% | 1.9 ? -288% | 1 -104% | 33 ? -6635% |
| Response Time Black / White * (ms) | 0.65 ? | 8.6 ? -1223% | 12 ? -1746% | 11.2 ? -1623% | 1.9 ? -192% | 2 ? -208% | 15 ? -2208% |
| PWM Frequency (Hz) | 240 ? | 59.52 ? | 247 ? | ||||
| Screen | -140% | -125% | -186% | -32% | 8% | -108% | |
| Brightness middle (cd/m²) | 400 | 364 -9% | 391 -2% | 532.8 33% | 381.4 -5% | 383 -4% | 411 3% |
| Brightness (cd/m²) | 399 | 347 -13% | 358 -10% | 519 30% | 384 -4% | 390 -2% | 378 -5% |
| Brightness Distribution (%) | 93 | 89 -4% | 84 -10% | 94 1% | 95 2% | 96 3% | 83 -11% |
| Black Level * (cd/m²) | 0.03 | 0.3 -900% | 0.29 -867% | 0.55 -1733% | 0.027 10% | 0.29 -867% | |
| Contrast (:1) | 13333 | 1213 -91% | 1348 -90% | 969 -93% | 14185 6% | 1417 -89% | |
| Colorchecker dE 2000 * | 2.3 | 3.3 -43% | 3.52 -53% | 1.32 43% | 4.34 -89% | 2.29 -0% | 2.18 5% |
| Colorchecker dE 2000 max. * | 4.15 | 6.6 -59% | 6.06 -46% | 3.97 4% | 9.24 -123% | 3.47 16% | 4.84 -17% |
| Colorchecker dE 2000 calibrated * | 1.66 | 2.5 -51% | 1.43 14% | 1.59 4% | 1.48 11% | ||
| Greyscale dE 2000 * | 2.7 | 5.2 -93% | 4.27 -58% | 1.8 33% | 2 26% | 1.84 32% | 2.68 1% |
| Gamma | 2.266 97% | 2.14 103% | 2.3 96% | 2.64 83% | 2.13 103% | 2.32 95% | 2.43 91% |
| CCT | 7047 92% | 6331 103% | 7203 90% | 6761 96% | 6210 105% | 6308 103% | 6717 97% |
| Moyenne finale (programmes/paramètres) | -727% /
-383% | -1067% /
-520% | -853% /
-460% | -92% /
-62% | -49% /
-19% | -1515% /
-704% |
* ... Moindre est la valeur, meilleures sont les performances
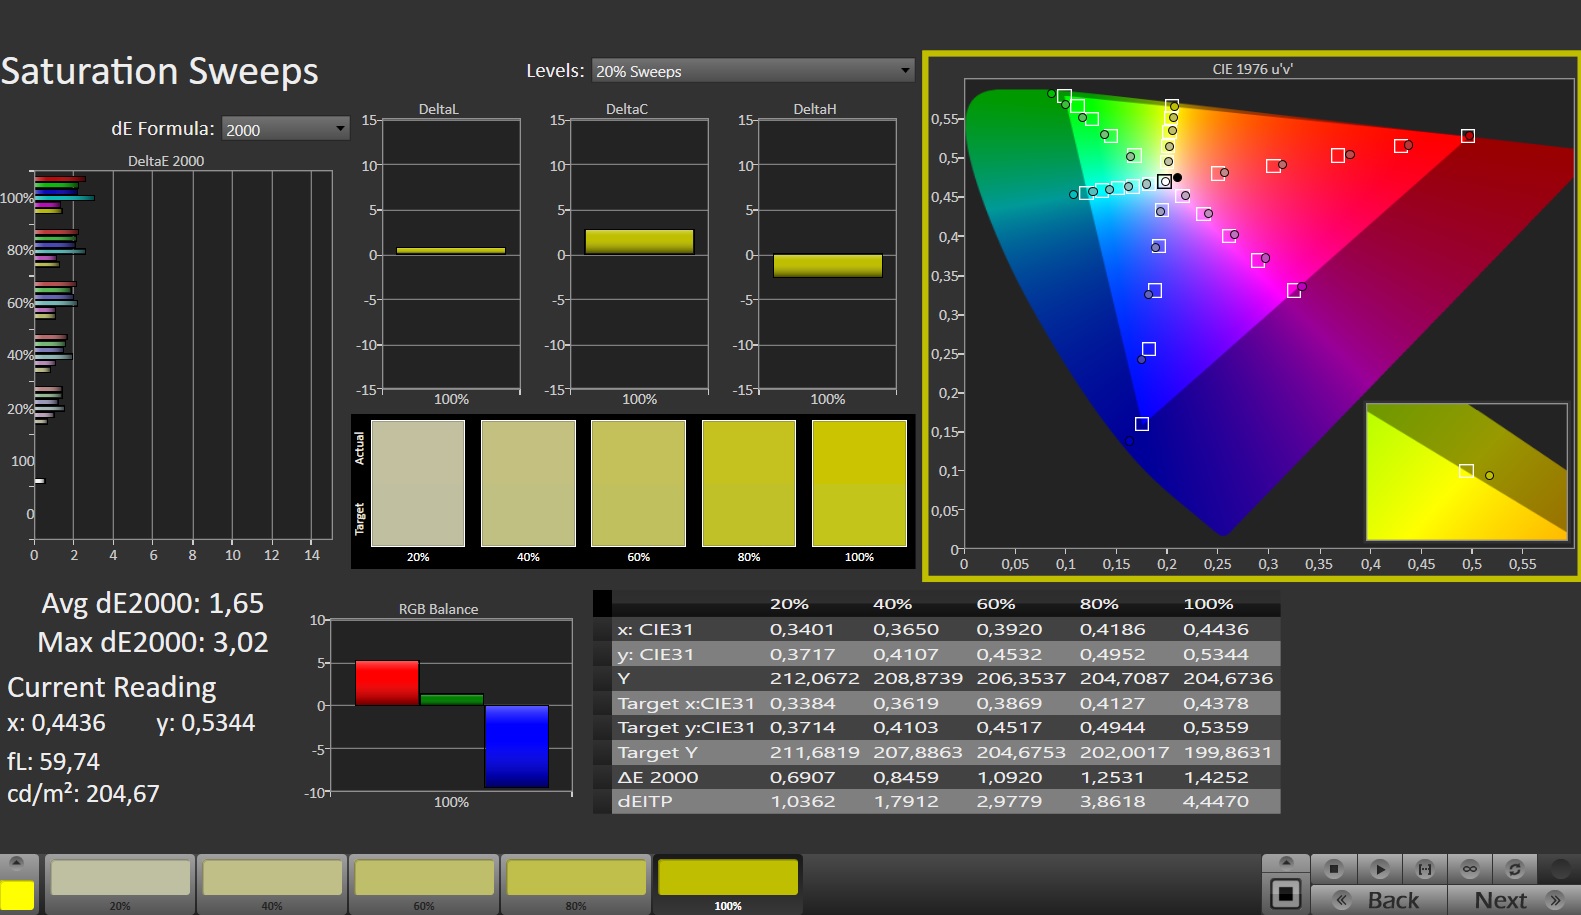
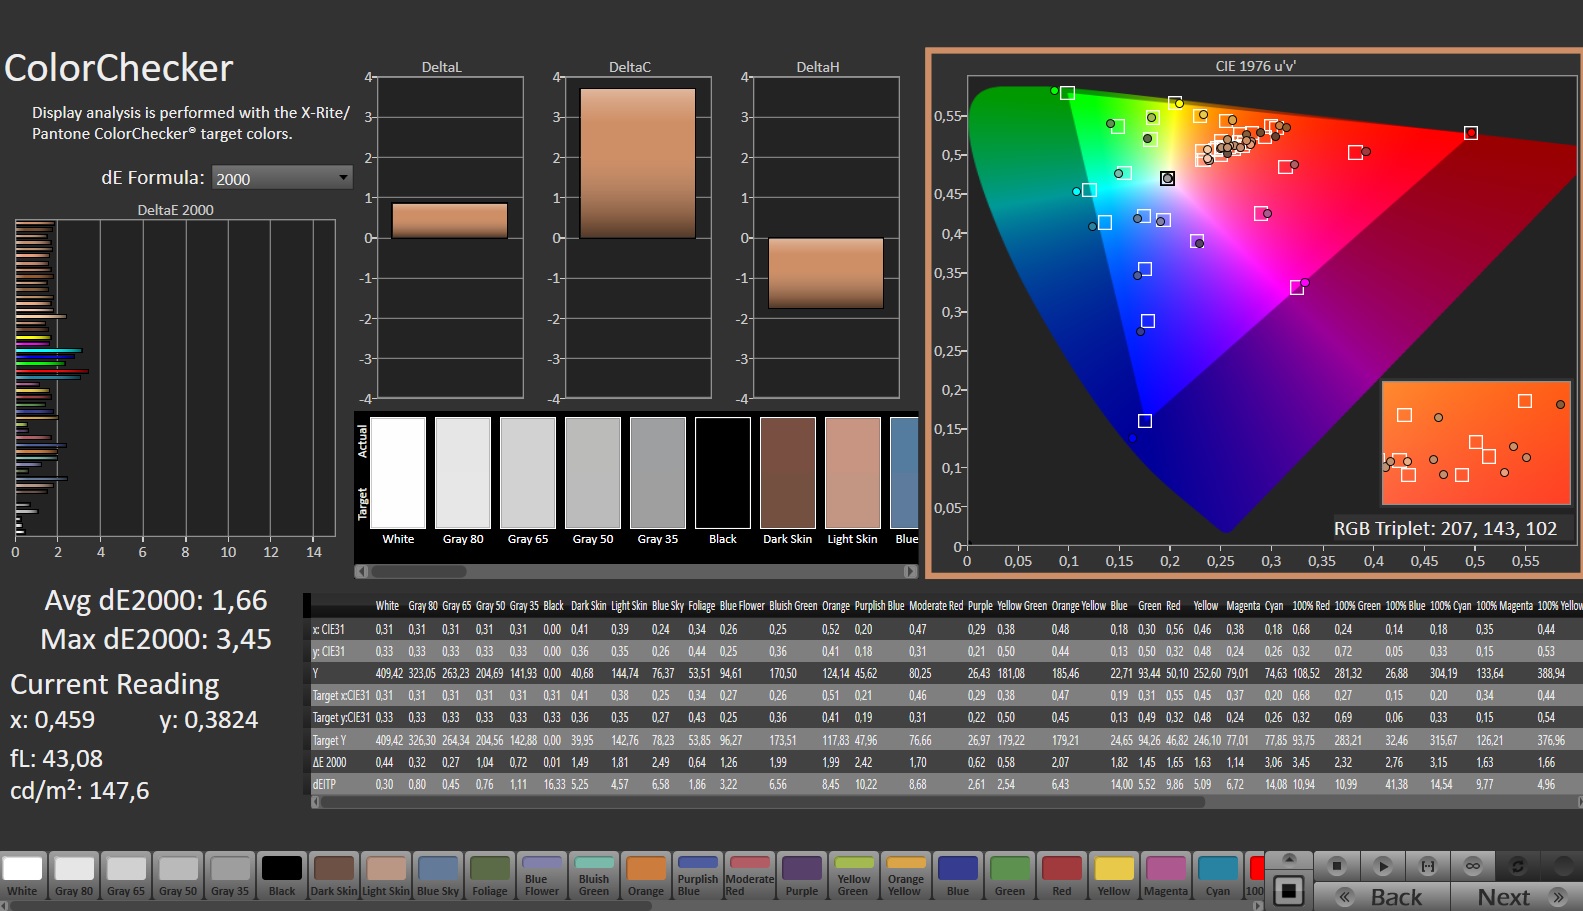
L'écran présente déjà une bonne reproduction des couleurs dans son état de livraison : Avec une déviation de 2,3, l'objectif (DeltaE < 3) est atteint. Le calibrage réduit la valeur à 1,66 et garantit des niveaux de gris plus équilibrés
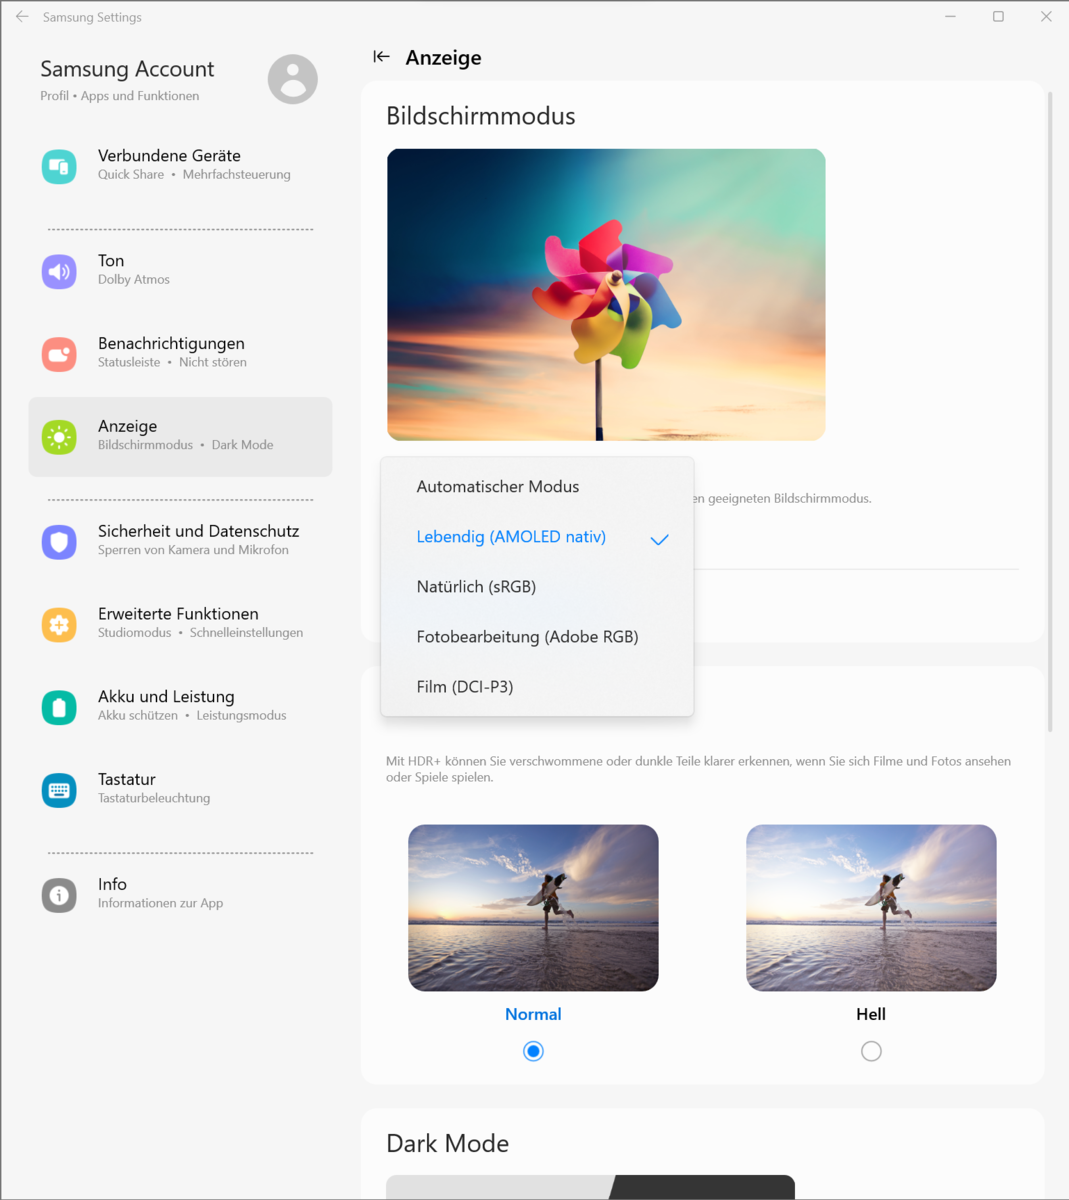
La fidélité des couleurs est une évidence : les espaces colorimétriques sRGB et DCI-P3 sont entièrement reproduits et l'espace Adobe RGB l'est presque entièrement. L'écran peut être réglé sur l'un des trois espaces via les paramètres préinstallés du logiciel Samsung. Nous avons utilisé le réglage par défaut "Vivid (AMOLED native)".

Temps de réponse de l'écran
| ↔ Temps de réponse noir à blanc | ||
|---|---|---|
| 0.65 ms ... hausse ↗ et chute ↘ combinées | ↗ 0.37 ms hausse | 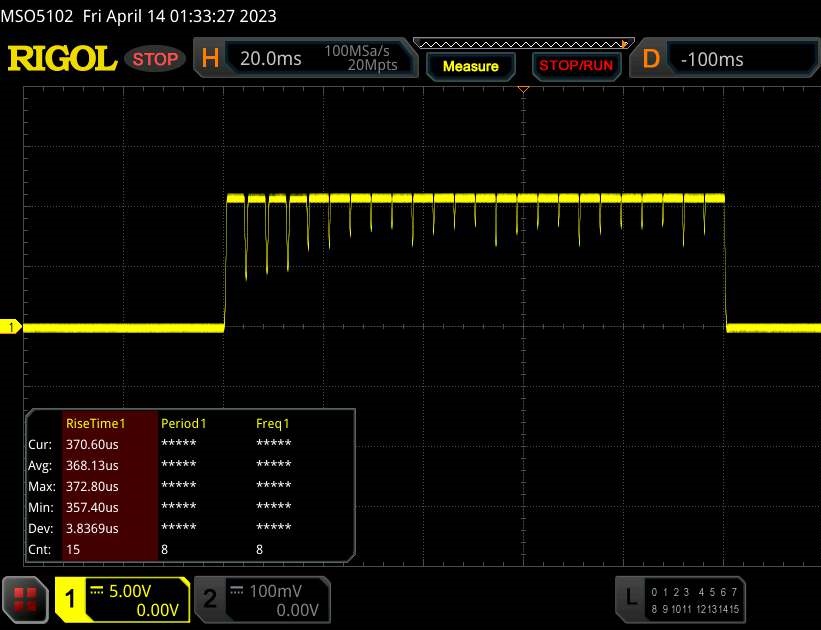 |
| ↘ 0.28 ms chute | ||
| L'écran montre de très faibles temps de réponse, parfait pour le jeu. En comparaison, tous les appareils testés affichent entre 0.1 (minimum) et 240 (maximum) ms. » 2 % des appareils testés affichent de meilleures performances. Cela signifie que les latences relevées sont meilleures que la moyenne (19.8 ms) de tous les appareils testés. | ||
| ↔ Temps de réponse gris 50% à gris 80% | ||
| 0.49 ms ... hausse ↗ et chute ↘ combinées | ↗ 0.26 ms hausse | 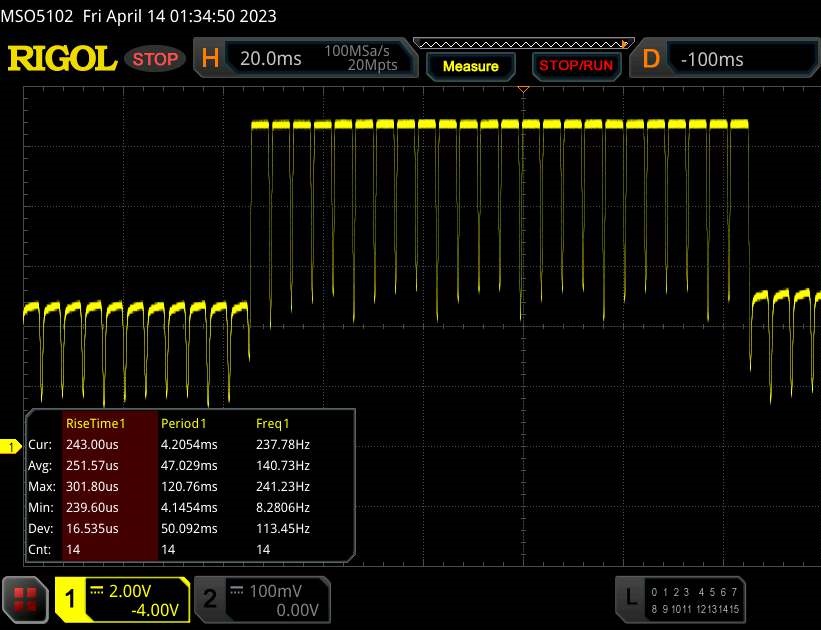 |
| ↘ 0.23 ms chute | ||
| L'écran montre de très faibles temps de réponse, parfait pour le jeu. En comparaison, tous les appareils testés affichent entre 0.165 (minimum) et 636 (maximum) ms. » 1 % des appareils testés affichent de meilleures performances. Cela signifie que les latences relevées sont meilleures que la moyenne (30.9 ms) de tous les appareils testés. | ||
Scintillement / MLI (Modulation de largeur d'impulsion)
| Scintillement / MLI (Modulation de largeur d'impulsion) décelé | 240 Hz | ≤ 100 Niveau de luminosité | 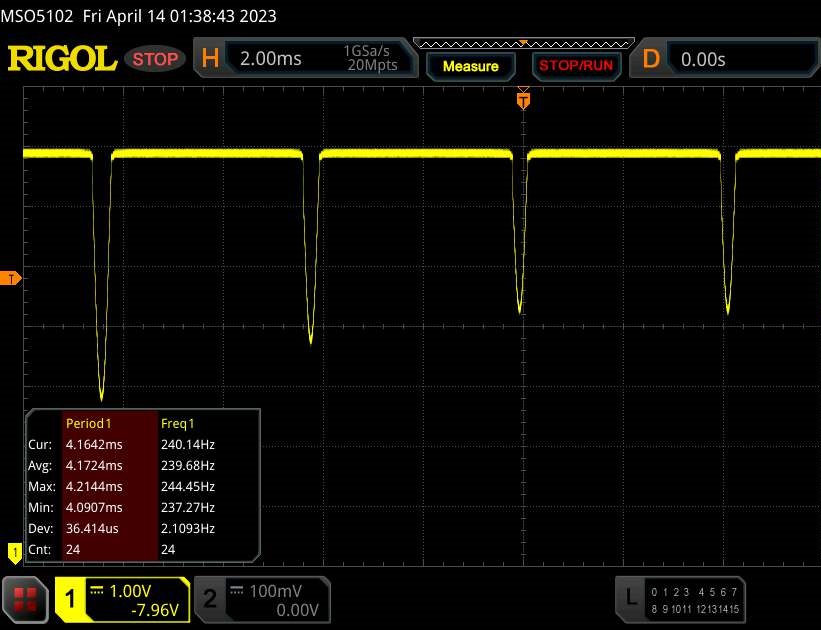 |
Le rétroéclairage de l'écran scintille à la fréquence de 240 Hz (certainement du fait de l'utilisation d'une MDI - Modulation de largeur d'impulsion) à un niveau de luminosité inférieur ou égal à 100 % . Aucun scintillement ne devrait être perceptible au-dessus de cette valeur. La fréquence de rafraîchissement de 240 Hz est relativement faible, les personnes les plus sensibles devraient percevoir un scintillement et être sujettes à une fatigue oculaire accrue (avec le niveau de luminosité indiqué) En comparaison, 52 % des appareils testés n'emploient pas MDI pour assombrir leur écran. Nous avons relevé une moyenne à 7741 (minimum : 5 - maximum : 343500) Hz dans le cas où une MDI était active. | |||
Le panneau à angle de vision stable peut être lu dans n'importe quelle position. La lecture à l'extérieur est difficile en raison de la surface d'affichage réfléchissante.
Performance - Alder Lake et Ada Lovelace à bord
Avec ses modèles Galaxy Book3 Ultra 16, Samsung propose une série d'ordinateurs portables pour les joueurs et les travailleurs créatifs. La certification GeForce RTX Studio devrait garantir une puissance de calcul élevée, des pilotes adaptés, un bon support logiciel et une couverture adéquate de l'espace colorimétrique de l'écran
Des versions basse consommation du GPU RTX 4050 ou RTX 4070 sont utilisées, tandis que les processeurs proviennent d'Intel (Raptor Lake). Cette variante est basée sur la RTX 4050 et constitue le modèle d'entrée de gamme à un prix d'environ 2 400 dollars américains.
Conditions d'essai
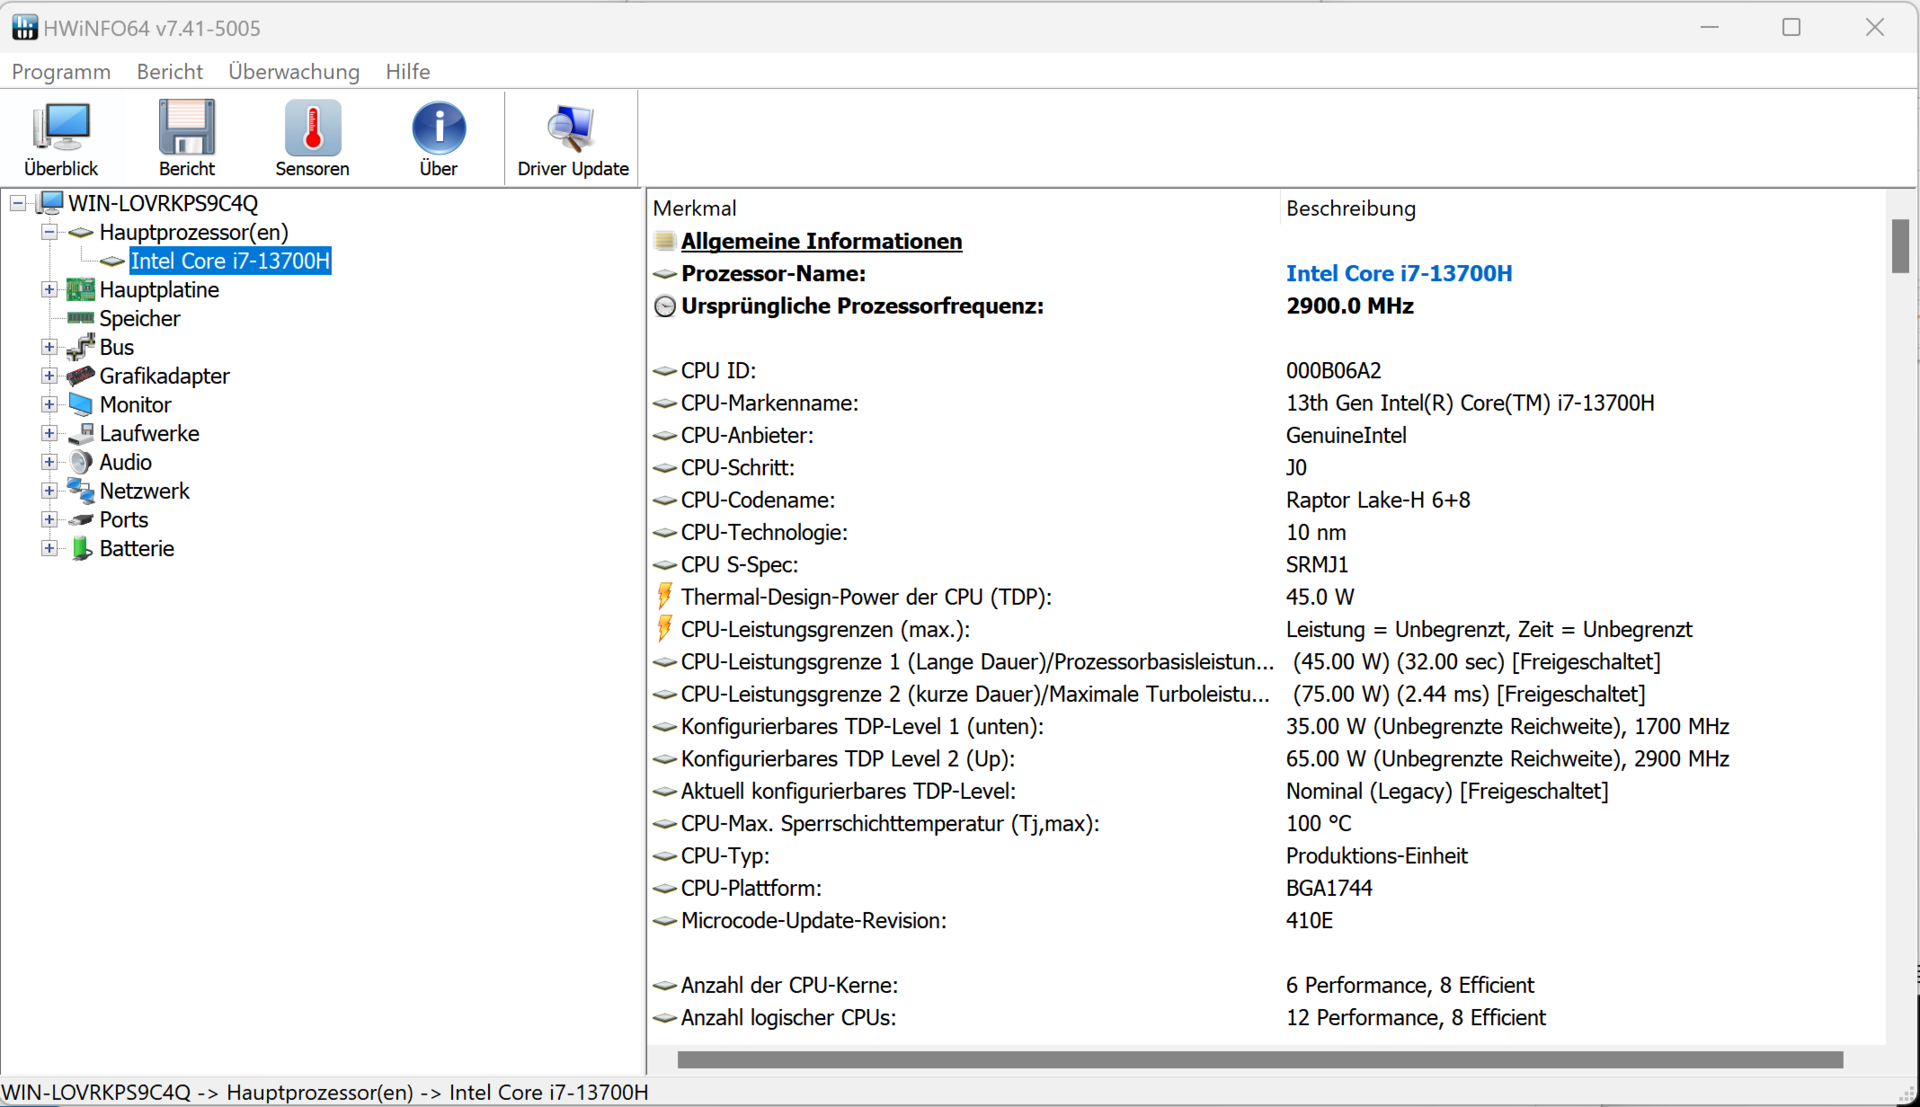
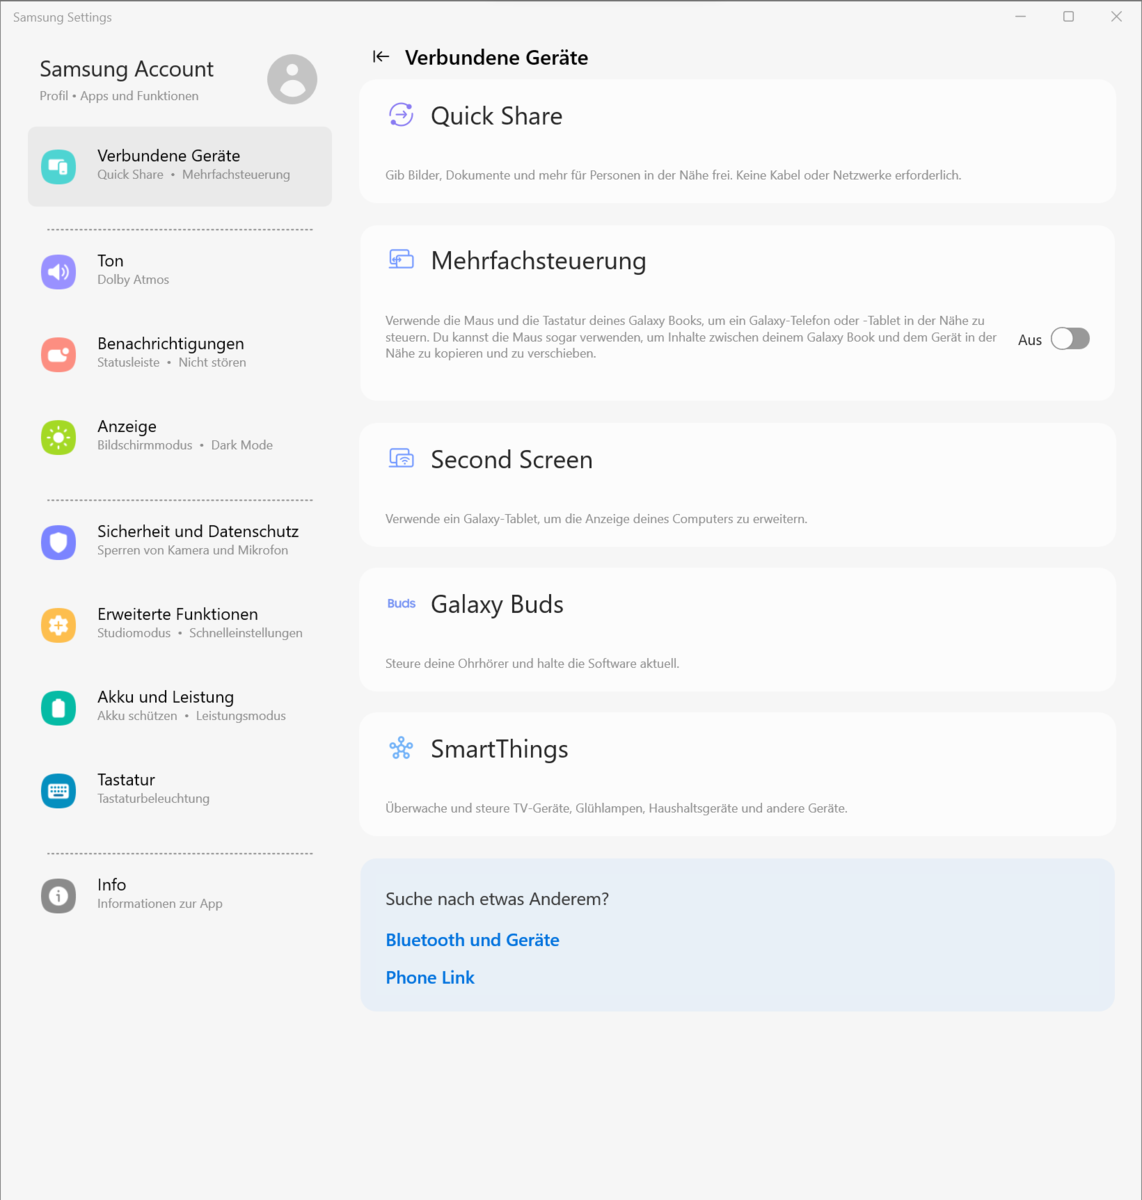
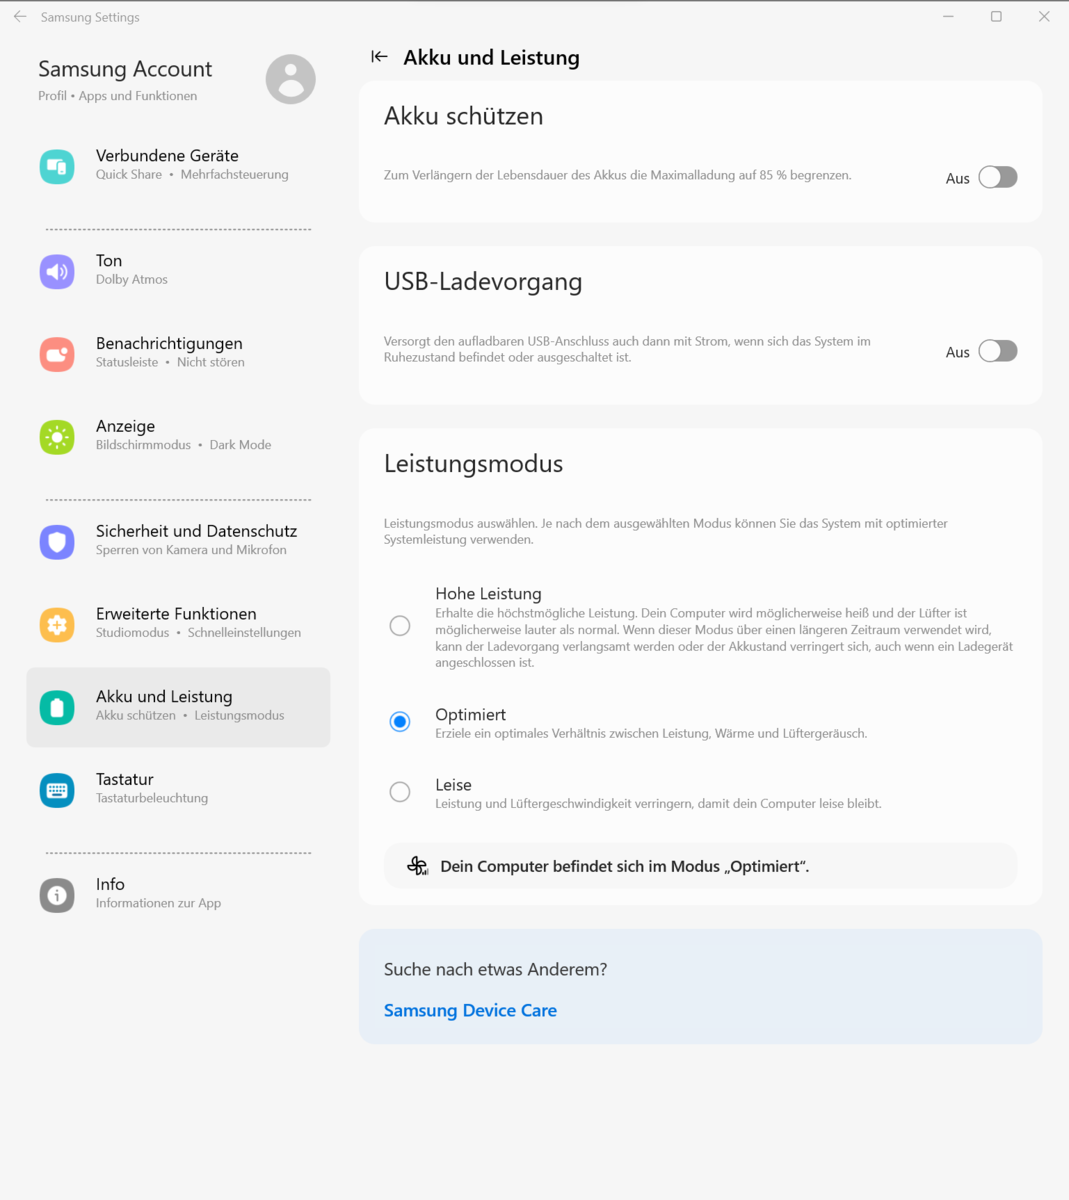
L'ordinateur portable dispose de trois modes de performance spécifiques au fabricant (voir tableau), entre lesquels il est possible de basculer via la combinaison de touches "Fn" + "F11" (ou via les paramètres logiciels de Samsung dans le centre de contrôle de l'ordinateur portable). Les modes "Optimisé" (benchmarks) et "Silencieux" (tests de batterie) ont été utilisés.
| Haute performance | Optimisé | Silencieux | |
|---|---|---|---|
| Limitede puissance 1 (HWInfo) | 70 watts | 45 watts | 30 watts |
| Limitede puissance 2 (HWInfo) | 75 watts | 75 watts | 75 watts |
| TGP RTX 4050 | 60 watts | ~ 40 - 45 watts | 20 watts |
| Bruit (Witcher 3 ) | 48 dB(A) | 39 dB(A) | 34 dB(A) |
| Performance (Witcher 3 ) | ~ 73 fps | ~ 60 fps | ~ 20 fps |
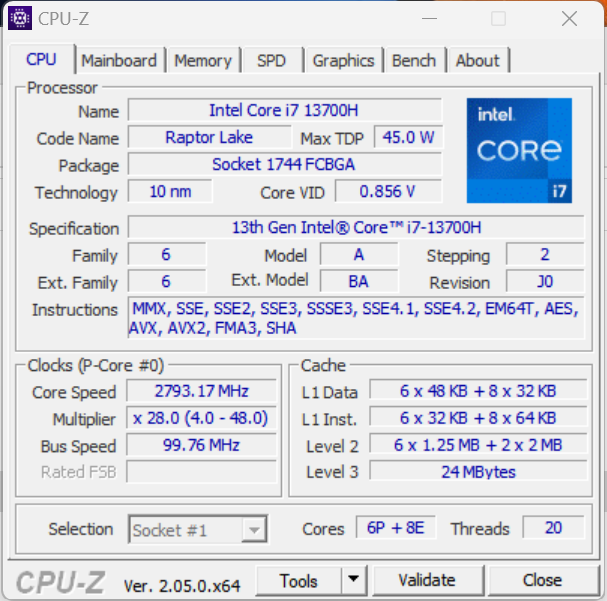
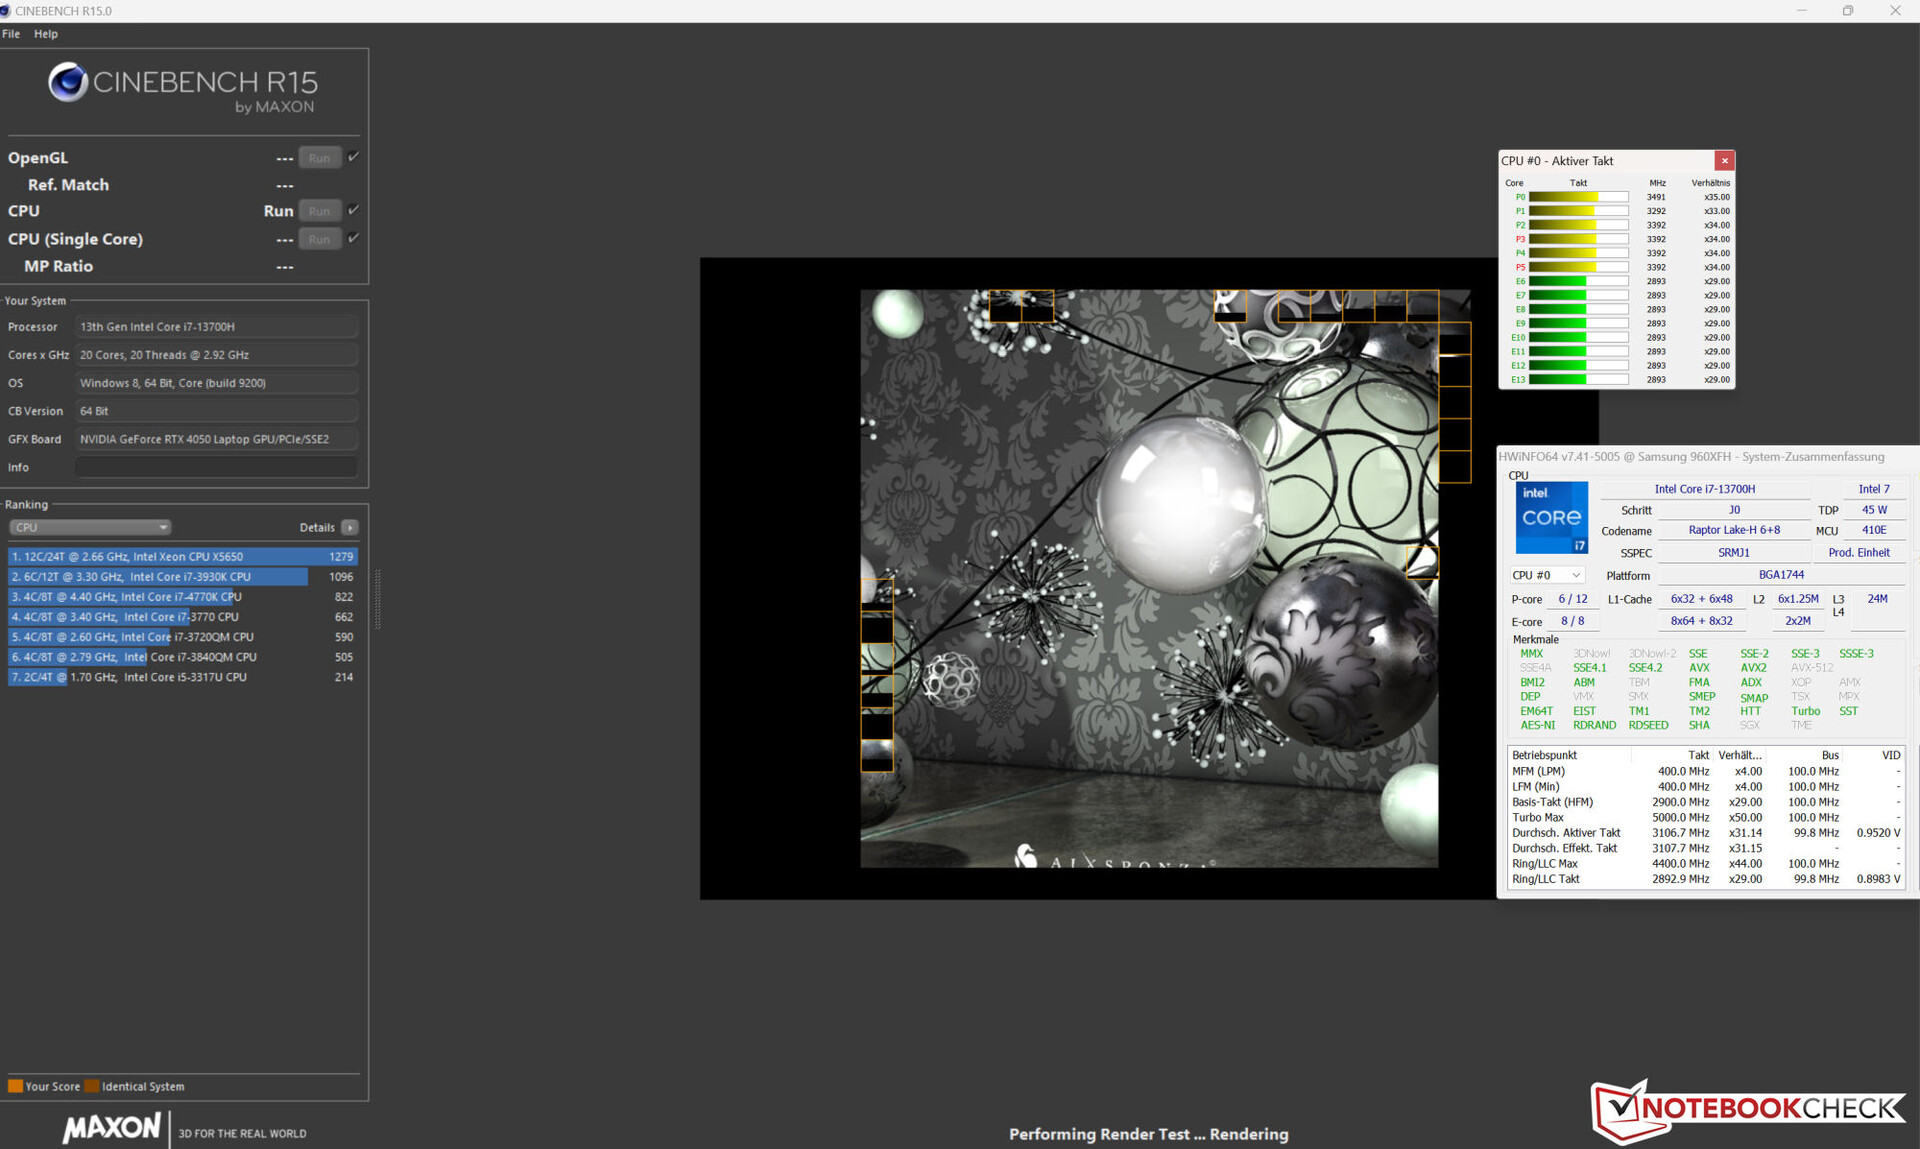
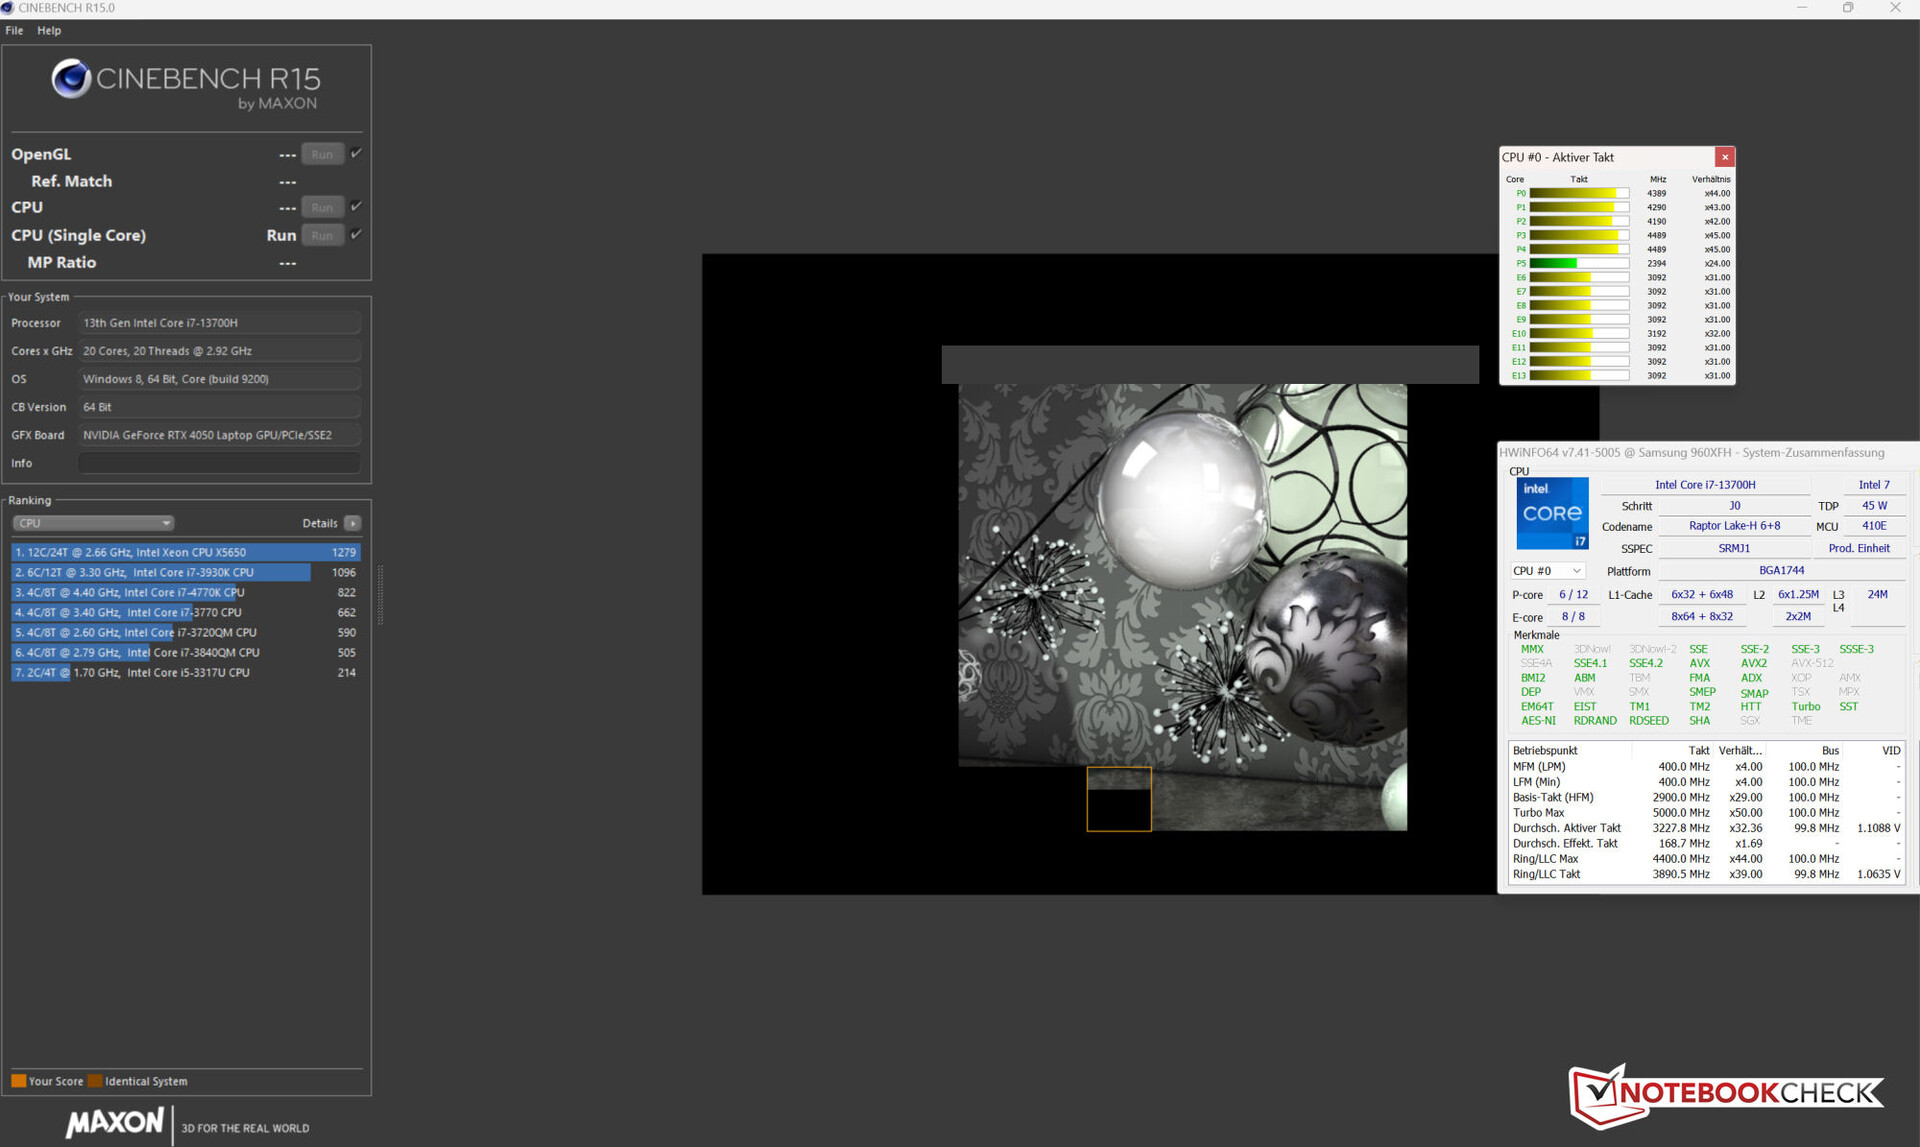
Processeur
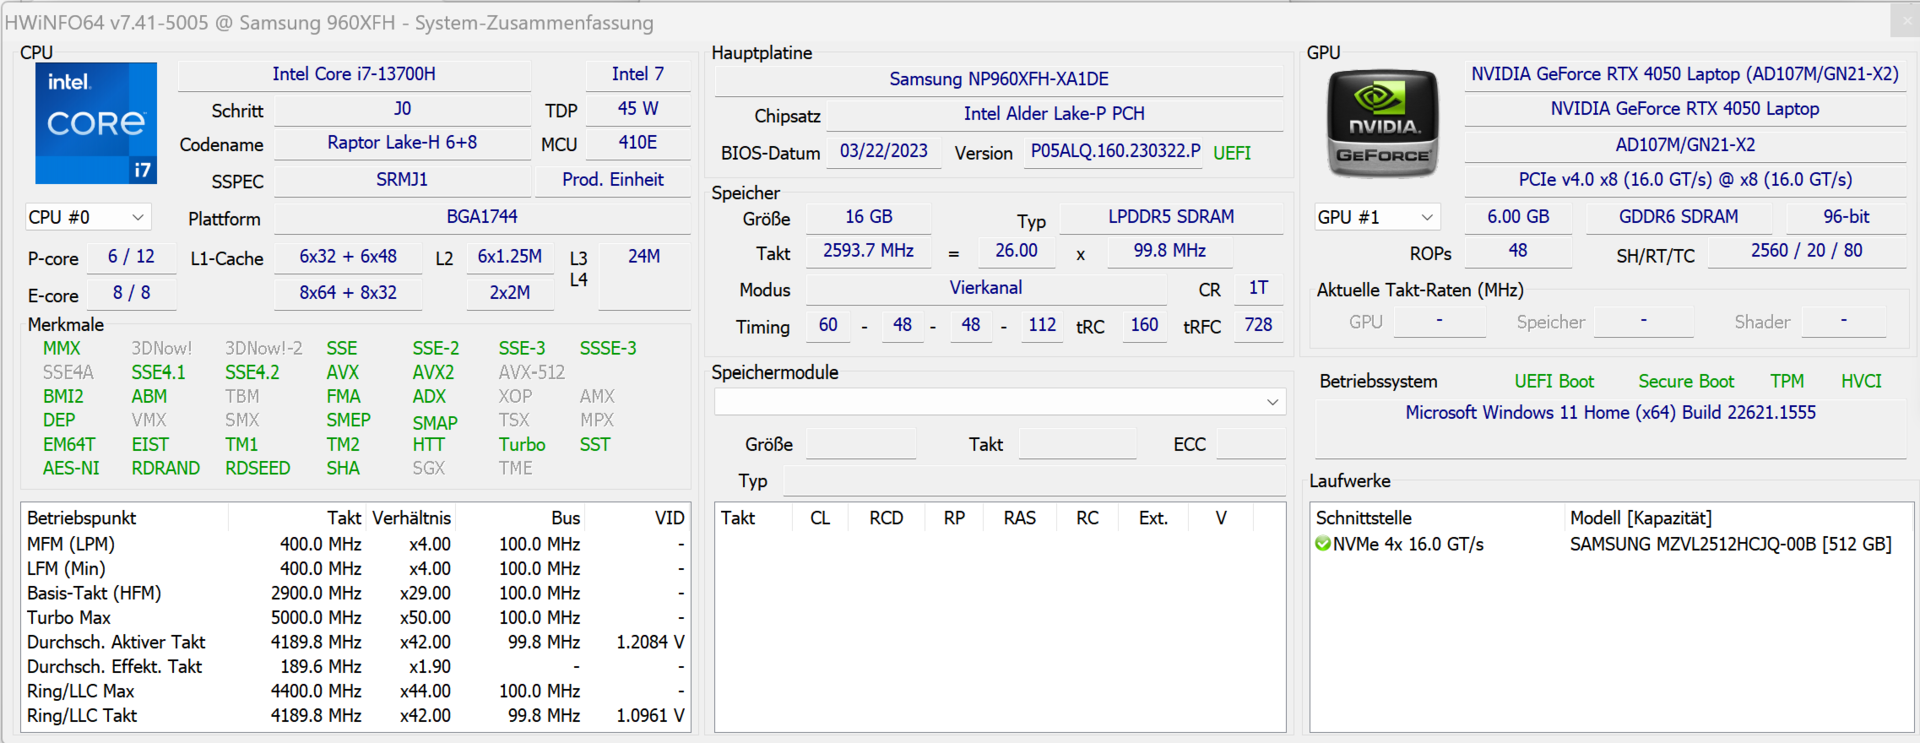
Le Core i7-13700H (Raptor Lake) se compose de huit cœurs efficaces (sans hyperthreading, 1,8 à 3,7 GHz) et de six cœurs performants (hyperthreading, 2,4 à 5 GHz). Cela revient à 20 cœurs logiques de processeur au total.
Les modes de performance "Haute performance" et "Optimisé" fournissent des résultats de référence qui se situent à peu près au niveau de la moyenne de l'unité centrale déterminée jusqu'à présent. Le profil "Silent" pousse ces valeurs bien plus bas, mais fournit tout de même des performances plus que suffisantes pour une utilisation quotidienne
Le test en boucle CB15 révèle qu'une charge multithread continue fait chuter l'horloge turbo à chaque nouvelle exécution et fluctue à partir de la huitième exécution. Il n'est pas possible de maintenir un niveau constant. Le profil "High Performance" garantit une horloge moyenne plus élevée et des fluctuations plus faibles.
Cinebench R15 Multi Sustained Load
| CPU Performance rating - Percent | |
| Moyenne de la classe Multimedia | |
| Samsung Galaxy Book3 Ultra 16 | |
| Moyenne Intel Core i7-13700H | |
| Dell XPS 15 9520 RTX 3050 Ti | |
| Samsung Galaxy Book3 Ultra 16 | |
| Schenker Vision 16 Pro RTX 3070 Ti | |
| Lenovo ThinkBook 16p G3 ARH | |
| Acer Swift X SFX16-52G-77RX | |
| Samsung Galaxy Book3 Ultra 16 | |
| LG Gram 17Z90Q-E.AD78G | |
| Asus VivoBook Pro 16X OLED N7600PC-L2026X | |
| Cinebench R23 | |
| Multi Core | |
| Moyenne de la classe Multimedia (4861 - 33362, n=65, 2 dernières années) | |
| Samsung Galaxy Book3 Ultra 16 | |
| Moyenne Intel Core i7-13700H (5890 - 20034, n=29) | |
| Samsung Galaxy Book3 Ultra 16 (Hohe Leistung) | |
| Dell XPS 15 9520 RTX 3050 Ti | |
| Lenovo ThinkBook 16p G3 ARH | |
| Schenker Vision 16 Pro RTX 3070 Ti | |
| Samsung Galaxy Book3 Ultra 16 (Leise) | |
| Acer Swift X SFX16-52G-77RX | |
| LG Gram 17Z90Q-E.AD78G | |
| LG Gram 17Z90Q-E.AD78G | |
| Asus VivoBook Pro 16X OLED N7600PC-L2026X | |
| Single Core | |
| Moyenne de la classe Multimedia (1128 - 2459, n=64, 2 dernières années) | |
| Samsung Galaxy Book3 Ultra 16 (Hohe Leistung) | |
| Schenker Vision 16 Pro RTX 3070 Ti | |
| Moyenne Intel Core i7-13700H (1323 - 1914, n=29) | |
| Dell XPS 15 9520 RTX 3050 Ti | |
| Acer Swift X SFX16-52G-77RX | |
| Samsung Galaxy Book3 Ultra 16 | |
| LG Gram 17Z90Q-E.AD78G | |
| Lenovo ThinkBook 16p G3 ARH | |
| Asus VivoBook Pro 16X OLED N7600PC-L2026X | |
| Samsung Galaxy Book3 Ultra 16 (Leise) | |
| Cinebench R20 | |
| CPU (Multi Core) | |
| Moyenne de la classe Multimedia (1887 - 12912, n=56, 2 dernières années) | |
| Samsung Galaxy Book3 Ultra 16 | |
| Moyenne Intel Core i7-13700H (2322 - 7674, n=29) | |
| Samsung Galaxy Book3 Ultra 16 (Hohe Leistung) | |
| Dell XPS 15 9520 RTX 3050 Ti | |
| Lenovo ThinkBook 16p G3 ARH | |
| Schenker Vision 16 Pro RTX 3070 Ti | |
| Samsung Galaxy Book3 Ultra 16 (Leise) | |
| Acer Swift X SFX16-52G-77RX | |
| LG Gram 17Z90Q-E.AD78G | |
| Asus VivoBook Pro 16X OLED N7600PC-L2026X | |
| CPU (Single Core) | |
| Moyenne de la classe Multimedia (425 - 853, n=56, 2 dernières années) | |
| Samsung Galaxy Book3 Ultra 16 (Hohe Leistung) | |
| Schenker Vision 16 Pro RTX 3070 Ti | |
| Moyenne Intel Core i7-13700H (508 - 741, n=29) | |
| Dell XPS 15 9520 RTX 3050 Ti | |
| Acer Swift X SFX16-52G-77RX | |
| Samsung Galaxy Book3 Ultra 16 | |
| LG Gram 17Z90Q-E.AD78G | |
| Lenovo ThinkBook 16p G3 ARH | |
| Asus VivoBook Pro 16X OLED N7600PC-L2026X | |
| Samsung Galaxy Book3 Ultra 16 (Leise) | |
| Cinebench R15 | |
| CPU Multi 64Bit | |
| Schenker Vision 16 Pro RTX 3070 Ti (Turbo) | |
| Schenker Vision 16 Pro RTX 3070 Ti | |
| Moyenne de la classe Multimedia (856 - 5224, n=60, 2 dernières années) | |
| Samsung Galaxy Book3 Ultra 16 | |
| Samsung Galaxy Book3 Ultra 16 (Hohe Leistung) | |
| Moyenne Intel Core i7-13700H (905 - 2982, n=29) | |
| Samsung Galaxy Book3 Ultra 16 (Leise) | |
| Dell XPS 15 9520 RTX 3050 Ti | |
| Lenovo ThinkBook 16p G3 ARH | |
| Acer Swift X SFX16-52G-77RX | |
| LG Gram 17Z90Q-E.AD78G | |
| Asus VivoBook Pro 16X OLED N7600PC-L2026X | |
| CPU Single 64Bit | |
| Moyenne de la classe Multimedia (184.8 - 326, n=58, 2 dernières années) | |
| Samsung Galaxy Book3 Ultra 16 (Hohe Leistung) | |
| Schenker Vision 16 Pro RTX 3070 Ti | |
| Moyenne Intel Core i7-13700H (213 - 278, n=29) | |
| Dell XPS 15 9520 RTX 3050 Ti | |
| Acer Swift X SFX16-52G-77RX | |
| Samsung Galaxy Book3 Ultra 16 | |
| Lenovo ThinkBook 16p G3 ARH | |
| Asus VivoBook Pro 16X OLED N7600PC-L2026X | |
| Asus VivoBook Pro 16X OLED N7600PC-L2026X | |
| LG Gram 17Z90Q-E.AD78G | |
| Samsung Galaxy Book3 Ultra 16 (Leise) | |
| Blender - v2.79 BMW27 CPU | |
| Asus VivoBook Pro 16X OLED N7600PC-L2026X | |
| LG Gram 17Z90Q-E.AD78G | |
| Acer Swift X SFX16-52G-77RX | |
| Samsung Galaxy Book3 Ultra 16 (Leise) | |
| Schenker Vision 16 Pro RTX 3070 Ti | |
| Moyenne de la classe Multimedia (100 - 557, n=57, 2 dernières années) | |
| Lenovo ThinkBook 16p G3 ARH | |
| Moyenne Intel Core i7-13700H (169 - 555, n=29) | |
| Dell XPS 15 9520 RTX 3050 Ti | |
| Samsung Galaxy Book3 Ultra 16 | |
| Samsung Galaxy Book3 Ultra 16 (Hohe Leistung) | |
| 7-Zip 18.03 | |
| 7z b 4 | |
| Dell XPS 15 9520 RTX 3050 Ti | |
| Samsung Galaxy Book3 Ultra 16 | |
| Moyenne Intel Core i7-13700H (27322 - 76344, n=29) | |
| Moyenne de la classe Multimedia (26062 - 130368, n=54, 2 dernières années) | |
| Samsung Galaxy Book3 Ultra 16 (Hohe Leistung) | |
| Lenovo ThinkBook 16p G3 ARH | |
| Schenker Vision 16 Pro RTX 3070 Ti | |
| Samsung Galaxy Book3 Ultra 16 (Leise) | |
| Acer Swift X SFX16-52G-77RX | |
| LG Gram 17Z90Q-E.AD78G | |
| Asus VivoBook Pro 16X OLED N7600PC-L2026X | |
| 7z b 4 -mmt1 | |
| Samsung Galaxy Book3 Ultra 16 (Hohe Leistung) | |
| Moyenne de la classe Multimedia (3666 - 7545, n=55, 2 dernières années) | |
| Moyenne Intel Core i7-13700H (4825 - 6238, n=29) | |
| Schenker Vision 16 Pro RTX 3070 Ti | |
| Dell XPS 15 9520 RTX 3050 Ti | |
| Samsung Galaxy Book3 Ultra 16 | |
| Asus VivoBook Pro 16X OLED N7600PC-L2026X | |
| Acer Swift X SFX16-52G-77RX | |
| Lenovo ThinkBook 16p G3 ARH | |
| LG Gram 17Z90Q-E.AD78G | |
| Samsung Galaxy Book3 Ultra 16 (Leise) | |
| Geekbench 5.5 | |
| Multi-Core | |
| Moyenne de la classe Multimedia (4652 - 20422, n=55, 2 dernières années) | |
| Samsung Galaxy Book3 Ultra 16 (Hohe Leistung) | |
| Dell XPS 15 9520 RTX 3050 Ti | |
| Moyenne Intel Core i7-13700H (6165 - 14215, n=29) | |
| Samsung Galaxy Book3 Ultra 16 | |
| Schenker Vision 16 Pro RTX 3070 Ti | |
| Acer Swift X SFX16-52G-77RX | |
| Samsung Galaxy Book3 Ultra 16 (Leise) | |
| Lenovo ThinkBook 16p G3 ARH | |
| LG Gram 17Z90Q-E.AD78G | |
| Asus VivoBook Pro 16X OLED N7600PC-L2026X | |
| Single-Core | |
| Moyenne de la classe Multimedia (805 - 2974, n=55, 2 dernières années) | |
| Samsung Galaxy Book3 Ultra 16 (Hohe Leistung) | |
| Schenker Vision 16 Pro RTX 3070 Ti | |
| Moyenne Intel Core i7-13700H (1362 - 1919, n=29) | |
| Acer Swift X SFX16-52G-77RX | |
| Dell XPS 15 9520 RTX 3050 Ti | |
| Samsung Galaxy Book3 Ultra 16 | |
| LG Gram 17Z90Q-E.AD78G | |
| Lenovo ThinkBook 16p G3 ARH | |
| Asus VivoBook Pro 16X OLED N7600PC-L2026X | |
| Samsung Galaxy Book3 Ultra 16 (Leise) | |
| HWBOT x265 Benchmark v2.2 - 4k Preset | |
| Moyenne de la classe Multimedia (5.26 - 36.1, n=55, 2 dernières années) | |
| Samsung Galaxy Book3 Ultra 16 (Hohe Leistung) | |
| Lenovo ThinkBook 16p G3 ARH | |
| Samsung Galaxy Book3 Ultra 16 | |
| Moyenne Intel Core i7-13700H (6.72 - 21.2, n=29) | |
| Dell XPS 15 9520 RTX 3050 Ti | |
| Schenker Vision 16 Pro RTX 3070 Ti | |
| Acer Swift X SFX16-52G-77RX | |
| Samsung Galaxy Book3 Ultra 16 (Leise) | |
| LG Gram 17Z90Q-E.AD78G | |
| Asus VivoBook Pro 16X OLED N7600PC-L2026X | |
| LibreOffice - 20 Documents To PDF | |
| LG Gram 17Z90Q-E.AD78G | |
| Lenovo ThinkBook 16p G3 ARH | |
| Acer Swift X SFX16-52G-77RX | |
| Asus VivoBook Pro 16X OLED N7600PC-L2026X | |
| Samsung Galaxy Book3 Ultra 16 (Leise) | |
| Samsung Galaxy Book3 Ultra 16 | |
| Moyenne de la classe Multimedia (23.9 - 146.7, n=56, 2 dernières années) | |
| Moyenne Intel Core i7-13700H (31.3 - 62.4, n=29) | |
| Schenker Vision 16 Pro RTX 3070 Ti | |
| Dell XPS 15 9520 RTX 3050 Ti | |
| Samsung Galaxy Book3 Ultra 16 (Hohe Leistung) | |
| R Benchmark 2.5 - Overall mean | |
| Samsung Galaxy Book3 Ultra 16 (Leise) | |
| Asus VivoBook Pro 16X OLED N7600PC-L2026X | |
| LG Gram 17Z90Q-E.AD78G | |
| Lenovo ThinkBook 16p G3 ARH | |
| Samsung Galaxy Book3 Ultra 16 | |
| Samsung Galaxy Book3 Ultra 16 (Hohe Leistung) | |
| Acer Swift X SFX16-52G-77RX | |
| Moyenne Intel Core i7-13700H (0.4308 - 0.607, n=29) | |
| Moyenne de la classe Multimedia (0.3604 - 0.947, n=55, 2 dernières années) | |
| Schenker Vision 16 Pro RTX 3070 Ti | |
| Dell XPS 15 9520 RTX 3050 Ti | |
* ... Moindre est la valeur, meilleures sont les performances
AIDA64: FP32 Ray-Trace | FPU Julia | CPU SHA3 | CPU Queen | FPU SinJulia | FPU Mandel | CPU AES | CPU ZLib | FP64 Ray-Trace | CPU PhotoWorxx
| Performance rating | |
| Moyenne de la classe Multimedia | |
| Lenovo ThinkBook 16p G3 ARH | |
| Samsung Galaxy Book3 Ultra 16 | |
| Moyenne Intel Core i7-13700H | |
| Schenker Vision 16 Pro RTX 3070 Ti | |
| Dell XPS 15 9520 RTX 3050 Ti | |
| Acer Swift X SFX16-52G-77RX | |
| LG Gram 17Z90Q-E.AD78G | |
| Asus VivoBook Pro 16X OLED N7600PC-L2026X | |
| AIDA64 / FP32 Ray-Trace | |
| Moyenne de la classe Multimedia (2214 - 50388, n=53, 2 dernières années) | |
| Lenovo ThinkBook 16p G3 ARH (v6.75.6100) | |
| Samsung Galaxy Book3 Ultra 16 (v6.75.6100) | |
| Moyenne Intel Core i7-13700H (4986 - 18908, n=29) | |
| Schenker Vision 16 Pro RTX 3070 Ti (v6.75.6100) | |
| Acer Swift X SFX16-52G-77RX (v6.70.6000) | |
| Dell XPS 15 9520 RTX 3050 Ti (v6.50.5800) | |
| Asus VivoBook Pro 16X OLED N7600PC-L2026X (v6.75.6100) | |
| LG Gram 17Z90Q-E.AD78G (v6.50.5800) | |
| AIDA64 / FPU Julia | |
| Lenovo ThinkBook 16p G3 ARH (v6.75.6100) | |
| Moyenne de la classe Multimedia (12867 - 201874, n=53, 2 dernières années) | |
| Moyenne Intel Core i7-13700H (25360 - 92359, n=29) | |
| Samsung Galaxy Book3 Ultra 16 (v6.75.6100) | |
| Schenker Vision 16 Pro RTX 3070 Ti (v6.75.6100) | |
| Acer Swift X SFX16-52G-77RX (v6.70.6000) | |
| Dell XPS 15 9520 RTX 3050 Ti (v6.50.5800) | |
| Asus VivoBook Pro 16X OLED N7600PC-L2026X (v6.75.6100) | |
| LG Gram 17Z90Q-E.AD78G (v6.50.5800) | |
| AIDA64 / CPU SHA3 | |
| Moyenne de la classe Multimedia (626 - 8623, n=53, 2 dernières années) | |
| Lenovo ThinkBook 16p G3 ARH (v6.75.6100) | |
| Samsung Galaxy Book3 Ultra 16 (v6.75.6100) | |
| Moyenne Intel Core i7-13700H (1339 - 4224, n=29) | |
| Schenker Vision 16 Pro RTX 3070 Ti (v6.75.6100) | |
| Dell XPS 15 9520 RTX 3050 Ti (v6.50.5800) | |
| Acer Swift X SFX16-52G-77RX (v6.70.6000) | |
| Asus VivoBook Pro 16X OLED N7600PC-L2026X (v6.75.6100) | |
| LG Gram 17Z90Q-E.AD78G (v6.50.5800) | |
| AIDA64 / CPU Queen | |
| Lenovo ThinkBook 16p G3 ARH (v6.75.6100) | |
| Samsung Galaxy Book3 Ultra 16 (v6.75.6100) | |
| Dell XPS 15 9520 RTX 3050 Ti (v6.50.5800) | |
| Moyenne Intel Core i7-13700H (59324 - 107159, n=29) | |
| Schenker Vision 16 Pro RTX 3070 Ti (v6.75.6100) | |
| Acer Swift X SFX16-52G-77RX (v6.70.6000) | |
| Moyenne de la classe Multimedia (13483 - 181505, n=40, 2 dernières années) | |
| LG Gram 17Z90Q-E.AD78G (v6.50.5800) | |
| Asus VivoBook Pro 16X OLED N7600PC-L2026X (v6.75.6100) | |
| AIDA64 / FPU SinJulia | |
| Lenovo ThinkBook 16p G3 ARH (v6.75.6100) | |
| Samsung Galaxy Book3 Ultra 16 (v6.75.6100) | |
| Moyenne Intel Core i7-13700H (4800 - 11050, n=29) | |
| Dell XPS 15 9520 RTX 3050 Ti (v6.50.5800) | |
| Moyenne de la classe Multimedia (886 - 28794, n=53, 2 dernières années) | |
| Schenker Vision 16 Pro RTX 3070 Ti (v6.75.6100) | |
| Acer Swift X SFX16-52G-77RX (v6.70.6000) | |
| LG Gram 17Z90Q-E.AD78G (v6.50.5800) | |
| Asus VivoBook Pro 16X OLED N7600PC-L2026X (v6.75.6100) | |
| AIDA64 / FPU Mandel | |
| Lenovo ThinkBook 16p G3 ARH (v6.75.6100) | |
| Moyenne de la classe Multimedia (6395 - 105740, n=53, 2 dernières années) | |
| Samsung Galaxy Book3 Ultra 16 (v6.75.6100) | |
| Moyenne Intel Core i7-13700H (12321 - 45118, n=29) | |
| Schenker Vision 16 Pro RTX 3070 Ti (v6.75.6100) | |
| Acer Swift X SFX16-52G-77RX (v6.70.6000) | |
| Dell XPS 15 9520 RTX 3050 Ti (v6.50.5800) | |
| Asus VivoBook Pro 16X OLED N7600PC-L2026X (v6.75.6100) | |
| LG Gram 17Z90Q-E.AD78G (v6.50.5800) | |
| AIDA64 / CPU AES | |
| Dell XPS 15 9520 RTX 3050 Ti (v6.50.5800) | |
| Moyenne Intel Core i7-13700H (28769 - 151254, n=29) | |
| Samsung Galaxy Book3 Ultra 16 (v6.75.6100) | |
| Moyenne de la classe Multimedia (8171 - 126790, n=53, 2 dernières années) | |
| Schenker Vision 16 Pro RTX 3070 Ti (v6.75.6100) | |
| Asus VivoBook Pro 16X OLED N7600PC-L2026X (v6.75.6100) | |
| Lenovo ThinkBook 16p G3 ARH (v6.75.6100) | |
| Acer Swift X SFX16-52G-77RX (v6.70.6000) | |
| LG Gram 17Z90Q-E.AD78G (v6.50.5800) | |
| AIDA64 / CPU ZLib | |
| Samsung Galaxy Book3 Ultra 16 (v6.75.6100) | |
| Moyenne de la classe Multimedia (143.8 - 2022, n=53, 2 dernières années) | |
| Moyenne Intel Core i7-13700H (389 - 1215, n=29) | |
| Lenovo ThinkBook 16p G3 ARH (v6.75.6100) | |
| Schenker Vision 16 Pro RTX 3070 Ti (v6.75.6100) | |
| Dell XPS 15 9520 RTX 3050 Ti (v6.50.5800) | |
| Acer Swift X SFX16-52G-77RX (v6.70.6000) | |
| LG Gram 17Z90Q-E.AD78G (v6.50.5800) | |
| Asus VivoBook Pro 16X OLED N7600PC-L2026X (v6.75.6100) | |
| AIDA64 / FP64 Ray-Trace | |
| Moyenne de la classe Multimedia (1014 - 26875, n=53, 2 dernières années) | |
| Lenovo ThinkBook 16p G3 ARH (v6.75.6100) | |
| Samsung Galaxy Book3 Ultra 16 (v6.75.6100) | |
| Moyenne Intel Core i7-13700H (2540 - 10135, n=29) | |
| Schenker Vision 16 Pro RTX 3070 Ti (v6.75.6100) | |
| Acer Swift X SFX16-52G-77RX (v6.70.6000) | |
| Dell XPS 15 9520 RTX 3050 Ti (v6.50.5800) | |
| Asus VivoBook Pro 16X OLED N7600PC-L2026X (v6.75.6100) | |
| LG Gram 17Z90Q-E.AD78G (v6.50.5800) | |
| AIDA64 / CPU PhotoWorxx | |
| Moyenne de la classe Multimedia (8187 - 88154, n=53, 2 dernières années) | |
| Samsung Galaxy Book3 Ultra 16 (v6.75.6100) | |
| Acer Swift X SFX16-52G-77RX (v6.70.6000) | |
| Schenker Vision 16 Pro RTX 3070 Ti (v6.75.6100) | |
| Moyenne Intel Core i7-13700H (12872 - 52727, n=29) | |
| LG Gram 17Z90Q-E.AD78G (v6.50.5800) | |
| Dell XPS 15 9520 RTX 3050 Ti (v6.50.5800) | |
| Lenovo ThinkBook 16p G3 ARH (v6.75.6100) | |
| Asus VivoBook Pro 16X OLED N7600PC-L2026X (v6.75.6100) | |
Performance du système
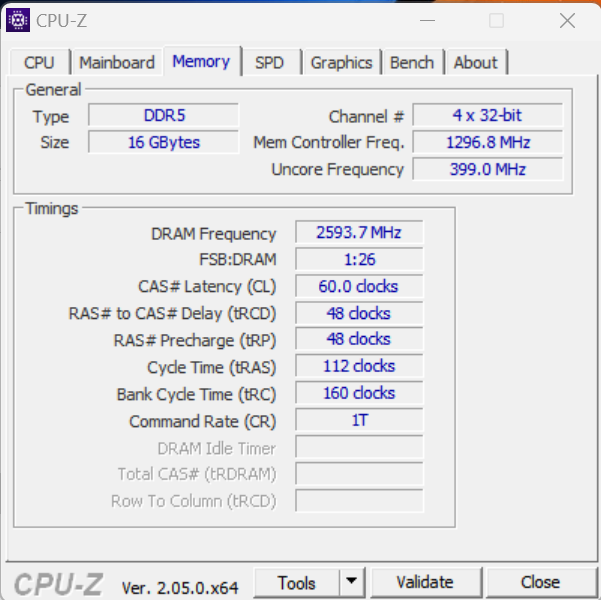
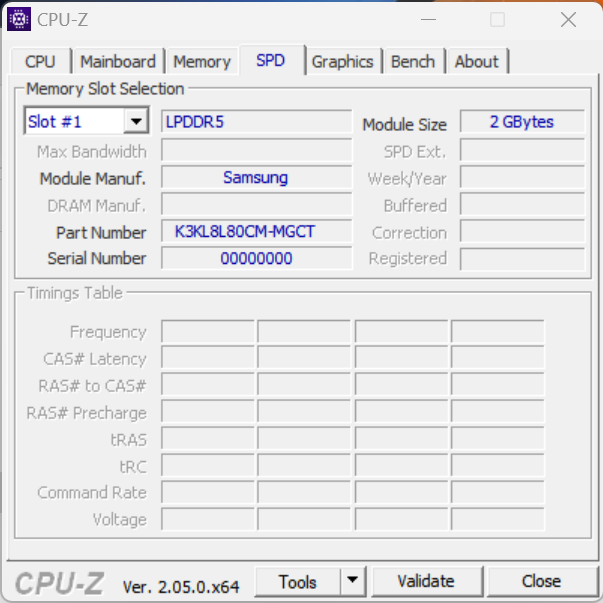
Le système, qui fonctionne en douceur, n'est pas conçu pour offrir des performances maximales. Il s'agit d'un compromis entre compacité, mobilité, consommation d'énergie et performances. Néanmoins, l'ordinateur portable peut gérer des applications exigeantes telles que le rendu et les jeux, comme le confirment les bons résultats de PCMark. Les taux de transfert de la mémoire vive se situent à un niveau normal pour une RAM LPDDR5-5200.
CrossMark: Overall | Productivity | Creativity | Responsiveness
| PCMark 10 / Score | |
| Moyenne de la classe Multimedia (4325 - 10386, n=51, 2 dernières années) | |
| Moyenne Intel Core i7-13700H, NVIDIA GeForce RTX 4050 Laptop GPU (6822 - 7556, n=7) | |
| Dell XPS 15 9520 RTX 3050 Ti | |
| Lenovo ThinkBook 16p G3 ARH | |
| Samsung Galaxy Book3 Ultra 16 | |
| LG Gram 17Z90Q-E.AD78G | |
| Acer Swift X SFX16-52G-77RX | |
| Asus VivoBook Pro 16X OLED N7600PC-L2026X | |
| PCMark 10 / Essentials | |
| Dell XPS 15 9520 RTX 3050 Ti | |
| Moyenne Intel Core i7-13700H, NVIDIA GeForce RTX 4050 Laptop GPU (10283 - 11549, n=7) | |
| Acer Swift X SFX16-52G-77RX | |
| Samsung Galaxy Book3 Ultra 16 | |
| Moyenne de la classe Multimedia (8025 - 11664, n=50, 2 dernières années) | |
| Lenovo ThinkBook 16p G3 ARH | |
| LG Gram 17Z90Q-E.AD78G | |
| Asus VivoBook Pro 16X OLED N7600PC-L2026X | |
| PCMark 10 / Productivity | |
| Moyenne de la classe Multimedia (7323 - 18233, n=50, 2 dernières années) | |
| Dell XPS 15 9520 RTX 3050 Ti | |
| LG Gram 17Z90Q-E.AD78G | |
| Moyenne Intel Core i7-13700H, NVIDIA GeForce RTX 4050 Laptop GPU (8368 - 9836, n=7) | |
| Lenovo ThinkBook 16p G3 ARH | |
| Samsung Galaxy Book3 Ultra 16 | |
| Asus VivoBook Pro 16X OLED N7600PC-L2026X | |
| Acer Swift X SFX16-52G-77RX | |
| PCMark 10 / Digital Content Creation | |
| Moyenne de la classe Multimedia (3651 - 16240, n=50, 2 dernières années) | |
| Moyenne Intel Core i7-13700H, NVIDIA GeForce RTX 4050 Laptop GPU (9527 - 10643, n=7) | |
| Samsung Galaxy Book3 Ultra 16 | |
| Lenovo ThinkBook 16p G3 ARH | |
| Dell XPS 15 9520 RTX 3050 Ti | |
| LG Gram 17Z90Q-E.AD78G | |
| Acer Swift X SFX16-52G-77RX | |
| Asus VivoBook Pro 16X OLED N7600PC-L2026X | |
| CrossMark / Overall | |
| Moyenne de la classe Multimedia (866 - 2728, n=59, 2 dernières années) | |
| Dell XPS 15 9520 RTX 3050 Ti | |
| Moyenne Intel Core i7-13700H, NVIDIA GeForce RTX 4050 Laptop GPU (1205 - 1937, n=9) | |
| Acer Swift X SFX16-52G-77RX | |
| Schenker Vision 16 Pro RTX 3070 Ti | |
| Samsung Galaxy Book3 Ultra 16 | |
| Lenovo ThinkBook 16p G3 ARH | |
| LG Gram 17Z90Q-E.AD78G | |
| Asus VivoBook Pro 16X OLED N7600PC-L2026X | |
| CrossMark / Productivity | |
| Dell XPS 15 9520 RTX 3050 Ti | |
| Moyenne de la classe Multimedia (931 - 2489, n=59, 2 dernières années) | |
| Acer Swift X SFX16-52G-77RX | |
| Moyenne Intel Core i7-13700H, NVIDIA GeForce RTX 4050 Laptop GPU (1158 - 1877, n=9) | |
| Schenker Vision 16 Pro RTX 3070 Ti | |
| Lenovo ThinkBook 16p G3 ARH | |
| Samsung Galaxy Book3 Ultra 16 | |
| LG Gram 17Z90Q-E.AD78G | |
| Asus VivoBook Pro 16X OLED N7600PC-L2026X | |
| CrossMark / Creativity | |
| Moyenne de la classe Multimedia (907 - 3465, n=59, 2 dernières années) | |
| Dell XPS 15 9520 RTX 3050 Ti | |
| Moyenne Intel Core i7-13700H, NVIDIA GeForce RTX 4050 Laptop GPU (1293 - 2044, n=9) | |
| Schenker Vision 16 Pro RTX 3070 Ti | |
| Acer Swift X SFX16-52G-77RX | |
| Samsung Galaxy Book3 Ultra 16 | |
| LG Gram 17Z90Q-E.AD78G | |
| Lenovo ThinkBook 16p G3 ARH | |
| Asus VivoBook Pro 16X OLED N7600PC-L2026X | |
| CrossMark / Responsiveness | |
| Dell XPS 15 9520 RTX 3050 Ti | |
| Acer Swift X SFX16-52G-77RX | |
| Moyenne Intel Core i7-13700H, NVIDIA GeForce RTX 4050 Laptop GPU (1097 - 1929, n=9) | |
| Moyenne de la classe Multimedia (605 - 2024, n=59, 2 dernières années) | |
| Samsung Galaxy Book3 Ultra 16 | |
| Schenker Vision 16 Pro RTX 3070 Ti | |
| Lenovo ThinkBook 16p G3 ARH | |
| LG Gram 17Z90Q-E.AD78G | |
| Asus VivoBook Pro 16X OLED N7600PC-L2026X | |
| PCMark 8 Home Score Accelerated v2 | 4564 points | |
| PCMark 8 Work Score Accelerated v2 | 5090 points | |
| PCMark 10 Score | 6822 points | |
Aide | ||
| AIDA64 / Memory Copy | |
| Moyenne de la classe Multimedia (11299 - 132135, n=53, 2 dernières années) | |
| Samsung Galaxy Book3 Ultra 16 | |
| LG Gram 17Z90Q-E.AD78G | |
| Acer Swift X SFX16-52G-77RX | |
| Schenker Vision 16 Pro RTX 3070 Ti | |
| Moyenne Intel Core i7-13700H (24334 - 78081, n=29) | |
| Dell XPS 15 9520 RTX 3050 Ti | |
| Lenovo ThinkBook 16p G3 ARH | |
| Asus VivoBook Pro 16X OLED N7600PC-L2026X | |
| AIDA64 / Memory Read | |
| Moyenne de la classe Multimedia (11624 - 174586, n=53, 2 dernières années) | |
| LG Gram 17Z90Q-E.AD78G | |
| Samsung Galaxy Book3 Ultra 16 | |
| Acer Swift X SFX16-52G-77RX | |
| Schenker Vision 16 Pro RTX 3070 Ti | |
| Moyenne Intel Core i7-13700H (23681 - 79656, n=29) | |
| Dell XPS 15 9520 RTX 3050 Ti | |
| Lenovo ThinkBook 16p G3 ARH | |
| Asus VivoBook Pro 16X OLED N7600PC-L2026X | |
| AIDA64 / Memory Write | |
| Samsung Galaxy Book3 Ultra 16 | |
| Moyenne de la classe Multimedia (11755 - 134998, n=53, 2 dernières années) | |
| Moyenne Intel Core i7-13700H (22986 - 99898, n=29) | |
| Schenker Vision 16 Pro RTX 3070 Ti | |
| LG Gram 17Z90Q-E.AD78G | |
| Acer Swift X SFX16-52G-77RX | |
| Dell XPS 15 9520 RTX 3050 Ti | |
| Lenovo ThinkBook 16p G3 ARH | |
| Asus VivoBook Pro 16X OLED N7600PC-L2026X | |
| AIDA64 / Memory Latency | |
| Moyenne de la classe Multimedia (7 - 535, n=52, 2 dernières années) | |
| Lenovo ThinkBook 16p G3 ARH | |
| Acer Swift X SFX16-52G-77RX | |
| LG Gram 17Z90Q-E.AD78G | |
| Dell XPS 15 9520 RTX 3050 Ti | |
| Samsung Galaxy Book3 Ultra 16 | |
| Moyenne Intel Core i7-13700H (82.4 - 136.8, n=29) | |
| Schenker Vision 16 Pro RTX 3070 Ti | |
| Asus VivoBook Pro 16X OLED N7600PC-L2026X | |
* ... Moindre est la valeur, meilleures sont les performances
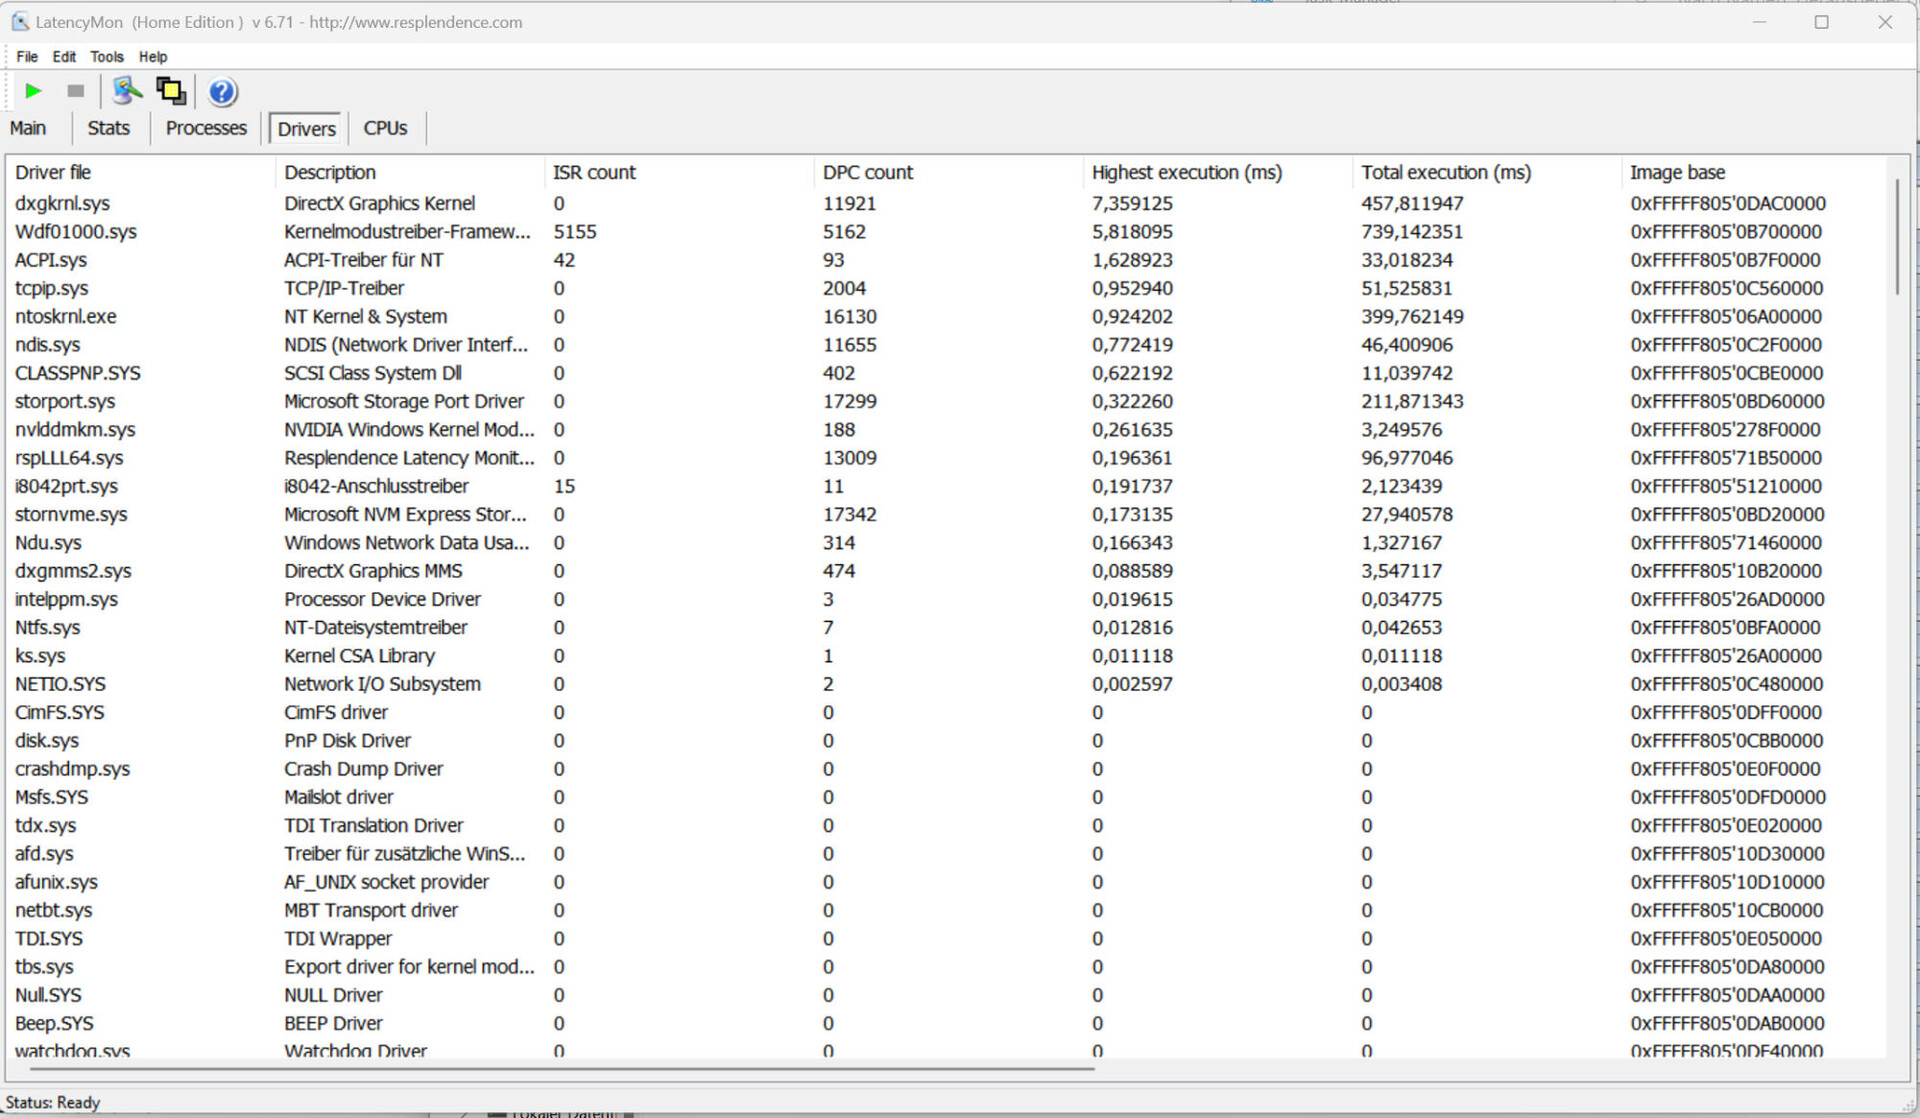
Latence DPC
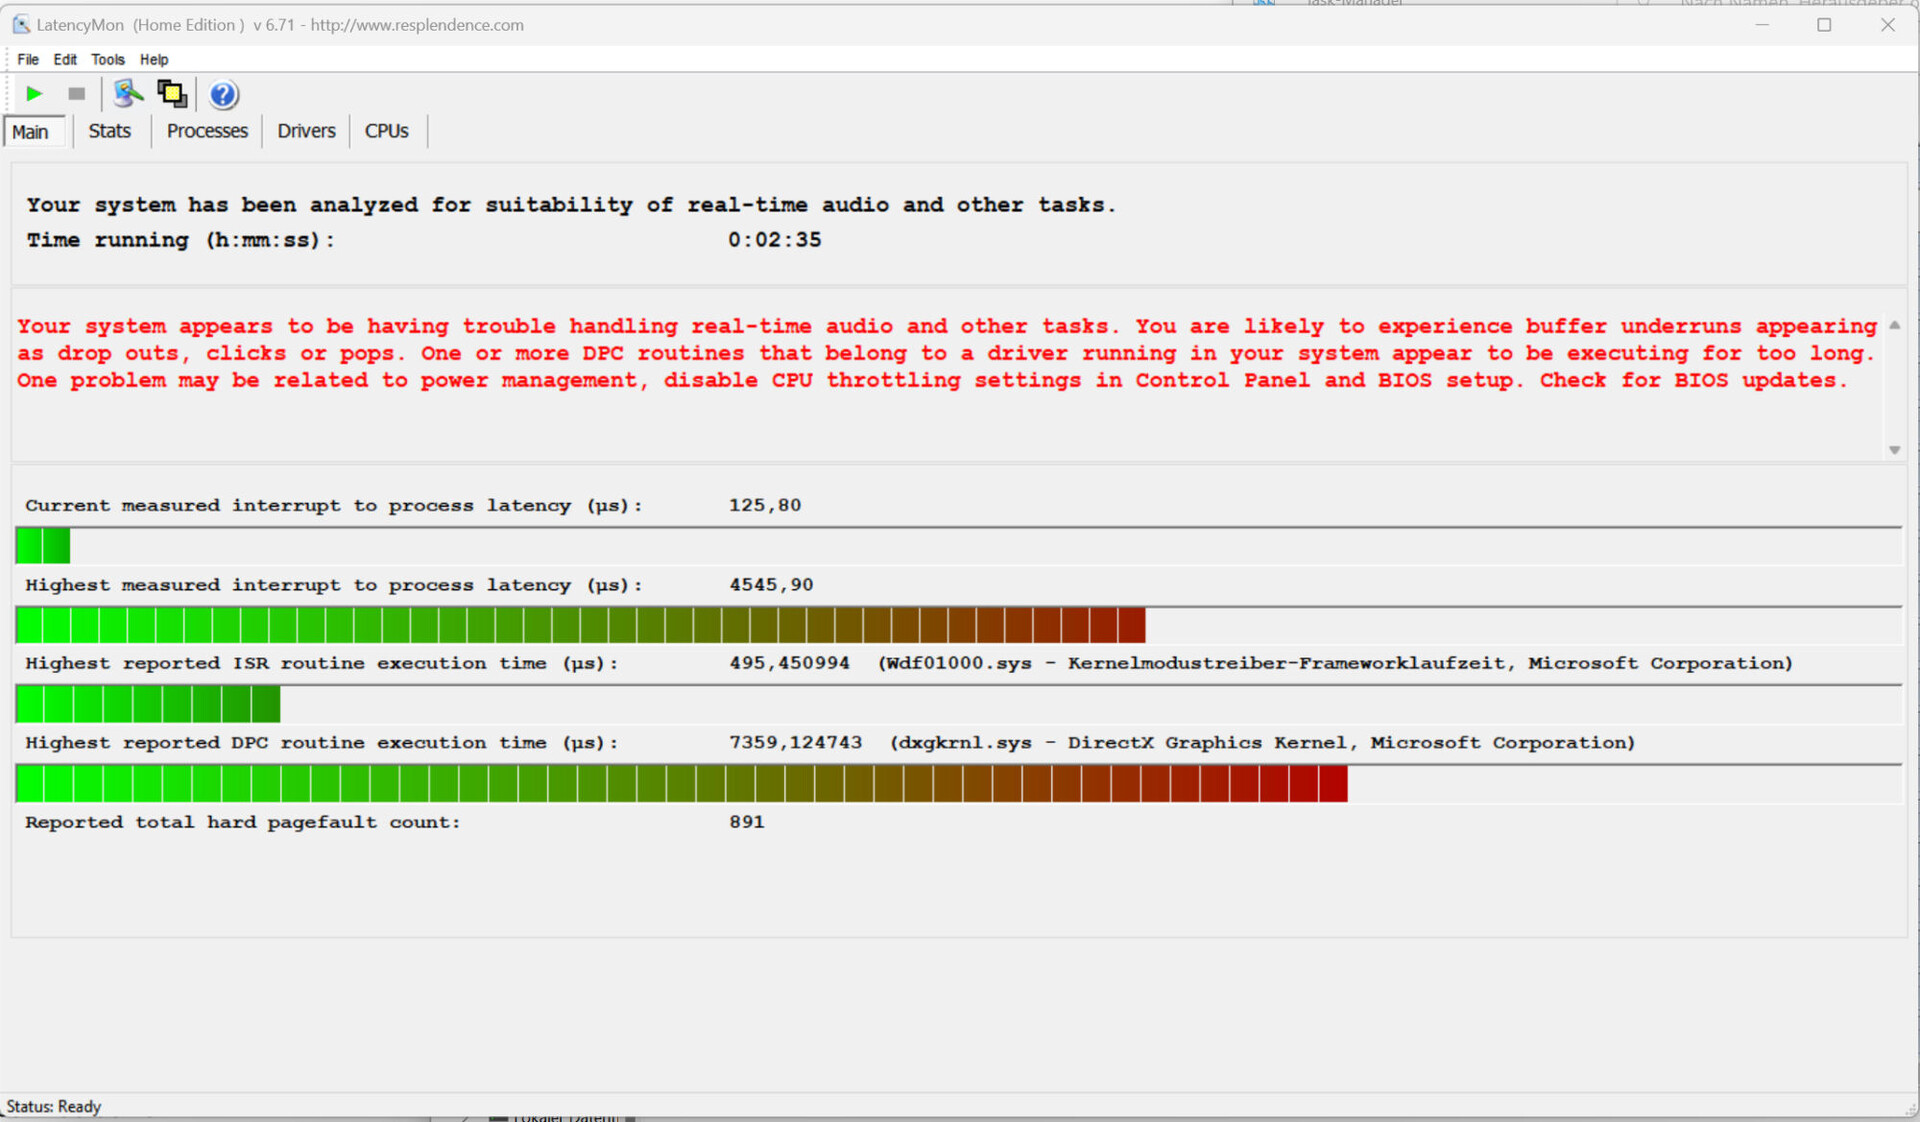
Le test normalisé du moniteur de latence (navigation sur le web, lecture de vidéos 4k, charge élevée Prime95) a révélé des anomalies, de sorte que le système ne semble pas adapté à l'édition vidéo et audio en temps réel. Les futures mises à jour logicielles pourraient apporter des améliorations, voire des détériorations.
| DPC Latencies / LatencyMon - interrupt to process latency (max), Web, Youtube, Prime95 | |
| LG Gram 17Z90Q-E.AD78G | |
| Samsung Galaxy Book3 Ultra 16 | |
| Lenovo ThinkBook 16p G3 ARH | |
| Dell XPS 15 9520 RTX 3050 Ti | |
| Acer Swift X SFX16-52G-77RX | |
| Schenker Vision 16 Pro RTX 3070 Ti | |
| Asus VivoBook Pro 16X OLED N7600PC-L2026X | |
* ... Moindre est la valeur, meilleures sont les performances
Dispositifs de stockage
Samsung n'est pas avare en espace de stockage : le disque SSD PCIe 4 (M.2 2280) intégré de notre appareil de test ne dispose que de 512 Go, ce qui est trop peu pour un ordinateur portable de 2 400 dollars. Au moins, il offre d'excellents débits de données. Un second SSD peut être installé.

* ... Moindre est la valeur, meilleures sont les performances
Sustained Read Performance: DiskSpd Read Loop, Queue Depth 8
Carte graphique
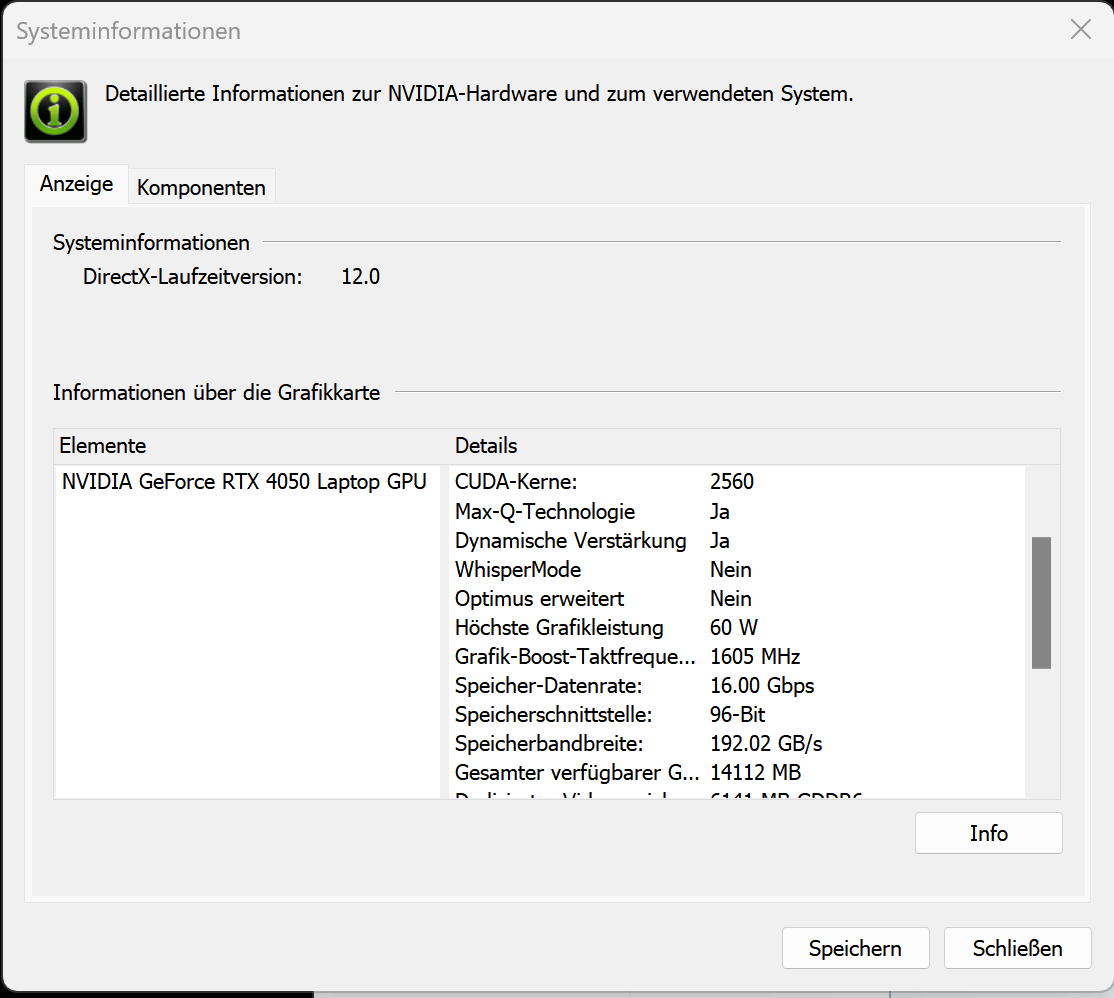
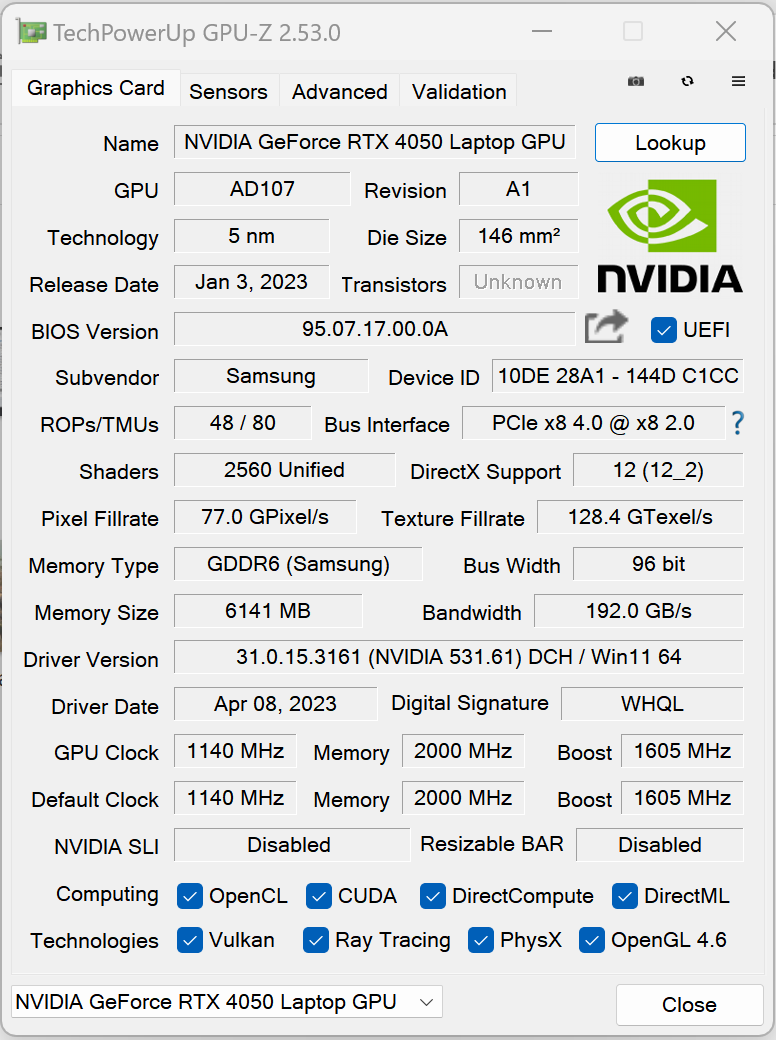
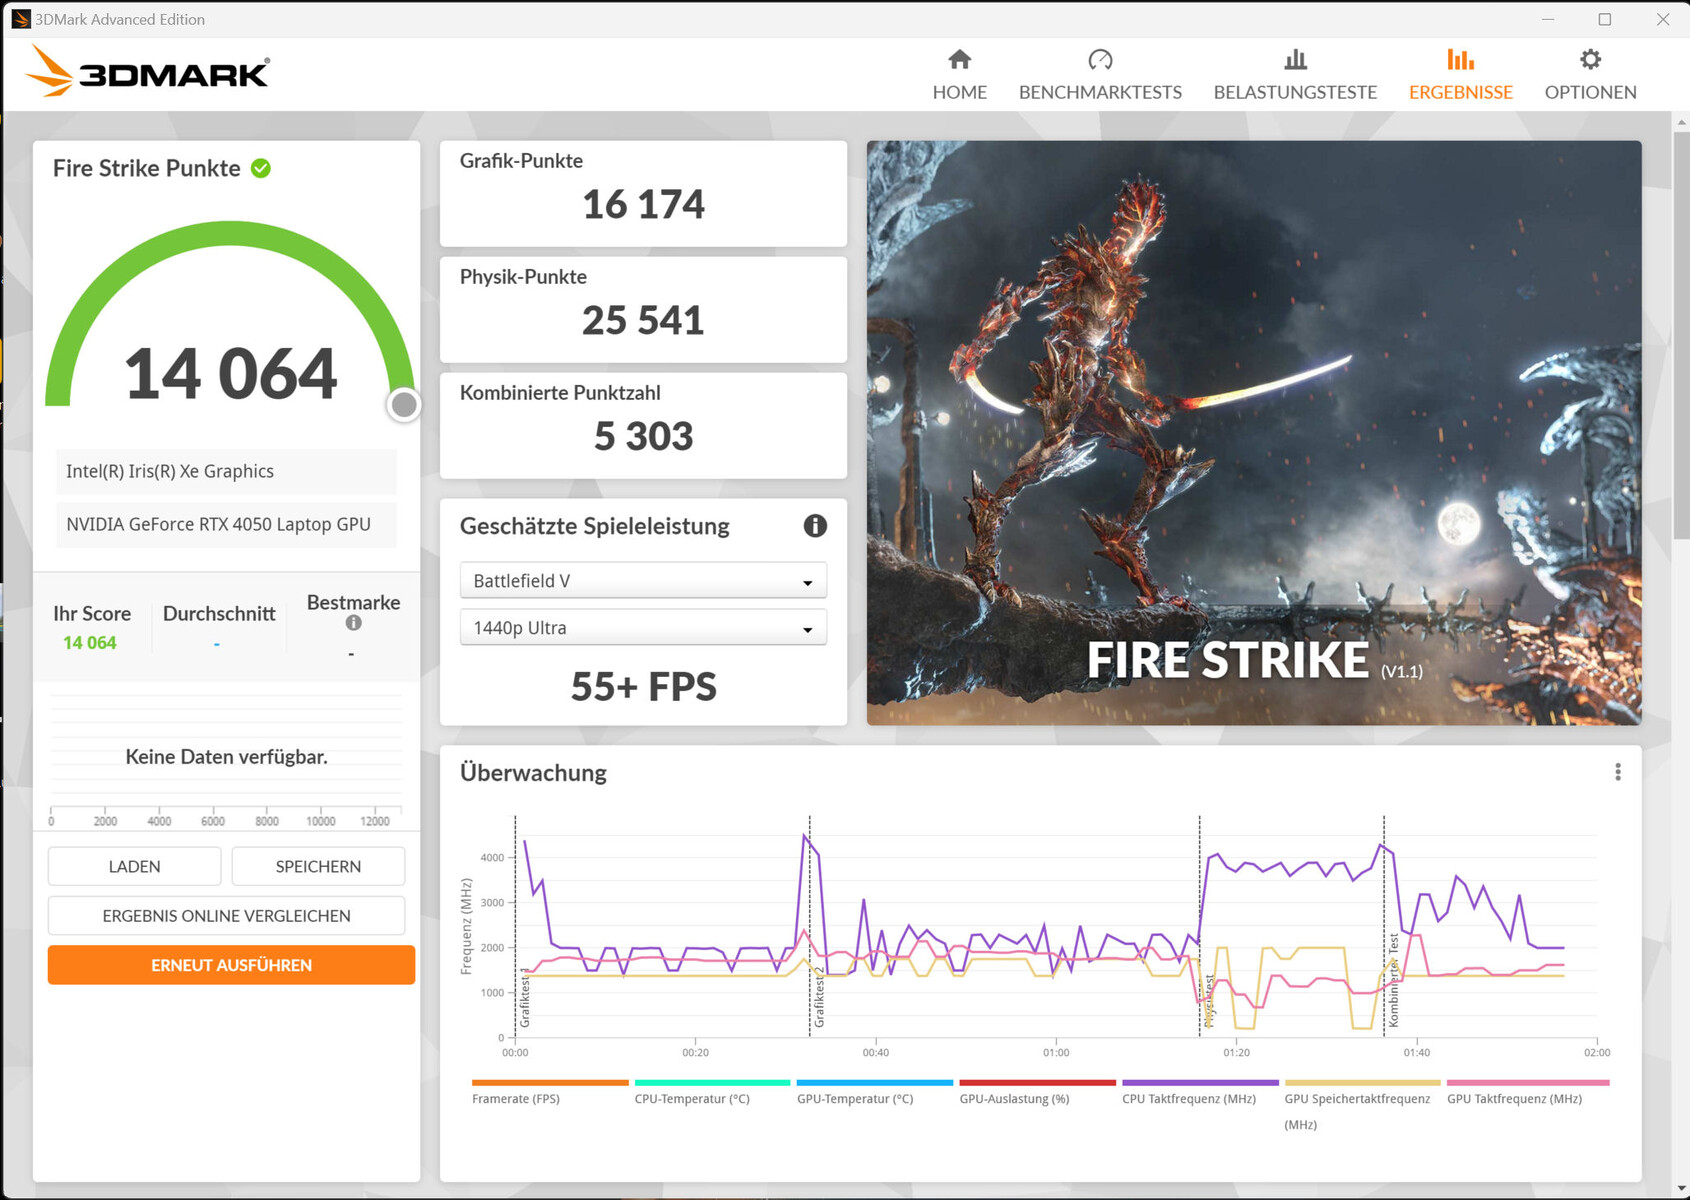
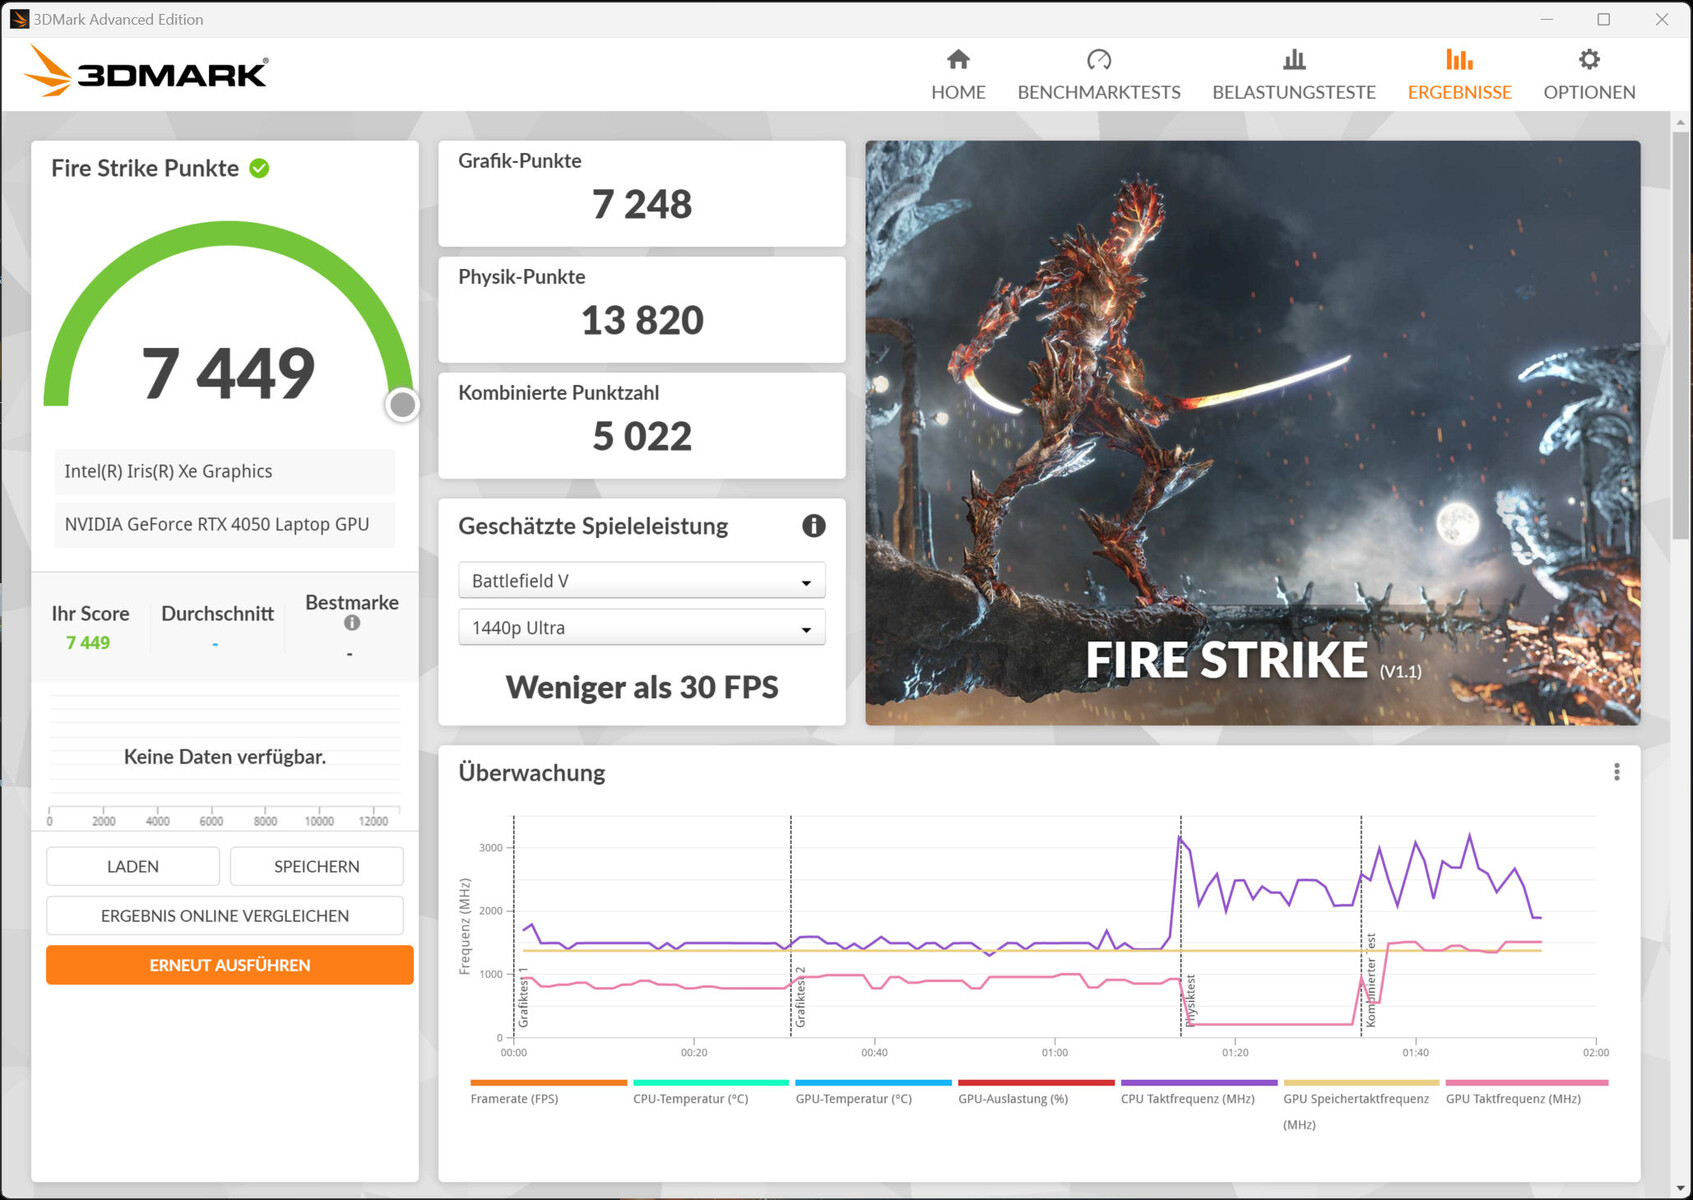
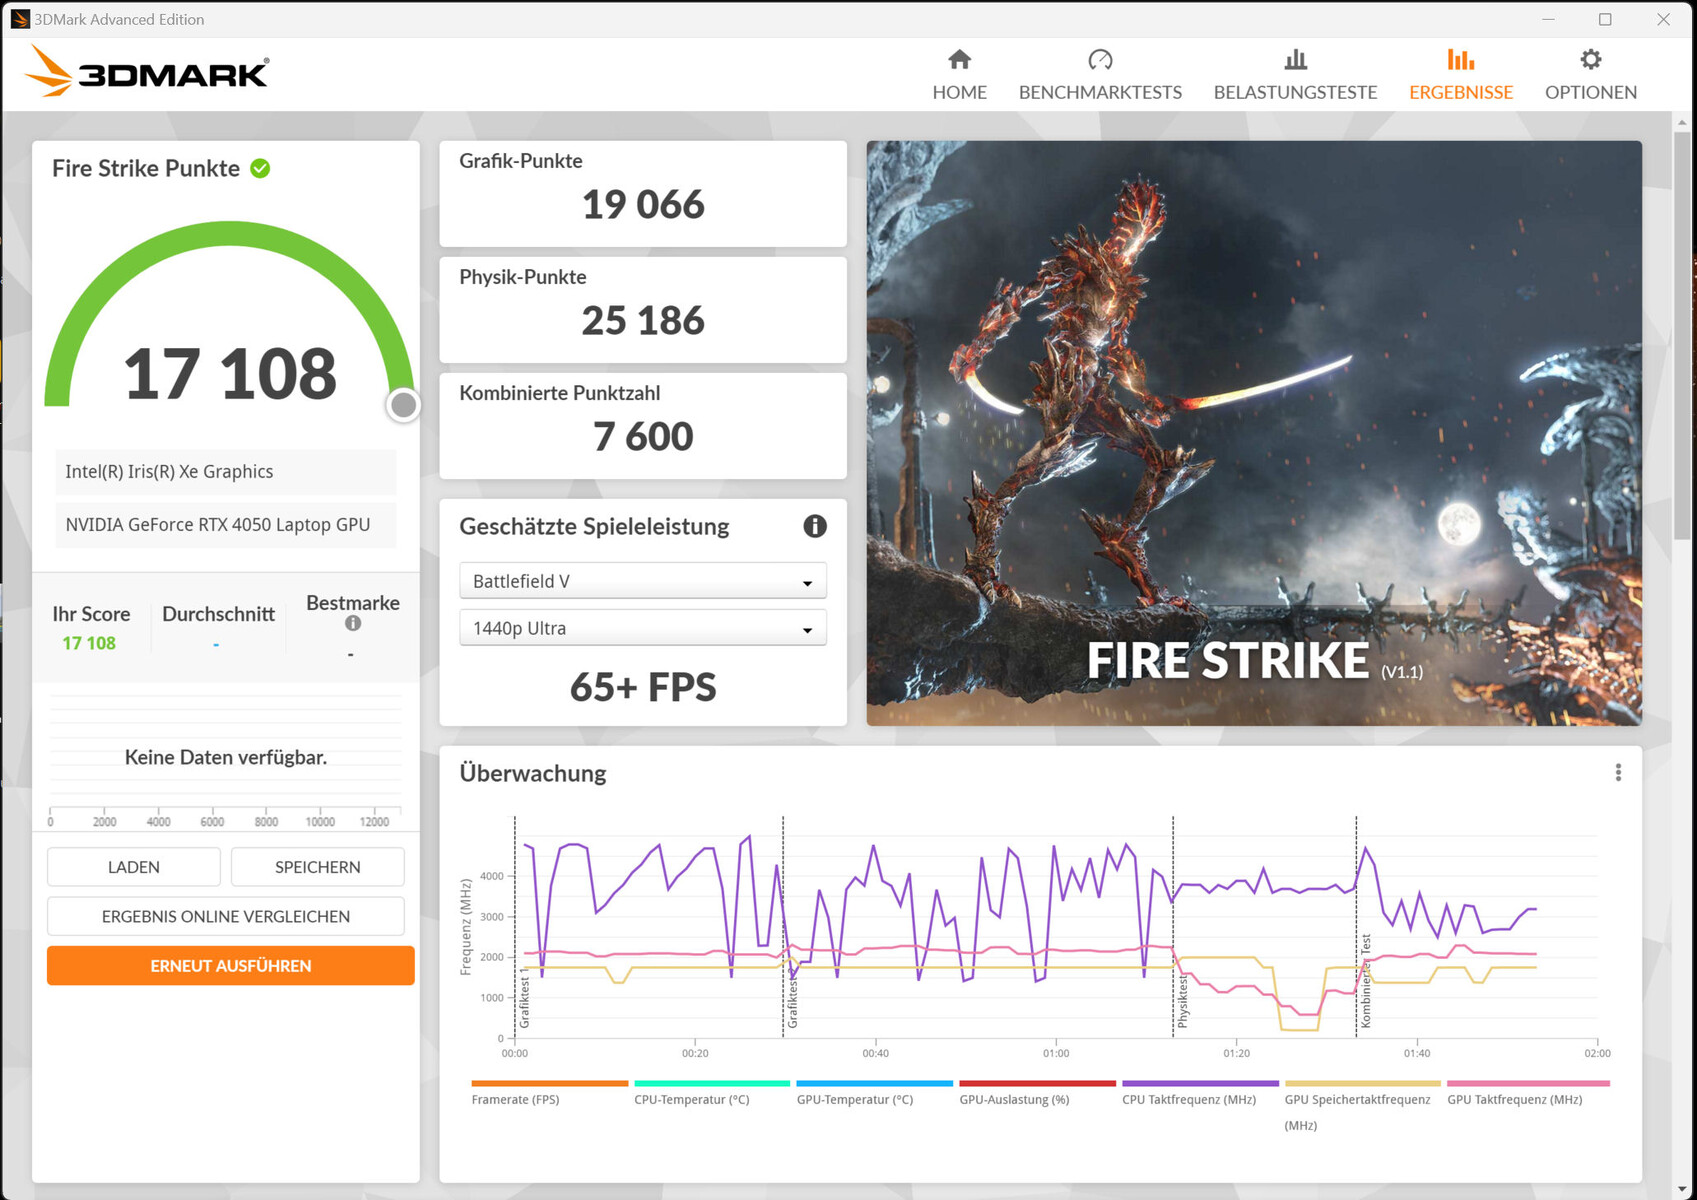
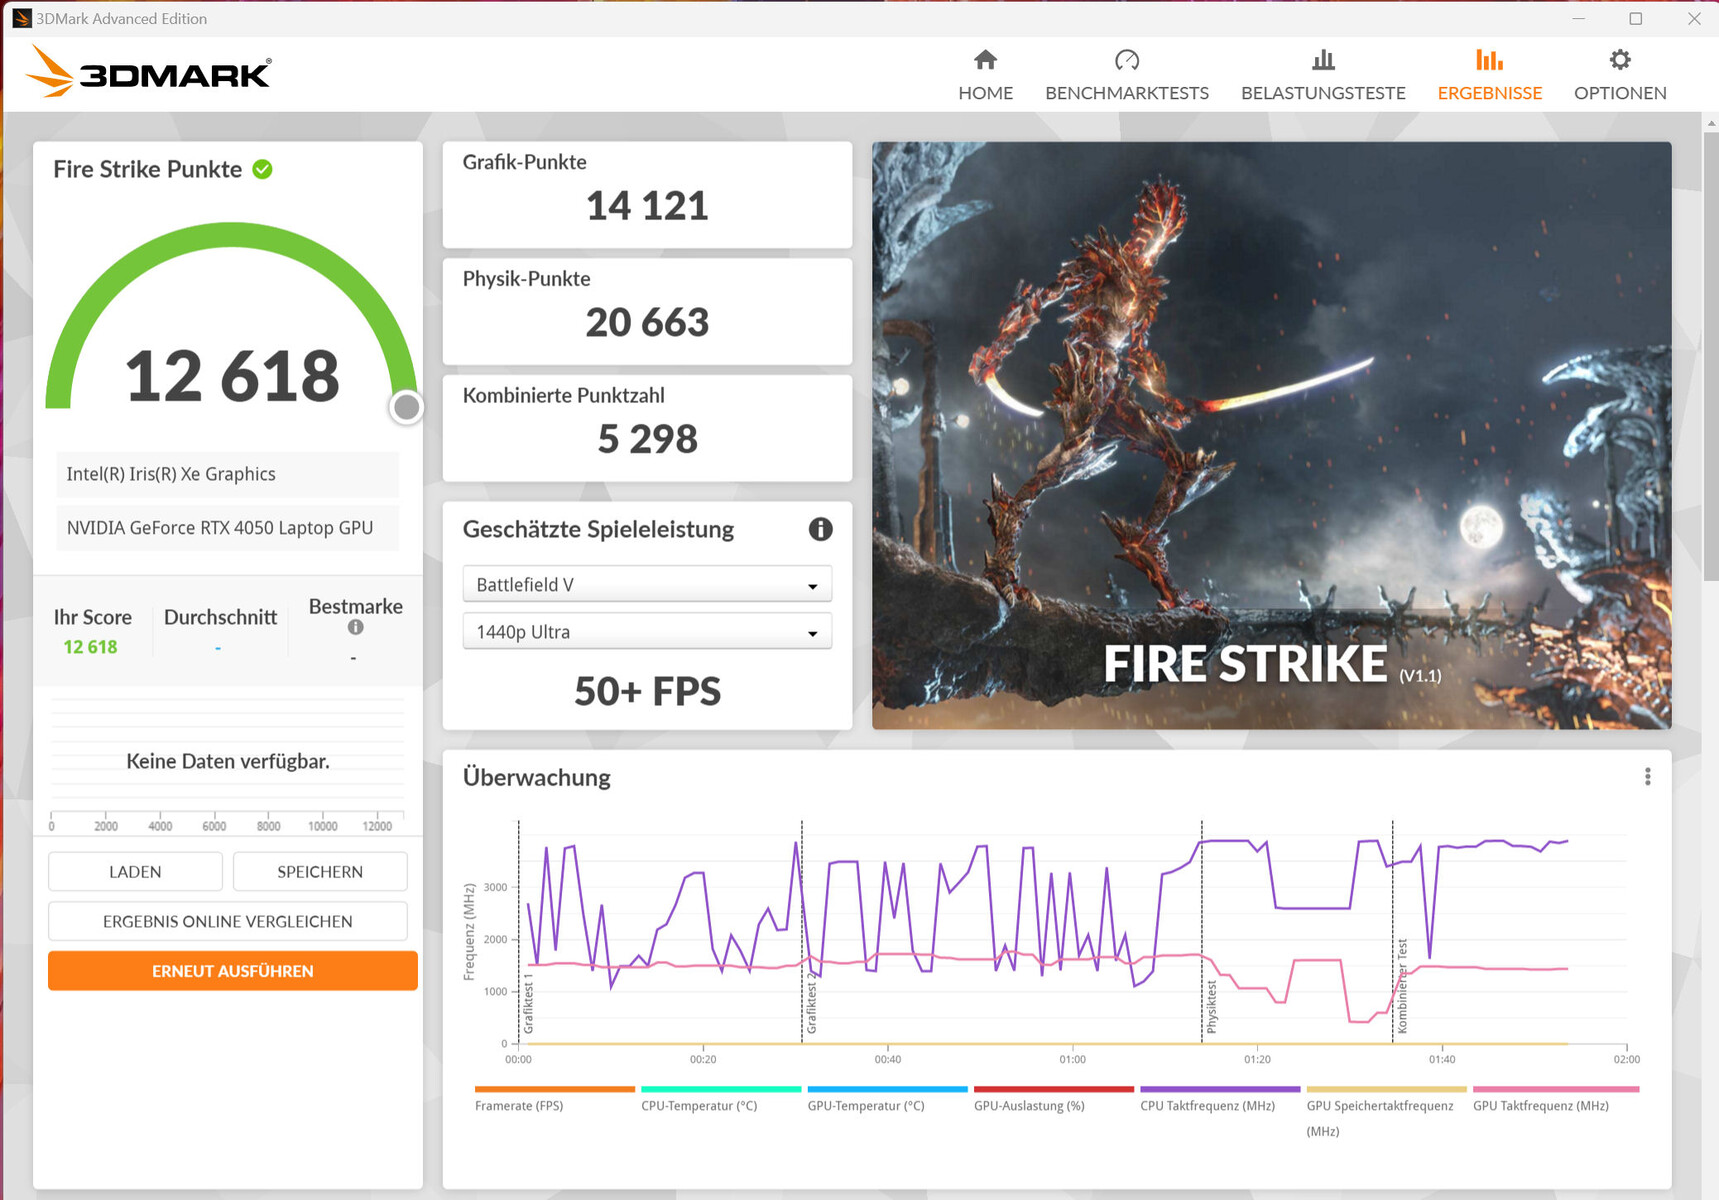
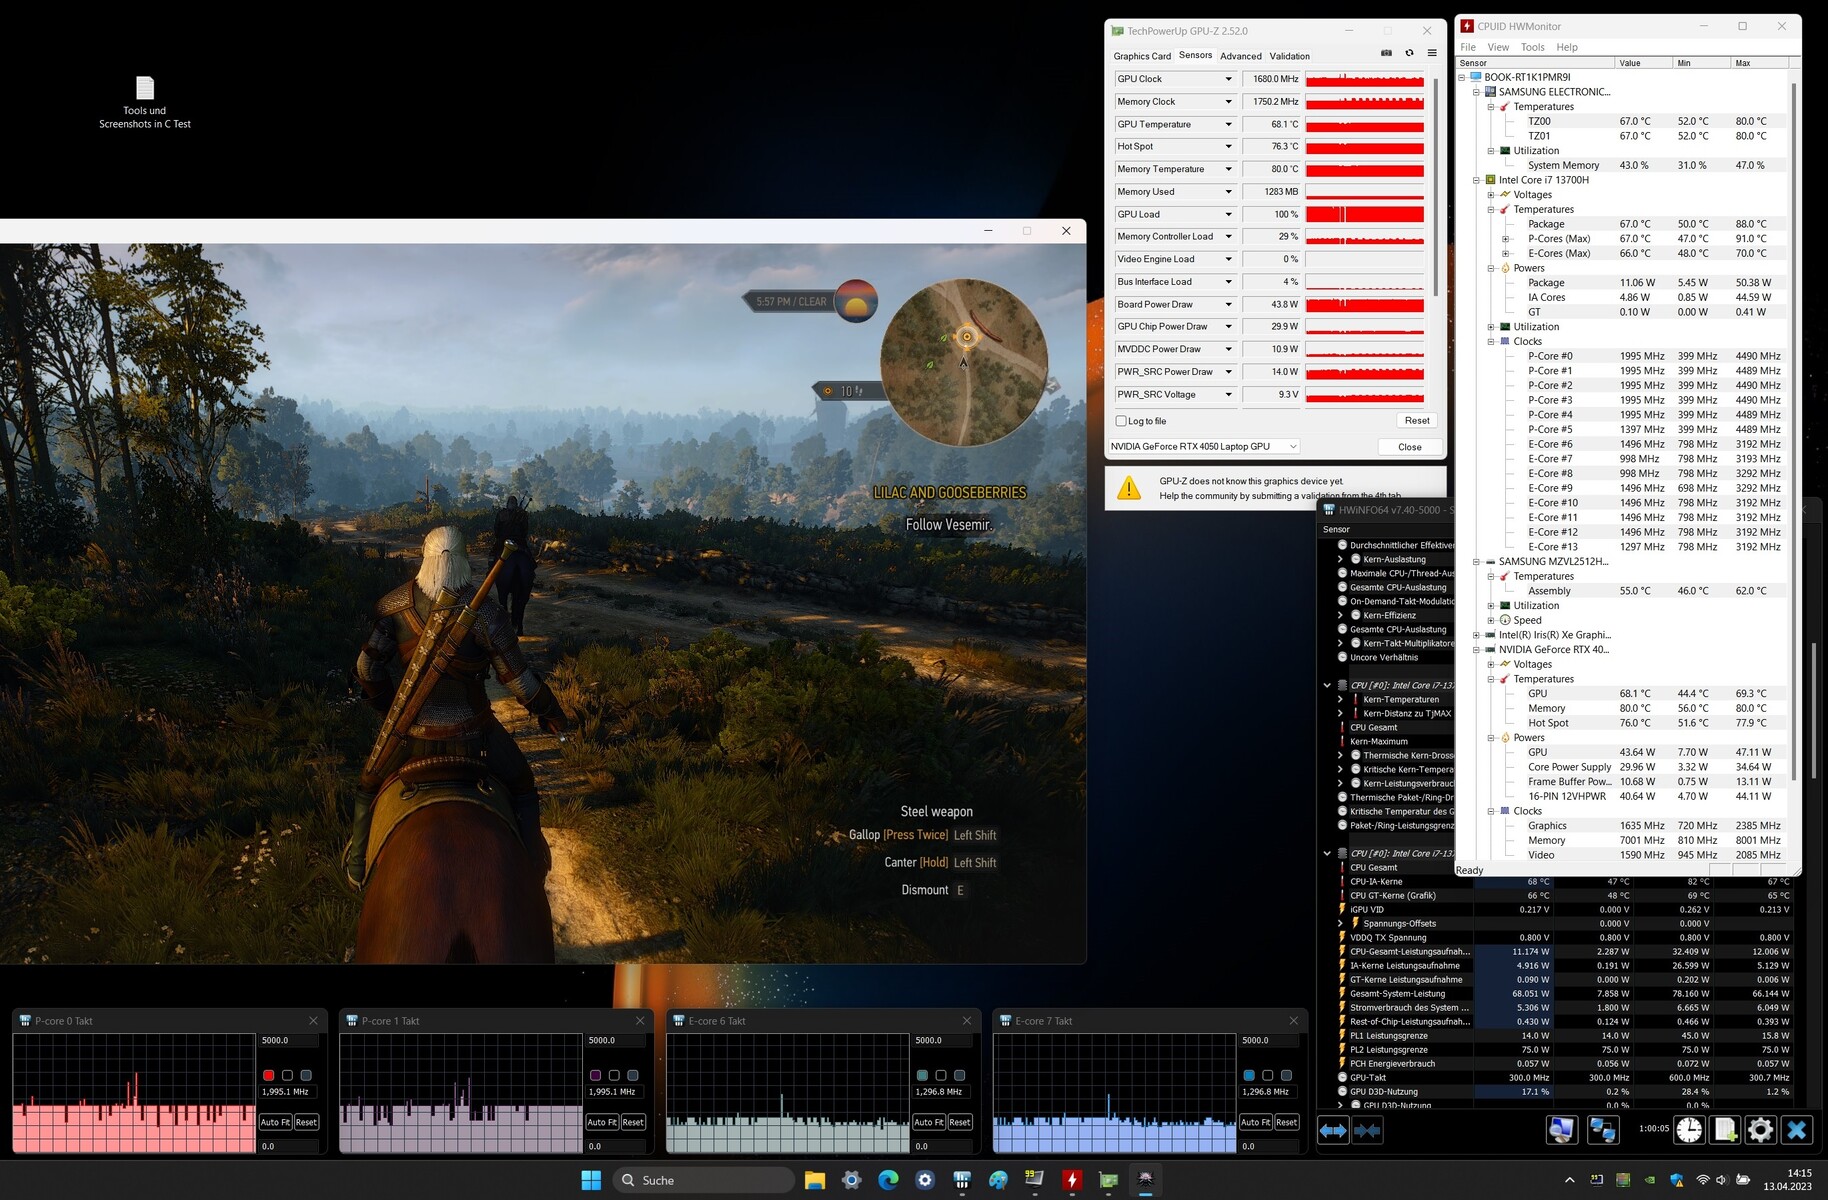
L'ordinateur portable GeForce RTX 4050 portable offre 2 560 shaders, un bus large de 96 bits et une mémoire GDDR6 rapide (6 144 Mo). Samsung lui accorde un TGP de 60 watts (35 watts + 25 watts dynamiques) - une valeur à l'extrémité inférieure de ce qui est possible. Selon le test Witcher 3, le TGP est pleinement utilisé - mais seulement lorsque le profil "High Performance" est actif. L'ordinateur portable n'offre pas de mode dGPU.
Les résultats du benchmark dépendent du profil de performance choisi, mais sont toujours en dessous de la moyenne de la RTX 4050. En fait, la RTX 4050 fonctionne assez efficacement avec un TGP bas, atteignant plus de points ou des taux de trame plus élevés par watt que la RTX 4050 de la MSI Katana 15 (TGP : 105 watts).
| 3DMark Performance rating - Percent | |
| Schenker Vision 16 Pro RTX 3070 Ti -1! | |
| MSI Katana 15 B12VEK | |
| Moyenne NVIDIA GeForce RTX 4050 Laptop GPU | |
| Lenovo ThinkBook 16p G3 ARH | |
| Samsung Galaxy Book3 Ultra 16 | |
| Samsung Galaxy Book3 Ultra 16 | |
| Moyenne de la classe Multimedia | |
| Samsung Galaxy Book3 Ultra 16 | |
| Dell XPS 15 9520 RTX 3050 Ti | |
| Asus VivoBook Pro 16X OLED N7600PC-L2026X | |
| Acer Swift X SFX16-52G-77RX | |
| LG Gram 17Z90Q-E.AD78G | |
| 3DMark 11 - 1280x720 Performance GPU | |
| Schenker Vision 16 Pro RTX 3070 Ti | |
| MSI Katana 15 B12VEK | |
| Moyenne NVIDIA GeForce RTX 4050 Laptop GPU (13339 - 32642, n=41) | |
| Samsung Galaxy Book3 Ultra 16 (Hohe Leistung) | |
| Lenovo ThinkBook 16p G3 ARH | |
| Samsung Galaxy Book3 Ultra 16 | |
| Samsung Galaxy Book3 Ultra 16 (Leise) | |
| Moyenne de la classe Multimedia (3749 - 60002, n=54, 2 dernières années) | |
| Asus VivoBook Pro 16X OLED N7600PC-L2026X | |
| Dell XPS 15 9520 RTX 3050 Ti | |
| Acer Swift X SFX16-52G-77RX | |
| LG Gram 17Z90Q-E.AD78G | |
| 3DMark 06 Standard Score | 45618 points | |
| 3DMark 11 Performance | 18217 points | |
| 3DMark Cloud Gate Standard Score | 41061 points | |
| 3DMark Fire Strike Score | 14064 points | |
| 3DMark Time Spy Score | 5784 points | |
Aide | ||
| V-Ray Benchmark Next 4.10 | |
| GPU | |
| Moyenne NVIDIA GeForce RTX 4050 Laptop GPU (333 - 565, n=35) | |
| Schenker Vision 16 Pro RTX 3070 Ti (v4.10.07 ) | |
| Samsung Galaxy Book3 Ultra 16 (v4.10.07, Hohe Leistung) | |
| Samsung Galaxy Book3 Ultra 16 (v4.10.07 ) | |
| Samsung Galaxy Book3 Ultra 16 (v4.10.07, Leise) | |
| Moyenne de la classe Multimedia (32 - 1191, n=52, 2 dernières années) | |
| Asus VivoBook Pro 16X OLED N7600PC-L2026X (v4.10.07 ) | |
| LG Gram 17Z90Q-E.AD78G (v4.10.07 ) | |
| Acer Swift X SFX16-52G-77RX (v4.10.07 ) | |
| CPU | |
| Moyenne de la classe Multimedia (4772 - 35165, n=52, 2 dernières années) | |
| Samsung Galaxy Book3 Ultra 16 (v4.10.07, Hohe Leistung ) | |
| Moyenne NVIDIA GeForce RTX 4050 Laptop GPU (5413 - 24181, n=35) | |
| Samsung Galaxy Book3 Ultra 16 (v4.10.07 ) | |
| Schenker Vision 16 Pro RTX 3070 Ti (v4.10.07 ) | |
| Samsung Galaxy Book3 Ultra 16 (v4.10.07, Leise) | |
| Acer Swift X SFX16-52G-77RX (v4.10.07 ) | |
| LG Gram 17Z90Q-E.AD78G (v4.10.07 ) | |
| Asus VivoBook Pro 16X OLED N7600PC-L2026X (v4.10.07 ) | |
* ... Moindre est la valeur, meilleures sont les performances
Performance des jeux
L'ordinateur portable est capable de jouer en FHD avec des réglages moyens à élevés, voire maximums. La splendeur de l'écran OLED (2880x1800) peut être mise en valeur avec des réglages réduits. Le taux de rafraîchissement dépend du mode de performance utilisé, mais il est toujours inférieur à la moyenne de la RTX 4050. le mode "Haute performance" offre des taux de rafraîchissement 20 à 30 % plus élevés que le mode "Optimisé". Le profil "Silent" est principalement adapté au jeu en HD.
| Performance rating - Percent | |
| Schenker Vision 16 Pro RTX 3070 Ti | |
| MSI Katana 15 B12VEK | |
| Moyenne NVIDIA GeForce RTX 4050 Laptop GPU | |
| Samsung Galaxy Book3 Ultra 16 | |
| Lenovo ThinkBook 16p G3 ARH | |
| Samsung Galaxy Book3 Ultra 16 | |
| Dell XPS 15 9520 RTX 3050 Ti | |
| Moyenne de la classe Multimedia | |
| Asus VivoBook Pro 16X OLED N7600PC-L2026X | |
| LG Gram 17Z90Q-E.AD78G | |
| Samsung Galaxy Book3 Ultra 16 | |
| Acer Swift X SFX16-52G-77RX | |
| The Witcher 3 - 1920x1080 Ultra Graphics & Postprocessing (HBAO+) | |
| Schenker Vision 16 Pro RTX 3070 Ti | |
| MSI Katana 15 B12VEK | |
| Moyenne NVIDIA GeForce RTX 4050 Laptop GPU (18.5 - 94.7, n=40) | |
| Lenovo ThinkBook 16p G3 ARH | |
| Samsung Galaxy Book3 Ultra 16 (Hohe Leistung) | |
| Samsung Galaxy Book3 Ultra 16 | |
| Asus VivoBook Pro 16X OLED N7600PC-L2026X | |
| Moyenne de la classe Multimedia (11 - 107, n=5, 2 dernières années) | |
| Dell XPS 15 9520 RTX 3050 Ti | |
| LG Gram 17Z90Q-E.AD78G | |
| Acer Swift X SFX16-52G-77RX | |
| Samsung Galaxy Book3 Ultra 16 | |
| GTA V - 1920x1080 Highest AA:4xMSAA + FX AF:16x | |
| Schenker Vision 16 Pro RTX 3070 Ti | |
| MSI Katana 15 B12VEK | |
| Samsung Galaxy Book3 Ultra 16 (Hohe Leistung) | |
| Moyenne NVIDIA GeForce RTX 4050 Laptop GPU (14.9 - 101.7, n=35) | |
| Lenovo ThinkBook 16p G3 ARH | |
| Samsung Galaxy Book3 Ultra 16 | |
| Moyenne de la classe Multimedia (7.92 - 141.6, n=53, 2 dernières années) | |
| Asus VivoBook Pro 16X OLED N7600PC-L2026X | |
| Dell XPS 15 9520 RTX 3050 Ti | |
| LG Gram 17Z90Q-E.AD78G | |
| Acer Swift X SFX16-52G-77RX | |
| Samsung Galaxy Book3 Ultra 16 (Leise) | |
| Final Fantasy XV Benchmark - 1920x1080 High Quality | |
| Schenker Vision 16 Pro RTX 3070 Ti (1.3) | |
| MSI Katana 15 B12VEK (1.3) | |
| Lenovo ThinkBook 16p G3 ARH (1.3) | |
| Moyenne NVIDIA GeForce RTX 4050 Laptop GPU (15.5 - 122.3, n=39) | |
| Samsung Galaxy Book3 Ultra 16 (1.3, Hohe Leistung) | |
| Samsung Galaxy Book3 Ultra 16 (1.3) | |
| Moyenne de la classe Multimedia (7.61 - 144.4, n=56, 2 dernières années) | |
| Dell XPS 15 9520 RTX 3050 Ti (1.3) | |
| Asus VivoBook Pro 16X OLED N7600PC-L2026X (1.3) | |
| LG Gram 17Z90Q-E.AD78G (1.3) | |
| Acer Swift X SFX16-52G-77RX (1.3) | |
| Samsung Galaxy Book3 Ultra 16 (1.3, Leise) | |
| Strange Brigade - 1920x1080 ultra AA:ultra AF:16 | |
| Schenker Vision 16 Pro RTX 3070 Ti (1.47.22.14 D3D12) | |
| MSI Katana 15 B12VEK (1.47.22.14 D3D12) | |
| Moyenne NVIDIA GeForce RTX 4050 Laptop GPU (21.2 - 156.6, n=38) | |
| Lenovo ThinkBook 16p G3 ARH (1.47.22.14 D3D12) | |
| Samsung Galaxy Book3 Ultra 16 (1.47.22.14 D3D12, Hohe Leistung) | |
| Samsung Galaxy Book3 Ultra 16 (1.47.22.14 D3D12) | |
| Moyenne de la classe Multimedia (13.3 - 303, n=55, 2 dernières années) | |
| Dell XPS 15 9520 RTX 3050 Ti (1.47.22.14 D3D12) | |
| Asus VivoBook Pro 16X OLED N7600PC-L2026X (1.47.22.14 D3D12) | |
| Acer Swift X SFX16-52G-77RX (1.47.22.14 D3D12) | |
| LG Gram 17Z90Q-E.AD78G (1.47.22.14 D3D12) | |
| Samsung Galaxy Book3 Ultra 16 (1.47.22.14 D3D12, Leise) | |
| Dota 2 Reborn - 1920x1080 ultra (3/3) best looking | |
| Schenker Vision 16 Pro RTX 3070 Ti | |
| MSI Katana 15 B12VEK | |
| Samsung Galaxy Book3 Ultra 16 (Hohe Leistung) | |
| Moyenne NVIDIA GeForce RTX 4050 Laptop GPU (73.5 - 175.6, n=39) | |
| Samsung Galaxy Book3 Ultra 16 (Leise) | |
| Dell XPS 15 9520 RTX 3050 Ti | |
| Asus VivoBook Pro 16X OLED N7600PC-L2026X | |
| Lenovo ThinkBook 16p G3 ARH | |
| Moyenne de la classe Multimedia (29 - 179.9, n=57, 2 dernières années) | |
| Samsung Galaxy Book3 Ultra 16 | |
| Acer Swift X SFX16-52G-77RX | |
| LG Gram 17Z90Q-E.AD78G | |
| X-Plane 11.11 - 1920x1080 high (fps_test=3) | |
| Schenker Vision 16 Pro RTX 3070 Ti | |
| Dell XPS 15 9520 RTX 3050 Ti | |
| Samsung Galaxy Book3 Ultra 16 (Hohe Leistung) | |
| MSI Katana 15 B12VEK | |
| Moyenne NVIDIA GeForce RTX 4050 Laptop GPU (55.5 - 117, n=40) | |
| Samsung Galaxy Book3 Ultra 16 (Leise) | |
| Samsung Galaxy Book3 Ultra 16 | |
| Asus VivoBook Pro 16X OLED N7600PC-L2026X | |
| Lenovo ThinkBook 16p G3 ARH | |
| LG Gram 17Z90Q-E.AD78G | |
| LG Gram 17Z90Q-E.AD78G | |
| Moyenne de la classe Multimedia (16.9 - 141.1, n=53, 2 dernières années) | |
| Acer Swift X SFX16-52G-77RX | |
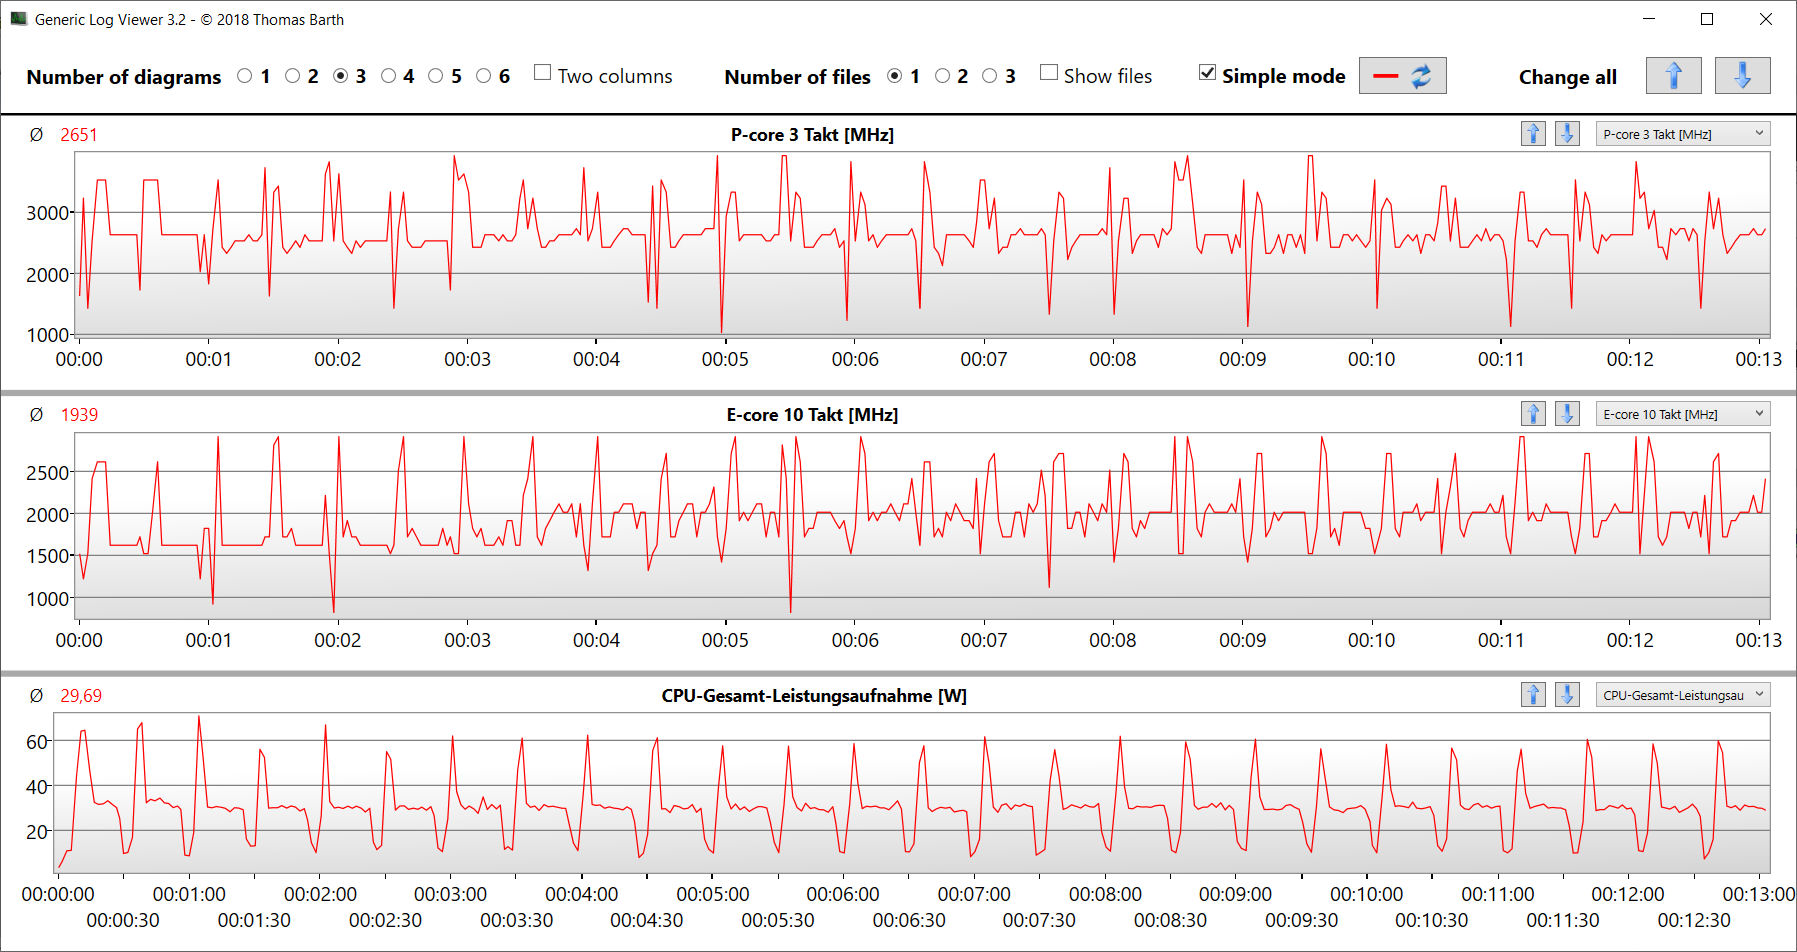
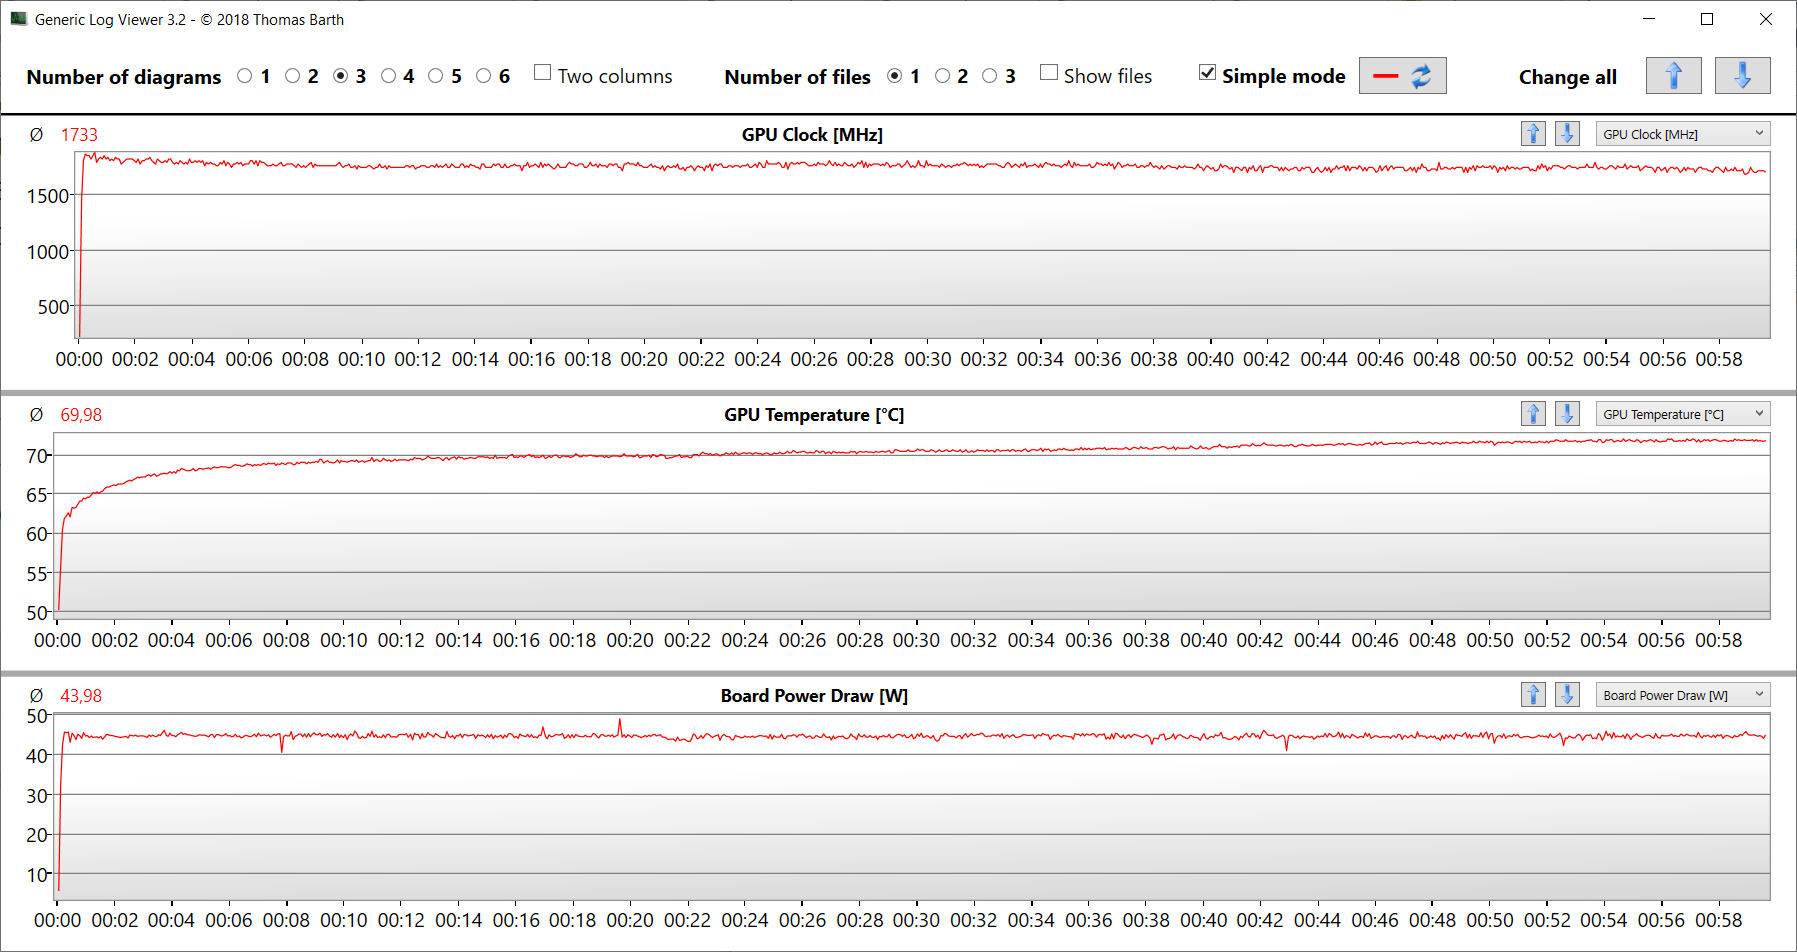
Pour vérifier si le taux de rafraîchissement reste constant sur une plus longue période, nous avons fait tourner "The Witcher 3" pendant environ 60 minutes en résolution Full HD et avec les paramètres de qualité maximum. Le personnage du jeu n'a pas été déplacé. Aucune baisse de la fréquence d'images n'a été détectée.
Witcher 3 FPS chart
| Bas | Moyen | Élevé | Ultra | QHD | |
|---|---|---|---|---|---|
| GTA V (2015) | 182.1 | 166.5 | 133.2 | 65.3 | 50.5 |
| The Witcher 3 (2015) | 268.5 | 184.1 | 107.1 | 60.1 | |
| Dota 2 Reborn (2015) | 161.8 | 138.7 | 79.2 | 73.5 | |
| Final Fantasy XV Benchmark (2018) | 105 | 77.2 | 56.9 | 41.5 | |
| X-Plane 11.11 (2018) | 143.6 | 88.2 | 79 | ||
| Far Cry 5 (2018) | 148 | 87 | 74 | 71 | 56 |
| Strange Brigade (2018) | 321 | 153.5 | 120.1 | 103.9 | 72.7 |
| The Division 2 (2019) | 130 | 83 | 69 | 53 | 35 |
| Doom Eternal (2020) | 228 | 135.6 | 124.7 | 114.3 | 82.5 |
| Gears Tactics (2020) | 268.5 | 141.8 | 95.2 | 64.8 | 44.8 |
| Flight Simulator 2020 (2020) | 107.2 | 57.6 | 40.5 | 30.6 | 22.9 |
| Crysis Remastered (2020) | 242 | 121.1 | 49.5 | 41.6 | 28.6 |
| Hitman 3 (2021) | 193.9 | 111.4 | 101 | 94.2 | 60.1 |
| Alan Wake Remastered (2021) | 161.5 | 98.3 | 86.7 | 63.2 | |
| Riders Republic (2021) | 138 | 72 | 67 | 63 | 44 |
| Forza Horizon 5 (2021) | 119 | 68 | 69 | 42 | 36 |
| Rainbow Six Extraction (2022) | 139 | 115 | 111 | 89 | 56 |
| Cyberpunk 2077 1.6 (2022) | 71 | 54.7 | 48 | 44.4 | 27.2 |
| Tiny Tina's Wonderlands (2022) | 104.5 | 93.4 | 63.3 | 49.8 | 33.6 |
| F1 22 (2022) | 135.3 | 127.4 | 97.5 | 36.2 | 23.1 |
| The Quarry (2022) | 91 | 68.8 | 57 | 44.6 | 28.5 |
| FIFA 23 (2022) | 94.3 | ||||
| A Plague Tale Requiem (2022) | 58.6 | 49 | 42.8 | 36.3 | 27.5 |
| Call of Duty Modern Warfare 2 2022 (2022) | 79 | 73 | 56 | 54 | 36 |
| Spider-Man Miles Morales (2022) | 72.9 | 67.1 | 56.9 | 51.5 | 42.5 |
| The Callisto Protocol (2022) | 74 | 62.5 | 59.3 | 41.4 | 29.5 |
| Need for Speed Unbound (2022) | 51.2 | 42.8 | 37 | 28.9 | 26.7 |
| High On Life (2023) | 104.9 | 78.1 | 65.3 | 57.3 | 35.7 |
| The Witcher 3 v4 (2023) | 113.4 | 82.5 | 43 | 38.1 | 23.8 |
| Dead Space Remake (2023) | 47.9 | 47.7 | 40.2 | 39.8 | 25.1 |
| Hogwarts Legacy (2023) | 92 | 74.2 | 59.6 | 51.9 | 23.9 |
| Returnal (2023) | 59 | 57 | 52 | 44 | |
| Atomic Heart (2023) | 95 | 76.1 | 47.8 | 37.8 | 28.2 |
| Company of Heroes 3 (2023) | 116.4 | 106.2 | 79 | 79.7 | 55.7 |
| Resident Evil 4 Remake (2023) | 81 | 57.7 | 53.4 | 36.8 | 23.8 |
Émissions - Ultrabook Samsung avec développement modéré du bruit
Bruit
Dans l'ensemble, Samsung maîtrise assez bien l'évolution du bruit. Les profils de l'ordinateur portable offrent un équilibre acceptable entre le bruit et les performances. La valeur maximale de 48 dB(A) a été atteinte lors du test Witcher 3 sous "High Performance". le profil "Optimisé" assure des niveaux de bruit modérés avec des taux de trame encore jouables. Le profil "Silent" est à la hauteur de son nom. On n'entend pratiquement rien des deux ventilateurs en mode veille et en utilisation quotidienne, car ils restent souvent immobiles.
Degré de la nuisance sonore
| Au repos |
| 26 / 27 / 28 dB(A) |
| Fortement sollicité |
| 40 / 41 dB(A) |
 | ||
30 dB silencieux 40 dB(A) audible 50 dB(A) bruyant |
||
min: | ||
| Samsung Galaxy Book3 Ultra 16 i7-13700H, GeForce RTX 4050 Laptop GPU | Schenker Vision 16 Pro RTX 3070 Ti i7-12700H, GeForce RTX 3070 Ti Laptop GPU | LG Gram 17Z90Q-E.AD78G i7-1260P, GeForce RTX 2050 Mobile | Lenovo ThinkBook 16p G3 ARH R9 6900HX, GeForce RTX 3060 Laptop GPU | Dell XPS 15 9520 RTX 3050 Ti i7-12700H, GeForce RTX 3050 Ti Laptop GPU | Asus VivoBook Pro 16X OLED N7600PC-L2026X i7-11370H, GeForce RTX 3050 4GB Laptop GPU | Acer Swift X SFX16-52G-77RX i7-1260P, A370M | |
|---|---|---|---|---|---|---|---|
| Noise | -2% | -10% | 5% | 10% | -22% | -0% | |
| arrêt / environnement * (dB) | 25 | 22.9 8% | 26 -4% | 22.7 9% | 22.8 9% | 25.15 -1% | 25 -0% |
| Idle Minimum * (dB) | 26 | 24.3 7% | 28 -8% | 23.1 11% | 22.9 12% | 30 -15% | 25 4% |
| Idle Average * (dB) | 27 | 24.3 10% | 28 -4% | 23.2 14% | 22.9 15% | 30 -11% | 25 7% |
| Idle Maximum * (dB) | 28 | 24.3 13% | 28.8 -3% | 23.6 16% | 22.9 18% | 30 -7% | 25 11% |
| Load Average * (dB) | 40 | 38.5 4% | 49.3 -23% | 30.6 23% | 30.9 23% | 57.6 -44% | 44.7 -12% |
| Witcher 3 ultra * (dB) | 39 | 51 -31% | 47.6 -22% | 37.8 3% | |||
| Load Maximum * (dB) | 41 | 51 -24% | 49.1 -20% | 47.5 -16% | 44.7 -9% | 62.9 -53% | 45.6 -11% |
* ... Moindre est la valeur, meilleures sont les performances
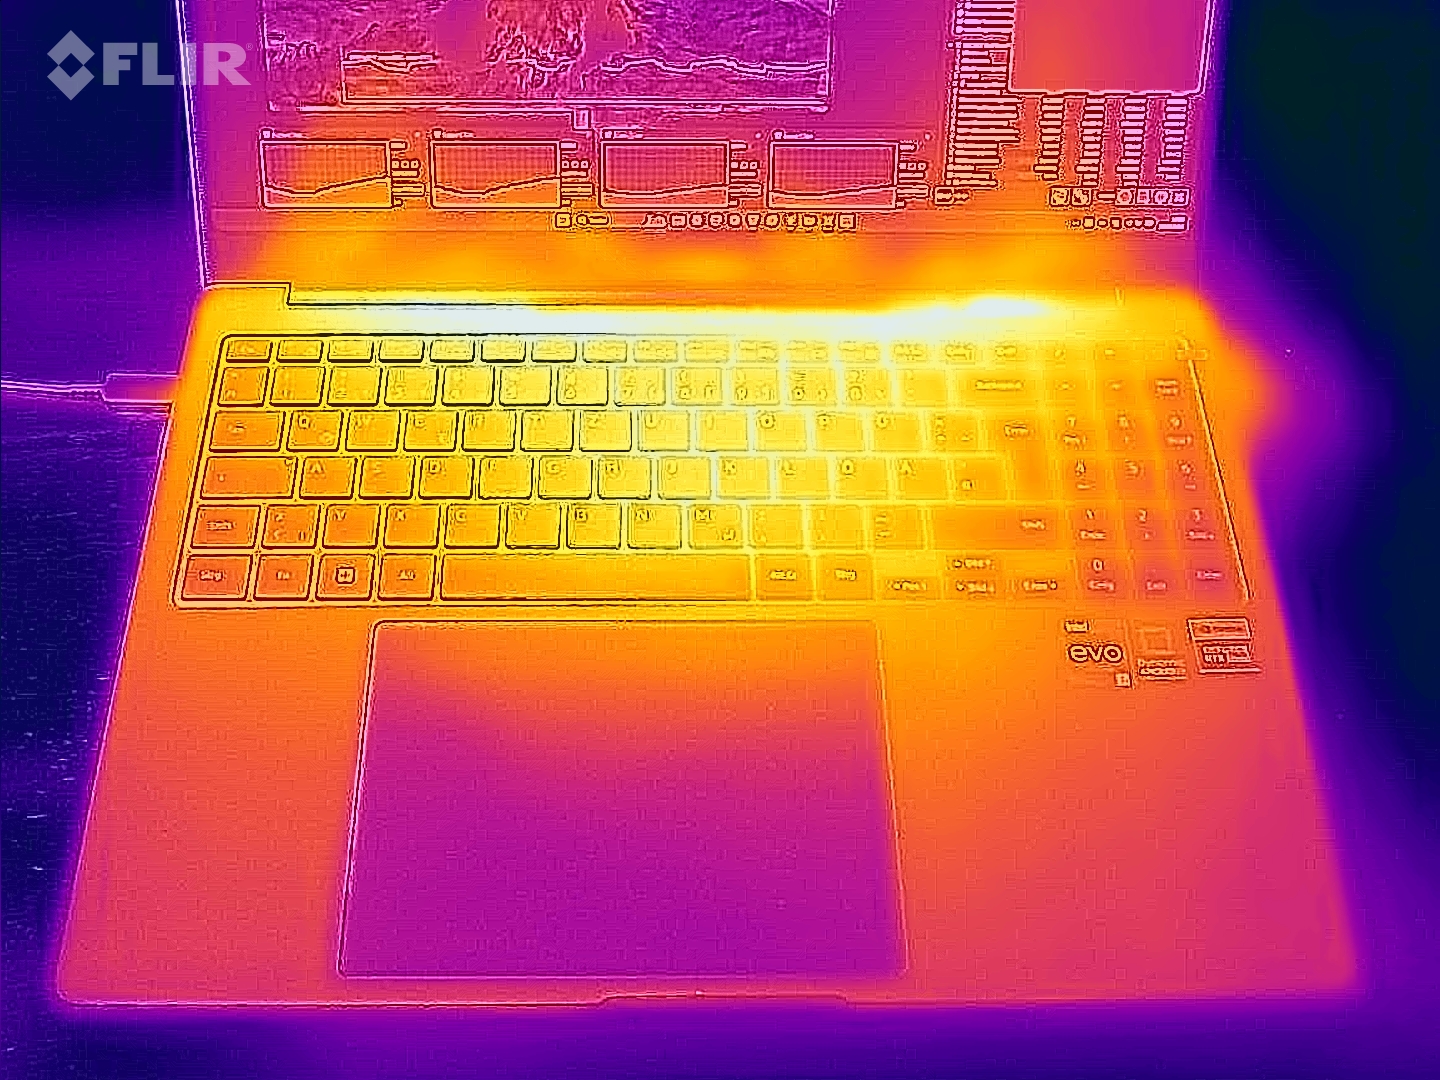
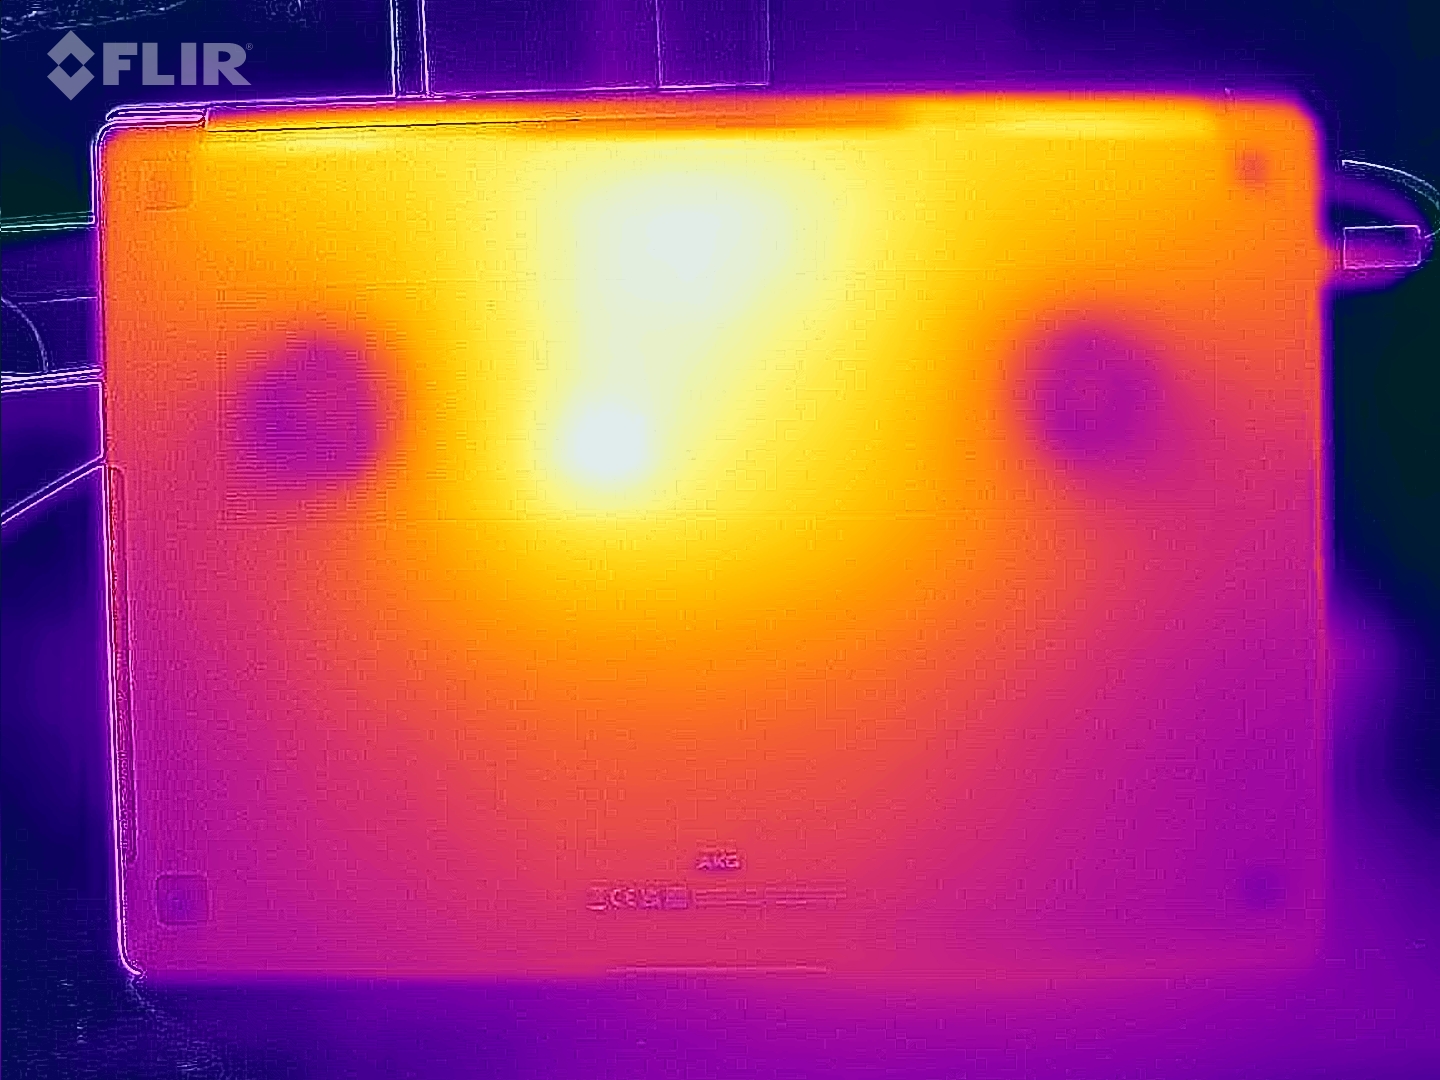
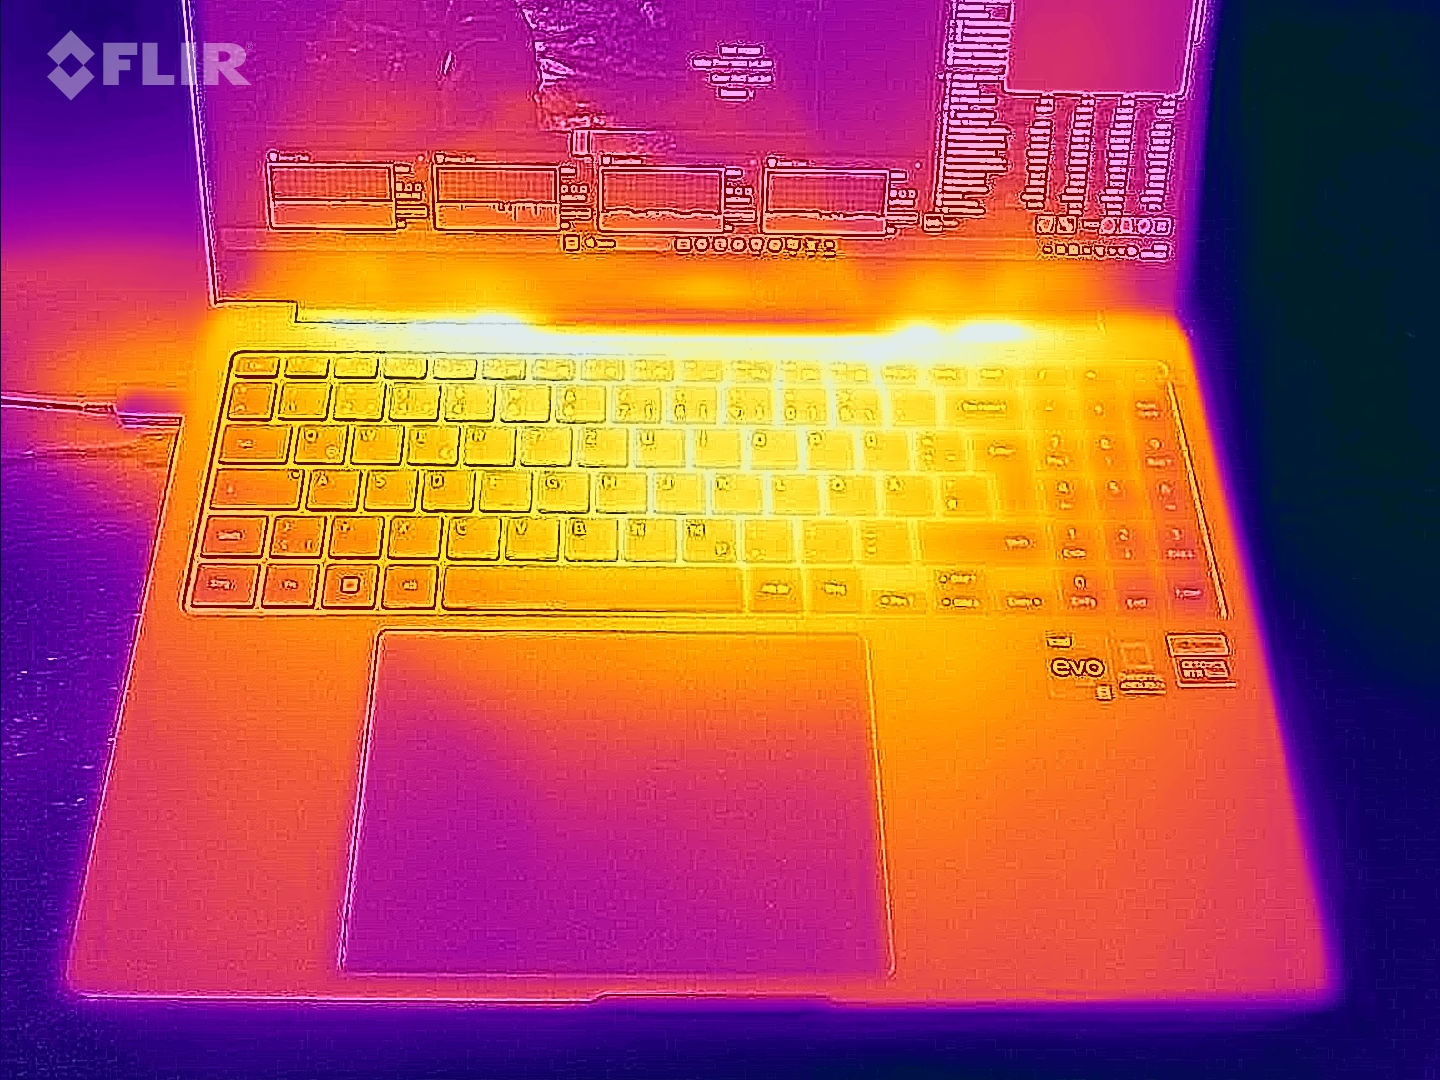
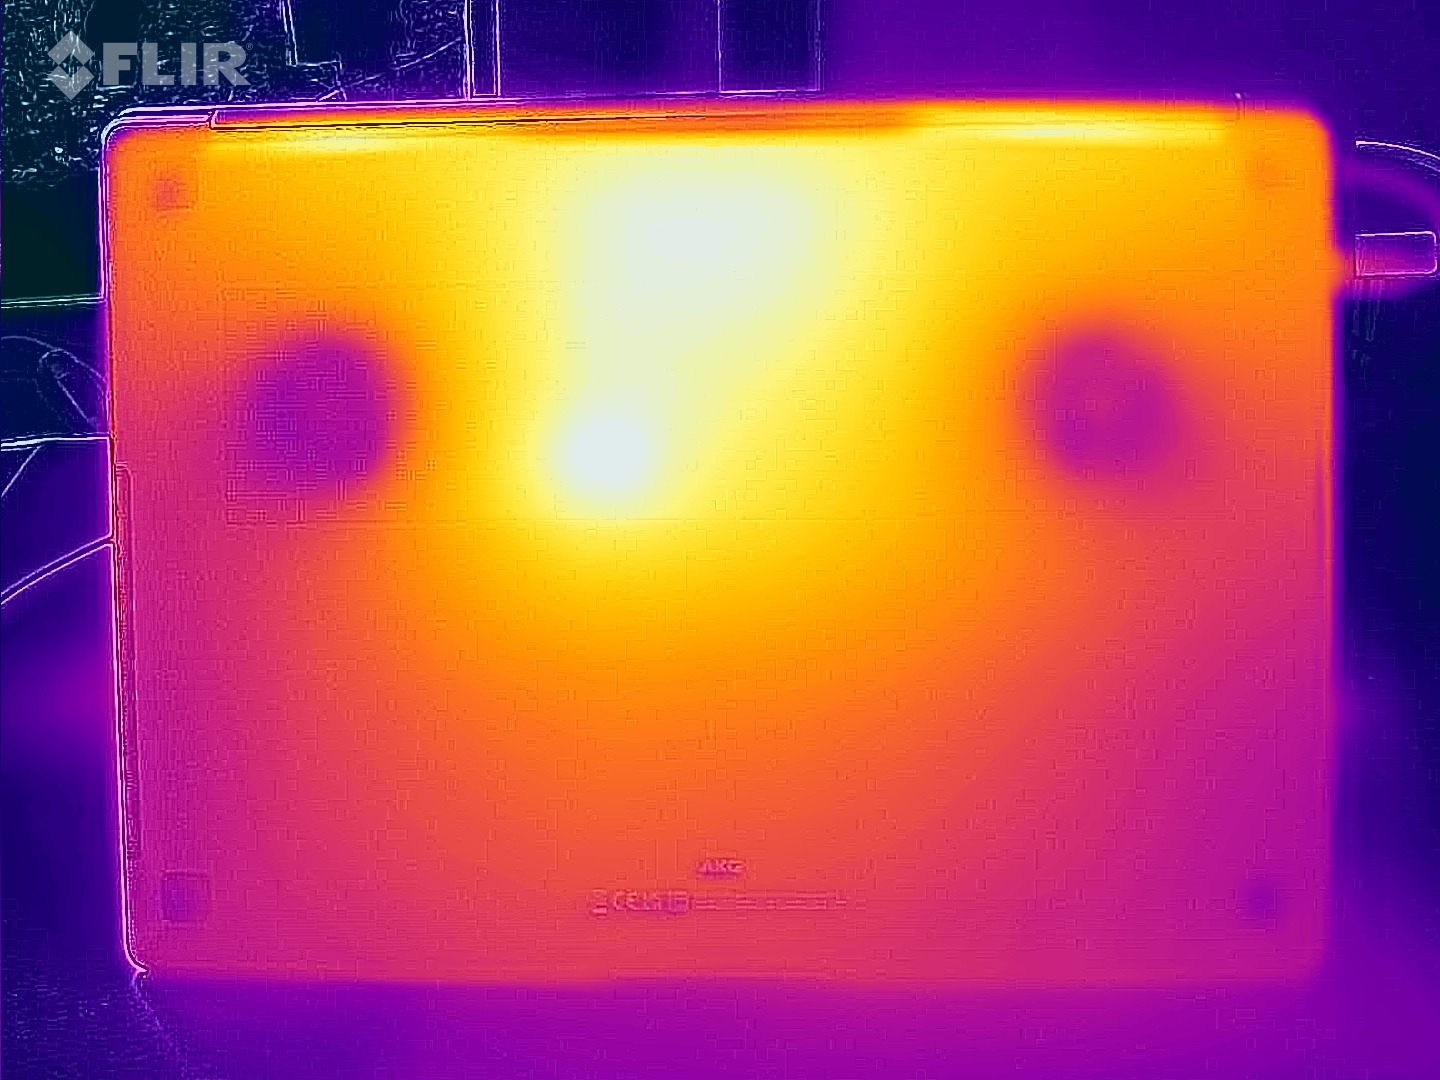
Température
La température du boîtier reste dans la zone verte en utilisation quotidienne (bureau, internet). Sous charge (test de stress, test Witcher 3 ), l'ordinateur portable chauffe sensiblement, mais pas de manière excessive. Les températures du processeur ne sont pas préoccupantes.
(±) La température maximale du côté supérieur est de 41 °C / 106 F, par rapport à la moyenne de 36.8 °C / 98 F, allant de 21 à 71 °C pour la classe Multimedia.
(±) Le fond chauffe jusqu'à un maximum de 44 °C / 111 F, contre une moyenne de 39.1 °C / 102 F
(+) En utilisation inactive, la température moyenne du côté supérieur est de 22.9 °C / 73 F, par rapport à la moyenne du dispositif de 31.3 °C / 88 F.
(-) En jouant à The Witcher 3, la température moyenne du côté supérieur est de 38.6 °C / 101 F, alors que la moyenne de l'appareil est de 31.3 °C / 88 F.
(+) Les repose-poignets et le pavé tactile atteignent la température maximale de la peau (35 °C / 95 F) et ne sont donc pas chauds.
(-) La température moyenne de la zone de l'appui-paume de dispositifs similaires était de 28.7 °C / 83.7 F (-6.3 °C / #-11.3 F).
| Samsung Galaxy Book3 Ultra 16 Intel Core i7-13700H, NVIDIA GeForce RTX 4050 Laptop GPU | Schenker Vision 16 Pro RTX 3070 Ti Intel Core i7-12700H, NVIDIA GeForce RTX 3070 Ti Laptop GPU | LG Gram 17Z90Q-E.AD78G Intel Core i7-1260P, NVIDIA GeForce RTX 2050 Mobile | Lenovo ThinkBook 16p G3 ARH AMD Ryzen 9 6900HX, NVIDIA GeForce RTX 3060 Laptop GPU | Dell XPS 15 9520 RTX 3050 Ti Intel Core i7-12700H, NVIDIA GeForce RTX 3050 Ti Laptop GPU | Asus VivoBook Pro 16X OLED N7600PC-L2026X Intel Core i7-11370H, NVIDIA GeForce RTX 3050 4GB Laptop GPU | Acer Swift X SFX16-52G-77RX Intel Core i7-1260P, Intel Arc A370M | |
|---|---|---|---|---|---|---|---|
| Heat | -12% | -15% | -25% | -25% | -14% | -24% | |
| Maximum Upper Side * (°C) | 41 | 50.8 -24% | 50.3 -23% | 48.2 -18% | 51.4 -25% | 40.6 1% | 49.4 -20% |
| Maximum Bottom * (°C) | 44 | 46.3 -5% | 52.5 -19% | 49.6 -13% | 51 -16% | 53 -20% | 55.5 -26% |
| Idle Upper Side * (°C) | 23 | 27.2 -18% | 26.9 -17% | 31.8 -38% | 30 -30% | 29 -26% | 28.4 -23% |
| Idle Bottom * (°C) | 26 | 26.6 -2% | 26.5 -2% | 33.6 -29% | 33 -27% | 28.3 -9% | 32.6 -25% |
* ... Moindre est la valeur, meilleures sont les performances
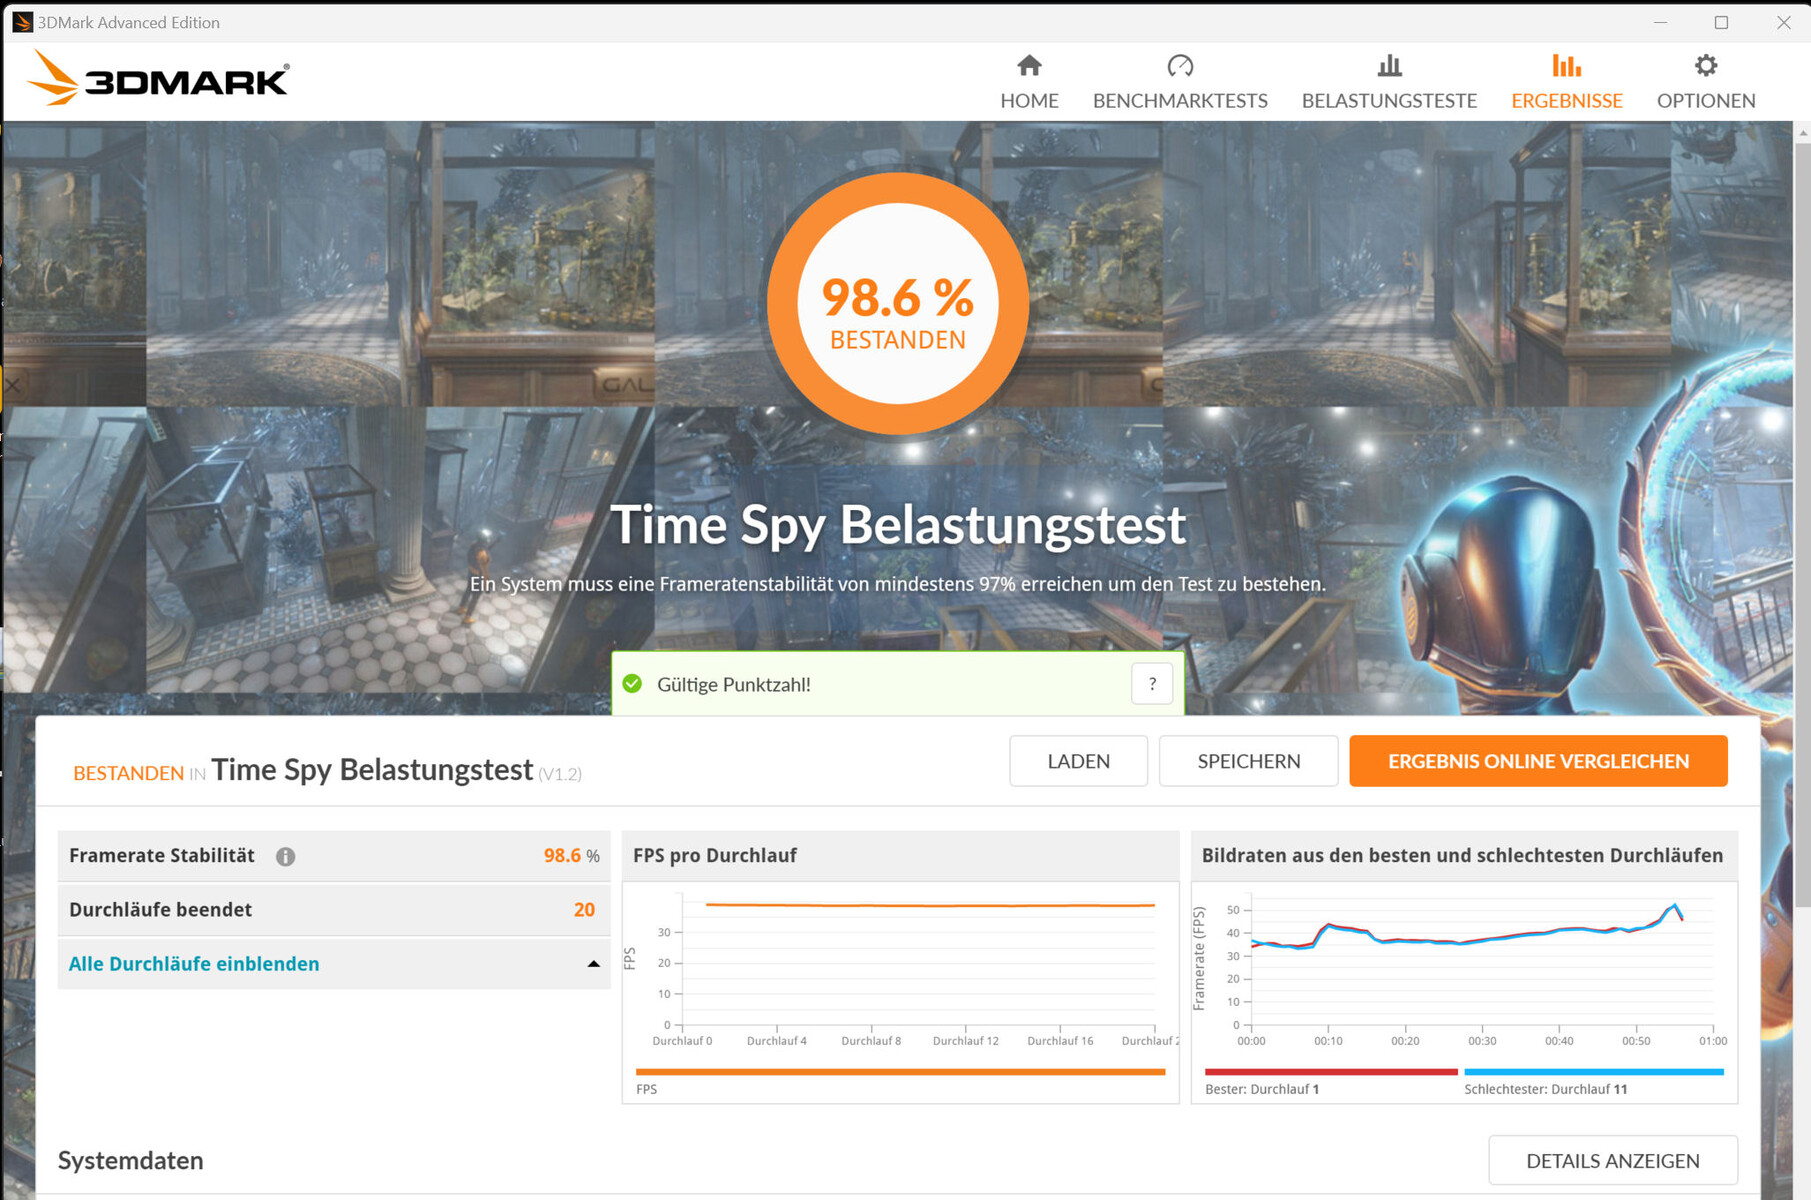
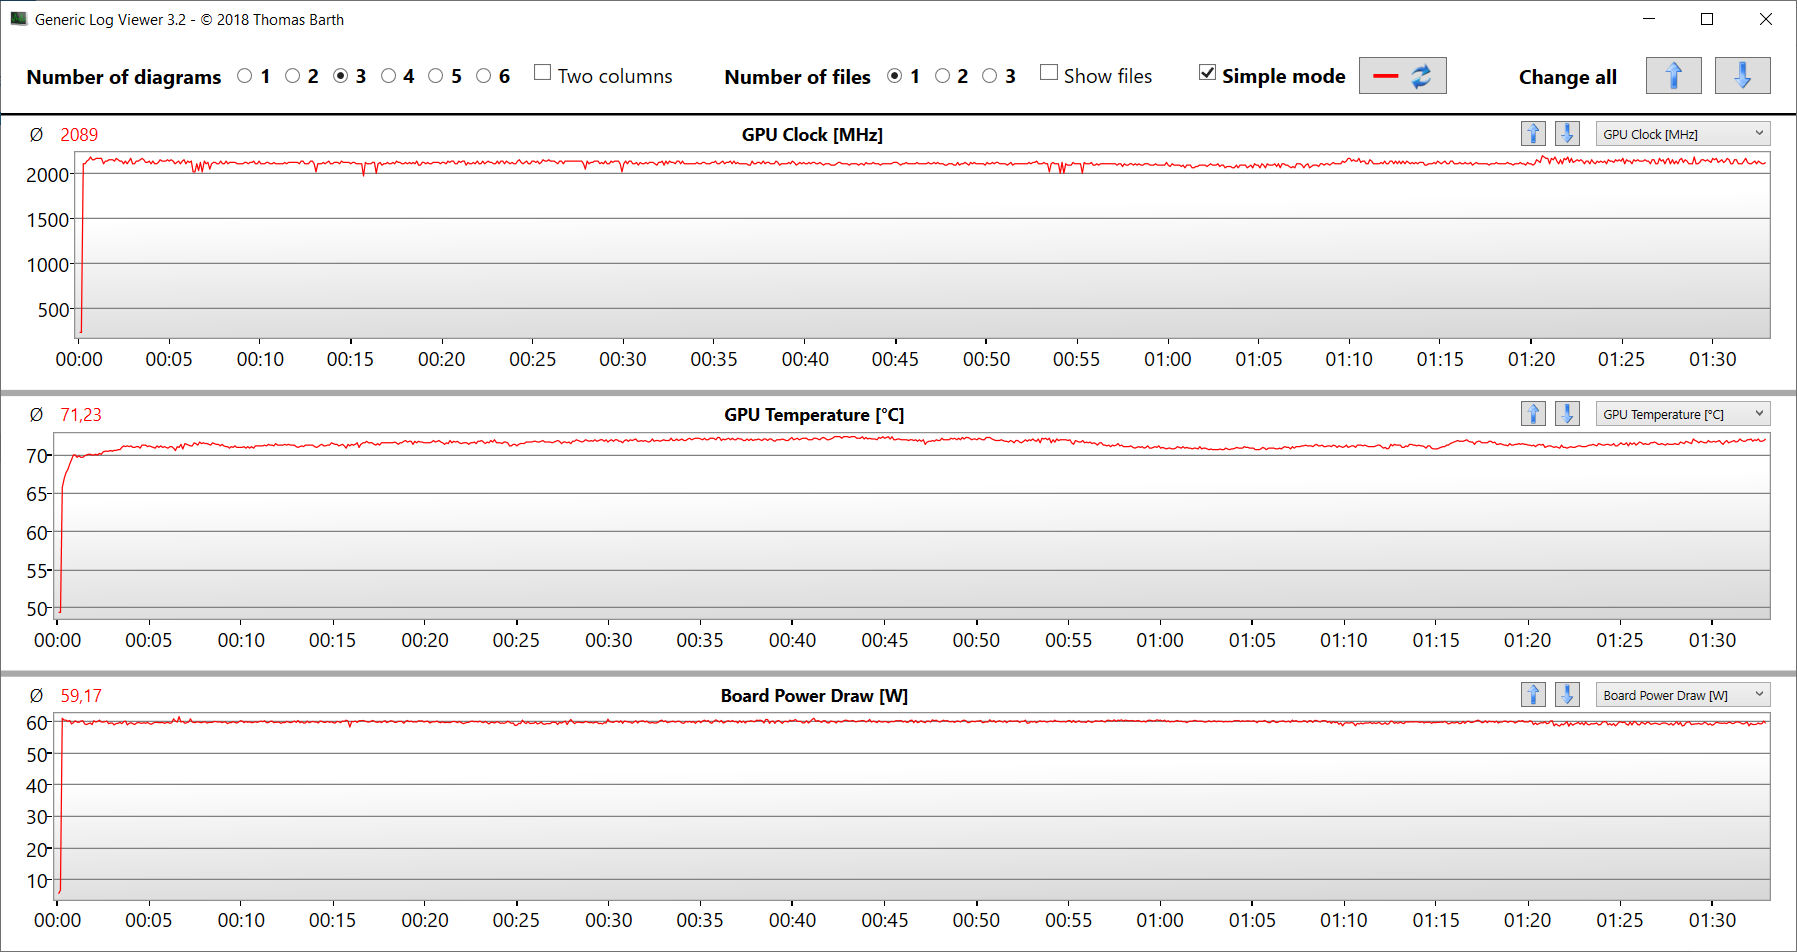
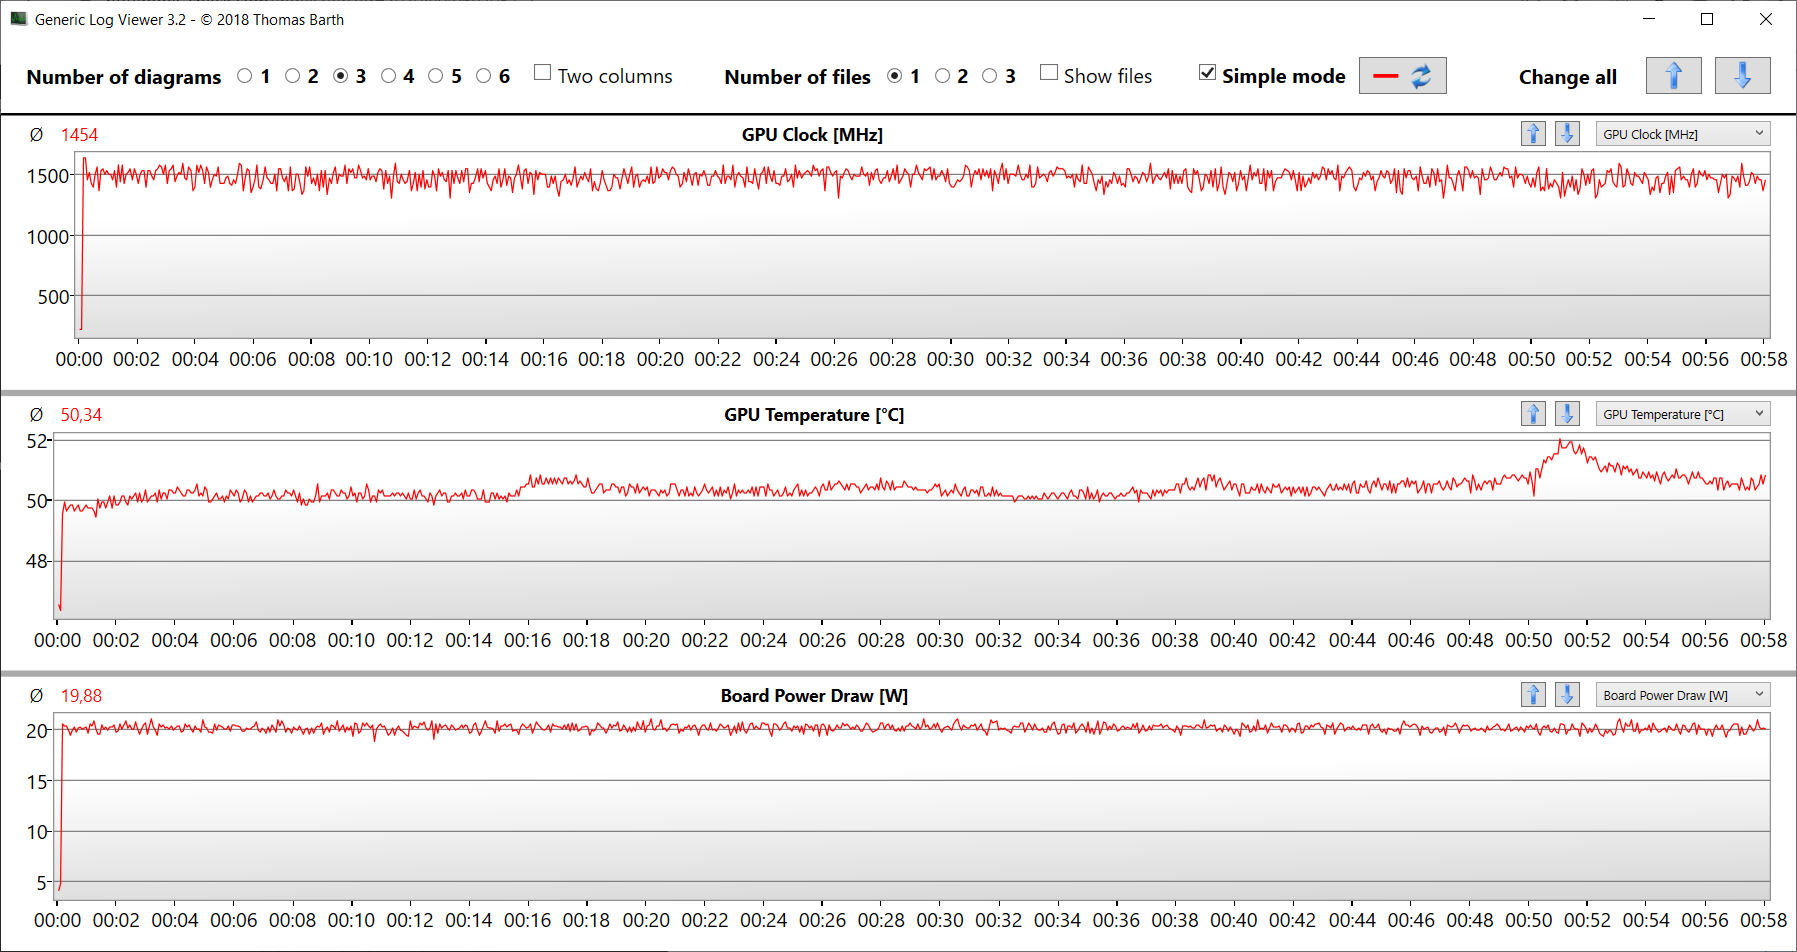
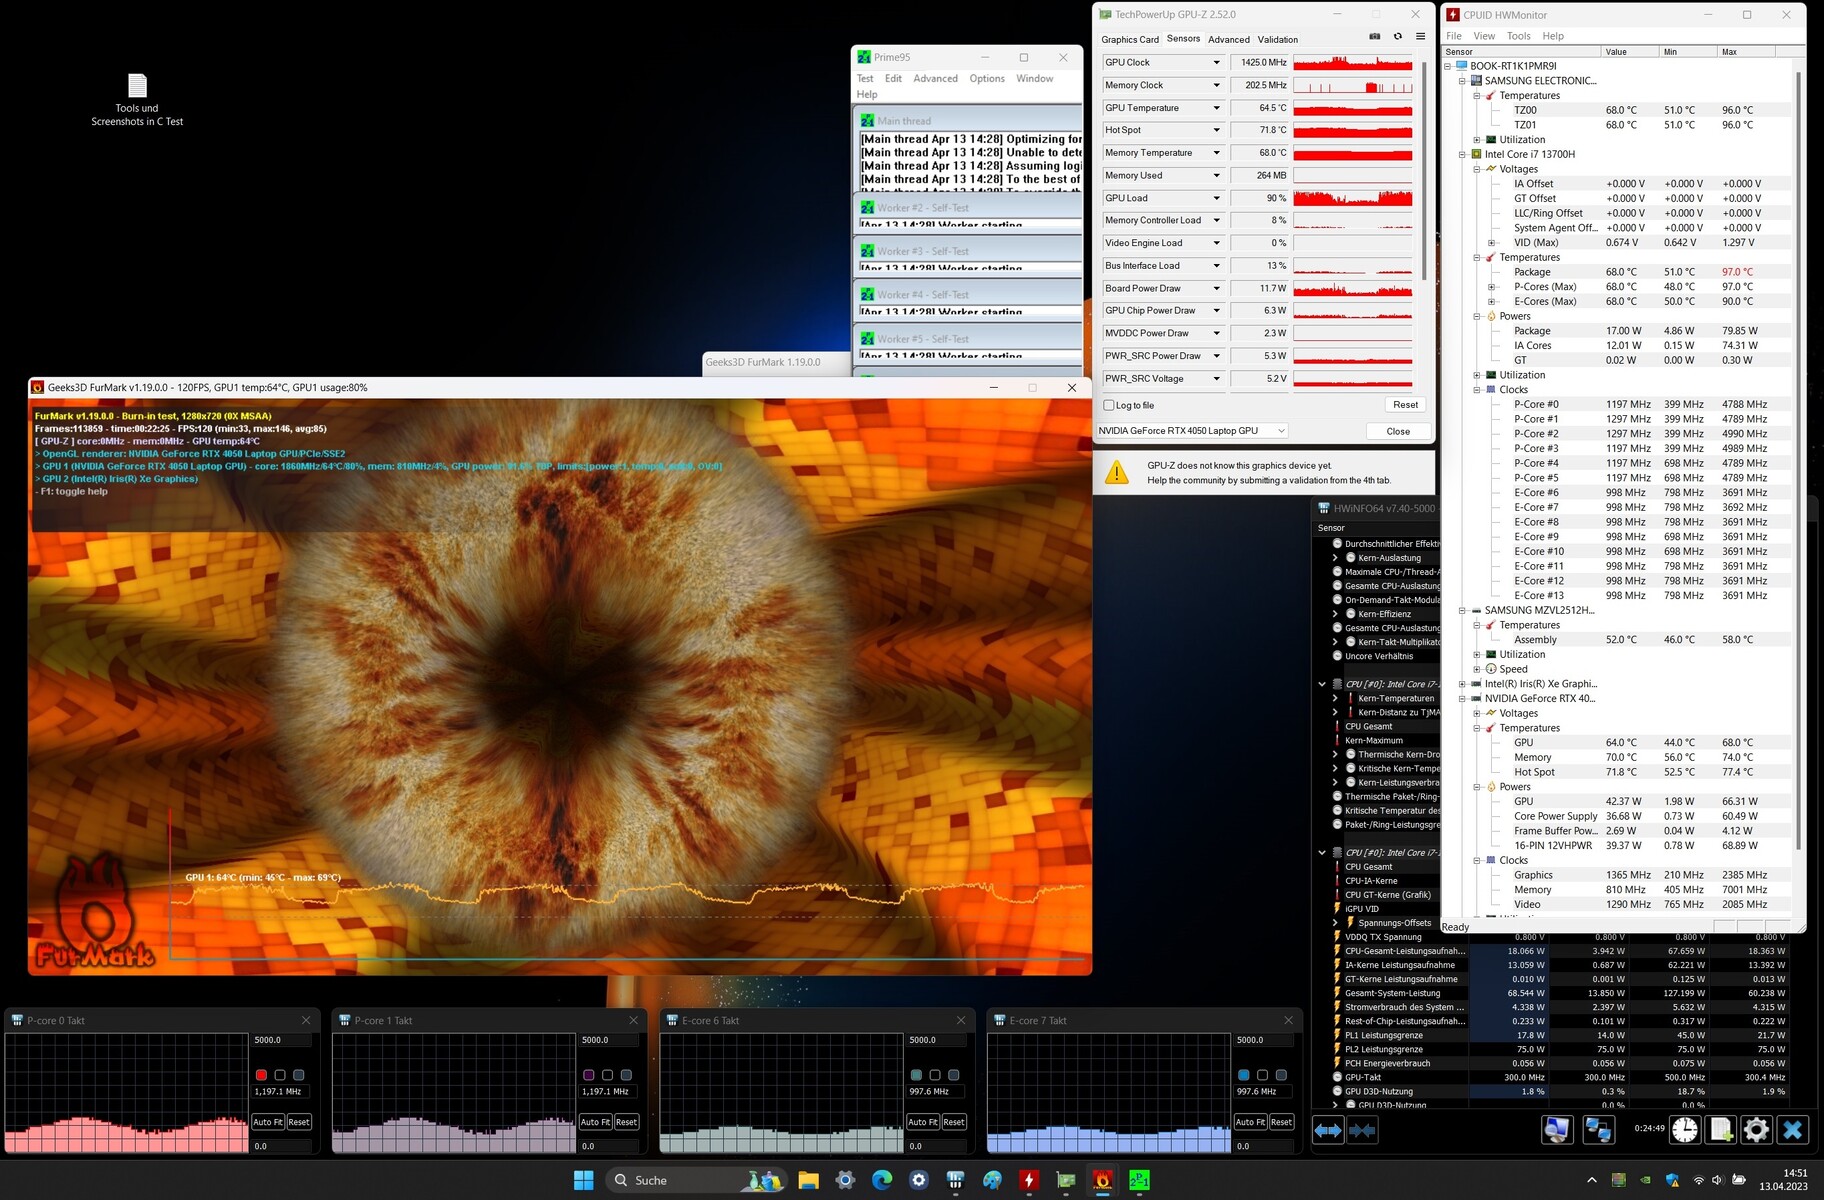
Test de stress
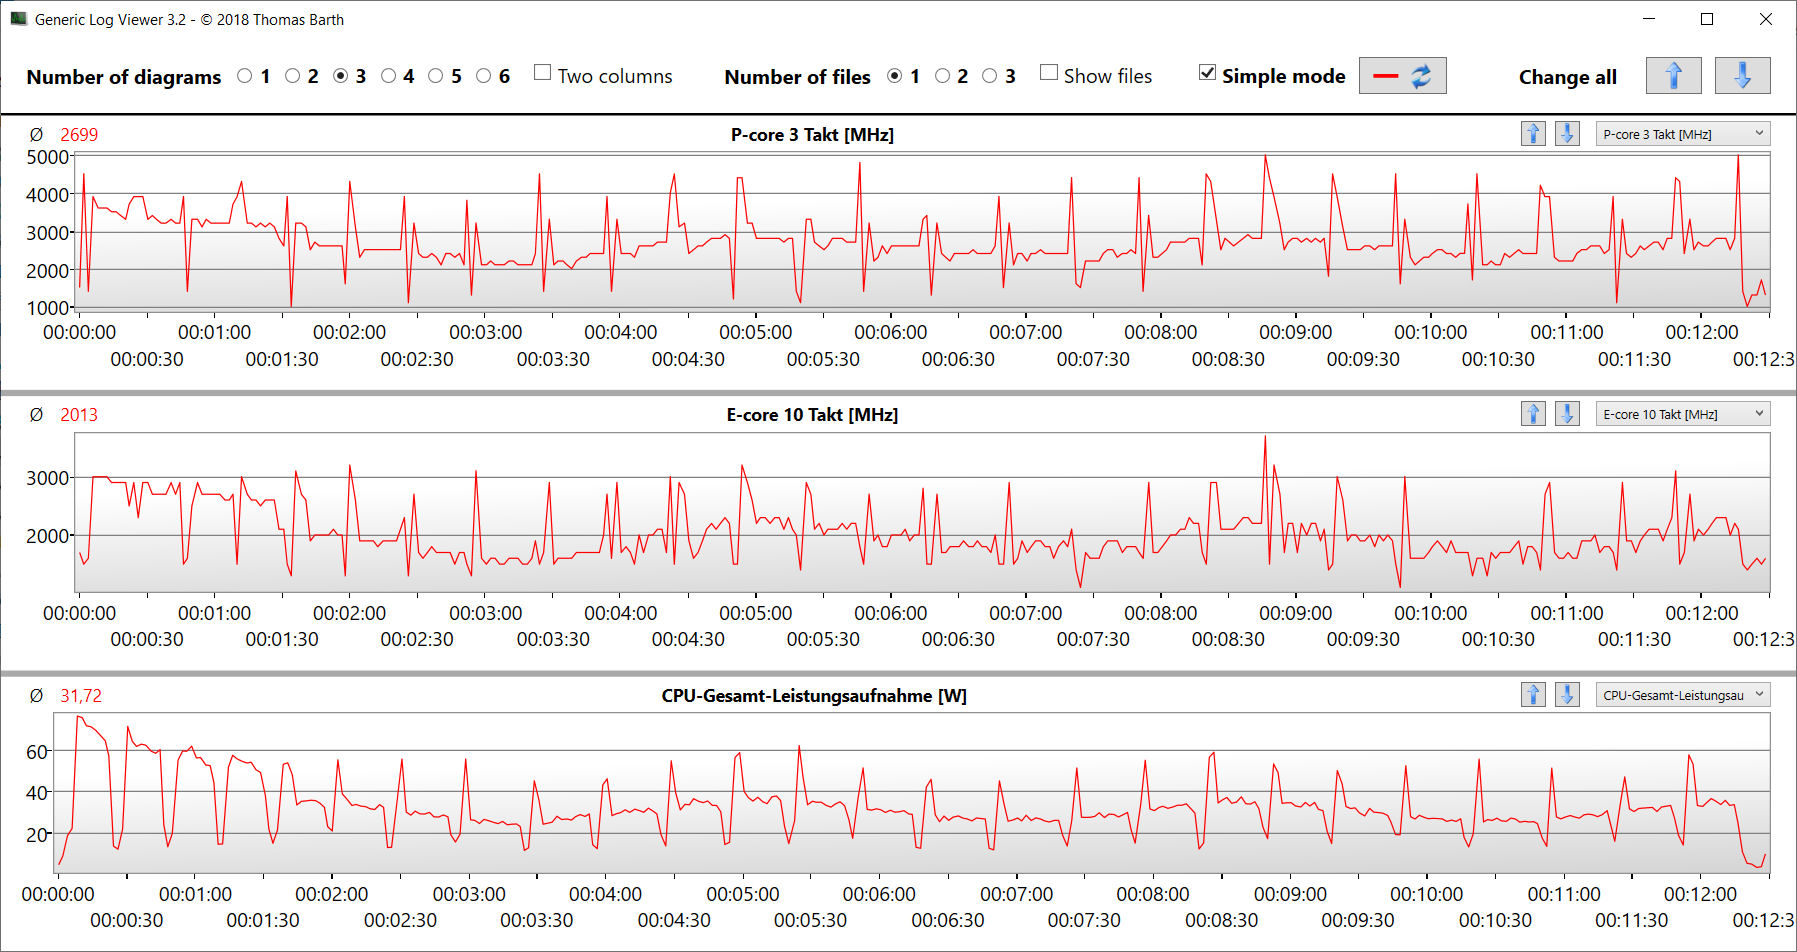
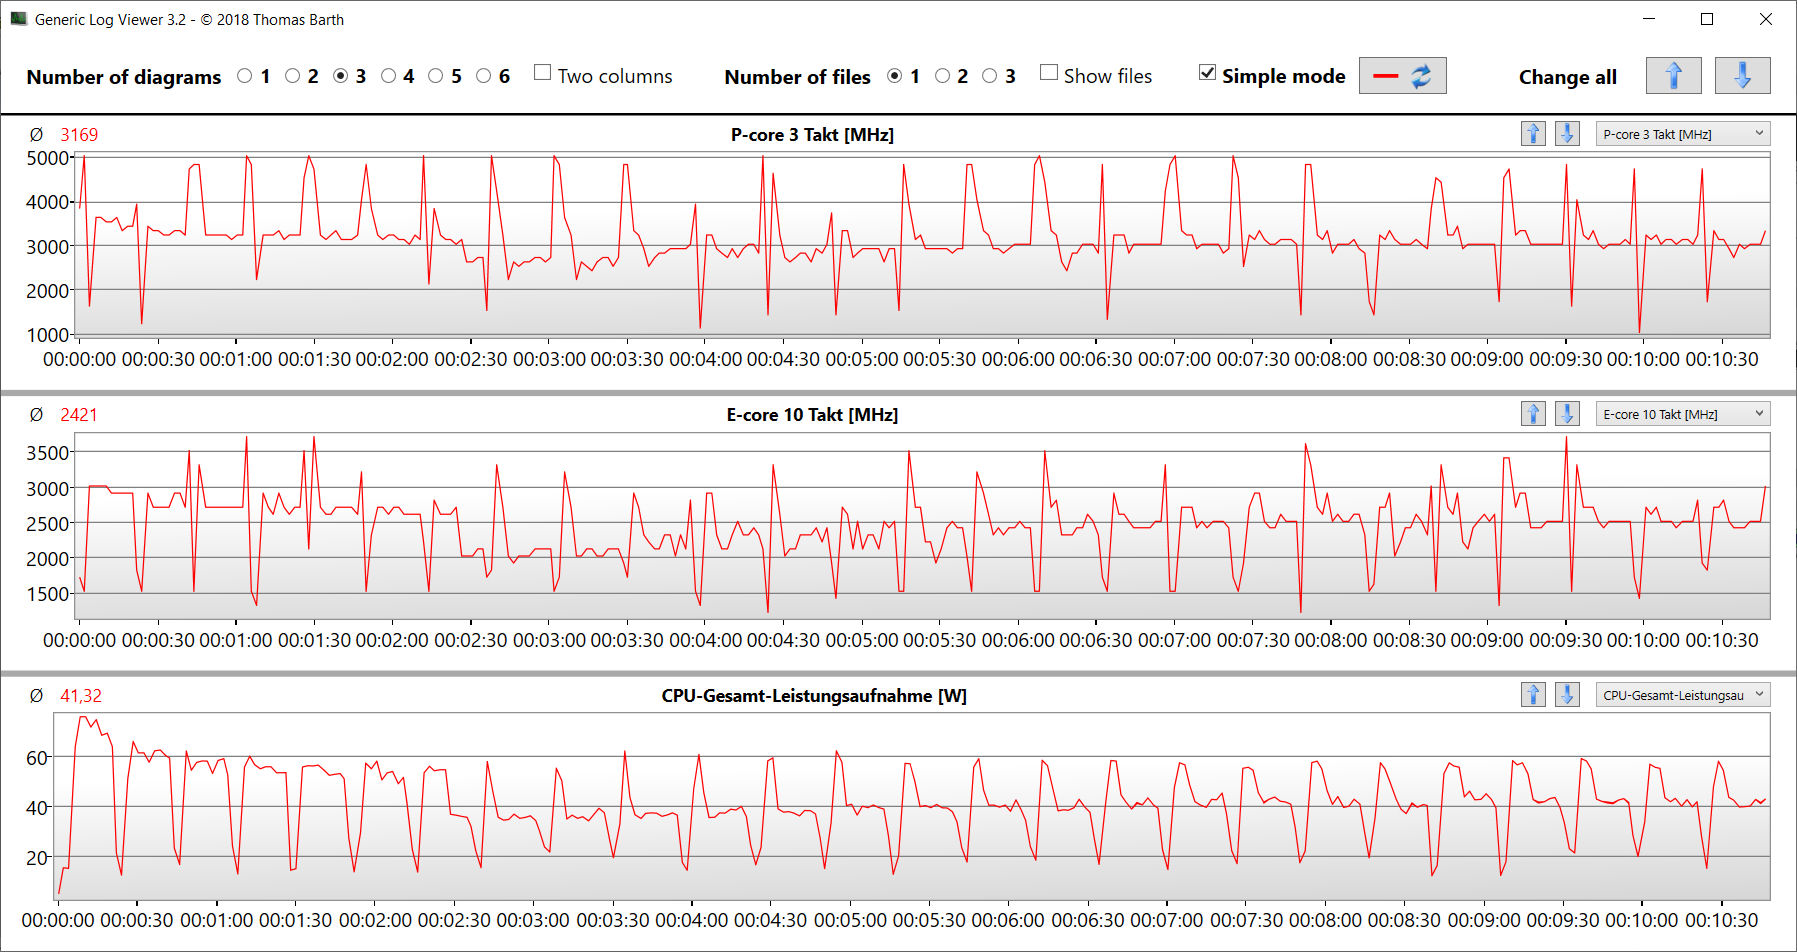
Le test de stress (Prime95 et Furmark en fonctionnement continu) représente un scénario extrême pour vérifier la stabilité du système à pleine charge. Le CPU (P : 2,8 à 2,9 GHz, E : 2,3 à 2,4 GHz) et le GPU (environ 1 100 MHz) commencent le test avec des vitesses à peu près équivalentes au niveau d'horloge de base, puis chutent de manière significative au cours du test.
Intervenants
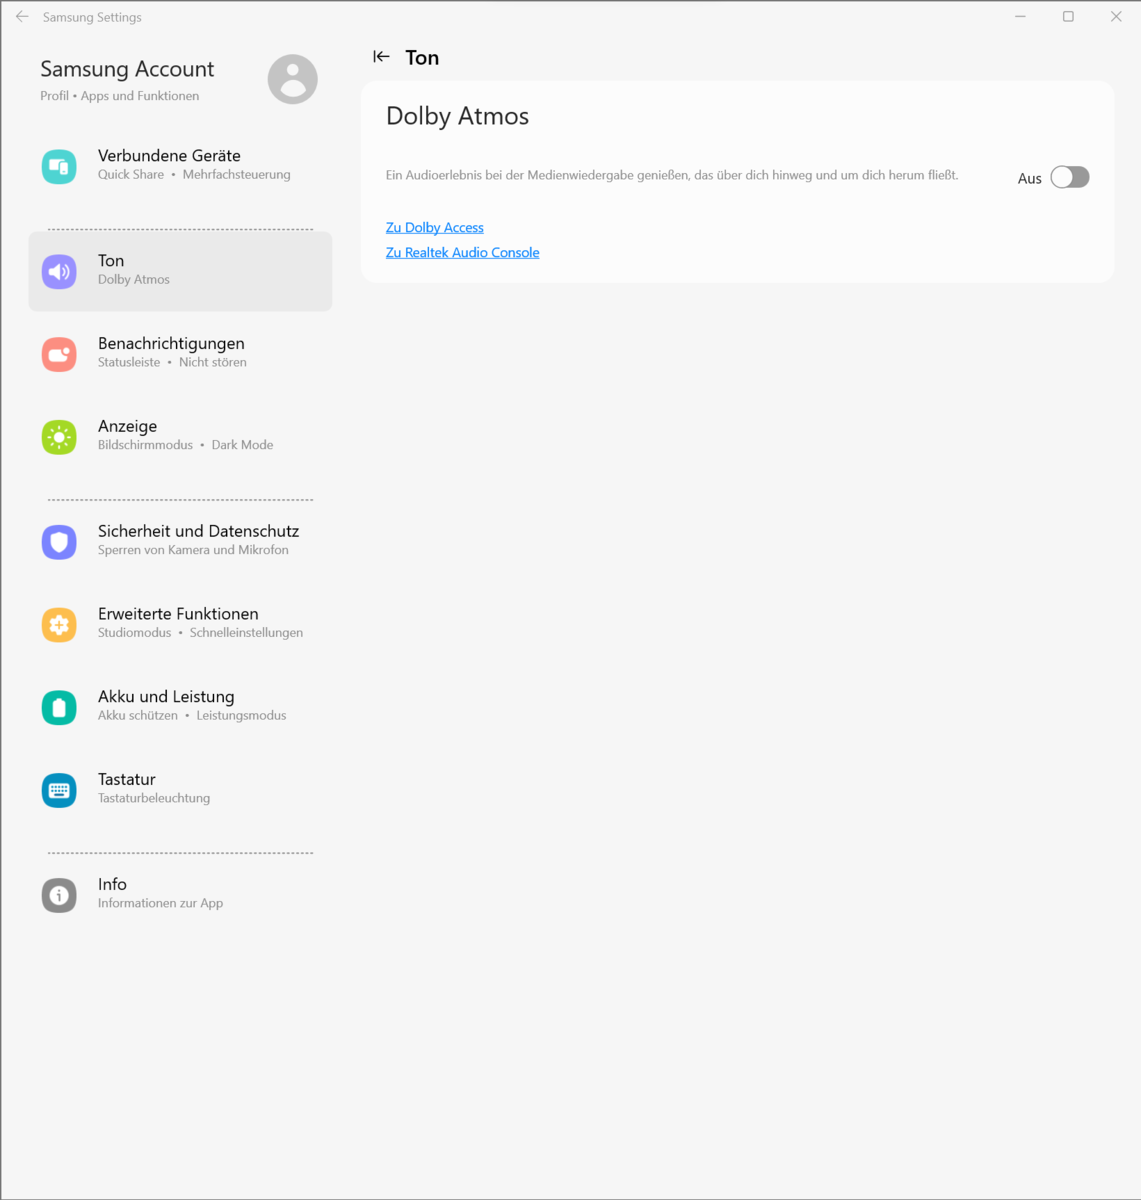
Les haut-parleurs stéréo produisent un son très correct, mais il faudrait plus de basses. Un casque ou des haut-parleurs externes sont recommandés pour une meilleure qualité sonore.
Samsung Galaxy Book3 Ultra 16 analyse audio
(+) | les haut-parleurs peuvent jouer relativement fort (83# dB)
Basses 100 - 315 Hz
(±) | basse réduite - en moyenne 11.4% inférieure à la médiane
(±) | la linéarité des basses est moyenne (10.3% delta à la fréquence précédente)
Médiums 400 - 2000 Hz
(±) | médiane supérieure - en moyenne 5.4% supérieure à la médiane
(+) | les médiums sont linéaires (3% delta à la fréquence précédente)
Aiguës 2 - 16 kHz
(+) | des sommets équilibrés - à seulement 1.6% de la médiane
(+) | les aigus sont linéaires (3.8% delta à la fréquence précédente)
Globalement 100 - 16 000 Hz
(+) | le son global est linéaire (11.8% différence à la médiane)
Par rapport à la même classe
» 19% de tous les appareils testés de cette catégorie étaient meilleurs, 4% similaires, 76% pires
» Le meilleur avait un delta de 5%, la moyenne était de 17%, le pire était de 45%.
Par rapport à tous les appareils testés
» 9% de tous les appareils testés étaient meilleurs, 3% similaires, 89% pires
» Le meilleur avait un delta de 4%, la moyenne était de 23%, le pire était de 134%.
Schenker Vision 16 Pro RTX 3070 Ti analyse audio
(±) | le niveau sonore du haut-parleur est moyen mais bon (77.6# dB)
Basses 100 - 315 Hz
(-) | presque aucune basse - en moyenne 17.9% plus bas que la médiane
(±) | la linéarité des basses est moyenne (12.2% delta à la fréquence précédente)
Médiums 400 - 2000 Hz
(+) | médiane équilibrée - seulement 3.3% de la médiane
(+) | les médiums sont linéaires (4.9% delta à la fréquence précédente)
Aiguës 2 - 16 kHz
(+) | des sommets équilibrés - à seulement 2.8% de la médiane
(+) | les aigus sont linéaires (5.1% delta à la fréquence précédente)
Globalement 100 - 16 000 Hz
(±) | la linéarité du son global est moyenne (15.1% de différence avec la médiane)
Par rapport à la même classe
» 36% de tous les appareils testés de cette catégorie étaient meilleurs, 4% similaires, 60% pires
» Le meilleur avait un delta de 5%, la moyenne était de 17%, le pire était de 45%.
Par rapport à tous les appareils testés
» 21% de tous les appareils testés étaient meilleurs, 4% similaires, 75% pires
» Le meilleur avait un delta de 4%, la moyenne était de 23%, le pire était de 134%.
Gestion de l'énergie - Le NP960XFH ne manque pas d'endurance
Consommation électrique
Dans l'ensemble, l'ordinateur portable de Samsung se contente de relativement peu d'énergie. Tant en veille qu'en charge, la demande d'énergie est inférieure à celle de la concurrence, à l'exception du LG Gram https://www.notebookcheck.net/LG-Gram-17-review-A-super-light-17-inch-laptop-with-a-modest-dGPU.698340.0.html. Le test Witcher 3 et le test de stress se déroulent avec une consommation d'énergie relativement constante. Vers la fin du test de stress, la demande diminue légèrement. L'alimentation USB-C (100 watts) est suffisamment dimensionnée.
| Éteint/en veille | |
| Au repos | |
| Fortement sollicité |
|
Légende:
min: | |
| Samsung Galaxy Book3 Ultra 16 i7-13700H, GeForce RTX 4050 Laptop GPU | Schenker Vision 16 Pro RTX 3070 Ti i7-12700H, GeForce RTX 3070 Ti Laptop GPU | LG Gram 17Z90Q-E.AD78G i7-1260P, GeForce RTX 2050 Mobile | Lenovo ThinkBook 16p G3 ARH R9 6900HX, GeForce RTX 3060 Laptop GPU | Dell XPS 15 9520 RTX 3050 Ti i7-12700H, GeForce RTX 3050 Ti Laptop GPU | Asus VivoBook Pro 16X OLED N7600PC-L2026X i7-11370H, GeForce RTX 3050 4GB Laptop GPU | Acer Swift X SFX16-52G-77RX i7-1260P, A370M | Moyenne NVIDIA GeForce RTX 4050 Laptop GPU | Moyenne de la classe Multimedia | |
|---|---|---|---|---|---|---|---|---|---|
| Power Consumption | -105% | -7% | -126% | -39% | -63% | -12% | -123% | -40% | |
| Idle Minimum * (Watt) | 3 | 9 -200% | 4.1 -37% | 10.3 -243% | 5.5 -83% | 8.9 -197% | 3.7 -23% | 9.95 ? -232% | 5.62 ? -87% |
| Idle Average * (Watt) | 5 | 13.3 -166% | 9.8 -96% | 16 -220% | 7.2 -44% | 10.2 -104% | 7.6 -52% | 15.8 ? -216% | 10.2 ? -104% |
| Idle Maximum * (Watt) | 11 | 14.3 -30% | 12 -9% | 24 -118% | 16 -45% | 12 -9% | 11.1 -1% | 20.1 ? -83% | 12.5 ? -14% |
| Load Average * (Watt) | 72 | 107 -49% | 49.3 32% | 85.4 -19% | 91.8 -27% | 94 -31% | 70 3% | 88 ? -22% | 65 ? 10% |
| Witcher 3 ultra * (Watt) | 69.7 | 155.2 -123% | 49.3 29% | 132.2 -90% | 74.6 -7% | 93.1 -34% | 68.8 1% | ||
| Load Maximum * (Watt) | 108 | 172 -59% | 66 39% | 181.9 -68% | 134.7 -25% | 112 -4% | 108 -0% | 176.3 ? -63% | 111.9 ? -4% |
* ... Moindre est la valeur, meilleures sont les performances
Power consumption Witcher 3 / Stress test
Power consumption with an external monitor
Autonomie de la batterie
L'ordinateur de 16 pouces a atteint des durées d'exécution de 9:36 h et 13:23 h dans le test WLAN (appel de sites web via un script) et le test vidéo (court métrage Big Buck Bunny, encodage H.264, FHD, en boucle), respectivement. Pendant les deux tests, les fonctions d'économie d'énergie de l'ordinateur portable ont été désactivées et la luminosité de l'écran a été réglée à environ 150 cd/m². Les modules sans fil ont également été désactivés pendant le test vidéo.
| Samsung Galaxy Book3 Ultra 16 i7-13700H, GeForce RTX 4050 Laptop GPU, 76 Wh | Schenker Vision 16 Pro RTX 3070 Ti i7-12700H, GeForce RTX 3070 Ti Laptop GPU, 80 Wh | LG Gram 17Z90Q-E.AD78G i7-1260P, GeForce RTX 2050 Mobile, 90 Wh | Lenovo ThinkBook 16p G3 ARH R9 6900HX, GeForce RTX 3060 Laptop GPU, 71 Wh | Dell XPS 15 9520 RTX 3050 Ti i7-12700H, GeForce RTX 3050 Ti Laptop GPU, 86 Wh | Asus VivoBook Pro 16X OLED N7600PC-L2026X i7-11370H, GeForce RTX 3050 4GB Laptop GPU, 96 Wh | Acer Swift X SFX16-52G-77RX i7-1260P, A370M, 56 Wh | Moyenne de la classe Multimedia | |
|---|---|---|---|---|---|---|---|---|
| Autonomie de la batterie | -40% | 37% | -32% | 17% | -3% | -22% | 20% | |
| Reader / Idle (h) | 18.2 | 14.8 -19% | 11.1 -39% | 24.9 ? 37% | ||||
| H.264 (h) | 13.4 | 6.1 -54% | 10.4 -22% | 16.8 ? 25% | ||||
| WiFi v1.3 (h) | 9.6 | 6 -37% | 14.5 51% | 6.5 -32% | 8.8 -8% | 8.7 -9% | 9.1 -5% | 12.3 ? 28% |
| Load (h) | 1.8 | 1.3 -28% | 2.2 22% | 3.2 78% | 2.5 39% | 1.1 -39% | 1.645 ? -9% |
Points positifs
Points négatifs
Conclusion - Un compromis réussi
Le Galaxy Book3 Ultra 16 est un bon compromis entre performance, mobilité et ergonomie. Le Core i7-13700H et GeForce RTX 4050 fonctionnent à des performances réduites, mais offrent suffisamment de puissance pour les jeux et le rendu en FHD.
Samsung propose un ordinateur portable pour les joueurs et les travailleurs créatifs avec le Galaxy Book3 Ultra 16. Mais le prix trop élevé jette une ombre sur le caractère autrement fort de l'ordinateur portable.
L'appareil compact ne pèse pas trop lourd (1,8 kg). En combinaison avec une autonomie pratique de 9 à 13 heures, vous avez entre les mains un appareil assez mobile. Le bruit et le dégagement de chaleur sont modérés. Deux emplacements USB-C (Thunderbolt 4) sont utilisés pour l'alimentation électrique et permettent une intégration facile dans les installations de travail existantes.
Le grand écran de 16 pouces (2 880 x 1 800, OLED) au format 16:10 convivial se distingue par une luminosité élevée, un excellent contraste, des angles de vision stables, des temps de réponse courts, une excellente reproduction des couleurs et une très bonne couverture de l'espace colorimétrique. L'inconvénient : le panneau a une surface réfléchissante, et il utilise également PWM pour tous les niveaux de luminosité - un appareil de 2399,99 $ devrait offrir plus ici.
La mémoire vive de 16 Go est également un peu juste. Un appareil de la taille du Galaxy Book devrait proposer 32 Go, d'autant plus que la mémoire (embarquée) ne peut pas être étendue. Au moins, des modèles de 32 Go plus chers sont disponibles.
Le Schenker Vision 16 Pro peut être considéré comme une alternative. Il offre de meilleures performances graphiques et une mémoire vive extensible, mais il est désavantagé en termes de durée d'exécution et d'émissions. L'Asus VivoBook Pro 16X OLED Asus VivoBook Pro 16X OLED (environ 1 400 euros) et le Acer Swift X 16 (environ 1 100 euros) sont des alternatives moins chères et moins performantes que l'ordinateur de Samsung. Ils offrent des performances moindres, des durées d'exécution parfois plus courtes et une mémoire de travail soudée en permanence.
Prix et disponibilité
La configuration de notre appareil de test est disponible via Amazon UK et Amazon Canada pour £2,449.00 et CAD$2,799.99, respectivement. Aux États-Unis, 1 To semble être la configuration minimale sur le site de Samsung, à partir de 2399,99 $à partir de 2399,99 $.
Samsung Galaxy Book3 Ultra 16
- 04/26/2023 v7 (old)
Sascha Mölck
Transparency
La sélection des appareils à examiner est effectuée par notre équipe éditoriale. L'échantillon de test a été prêté à l'auteur par le fabricant ou le détaillant pour les besoins de cet examen. Le prêteur n'a pas eu d'influence sur cette évaluation et le fabricant n'a pas reçu de copie de cette évaluation avant sa publication. Il n'y avait aucune obligation de publier cet article. En tant que média indépendant, Notebookcheck n'est pas soumis à l'autorité des fabricants, des détaillants ou des éditeurs.
Voici comment Notebookcheck teste
Chaque année, Notebookcheck examine de manière indépendante des centaines d'ordinateurs portables et de smartphones en utilisant des procédures standardisées afin de garantir que tous les résultats sont comparables. Nous avons continuellement développé nos méthodes de test depuis environ 20 ans et avons établi des normes industrielles dans le processus. Dans nos laboratoires de test, des équipements de mesure de haute qualité sont utilisés par des techniciens et des rédacteurs expérimentés. Ces tests impliquent un processus de validation en plusieurs étapes. Notre système d'évaluation complexe repose sur des centaines de mesures et de points de référence bien fondés, ce qui garantit l'objectivité.Price comparison

