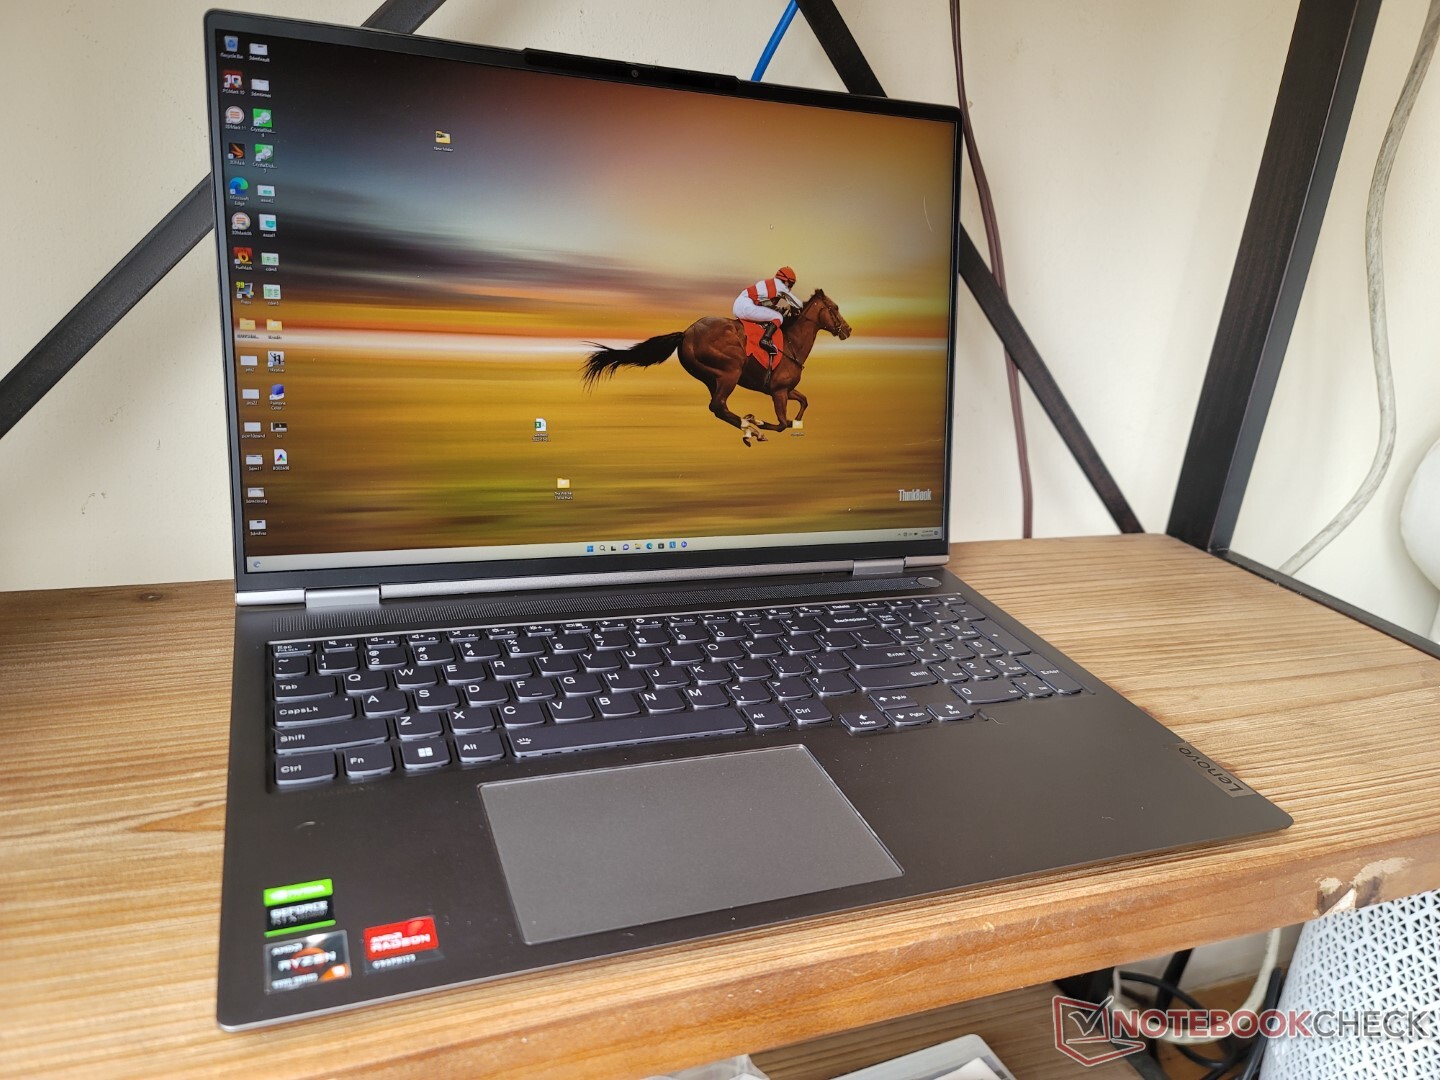
Test du Lenovo ThinkBook 16p Gen 3 ARH : le challenger du Dell XPS 15

Le ThinkBook 16p Gen 3 de 16 pouces est le successeur du ThinkBook 16p Gen 2 de l'année dernière. Il est livré avec des options de CPU AMD Zen 3+ améliorées pour remplacer la série Zen 3 du modèle 2021. Il existe d'autres différences mineures, expliquées dans cet article, mais le modèle 2022 est visuellement identique au modèle 2021. Nous vous recommandons donc de consulter notre article sur le ThinkBook 16p Gen 2 pour en savoir plus sur les caractéristiques physiques de la Gen 3
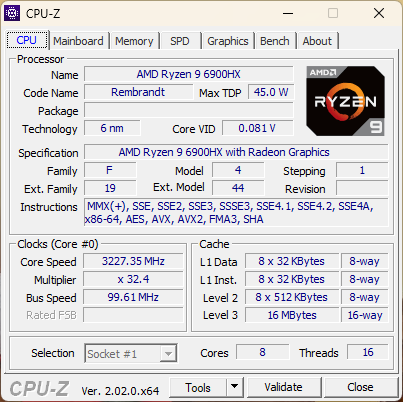
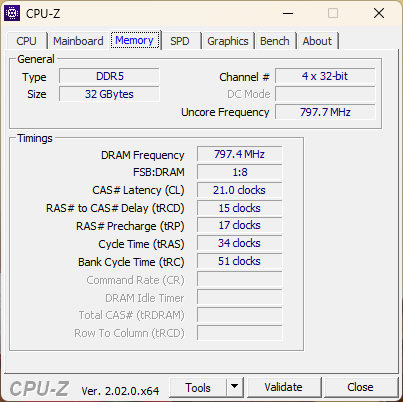
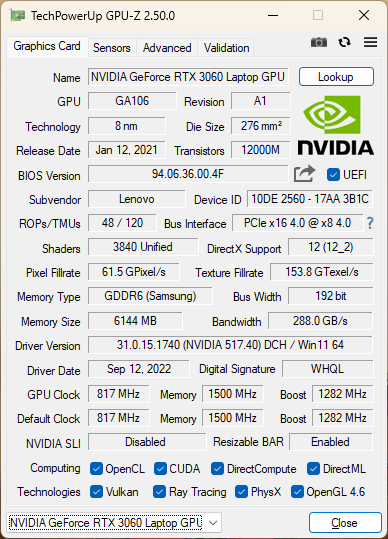
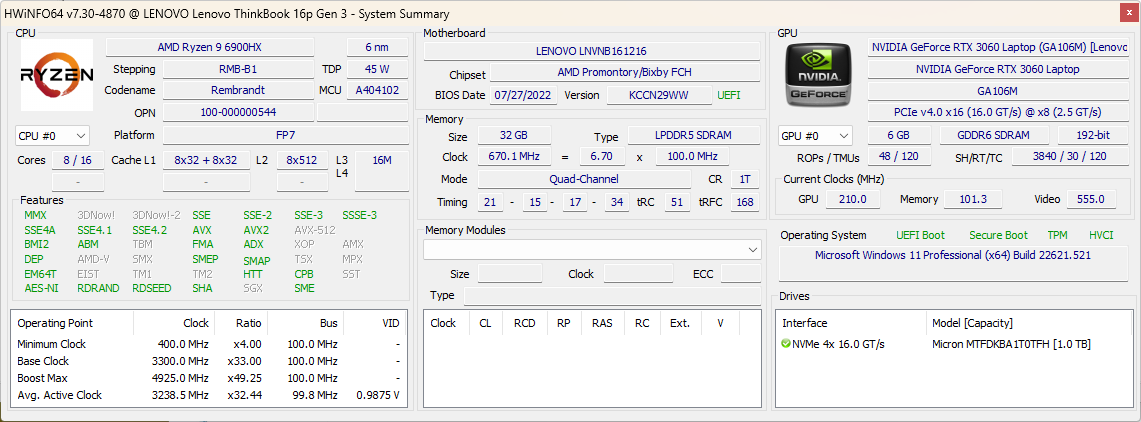
Notre unité de test spécifique est équipée d'un processeur Ryzen 9 6900HX, d'un GPU RTX 3060 de 90 W GeForce, de 32 Go de RAM LPDDR5 et d'un écran IPS d'une résolution de 2560 x 1600 à 165 Hz pour un prix de détail d'environ 2600 USD. Des SKU plus petits avec un écran 60 Hz et un CPU Ryzen 5 6600H ou Ryzen 7 6800H sont également disponibles.
Parmi les concurrents directs, on trouve d'autres ordinateurs portables haut de gamme de 16 pouces, multimédias ou Nvidia Studio, comme le HP Envy 16, Dell Inspiron 16 Plus 7620, Acer Swift X 16ou le MSI Creator Z16.
Plus de commentaires sur Lenovo :
Comparaison avec les concurrents potentiels
Note | Date | Modèle | Poids | Épaisseur | Taille | Résolution | Prix |
|---|---|---|---|---|---|---|---|
| 87.9 % v7 (old) | 10/22 | Lenovo ThinkBook 16p G3 ARH R9 6900HX, GeForce RTX 3060 Laptop GPU | 2.1 kg | 19.5 mm | 16.00" | 2560x1600 | |
| 86.9 % v7 (old) | 09/22 | HP Envy 16 h0112nr i7-12700H, GeForce RTX 3060 Laptop GPU | 2.3 kg | 19.8 mm | 16.00" | 3840x2400 | |
| 87 % v7 (old) | 09/21 | Lenovo ThinkBook 16p G2 ACH R9 5900HX, GeForce RTX 3060 Laptop GPU | 2 kg | 19.5 mm | 16.00" | 2560x1600 | |
| 85.7 % v7 (old) | 09/22 | Lenovo IdeaPad 5 Pro 16ARH7 R5 6600HS, Radeon 660M | 1.9 kg | 18.4 mm | 16.00" | 2560x1600 | |
| 86.2 % v7 (old) | 07/22 | Acer Swift X SFX16-51G-5388 i5-11320H, GeForce RTX 3050 4GB Laptop GPU | 1.8 kg | 18.9 mm | 16.10" | 1920x1080 | |
| 86.6 % v7 (old) | 07/22 | Lenovo Legion 5 Pro 16IAH7H i7-12700H, GeForce RTX 3060 Laptop GPU | 2.6 kg | 27 mm | 16.00" | 2560x1600 |
Cas
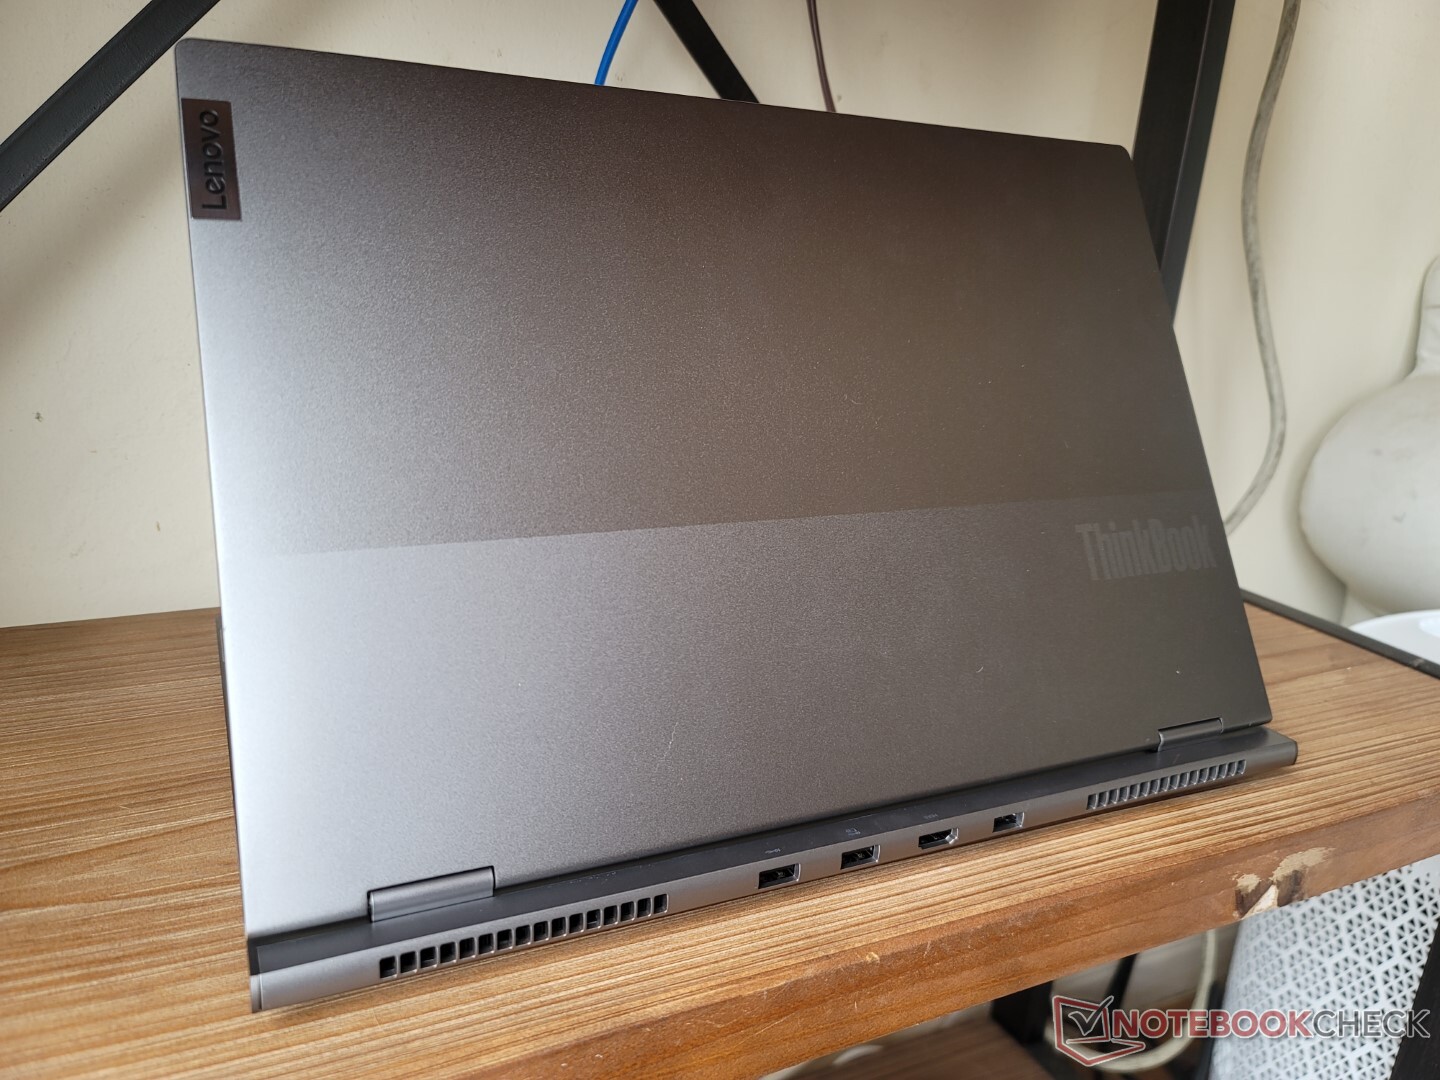
Bien que le châssis soit visuellement identique au modèle Gen 2 de l'année dernière, il existe un moyen facile de distinguer le modèle Gen 3 du Gen 2 : la présence d'un port HDMI à l'arrière. Le modèle Gen 2 ne comporte aucun port HDMI en comparaison.
Lecteur de carte SD
| SD Card Reader | |
| average JPG Copy Test (av. of 3 runs) | |
| Lenovo IdeaPad 5 Pro 16ARH7 (AV PRO microSD 128 GB V60) | |
| Lenovo ThinkBook 16p G2 ACH | |
| Lenovo ThinkBook 16p G3 ARH (AV PRO microSD 128 GB V60) | |
| HP Envy 16 h0112nr (AV Pro SD microSD 128 GB V60) | |
| maximum AS SSD Seq Read Test (1GB) | |
| Lenovo ThinkBook 16p G2 ACH | |
| Lenovo ThinkBook 16p G3 ARH (AV PRO microSD 128 GB V60) | |
| HP Envy 16 h0112nr (AV Pro SD microSD 128 GB V60) | |
Communication
| Networking | |
| iperf3 transmit AX12 | |
| Acer Swift X SFX16-51G-5388 | |
| Lenovo ThinkBook 16p G2 ACH | |
| iperf3 receive AX12 | |
| Acer Swift X SFX16-51G-5388 | |
| Lenovo ThinkBook 16p G2 ACH | |
| iperf3 receive AXE11000 6GHz | |
| Lenovo Legion 5 Pro 16IAH7H | |
| HP Envy 16 h0112nr | |
| iperf3 receive AXE11000 | |
| Lenovo ThinkBook 16p G3 ARH | |
| Lenovo IdeaPad 5 Pro 16ARH7 | |
| iperf3 transmit AXE11000 6GHz | |
| Lenovo Legion 5 Pro 16IAH7H | |
| HP Envy 16 h0112nr | |
| iperf3 transmit AXE11000 | |
| Lenovo ThinkBook 16p G3 ARH | |
| Lenovo IdeaPad 5 Pro 16ARH7 | |
Webcam


Maintenance
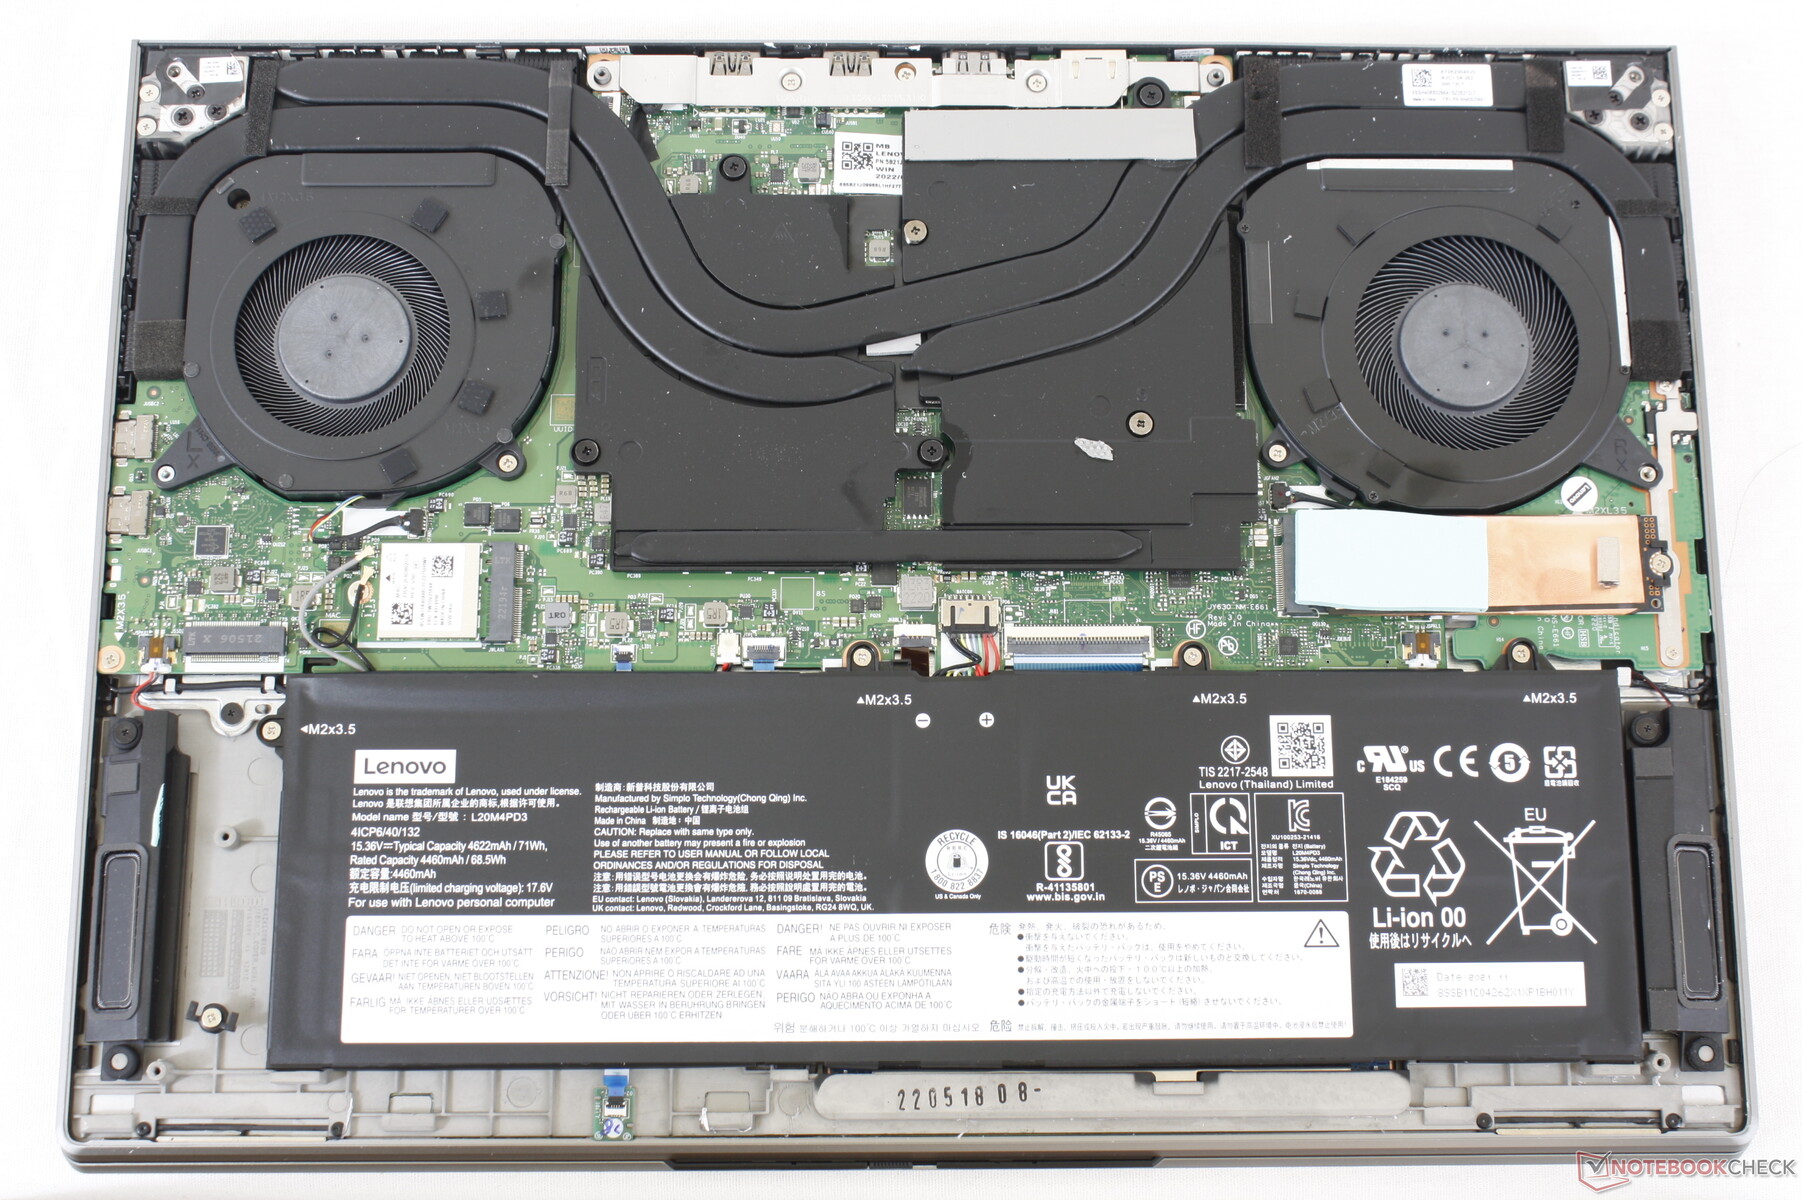
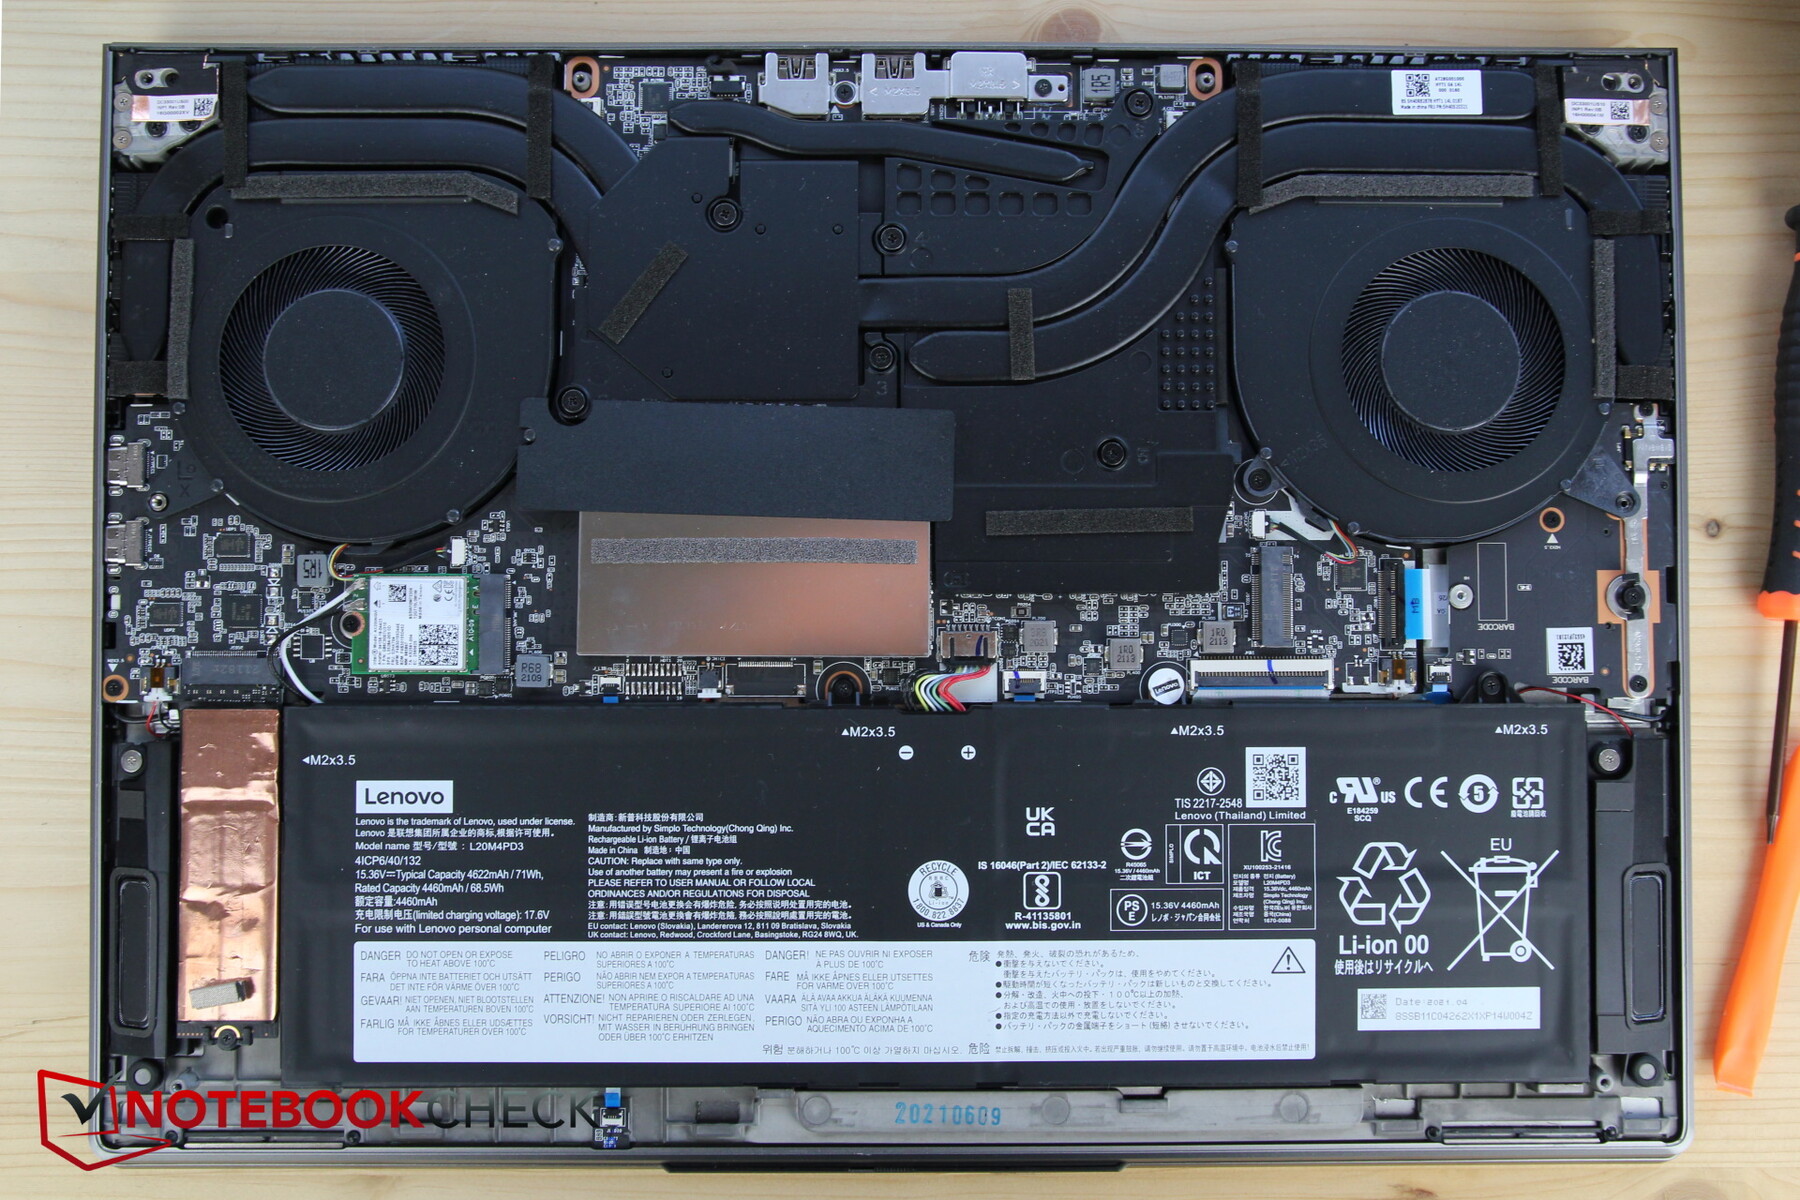
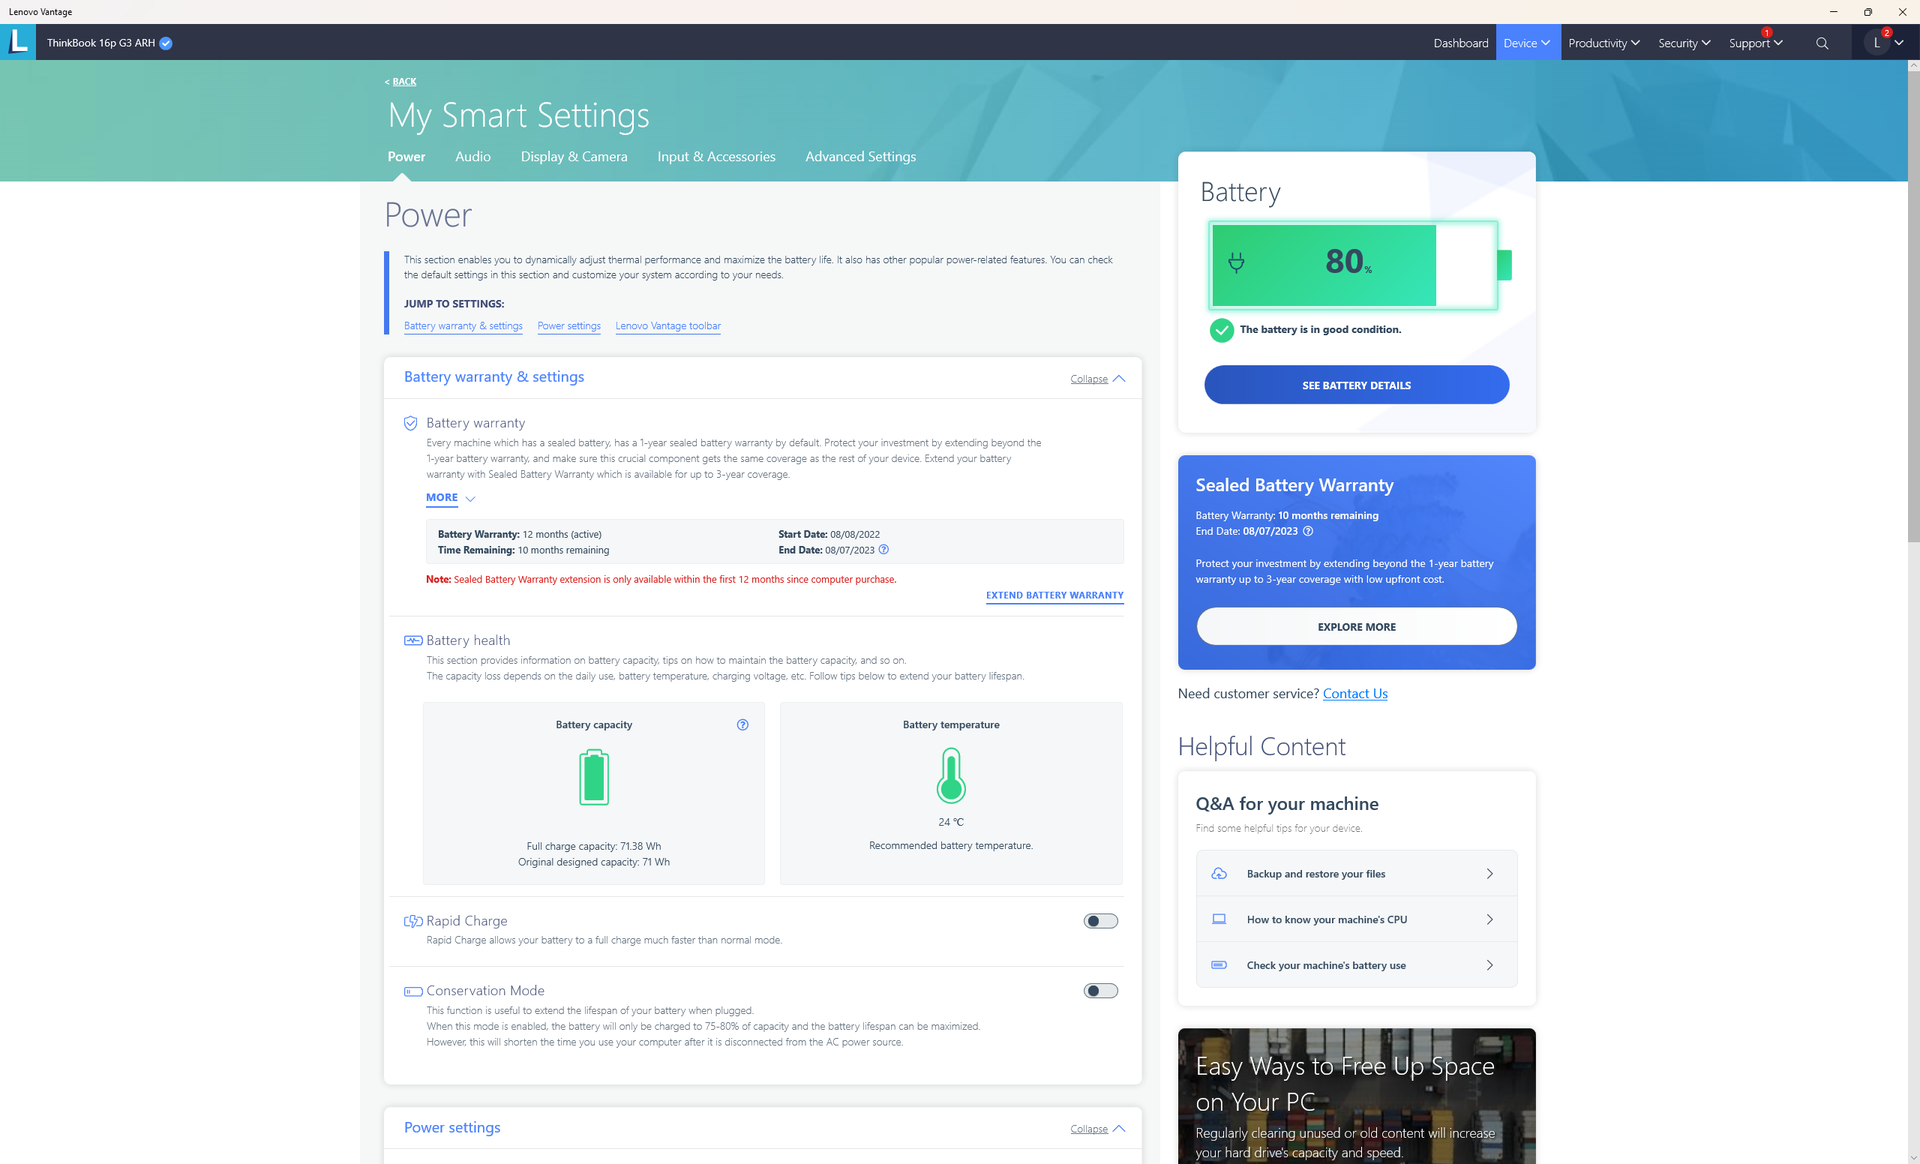
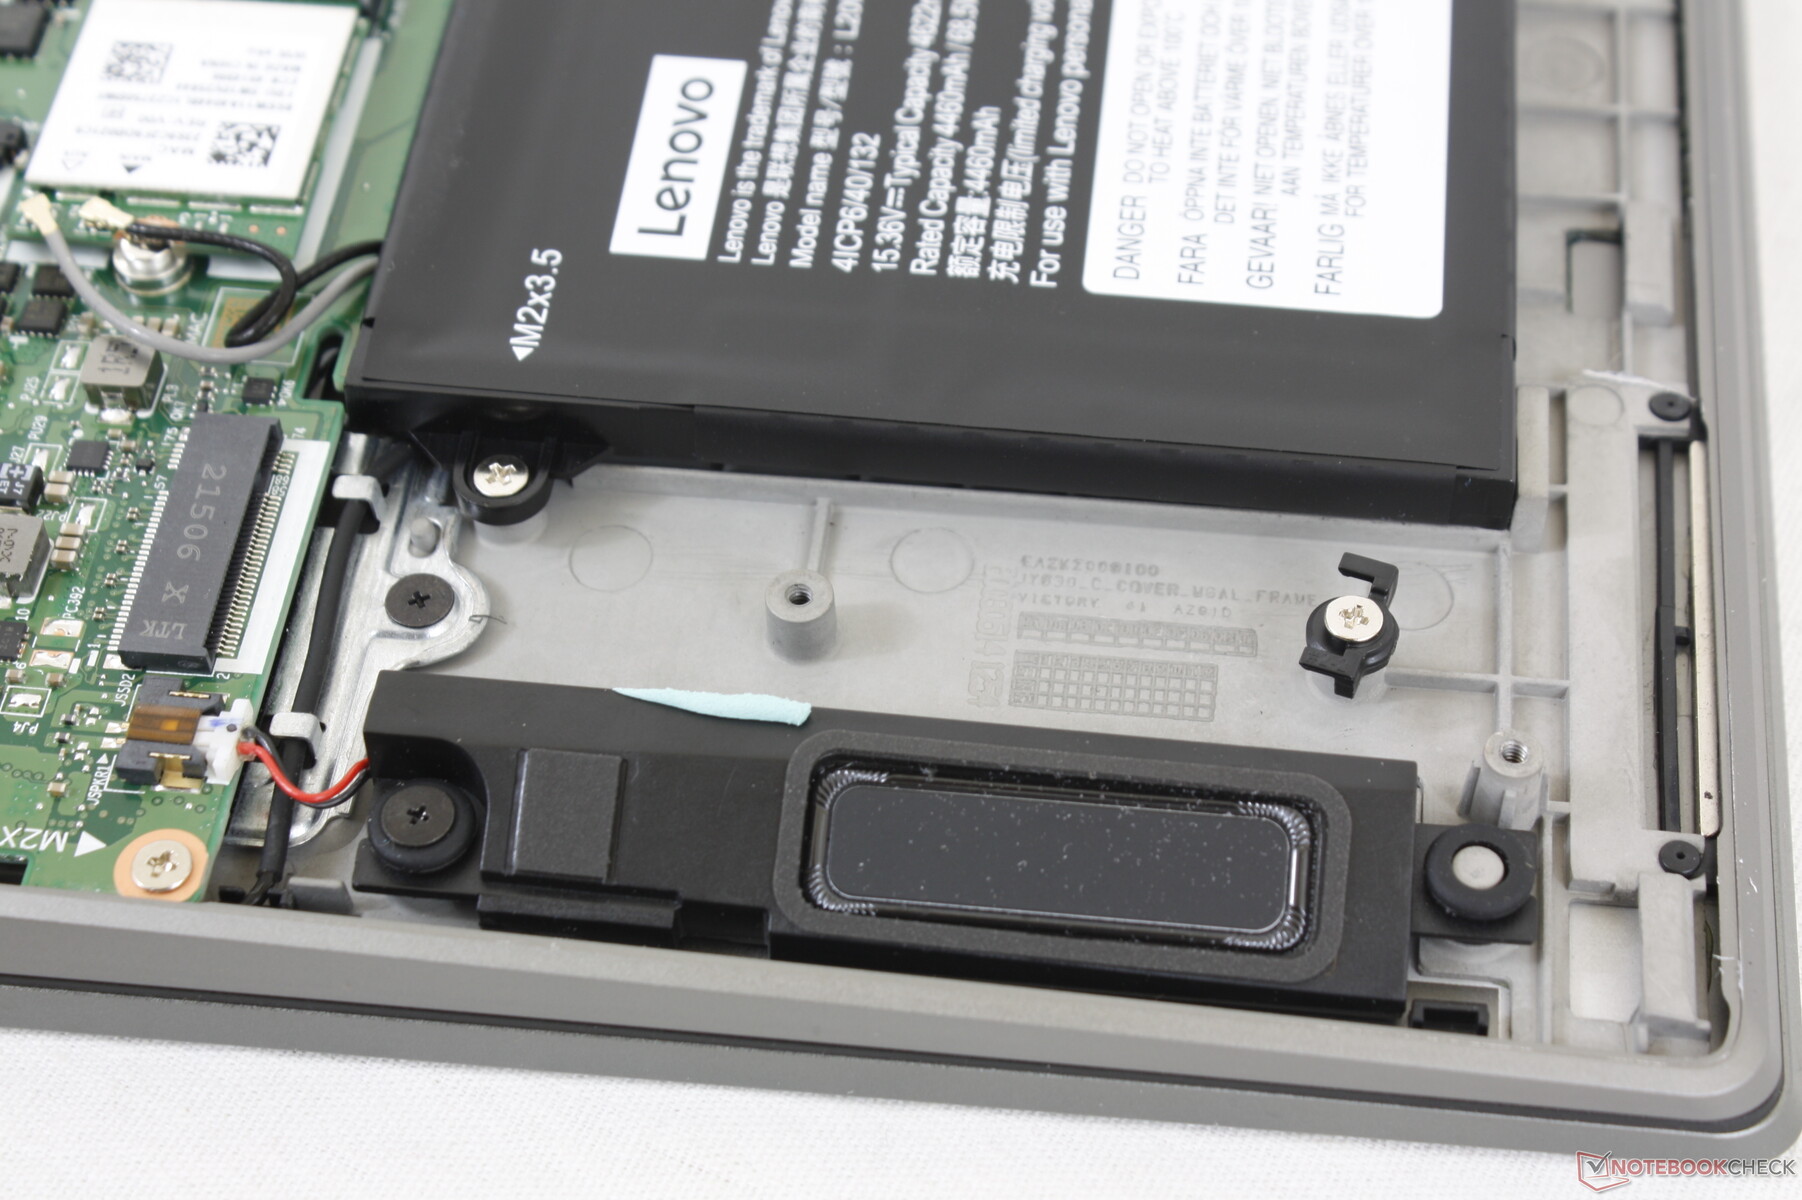
Le modèle Gen 3 utilise de la RAM soudée alors que le modèle Gen 2 possède un emplacement SODIMM amovible.
Afficher
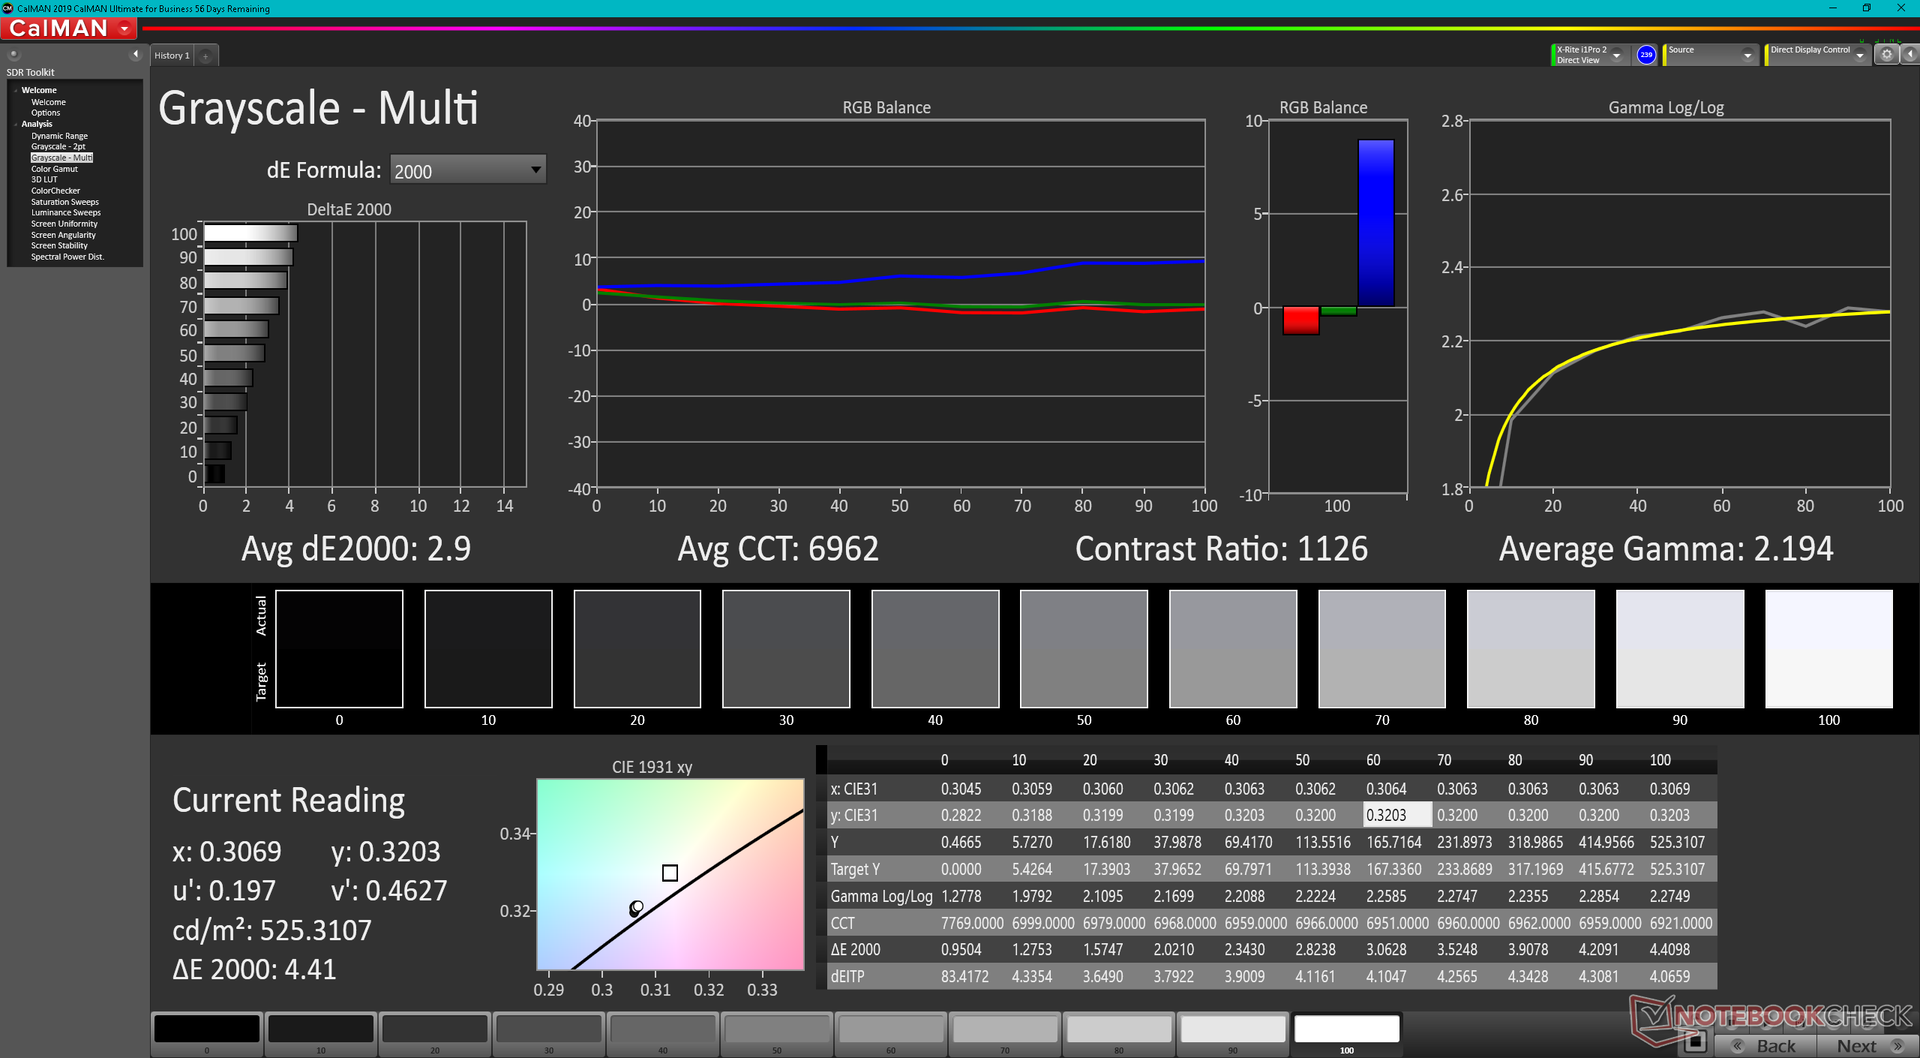
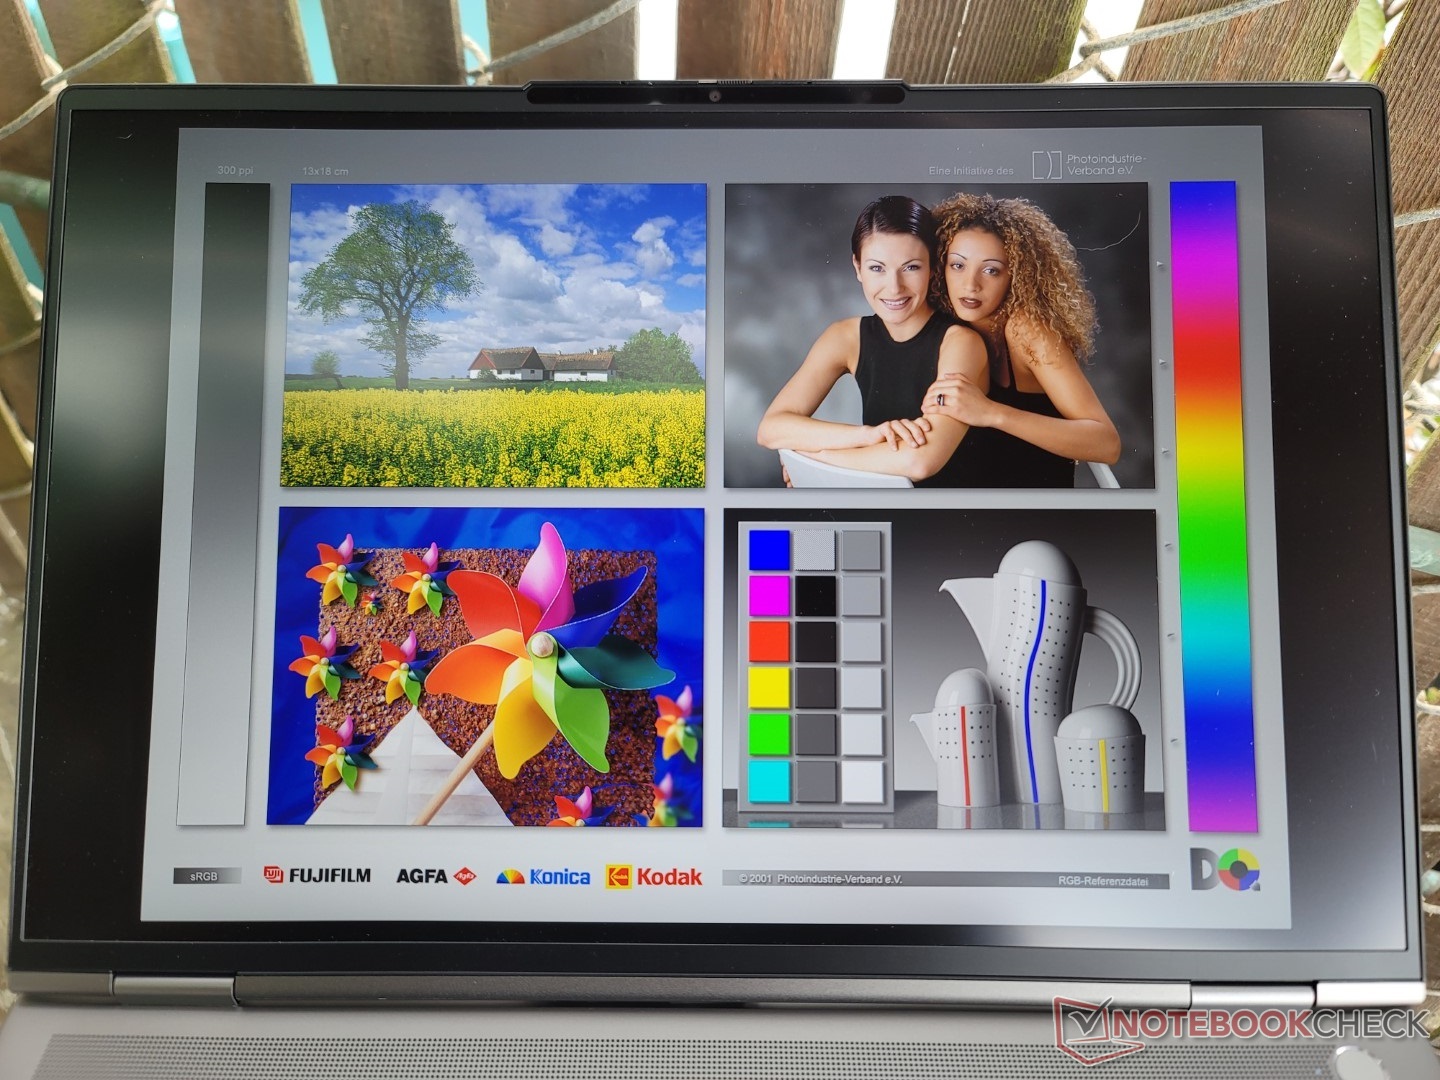
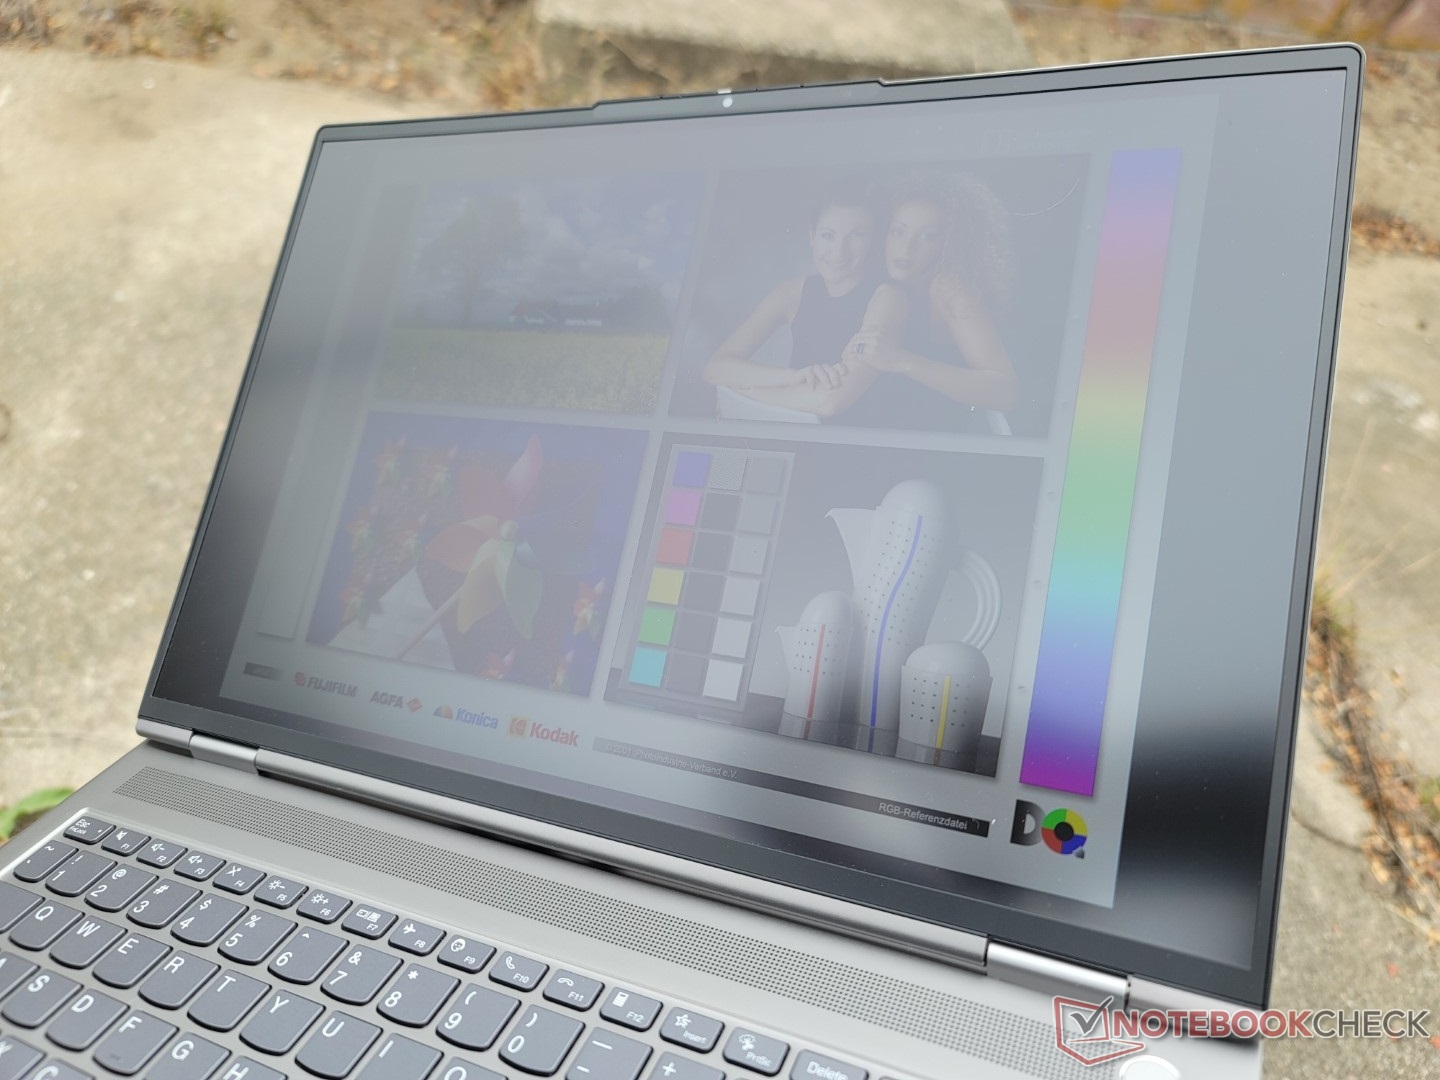
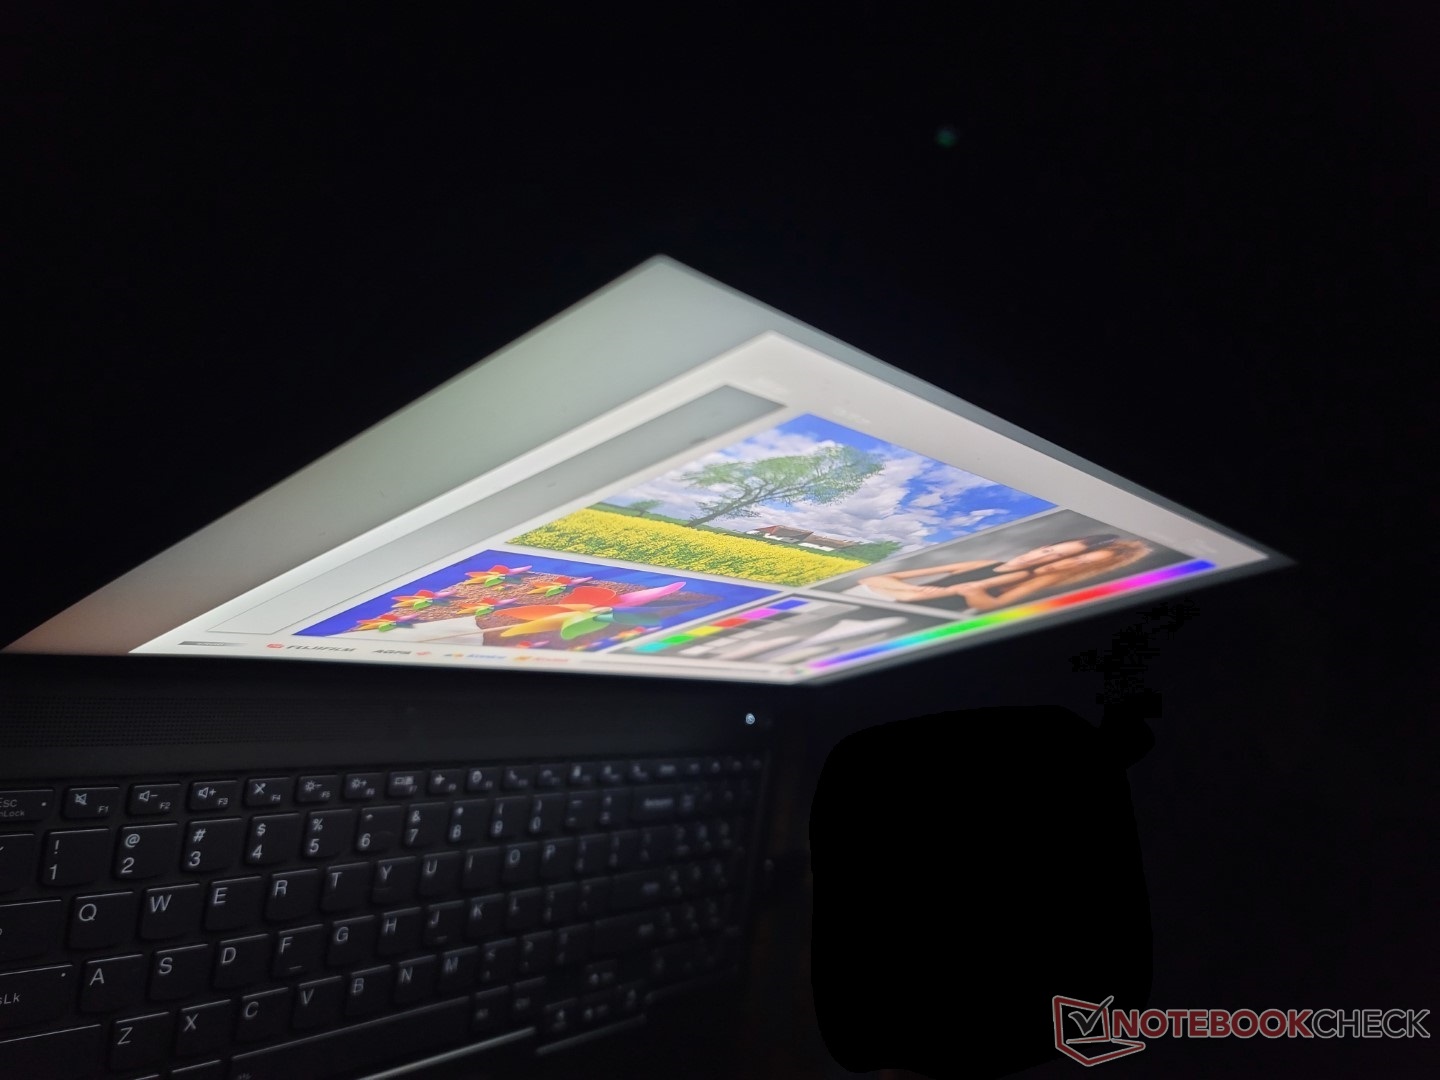
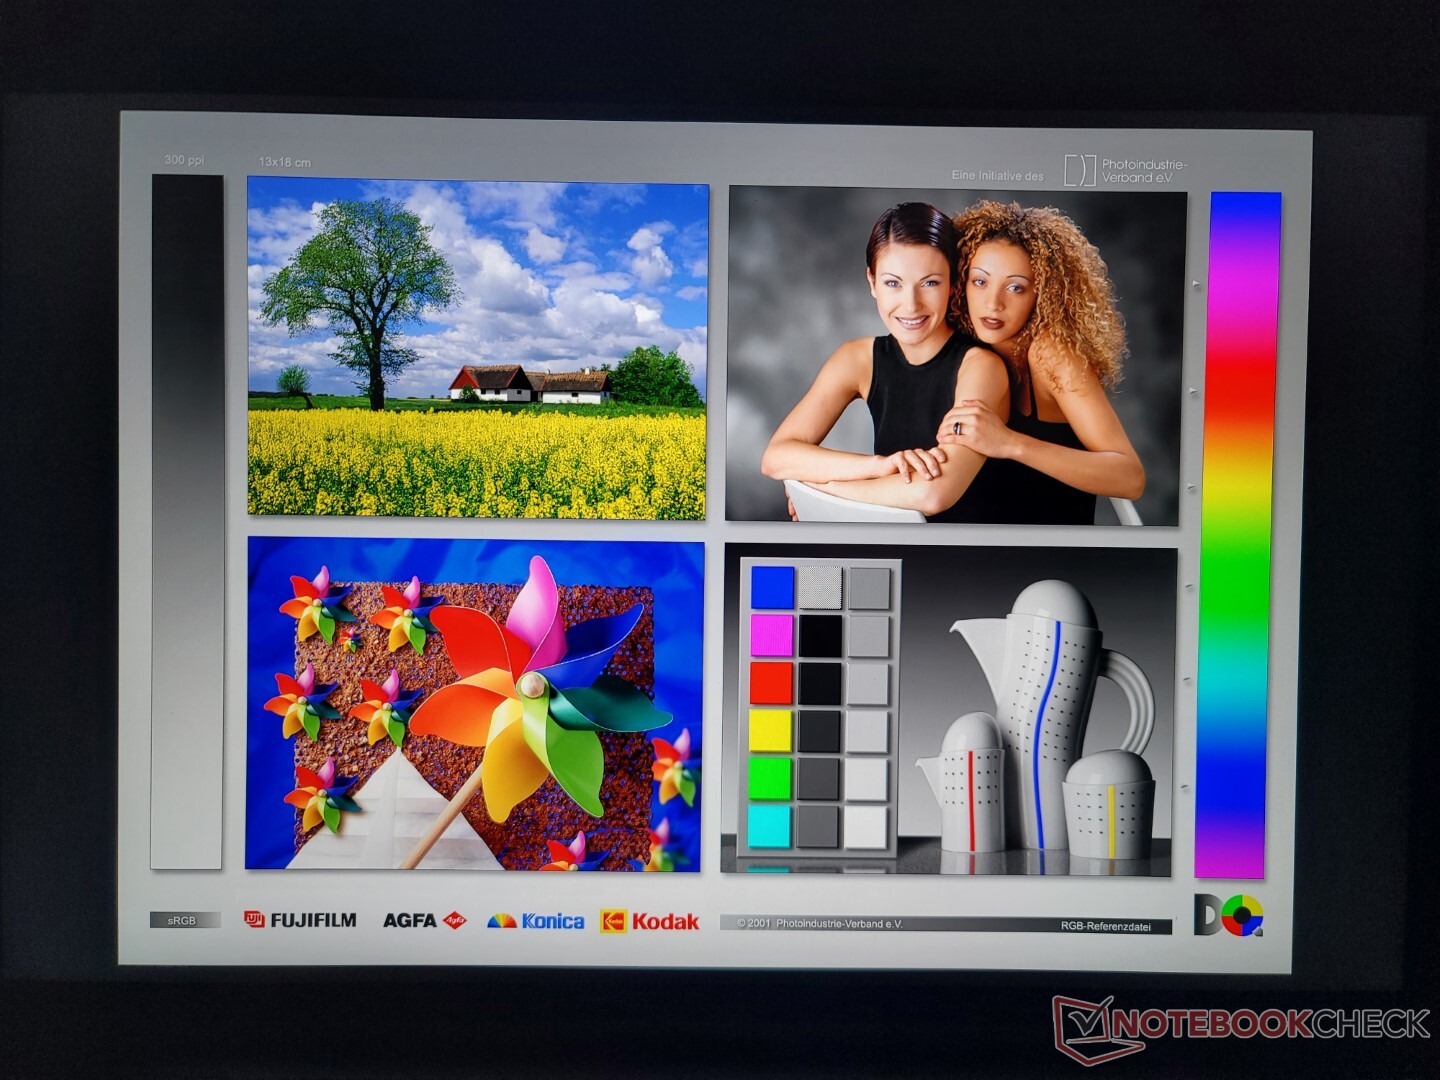
Notre écran 165 Hz est une mise à niveau de l'écran 60 Hz de notre unité de test Gen 2. Il offre également des temps de réponse plus rapides, un rétroéclairage plus lumineux et la même couverture sRGB complète. Il n'y a malheureusement pas d'options de panneaux OLED ou P3 pour le moment.


| |||||||||||||||||||||||||
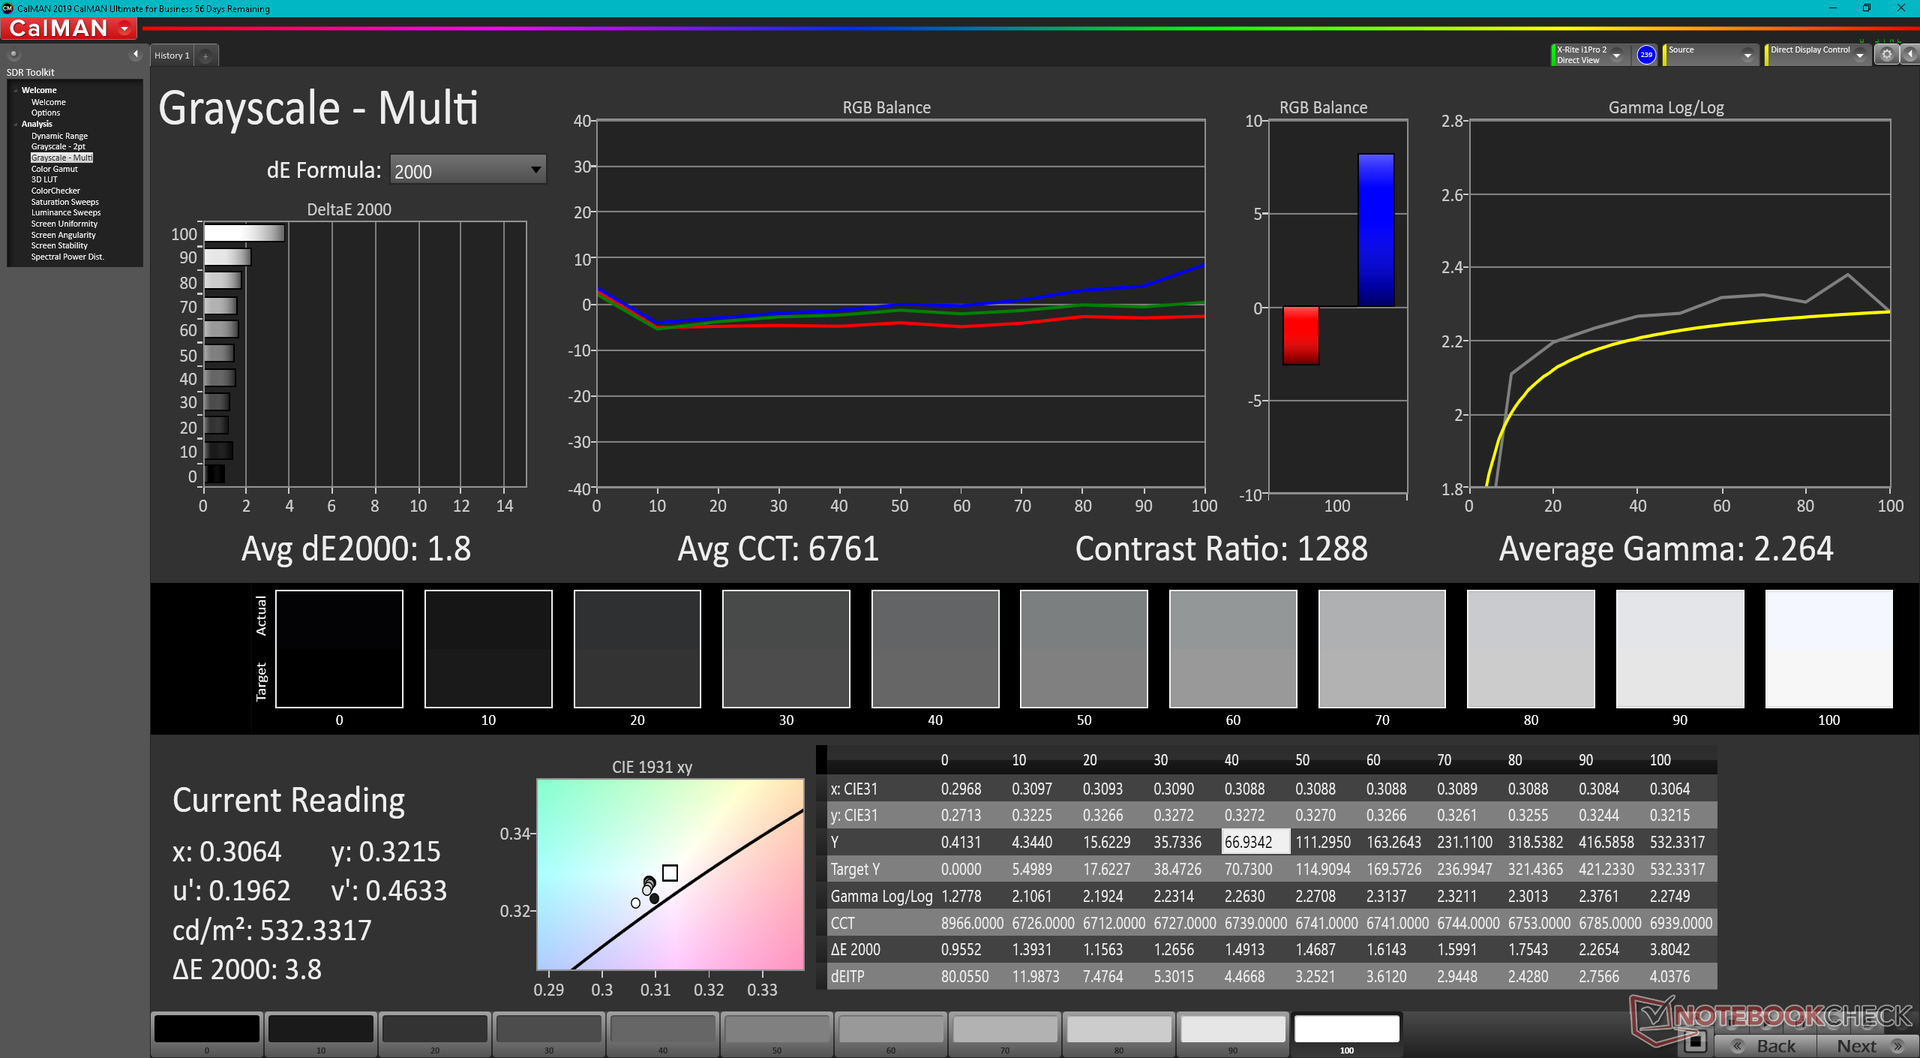
Homogénéité de la luminosité: 94 %
Valeur mesurée au centre, sur batterie: 532.8 cd/m²
Contraste: 969:1 (Valeurs des noirs: 0.55 cd/m²)
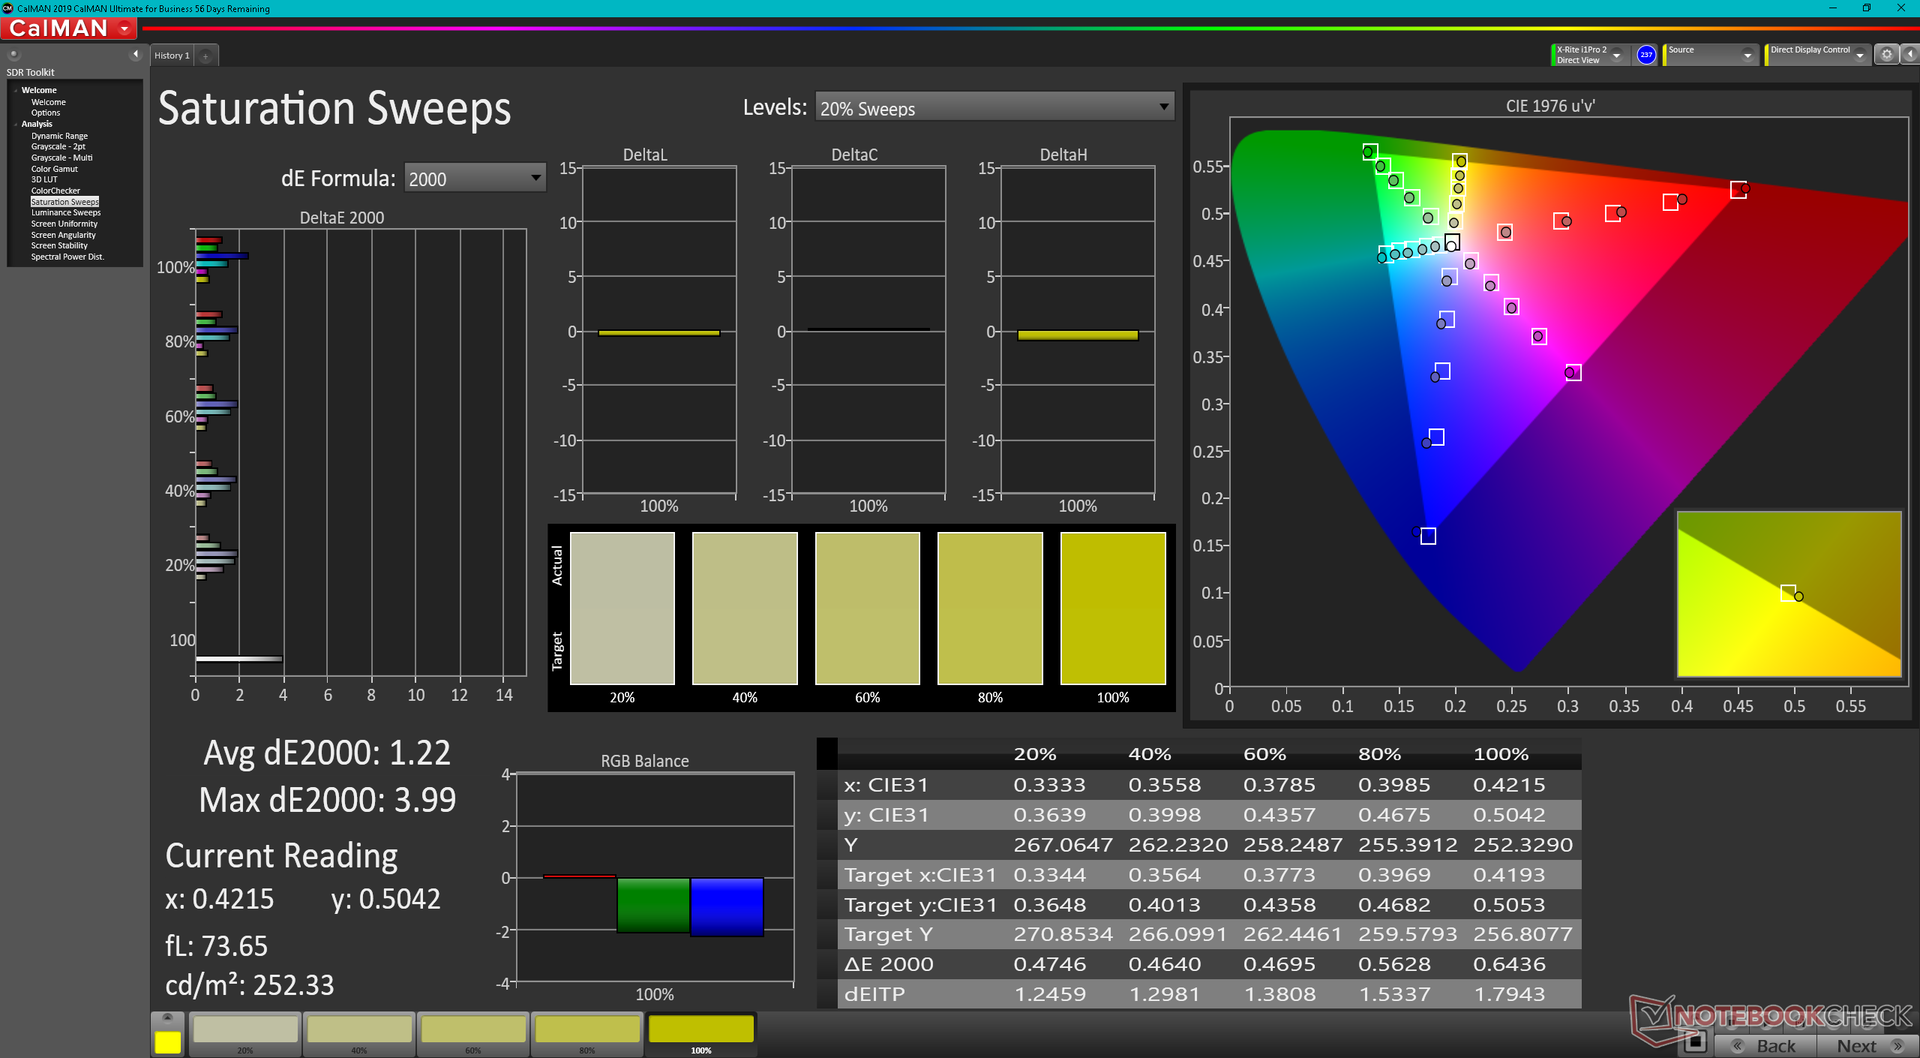
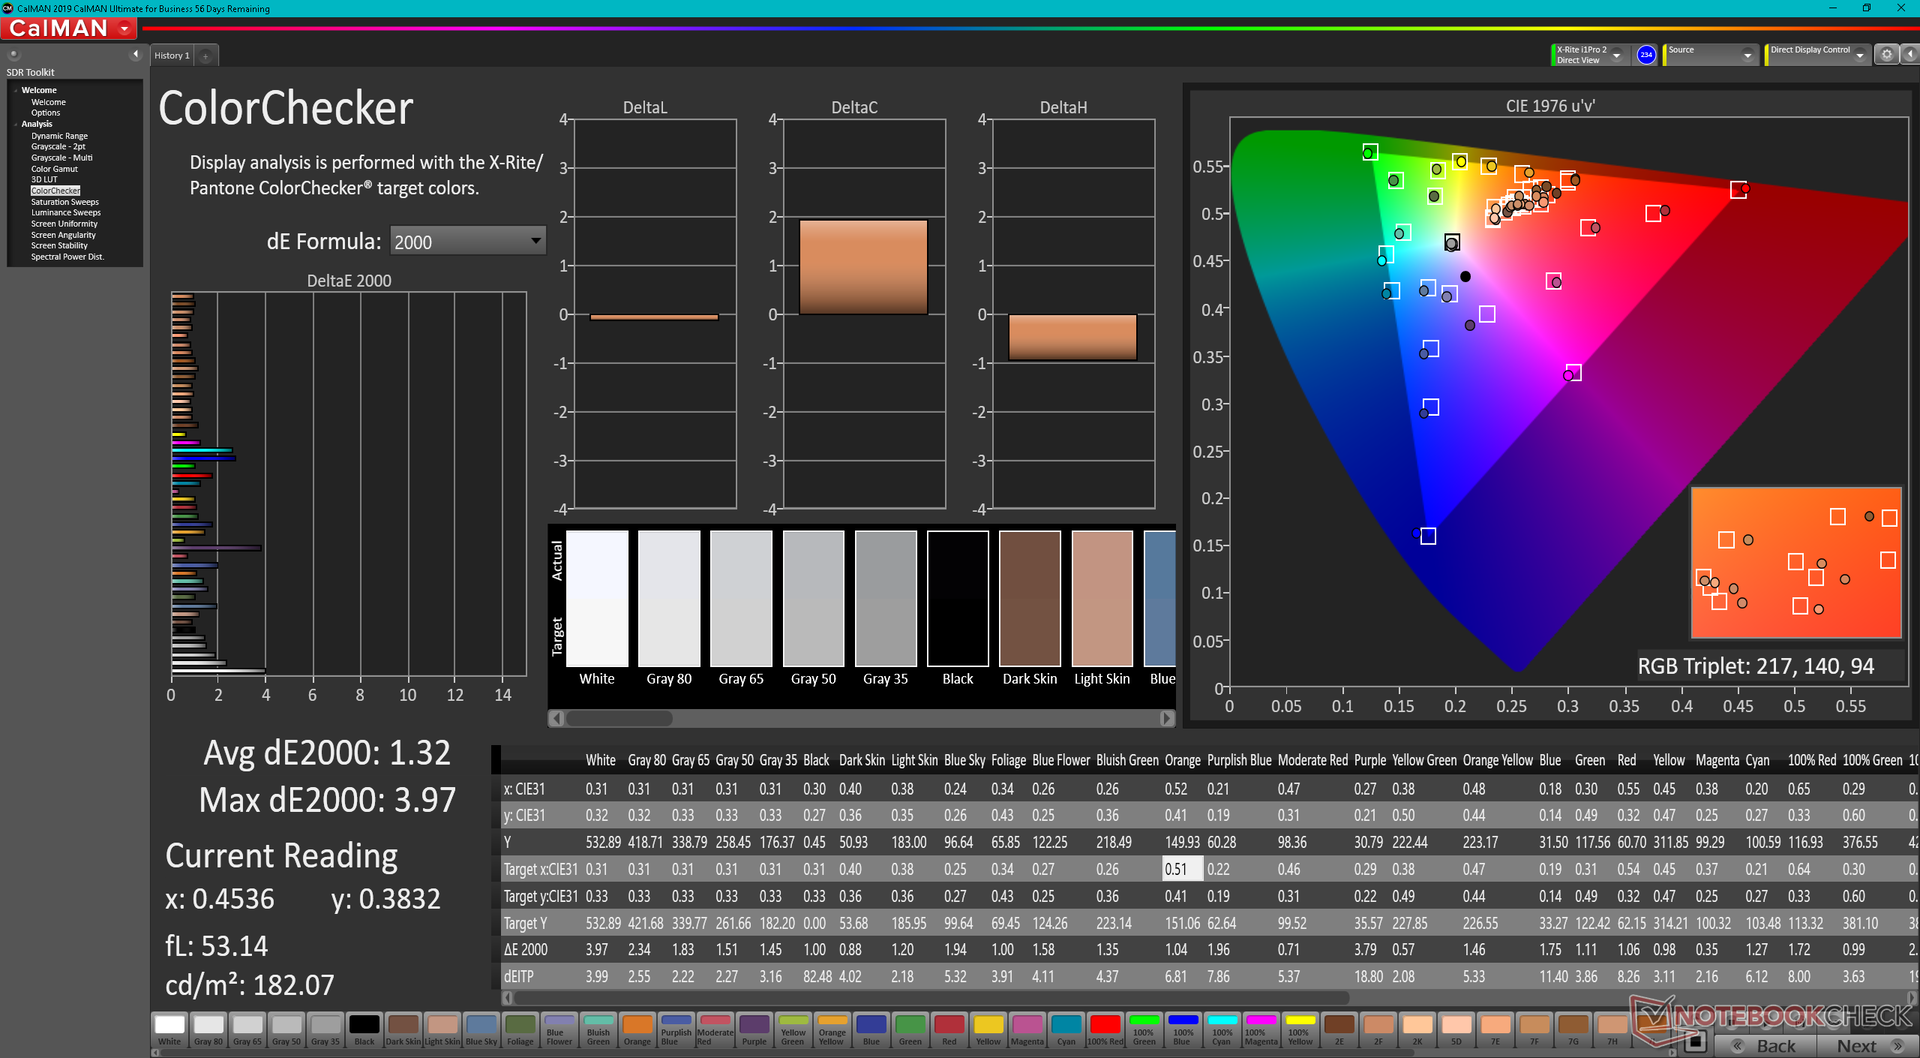
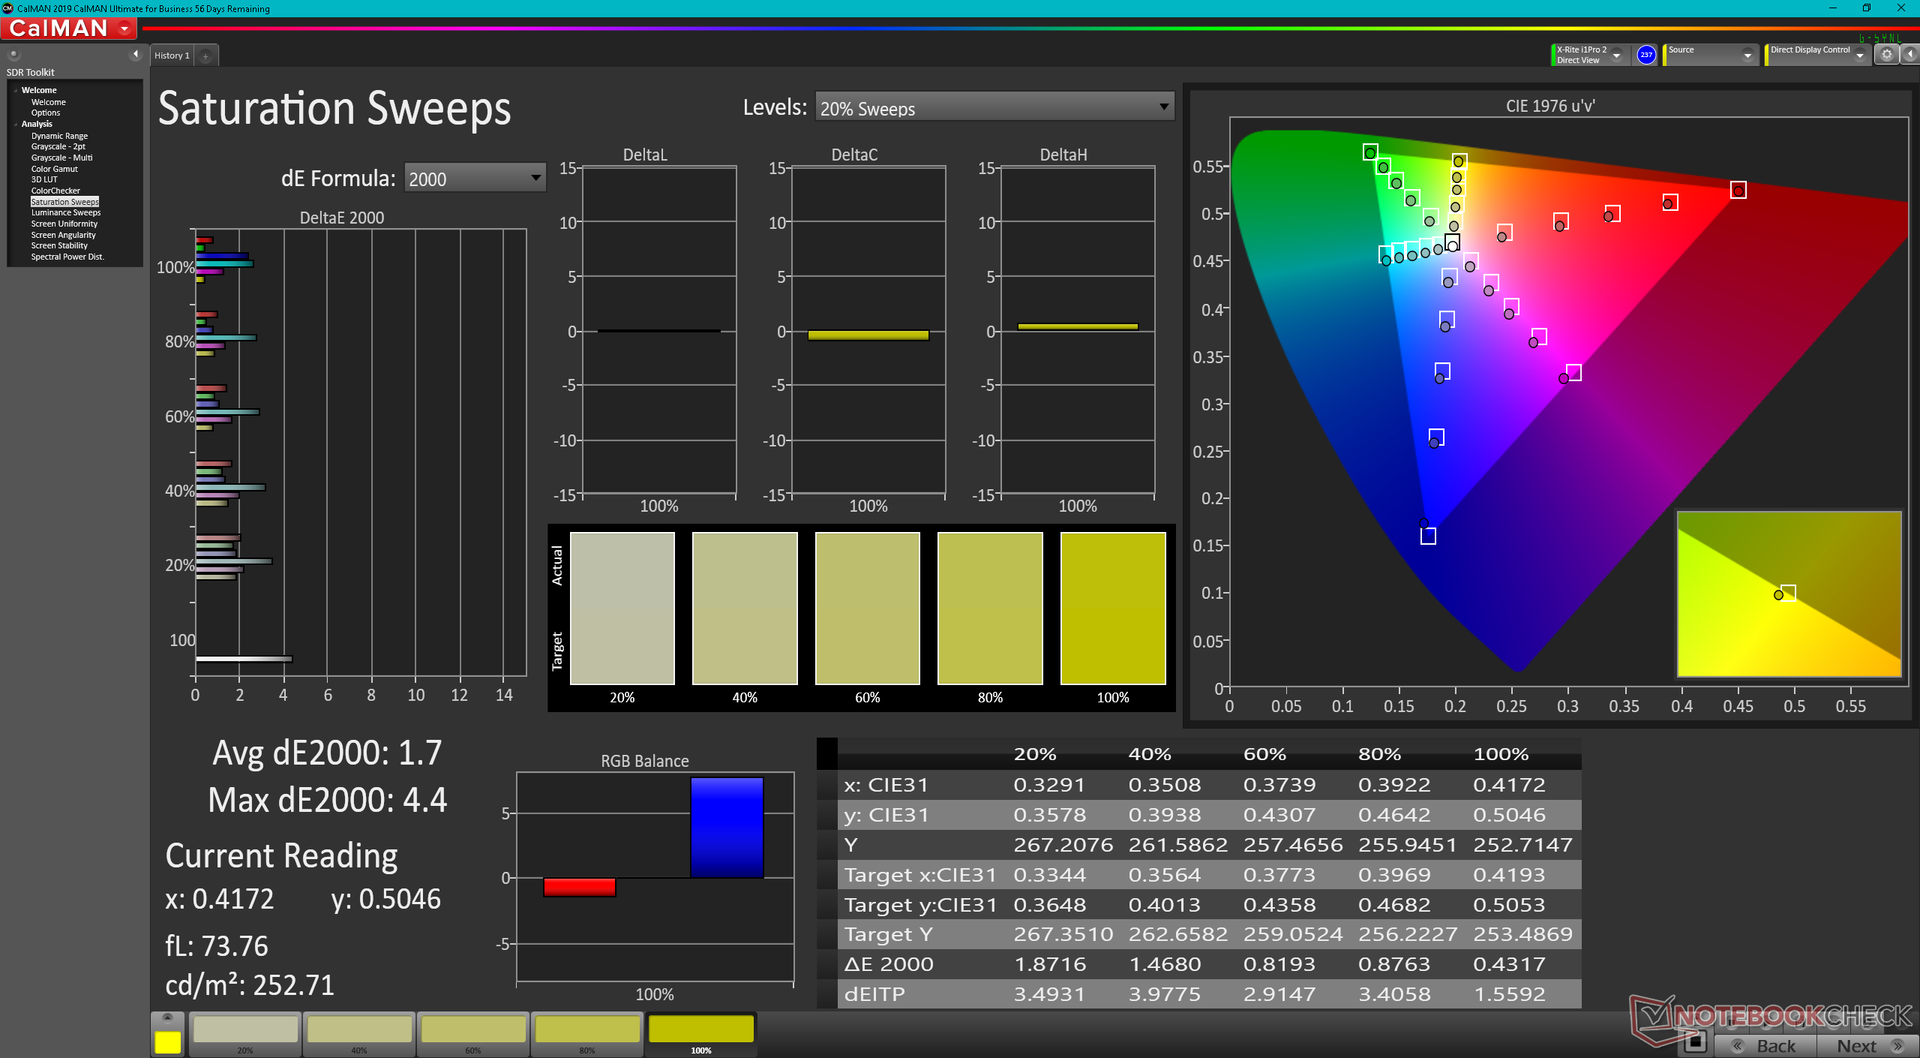
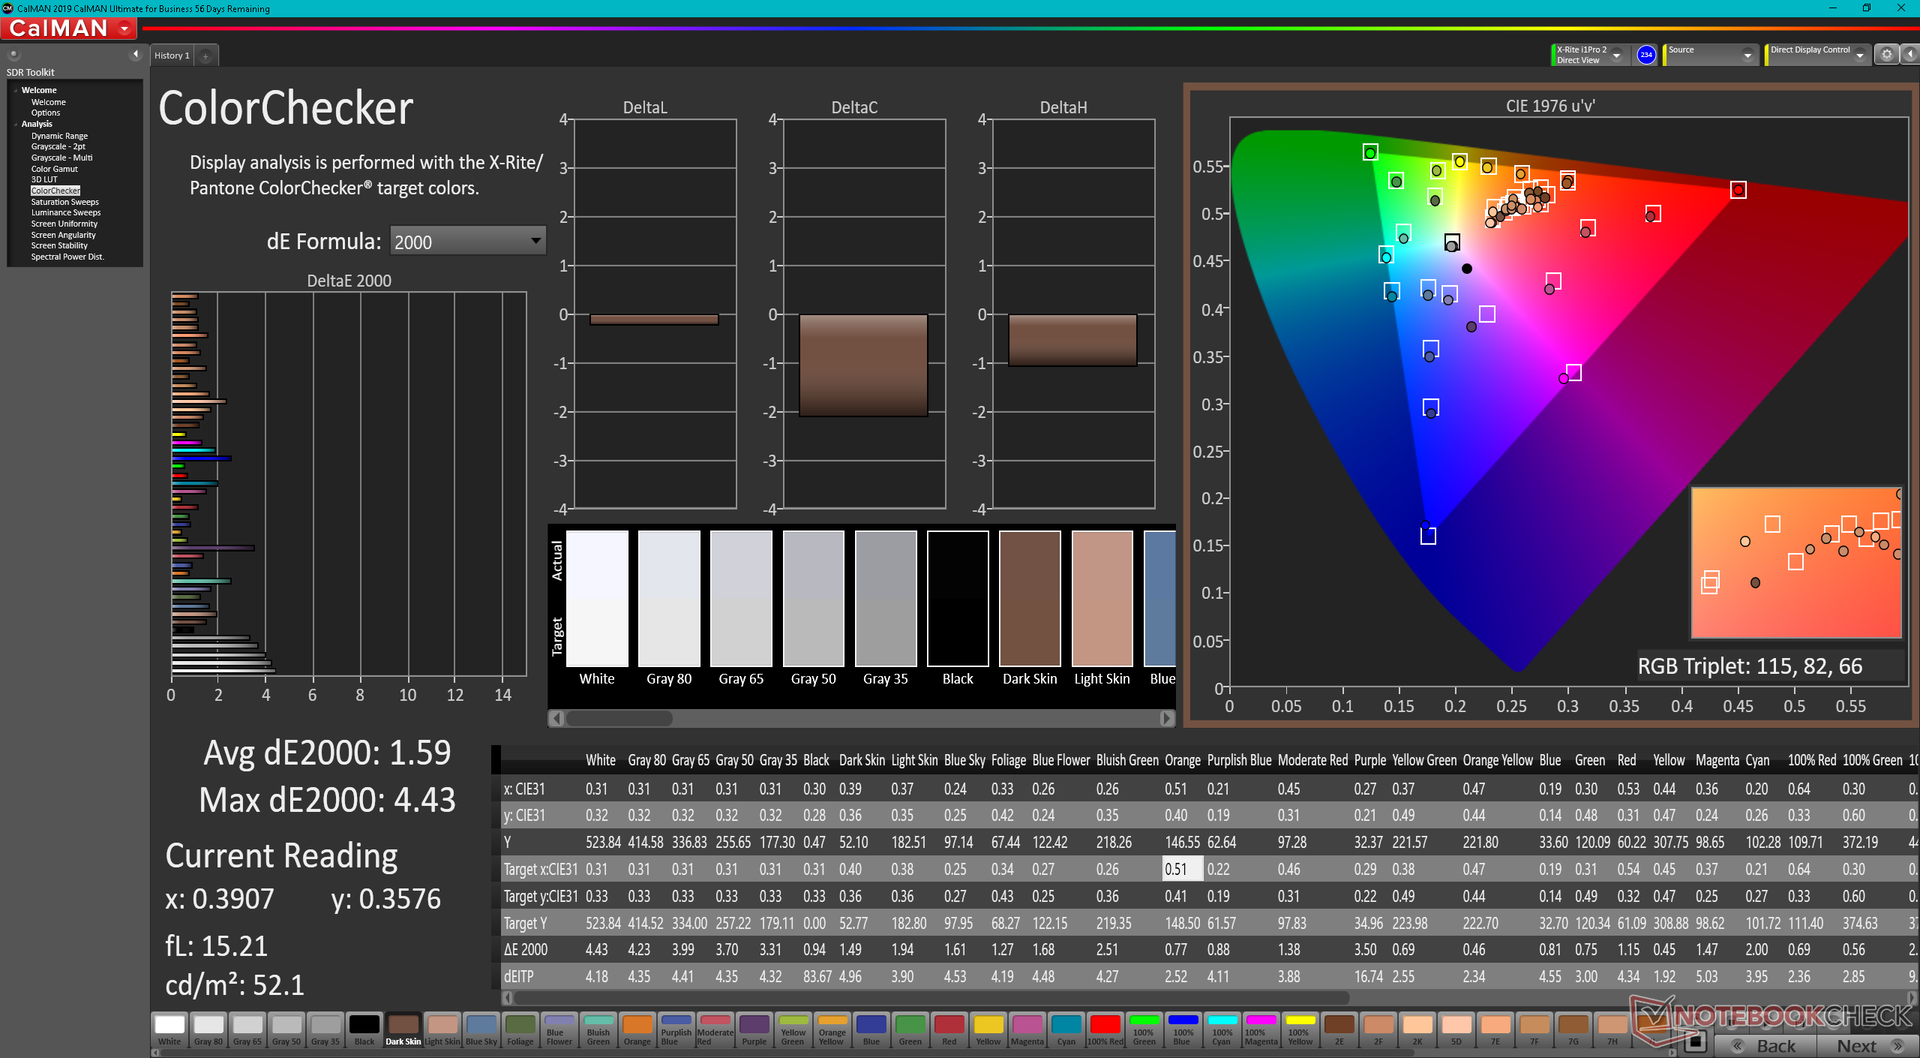
ΔE ColorChecker Calman: 1.32 | ∀{0.5-29.43 Ø4.72}
calibrated: 1.59
ΔE Greyscale Calman: 1.8 | ∀{0.09-98 Ø4.97}
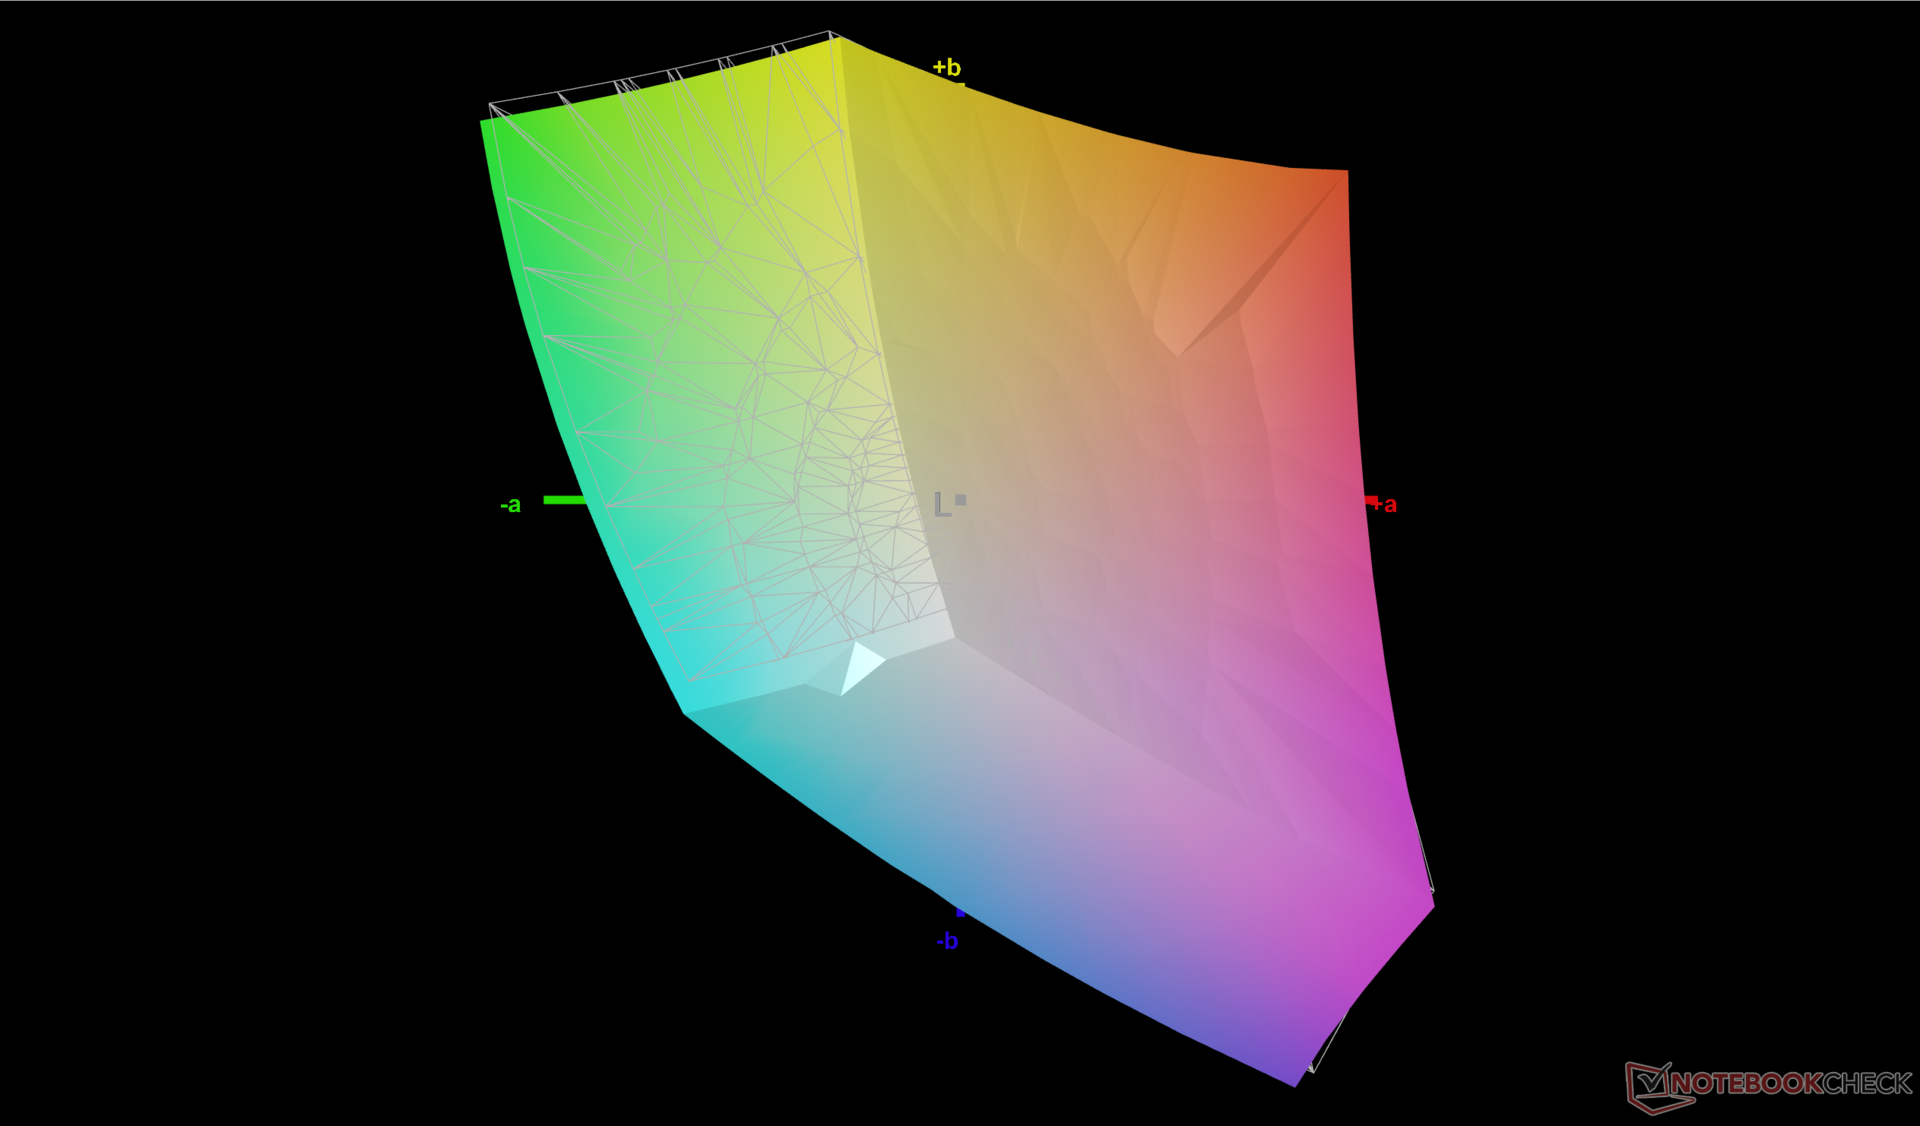
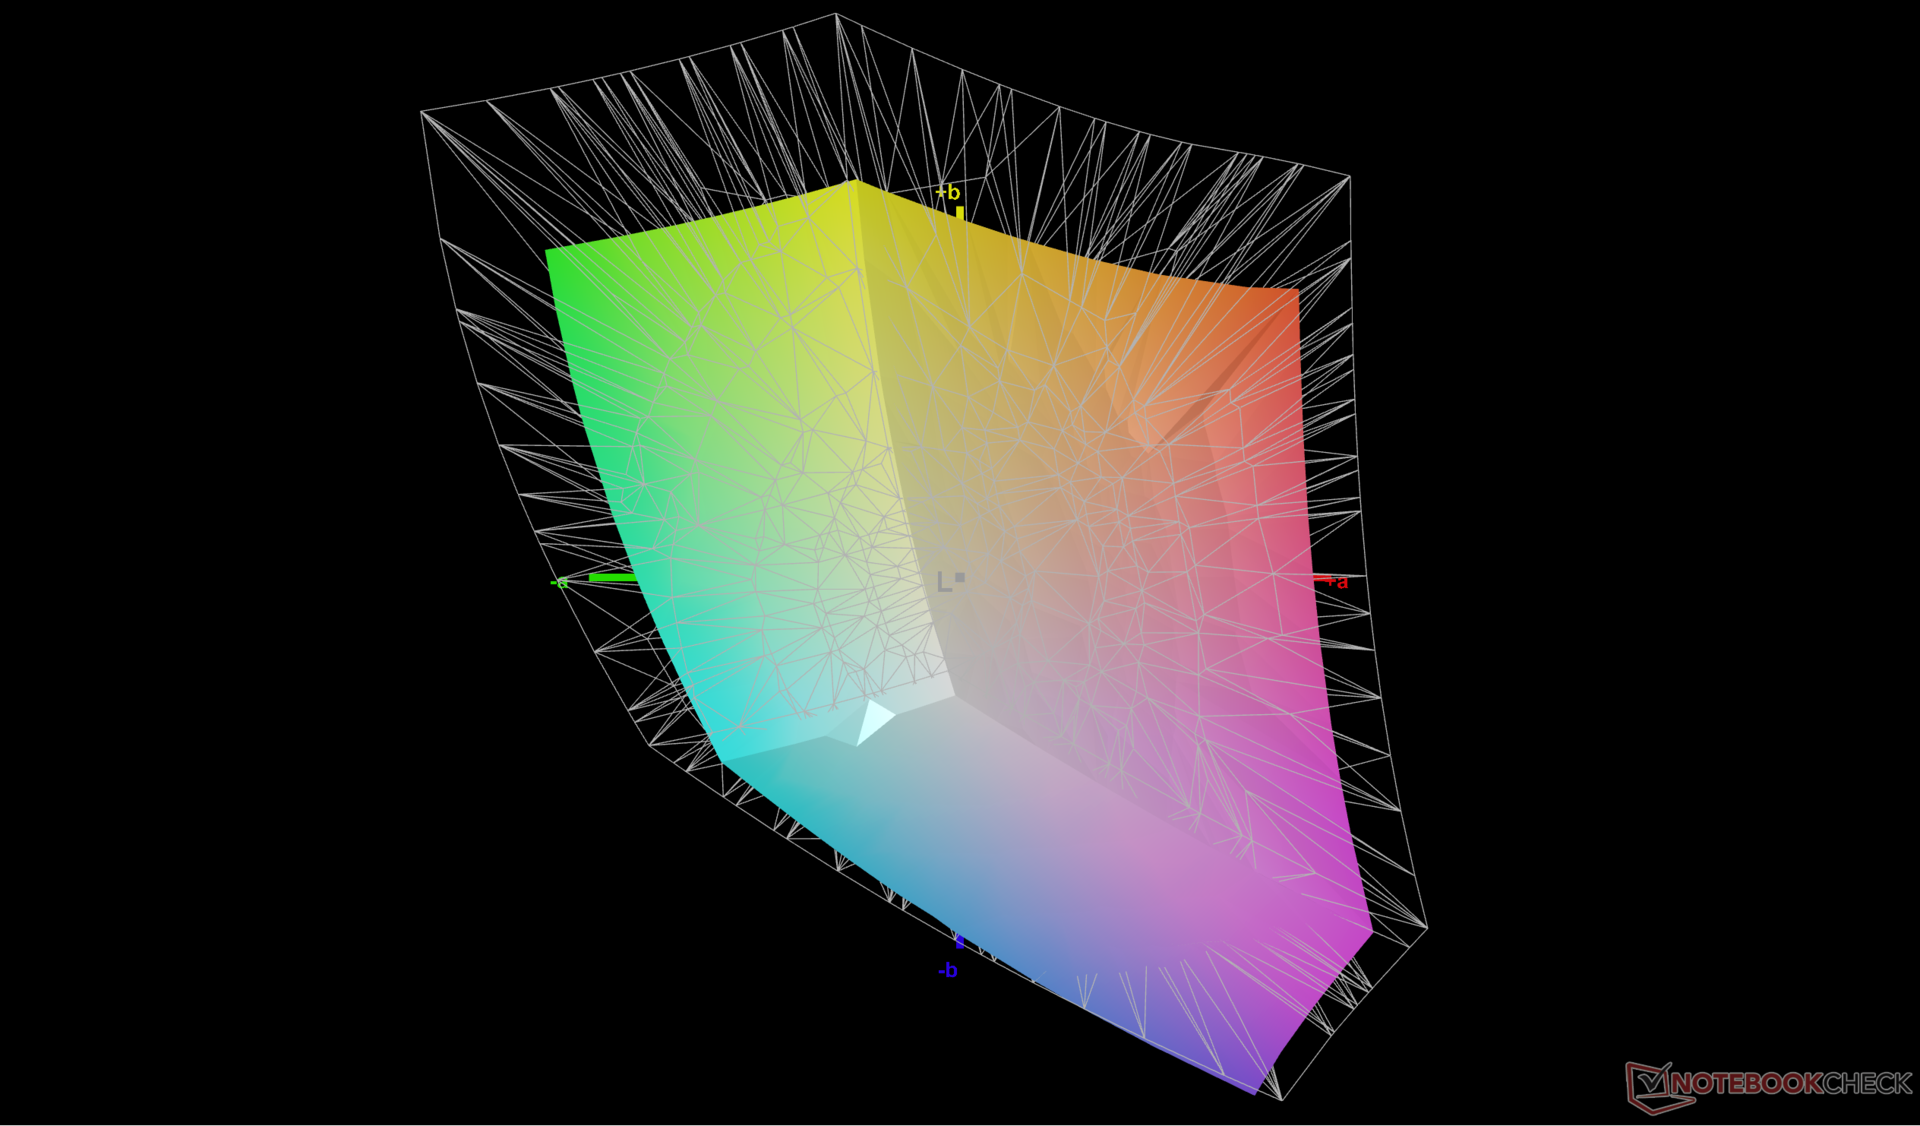
71.4% AdobeRGB 1998 (Argyll 3D)
98.2% sRGB (Argyll 3D)
69.8% Display P3 (Argyll 3D)
Gamma: 2.64
CCT: 6761 K
| Lenovo ThinkBook 16p G3 ARH BOE CQ NE160QDM-NY1, IPS, 2560x1600, 16" | HP Envy 16 h0112nr Samsung SDC4174, OLED, 3840x2400, 16" | Lenovo ThinkBook 16p G2 ACH Lenovo LEN8A95 (AUO B160QAN02.M), IPS, 2560x1600, 16" | Lenovo IdeaPad 5 Pro 16ARH7 AUO B160QAN02.H, IPS, 2560x1600, 16" | Acer Swift X SFX16-51G-5388 Chi Mei N161HCA-EA3, , 1920x1080, 16.1" | Lenovo Legion 5 Pro 16IAH7H BOE CCQ_NE160QDM_NY1, IPS, 2560x1600, 16" | |
|---|---|---|---|---|---|---|
| Display | 22% | 6% | -4% | -6% | -1% | |
| Display P3 Coverage (%) | 69.8 | 99.3 42% | 76.4 9% | 65 -7% | 65.1 -7% | 68.53 -2% |
| sRGB Coverage (%) | 98.2 | 100 2% | 100 2% | 98 0% | 95.65 -3% | 98.38 0% |
| AdobeRGB 1998 Coverage (%) | 71.4 | 88 23% | 77.4 8% | 67.2 -6% | 66.75 -7% | 70.45 -1% |
| Response Times | 85% | -89% | 24% | -86% | 28% | |
| Response Time Grey 50% / Grey 80% * (ms) | 15.6 ? | 2 ? 87% | 36 -131% | 14.1 ? 10% | 30 ? -92% | 14 ? 10% |
| Response Time Black / White * (ms) | 11.2 ? | 1.9 ? 83% | 16.4 -46% | 7.1 ? 37% | 20 ? -79% | 6 ? 46% |
| PWM Frequency (Hz) | 240.4 ? | |||||
| Screen | -19% | -1% | -11% | 2% | -11% | |
| Brightness middle (cd/m²) | 532.8 | 328.8 -38% | 439 -18% | 415 -22% | 276 -48% | 515 -3% |
| Brightness (cd/m²) | 519 | 332 -36% | 397 -24% | 409 -21% | 264 -49% | 475 -8% |
| Brightness Distribution (%) | 94 | 97 3% | 83 -12% | 91 -3% | 85 -10% | 85 -10% |
| Black Level * (cd/m²) | 0.55 | 0.44 20% | 0.32 42% | 0.16 71% | 0.45 18% | |
| Contrast (:1) | 969 | 998 3% | 1297 34% | 1725 78% | 1144 18% | |
| Colorchecker dE 2000 * | 1.32 | 1.53 -16% | 1.68 -27% | 1.92 -45% | 1.8 -36% | 2.38 -80% |
| Colorchecker dE 2000 max. * | 3.97 | 6.04 -52% | 2.36 41% | 5.71 -44% | 3.77 5% | 4.37 -10% |
| Colorchecker dE 2000 calibrated * | 1.59 | 1.57 1% | 0.58 64% | 0.63 60% | 1.1 31% | |
| Greyscale dE 2000 * | 1.8 | 1.3 28% | 1.64 9% | 3.7 -106% | 2.76 -53% | 2.71 -51% |
| Gamma | 2.64 83% | 2.18 101% | 2.39 92% | 2.272 97% | 2.37 93% | 2.49 88% |
| CCT | 6761 96% | 6362 102% | 6616 98% | 7132 91% | 6564 99% | 6117 106% |
| Moyenne finale (programmes/paramètres) | 29% /
11% | -28% /
-12% | 3% /
-5% | -30% /
-12% | 5% /
-3% |
* ... Moindre est la valeur, meilleures sont les performances
L'écran est livré pré-calibré par rapport à la norme sRGB. Les valeurs moyennes du deltaE des niveaux de gris et des couleurs ne sont que de 1,8 et 1,32, respectivement, et un étalonnage par l'utilisateur final n'est donc pas nécessaire.
Temps de réponse de l'écran
| ↔ Temps de réponse noir à blanc | ||
|---|---|---|
| 11.2 ms ... hausse ↗ et chute ↘ combinées | ↗ 6 ms hausse | 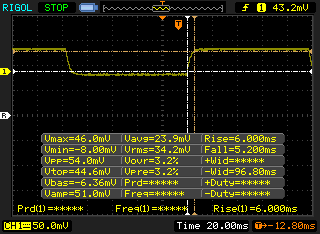 |
| ↘ 5.2 ms chute | ||
| L'écran montre de bons temps de réponse, mais insuffisant pour du jeu compétitif. En comparaison, tous les appareils testés affichent entre 0.1 (minimum) et 240 (maximum) ms. » 30 % des appareils testés affichent de meilleures performances. Cela signifie que les latences relevées sont meilleures que la moyenne (19.8 ms) de tous les appareils testés. | ||
| ↔ Temps de réponse gris 50% à gris 80% | ||
| 15.6 ms ... hausse ↗ et chute ↘ combinées | ↗ 7.2 ms hausse | 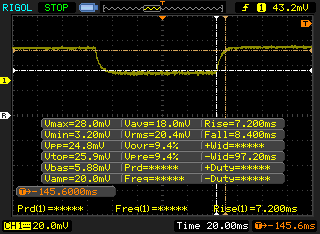 |
| ↘ 8.4 ms chute | ||
| L'écran montre de bons temps de réponse, mais insuffisant pour du jeu compétitif. En comparaison, tous les appareils testés affichent entre 0.165 (minimum) et 636 (maximum) ms. » 30 % des appareils testés affichent de meilleures performances. Cela signifie que les latences relevées sont meilleures que la moyenne (31 ms) de tous les appareils testés. | ||
Scintillement / MLI (Modulation de largeur d'impulsion)
| Scintillement / MLI (Modulation de largeur d'impulsion) non décelé | 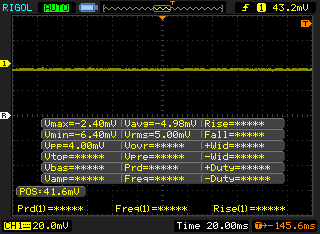 | ||
En comparaison, 52 % des appareils testés n'emploient pas MDI pour assombrir leur écran. Nous avons relevé une moyenne à 7781 (minimum : 5 - maximum : 343500) Hz dans le cas où une MDI était active. | |||
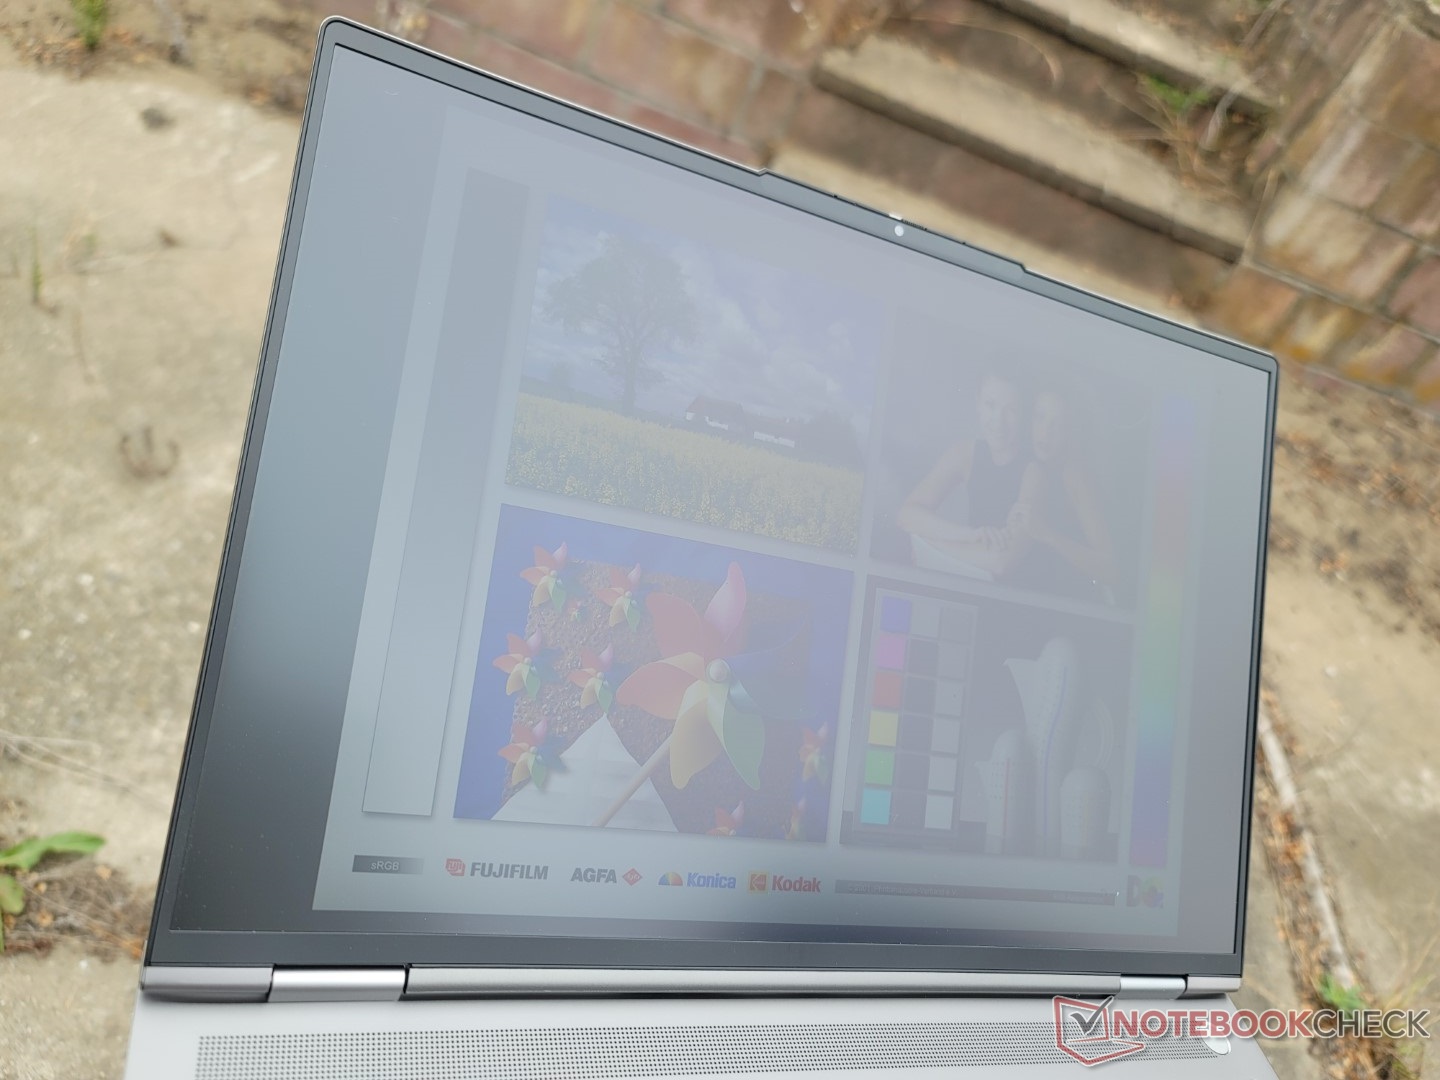
La visibilité extérieure est décente si elle est à l'ombre. Le revêtement mat et le rétroéclairage relativement lumineux de 500 nits contribuent à minimiser les reflets, plus qu'avec une alternative brillante.
Performance
Conditions d'essai
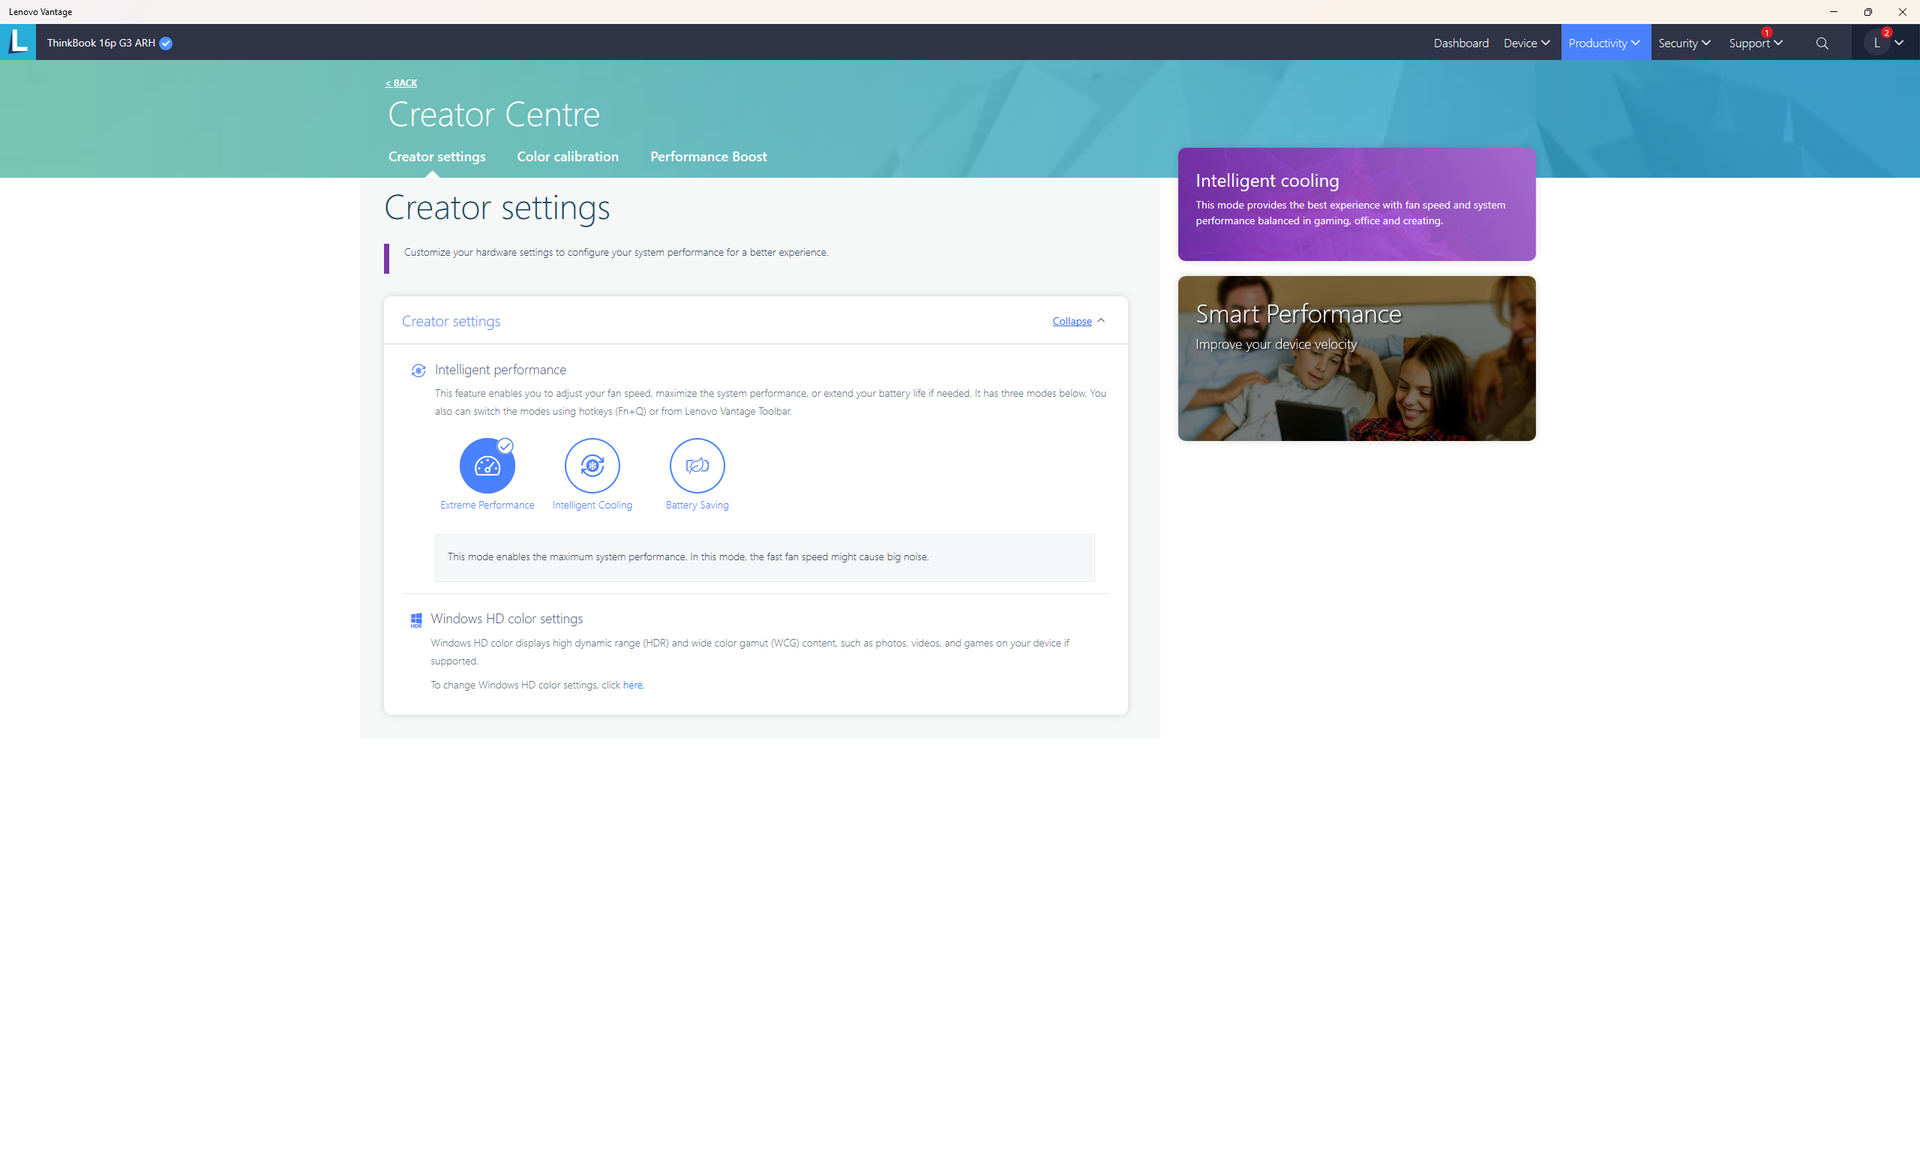
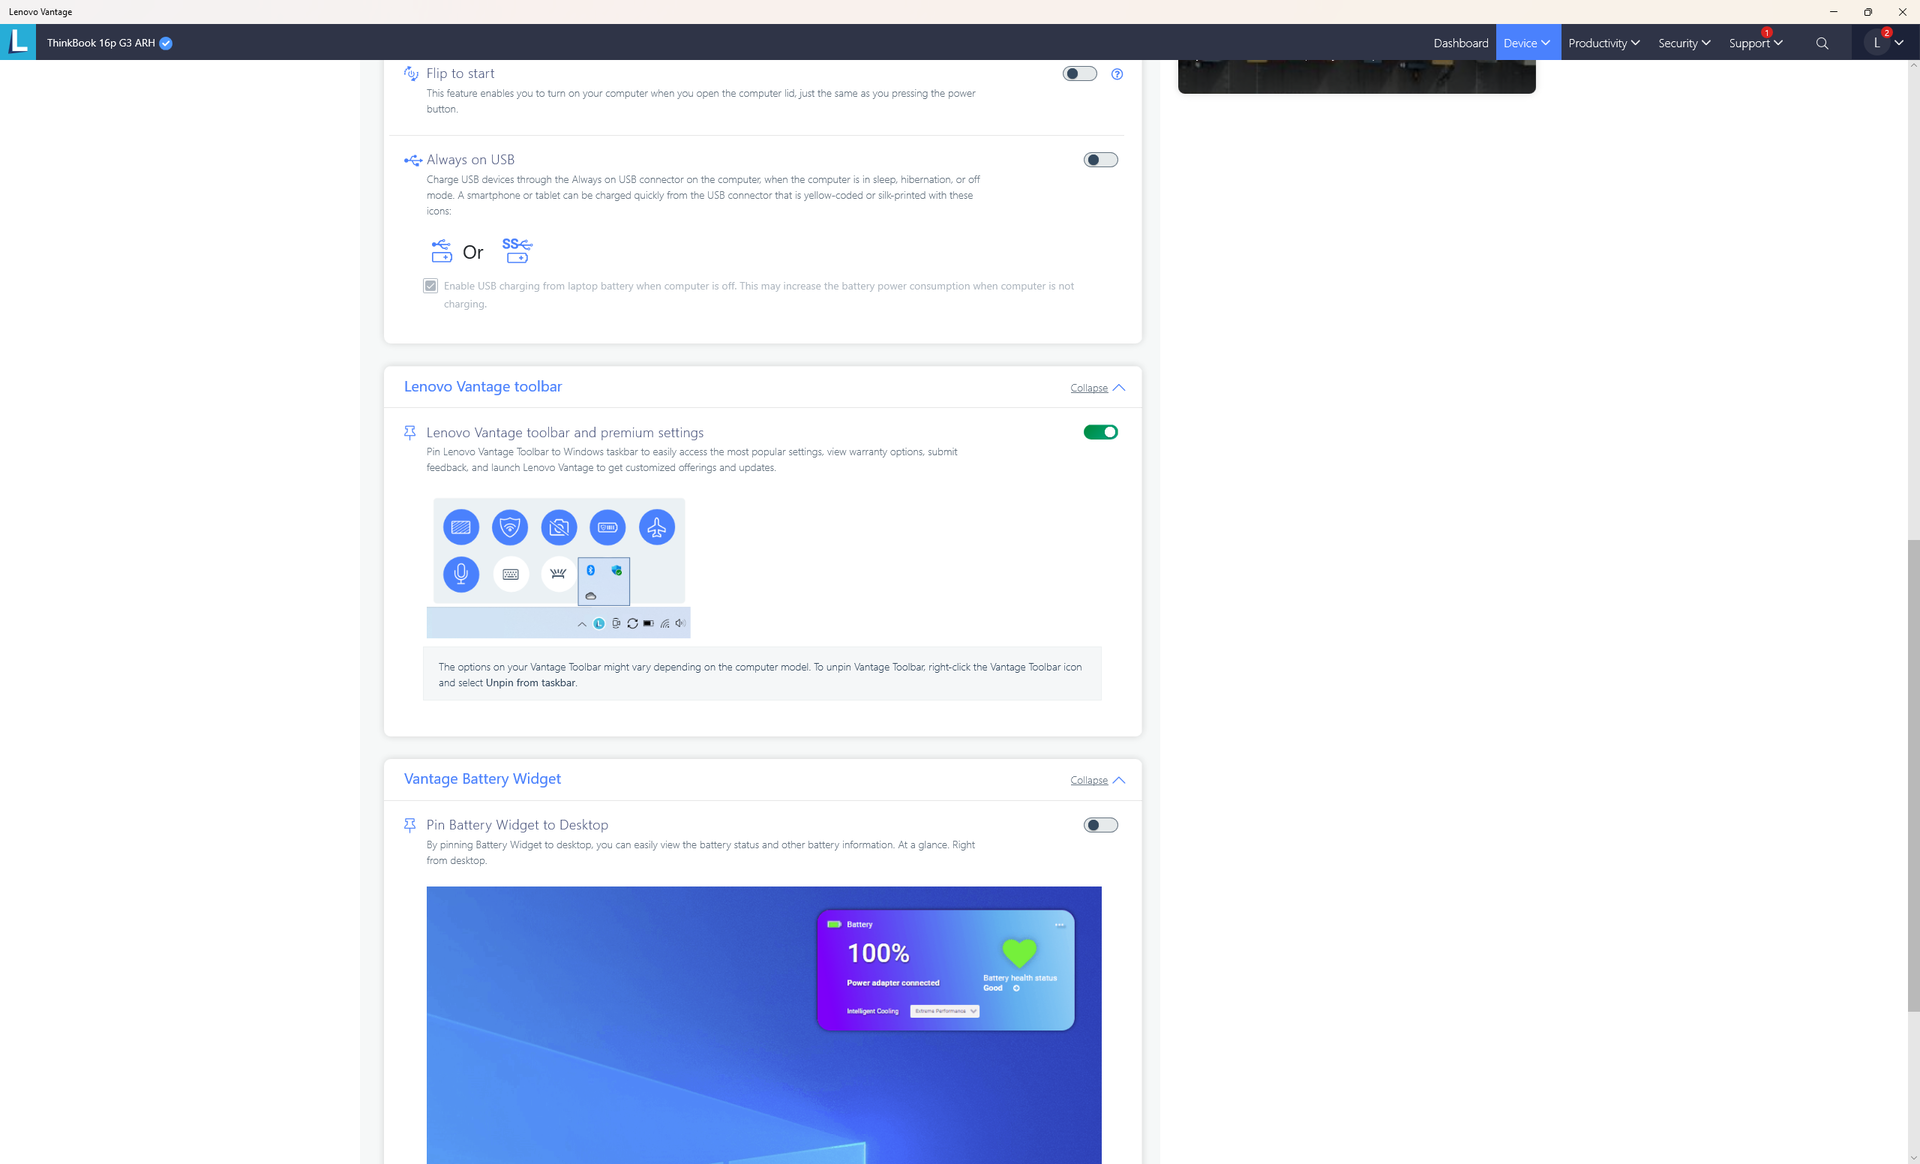
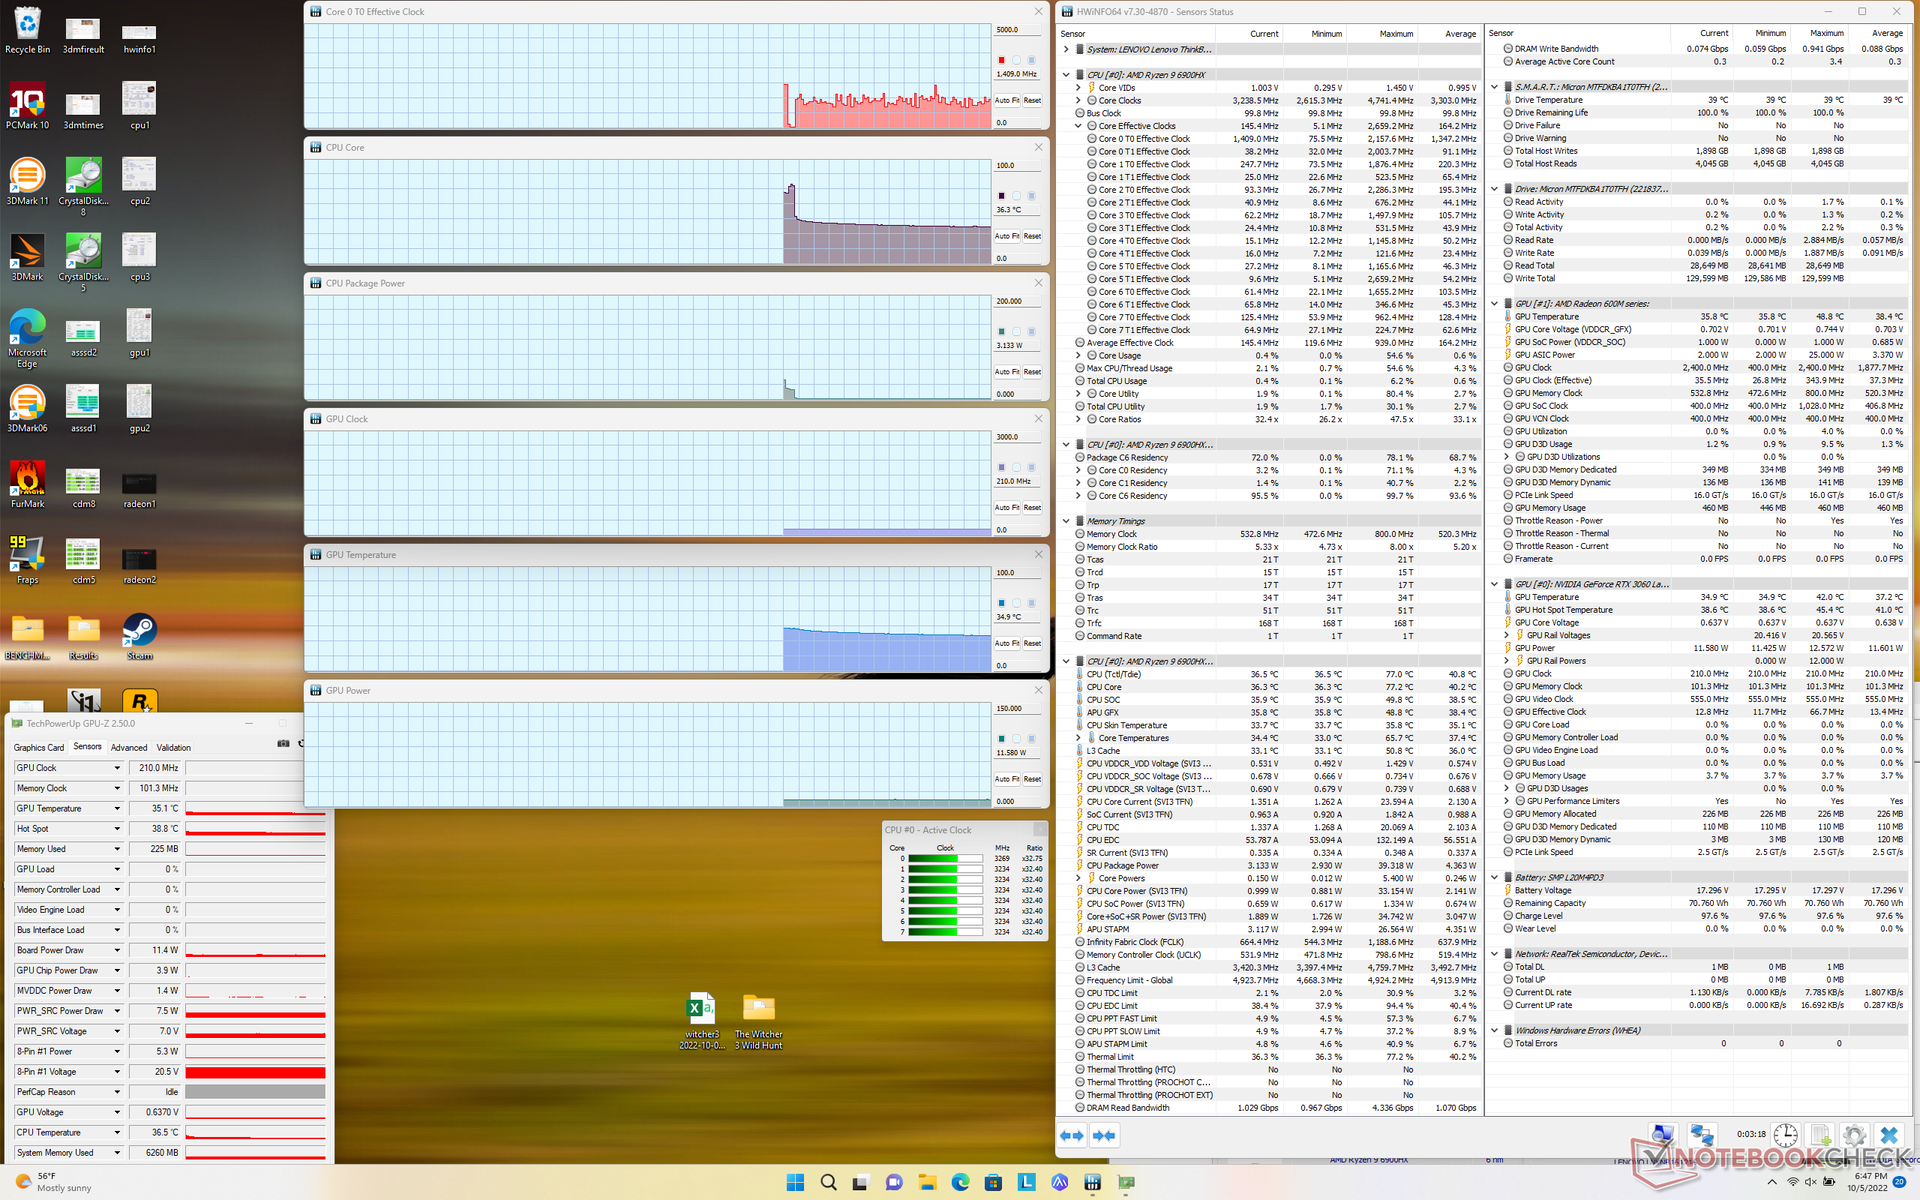
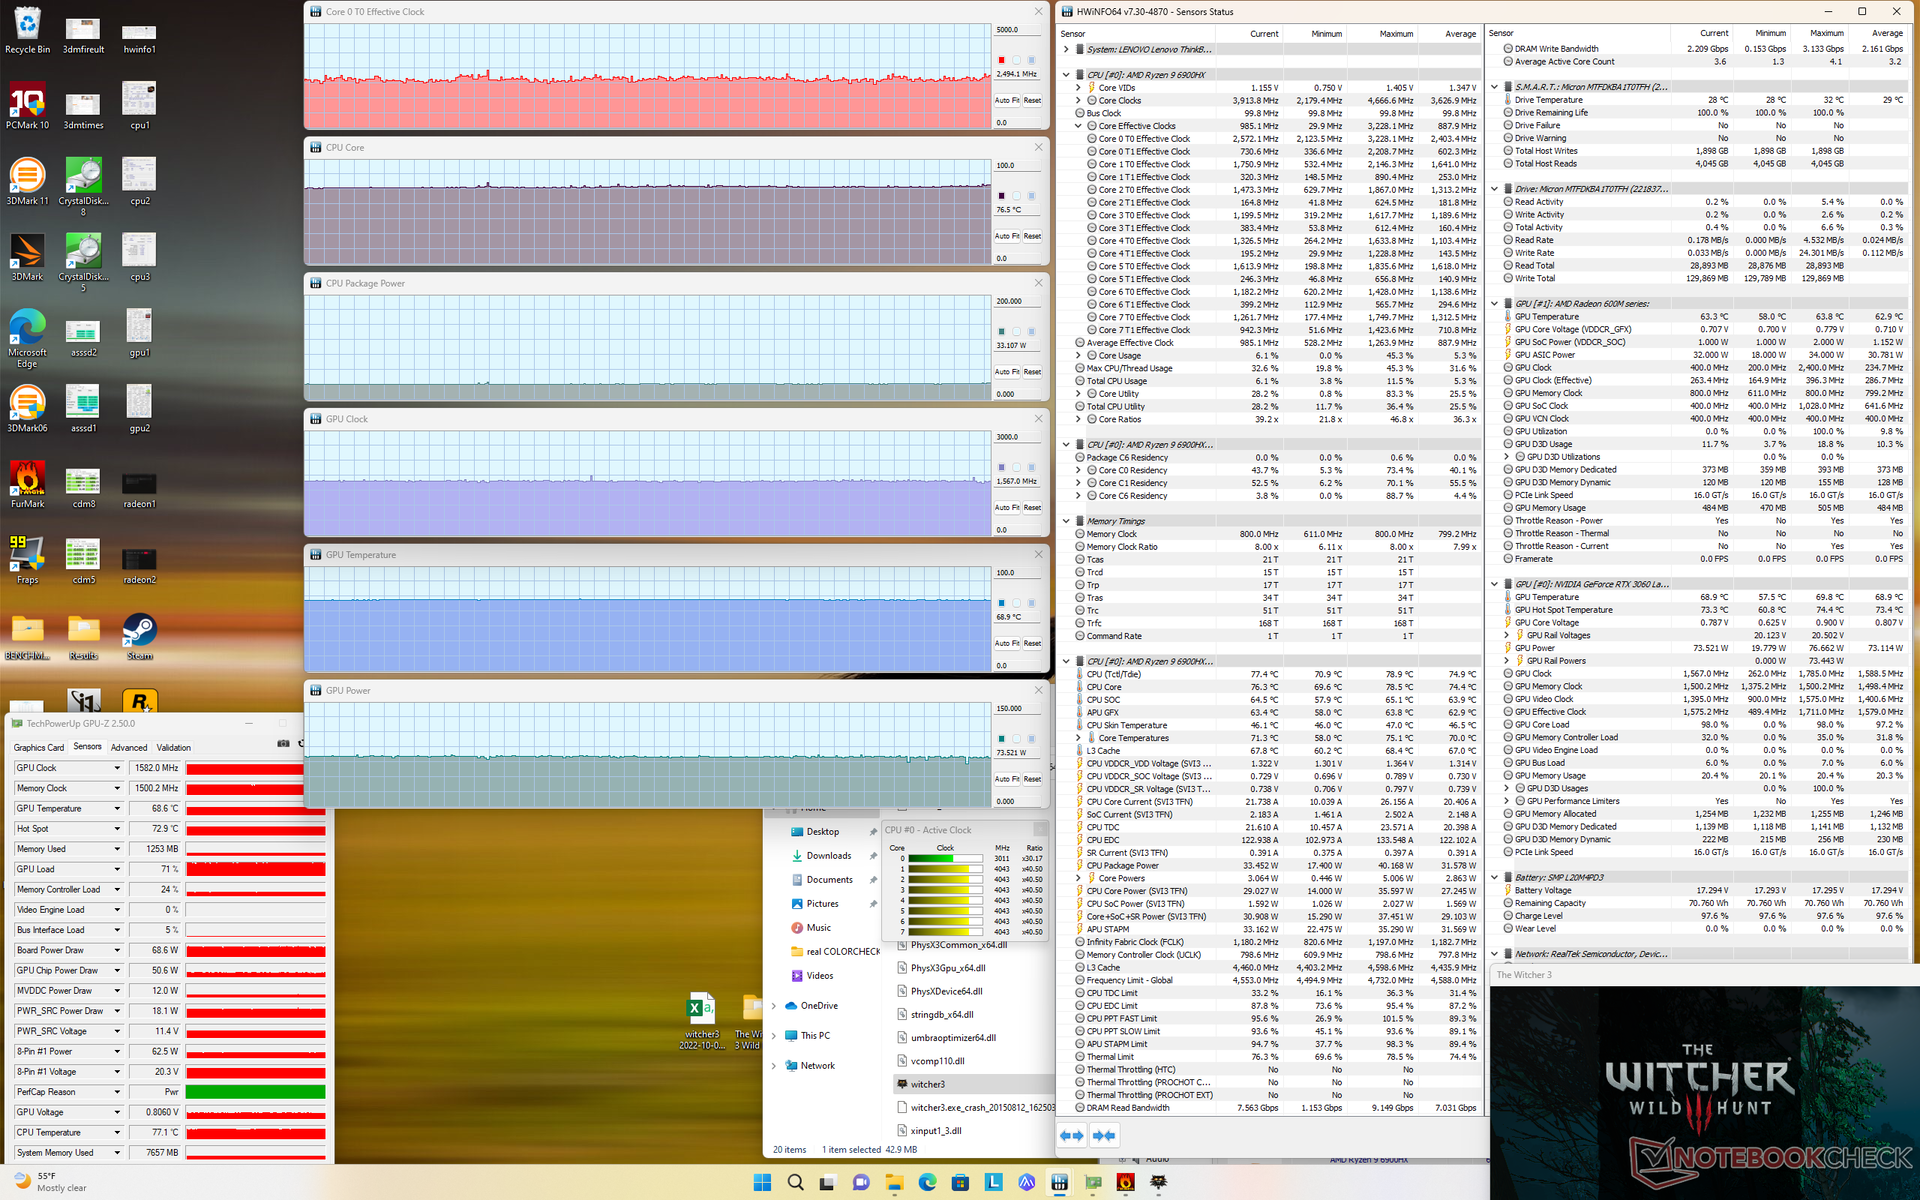
Nous avons réglé notre appareil en mode Performance via Windows et en mode Performance extrême via le logiciel Lenovo Vantage avant d'effectuer les tests de référence ci-dessous. Il est recommandé de se familiariser avec Lenovo Vantage, car il s'agit du centre de contrôle des mises à jour et des paramètres, comme le montrent les captures d'écran ci-dessous.

Processeur
Les performances du CPU sont mitigées. Bien que le Ryzen 9 6900HX est certainement l'un des CPU mobiles les plus rapides d'AMD, les performances sont essentiellement identiques à celles du Ryzen 9 5900HX. En fait, il est à peine plus rapide que le Ryzen 7 6800H. En rétrogradant vers le Ryzen 5 6600H réduira les performances mono et multi-thread d'environ 5 % et 20 %, respectivement.
Cinebench R15 Multi Loop
Cinebench R23: Multi Core | Single Core
Cinebench R15: CPU Multi 64Bit | CPU Single 64Bit
Blender: v2.79 BMW27 CPU
7-Zip 18.03: 7z b 4 | 7z b 4 -mmt1
Geekbench 5.5: Multi-Core | Single-Core
HWBOT x265 Benchmark v2.2: 4k Preset
LibreOffice : 20 Documents To PDF
R Benchmark 2.5: Overall mean
| Cinebench R20 / CPU (Multi Core) | |
| Lenovo Legion 5 Pro 16IAH7H | |
| Razer Blade 15 2022 | |
| Lenovo ThinkBook 16p G3 ARH | |
| Moyenne AMD Ryzen 9 6900HX (3742 - 5813, n=19) | |
| Lenovo ThinkBook 16p G2 ACH | |
| HP Envy 16 h0112nr | |
| Asus ROG Zephyrus G14 GA402RJ | |
| Lenovo IdeaPad 5 Pro 16ACH | |
| Lenovo Legion 5 Pro 16 ARH7H-82RG0047GE | |
| Aorus 15P XC | |
| Acer Swift X SFX16-51G-5388 | |
| Cinebench R20 / CPU (Single Core) | |
| Razer Blade 15 2022 | |
| HP Envy 16 h0112nr | |
| Lenovo Legion 5 Pro 16IAH7H | |
| Moyenne AMD Ryzen 9 6900HX (595 - 631, n=19) | |
| Lenovo ThinkBook 16p G3 ARH | |
| Lenovo ThinkBook 16p G2 ACH | |
| Lenovo Legion 5 Pro 16 ARH7H-82RG0047GE | |
| Asus ROG Zephyrus G14 GA402RJ | |
| Acer Swift X SFX16-51G-5388 | |
| Lenovo IdeaPad 5 Pro 16ACH | |
| Aorus 15P XC | |
| Cinebench R23 / Multi Core | |
| Lenovo Legion 5 Pro 16IAH7H | |
| Razer Blade 15 2022 | |
| Lenovo ThinkBook 16p G3 ARH | |
| Moyenne AMD Ryzen 9 6900HX (9709 - 15100, n=19) | |
| Lenovo ThinkBook 16p G2 ACH | |
| HP Envy 16 h0112nr | |
| Asus ROG Zephyrus G14 GA402RJ | |
| Lenovo IdeaPad 5 Pro 16ACH | |
| Lenovo Legion 5 Pro 16 ARH7H-82RG0047GE | |
| Aorus 15P XC | |
| Acer Swift X SFX16-51G-5388 | |
| Cinebench R23 / Single Core | |
| Razer Blade 15 2022 | |
| HP Envy 16 h0112nr | |
| Lenovo Legion 5 Pro 16IAH7H | |
| Moyenne AMD Ryzen 9 6900HX (1516 - 1616, n=19) | |
| Lenovo ThinkBook 16p G3 ARH | |
| Lenovo ThinkBook 16p G2 ACH | |
| Lenovo Legion 5 Pro 16 ARH7H-82RG0047GE | |
| Asus ROG Zephyrus G14 GA402RJ | |
| Lenovo IdeaPad 5 Pro 16ACH | |
| Acer Swift X SFX16-51G-5388 | |
| Aorus 15P XC | |
| Cinebench R15 / CPU Multi 64Bit | |
| Lenovo Legion 5 Pro 16IAH7H | |
| HP Envy 16 h0112nr | |
| Razer Blade 15 2022 | |
| Moyenne AMD Ryzen 9 6900HX (1588 - 2411, n=19) | |
| Lenovo ThinkBook 16p G3 ARH | |
| Lenovo ThinkBook 16p G2 ACH | |
| Asus ROG Zephyrus G14 GA402RJ | |
| Lenovo IdeaPad 5 Pro 16ACH | |
| Lenovo Legion 5 Pro 16 ARH7H-82RG0047GE | |
| Aorus 15P XC | |
| Acer Swift X SFX16-51G-5388 | |
| Cinebench R15 / CPU Single 64Bit | |
| Razer Blade 15 2022 | |
| HP Envy 16 h0112nr | |
| Lenovo Legion 5 Pro 16IAH7H | |
| Moyenne AMD Ryzen 9 6900HX (241 - 261, n=19) | |
| Lenovo ThinkBook 16p G3 ARH | |
| Lenovo ThinkBook 16p G2 ACH | |
| Lenovo Legion 5 Pro 16 ARH7H-82RG0047GE | |
| Asus ROG Zephyrus G14 GA402RJ | |
| Lenovo IdeaPad 5 Pro 16ACH | |
| Acer Swift X SFX16-51G-5388 | |
| Aorus 15P XC | |
| Blender / v2.79 BMW27 CPU | |
| Acer Swift X SFX16-51G-5388 | |
| Aorus 15P XC | |
| Lenovo Legion 5 Pro 16 ARH7H-82RG0047GE | |
| Lenovo IdeaPad 5 Pro 16ACH | |
| Asus ROG Zephyrus G14 GA402RJ | |
| HP Envy 16 h0112nr | |
| Lenovo ThinkBook 16p G3 ARH | |
| Moyenne AMD Ryzen 9 6900HX (212 - 357, n=21) | |
| Lenovo ThinkBook 16p G2 ACH | |
| Razer Blade 15 2022 | |
| Lenovo Legion 5 Pro 16IAH7H | |
| 7-Zip 18.03 / 7z b 4 | |
| Lenovo Legion 5 Pro 16IAH7H | |
| Razer Blade 15 2022 | |
| Moyenne AMD Ryzen 9 6900HX (49526 - 65336, n=20) | |
| Lenovo ThinkBook 16p G2 ACH | |
| Asus ROG Zephyrus G14 GA402RJ | |
| Lenovo ThinkBook 16p G3 ARH | |
| HP Envy 16 h0112nr | |
| Lenovo IdeaPad 5 Pro 16ACH | |
| Lenovo Legion 5 Pro 16 ARH7H-82RG0047GE | |
| Aorus 15P XC | |
| Acer Swift X SFX16-51G-5388 | |
| 7-Zip 18.03 / 7z b 4 -mmt1 | |
| Moyenne AMD Ryzen 9 6900HX (5090 - 6070, n=20) | |
| Lenovo ThinkBook 16p G2 ACH | |
| Razer Blade 15 2022 | |
| HP Envy 16 h0112nr | |
| Lenovo Legion 5 Pro 16 ARH7H-82RG0047GE | |
| Asus ROG Zephyrus G14 GA402RJ | |
| Lenovo Legion 5 Pro 16IAH7H | |
| Lenovo IdeaPad 5 Pro 16ACH | |
| Aorus 15P XC | |
| Lenovo ThinkBook 16p G3 ARH | |
| Acer Swift X SFX16-51G-5388 | |
| Geekbench 5.5 / Multi-Core | |
| Lenovo Legion 5 Pro 16IAH7H | |
| HP Envy 16 h0112nr | |
| Razer Blade 15 2022 | |
| Moyenne AMD Ryzen 9 6900HX (8313 - 10490, n=21) | |
| Lenovo ThinkBook 16p G3 ARH | |
| Asus ROG Zephyrus G14 GA402RJ | |
| Lenovo ThinkBook 16p G2 ACH | |
| Aorus 15P XC | |
| Lenovo Legion 5 Pro 16 ARH7H-82RG0047GE | |
| Lenovo IdeaPad 5 Pro 16ACH | |
| Acer Swift X SFX16-51G-5388 | |
| Geekbench 5.5 / Single-Core | |
| HP Envy 16 h0112nr | |
| Razer Blade 15 2022 | |
| Lenovo Legion 5 Pro 16IAH7H | |
| Moyenne AMD Ryzen 9 6900HX (1523 - 1652, n=21) | |
| Lenovo ThinkBook 16p G3 ARH | |
| Lenovo ThinkBook 16p G2 ACH | |
| Acer Swift X SFX16-51G-5388 | |
| Asus ROG Zephyrus G14 GA402RJ | |
| Lenovo Legion 5 Pro 16 ARH7H-82RG0047GE | |
| Lenovo IdeaPad 5 Pro 16ACH | |
| Aorus 15P XC | |
| HWBOT x265 Benchmark v2.2 / 4k Preset | |
| Lenovo Legion 5 Pro 16IAH7H | |
| Razer Blade 15 2022 | |
| Lenovo ThinkBook 16p G3 ARH | |
| Moyenne AMD Ryzen 9 6900HX (12.6 - 18.7, n=20) | |
| Lenovo ThinkBook 16p G2 ACH | |
| Asus ROG Zephyrus G14 GA402RJ | |
| HP Envy 16 h0112nr | |
| Lenovo Legion 5 Pro 16 ARH7H-82RG0047GE | |
| Lenovo IdeaPad 5 Pro 16ACH | |
| Aorus 15P XC | |
| Acer Swift X SFX16-51G-5388 | |
| LibreOffice / 20 Documents To PDF | |
| Lenovo Legion 5 Pro 16 ARH7H-82RG0047GE | |
| Lenovo ThinkBook 16p G3 ARH | |
| Asus ROG Zephyrus G14 GA402RJ | |
| Lenovo ThinkBook 16p G2 ACH | |
| Aorus 15P XC | |
| Moyenne AMD Ryzen 9 6900HX (44.8 - 81.7, n=20) | |
| Razer Blade 15 2022 | |
| Acer Swift X SFX16-51G-5388 | |
| Lenovo IdeaPad 5 Pro 16ACH | |
| HP Envy 16 h0112nr | |
| Lenovo Legion 5 Pro 16IAH7H | |
| R Benchmark 2.5 / Overall mean | |
| Acer Swift X SFX16-51G-5388 | |
| Aorus 15P XC | |
| Lenovo IdeaPad 5 Pro 16ACH | |
| Asus ROG Zephyrus G14 GA402RJ | |
| Lenovo Legion 5 Pro 16 ARH7H-82RG0047GE | |
| Lenovo ThinkBook 16p G2 ACH | |
| Lenovo ThinkBook 16p G3 ARH | |
| Moyenne AMD Ryzen 9 6900HX (0.4627 - 0.4974, n=20) | |
| Lenovo Legion 5 Pro 16IAH7H | |
| Razer Blade 15 2022 | |
| HP Envy 16 h0112nr | |
* ... Moindre est la valeur, meilleures sont les performances
AIDA64: FP32 Ray-Trace | FPU Julia | CPU SHA3 | CPU Queen | FPU SinJulia | FPU Mandel | CPU AES | CPU ZLib | FP64 Ray-Trace | CPU PhotoWorxx
| Performance rating | |
| Moyenne AMD Ryzen 9 6900HX | |
| Lenovo ThinkBook 16p G2 ACH | |
| Lenovo ThinkBook 16p G3 ARH | |
| Lenovo Legion 5 Pro 16IAH7H | |
| HP Envy 16 h0112nr | |
| Lenovo IdeaPad 5 Pro 16ARH7 | |
| Acer Swift X SFX16-51G-5388 | |
| AIDA64 / FP32 Ray-Trace | |
| Lenovo ThinkBook 16p G3 ARH | |
| Lenovo ThinkBook 16p G2 ACH | |
| Moyenne AMD Ryzen 9 6900HX (10950 - 17963, n=20) | |
| Lenovo Legion 5 Pro 16IAH7H | |
| Lenovo Legion 5 Pro 16IAH7H | |
| HP Envy 16 h0112nr | |
| Lenovo IdeaPad 5 Pro 16ARH7 | |
| Acer Swift X SFX16-51G-5388 | |
| AIDA64 / CPU Queen | |
| Lenovo ThinkBook 16p G3 ARH | |
| Lenovo ThinkBook 16p G2 ACH | |
| HP Envy 16 h0112nr | |
| Moyenne AMD Ryzen 9 6900HX (84185 - 107544, n=20) | |
| Lenovo Legion 5 Pro 16IAH7H | |
| Lenovo IdeaPad 5 Pro 16ARH7 | |
| Acer Swift X SFX16-51G-5388 | |
| AIDA64 / FPU SinJulia | |
| Lenovo ThinkBook 16p G3 ARH | |
| Moyenne AMD Ryzen 9 6900HX (10970 - 13205, n=20) | |
| Lenovo ThinkBook 16p G2 ACH | |
| Lenovo Legion 5 Pro 16IAH7H | |
| Lenovo Legion 5 Pro 16IAH7H | |
| Lenovo IdeaPad 5 Pro 16ARH7 | |
| HP Envy 16 h0112nr | |
| Acer Swift X SFX16-51G-5388 | |
| AIDA64 / FP64 Ray-Trace | |
| Lenovo ThinkBook 16p G3 ARH | |
| Lenovo ThinkBook 16p G2 ACH | |
| Moyenne AMD Ryzen 9 6900HX (5798 - 9540, n=20) | |
| Lenovo Legion 5 Pro 16IAH7H | |
| Lenovo Legion 5 Pro 16IAH7H | |
| HP Envy 16 h0112nr | |
| Lenovo IdeaPad 5 Pro 16ARH7 | |
| Acer Swift X SFX16-51G-5388 | |
| AIDA64 / CPU PhotoWorxx | |
| HP Envy 16 h0112nr | |
| Acer Swift X SFX16-51G-5388 | |
| Lenovo Legion 5 Pro 16IAH7H | |
| Lenovo Legion 5 Pro 16IAH7H | |
| Moyenne AMD Ryzen 9 6900HX (26873 - 30604, n=20) | |
| Lenovo IdeaPad 5 Pro 16ARH7 | |
| Lenovo ThinkBook 16p G3 ARH | |
| Lenovo ThinkBook 16p G2 ACH | |
Performance du système
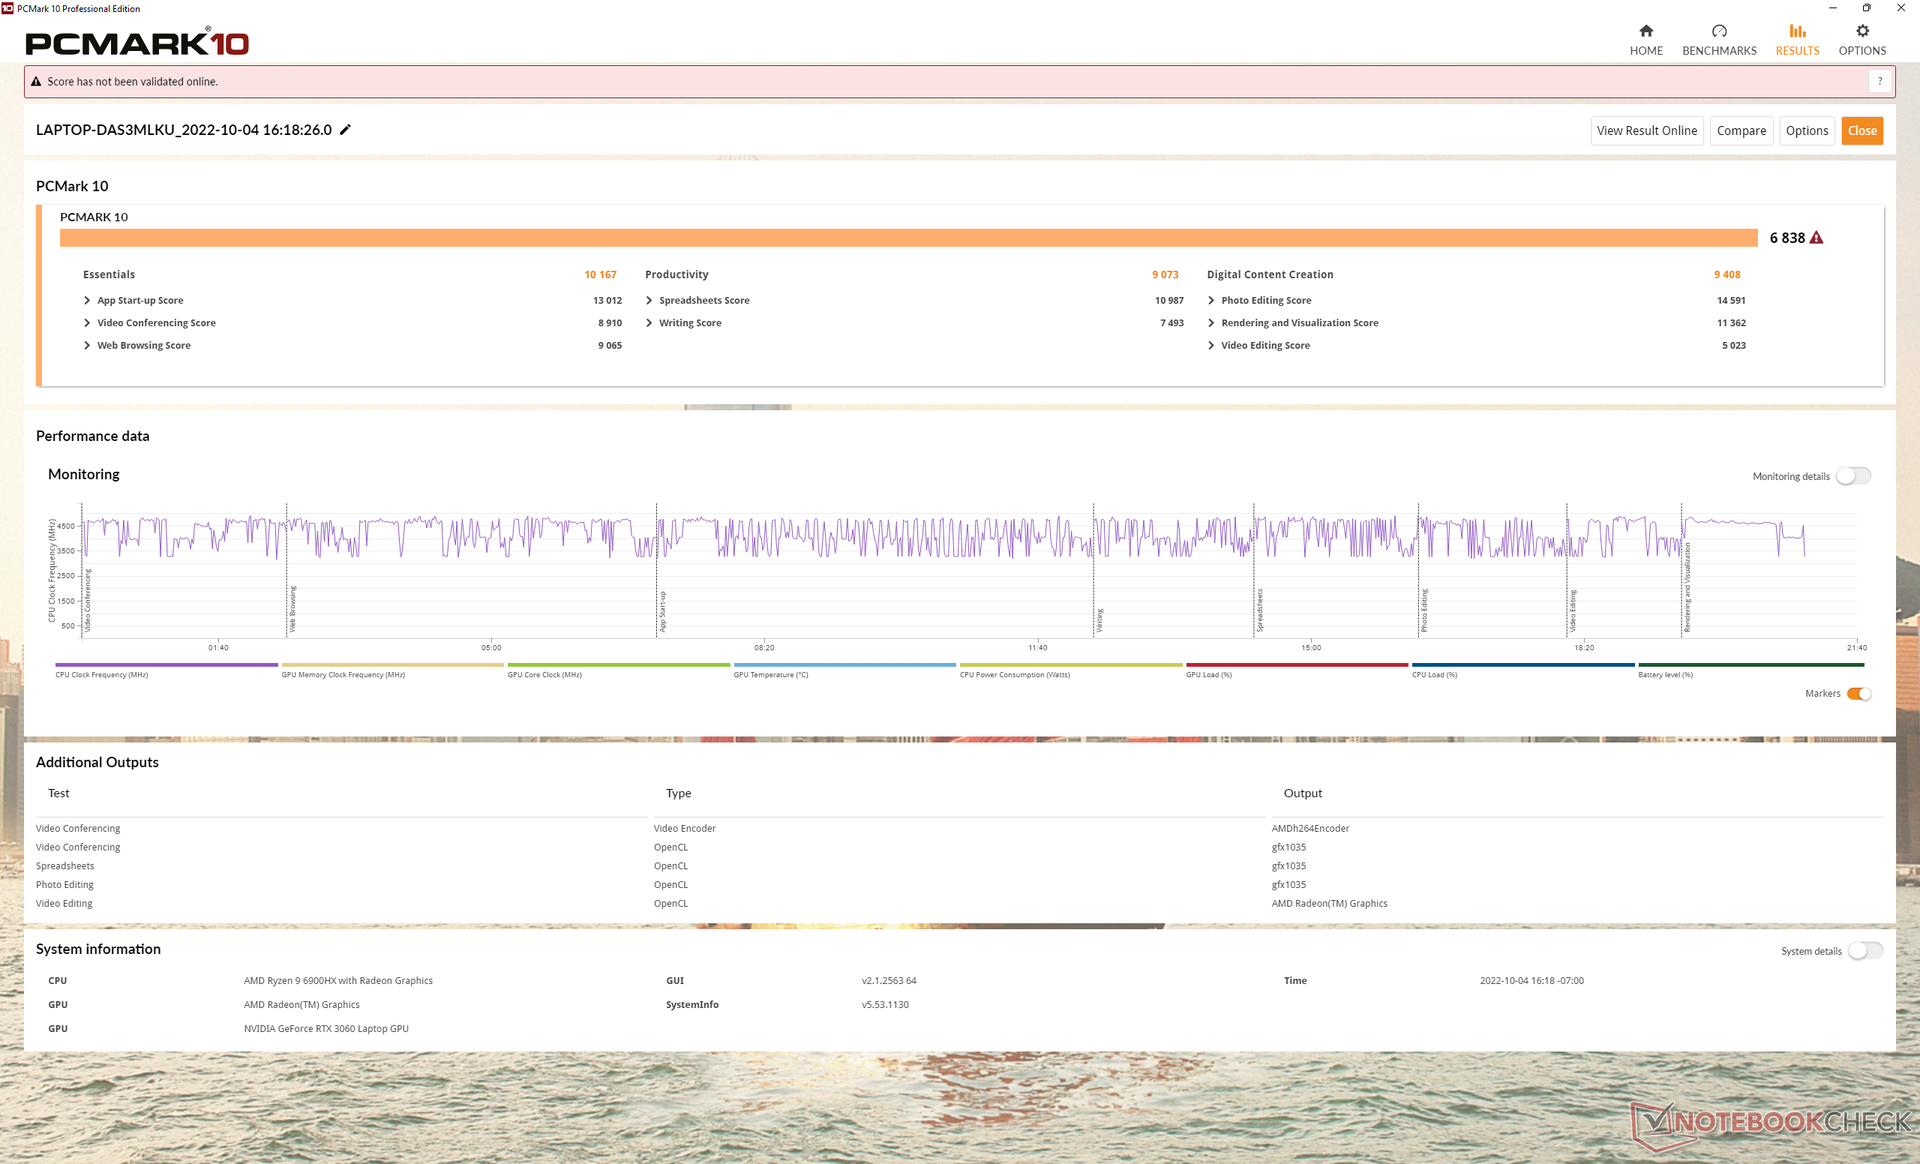
Les résultats de PCMark sont presque identiques à ceux du ThinkBook 16p Gen 2, car les performances du CPU sont à peine meilleures, comme mentionné ci-dessus.
CrossMark: Overall | Productivity | Creativity | Responsiveness
| PCMark 10 / Score | |
| HP Envy 16 h0112nr | |
| Lenovo Legion 5 Pro 16IAH7H | |
| Lenovo ThinkBook 16p G3 ARH | |
| Moyenne AMD Ryzen 9 6900HX, NVIDIA GeForce RTX 3060 Laptop GPU (n=1) | |
| Lenovo ThinkBook 16p G2 ACH | |
| Lenovo IdeaPad 5 Pro 16ARH7 | |
| Acer Swift X SFX16-51G-5388 | |
| PCMark 10 / Essentials | |
| HP Envy 16 h0112nr | |
| Lenovo Legion 5 Pro 16IAH7H | |
| Lenovo ThinkBook 16p G2 ACH | |
| Lenovo ThinkBook 16p G3 ARH | |
| Moyenne AMD Ryzen 9 6900HX, NVIDIA GeForce RTX 3060 Laptop GPU (n=1) | |
| Lenovo IdeaPad 5 Pro 16ARH7 | |
| Acer Swift X SFX16-51G-5388 | |
| PCMark 10 / Productivity | |
| Lenovo Legion 5 Pro 16IAH7H | |
| HP Envy 16 h0112nr | |
| Lenovo ThinkBook 16p G2 ACH | |
| Lenovo ThinkBook 16p G3 ARH | |
| Moyenne AMD Ryzen 9 6900HX, NVIDIA GeForce RTX 3060 Laptop GPU (n=1) | |
| Lenovo IdeaPad 5 Pro 16ARH7 | |
| Acer Swift X SFX16-51G-5388 | |
| PCMark 10 / Digital Content Creation | |
| Lenovo Legion 5 Pro 16IAH7H | |
| HP Envy 16 h0112nr | |
| Lenovo ThinkBook 16p G3 ARH | |
| Moyenne AMD Ryzen 9 6900HX, NVIDIA GeForce RTX 3060 Laptop GPU (n=1) | |
| Lenovo ThinkBook 16p G2 ACH | |
| Acer Swift X SFX16-51G-5388 | |
| Lenovo IdeaPad 5 Pro 16ARH7 | |
| CrossMark / Overall | |
| HP Envy 16 h0112nr | |
| Lenovo Legion 5 Pro 16IAH7H | |
| Lenovo ThinkBook 16p G3 ARH | |
| Moyenne AMD Ryzen 9 6900HX, NVIDIA GeForce RTX 3060 Laptop GPU (n=1) | |
| Acer Swift X SFX16-51G-5388 | |
| CrossMark / Productivity | |
| HP Envy 16 h0112nr | |
| Lenovo Legion 5 Pro 16IAH7H | |
| Lenovo ThinkBook 16p G3 ARH | |
| Moyenne AMD Ryzen 9 6900HX, NVIDIA GeForce RTX 3060 Laptop GPU (n=1) | |
| Acer Swift X SFX16-51G-5388 | |
| CrossMark / Creativity | |
| HP Envy 16 h0112nr | |
| Lenovo Legion 5 Pro 16IAH7H | |
| Lenovo ThinkBook 16p G3 ARH | |
| Moyenne AMD Ryzen 9 6900HX, NVIDIA GeForce RTX 3060 Laptop GPU (n=1) | |
| Acer Swift X SFX16-51G-5388 | |
| CrossMark / Responsiveness | |
| Lenovo Legion 5 Pro 16IAH7H | |
| HP Envy 16 h0112nr | |
| Lenovo ThinkBook 16p G3 ARH | |
| Moyenne AMD Ryzen 9 6900HX, NVIDIA GeForce RTX 3060 Laptop GPU (n=1) | |
| Acer Swift X SFX16-51G-5388 | |
| PCMark 10 Score | 6838 points | |
Aide | ||
| AIDA64 / Memory Copy | |
| HP Envy 16 h0112nr | |
| Acer Swift X SFX16-51G-5388 | |
| Lenovo Legion 5 Pro 16IAH7H | |
| Lenovo Legion 5 Pro 16IAH7H | |
| Lenovo IdeaPad 5 Pro 16ARH7 | |
| Moyenne AMD Ryzen 9 6900HX (47938 - 53345, n=20) | |
| Lenovo ThinkBook 16p G3 ARH | |
| Lenovo ThinkBook 16p G2 ACH | |
| AIDA64 / Memory Read | |
| HP Envy 16 h0112nr | |
| Lenovo Legion 5 Pro 16IAH7H | |
| Lenovo Legion 5 Pro 16IAH7H | |
| Acer Swift X SFX16-51G-5388 | |
| Moyenne AMD Ryzen 9 6900HX (43892 - 53321, n=20) | |
| Lenovo ThinkBook 16p G2 ACH | |
| Lenovo IdeaPad 5 Pro 16ARH7 | |
| Lenovo ThinkBook 16p G3 ARH | |
| AIDA64 / Memory Write | |
| Lenovo IdeaPad 5 Pro 16ARH7 | |
| Acer Swift X SFX16-51G-5388 | |
| Lenovo Legion 5 Pro 16IAH7H | |
| Lenovo Legion 5 Pro 16IAH7H | |
| HP Envy 16 h0112nr | |
| Moyenne AMD Ryzen 9 6900HX (51085 - 57202, n=20) | |
| Lenovo ThinkBook 16p G3 ARH | |
| Lenovo ThinkBook 16p G2 ACH | |
| AIDA64 / Memory Latency | |
| Lenovo ThinkBook 16p G3 ARH | |
| Lenovo IdeaPad 5 Pro 16ARH7 | |
| Lenovo Legion 5 Pro 16IAH7H | |
| Lenovo Legion 5 Pro 16IAH7H | |
| Acer Swift X SFX16-51G-5388 | |
| HP Envy 16 h0112nr | |
| Moyenne AMD Ryzen 9 6900HX (80.7 - 120.6, n=20) | |
| Lenovo ThinkBook 16p G2 ACH | |
* ... Moindre est la valeur, meilleures sont les performances
Latence DPC
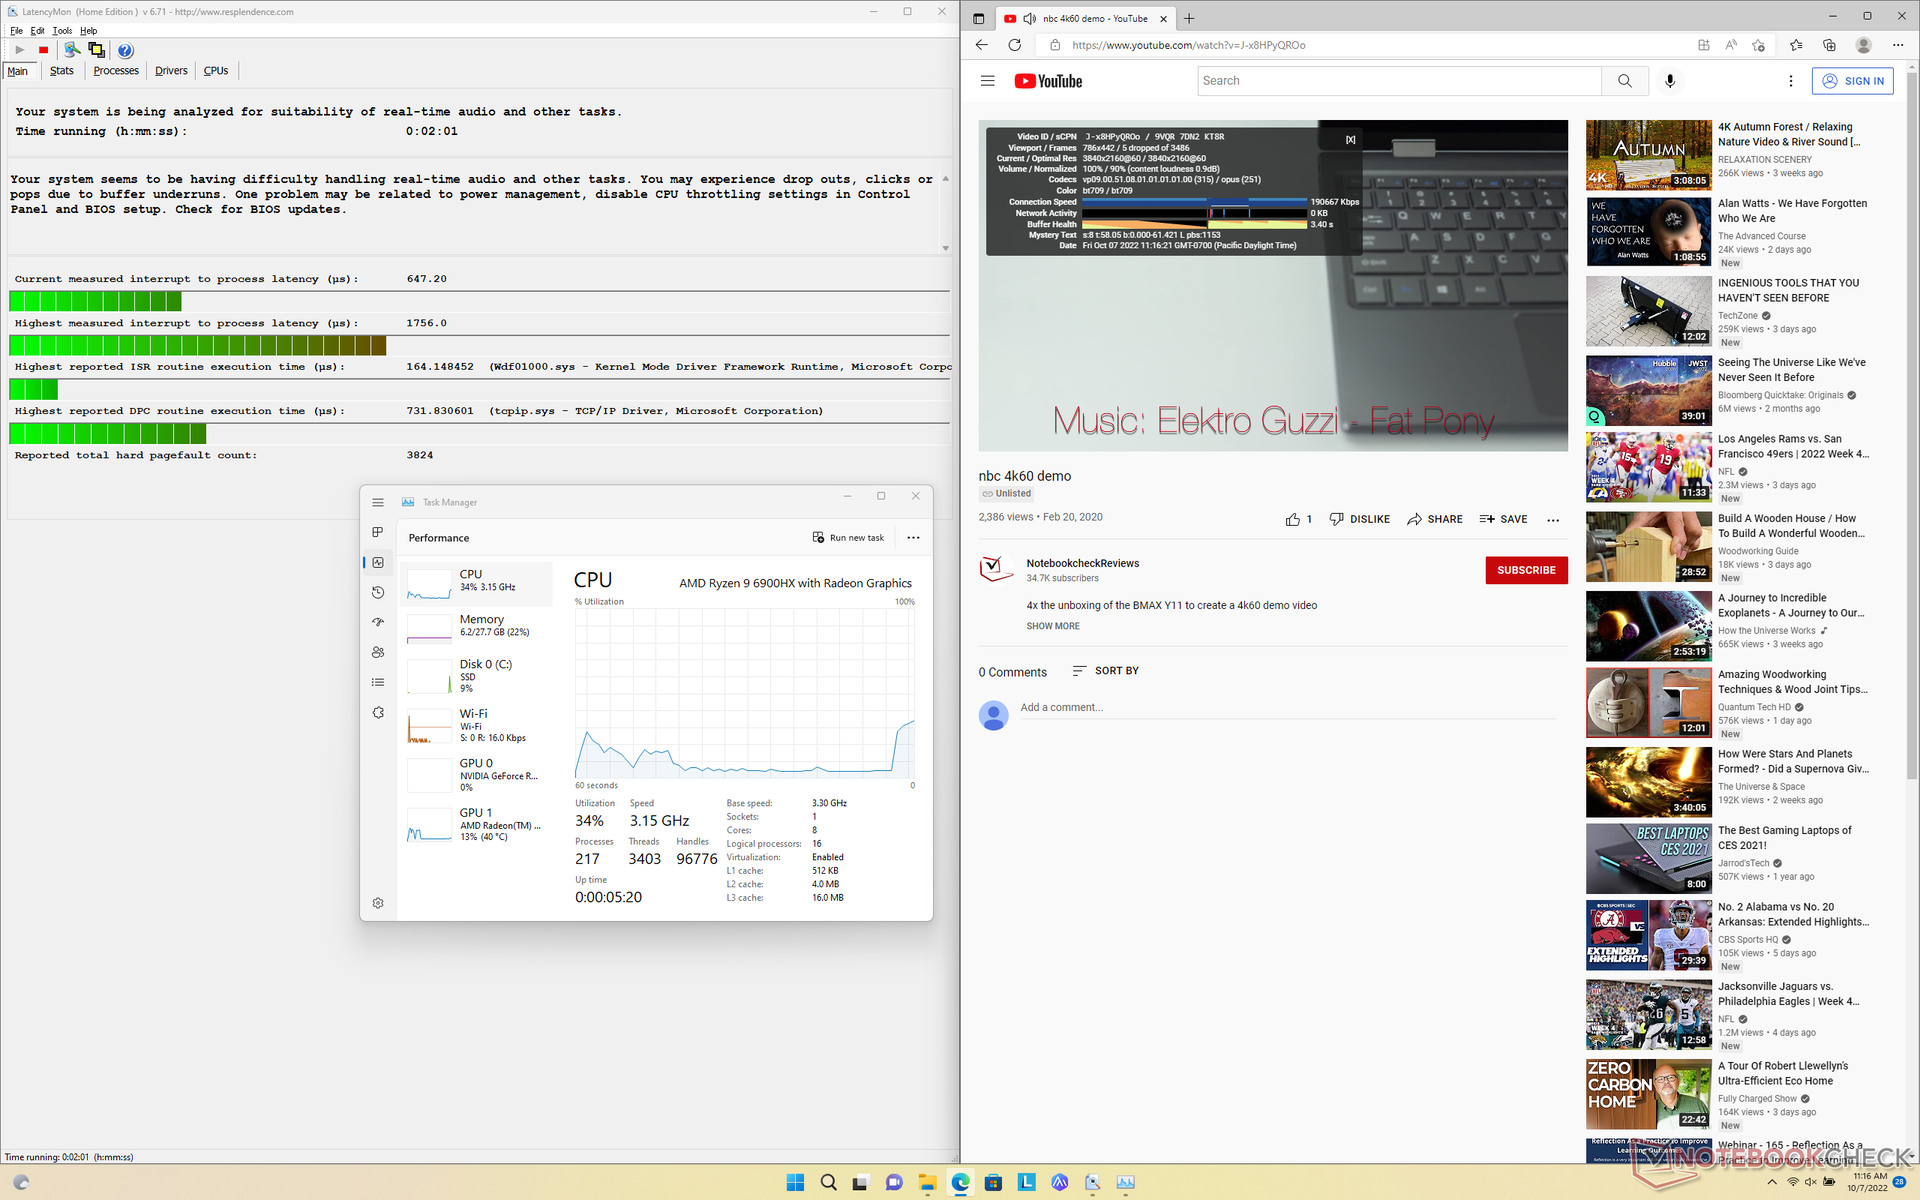
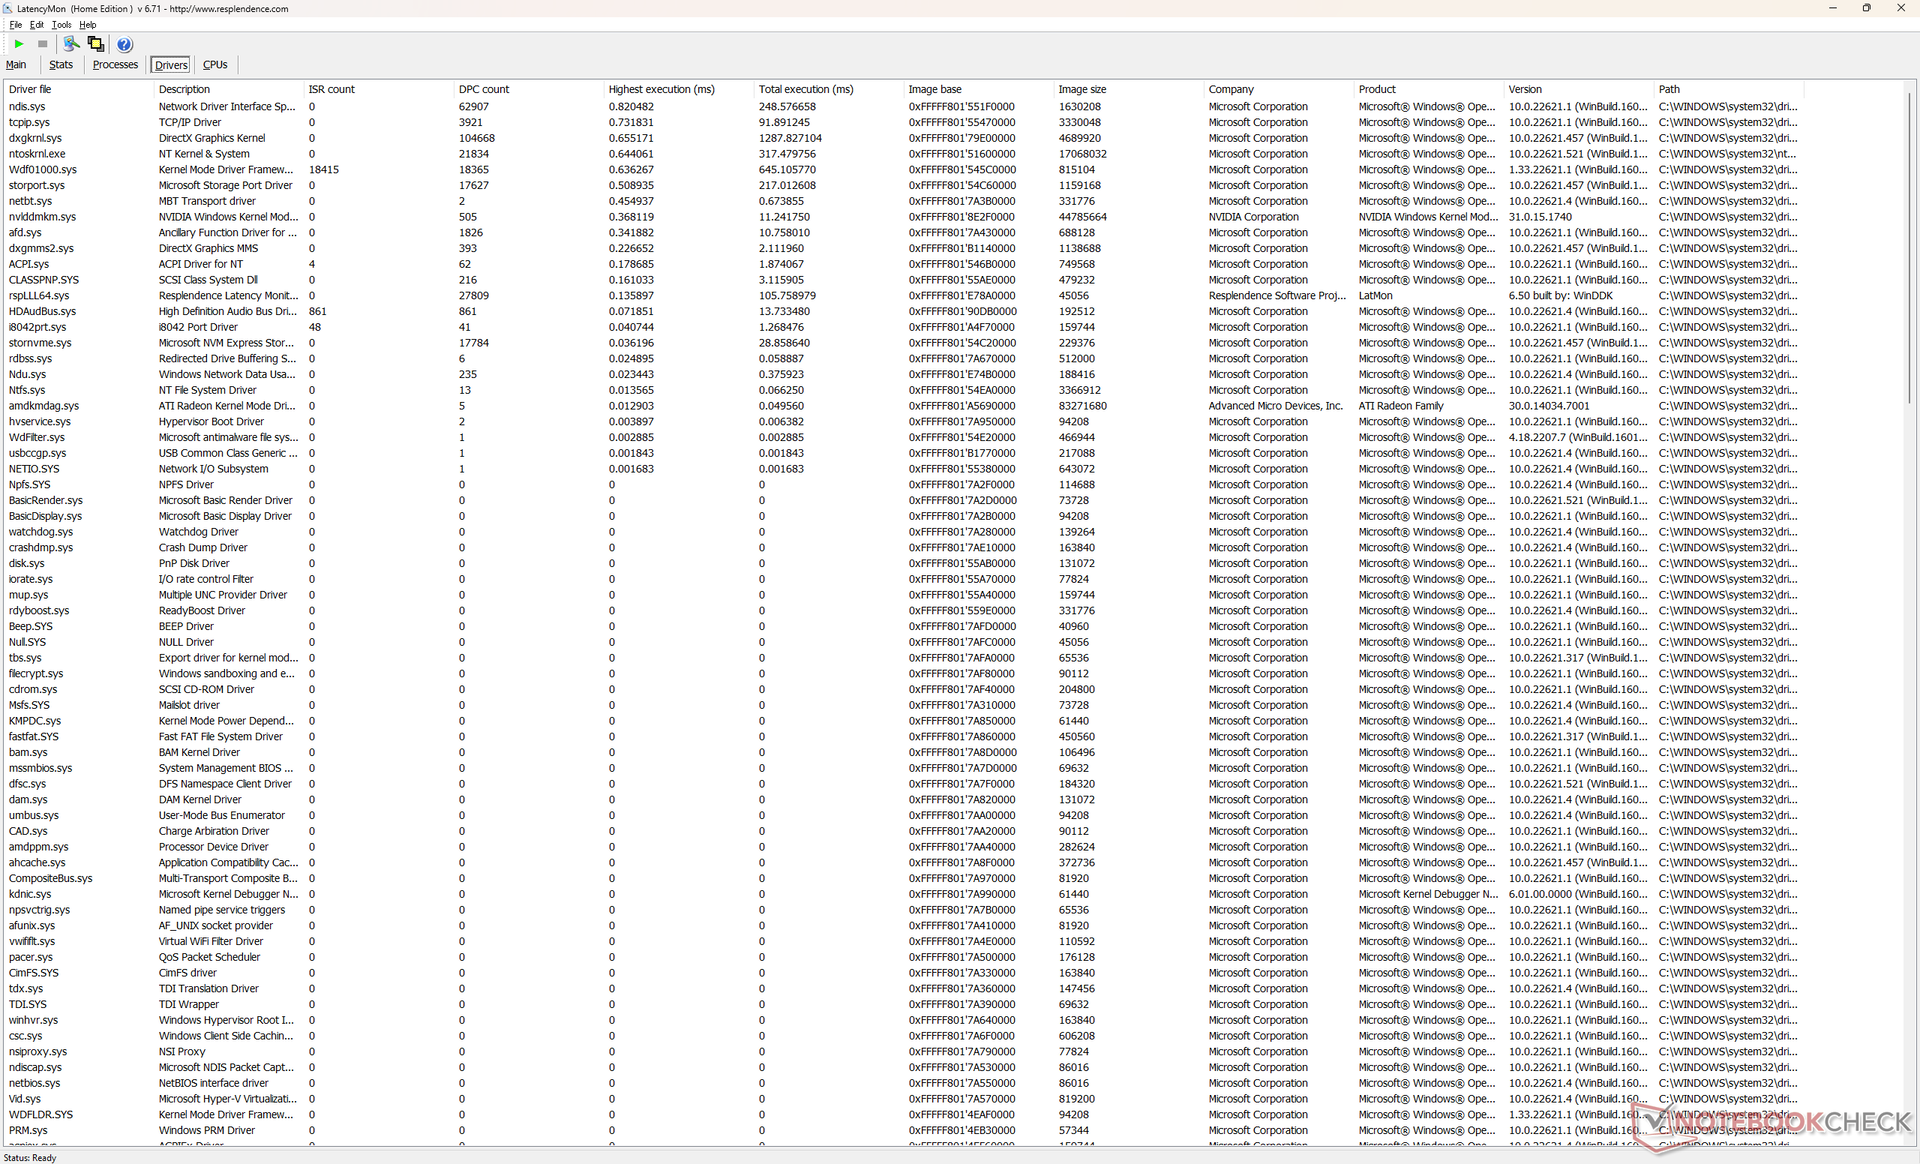
LatencyMon révèle de légers problèmes de CPD lors de l'ouverture de plusieurs onglets de navigateur de notre page d'accueil. la lecture de vidéos 4K à 60 FPS est également imparfaite avec 5 images perdues pendant notre vidéo de test d'une minute.
| DPC Latencies / LatencyMon - interrupt to process latency (max), Web, Youtube, Prime95 | |
| Acer Swift X SFX16-51G-5388 | |
| Lenovo ThinkBook 16p G3 ARH | |
| HP Envy 16 h0112nr | |
| Lenovo IdeaPad 5 Pro 16ARH7 | |
| Lenovo Legion 5 Pro 16IAH7H | |
| Lenovo ThinkBook 16p G2 ACH | |
* ... Moindre est la valeur, meilleures sont les performances
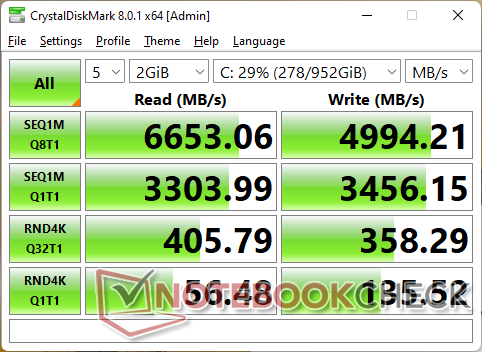
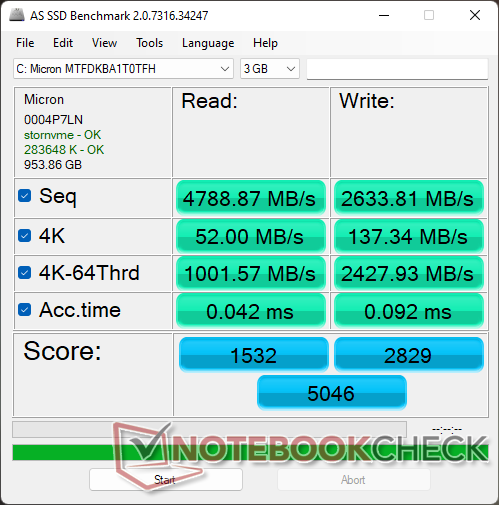
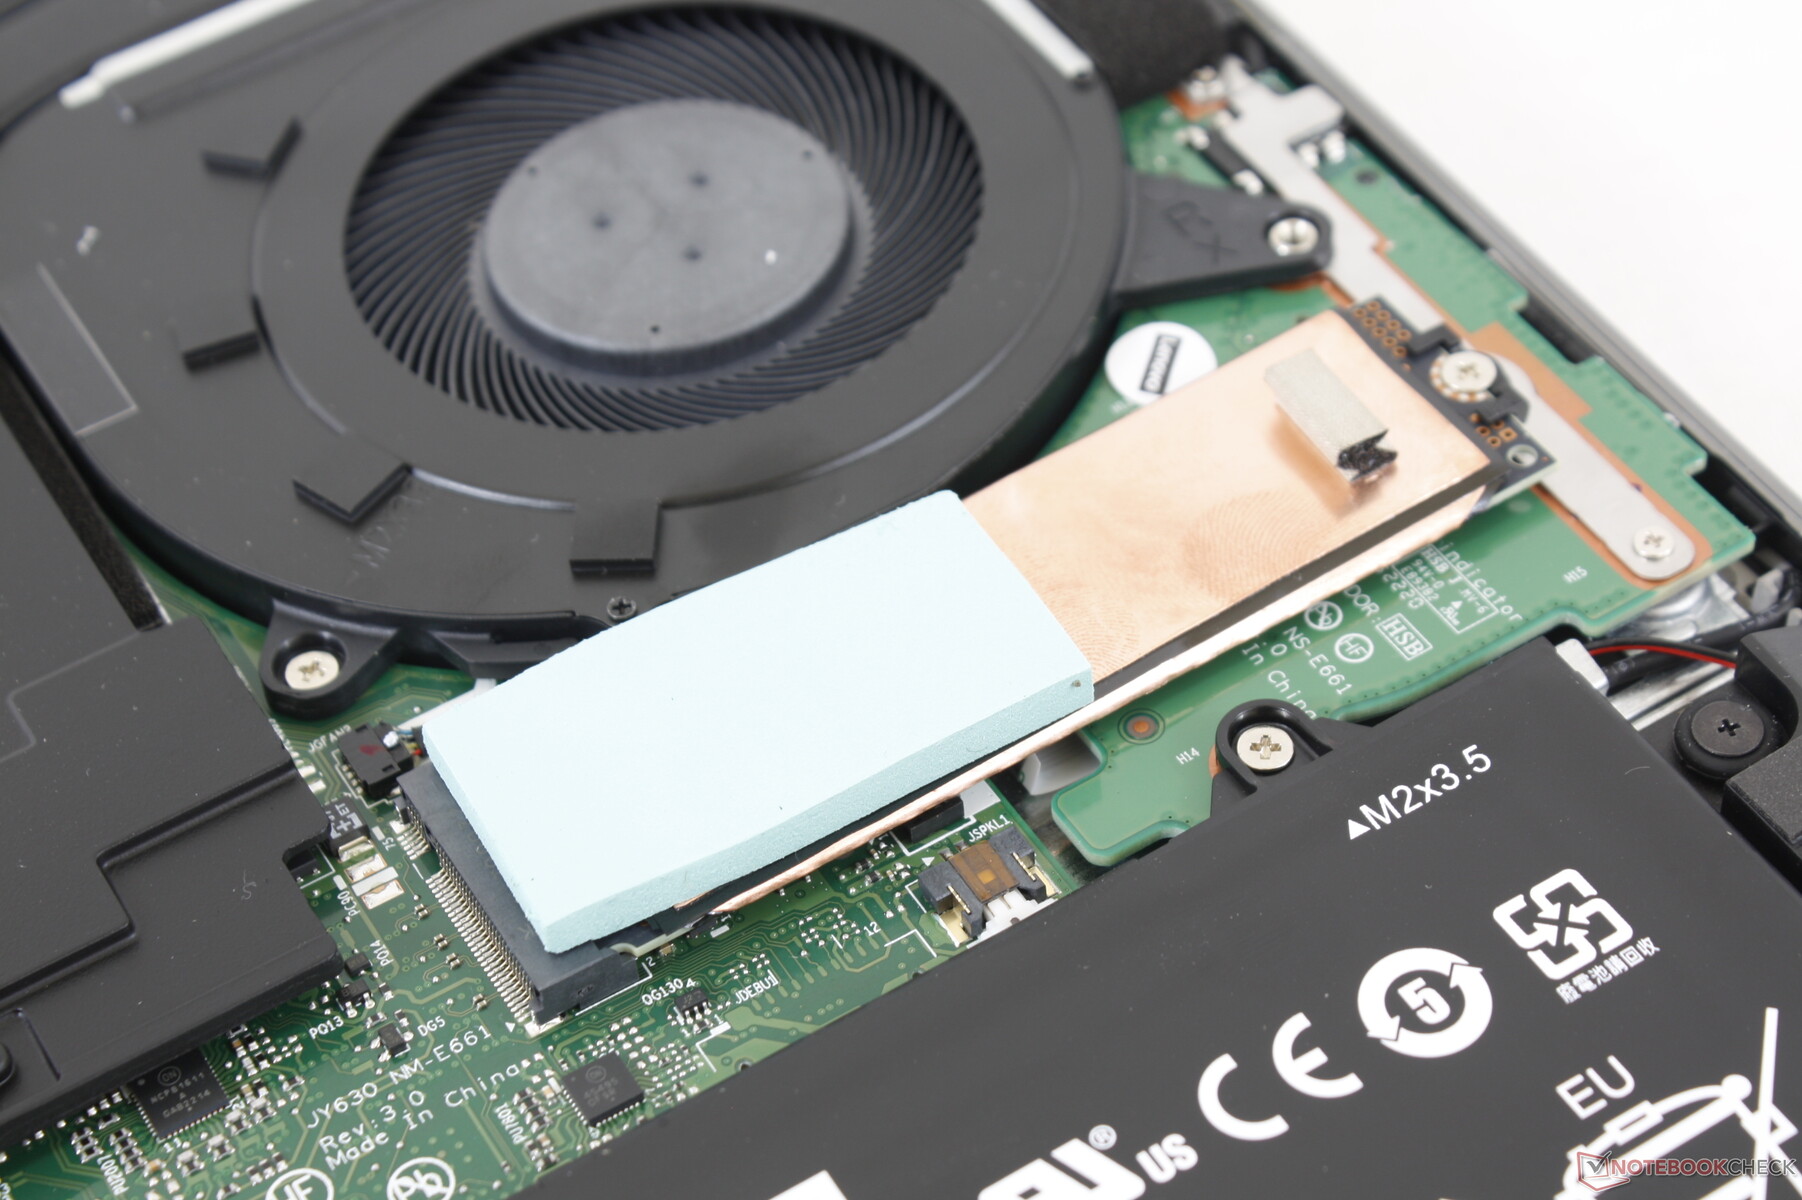
Périphériques de stockage
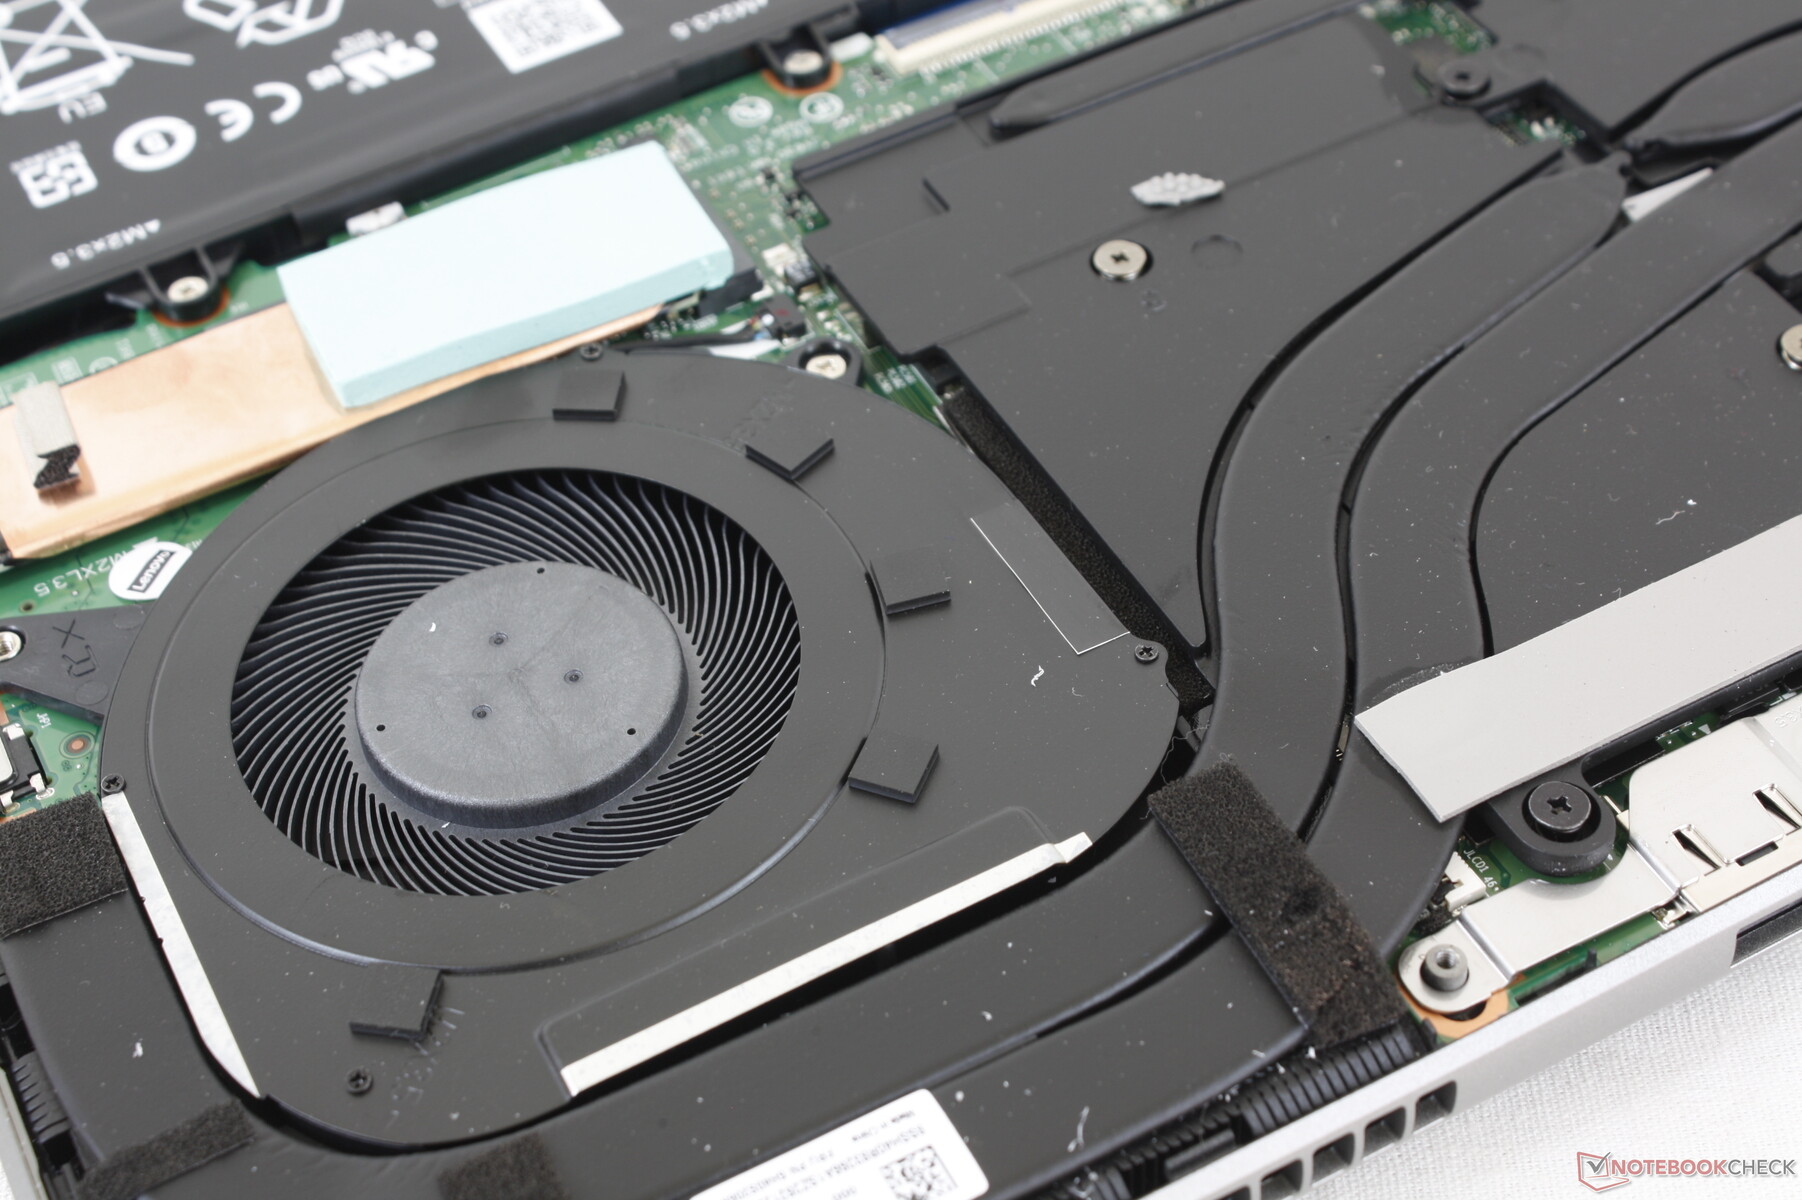
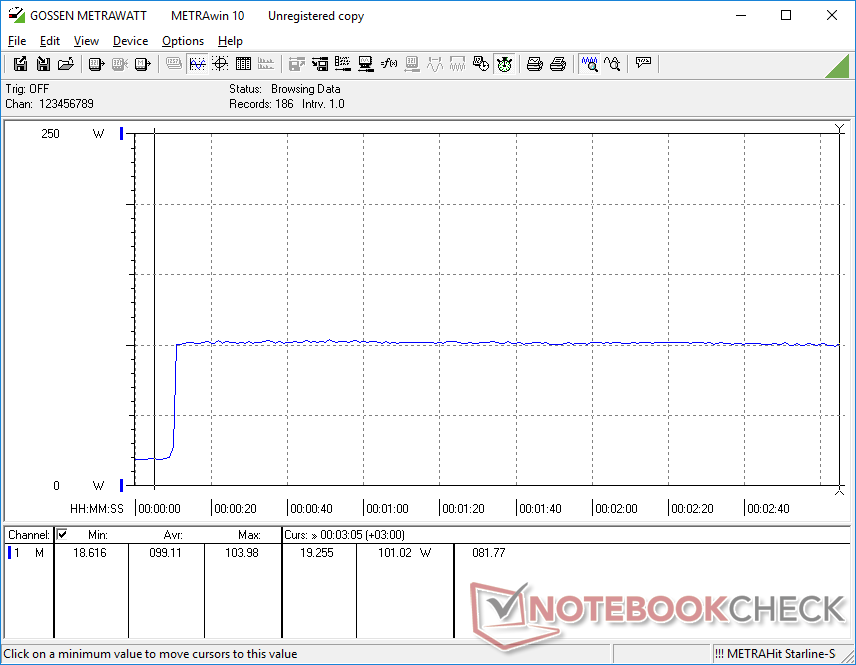
Le SSD PCIe4 x4 inclus est livré avec son propre dissipateur de chaleur et son tampon thermique pour faciliter la dissipation de la chaleur. Notre disque ne présentait aucun problème d'accélération lors de l'exécution de DiskSpd en boucle, comme le montre le graphique ci-dessous.

| Drive Performance rating - Percent | |
| Lenovo Legion 5 Pro 16IAH7H | |
| Lenovo ThinkBook 16p G2 ACH | |
| HP Envy 16 h0112nr | |
| Lenovo ThinkBook 16p G3 ARH | |
| Lenovo IdeaPad 5 Pro 16ARH7 | |
| Acer Swift X SFX16-51G-5388 | |
* ... Moindre est la valeur, meilleures sont les performances
Disk Throttling: DiskSpd Read Loop, Queue Depth 8
Performances du GPU
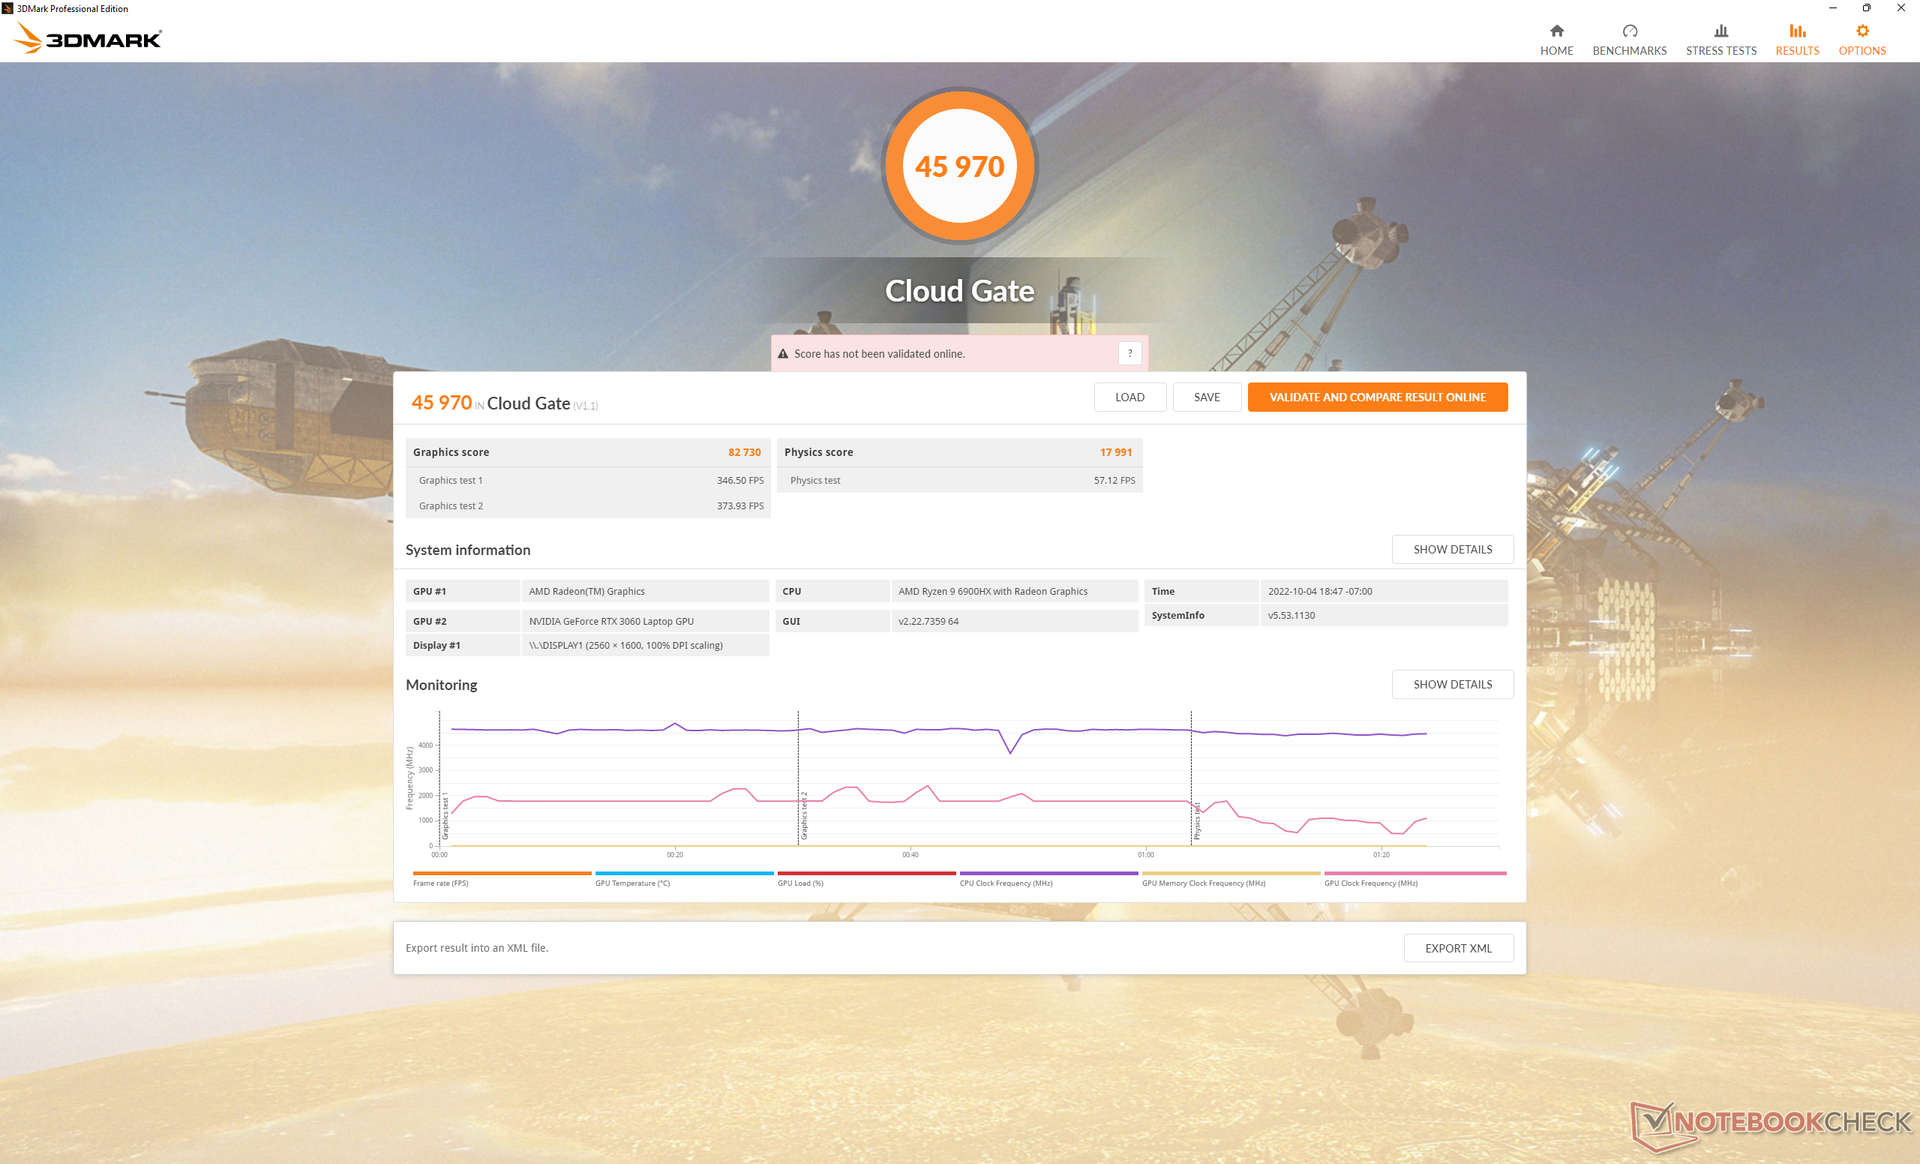
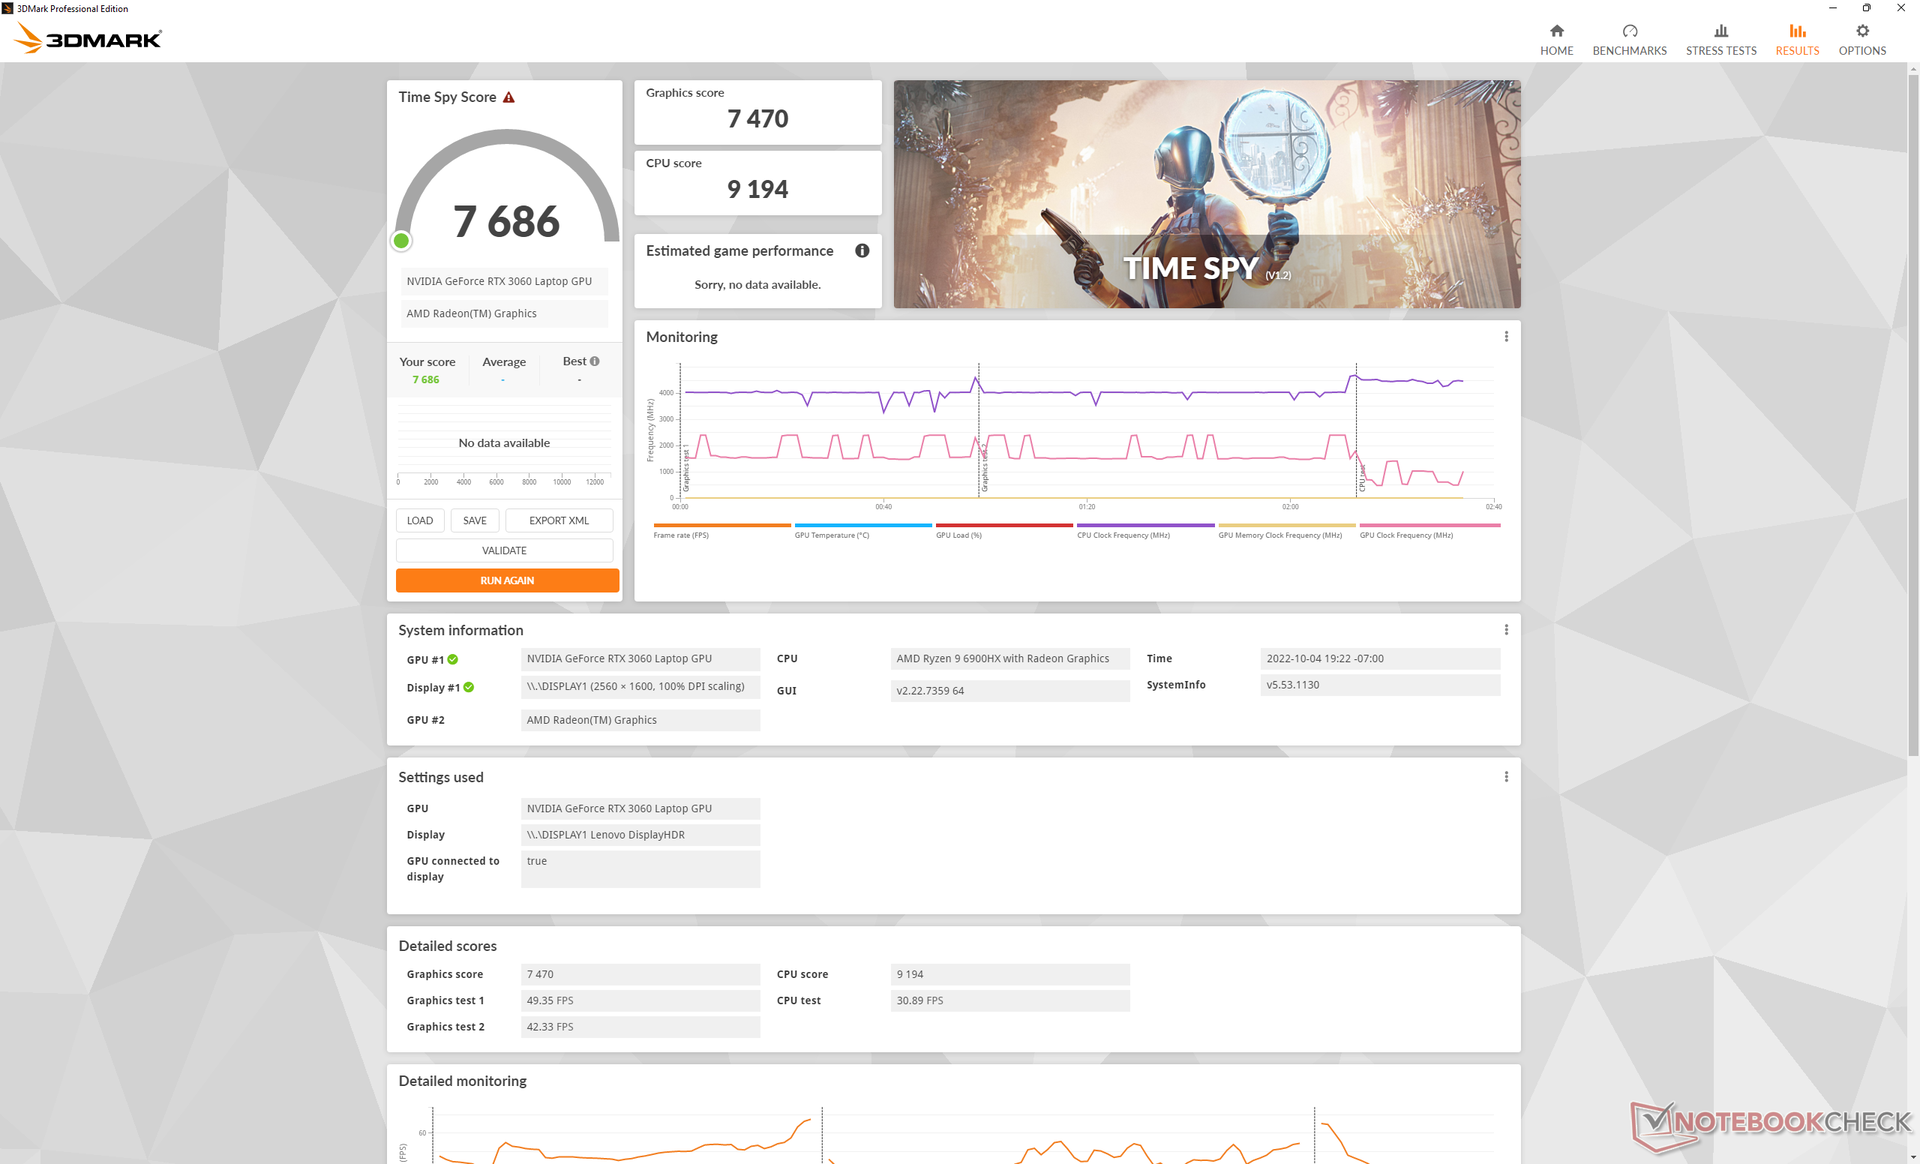
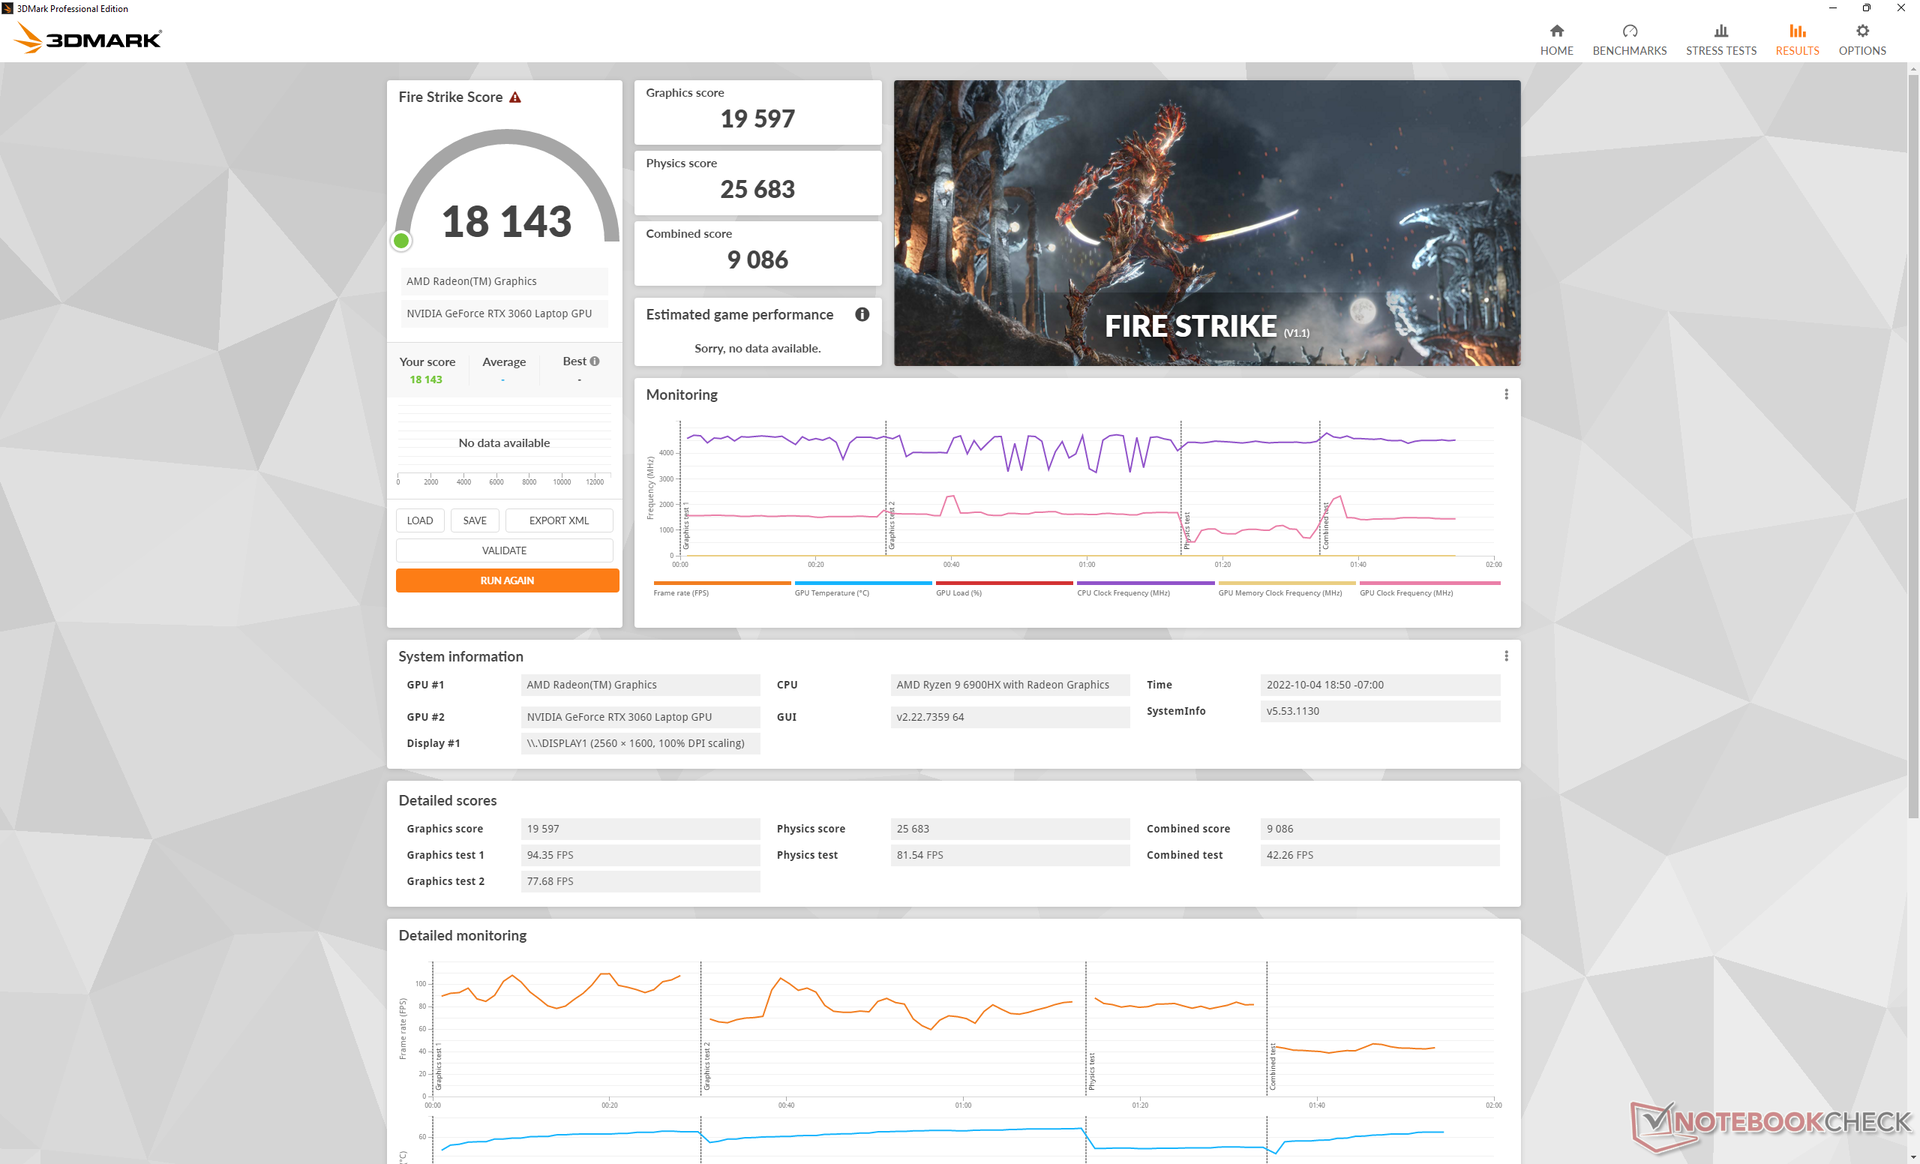
Lenovo a augmenté le nombre de GeForce RTX 3060 TGP de 75 W sur le ThinkBook 16p Gen 2 à 90 W sur le ThinkBook 16p Gen 3. Malgré cela, les performances ne sont qu'environ 10 % plus rapides, au mieux.
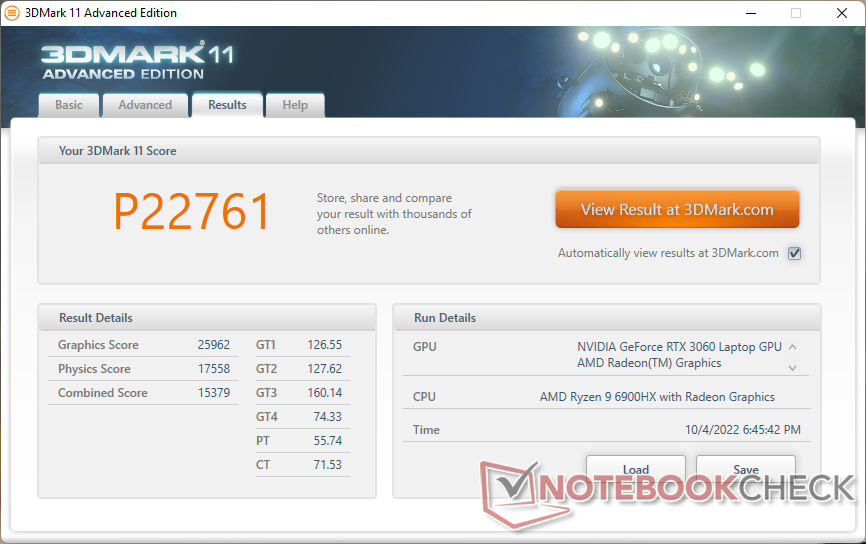
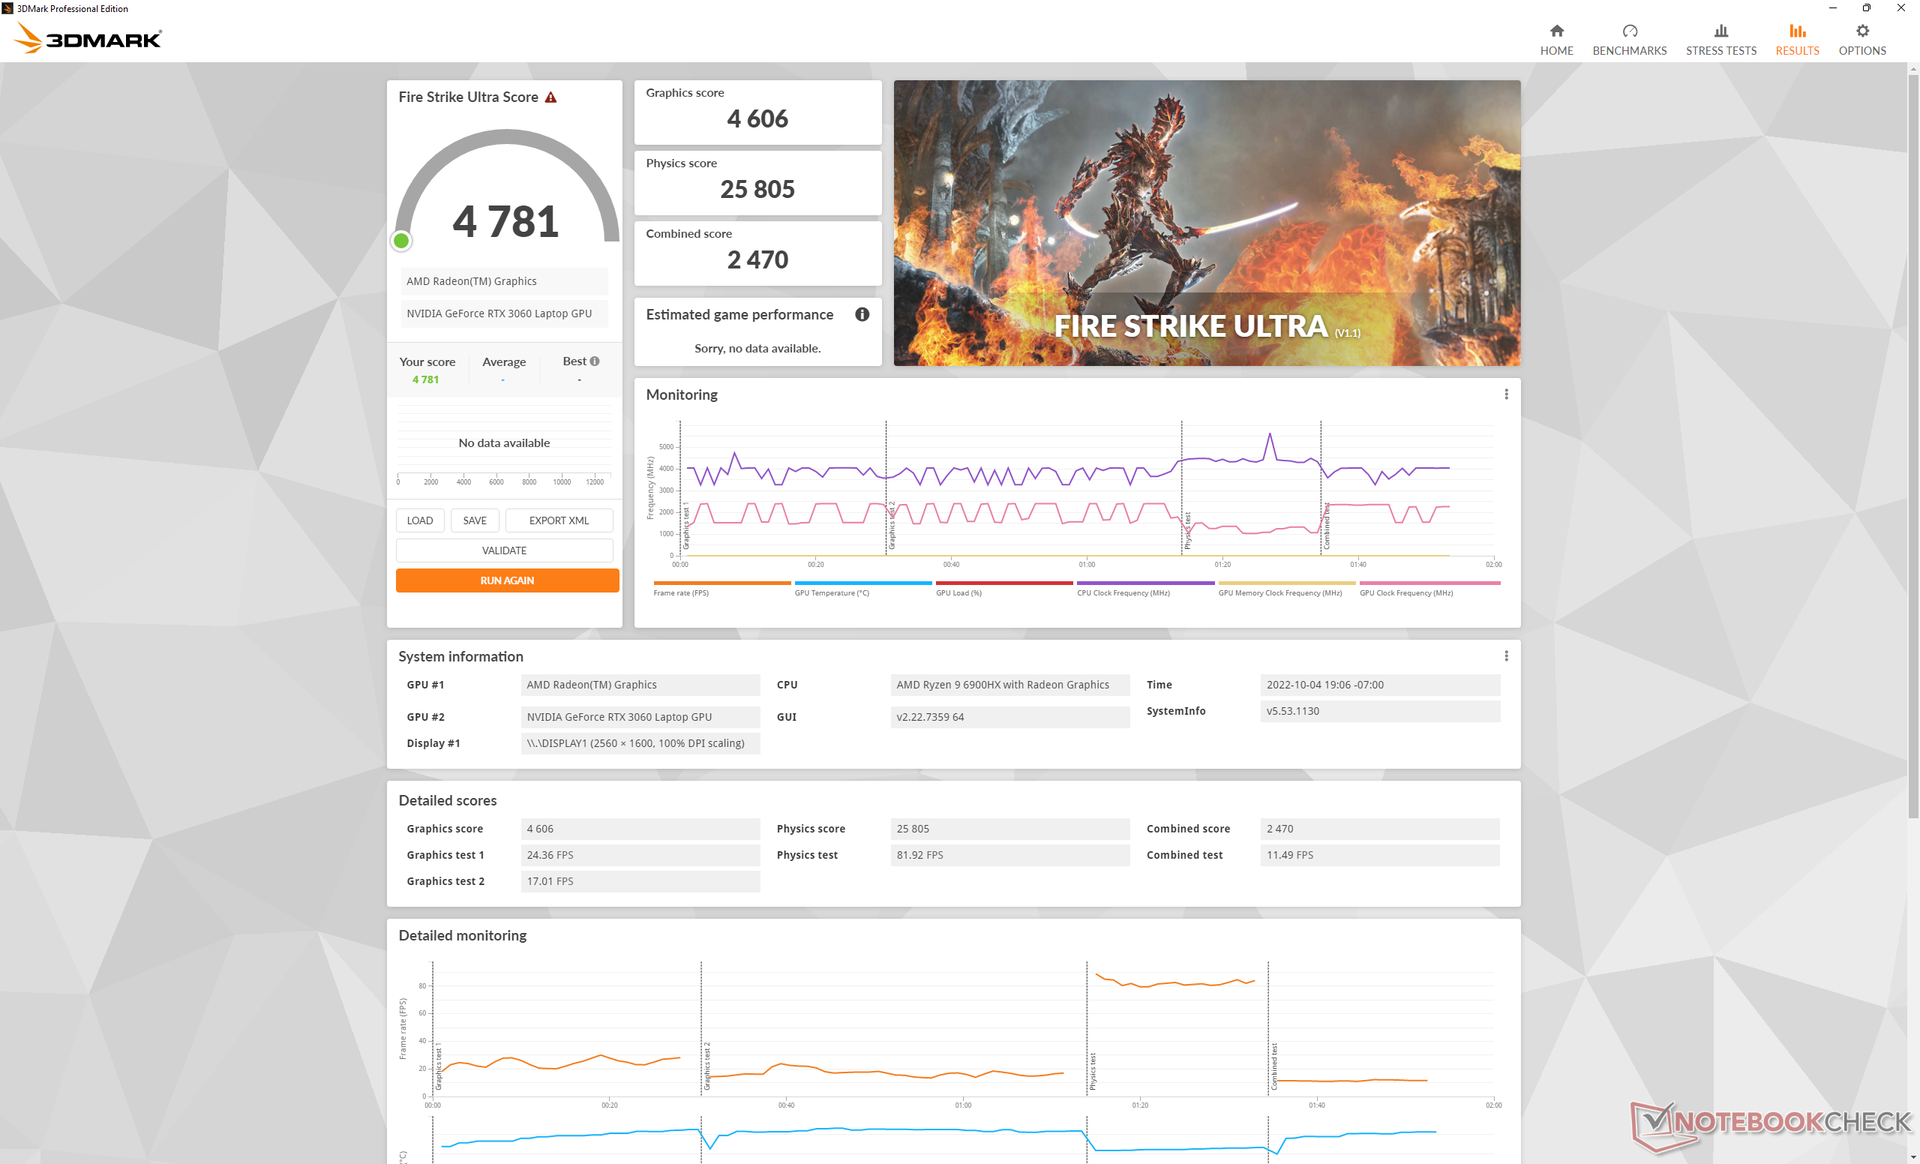
| 3DMark 11 Performance | 22761 points | |
| 3DMark Cloud Gate Standard Score | 45970 points | |
| 3DMark Fire Strike Score | 18143 points | |
| 3DMark Time Spy Score | 7686 points | |
Aide | ||
* ... Moindre est la valeur, meilleures sont les performances
| Cyberpunk 2077 1.6 | |
| 1920x1080 Low Preset | |
| Moyenne NVIDIA GeForce RTX 3060 Laptop GPU (80 - 135.7, n=14) | |
| Lenovo ThinkBook 16p G3 ARH | |
| Lenovo IdeaPad 5 Pro 16ARH7 | |
| 1920x1080 Medium Preset | |
| Moyenne NVIDIA GeForce RTX 3060 Laptop GPU (68 - 118, n=14) | |
| Lenovo ThinkBook 16p G3 ARH | |
| Lenovo IdeaPad 5 Pro 16ARH7 | |
| 1920x1080 High Preset | |
| Moyenne NVIDIA GeForce RTX 3060 Laptop GPU (42.2 - 87.7, n=14) | |
| Lenovo ThinkBook 16p G3 ARH | |
| Lenovo IdeaPad 5 Pro 16ARH7 | |
| 1920x1080 Ultra Preset | |
| Moyenne NVIDIA GeForce RTX 3060 Laptop GPU (40 - 78.8, n=16) | |
| Lenovo ThinkBook 16p G3 ARH | |
| 2560x1440 Ultra Preset | |
| Moyenne NVIDIA GeForce RTX 3060 Laptop GPU (23 - 45.8, n=9) | |
| Lenovo ThinkBook 16p G3 ARH | |
Witcher 3 FPS Chart
| Bas | Moyen | Élevé | Ultra | QHD | |
|---|---|---|---|---|---|
| GTA V (2015) | 165.4 | 158.9 | 134.6 | 78.5 | 68.8 |
| The Witcher 3 (2015) | 259.5 | 211.4 | 138.5 | 73.4 | |
| Dota 2 Reborn (2015) | 112.5 | 106 | 98.9 | 96.8 | |
| Final Fantasy XV Benchmark (2018) | 141.8 | 104.1 | 78.2 | 58.5 | |
| X-Plane 11.11 (2018) | 90.6 | 81.8 | 64.8 | ||
| Strange Brigade (2018) | 253 | 170.9 | 147.7 | 132.5 | 99.3 |
| Cyberpunk 2077 1.6 (2022) | 100.8 | 87.7 | 67.8 | 56 | 35 |
Émissions
Bruit du système
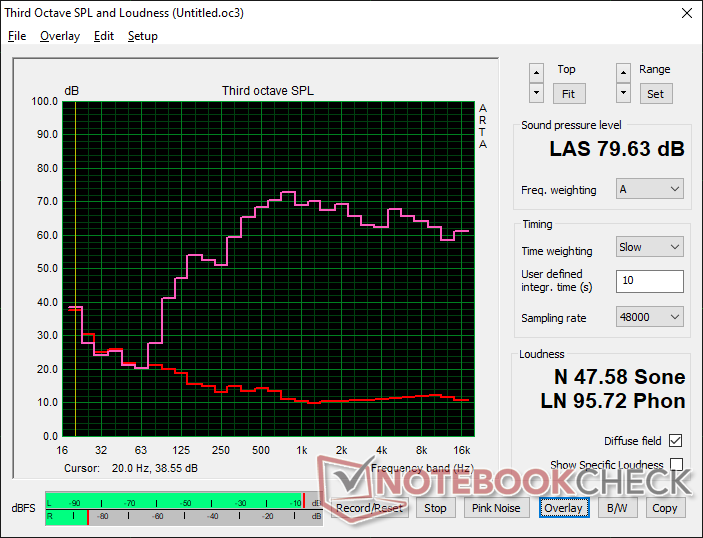
Le bruit du ventilateur en cas de charge élevée est comparable à celui de l'Acer Swift X SFX16.Acer Swift X SFX16 mais plus silencieux que leHP Envy 16. Les ventilateurs internes ne pulsent pas très souvent pour une expérience généralement silencieuse lors de la navigation sur Internet, du streaming vidéo ou d'autres charges peu exigeantes.
Degré de la nuisance sonore
| Au repos |
| 23.1 / 23.2 / 23.6 dB(A) |
| Fortement sollicité |
| 30.6 / 47.5 dB(A) |
 | ||
30 dB silencieux 40 dB(A) audible 50 dB(A) bruyant |
||
min: | ||
| Lenovo ThinkBook 16p G3 ARH GeForce RTX 3060 Laptop GPU, R9 6900HX, Micron 3400 1TB MTFDKBA1T0TFH | HP Envy 16 h0112nr GeForce RTX 3060 Laptop GPU, i7-12700H, Micron 3400 1TB MTFDKBA1T0TFH | Lenovo ThinkBook 16p G2 ACH GeForce RTX 3060 Laptop GPU, R9 5900HX, WDC PC SN730 SDBPNTY-1T00 | Lenovo IdeaPad 5 Pro 16ARH7 Radeon 660M, R5 6600HS, Samsung PM9A1 MZVL2512HCJQ | Acer Swift X SFX16-51G-5388 GeForce RTX 3050 4GB Laptop GPU, i5-11320H, Samsung PM991 MZVLQ512HBLU | Lenovo Legion 5 Pro 16IAH7H GeForce RTX 3060 Laptop GPU, i7-12700H, 2x Samsung PM9A1 MZVL21T0HCLR (RAID 0) | |
|---|---|---|---|---|---|---|
| Noise | -11% | -2% | -6% | -14% | -28% | |
| arrêt / environnement * (dB) | 22.7 | 22.8 -0% | 23 -1% | 25 -10% | 25.4 -12% | 24.6 -8% |
| Idle Minimum * (dB) | 23.1 | 22.9 1% | 23 -0% | 25 -8% | 25.4 -10% | 28.7 -24% |
| Idle Average * (dB) | 23.2 | 22.9 1% | 23 1% | 26 -12% | 25.4 -9% | 32 -38% |
| Idle Maximum * (dB) | 23.6 | 30.5 -29% | 23 3% | 28 -19% | 27.8 -18% | 32 -36% |
| Load Average * (dB) | 30.6 | 41.4 -35% | 35.66 -17% | 44 -44% | 41 -34% | 45.2 -48% |
| Witcher 3 ultra * (dB) | 47.6 | 51.1 -7% | 48.7 -2% | 35 26% | ||
| Load Maximum * (dB) | 47.5 | 51.4 -8% | 48.13 -1% | 35 26% | 47 1% | 54.4 -15% |
* ... Moindre est la valeur, meilleures sont les performances
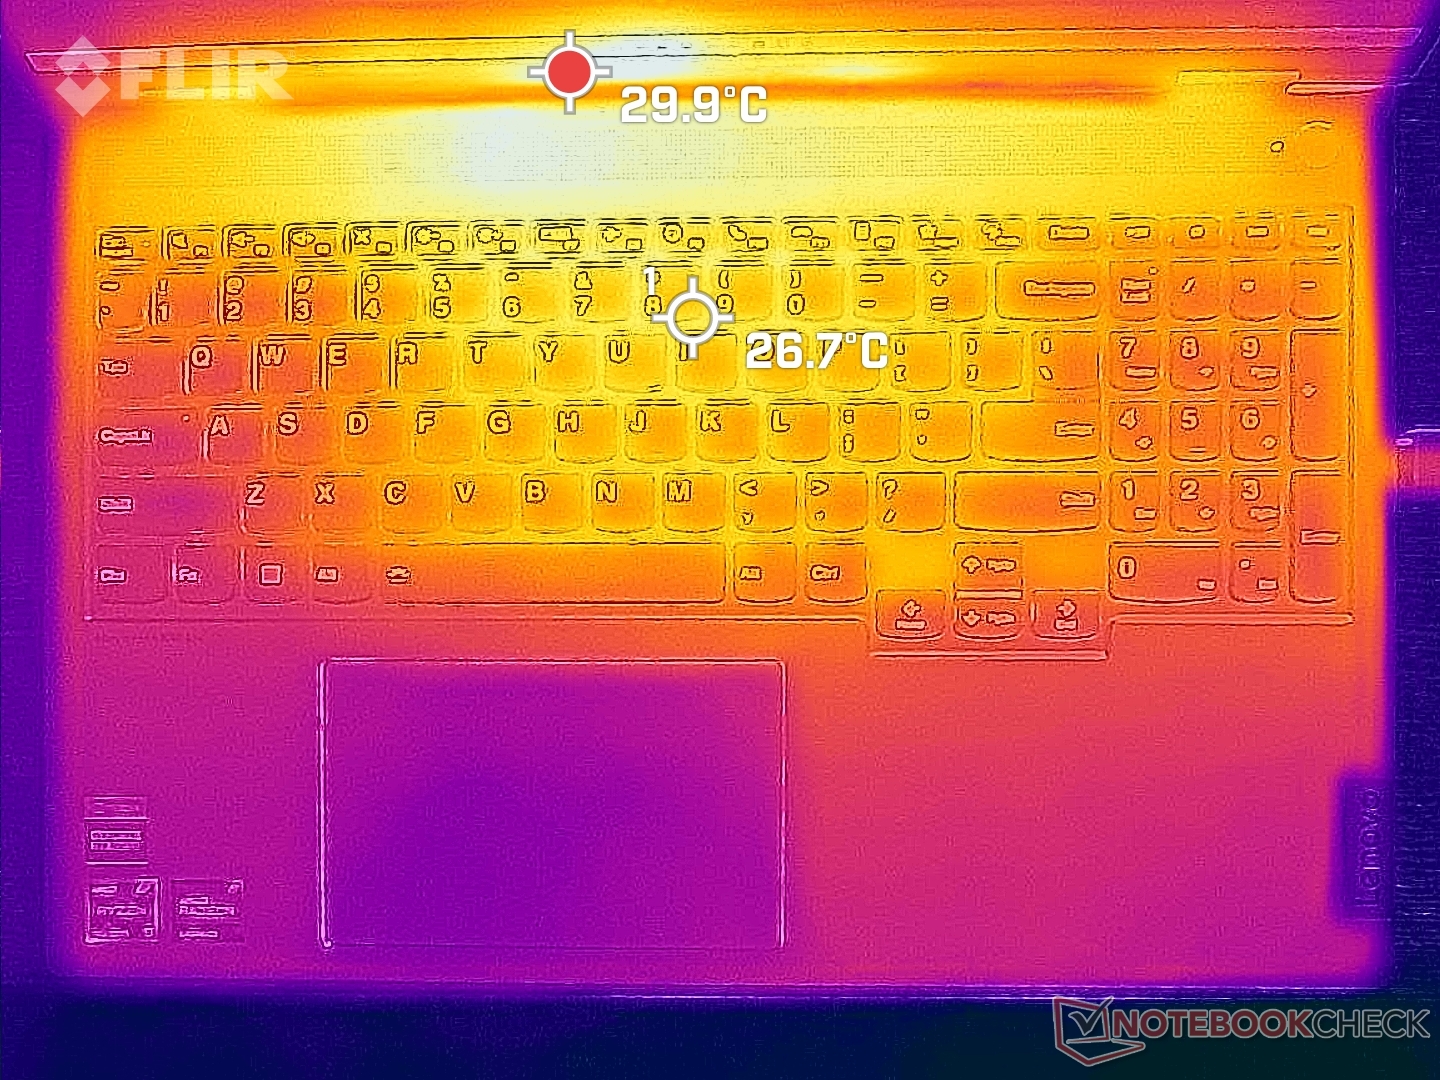
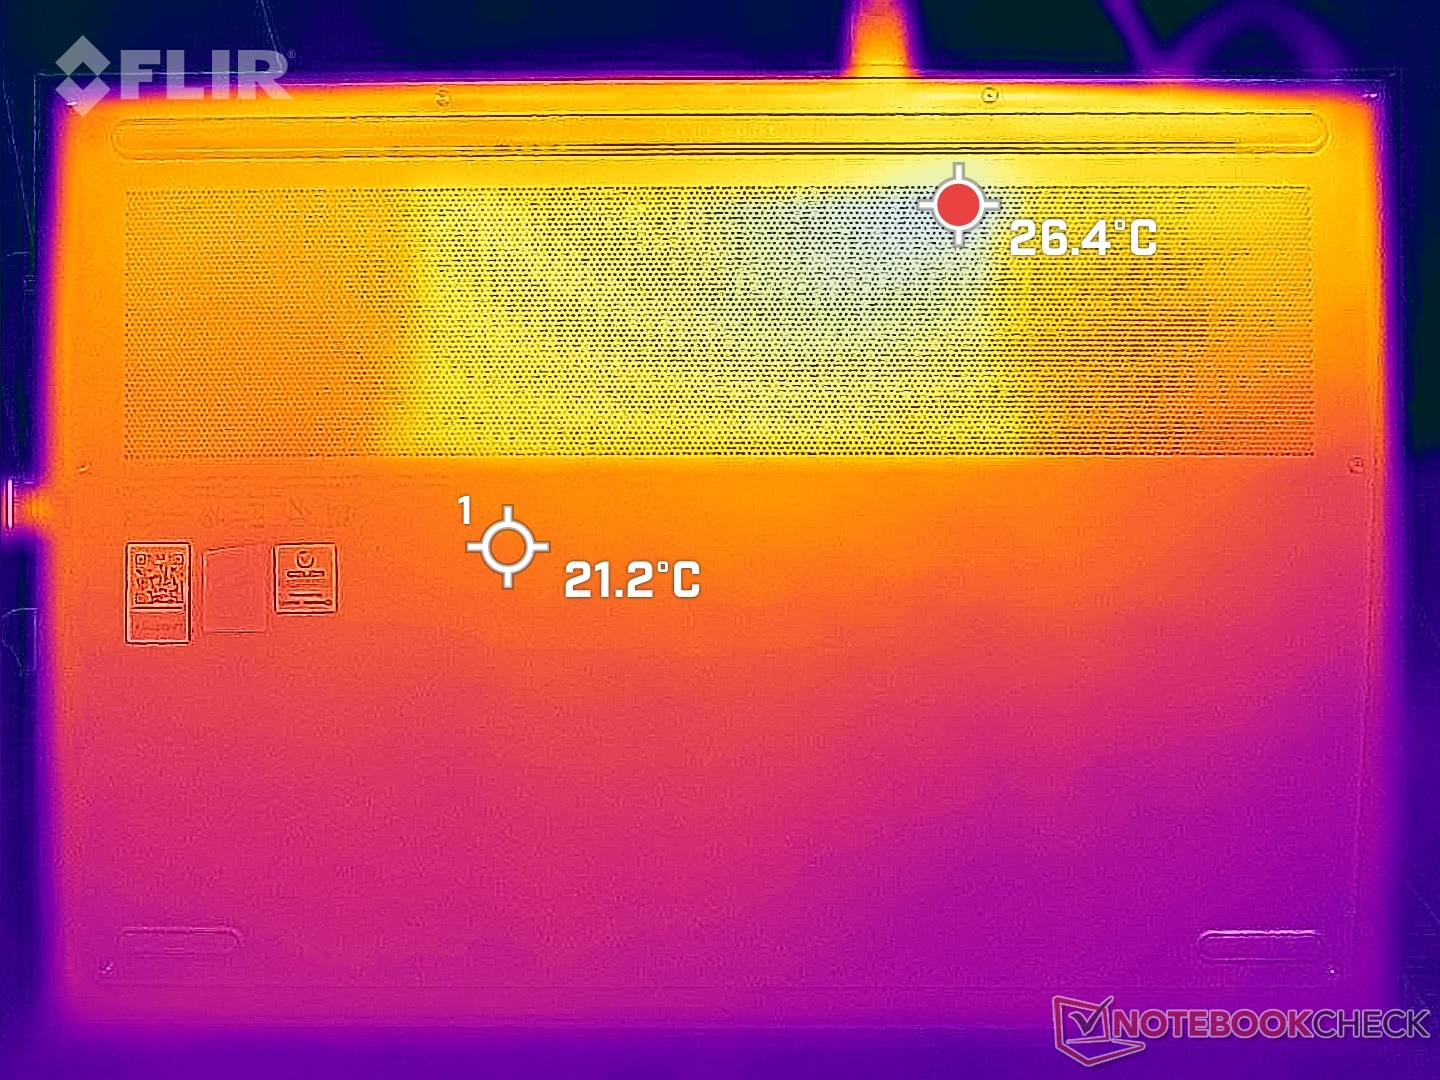
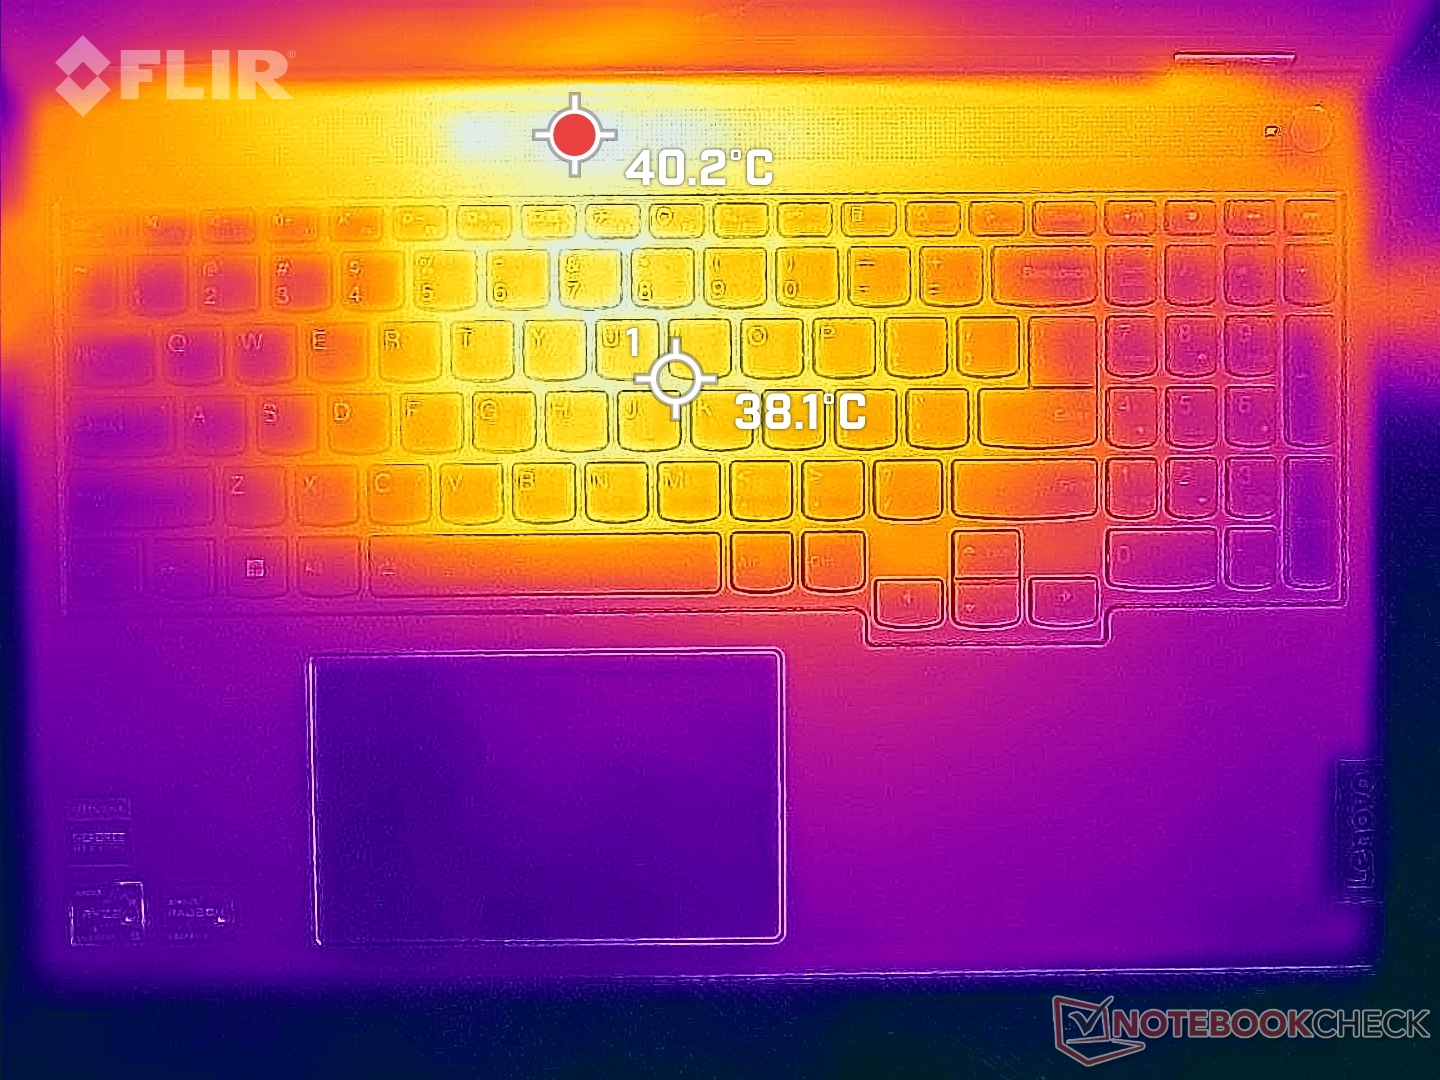
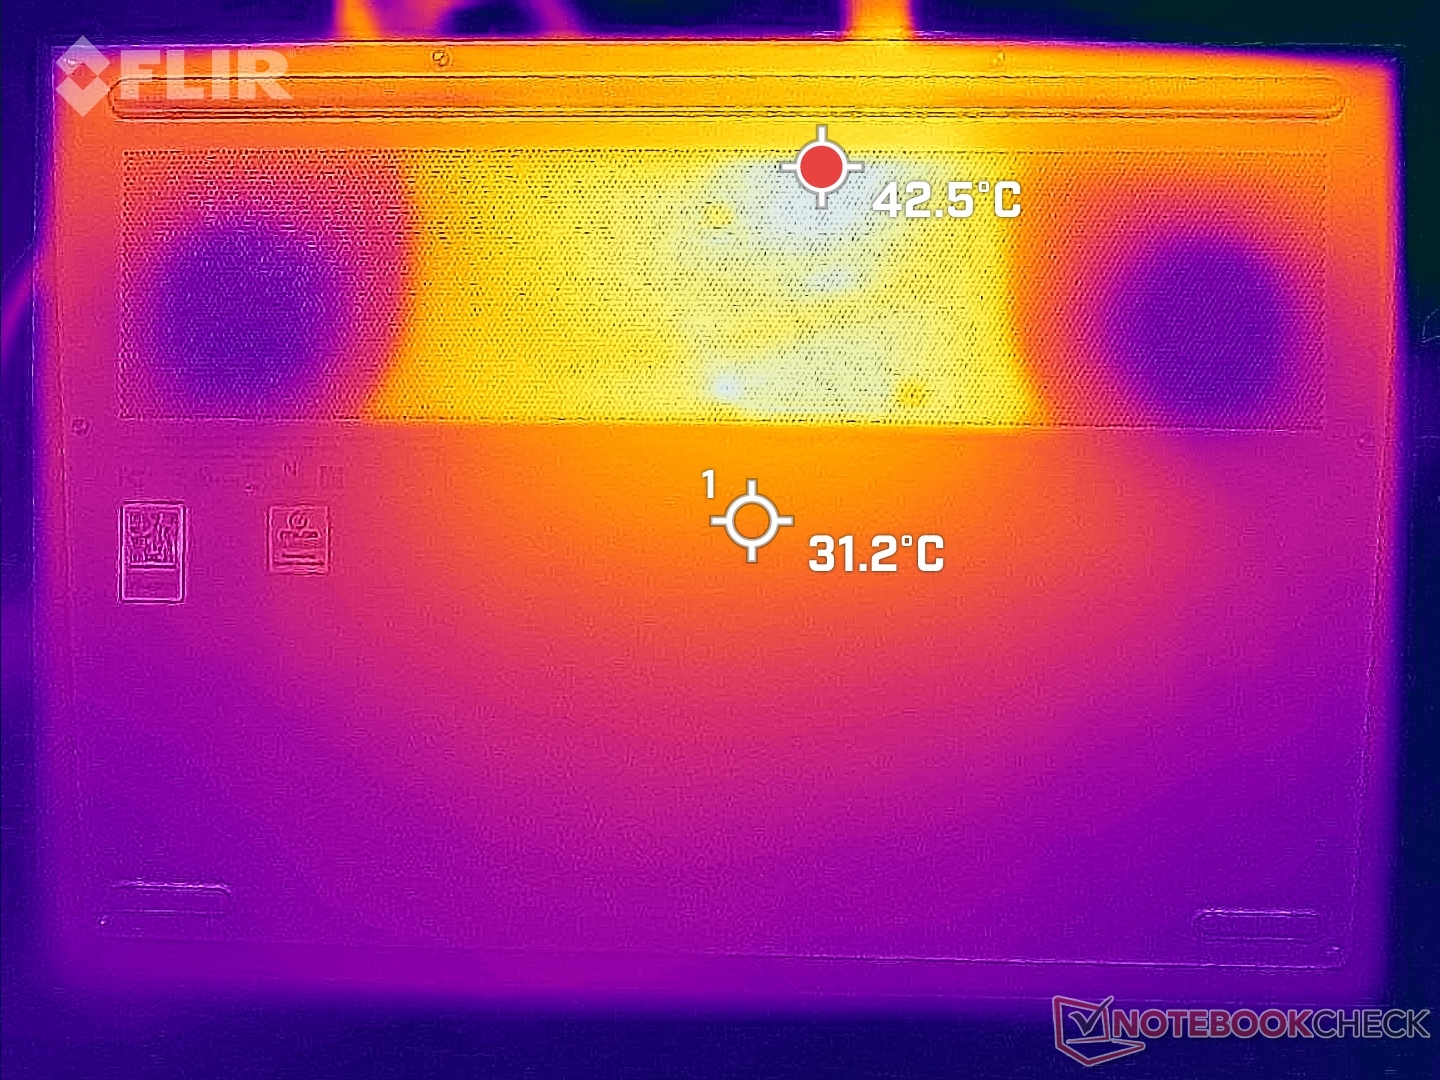
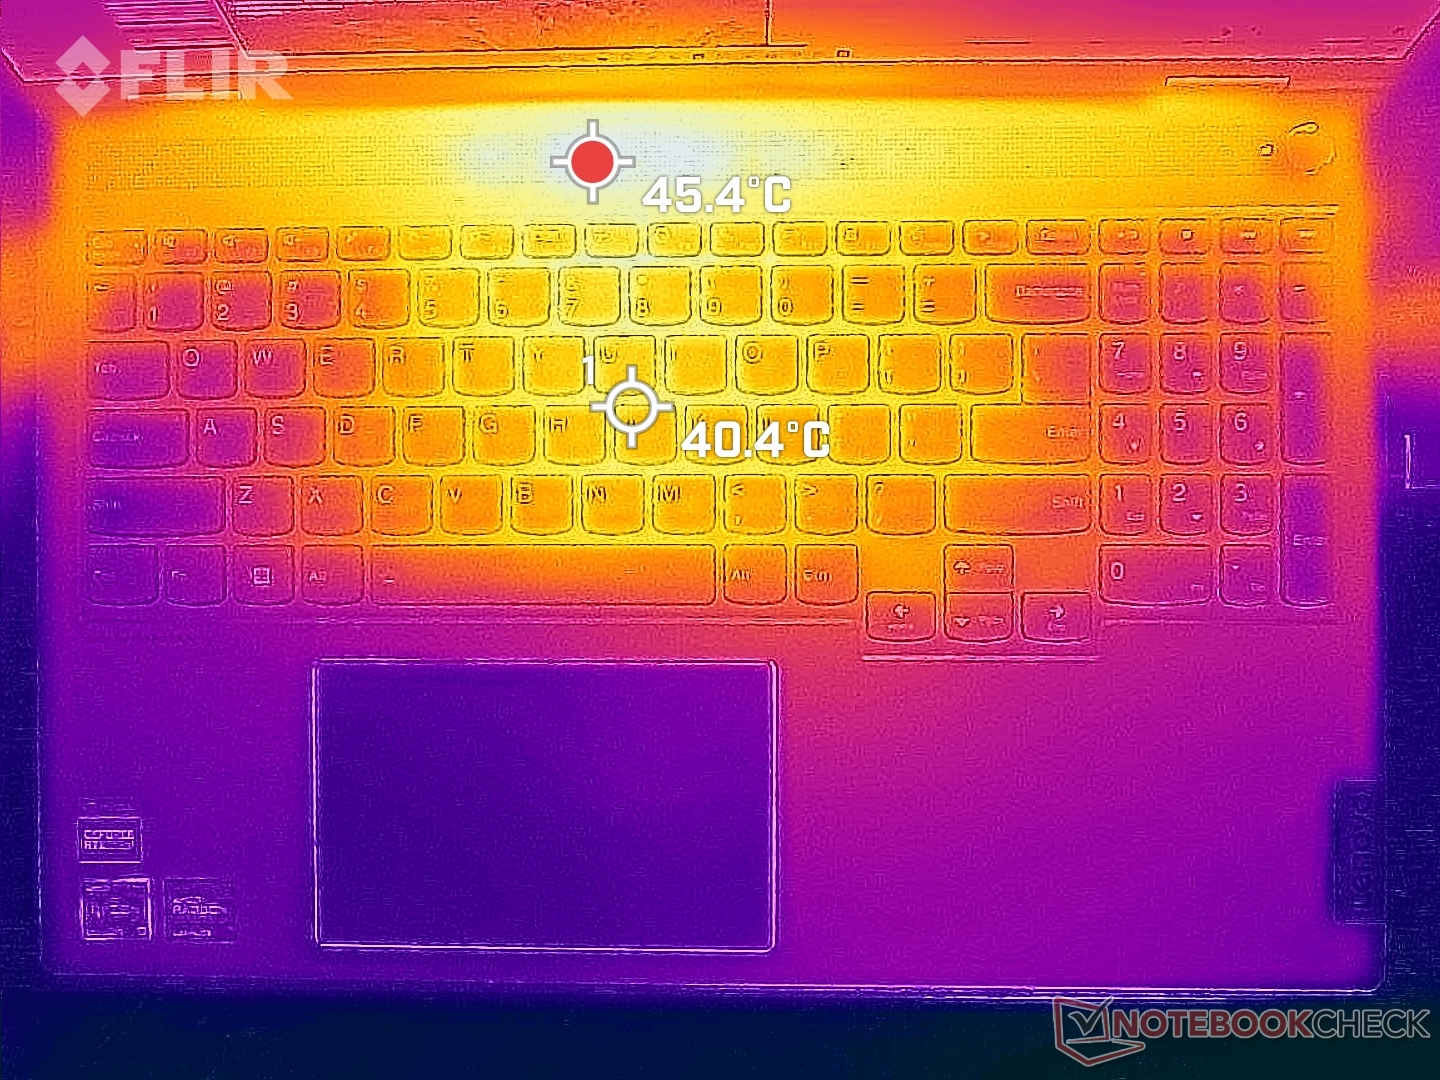
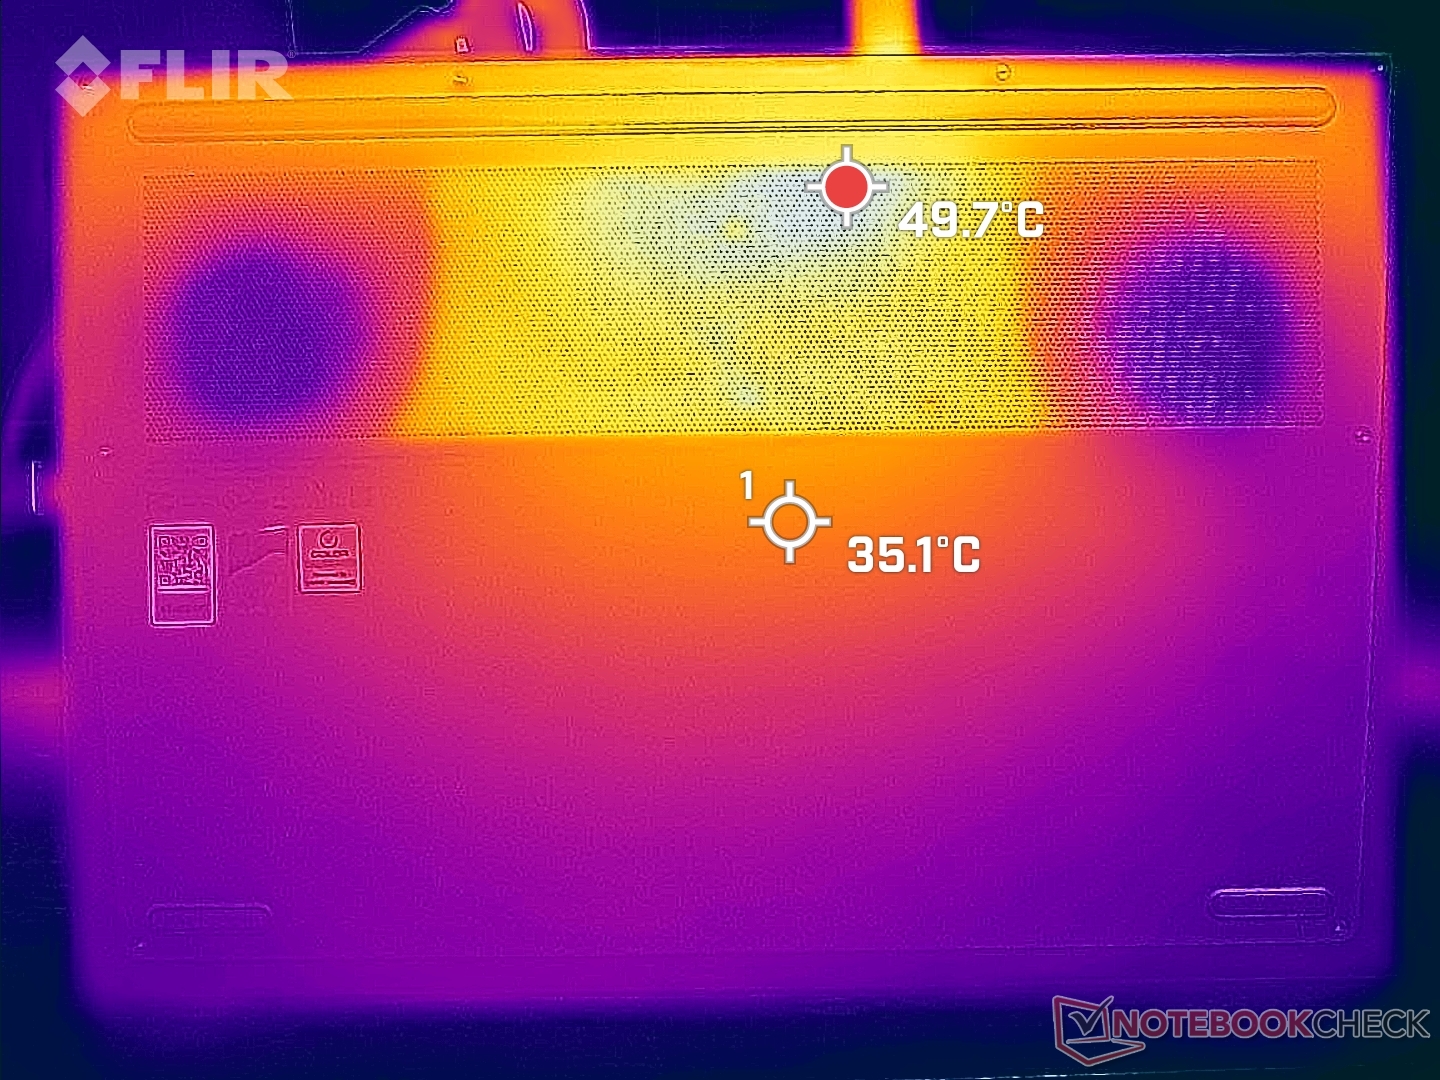
Température
Les points chauds de surface peuvent atteindre près de 50 C sur le dessus et le dessous, de manière similaire à ce que nous avons observé sur le modèle Gen 2 ouDell Inspiron 16 Plus.
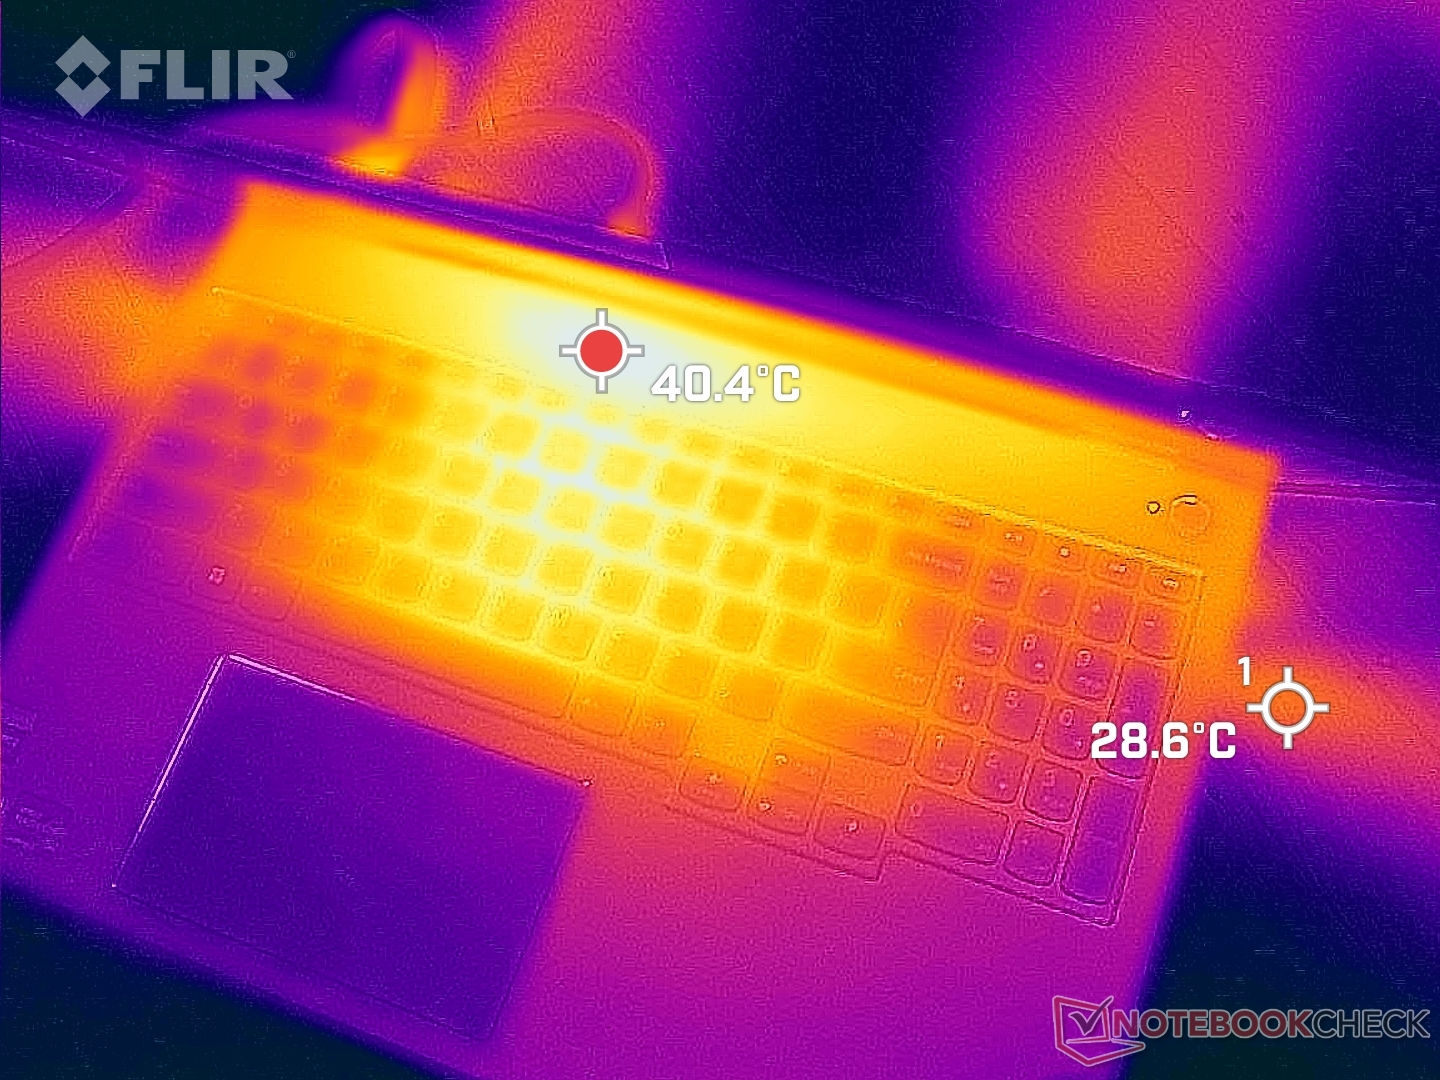
(-) La température maximale du côté supérieur est de 48.2 °C / 119 F, par rapport à la moyenne de 36.8 °C / 98 F, allant de 21 à 71 °C pour la classe Multimedia.
(-) Le fond chauffe jusqu'à un maximum de 49.6 °C / 121 F, contre une moyenne de 39.1 °C / 102 F
(+) En utilisation inactive, la température moyenne du côté supérieur est de 29.3 °C / 85 F, par rapport à la moyenne du dispositif de 31.3 °C / 88 F.
(±) En jouant à The Witcher 3, la température moyenne du côté supérieur est de 34.3 °C / 94 F, alors que la moyenne de l'appareil est de 31.3 °C / 88 F.
(+) Les repose-poignets et le pavé tactile sont plus froids que la température de la peau avec un maximum de 29.4 °C / 84.9 F et sont donc froids au toucher.
(±) La température moyenne de la zone de l'appui-paume de dispositifs similaires était de 28.7 °C / 83.7 F (-0.7 °C / #-1.2 F).
| Lenovo ThinkBook 16p G3 ARH AMD Ryzen 9 6900HX, NVIDIA GeForce RTX 3060 Laptop GPU | HP Envy 16 h0112nr Intel Core i7-12700H, NVIDIA GeForce RTX 3060 Laptop GPU | Lenovo ThinkBook 16p G2 ACH AMD Ryzen 9 5900HX, NVIDIA GeForce RTX 3060 Laptop GPU | Lenovo IdeaPad 5 Pro 16ARH7 AMD Ryzen 5 6600HS, AMD Radeon 660M | Acer Swift X SFX16-51G-5388 Intel Core i5-11320H, NVIDIA GeForce RTX 3050 4GB Laptop GPU | Lenovo Legion 5 Pro 16IAH7H Intel Core i7-12700H, NVIDIA GeForce RTX 3060 Laptop GPU | |
|---|---|---|---|---|---|---|
| Heat | 4% | 2% | 10% | 1% | -4% | |
| Maximum Upper Side * (°C) | 48.2 | 45.2 6% | 50 -4% | 46 5% | 52.4 -9% | 45.8 5% |
| Maximum Bottom * (°C) | 49.6 | 44 11% | 53 -7% | 48 3% | 50 -1% | 66.3 -34% |
| Idle Upper Side * (°C) | 31.8 | 33.6 -6% | 29 9% | 28 12% | 30.3 5% | 30.4 4% |
| Idle Bottom * (°C) | 33.6 | 32.6 3% | 30 11% | 27 20% | 30.4 10% | 30.4 10% |
* ... Moindre est la valeur, meilleures sont les performances
Test de stress
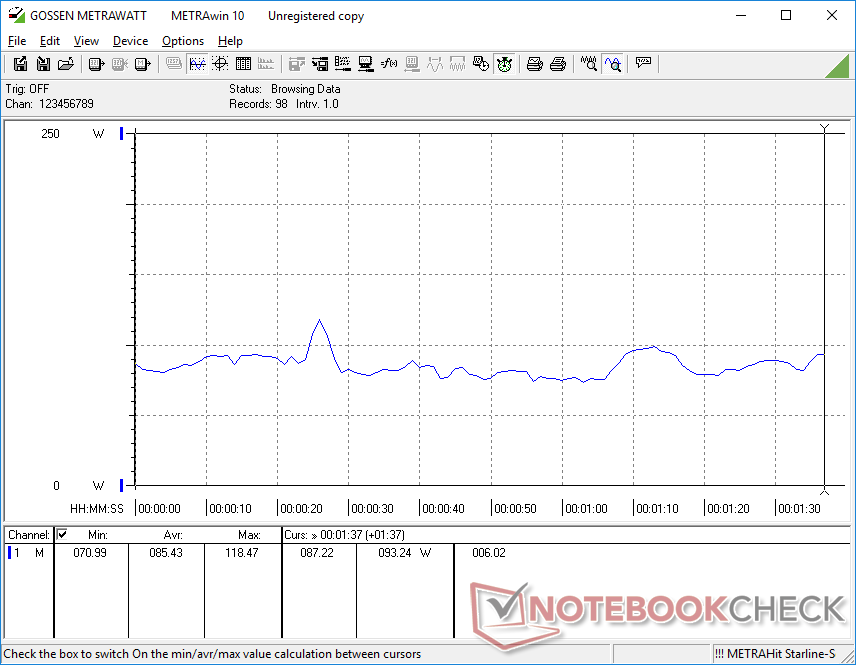
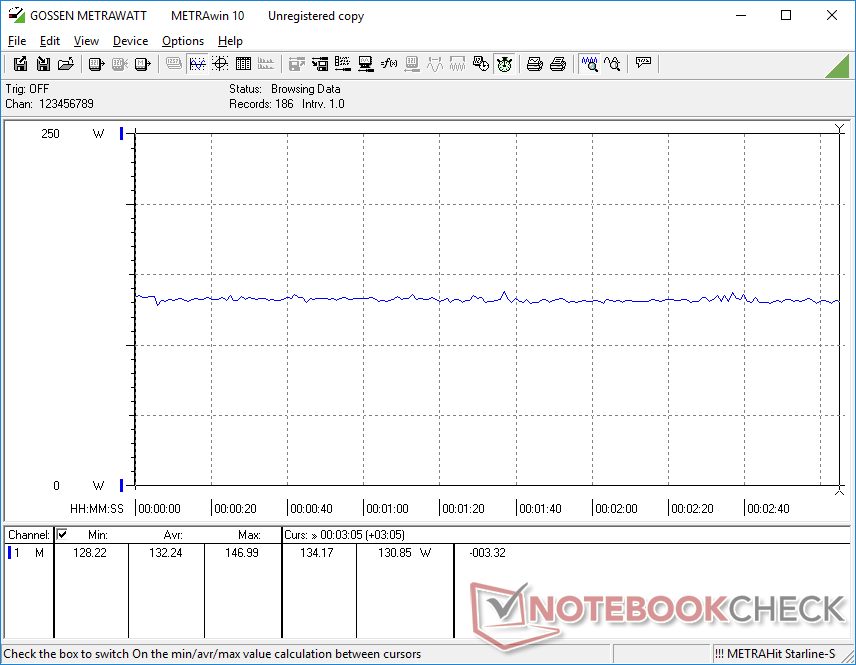
Les fréquences d'horloge du processeur, la température et la consommation d'énergie de la carte atteignent respectivement 4,1 GHz, 77 C et 65 W lors du déclenchement du stress Prime95. Peu de temps après, le processeur s'est stabilisé à 3,7 GHz, 82°C et 54W. En comparaison, l'épais Legion 7 16ARHA avec le même CPU Ryzen 9 6900HX se stabilise à 4,2 GHz, 89 C et 99 W lors du même test Prime95.
Les fréquences d'horloge du GPU, la température et la consommation d'énergie de la carte se stabilisent à 1582 MHz, 69 C et 69 W lors de l'exécution de Witcher 3. Nous ne parvenons pas à nous approcher de l'objectif de 90 W TGP visé par le système, même en mode Performance extrême.
Le fonctionnement sur batterie réduit les performances. Un test Fire Strike sur batterie donnerait des scores de physique et de graphisme de 17799 et 10557 points, respectivement, contre 25683 et 19597 points sur secteur.
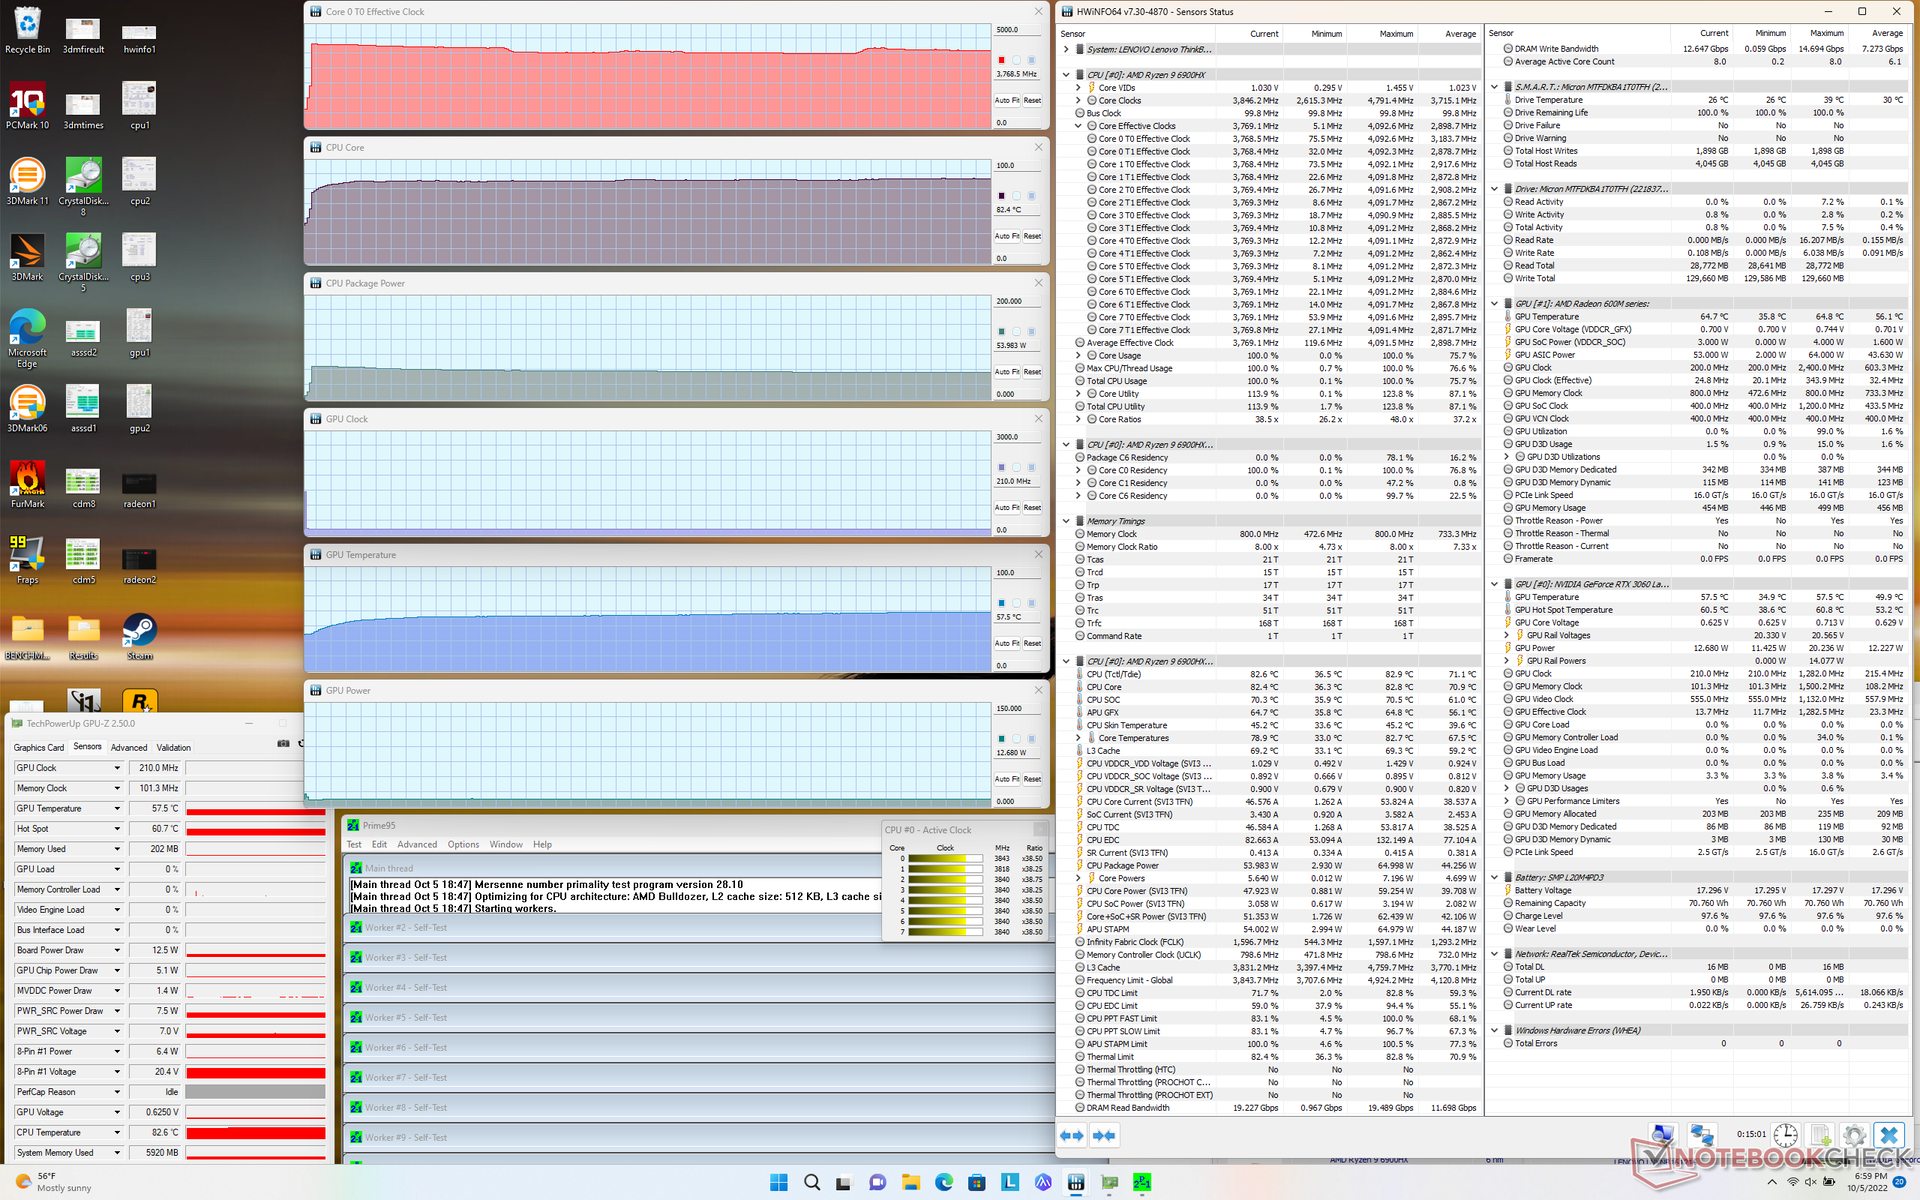
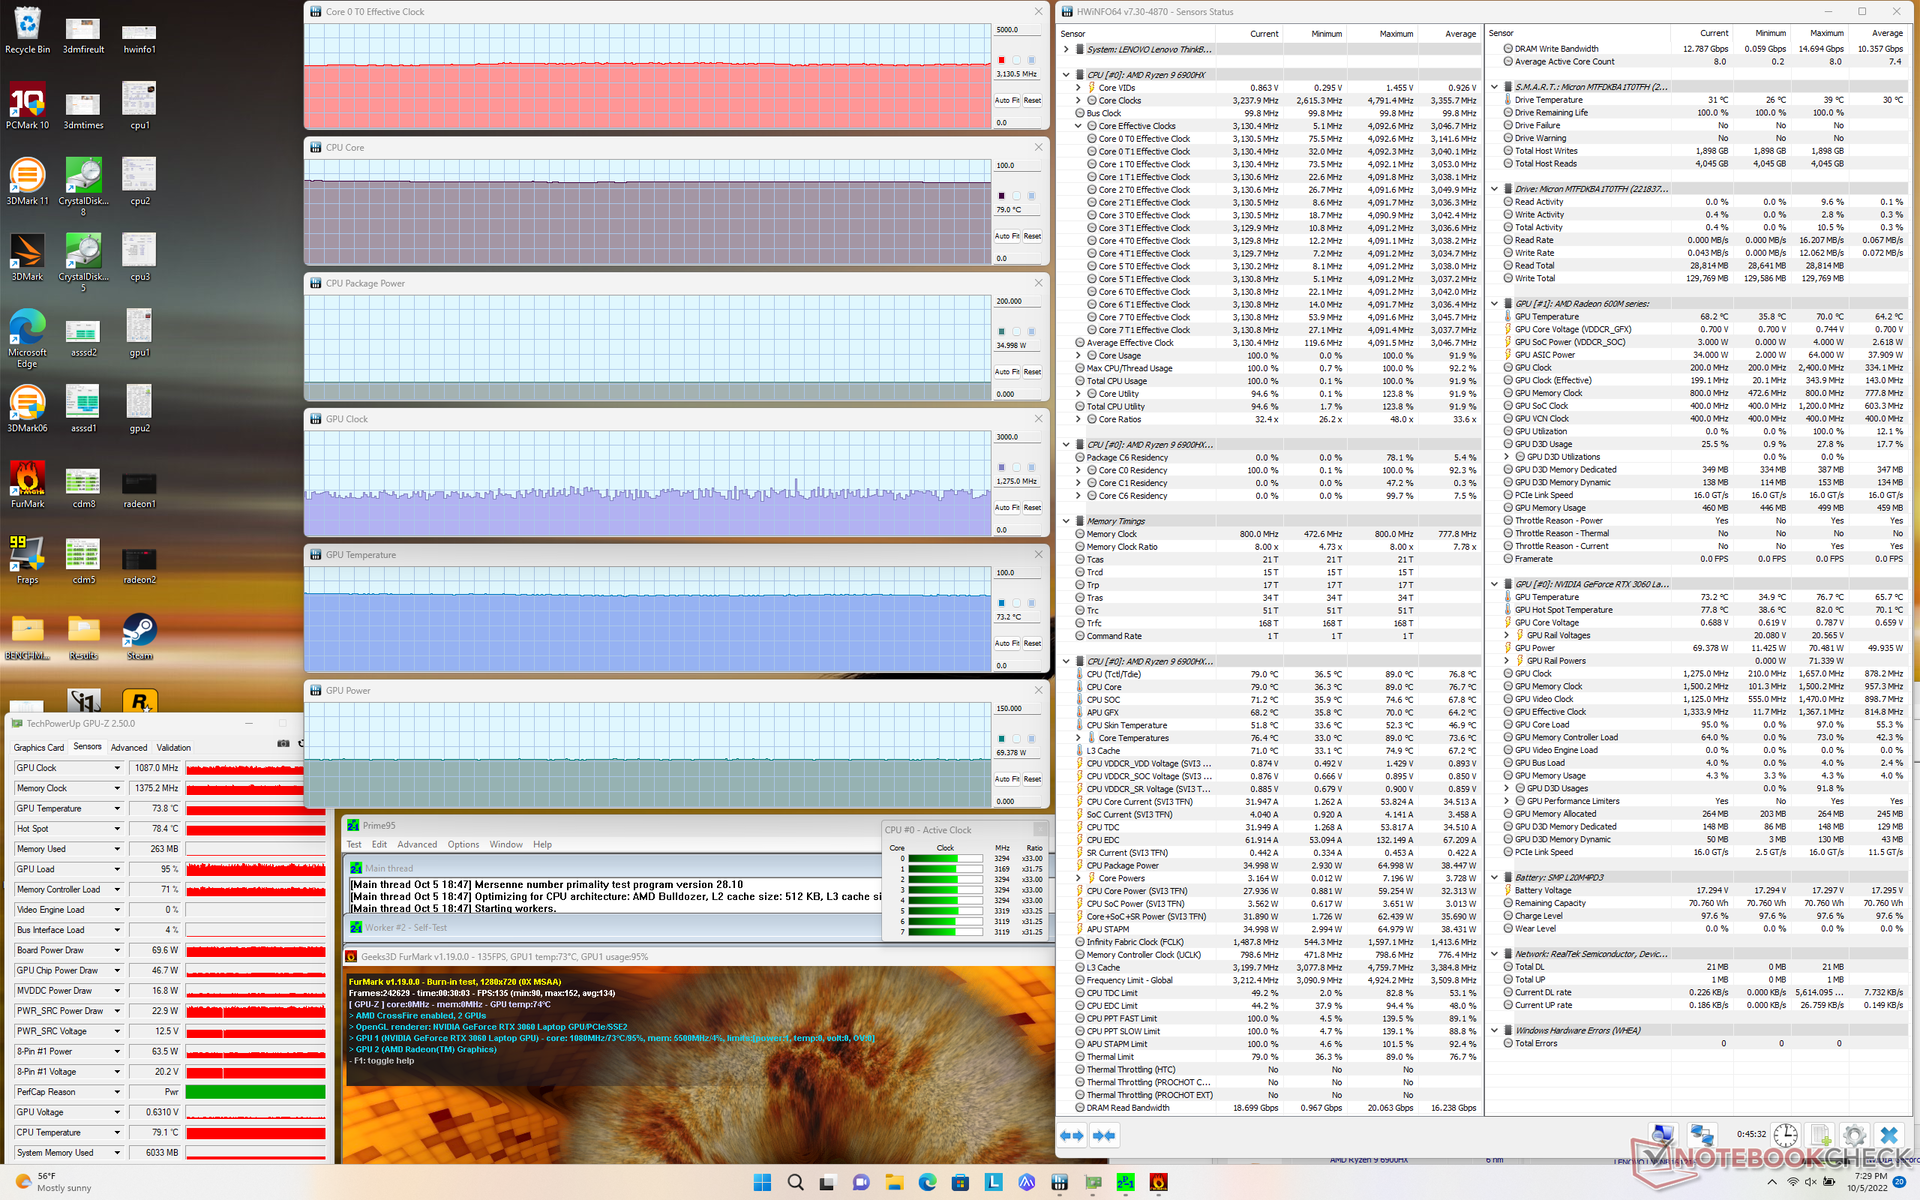
| Fréquence du CPU (GHz) | Fréquence du GPU (MHz) | Température moyenne du CPU (°C) | Température moyenne du GPU (°C) | |
| Système au repos | -- | -- | 36 | 34 |
| Prime95 Stress | 3.7 | -- | 82 | 58 |
| Prime95+ FurMark Stress | 3.1 | ~1275 | 79 | 73 |
| Witcher 3 Stress | ~2.5 | 1582 | 77 | 69 |
Haut-parleurs
Lenovo ThinkBook 16p G3 ARH analyse audio
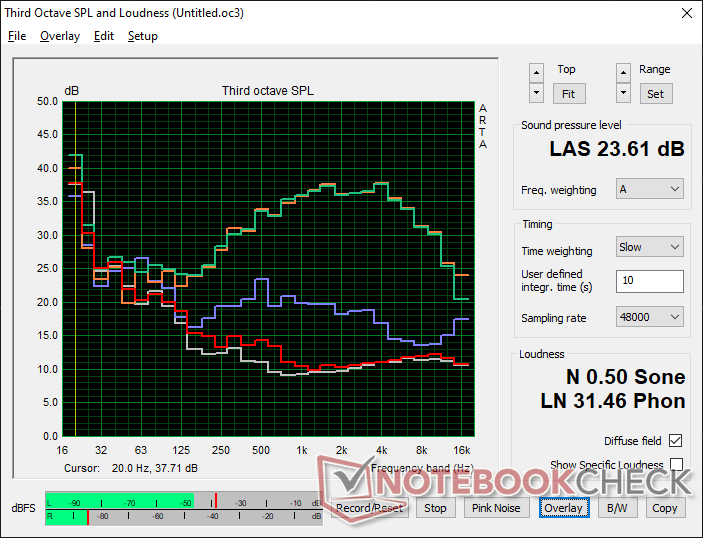
(±) | le niveau sonore du haut-parleur est moyen mais bon (79.6# dB)
Basses 100 - 315 Hz
(±) | basse réduite - en moyenne 13.4% inférieure à la médiane
(±) | la linéarité des basses est moyenne (11.9% delta à la fréquence précédente)
Médiums 400 - 2000 Hz
(+) | médiane équilibrée - seulement 4.8% de la médiane
(+) | les médiums sont linéaires (5.5% delta à la fréquence précédente)
Aiguës 2 - 16 kHz
(+) | des sommets équilibrés - à seulement 1.6% de la médiane
(+) | les aigus sont linéaires (4.6% delta à la fréquence précédente)
Globalement 100 - 16 000 Hz
(+) | le son global est linéaire (13% différence à la médiane)
Par rapport à la même classe
» 26% de tous les appareils testés de cette catégorie étaient meilleurs, 5% similaires, 70% pires
» Le meilleur avait un delta de 5%, la moyenne était de 17%, le pire était de 45%.
Par rapport à tous les appareils testés
» 13% de tous les appareils testés étaient meilleurs, 2% similaires, 85% pires
» Le meilleur avait un delta de 4%, la moyenne était de 24%, le pire était de 134%.
Apple MacBook Pro 16 2021 M1 Pro analyse audio
(+) | les haut-parleurs peuvent jouer relativement fort (84.7# dB)
Basses 100 - 315 Hz
(+) | bonne basse - seulement 3.8% loin de la médiane
(+) | les basses sont linéaires (5.2% delta à la fréquence précédente)
Médiums 400 - 2000 Hz
(+) | médiane équilibrée - seulement 1.3% de la médiane
(+) | les médiums sont linéaires (2.1% delta à la fréquence précédente)
Aiguës 2 - 16 kHz
(+) | des sommets équilibrés - à seulement 1.9% de la médiane
(+) | les aigus sont linéaires (2.7% delta à la fréquence précédente)
Globalement 100 - 16 000 Hz
(+) | le son global est linéaire (4.6% différence à la médiane)
Par rapport à la même classe
» 0% de tous les appareils testés de cette catégorie étaient meilleurs, 0% similaires, 100% pires
» Le meilleur avait un delta de 5%, la moyenne était de 17%, le pire était de 45%.
Par rapport à tous les appareils testés
» 0% de tous les appareils testés étaient meilleurs, 0% similaires, 100% pires
» Le meilleur avait un delta de 4%, la moyenne était de 24%, le pire était de 134%.
Gestion de l'énergie
Consommation d'énergie
La consommation en mode veille sur le bureau varie de 10 à 24 W selon le profil d'alimentation et la luminosité, contre seulement 10 à 19 W pour le modèle Gen 2. La consommation globale est nettement inférieure à celle du Legion 5 Pro 16 qui est équipé du même GPU GeForce RTX 3060 mais d'un CPU Intel Core i7 de 12e génération plus rapide
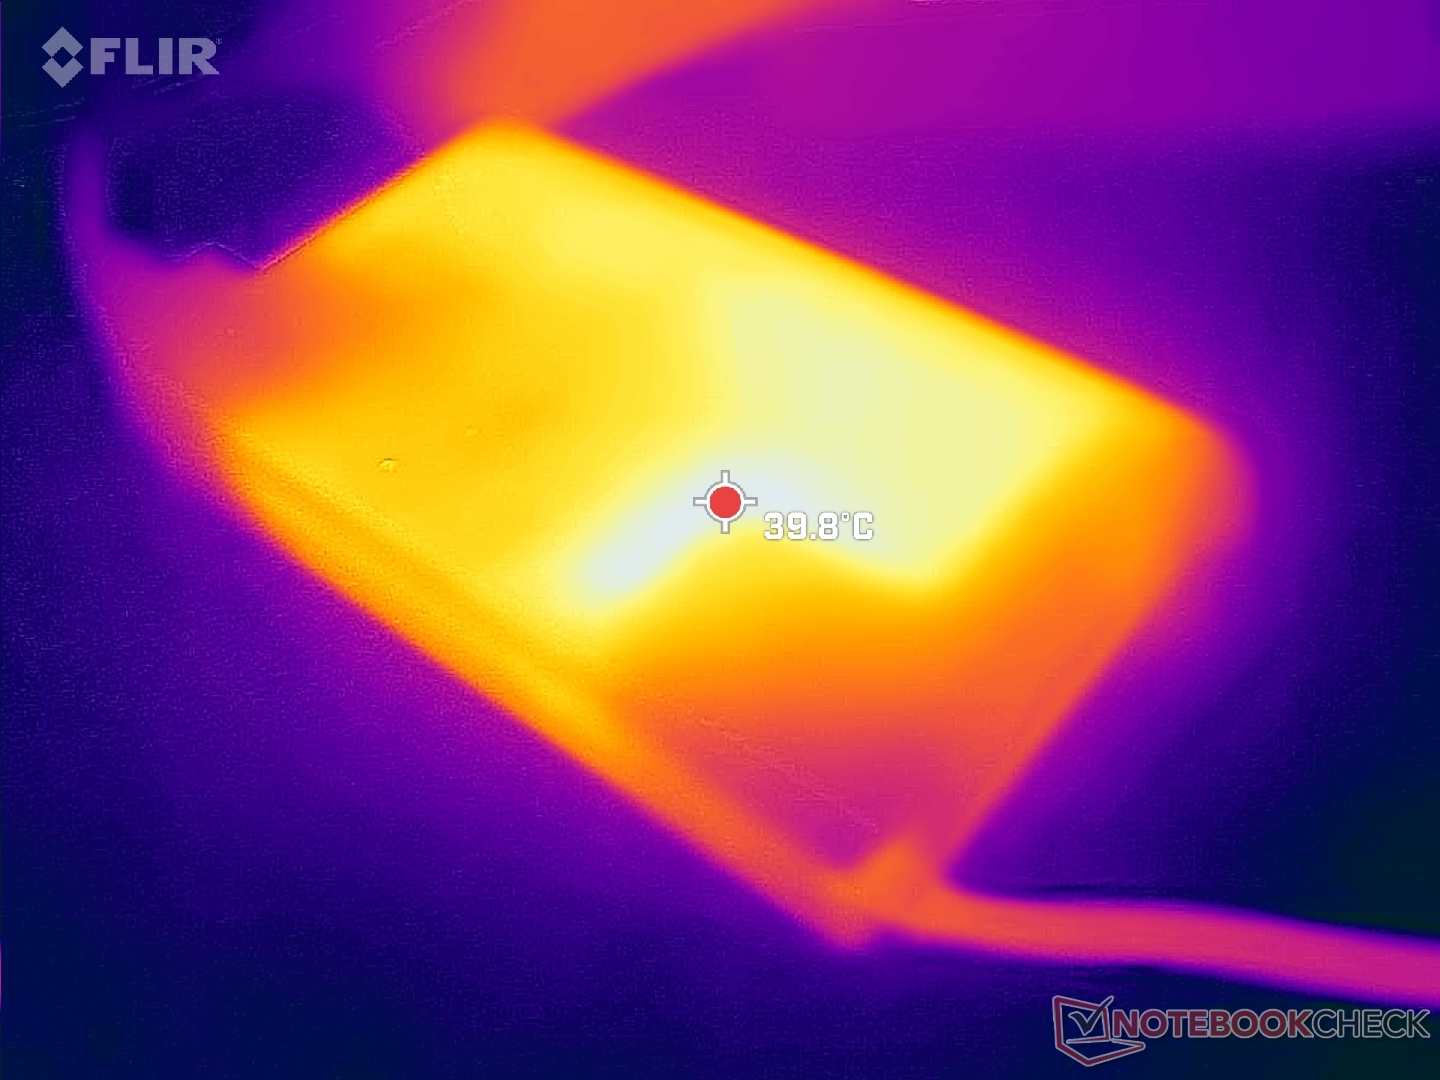
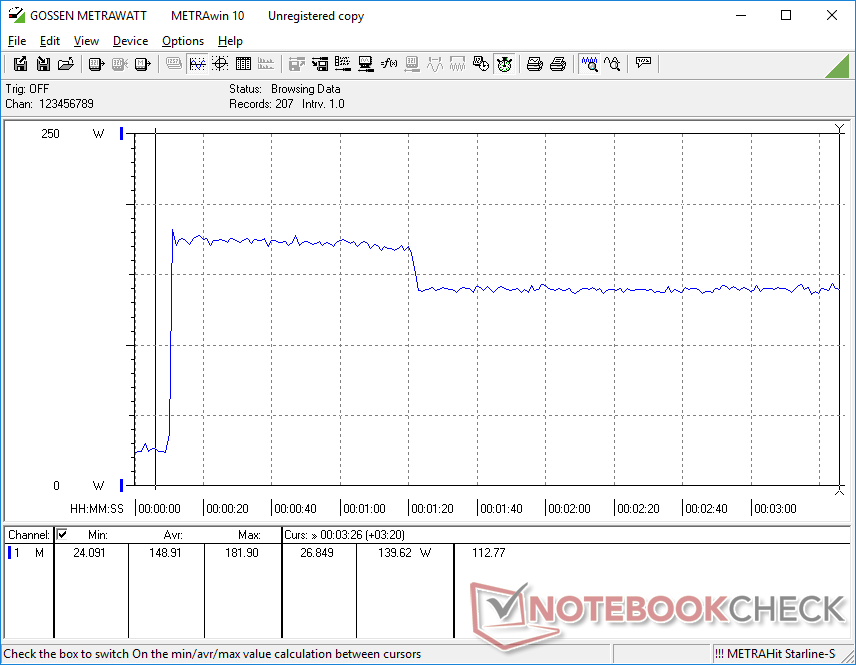
Nous avons pu atteindre un maximum de 182 W avec l'adaptateur secteur 230 W de taille moyenne (~16 x 8,8 x 2,8 cm) lorsque le CPU et le GPU sont tous deux utilisés à 100 %.
| Éteint/en veille | |
| Au repos | |
| Fortement sollicité |
|
Légende:
min: | |
| Lenovo ThinkBook 16p G3 ARH R9 6900HX, GeForce RTX 3060 Laptop GPU, Micron 3400 1TB MTFDKBA1T0TFH, IPS, 2560x1600, 16" | HP Envy 16 h0112nr i7-12700H, GeForce RTX 3060 Laptop GPU, Micron 3400 1TB MTFDKBA1T0TFH, OLED, 3840x2400, 16" | Lenovo ThinkBook 16p G2 ACH R9 5900HX, GeForce RTX 3060 Laptop GPU, WDC PC SN730 SDBPNTY-1T00, IPS, 2560x1600, 16" | Lenovo IdeaPad 5 Pro 16ARH7 R5 6600HS, Radeon 660M, Samsung PM9A1 MZVL2512HCJQ, IPS, 2560x1600, 16" | Acer Swift X SFX16-51G-5388 i5-11320H, GeForce RTX 3050 4GB Laptop GPU, Samsung PM991 MZVLQ512HBLU, , 1920x1080, 16.1" | Lenovo Legion 5 Pro 16IAH7H i7-12700H, GeForce RTX 3060 Laptop GPU, 2x Samsung PM9A1 MZVL21T0HCLR (RAID 0), IPS, 2560x1600, 16" | |
|---|---|---|---|---|---|---|
| Power Consumption | -6% | 4% | 52% | 39% | -77% | |
| Idle Minimum * (Watt) | 10.3 | 10 3% | 13.2 -28% | 4 61% | 7 32% | 22.8 -121% |
| Idle Average * (Watt) | 16 | 10.9 32% | 17 -6% | 7 56% | 10.1 37% | 26.5 -66% |
| Idle Maximum * (Watt) | 24 | 27.8 -16% | 18.6 22% | 13 46% | 15 37% | 41 -71% |
| Load Average * (Watt) | 85.4 | 116.4 -36% | 88.8 -4% | 61 29% | 63.3 26% | 191 -124% |
| Witcher 3 ultra * (Watt) | 132.2 | 133.7 -1% | 123 7% 123 7% | 42.8 68% | 63.3 52% | 194.7 -47% |
| Load Maximum * (Watt) | 181.9 | 209.8 -15% | 132 27% | 88 52% | 94 48% | 238 -31% |
* ... Moindre est la valeur, meilleures sont les performances
Power Consumption Witcher 3 / Stresstest
Power Consumption external Monitor
Autonomie de la batterie
L'autonomie du WLAN est inférieure d'environ 2 heures à celle que nous avons enregistrée sur le modèle Gen 2, bien qu'ils aient les mêmes batteries de 71 Wh. La fréquence de rafraîchissement plus élevée de notre écran (165 Hz contre 60 Hz) peut être en partie responsable de l'autonomie plus courte
Le chargement d'une batterie vide à sa pleine capacité prend environ 1,5 à 2 heures. Le système ne peut pas être rechargé via l'USB-C.
| Lenovo ThinkBook 16p G3 ARH R9 6900HX, GeForce RTX 3060 Laptop GPU, 71 Wh | HP Envy 16 h0112nr i7-12700H, GeForce RTX 3060 Laptop GPU, 83 Wh | Lenovo ThinkBook 16p G2 ACH R9 5900HX, GeForce RTX 3060 Laptop GPU, 71 Wh | Lenovo IdeaPad 5 Pro 16ARH7 R5 6600HS, Radeon 660M, 75 Wh | Acer Swift X SFX16-51G-5388 i5-11320H, GeForce RTX 3050 4GB Laptop GPU, 58.7 Wh | Lenovo Legion 5 Pro 16IAH7H i7-12700H, GeForce RTX 3060 Laptop GPU, 80 Wh | |
|---|---|---|---|---|---|---|
| Autonomie de la batterie | 22% | 31% | 51% | 25% | -45% | |
| WiFi v1.3 (h) | 6.5 | 7.9 22% | 8.5 31% | 9.8 51% | 8.1 25% | 3.6 -45% |
| Reader / Idle (h) | 17.8 | |||||
| Load (h) | 1.6 | 2 | 1.5 | 0.6 | ||
| H.264 (h) | 7 | 8.4 | 4.1 | |||
| Gaming (h) | 1.1 | |||||
| Witcher 3 ultra (h) | 2.1 |
Points positifs
Points négatifs
Verdict - Considérez plutôt le modèle de l'année dernière
Contrairement au saut de performance de la 11e génération d'Intel à la 12e génération d'Intel, le passage de Zen 3 d'AMD à Zen 3+ n'apporte au mieux que des avantages mineurs. Le fait que le Ryzen 9 5900HX dans le 2021 ThinkBook 16p Gen 2 peut faire moins de 5 pour cent sur le Ryzen 9 6900HX dans le 2022 ThinkBook 16p Gen 3 fait de ce dernier modèle une recommandation plus difficile si la performance du processeur est ce que vous recherchez.
Les autres changements apportés au modèle 2022 méritent toutefois d'être mentionnés. La nouvelle dalle G-Sync de 165 Hz, en particulier, est une amélioration significative par rapport à la dalle de 60 Hz, pour une expérience de jeu beaucoup plus fluide. Nous apprécions également l'ajout d'un port HDMI, mais le passage à la mémoire vive soudée pourrait finalement déranger certains utilisateurs. Nous soupçonnons que Lenovo a opté pour une RAM non amovible afin de prendre en charge une solution de refroidissement légèrement plus grande pour le GPU TGP 90 W plus rapide.
La mise à jour des performances d'une année sur l'autre par rapport au ThinkBook 16p Gen 2 est trop faible pour être perceptible dans la plupart des circonstances. Toutefois, la nouvelle option d'affichage 165 Hz, plus impressionnante, contribue à distinguer le ThinkBook 16p Gen 3 de la plupart des autres ordinateurs portables de 16 pouces actuellement sur le marché.
Les utilisateurs peuvent économiser un peu d'argent et obtenir presque le même niveau de performance que le modèle Gen 3 en achetant une version Gen 2 plus ancienne mais visuellement identique. Gardez à l'esprit que Lenovo demande une prime pour le ThinkBook 15p Gen 3 à l'heure actuelle par rapport à la concurrence Dell Inspiron 16 Plus 7620 ou HP Envy 16. Le modèle Lenovo comprend l'option de panneau 165 Hz qui n'est actuellement pas disponible sur les alternatives Dell ou HP susmentionnées.
Prix et disponibilité
Le ThinkBook 16p n'est pas encore largement disponible auprès de canaux tiers comme Amazon, Best Buy ou Newegg. Nous recommandons d'acheter directement auprès de Lenovo qui livre actuellement des configurations Ryzen 5 6600H et Ryzen 7 6800H à partir de 2460 USD.
Lenovo ThinkBook 16p G3 ARH
- 10/08/2022 v7 (old)
Allen Ngo
Price comparison

