Courte critique du PC portable HP Pavilion 15t X7P44AV (7700HQ, FHD, GTX 1050)
| SD Card Reader | |
| average JPG Copy Test (av. of 3 runs) | |
| HP Pavilion 15t-X7P42AV | |
| Lenovo IdeaPad 510-15IKB 80SV0087GE | |
| Dell XPS 15 2017 9560 (7300HQ, Full-HD) | |
| Asus N552VX-FY103T | |
| maximum AS SSD Seq Read Test (1GB) | |
| Dell XPS 15 2017 9560 (7300HQ, Full-HD) | |
| HP Pavilion 15t-X7P42AV | |
| Asus N552VX-FY103T | |
| Lenovo IdeaPad 510-15IKB 80SV0087GE | |
| Networking | |
| iperf3 transmit AX12 | |
| Apple MacBook Pro 15 2016 (2.6 GHz, 450) (Klaus I211) | |
| Dell XPS 15 2017 9560 (7300HQ, Full-HD) | |
| HP Pavilion 15t-X7P42AV | |
| iperf3 receive AX12 | |
| Apple MacBook Pro 15 2016 (2.6 GHz, 450) (Klaus I211) | |
| Dell XPS 15 2017 9560 (7300HQ, Full-HD) | |
| HP Pavilion 15t-X7P42AV | |
| |||||||||||||||||||||||||
Homogénéité de la luminosité: 75 %
Valeur mesurée au centre, sur batterie: 209.7 cd/m²
Contraste: 1104:1 (Valeurs des noirs: 0.19 cd/m²)
ΔE ColorChecker Calman: 7.8 | ∀{0.5-29.43 Ø4.71}
ΔE Greyscale Calman: 7.3 | ∀{0.09-98 Ø4.96}
56.5% sRGB (Argyll 1.6.3 3D)
39.3% AdobeRGB 1998 (Argyll 1.6.3 3D)
39.29% AdobeRGB 1998 (Argyll 3D)
56.5% sRGB (Argyll 3D)
38.03% Display P3 (Argyll 3D)
Gamma: 2.39
CCT: 5771 K
| HP Pavilion 15t-X7P42AV AU Optronics AUO41ED, IPS, 15.6", 1920x1080 | Dell XPS 15 2017 9560 (7300HQ, Full-HD) Sharp SHP1453 LQ156M1, LED IGZO IPS InfinityEdge, 15.6", 1920x1080 | Lenovo IdeaPad 510-15IKB 80SV0087GE BOE HF NV156FHM-N42, IPS, 15.6", 1920x1080 | Asus N552VX-FY103T LG Philips LP156WF6-SPB5, AH-IPS, 15.6", 1920x1080 | MSI PE60 6QE-056XUS Name: Chi Mei N156HGE-EAL, ID: CMN15D2, TN LED, 15.6", 1920x1080 | HP Pavilion 15 UHD T9Y85AV SDC5958, IPS, 15.6", 3840x2160 | |
|---|---|---|---|---|---|---|
| Display | 79% | 12% | 66% | 106% | 56% | |
| Display P3 Coverage (%) | 38.03 | 68.9 81% | 42.66 12% | 67.9 79% | 86 126% | 60 58% |
| sRGB Coverage (%) | 56.5 | 98.9 75% | 64.1 13% | 87.7 55% | 99.8 77% | 85.8 52% |
| AdobeRGB 1998 Coverage (%) | 39.29 | 70.9 80% | 44.08 12% | 64 63% | 84.2 114% | 61.8 57% |
| Response Times | -58% | -28% | 5% | 1% | 6% | |
| Response Time Grey 50% / Grey 80% * (ms) | 44.4 ? | 54 ? -22% | 51 ? -15% | 42 ? 5% | 43.6 ? 2% | 39.6 ? 11% |
| Response Time Black / White * (ms) | 27.2 ? | 52.4 ? -93% | 38 ? -40% | 26 ? 4% | 27.6 ? -1% | 27.2 ? -0% |
| PWM Frequency (Hz) | 50 ? | 1000 ? | 1282 ? | |||
| Screen | 45% | 25% | 27% | -8% | 14% | |
| Brightness middle (cd/m²) | 209.7 | 400 91% | 291 39% | 336 60% | 200.1 -5% | 336.2 60% |
| Brightness (cd/m²) | 193 | 392 103% | 265 37% | 304 58% | 194 1% | 323 67% |
| Brightness Distribution (%) | 75 | 89 19% | 86 15% | 85 13% | 86 15% | 87 16% |
| Black Level * (cd/m²) | 0.19 | 0.26 -37% | 0.23 -21% | 0.34 -79% | 0.429 -126% | 0.629 -231% |
| Contrast (:1) | 1104 | 1538 39% | 1265 15% | 988 -11% | 466 -58% | 534 -52% |
| Colorchecker dE 2000 * | 7.8 | 4.9 37% | 4.78 39% | 5.26 33% | 10.63 -36% | 3.32 57% |
| Colorchecker dE 2000 max. * | 24.1 | 11 54% | 9.51 61% | 10.49 56% | 18.19 25% | 7.4 69% |
| Greyscale dE 2000 * | 7.3 | 7.2 1% | 3.49 52% | 4.26 42% | 11.51 -58% | 2.88 61% |
| Gamma | 2.39 92% | 2.11 104% | 2.58 85% | 2.35 94% | 2.23 99% | 2.34 94% |
| CCT | 5771 113% | 6911 94% | 6013 108% | 6758 96% | 14492 45% | 6279 104% |
| Color Space (Percent of AdobeRGB 1998) (%) | 39.3 | 64.2 63% | 40 2% | 57 45% | 74.6 90% | 55.3 41% |
| Color Space (Percent of sRGB) (%) | 56.5 | 98.9 75% | 64 13% | 88 56% | 99.8 77% | 85.5 51% |
| Moyenne finale (programmes/paramètres) | 22% /
38% | 3% /
16% | 33% /
32% | 33% /
16% | 25% /
21% |
* ... Moindre est la valeur, meilleures sont les performances
Temps de réponse de l'écran
| ↔ Temps de réponse noir à blanc | ||
|---|---|---|
| 27.2 ms ... hausse ↗ et chute ↘ combinées | ↗ 6.8 ms hausse | 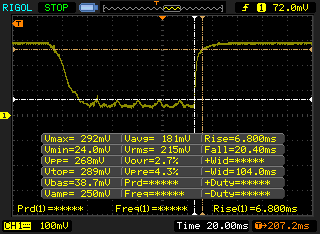 |
| ↘ 20.4 ms chute | ||
| L'écran souffre de latences relativement élevées, insuffisant pour le jeu. En comparaison, tous les appareils testés affichent entre 0.1 (minimum) et 240 (maximum) ms. » 69 % des appareils testés affichent de meilleures performances. Cela signifie que les latences relevées sont moins bonnes que la moyenne (19.8 ms) de tous les appareils testés. | ||
| ↔ Temps de réponse gris 50% à gris 80% | ||
| 44.4 ms ... hausse ↗ et chute ↘ combinées | ↗ 15.2 ms hausse | 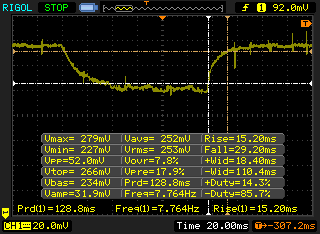 |
| ↘ 29.2 ms chute | ||
| L'écran souffre de latences très élevées, à éviter pour le jeu. En comparaison, tous les appareils testés affichent entre 0.165 (minimum) et 636 (maximum) ms. » 76 % des appareils testés affichent de meilleures performances. Cela signifie que les latences relevées sont moins bonnes que la moyenne (31 ms) de tous les appareils testés. | ||
Scintillement / MLI (Modulation de largeur d'impulsion)
| Scintillement / MLI (Modulation de largeur d'impulsion) non décelé | 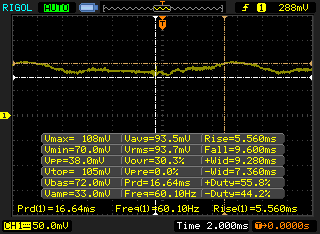 | ||
En comparaison, 52 % des appareils testés n'emploient pas MDI pour assombrir leur écran. Nous avons relevé une moyenne à 7754 (minimum : 5 - maximum : 343500) Hz dans le cas où une MDI était active. | |||
| Cinebench R15 | |
| CPU Single 64Bit | |
| HP Pavilion 15t-X7P42AV | |
| HP Pavilion 17t-ab200 | |
| Lenovo IdeaPad 510-15IKB 80SV0087GE | |
| Asus N552VX-FY103T | |
| Dell XPS 15 2017 9560 (7300HQ, Full-HD) | |
| HP Pavilion 15 UHD T9Y85AV | |
| MSI PE60 6QE-056XUS | |
| CPU Multi 64Bit | |
| HP Pavilion 15t-X7P42AV | |
| HP Pavilion 17t-ab200 | |
| MSI PE60 6QE-056XUS | |
| HP Pavilion 15 UHD T9Y85AV | |
| Asus N552VX-FY103T | |
| Dell XPS 15 2017 9560 (7300HQ, Full-HD) | |
| Lenovo IdeaPad 510-15IKB 80SV0087GE | |
| Cinebench R10 | |
| Rendering Multiple CPUs 32Bit | |
| Asus N552VX-FY103T | |
| MSI PE60 6QE-056XUS | |
| HP Pavilion 15 UHD T9Y85AV | |
| HP Pavilion 15t-X7P42AV | |
| Lenovo IdeaPad 510-15IKB 80SV0087GE | |
| Rendering Single 32Bit | |
| HP Pavilion 15t-X7P42AV | |
| Lenovo IdeaPad 510-15IKB 80SV0087GE | |
| MSI PE60 6QE-056XUS | |
| Asus N552VX-FY103T | |
| HP Pavilion 15 UHD T9Y85AV | |
| wPrime 2.10 - 1024m | |
| HP Pavilion 15t-X7P42AV | |
| HP Pavilion 17t-ab200 | |
| MSI PE60 6QE-056XUS | |
| HP Pavilion 15 UHD T9Y85AV | |
* ... Moindre est la valeur, meilleures sont les performances
| PCMark 8 | |
| Home Score Accelerated v2 | |
| HP Pavilion 17t-ab200 | |
| HP Pavilion 15t-X7P42AV | |
| Lenovo IdeaPad 510-15IKB 80SV0087GE | |
| MSI PE60 6QE-056XUS | |
| Dell XPS 15 2017 9560 (7300HQ, Full-HD) | |
| Asus N552VX-FY103T | |
| HP Pavilion 15 UHD T9Y85AV | |
| Work Score Accelerated v2 | |
| HP Pavilion 17t-ab200 | |
| Dell XPS 15 2017 9560 (7300HQ, Full-HD) | |
| MSI PE60 6QE-056XUS | |
| Asus N552VX-FY103T | |
| HP Pavilion 15 UHD T9Y85AV | |
| HP Pavilion 15t-X7P42AV | |
| Creative Score Accelerated v2 | |
| HP Pavilion 17t-ab200 | |
| HP Pavilion 15t-X7P42AV | |
| MSI PE60 6QE-056XUS | |
| HP Pavilion 15 UHD T9Y85AV | |
| PCMark 8 Home Score Accelerated v2 | 4182 points | |
| PCMark 8 Creative Score Accelerated v2 | 5275 points | |
| PCMark 8 Work Score Accelerated v2 | 2880 points | |
Aide | ||
| HP Pavilion 15t-X7P42AV Samsung CM871a MZNTY128HDHP | Dell XPS 15 2017 9560 (7300HQ, Full-HD) WDC WD10SPCX-75KHST0 + SanDisk Z400s M.2 2242 32 GB Cache | Lenovo IdeaPad 510-15IKB 80SV0087GE Liteonit CV3-DE256 | MSI PE60 6QE-056XUS Intel SSD 535 SSDSCKJW120H6 | HP Pavilion 15 UHD T9Y85AV SanDisk Z400s SD8SNAT-128G | HP Pavilion 17t-ab200 Samsung CM871a MZNTY128HDHP | |
|---|---|---|---|---|---|---|
| CrystalDiskMark 3.0 | -83% | 7% | -36% | -22% | -10% | |
| Read Seq (MB/s) | 522 | 123 -76% | 469.2 -10% | 445.3 -15% | 484.6 -7% | 520 0% |
| Write Seq (MB/s) | 476.6 | 74.2 -84% | 431.5 -9% | 173.9 -64% | 185.2 -61% | 353.6 -26% |
| Read 512 (MB/s) | 399.7 | 101.7 -75% | 338.3 -15% | 212.4 -47% | 307.6 -23% | 376.2 -6% |
| Write 512 (MB/s) | 185.4 | 42.51 -77% | 297.9 61% | 133.7 -28% | 180 -3% | 118.5 -36% |
| Read 4k (MB/s) | 33.12 | 10.84 -67% | 28.68 -13% | 17.6 -47% | 22.08 -33% | 32.7 -1% |
| Write 4k (MB/s) | 89.8 | 1.021 -99% | 66.8 -26% | 83.6 -7% | 77.7 -13% | 85.3 -5% |
| Read 4k QD32 (MB/s) | 400.9 | 69.8 -83% | 364.7 -9% | 109.1 -73% | 143.7 -64% | 399 0% |
| Write 4k QD32 (MB/s) | 140.2 | 1.057 -99% | 245.9 75% | 130.7 -7% | 177.6 27% | 132.5 -5% |

| 3DMark 11 | |
| 1280x720 Performance GPU | |
| Dell XPS 15 2017 9560 (7300HQ, Full-HD) | |
| HP Pavilion 17t-ab200 | |
| HP Pavilion 15t-X7P42AV | |
| MSI PE60 6QE-056XUS | |
| HP Pavilion 15 UHD T9Y85AV | |
| Asus N552VX-FY103T | |
| HP Spectre x360 15-bl002xx | |
| Lenovo IdeaPad 510-15IKB 80SV0087GE | |
| 1280x720 Performance Combined | |
| HP Pavilion 17t-ab200 | |
| HP Pavilion 15t-X7P42AV | |
| Dell XPS 15 2017 9560 (7300HQ, Full-HD) | |
| MSI PE60 6QE-056XUS | |
| HP Pavilion 15 UHD T9Y85AV | |
| Asus N552VX-FY103T | |
| HP Spectre x360 15-bl002xx | |
| Lenovo IdeaPad 510-15IKB 80SV0087GE | |
| 3DMark | |
| 1280x720 Cloud Gate Standard Graphics | |
| Dell XPS 15 2017 9560 (7300HQ, Full-HD) | |
| HP Pavilion 15t-X7P42AV | |
| HP Pavilion 17t-ab200 | |
| MSI PE60 6QE-056XUS | |
| HP Pavilion 15 UHD T9Y85AV | |
| Asus N552VX-FY103T | |
| HP Spectre x360 15-bl002xx | |
| 1920x1080 Fire Strike Graphics | |
| Dell XPS 15 2017 9560 (7300HQ, Full-HD) | |
| HP Pavilion 15t-X7P42AV | |
| HP Pavilion 17t-ab200 | |
| MSI PE60 6QE-056XUS | |
| HP Pavilion 15 UHD T9Y85AV | |
| Asus N552VX-FY103T | |
| HP Spectre x360 15-bl002xx | |
| 1920x1080 Ice Storm Extreme Graphics | |
| HP Pavilion 15t-X7P42AV | |
| MSI PE60 6QE-056XUS | |
| HP Pavilion 15 UHD T9Y85AV | |
| HP Spectre x360 15-bl002xx | |
| 3DMark 11 Performance | 7706 points | |
| 3DMark Ice Storm Standard Score | 87227 points | |
| 3DMark Cloud Gate Standard Score | 19978 points | |
| 3DMark Fire Strike Score | 5528 points | |
| 3DMark Fire Strike Extreme Score | 2653 points | |
Aide | ||
| Bas | Moyen | Élevé | Ultra | |
|---|---|---|---|---|
| Dirt 3 (2011) | 176.1 | 161 | 152.9 | 102 |
| Tomb Raider (2013) | 106.5 | 87.6 | 75.6 | 42.3 |
| BioShock Infinite (2013) | 205.3 | 162.6 | 150.2 | 64.8 |
| Metro: Last Light (2013) | 135.2 | 126 | 83.1 | 43.9 |
| GRID 2 (2013) | 161.5 | 131.8 | 123 | 75.1 |
| Company of Heroes 2 (2013) | 65.6 | 61.7 | 58.8 | 45.2 |
| GRID: Autosport (2014) | 220.8 | 135.3 | 121.3 | 78.3 |
| Middle-earth: Shadow of Mordor (2014) | 169.7 | 105.8 | 58.7 | 45.2 |
| The Witcher 3 (2015) | 120.4 | 70.1 | 39.9 | 21.4 |
Degré de la nuisance sonore
| Au repos |
| 32.3 / 32.3 / 32.4 dB(A) |
| Fortement sollicité |
| 44.4 / 49.2 dB(A) |
 | ||
30 dB silencieux 40 dB(A) audible 50 dB(A) bruyant |
||
min: | ||
| HP Pavilion 15t-X7P42AV GeForce GTX 1050 Mobile, i7-7700HQ, Samsung CM871a MZNTY128HDHP | Dell XPS 15 2017 9560 (7300HQ, Full-HD) GeForce GTX 1050 Mobile, i5-7300HQ, WDC WD10SPCX-75KHST0 + SanDisk Z400s M.2 2242 32 GB Cache | Lenovo IdeaPad 510-15IKB 80SV0087GE GeForce 940MX, i7-7500U, Liteonit CV3-DE256 | MSI PE60 6QE-056XUS GeForce GTX 960M, 6700HQ, Intel SSD 535 SSDSCKJW120H6 | HP Pavilion 15 UHD T9Y85AV GeForce GTX 960M, 6700HQ, SanDisk Z400s SD8SNAT-128G | HP Pavilion 17t-ab200 GeForce GTX 1050 Mobile, i7-7700HQ, Samsung CM871a MZNTY128HDHP | |
|---|---|---|---|---|---|---|
| Noise | -1% | 6% | 1% | 1% | -7% | |
| arrêt / environnement * (dB) | 29.3 | 30.3 -3% | 31.6 -8% | 29.3 -0% | 29.5 -1% | 30.8 -5% |
| Idle Minimum * (dB) | 32.3 | 31.6 2% | 32.6 -1% | 32.4 -0% | 32.3 -0% | 35.3 -9% |
| Idle Average * (dB) | 32.3 | 31.6 2% | 32.6 -1% | 32.4 -0% | 32.4 -0% | 35.4 -10% |
| Idle Maximum * (dB) | 32.4 | 33.4 -3% | 32.6 -1% | 35.4 -9% | 32.4 -0% | 35.4 -9% |
| Load Average * (dB) | 44.4 | 47.8 -8% | 35.3 20% | 40.5 9% | 40.5 9% | 48.6 -9% |
| Load Maximum * (dB) | 49.2 | 47.8 3% | 37.1 25% | 45.3 8% | 50.3 -2% | 49.8 -1% |
* ... Moindre est la valeur, meilleures sont les performances
(±) La température maximale du côté supérieur est de 41.8 °C / 107 F, par rapport à la moyenne de 36.8 °C / 98 F, allant de 21 à 71 °C pour la classe Multimedia.
(+) Le fond chauffe jusqu'à un maximum de 33.4 °C / 92 F, contre une moyenne de 39.1 °C / 102 F
(+) En utilisation inactive, la température moyenne du côté supérieur est de 22.5 °C / 73 F, par rapport à la moyenne du dispositif de 31.3 °C / 88 F.
(+) En jouant à The Witcher 3, la température moyenne du côté supérieur est de 28.9 °C / 84 F, alors que la moyenne de l'appareil est de 31.3 °C / 88 F.
(±) Les repose-poignets et le pavé tactile peuvent devenir très chauds au toucher, avec un maximum de 37.6 °C / 99.7# F.
(-) La température moyenne de la zone de l'appui-paume de dispositifs similaires était de 28.7 °C / 83.7 F (-8.9 °C / #-16 F).
| Éteint/en veille | |
| Au repos | |
| Fortement sollicité |
|
Légende:
min: | |
| HP Pavilion 15t-X7P42AV i7-7700HQ, GeForce GTX 1050 Mobile, Samsung CM871a MZNTY128HDHP, IPS, 1920x1080, 15.6" | Dell XPS 15 2017 9560 (7300HQ, Full-HD) i5-7300HQ, GeForce GTX 1050 Mobile, WDC WD10SPCX-75KHST0 + SanDisk Z400s M.2 2242 32 GB Cache, LED IGZO IPS InfinityEdge, 1920x1080, 15.6" | Lenovo IdeaPad 510-15IKB 80SV0087GE i7-7500U, GeForce 940MX, Liteonit CV3-DE256, IPS, 1920x1080, 15.6" | MSI PE60 6QE-056XUS 6700HQ, GeForce GTX 960M, Intel SSD 535 SSDSCKJW120H6, TN LED, 1920x1080, 15.6" | HP Pavilion 15 UHD T9Y85AV 6700HQ, GeForce GTX 960M, SanDisk Z400s SD8SNAT-128G, IPS, 3840x2160, 15.6" | HP Pavilion 17t-ab200 i7-7700HQ, GeForce GTX 1050 Mobile, Samsung CM871a MZNTY128HDHP, IPS, 1920x1080, 17.3" | Asus N552VX-FY103T 6700HQ, GeForce GTX 950M, Toshiba MQ02ABD100H, AH-IPS, 1920x1080, 15.6" | HP Spectre x360 15-bl002xx i7-7500U, GeForce 940MX, Toshiba XG4 NVMe (THNSN5512GPUK), IPS, 3840x2160, 15.6" | |
|---|---|---|---|---|---|---|---|---|
| Power Consumption | 4% | 38% | -37% | -22% | -4% | -1% | 9% | |
| Idle Minimum * (Watt) | 8.29 | 6.6 20% | 3.9 53% | 9.7 -17% | 8.3 -0% | 8.2 1% | 7 16% | 8.14 2% |
| Idle Average * (Watt) | 8.9 | 9 -1% | 7.4 17% | 13.1 -47% | 14.8 -66% | 11 -24% | 10.9 -22% | 10.91 -23% |
| Idle Maximum * (Watt) | 10.2 | 10.7 -5% | 9.5 7% | 23.2 -127% | 16.8 -65% | 11.1 -9% | 12.9 -26% | 12.26 -20% |
| Load Average * (Watt) | 77.1 | 77.5 -1% | 41 47% | 79.1 -3% | 71 8% | 77 -0% | 72 7% | 45.67 41% |
| Load Maximum * (Watt) | 136.6 | 130 5% | 48 65% | 122.9 10% | 119.2 13% | 116.9 14% | 109 20% | 74.94 45% |
* ... Moindre est la valeur, meilleures sont les performances
| HP Pavilion 15t-X7P42AV i7-7700HQ, GeForce GTX 1050 Mobile, 63.3 Wh | Dell XPS 15 2017 9560 (7300HQ, Full-HD) i5-7300HQ, GeForce GTX 1050 Mobile, 56 Wh | MSI PE60 6QE-056XUS 6700HQ, GeForce GTX 960M, 42 Wh | HP Pavilion 15 UHD T9Y85AV 6700HQ, GeForce GTX 960M, 61.5 Wh | HP Pavilion 17t-ab200 i7-7700HQ, GeForce GTX 1050 Mobile, 62 Wh | Asus N552VX-FY103T 6700HQ, GeForce GTX 950M, 44 Wh | HP Spectre x360 15-bl002xx i7-7500U, GeForce 940MX, 79.2 Wh | |
|---|---|---|---|---|---|---|---|
| Autonomie de la batterie | -27% | -52% | -32% | -11% | -45% | 20% | |
| Reader / Idle (h) | 16 | 9.4 -41% | 5.7 -64% | 8.5 -47% | 11.5 -28% | 6 -62% | 14.4 -10% |
| WiFi v1.3 (h) | 6.5 | 5.6 -14% | 3 -54% | 4.4 -32% | 6.8 5% | 4.5 -31% | 8.9 37% |
| Load (h) | 1.9 | 1.4 -26% | 1.2 -37% | 1.6 -16% | 1.7 -11% | 1.1 -42% | 2.5 32% |
Points positifs
Points négatifs
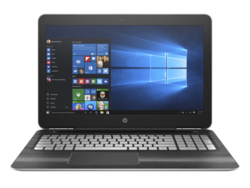

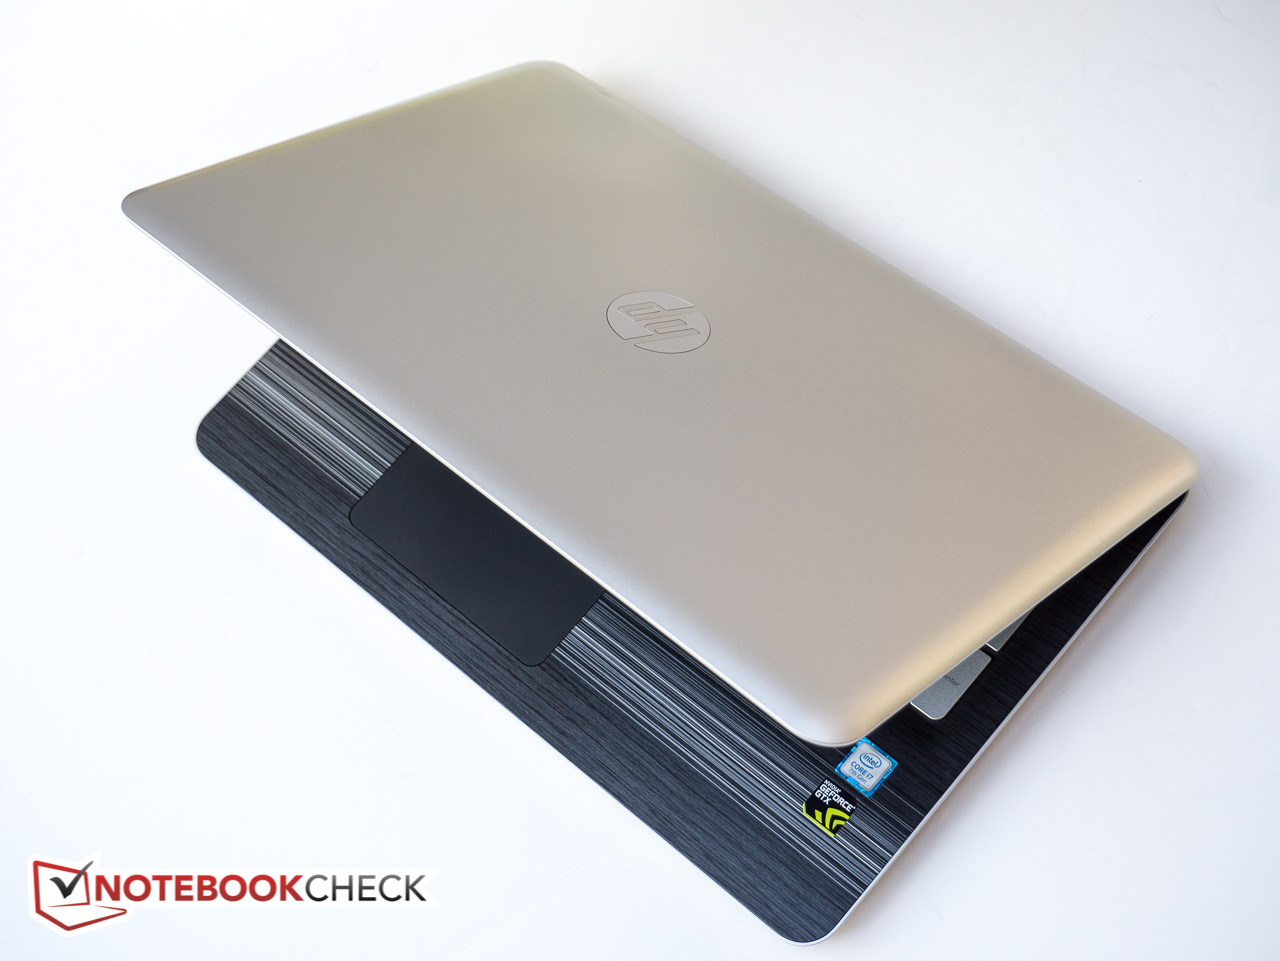
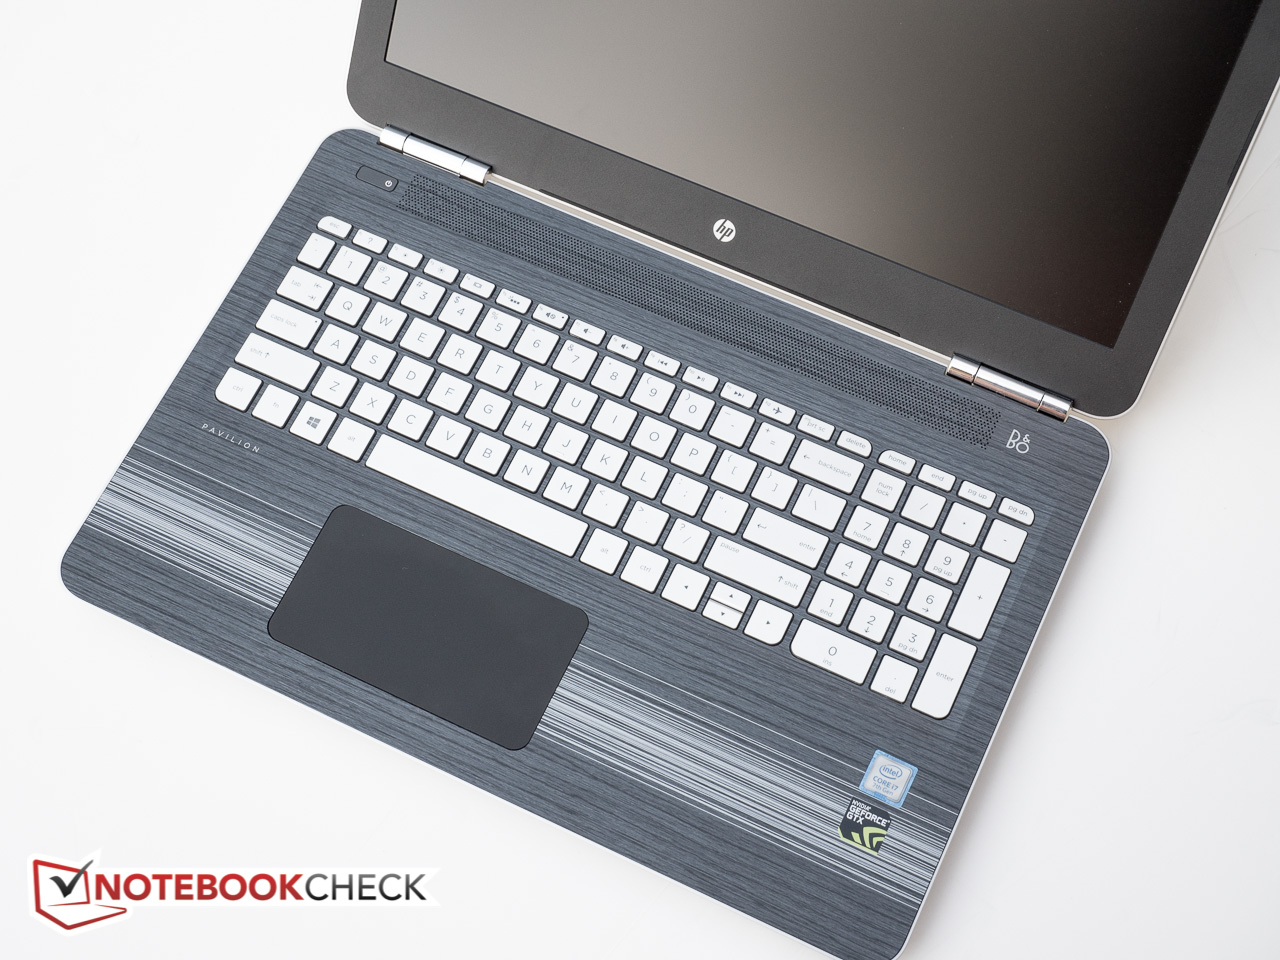
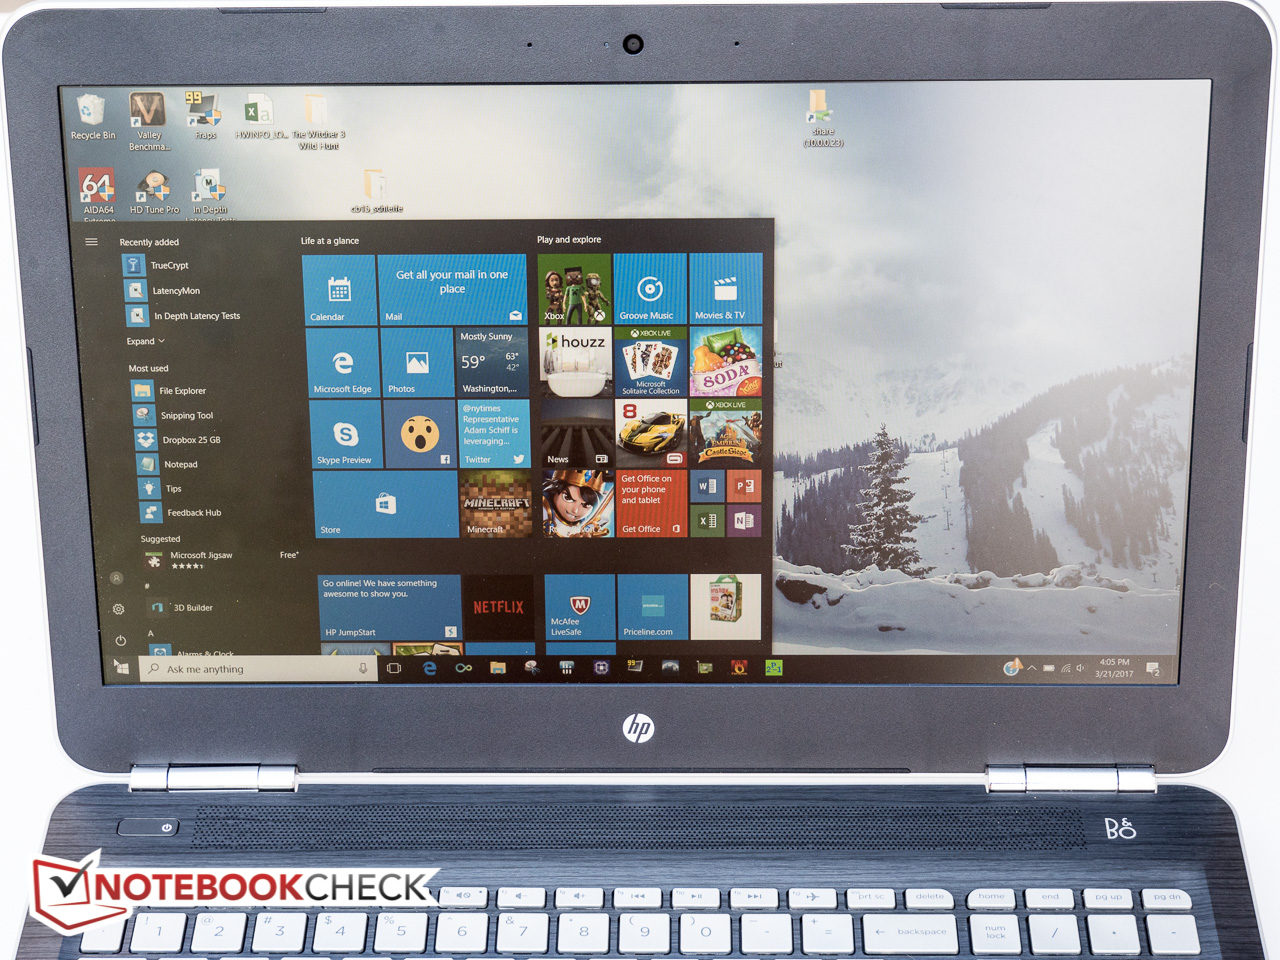
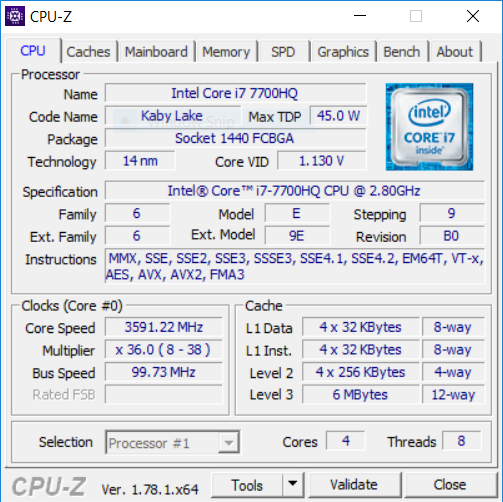
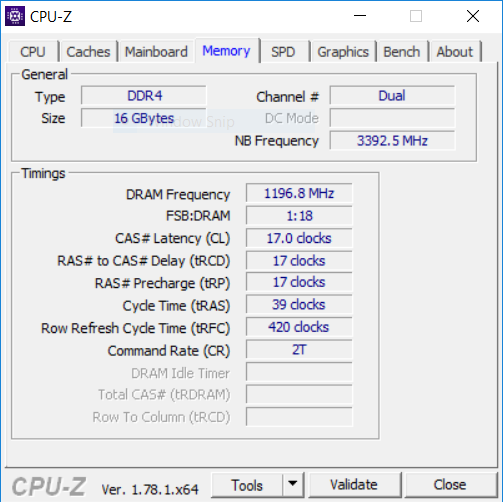
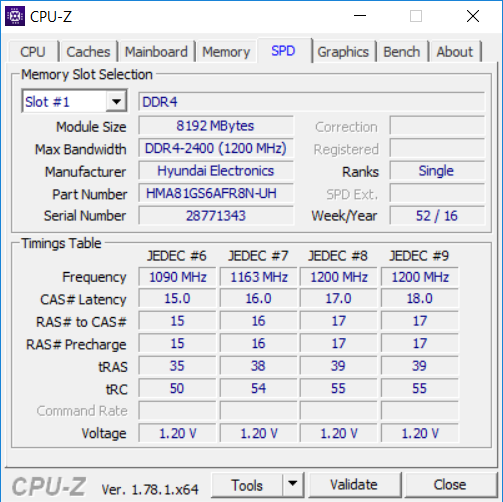
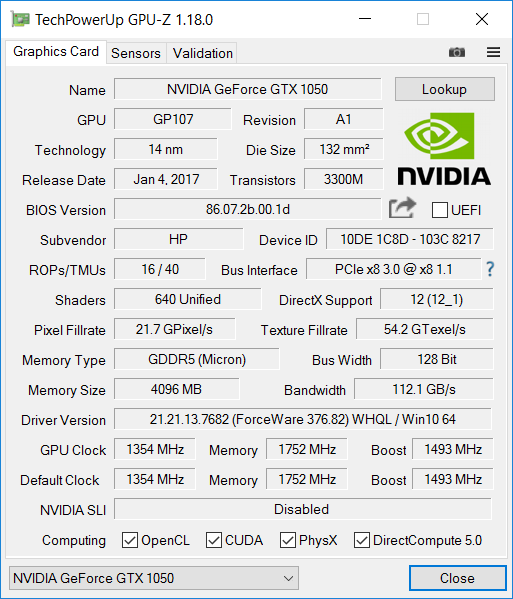
Le Pavilion 15t X7P44AV offre de bonne performances à un prix raisonnable. Le châssis en plastique n'inspire pas vraiment confiance et est loin de l'élégance de ses concurrents en aluminium, mais les composants internes sont très intéressants: CPU quad core Intel Kaby Lake, 16 Go de RAM, deux unités de stockage et GPU GeForce GTX 1050; le système fait tourner toutes les applications sans soucis. Les utilisateurs recherchant un appareil polyvalent seront également ravis par les performances en jeu du 15t X744AV, qui surpasse sans difficulté ses concurrents équipés du GPU GeForce 940MX.
Comme c'est souvent le cas, le point faible majeur de ce PC est son écran. Avec une luminosité maximum de seulement 190 cd/m², l'écran mat est plutôt sombre avec une colorimétrie médiocre et une faible couverture des espaces de couleur. Même si l'autonomie a été améliorée par rapport au modèle précédent, la faible luminosité rend difficile l'utilisation en extérieur. L'option d'écran UHD impliquera surement une réduction de l'autonomie et une charge plus importante pour le GPU, mais si sa luminosité est meilleure, nous le recommanderons face à la version Full HD.
Le principal point fort des Pavilion avec CPU quad core est leur prix relativement abordable: Pour une configuration comprenant un Intel Core i5-7300HQ, 8 Go de RAM, un GPU GeForce GTX 1050 (mais avec seulement 2 Go de VRAM dans ce cas) et un SSD PCIe-NVMe de 256 Go, le PC revient à environ 730 € (800 $US).
Pour une utilisation multimédia ou un peu de jeu occasionnel, le HP Pavilion 15t peut être un bon choix - pourvu que l'utilisateur soit bien au courant de ses défauts.
Pour plus de détails, la version complète de ce test (en anglais) est disponible ici.
HP Pavilion 15t-X7P42AV
- 03/28/2017 v6 (old)
Bernhard Pechlaner
Price comparison
