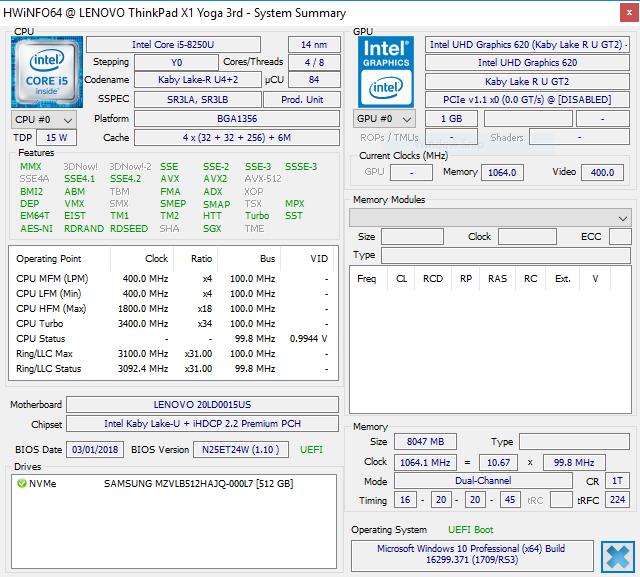
Courte critique du convertible Lenovo ThinkPad X1 Yoga 2018 (Core i5-8250U, FHD)
| |||||||||||||||||||||||||
Homogénéité de la luminosité: 75 %
Valeur mesurée au centre, sur batterie: 267.2 cd/m²
Contraste: 990:1 (Valeurs des noirs: 0.27 cd/m²)
ΔE ColorChecker Calman: 3.5 | ∀{0.5-29.43 Ø4.73}
calibrated: 3.81
ΔE Greyscale Calman: 1.3 | ∀{0.09-98 Ø4.97}
86% sRGB (Argyll 1.6.3 3D)
56% AdobeRGB 1998 (Argyll 1.6.3 3D)
61.9% AdobeRGB 1998 (Argyll 3D)
86.4% sRGB (Argyll 3D)
60.9% Display P3 (Argyll 3D)
Gamma: 2.146
CCT: 6523 K
| Lenovo ThinkPad X1 Yoga 2018-20LD0015US Lenovo LEN40A9, IPS, 14", 1920x1080 | Lenovo ThinkPad X1 Yoga 2018-20LES01W00 Lenovo 40AE / B140QAN02.0, IPS Dolby Vision HDR, 14", 2560x1440 | Lenovo Yoga 920-13IKB-80Y7 AU Optronics B139HAN03.0, IPS, 13.9", 1920x1080 | Dell XPS 13-9365 2-in-1 IPS, 13.3", 1920x1080 | HP EliteBook x360 1030 G2 CMN1374, IPS, 13.3", 1920x1080 | Microsoft Surface Pro (2017) i5 LG Display LP123WQ112604, IPS, 12.3", 2736x1824 | Asus ZenBook Flip 14 UX461UA BOE NV140FHM-N62, IPS, 14", 1920x1080 | |
|---|---|---|---|---|---|---|---|
| Display | 40% | 4% | -20% | 5% | 13% | 1% | |
| Display P3 Coverage (%) | 60.9 | 86.5 42% | 62.5 3% | 47.32 -22% | 65.5 8% | 67.6 11% | 64.4 6% |
| sRGB Coverage (%) | 86.4 | 100 16% | 91.7 6% | 71.1 -18% | 88.8 3% | 99 15% | 84.6 -2% |
| AdobeRGB 1998 Coverage (%) | 61.9 | 99.4 61% | 64.1 4% | 48.83 -21% | 64.9 5% | 69.1 12% | 61.8 0% |
| Response Times | -12% | -12% | -17% | -16% | -3% | -12% | |
| Response Time Grey 50% / Grey 80% * (ms) | 40.4 ? | 56.8 ? -41% | 46 ? -14% | 48 ? -19% | 55.2 ? -37% | 42 ? -4% | 44 ? -9% |
| Response Time Black / White * (ms) | 28.8 ? | 24 ? 17% | 31.6 ? -10% | 32.8 ? -14% | 27.2 ? 6% | 29 ? -1% | 33 ? -15% |
| PWM Frequency (Hz) | 1042 ? | 21000 | 200 ? | ||||
| Screen | 18% | -57% | -57% | -44% | 13% | -33% | |
| Brightness middle (cd/m²) | 267.2 | 562 110% | 297.9 11% | 322.6 21% | 262 -2% | 417 56% | 302 13% |
| Brightness (cd/m²) | 239 | 522 118% | 278 16% | 306 28% | 256 7% | 401 68% | 288 21% |
| Brightness Distribution (%) | 75 | 86 15% | 81 8% | 91 21% | 83 11% | 88 17% | 90 20% |
| Black Level * (cd/m²) | 0.27 | 0.3 -11% | 0.44 -63% | 0.19 30% | 0.25 7% | 0.29 -7% | 0.57 -111% |
| Contrast (:1) | 990 | 1873 89% | 677 -32% | 1698 72% | 1048 6% | 1438 45% | 530 -46% |
| Colorchecker dE 2000 * | 3.5 | 2.8 20% | 5.1 -46% | 7.7 -120% | 5.13 -47% | 3.63 -4% | 5.17 -48% |
| Colorchecker dE 2000 max. * | 6.4 | 5.8 9% | 11 -72% | 11.1 -73% | 9.46 -48% | 6.74 -5% | 7.68 -20% |
| Colorchecker dE 2000 calibrated * | 3.81 | ||||||
| Greyscale dE 2000 * | 1.3 | 4.5 -246% | 6.7 -415% | 7.9 -508% | 6.23 -379% | 2.18 -68% | 3.26 -151% |
| Gamma | 2.146 103% | 2.16 102% | 2.9 76% | 2.88 76% | 2.45 90% | 3.09 71% | 2.45 90% |
| CCT | 6523 100% | 7205 90% | 6839 95% | 7044 92% | 6413 101% | 6767 96% | 7142 91% |
| Color Space (Percent of AdobeRGB 1998) (%) | 56 | 88.9 59% | 64.1 14% | 44.1 -21% | 57.84 3% | 63 13% | 55 -2% |
| Color Space (Percent of sRGB) (%) | 86 | 100 16% | 91.7 7% | 69.9 -19% | 88.57 3% | 99 15% | 85 -1% |
| Moyenne finale (programmes/paramètres) | 15% /
18% | -22% /
-39% | -31% /
-44% | -18% /
-30% | 8% /
11% | -15% /
-23% |
* ... Moindre est la valeur, meilleures sont les performances
Temps de réponse de l'écran
| ↔ Temps de réponse noir à blanc | ||
|---|---|---|
| 28.8 ms ... hausse ↗ et chute ↘ combinées | ↗ 17.2 ms hausse | 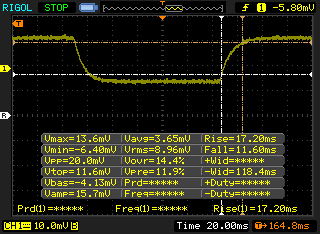 |
| ↘ 11.6 ms chute | ||
| L'écran souffre de latences relativement élevées, insuffisant pour le jeu. En comparaison, tous les appareils testés affichent entre 0.1 (minimum) et 240 (maximum) ms. » 76 % des appareils testés affichent de meilleures performances. Cela signifie que les latences relevées sont moins bonnes que la moyenne (19.9 ms) de tous les appareils testés. | ||
| ↔ Temps de réponse gris 50% à gris 80% | ||
| 40.4 ms ... hausse ↗ et chute ↘ combinées | ↗ 22.4 ms hausse | 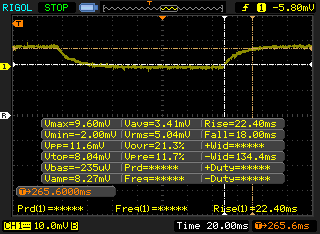 |
| ↘ 18 ms chute | ||
| L'écran souffre de latences très élevées, à éviter pour le jeu. En comparaison, tous les appareils testés affichent entre 0.165 (minimum) et 636 (maximum) ms. » 63 % des appareils testés affichent de meilleures performances. Cela signifie que les latences relevées sont moins bonnes que la moyenne (31.1 ms) de tous les appareils testés. | ||
Scintillement / MLI (Modulation de largeur d'impulsion)
| Scintillement / MLI (Modulation de largeur d'impulsion) non décelé | 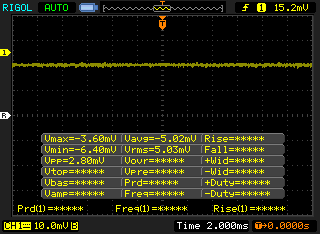 | ||
En comparaison, 52 % des appareils testés n'emploient pas MDI pour assombrir leur écran. Nous avons relevé une moyenne à 7797 (minimum : 5 - maximum : 343500) Hz dans le cas où une MDI était active. | |||
* ... Moindre est la valeur, meilleures sont les performances
| PCMark 8 Home Score Accelerated v2 | 3946 points | |
| PCMark 8 Creative Score Accelerated v2 | 4879 points | |
| PCMark 8 Work Score Accelerated v2 | 4823 points | |
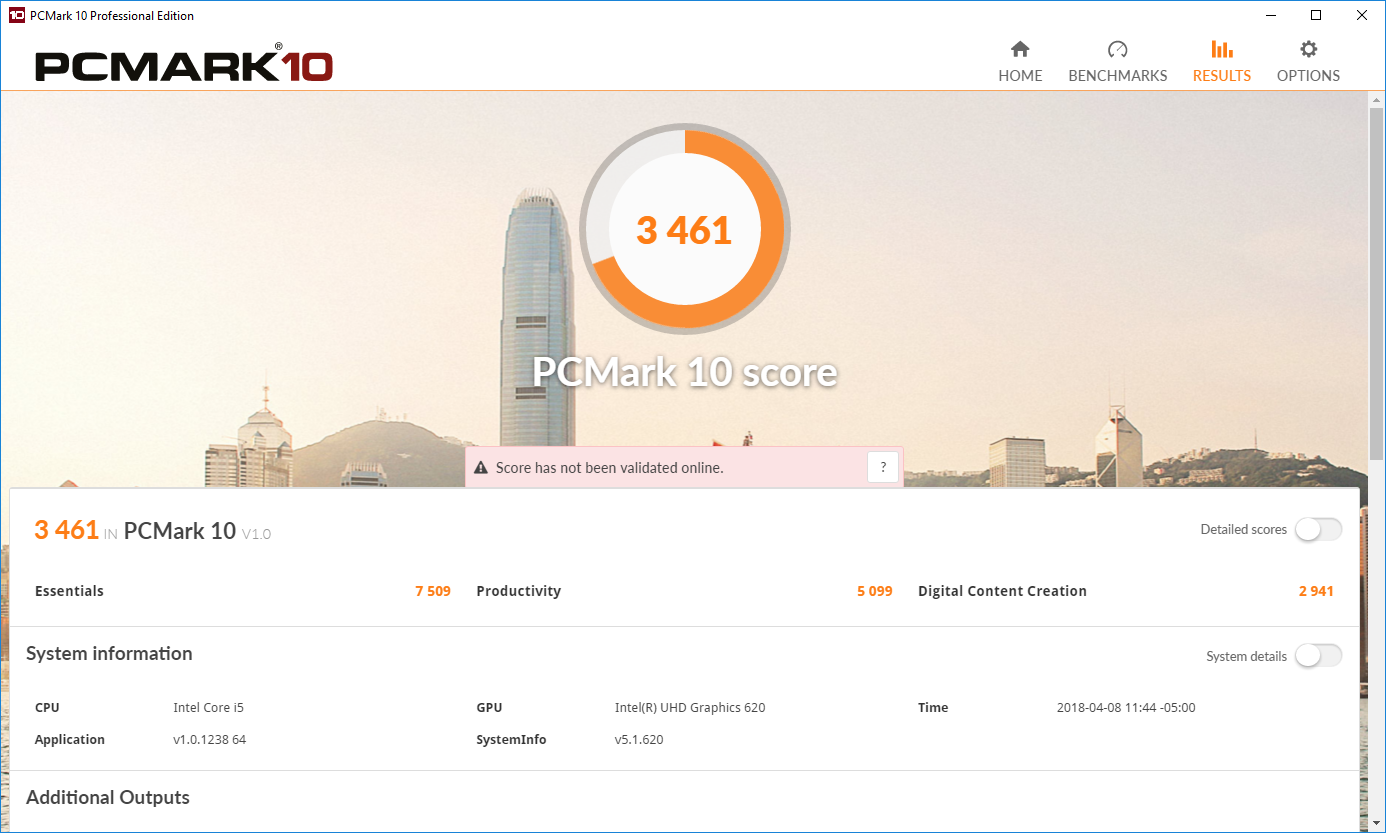
| PCMark 10 Score | 3461 points | |
Aide | ||
| Lenovo ThinkPad X1 Yoga 2018-20LD0015US Samsung SSD PM981 MZVLB512HAJQ | Lenovo Yoga 920-13IKB-80Y7 Samsung PM961 MZVLW256HEHP | Dell XPS 13-9365 2-in-1 Toshiba NVMe THNSN5256GPUK | HP EliteBook x360 1030 G2 Sandisk SD8TN8U-256G-1006 | Microsoft Surface Pro (2017) i5 Samsung PM971 KUS030202M | Asus ZenBook Flip 14 UX461UA SanDisk SD8SN8U256G1002 | Moyenne Samsung SSD PM981 MZVLB512HAJQ | |
|---|---|---|---|---|---|---|---|
| AS SSD | -6% | -29% | -86% | -6942% | -81% | 13% | |
| Copy Game MB/s (MB/s) | 607 | 319.2 -47% | 726 20% | 178.5 -71% | 389 -36% | 186.1 -69% | 1057 ? 74% |
| Copy Program MB/s (MB/s) | 233.5 | 463.3 98% | 263.8 13% | 110.6 -53% | 141 -40% | 118.6 -49% | 454 ? 94% |
| Copy ISO MB/s (MB/s) | 917 | 1341 46% | 950 4% | 255.9 -72% | 572 -38% | 324.1 -65% | 1755 ? 91% |
| Score Total (Points) | 3594 | 2536 -29% | 1495 -58% | 736 -80% | 908 -75% | 3966 ? 10% | |
| Score Write (Points) | 1359 | 608 -55% | 375 -72% | 194 -86% | 236 -83% | 1780 ? 31% | |
| Score Read (Points) | 1487 | 1316 -11% | 752 -49% | 362 -76% | 441 -70% | 1451 ? -2% | |
| Access Time Write * (ms) | 0.037 | 0.028 24% | 0.037 -0% | 0.075 -103% | 23 -62062% | 0.086 -132% | 0.08337 ? -125% |
| Access Time Read * (ms) | 0.043 | 0.044 -2% | 0.045 -5% | 0.143 -233% | 0.071 -65% | 0.123 -186% | 0.05092 ? -18% |
| 4K-64 Write (MB/s) | 1072 | 391.3 -63% | 204.7 -81% | 120.9 -89% | 75 -93% | 146.4 -86% | 1504 ? 40% |
| 4K-64 Read (MB/s) | 1216 | 1039 -15% | 586 -52% | 286.2 -76% | 1222 0% | 368.3 -70% | 1203 ? -1% |
| 4K Write (MB/s) | 102.3 | 128.1 25% | 96.9 -5% | 52.6 -49% | 50.7 -50% | 112 ? 9% | |
| 4K Read (MB/s) | 49.11 | 48.46 -1% | 37.69 -23% | 27.37 -44% | 26.93 -45% | 50.5 ? 3% | |
| Seq Write (MB/s) | 1840 | 885 -52% | 735 -60% | 201.9 -89% | 156.7 -91% | 388.2 -79% | 1637 ? -11% |
| Seq Read (MB/s) | 2218 | 2282 3% | 1283 -42% | 486.9 -78% | 1037 -53% | 459.9 -79% | 1976 ? -11% |
* ... Moindre est la valeur, meilleures sont les performances

| 3DMark 06 Standard Score | 12344 points | |
| 3DMark 11 Performance | 2040 points | |
| 3DMark Cloud Gate Standard Score | 9206 points | |
| 3DMark Fire Strike Score | 1119 points | |
Aide | ||
| Bas | Moyen | Élevé | Ultra | |
|---|---|---|---|---|
| BioShock Infinite (2013) | 56 | 35 | 30 | 10 |
| Civilization 6 (2016) | 37 | 16 | 7 | 6 |
| Farming Simulator 17 (2016) | 65 | 44 | 25 | 10 |
Degré de la nuisance sonore
| Au repos |
| 27.8 / 27.8 / 27.8 dB(A) |
| Fortement sollicité |
| 33.9 / 39.9 dB(A) |
 | ||
30 dB silencieux 40 dB(A) audible 50 dB(A) bruyant |
||
min: | ||
| Lenovo ThinkPad X1 Yoga 2018-20LD0015US UHD Graphics 620, i5-8250U, Samsung SSD PM981 MZVLB512HAJQ | Lenovo ThinkPad X1 Yoga 2018-20LES01W00 UHD Graphics 620, i5-8550U, Samsung SSD PM981 MZVLB512HAJQ | Lenovo Yoga 920-13IKB-80Y7 UHD Graphics 620, i5-8550U, Samsung PM961 MZVLW256HEHP | HP EliteBook x360 1030 G2 HD Graphics 620, i5-7300U, Sandisk SD8TN8U-256G-1006 | Asus ZenBook Flip 14 UX461UA UHD Graphics 620, i5-8250U, SanDisk SD8SN8U256G1002 | |
|---|---|---|---|---|---|
| Noise | -6% | -1% | -1% | -4% | |
| arrêt / environnement * (dB) | 27.8 | 29.1 -5% | 28 -1% | 29 -4% | 30.4 -9% |
| Idle Minimum * (dB) | 27.8 | 29.1 -5% | 28 -1% | 29 -4% | 30.4 -9% |
| Idle Average * (dB) | 27.8 | 29.1 -5% | 28.8 -4% | 29 -4% | 30.4 -9% |
| Idle Maximum * (dB) | 27.8 | 31.3 -13% | 30.3 -9% | 29 -4% | 32 -15% |
| Load Average * (dB) | 33.9 | 37.6 -11% | 34.5 -2% | 33.6 1% | 31.7 6% |
| Load Maximum * (dB) | 39.9 | 37.6 6% | 34.3 14% | 35.8 10% | 35.9 10% |
* ... Moindre est la valeur, meilleures sont les performances
(±) La température maximale du côté supérieur est de 43 °C / 109 F, par rapport à la moyenne de 35.4 °C / 96 F, allant de 19.6 à 60 °C pour la classe Convertible.
(-) Le fond chauffe jusqu'à un maximum de 47.4 °C / 117 F, contre une moyenne de 36.9 °C / 98 F
(+) En utilisation inactive, la température moyenne du côté supérieur est de 22.8 °C / 73 F, par rapport à la moyenne du dispositif de 30.3 °C / 87 F.
(+) Les repose-poignets et le pavé tactile sont plus froids que la température de la peau avec un maximum de 26 °C / 78.8 F et sont donc froids au toucher.
(±) La température moyenne de la zone de l'appui-paume de dispositifs similaires était de 28 °C / 82.4 F (+2 °C / #3.6 F).
Lenovo ThinkPad X1 Yoga 2018-20LD0015US analyse audio
(±) | le niveau sonore du haut-parleur est moyen mais bon (72.9# dB)
Basses 100 - 315 Hz
(-) | presque aucune basse - en moyenne 15.2% plus bas que la médiane
(±) | la linéarité des basses est moyenne (14.1% delta à la fréquence précédente)
Médiums 400 - 2000 Hz
(+) | médiane équilibrée - seulement 3.9% de la médiane
(±) | la linéarité des médiums est moyenne (9.4% delta à la fréquence précédente)
Aiguës 2 - 16 kHz
(+) | des sommets équilibrés - à seulement 2.3% de la médiane
(±) | la linéarité des aigus est moyenne (9.9% delta à la fréquence précédente)
Globalement 100 - 16 000 Hz
(±) | la linéarité du son global est moyenne (19% de différence avec la médiane)
Par rapport à la même classe
» 44% de tous les appareils testés de cette catégorie étaient meilleurs, 7% similaires, 48% pires
» Le meilleur avait un delta de 6%, la moyenne était de 20%, le pire était de 57%.
Par rapport à tous les appareils testés
» 45% de tous les appareils testés étaient meilleurs, 7% similaires, 48% pires
» Le meilleur avait un delta de 4%, la moyenne était de 24%, le pire était de 134%.
HP EliteBook x360 1030 G2 analyse audio
(+) | les haut-parleurs peuvent jouer relativement fort (86.3# dB)
Analysis not possible as minimum curve is missing or too high
| Éteint/en veille | |
| Au repos | |
| Fortement sollicité |
|
Légende:
min: | |
| Lenovo ThinkPad X1 Yoga 2018-20LD0015US i5-8250U, UHD Graphics 620, Samsung SSD PM981 MZVLB512HAJQ, IPS, 1920x1080, 14" | Lenovo ThinkPad X1 Yoga 2018-20LES01W00 i5-8550U, UHD Graphics 620, Samsung SSD PM981 MZVLB512HAJQ, IPS Dolby Vision HDR, 2560x1440, 14" | Lenovo Yoga 920-13IKB-80Y7 i5-8550U, UHD Graphics 620, Samsung PM961 MZVLW256HEHP, IPS, 1920x1080, 13.9" | Dell XPS 13-9365 2-in-1 i7-7Y75, HD Graphics 615, Toshiba NVMe THNSN5256GPUK, IPS, 1920x1080, 13.3" | HP EliteBook x360 1030 G2 i5-7300U, HD Graphics 620, Sandisk SD8TN8U-256G-1006, IPS, 1920x1080, 13.3" | Microsoft Surface Pro (2017) i5 i5-7300U, HD Graphics 620, Samsung PM971 KUS030202M, IPS, 2736x1824, 12.3" | Asus ZenBook Flip 14 UX461UA i5-8250U, UHD Graphics 620, SanDisk SD8SN8U256G1002, IPS, 1920x1080, 14" | |
|---|---|---|---|---|---|---|---|
| Power Consumption | -37% | 7% | 30% | 12% | 2% | -2% | |
| Idle Minimum * (Watt) | 3 | 3.4 -13% | 3.1 -3% | 3.1 -3% | 3.2 -7% | 3.6 -20% | 3.3 -10% |
| Idle Average * (Watt) | 5.4 | 8.8 -63% | 6.6 -22% | 4.3 20% | 5.5 -2% | 8.1 -50% | 6.3 -17% |
| Idle Maximum * (Watt) | 7.5 | 11.9 -59% | 7 7% | 4.9 35% | 6.5 13% | 8.7 -16% | 11 -47% |
| Load Average * (Watt) | 40.1 | 50.4 -26% | 35.2 12% | 24.3 39% | 29.7 26% | 25.5 36% | 30 25% |
| Load Maximum * (Watt) | 57.1 | 71.2 -25% | 34.6 39% | 22.8 60% | 41.3 28% | 23.5 59% | 35.4 38% |
* ... Moindre est la valeur, meilleures sont les performances
| Lenovo ThinkPad X1 Yoga 2018-20LD0015US i5-8250U, UHD Graphics 620, 54 Wh | Lenovo ThinkPad X1 Yoga 2018-20LES01W00 i5-8550U, UHD Graphics 620, 54 Wh | Lenovo Yoga 920-13IKB-80Y7 i5-8550U, UHD Graphics 620, 70 Wh | Dell XPS 13-9365 2-in-1 i7-7Y75, HD Graphics 615, 46 Wh | HP EliteBook x360 1030 G2 i5-7300U, HD Graphics 620, 57 Wh | Microsoft Surface Pro (2017) i5 i5-7300U, HD Graphics 620, 45 Wh | Asus ZenBook Flip 14 UX461UA i5-8250U, UHD Graphics 620, 57 Wh | |
|---|---|---|---|---|---|---|---|
| Autonomie de la batterie | -19% | 14% | 4% | 29% | 8% | -10% | |
| Reader / Idle (h) | 20.3 | 20.1 -1% | 27.6 36% | 16.2 -20% | 23.1 14% | 17.6 -13% | 18.9 -7% |
| WiFi v1.3 (h) | 10.9 | 8.6 -21% | 11.4 5% | 11.4 5% | 10.5 -4% | 12.4 14% | 9.4 -14% |
| Load (h) | 2.3 | 1.5 -35% | 2.3 0% | 2.9 26% | 4.1 78% | 2.8 22% | 2.1 -9% |
Points positifs
Points négatifs

Nous avions loué les qualités de la variante Core i7 HDR du X1 Yoga 2018, grâce aux finitions de son châssis, ses performances et son silence, mais trouvions son prix quelque peu élevé. A 2 400 $, ce modèle du X1 Yoga pouvait être trop cher pour la plupart des utilisateurs. A 600 $ de moins, la version Core i5 FHD est plus abordable, tout en offrant la plupart des avantages du modèle plus cher.
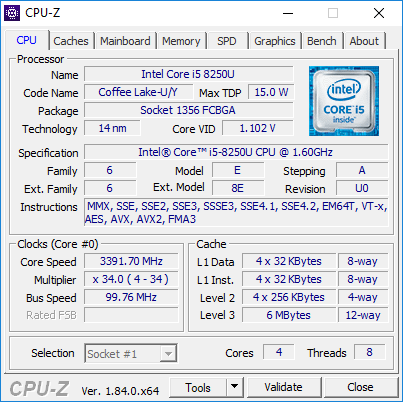
La différence de performances entre le Core i5-8250U et le Core i7-8550U est au mieux négligeable. Ainsi, la plupart des utilisateurs ne verront aucun changement notable en prenant le processeur le moins puissant. Plutôt que d’investir dans un processeur légèrement plus rapide, les clients potentiels devraient plutôt investir dans l’écran WQHD, qui coûte environ 170 $ de plus. Avec cet écran plus cher, la luminosité est doublée, et la fidélité des couleurs et le contraste sont excellents. La meilleure configuration disponible est sans doute celle combinant Core i5-8250U et écran WQHD HDR.
La variante Core i5 du X1 Yoga conserve les meilleurs atouts de son grand frère tout en réduisant son prix. Pour 600 $ de moins, le X1 Yoga Core i5 FHD propose des performances similaires, dans le même excellent châssis. Si vous cherchez un convertible pro et pouvez vous permettre une hausse de 5 % du tarif pour l’écran HDR, c’est la machine à ne pas rater.
L’intégralité de cette critique est disponible en anglais en suivant ce lien.
Lenovo ThinkPad X1 Yoga 2018-20LD0015US
- 04/15/2018 v6 (old)
Sam Medley
Price comparison
