Verdict : de bonnes performances avec les compromis attendus
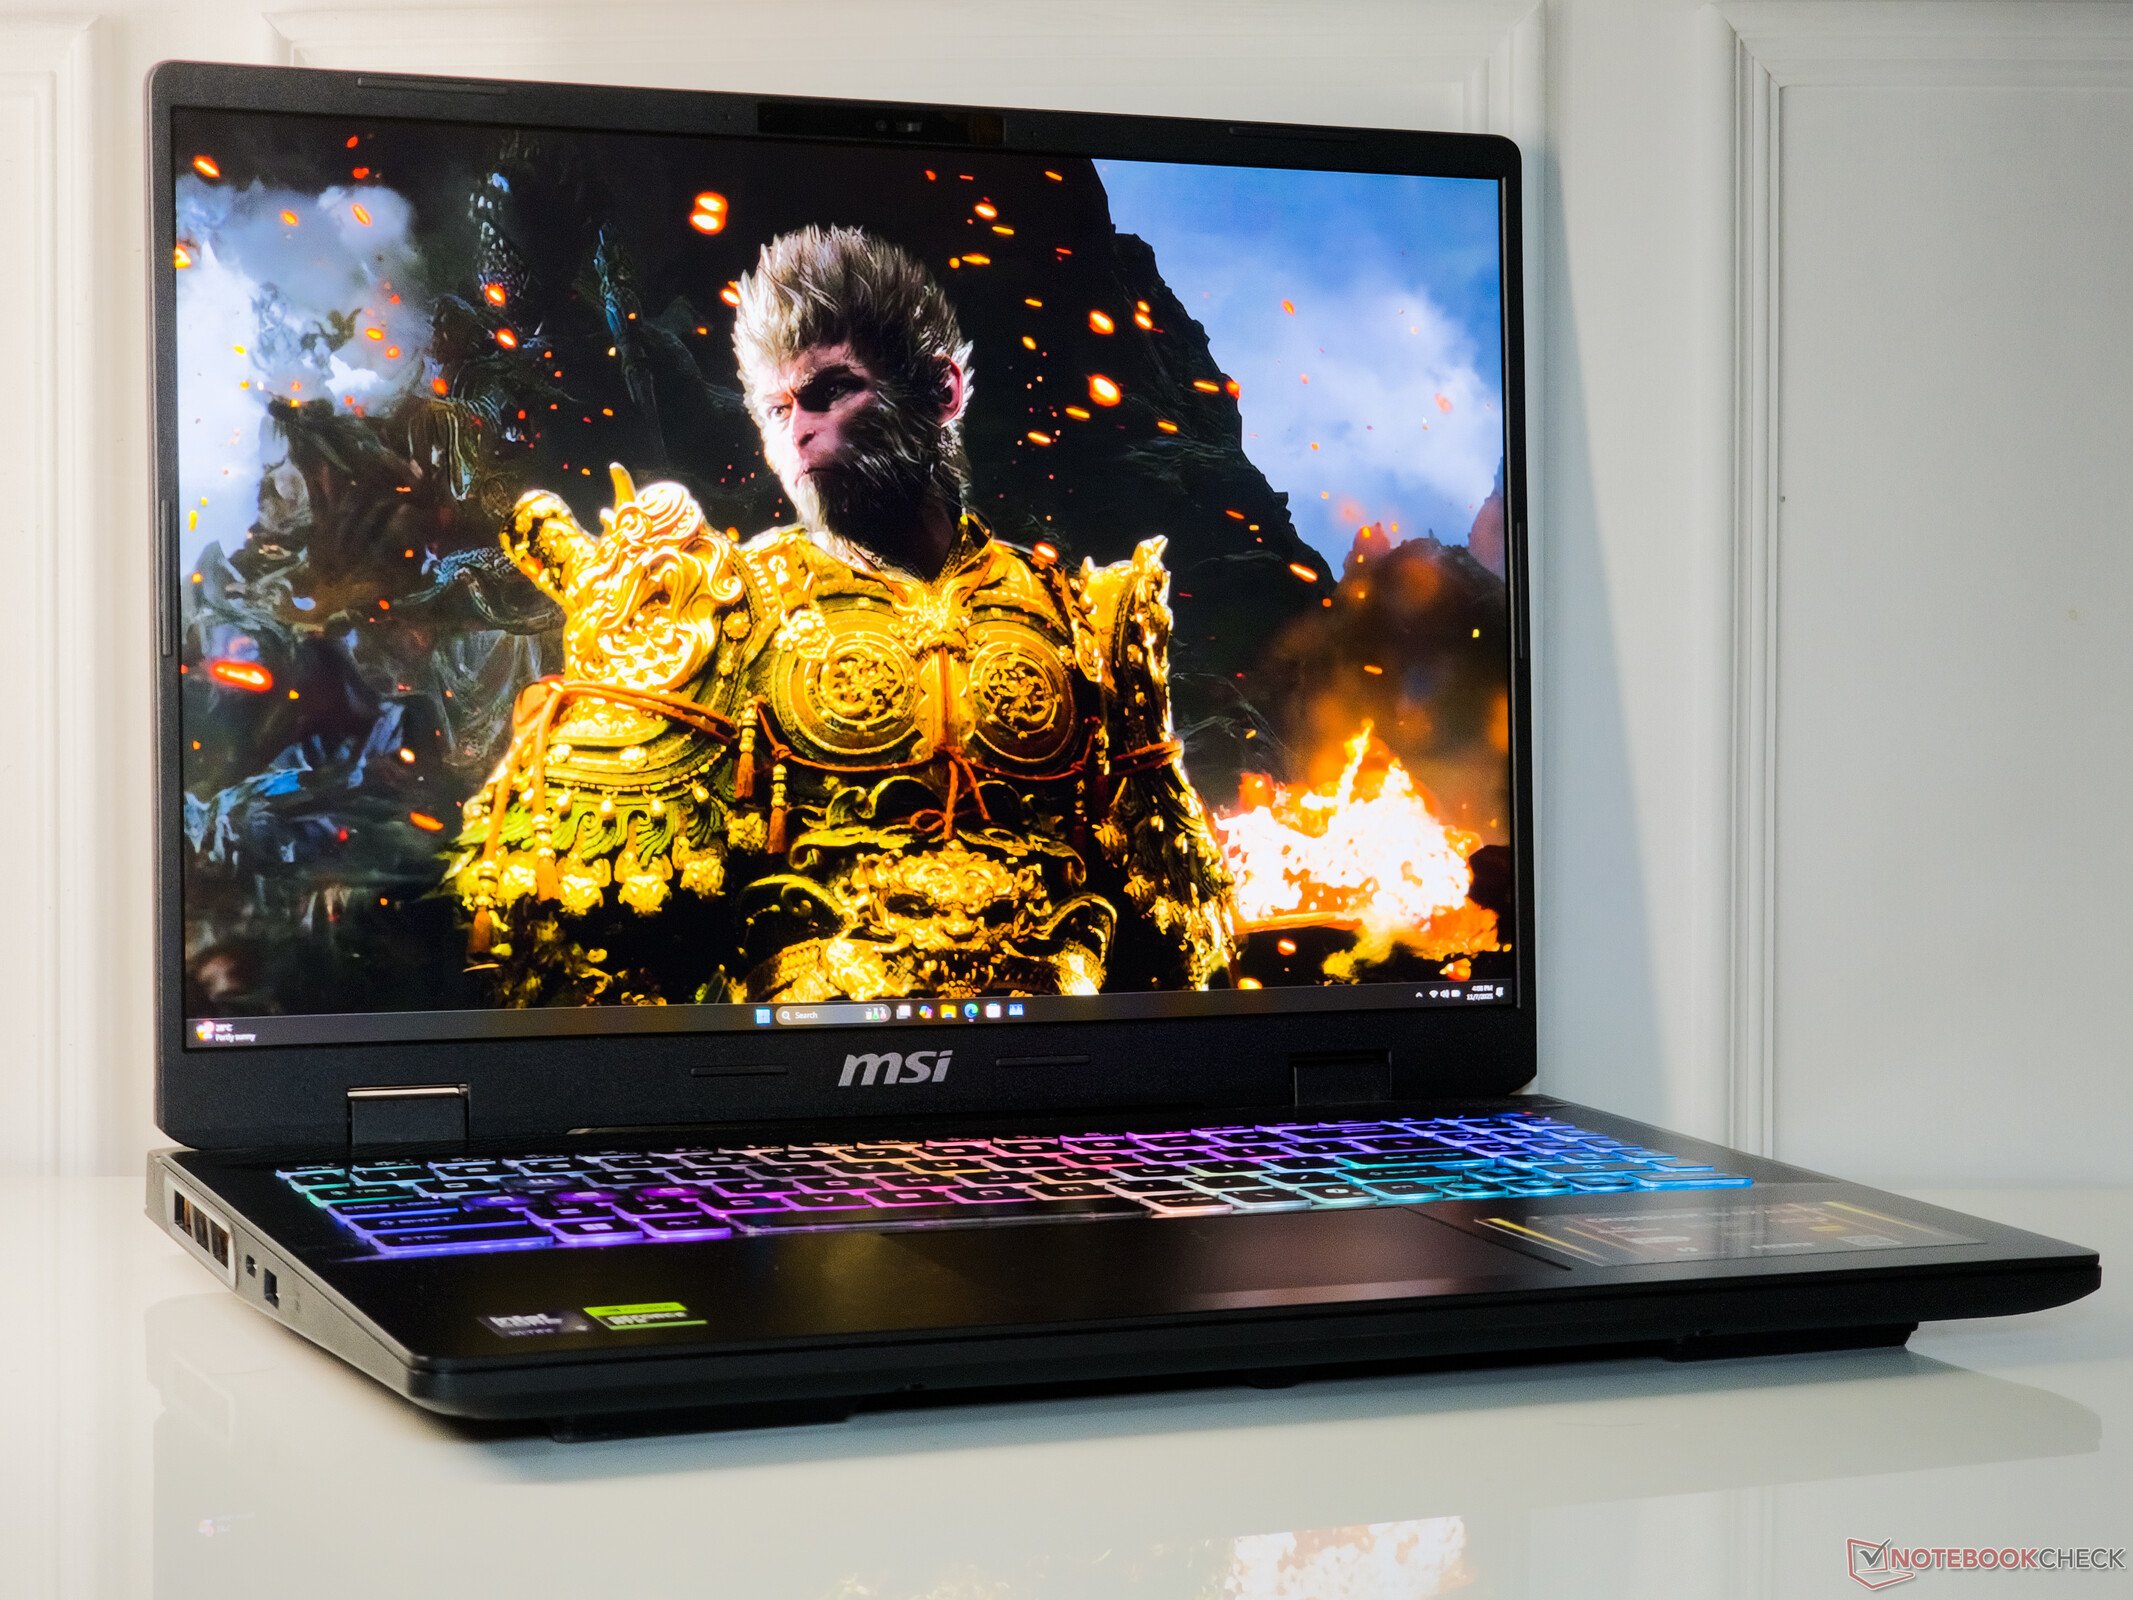
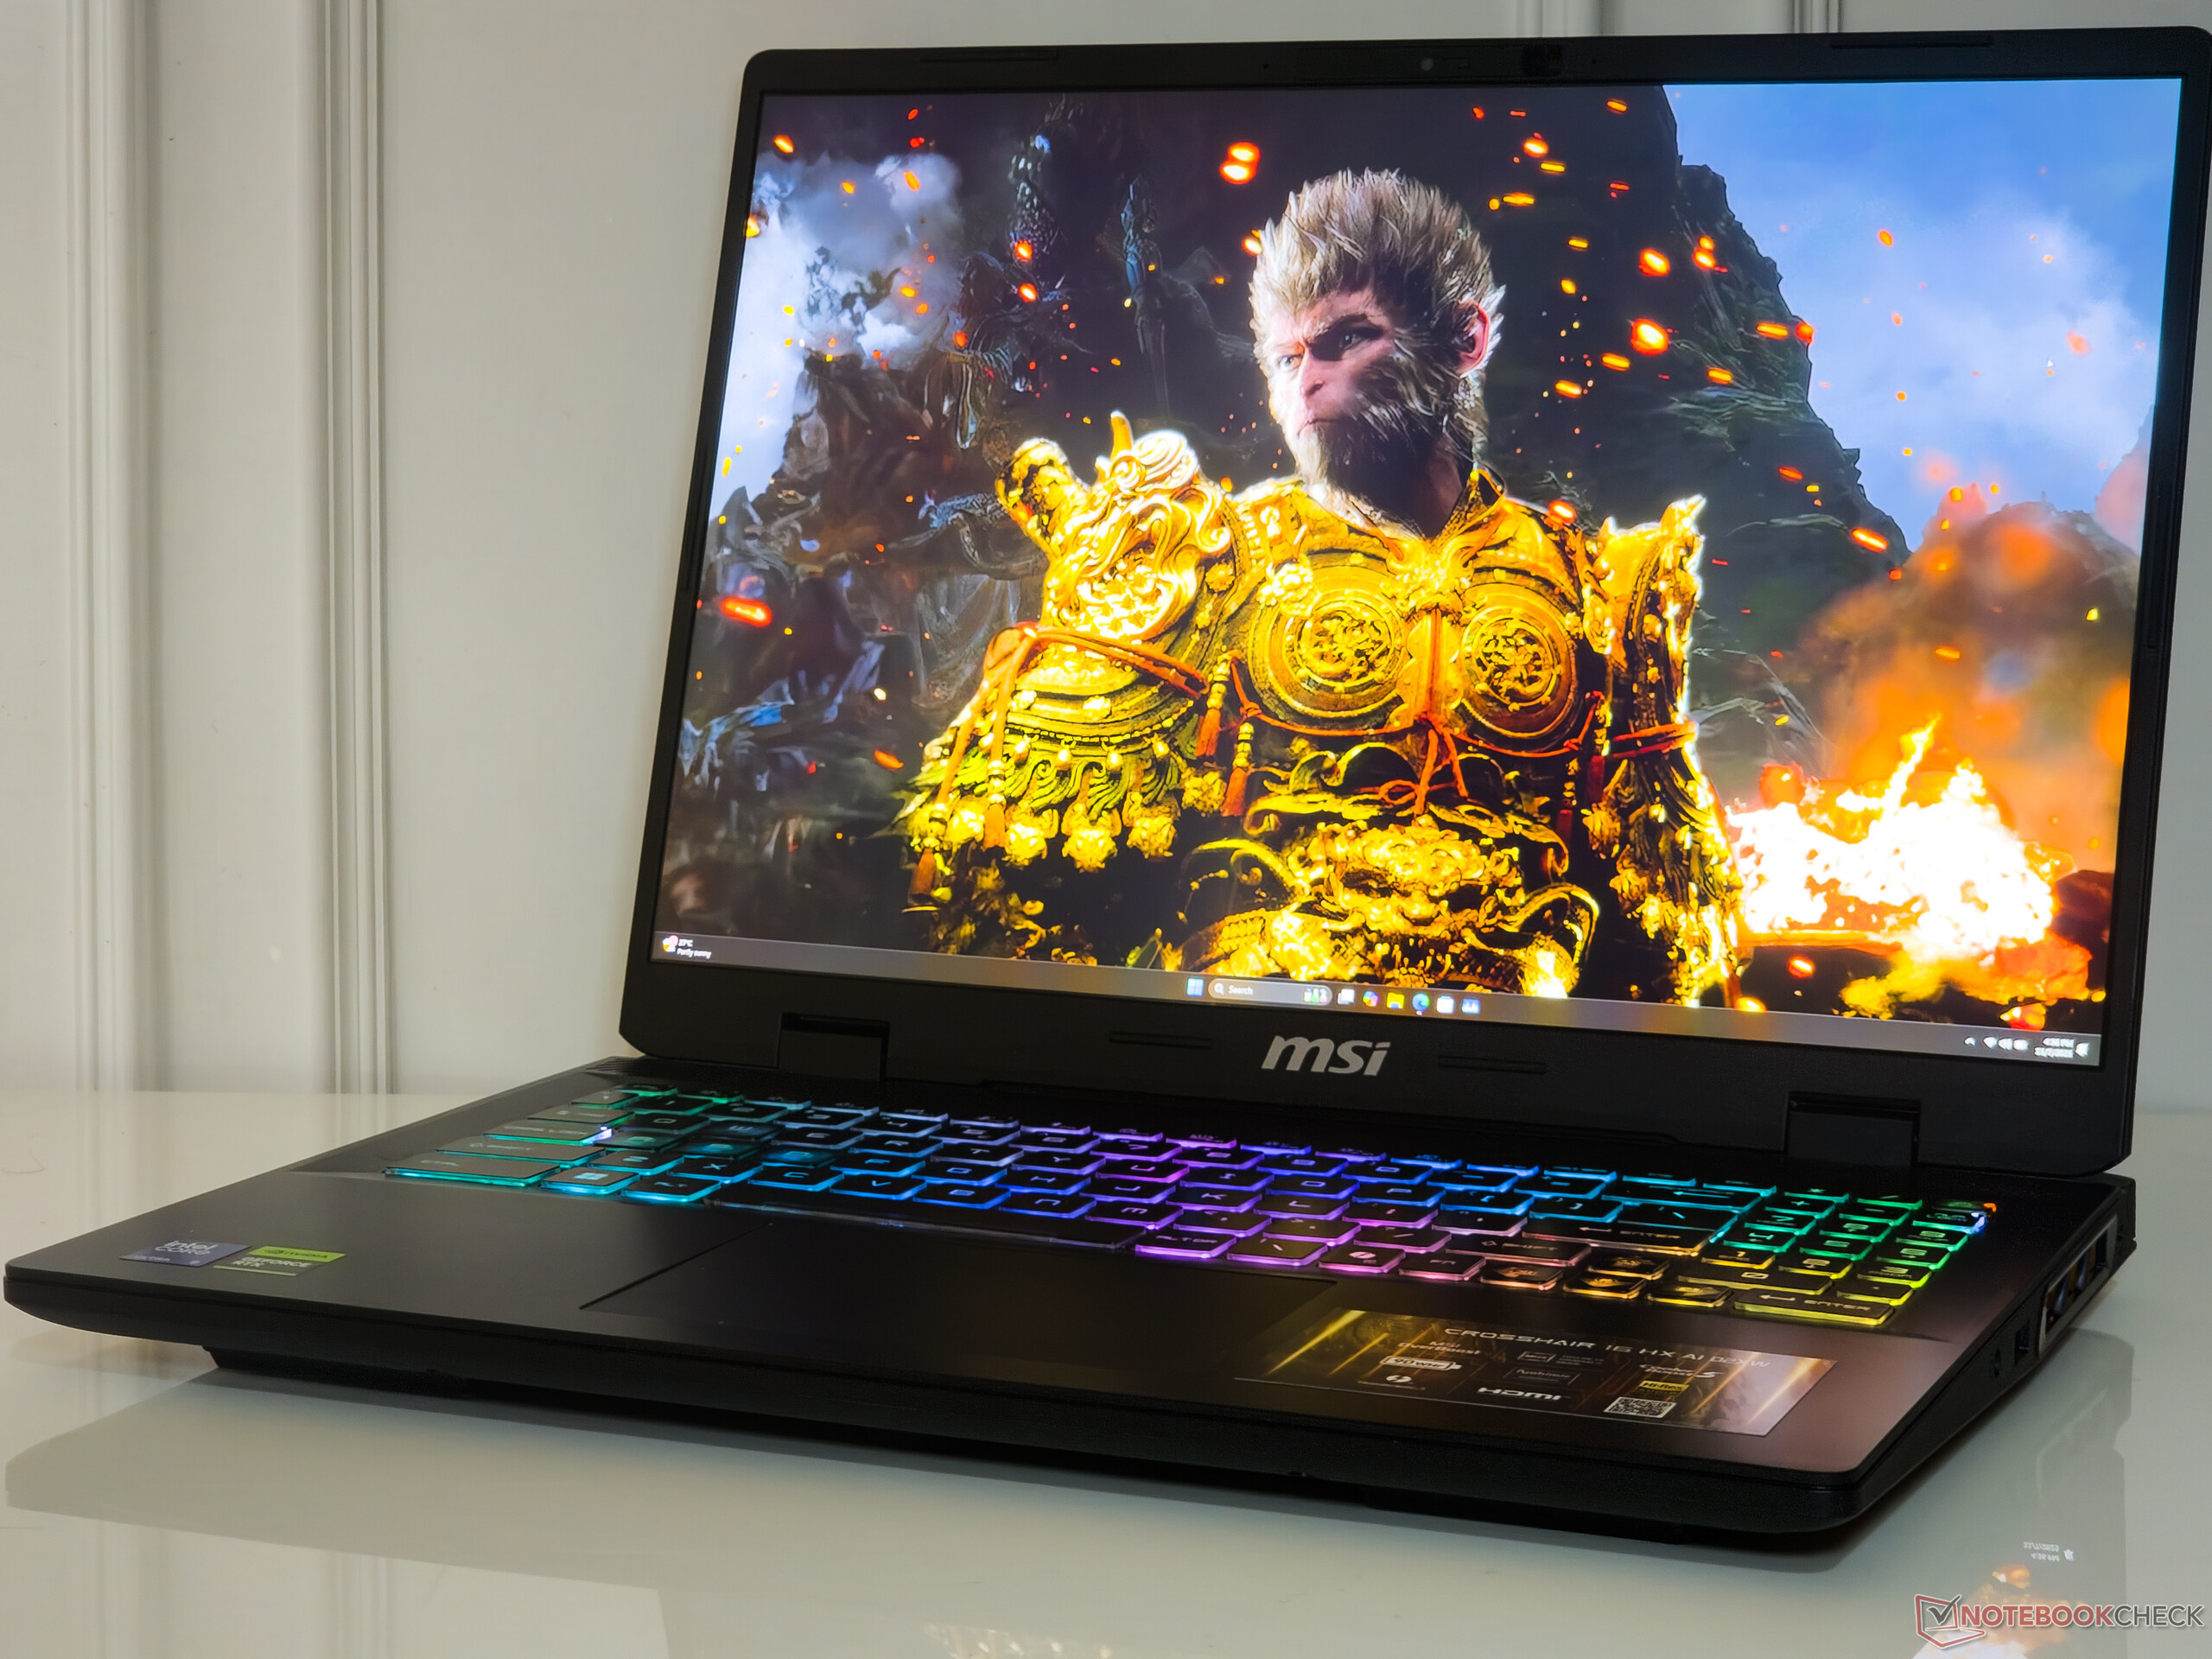
Avec un Intel Core Ultra 9 275HX et un ordinateur portable Nvidia GeForce RTX 5070, le MSI Crosshair 16 HX AI est un ordinateur portable de jeu QHD pour 2025 qui est également tout à fait apte à la création de contenu.
Le Crosshair 16 HX AI peut gérer les jeux en 1440p Ultra avec des taux de rafraîchissement acceptables, bien que les titres gourmands en VRAM puissent s'avérer difficiles à gérer en raison du frame buffer de 8 Go de la RTX 5070 Laptop. DLSS4 et la génération d'images multiples peuvent aider, mais cela n'est pas toujours de bon augure, en particulier pour les jeux de tir compétitifs.
Le mode Performance extrême libère tout le potentiel de la Crosshair 16 HX AI, mais il s'accompagne d'une augmentation des émissions de chaleur et de bruit, ainsi que d'une consommation d'énergie plus élevée.
Autrement, MSI n'a pas coupé les coins plus que ce que nous avions déjà anticipé. Il n'y a pas grand-chose à redire sur la construction en plastique et la connectivité est raisonnable, même si nous aurions aimé un port Thunderbolt 4/USB Type-C supplémentaire et de meilleures performances en Wi-Fi 5.
L'écran QHD+ 240 Hz n'est pas un mini-LED ou un OLED, mais il offre des images impressionnantes, des temps de réponse rapides et pas de PWM.
Dans l'ensemble, le MSI Crosshair 16 HX AI fait l'affaire si vous êtes à la recherche d'un ordinateur portable 1440p décent pour le jeu et la création de contenu autour de la barre des 2 000 $.
Points positifs
Points négatifs
Prix et disponibilité
Aux Etats-Unis, la Crosshair 16 HX AI est disponible sur Micro Center à partir de 1 499,99 $ pour la variante Core Ultra 7 255HX.
En Inde, la Crosshair 16 HX AI de MSI est disponible à partir de 1 59 990 ₹ pour la variante Core Ultra 9 275HX + RTX 5060 sur MSI.com et d'autres détaillants, tandis que le combo Core Ultra 9 275HX + RTX 5070 peut être obtenu pour ₹1,99,990 via Amazon India.
- $1,749.00msi Crosshair 16 HX AI 16" QHD+ 240Hz Display; Gaming Laptop - Gray, Intel Core Ultra 7 255HX 1.8GHz; NVIDIA GeForce RTX 5070 8GB GDDR7; 32GB DDR5-5600 RAM; 1TB NVMe SSD; WiFi 6E
- $1,332.09msi Crosshair A16 HX 16” QHD+ 240Hz Gaming Laptop – AMD Ryzen 9 8940HX, NVIDIA GeForce RTX 5060, 16GB DDR5, 1TB NVMe SSD, Wi-Fi 6E, USB-C, Windows 11 D8WFKG-090US
- $49.99Dongerdi 240W Charger Fit for MSI Katana A15 A17 15 17 GF66 GF76, Crosshair 16/17/18 HX AI, Stealth 17M 15M 15 14/14 AI Studio, Pulse 15 16 17 GL66 GL76, Sword/Bravo/Alpha 17 15 CreatorPro M16 Z16
Table des matières
- Verdict : de bonnes performances avec les compromis attendus
- Spécifications
- Châssis : Construction en plastique avec des options de connectivité décentes
- Connectivité : Haut débit 6 GHz 6E
- Périphériques d'entrée : Expérience de frappe décente avec suffisamment de RVB
- Écran : Panneau QHD+ 240 Hz avec une bonne couverture du gamut et sans PWM
- Performance : Le Core Ultra 9 275HX et la RTX 5070 ne réservent aucune surprise
- Émissions : Refroidissement robuste mais avec des niveaux de décibels et de chaleur élevés
- Consommation électrique : Pas la plus économe de la comparaison
- Impressions générales de Notebookcheck sur la MSI Crosshair 16 HX AI
- Comparaison des concurrents potentiels
Après avoir passé en revue le MSI Crosshair A17 HX et la Crosshair 18 HX AInous nous intéressons maintenant à la MSI Crosshair 16 HX AI.
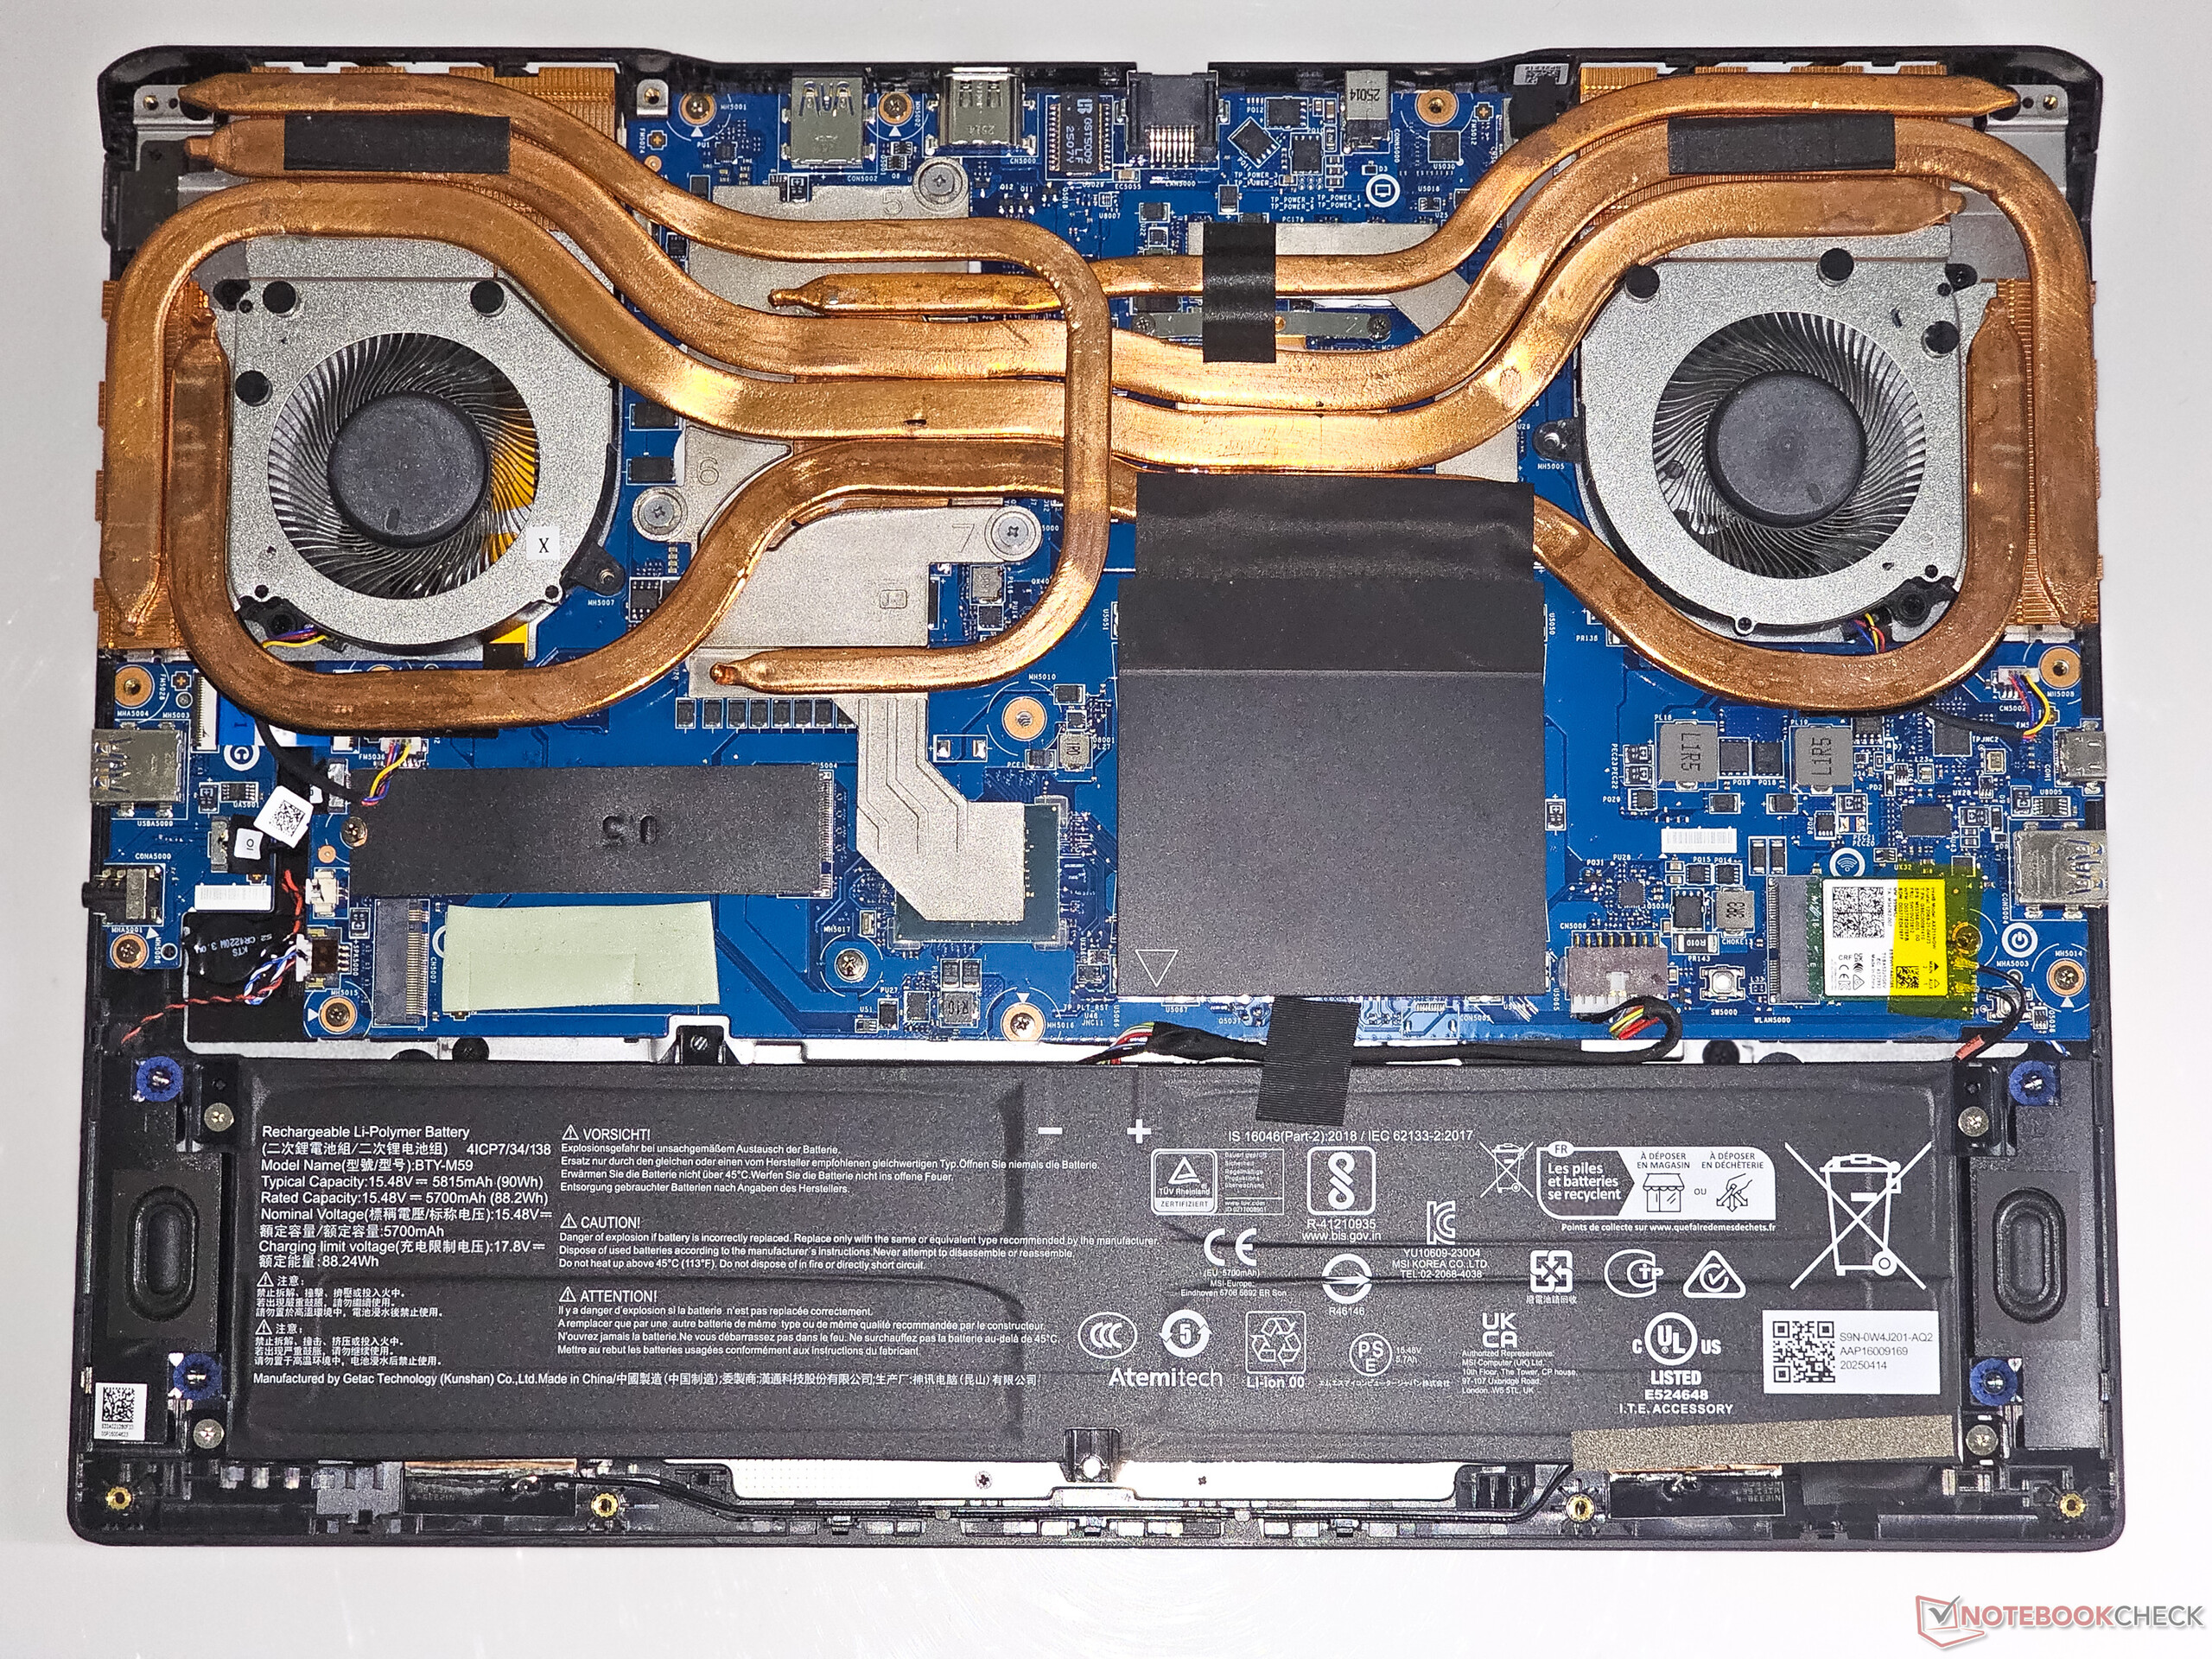
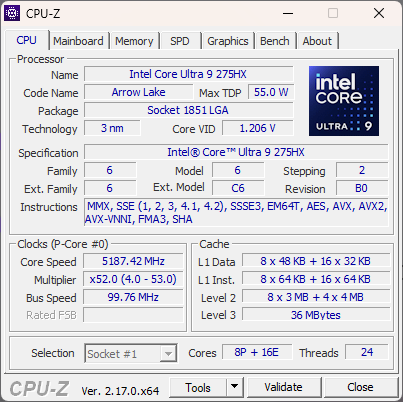
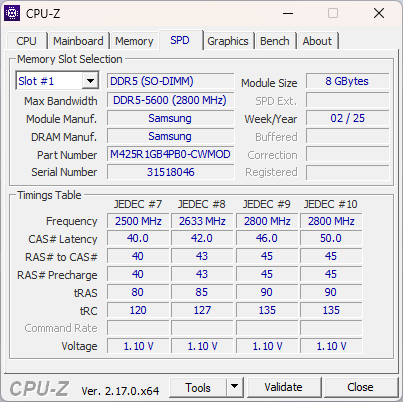
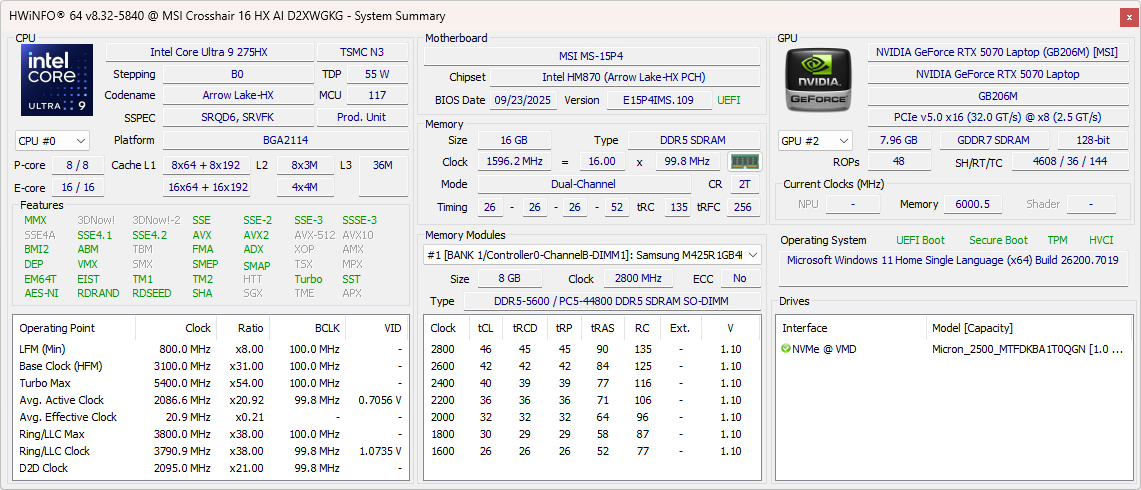
Notre Crosshair 16 HX AI est équipé d'un Core Ultra 9 275HX et d'un GPU RTX 5070 Laptop de 115 W, de 16 Go de mémoire DDR5-5600, d'un SSD NVMe de 1 To et d'un écran QHD+ 240 Hz de niveau IPS dans un boîtier familier Crosshair 16 HX D14 châssis.
Spécifications
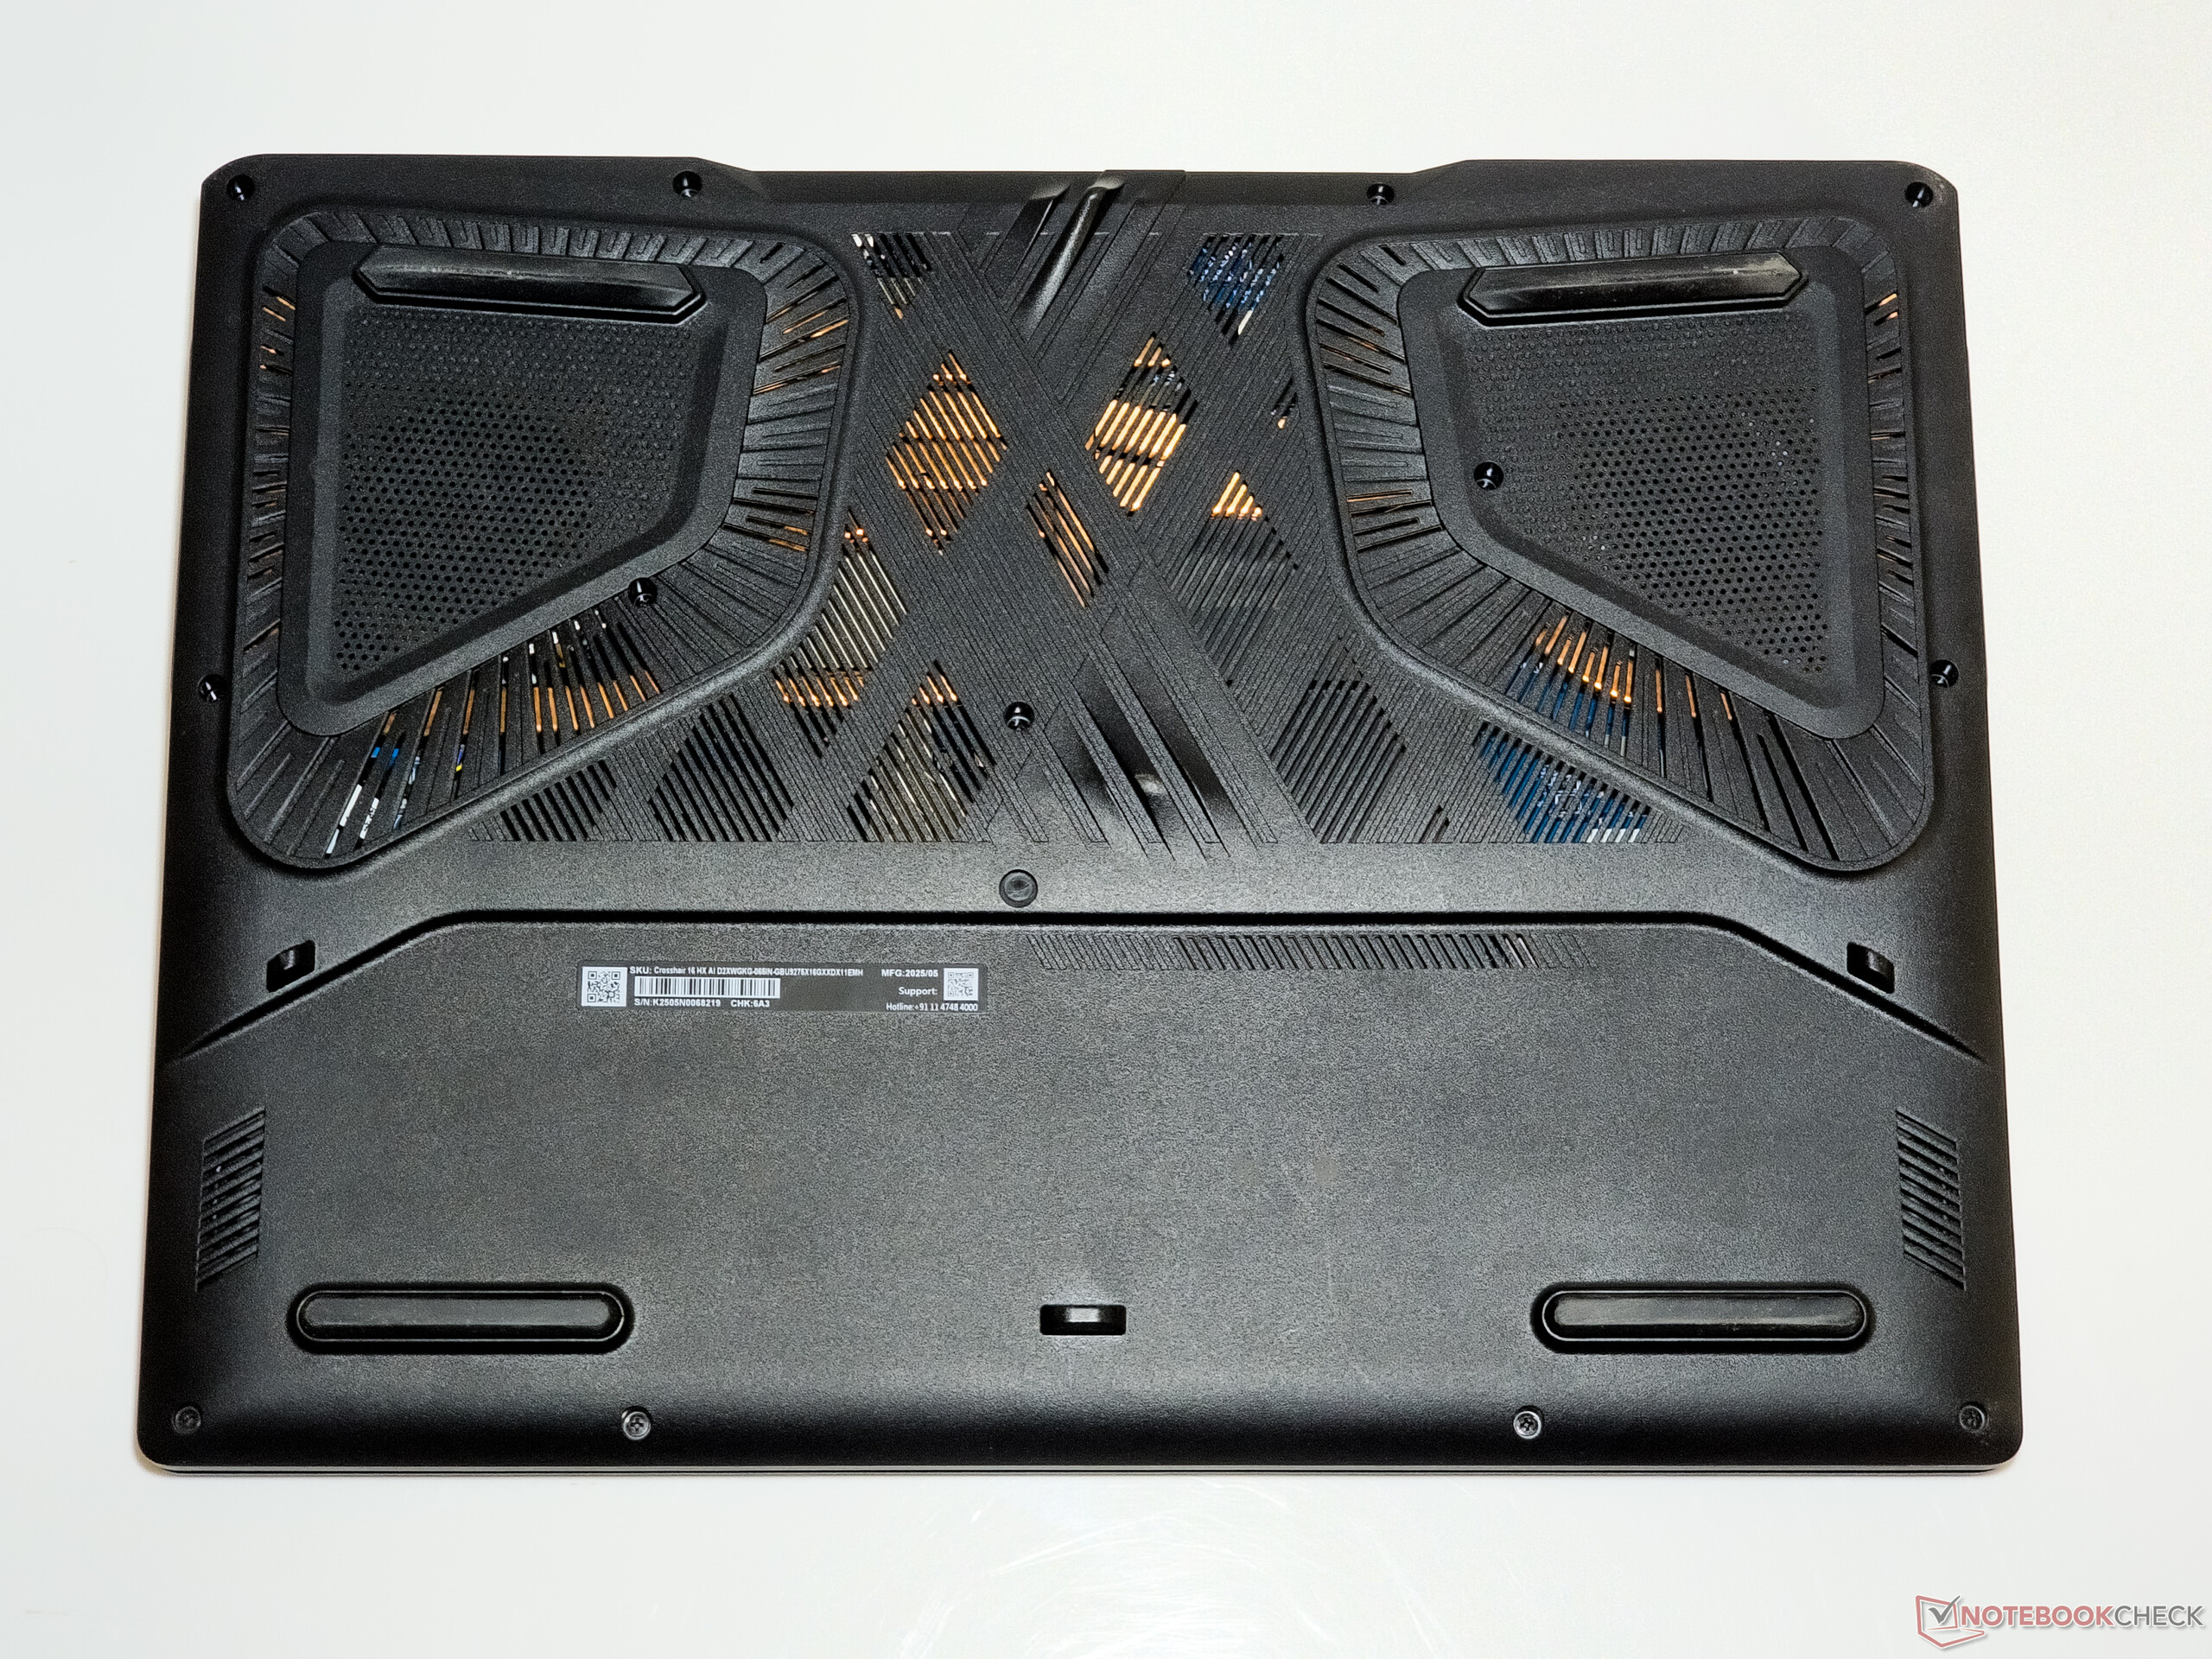
Châssis : Construction en plastique avec des options de connectivité décentes
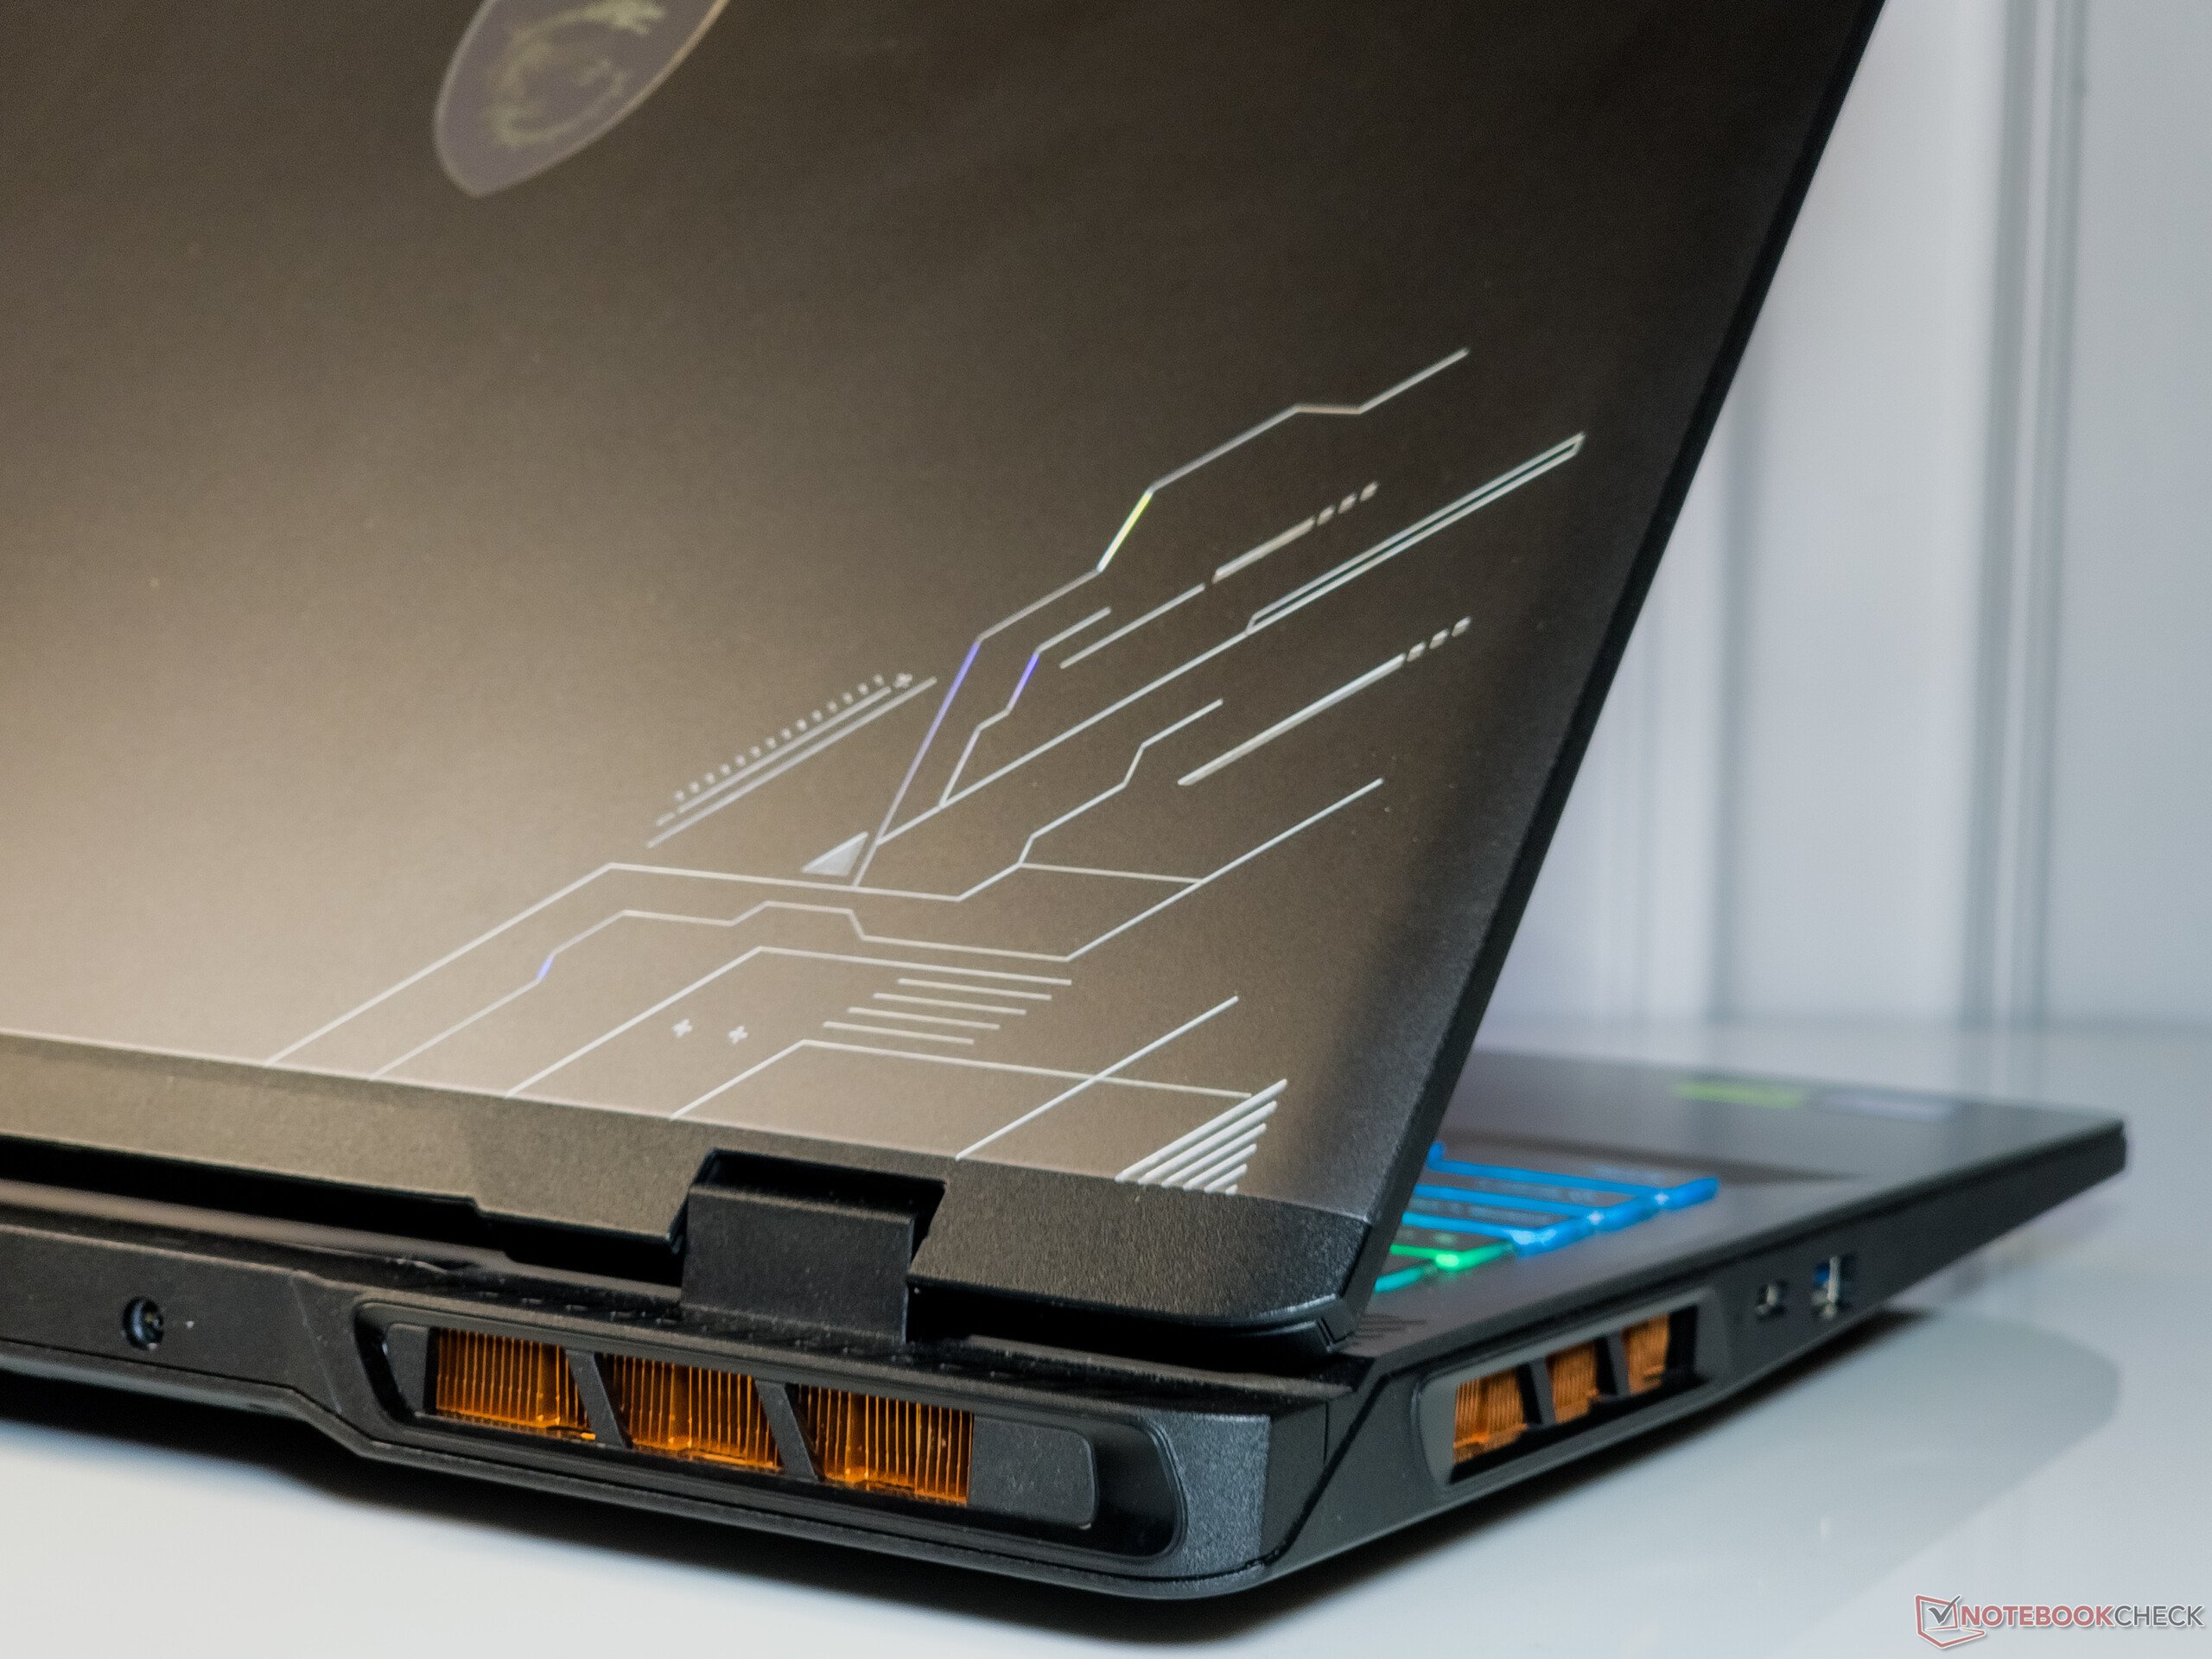
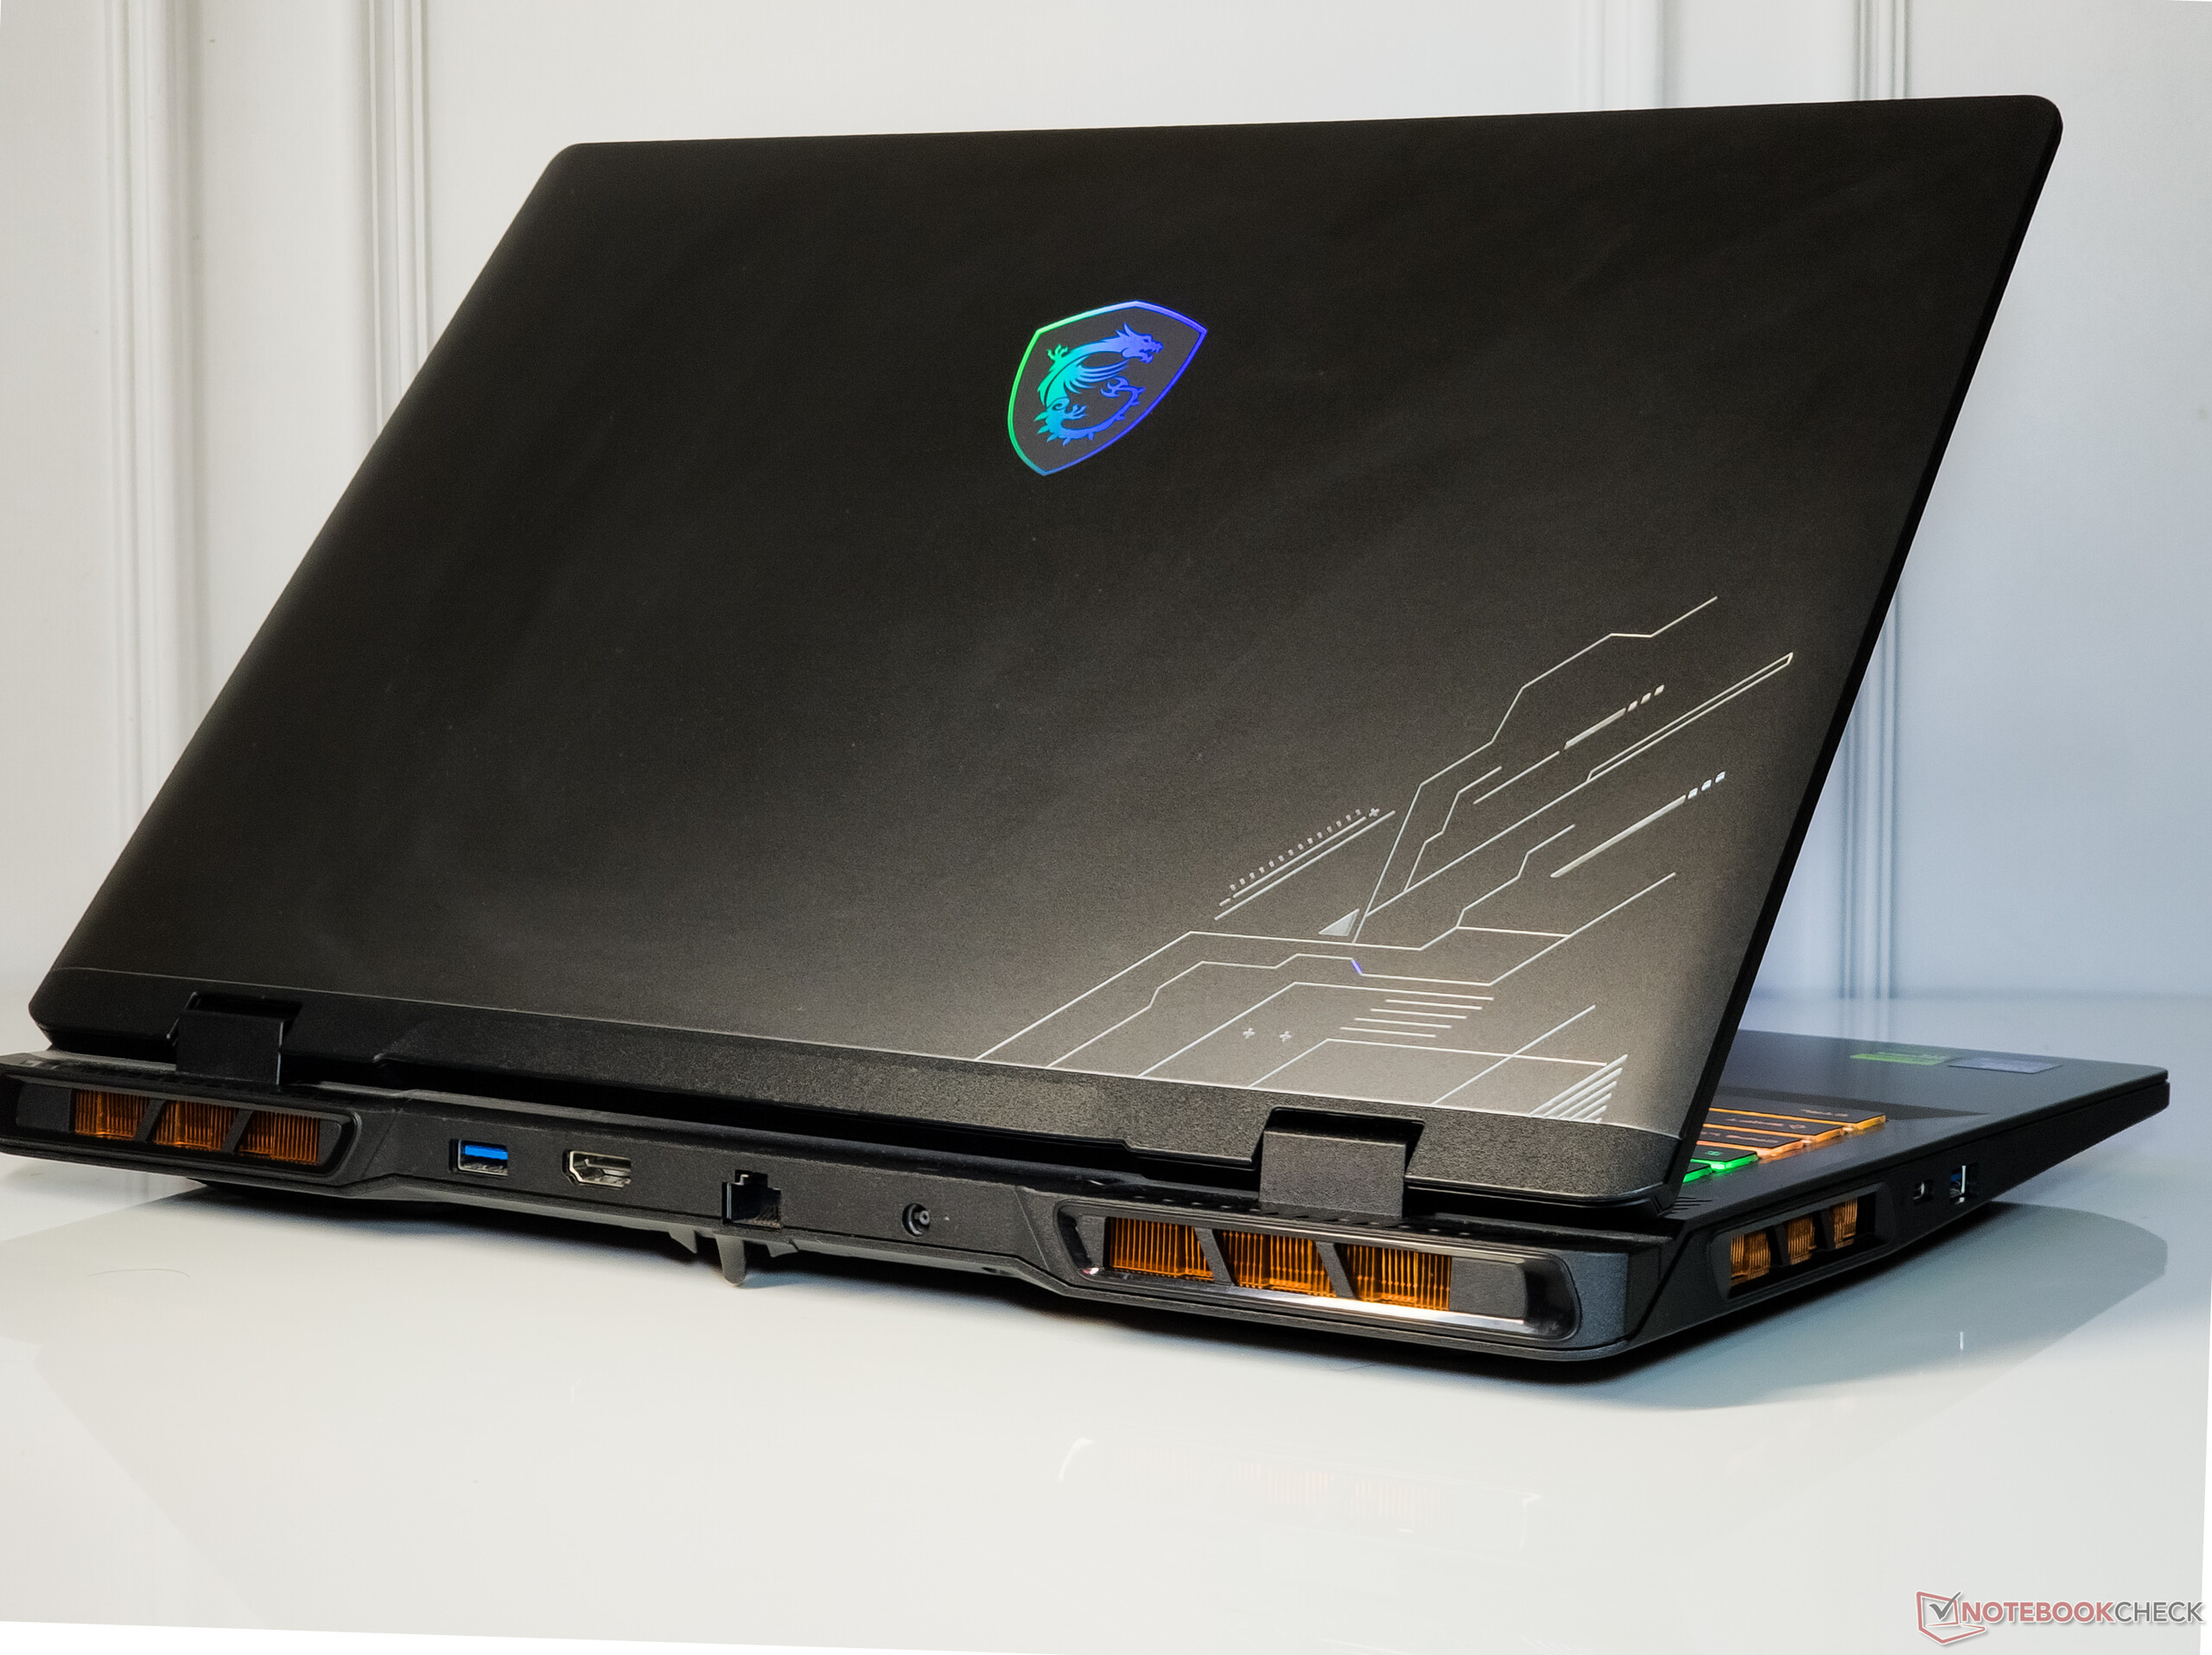
La Crosshair 16 HX AI est principalement construite en plastique dans une finition gris cosmos avec un couvercle métallique qui peut s'étendre complètement à plat à un angle de 180°.
La qualité de construction est robuste avec une flexion minimale sur le clavier et le couvercle.
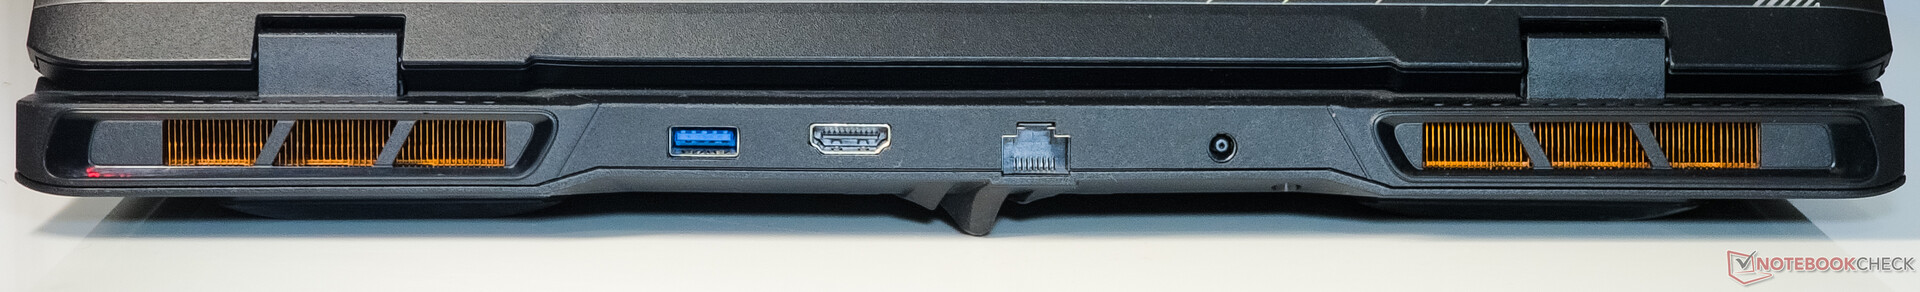
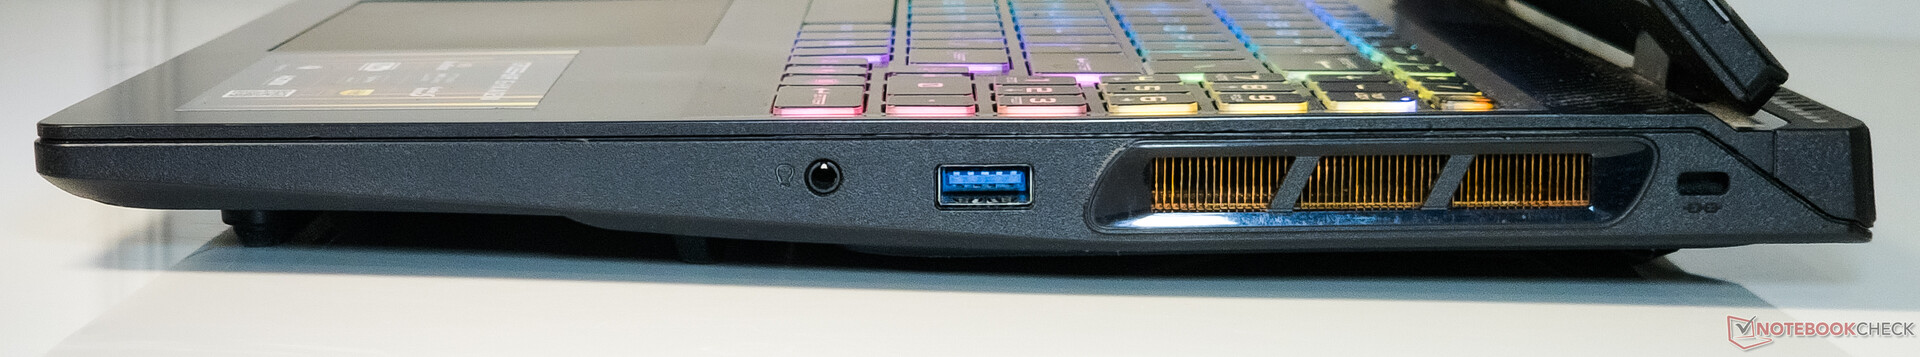
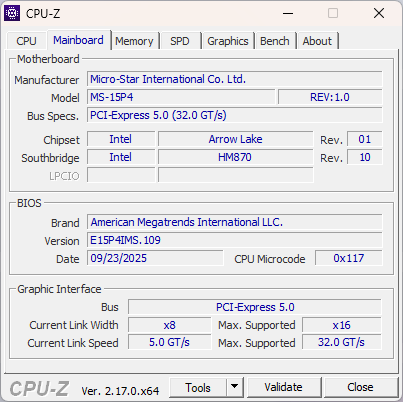
La sélection des ports est similaire à celle de la Crosshair 18 HX AI et comprend un port Thunderbolt 4, 3x ports USB 3.2 Gen1 Type-A, une sortie HDMI 2.1, et Gigabit Ethernet. Nous n'avons rencontré aucun problème lors de la connexion de périphériques adjacents.


Connectivité : Haut débit 6 GHz 6E
La carte WLAN Intel Wi-Fi 6E AX211 affiche des vitesses décentes dans la bande 5 GHz, mais la bande 6 GHz 6E offre un débit élevé de 1,7 Gbps en émission et en réception lors des tests effectués avec notre routeur de référence Asus ROG Rapture GT-AXE11000.
| Networking / iperf3 transmit AXE11000 | |
| Asus TUF Gaming A16 FA608UP | |
| Moyenne de la classe Gaming (560 - 1862, n=108, 2 dernières années) | |
| Moyenne Intel Wi-Fi 6E AX211 (64 - 1921, n=276) | |
| Aorus Elite 16 AE6H | |
| Lenovo Legion 5 Pro 16IAX10H | |
| MSI Crosshair 16 HX AI D2XWGKG | |
| Alienware 16X Aurora, RTX 5070 | |
| Networking / iperf3 receive AXE11000 | |
| Asus TUF Gaming A16 FA608UP | |
| Aorus Elite 16 AE6H | |
| Moyenne de la classe Gaming (680 - 1745, n=108, 2 dernières années) | |
| Moyenne Intel Wi-Fi 6E AX211 (582 - 1890, n=276) | |
| MSI Crosshair 16 HX AI D2XWGKG | |
| Alienware 16X Aurora, RTX 5070 | |
| Lenovo Legion 5 Pro 16IAX10H | |
| Networking / iperf3 transmit AXE11000 6GHz | |
| MSI Crosshair 16 HX AI D2XWGKG | |
| Moyenne de la classe Gaming (723 - 2355, n=41, 2 dernières années) | |
| Moyenne Intel Wi-Fi 6E AX211 (385 - 1851, n=226) | |
| Alienware 16X Aurora, RTX 5070 | |
| Networking / iperf3 receive AXE11000 6GHz | |
| MSI Crosshair 16 HX AI D2XWGKG | |
| Moyenne de la classe Gaming (975 - 1775, n=40, 2 dernières années) | |
| Moyenne Intel Wi-Fi 6E AX211 (700 - 1857, n=226) | |
| Alienware 16X Aurora, RTX 5070 | |
La qualité de la webcam 720p n'a rien d'extraordinaire. Il n'y a pas de connexion IR Windows Hello, mais un volet de confidentialité physique est fourni en standard.


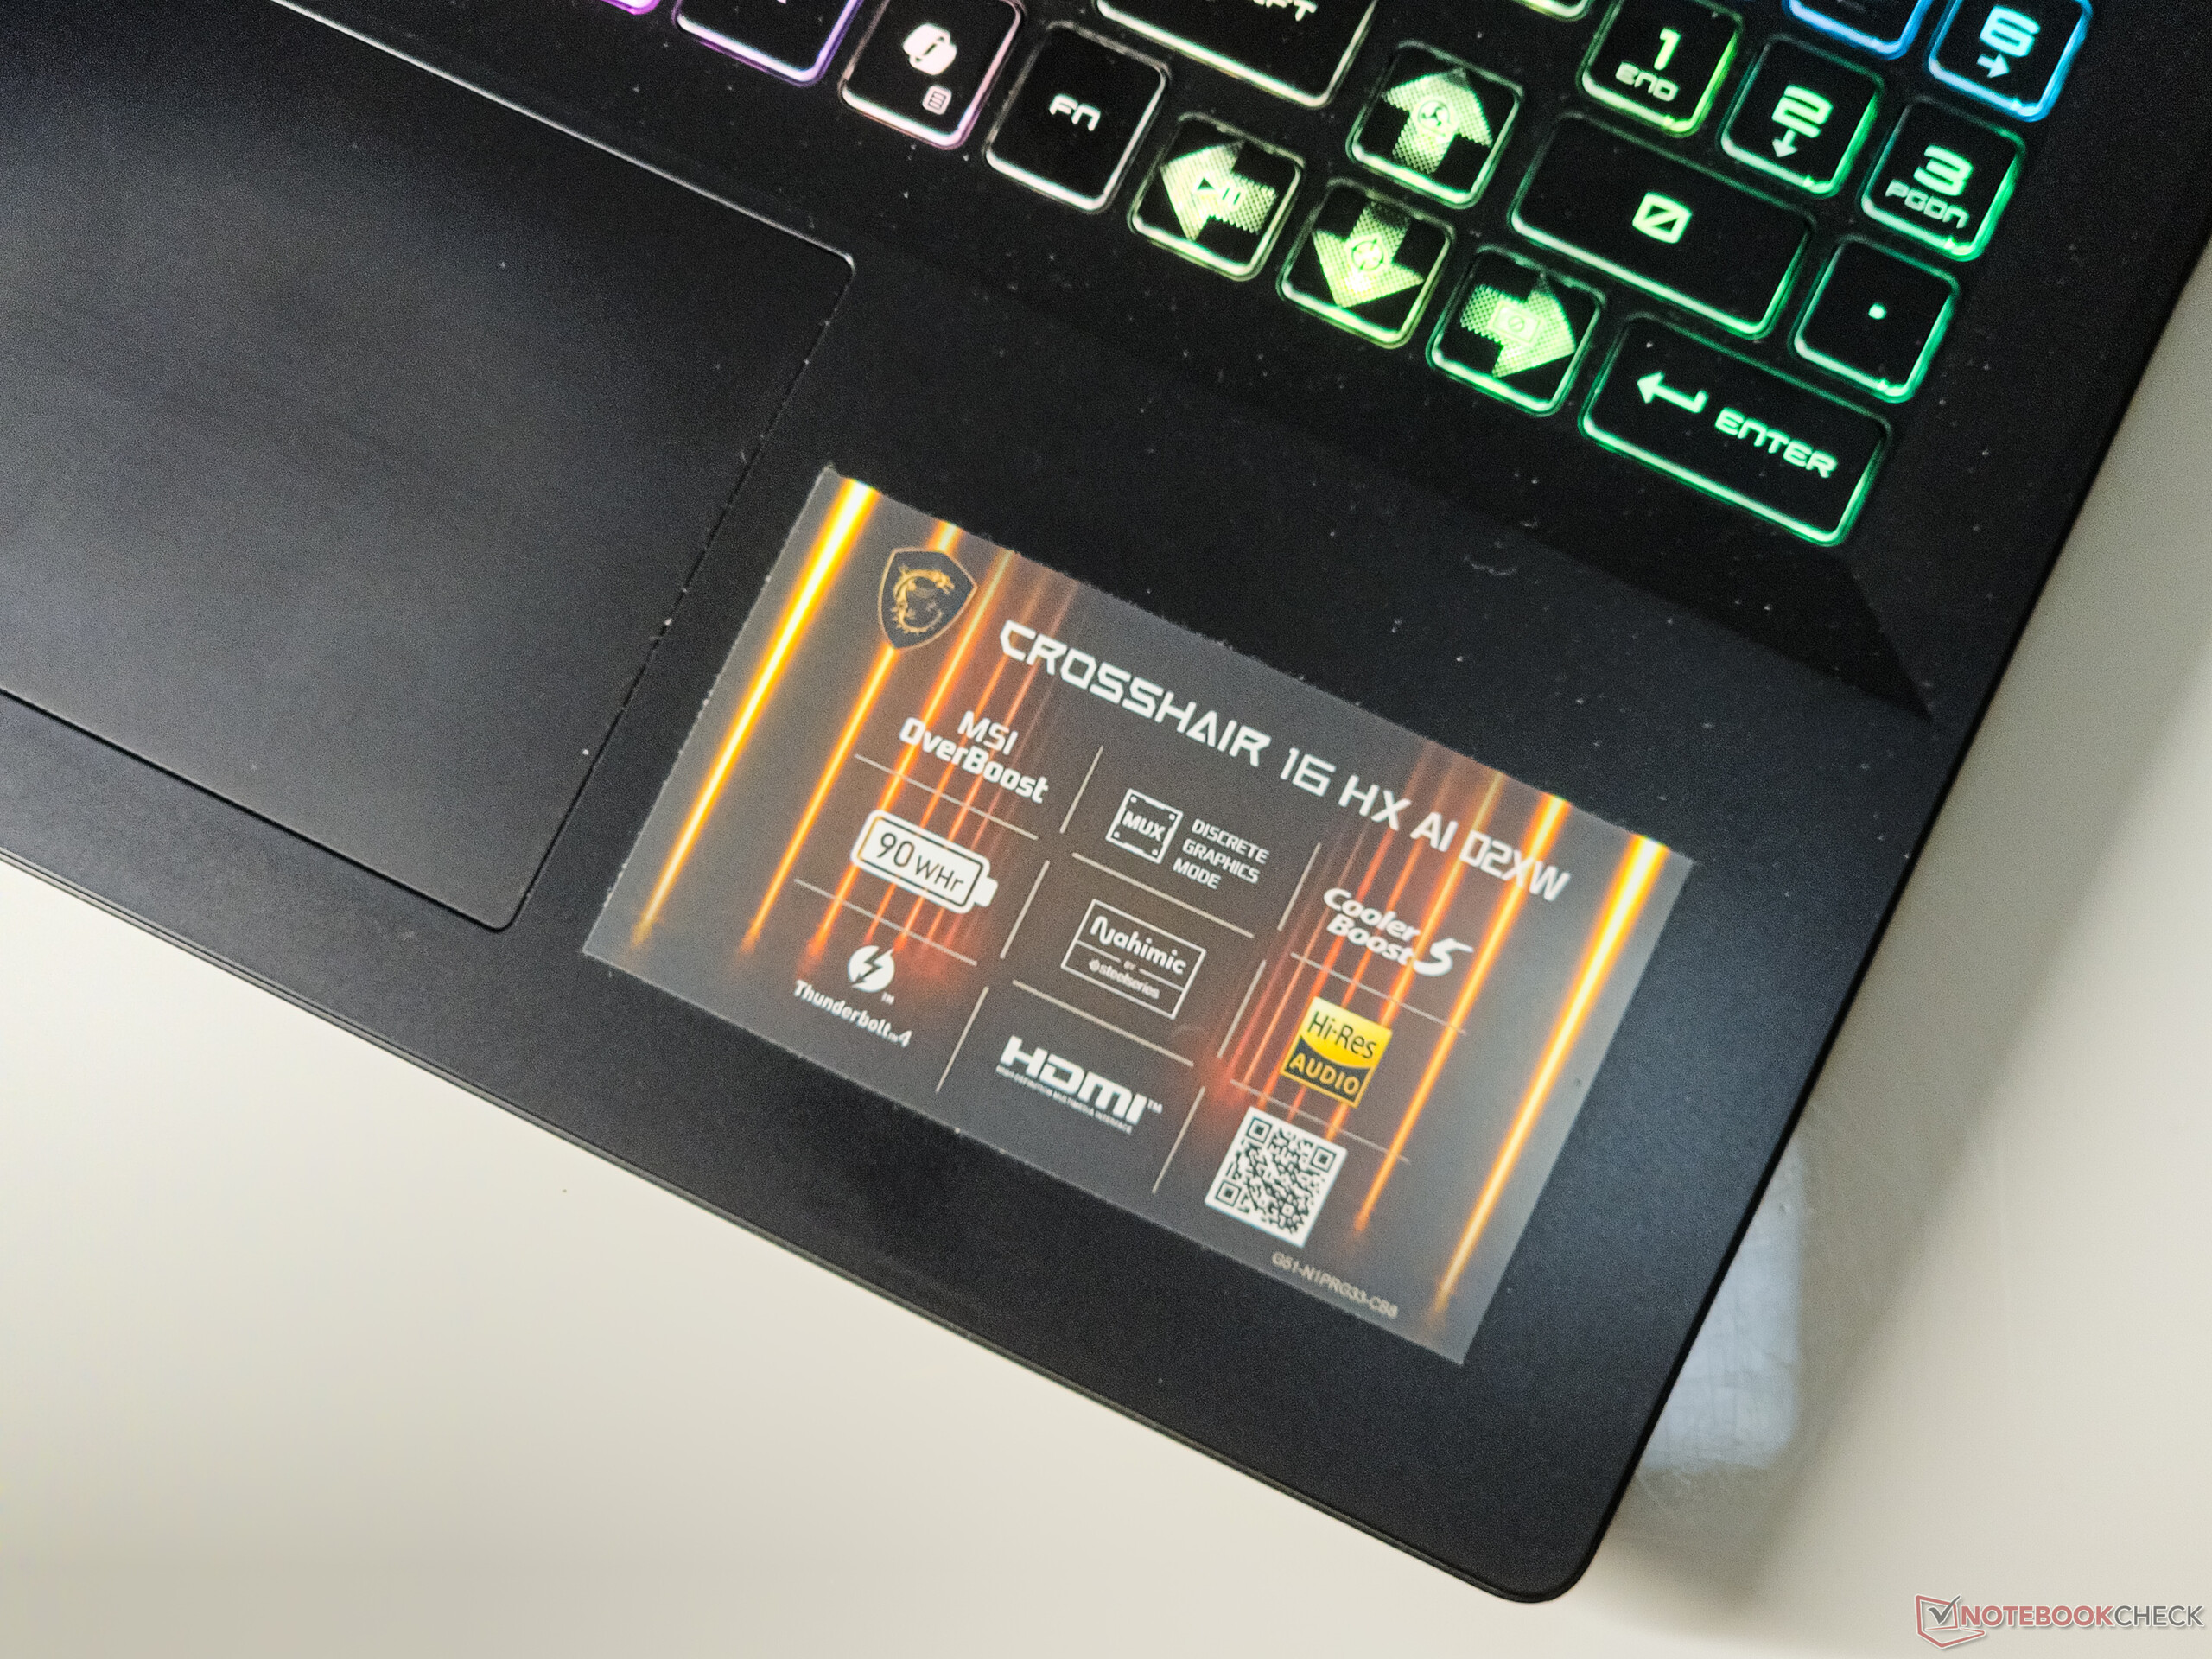
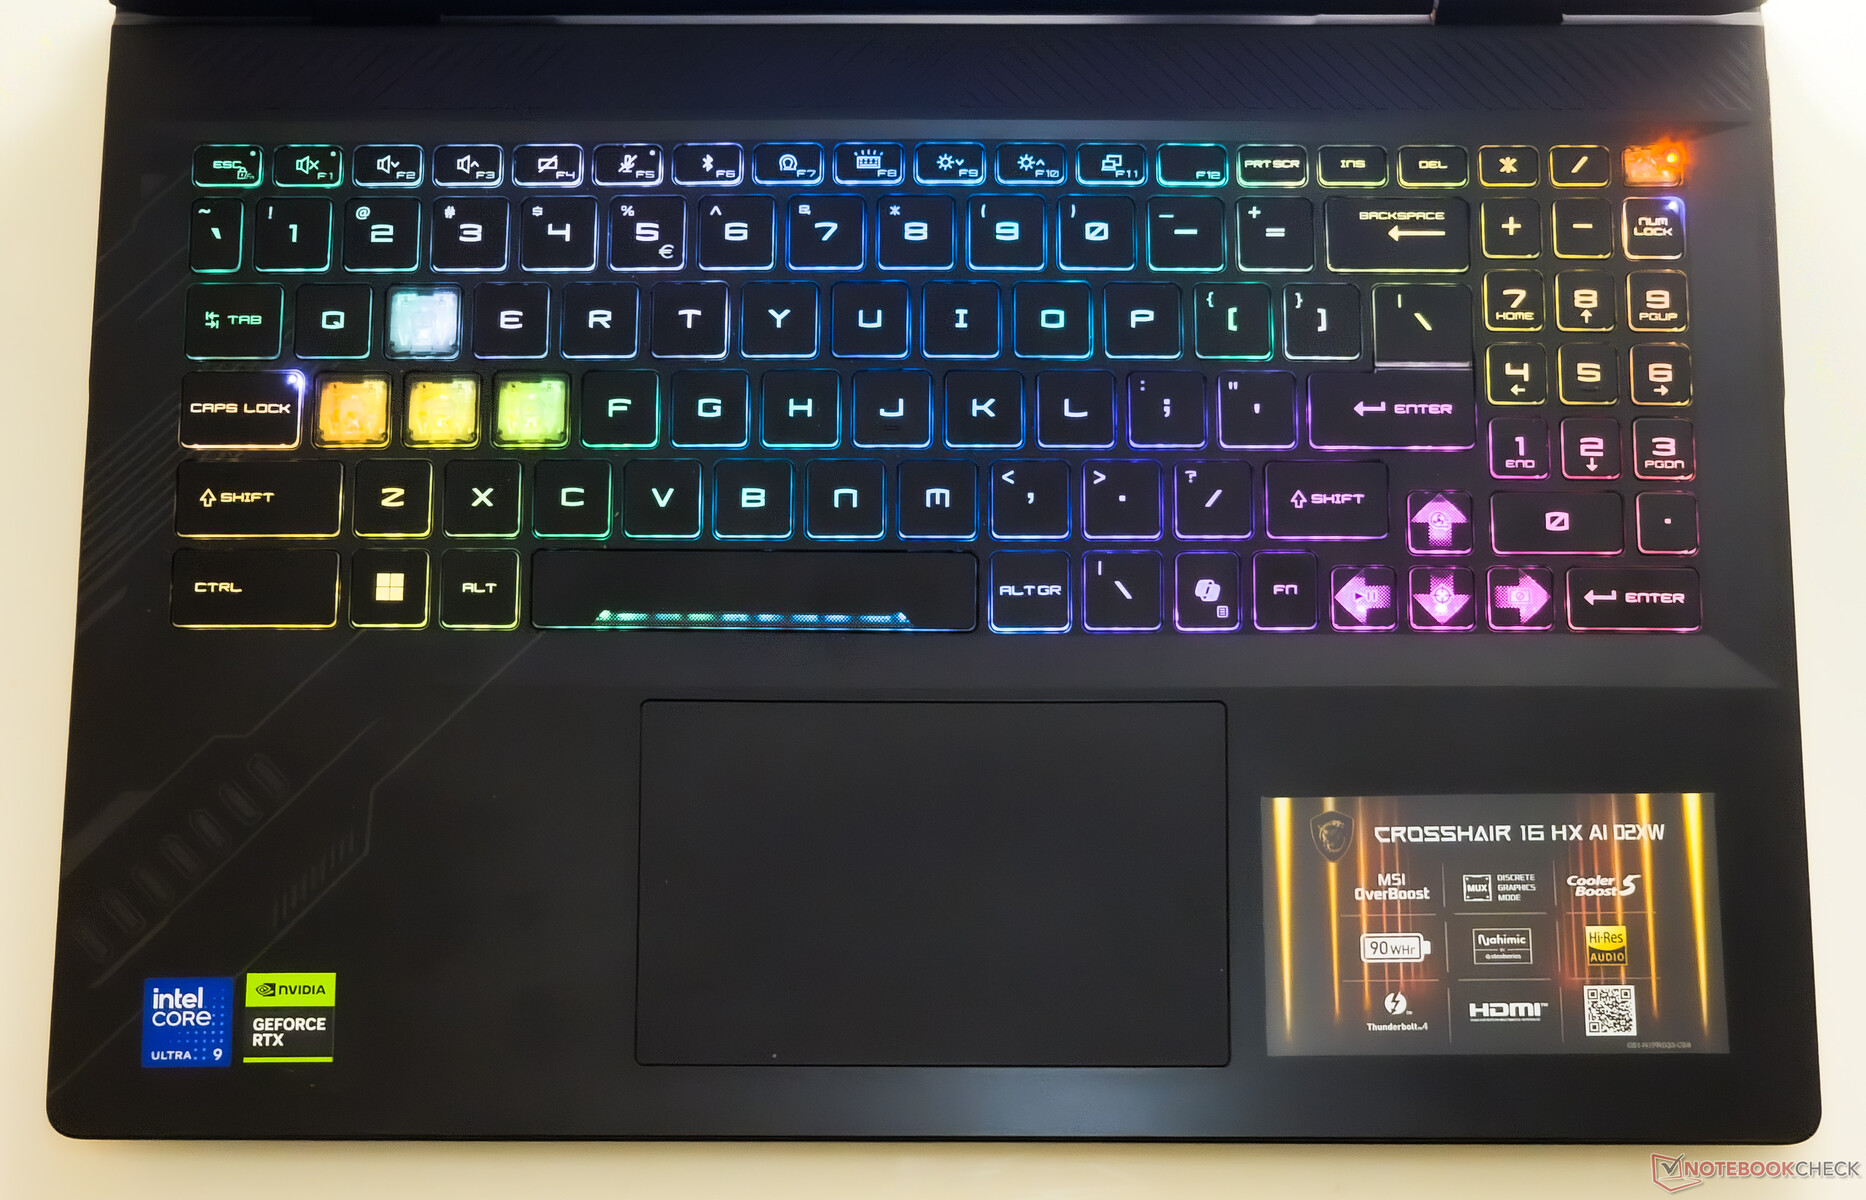
Périphériques d'entrée : Expérience de frappe décente avec suffisamment de RVB
Le clavier RGB 24 zones de la Crosshair 16 HX AI offre une tactilité décente avec une course de touche de 1,7 mm et des touches fléchées de taille normale. La disposition quelque peu atypique peut conduire à appuyer plus souvent sur la touche Fn que sur la flèche gauche.
Le pavé numérique à trois colonnes est pratique, mais il est trop étroit et n'est pas vraiment adapté à la saisie rapide de chiffres.
Le rétroéclairage à quatre niveaux offre un bon éclairage dans l'obscurité et brille bien, en particulier à travers les touches WASD entièrement transparentes.
Le pavé tactile de 12 x 7,5 cm présente de bonnes propriétés de glissement et prend en charge les gestes Windows Precision, bien que les clics et les gestes le long du bord supérieur soient parfois difficiles à enregistrer.
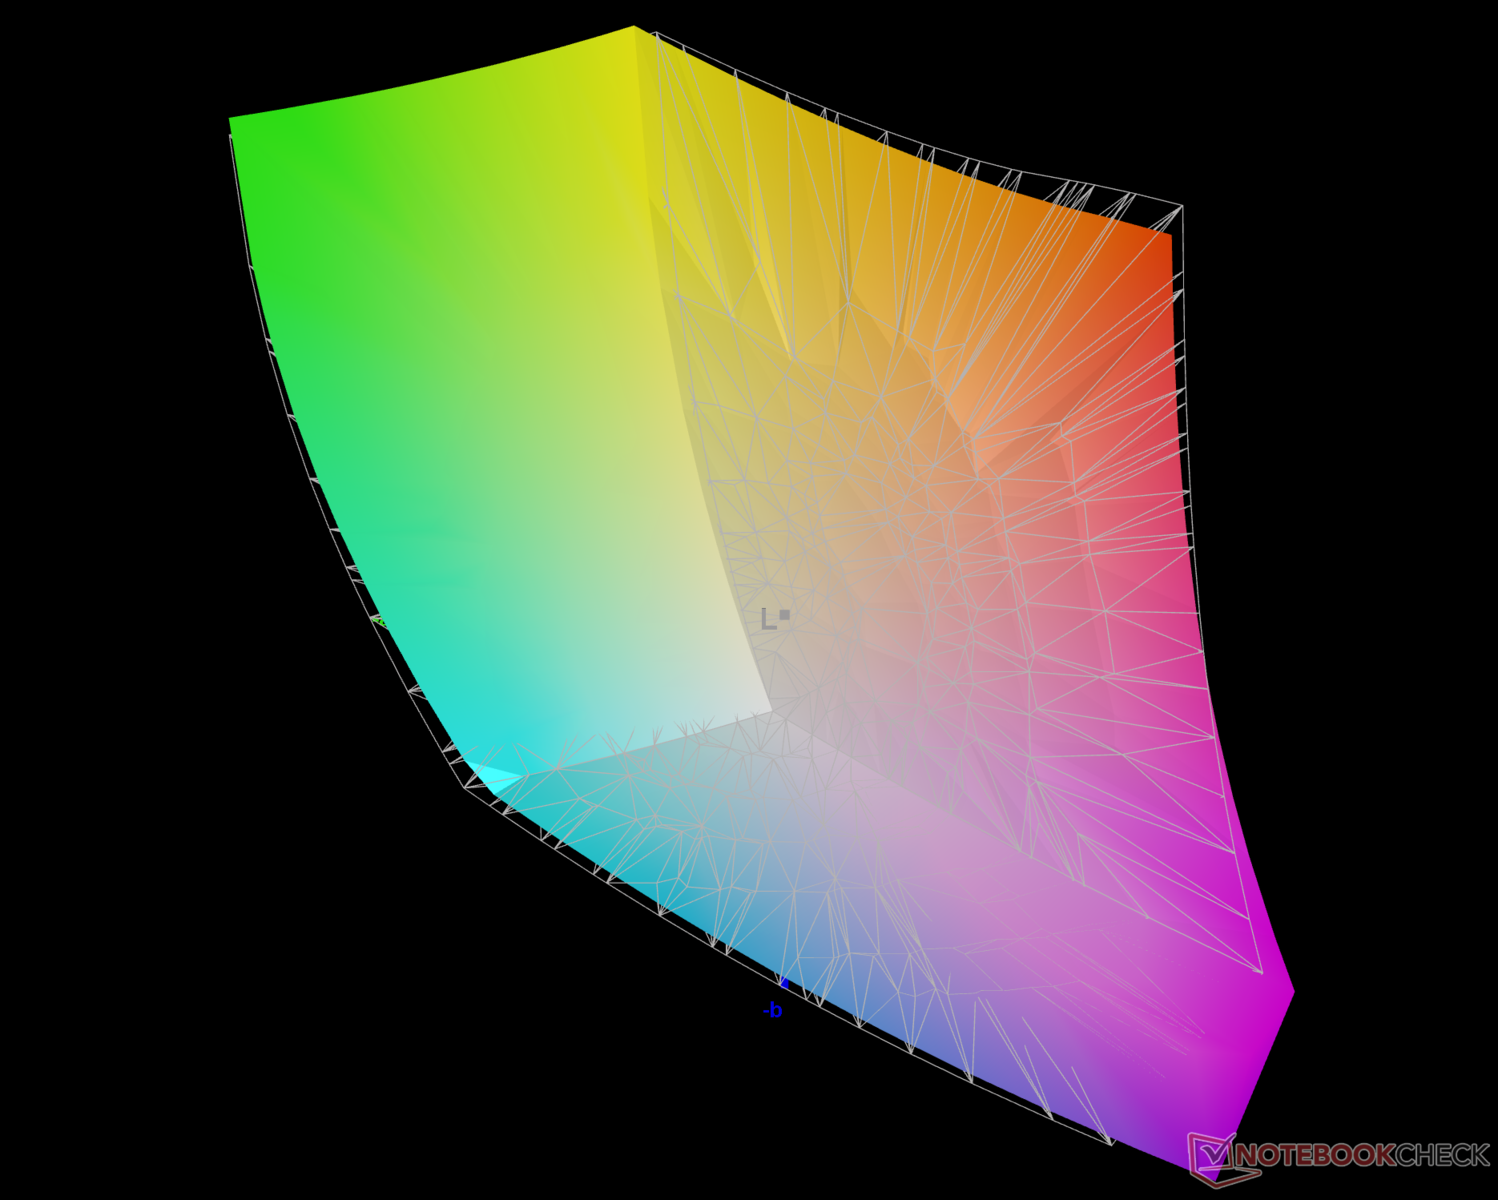
Écran : Panneau QHD+ 240 Hz avec une bonne couverture du gamut et sans PWM
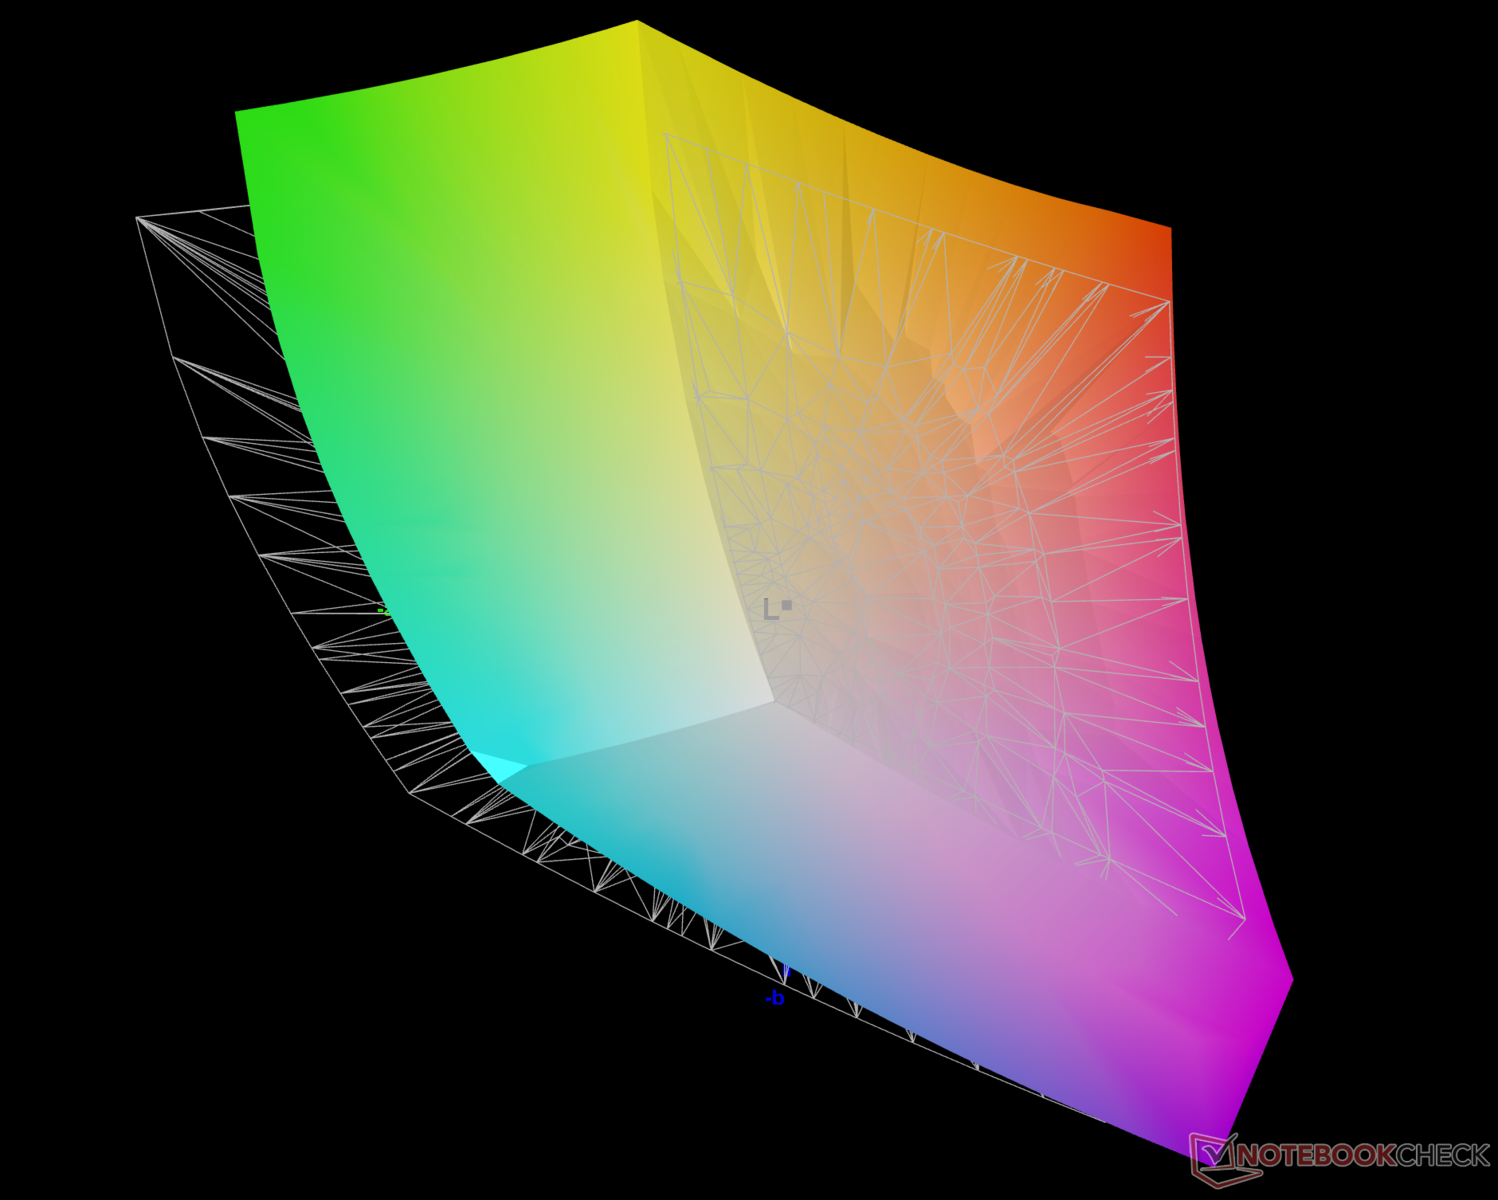
L'écran IPS 16:10 QHD+ 240 Hz du Crosshair 16 HX AI offre une luminosité maximale de 472 nits avec une uniformité de 88%, ce qui est un niveau décent pour une utilisation en intérieur.
Le rapport de contraste mesuré de 1 180:1 se prête à une expérience visuelle subjectivement bonne avec une couverture presque complète de la gamme de couleurs sRGB et Display P3.
Cela dit, l'écran ne prend pas en charge le HDR ni aucune forme de synchronisation adaptative.


| |||||||||||||||||||||||||
Homogénéité de la luminosité: 88 %
Valeur mesurée au centre, sur batterie: 471 cd/m²
Contraste: 1180:1 (Valeurs des noirs: 0.4 cd/m²)
ΔE ColorChecker Calman: 6.07 | ∀{0.5-29.43 Ø4.75}
calibrated: 2.25
ΔE Greyscale Calman: 6.4 | ∀{0.09-98 Ø5}
83.9% AdobeRGB 1998 (Argyll 3D)
99.7% sRGB (Argyll 3D)
95.5% Display P3 (Argyll 3D)
Gamma: 2.52
CCT: 7987 K
| MSI Crosshair 16 HX AI D2XWGKG AUO B160QAN02.3, IPS, 2560x1600, 16", 240 Hz | Alienware 16X Aurora, RTX 5070 LG Philips 160WQG, IPS, 2560x1600, 16", 240 Hz | Aorus Elite 16 AE6H NE160QDM-NYJ, IPS, 2560x1600, 16", 165 Hz | Lenovo Legion 5 Pro 16IAX10H ATNA60HS01-0 (Samsung SDC420A), OLED, 2560x1600, 16", 165 Hz | Asus TUF Gaming A16 FA608UP MNG007DA5-3, IPS, 2560x1600, 16", 165 Hz | |
|---|---|---|---|---|---|
| Display | 3% | -13% | 6% | -15% | |
| Display P3 Coverage (%) | 95.5 | 96.9 1% | 70.8 -26% | 99.9 5% | 69.4 -27% |
| sRGB Coverage (%) | 99.7 | 99.8 0% | 99.8 0% | 100 0% | 97.2 -3% |
| AdobeRGB 1998 Coverage (%) | 83.9 | 89.7 7% | 72.6 -13% | 94.1 12% | 71.9 -14% |
| Response Times | -22% | -190% | 62% | -22% | |
| Response Time Grey 50% / Grey 80% * (ms) | 3.59 ? | 4.3 ? -20% | 16.8 ? -368% | 2 ? 44% | 6.3 ? -75% |
| Response Time Black / White * (ms) | 7.09 ? | 8.7 ? -23% | 7.9 ? -11% | 1.4 ? 80% | 4.8 ? 32% |
| PWM Frequency (Hz) | 1300 | ||||
| PWM Amplitude * (%) | 16.7 | ||||
| Screen | 18% | 10% | 29% | 37% | |
| Brightness middle (cd/m²) | 472 | 493.2 4% | 443 -6% | 518 10% | 480 2% |
| Brightness (cd/m²) | 438 | 477 9% | 433 -1% | 522 19% | 456 4% |
| Brightness Distribution (%) | 88 | 93 6% | 90 2% | 97 10% | 91 3% |
| Black Level * (cd/m²) | 0.4 | 0.5 -25% | 0.42 -5% | 0.32 20% | |
| Contrast (:1) | 1180 | 986 -16% | 1055 -11% | 1500 27% | |
| Colorchecker dE 2000 * | 6.07 | 3.57 41% | 3.82 37% | 2.49 59% | 1.4 77% |
| Colorchecker dE 2000 max. * | 9.76 | 7.03 28% | 7.61 22% | 5.25 46% | 2.5 74% |
| Colorchecker dE 2000 calibrated * | 2.25 | 0.68 70% | 1.33 41% | 2.15 4% | 1.3 42% |
| Greyscale dE 2000 * | 6.4 | 3.7 42% | 5.5 14% | 3.02 53% | 1.2 81% |
| Gamma | 2.52 87% | 2.16 102% | 2.249 98% | 2.37 93% | 2.16 102% |
| CCT | 7987 81% | 5876 111% | 6549 99% | 6426 101% | 6620 98% |
| Moyenne finale (programmes/paramètres) | -0% /
9% | -64% /
-23% | 32% /
29% | 0% /
17% |
* ... Moindre est la valeur, meilleures sont les performances

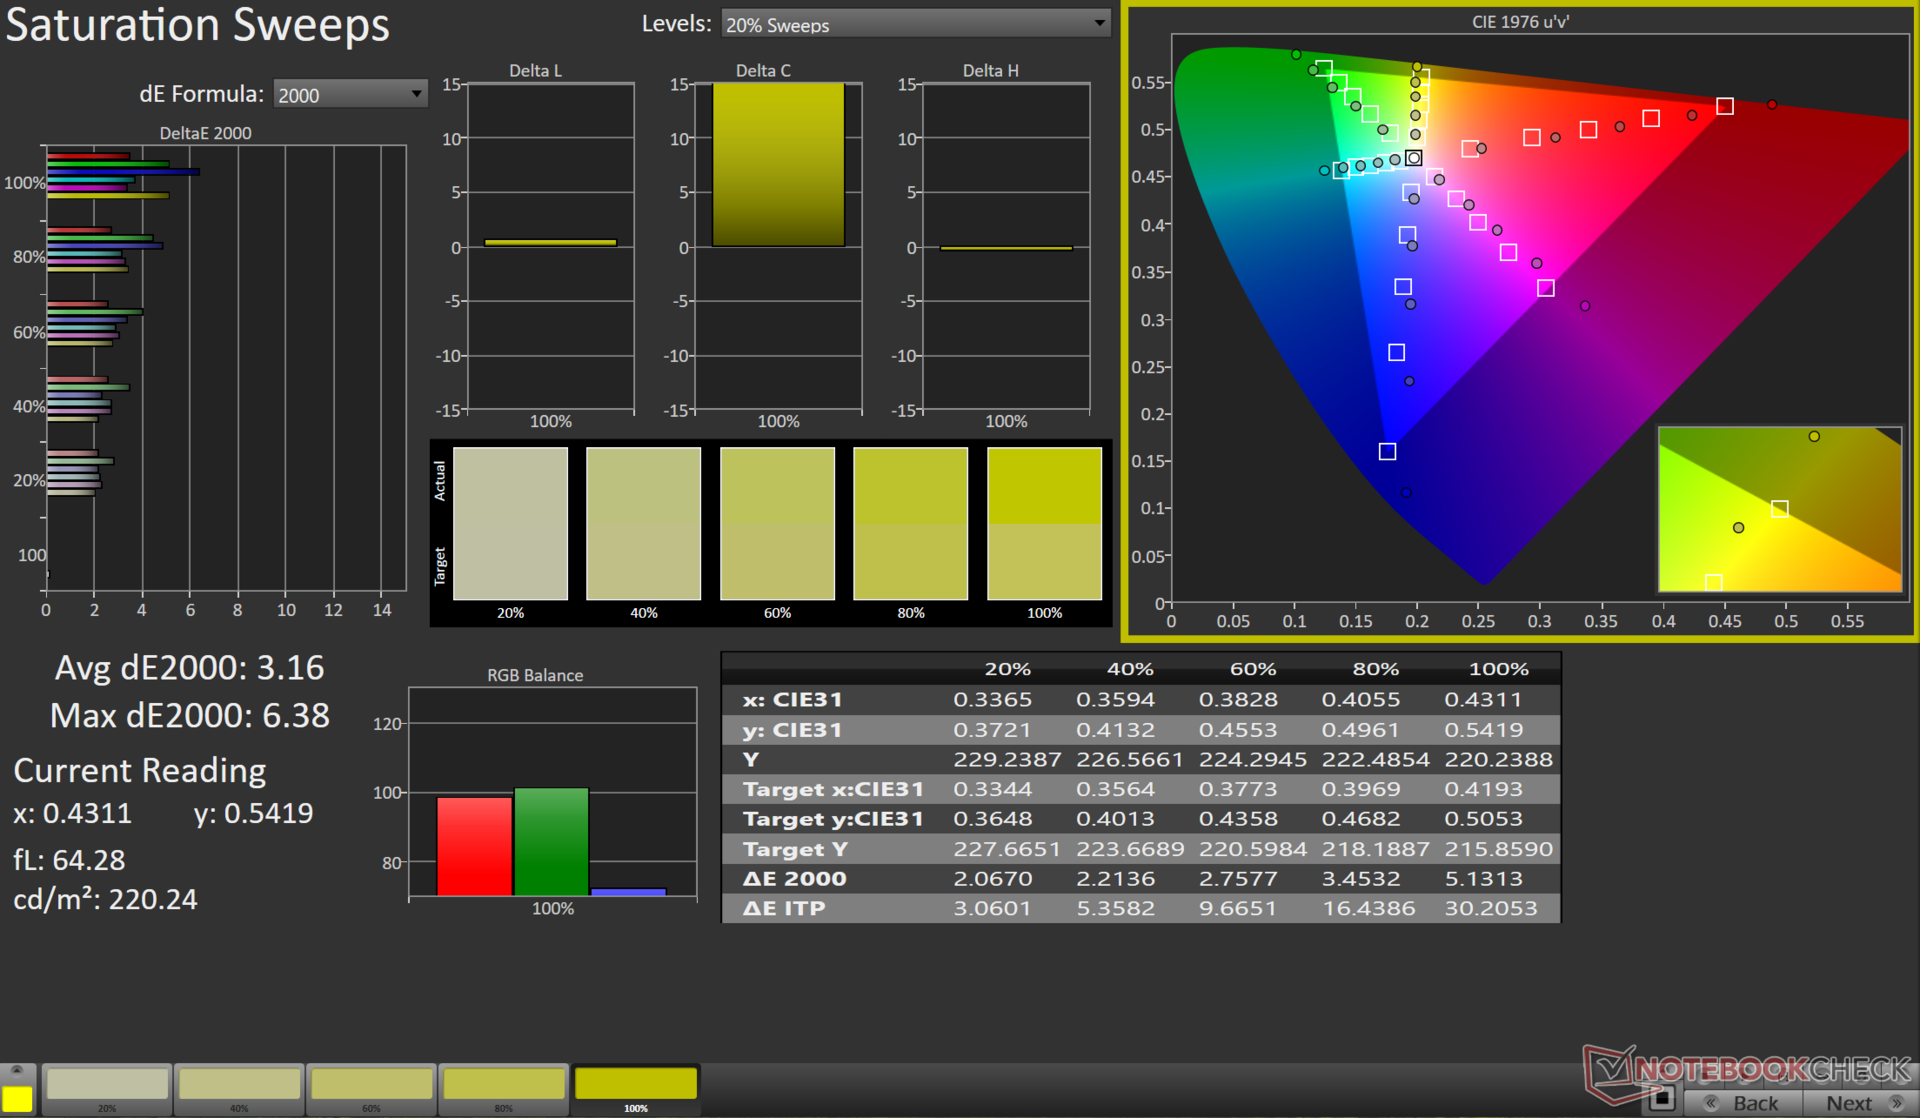
La précision des couleurs de la Crosshair 16 HX AI est un peu faible.
Notre routine de calibration utilisant le spectrophotomètre X-Rite i1Basic Pro 3 et le logiciel Calman Ultimate de Portrait Displays améliore de manière significative le DeltaE2000 en niveaux de gris à seulement 0,5 et le DeltaE2000 moyen du ColorChecker à 2,25.
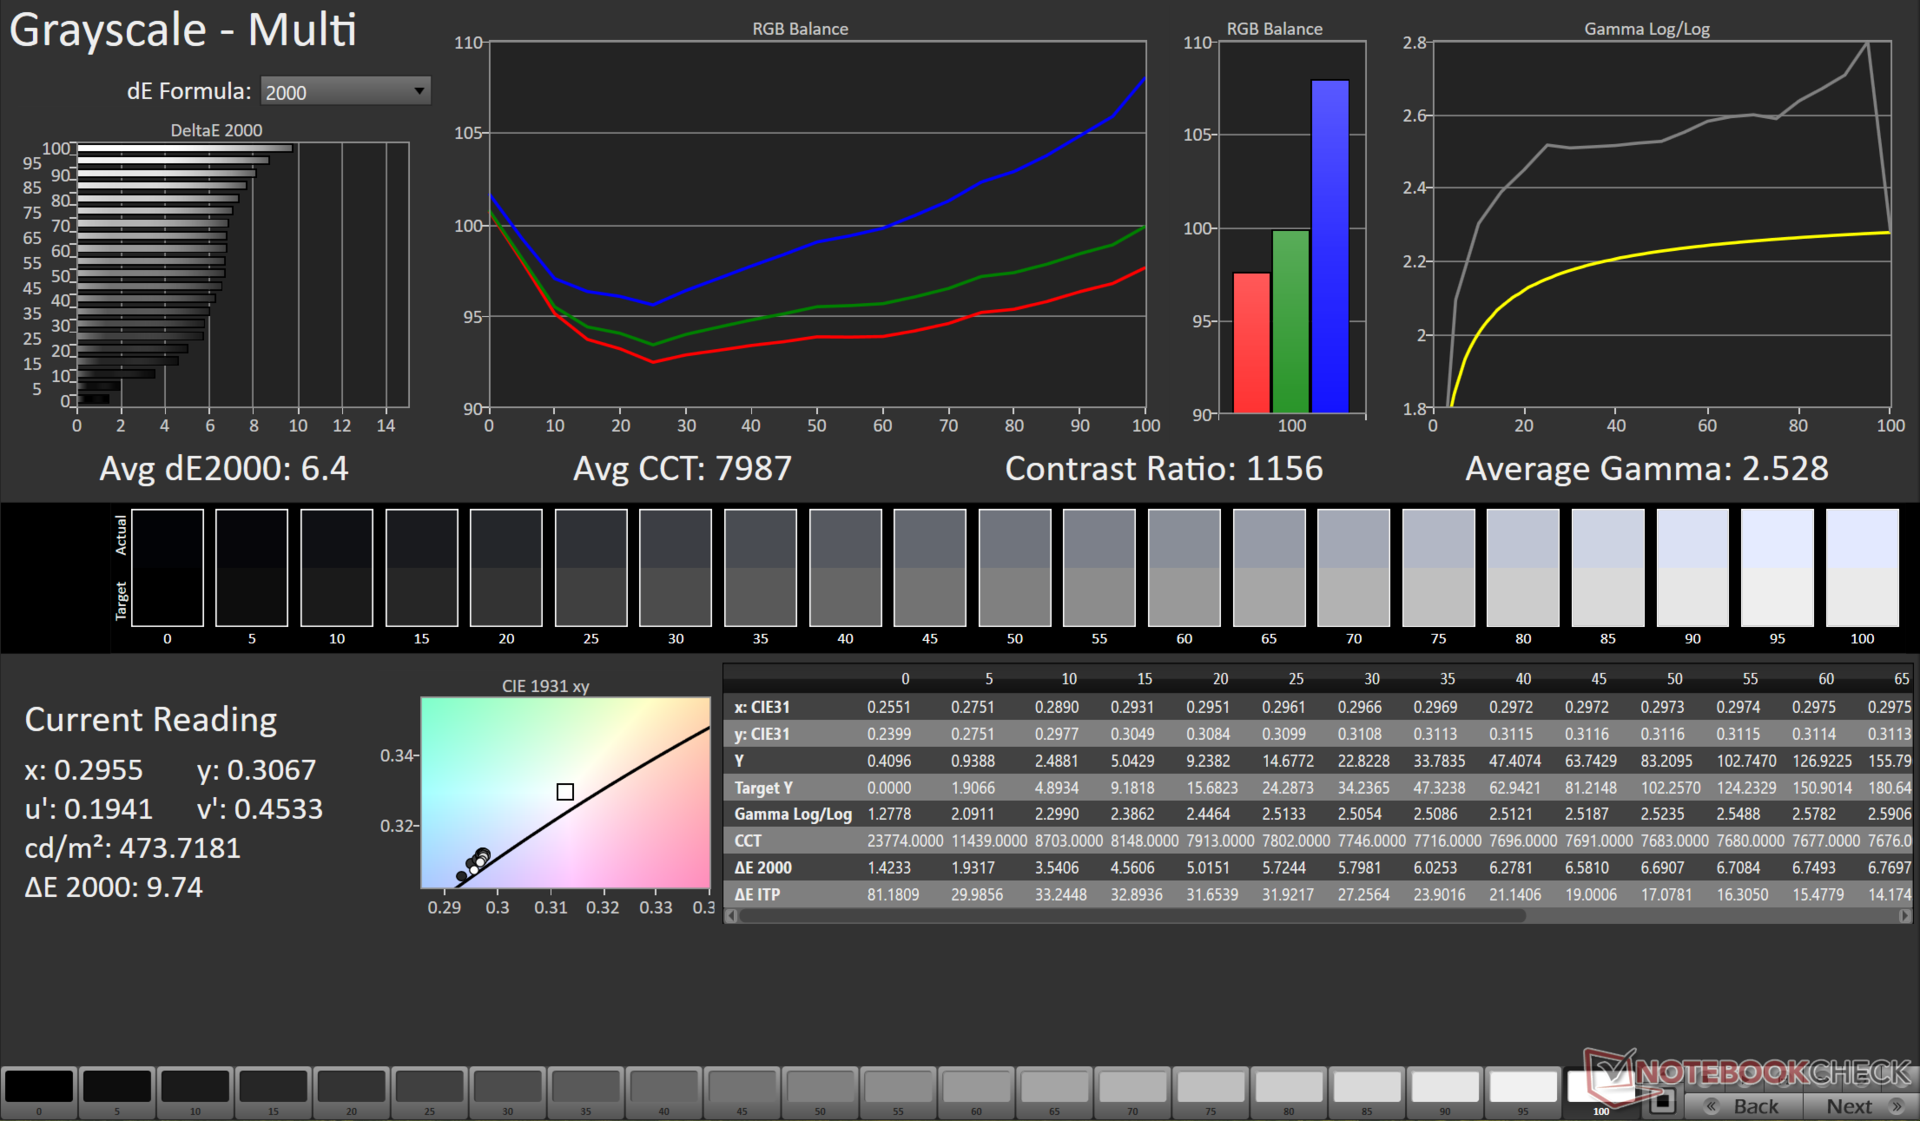


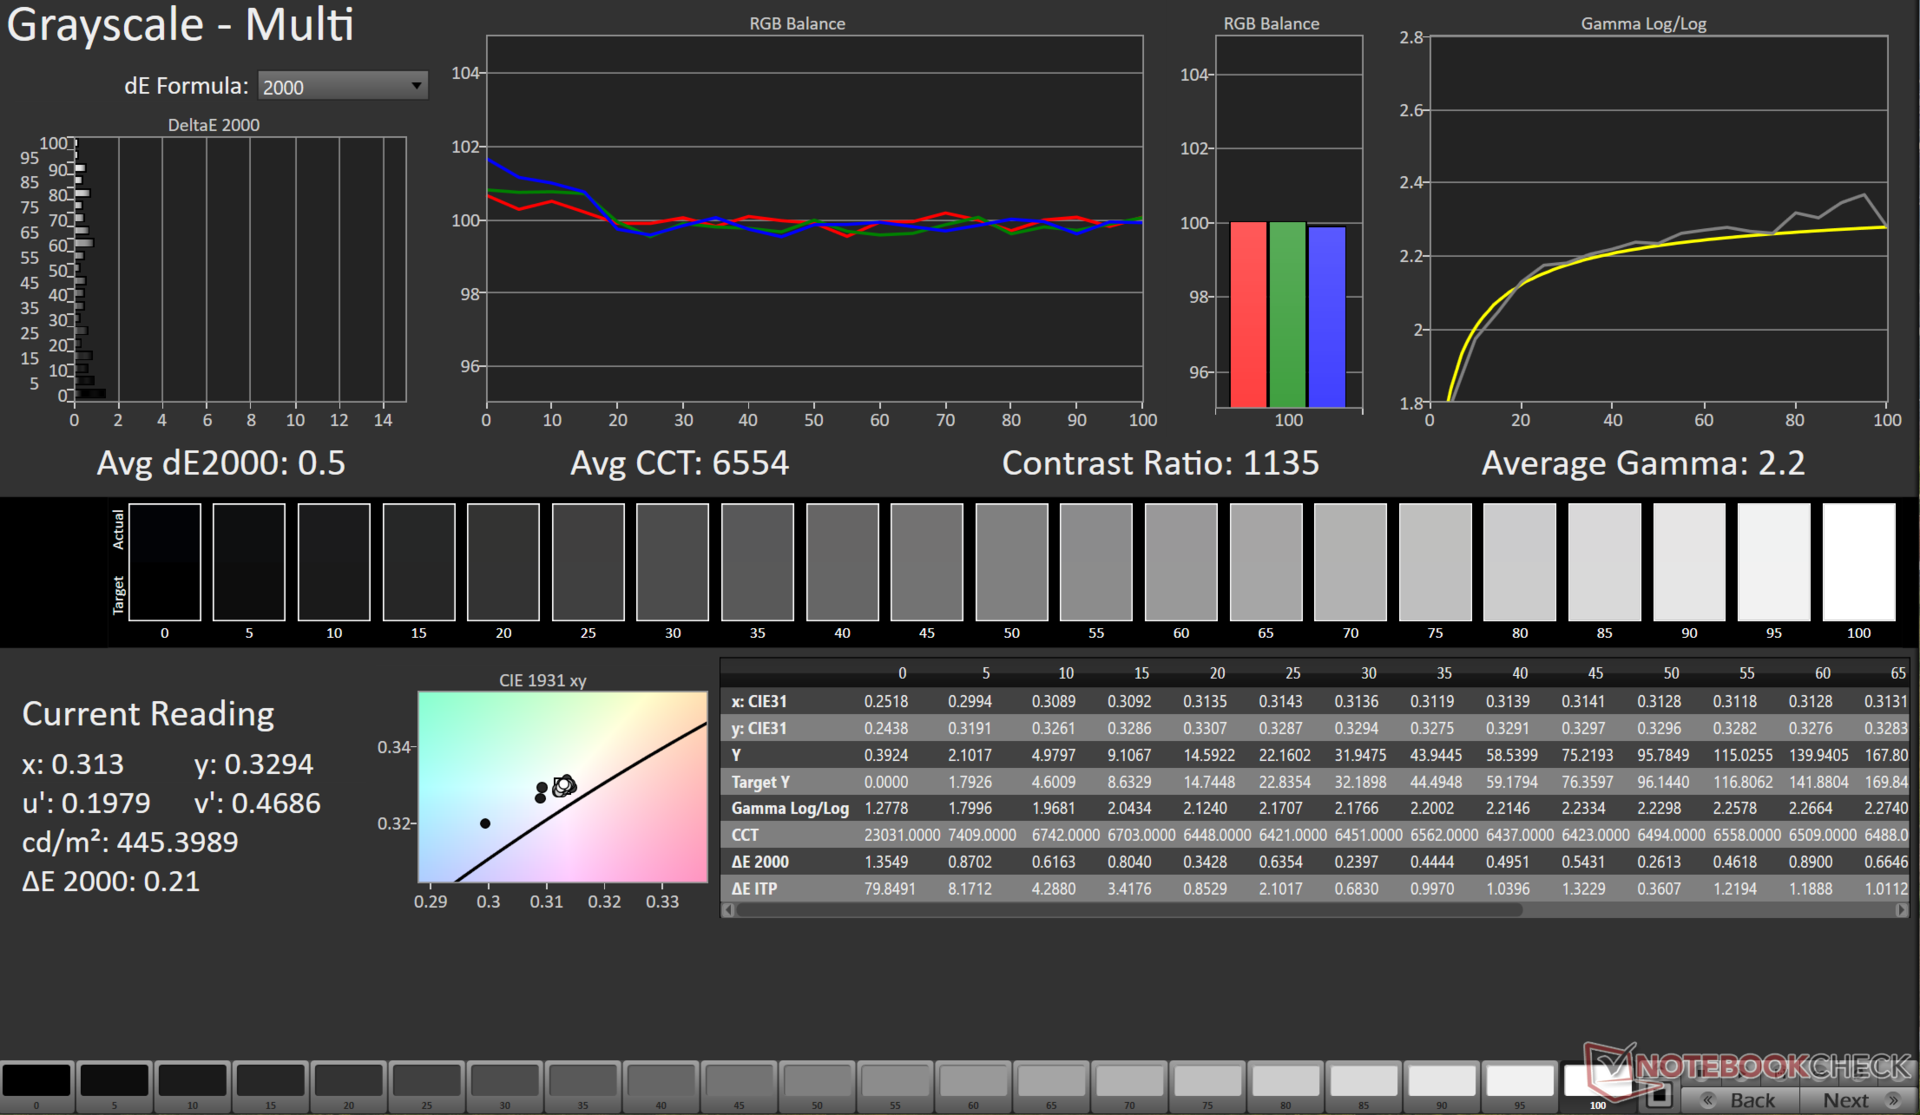

Notre fichier ICC calibré peut être téléchargé à partir du lien ci-dessus.
Temps de réponse de l'écran
| ↔ Temps de réponse noir à blanc | ||
|---|---|---|
| 7.09 ms ... hausse ↗ et chute ↘ combinées | ↗ 3.52 ms hausse | 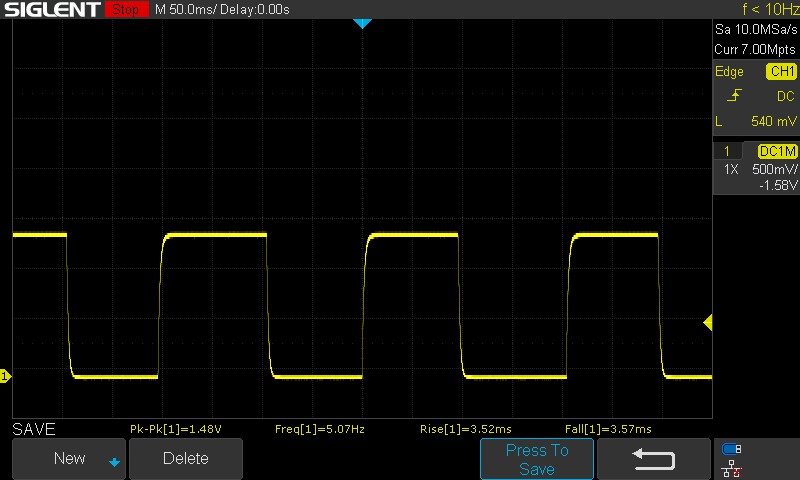 |
| ↘ 3.57 ms chute | ||
| L'écran montre de très faibles temps de réponse, parfait pour le jeu. En comparaison, tous les appareils testés affichent entre 0.1 (minimum) et 240 (maximum) ms. » 21 % des appareils testés affichent de meilleures performances. Cela signifie que les latences relevées sont meilleures que la moyenne (20 ms) de tous les appareils testés. | ||
| ↔ Temps de réponse gris 50% à gris 80% | ||
| 3.59 ms ... hausse ↗ et chute ↘ combinées | ↗ 1.51 ms hausse | 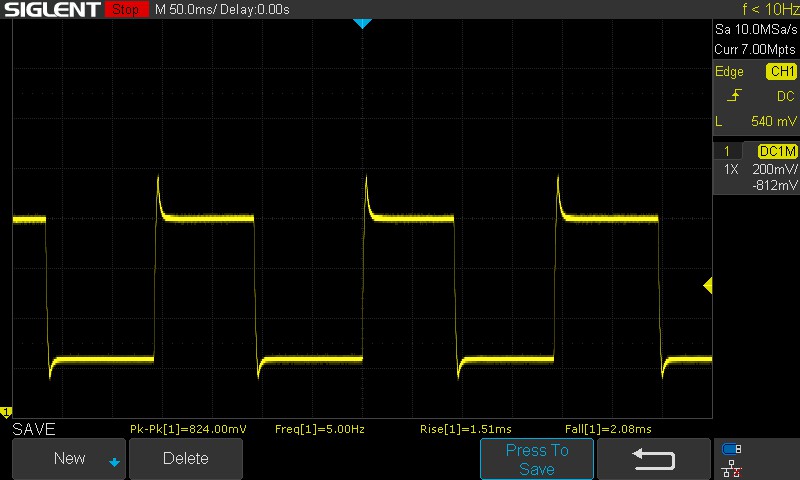 |
| ↘ 2.08 ms chute | ||
| L'écran montre de très faibles temps de réponse, parfait pour le jeu. En comparaison, tous les appareils testés affichent entre 0.165 (minimum) et 636 (maximum) ms. » 13 % des appareils testés affichent de meilleures performances. Cela signifie que les latences relevées sont meilleures que la moyenne (31.3 ms) de tous les appareils testés. | ||
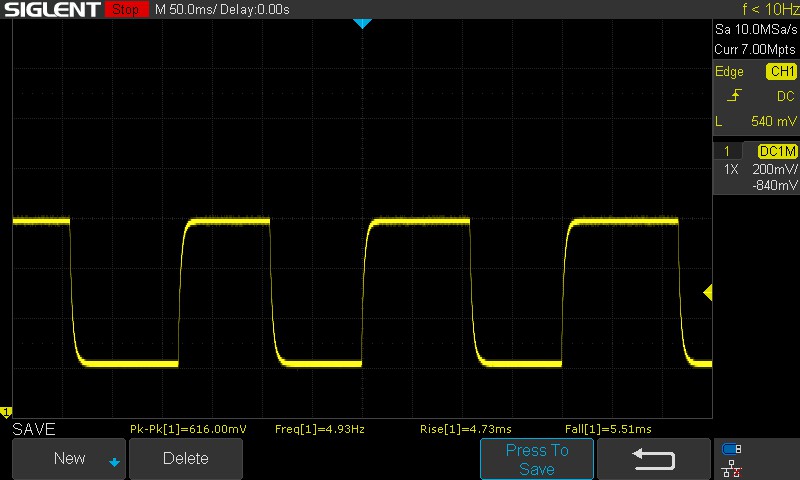
Le panneau utilise la surmultiplication par défaut.
La désactivation de l'overdrive du panneau via le centre MSI fait passer les temps de réponse de 50 % de gris à 80 % de gris de 3,59 ms à 10,24 ms.
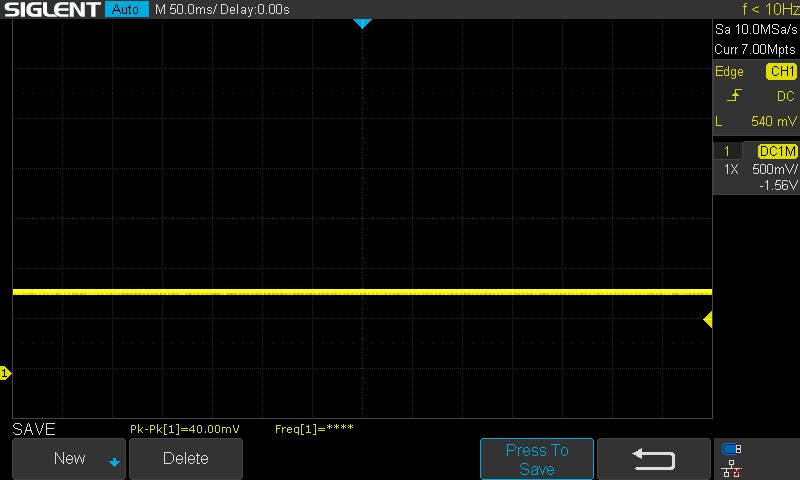
Nous n'avons observé aucun scintillement PWM à tous les niveaux de luminosité testés.
Scintillement / MLI (Modulation de largeur d'impulsion)
| Scintillement / MLI (Modulation de largeur d'impulsion) non décelé | ≤ 100 Niveau de luminosité | 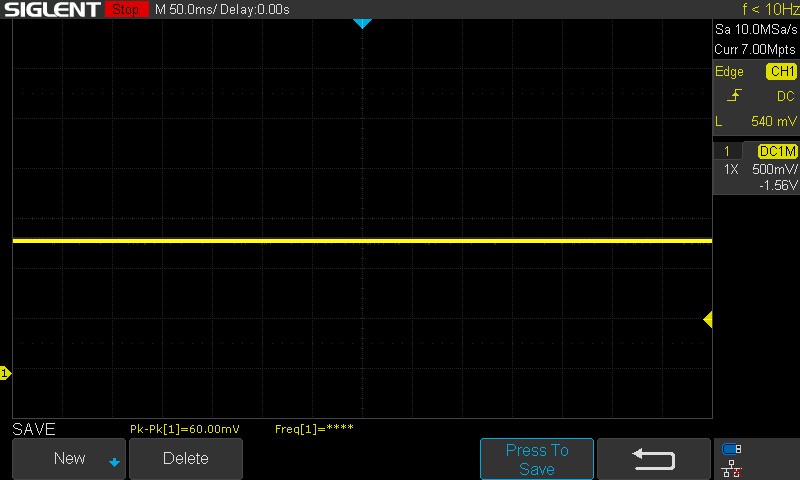 | |
En comparaison, 53 % des appareils testés n'emploient pas MDI pour assombrir leur écran. Nous avons relevé une moyenne à 7946 (minimum : 5 - maximum : 343500) Hz dans le cas où une MDI était active. | |||


Performance : Le Core Ultra 9 275HX et la RTX 5070 ne réservent aucune surprise
MSI propose la Crosshair 16 HX AI en deux versions : Core Ultra 7 255HX + RTX 5060 ordinateur portable et Core Ultra 9 275HX + RTX 5070 Laptop.
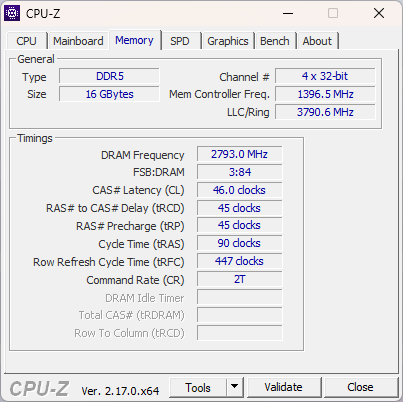
Les deux modèles peuvent être équipés de 96 Go de mémoire DDR5-6400, mais notre modèle n'était équipé que de 16 Go de RAM DDR5-5600.
Conditions d'essai
Nous avons utilisé le mode Extreme Performance dans le MSI Center avec le dGPU MUX pour tous les benchmarks et les jeux.
Les tests de batterie ont été effectués en mode ECO-Silent avec le GPU réglé sur MSHybrid.

| Mode de performance | PL1 (PBP) / Tau | PL2 (MTP) / Tau | GPU TGP (FurMark) | Cinebench R15 Multi score | Cinebench R15 Multi score (30 boucles) |
|---|---|---|---|---|---|
| ECO-Silent | 20 W / 56 s | 20 W / 2,44 ms | 13 W | 1728 (-67,8%) | 1752 (-65,05%) |
| Équilibré | 40 W / 56 s | 60 W / 2,44 ms | 75 W | 4171 (-22,28%) | 3517 (-29,84%) |
| Performance extrême | 100 W / 56 s | 130 W / 2.44 ms | 92 W | 5367 (100%) | 5013 (100%) |
Processeur
Les Crosshair 16 HX AI's Intel Core Ultra 9 275HX offre des performances comparables à celles d'autres ordinateurs portables équipés du même processeur, bien que le Lenovo Legion Pro 5soit un peu plus rapide dans l'ensemble grâce à un PL1/PL2 plus élevé.
Les performances soutenues multicœurs sont généralement stables, à l'exception d'une baisse momentanée lors de la 20e exécution d'une boucle multicœurs Cinebench R15.
Cinebench R15 Boucle multi-cœur
Cinebench R23: Multi Core | Single Core
Cinebench R20: CPU (Multi Core) | CPU (Single Core)
Cinebench R15: CPU Multi 64Bit | CPU Single 64Bit
Blender: v2.79 BMW27 CPU
7-Zip 18.03: 7z b 4 | 7z b 4 -mmt1
Geekbench 6.6: Multi-Core | Single-Core
Geekbench 5.5: Multi-Core | Single-Core
HWBOT x265 Benchmark v2.2: 4k Preset
LibreOffice : 20 Documents To PDF
R Benchmark 2.5: Overall mean
| CPU Performance rating | |
| Lenovo Legion 5 Pro 16IAX10H | |
| Aorus Elite 16 AE6H -1! | |
| Moyenne Intel Core Ultra 9 275HX | |
| Alienware 16X Aurora, RTX 5070 | |
| MSI Crosshair 16 HX AI D2XWGKG | |
| MSI Crosshair 18 HX AI A2XW | |
| MSI Crosshair A17 HX D8WGKG | |
| Moyenne de la classe Gaming | |
| Schenker XMG Core 16 M25 | |
| Asus TUF Gaming A16 FA608UP | |
| Cinebench R23 / Multi Core | |
| Lenovo Legion 5 Pro 16IAX10H | |
| Moyenne Intel Core Ultra 9 275HX (30712 - 40970, n=31) | |
| Alienware 16X Aurora, RTX 5070 | |
| MSI Crosshair 16 HX AI D2XWGKG | |
| Aorus Elite 16 AE6H | |
| MSI Crosshair 18 HX AI A2XW | |
| MSI Crosshair A17 HX D8WGKG | |
| Moyenne de la classe Gaming (10488 - 40970, n=126, 2 dernières années) | |
| Schenker XMG Core 16 M25 | |
| Asus TUF Gaming A16 FA608UP | |
| Cinebench R23 / Single Core | |
| Lenovo Legion 5 Pro 16IAX10H | |
| MSI Crosshair 16 HX AI D2XWGKG | |
| Moyenne Intel Core Ultra 9 275HX (2009 - 2267, n=31) | |
| Alienware 16X Aurora, RTX 5070 | |
| Aorus Elite 16 AE6H | |
| MSI Crosshair 18 HX AI A2XW | |
| Schenker XMG Core 16 M25 | |
| Moyenne de la classe Gaming (1166 - 2267, n=126, 2 dernières années) | |
| MSI Crosshair A17 HX D8WGKG | |
| Asus TUF Gaming A16 FA608UP | |
| Cinebench R20 / CPU (Multi Core) | |
| Lenovo Legion 5 Pro 16IAX10H | |
| Moyenne Intel Core Ultra 9 275HX (12026 - 16108, n=30) | |
| Alienware 16X Aurora, RTX 5070 | |
| MSI Crosshair 16 HX AI D2XWGKG | |
| MSI Crosshair 18 HX AI A2XW | |
| Aorus Elite 16 AE6H | |
| MSI Crosshair A17 HX D8WGKG | |
| Moyenne de la classe Gaming (4029 - 16108, n=125, 2 dernières années) | |
| Schenker XMG Core 16 M25 | |
| Asus TUF Gaming A16 FA608UP | |
| Cinebench R20 / CPU (Single Core) | |
| Lenovo Legion 5 Pro 16IAX10H | |
| MSI Crosshair 16 HX AI D2XWGKG | |
| Alienware 16X Aurora, RTX 5070 | |
| Moyenne Intel Core Ultra 9 275HX (774 - 870, n=30) | |
| Aorus Elite 16 AE6H | |
| MSI Crosshair 18 HX AI A2XW | |
| Schenker XMG Core 16 M25 | |
| Moyenne de la classe Gaming (442 - 870, n=125, 2 dernières années) | |
| MSI Crosshair A17 HX D8WGKG | |
| Asus TUF Gaming A16 FA608UP | |
| Cinebench R15 / CPU Multi 64Bit | |
| Lenovo Legion 5 Pro 16IAX10H | |
| Alienware 16X Aurora, RTX 5070 | |
| Moyenne Intel Core Ultra 9 275HX (4737 - 6271, n=30) | |
| MSI Crosshair A17 HX D8WGKG | |
| MSI Crosshair 16 HX AI D2XWGKG | |
| Aorus Elite 16 AE6H | |
| MSI Crosshair 18 HX AI A2XW | |
| Moyenne de la classe Gaming (1578 - 6271, n=126, 2 dernières années) | |
| Schenker XMG Core 16 M25 | |
| Asus TUF Gaming A16 FA608UP | |
| Cinebench R15 / CPU Single 64Bit | |
| Lenovo Legion 5 Pro 16IAX10H | |
| Moyenne Intel Core Ultra 9 275HX (306 - 343, n=31) | |
| MSI Crosshair 16 HX AI D2XWGKG | |
| Alienware 16X Aurora, RTX 5070 | |
| Aorus Elite 16 AE6H | |
| MSI Crosshair 18 HX AI A2XW | |
| Moyenne de la classe Gaming (188.8 - 343, n=125, 2 dernières années) | |
| MSI Crosshair A17 HX D8WGKG | |
| Asus TUF Gaming A16 FA608UP | |
| Schenker XMG Core 16 M25 | |
| Blender / v2.79 BMW27 CPU | |
| Asus TUF Gaming A16 FA608UP | |
| Moyenne de la classe Gaming (80 - 330, n=122, 2 dernières années) | |
| Schenker XMG Core 16 M25 | |
| MSI Crosshair A17 HX D8WGKG | |
| Alienware 16X Aurora, RTX 5070 | |
| MSI Crosshair 18 HX AI A2XW | |
| Lenovo Legion 5 Pro 16IAX10H | |
| MSI Crosshair 16 HX AI D2XWGKG | |
| Moyenne Intel Core Ultra 9 275HX (82 - 116, n=29) | |
| 7-Zip 18.03 / 7z b 4 | |
| MSI Crosshair A17 HX D8WGKG | |
| Moyenne Intel Core Ultra 9 275HX (98236 - 124155, n=30) | |
| Lenovo Legion 5 Pro 16IAX10H | |
| Aorus Elite 16 AE6H | |
| MSI Crosshair 18 HX AI A2XW | |
| MSI Crosshair 16 HX AI D2XWGKG | |
| Alienware 16X Aurora, RTX 5070 | |
| Moyenne de la classe Gaming (33491 - 148086, n=123, 2 dernières années) | |
| Schenker XMG Core 16 M25 | |
| Asus TUF Gaming A16 FA608UP | |
| 7-Zip 18.03 / 7z b 4 -mmt1 | |
| MSI Crosshair A17 HX D8WGKG | |
| MSI Crosshair 16 HX AI D2XWGKG | |
| Moyenne Intel Core Ultra 9 275HX (6026 - 7149, n=30) | |
| Lenovo Legion 5 Pro 16IAX10H | |
| Alienware 16X Aurora, RTX 5070 | |
| Schenker XMG Core 16 M25 | |
| Aorus Elite 16 AE6H | |
| Moyenne de la classe Gaming (4199 - 7508, n=123, 2 dernières années) | |
| MSI Crosshair 18 HX AI A2XW | |
| Asus TUF Gaming A16 FA608UP | |
| Geekbench 6.6 / Multi-Core | |
| Lenovo Legion 5 Pro 16IAX10H | |
| Moyenne Intel Core Ultra 9 275HX (16033 - 21668, n=32) | |
| Alienware 16X Aurora, RTX 5070 | |
| MSI Crosshair 18 HX AI A2XW | |
| Aorus Elite 16 AE6H | |
| MSI Crosshair 16 HX AI D2XWGKG | |
| MSI Crosshair A17 HX D8WGKG | |
| Schenker XMG Core 16 M25 | |
| Moyenne de la classe Gaming (6625 - 22104, n=124, 2 dernières années) | |
| Asus TUF Gaming A16 FA608UP | |
| Geekbench 6.6 / Single-Core | |
| Lenovo Legion 5 Pro 16IAX10H | |
| Alienware 16X Aurora, RTX 5070 | |
| MSI Crosshair 16 HX AI D2XWGKG | |
| Moyenne Intel Core Ultra 9 275HX (2843 - 3160, n=32) | |
| Aorus Elite 16 AE6H | |
| Schenker XMG Core 16 M25 | |
| MSI Crosshair 18 HX AI A2XW | |
| MSI Crosshair A17 HX D8WGKG | |
| Moyenne de la classe Gaming (1490 - 3259, n=124, 2 dernières années) | |
| Asus TUF Gaming A16 FA608UP | |
| Geekbench 5.5 / Multi-Core | |
| Moyenne Intel Core Ultra 9 275HX (19105 - 25855, n=31) | |
| Aorus Elite 16 AE6H | |
| MSI Crosshair 18 HX AI A2XW | |
| Lenovo Legion 5 Pro 16IAX10H | |
| MSI Crosshair 16 HX AI D2XWGKG | |
| Alienware 16X Aurora, RTX 5070 | |
| MSI Crosshair A17 HX D8WGKG | |
| Moyenne de la classe Gaming (6460 - 27010, n=123, 2 dernières années) | |
| Schenker XMG Core 16 M25 | |
| Asus TUF Gaming A16 FA608UP | |
| Geekbench 5.5 / Single-Core | |
| Lenovo Legion 5 Pro 16IAX10H | |
| Alienware 16X Aurora, RTX 5070 | |
| MSI Crosshair 16 HX AI D2XWGKG | |
| Moyenne Intel Core Ultra 9 275HX (2033 - 2292, n=31) | |
| Aorus Elite 16 AE6H | |
| MSI Crosshair 18 HX AI A2XW | |
| Schenker XMG Core 16 M25 | |
| Moyenne de la classe Gaming (986 - 2474, n=123, 2 dernières années) | |
| Asus TUF Gaming A16 FA608UP | |
| MSI Crosshair A17 HX D8WGKG | |
| HWBOT x265 Benchmark v2.2 / 4k Preset | |
| Lenovo Legion 5 Pro 16IAX10H | |
| Moyenne Intel Core Ultra 9 275HX (30.7 - 43.8, n=30) | |
| Alienware 16X Aurora, RTX 5070 | |
| MSI Crosshair A17 HX D8WGKG | |
| MSI Crosshair 16 HX AI D2XWGKG | |
| MSI Crosshair 18 HX AI A2XW | |
| Aorus Elite 16 AE6H | |
| Schenker XMG Core 16 M25 | |
| Moyenne de la classe Gaming (11.5 - 44.3, n=123, 2 dernières années) | |
| Asus TUF Gaming A16 FA608UP | |
| LibreOffice / 20 Documents To PDF | |
| Asus TUF Gaming A16 FA608UP | |
| Schenker XMG Core 16 M25 | |
| Moyenne de la classe Gaming (19 - 88.8, n=123, 2 dernières années) | |
| Moyenne Intel Core Ultra 9 275HX (33.2 - 62.1, n=30) | |
| MSI Crosshair 16 HX AI D2XWGKG | |
| MSI Crosshair A17 HX D8WGKG | |
| Aorus Elite 16 AE6H | |
| Alienware 16X Aurora, RTX 5070 | |
| MSI Crosshair 18 HX AI A2XW | |
| Lenovo Legion 5 Pro 16IAX10H | |
| R Benchmark 2.5 / Overall mean | |
| MSI Crosshair 18 HX AI A2XW | |
| Asus TUF Gaming A16 FA608UP | |
| MSI Crosshair A17 HX D8WGKG | |
| Moyenne de la classe Gaming (0.3439 - 0.759, n=124, 2 dernières années) | |
| Aorus Elite 16 AE6H | |
| Alienware 16X Aurora, RTX 5070 | |
| Moyenne Intel Core Ultra 9 275HX (0.3943 - 0.4568, n=30) | |
| Lenovo Legion 5 Pro 16IAX10H | |
| MSI Crosshair 16 HX AI D2XWGKG | |
| Schenker XMG Core 16 M25 | |
* ... Moindre est la valeur, meilleures sont les performances
AIDA64: FP32 Ray-Trace | FPU Julia | CPU SHA3 | CPU Queen | FPU SinJulia | FPU Mandel | CPU AES | CPU ZLib | FP64 Ray-Trace | CPU PhotoWorxx
| Performance rating | |
| MSI Crosshair A17 HX D8WGKG | |
| Lenovo Legion 5 Pro 16IAX10H | |
| Moyenne Intel Core Ultra 9 275HX | |
| MSI Crosshair 18 HX AI A2XW | |
| MSI Crosshair 16 HX AI D2XWGKG | |
| Alienware 16X Aurora, RTX 5070 | |
| Aorus Elite 16 AE6H | |
| Schenker XMG Core 16 M25 | |
| Moyenne de la classe Gaming | |
| Asus TUF Gaming A16 FA608UP | |
| AIDA64 / FP32 Ray-Trace | |
| MSI Crosshair A17 HX D8WGKG | |
| Schenker XMG Core 16 M25 | |
| MSI Crosshair 18 HX AI A2XW | |
| MSI Crosshair 16 HX AI D2XWGKG | |
| Moyenne Intel Core Ultra 9 275HX (28039 - 39895, n=30) | |
| Lenovo Legion 5 Pro 16IAX10H | |
| Alienware 16X Aurora, RTX 5070 | |
| Aorus Elite 16 AE6H | |
| Moyenne de la classe Gaming (10227 - 85542, n=123, 2 dernières années) | |
| Asus TUF Gaming A16 FA608UP | |
| AIDA64 / FPU Julia | |
| MSI Crosshair A17 HX D8WGKG | |
| MSI Crosshair 18 HX AI A2XW | |
| Lenovo Legion 5 Pro 16IAX10H | |
| MSI Crosshair 16 HX AI D2XWGKG | |
| Moyenne Intel Core Ultra 9 275HX (140254 - 200744, n=30) | |
| Aorus Elite 16 AE6H | |
| Alienware 16X Aurora, RTX 5070 | |
| Schenker XMG Core 16 M25 | |
| Moyenne de la classe Gaming (51376 - 238426, n=123, 2 dernières années) | |
| Asus TUF Gaming A16 FA608UP | |
| AIDA64 / CPU SHA3 | |
| MSI Crosshair A17 HX D8WGKG | |
| Moyenne Intel Core Ultra 9 275HX (6710 - 9817, n=30) | |
| Lenovo Legion 5 Pro 16IAX10H | |
| MSI Crosshair 16 HX AI D2XWGKG | |
| MSI Crosshair 18 HX AI A2XW | |
| Alienware 16X Aurora, RTX 5070 | |
| Aorus Elite 16 AE6H | |
| Moyenne de la classe Gaming (2180 - 9817, n=123, 2 dernières années) | |
| Schenker XMG Core 16 M25 | |
| Asus TUF Gaming A16 FA608UP | |
| AIDA64 / CPU Queen | |
| MSI Crosshair A17 HX D8WGKG | |
| Lenovo Legion 5 Pro 16IAX10H | |
| Alienware 16X Aurora, RTX 5070 | |
| Moyenne Intel Core Ultra 9 275HX (113887 - 140937, n=30) | |
| Aorus Elite 16 AE6H | |
| MSI Crosshair 16 HX AI D2XWGKG | |
| MSI Crosshair 18 HX AI A2XW | |
| Asus TUF Gaming A16 FA608UP | |
| Moyenne de la classe Gaming (49785 - 173351, n=120, 2 dernières années) | |
| Schenker XMG Core 16 M25 | |
| AIDA64 / FPU SinJulia | |
| MSI Crosshair A17 HX D8WGKG | |
| Schenker XMG Core 16 M25 | |
| Asus TUF Gaming A16 FA608UP | |
| Moyenne de la classe Gaming (4424 - 33636, n=123, 2 dernières années) | |
| Lenovo Legion 5 Pro 16IAX10H | |
| Alienware 16X Aurora, RTX 5070 | |
| Moyenne Intel Core Ultra 9 275HX (11172 - 14425, n=30) | |
| MSI Crosshair 16 HX AI D2XWGKG | |
| Aorus Elite 16 AE6H | |
| MSI Crosshair 18 HX AI A2XW | |
| AIDA64 / FPU Mandel | |
| MSI Crosshair A17 HX D8WGKG | |
| MSI Crosshair 18 HX AI A2XW | |
| MSI Crosshair 16 HX AI D2XWGKG | |
| Moyenne Intel Core Ultra 9 275HX (72596 - 104508, n=30) | |
| Lenovo Legion 5 Pro 16IAX10H | |
| Aorus Elite 16 AE6H | |
| Alienware 16X Aurora, RTX 5070 | |
| Schenker XMG Core 16 M25 | |
| Moyenne de la classe Gaming (25115 - 128721, n=123, 2 dernières années) | |
| Asus TUF Gaming A16 FA608UP | |
| AIDA64 / CPU AES | |
| MSI Crosshair A17 HX D8WGKG | |
| Lenovo Legion 5 Pro 16IAX10H | |
| Moyenne Intel Core Ultra 9 275HX (105608 - 247074, n=30) | |
| MSI Crosshair 16 HX AI D2XWGKG | |
| Alienware 16X Aurora, RTX 5070 | |
| MSI Crosshair 18 HX AI A2XW | |
| Schenker XMG Core 16 M25 | |
| Aorus Elite 16 AE6H | |
| Moyenne de la classe Gaming (39258 - 247074, n=123, 2 dernières années) | |
| Asus TUF Gaming A16 FA608UP | |
| AIDA64 / CPU ZLib | |
| Lenovo Legion 5 Pro 16IAX10H | |
| MSI Crosshair A17 HX D8WGKG | |
| Moyenne Intel Core Ultra 9 275HX (1582 - 2263, n=30) | |
| MSI Crosshair 16 HX AI D2XWGKG | |
| Alienware 16X Aurora, RTX 5070 | |
| MSI Crosshair 18 HX AI A2XW | |
| Aorus Elite 16 AE6H | |
| Schenker XMG Core 16 M25 | |
| Moyenne de la classe Gaming (574 - 2531, n=123, 2 dernières années) | |
| Asus TUF Gaming A16 FA608UP | |
| AIDA64 / FP64 Ray-Trace | |
| MSI Crosshair A17 HX D8WGKG | |
| Schenker XMG Core 16 M25 | |
| MSI Crosshair 18 HX AI A2XW | |
| MSI Crosshair 16 HX AI D2XWGKG | |
| Moyenne Intel Core Ultra 9 275HX (14847 - 21854, n=30) | |
| Lenovo Legion 5 Pro 16IAX10H | |
| Aorus Elite 16 AE6H | |
| Alienware 16X Aurora, RTX 5070 | |
| Moyenne de la classe Gaming (5509 - 45446, n=123, 2 dernières années) | |
| Asus TUF Gaming A16 FA608UP | |
| AIDA64 / CPU PhotoWorxx | |
| Schenker XMG Core 16 M25 | |
| Moyenne Intel Core Ultra 9 275HX (37482 - 62916, n=30) | |
| Lenovo Legion 5 Pro 16IAX10H | |
| Alienware 16X Aurora, RTX 5070 | |
| Aorus Elite 16 AE6H | |
| MSI Crosshair 18 HX AI A2XW | |
| Moyenne de la classe Gaming (12271 - 62916, n=123, 2 dernières années) | |
| Asus TUF Gaming A16 FA608UP | |
| MSI Crosshair 16 HX AI D2XWGKG | |
| MSI Crosshair A17 HX D8WGKG | |
Performance du système
Nous avons dû temporairement rétrograder le pilote Nvidia à la version 577.00 pour que PCMark 10 fonctionne de manière fiable.
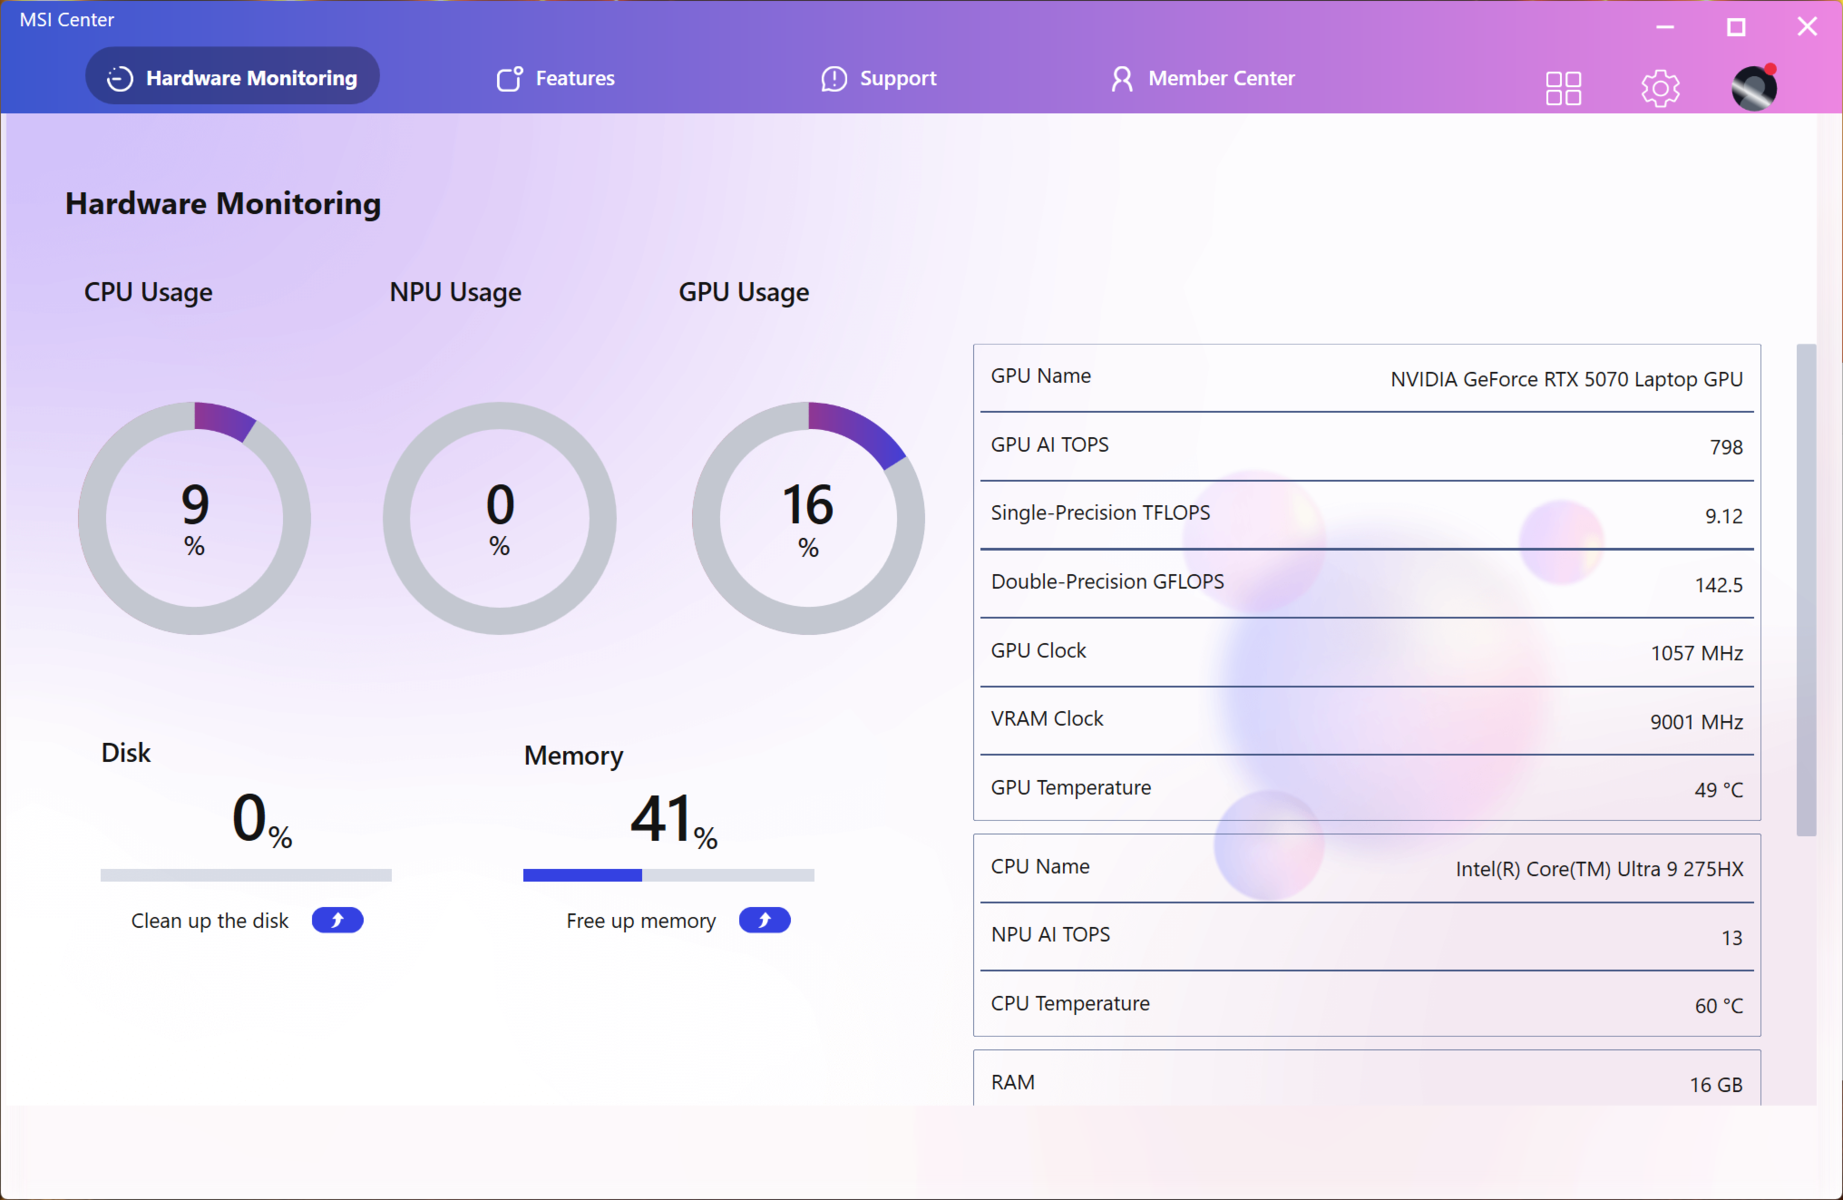
Les performances globales du système sont plus qu'adéquates pour la productivité quotidienne et la navigation sur le web.
PCMark 10: Score | Essentials | Productivity | Digital Content Creation
CrossMark: Overall | Productivity | Creativity | Responsiveness
AIDA64: Memory Copy | Memory Read | Memory Write | Memory Latency
WebXPRT 3: Overall
WebXPRT 4: Overall
Mozilla Kraken 1.1: Total
| Performance rating | |
| Lenovo Legion 5 Pro 16IAX10H | |
| Aorus Elite 16 AE6H | |
| Moyenne Intel Core Ultra 9 275HX, NVIDIA GeForce RTX 5070 Laptop | |
| Alienware 16X Aurora, RTX 5070 -4! | |
| MSI Crosshair 18 HX AI A2XW | |
| MSI Crosshair 16 HX AI D2XWGKG | |
| Schenker XMG Core 16 M25 -4! | |
| Moyenne de la classe Gaming | |
| MSI Crosshair A17 HX D8WGKG | |
| Asus TUF Gaming A16 FA608UP -4! | |
| PCMark 10 / Score | |
| Moyenne Intel Core Ultra 9 275HX, NVIDIA GeForce RTX 5070 Laptop (8018 - 9667, n=4) | |
| Lenovo Legion 5 Pro 16IAX10H | |
| Moyenne de la classe Gaming (5828 - 10060, n=105, 2 dernières années) | |
| MSI Crosshair 16 HX AI D2XWGKG | |
| MSI Crosshair A17 HX D8WGKG | |
| Aorus Elite 16 AE6H | |
| MSI Crosshair 18 HX AI A2XW | |
| PCMark 10 / Essentials | |
| MSI Crosshair A17 HX D8WGKG | |
| MSI Crosshair 18 HX AI A2XW | |
| Aorus Elite 16 AE6H | |
| MSI Crosshair 16 HX AI D2XWGKG | |
| Lenovo Legion 5 Pro 16IAX10H | |
| Moyenne Intel Core Ultra 9 275HX, NVIDIA GeForce RTX 5070 Laptop (10259 - 11025, n=4) | |
| Moyenne de la classe Gaming (8810 - 12600, n=109, 2 dernières années) | |
| PCMark 10 / Productivity | |
| Moyenne Intel Core Ultra 9 275HX, NVIDIA GeForce RTX 5070 Laptop (8307 - 16716, n=4) | |
| Moyenne de la classe Gaming (6662 - 16716, n=107, 2 dernières années) | |
| MSI Crosshair 18 HX AI A2XW | |
| Lenovo Legion 5 Pro 16IAX10H | |
| MSI Crosshair A17 HX D8WGKG | |
| Aorus Elite 16 AE6H | |
| MSI Crosshair 16 HX AI D2XWGKG | |
| PCMark 10 / Digital Content Creation | |
| MSI Crosshair 16 HX AI D2XWGKG | |
| Lenovo Legion 5 Pro 16IAX10H | |
| Moyenne Intel Core Ultra 9 275HX, NVIDIA GeForce RTX 5070 Laptop (13010 - 16417, n=4) | |
| Aorus Elite 16 AE6H | |
| Moyenne de la classe Gaming (7602 - 19351, n=107, 2 dernières années) | |
| MSI Crosshair A17 HX D8WGKG | |
| MSI Crosshair 18 HX AI A2XW | |
| CrossMark / Overall | |
| Alienware 16X Aurora, RTX 5070 | |
| Lenovo Legion 5 Pro 16IAX10H | |
| Moyenne Intel Core Ultra 9 275HX, NVIDIA GeForce RTX 5070 Laptop (2084 - 2269, n=5) | |
| Aorus Elite 16 AE6H | |
| MSI Crosshair 16 HX AI D2XWGKG | |
| MSI Crosshair 18 HX AI A2XW | |
| Schenker XMG Core 16 M25 | |
| MSI Crosshair A17 HX D8WGKG | |
| Moyenne de la classe Gaming (1366 - 2344, n=107, 2 dernières années) | |
| Asus TUF Gaming A16 FA608UP | |
| CrossMark / Productivity | |
| Alienware 16X Aurora, RTX 5070 | |
| Lenovo Legion 5 Pro 16IAX10H | |
| Aorus Elite 16 AE6H | |
| Moyenne Intel Core Ultra 9 275HX, NVIDIA GeForce RTX 5070 Laptop (1931 - 2173, n=5) | |
| MSI Crosshair 16 HX AI D2XWGKG | |
| MSI Crosshair 18 HX AI A2XW | |
| MSI Crosshair A17 HX D8WGKG | |
| Moyenne de la classe Gaming (1386 - 2211, n=107, 2 dernières années) | |
| Schenker XMG Core 16 M25 | |
| Asus TUF Gaming A16 FA608UP | |
| CrossMark / Creativity | |
| Lenovo Legion 5 Pro 16IAX10H | |
| Schenker XMG Core 16 M25 | |
| Alienware 16X Aurora, RTX 5070 | |
| Moyenne Intel Core Ultra 9 275HX, NVIDIA GeForce RTX 5070 Laptop (2322 - 2430, n=5) | |
| MSI Crosshair 16 HX AI D2XWGKG | |
| MSI Crosshair 18 HX AI A2XW | |
| Aorus Elite 16 AE6H | |
| MSI Crosshair A17 HX D8WGKG | |
| Moyenne de la classe Gaming (1343 - 2729, n=107, 2 dernières années) | |
| Asus TUF Gaming A16 FA608UP | |
| CrossMark / Responsiveness | |
| Alienware 16X Aurora, RTX 5070 | |
| Aorus Elite 16 AE6H | |
| Moyenne Intel Core Ultra 9 275HX, NVIDIA GeForce RTX 5070 Laptop (1754 - 2143, n=5) | |
| Lenovo Legion 5 Pro 16IAX10H | |
| MSI Crosshair 16 HX AI D2XWGKG | |
| MSI Crosshair 18 HX AI A2XW | |
| MSI Crosshair A17 HX D8WGKG | |
| Moyenne de la classe Gaming (1226 - 2330, n=107, 2 dernières années) | |
| Schenker XMG Core 16 M25 | |
| Asus TUF Gaming A16 FA608UP | |
| AIDA64 / Memory Copy | |
| Aorus Elite 16 AE6H | |
| Lenovo Legion 5 Pro 16IAX10H | |
| Alienware 16X Aurora, RTX 5070 | |
| MSI Crosshair 18 HX AI A2XW | |
| Moyenne Intel Core Ultra 9 275HX, NVIDIA GeForce RTX 5070 Laptop (68559 - 83499, n=5) | |
| Schenker XMG Core 16 M25 | |
| Moyenne de la classe Gaming (21750 - 108104, n=123, 2 dernières années) | |
| MSI Crosshair 16 HX AI D2XWGKG | |
| Asus TUF Gaming A16 FA608UP | |
| MSI Crosshair A17 HX D8WGKG | |
| AIDA64 / Memory Read | |
| Moyenne Intel Core Ultra 9 275HX, NVIDIA GeForce RTX 5070 Laptop (83924 - 93622, n=5) | |
| Lenovo Legion 5 Pro 16IAX10H | |
| Aorus Elite 16 AE6H | |
| Alienware 16X Aurora, RTX 5070 | |
| Schenker XMG Core 16 M25 | |
| MSI Crosshair 18 HX AI A2XW | |
| MSI Crosshair 16 HX AI D2XWGKG | |
| Moyenne de la classe Gaming (22956 - 104349, n=123, 2 dernières années) | |
| MSI Crosshair A17 HX D8WGKG | |
| Asus TUF Gaming A16 FA608UP | |
| AIDA64 / Memory Write | |
| Aorus Elite 16 AE6H | |
| Asus TUF Gaming A16 FA608UP | |
| Moyenne Intel Core Ultra 9 275HX, NVIDIA GeForce RTX 5070 Laptop (66719 - 106063, n=5) | |
| Schenker XMG Core 16 M25 | |
| Alienware 16X Aurora, RTX 5070 | |
| Lenovo Legion 5 Pro 16IAX10H | |
| MSI Crosshair 18 HX AI A2XW | |
| Moyenne de la classe Gaming (22297 - 133486, n=123, 2 dernières années) | |
| MSI Crosshair 16 HX AI D2XWGKG | |
| MSI Crosshair A17 HX D8WGKG | |
| AIDA64 / Memory Latency | |
| Alienware 16X Aurora, RTX 5070 | |
| Lenovo Legion 5 Pro 16IAX10H | |
| Aorus Elite 16 AE6H | |
| MSI Crosshair 16 HX AI D2XWGKG | |
| Moyenne Intel Core Ultra 9 275HX, NVIDIA GeForce RTX 5070 Laptop (106.8 - 116, n=5) | |
| MSI Crosshair 18 HX AI A2XW | |
| Moyenne de la classe Gaming (75.3 - 259, n=123, 2 dernières années) | |
| Asus TUF Gaming A16 FA608UP | |
| Schenker XMG Core 16 M25 | |
| MSI Crosshair A17 HX D8WGKG | |
| WebXPRT 3 / Overall | |
| Lenovo Legion 5 Pro 16IAX10H | |
| Alienware 16X Aurora, RTX 5070 | |
| Schenker XMG Core 16 M25 | |
| Moyenne Intel Core Ultra 9 275HX, NVIDIA GeForce RTX 5070 Laptop (309 - 364, n=5) | |
| MSI Crosshair 16 HX AI D2XWGKG | |
| MSI Crosshair 18 HX AI A2XW | |
| Moyenne de la classe Gaming (237 - 532, n=110, 2 dernières années) | |
| Aorus Elite 16 AE6H | |
| Asus TUF Gaming A16 FA608UP | |
| MSI Crosshair A17 HX D8WGKG | |
| WebXPRT 4 / Overall | |
| Schenker XMG Core 16 M25 | |
| Alienware 16X Aurora, RTX 5070 | |
| Aorus Elite 16 AE6H | |
| Lenovo Legion 5 Pro 16IAX10H | |
| MSI Crosshair 18 HX AI A2XW | |
| Moyenne Intel Core Ultra 9 275HX, NVIDIA GeForce RTX 5070 Laptop (297 - 330, n=5) | |
| MSI Crosshair 16 HX AI D2XWGKG | |
| Moyenne de la classe Gaming (176.4 - 345, n=108, 2 dernières années) | |
| Asus TUF Gaming A16 FA608UP | |
| MSI Crosshair A17 HX D8WGKG | |
| Mozilla Kraken 1.1 / Total | |
| Asus TUF Gaming A16 FA608UP | |
| MSI Crosshair A17 HX D8WGKG | |
| Moyenne de la classe Gaming (397 - 594, n=116, 2 dernières années) | |
| MSI Crosshair 18 HX AI A2XW | |
| Aorus Elite 16 AE6H | |
| Moyenne Intel Core Ultra 9 275HX, NVIDIA GeForce RTX 5070 Laptop (407 - 431, n=5) | |
| Schenker XMG Core 16 M25 | |
| Lenovo Legion 5 Pro 16IAX10H | |
| Alienware 16X Aurora, RTX 5070 | |
| MSI Crosshair 16 HX AI D2XWGKG | |
* ... Moindre est la valeur, meilleures sont les performances
| PCMark 10 Score | 8149 points | |
Aide | ||
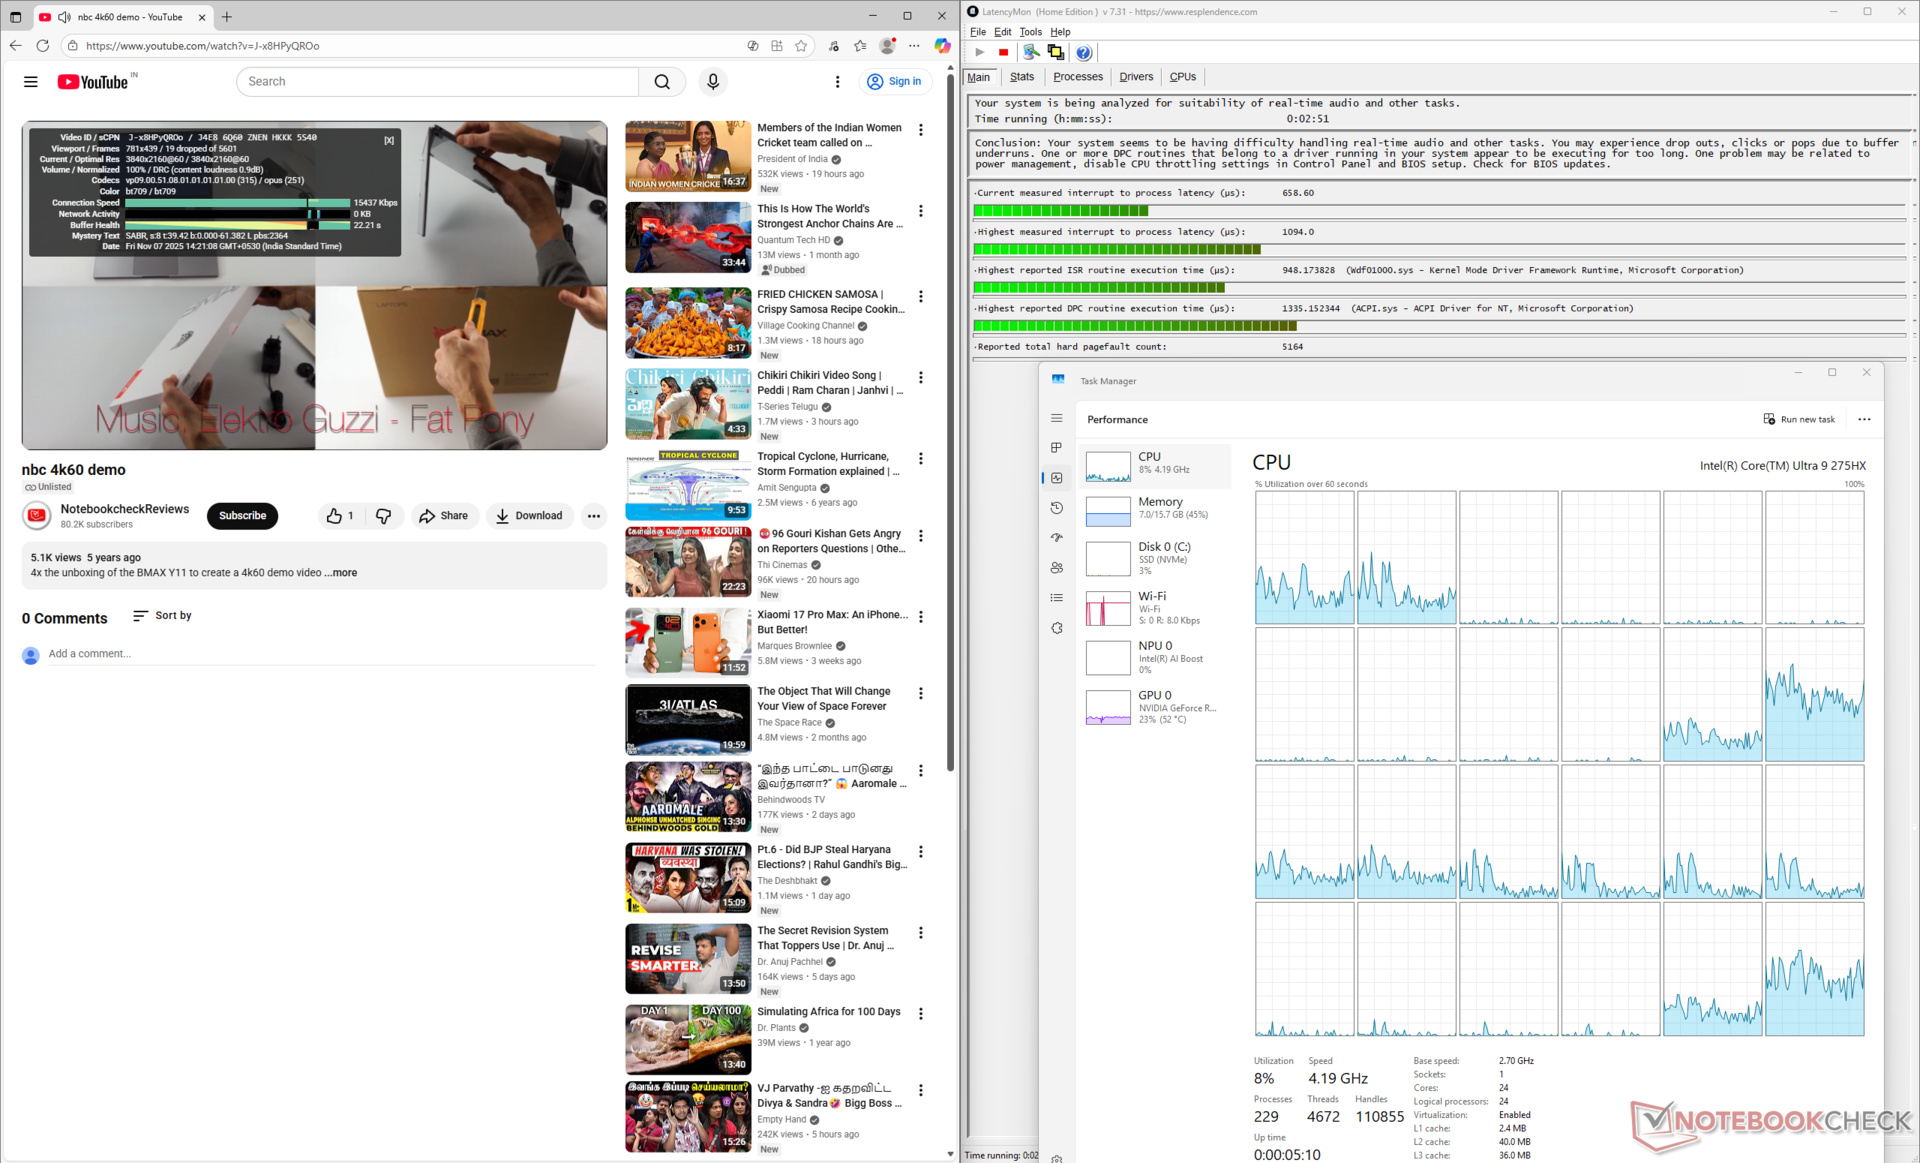
Latence DPC
Le temps de latence latence DPC mesurée mesurée est plus élevée, ce qui peut éventuellement poser des problèmes lors des flux de travail audio en temps réel.
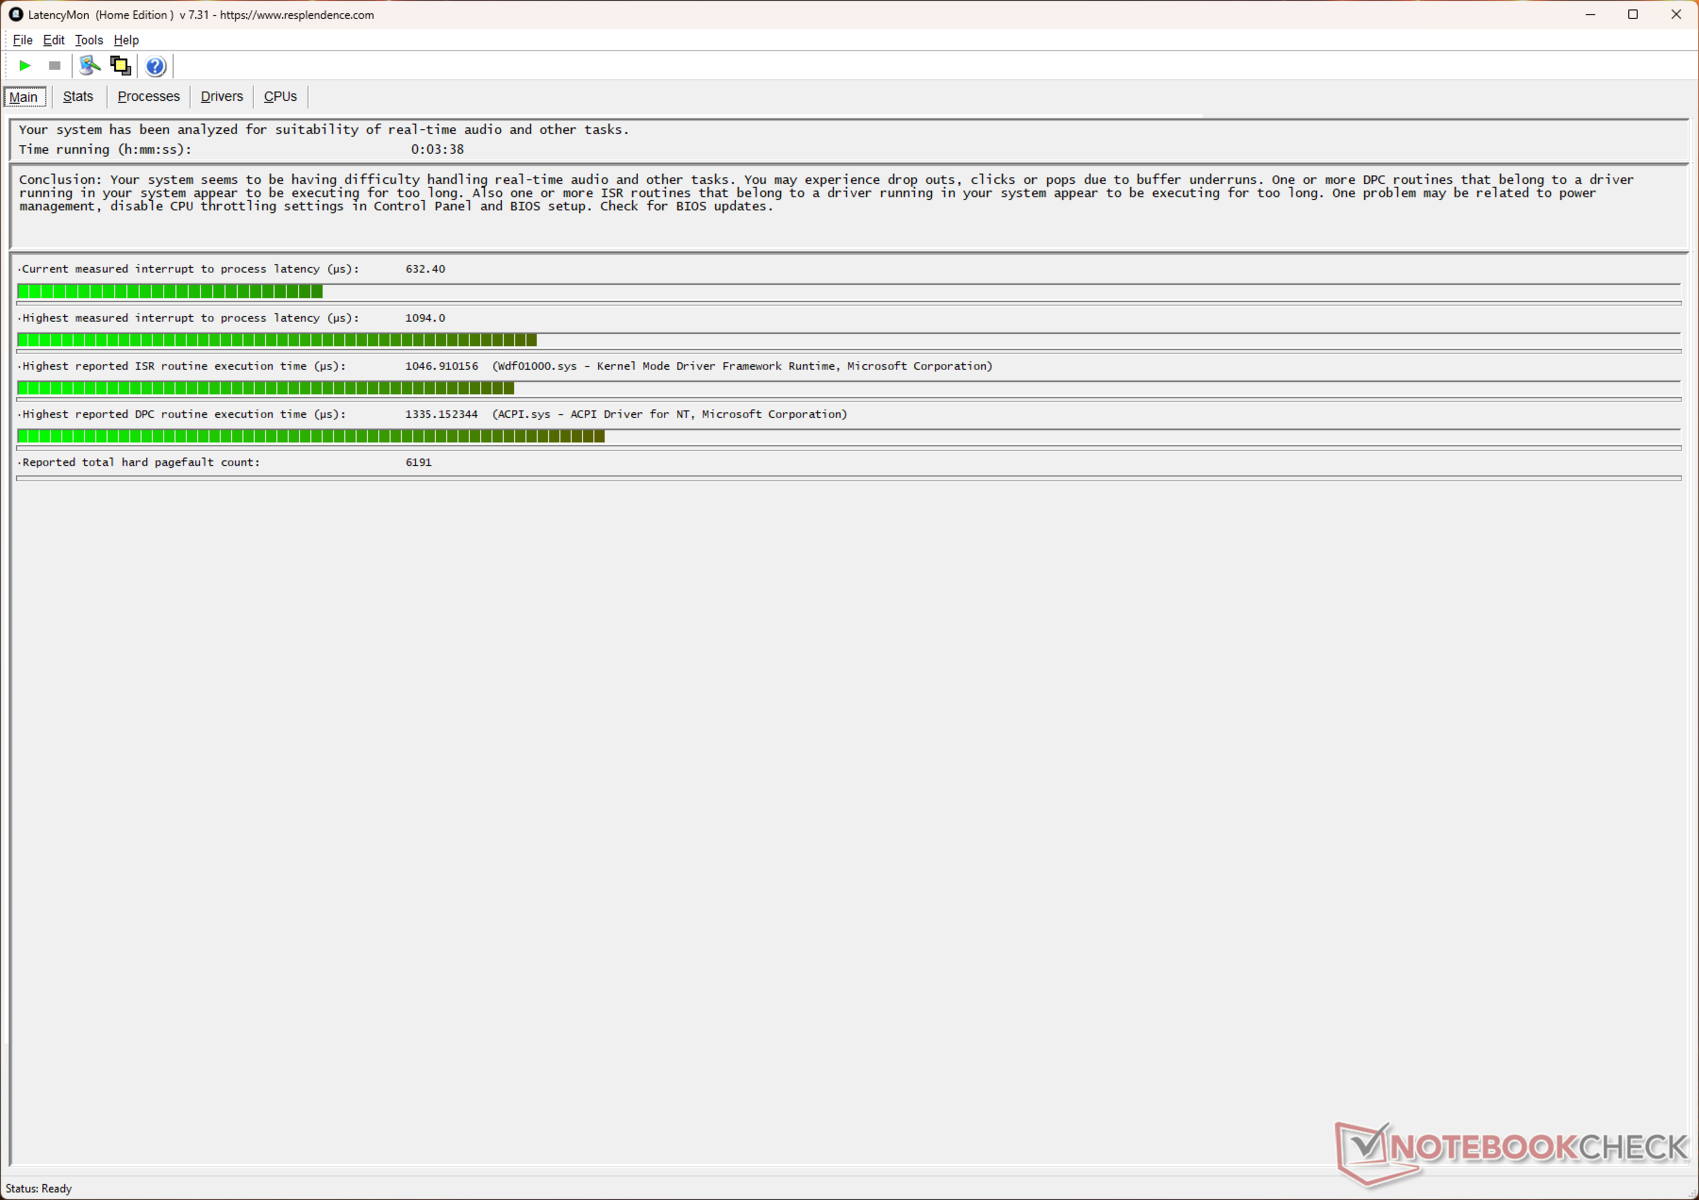

| DPC Latencies / LatencyMon - interrupt to process latency (max), Web, Youtube, Prime95 | |
| Alienware 16X Aurora, RTX 5070 | |
| Lenovo Legion 5 Pro 16IAX10H | |
| MSI Crosshair 16 HX AI D2XWGKG | |
| MSI Crosshair 18 HX AI A2XW | |
| Aorus Elite 16 AE6H | |
| MSI Crosshair A17 HX D8WGKG | |
| Schenker XMG Core 16 M25 | |
| Asus TUF Gaming A16 FA608UP | |
* ... Moindre est la valeur, meilleures sont les performances
Dispositifs de stockage
Le SSD Micron 2500 1 TB PCIe Gen 4 NVMe offre des performances décentes en lecture/écriture, mais il ne peut pas rivaliser avec des éléments comme le Samsung PM9C1 dans la Crosshair A17 HX.
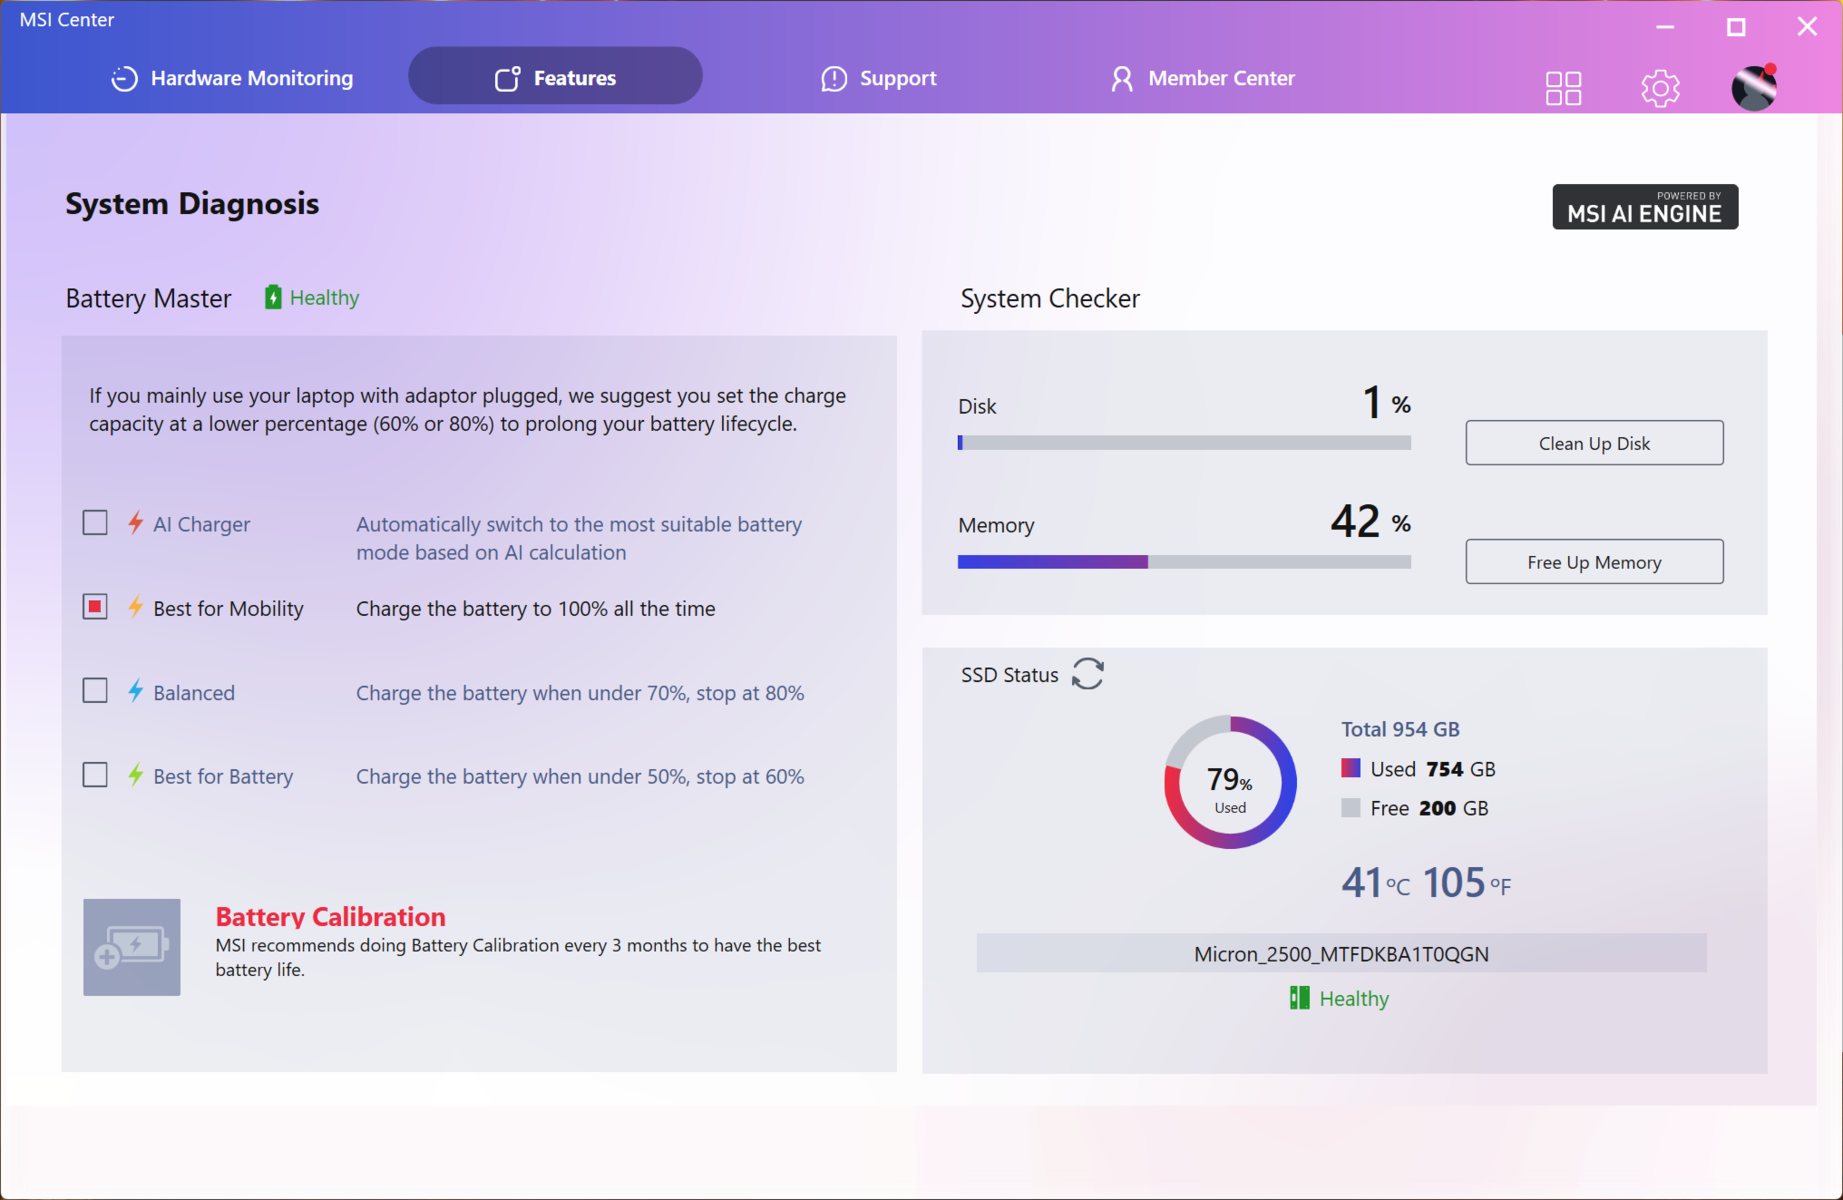
Un emplacement M.2 supplémentaire est disponible pour l'extension du stockage.

* ... Moindre est la valeur, meilleures sont les performances
Throttoir de disque : Boucle de lecture DiskSpd, profondeur de la file d'attente 8
Performance du GPU
La Crosshair 16 HX AI's 115 W GPU Nvidia GeForce RTX 5070 pour ordinateur portable se comporte comme prévu.
L'ordinateur portable est derrière le Legion Pro 5 avec un GPU pour ordinateur portable RTX 5070 Ti de 140 W RTX 5070 Ti pour ordinateur portable de 22% dans les tests 3DMark.
| 3DMark 11 Performance | 36966 points | |
| 3DMark Ice Storm Standard Score | 313398 points | |
| 3DMark Cloud Gate Standard Score | 67854 points | |
| 3DMark Fire Strike Score | 28686 points | |
| 3DMark Fire Strike Extreme Score | 16912 points | |
| 3DMark Time Spy Score | 13956 points | |
| 3DMark Steel Nomad Score | 3108 points | |
| 3DMark Steel Nomad Light Score | 14107 points | |
Aide | ||
| Blender / v3.3 Classroom OPTIX/RTX | |
| Schenker XMG Core 16 M25 | |
| MSI Crosshair 16 HX AI D2XWGKG | |
| Asus TUF Gaming A16 FA608UP | |
| Moyenne NVIDIA GeForce RTX 5070 Laptop (17 - 24, n=27) | |
| Aorus Elite 16 AE6H | |
| MSI Crosshair 18 HX AI A2XW | |
| Moyenne de la classe Gaming (9 - 32, n=123, 2 dernières années) | |
| Alienware 16X Aurora, RTX 5070 | |
| MSI Crosshair A17 HX D8WGKG | |
| Lenovo Legion 5 Pro 16IAX10H | |
| Blender / v3.3 Classroom CUDA | |
| Moyenne NVIDIA GeForce RTX 5070 Laptop (29 - 228, n=28) | |
| Schenker XMG Core 16 M25 | |
| Moyenne de la classe Gaming (15 - 228, n=123, 2 dernières années) | |
| Asus TUF Gaming A16 FA608UP | |
| Aorus Elite 16 AE6H | |
| MSI Crosshair 16 HX AI D2XWGKG | |
| MSI Crosshair A17 HX D8WGKG | |
| MSI Crosshair 18 HX AI A2XW | |
| Alienware 16X Aurora, RTX 5070 | |
| Lenovo Legion 5 Pro 16IAX10H | |
| Blender / v3.3 Classroom CPU | |
| Asus TUF Gaming A16 FA608UP | |
| Moyenne NVIDIA GeForce RTX 5070 Laptop (137 - 507, n=25) | |
| Moyenne de la classe Gaming (122 - 565, n=120, 2 dernières années) | |
| Schenker XMG Core 16 M25 | |
| Alienware 16X Aurora, RTX 5070 | |
| MSI Crosshair 18 HX AI A2XW | |
| Lenovo Legion 5 Pro 16IAX10H | |
| MSI Crosshair 16 HX AI D2XWGKG | |
* ... Moindre est la valeur, meilleures sont les performances
La Crosshair 16 HX AI peut faire tourner de manière convaincante de nombreux titres avec des paramètres QHD Ultra, mais la limitation à 8 Go de VRAM devient immédiatement évidente dans les jeux gourmands en VRAM tels que Black Myth : Wukong et F1 25.
Cyberpunk 2077 1080p Ultra fps chart
Nous n'avons pas remarqué de problèmes majeurs d'étranglement lors d'une utilisation prolongée de Cyberpunk 2077 : Phantom Liberty en 1080p Ultra.
| Bas | Moyen | Élevé | Ultra | QHD DLSS | QHD | |
|---|---|---|---|---|---|---|
| GTA V (2015) | 179.8 | 174.1 | 172.4 | 142.3 | 125.9 | |
| Dota 2 Reborn (2015) | 217 | 190.5 | 183.8 | 170 | ||
| Final Fantasy XV Benchmark (2018) | 234 | 192.6 | 141.9 | 104 | ||
| X-Plane 11.11 (2018) | 148.1 | 133.9 | 111 | |||
| Strange Brigade (2018) | 536 | 362 | 302 | 259 | 171.8 | |
| Baldur's Gate 3 (2023) | 204 | 150.7 | 135.5 | 131 | 133.9 | 90.7 |
| Cyberpunk 2077 (2023) | 174.2 | 145 | 120.1 | 107.1 | 77 | 66.3 |
| F1 24 (2024) | 305 | 316 | 251 | 87.6 | 86.7 | 53.8 |
| Black Myth: Wukong (2024) | 197 | 112 | 86 | 44 | 40 | 26 |
| F1 25 (2025) | 267 | 242 | 191 | 26.5 | 29.1 | 7.69 |
| Battlefield 6 (2025) | 154 | 138.6 | 106.6 | 79.9 | 56.1 | 43.4 |
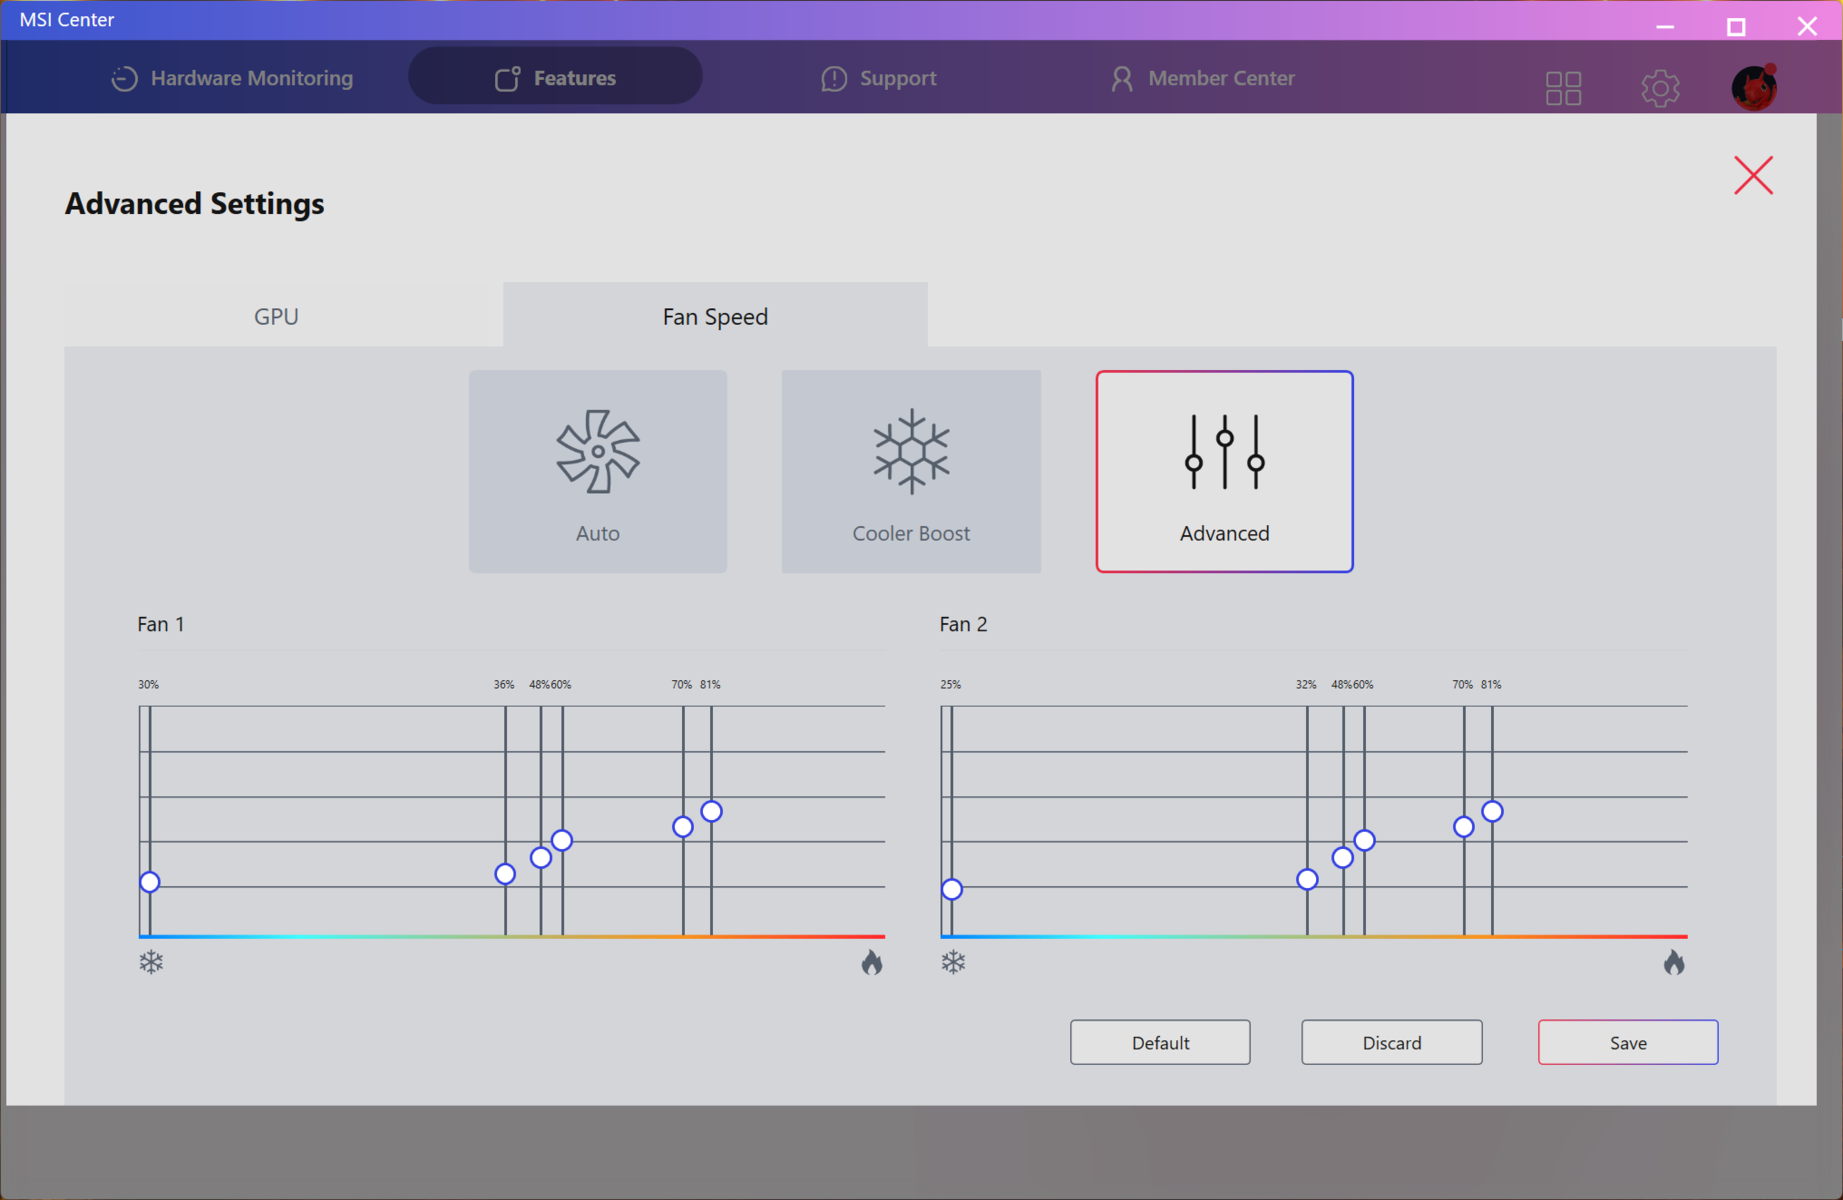
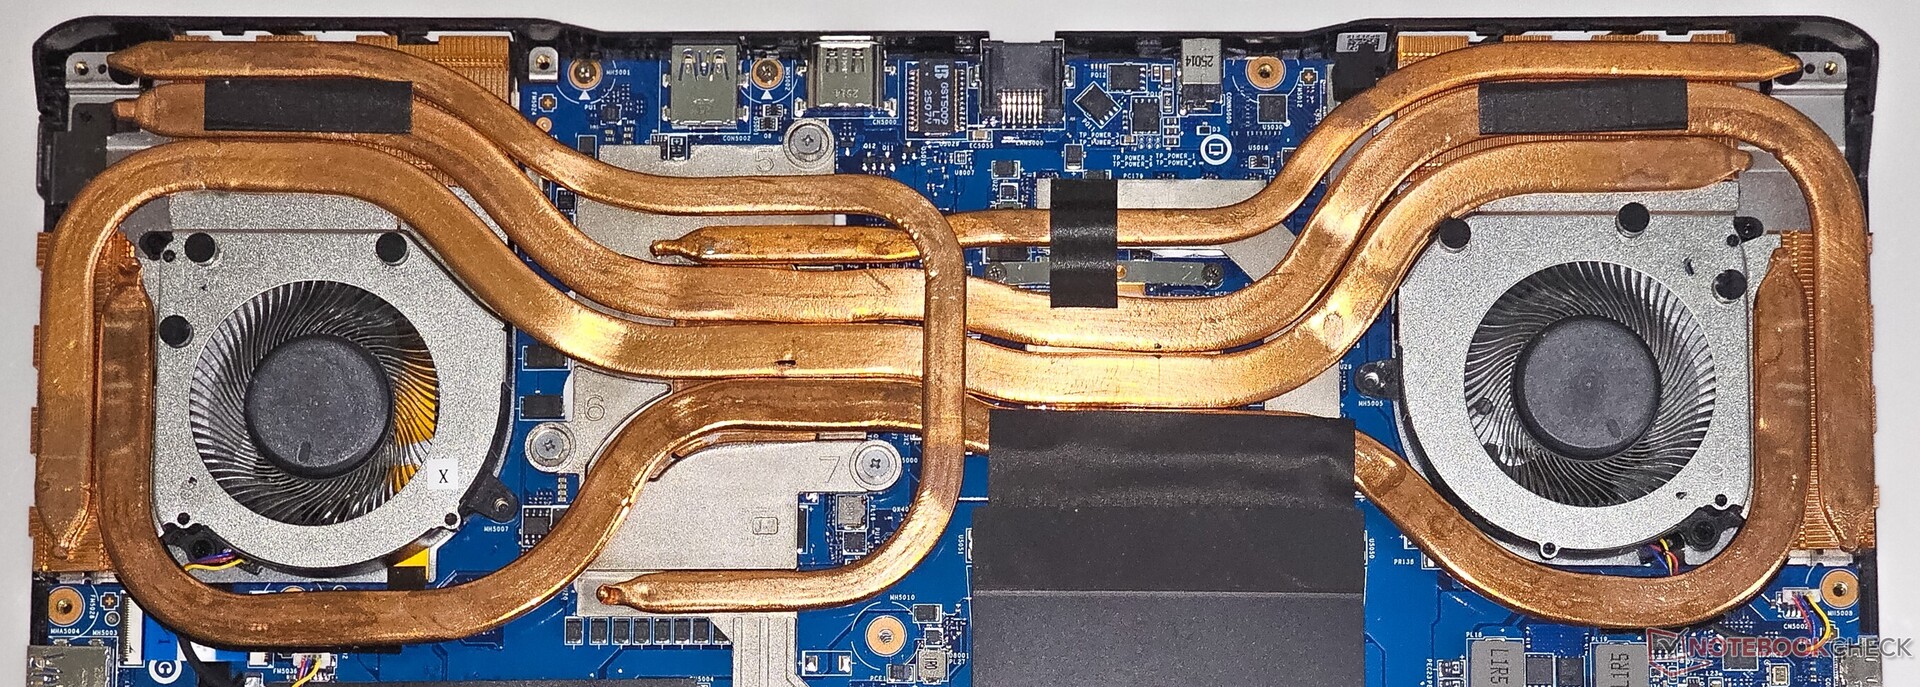
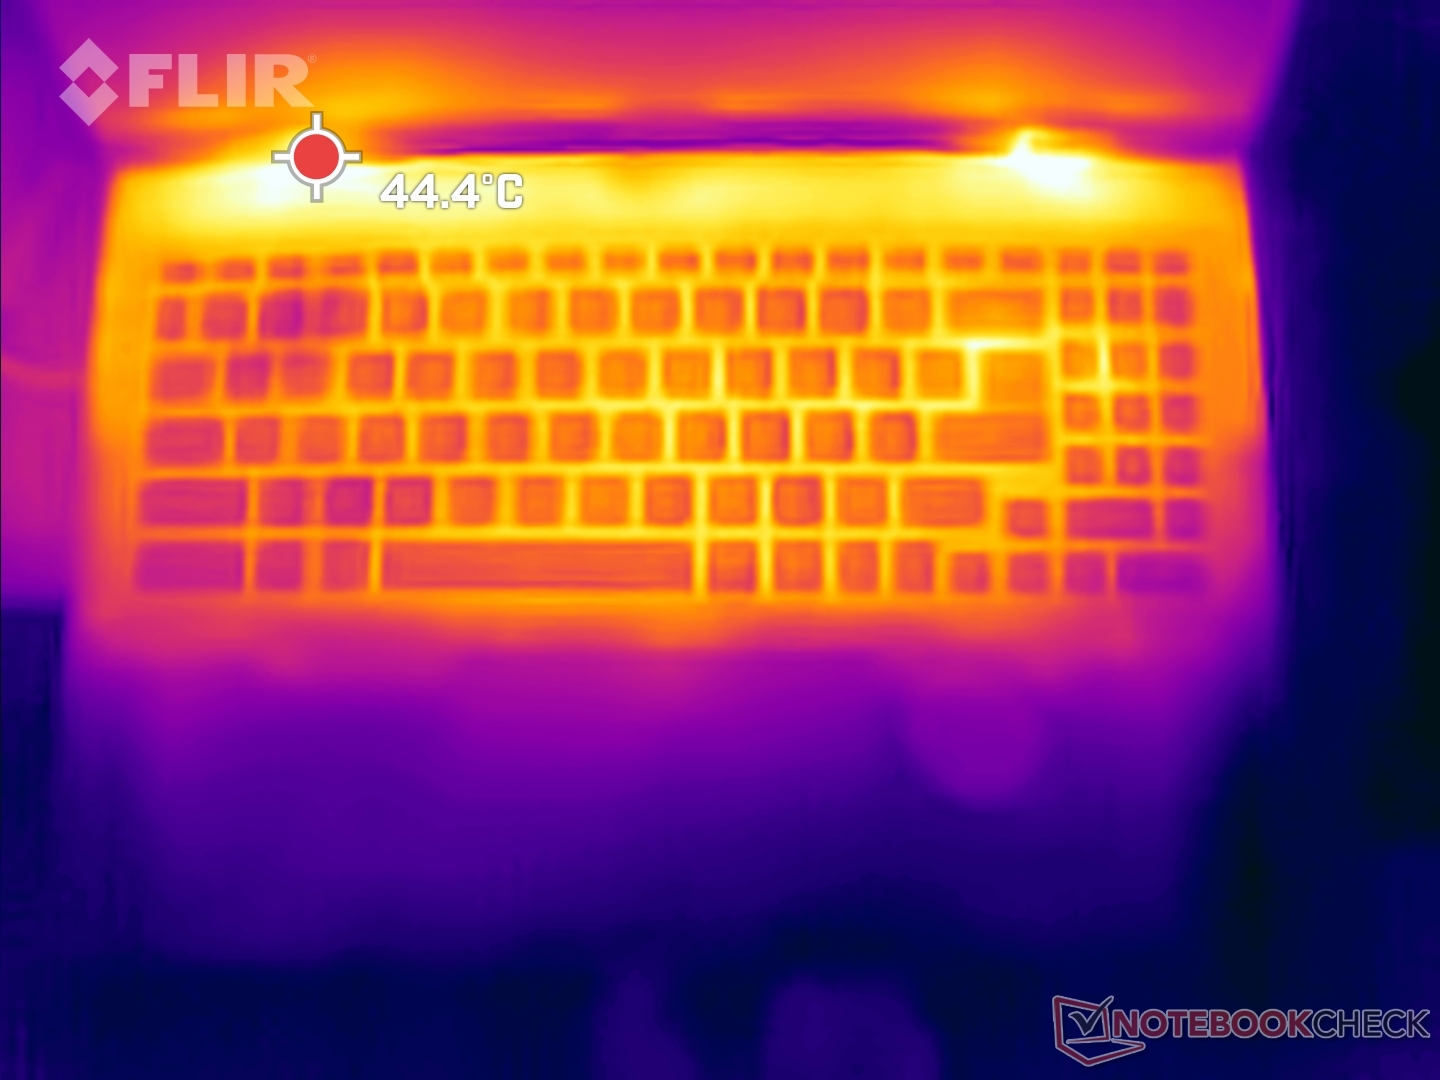
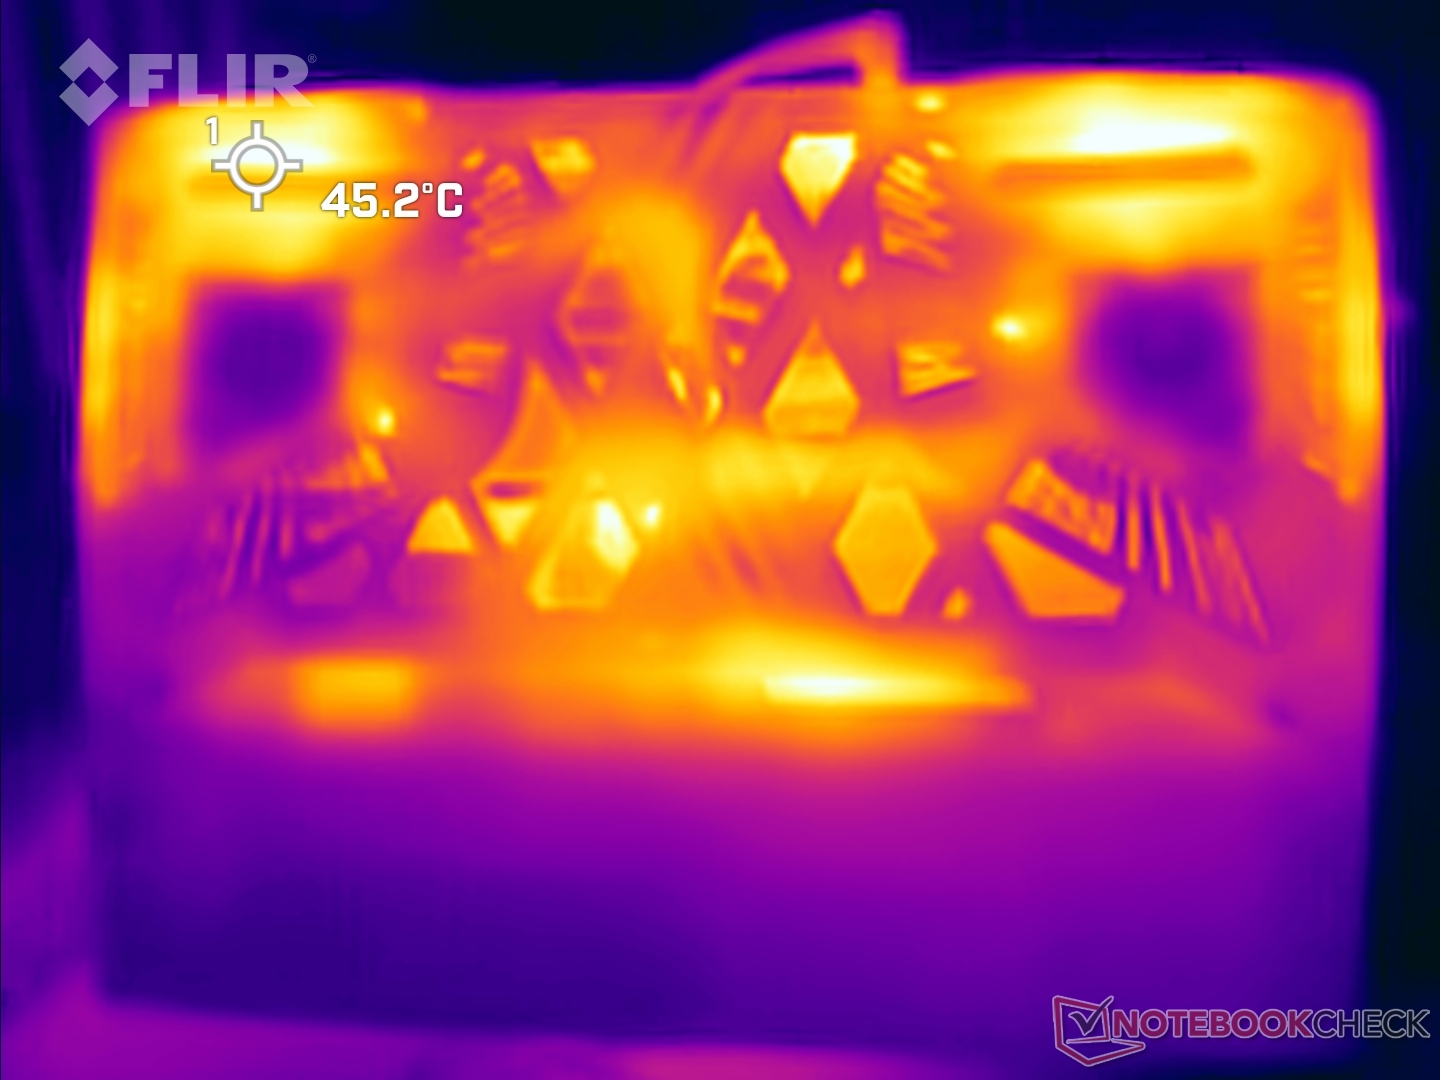
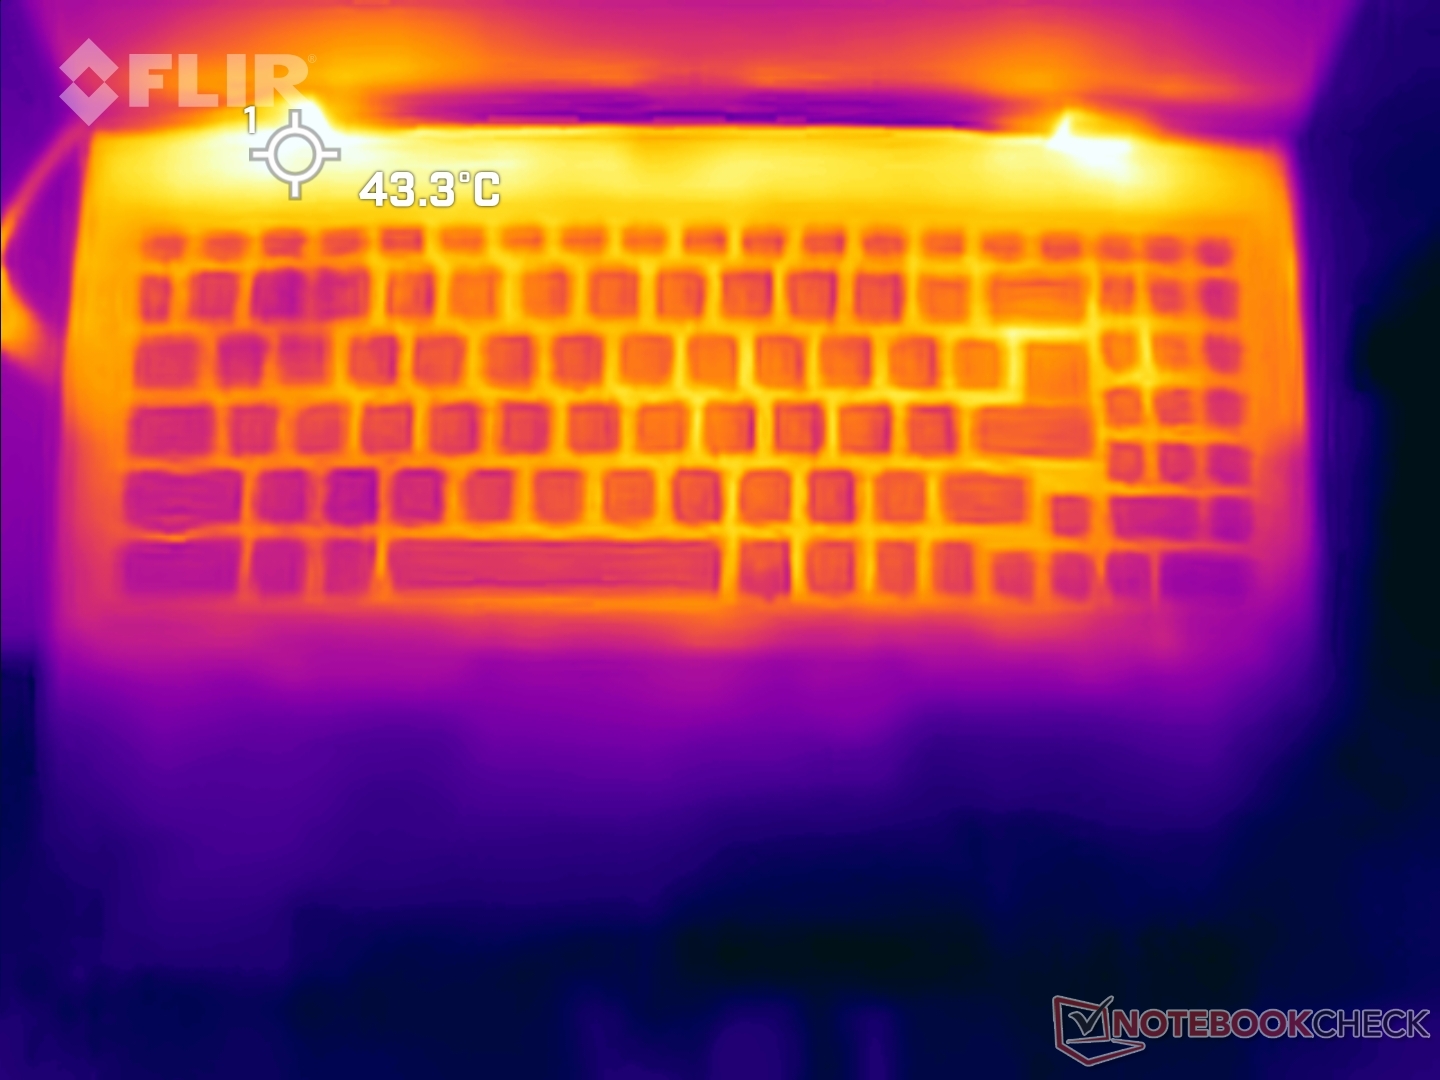
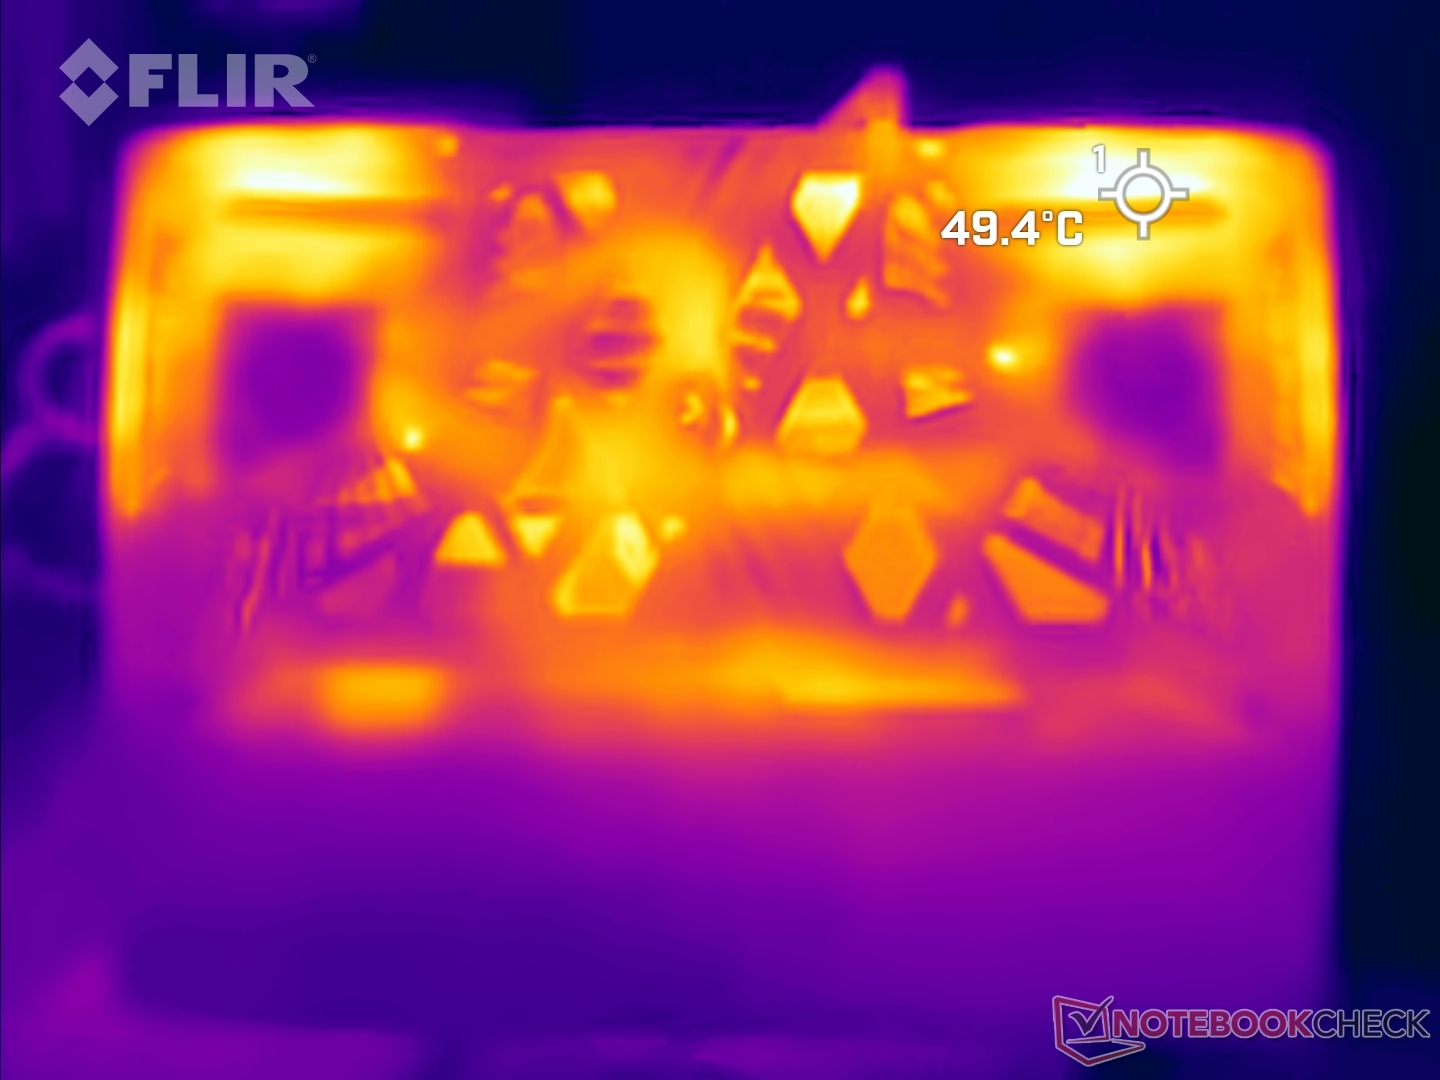
Émissions : Refroidissement robuste mais avec des niveaux de décibels et de chaleur élevés
Bruit du système
Le bruit du ventilateur en mode Extreme Performance atteint près de 58 db(A) à pleine charge.
Le profil Performance extrême comprend un mode de ventilation Cooler Boost, qui atteint 65 db(A), de sorte que l'utilisation d'un casque est fortement recommandée lorsque vous jouez dans ce mode.
Degré de la nuisance sonore
| Au repos |
| 28.3 / 28.3 / 28.3 dB(A) |
| Fortement sollicité |
| 50.26 / 57.95 dB(A) |
 | ||
30 dB silencieux 40 dB(A) audible 50 dB(A) bruyant |
||
min: | ||
| MSI Crosshair 16 HX AI D2XWGKG Ultra 9 275HX, GeForce RTX 5070 Laptop | Alienware 16X Aurora, RTX 5070 Ultra 9 275HX, GeForce RTX 5070 Laptop | Aorus Elite 16 AE6H Ultra 9 275HX, GeForce RTX 5070 Laptop | Lenovo Legion 5 Pro 16IAX10H Ultra 9 275HX, GeForce RTX 5070 Ti Laptop | Asus TUF Gaming A16 FA608UP R7 260, GeForce RTX 5070 Laptop | |
|---|---|---|---|---|---|
| Noise | 15% | -3% | 3% | -1% | |
| arrêt / environnement * (dB) | 25.56 | 23.7 7% | 24 6% | 24 6% | 25.1 2% |
| Idle Minimum * (dB) | 28.3 | 23.9 16% | 25 12% | 24 15% | 32.2 -14% |
| Idle Average * (dB) | 28.3 | 23.9 16% | 29 -2% | 24 15% | 32.2 -14% |
| Idle Maximum * (dB) | 28.3 | 26.1 8% | 32 -13% | 30.9 -9% | 32.2 -14% |
| Load Average * (dB) | 50.26 | 26.8 47% | 60 -19% | 55.9 -11% | 38.1 24% |
| Cyberpunk 2077 ultra * (dB) | 57.8 | 51.8 10% | 59 -2% | 56.72 2% | 53.9 7% |
| Load Maximum * (dB) | 57.95 | 58 -0% | 61 -5% | 56.72 2% | 57.1 1% |
* ... Moindre est la valeur, meilleures sont les performances
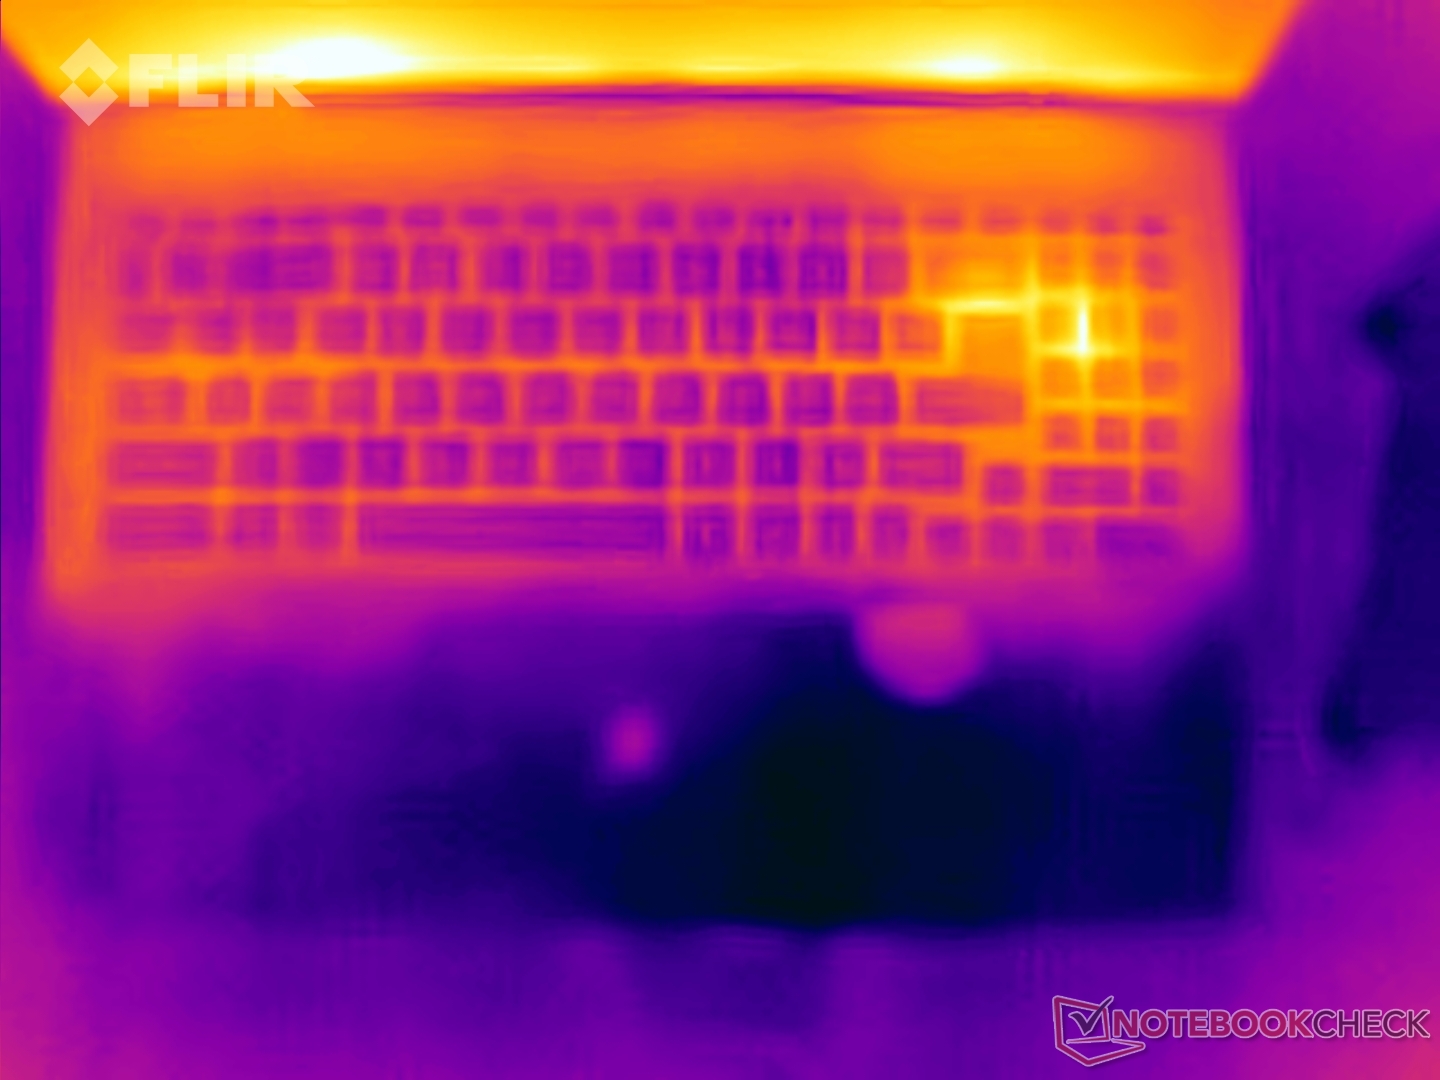
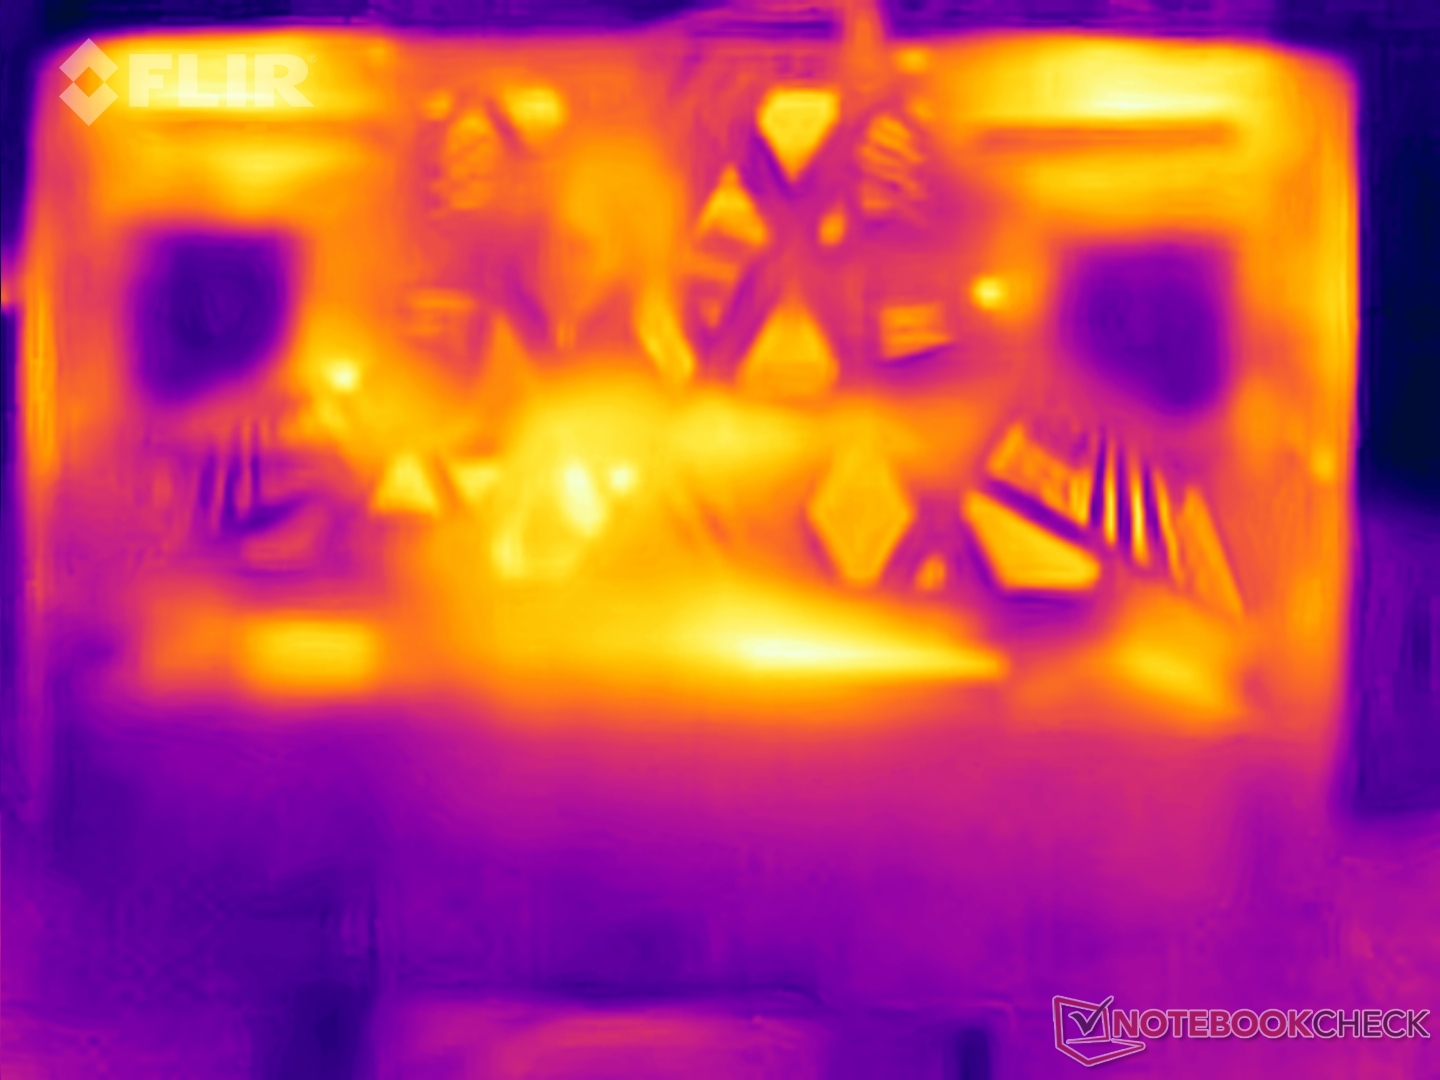
Température
Les températures de surface peuvent atteindre 45 °C sur la partie supérieure et près de 49 °C sur la partie inférieure, sous charge en mode Performance extrême.
Les zones WASD, touchpad et palm restaient relativement froides pendant les tests de stress.
Étant donné que les ventilateurs expulsent beaucoup d'air par les multiples évents, ceux qui utilisent une souris peuvent vouloir se positionner de manière appropriée pour éviter l'inconfort dû à la chaleur de l'échappement.
(±) La température maximale du côté supérieur est de 44.8 °C / 113 F, par rapport à la moyenne de 40.4 °C / 105 F, allant de 21.2 à 68.8 °C pour la classe Gaming.
(±) Le fond chauffe jusqu'à un maximum de 43.4 °C / 110 F, contre une moyenne de 43.3 °C / 110 F
(+) En utilisation inactive, la température moyenne du côté supérieur est de 28.9 °C / 84 F, par rapport à la moyenne du dispositif de 33.9 °C / 93 F.
(±) 3: The average temperature for the upper side is 36.9 °C / 98 F, compared to the average of 33.9 °C / 93 F for the class Gaming.
(+) Les repose-poignets et le pavé tactile sont plus froids que la température de la peau avec un maximum de 31 °C / 87.8 F et sont donc froids au toucher.
(-) La température moyenne de la zone de l'appui-paume de dispositifs similaires était de 28.8 °C / 83.8 F (-2.2 °C / #-4 F).
| MSI Crosshair 16 HX AI D2XWGKG Ultra 9 275HX, GeForce RTX 5070 Laptop | Alienware 16X Aurora, RTX 5070 Ultra 9 275HX, GeForce RTX 5070 Laptop | Aorus Elite 16 AE6H Ultra 9 275HX, GeForce RTX 5070 Laptop | Lenovo Legion 5 Pro 16IAX10H Ultra 9 275HX, GeForce RTX 5070 Ti Laptop | Asus TUF Gaming A16 FA608UP R7 260, GeForce RTX 5070 Laptop | |
|---|---|---|---|---|---|
| Heat | -3% | -8% | -23% | 9% | |
| Maximum Upper Side * (°C) | 44.8 | 51 -14% | 41 8% | 48 -7% | 39.5 12% |
| Maximum Bottom * (°C) | 43.4 | 45.6 -5% | 45 -4% | 50 -15% | 45.1 -4% |
| Idle Upper Side * (°C) | 31.2 | 29.8 4% | 35 -12% | 38 -22% | 25.7 18% |
| Idle Bottom * (°C) | 28.8 | 27.4 5% | 36 -25% | 42 -46% | 25.5 11% |
* ... Moindre est la valeur, meilleures sont les performances
Intervenants
Les haut-parleurs stéréo de la Crosshair 16 HX AI ont des niveaux sonores décents mais manquent d'une bonne réponse dans les basses.
MSI Crosshair 16 HX AI D2XWGKG analyse audio
(±) | le niveau sonore du haut-parleur est moyen mais bon (81.5# dB)
Basses 100 - 315 Hz
(-) | presque aucune basse - en moyenne 15.6% plus bas que la médiane
(±) | la linéarité des basses est moyenne (10.5% delta à la fréquence précédente)
Médiums 400 - 2000 Hz
(±) | médiane supérieure - en moyenne 6.6% supérieure à la médiane
(±) | la linéarité des médiums est moyenne (7.1% delta à la fréquence précédente)
Aiguës 2 - 16 kHz
(+) | des sommets équilibrés - à seulement 1.6% de la médiane
(+) | les aigus sont linéaires (5.8% delta à la fréquence précédente)
Globalement 100 - 16 000 Hz
(+) | le son global est linéaire (14.7% différence à la médiane)
Par rapport à la même classe
» 28% de tous les appareils testés de cette catégorie étaient meilleurs, 7% similaires, 65% pires
» Le meilleur avait un delta de 6%, la moyenne était de 18%, le pire était de 132%.
Par rapport à tous les appareils testés
» 19% de tous les appareils testés étaient meilleurs, 4% similaires, 77% pires
» Le meilleur avait un delta de 4%, la moyenne était de 24%, le pire était de 134%.
Apple MacBook Pro 16 2021 M1 Pro analyse audio
(+) | les haut-parleurs peuvent jouer relativement fort (84.7# dB)
Basses 100 - 315 Hz
(+) | bonne basse - seulement 3.8% loin de la médiane
(+) | les basses sont linéaires (5.2% delta à la fréquence précédente)
Médiums 400 - 2000 Hz
(+) | médiane équilibrée - seulement 1.3% de la médiane
(+) | les médiums sont linéaires (2.1% delta à la fréquence précédente)
Aiguës 2 - 16 kHz
(+) | des sommets équilibrés - à seulement 1.9% de la médiane
(+) | les aigus sont linéaires (2.7% delta à la fréquence précédente)
Globalement 100 - 16 000 Hz
(+) | le son global est linéaire (4.6% différence à la médiane)
Par rapport à la même classe
» 0% de tous les appareils testés de cette catégorie étaient meilleurs, 0% similaires, 100% pires
» Le meilleur avait un delta de 5%, la moyenne était de 17%, le pire était de 45%.
Par rapport à tous les appareils testés
» 0% de tous les appareils testés étaient meilleurs, 0% similaires, 100% pires
» Le meilleur avait un delta de 4%, la moyenne était de 24%, le pire était de 134%.
Consommation électrique : Pas la plus économe de la comparaison
La Crosshair 16 HX AI n'est pas très économe en termes de consommation d'énergie en mode Extreme Performance. La consommation d'énergie est un peu plus élevée même en mode éteint et en mode veille.
| Éteint/en veille | |
| Au repos | |
| Fortement sollicité |
|
Légende:
min: | |
| MSI Crosshair 16 HX AI D2XWGKG Ultra 9 275HX, GeForce RTX 5070 Laptop, IPS, 2560x1600, 16" | Alienware 16X Aurora, RTX 5070 Ultra 9 275HX, GeForce RTX 5070 Laptop, IPS, 2560x1600, 16" | Aorus Elite 16 AE6H Ultra 9 275HX, GeForce RTX 5070 Laptop, IPS, 2560x1600, 16" | Lenovo Legion 5 Pro 16IAX10H Ultra 9 275HX, GeForce RTX 5070 Ti Laptop, OLED, 2560x1600, 16" | Asus TUF Gaming A16 FA608UP R7 260, GeForce RTX 5070 Laptop, IPS, 2560x1600, 16" | Moyenne NVIDIA GeForce RTX 5070 Laptop | Moyenne de la classe Gaming | |
|---|---|---|---|---|---|---|---|
| Power Consumption | 11% | 26% | 9% | 43% | 40% | 29% | |
| Idle Minimum * (Watt) | 26.2 | 20.1 23% | 8.5 68% | 14 47% | 4.6 82% | 10.7 ? 59% | 13.4 ? 49% |
| Idle Average * (Watt) | 33.8 | 27.6 18% | 13.6 60% | 14.3 58% | 9.8 71% | 15.3 ? 55% | 19.1 ? 43% |
| Idle Maximum * (Watt) | 34 | 31.8 6% | 22 35% | 20.1 41% | 10.2 70% | 20.2 ? 41% | 24.5 ? 28% |
| Load Average * (Watt) | 112 | 102.7 8% | 113 -1% | 177 -58% | 76.1 32% | 97.5 ? 13% | 108.3 ? 3% |
| Cyberpunk 2077 ultra external monitor * (Watt) | 220 | 192.3 13% | 219 -0% | 255 -16% | 198.1 10% | ||
| Cyberpunk 2077 ultra * (Watt) | 224 | 217 3% | 223 -0% | 255 -14% | 198.9 11% | ||
| Load Maximum * (Watt) | 315 | 292 7% | 257 18% | 294 7% | 235.2 25% | 216 ? 31% | 253 ? 20% |
* ... Moindre est la valeur, meilleures sont les performances
Consommation d'énergie : Cyberpunk 2077 / Test de stress
Consommation électrique : Moniteur externe
Durée de vie de la batterie
Une autonomie de 12 heures ou plus est possible en mode ECO-Silent avec MSHybrid et la fréquence de rafraîchissement réglée sur 60 Hz.
| MSI Crosshair 16 HX AI D2XWGKG Ultra 9 275HX, GeForce RTX 5070 Laptop, 90 Wh | Alienware 16X Aurora, RTX 5070 Ultra 9 275HX, GeForce RTX 5070 Laptop, 96 Wh | Aorus Elite 16 AE6H Ultra 9 275HX, GeForce RTX 5070 Laptop, 99 Wh | Lenovo Legion 5 Pro 16IAX10H Ultra 9 275HX, GeForce RTX 5070 Ti Laptop, 80 Wh | Asus TUF Gaming A16 FA608UP R7 260, GeForce RTX 5070 Laptop, 90 Wh | Moyenne de la classe Gaming | |
|---|---|---|---|---|---|---|
| Autonomie de la batterie | ||||||
| WiFi v1.3 (h) | 11.1 | 4.3 -61% | 8.5 -23% | 4.9 -56% | 13 17% | 6.82 ? -39% |
Impressions générales de Notebookcheck sur la MSI Crosshair 16 HX AI
Le MSI Crosshair 16 HX AI se présente comme un ordinateur portable de jeu de milieu de gamme supérieur. Les mesures de réduction des coûts sont visibles, mais aucune n'affecte l'expérience de jeu.
MSI Crosshair 16 HX AI D2XWGKG
- 11/11/2025 v8
Vaidyanathan Subramaniam
 Total Sustainability Score:
 Comparaison des concurrents potentiels
Image | Modèle | Prix | Poids | Épaisseur | Écran |
|---|---|---|---|---|---|
1. 81.9%  | MSI Crosshair 16 HX AI D2XWGKG Intel Core Ultra 9 275HX ⎘ NVIDIA GeForce RTX 5070 Laptop ⎘ 16 Go Mémoire, 1024 Go SSD | Amazon: Prix de liste: 2500 EUR | 2.5 kg | 27.9 mm | 16.00" 2560x1600 189 PPI IPS |
2. 84.9%  | Alienware 16X Aurora, RTX 5070 Intel Core Ultra 9 275HX ⎘ NVIDIA GeForce RTX 5070 Laptop ⎘ 32 Go Mémoire | Amazon: Prix de liste: 1800 USD | 2.5 kg | 23.4 mm | 16.00" 2560x1600 189 PPI IPS |
3. 84.4%  | Aorus Elite 16 AE6H Intel Core Ultra 9 275HX ⎘ NVIDIA GeForce RTX 5070 Laptop ⎘ 32 Go Mémoire, 1024 Go SSD | Prix de liste: 2300 EUR | 2.4 kg | 26 mm | 16.00" 2560x1600 189 PPI IPS |
4. 84.5% 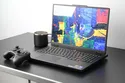 | Lenovo Legion 5 Pro 16IAX10H Intel Core Ultra 9 275HX ⎘ NVIDIA GeForce RTX 5070 Ti Laptop ⎘ 32 Go Mémoire, 1024 Go SSD | Amazon: 1. $2,333.00 Lenovo Legion Pro 7 16IAX10H... 2. $1,699.99 Lenovo Legion 5 Pro 5i Gen 1... 3. $5.99 Keyboard Cover for Lenovo Le... Prix de liste: 2500 Euro | 2.4 kg | 25.95 mm | 16.00" 2560x1600 189 PPI OLED |
5. 83.8%  | Asus TUF Gaming A16 FA608UP AMD Ryzen 7 260 ⎘ NVIDIA GeForce RTX 5070 Laptop ⎘ 32 Go Mémoire, 1024 Go SSD | Amazon: Prix de liste: 2199€ | 2.2 kg | 25.7 mm | 16.00" 2560x1600 189 PPI IPS |
Transparency
La sélection des appareils à examiner est effectuée par notre équipe éditoriale. L'échantillon de test a été prêté à l'auteur par le fabricant ou le détaillant pour les besoins de cet examen. Le prêteur n'a pas eu d'influence sur cette évaluation et le fabricant n'a pas reçu de copie de cette évaluation avant sa publication. Il n'y avait aucune obligation de publier cet article. En tant que média indépendant, Notebookcheck n'est pas soumis à l'autorité des fabricants, des détaillants ou des éditeurs.
Voici comment Notebookcheck teste
Chaque année, Notebookcheck examine de manière indépendante des centaines d'ordinateurs portables et de smartphones en utilisant des procédures standardisées afin de garantir que tous les résultats sont comparables. Nous avons continuellement développé nos méthodes de test depuis environ 20 ans et avons établi des normes industrielles dans le processus. Dans nos laboratoires de test, des équipements de mesure de haute qualité sont utilisés par des techniciens et des rédacteurs expérimentés. Ces tests impliquent un processus de validation en plusieurs étapes. Notre système d'évaluation complexe repose sur des centaines de mesures et de points de référence bien fondés, ce qui garantit l'objectivité.
