Verdict
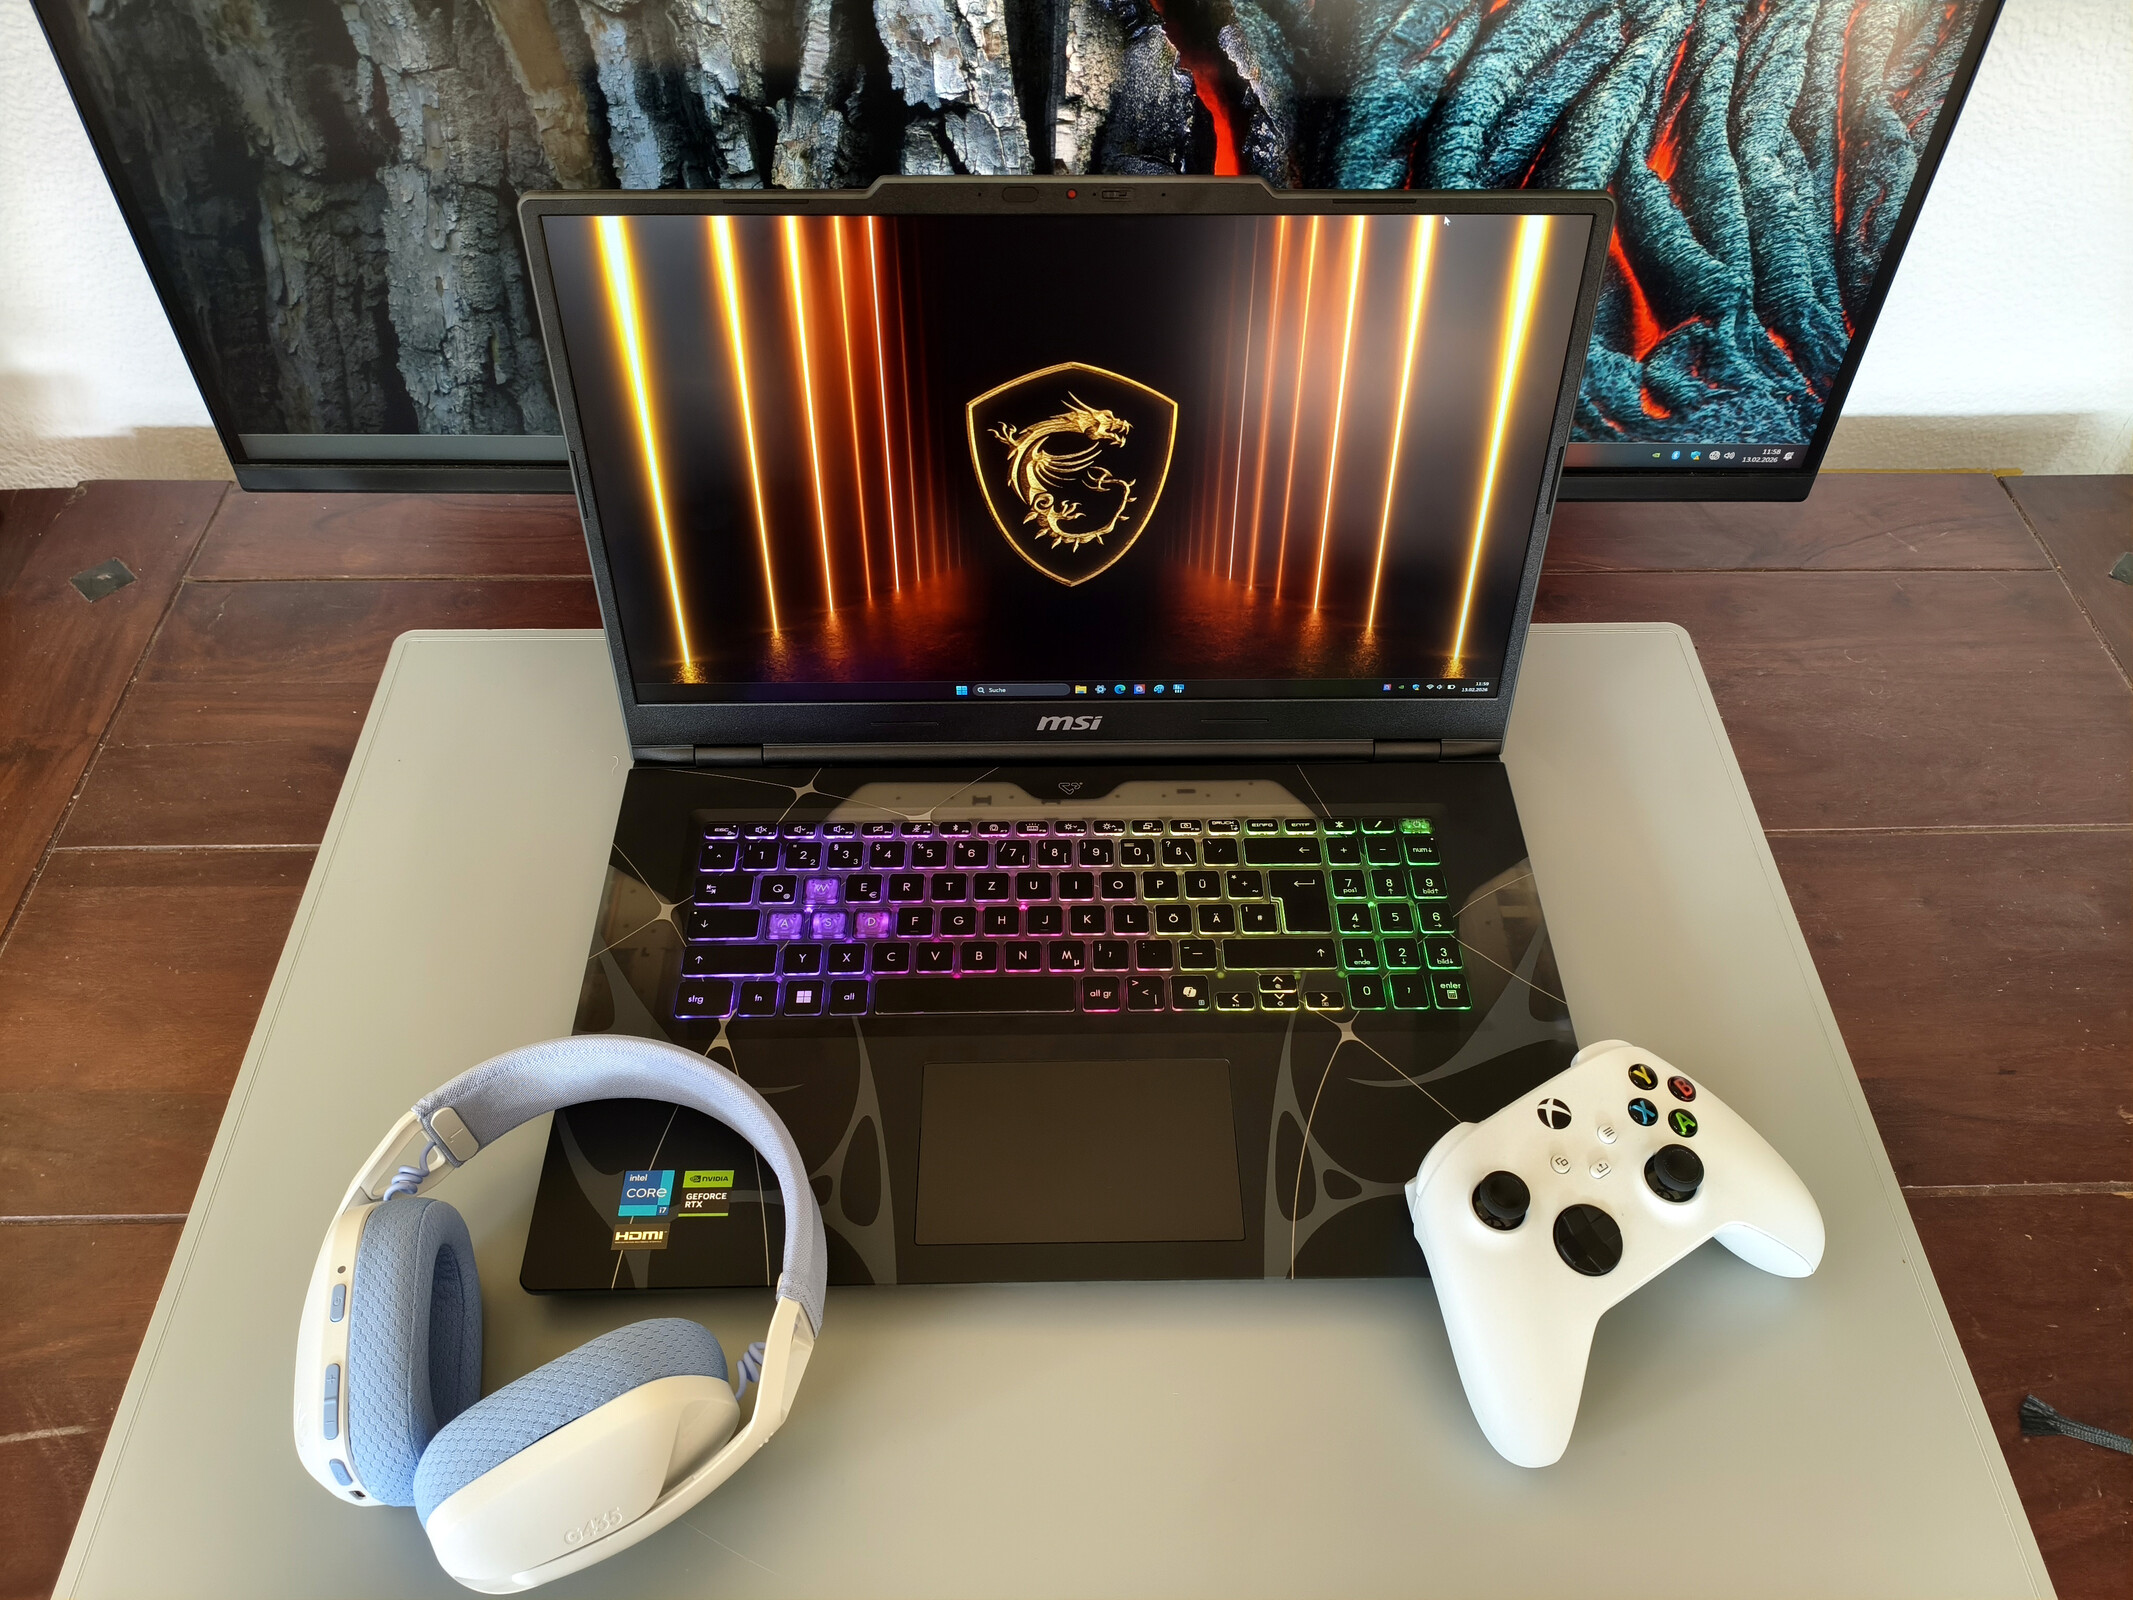
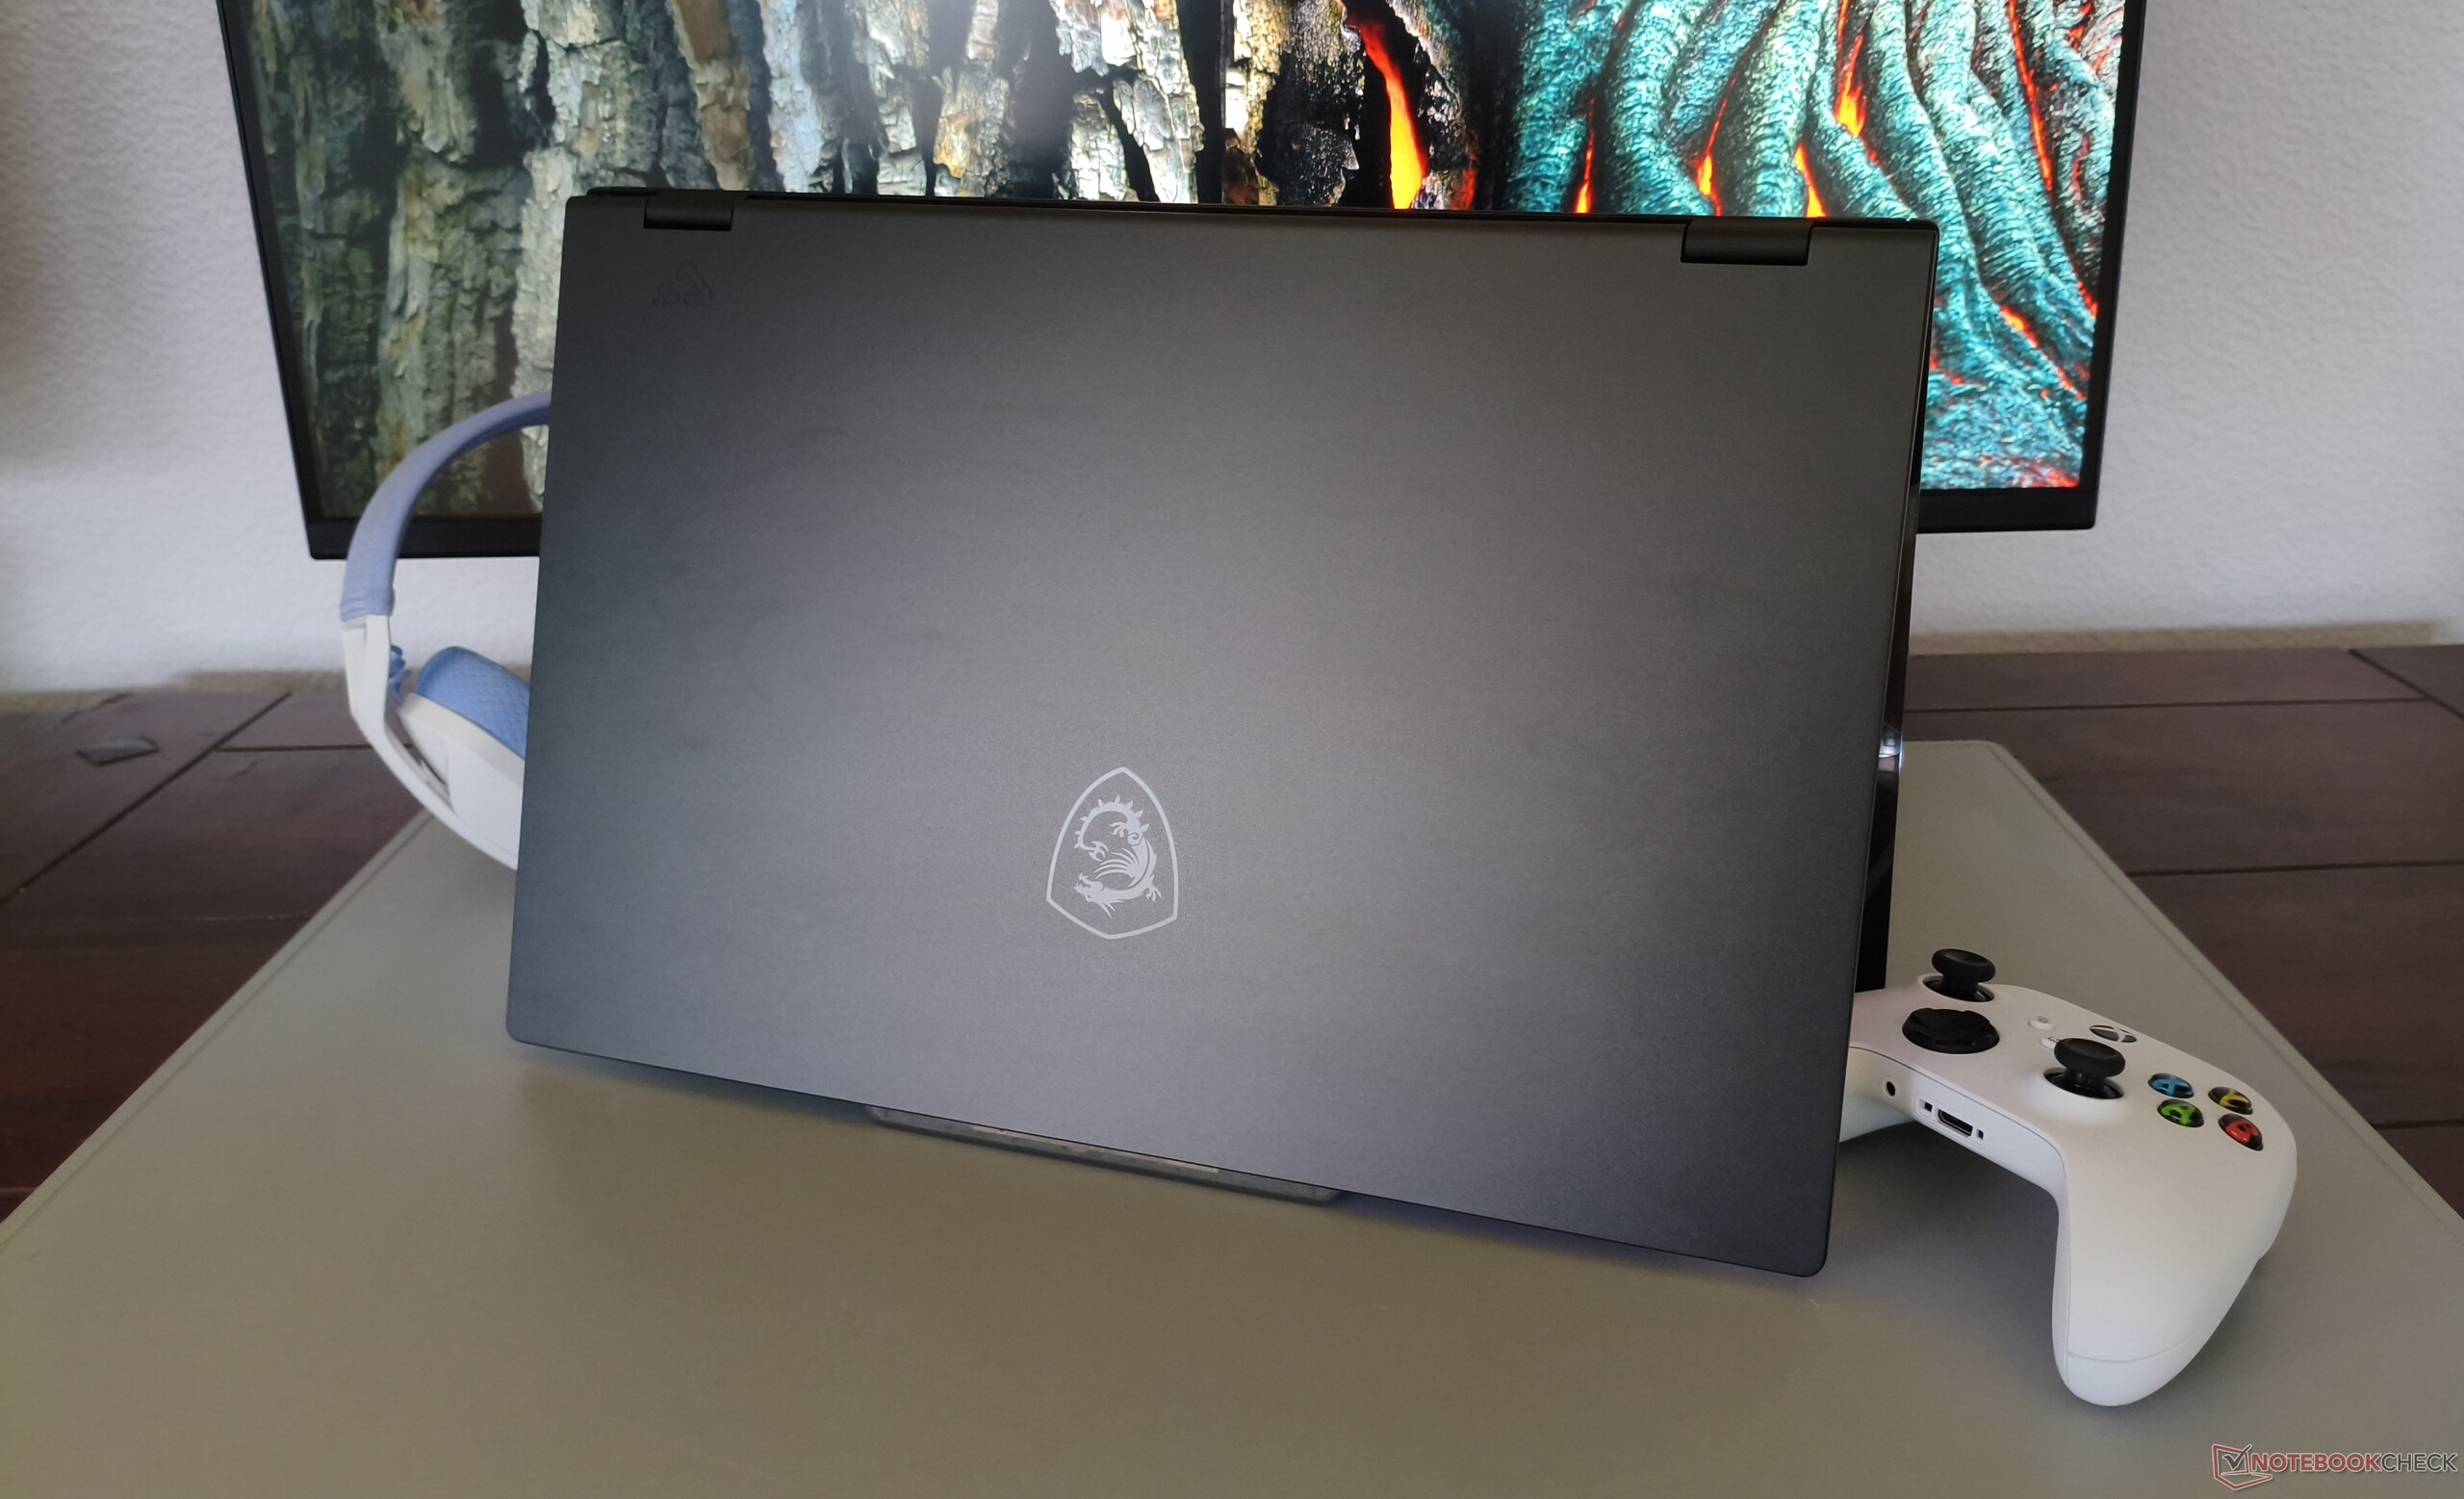
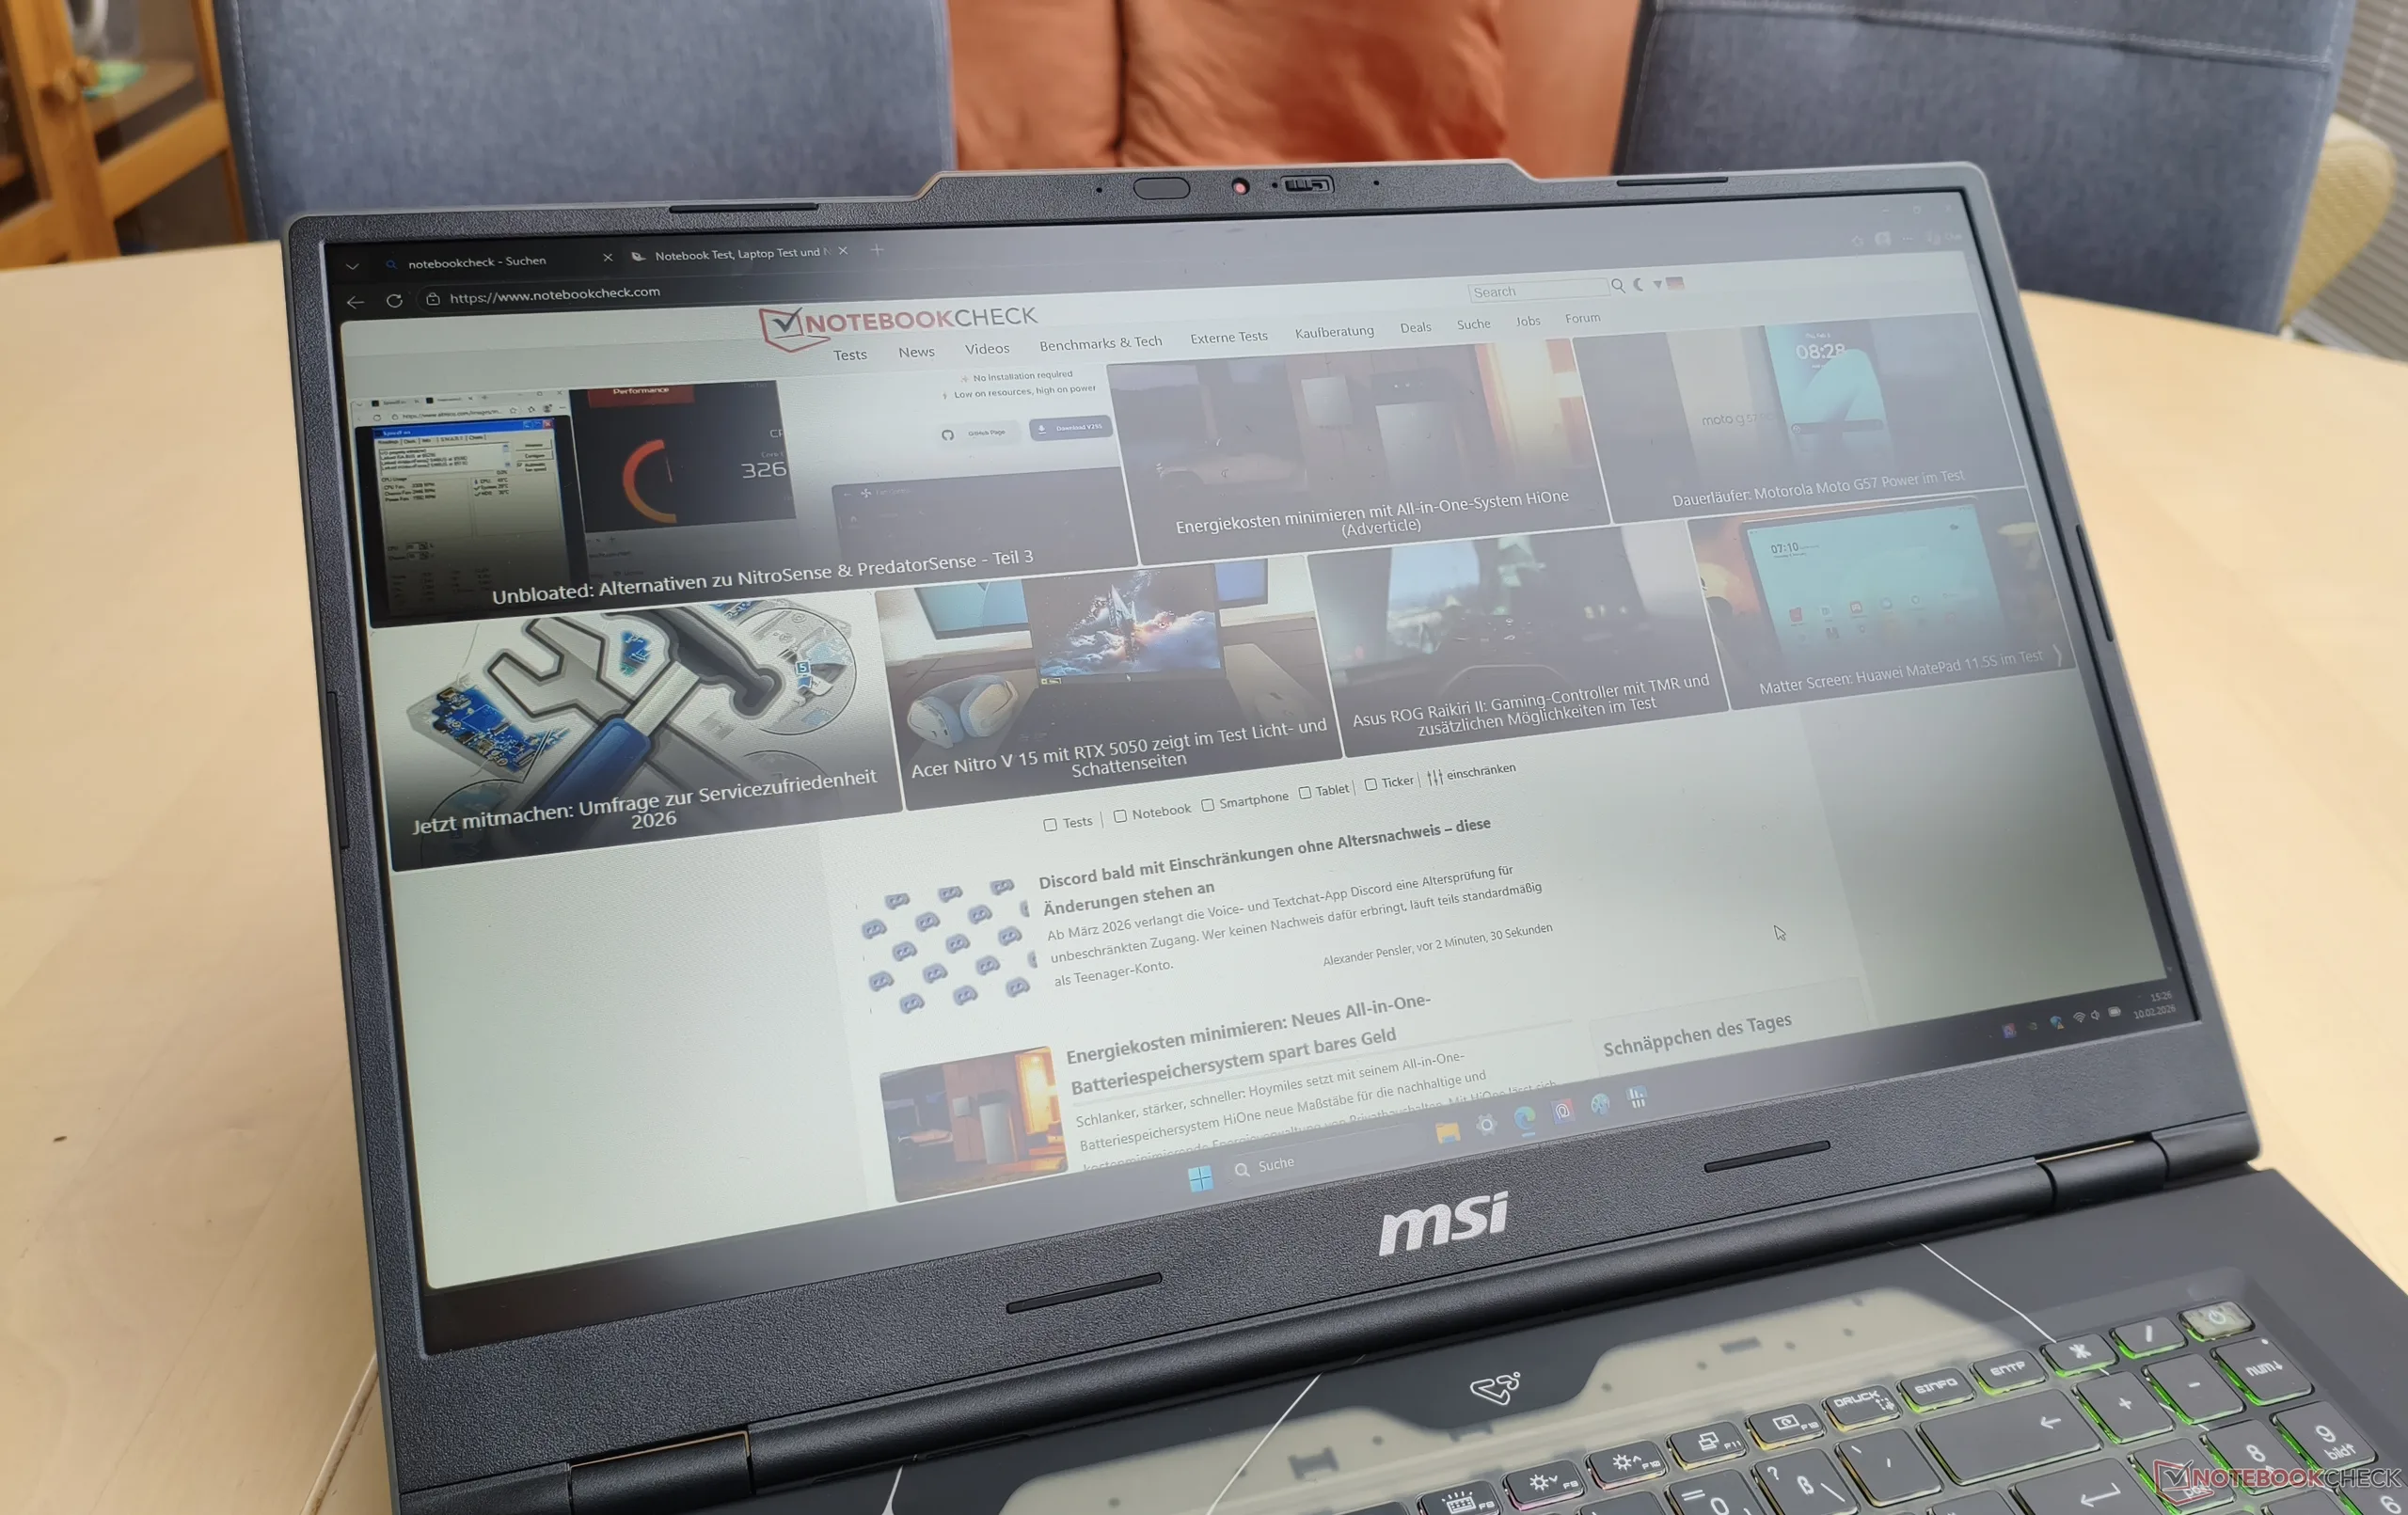
Le Cyborg 17 impressionne au premier coup d'œil. Le couvercle texturé avec ses éléments translucides est attrayant et distinctif, et un couvercle en métal est loin d'être garanti dans la gamme de prix inférieure à 1 500 euros. En revanche, les performances laissent une impression mitigée. Alors que cette configuration de test fait partie des ordinateurs portables RTX 5060 les plus abordables, le faible TGP de 55 watts fait que le système de 17 pouces est souvent derrière la concurrence, et dans certains cas, même derrière les ordinateurs portables équipés de la RTX 5050.
L'écran révèle d'autres compromis. La dalle Full HD n'est pas particulièrement lumineuse et n'offre qu'une couverture limitée des couleurs. La connectivité (pas de lecteur de carte) et la capacité de la batterie (seulement 55 Wh) peuvent également être améliorées. En revanche, les périphériques d'entrée sont raisonnablement bons, à l'exception de la disposition peu conventionnelle du clavier. La possibilité de mettre à niveau la mémoire et le stockage apporte des points supplémentaires, bien que le fait de n'avoir qu'un seul emplacement M.2 soit un peu modeste pour un appareil de 17 pouces.
Les modèles concurrents dans le segment des RTX 5000 à moins de 1 500 € sont les suivants Acer Nitro V 16 AIl'Alienware Alienware 16 Auroral'Alienware 16 Aurora HP Omen 16 et le Gigabyte Gaming A16. L'une des implémentations les plus fortes de la RTX 5060, le modèle le plus cher Lenovo Legion 7 16sert également de point de référence dans nos tableaux comparatifs.
Points positifs
Points négatifs
Prix et disponibilité
Le MSI Cyborg 17 B13WFKG testé, équipé d'un Core i7-13620H et d'un GPU pour ordinateur portable GeForce RTX 5050, est disponible auprès de divers revendeurs en ligne (par exemple, Galaxus) à partir d'environ 1 200 €, bien que les prix et la disponibilité puissent varier en fonction de la région et de la configuration.
- msi Cyborg 17 Gaming Laptop, Intel 7-240H, 16 GB DDR5 RAM, 1 TB PCIe SSD, 17.3" FHD (1920x1080) 144Hz Display, Nvidia G-Force RTX 5060, 4-Zone RGB Keyboard, W11 Home, Translucent Black
- MSI Cyborg 17 B2RWFKG-055CA 17.3" FHD 144Hz Gaming Laptop, Intel® Core™ 7-240H, RTX 5060, 16GB DDR5 Memory, 1TB NVMe SSD, Windows 11 Home
- msi Cyborg 17 B2RWFKG Gaming Laptop 2025 17.3” FHD 1920x1080 Display IPS 144 hz Intel Core 7 240H NVIDIA GeForce RTX 5060 8GB GDDR7 16GB DDR5 1TB SSD Four-Zone RGB Backlit KB Wi-Fi 6E Windows 11 Pro
Spécifications
Cas
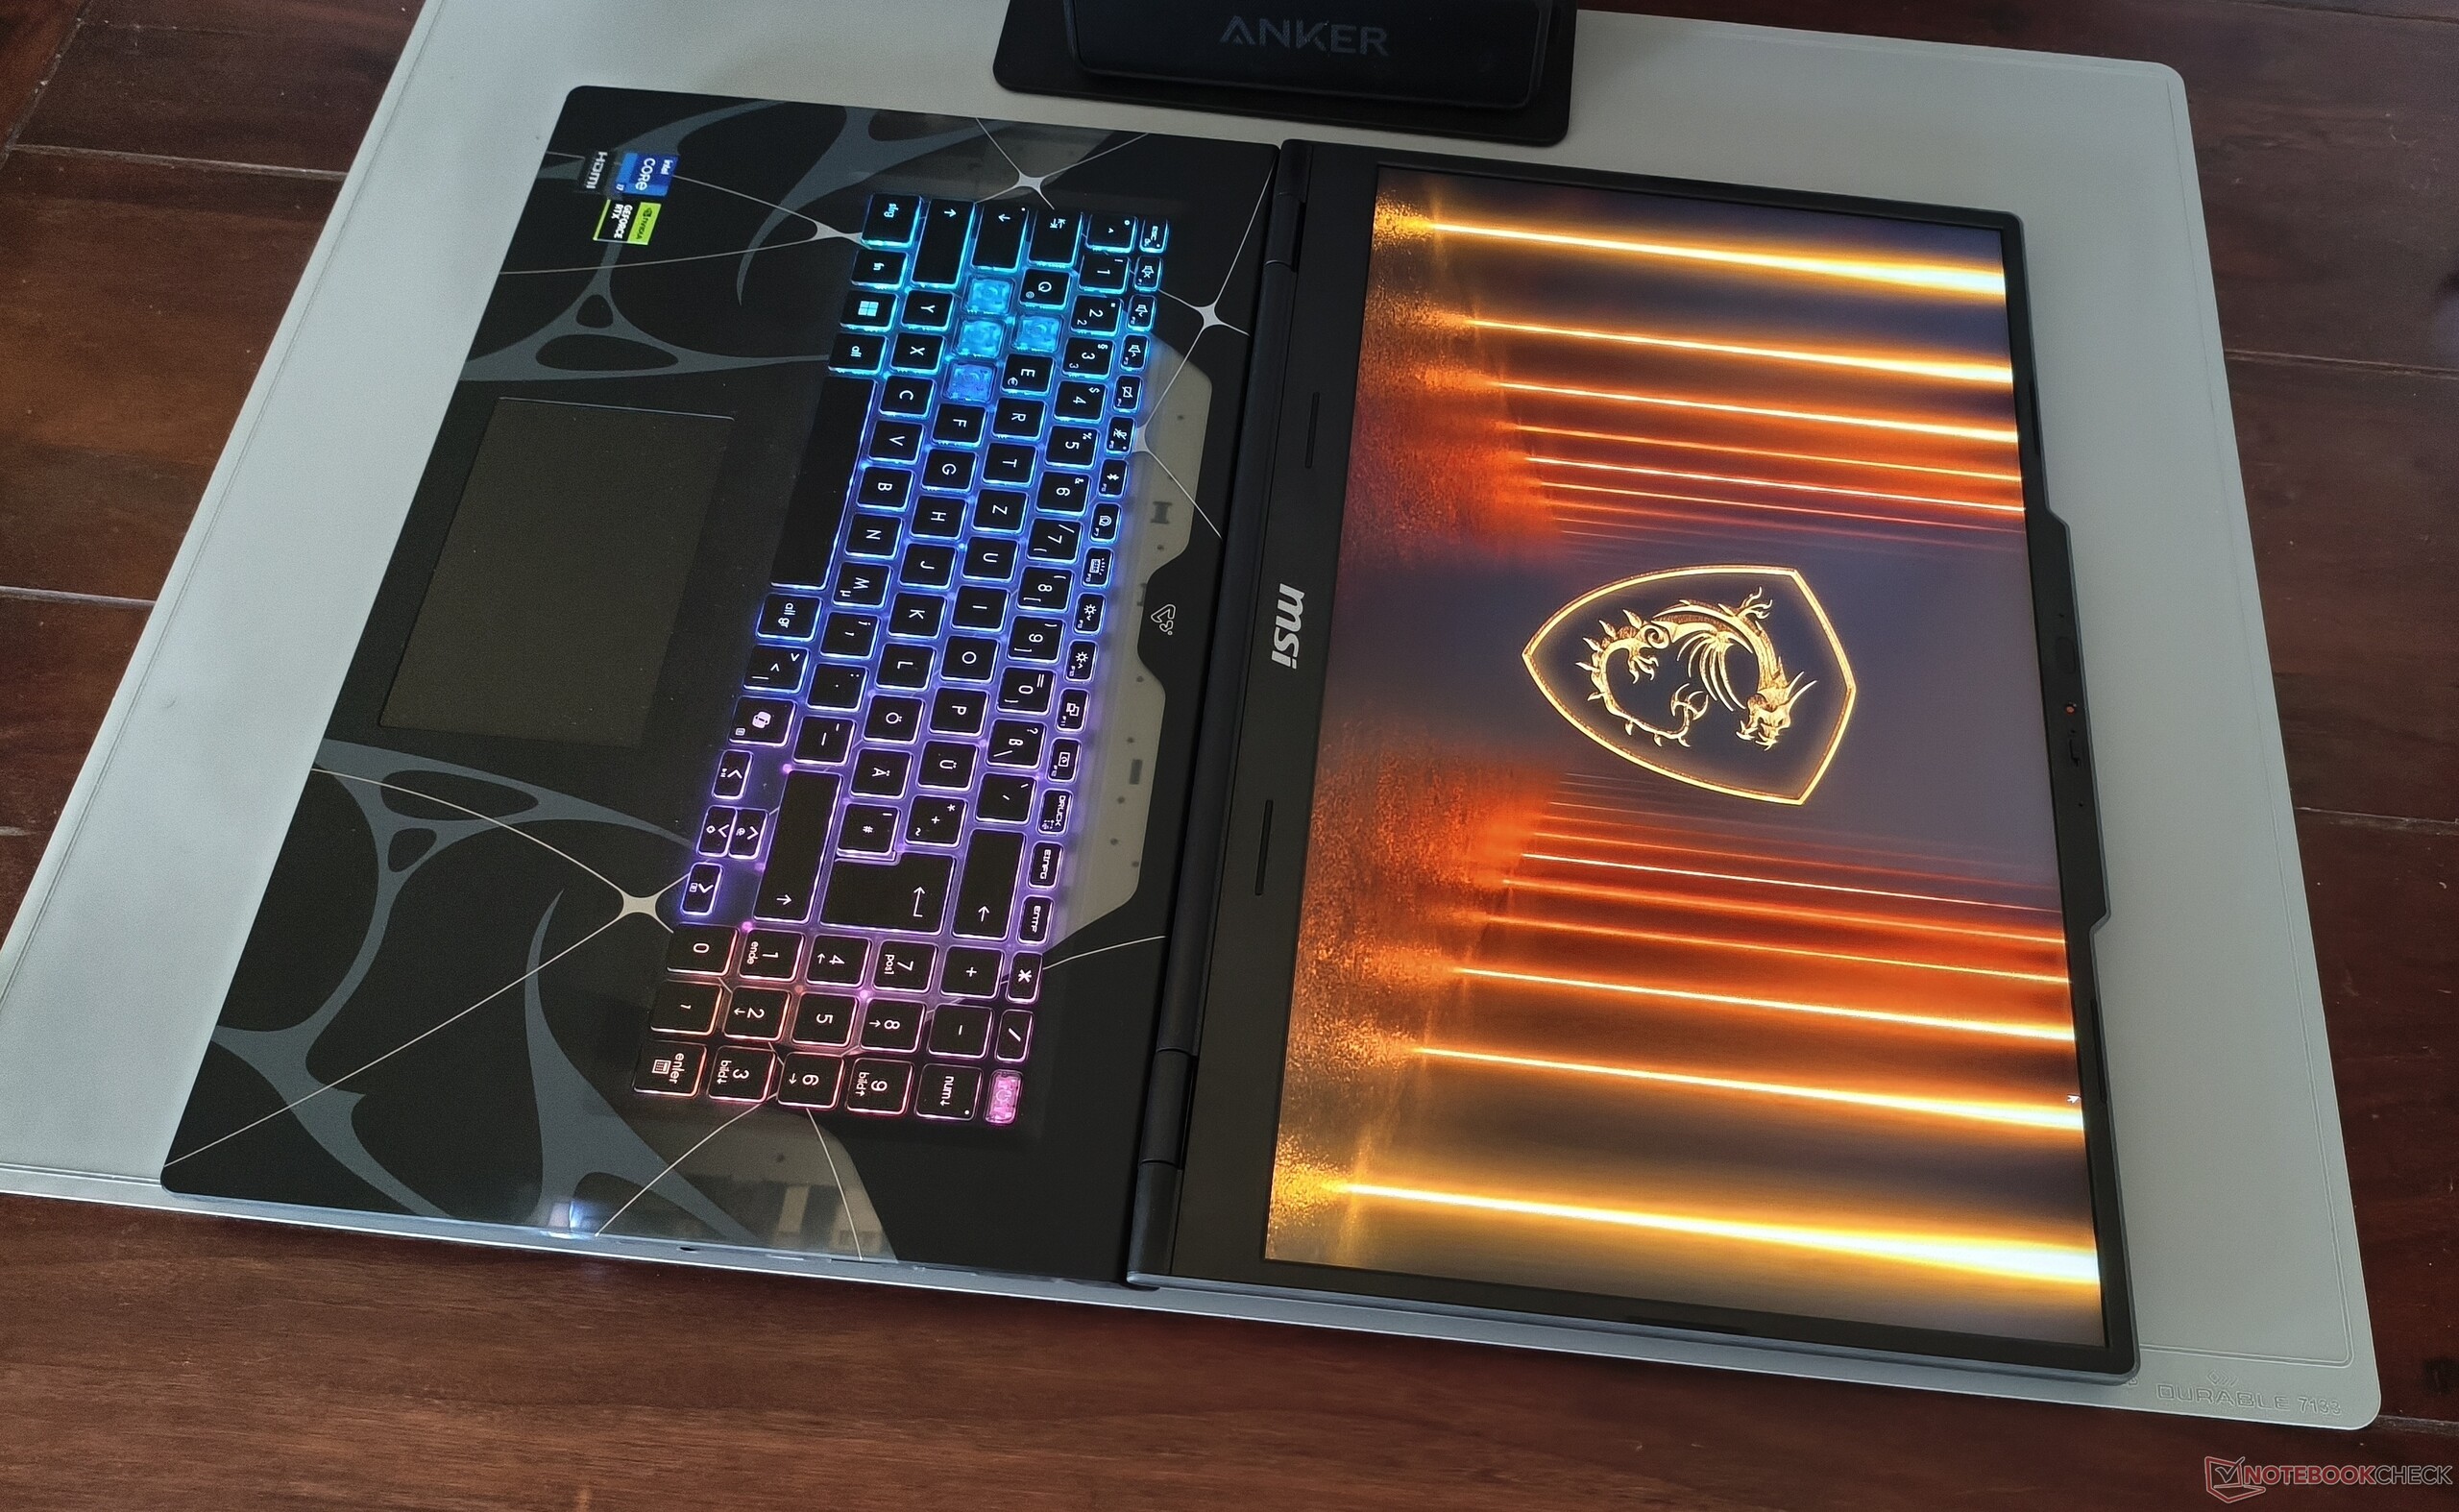
Comme nous l'avons mentionné au début, l'étui présente plusieurs points forts. Outre le design et le choix des matériaux, la qualité de fabrication et la stabilité sont largement convaincantes. Une charnière à 180 degrés n'est pas non plus quelque chose que l'on voit tous les jours. Avec environ 2,6 kg, le Cyborg 17 se situe dans une fourchette de poids similaire à celle de l'Alienware 16 Aurora, et une hauteur de 2,2 cm est tout à fait acceptable pour un appareil de 17 pouces.
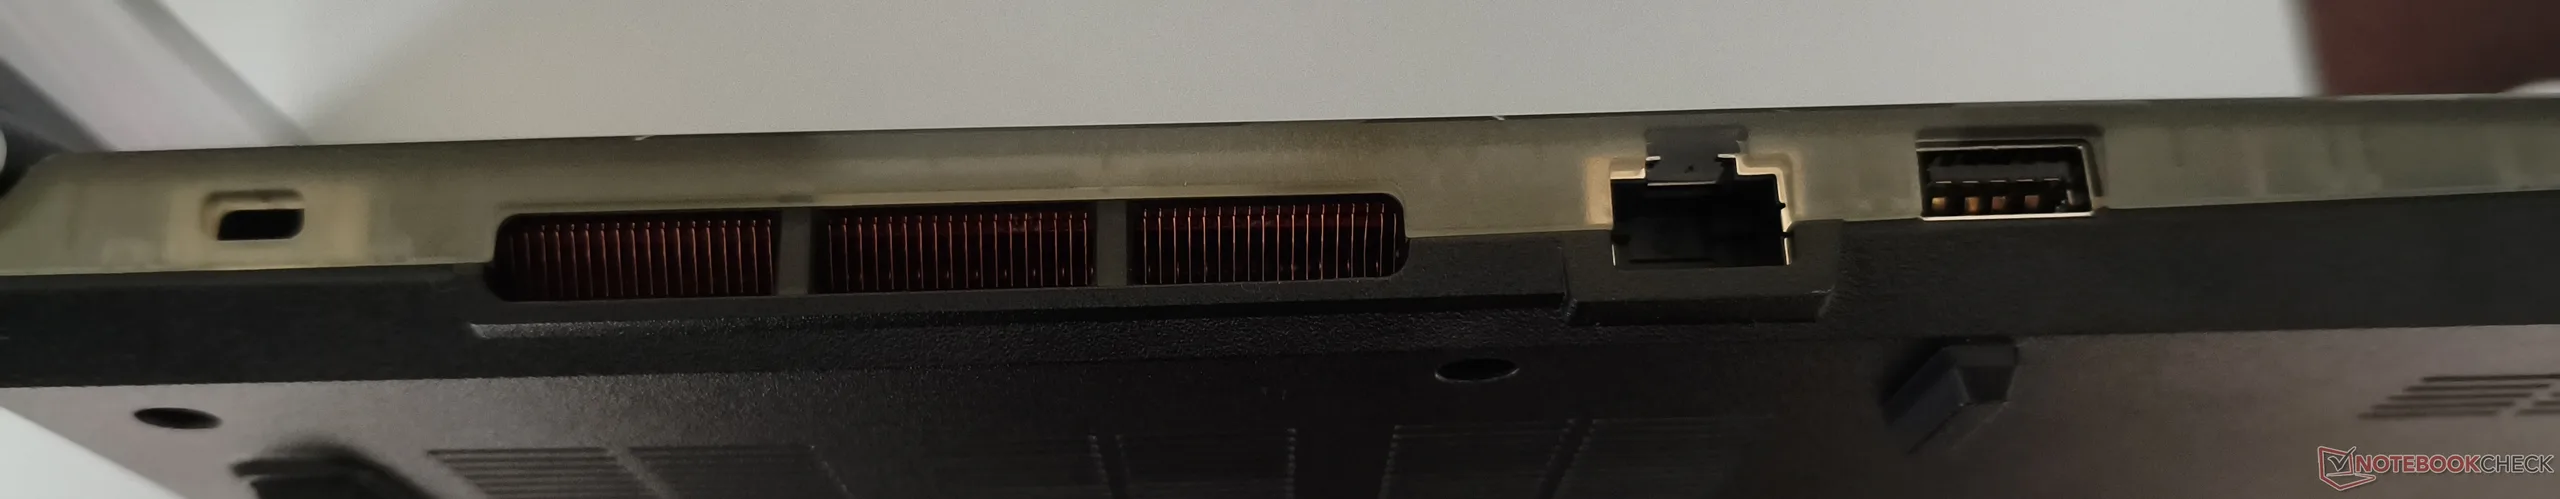
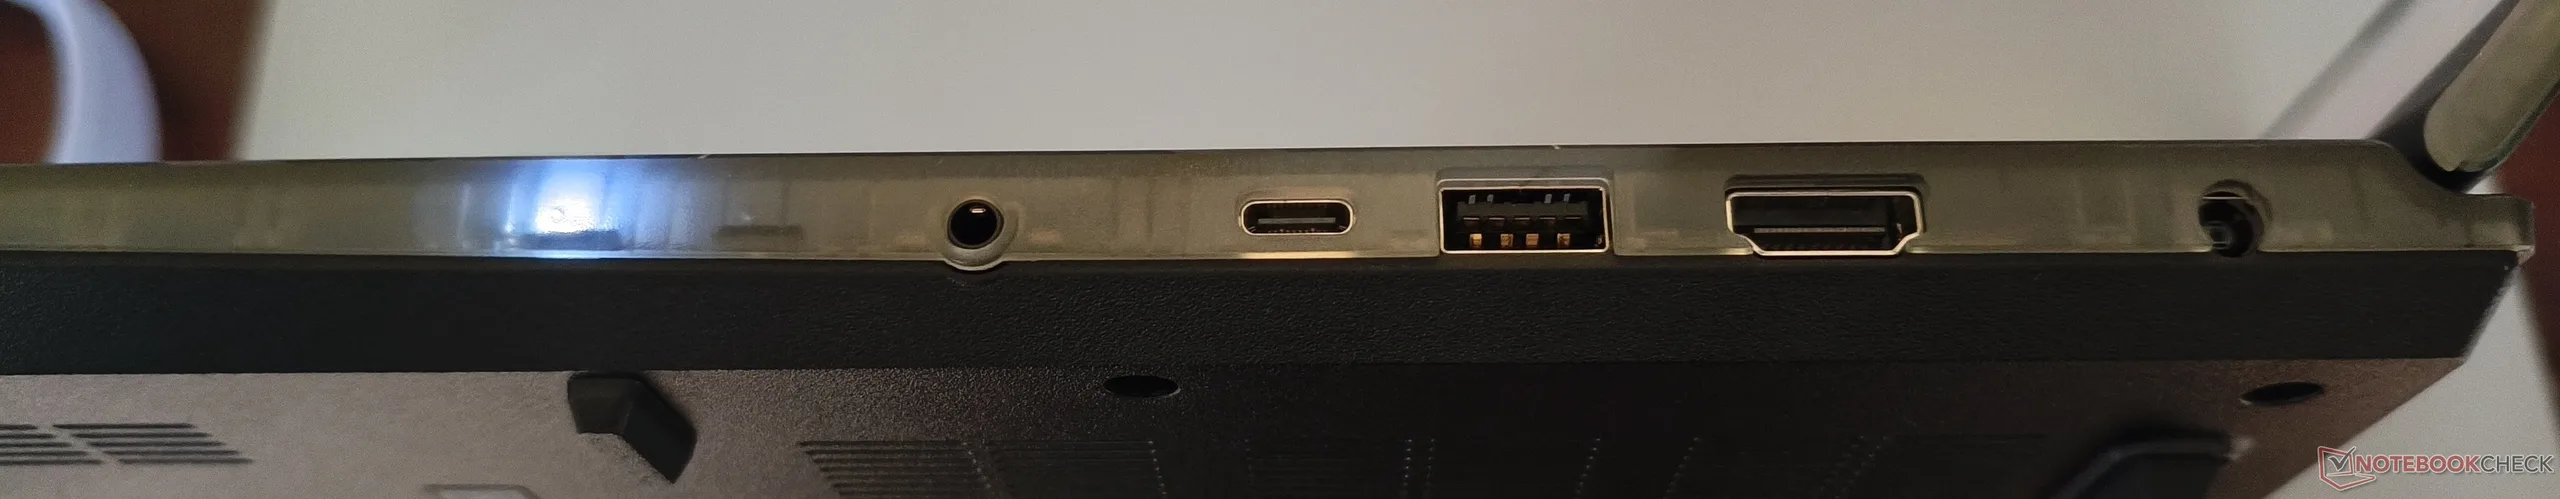
Connectivité
La sélection des ports n'est pas particulièrement généreuse. Trois ports USB semblent plutôt limités, d'autant plus que MSI a renoncé à la prise en charge de l'USB 4 et du Thunderbolt. Point positif, le port USB-C disponible prend en charge Power Delivery et DisplayPort. Les écrans externes peuvent également être connectés directement via HDMI. L'ensemble est complété par une prise audio, un port RJ45 et un verrou Kensington.
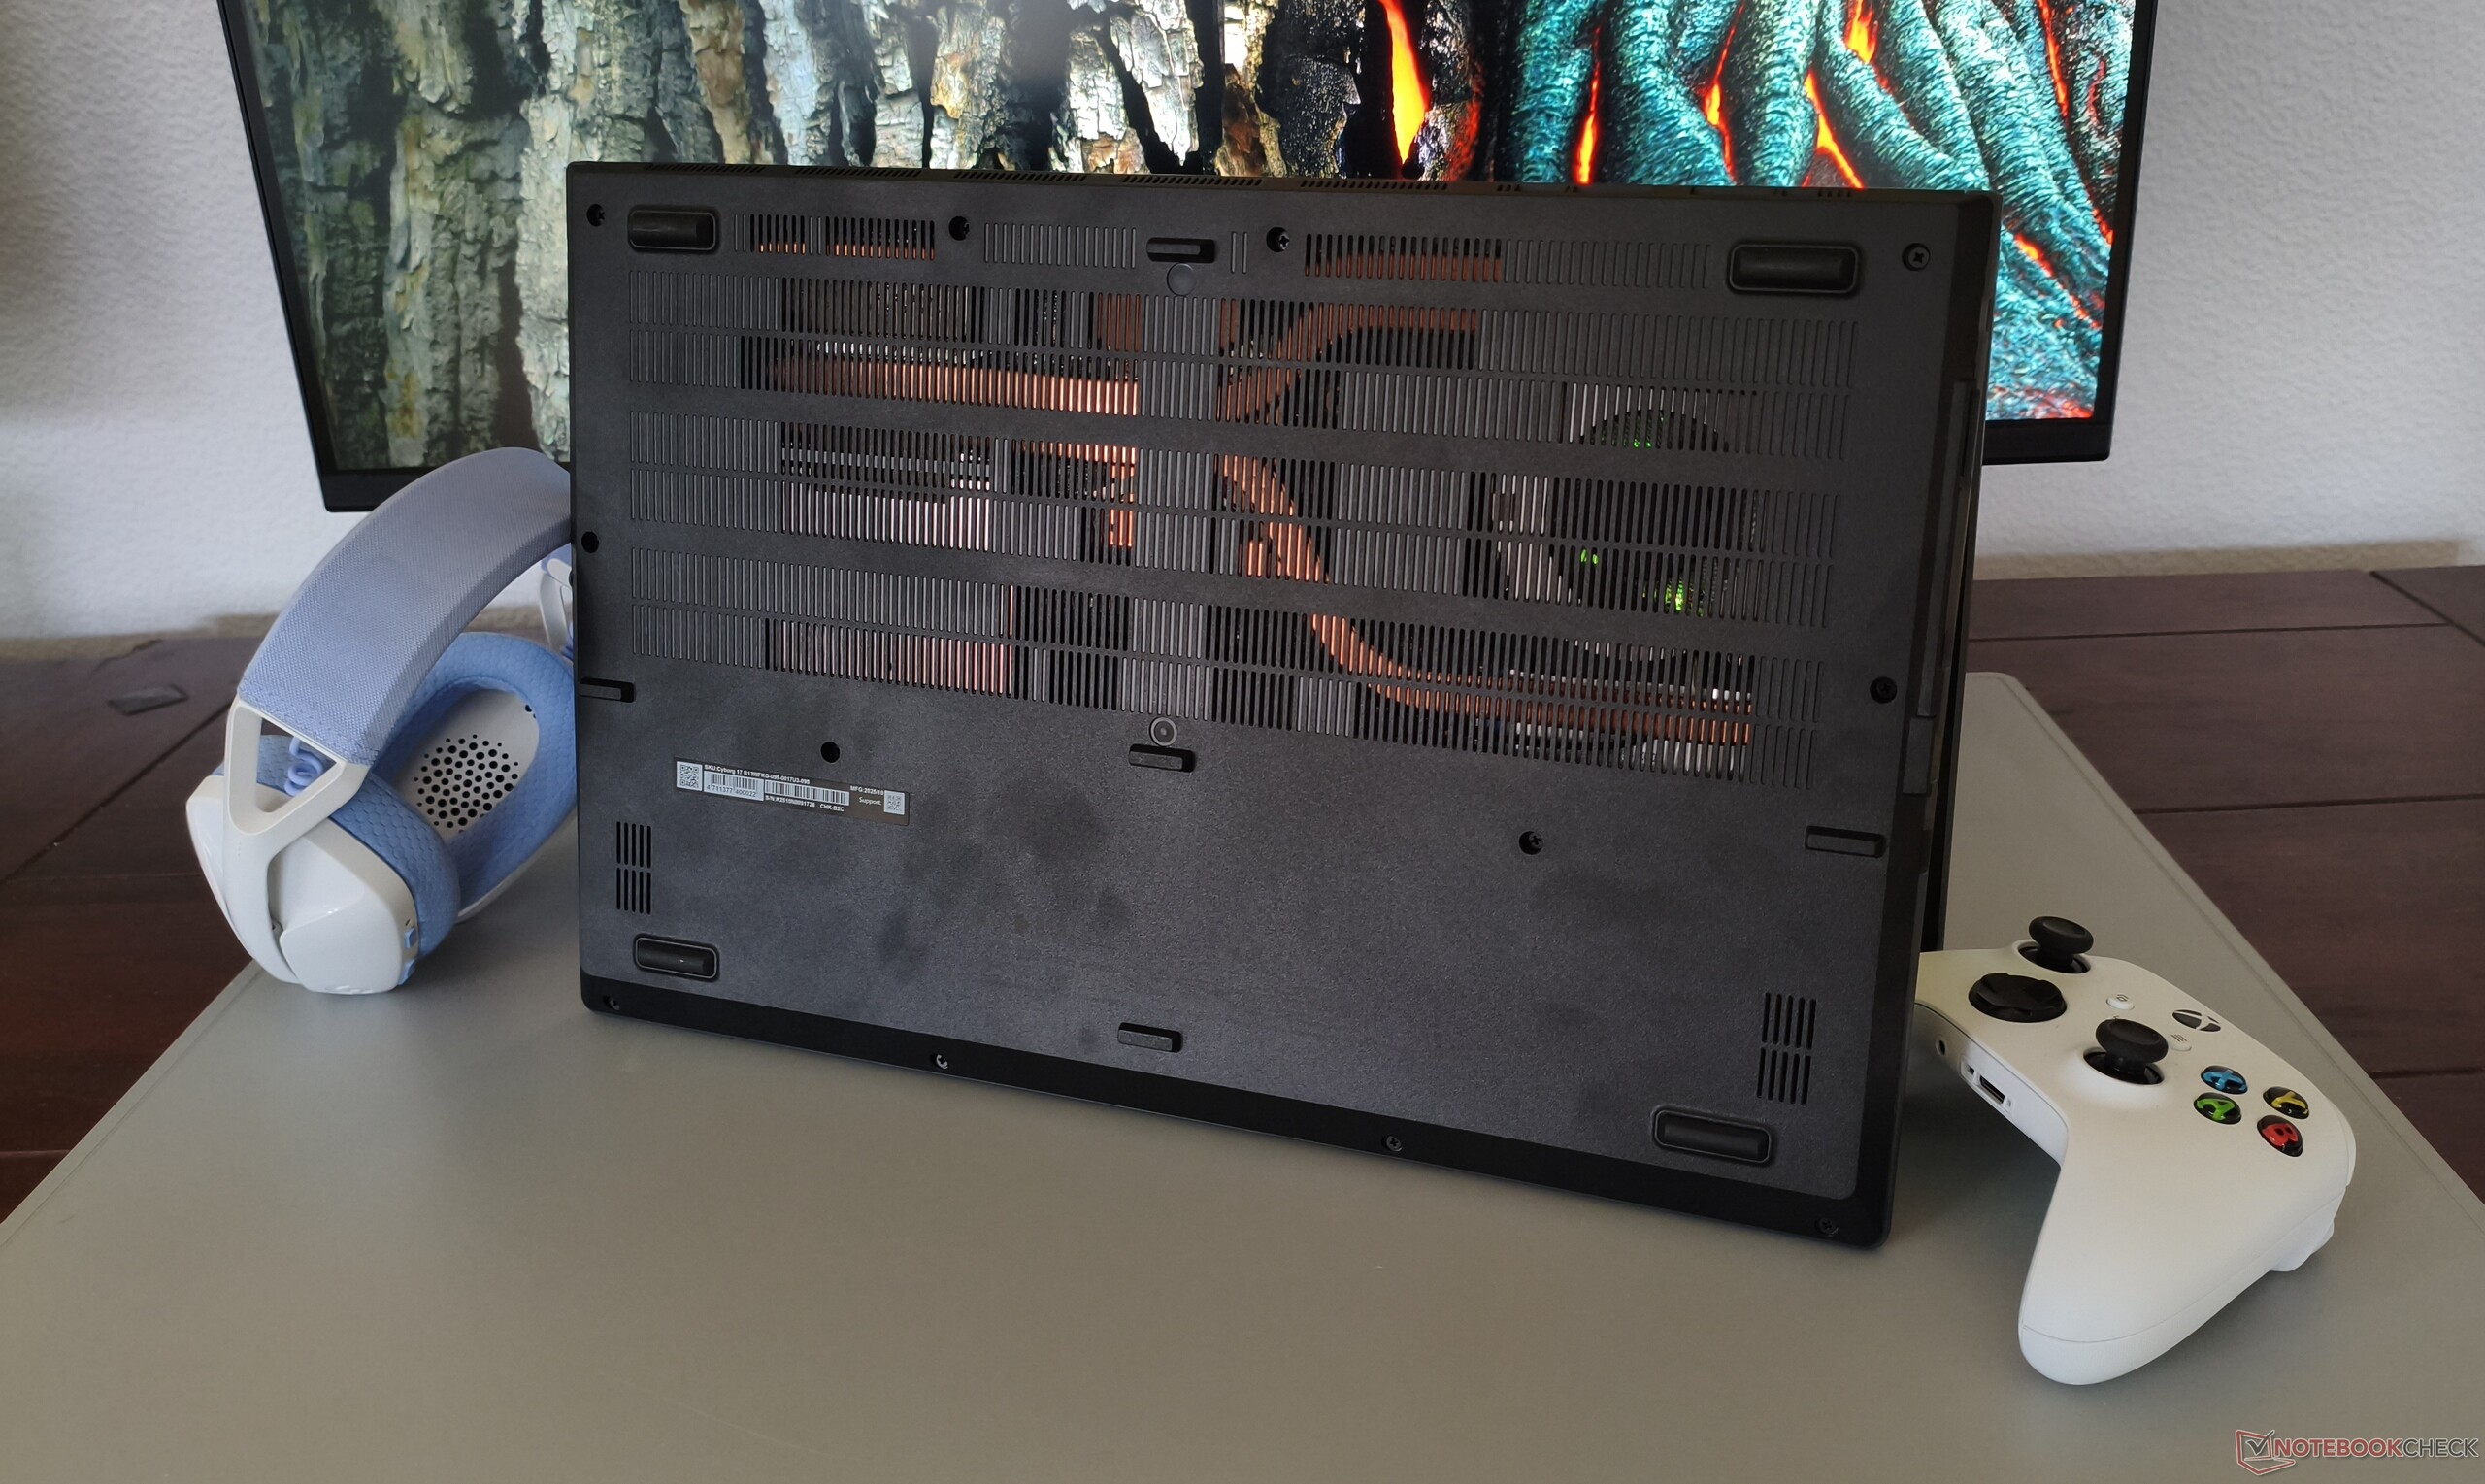
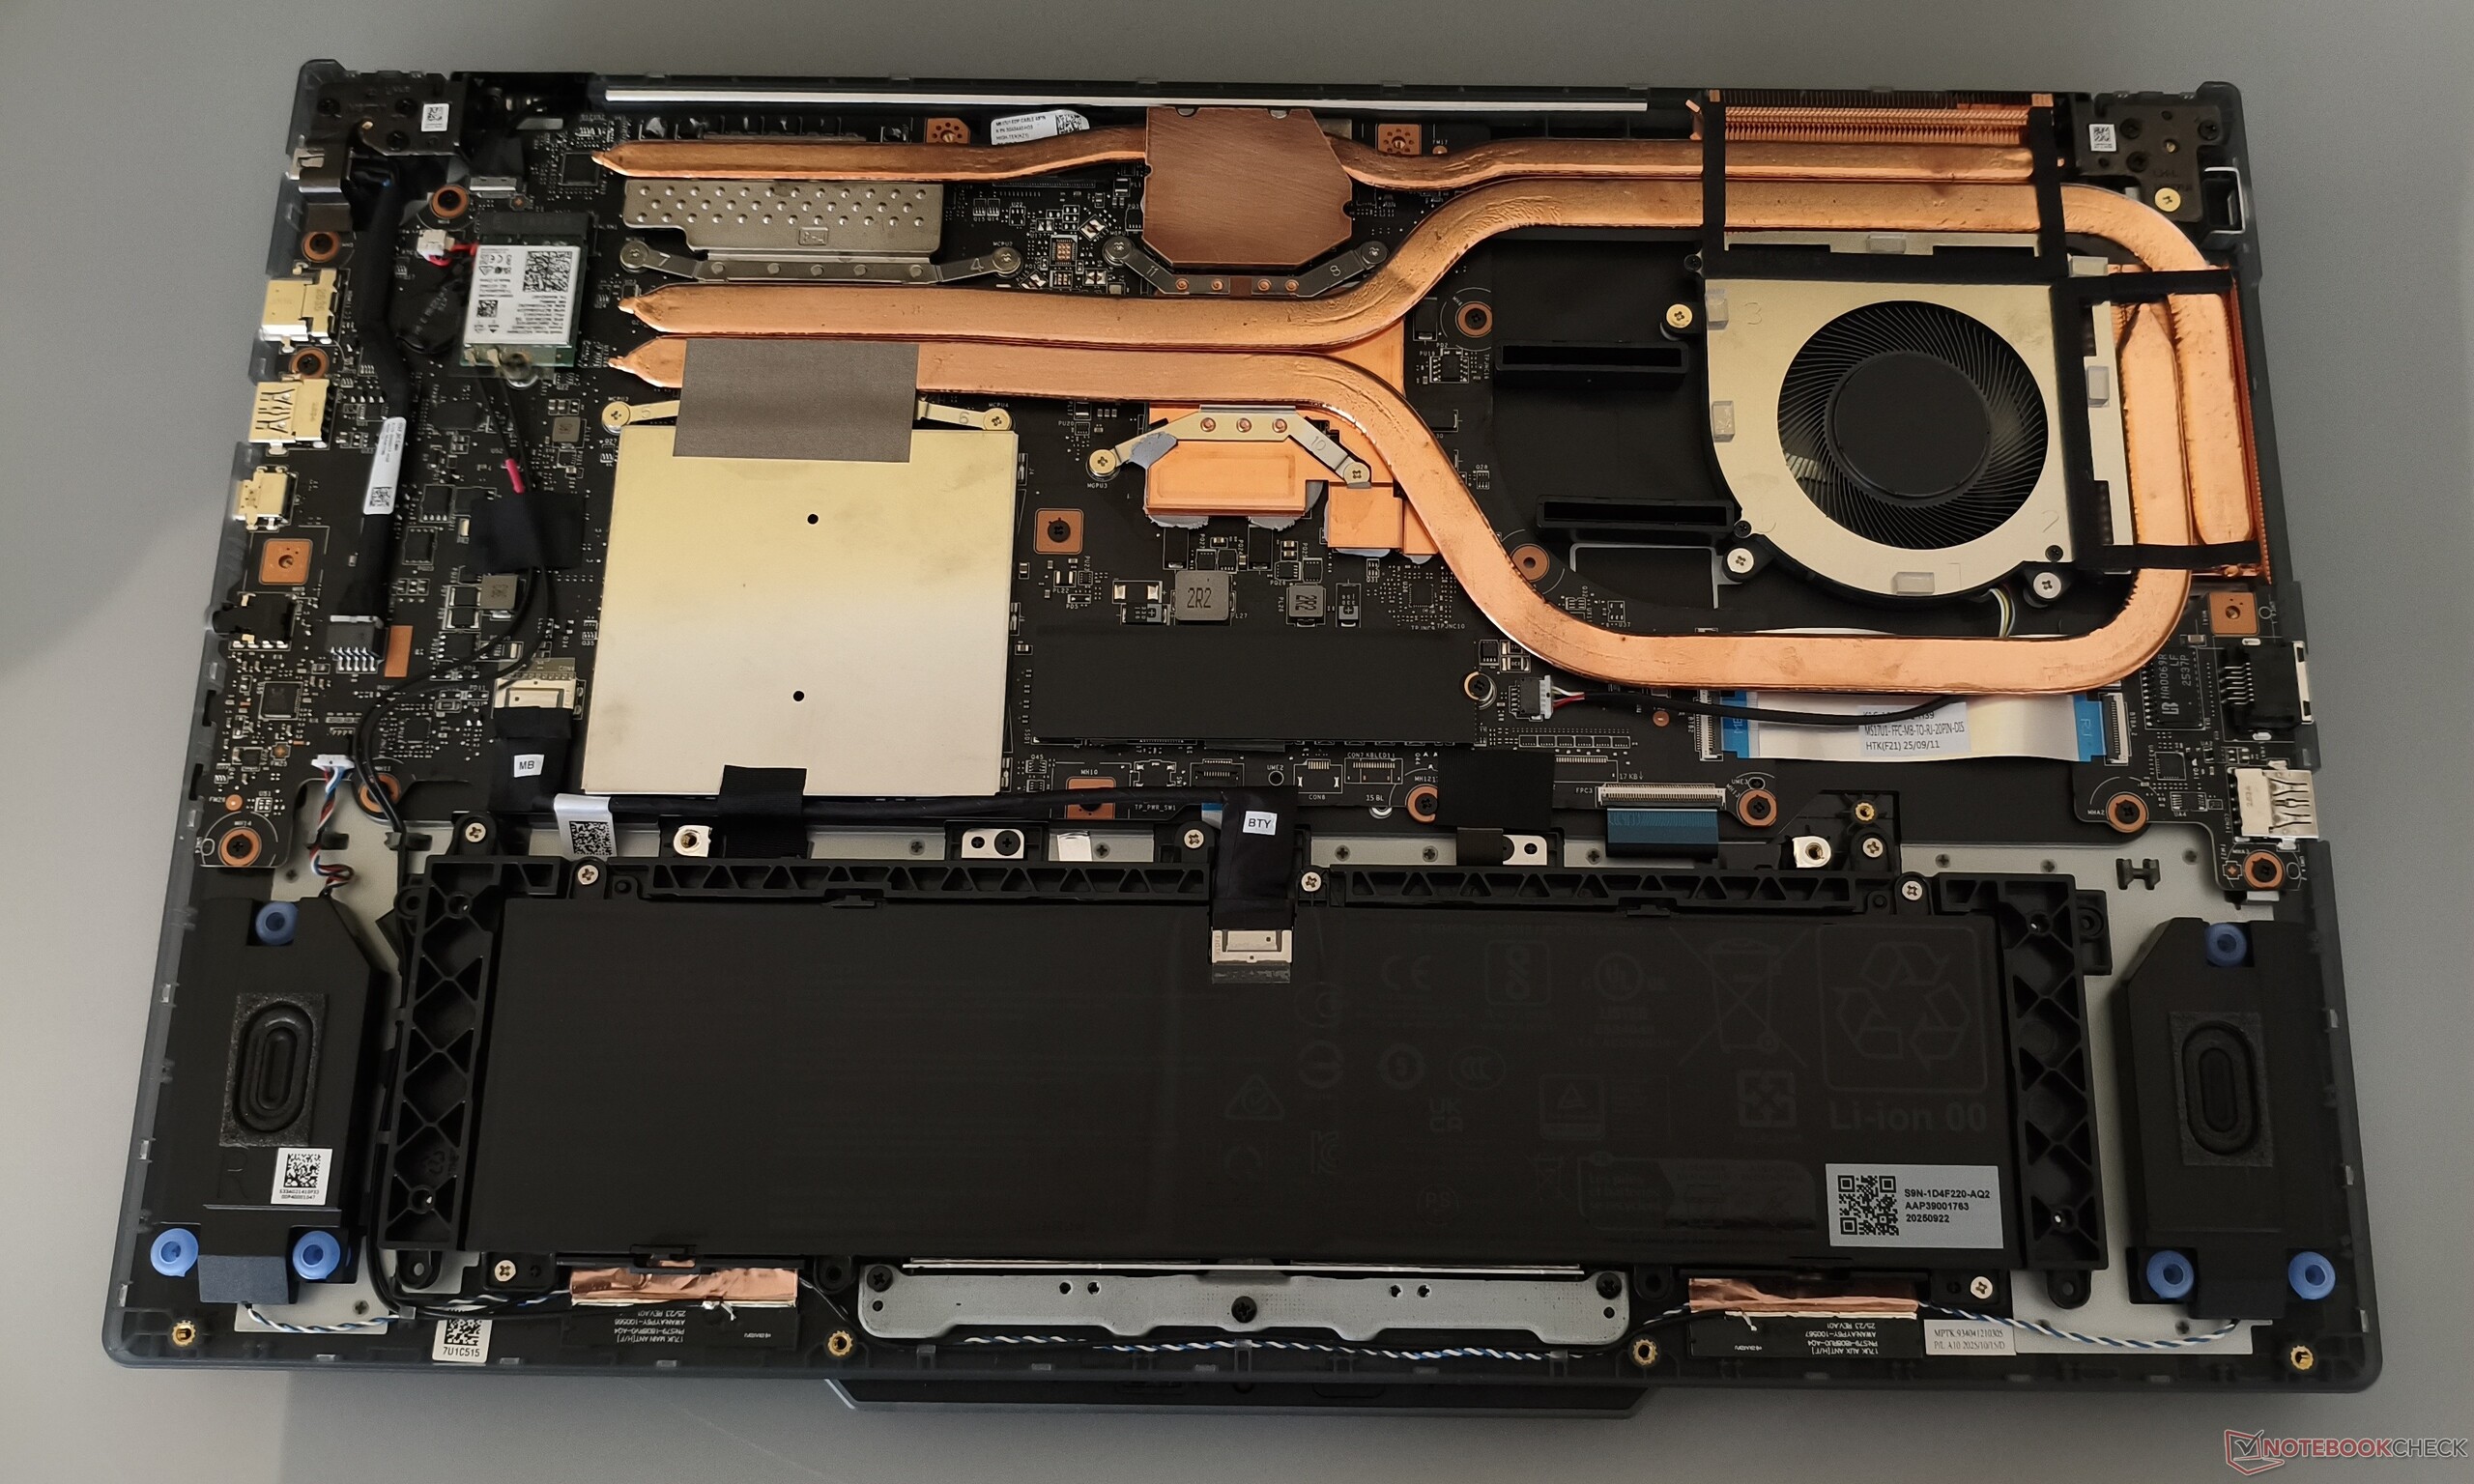
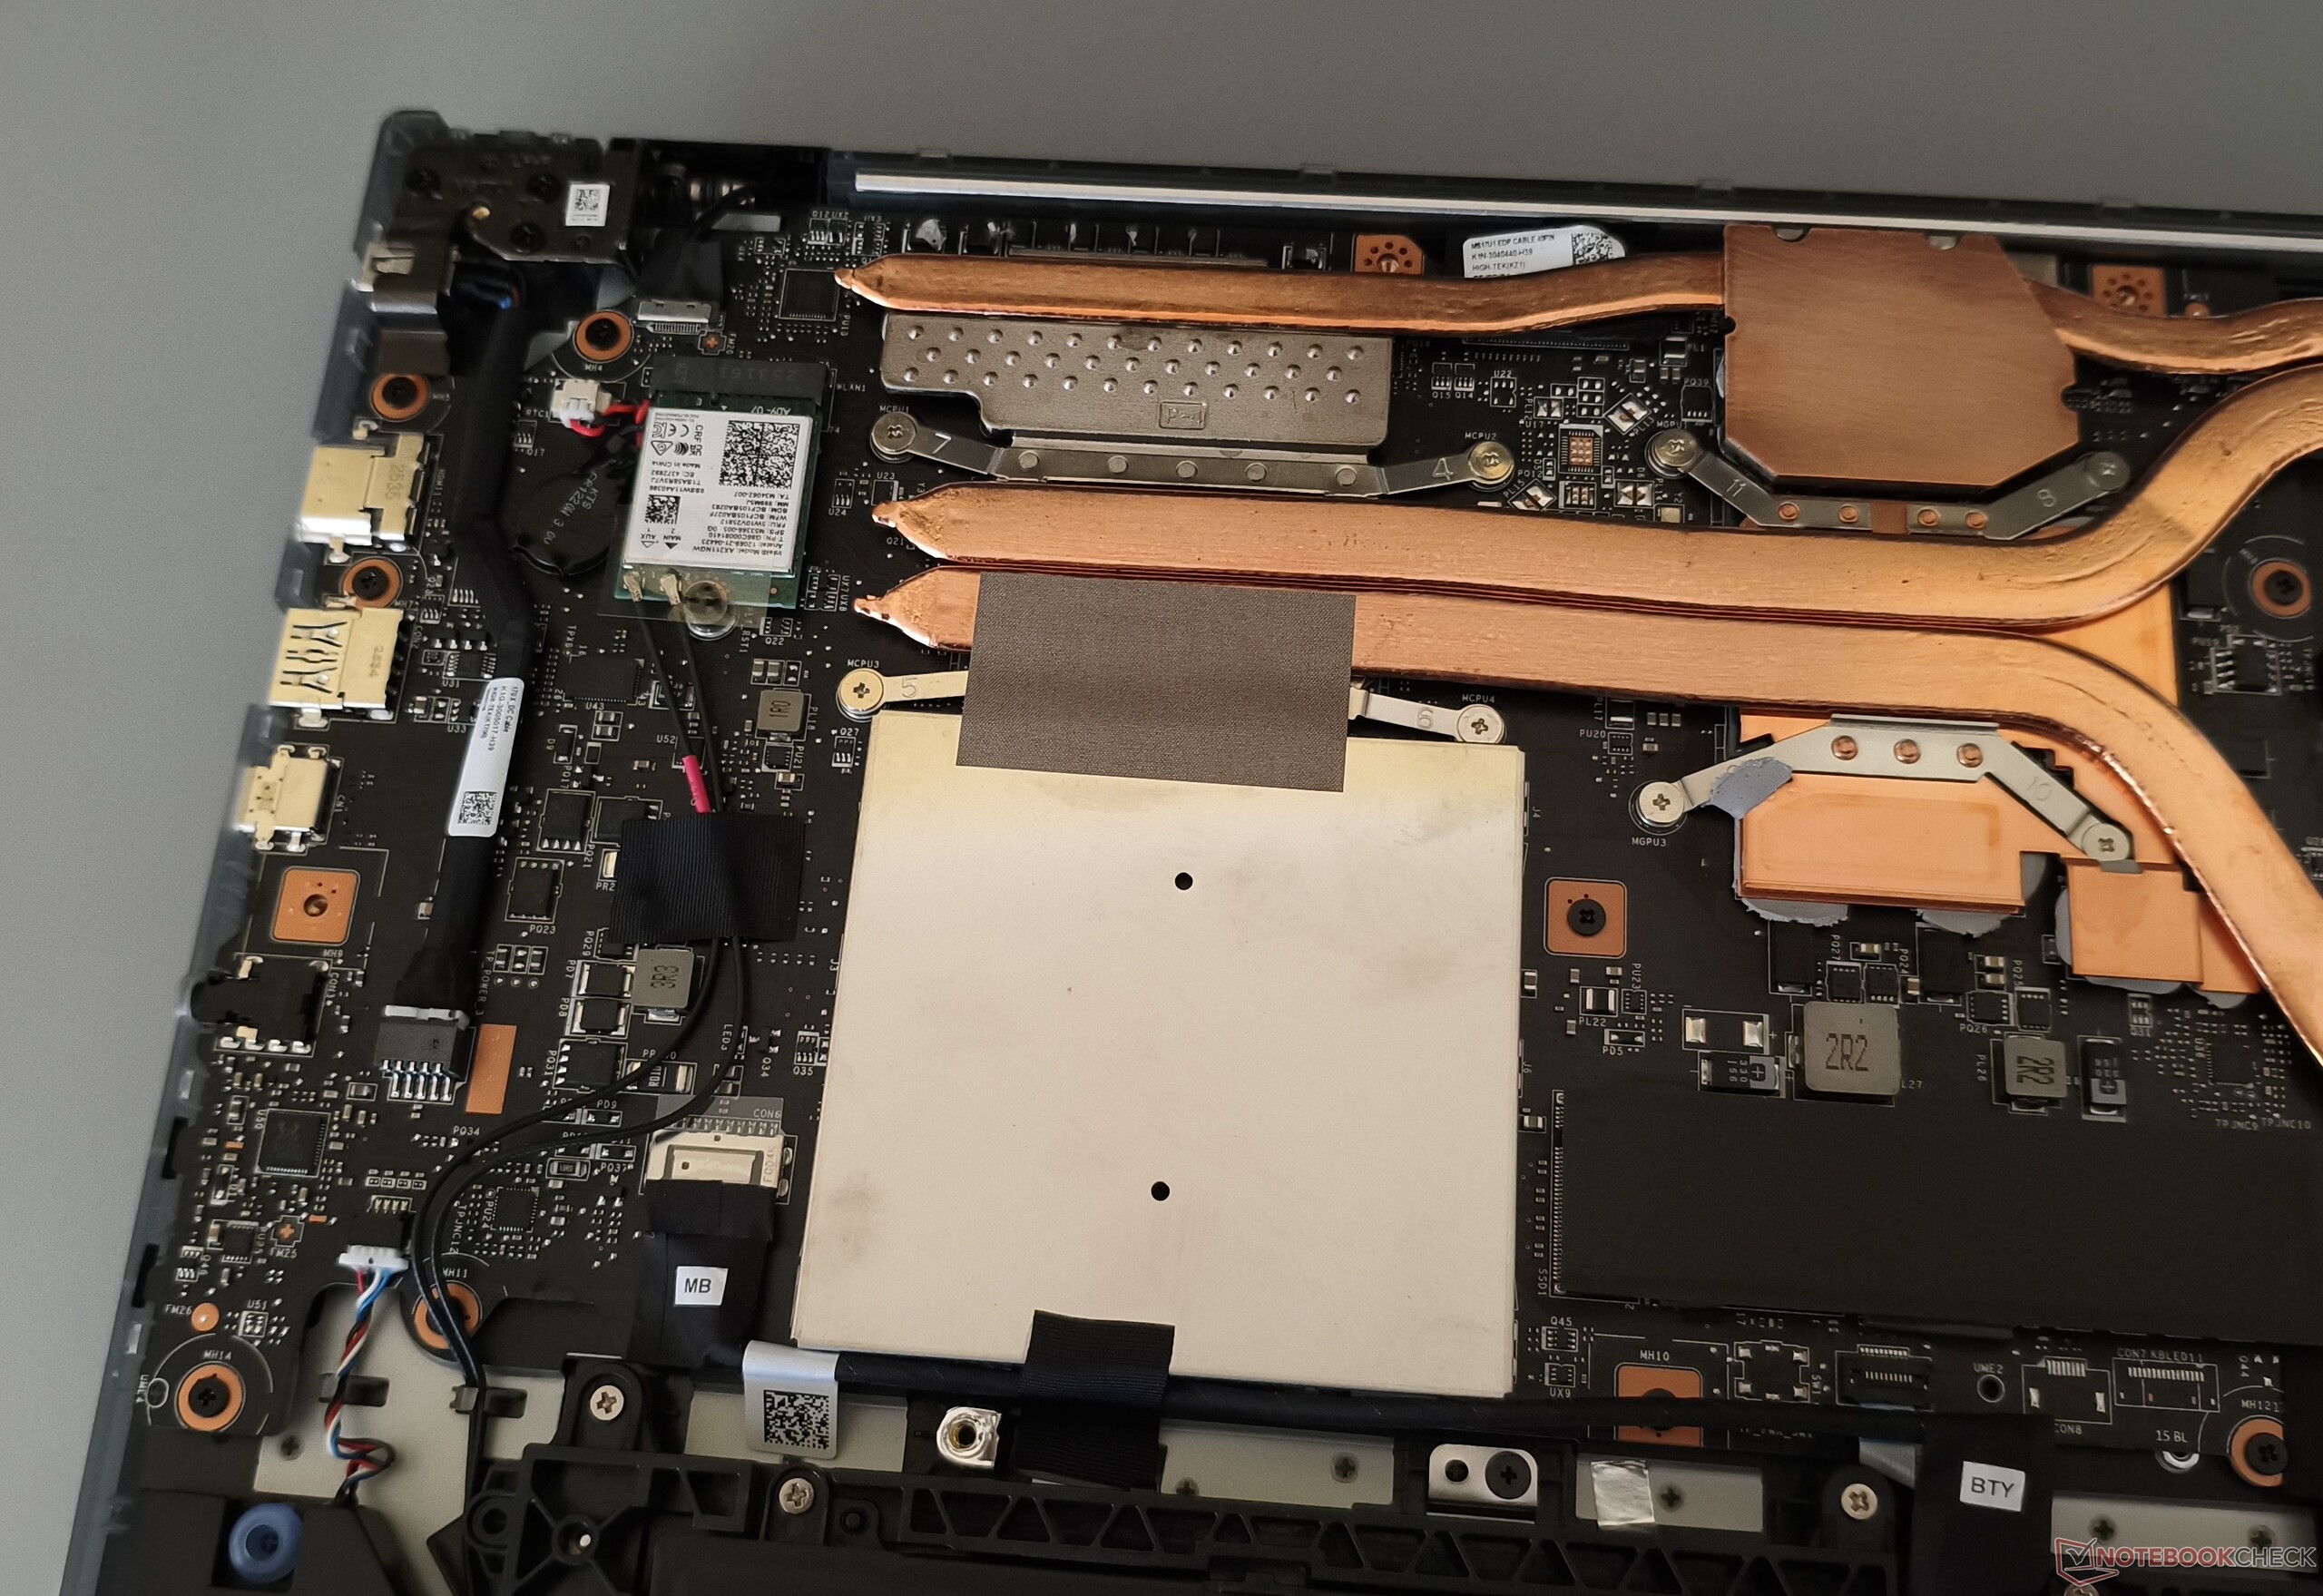
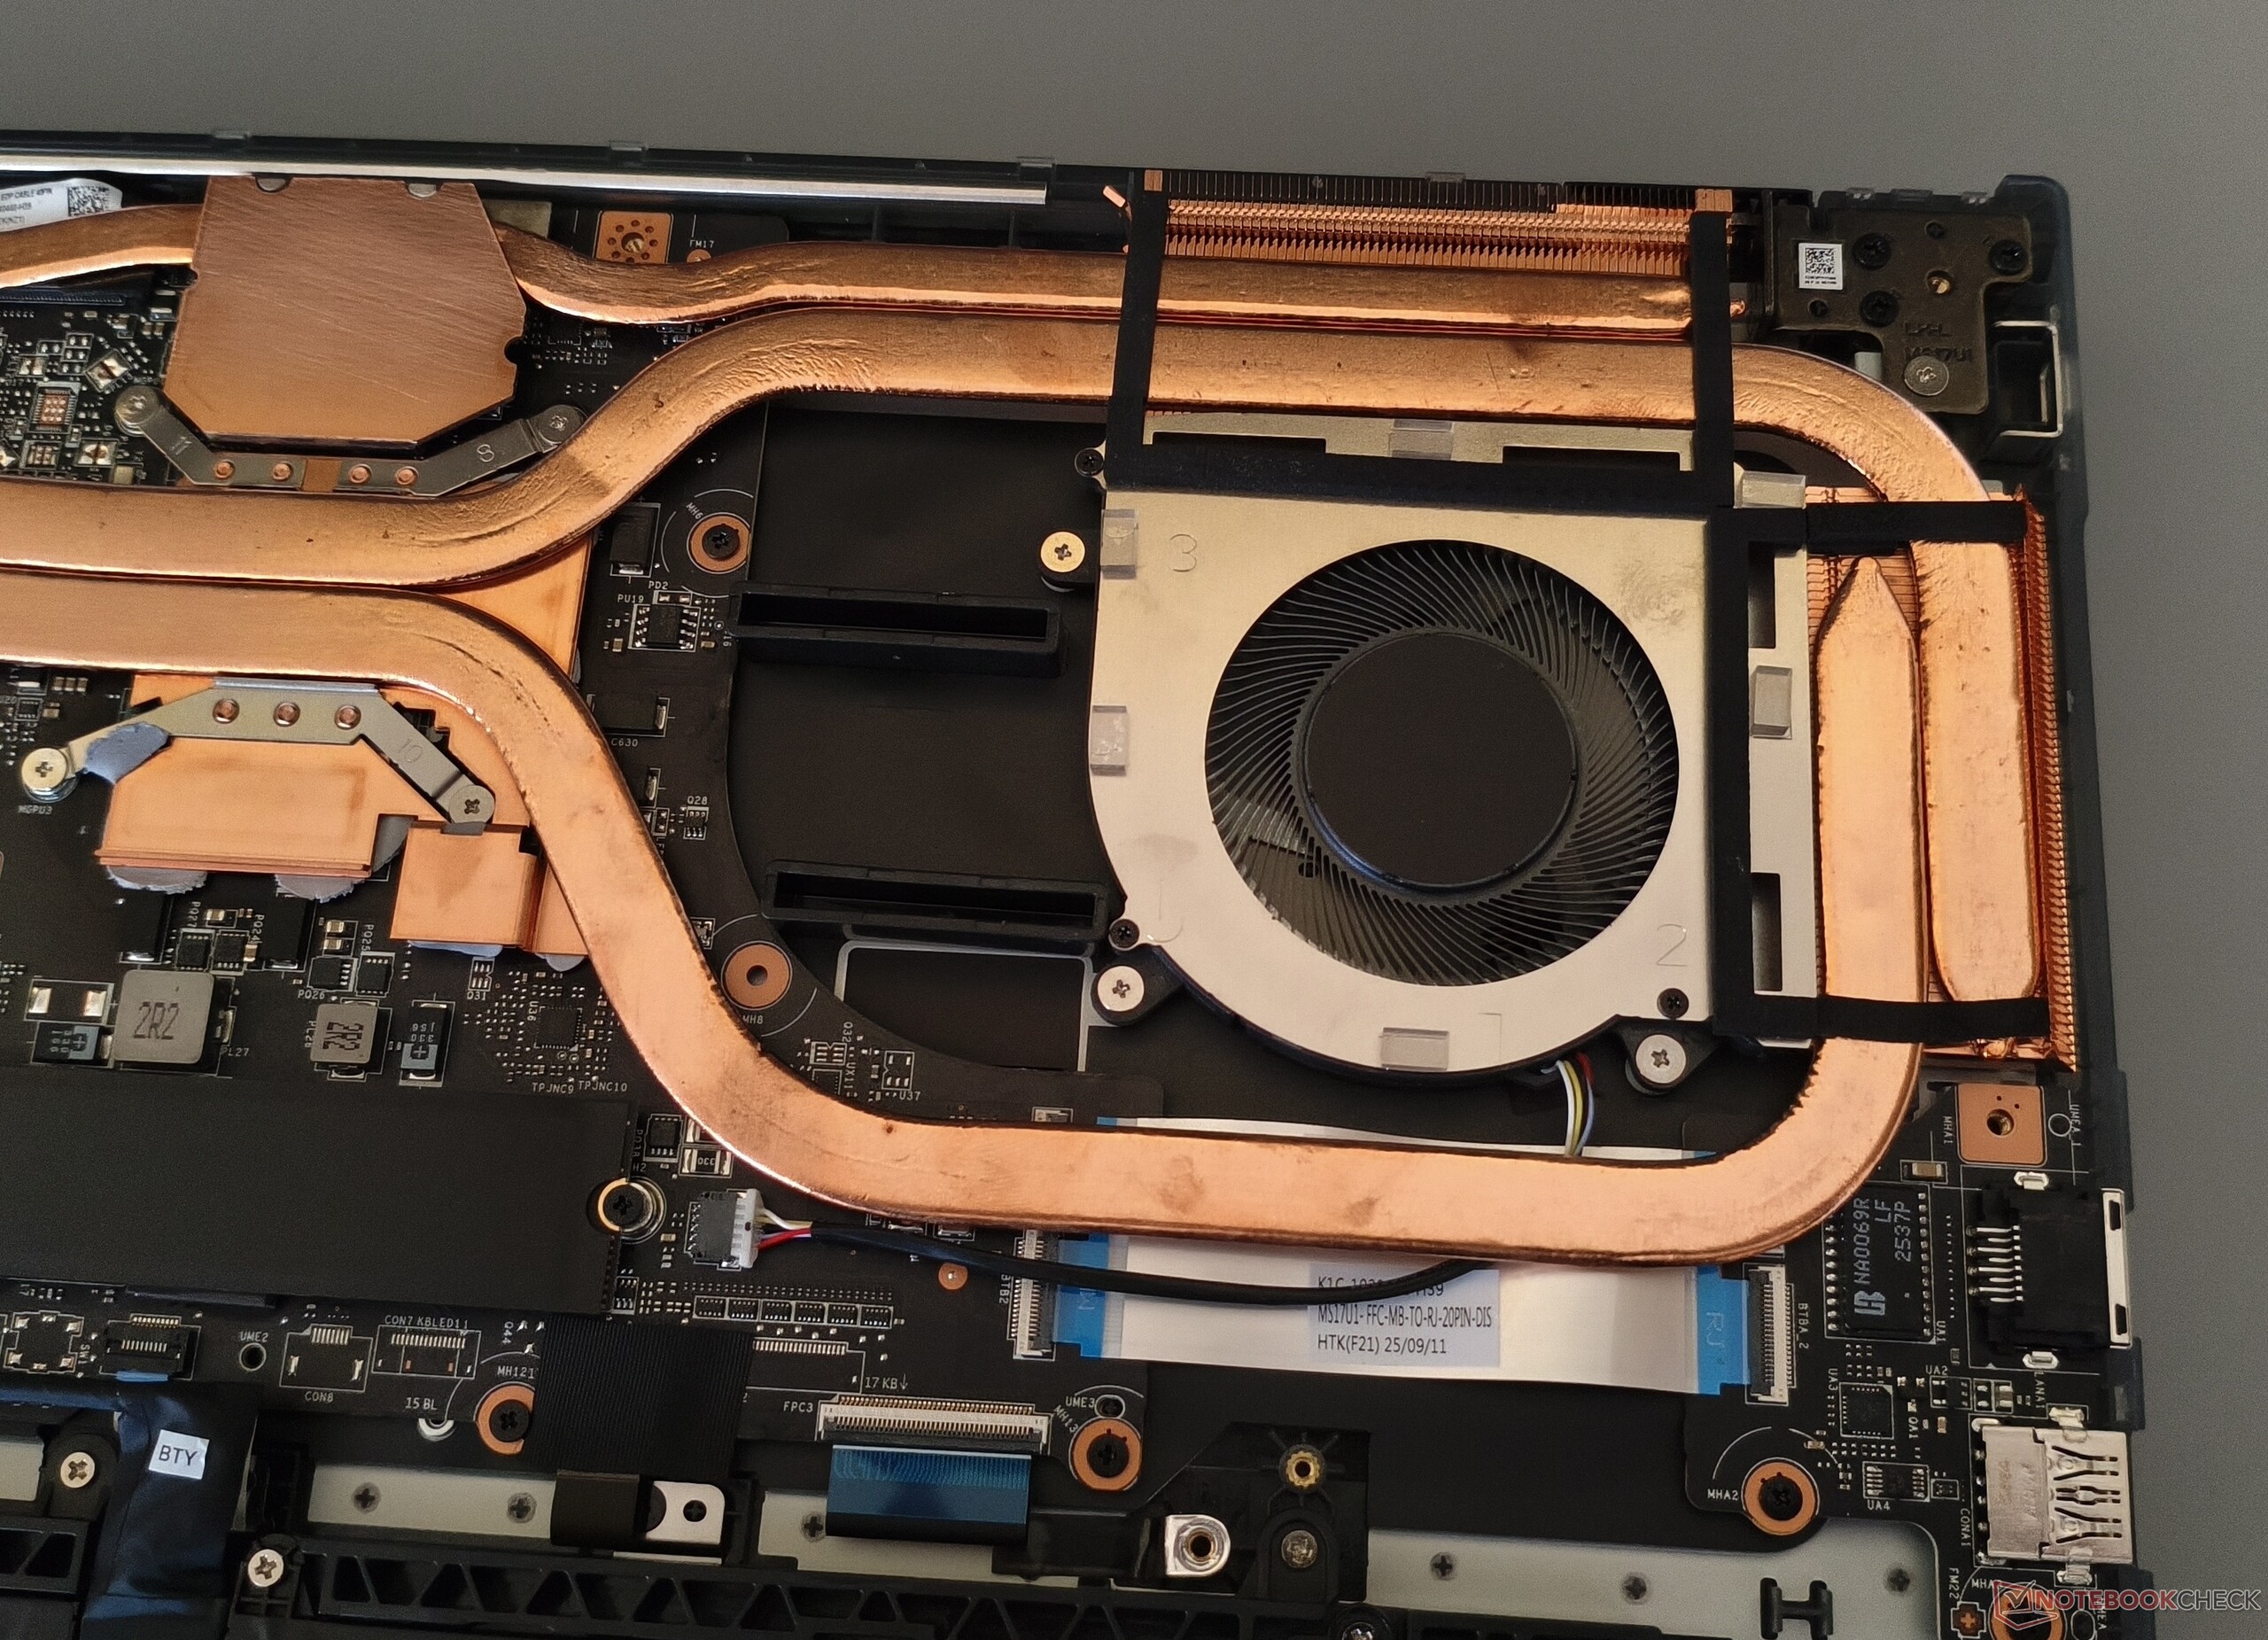
Le module Wi-Fi 6E intégré d'Intel (AX211) offre des performances solides en émission et très bonnes en réception. La qualité de la webcam est cependant assez médiocre en termes de netteté et de précision des couleurs. Pour ouvrir le boîtier, il faut retirer douze vis cruciformes. Contrairement à certains concurrents, MSI a opté pour une solution de refroidissement à ventilateur unique.
Communication
Webcam


Maintenance
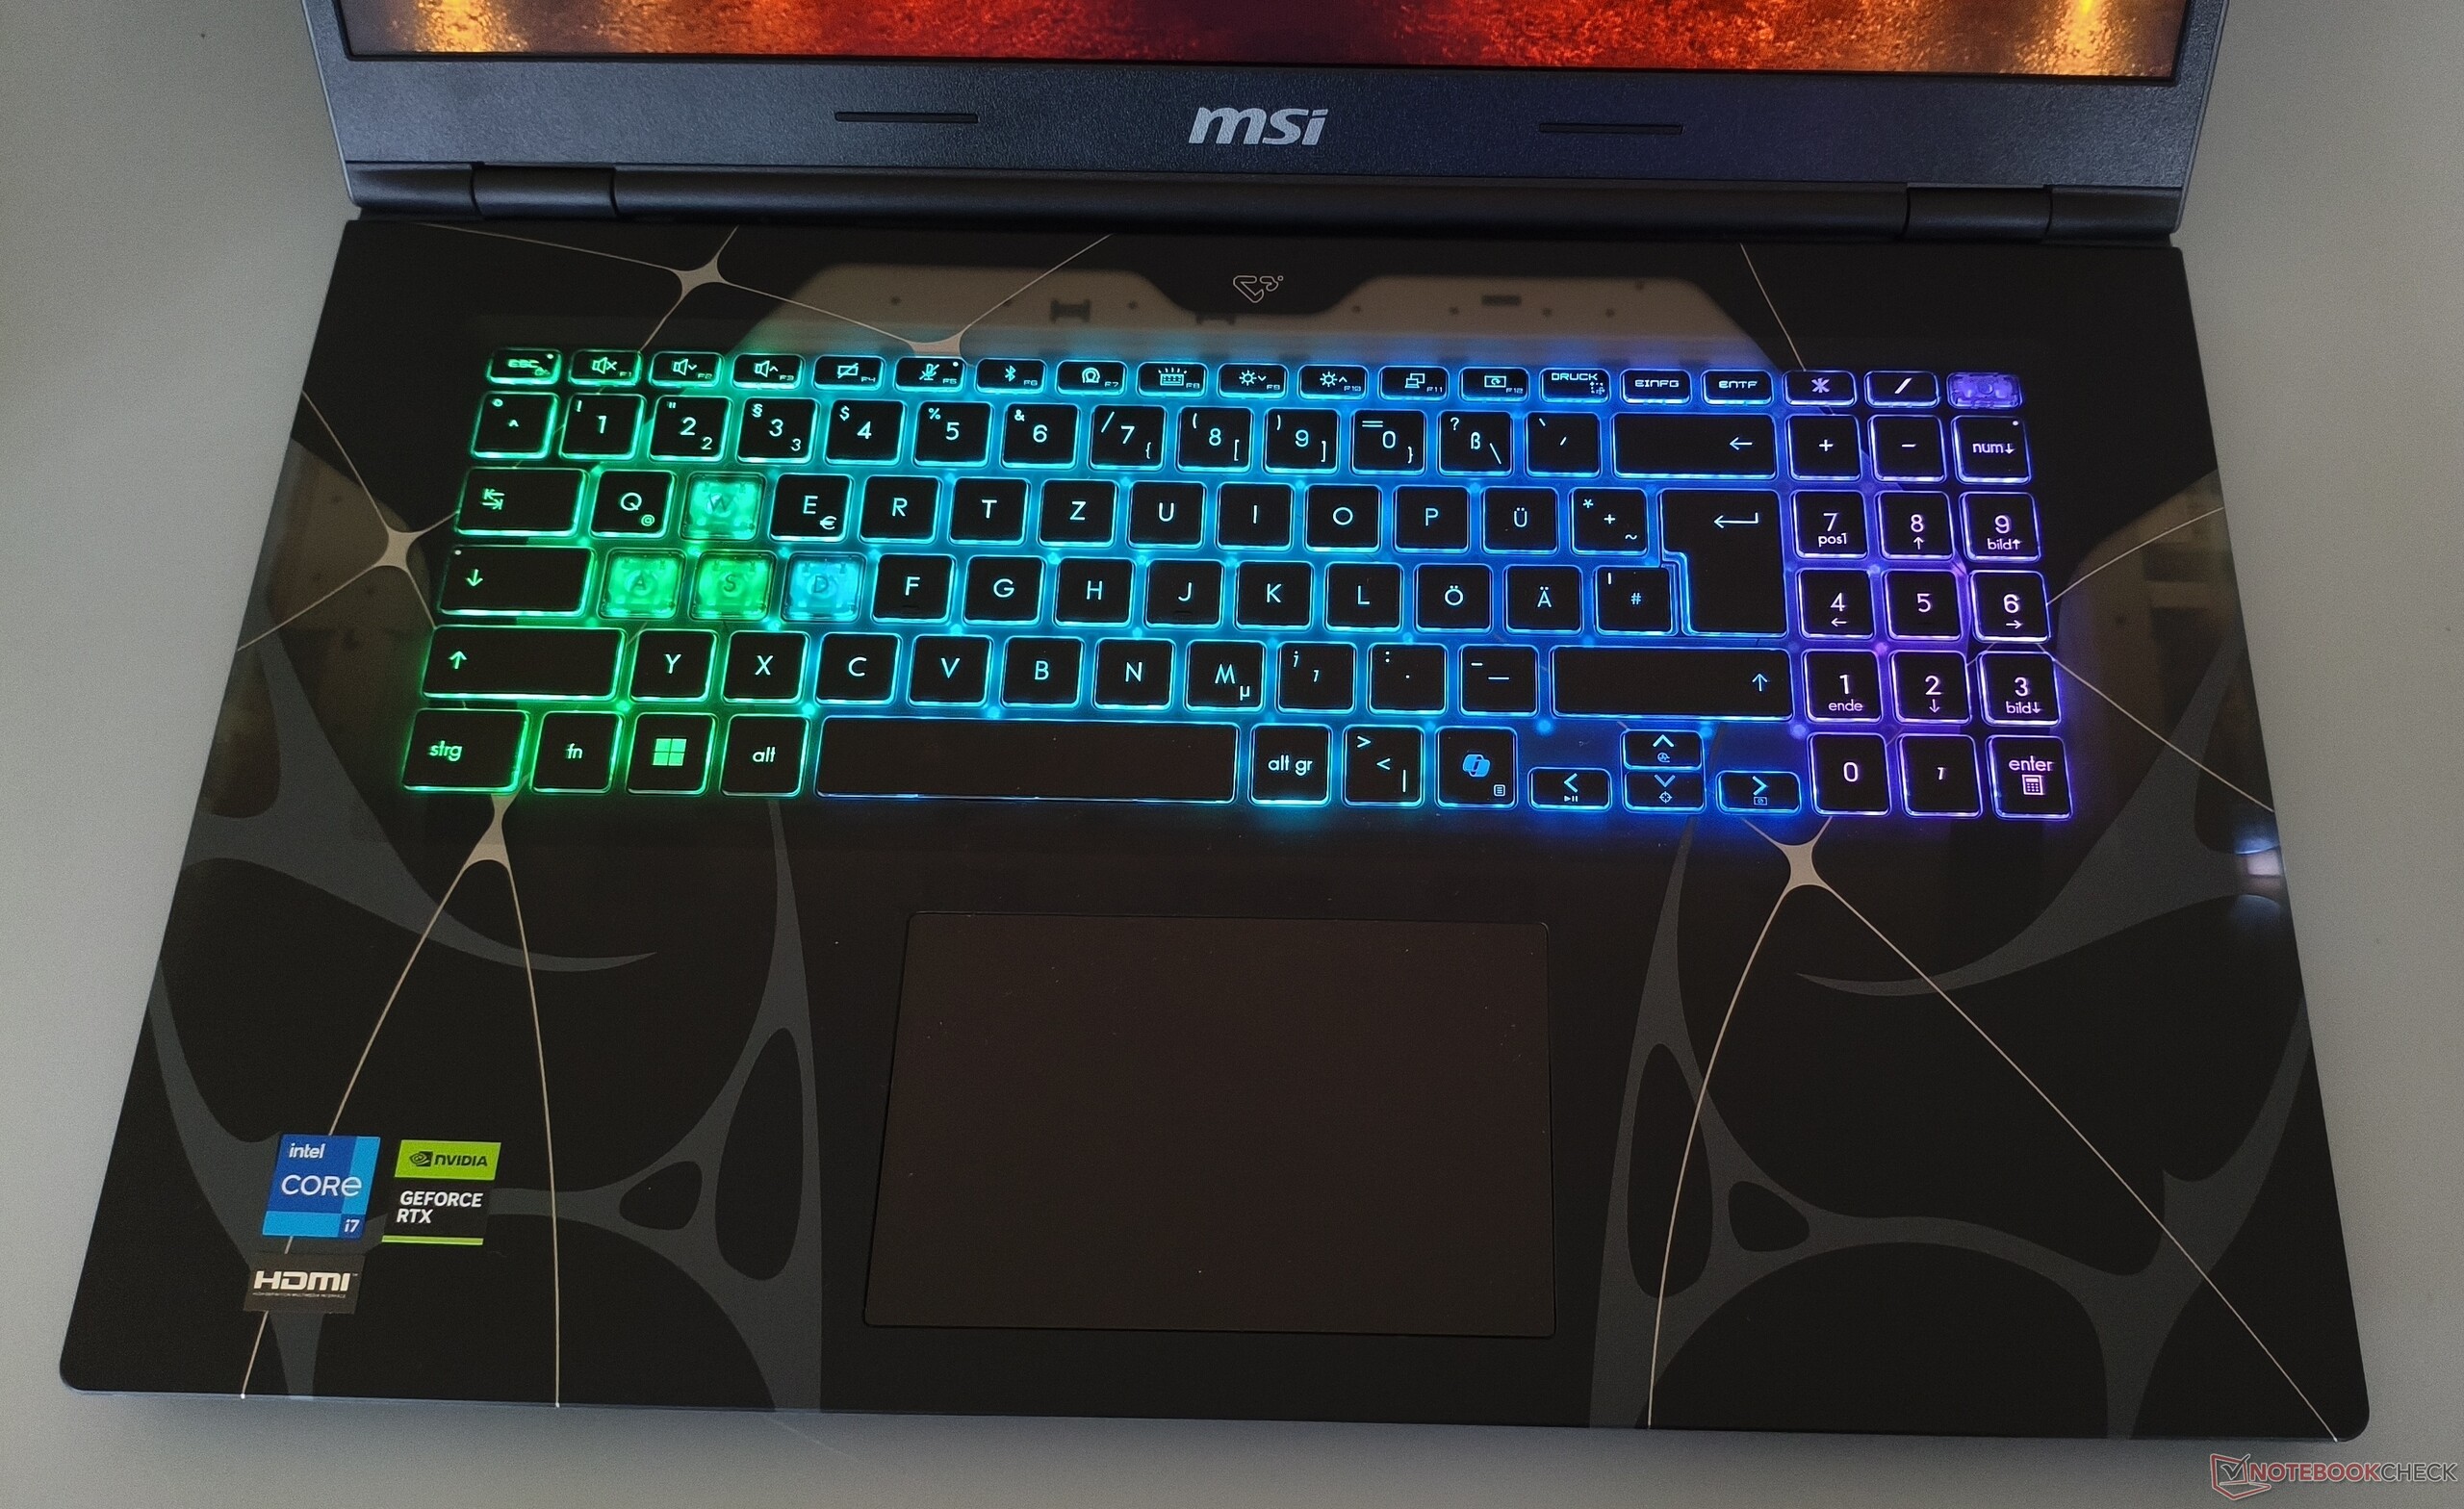
Dispositifs d'entrée
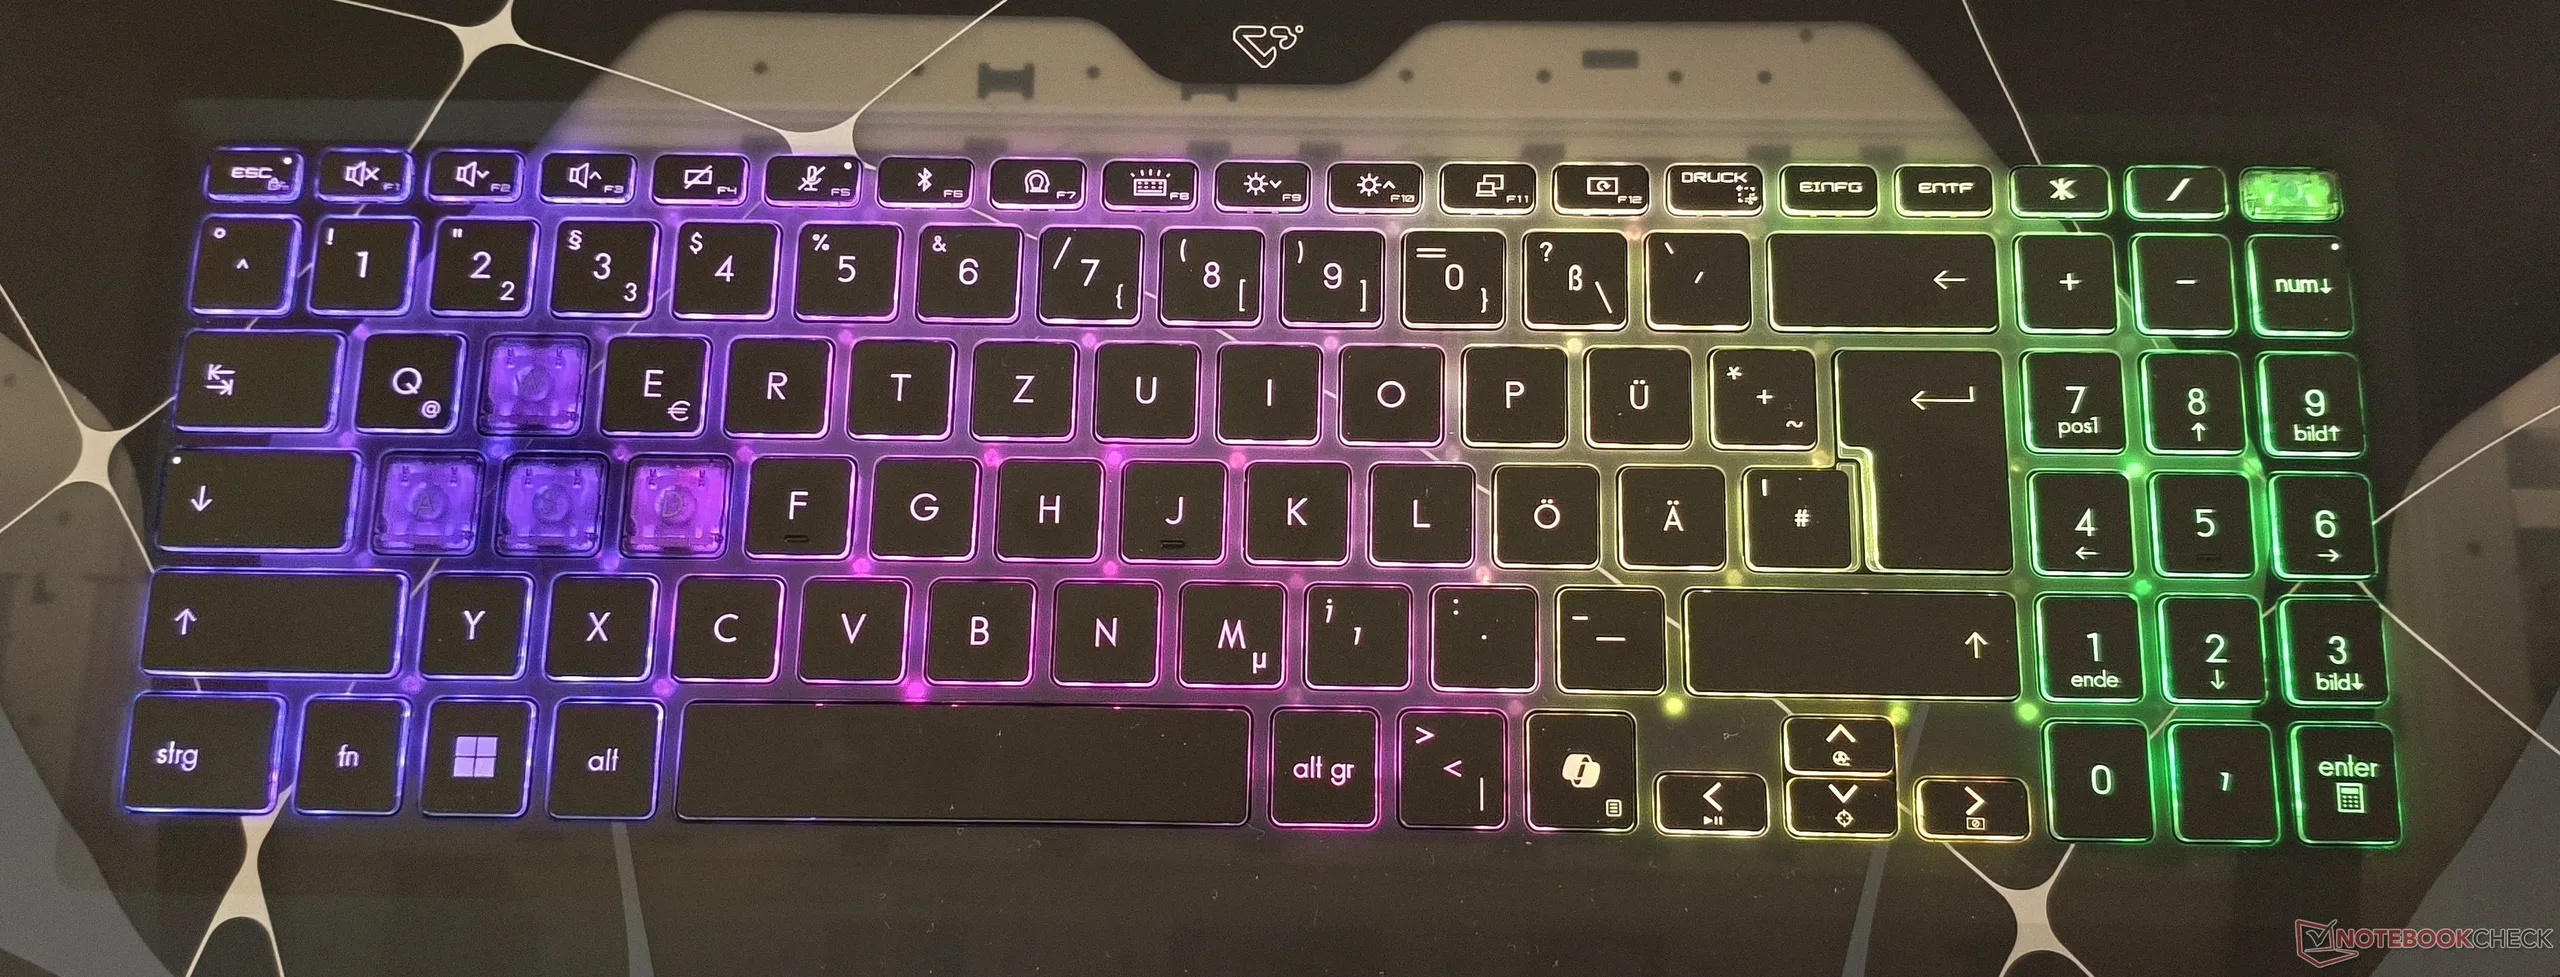
Les personnes qui ne sont pas habituées aux claviers MSI auront d'abord du mal avec la disposition. Cela commence par le pavé numérique, qui s'étend sur trois colonnes au lieu de quatre, bien qu'il y ait suffisamment d'espace. Les minuscules touches fléchies et la disposition partiellement non standard des touches ne facilitent pas non plus l'expérience de l'utilisateur. En revanche, la sensation de frappe est bonne. L'éclairage RGB puissant, qui peut être réglé en plusieurs étapes, a été particulièrement apprécié.
Le pavé tactile, qui mesure environ 12 x 7,5 cm, est de taille convenable pour un appareil de 17 pouces et offre de bonnes caractéristiques de glisse. MSI pourrait cependant améliorer la stabilité, car le mécanisme de clic a tendance à cliqueter et le côté gauche en particulier bénéficierait d'une construction plus ferme.
Affichage
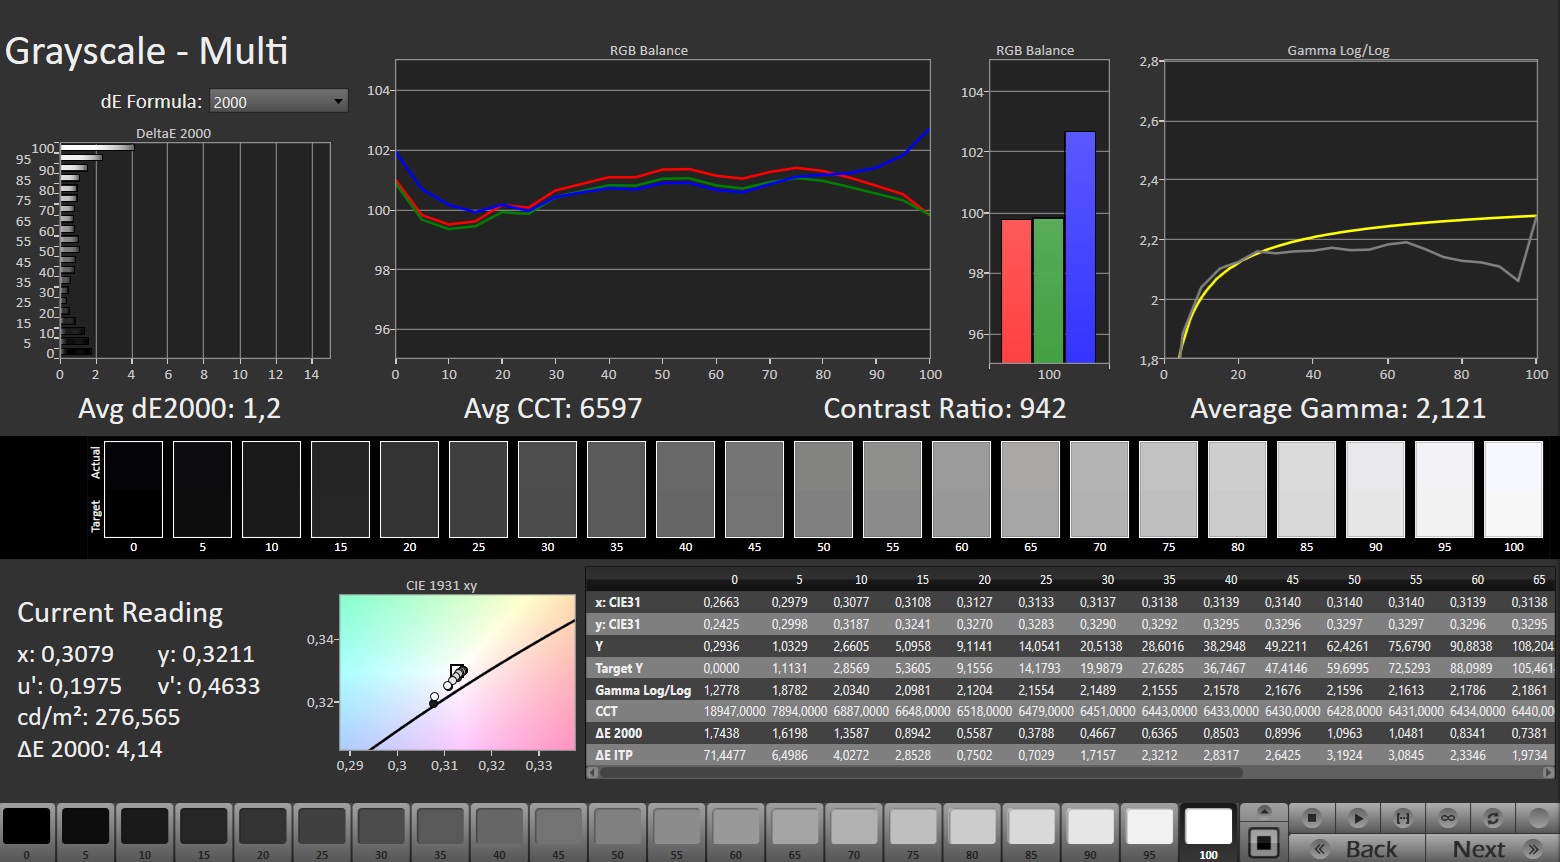
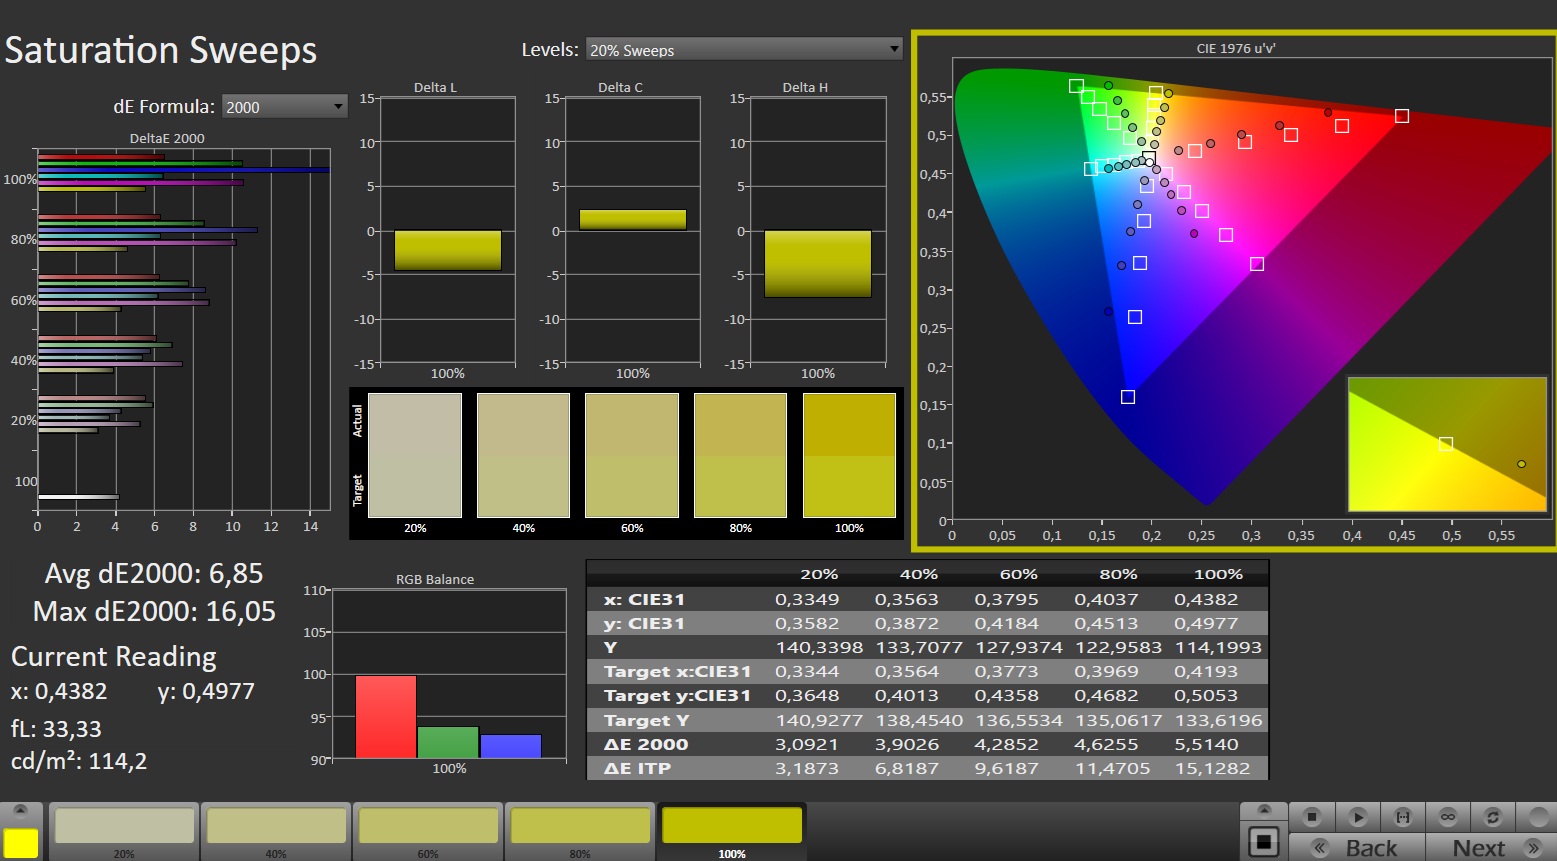
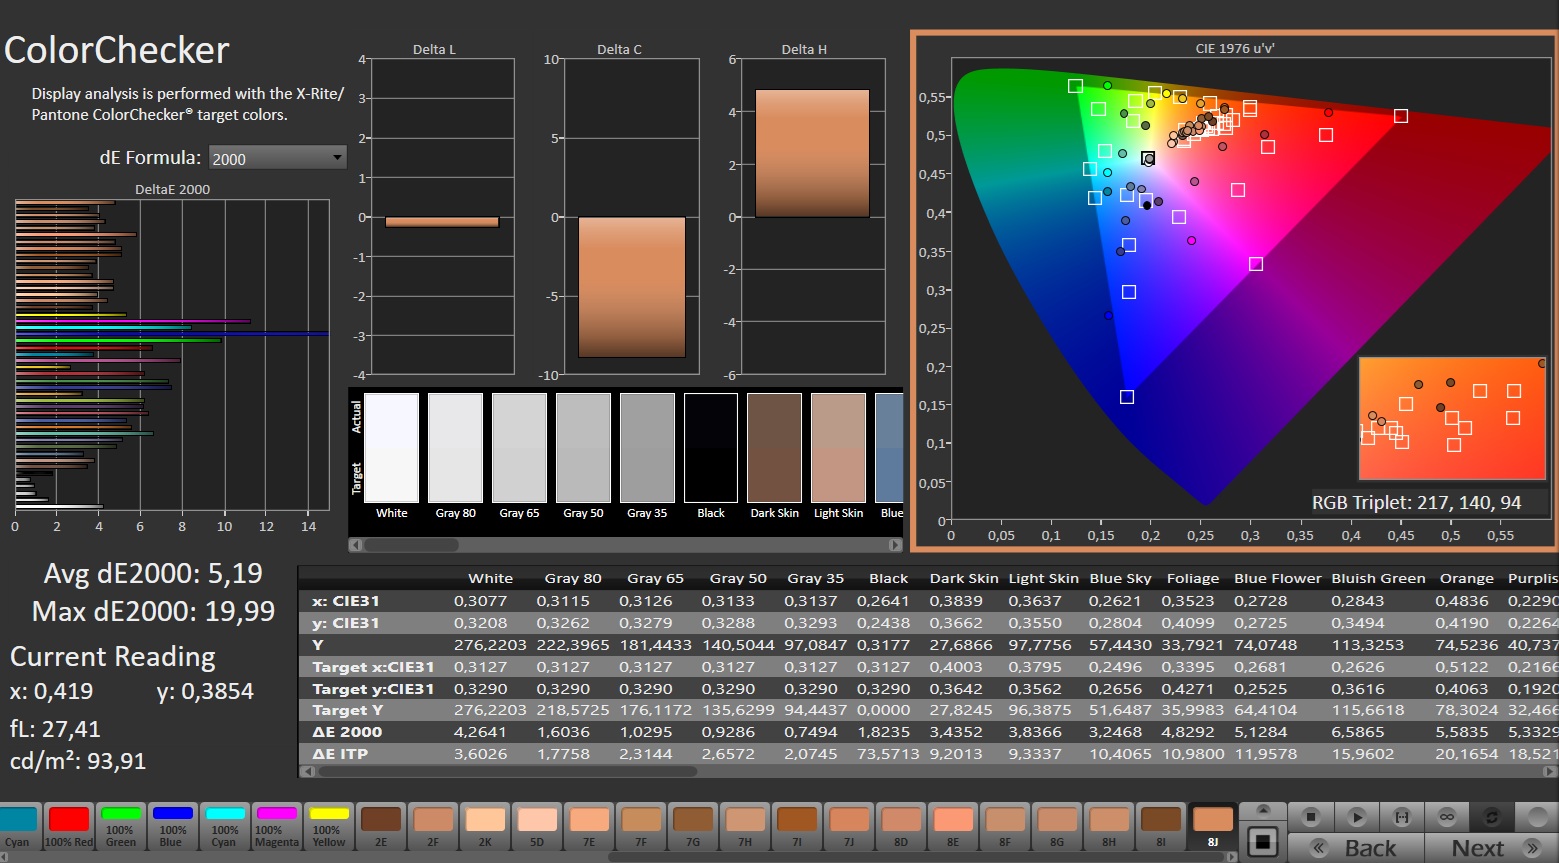
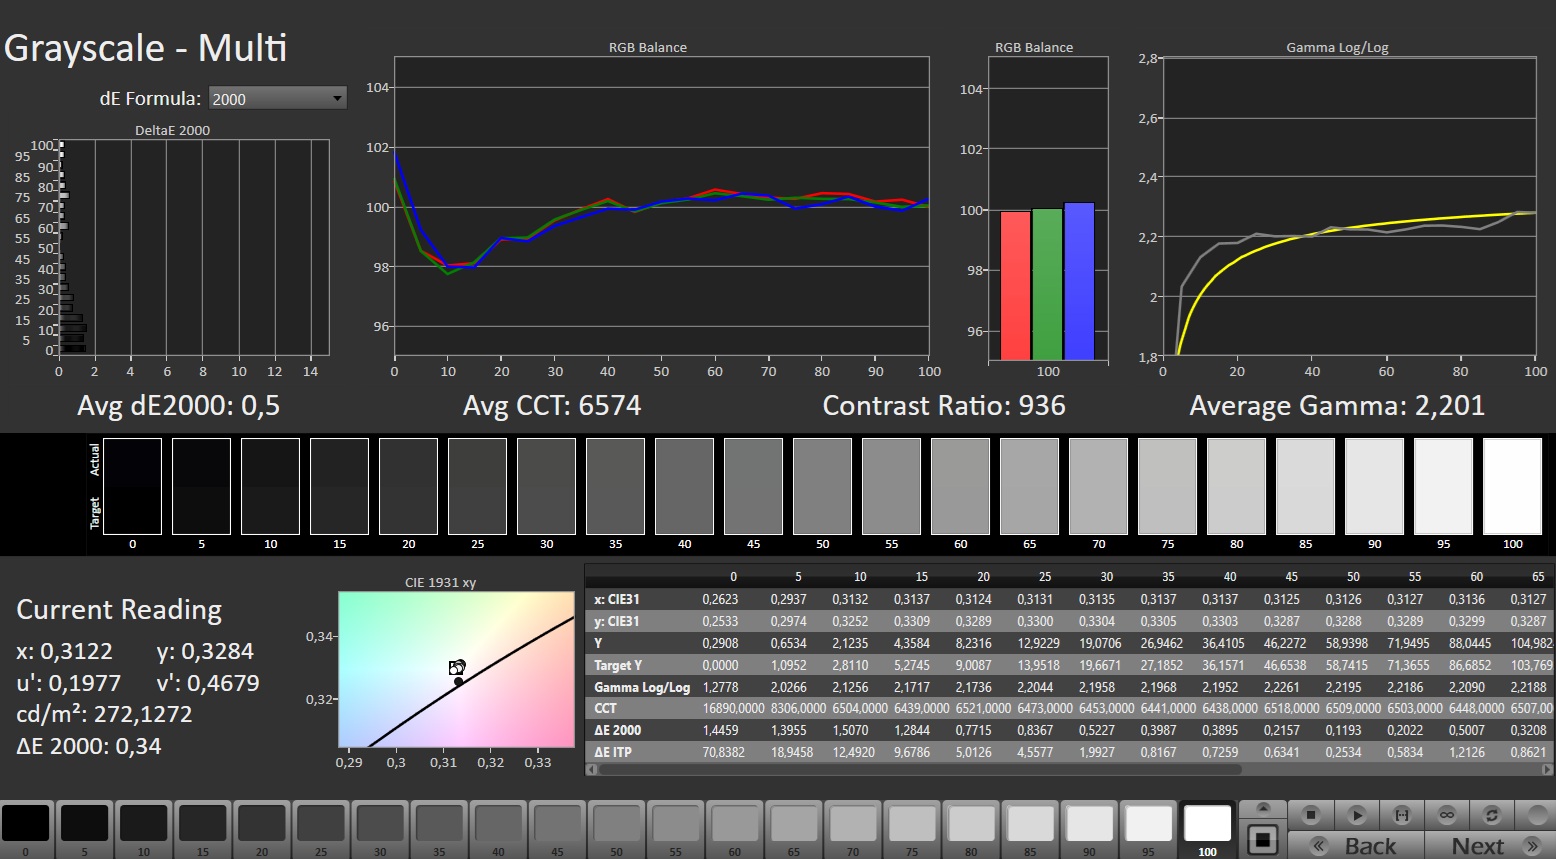
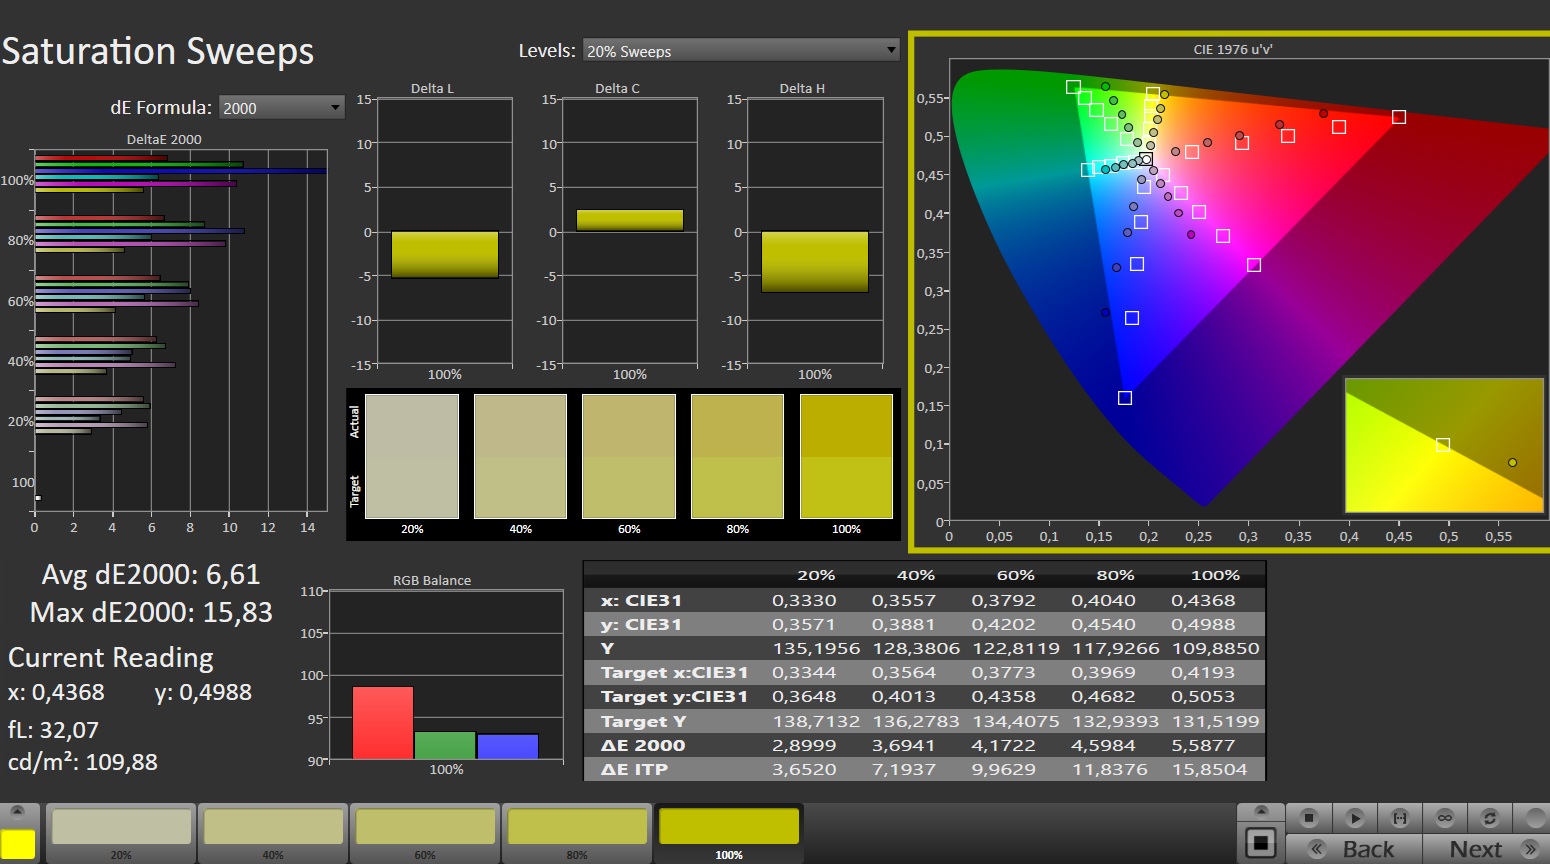
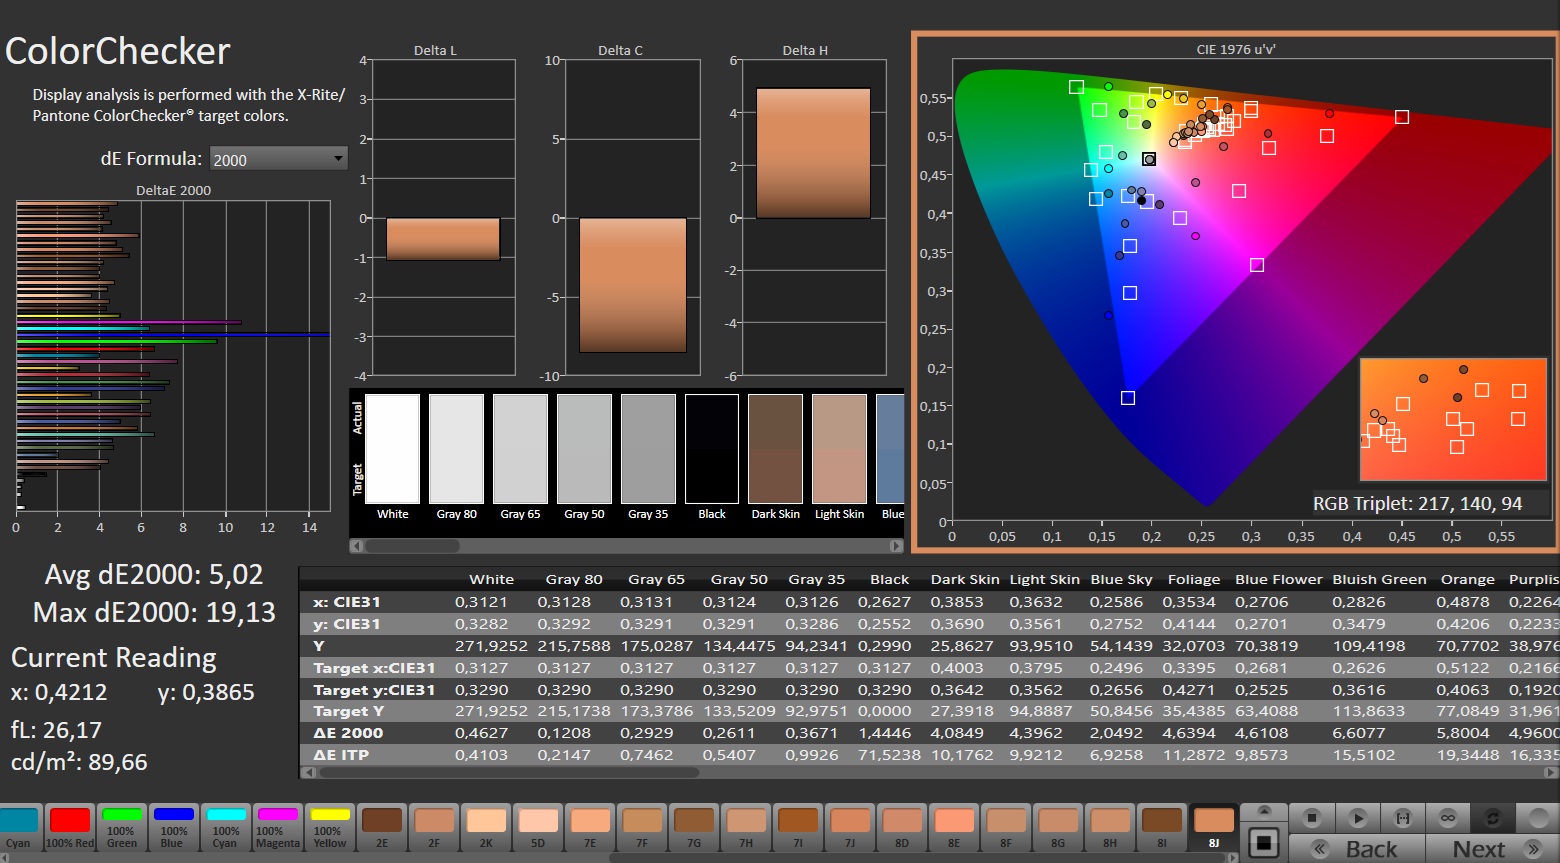
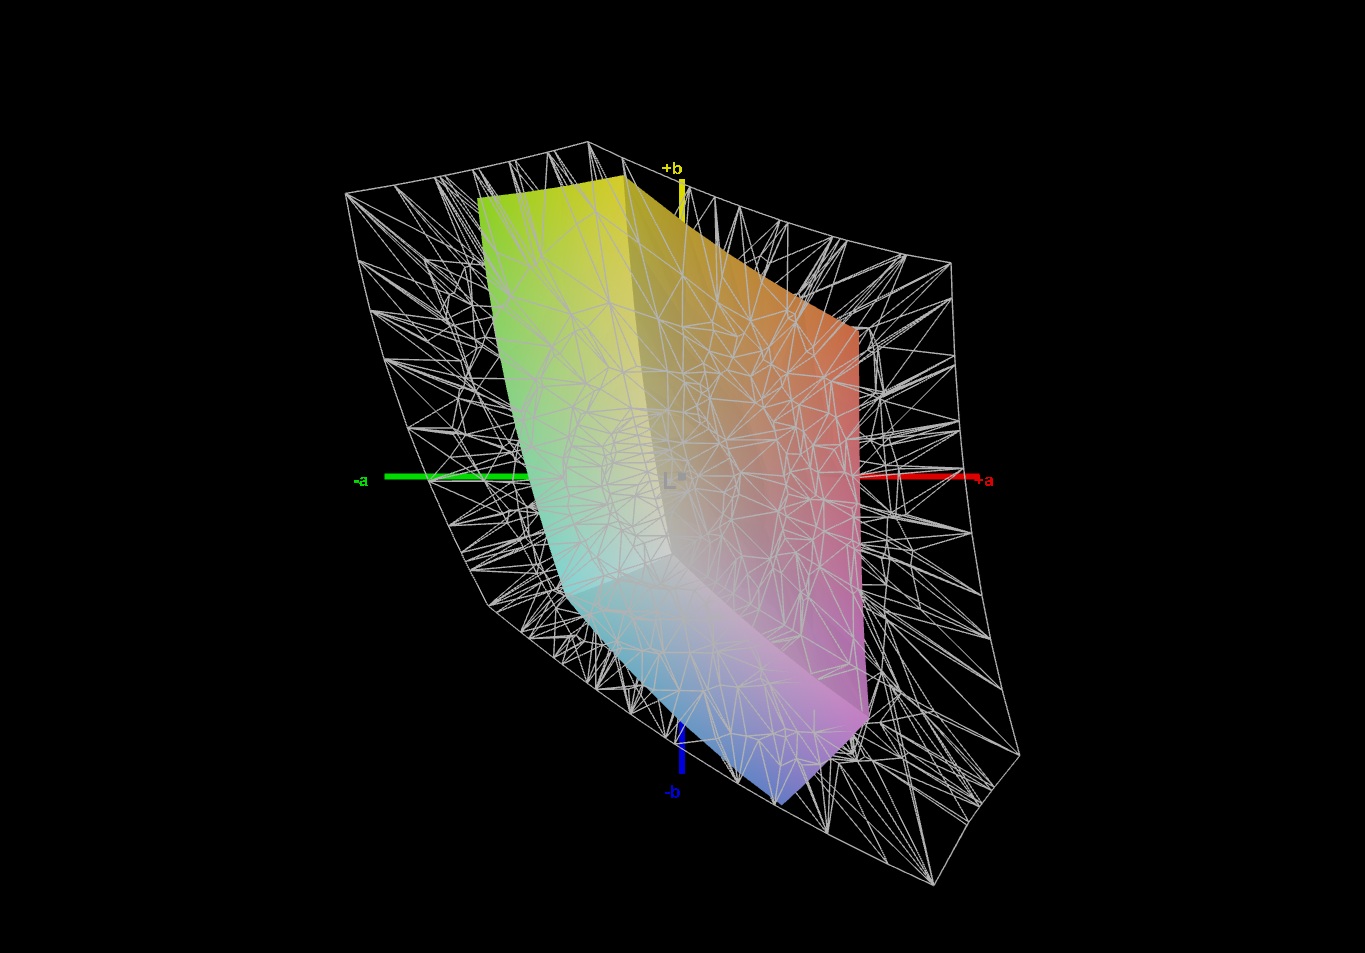
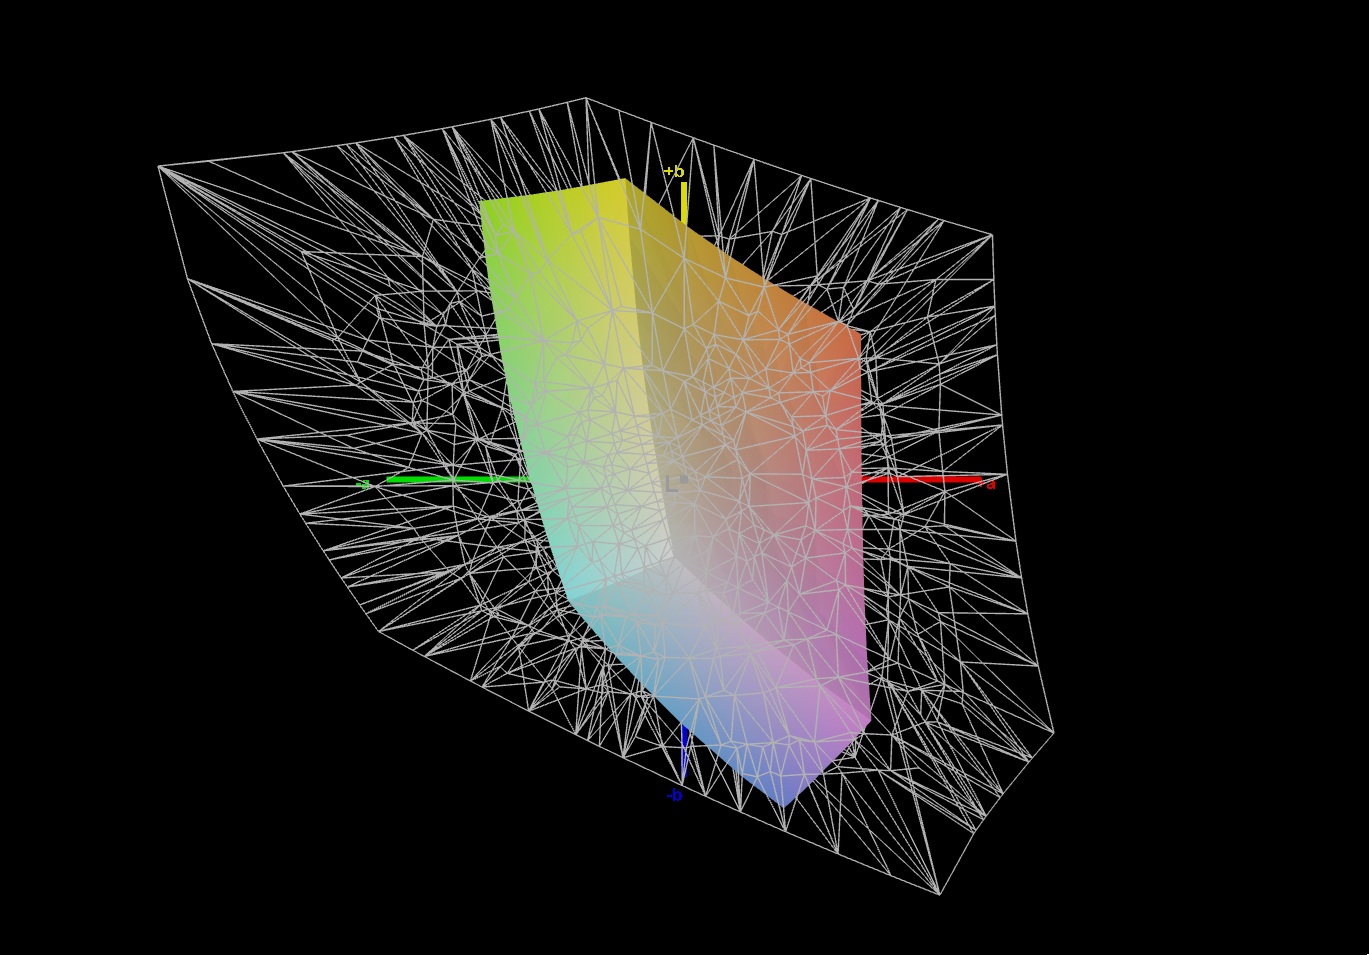
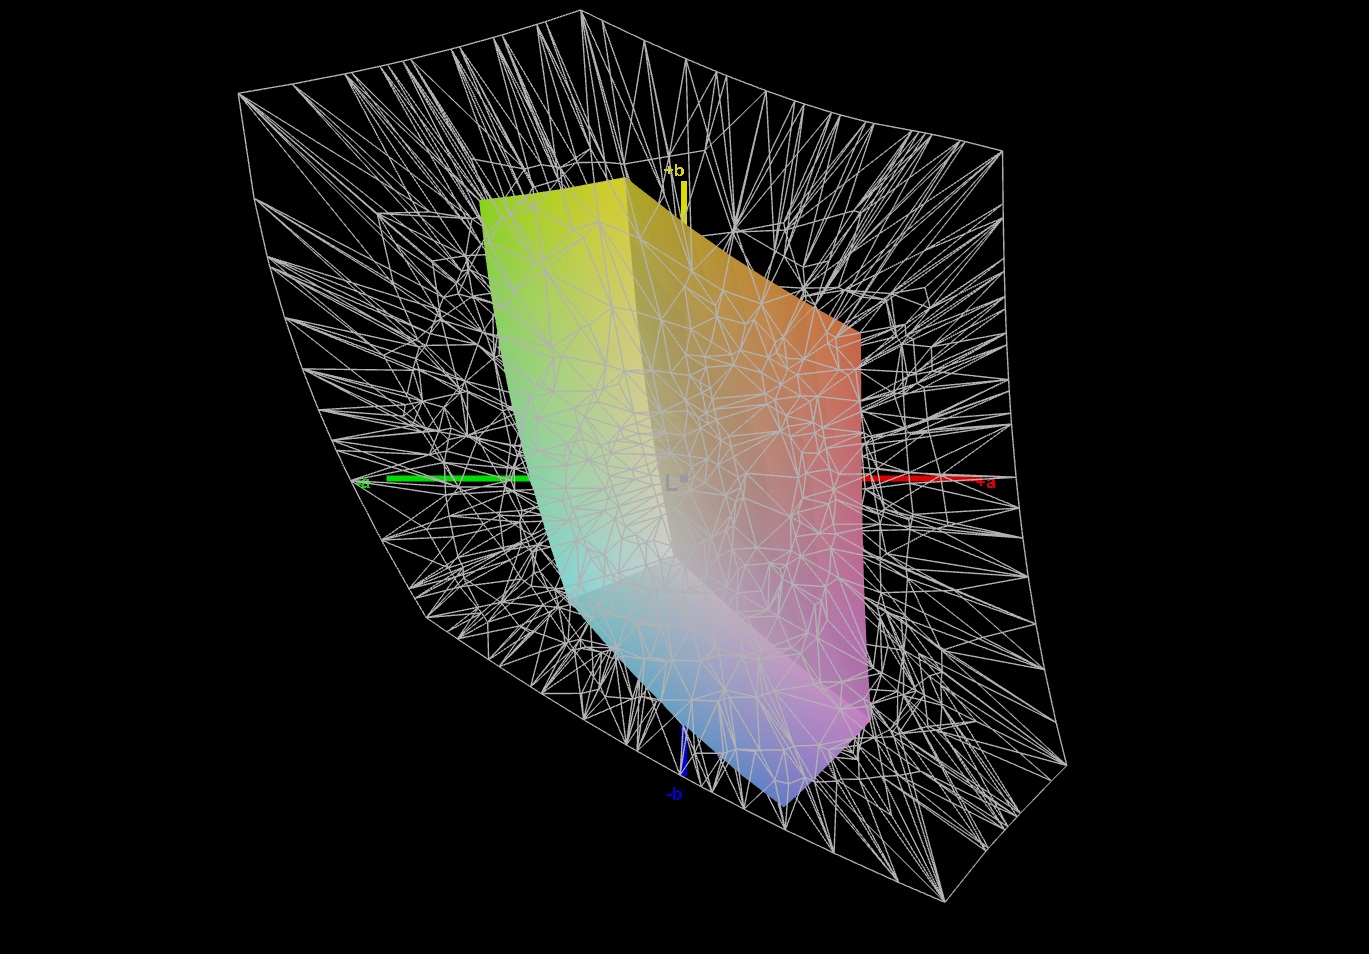
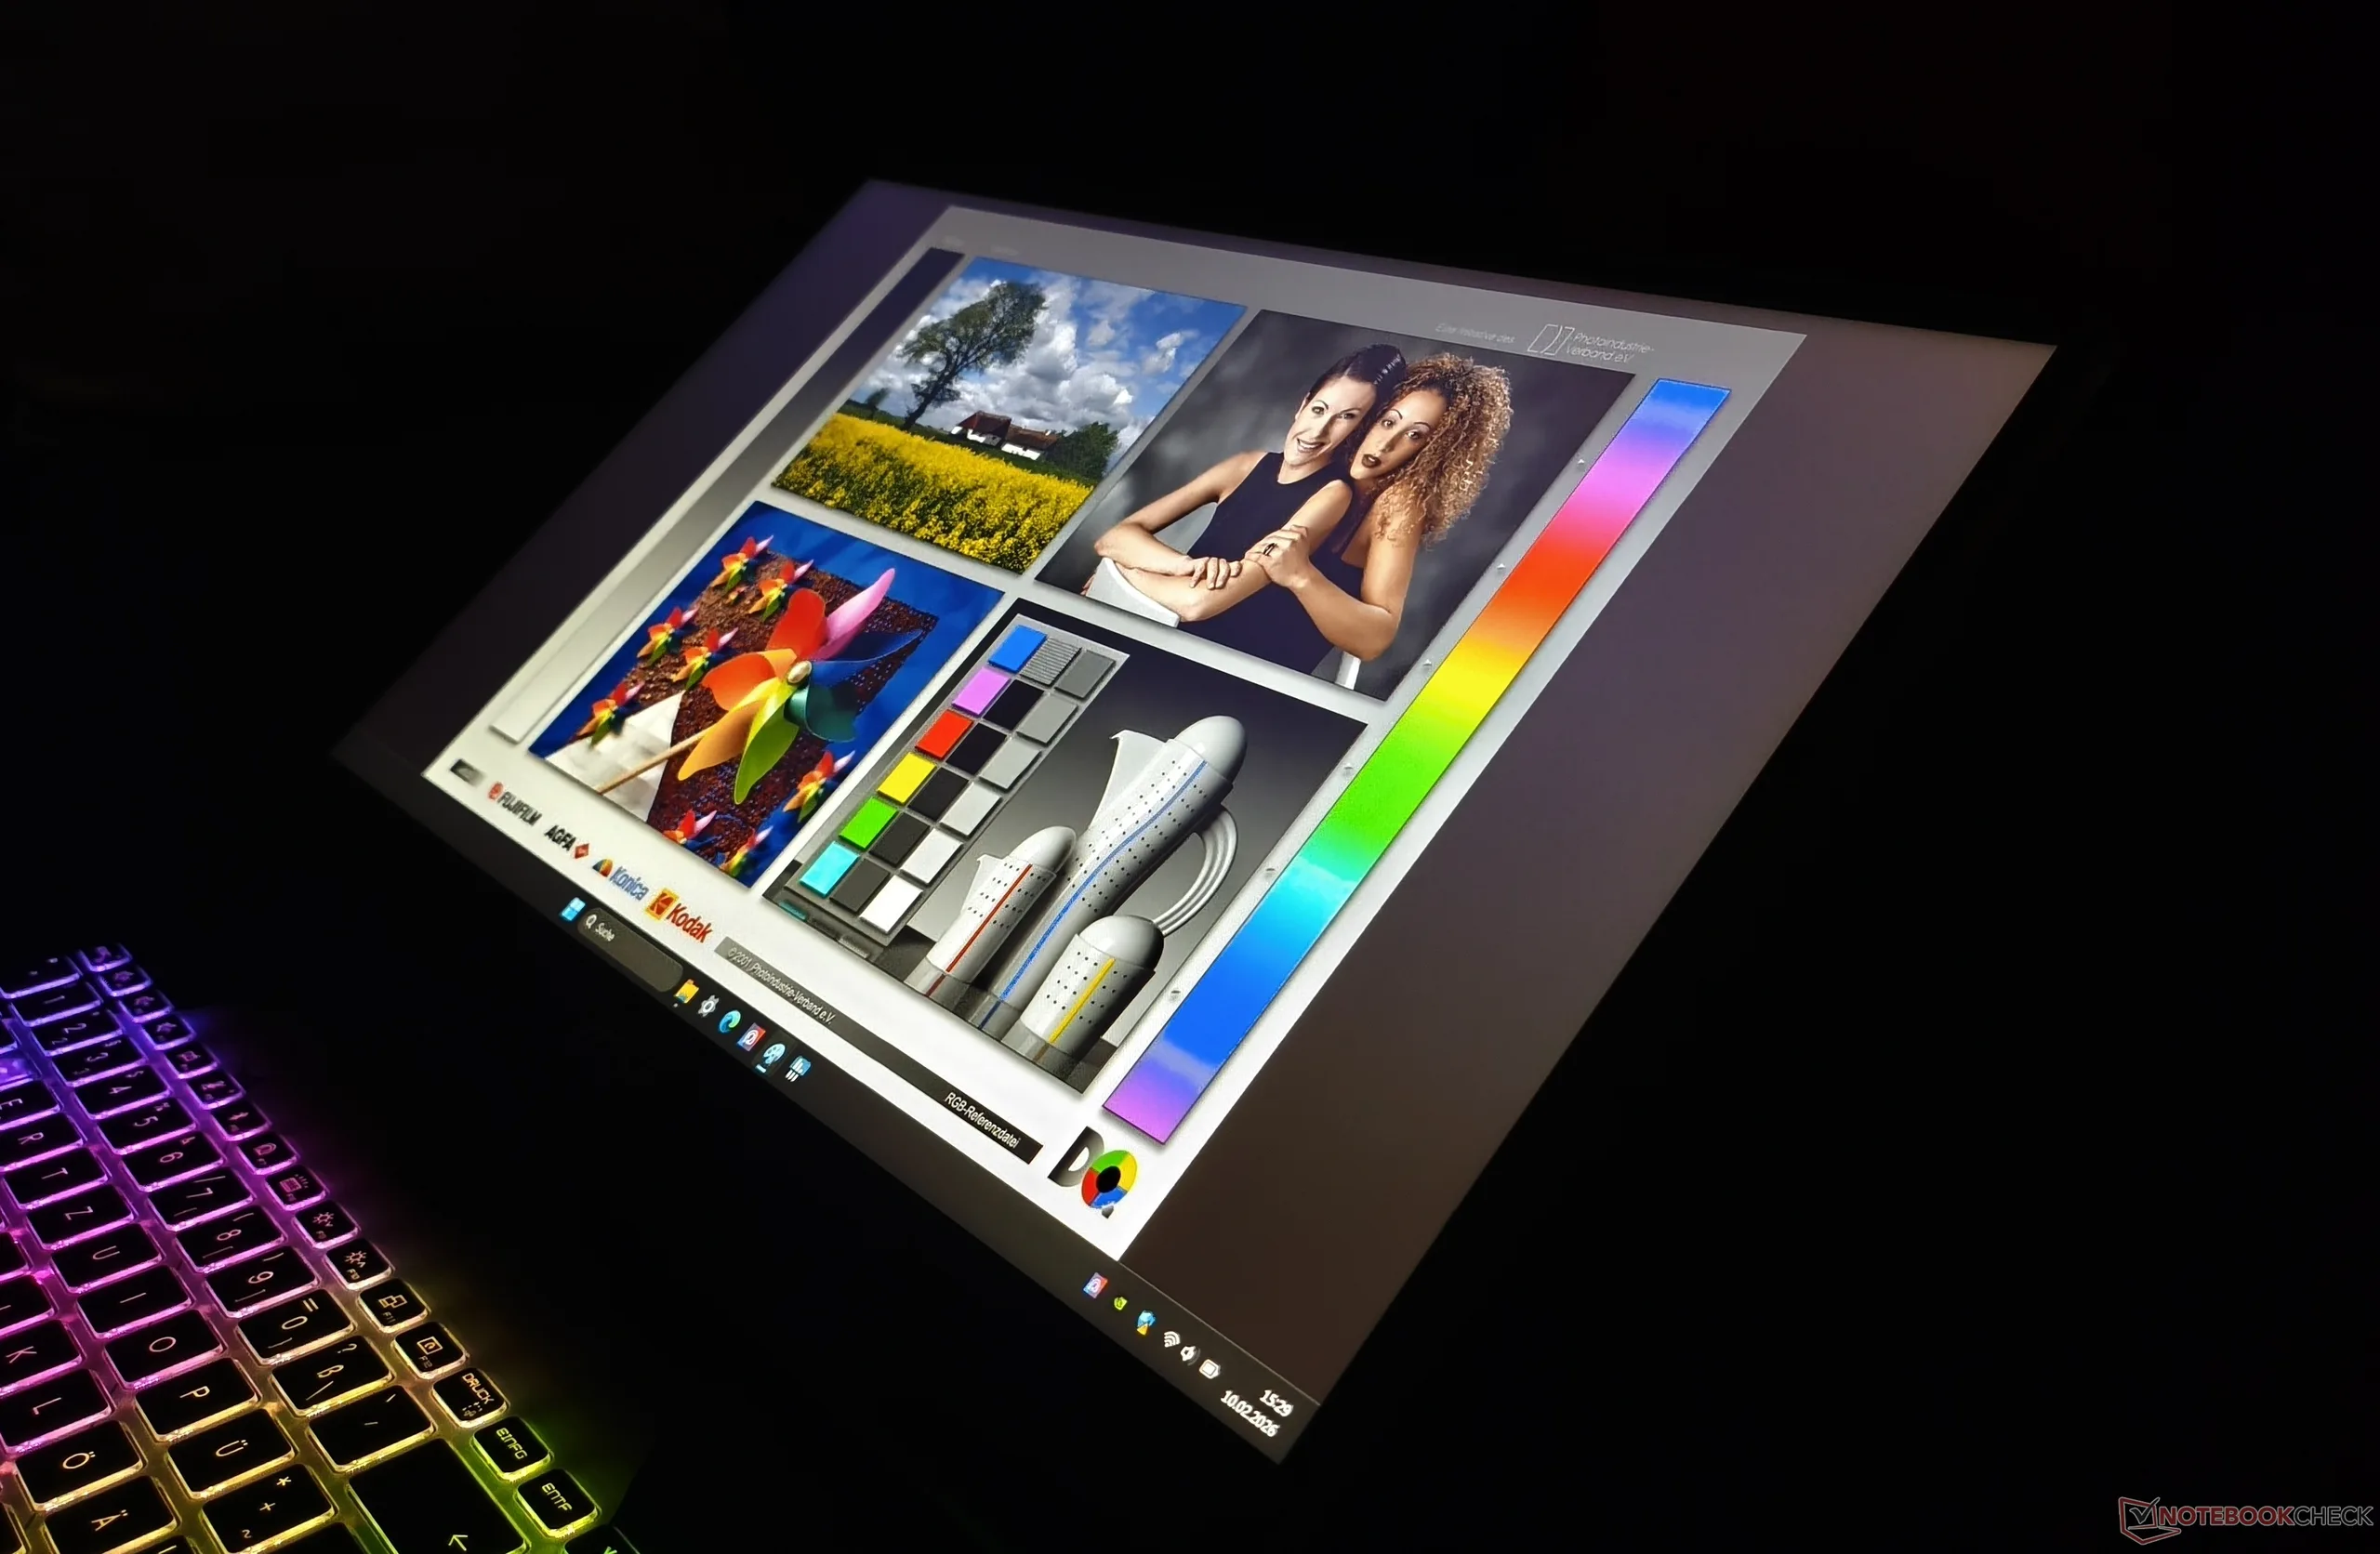
L'une des plus grandes faiblesses du Cyborg 17 est son écran modeste. Si le niveau de noir (un peu moins de 0,3 cd/m²) et le rapport de contraste (près de 1 000:1) laissent peu de place à la critique, la luminosité moyenne de 250 cd/m² ne convient qu'à une utilisation en intérieur. La couverture des couleurs est également en retrait par rapport à certains concurrents. Avec environ 50 % de sRGB, l'image semble plutôt délavée. Les angles de vision et les temps de réponse sont conformes aux performances IPS habituelles.
| |||||||||||||||||||||||||
Homogénéité de la luminosité: 85 %
Valeur mesurée au centre, sur batterie: 274 cd/m²
Contraste: 945:1 (Valeurs des noirs: 0.29 cd/m²)
ΔE ColorChecker Calman: 5.19 | ∀{0.5-29.43 Ø4.76}
calibrated: 5.02
ΔE Greyscale Calman: 1.2 | ∀{0.09-98 Ø5}
34.8% AdobeRGB 1998 (Argyll 3D)
50.7% sRGB (Argyll 3D)
33.7% Display P3 (Argyll 3D)
Gamma: 2.121
CCT: 6597 K
| MSI Cyborg 17 B13WFKG BOEhydis NV173FHM-NX4, IPS, 1920x1080, 17.3", 144 Hz | Acer Nitro V 16 AI ANV16-42-R860 B160UAN08.3 (AUO2CB8), IPS, 1920x1200, 16", 180 Hz | Alienware 16 Aurora BOE NE16N41, IPS, 2560x1600, 16", 120 Hz | HP Omen 16-ap0091ng AUODBB2, IPS, 1920x1200, 16", 144 Hz | Lenovo Legion 7 16IAX10 Samsung ATNA60HS01-0, OLED, 2560x1600, 16", 165 Hz | Gigabyte Gaming A16 GA6H NE160QDM-NYJ (BOE0C80), IPS, 2560x1600, 16", 165 Hz | |
|---|---|---|---|---|---|---|
| Display | 16% | 105% | 15% | 154% | 103% | |
| Display P3 Coverage (%) | 33.7 | 39.2 16% | 70.8 110% | 40 19% | 99.6 196% | 69.4 106% |
| sRGB Coverage (%) | 50.7 | 58.2 15% | 99.9 97% | 58.1 15% | 100 97% | 99.5 96% |
| AdobeRGB 1998 Coverage (%) | 34.8 | 40.5 16% | 72.1 107% | 38.7 11% | 93.5 169% | 71.6 106% |
| Response Times | 50% | -106% | -25% | 96% | 46% | |
| Response Time Grey 50% / Grey 80% * (ms) | 21.9 ? | 11.6 ? 47% | 49.5 ? -126% | 27.6 ? -26% | 0.6 ? 97% | 14.3 ? 35% |
| Response Time Black / White * (ms) | 15.8 ? | 7.4 ? 53% | 29.3 ? -85% | 19.4 ? -23% | 0.8 ? 95% | 7 ? 56% |
| PWM Frequency (Hz) | 1317 ? | |||||
| PWM Amplitude * (%) | 23 | |||||
| Screen | -29% | 6% | 7% | 57% | -16% | |
| Brightness middle (cd/m²) | 274 | 384 40% | 345.3 26% | 328 20% | 477.6 74% | 432 58% |
| Brightness (cd/m²) | 252 | 372 48% | 324 29% | 313 24% | 483 92% | 425 69% |
| Brightness Distribution (%) | 85 | 92 8% | 88 4% | 91 7% | 95 12% | 91 7% |
| Black Level * (cd/m²) | 0.29 | 0.36 -24% | 0.23 21% | 0.26 10% | 0.37 -28% | |
| Contrast (:1) | 945 | 1067 13% | 1501 59% | 1262 34% | 1168 24% | |
| Colorchecker dE 2000 * | 5.19 | 5.82 -12% | 3.22 38% | 4.73 9% | 3.11 40% | 4.76 8% |
| Colorchecker dE 2000 max. * | 19.99 | 20.34 -2% | 5.68 72% | 17.47 13% | 5.99 70% | 8.59 57% |
| Colorchecker dE 2000 calibrated * | 5.02 | 3.95 21% | 0.93 81% | 4.22 16% | 0.79 84% | 1.18 76% |
| Greyscale dE 2000 * | 1.2 | 5.4 -350% | 4.5 -275% | 2.05 -71% | 0.9 25% | 6.2 -417% |
| Gamma | 2.121 104% | 2.174 101% | 2.1 105% | 2.63 84% | 2.18 101% | 2.079 106% |
| CCT | 6597 99% | 6067 107% | 7041 92% | 6718 97% | 6405 101% | 6690 97% |
| Moyenne finale (programmes/paramètres) | 12% /
-8% | 2% /
11% | -1% /
4% | 102% /
88% | 44% /
18% |
* ... Moindre est la valeur, meilleures sont les performances
Temps de réponse de l'écran
| ↔ Temps de réponse noir à blanc | ||
|---|---|---|
| 15.8 ms ... hausse ↗ et chute ↘ combinées | ↗ 8 ms hausse | 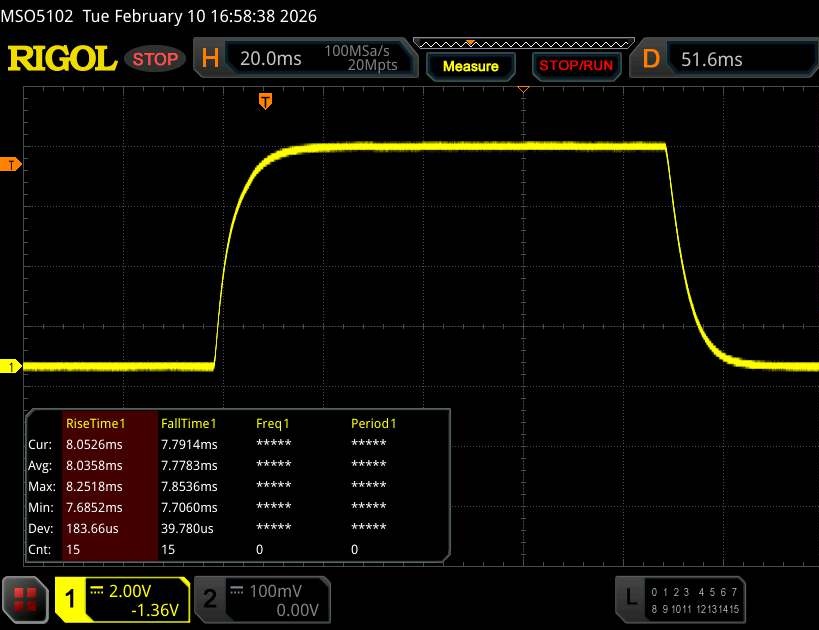 |
| ↘ 7.8 ms chute | ||
| L'écran montre de bons temps de réponse, mais insuffisant pour du jeu compétitif. En comparaison, tous les appareils testés affichent entre 0.1 (minimum) et 240 (maximum) ms. » 36 % des appareils testés affichent de meilleures performances. Cela signifie que les latences relevées sont meilleures que la moyenne (20.1 ms) de tous les appareils testés. | ||
| ↔ Temps de réponse gris 50% à gris 80% | ||
| 21.9 ms ... hausse ↗ et chute ↘ combinées | ↗ 10.4 ms hausse | 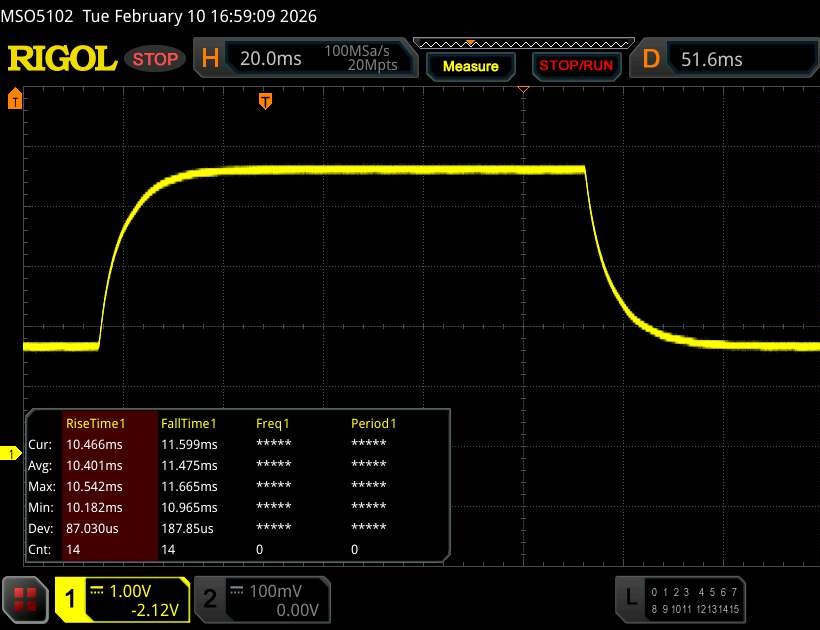 |
| ↘ 11.5 ms chute | ||
| L'écran montre de bons temps de réponse, mais insuffisant pour du jeu compétitif. En comparaison, tous les appareils testés affichent entre 0.165 (minimum) et 636 (maximum) ms. » 33 % des appareils testés affichent de meilleures performances. Cela signifie que les latences relevées sont meilleures que la moyenne (31.4 ms) de tous les appareils testés. | ||
Scintillement / MLI (Modulation de largeur d'impulsion)
| Scintillement / MLI (Modulation de largeur d'impulsion) non décelé | 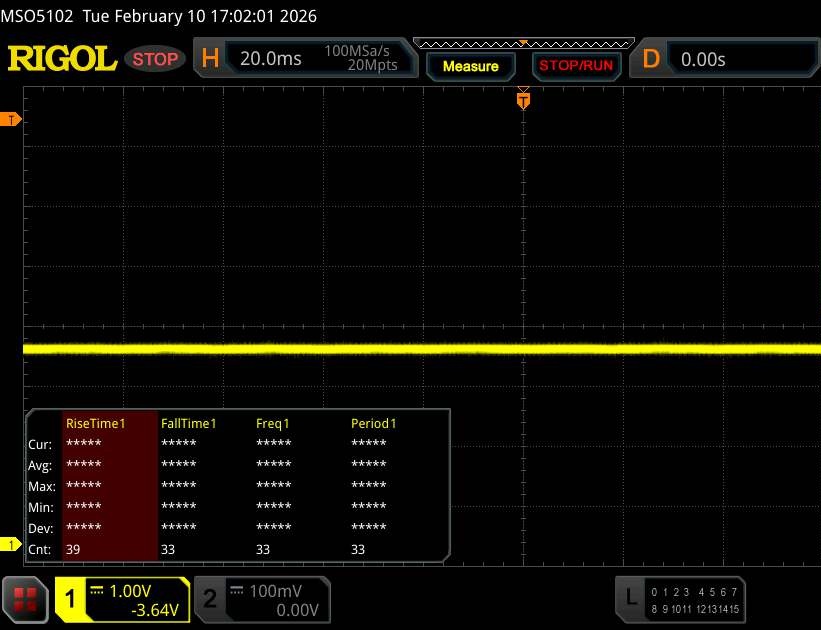 | ||
En comparaison, 53 % des appareils testés n'emploient pas MDI pour assombrir leur écran. Nous avons relevé une moyenne à 8013 (minimum : 5 - maximum : 343500) Hz dans le cas où une MDI était active. | |||
Performance
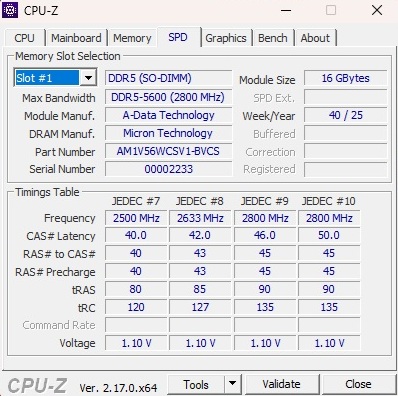
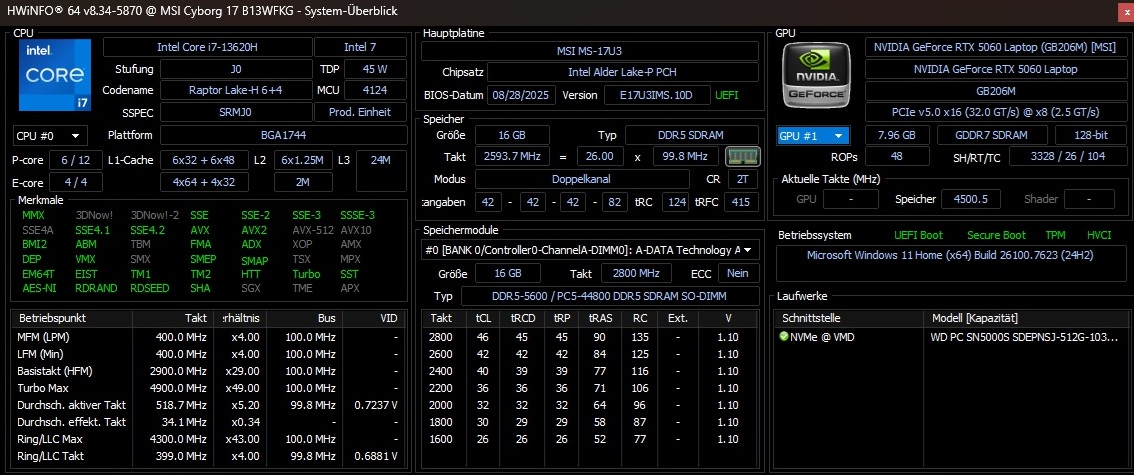
Les performances du Cyborg 17 le placent dans le segment inférieur du milieu de gamme. Avec 16 Go de RAM DDR5, le système est encore suffisamment équipé pour jouer en 2026. Cependant, le SSD de 512 Go peut rapidement devenir un facteur limitant, car de nombreux titres modernes dépassent facilement les 100 Go.
Conditions d'essai
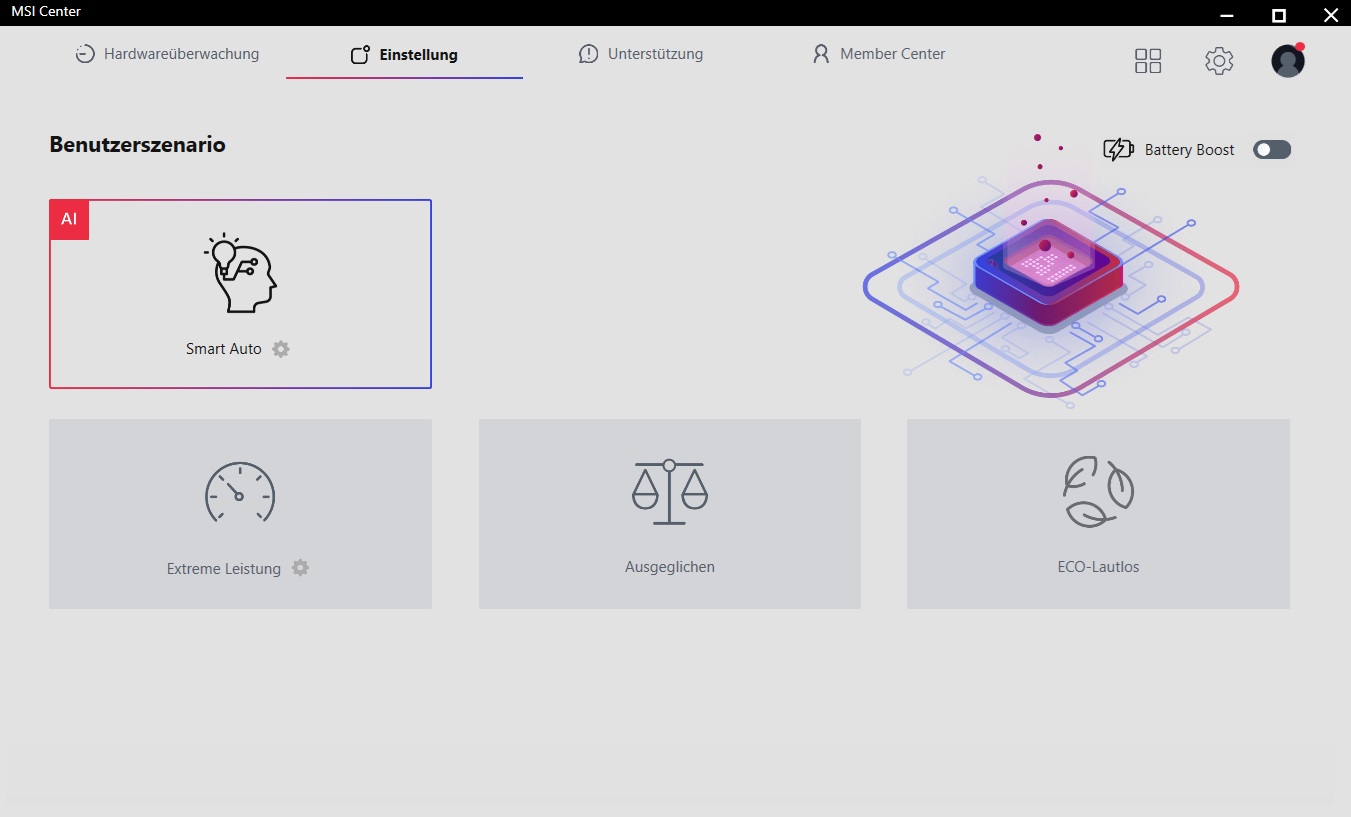
Toutes nos mesures ont été effectuées en mode AI "Smart Auto" qui, en termes de performances CPU, est comparable au profil "Extreme Performance". A partir du mode "Balanced", les performances du GPU sont sensiblement identiques (voir tableau).

| Mode | Smart Auto | Extreme performance | Balanced | ECO Silent |
| Cyberpunk 2077 Bruit | 48 dB(A) | 49 dB(A) | 48 dB(A) | 35 dB(A) |
| Taux de rafraîchissement de Cyberpunk 2077 (FHD/Ultra) | 68,1 fps | 69,1 fps | 68 fps | 30 fps |
| Consommation du GPU | ~55 W | ~55 W | ~55 W | ~25 W |
| CPU PL1 | 45 W | 45 W | 35 W | 15 W |
| CPU PL2 | 45 W | 45 W | 35 W | 15 W |
| Cinebench R15 Multi Score | 1798 Points | 1802 Points | 1582 Points | 765 Points |
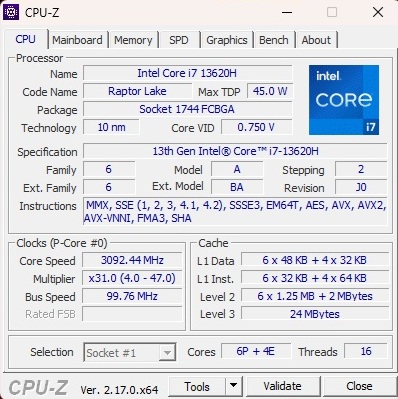
Processeur
Le Core i7-13620H n'est plus un processeur particulièrement nouveau de la génération Raptor Lake d'Intel. Il offre six cœurs de performance et quatre cœurs d'efficacité, supportant au total jusqu'à seize threads. Dans les benchmarks CPU, le modèle 10 nm ne parvient pas à exploiter pleinement son potentiel et se retrouve environ seize pour cent en dessous de la moyenne précédemment établie pour ce CPU. En revanche, les résultats de la boucle Cinebench sont restés largement constants. Malgré cela, les processeurs des appareils concurrents sont globalement plus rapides.
Test d'endurance multicœur Cinebench R15
* ... Moindre est la valeur, meilleures sont les performances
AIDA64: FP32 Ray-Trace | FPU Julia | CPU SHA3 | CPU Queen | FPU SinJulia | FPU Mandel | CPU AES | CPU ZLib | FP64 Ray-Trace | CPU PhotoWorxx
| Performance rating | |
| HP Omen 16-ap0091ng | |
| Lenovo Legion 7 16IAX10 | |
| Moyenne de la classe Gaming | |
| Acer Nitro V 16 AI ANV16-42-R860 | |
| Alienware 16 Aurora | |
| Moyenne Intel Core i7-13620H | |
| Gigabyte Gaming A16 GA6H | |
| MSI Cyborg 17 B13WFKG | |
| AIDA64 / FP32 Ray-Trace | |
| HP Omen 16-ap0091ng (v6.92.6600) | |
| Moyenne de la classe Gaming (7192 - 85542, n=133, 2 dernières années) | |
| Lenovo Legion 7 16IAX10 (v6.92.6600) | |
| Acer Nitro V 16 AI ANV16-42-R860 (v6.92.6600) | |
| Alienware 16 Aurora (v6.92.6600) | |
| Gigabyte Gaming A16 GA6H (v6.92.6600) | |
| Moyenne Intel Core i7-13620H (10779 - 13601, n=7) | |
| MSI Cyborg 17 B13WFKG (v6.92.6600) | |
| AIDA64 / FPU Julia | |
| HP Omen 16-ap0091ng (v6.92.6600) | |
| Lenovo Legion 7 16IAX10 (v6.92.6600) | |
| Moyenne de la classe Gaming (35040 - 238426, n=133, 2 dernières années) | |
| Acer Nitro V 16 AI ANV16-42-R860 (v6.92.6600) | |
| Alienware 16 Aurora (v6.92.6600) | |
| Gigabyte Gaming A16 GA6H (v6.92.6600) | |
| Moyenne Intel Core i7-13620H (54287 - 67187, n=7) | |
| MSI Cyborg 17 B13WFKG (v6.92.6600) | |
| AIDA64 / CPU SHA3 | |
| HP Omen 16-ap0091ng (v6.92.6600) | |
| Lenovo Legion 7 16IAX10 (v6.92.6600) | |
| Moyenne de la classe Gaming (1728 - 9817, n=133, 2 dernières années) | |
| Acer Nitro V 16 AI ANV16-42-R860 (v6.92.6600) | |
| Alienware 16 Aurora (v6.92.6600) | |
| Gigabyte Gaming A16 GA6H (v6.92.6600) | |
| Moyenne Intel Core i7-13620H (2327 - 2773, n=7) | |
| MSI Cyborg 17 B13WFKG (v6.92.6600) | |
| AIDA64 / CPU Queen | |
| HP Omen 16-ap0091ng (v6.92.6600) | |
| Lenovo Legion 7 16IAX10 (v6.92.6600) | |
| Moyenne de la classe Gaming (49785 - 173351, n=133, 2 dernières années) | |
| Acer Nitro V 16 AI ANV16-42-R860 (v6.92.6600) | |
| Alienware 16 Aurora (v6.92.6600) | |
| Gigabyte Gaming A16 GA6H (v6.92.6600) | |
| Moyenne Intel Core i7-13620H (66885 - 78867, n=7) | |
| MSI Cyborg 17 B13WFKG (v6.92.6600) | |
| AIDA64 / FPU SinJulia | |
| HP Omen 16-ap0091ng (v6.92.6600) | |
| Moyenne de la classe Gaming (4424 - 33636, n=133, 2 dernières années) | |
| Lenovo Legion 7 16IAX10 (v6.92.6600) | |
| Acer Nitro V 16 AI ANV16-42-R860 (v6.92.6600) | |
| Alienware 16 Aurora (v6.92.6600) | |
| Gigabyte Gaming A16 GA6H (v6.92.6600) | |
| Moyenne Intel Core i7-13620H (6737 - 8421, n=7) | |
| MSI Cyborg 17 B13WFKG (v6.92.6600) | |
| AIDA64 / FPU Mandel | |
| HP Omen 16-ap0091ng (v6.92.6600) | |
| Lenovo Legion 7 16IAX10 (v6.92.6600) | |
| Moyenne de la classe Gaming (17585 - 128721, n=133, 2 dernières années) | |
| Acer Nitro V 16 AI ANV16-42-R860 (v6.92.6600) | |
| Alienware 16 Aurora (v6.92.6600) | |
| Gigabyte Gaming A16 GA6H (v6.92.6600) | |
| Moyenne Intel Core i7-13620H (27242 - 32787, n=7) | |
| MSI Cyborg 17 B13WFKG (v6.92.6600) | |
| AIDA64 / CPU AES | |
| HP Omen 16-ap0091ng (v6.92.6600) | |
| Lenovo Legion 7 16IAX10 (v6.92.6600) | |
| Moyenne de la classe Gaming (19065 - 247074, n=133, 2 dernières années) | |
| Acer Nitro V 16 AI ANV16-42-R860 (v6.92.6600) | |
| Alienware 16 Aurora (v6.92.6600) | |
| Moyenne Intel Core i7-13620H (48646 - 85895, n=7) | |
| Gigabyte Gaming A16 GA6H (v6.92.6600) | |
| MSI Cyborg 17 B13WFKG (v6.92.6600) | |
| AIDA64 / CPU ZLib | |
| Lenovo Legion 7 16IAX10 (v6.92.6600) | |
| HP Omen 16-ap0091ng (v6.92.6600) | |
| Moyenne de la classe Gaming (373 - 2531, n=133, 2 dernières années) | |
| Alienware 16 Aurora (v6.92.6600) | |
| Acer Nitro V 16 AI ANV16-42-R860 (v6.92.6600) | |
| Gigabyte Gaming A16 GA6H (v6.92.6600) | |
| Moyenne Intel Core i7-13620H (688 - 835, n=7) | |
| MSI Cyborg 17 B13WFKG (v6.92.6600) | |
| AIDA64 / FP64 Ray-Trace | |
| HP Omen 16-ap0091ng (v6.92.6600) | |
| Lenovo Legion 7 16IAX10 (v6.92.6600) | |
| Moyenne de la classe Gaming (3856 - 45446, n=133, 2 dernières années) | |
| Acer Nitro V 16 AI ANV16-42-R860 (v6.92.6600) | |
| Alienware 16 Aurora (v6.92.6600) | |
| Gigabyte Gaming A16 GA6H (v6.92.6600) | |
| Moyenne Intel Core i7-13620H (5919 - 7364, n=7) | |
| MSI Cyborg 17 B13WFKG (v6.92.6600) | |
| AIDA64 / CPU PhotoWorxx | |
| Lenovo Legion 7 16IAX10 (v6.92.6600) | |
| Moyenne de la classe Gaming (10805 - 62916, n=133, 2 dernières années) | |
| Alienware 16 Aurora (v6.92.6600) | |
| Acer Nitro V 16 AI ANV16-42-R860 (v6.92.6600) | |
| Moyenne Intel Core i7-13620H (19421 - 34544, n=7) | |
| MSI Cyborg 17 B13WFKG (v6.92.6600) | |
| Gigabyte Gaming A16 GA6H (v6.92.6600) | |
| HP Omen 16-ap0091ng (v6.92.6600) | |
Performance du système
En termes de performances globales du système, le Cyborg 17 réussit au moins à ne pas finir dernier, se plaçant juste devant l'Acer Nitro V 16 dans notre champ de comparaison.
PCMark 10: Score | Essentials | Productivity | Digital Content Creation
CrossMark: Overall | Productivity | Creativity | Responsiveness
WebXPRT 3: Overall
WebXPRT 4: Overall
Mozilla Kraken 1.1: Total
| Performance rating | |
| Lenovo Legion 7 16IAX10 | |
| Moyenne de la classe Gaming | |
| HP Omen 16-ap0091ng | |
| Alienware 16 Aurora -4! | |
| Gigabyte Gaming A16 GA6H | |
| MSI Cyborg 17 B13WFKG | |
| Moyenne Intel Core i7-13620H, NVIDIA GeForce RTX 5060 Laptop | |
| Acer Nitro V 16 AI ANV16-42-R860 | |
| PCMark 10 / Score | |
| Moyenne de la classe Gaming (5776 - 10060, n=113, 2 dernières années) | |
| HP Omen 16-ap0091ng | |
| MSI Cyborg 17 B13WFKG | |
| Moyenne Intel Core i7-13620H, NVIDIA GeForce RTX 5060 Laptop (n=1) | |
| Lenovo Legion 7 16IAX10 | |
| Acer Nitro V 16 AI ANV16-42-R860 | |
| Gigabyte Gaming A16 GA6H | |
| PCMark 10 / Essentials | |
| Lenovo Legion 7 16IAX10 | |
| Moyenne de la classe Gaming (8810 - 12600, n=117, 2 dernières années) | |
| HP Omen 16-ap0091ng | |
| Gigabyte Gaming A16 GA6H | |
| Acer Nitro V 16 AI ANV16-42-R860 | |
| MSI Cyborg 17 B13WFKG | |
| Moyenne Intel Core i7-13620H, NVIDIA GeForce RTX 5060 Laptop (n=1) | |
| PCMark 10 / Productivity | |
| MSI Cyborg 17 B13WFKG | |
| Moyenne Intel Core i7-13620H, NVIDIA GeForce RTX 5060 Laptop (n=1) | |
| Lenovo Legion 7 16IAX10 | |
| Moyenne de la classe Gaming (6662 - 16716, n=115, 2 dernières années) | |
| HP Omen 16-ap0091ng | |
| Acer Nitro V 16 AI ANV16-42-R860 | |
| Gigabyte Gaming A16 GA6H | |
| PCMark 10 / Digital Content Creation | |
| Moyenne de la classe Gaming (7440 - 19351, n=115, 2 dernières années) | |
| HP Omen 16-ap0091ng | |
| Gigabyte Gaming A16 GA6H | |
| MSI Cyborg 17 B13WFKG | |
| Moyenne Intel Core i7-13620H, NVIDIA GeForce RTX 5060 Laptop (n=1) | |
| Lenovo Legion 7 16IAX10 | |
| Acer Nitro V 16 AI ANV16-42-R860 | |
| CrossMark / Overall | |
| Lenovo Legion 7 16IAX10 | |
| Alienware 16 Aurora | |
| Moyenne de la classe Gaming (1247 - 2344, n=113, 2 dernières années) | |
| HP Omen 16-ap0091ng | |
| Gigabyte Gaming A16 GA6H | |
| Acer Nitro V 16 AI ANV16-42-R860 | |
| MSI Cyborg 17 B13WFKG | |
| Moyenne Intel Core i7-13620H, NVIDIA GeForce RTX 5060 Laptop (n=1) | |
| CrossMark / Productivity | |
| Lenovo Legion 7 16IAX10 | |
| Alienware 16 Aurora | |
| Moyenne de la classe Gaming (1299 - 2211, n=113, 2 dernières années) | |
| HP Omen 16-ap0091ng | |
| Gigabyte Gaming A16 GA6H | |
| Acer Nitro V 16 AI ANV16-42-R860 | |
| MSI Cyborg 17 B13WFKG | |
| Moyenne Intel Core i7-13620H, NVIDIA GeForce RTX 5060 Laptop (n=1) | |
| CrossMark / Creativity | |
| Lenovo Legion 7 16IAX10 | |
| Moyenne de la classe Gaming (1275 - 2729, n=113, 2 dernières années) | |
| Alienware 16 Aurora | |
| HP Omen 16-ap0091ng | |
| Gigabyte Gaming A16 GA6H | |
| Acer Nitro V 16 AI ANV16-42-R860 | |
| MSI Cyborg 17 B13WFKG | |
| Moyenne Intel Core i7-13620H, NVIDIA GeForce RTX 5060 Laptop (n=1) | |
| CrossMark / Responsiveness | |
| Alienware 16 Aurora | |
| Gigabyte Gaming A16 GA6H | |
| Lenovo Legion 7 16IAX10 | |
| Moyenne de la classe Gaming (1030 - 2330, n=113, 2 dernières années) | |
| HP Omen 16-ap0091ng | |
| Acer Nitro V 16 AI ANV16-42-R860 | |
| MSI Cyborg 17 B13WFKG | |
| Moyenne Intel Core i7-13620H, NVIDIA GeForce RTX 5060 Laptop (n=1) | |
| WebXPRT 3 / Overall | |
| Lenovo Legion 7 16IAX10 | |
| HP Omen 16-ap0091ng | |
| Moyenne de la classe Gaming (237 - 532, n=115, 2 dernières années) | |
| Alienware 16 Aurora | |
| Acer Nitro V 16 AI ANV16-42-R860 | |
| Gigabyte Gaming A16 GA6H | |
| MSI Cyborg 17 B13WFKG | |
| Moyenne Intel Core i7-13620H, NVIDIA GeForce RTX 5060 Laptop (n=1) | |
| WebXPRT 4 / Overall | |
| Lenovo Legion 7 16IAX10 | |
| Moyenne de la classe Gaming (176.4 - 345, n=114, 2 dernières années) | |
| Alienware 16 Aurora | |
| Gigabyte Gaming A16 GA6H | |
| HP Omen 16-ap0091ng | |
| Acer Nitro V 16 AI ANV16-42-R860 | |
| MSI Cyborg 17 B13WFKG | |
| Moyenne Intel Core i7-13620H, NVIDIA GeForce RTX 5060 Laptop (n=1) | |
| Mozilla Kraken 1.1 / Total | |
| Acer Nitro V 16 AI ANV16-42-R860 | |
| MSI Cyborg 17 B13WFKG | |
| Moyenne Intel Core i7-13620H, NVIDIA GeForce RTX 5060 Laptop (n=1) | |
| Alienware 16 Aurora | |
| Gigabyte Gaming A16 GA6H | |
| HP Omen 16-ap0091ng | |
| Moyenne de la classe Gaming (397 - 674, n=124, 2 dernières années) | |
| Lenovo Legion 7 16IAX10 | |
* ... Moindre est la valeur, meilleures sont les performances
| PCMark 10 Score | 7664 points | |
Aide | ||
| AIDA64 / Memory Copy | |
| Lenovo Legion 7 16IAX10 | |
| Moyenne de la classe Gaming (21750 - 108104, n=133, 2 dernières années) | |
| Alienware 16 Aurora | |
| Acer Nitro V 16 AI ANV16-42-R860 | |
| Moyenne Intel Core i7-13620H (31629 - 53927, n=7) | |
| MSI Cyborg 17 B13WFKG | |
| Gigabyte Gaming A16 GA6H | |
| HP Omen 16-ap0091ng | |
| AIDA64 / Memory Read | |
| Lenovo Legion 7 16IAX10 | |
| Moyenne de la classe Gaming (22956 - 104349, n=133, 2 dernières années) | |
| Alienware 16 Aurora | |
| Acer Nitro V 16 AI ANV16-42-R860 | |
| Moyenne Intel Core i7-13620H (35115 - 61853, n=7) | |
| MSI Cyborg 17 B13WFKG | |
| HP Omen 16-ap0091ng | |
| Gigabyte Gaming A16 GA6H | |
| AIDA64 / Memory Write | |
| Acer Nitro V 16 AI ANV16-42-R860 | |
| Lenovo Legion 7 16IAX10 | |
| Moyenne de la classe Gaming (22297 - 133486, n=133, 2 dernières années) | |
| Alienware 16 Aurora | |
| Moyenne Intel Core i7-13620H (30611 - 54111, n=7) | |
| MSI Cyborg 17 B13WFKG | |
| HP Omen 16-ap0091ng | |
| Gigabyte Gaming A16 GA6H | |
| AIDA64 / Memory Latency | |
| Lenovo Legion 7 16IAX10 | |
| Alienware 16 Aurora | |
| Gigabyte Gaming A16 GA6H | |
| Moyenne de la classe Gaming (59.5 - 259, n=133, 2 dernières années) | |
| MSI Cyborg 17 B13WFKG | |
| Moyenne Intel Core i7-13620H (75.9 - 108.2, n=7) | |
| Acer Nitro V 16 AI ANV16-42-R860 | |
| HP Omen 16-ap0091ng | |
* ... Moindre est la valeur, meilleures sont les performances
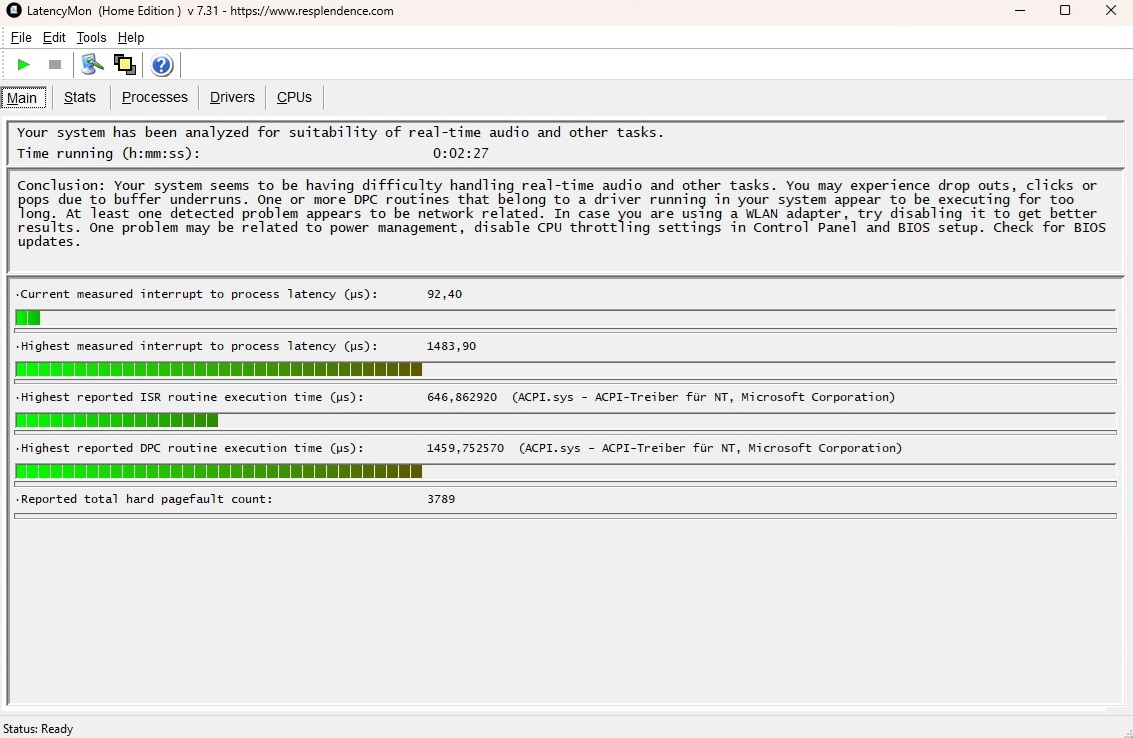
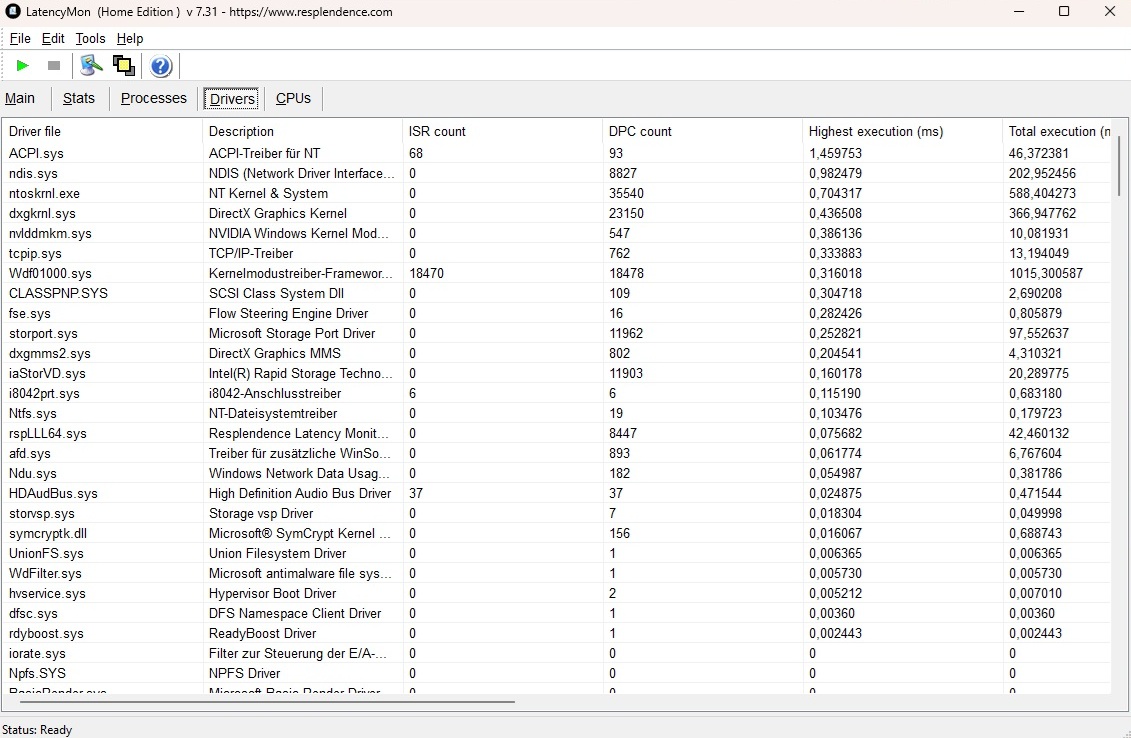
Latences DPC
Les résultats en matière de latence se situent dans la moyenne et ne sont ni particulièrement bons ni particulièrement mauvais.
| DPC Latencies / LatencyMon - interrupt to process latency (max), Web, Youtube, Prime95 | |
| Gigabyte Gaming A16 GA6H | |
| Acer Nitro V 16 AI ANV16-42-R860 | |
| MSI Cyborg 17 B13WFKG | |
| HP Omen 16-ap0091ng | |
| Lenovo Legion 7 16IAX10 | |
* ... Moindre est la valeur, meilleures sont les performances
Stockage
MSI équipe le système d'un SSD NVMe de Western Digital qui fonctionne correctement, mais n'offre rien d'exceptionnel.

* ... Moindre est la valeur, meilleures sont les performances
Performances de lecture soutenues : Boucle de lecture DiskSpd (profondeur de file d'attente 8)
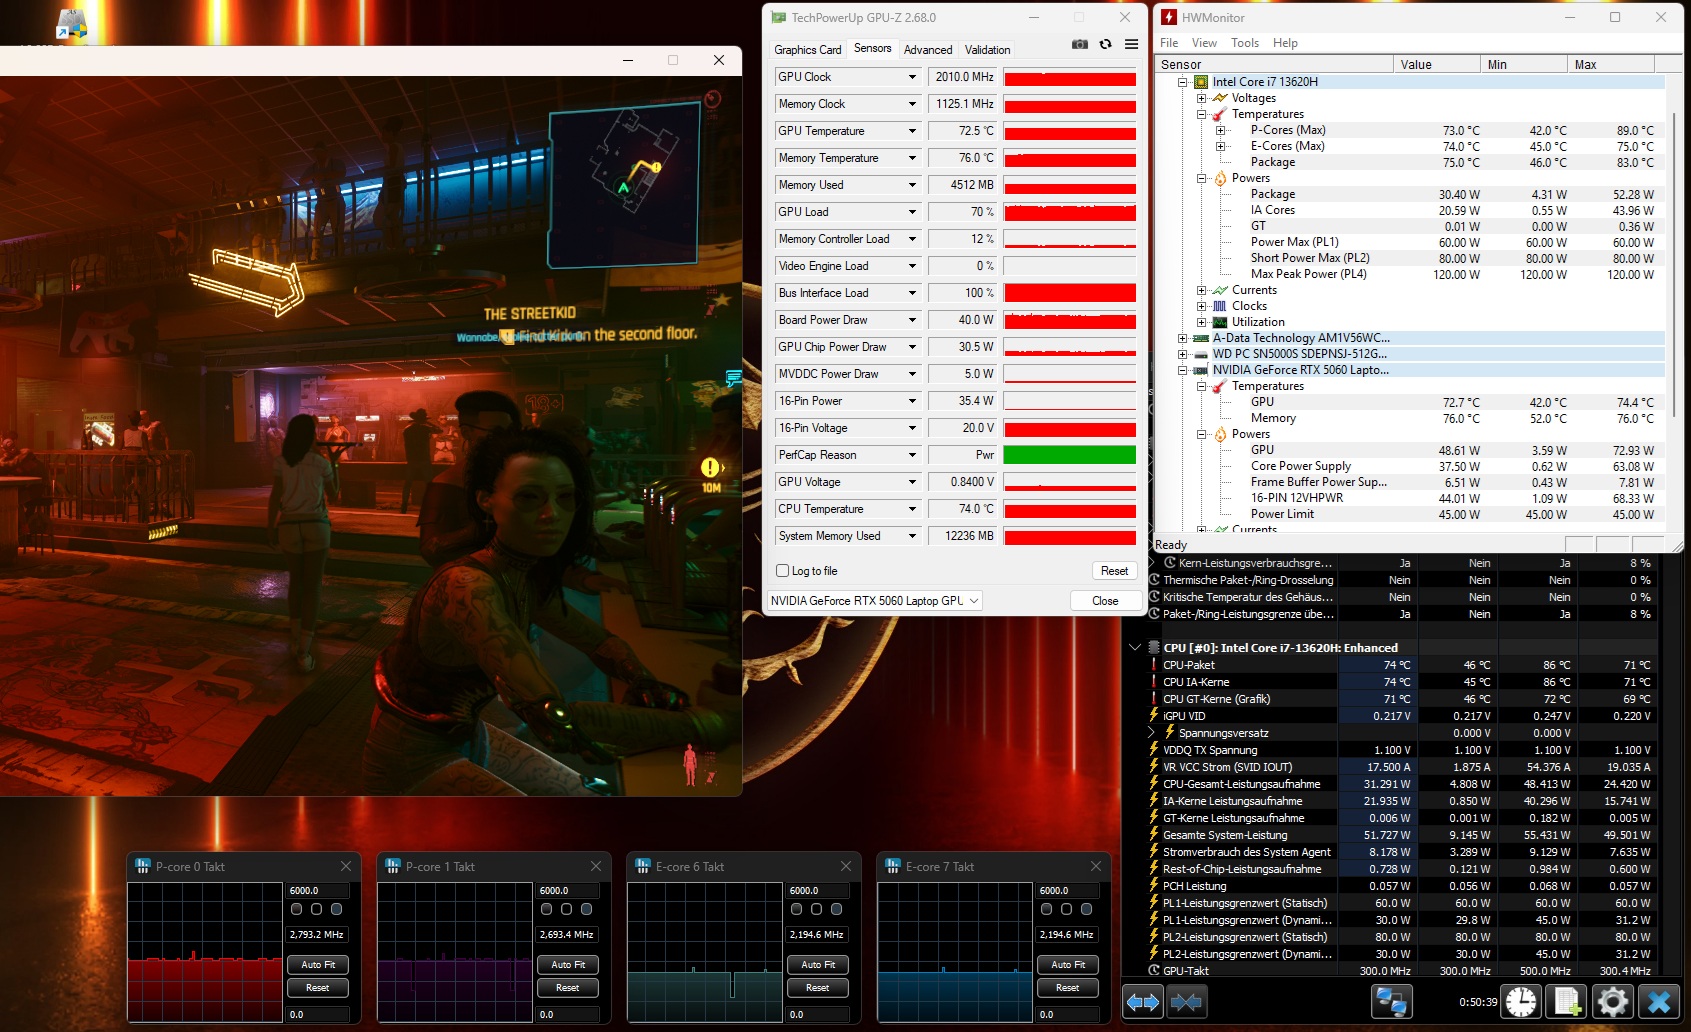
Performance du GPU
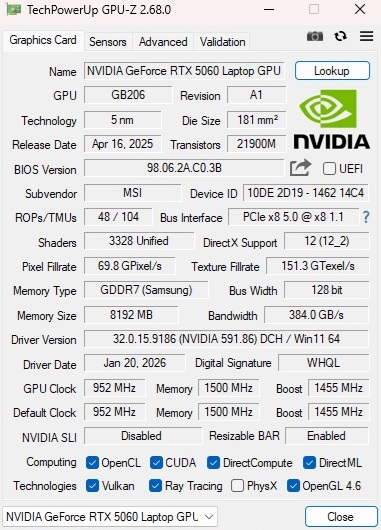
Comme le CPU, le GPU n'est pas en mesure d'atteindre son plein potentiel. Un TGP maximum de 55 watts incluant le Dynamic Boost est assez limité, surtout si l'on considère que la RTX 5060 peut fonctionner jusqu'à 115 watts. Par conséquent, le Cyborg 17 est confronté à une bataille difficile dans les tests graphiques. Même la RTX 5050 de la Nitro V 16 AI est plus performante. Dans l'ensemble, l'écart par rapport à la moyenne de la RTX 5060 enregistrée précédemment est de près de 20 %.
| 3DMark 11 Performance | 26544 points | |
| 3DMark Cloud Gate Standard Score | 52784 points | |
| 3DMark Fire Strike Score | 21242 points | |
| 3DMark Time Spy Score | 9228 points | |
Aide | ||
* ... Moindre est la valeur, meilleures sont les performances
Performances des jeux
La même tendance se poursuit dans les tests de jeu. Comme MSI a opté pour une résolution de 1 920 x 1 080 pixels, la plupart des jeux se déroulent sans problème avec des paramètres élevés. Les choses ne se gâtent qu'avec des titres extrêmement exigeants ou mal optimisés tels que Borderlands 4. Nous avons testé l'upscaling en utilisant Outer Worlds 2 à titre d'exemple. Alors qu'une combinaison de Full HD et de paramètres maximaux ne produisait que 31 fps, l'activation de la qualité DLSS permettait d'atteindre 45 fps. Avec une génération d'images multipliée par quatre, le taux de rafraîchissement a même atteint 141 images par seconde, bien que les commandes soient alors un peu bizarres.
| Bas | Moyen | Élevé | Ultra | |
|---|---|---|---|---|
| GTA V (2015) | 178.4 | 160.3 | 103.5 | |
| Dota 2 Reborn (2015) | 136.3 | 118.7 | 115 | |
| X-Plane 11.11 (2018) | 79.8 | 68.2 | ||
| Baldur's Gate 3 (2023) | 96.2 | 81.1 | 78.1 | |
| Cyberpunk 2077 (2023) | 92.4 | 79.9 | 68.1 | |
| Kingdom Come Deliverance 2 (2025) | 77.6 | 64.9 | 46.1 | |
| Monster Hunter Wilds (2025) | 53.8 | 49.7 | 36.5 | |
| The Elder Scrolls IV Oblivion Remastered (2025) | 48.2 | 43.7 | 22.8 | |
| Doom: The Dark Ages (2025) | 52.6 | 48.6 | 47.1 | |
| Borderlands 4 (2025) | 41.2 | 34.1 | 20.5 | |
| The Outer Worlds 2 (2025) | 71.5 | 58.3 | 31.1 | |
| ARC Raiders (2025) | 102 | 79.9 | 55 | |
| Anno 117: Pax Romana (2025) | 69 | 50 | 25.1 |
| The Outer Worlds 2 | |
| 1920x1080 High Preset AA:T | |
| Moyenne NVIDIA GeForce RTX 5060 Laptop (58.3 - 72.7, n=4) | |
| Acer Nitro V 16 AI ANV16-42-R860 | |
| Moyenne de la classe Gaming (20.4 - 82.3, n=9, 2 dernières années) | |
| MSI Cyborg 17 B13WFKG | |
| 1920x1080 Very High Preset AA:T | |
| Moyenne NVIDIA GeForce RTX 5060 Laptop (31.1 - 40.9, n=4) | |
| Acer Nitro V 16 AI ANV16-42-R860 | |
| Moyenne de la classe Gaming (9.81 - 49.9, n=9, 2 dernières années) | |
| MSI Cyborg 17 B13WFKG | |
| The Elder Scrolls IV Oblivion Remastered | |
| 1920x1080 High Preset AA:T | |
| Moyenne de la classe Gaming (13.2 - 111.8, n=17, 2 dernières années) | |
| Moyenne NVIDIA GeForce RTX 5060 Laptop (43.7 - 54.9, n=3) | |
| Gigabyte Gaming A16 GA6H | |
| MSI Cyborg 17 B13WFKG | |
| 1920x1080 Ultra Preset AA:T | |
| Moyenne de la classe Gaming (10.7 - 61.9, n=18, 2 dernières années) | |
| Gigabyte Gaming A16 GA6H | |
| Moyenne NVIDIA GeForce RTX 5060 Laptop (22.8 - 29.2, n=3) | |
| MSI Cyborg 17 B13WFKG | |
| Kingdom Come Deliverance 2 | |
| 1920x1080 High Preset | |
| Moyenne de la classe Gaming (37.8 - 165.7, n=16, 2 dernières années) | |
| Gigabyte Gaming A16 GA6H | |
| Moyenne NVIDIA GeForce RTX 5060 Laptop (64.9 - 86, n=3) | |
| MSI Cyborg 17 B13WFKG | |
| 1920x1080 Ultra Preset | |
| Moyenne de la classe Gaming (25.2 - 130.3, n=17, 2 dernières années) | |
| Gigabyte Gaming A16 GA6H | |
| Moyenne NVIDIA GeForce RTX 5060 Laptop (46.1 - 61.1, n=3) | |
| MSI Cyborg 17 B13WFKG | |
| Monster Hunter Wilds | |
| 1920x1080 high, no upscaling | |
| MSI Cyborg 17 B13WFKG | |
| Moyenne NVIDIA GeForce RTX 5060 Laptop (n=1) | |
| Moyenne de la classe Gaming (13.6 - 49.7, n=4, 2 dernières années) | |
| 1920x1080 ultra, RT: high, no upscaling | |
| Moyenne de la classe Gaming (16.6 - 95.3, n=26, 2 dernières années) | |
| MSI Cyborg 17 B13WFKG | |
| Alienware 16 Aurora | |
| Moyenne NVIDIA GeForce RTX 5060 Laptop (16.6 - 36.5, n=3) | |
| Lenovo Legion 7 16IAX10 | |
Cyberpunk 2077 Ultra FPS chart
Émissions
Émissions sonores
Malgré ses limites de puissance inférieures, le Cyborg 17 atteint des niveaux de bruit similaires à ceux de ses concurrents en charge. Avec 44 à 50 dB(A), l'utilisation d'un casque est conseillée. En mode veille, le ventilateur s'éteint parfois complètement.
Degré de la nuisance sonore
| Au repos |
| 25 / 27 / 34 dB(A) |
| Fortement sollicité |
| 44 / 50 dB(A) |
 | ||
30 dB silencieux 40 dB(A) audible 50 dB(A) bruyant |
||
min: | ||
| MSI Cyborg 17 B13WFKG i7-13620H, GeForce RTX 5060 Laptop | Acer Nitro V 16 AI ANV16-42-R860 R5 240, GeForce RTX 5050 Laptop | Alienware 16 Aurora Core 7 240H, GeForce RTX 5060 Laptop | HP Omen 16-ap0091ng R9 8940HX, GeForce RTX 5060 Laptop | Lenovo Legion 7 16IAX10 Ultra 7 255HX, GeForce RTX 5060 Laptop | Gigabyte Gaming A16 GA6H i7-13620H, GeForce RTX 5070 Laptop | |
|---|---|---|---|---|---|---|
| Noise | 1% | 3% | 4% | 3% | -2% | |
| arrêt / environnement * (dB) | 25 | 25 -0% | 22.9 8% | 23 8% | 23.9 4% | 24 4% |
| Idle Minimum * (dB) | 25 | 25 -0% | 24 4% | 23 8% | 24 4% | 25 -0% |
| Idle Average * (dB) | 27 | 30 -11% | 25.6 5% | 23 15% | 26 4% | 26 4% |
| Idle Maximum * (dB) | 34 | 33 3% | 25.6 25% | 27.64 19% | 29.4 14% | 27 21% |
| Load Average * (dB) | 44 | 38 14% | 46.8 -6% | 49.5 -13% | 35.4 20% | 54 -23% |
| Cyberpunk 2077 ultra * (dB) | 48 | 49 -2% | 49.9 -4% | 49.5 -3% | 54.6 -14% | 54 -13% |
| Load Maximum * (dB) | 50 | 50 -0% | 55.6 -11% | 52.73 -5% | 54.7 -9% | 55 -10% |
* ... Moindre est la valeur, meilleures sont les performances
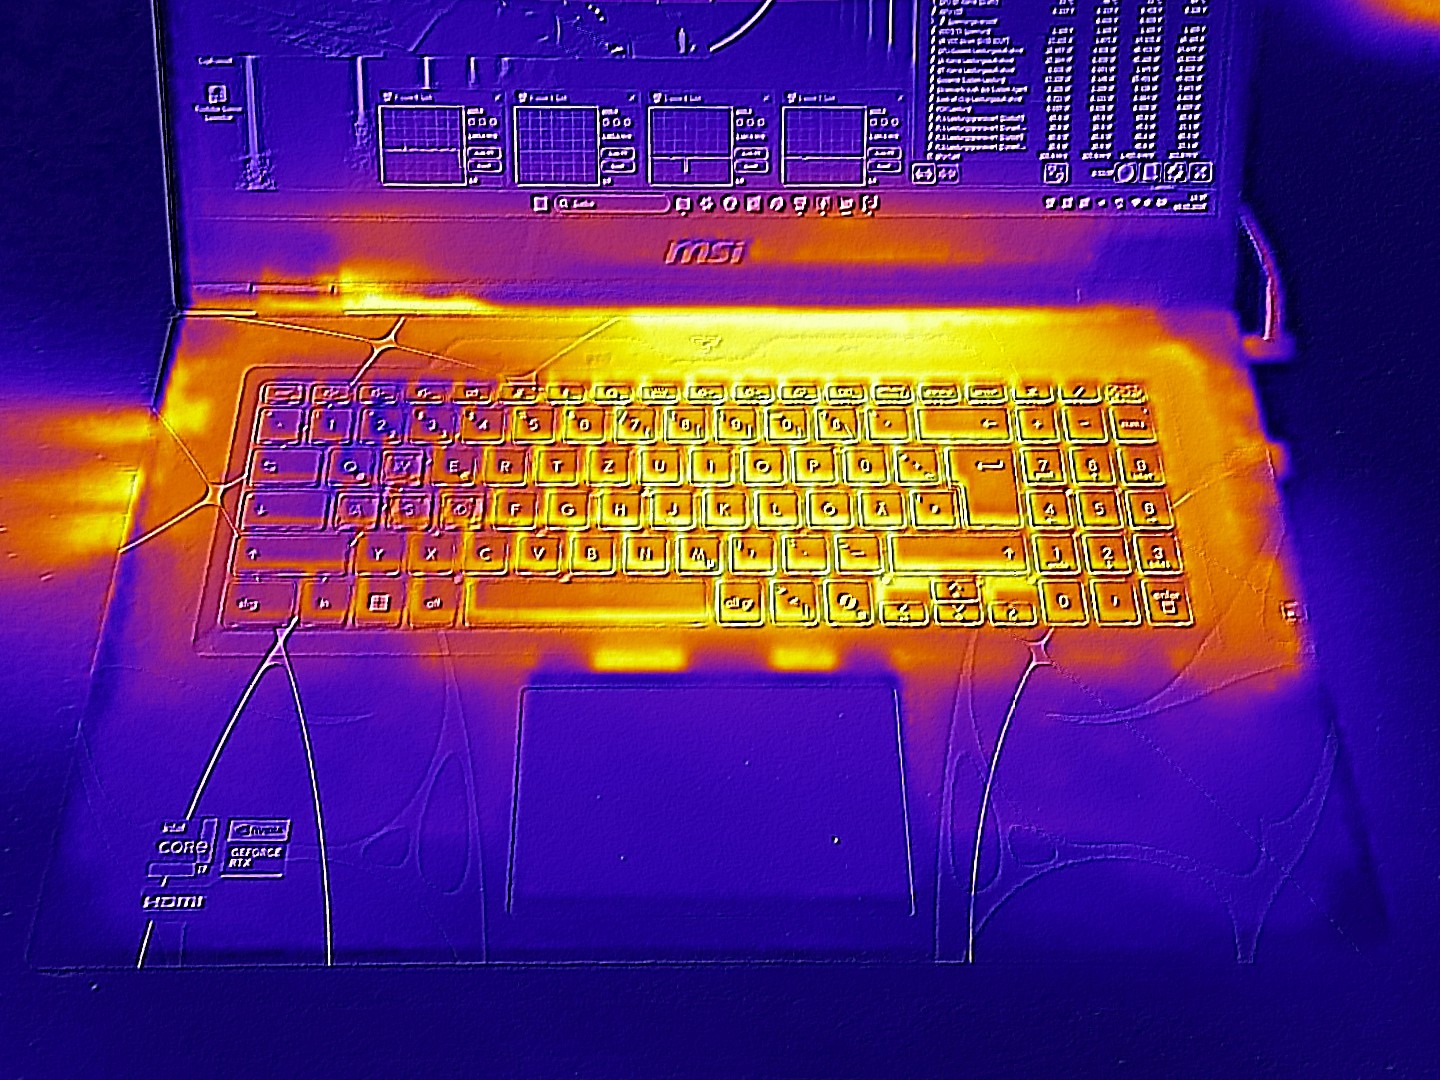
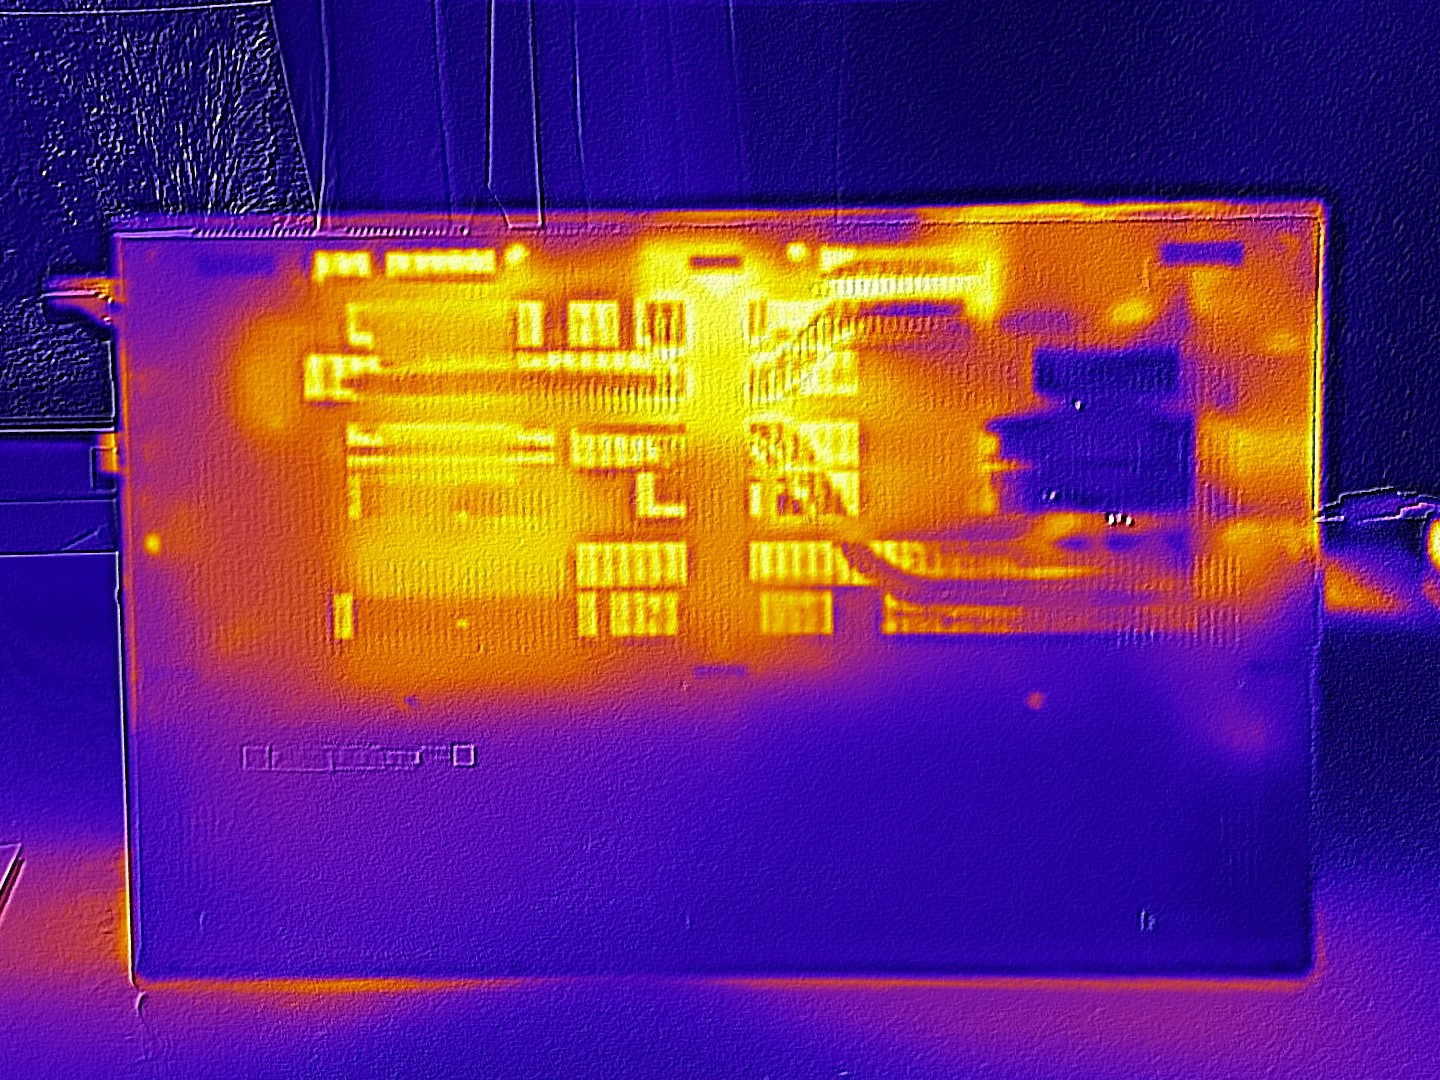
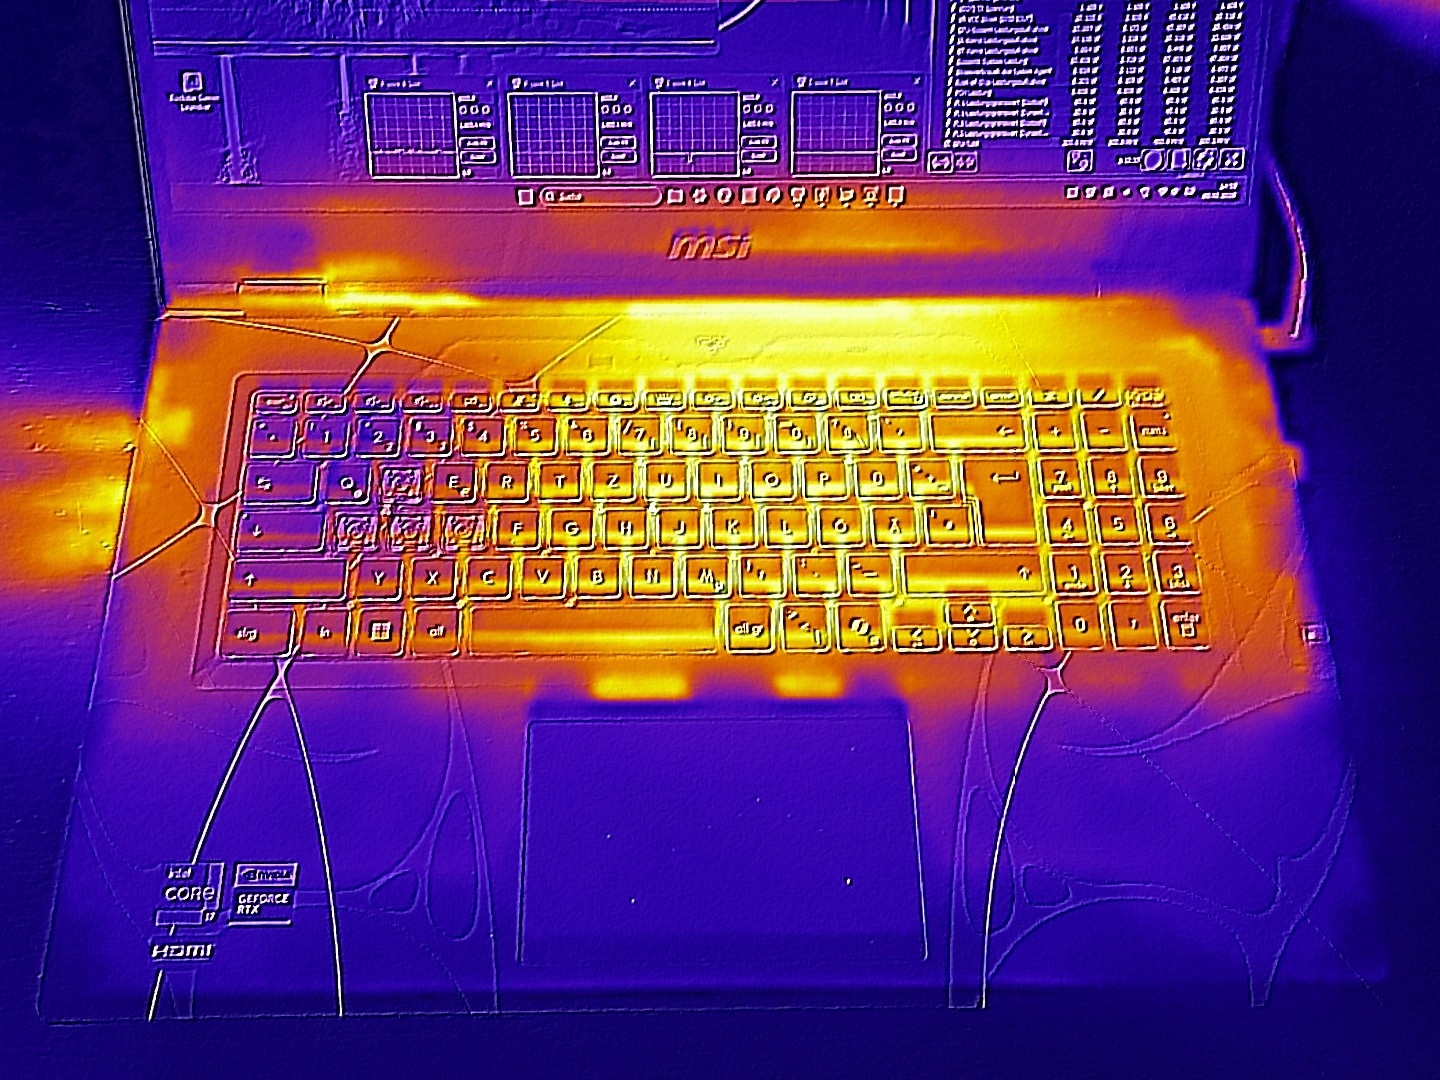
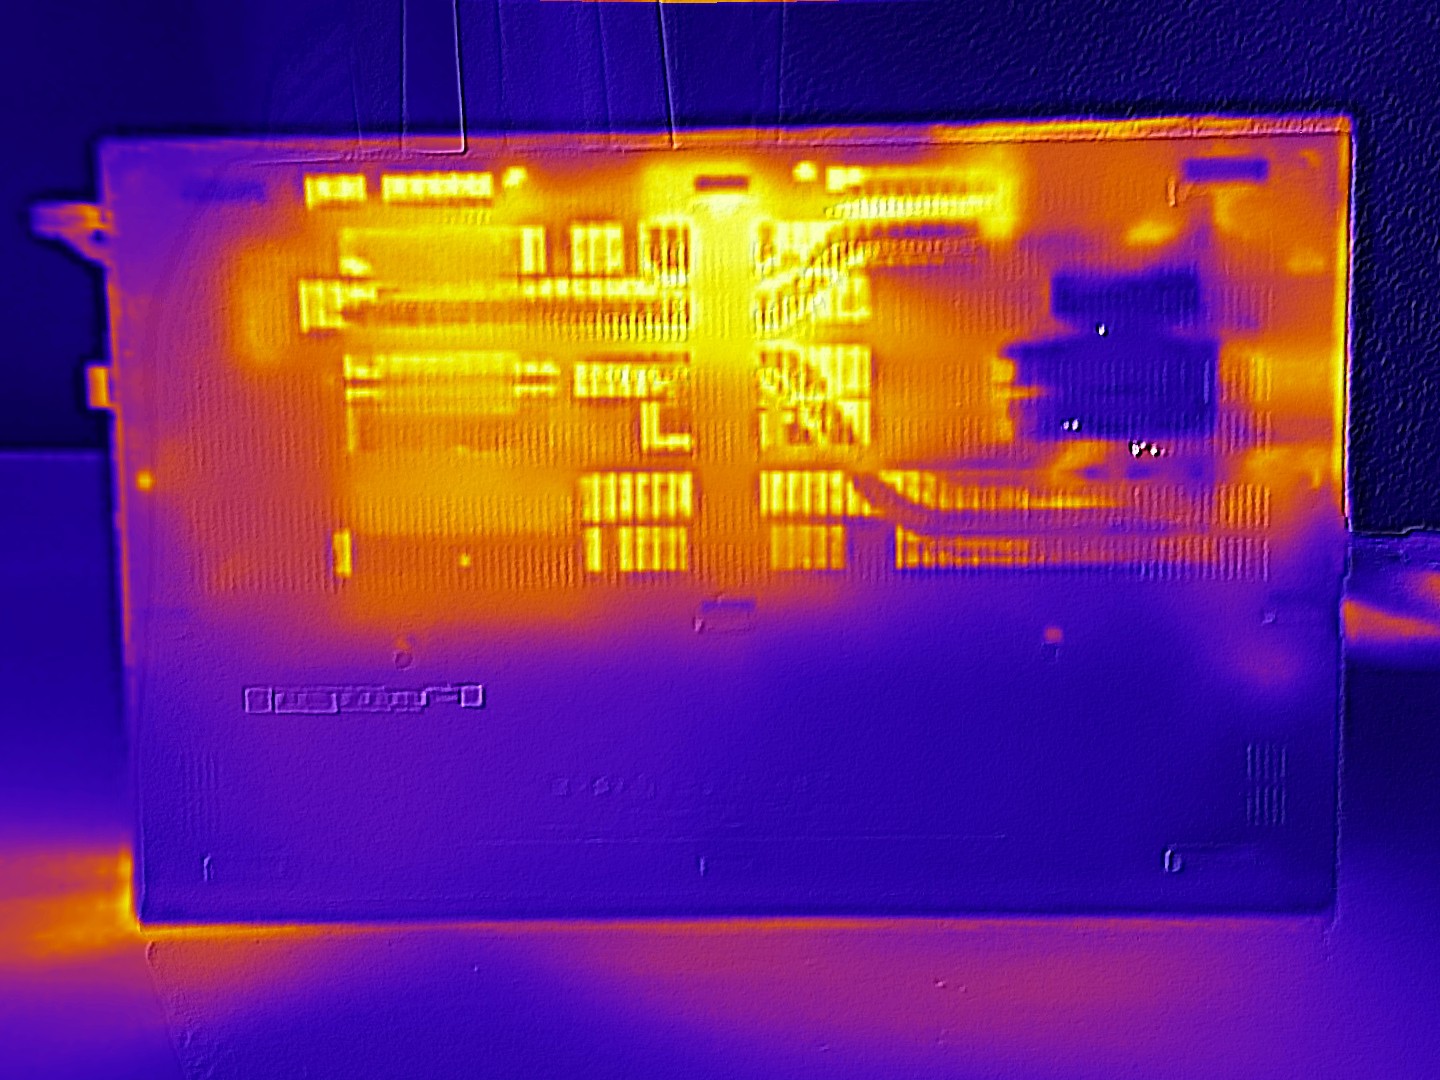
Température
Les températures ne reflètent pas non plus entièrement les performances offertes, bien qu'un maximum de 49 °C sur la face supérieure ou inférieure du boîtier soit loin d'être critique.
(-) La température maximale du côté supérieur est de 49 °C / 120 F, par rapport à la moyenne de 40.4 °C / 105 F, allant de 21.2 à 68.8 °C pour la classe Gaming.
(-) Le fond chauffe jusqu'à un maximum de 49 °C / 120 F, contre une moyenne de 43.3 °C / 110 F
(±) En utilisation inactive, la température moyenne du côté supérieur est de 32.3 °C / 90 F, par rapport à la moyenne du dispositif de 33.9 °C / 93 F.
(-) 3: The average temperature for the upper side is 40.1 °C / 104 F, compared to the average of 33.9 °C / 93 F for the class Gaming.
(+) Les repose-poignets et le pavé tactile atteignent la température maximale de la peau (32 °C / 89.6 F) et ne sont donc pas chauds.
(-) La température moyenne de la zone de l'appui-paume de dispositifs similaires était de 28.8 °C / 83.8 F (-3.2 °C / #-5.8 F).
| MSI Cyborg 17 B13WFKG i7-13620H, GeForce RTX 5060 Laptop | Acer Nitro V 16 AI ANV16-42-R860 R5 240, GeForce RTX 5050 Laptop | HP Omen 16-ap0091ng R9 8940HX, GeForce RTX 5060 Laptop | Lenovo Legion 7 16IAX10 Ultra 7 255HX, GeForce RTX 5060 Laptop | Gigabyte Gaming A16 GA6H i7-13620H, GeForce RTX 5070 Laptop | |
|---|---|---|---|---|---|
| Heat | 5% | 22% | 7% | 4% | |
| Maximum Upper Side * (°C) | 49 | 45 8% | 36 27% | 47 4% | 50 -2% |
| Maximum Bottom * (°C) | 49 | 59 -20% | 37 24% | 44 10% | 49 -0% |
| Idle Upper Side * (°C) | 37 | 29 22% | 30 19% | 35.6 4% | 35 5% |
| Idle Bottom * (°C) | 39 | 36 8% | 32 18% | 35.2 10% | 34 13% |
* ... Moindre est la valeur, meilleures sont les performances
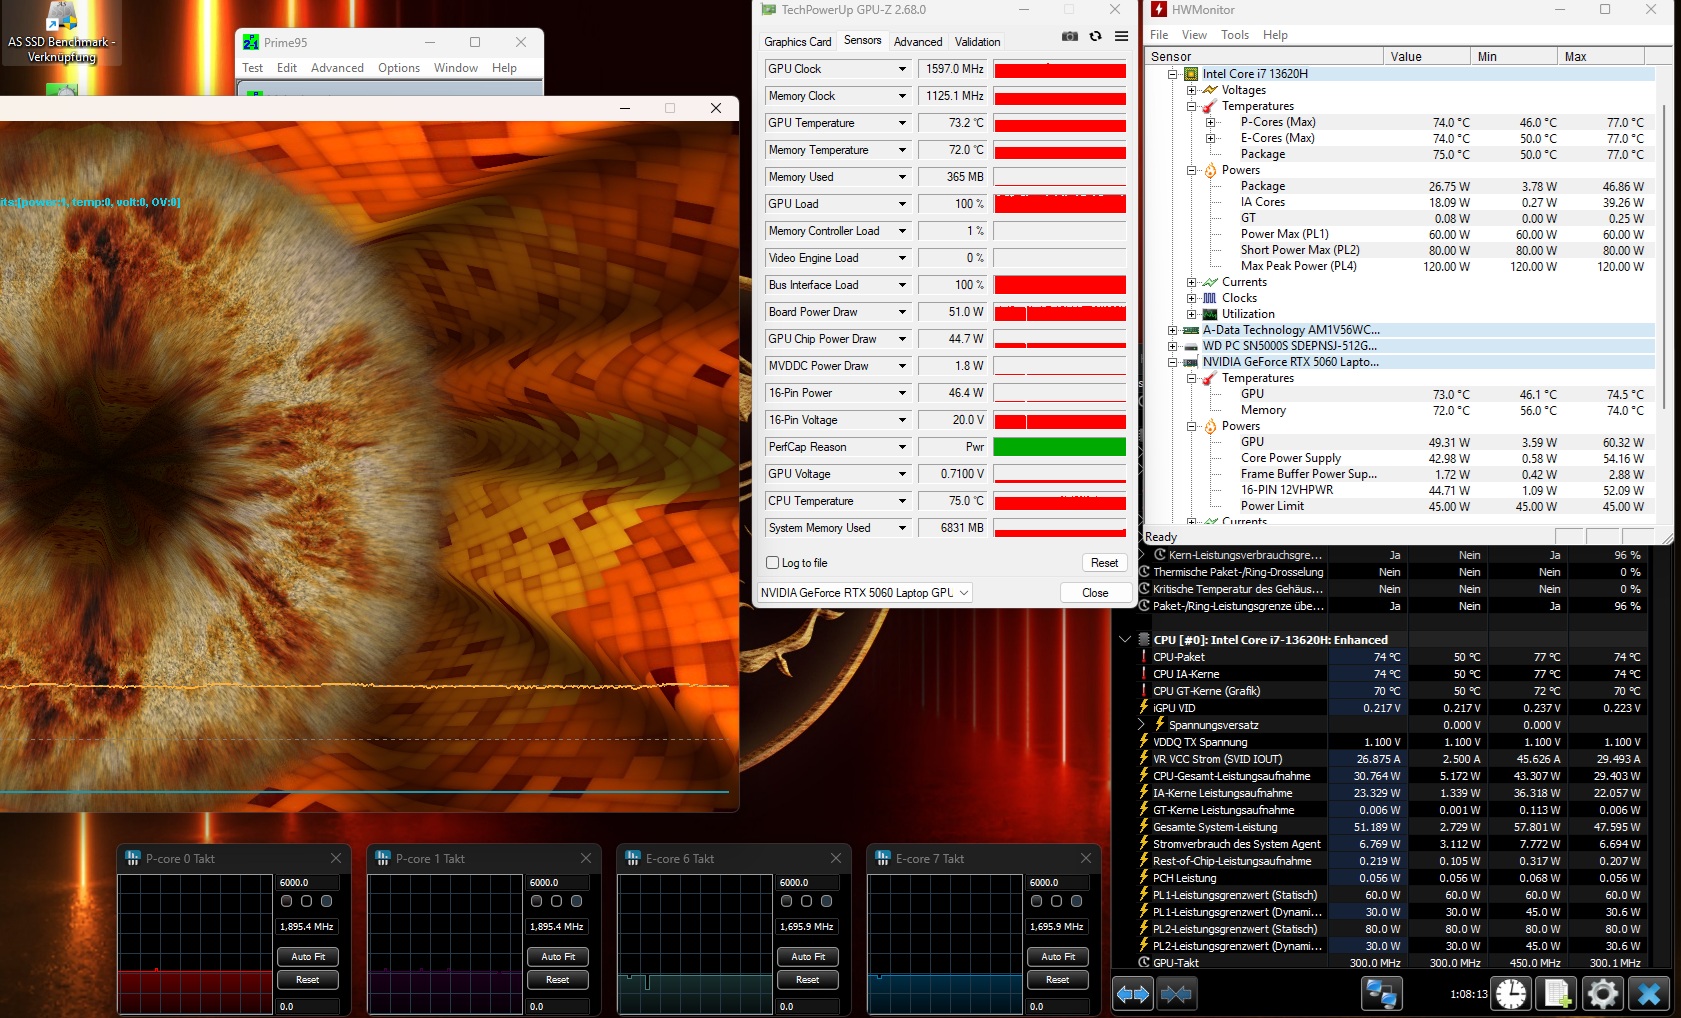
Épreuve d'effort
Lors du test de stress réalisé à l'aide des outils FurMark et Prime95, le CPU et le GPU ont atteint une température légèrement supérieure à 70 °C, ce qui est un résultat modéré.
Intervenants
Le système de haut-parleurs 2.0 offre une qualité sonore plus que solide, hormis des basses limitées, et surpasse même le HP Omen 16 à cet égard.
MSI Cyborg 17 B13WFKG analyse audio
(+) | les haut-parleurs peuvent jouer relativement fort (86# dB)
Basses 100 - 315 Hz
(-) | presque aucune basse - en moyenne 23% plus bas que la médiane
(±) | la linéarité des basses est moyenne (14% delta à la fréquence précédente)
Médiums 400 - 2000 Hz
(+) | médiane équilibrée - seulement 2.5% de la médiane
(+) | les médiums sont linéaires (4.3% delta à la fréquence précédente)
Aiguës 2 - 16 kHz
(±) | sommets plus élevés - en moyenne 5.1% plus élevés que la médiane
(+) | les aigus sont linéaires (4% delta à la fréquence précédente)
Globalement 100 - 16 000 Hz
(±) | la linéarité du son global est moyenne (15.2% de différence avec la médiane)
Par rapport à la même classe
» 33% de tous les appareils testés de cette catégorie étaient meilleurs, 6% similaires, 61% pires
» Le meilleur avait un delta de 6%, la moyenne était de 18%, le pire était de 132%.
Par rapport à tous les appareils testés
» 21% de tous les appareils testés étaient meilleurs, 4% similaires, 75% pires
» Le meilleur avait un delta de 4%, la moyenne était de 24%, le pire était de 134%.
HP Omen 16-ap0091ng analyse audio
(±) | le niveau sonore du haut-parleur est moyen mais bon (79.91# dB)
Basses 100 - 315 Hz
(-) | presque aucune basse - en moyenne 18% plus bas que la médiane
(±) | la linéarité des basses est moyenne (11.1% delta à la fréquence précédente)
Médiums 400 - 2000 Hz
(±) | médiane supérieure - en moyenne 6.9% supérieure à la médiane
(±) | la linéarité des médiums est moyenne (7.5% delta à la fréquence précédente)
Aiguës 2 - 16 kHz
(+) | des sommets équilibrés - à seulement 2.1% de la médiane
(±) | la linéarité des aigus est moyenne (7.5% delta à la fréquence précédente)
Globalement 100 - 16 000 Hz
(±) | la linéarité du son global est moyenne (17.8% de différence avec la médiane)
Par rapport à la même classe
» 53% de tous les appareils testés de cette catégorie étaient meilleurs, 10% similaires, 38% pires
» Le meilleur avait un delta de 6%, la moyenne était de 18%, le pire était de 132%.
Par rapport à tous les appareils testés
» 35% de tous les appareils testés étaient meilleurs, 8% similaires, 57% pires
» Le meilleur avait un delta de 4%, la moyenne était de 24%, le pire était de 134%.
Gestion de l'énergie
Consommation électrique
Bien que la consommation d'énergie en mode veille puisse être inférieure, la Cyborg 17 consomme moins d'énergie que ses concurrentes en charge, avec une consommation de 90 à 115 watts.
| Éteint/en veille | |
| Au repos | |
| Fortement sollicité |
|
Légende:
min: | |
| MSI Cyborg 17 B13WFKG i7-13620H, GeForce RTX 5060 Laptop | Acer Nitro V 16 AI ANV16-42-R860 R5 240, GeForce RTX 5050 Laptop | Alienware 16 Aurora Core 7 240H, GeForce RTX 5060 Laptop | HP Omen 16-ap0091ng R9 8940HX, GeForce RTX 5060 Laptop | Lenovo Legion 7 16IAX10 Ultra 7 255HX, GeForce RTX 5060 Laptop | Gigabyte Gaming A16 GA6H i7-13620H, GeForce RTX 5070 Laptop | Moyenne de la classe Gaming | |
|---|---|---|---|---|---|---|---|
| Power Consumption | 16% | -11% | -32% | -55% | -15% | -63% | |
| Idle Minimum * (Watt) | 7.9 | 4.2 47% | 4.4 44% | 7.8 1% | 9.4 -19% | 9 -14% | 13.8 ? -75% |
| Idle Average * (Watt) | 12.7 | 6.8 46% | 18 -42% | 8.8 31% | 10.6 17% | 11 13% | 19.5 ? -54% |
| Idle Maximum * (Watt) | 18.1 | 9.8 46% | 18.2 -1% | 21.5 -19% | 36.4 -101% | 23 -27% | 25.5 ? -41% |
| Load Average * (Watt) | 90 | 62 31% | 87.1 3% | 119 -32% | 107.7 -20% | 91 -1% | 110.6 ? -23% |
| Cyberpunk 2077 ultra external monitor * (Watt) | 108.4 | 129.6 -20% | 120.6 -11% | 164.5 -52% | 187.5 -73% | 130 -20% | |
| Cyberpunk 2077 ultra * (Watt) | 109.7 | 130.3 -19% | 123 -12% | 192 -75% | 188 -71% | 132.5 -21% | |
| Load Maximum * (Watt) | 115 | 135 -17% | 183 -59% | 208 -81% | 247 -115% | 155 -35% | 257 ? -123% |
* ... Moindre est la valeur, meilleures sont les performances
consommation d'énergie Cyberpunk / Stress test
Consommation d'énergie lors d'un test de résistance avec moniteur externe
Durée de vie de la batterie
La combinaison d'une consommation en veille sous-optimale et d'une capacité de batterie modeste se traduit par des durées d'utilisation quelque peu décevantes. Avec un peu moins de quatre heures lors de notre test Wi-Fi (avec une luminosité réduite à 150 cd/m²), le Cyborg 17 enregistre le résultat le plus faible du champ de comparaison. Ce n'est pas surprenant, car les appareils concurrents offrent entre 70 et 96 Wh.
| MSI Cyborg 17 B13WFKG i7-13620H, GeForce RTX 5060 Laptop, 55.2 Wh | Acer Nitro V 16 AI ANV16-42-R860 R5 240, GeForce RTX 5050 Laptop, 76 Wh | Alienware 16 Aurora Core 7 240H, GeForce RTX 5060 Laptop, 96 Wh | HP Omen 16-ap0091ng R9 8940HX, GeForce RTX 5060 Laptop, 70 Wh | Lenovo Legion 7 16IAX10 Ultra 7 255HX, GeForce RTX 5060 Laptop, 84 Wh | Gigabyte Gaming A16 GA6H i7-13620H, GeForce RTX 5070 Laptop, 76 Wh | Moyenne de la classe Gaming | |
|---|---|---|---|---|---|---|---|
| Autonomie de la batterie | 195% | 97% | 32% | 24% | 103% | 76% | |
| WiFi v1.3 (h) | 3.8 | 11.2 195% | 7.5 97% | 5 32% | 4.7 24% | 7.7 103% | 6.67 ? 76% |
| H.264 (h) | 5.1 | 7.93 ? | |||||
| Load (h) | 1.3 | 1.483 ? |
Notebookcheck note globale
MSI a réduit les coûts dans tellement de domaines avec le Cyborg 17 que nous ne pouvons recommander cet ordinateur portable de jeu de 17 pouces qu'avec des réserves, même dans une perspective de budget.
MSI Cyborg 17 B13WFKG
- 02/13/2026 v8
Florian Glaser
 Total Sustainability Score:
 Les alternatives possibles en un coup d'œil
Image | Modèle | Prix | Poids | Épaisseur | Écran |
|---|---|---|---|---|---|
1. 76.3% 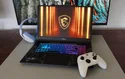 | MSI Cyborg 17 B13WFKG Intel Core i7-13620H ⎘ NVIDIA GeForce RTX 5060 Laptop ⎘ 16 Go Mémoire, 512 Go SSD | Amazon: 1. msi Cyborg 17 Gaming Laptop,... 2. MSI Cyborg 17 B2RWFKG-055CA ... 3. msi Cyborg 17 B2RWFKG Gaming... Prix de liste: 1200 EUR | 2.6 kg | 22.2 mm | 17.30" 1920x1080 127 PPI IPS |
2. 77.5%  | Acer Nitro V 16 AI ANV16-42-R860 AMD Ryzen 5 240 ⎘ NVIDIA GeForce RTX 5050 Laptop ⎘ 16 Go Mémoire, 1024 Go SSD | Amazon: Prix de liste: 1100 EUR | 2.4 kg | 24.5 mm | 16.00" 1920x1200 142 PPI IPS |
3. 76.2%  | Alienware 16 Aurora Intel Core 7 240H ⎘ NVIDIA GeForce RTX 5060 Laptop ⎘ 32 Go Mémoire | Amazon: 1. Alienware 16 Aurora Laptop A... 2. Alienware 16 Aurora Gaming L... 3. Alienware 16 Area-51 Gaming ... Prix de liste: 1100 USD | 2.6 kg | 15.2 mm | 16.00" 2560x1600 189 PPI IPS |
4. 82.5%  | HP Omen 16-ap0091ng AMD Ryzen 9 8940HX ⎘ NVIDIA GeForce RTX 5060 Laptop ⎘ 16 Go Mémoire, 1000 Go SSD | Amazon: 1. Fleshy Leaf CPU+GPU Cooling ... 2. LAOKOEN New Cooling Fan for ... 3. ZAHARA Laptop Complete Set o... Prix de liste: 1500 Euro | 2.4 kg | 23.7 mm | 16.00" 1920x1200 162 PPI IPS |
5. 86.6%  | Lenovo Legion 7 16IAX10 Intel Core Ultra 7 255HX ⎘ NVIDIA GeForce RTX 5060 Laptop ⎘ 32 Go Mémoire, 1024 Go SSD | Amazon: Prix de liste: 1650 USD | 2 kg | 17.9 mm | 16.00" 2560x1600 189 PPI OLED |
6. 80.1%  | Gigabyte Gaming A16 GA6H Intel Core i7-13620H ⎘ NVIDIA GeForce RTX 5070 Laptop ⎘ 16 Go Mémoire, 1024 Go SSD | Amazon: 1. Puccy 2 Pack Touch Pad Film ... 2. Smatree Laptop Sleeve for 16... 3. 180W/150W Laptop AC Power Ad... Prix de liste: 1700 EUR | 2.3 kg | 23 mm | 16.00" 2560x1600 189 PPI IPS |
Transparency
La sélection des appareils à examiner est effectuée par notre équipe éditoriale. L'échantillon de test a été prêté à l'auteur par le fabricant ou le détaillant pour les besoins de cet examen. Le prêteur n'a pas eu d'influence sur cette évaluation et le fabricant n'a pas reçu de copie de cette évaluation avant sa publication. Il n'y avait aucune obligation de publier cet article. En tant que média indépendant, Notebookcheck n'est pas soumis à l'autorité des fabricants, des détaillants ou des éditeurs.
Voici comment Notebookcheck teste
Chaque année, Notebookcheck examine de manière indépendante des centaines d'ordinateurs portables et de smartphones en utilisant des procédures standardisées afin de garantir que tous les résultats sont comparables. Nous avons continuellement développé nos méthodes de test depuis environ 20 ans et avons établi des normes industrielles dans le processus. Dans nos laboratoires de test, des équipements de mesure de haute qualité sont utilisés par des techniciens et des rédacteurs expérimentés. Ces tests impliquent un processus de validation en plusieurs étapes. Notre système d'évaluation complexe repose sur des centaines de mesures et de points de référence bien fondés, ce qui garantit l'objectivité.