Critiques du Intel Core i7-13620H processeur
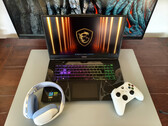
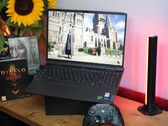
Test du MSI Cyborg 17 : des jeux abordables pour le grand public ?
Le segment de prix inférieur est devenu un champ de bataille pour les ordinateurs portables de jeu, les fabricants se battant pour chaque centimètre. Sur le papier, le MSI Cyborg 17 semble être un concurrent de taille pour la couronne budgétaire - mais notre examen montre s'il est à la hauteur dans le monde réel.
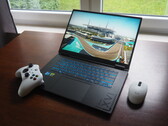
Intel Core i7-13620H, NVIDIA GeForce RTX 5060 Laptop, 17.3", 2.6 kgTest du Gigabyte Gaming A16 : un ordinateur portable RTX 5070 abordable ?
Le Gaming A16 de Gigabyte est actuellement l'un des ordinateurs portables les plus abordables basés sur la GeForce RTX 5070. Nous avons testé en profondeur le modèle 16 pouces prometteur et l'avons comparé à la concurrence Blackwell.
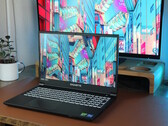
Intel Core i7-13620H, NVIDIA GeForce RTX 5070 Laptop, 16", 2.3 kgTest du Gigabyte G5 KF5 2024 : le jeu RTX 4060 à prix cassé - l'affaire en vaut-elle la peine ?
Un Intel Core i7-13620H, une RTX 4060, 16 Go de RAM et un SSD de 1 To, le tout pour 899 euros. Vous ne pouvez pas trouver un RTX 4060 gamer beaucoup moins cher en ce moment. Nous vérifions si le dernier G5 en vaut la peine et s'il peut figurer dans notre liste des meilleurs ordinateurs portables de jeu.
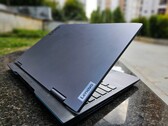
Intel Core i7-13620H, NVIDIA GeForce RTX 4060 Laptop GPU, 15.6", 2 kgTest du Lenovo LOQ 15 Core i7 : alternative abordable au Legion mais au cœur du conflit Intel - AMD
Avec le LOQ 15IRH8, Lenovo entend proposer un ordinateur portable de jeu original et performant, qui ne pèse pas lourd dans le portefeuille et qui n'a pas les inconvénients de ses autres gammes à bas prix. Ce modèle en plastique réussit-il à s'imposer ? Comment ce modèle Core i7-13620H se comporte-t-il par rapport à son cousin AMD Zen 4 au prix similaire ? Nos tests révèlent des résultats mitigés.
Intel Core i7-13620H, NVIDIA GeForce RTX 4050 Laptop GPU, 15.6", 2.4 kgTest du Lenovo LOQ 16 : où est le problème par rapport aux PC portables Legion plus chers ?
Avec sa série LOQ, Lenovo tente de donner un nouveau nom aux ordinateurs portables de jeu abordables par rapport aux modèles plus onéreux de la gamme Legion. Le modèle actuel de 16 pouces est abordable et les performances sont bonnes. Mais où est le problème ? Nous testons l'ordinateur portable de jeu avec une RTX 4060 !
Intel Core i7-13620H, NVIDIA GeForce RTX 4060 Laptop GPU, 16", 2.7 kgMSI Katana 17 B13VFK: NVIDIA GeForce RTX 4060 Laptop GPU, 17.30", 2.8 kg
Critique » Test du MSI Katana 17 B13V : la Nvidia GeForce RTX 4060 fait ses débuts
MSI Cyborg 17 B13WFKG: NVIDIA GeForce RTX 5060 Laptop, 17.30", 2.6 kg
Autres tests » MSI Cyborg 17 B13WFKG - Tests et Caractéristiques
HP Victus 15-fa2000ng: NVIDIA GeForce RTX 5060 Laptop, 15.60", 2.3 kg
Autres tests » HP Victus 15-fa2000ng
Gigabyte Gaming A16 CVH: NVIDIA GeForce RTX 5060 Laptop, 16.00", 2.2 kg
Autres tests » Gigabyte Gaming A16 CVH
Gigabyte Gaming A16 CWH: NVIDIA GeForce RTX 5070 Laptop, 16.00", 2.2 kg
Autres tests » Gigabyte Gaming A16 CWH
Gigabyte Gaming A16 GA6H: NVIDIA GeForce RTX 5070 Laptop, 16.00", 2.3 kg
Autres tests » Gigabyte Gaming A16 GA6H
Acer Nitro V 15 ANV15-52: NVIDIA GeForce RTX 5060 Laptop, 15.60", 2.1 kg
Autres tests » Acer Nitro V 15 ANV15-52
Acer Nitro V15 ANV15-52: NVIDIA GeForce RTX 5050 Laptop, 15.60", 2.1 kg
Autres tests » Acer Nitro V15 ANV15-52
Acer Aspire Go 15 AG15-71P: Intel UHD Graphics 64EUs (Alder Lake 12th Gen), 15.60", 1.8 kg
Autres tests » Acer Aspire Go 15 AG15-71P
Asus Vivobook S16 S3607VA: Intel UHD Graphics 64EUs (Alder Lake 12th Gen), 16.00", 1.8 kg
Autres tests » Asus Vivobook S16 S3607VA
Monster Tulpar T7 V26.2.5: NVIDIA GeForce RTX 5060 Laptop, 17.30", 2.7 kg
Autres tests » Monster Tulpar T7 V26.2.5
Asus ExpertBook P3 P3405CVA: Intel UHD Graphics 64EUs (Alder Lake 12th Gen), 14.00", 1.4 kg
Autres tests » Asus ExpertBook P3 P3405CVA
Acer Nitro Lite 16 NL16-71G, RTX 2050 : NVIDIA GeForce RTX 2050 Mobile, 16.00", 1.9 kg
Autres tests » Acer Nitro Lite 16 NL16-71G, RTX 2050
Gigabyte Gaming A16 CMHI2: NVIDIA GeForce RTX 4050 Laptop GPU, 16.00", 2.2 kg
Autres tests » Gigabyte Gaming A16 CMHI2
Asus TUF Gaming F15 FX507VV, i7-13620H: NVIDIA GeForce RTX 4060 Laptop GPU, 15.60", 2.2 kg
Autres tests » Asus TUF Gaming F15 FX507VV, i7-13620H
Acer Nitro Lite 16 NL16-71G: NVIDIA GeForce RTX 3050 6GB Laptop GPU, 16.00", 1.9 kg
Autres tests » Acer Nitro Lite 16 NL16-71G
Gigabyte G6 MF: NVIDIA GeForce RTX 4050 Laptop GPU, 16.00", 2.3 kg
Autres tests » Gigabyte G6 MF
Asus ExpertBook P3 P3605CVA: Intel UHD Graphics 64EUs (Alder Lake 12th Gen), 16.00", 1.8 kg
Autres tests » Asus ExpertBook P3 P3605CVA
Asus ExpertBook P1 P1403CVA: Intel UHD Graphics 64EUs (Alder Lake 12th Gen), 14.00", 1.4 kg
Autres tests » Asus ExpertBook P1 P1403CVA
Asus ExpertBook P1 P1503CVA, i7-13620H: Intel UHD Graphics 64EUs (Alder Lake 12th Gen), 15.60", 1.6 kg
Autres tests » Asus ExpertBook P1 P1503CVA, i7-13620H
Alienware x14 R2: NVIDIA GeForce RTX 4060 Laptop GPU, 14.00", 1.9 kg
Autres tests » Alienware x14 R2
MSI Katana 15 B13UDXK: NVIDIA GeForce RTX 3050 6GB Laptop GPU, 15.60", 2.3 kg
Autres tests » MSI Katana 15 B13UDXK
Asus TUF Gaming F15 FX507VI: NVIDIA GeForce RTX 4070 Laptop GPU, 15.60", 2.2 kg
Autres tests » Asus TUF Gaming F15 FX507VI
Lenovo IdeaPad Slim 5 16IRL8: Intel UHD Graphics 64EUs (Alder Lake 12th Gen), 16.00", 1.9 kg
Autres tests » Lenovo IdeaPad Slim 5 16IRL8
Gigabyte G6 KF: NVIDIA GeForce RTX 4060 Laptop GPU, 16.00", 2.3 kg
Autres tests » Gigabyte G6 KF
Acer Aspire 3D 15 SpatialLabs Edition A3D15-71GM: NVIDIA GeForce RTX 4050 Laptop GPU, 15.60", 2.3 kg
Autres tests » Acer Aspire 3D 15 SpatialLabs Edition A3D15-71GM
MSI Thin 15 B13VE: NVIDIA GeForce RTX 4050 Laptop GPU, 15.60", 1.9 kg
Autres tests » MSI Thin 15 B13VE
Asus TUF Gaming F17 FX707VU: NVIDIA GeForce RTX 4050 Laptop GPU, 17.30", 2.6 kg
Autres tests » Asus TUF Gaming F17 FX707VU
Lenovo IdeaPad Slim 3 15IRH8, i7-13620H: Intel UHD Graphics 64EUs (Alder Lake 12th Gen), 15.60", 1.6 kg
Autres tests » Lenovo IdeaPad Slim 3 15IRH8, i7-13620H
MSI Cyborg 14 A13VE: NVIDIA GeForce RTX 4060 Laptop GPU, 14.00", 1.6 kg
Autres tests » MSI Cyborg 14 A13VE
Lenovo IdeaPad Slim 5 14IRL8: Intel UHD Graphics 64EUs (Alder Lake 12th Gen), 14.00", 1.5 kg
Autres tests » Lenovo IdeaPad Slim 5 14IRL8
Acer Nitro V 15 ANV15-51, i7-13620H: NVIDIA GeForce RTX 4050 Laptop GPU, 15.60", 2.1 kg
Autres tests » Acer Nitro V 15 ANV15-51, i7-13620H
MSI Stealth 16 Studio A13VG, i7-13620H: NVIDIA GeForce RTX 4060 Laptop GPU, 17.30", 2.8 kg
Autres tests » MSI Stealth 16 Studio A13VG, i7-13620H
MSI Stealth 15 A13VF: NVIDIA GeForce RTX 4060 Laptop GPU, 15.60", 2.1 kg
Autres tests » MSI Stealth 15 A13VF
Alienware x14 R2 2023, RTX 4060: NVIDIA GeForce RTX 4060 Laptop GPU, 14.00", 1.9 kg
Autres tests » Alienware x14 R2 2023, RTX 4060
MSI Katana 17 B13VGK: NVIDIA GeForce RTX 4070 Laptop GPU, 17.30", 2.6 kg
Autres tests » MSI Katana 17 B13VGK
Lenovo LOQ 15IRH8 Core i7: NVIDIA GeForce RTX 4050 Laptop GPU, 15.60", 2.4 kg
Autres tests » Lenovo LOQ 15IRH8, i7-13620H RTX 4050
MSI Cyborg 15 A13VE: NVIDIA GeForce RTX 4050 Laptop GPU, 15.60", 2 kg
Autres tests » MSI Cyborg 15 A13VE
Lenovo LOQ 16IRH8, i7-13620H RTX 4050: NVIDIA GeForce RTX 4050 Laptop GPU, 16.00", 2.6 kg
Autres tests » Lenovo LOQ 16IRH8, i7-13620H RTX 4050
Lenovo LOQ 16IRH8: NVIDIA GeForce RTX 4060 Laptop GPU, 16.00", 2.7 kg
Autres tests » Lenovo LOQ 16IRH8
MSI Cyborg 15 A13VF: NVIDIA GeForce RTX 4060 Laptop GPU, 15.60", 2 kg
Autres tests » MSI Cyborg 15 A13VF
MSI Stealth 14 Studio A13VG, i7-13620H: NVIDIA GeForce RTX 4070 Laptop GPU, 14.00", 1.7 kg
Autres tests » MSI Stealth 14 Studio A13VG, i7-13620H
MSI Stealth 16 Studio A13VF: NVIDIA GeForce RTX 4060 Laptop GPU, 16.00", 2 kg
Autres tests » MSI Stealth 16 Studio A13VF
Lenovo LOQ 15IRH8, i7-13620H: NVIDIA GeForce RTX 4060 Laptop GPU, 15.60", 2.4 kg
Autres tests » Lenovo LOQ 15IRH8, i7-13620H
MSI Katana 17 B13VFK: NVIDIA GeForce RTX 4060 Laptop GPU, 17.30", 2.8 kg
Autres tests » MSI Katana 17 B13VFK
MSI Katana 15 B13VEK: NVIDIA GeForce RTX 4050 Laptop GPU, 15.60", 2.3 kg
Autres tests » MSI Katana 15 B13VEK
MSI Katana 15 B13VFK: NVIDIA GeForce RTX 4060 Laptop GPU, 15.60", 2.3 kg
Autres tests » MSI Katana 15 B13VFK
Asus ROG Zephyrus G16 GU603VV: NVIDIA GeForce RTX 4060 Laptop GPU, 16.00", 2 kg
Autres tests » Asus ROG Zephyrus G16 GU603VV
Alienware x14 R2 2023: NVIDIA GeForce RTX 4050 Laptop GPU, 14.00", 1.9 kg
Autres tests » Alienware x14 R2 2023
MSI Katana 15 B13VGK: NVIDIA GeForce RTX 4070 Laptop GPU, 15.60", 2.3 kg
Autres tests » MSI Katana 15 2023 B13VGK