Verdict : beaucoup plus léger que l'Aurora 16X
L'Alienware 16 Aurora fait quelques compromis par rapport à l'Alienware 16X Aurora, plus cher 16X Aurora. Si les baisses de performances sont prévisibles, l'impact sur les temps de réponse noir-blanc est plus difficile à accepter pour les joueurs, car l'image fantôme peut devenir perceptible dans les jeux rapides. C'est un aspect clé que des concurrents comme le Gigabyte Gaming A16 ou Asus TUF Gaming A16 sont plus performants. D'autres petites omissions incluent les touches RGB et la prise en charge de G-Sync et Thunderbolt, mais le budget ciblé et les joueurs de milieu de gamme sont moins susceptibles de manquer de telles commodités.
Ce modèle présente quelques avantages notables. Comme il est livré avec un matériel moins exigeant que le 16X Aurora, le 16 Aurora est plus fin, avec une autonomie de batterie plus longue et un adaptateur secteur plus petit pour faciliter le transport. Ces avantages sont notables car le 16X Aurora peut être quelque peu encombrant.
En ce qui concerne ses capacités de jeu, la 16 Aurora peut avoir du mal à faire tourner des titres exigeants à la résolution native de 2K, car le GPU mobile RTX 5060 est plutôt orienté vers le 1080p. L'activation du DLSS et de la génération d'images avec des paramètres plus bas est essentielle pour maximiser le potentiel du GPU RTX 5060. Sinon, les performances de jeu ne représentent qu'une amélioration marginale par rapport aux anciennes options RTX 4060.
Points positifs
Points négatifs
Prix et disponibilité
Dell livre dès à présent l'Alienware 16 Aurora au prix de 1100$, comme indiqué dans la revue. Des configurations plus modestes avec la RTX 4050 ou la RTX 5050 sont également disponibles. Des configurations sont également disponibles sur Amazon à partir de 1300$.
- $1,399.00Alienware 16 Aurora Laptop AC16250-16-inch 16:10 WQXGA Display, Intel Core 7-240H Series 2, 16GB DDR5 RAM, 1TB SSD, NVIDIA GeForce RTX 5060 8GB GDDR7, Windows 11 Home, Onsite Service - Blue
- $2,306.87Alienware 16 Aurora Gaming Laptop AC16250-16-inch WQXGA 120Hz Display, Intel Core 9-270H Processor, 32GB DDR5 RAM, 1TB SSD, NVIDIA GeForce RTX 5070 Graphics, Windows 11 Home - Blue
- $1,398.99Dell Alienware 16 Aurora Gaming Laptop AC16250, 16" WQXGA Display, NVIDIA GeForce RTX 5050, Intel Core 7-240H, 16GB RAM, 1TB SSD, Backlit Keyboard, with Lifetime MS Office, Wins 11 Pro
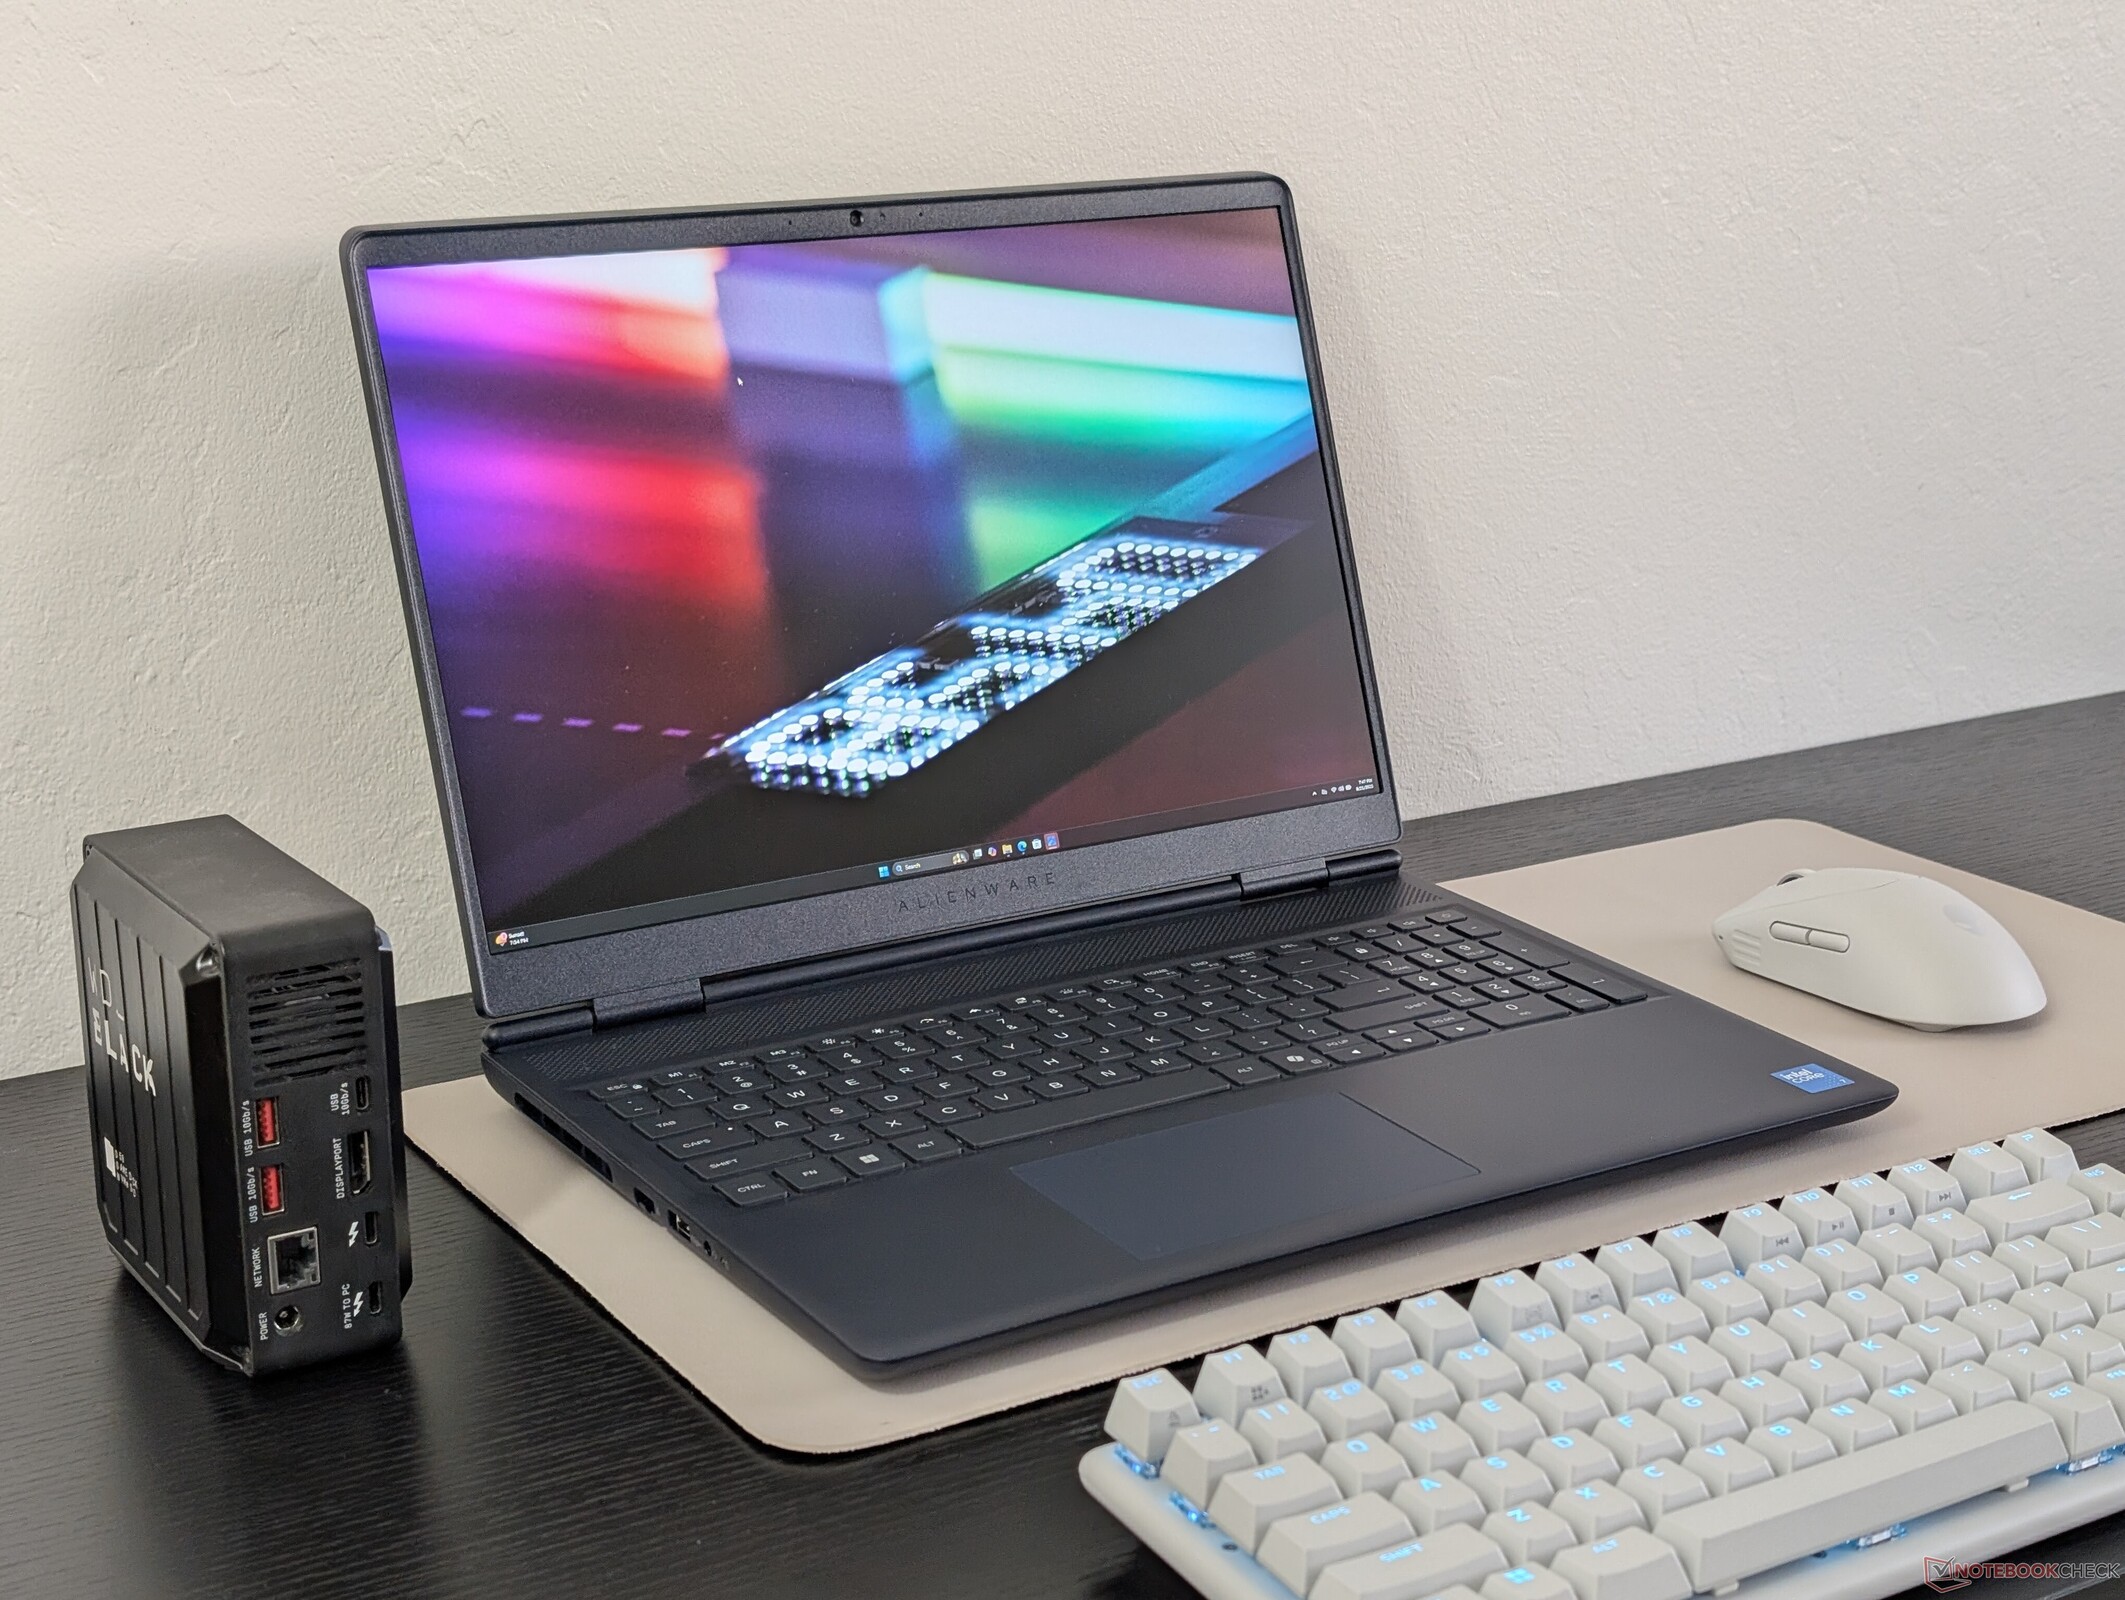
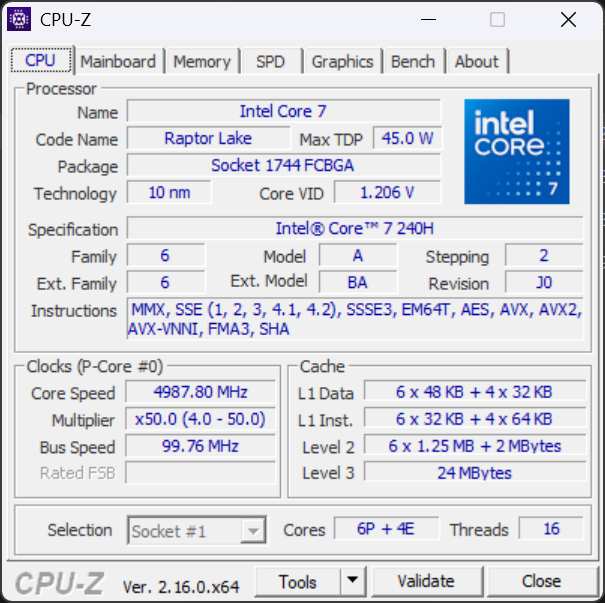
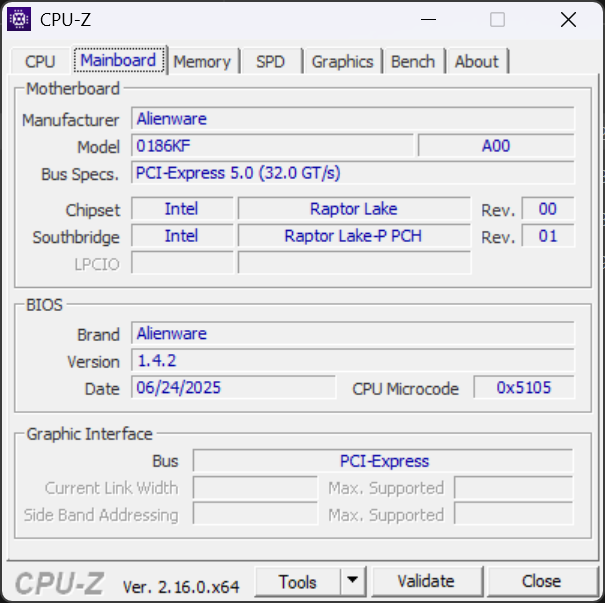
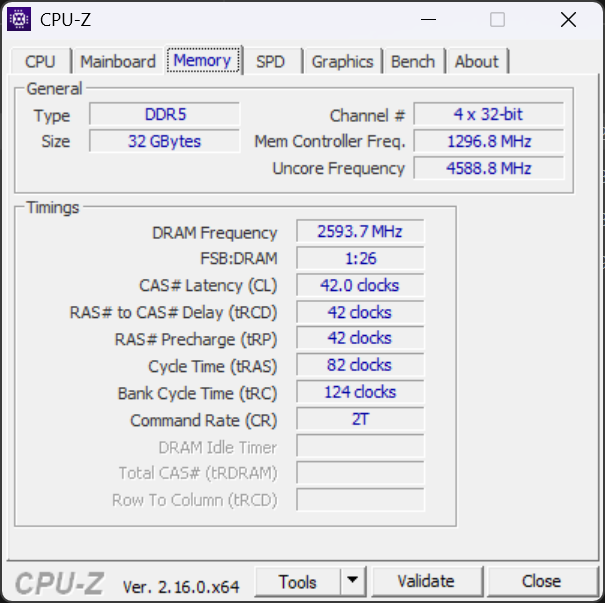
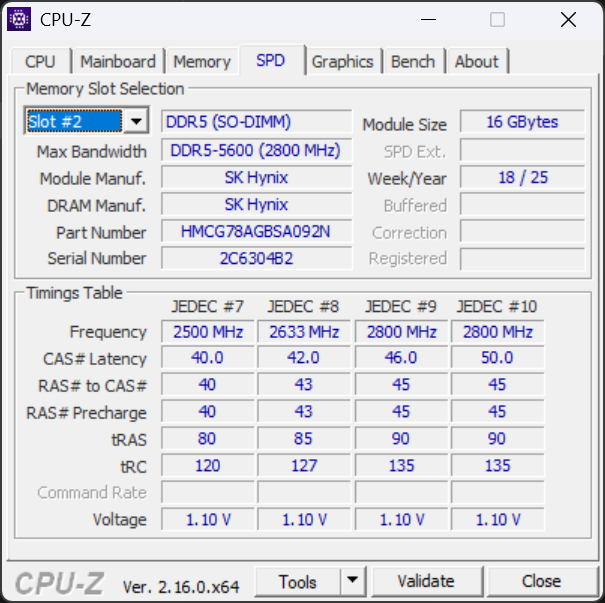
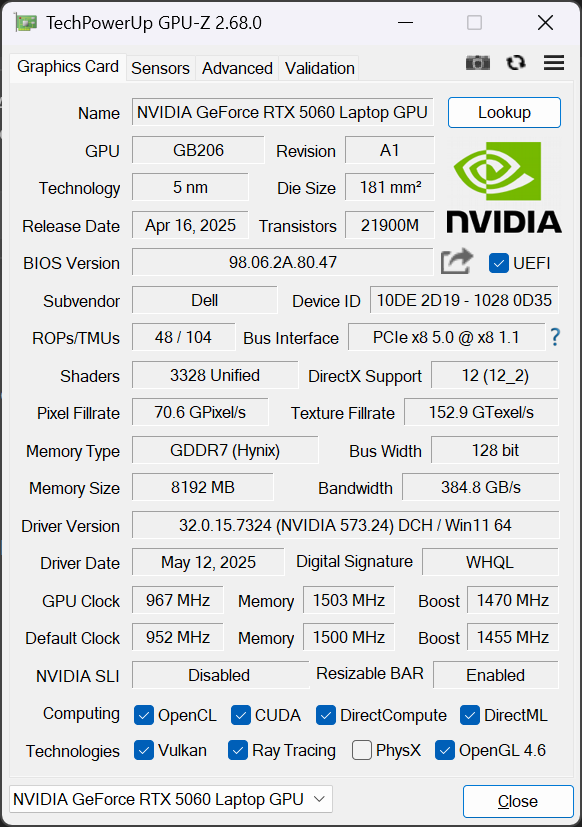
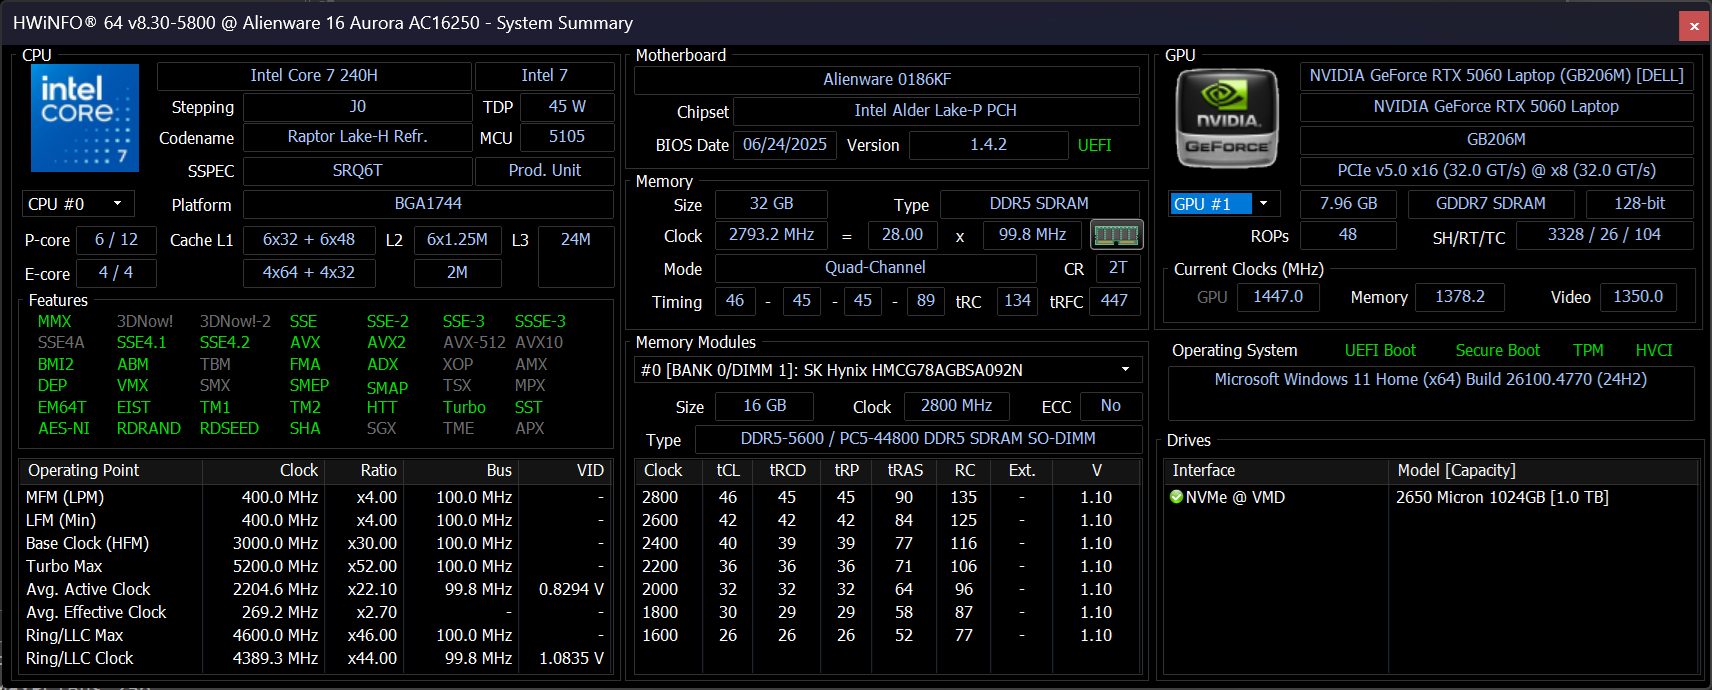
L'Alienware 16 Aurora est la version la plus abordable de l'Alienware 16X Aurora Alienware 16X Aurora. Il est livré avec le CPU Raptor Lake Core 7 240H, le GPU GeForce RTX 5060 de 80 W et un écran 1600p120 sRGB au lieu du Core Lake Arrow Ultra 9 275HX, de la RTX 5070 de 115 W et de l'écran P3 1600p240 de l'Aurora 16X. Pour le reste, le système est visuellement presque identique au 16X Aurora.
Nous vous recommandons de consulter notre article sur le 16X Aurora pour en savoir plus sur les caractéristiques physiques du 16 Aurora. Cette page se concentre sur les principales différences entre les deux configurations auxquelles les utilisateurs peuvent s'attendre.
Les concurrents de l'Alienware 16 Aurora comprennent d'autres ordinateurs portables de jeu 16 pouces économiques comme le Lenovo Legion 5 16, MSI Sword 16mSI Sword 16 Asus ROG TUF series.
Plus d'avis sur Dell :
Spécifications
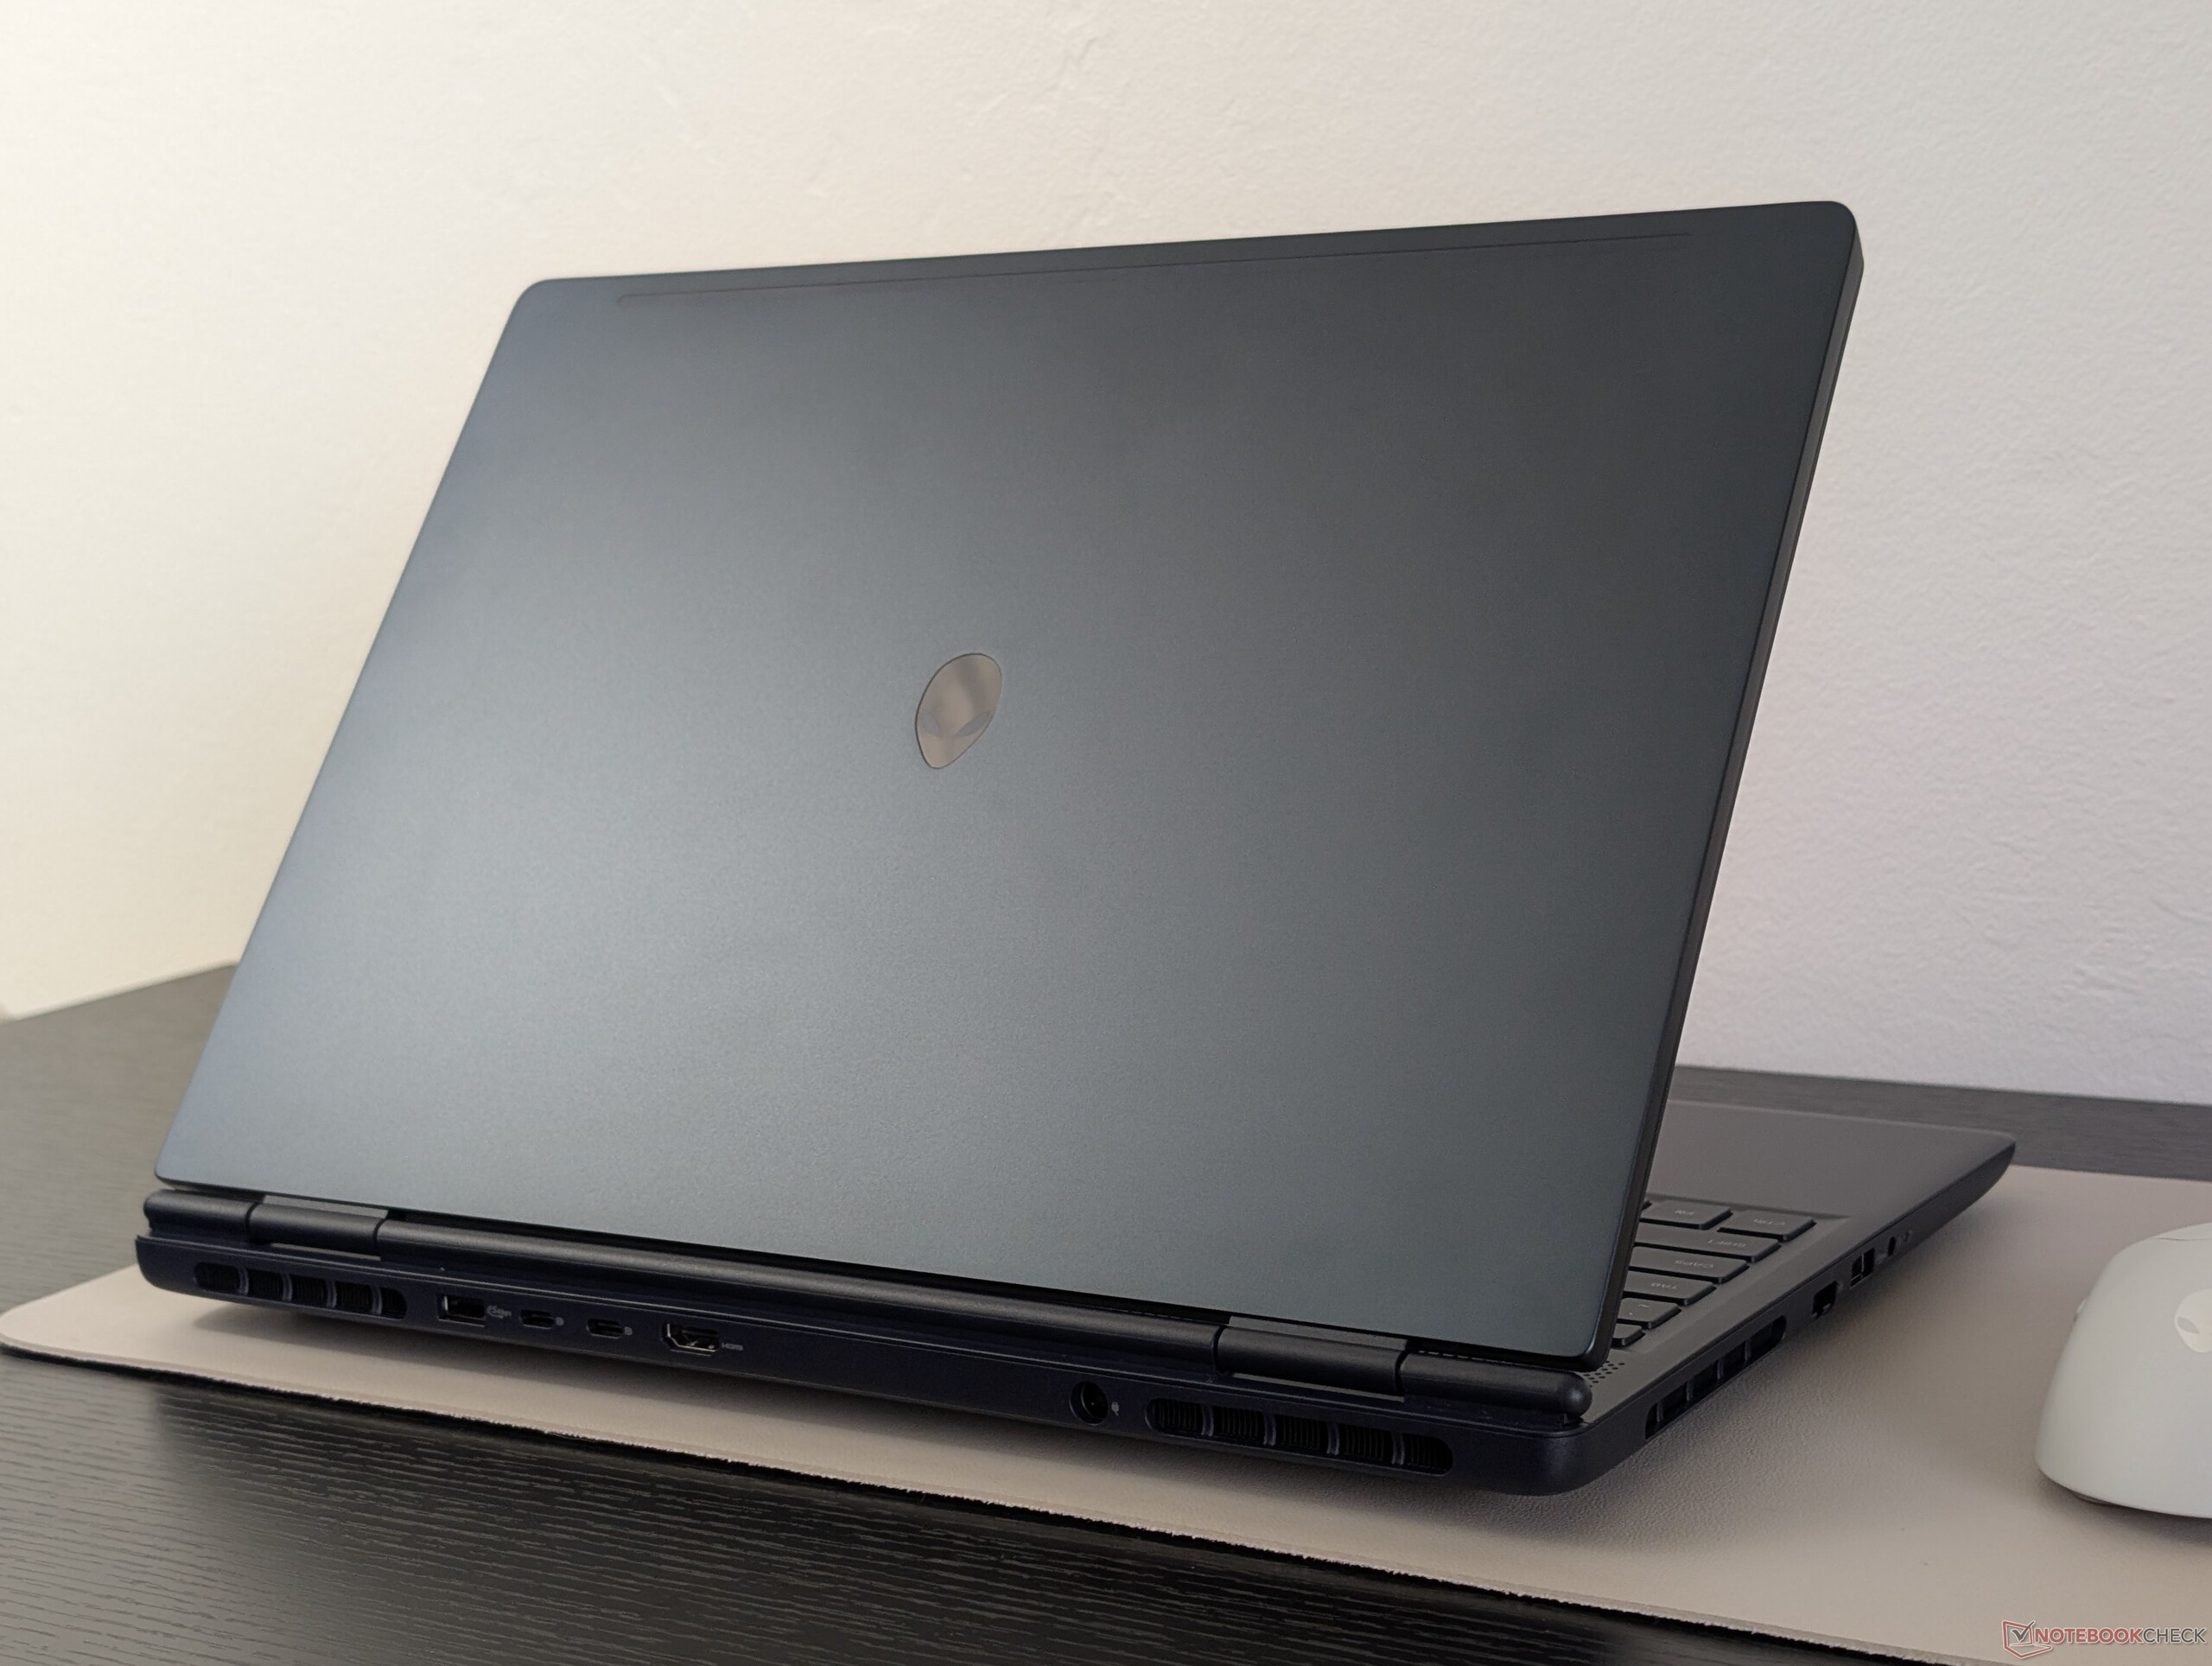
Cas
Bien que le châssis et le poids soient presque identiques à ceux du 16X Aurora, notez que le 16 Aurora est beaucoup plus fin (15,2 mm contre 23,4 mm). Les utilisateurs devront également garder à l'esprit que le 16 Aurora perd la prise en charge de Thunderbolt pour des capacités d'ancrage plus limitées.
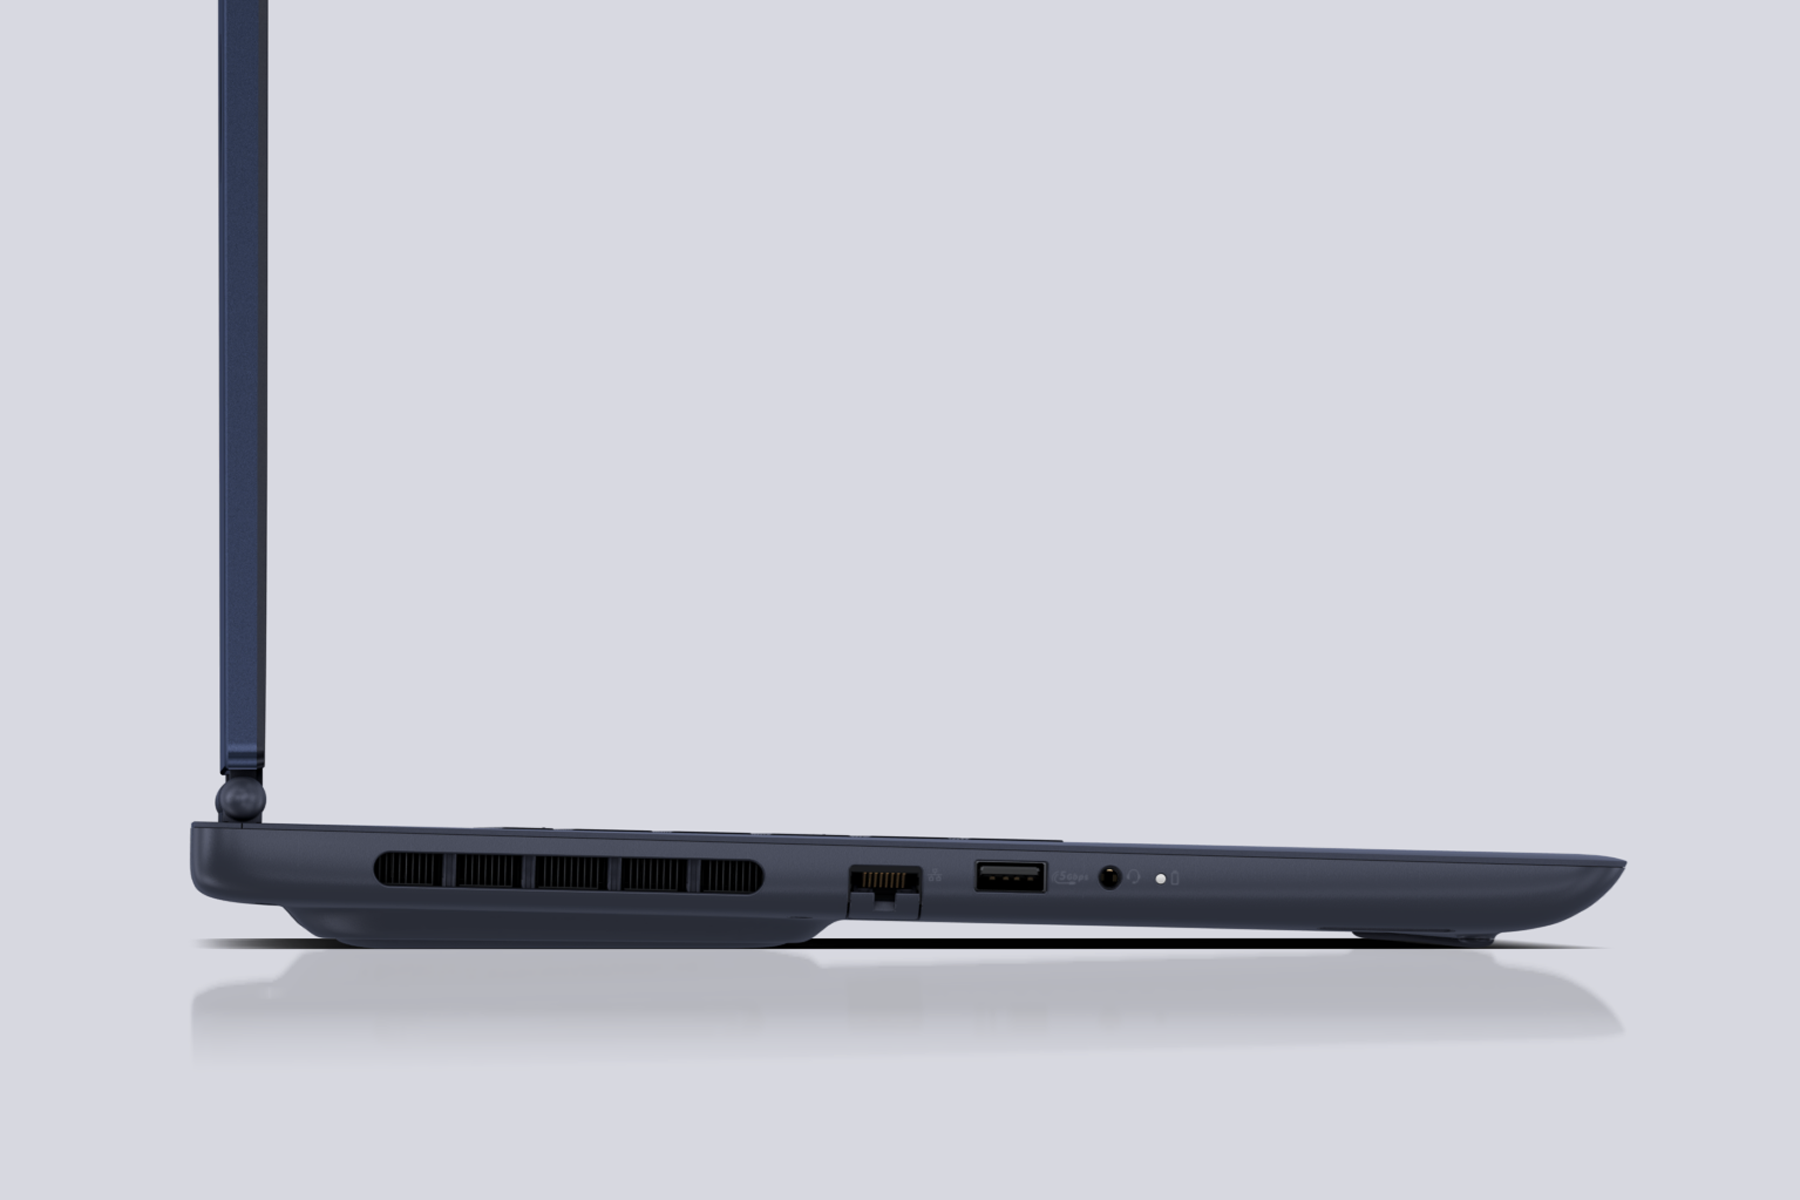
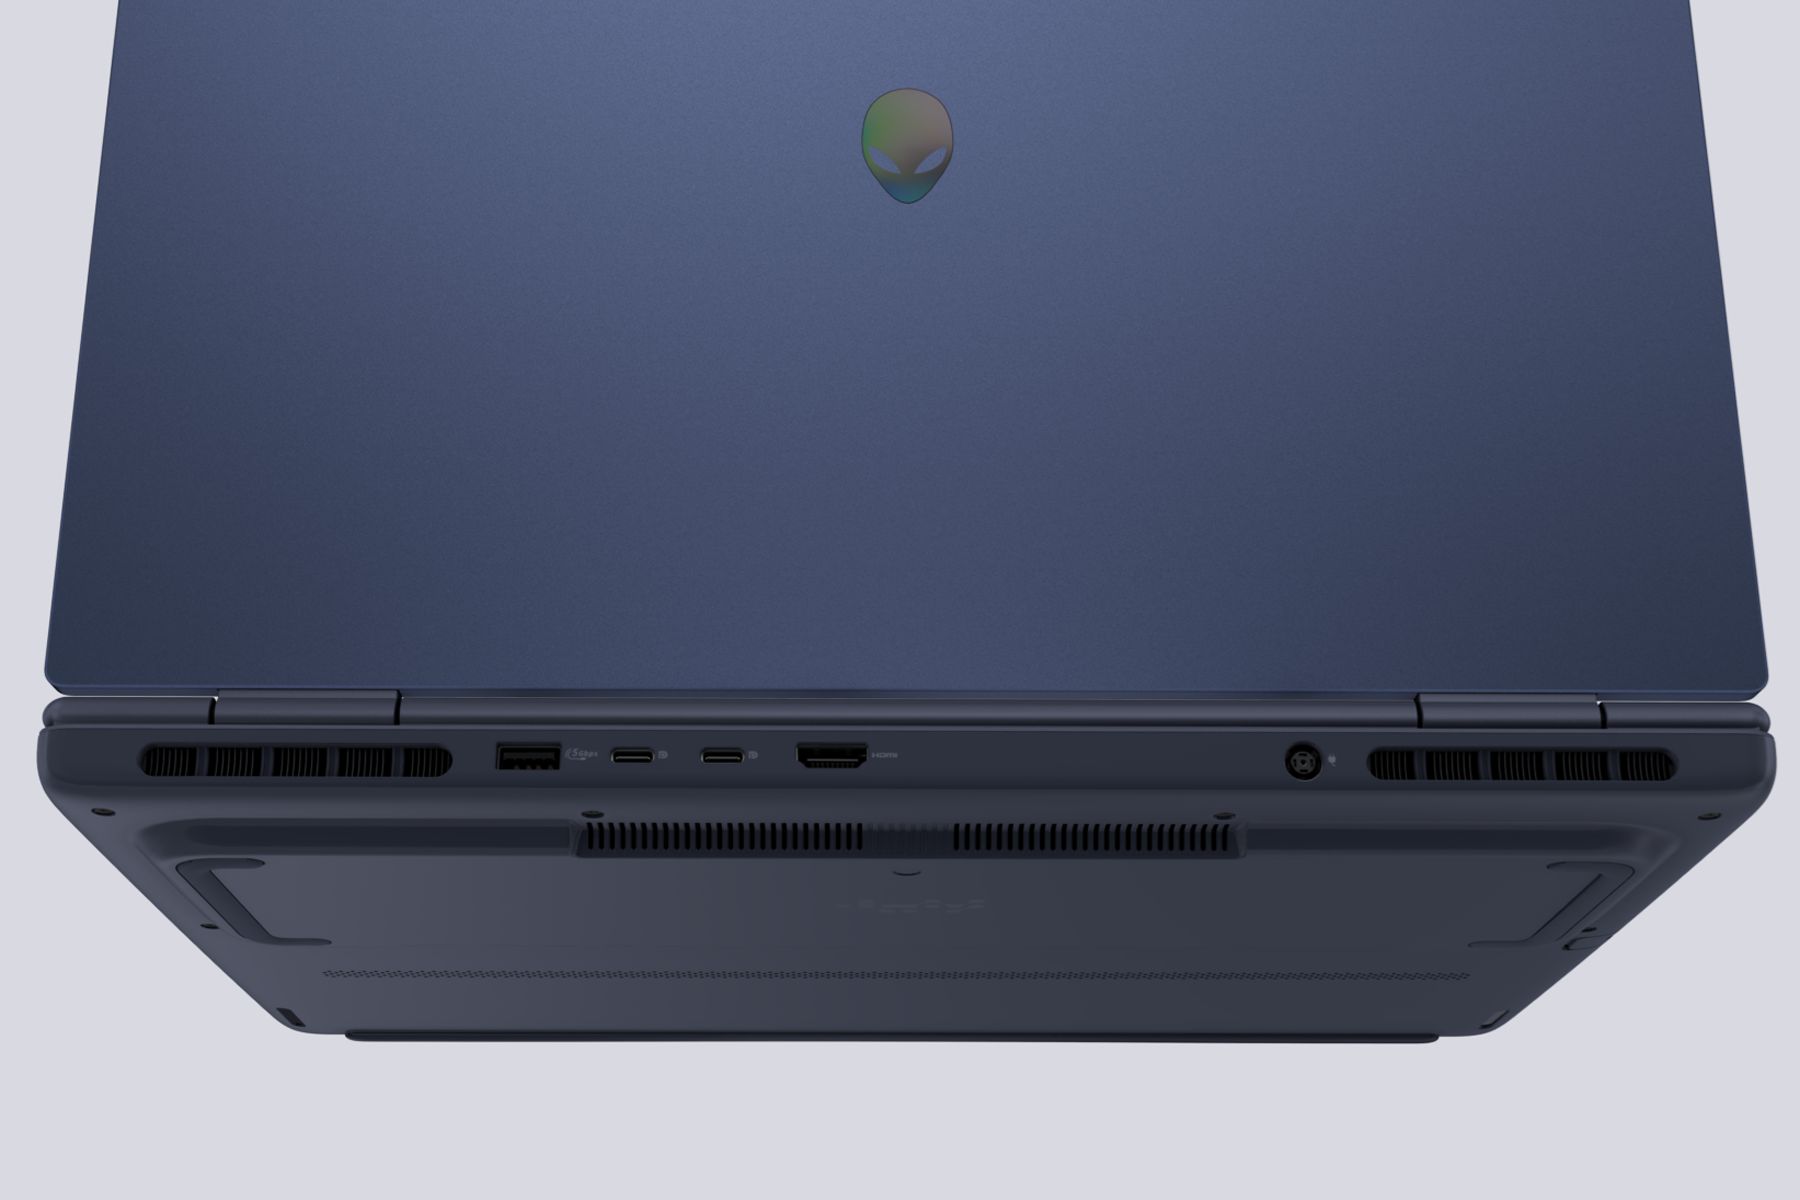
Connectivité
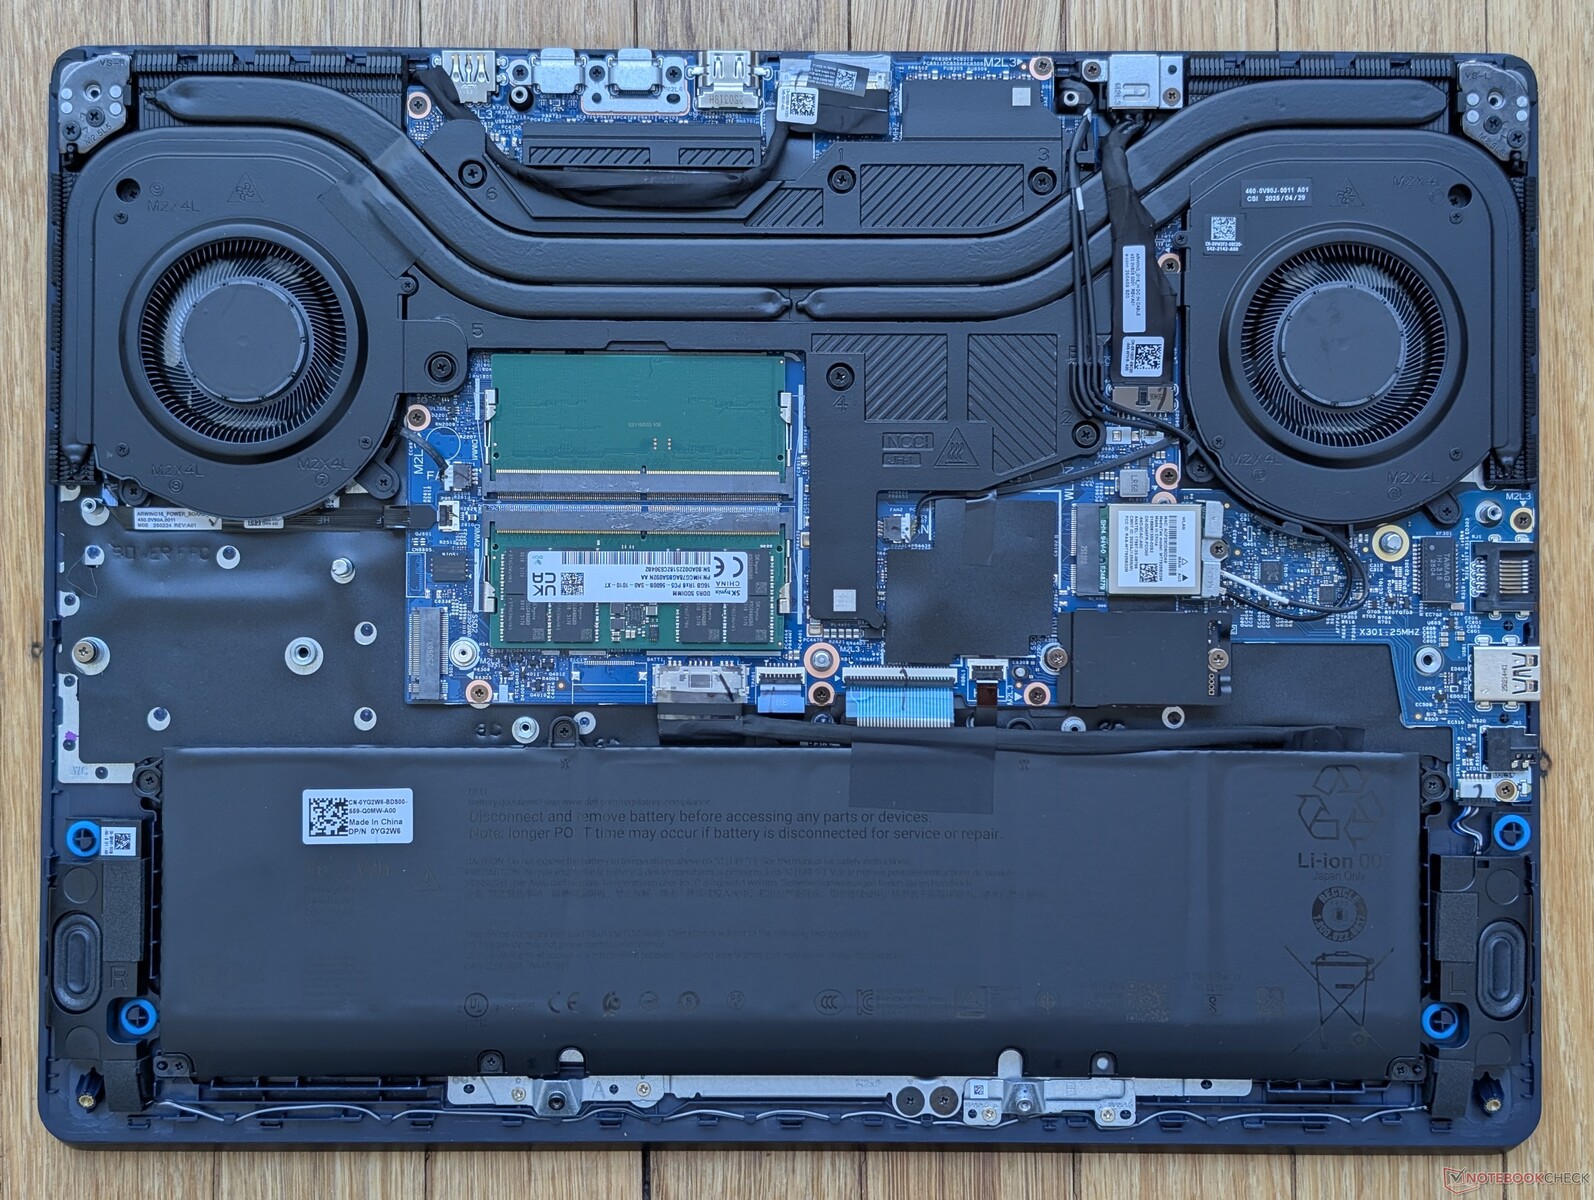
Maintenance
L'entretien est identique à celui de l'Aurora 16X, avec toutefois des changements modérés dans la solution de refroidissement.
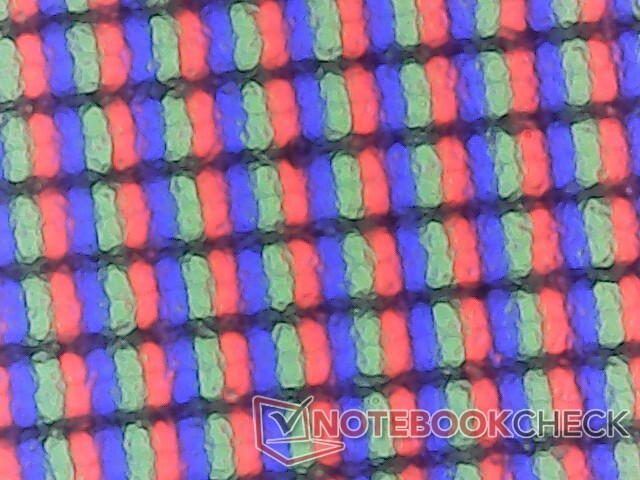
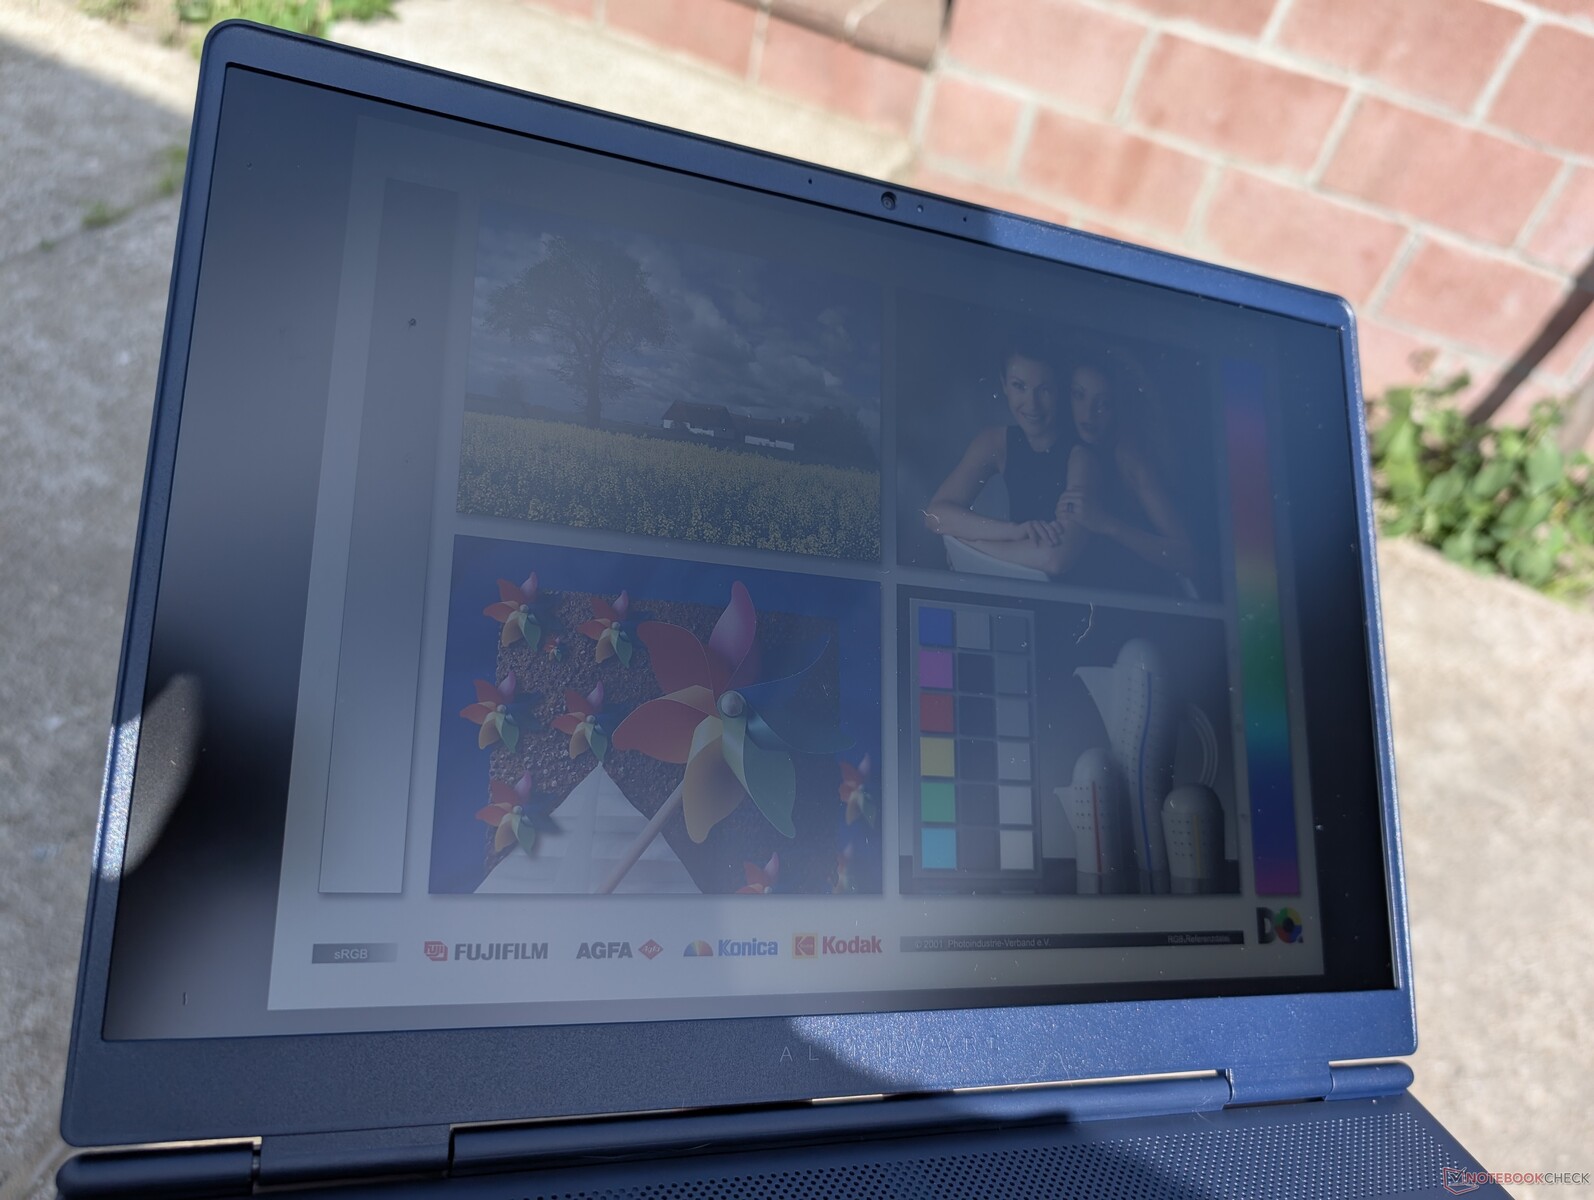
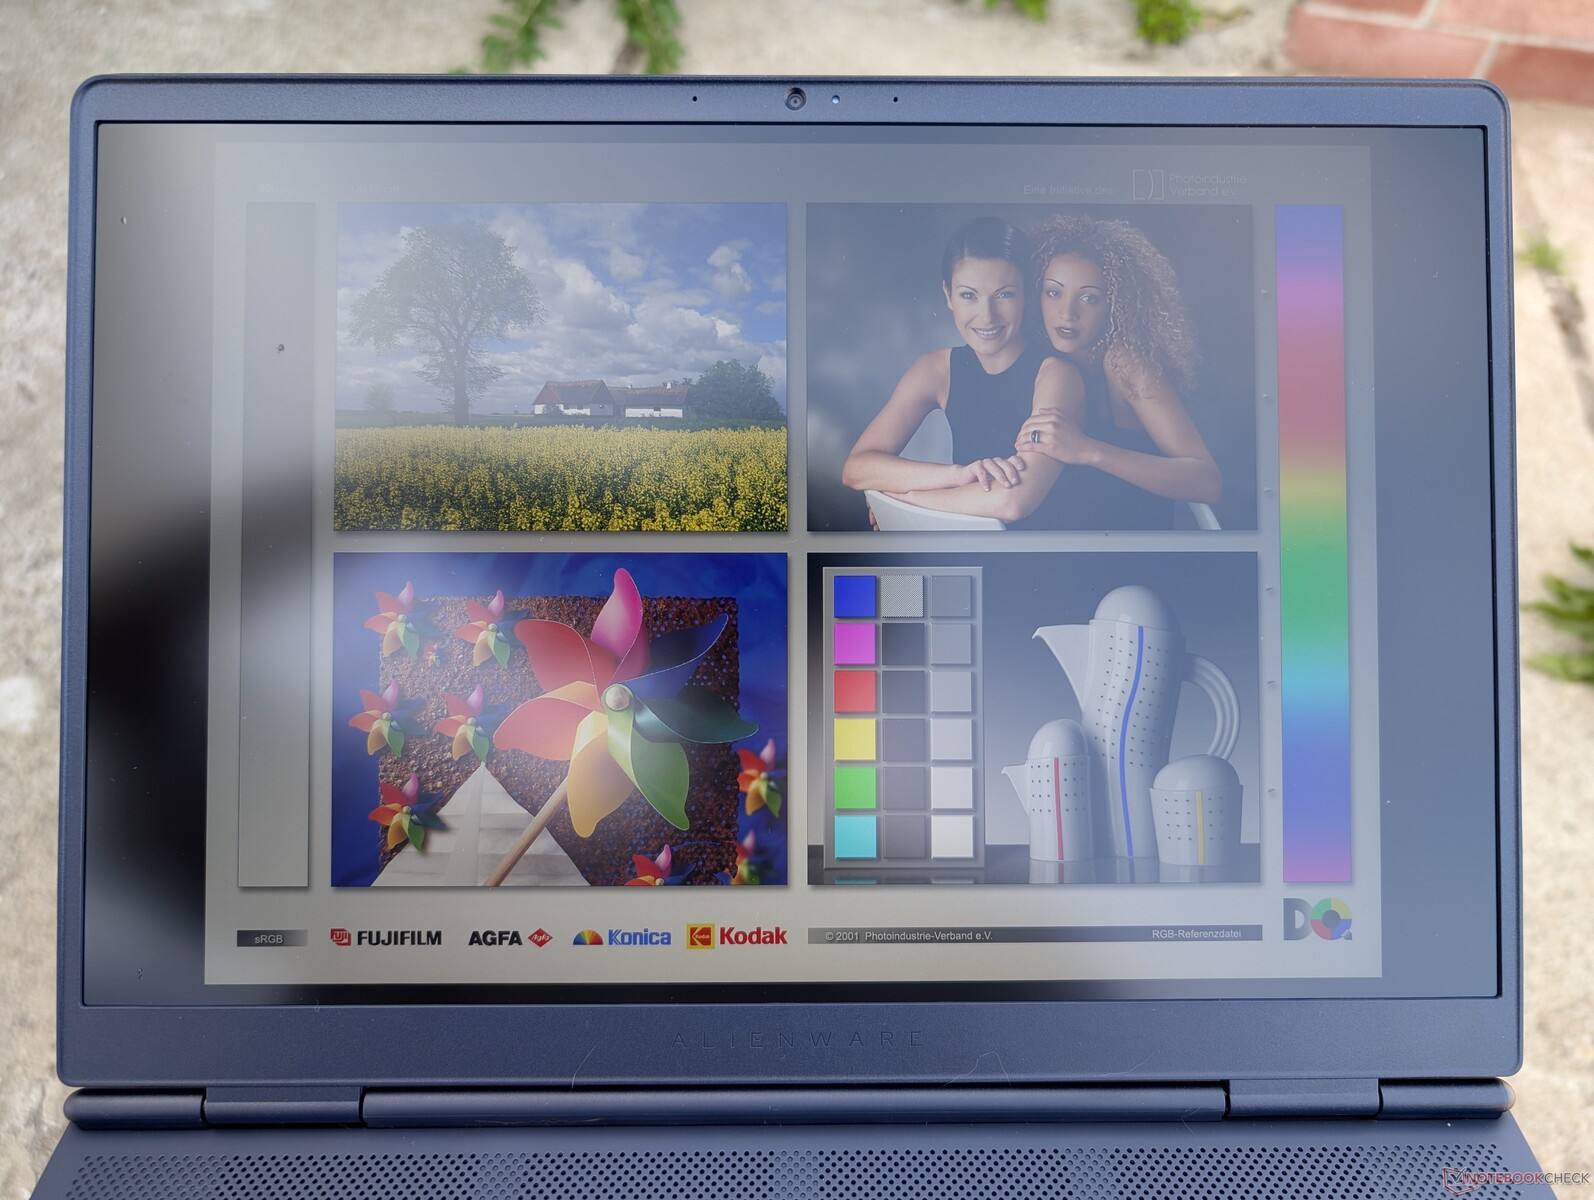
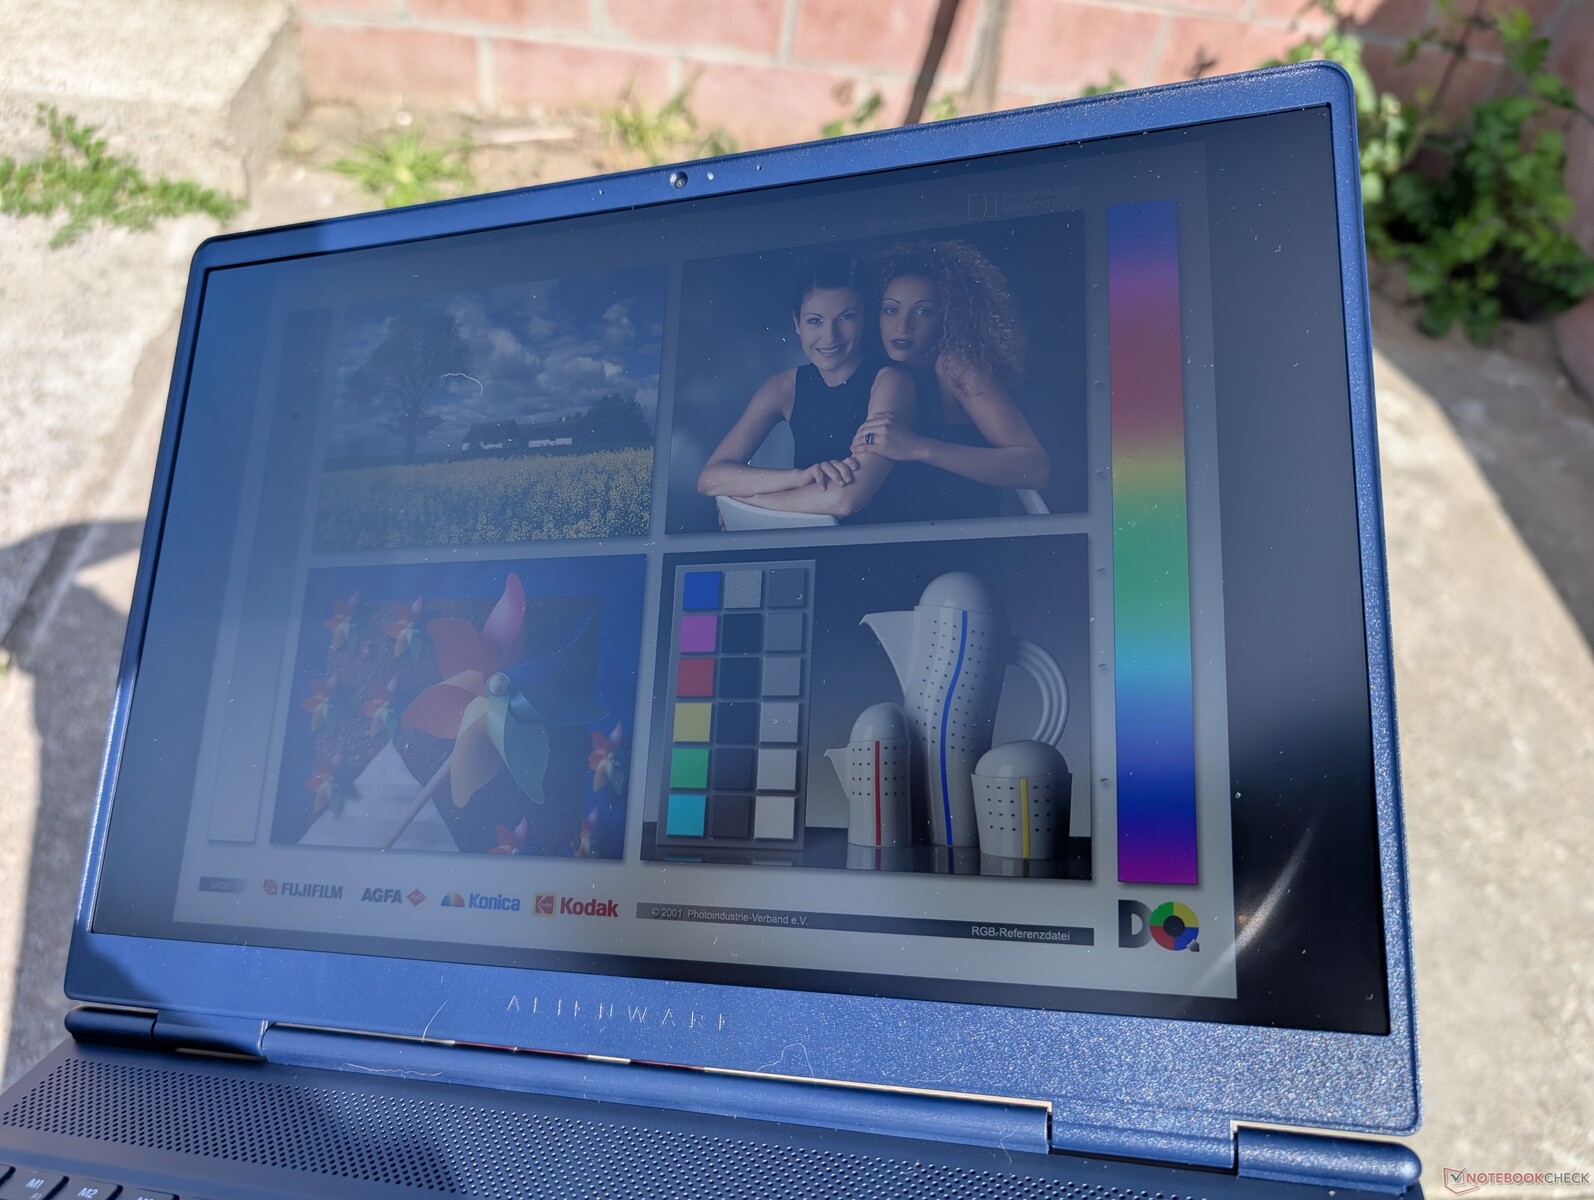
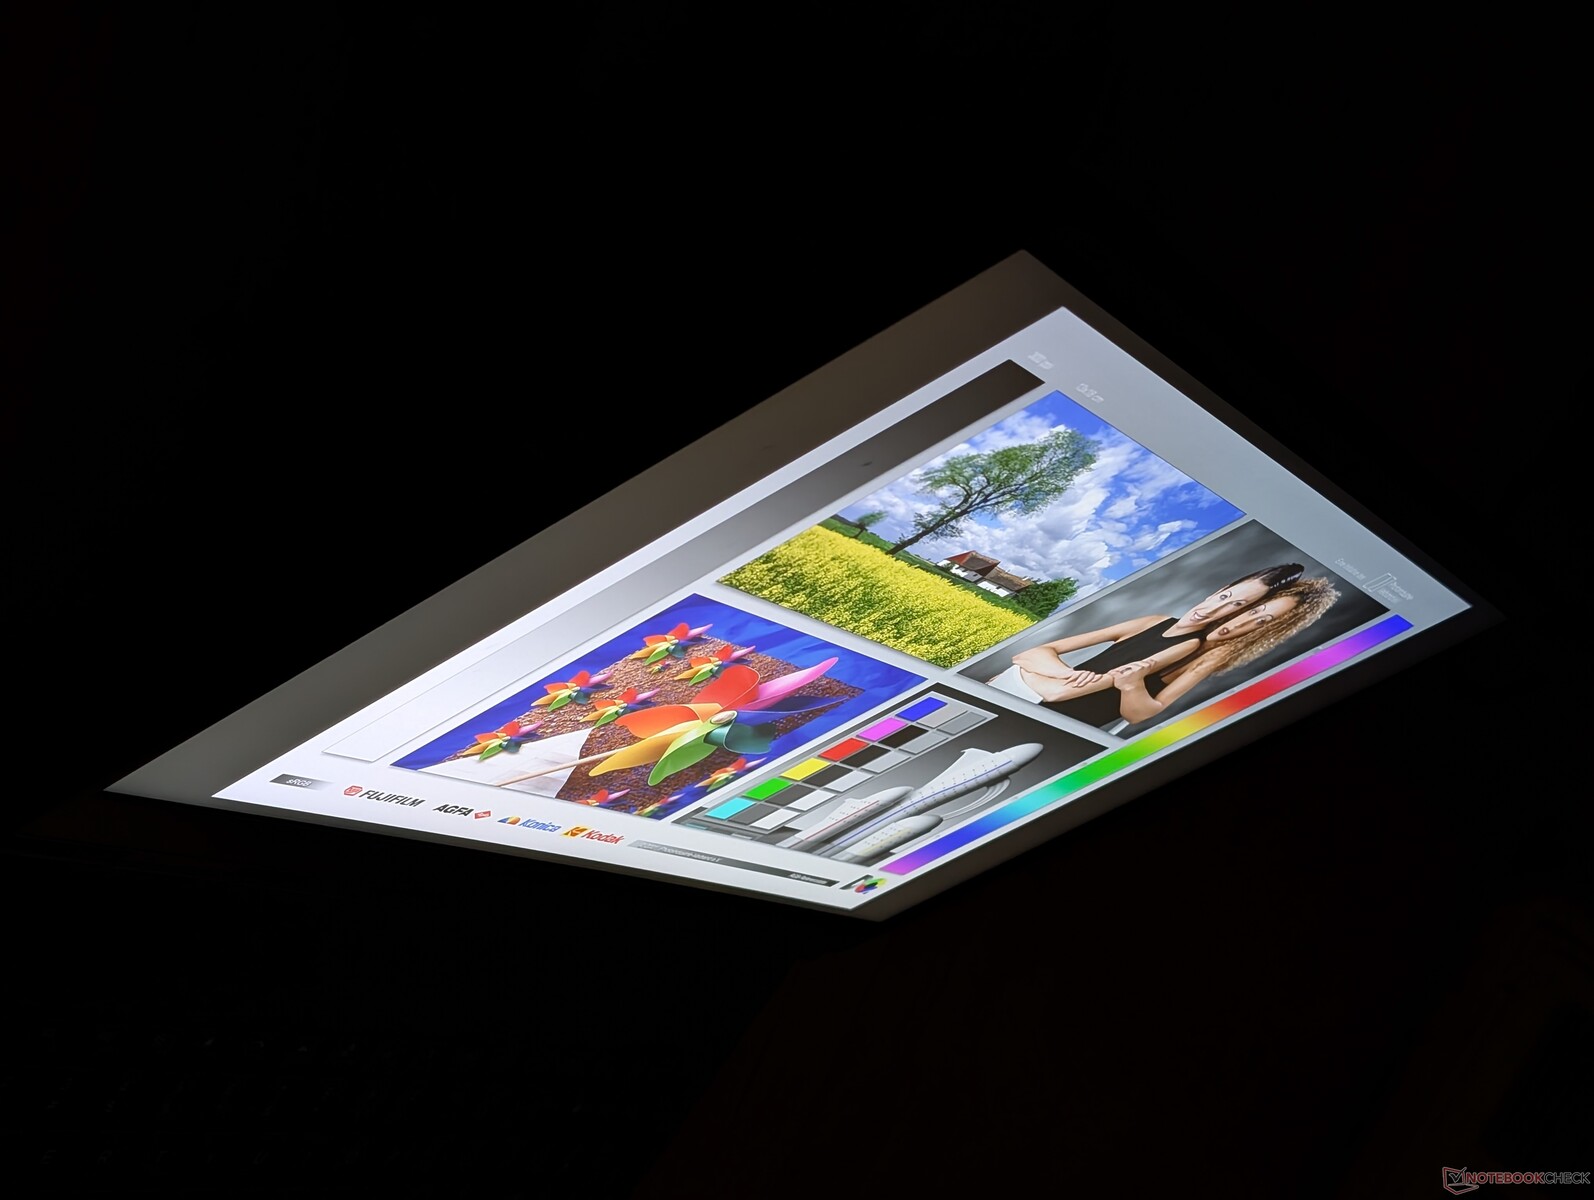
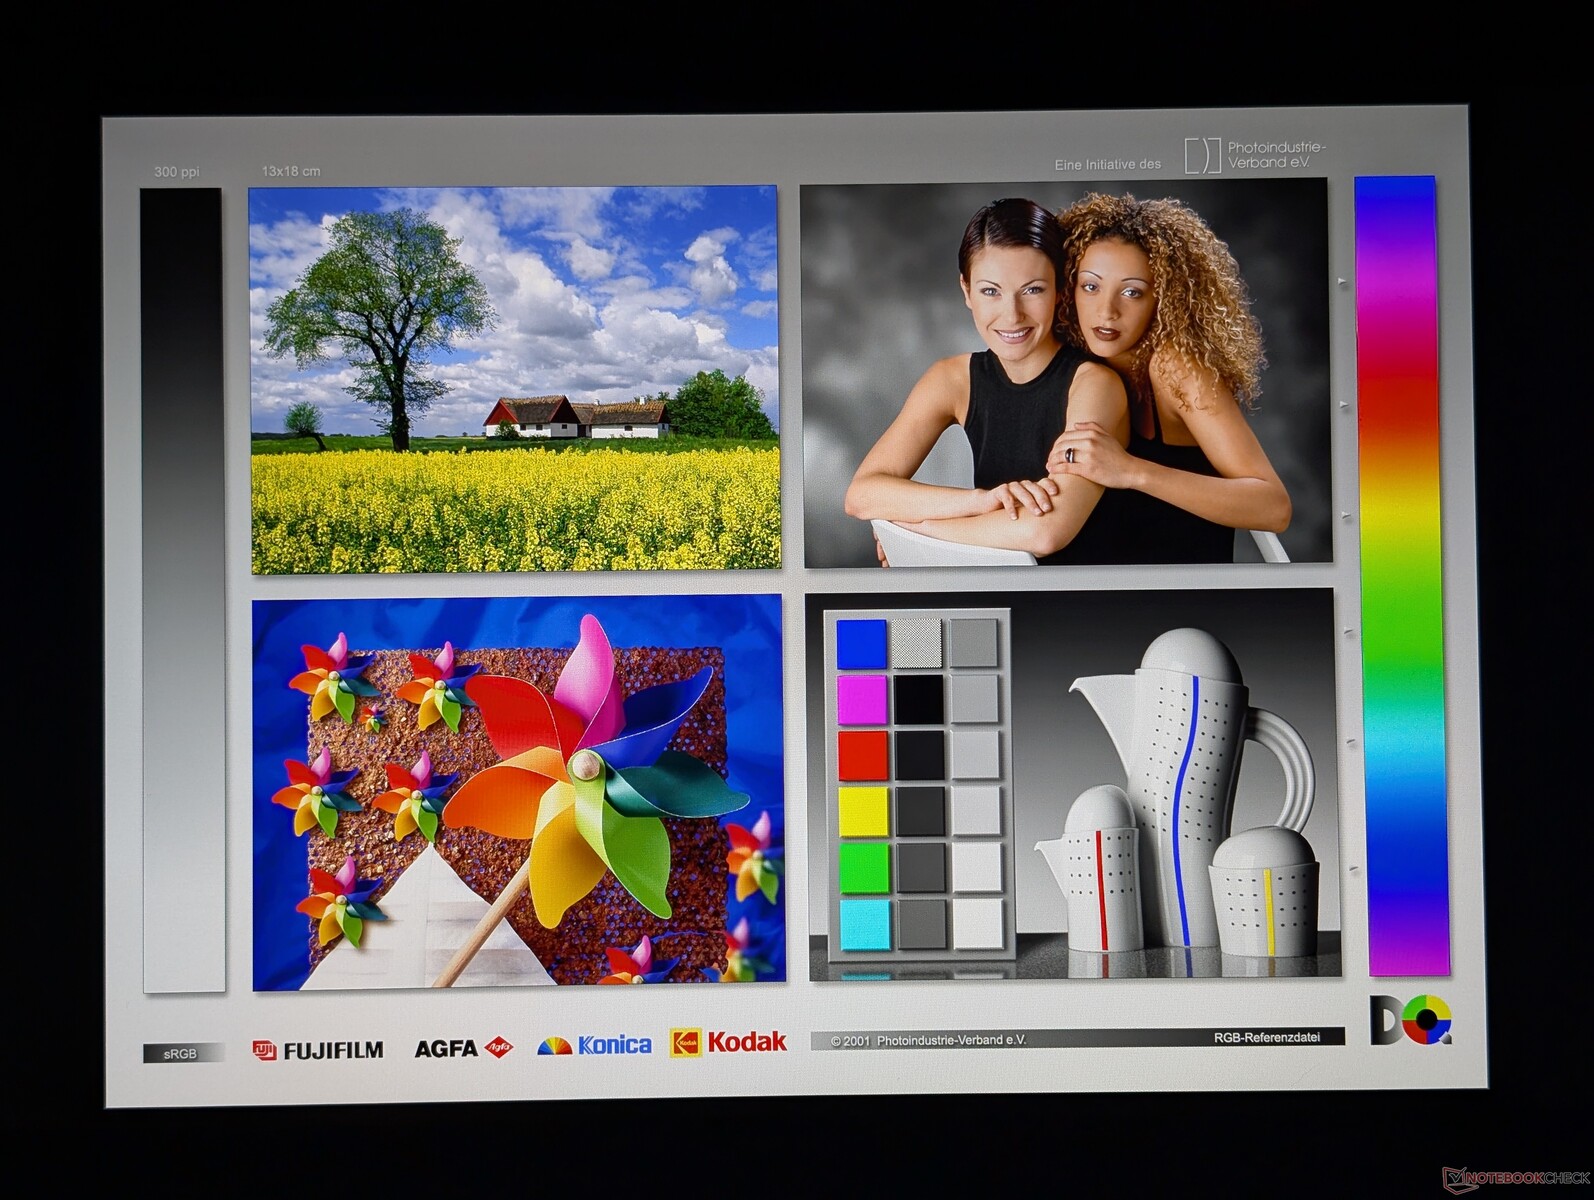
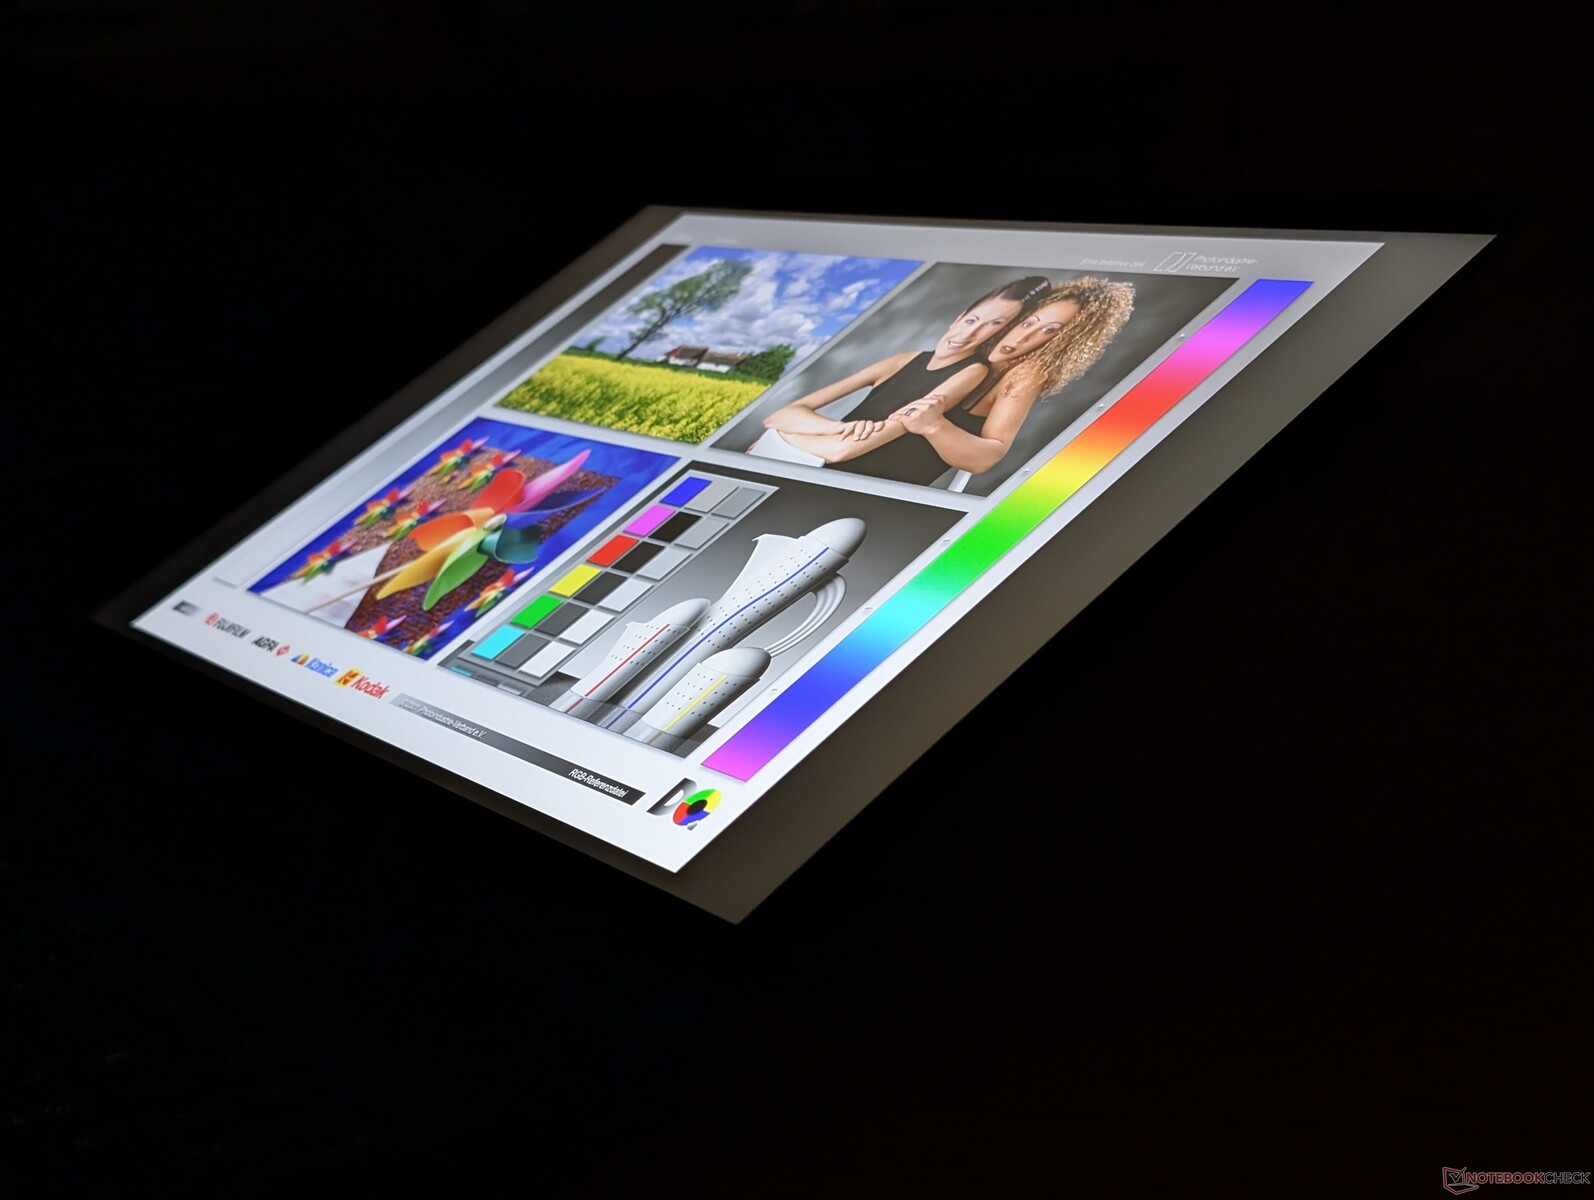
Affichage
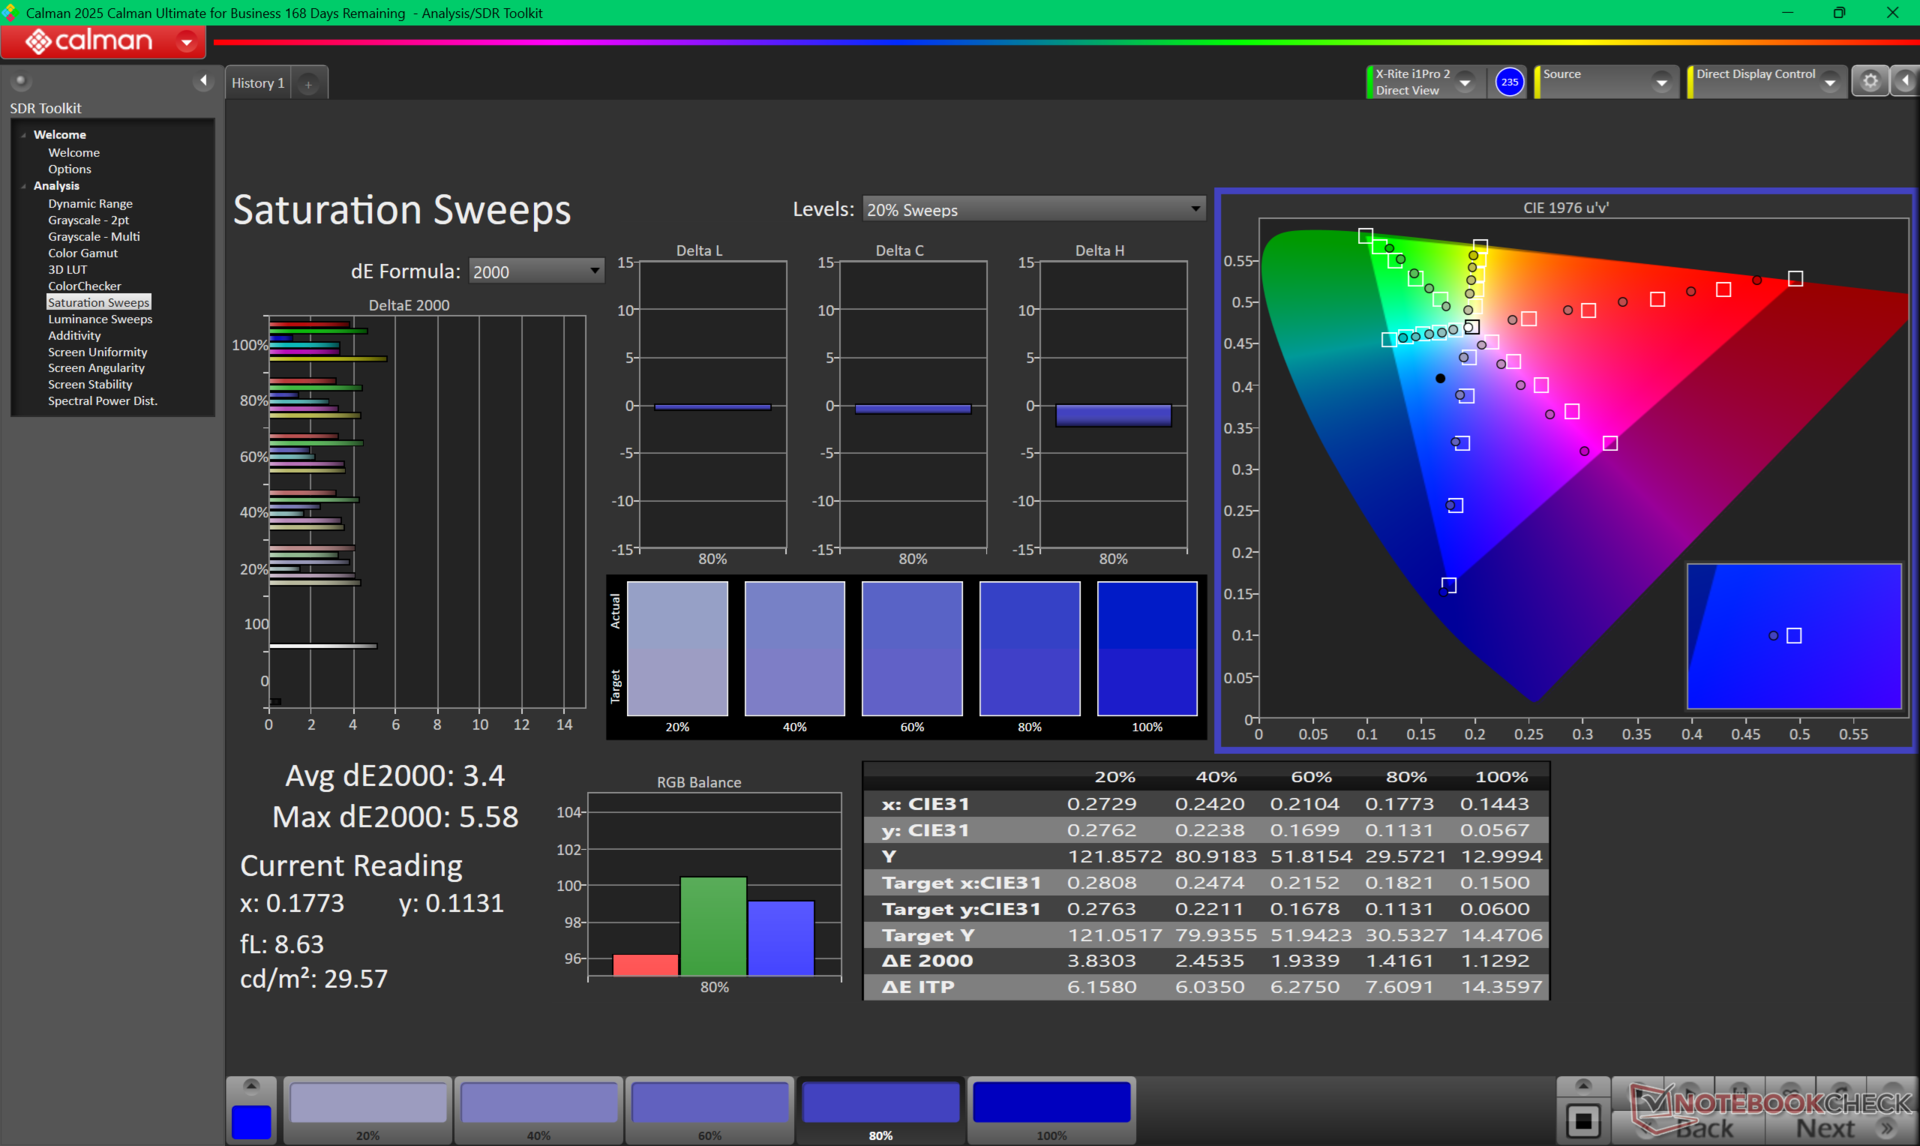
Alors que le 16X Aurora est livré avec un écran 1600p 240 Hz G-Sync avec des couleurs P3, le 16 Aurora est livré avec un écran 1600p 120 Hz avec des couleurs sRGB et pas de G-Sync. D'autres dégradations cachées incluent un écran plus faible (~500 nits contre ~350 nits) avec des temps de réponse noir-blanc et gris-gris significativement plus lents pour plus d'images fantômes lors des jeux. Ce dernier point est malheureusement perceptible dans les jeux de course rapide comme F1 24 ou dans les jeux de type FPS.

| |||||||||||||||||||||||||
Homogénéité de la luminosité: 88 %
Valeur mesurée au centre, sur batterie: 345.3 cd/m²
Contraste: 1501:1 (Valeurs des noirs: 0.23 cd/m²)
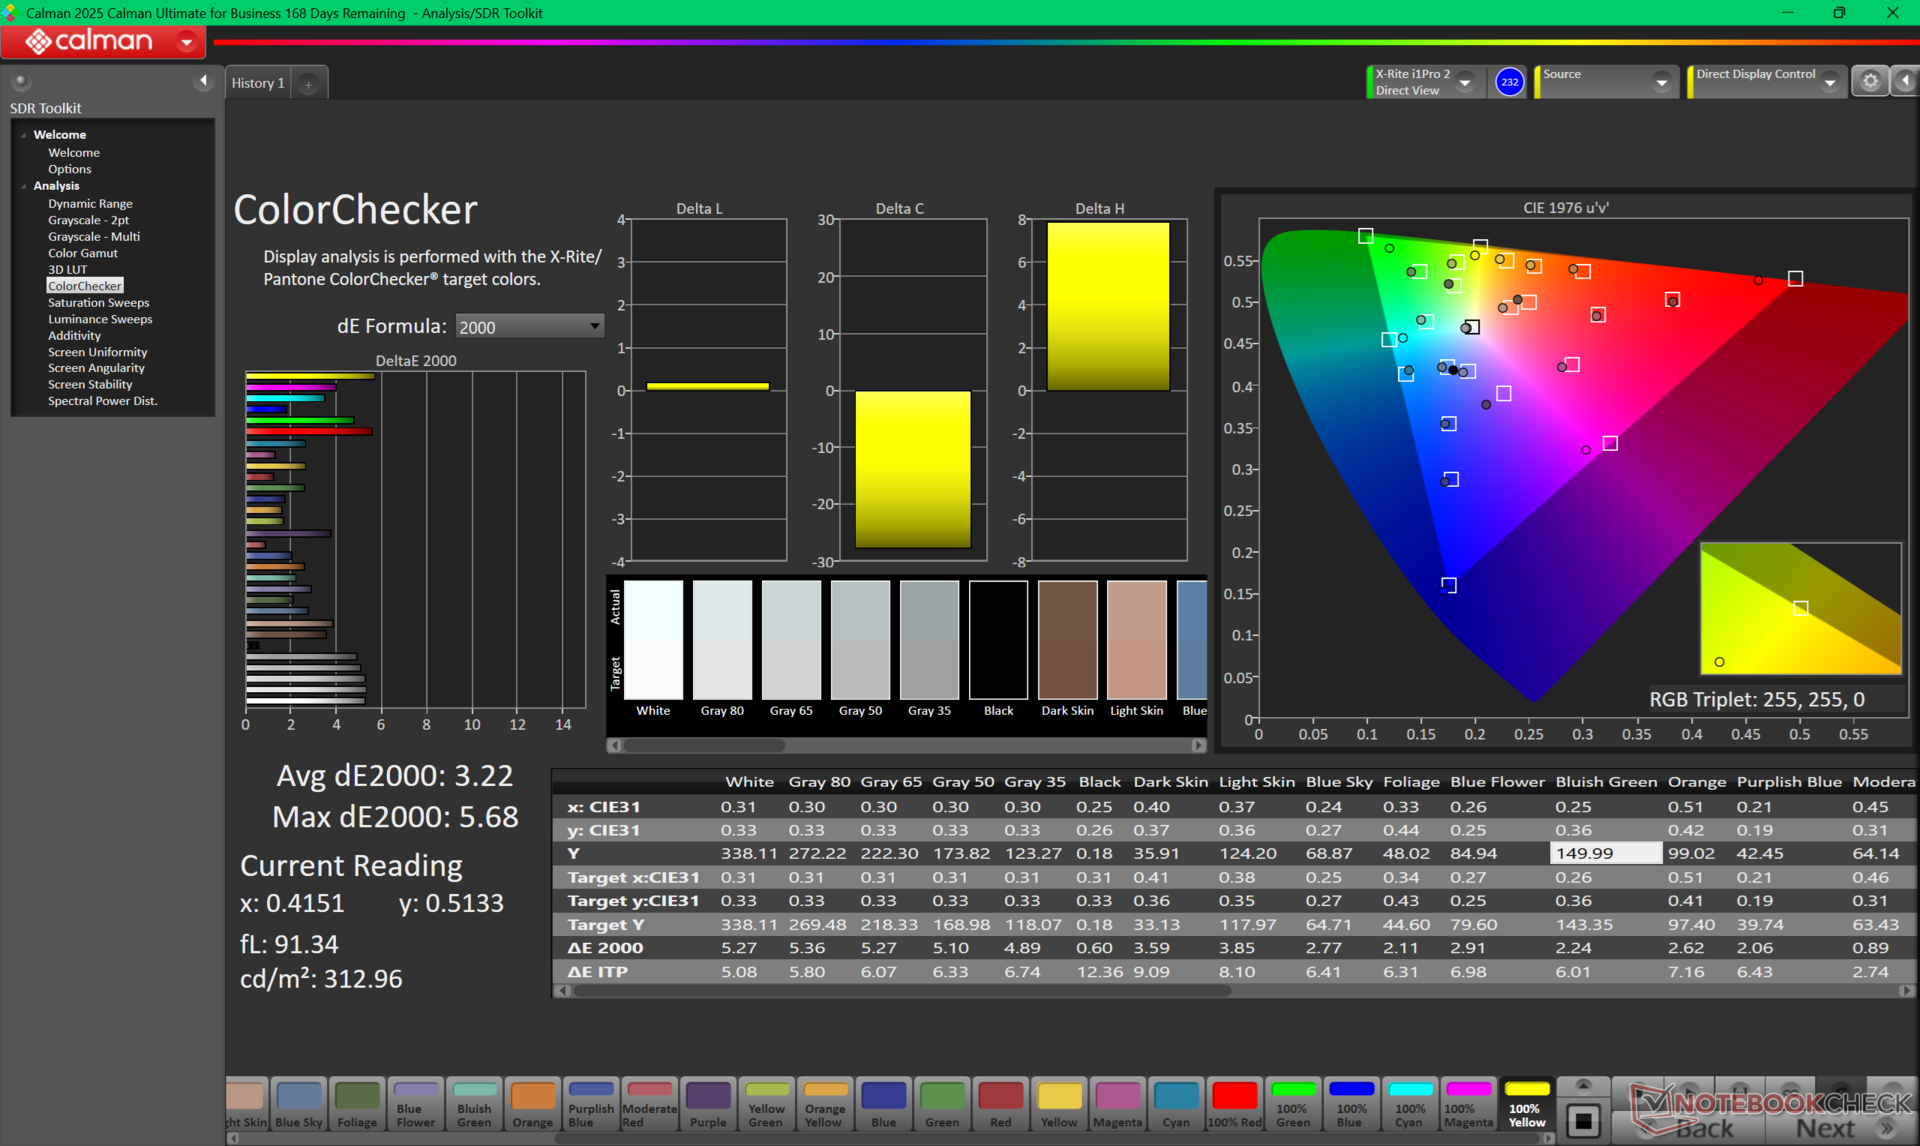
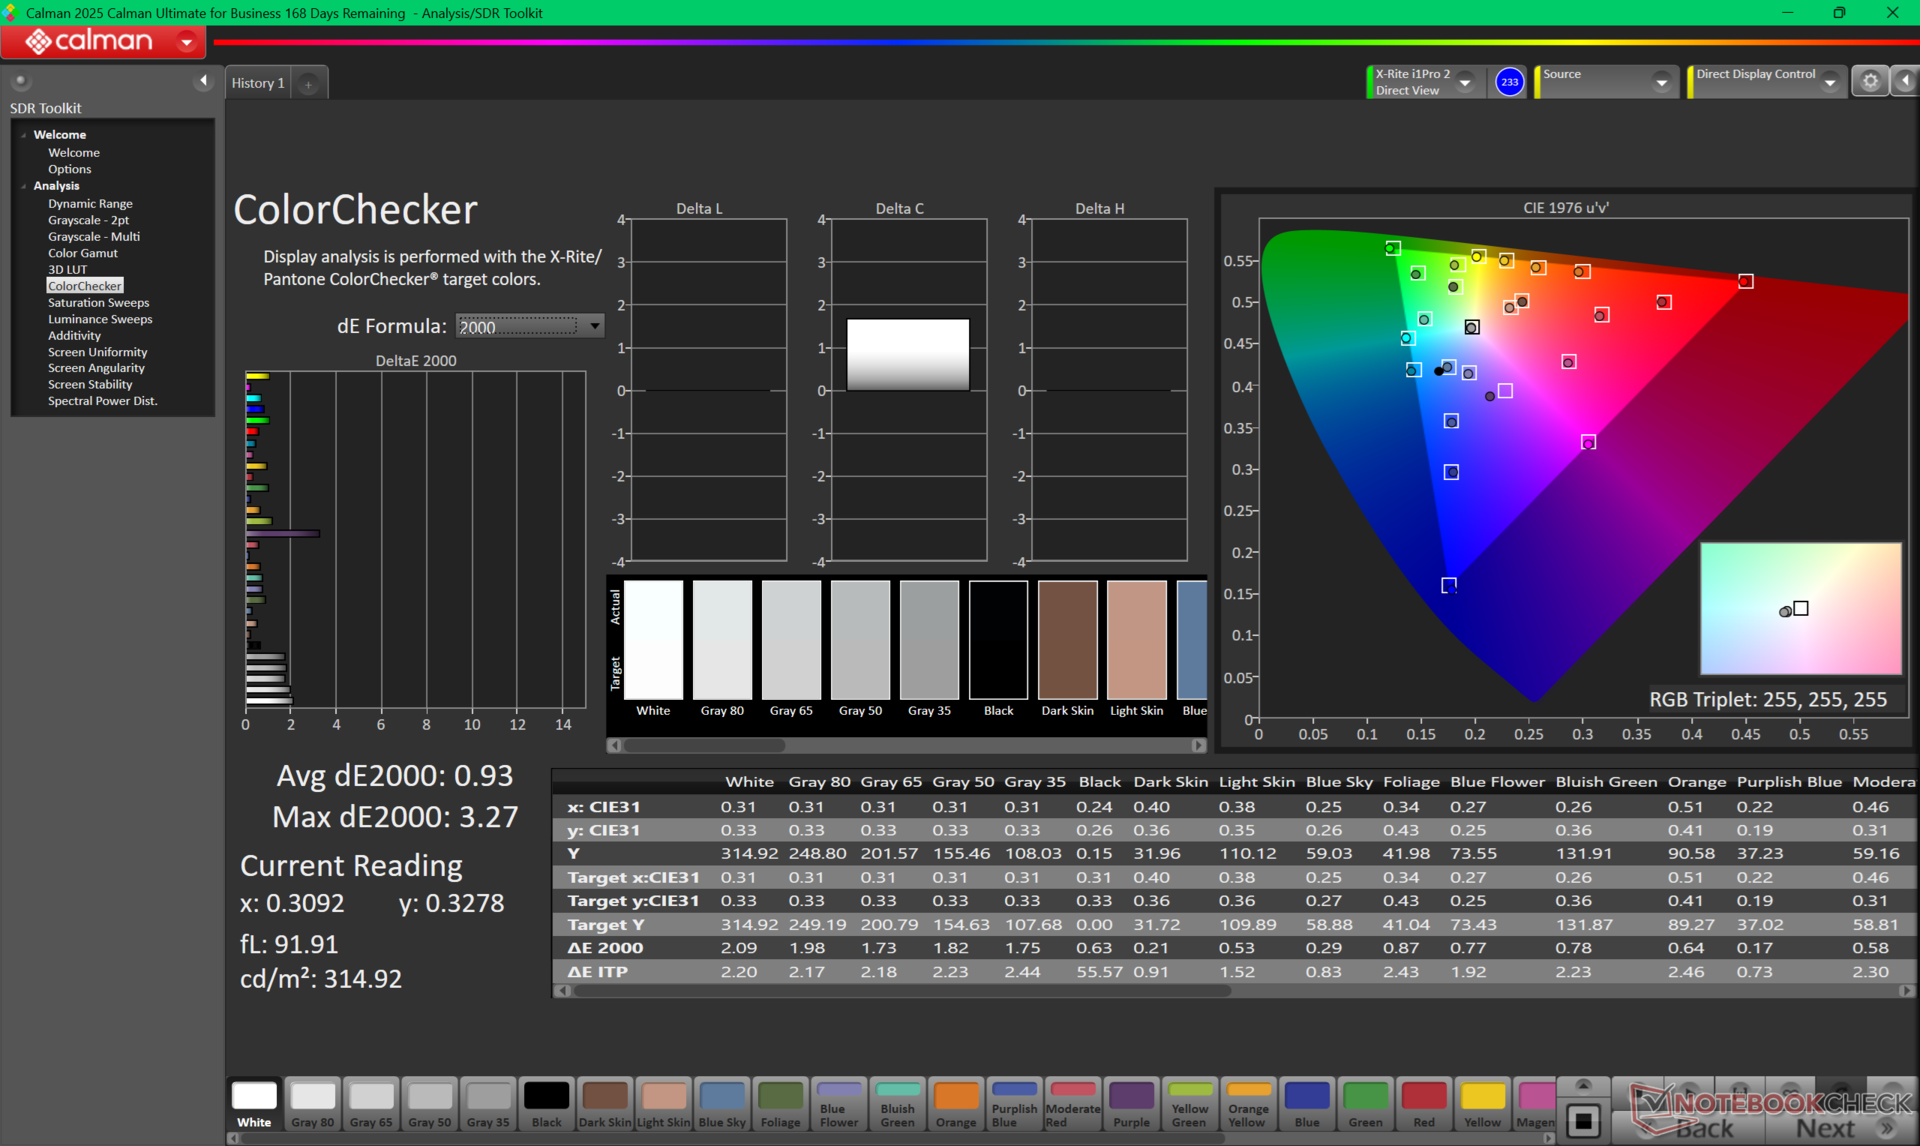
ΔE ColorChecker Calman: 3.22 | ∀{0.5-29.43 Ø4.72}
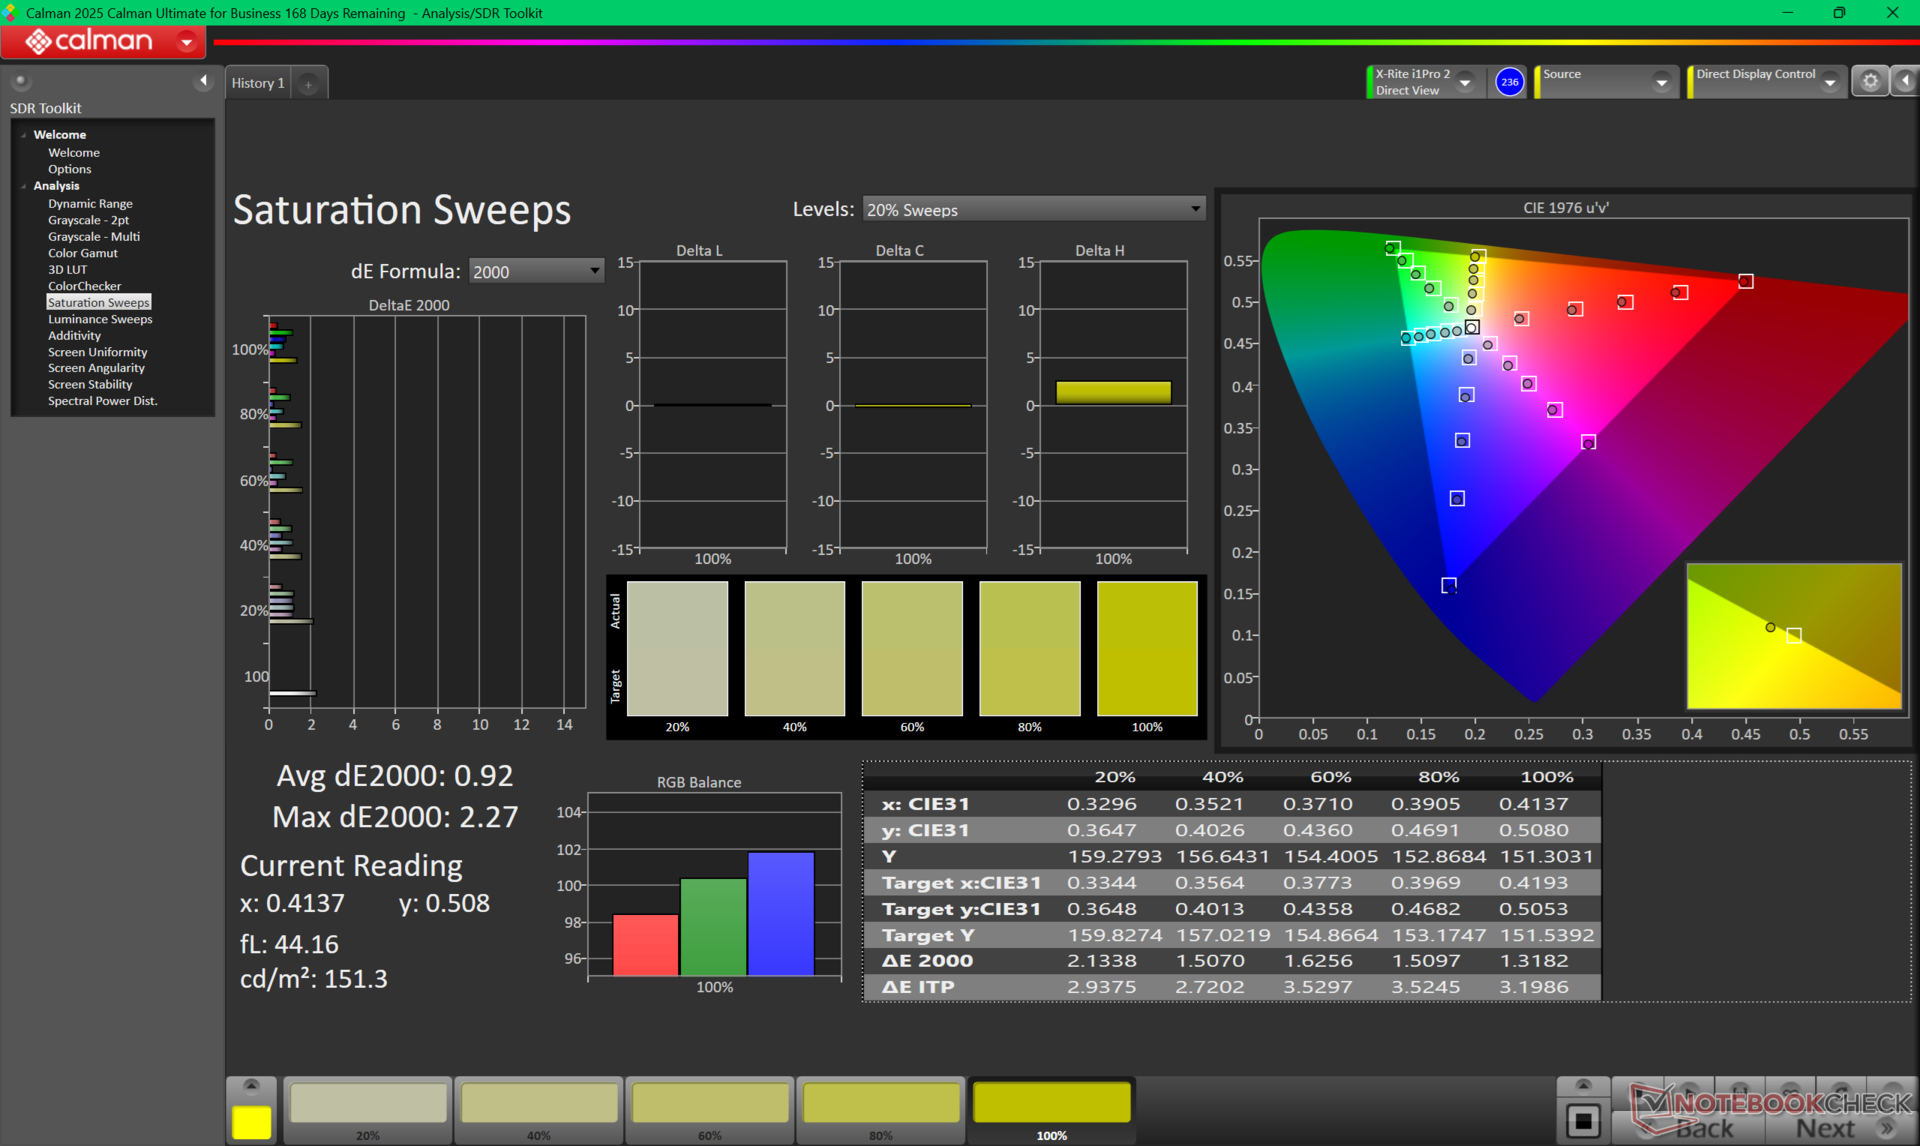
calibrated: 0.93
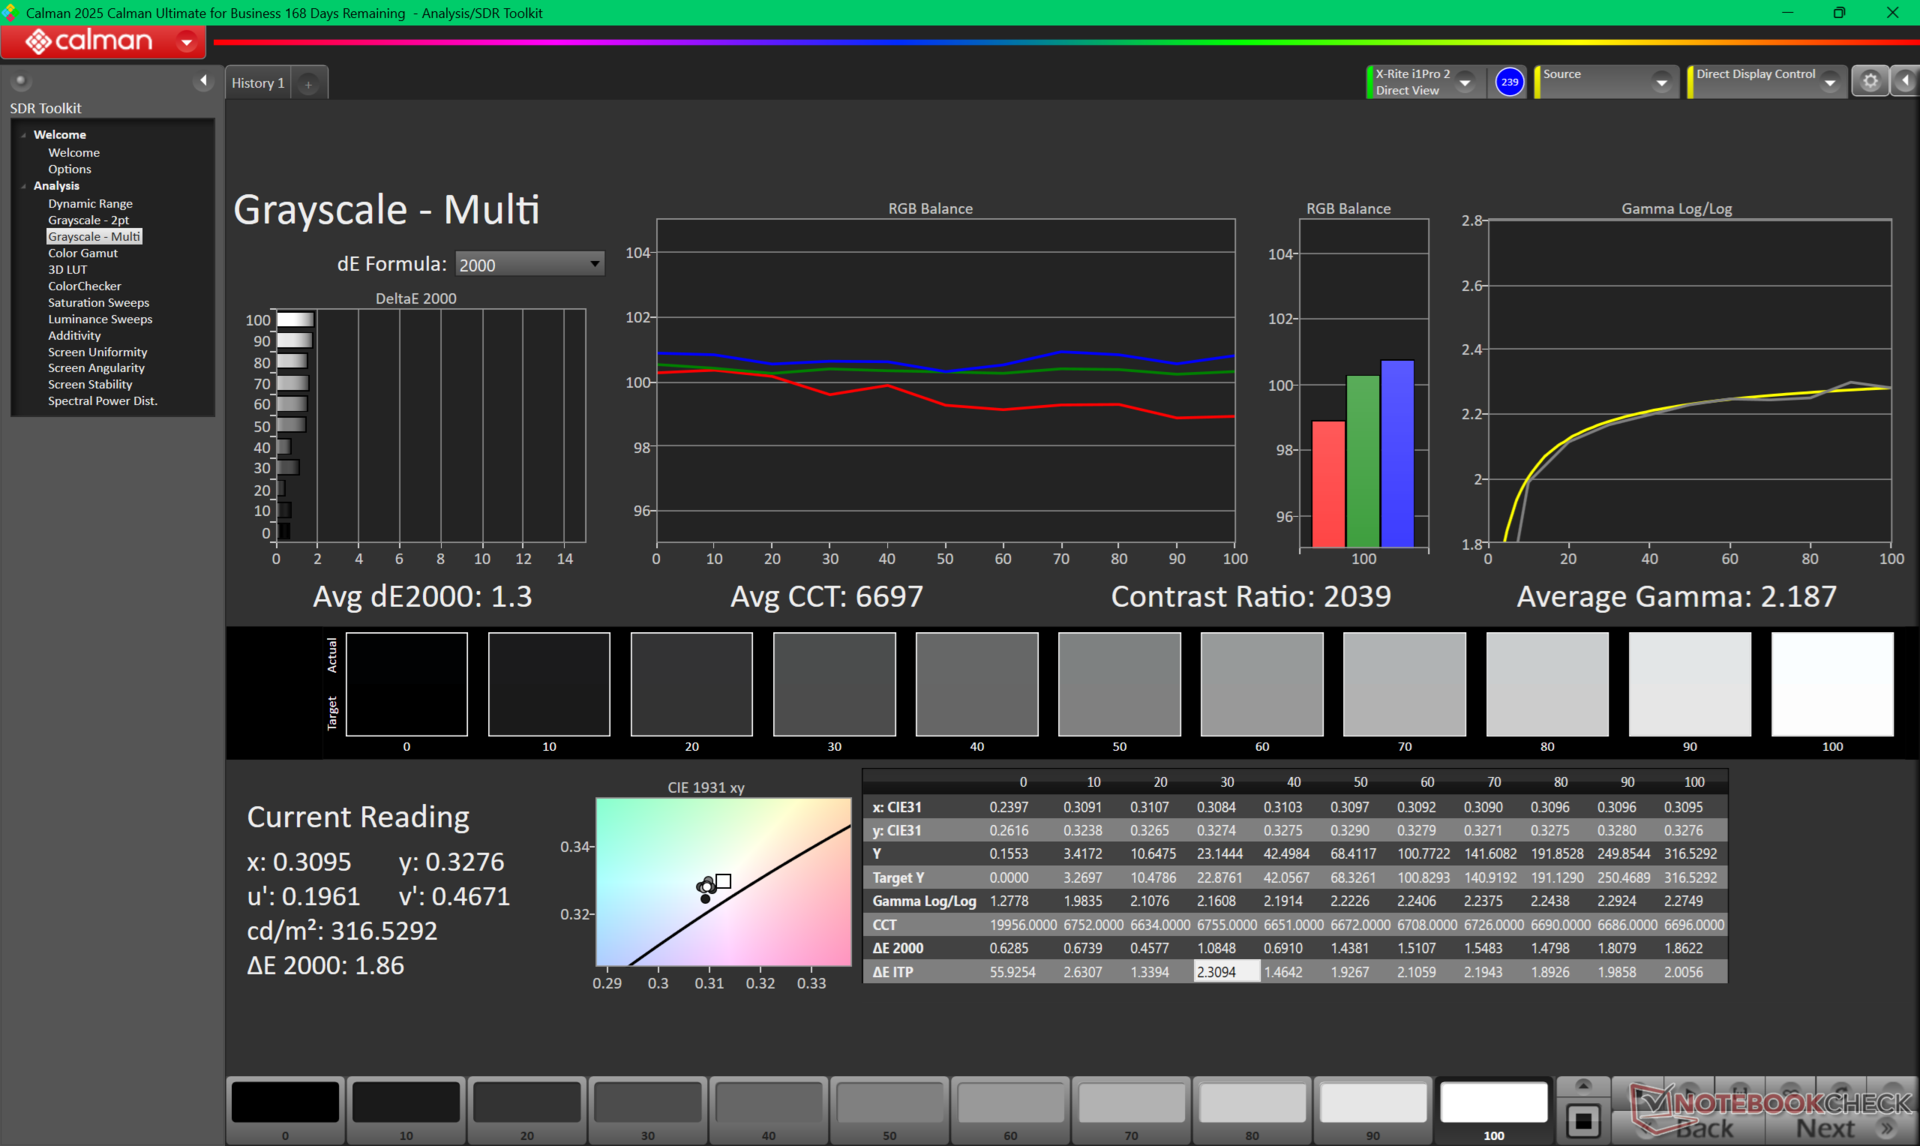
ΔE Greyscale Calman: 4.5 | ∀{0.09-98 Ø4.97}
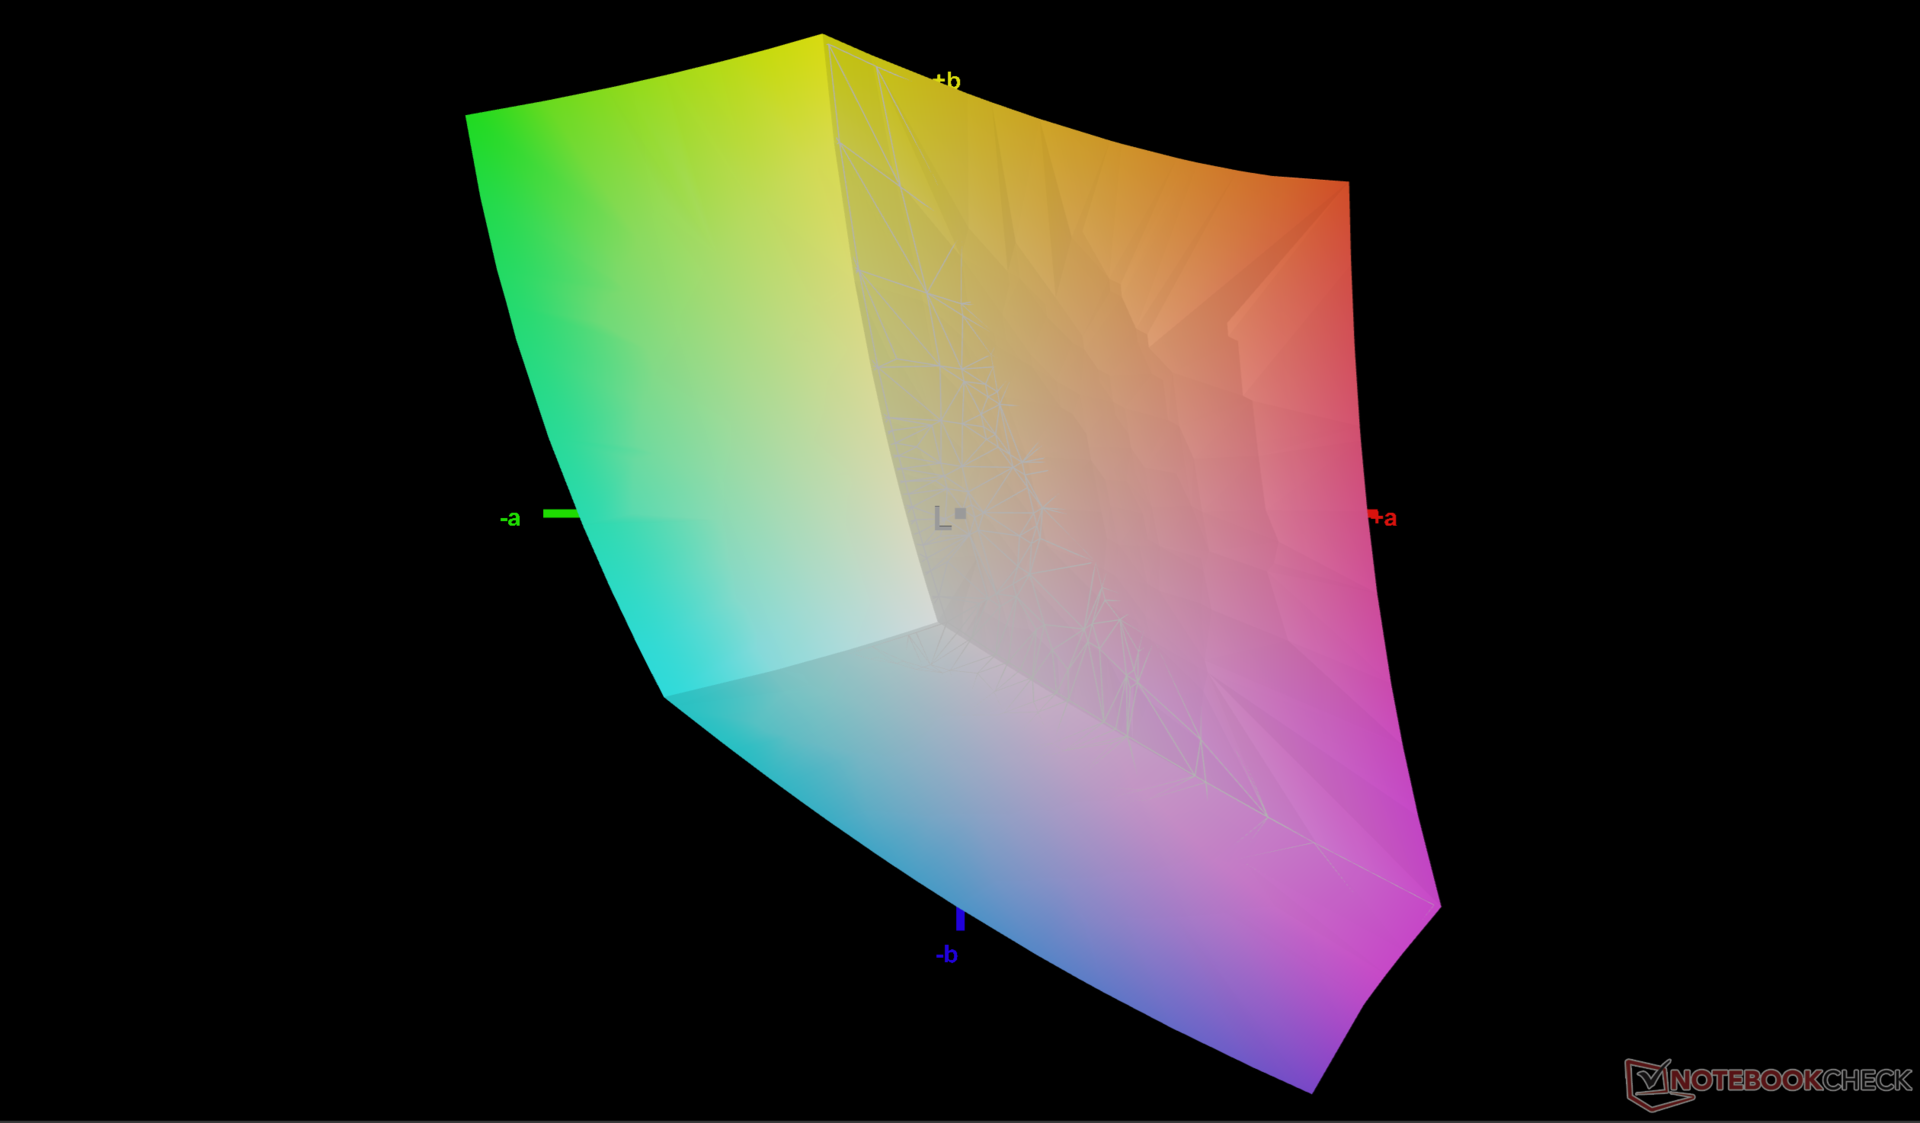
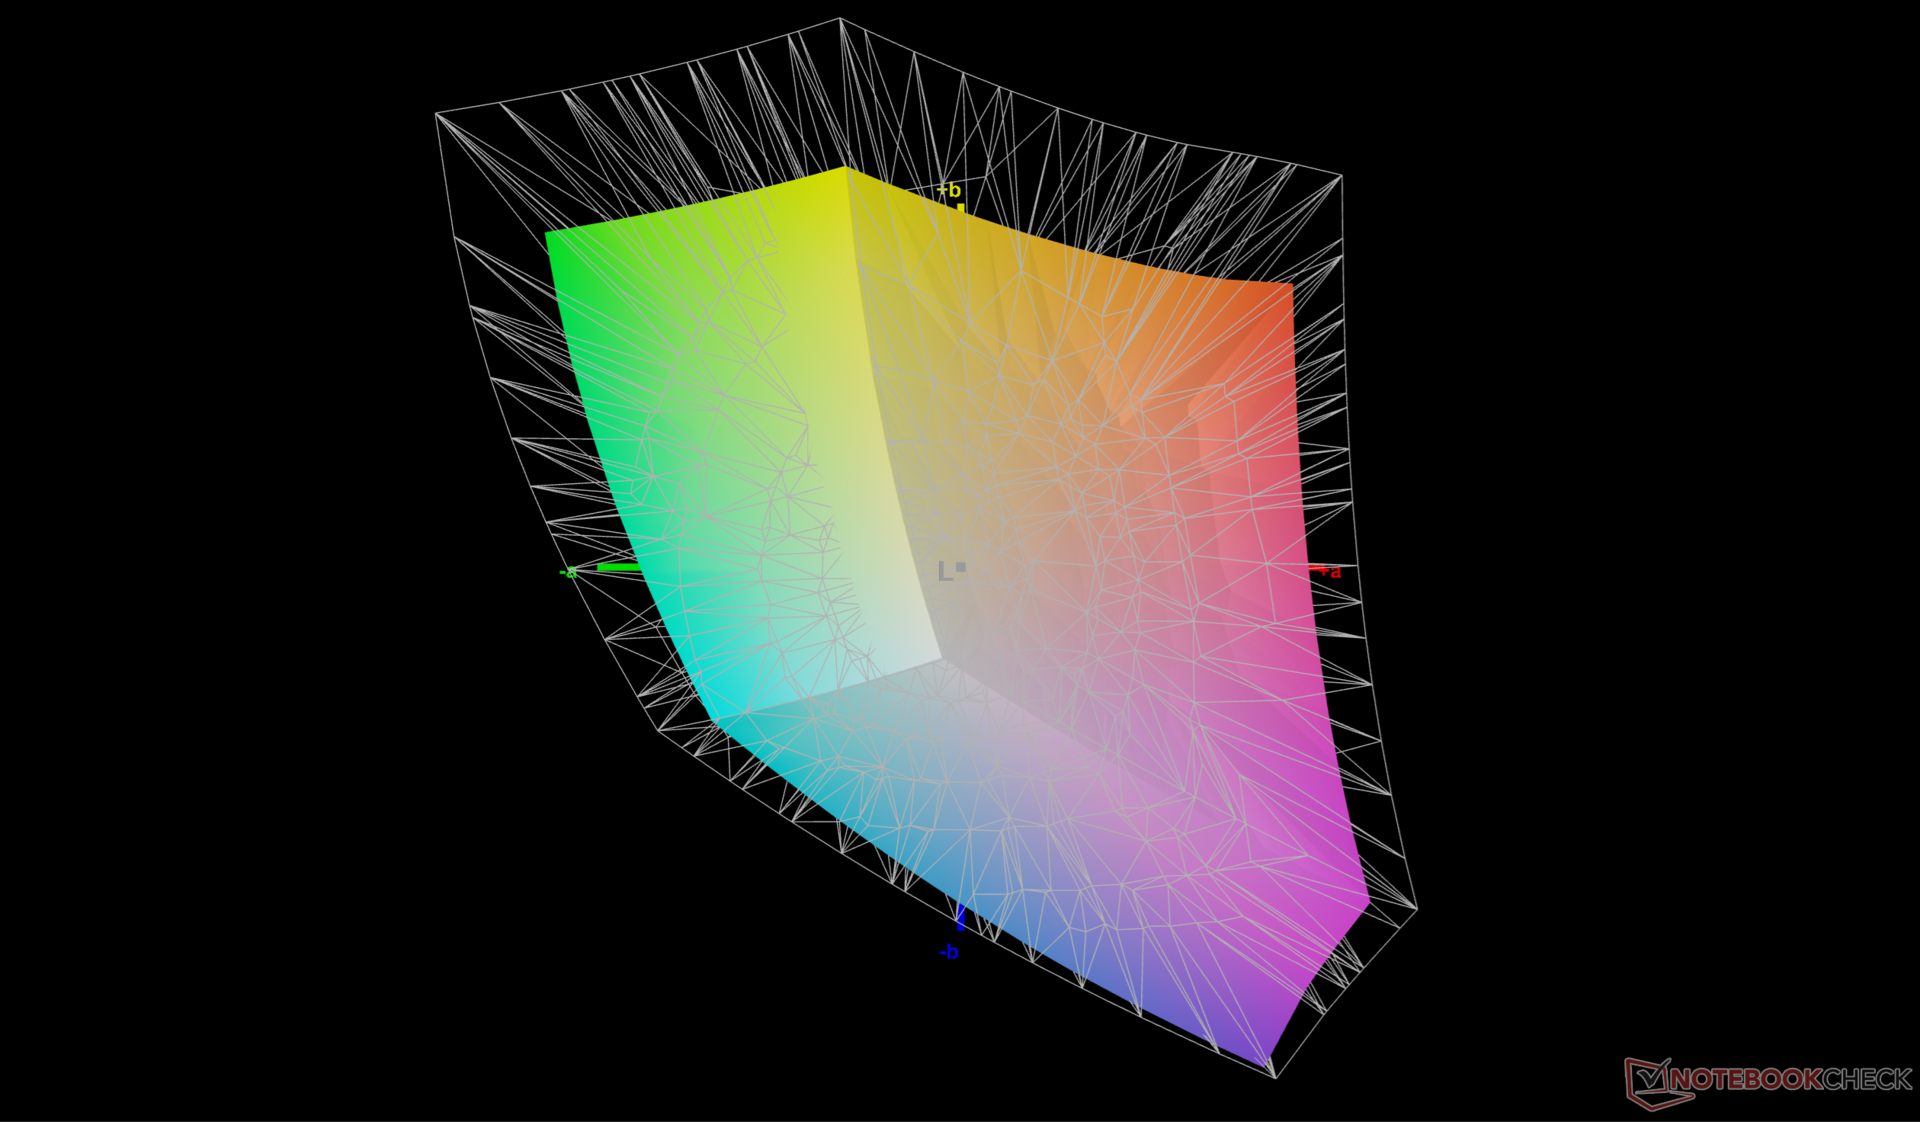
72.1% AdobeRGB 1998 (Argyll 3D)
99.9% sRGB (Argyll 3D)
70.8% Display P3 (Argyll 3D)
Gamma: 2.1
CCT: 7041 K
| Alienware 16 Aurora BOE NE16N41, IPS, 2560x1600, 16", 120 Hz | Alienware 16X Aurora, RTX 5070 LG Philips 160WQG, IPS, 2560x1600, 16", 240 Hz | Lenovo LOQ 15AHP10 CSOT MNF601BA1-4, IPS, 1920x1080, 15.6", 144 Hz | Gigabyte Gaming A16 GA6H NE160QDM-NYJ (BOE0C80), IPS, 2560x1600, 16", 165 Hz | Asus TUF Gaming A16 FA608WV B160UAN08.1 (AUO9BB0), IPS, 1920x1200, 16", 144 Hz | HP Victus 16 (2024) Chi Mei CMN163E, IPS, 1920x1080, 16.1", 144 Hz | |
|---|---|---|---|---|---|---|
| Display | 20% | -3% | -1% | -42% | -40% | |
| Display P3 Coverage (%) | 70.8 | 96.9 37% | 67.3 -5% | 69.4 -2% | 39.8 -44% | 41.3 -42% |
| sRGB Coverage (%) | 99.9 | 99.8 0% | 99.2 -1% | 99.5 0% | 59.7 -40% | 61.7 -38% |
| AdobeRGB 1998 Coverage (%) | 72.1 | 89.7 24% | 69.1 -4% | 71.6 -1% | 41.1 -43% | 42.7 -41% |
| Response Times | 81% | 30% | 74% | 72% | 39% | |
| Response Time Grey 50% / Grey 80% * (ms) | 49.5 ? | 4.3 ? 91% | 33.9 ? 32% | 14.3 ? 71% | 13.6 ? 73% | 28.6 ? 42% |
| Response Time Black / White * (ms) | 29.3 ? | 8.7 ? 70% | 21.2 ? 28% | 7 ? 76% | 8.4 ? 71% | 18.7 ? 36% |
| PWM Frequency (Hz) | ||||||
| Screen | -5% | 16% | -21% | -81% | -69% | |
| Brightness middle (cd/m²) | 345.3 | 493.2 43% | 318 -8% | 432 25% | 347 0% | 287 -17% |
| Brightness (cd/m²) | 324 | 477 47% | 300 -7% | 425 31% | 321 -1% | 288 -11% |
| Brightness Distribution (%) | 88 | 93 6% | 89 1% | 91 3% | 88 0% | 86 -2% |
| Black Level * (cd/m²) | 0.23 | 0.5 -117% | 0.2 13% | 0.37 -61% | 0.3 -30% | 0.19 17% |
| Contrast (:1) | 1501 | 986 -34% | 1590 6% | 1168 -22% | 1157 -23% | 1511 1% |
| Colorchecker dE 2000 * | 3.22 | 3.57 -11% | 1.33 59% | 4.76 -48% | 5.89 -83% | 5.46 -70% |
| Colorchecker dE 2000 max. * | 5.68 | 7.03 -24% | 4.42 22% | 8.59 -51% | 19.26 -239% | 20.36 -258% |
| Colorchecker dE 2000 calibrated * | 0.93 | 0.68 27% | 0.94 -1% | 1.18 -27% | 4.3 -362% | 3.52 -278% |
| Greyscale dE 2000 * | 4.5 | 3.7 18% | 1.9 58% | 6.2 -38% | 4.27 5% | 4.8 -7% |
| Gamma | 2.1 105% | 2.16 102% | 2.187 101% | 2.079 106% | 2.47 89% | 2.108 104% |
| CCT | 7041 92% | 5876 111% | 6678 97% | 6690 97% | 7158 91% | 6442 101% |
| Moyenne finale (programmes/paramètres) | 32% /
13% | 14% /
14% | 17% /
-3% | -17% /
-51% | -23% /
-48% |
* ... Moindre est la valeur, meilleures sont les performances

Temps de réponse de l'écran
| ↔ Temps de réponse noir à blanc | ||
|---|---|---|
| 29.3 ms ... hausse ↗ et chute ↘ combinées | ↗ 14.2 ms hausse | 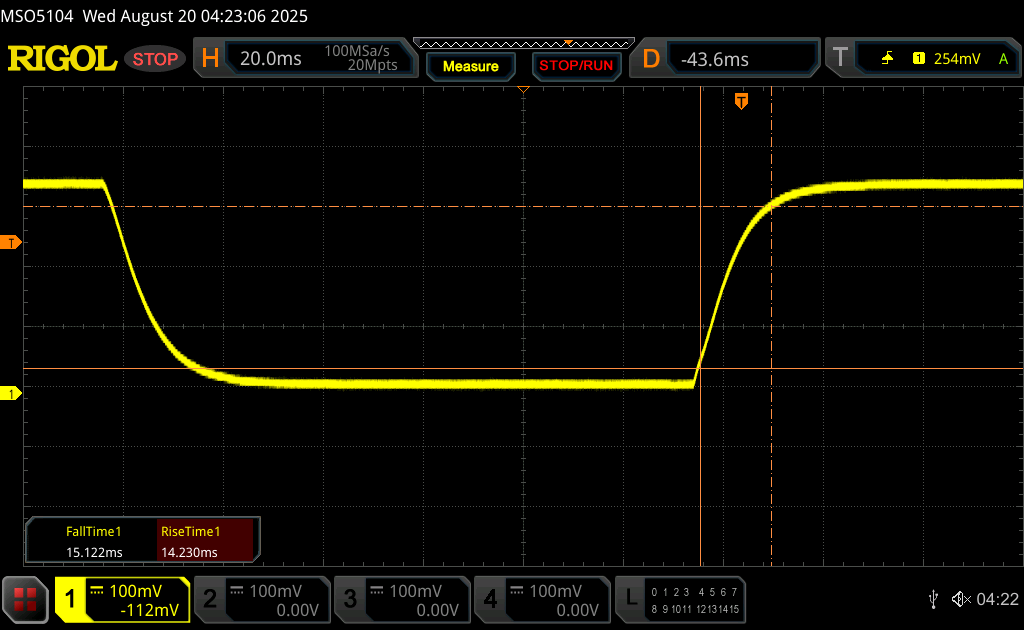 |
| ↘ 15.1 ms chute | ||
| L'écran souffre de latences relativement élevées, insuffisant pour le jeu. En comparaison, tous les appareils testés affichent entre 0.1 (minimum) et 240 (maximum) ms. » 79 % des appareils testés affichent de meilleures performances. Cela signifie que les latences relevées sont moins bonnes que la moyenne (19.8 ms) de tous les appareils testés. | ||
| ↔ Temps de réponse gris 50% à gris 80% | ||
| 49.5 ms ... hausse ↗ et chute ↘ combinées | ↗ 23.1 ms hausse | 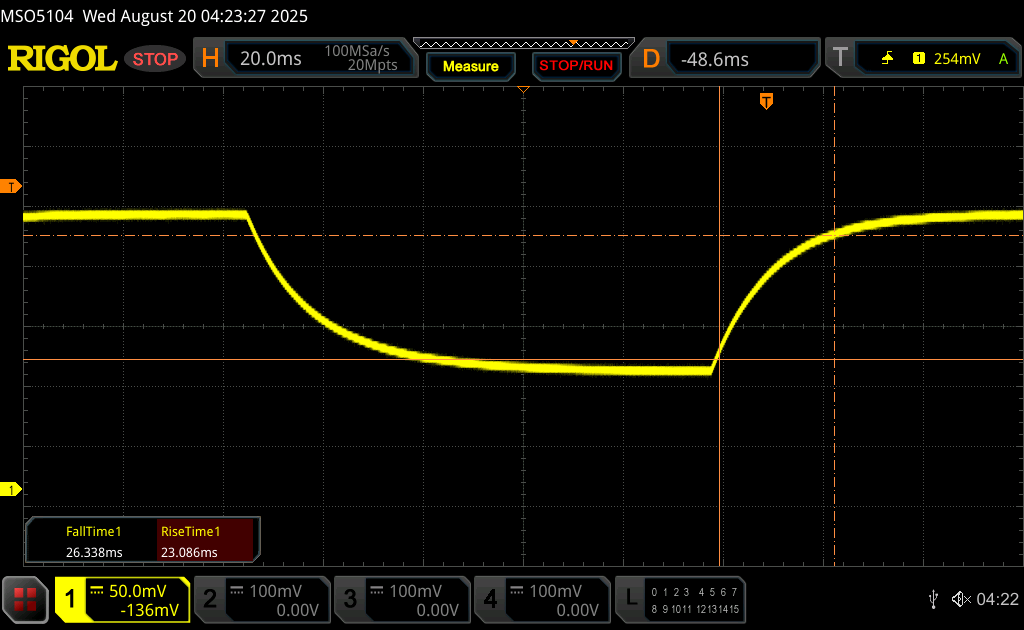 |
| ↘ 26.4 ms chute | ||
| L'écran souffre de latences très élevées, à éviter pour le jeu. En comparaison, tous les appareils testés affichent entre 0.165 (minimum) et 636 (maximum) ms. » 85 % des appareils testés affichent de meilleures performances. Cela signifie que les latences relevées sont moins bonnes que la moyenne (31 ms) de tous les appareils testés. | ||
Scintillement / MLI (Modulation de largeur d'impulsion)
| Scintillement / MLI (Modulation de largeur d'impulsion) non décelé | 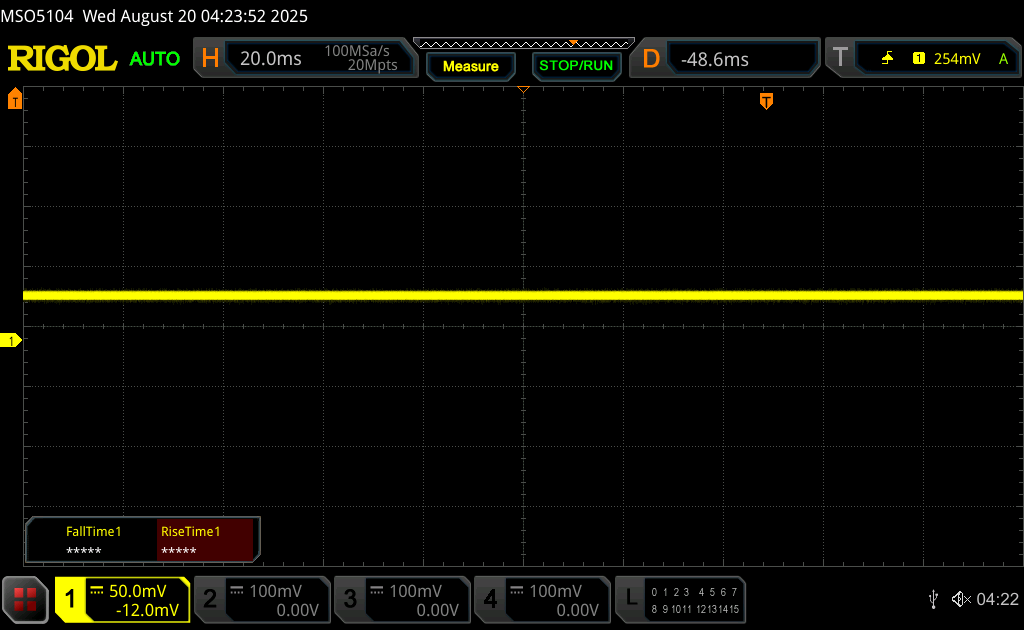 | ||
En comparaison, 52 % des appareils testés n'emploient pas MDI pour assombrir leur écran. Nous avons relevé une moyenne à 7765 (minimum : 5 - maximum : 343500) Hz dans le cas où une MDI était active. | |||
Performance
Conditions d'essai
Nous avons réglé Windows et Alienware Command Center en mode Performance avant d'effectuer les tests ci-dessous.
Processeur
Déclinant le Core Ultra 9 275HX dans l'Aurora 16X à la Core 7 240H dans notre 16 Aurora entraîne une baisse significative des performances multithread de près de 55%. Les performances brutes sont légèrement inférieures à celles du Core i7-12700H.
Cinebench R15 Multi Loop
Cinebench R23: Multi Core | Single Core
Cinebench R20: CPU (Multi Core) | CPU (Single Core)
Cinebench R15: CPU Multi 64Bit | CPU Single 64Bit
Blender: v2.79 BMW27 CPU
7-Zip 18.03: 7z b 4 | 7z b 4 -mmt1
Geekbench 6.7: Multi-Core | Single-Core
Geekbench 5.5: Multi-Core | Single-Core
HWBOT x265 Benchmark v2.2: 4k Preset
LibreOffice : 20 Documents To PDF
R Benchmark 2.5: Overall mean
* ... Moindre est la valeur, meilleures sont les performances
AIDA64: FP32 Ray-Trace | FPU Julia | CPU SHA3 | CPU Queen | FPU SinJulia | FPU Mandel | CPU AES | CPU ZLib | FP64 Ray-Trace | CPU PhotoWorxx
| Performance rating | |
| Alienware 16X Aurora, RTX 5070 | |
| Asus TUF Gaming A16 FA608WV | |
| Lenovo LOQ 15AHP10 | |
| HP Victus 16 (2024) | |
| Alienware 16 Aurora | |
| Moyenne Intel Core 7 240H | |
| Gigabyte Gaming A16 GA6H | |
| AIDA64 / FP32 Ray-Trace | |
| Asus TUF Gaming A16 FA608WV | |
| Alienware 16X Aurora, RTX 5070 | |
| Lenovo LOQ 15AHP10 | |
| HP Victus 16 (2024) | |
| Alienware 16 Aurora | |
| Moyenne Intel Core 7 240H (11867 - 15972, n=5) | |
| Gigabyte Gaming A16 GA6H | |
| AIDA64 / FPU Julia | |
| Alienware 16X Aurora, RTX 5070 | |
| Asus TUF Gaming A16 FA608WV | |
| Lenovo LOQ 15AHP10 | |
| HP Victus 16 (2024) | |
| Alienware 16 Aurora | |
| Moyenne Intel Core 7 240H (59260 - 80238, n=5) | |
| Gigabyte Gaming A16 GA6H | |
| AIDA64 / CPU SHA3 | |
| Alienware 16X Aurora, RTX 5070 | |
| Asus TUF Gaming A16 FA608WV | |
| Lenovo LOQ 15AHP10 | |
| HP Victus 16 (2024) | |
| Alienware 16 Aurora | |
| Moyenne Intel Core 7 240H (2455 - 3287, n=5) | |
| Gigabyte Gaming A16 GA6H | |
| AIDA64 / CPU Queen | |
| Alienware 16X Aurora, RTX 5070 | |
| HP Victus 16 (2024) | |
| Lenovo LOQ 15AHP10 | |
| Asus TUF Gaming A16 FA608WV | |
| Alienware 16 Aurora | |
| Moyenne Intel Core 7 240H (75356 - 86602, n=3) | |
| Gigabyte Gaming A16 GA6H | |
| AIDA64 / FPU SinJulia | |
| Asus TUF Gaming A16 FA608WV | |
| Lenovo LOQ 15AHP10 | |
| Alienware 16X Aurora, RTX 5070 | |
| HP Victus 16 (2024) | |
| Alienware 16 Aurora | |
| Moyenne Intel Core 7 240H (7777 - 9366, n=5) | |
| Gigabyte Gaming A16 GA6H | |
| AIDA64 / FPU Mandel | |
| Alienware 16X Aurora, RTX 5070 | |
| Asus TUF Gaming A16 FA608WV | |
| Lenovo LOQ 15AHP10 | |
| HP Victus 16 (2024) | |
| Alienware 16 Aurora | |
| Moyenne Intel Core 7 240H (29381 - 39967, n=5) | |
| Gigabyte Gaming A16 GA6H | |
| AIDA64 / CPU AES | |
| Alienware 16X Aurora, RTX 5070 | |
| HP Victus 16 (2024) | |
| Asus TUF Gaming A16 FA608WV | |
| Lenovo LOQ 15AHP10 | |
| Alienware 16 Aurora | |
| Moyenne Intel Core 7 240H (50528 - 67855, n=5) | |
| Gigabyte Gaming A16 GA6H | |
| AIDA64 / CPU ZLib | |
| Alienware 16X Aurora, RTX 5070 | |
| Asus TUF Gaming A16 FA608WV | |
| HP Victus 16 (2024) | |
| Lenovo LOQ 15AHP10 | |
| Alienware 16 Aurora | |
| Moyenne Intel Core 7 240H (725 - 951, n=5) | |
| Gigabyte Gaming A16 GA6H | |
| AIDA64 / FP64 Ray-Trace | |
| Asus TUF Gaming A16 FA608WV | |
| Alienware 16X Aurora, RTX 5070 | |
| Lenovo LOQ 15AHP10 | |
| HP Victus 16 (2024) | |
| Alienware 16 Aurora | |
| Moyenne Intel Core 7 240H (6389 - 8569, n=5) | |
| Gigabyte Gaming A16 GA6H | |
| AIDA64 / CPU PhotoWorxx | |
| Alienware 16X Aurora, RTX 5070 | |
| Alienware 16 Aurora | |
| HP Victus 16 (2024) | |
| Moyenne Intel Core 7 240H (21710 - 44874, n=5) | |
| Asus TUF Gaming A16 FA608WV | |
| Lenovo LOQ 15AHP10 | |
| Gigabyte Gaming A16 GA6H | |
| AIDA64 / Memory Copy | |
| Asus TUF Gaming A16 FA608WV | |
| Alienware 16X Aurora, RTX 5070 | |
| HP Victus 16 (2024) | |
| Alienware 16 Aurora | |
| Moyenne Intel Core 7 240H (34965 - 69215, n=5) | |
| Lenovo LOQ 15AHP10 | |
| Gigabyte Gaming A16 GA6H | |
| AIDA64 / Memory Read | |
| Asus TUF Gaming A16 FA608WV | |
| Alienware 16X Aurora, RTX 5070 | |
| HP Victus 16 (2024) | |
| Alienware 16 Aurora | |
| Moyenne Intel Core 7 240H (39706 - 71870, n=5) | |
| Gigabyte Gaming A16 GA6H | |
| Lenovo LOQ 15AHP10 | |
| AIDA64 / Memory Write | |
| Asus TUF Gaming A16 FA608WV | |
| Alienware 16X Aurora, RTX 5070 | |
| HP Victus 16 (2024) | |
| Moyenne Intel Core 7 240H (33560 - 80488, n=5) | |
| Alienware 16 Aurora | |
| Lenovo LOQ 15AHP10 | |
| Gigabyte Gaming A16 GA6H | |
| AIDA64 / Memory Latency | |
| Alienware 16X Aurora, RTX 5070 | |
| Asus TUF Gaming A16 FA608WV | |
| Alienware 16 Aurora | |
| Moyenne Intel Core 7 240H (97.1 - 125.6, n=5) | |
| Gigabyte Gaming A16 GA6H | |
| Lenovo LOQ 15AHP10 | |
| HP Victus 16 (2024) | |
* ... Moindre est la valeur, meilleures sont les performances
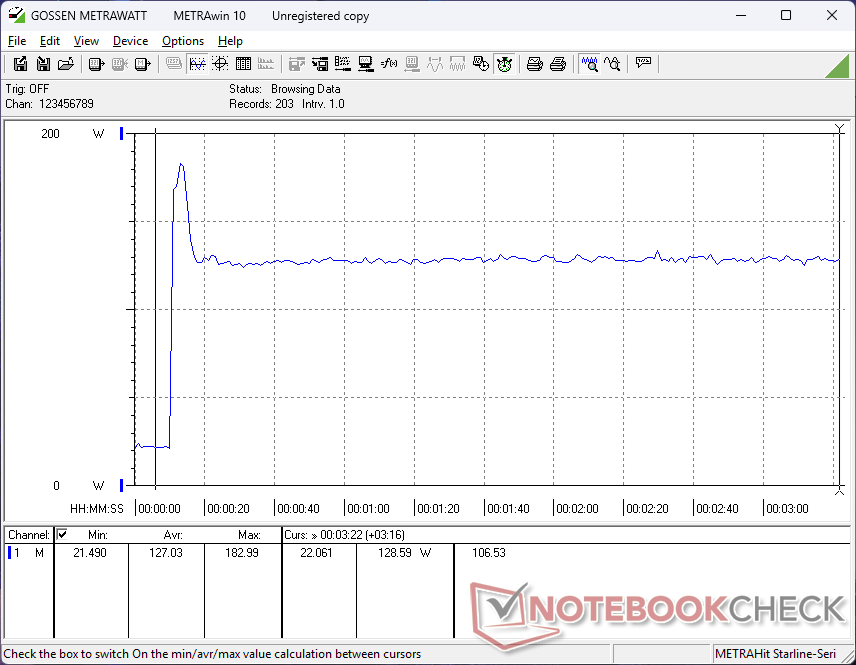
Test de stress
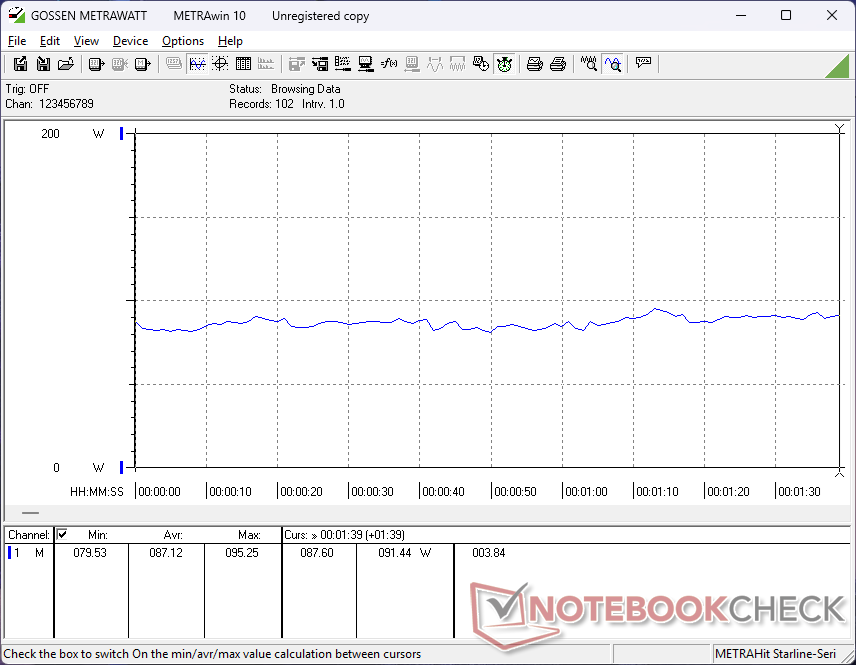
Le CPU atteint 4,3 GHz et 120 W lorsqu'il lance le stress Prime95 avant de redescendre régulièrement à 3,7 GHz et 95 W. La température du cœur se stabilise également à 100 C et le CPU n'est donc pas plus froid que sur la 16X Aurora malgré les écarts de performance importants.
La consommation d'énergie de la carte GPU lors de l'exécution de Cyberpunk 2077 serait en moyenne de 31 W, 58 W et 51 W en mode équilibré, mode performance et mode Overdrive, respectivement. L'écart entre les modes Performance et Overdrive semble indiquer que le mode Overdrive n'améliore pas nécessairement les performances, car les fréquences d'horloge restent très dynamiques.
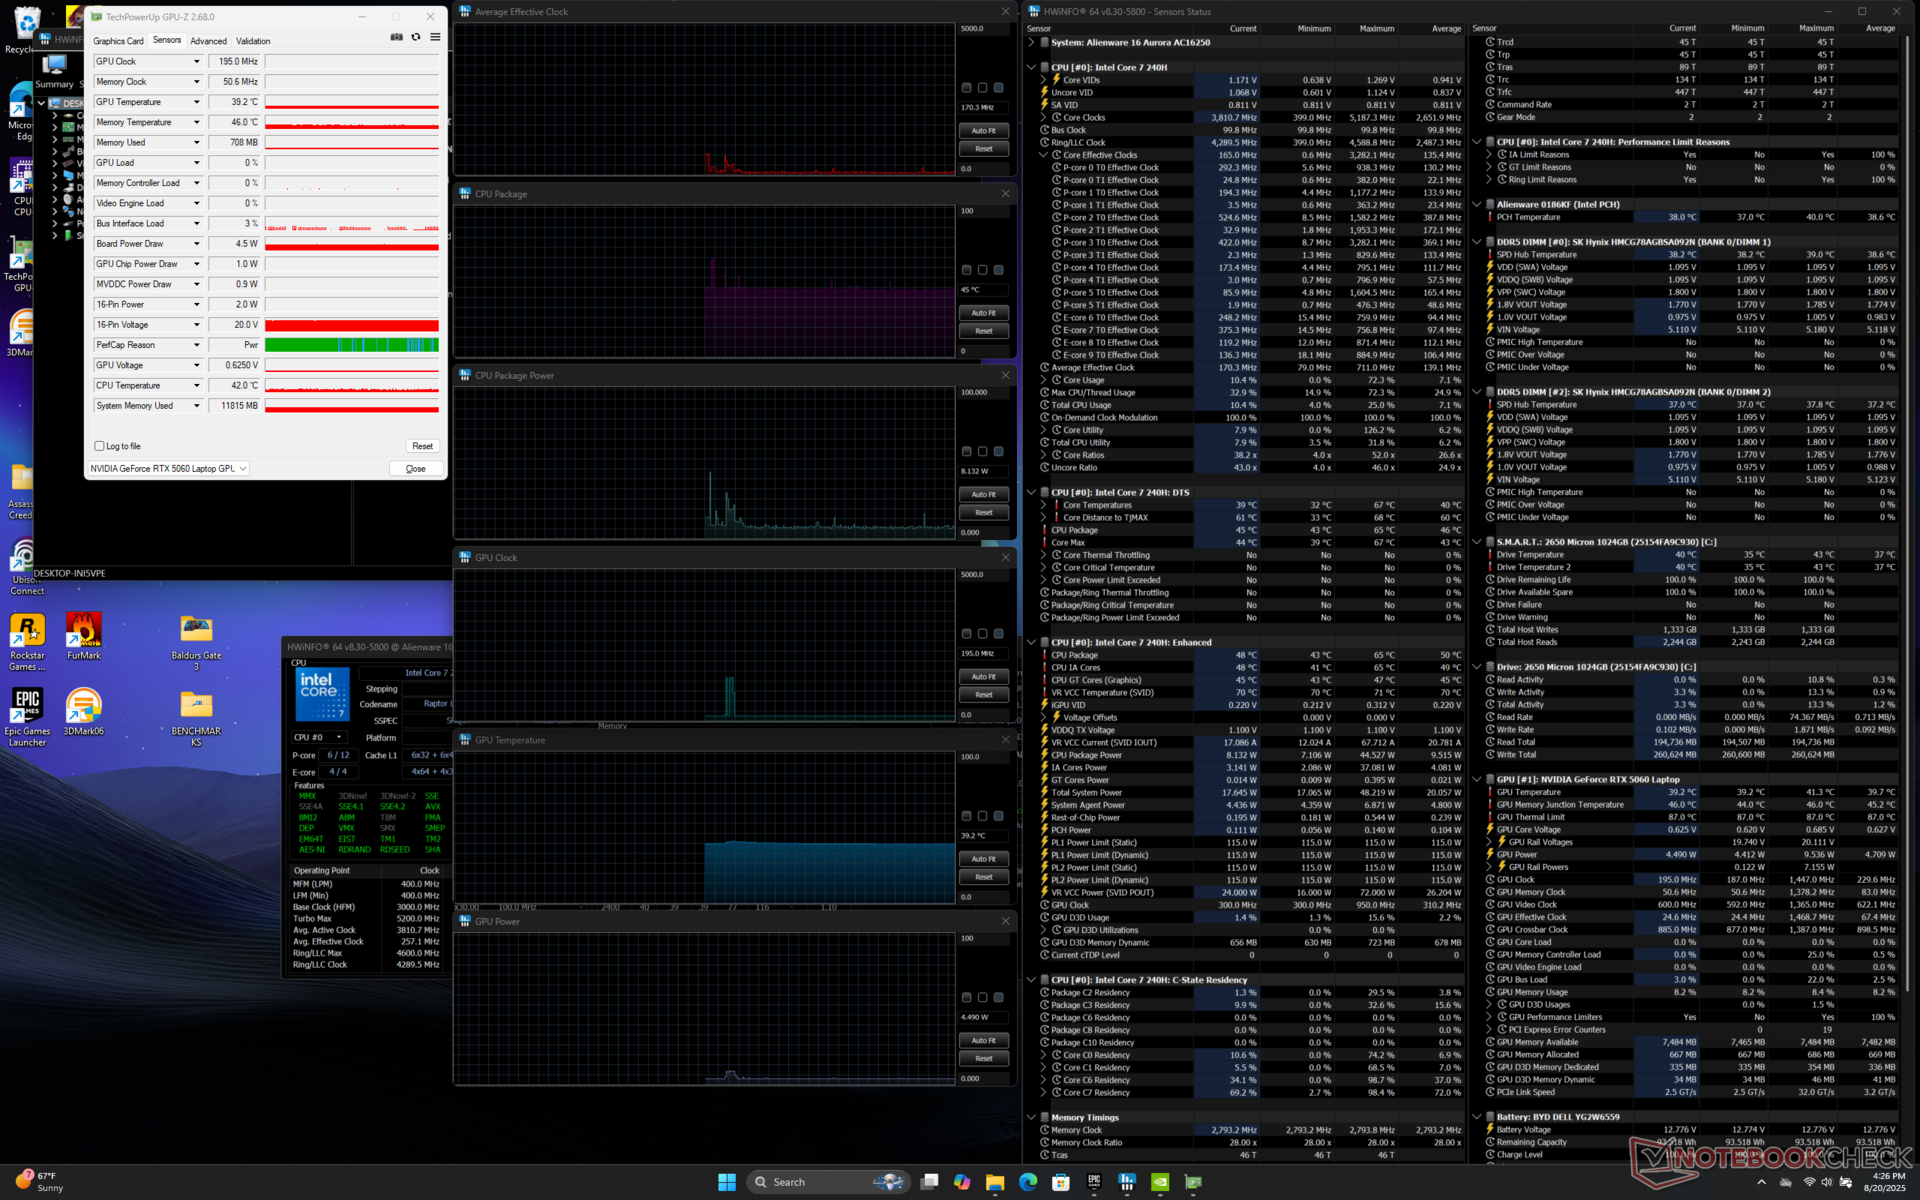
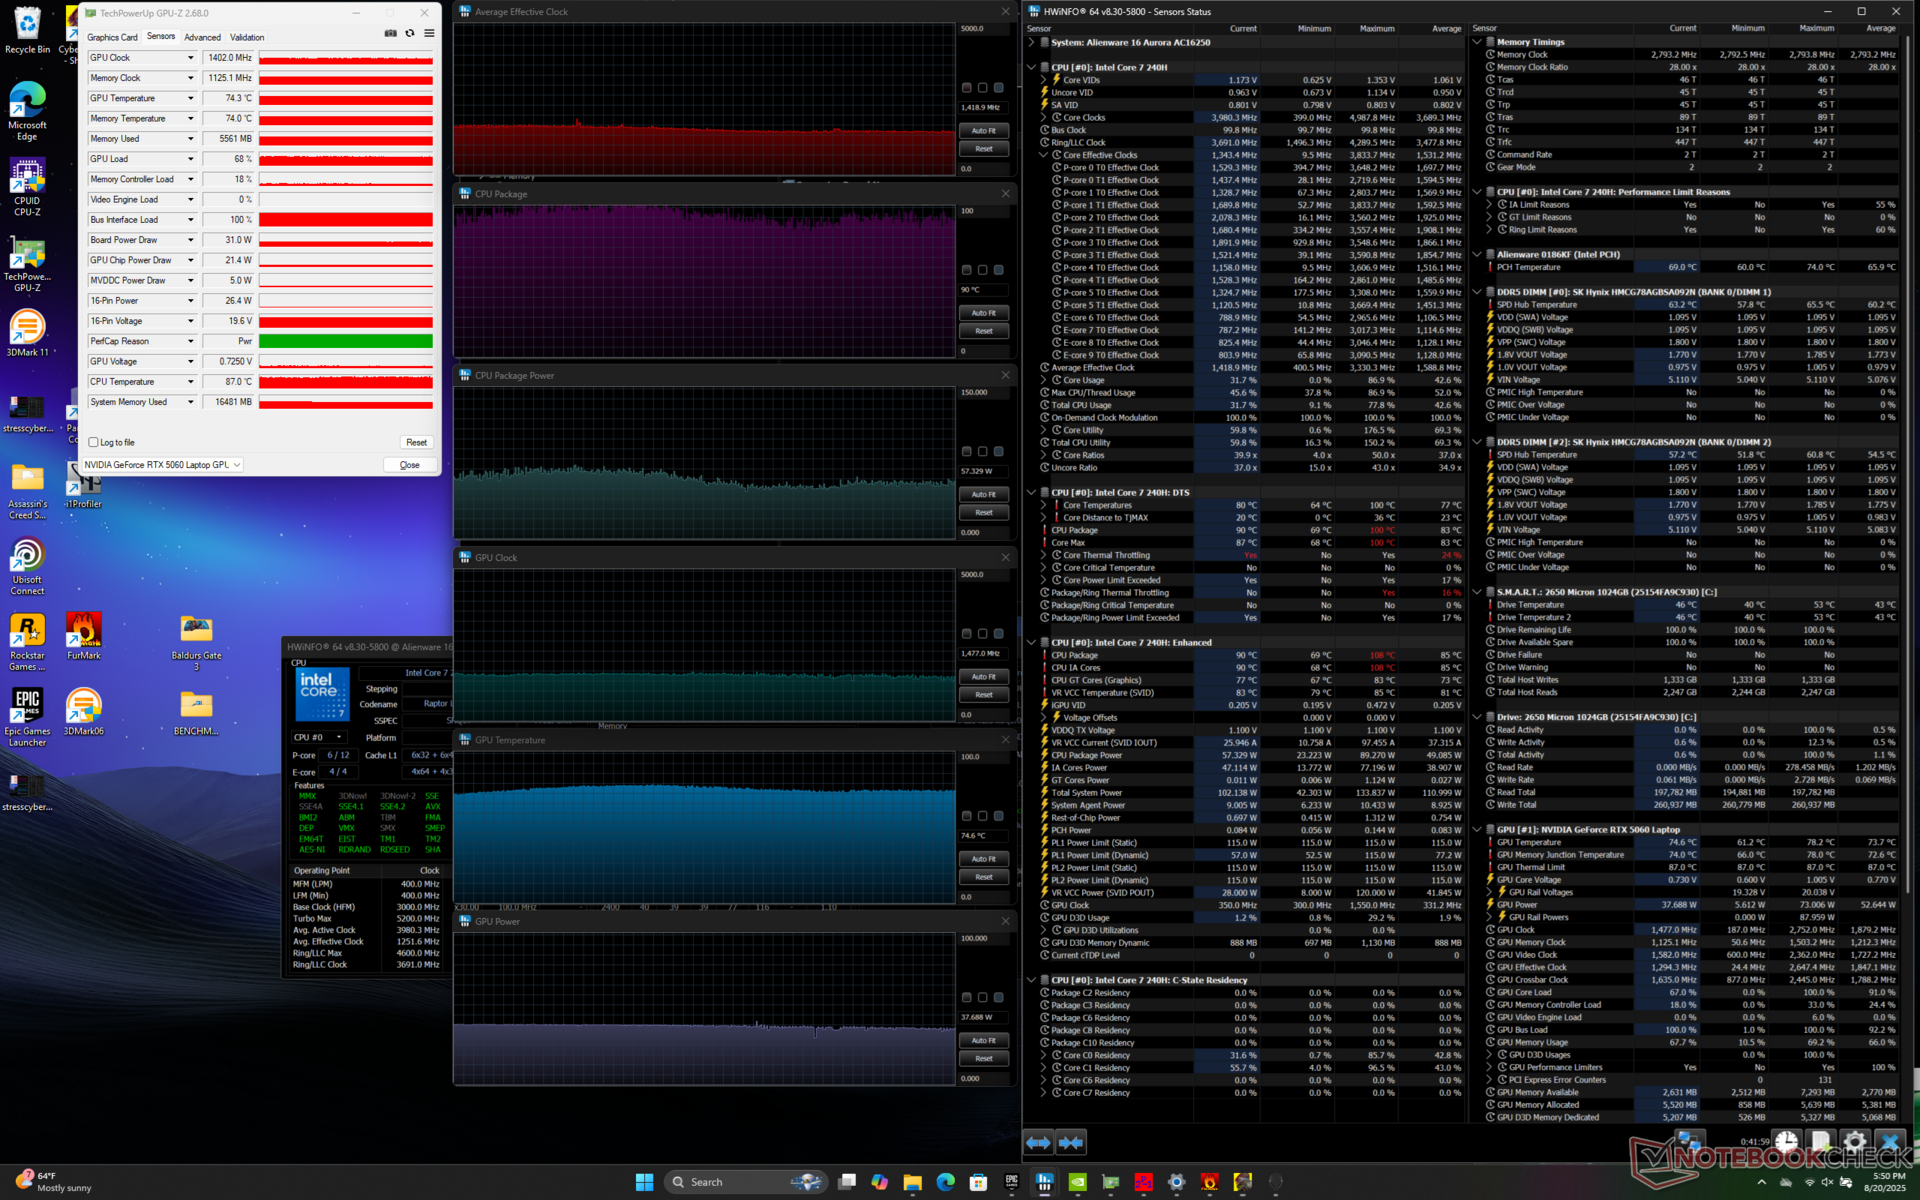
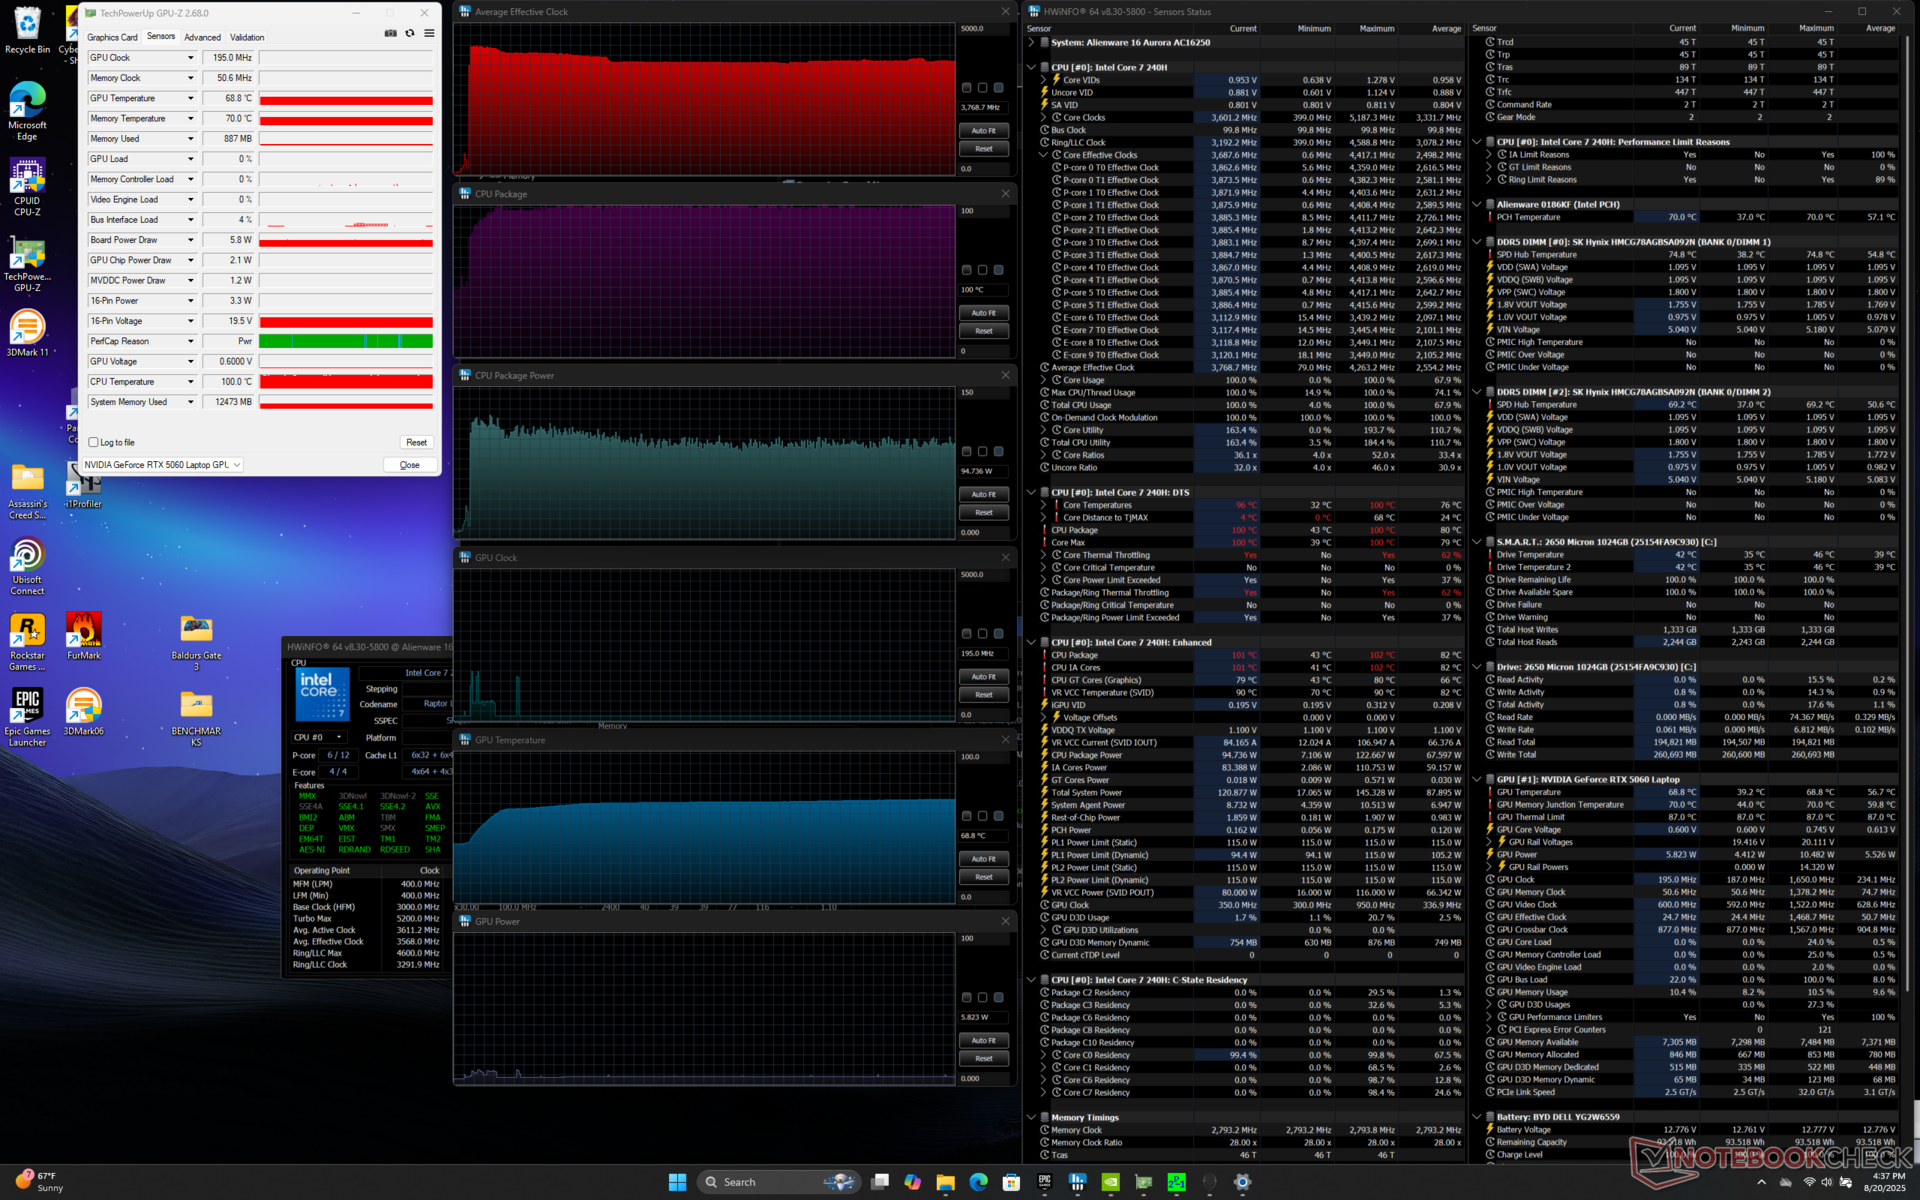
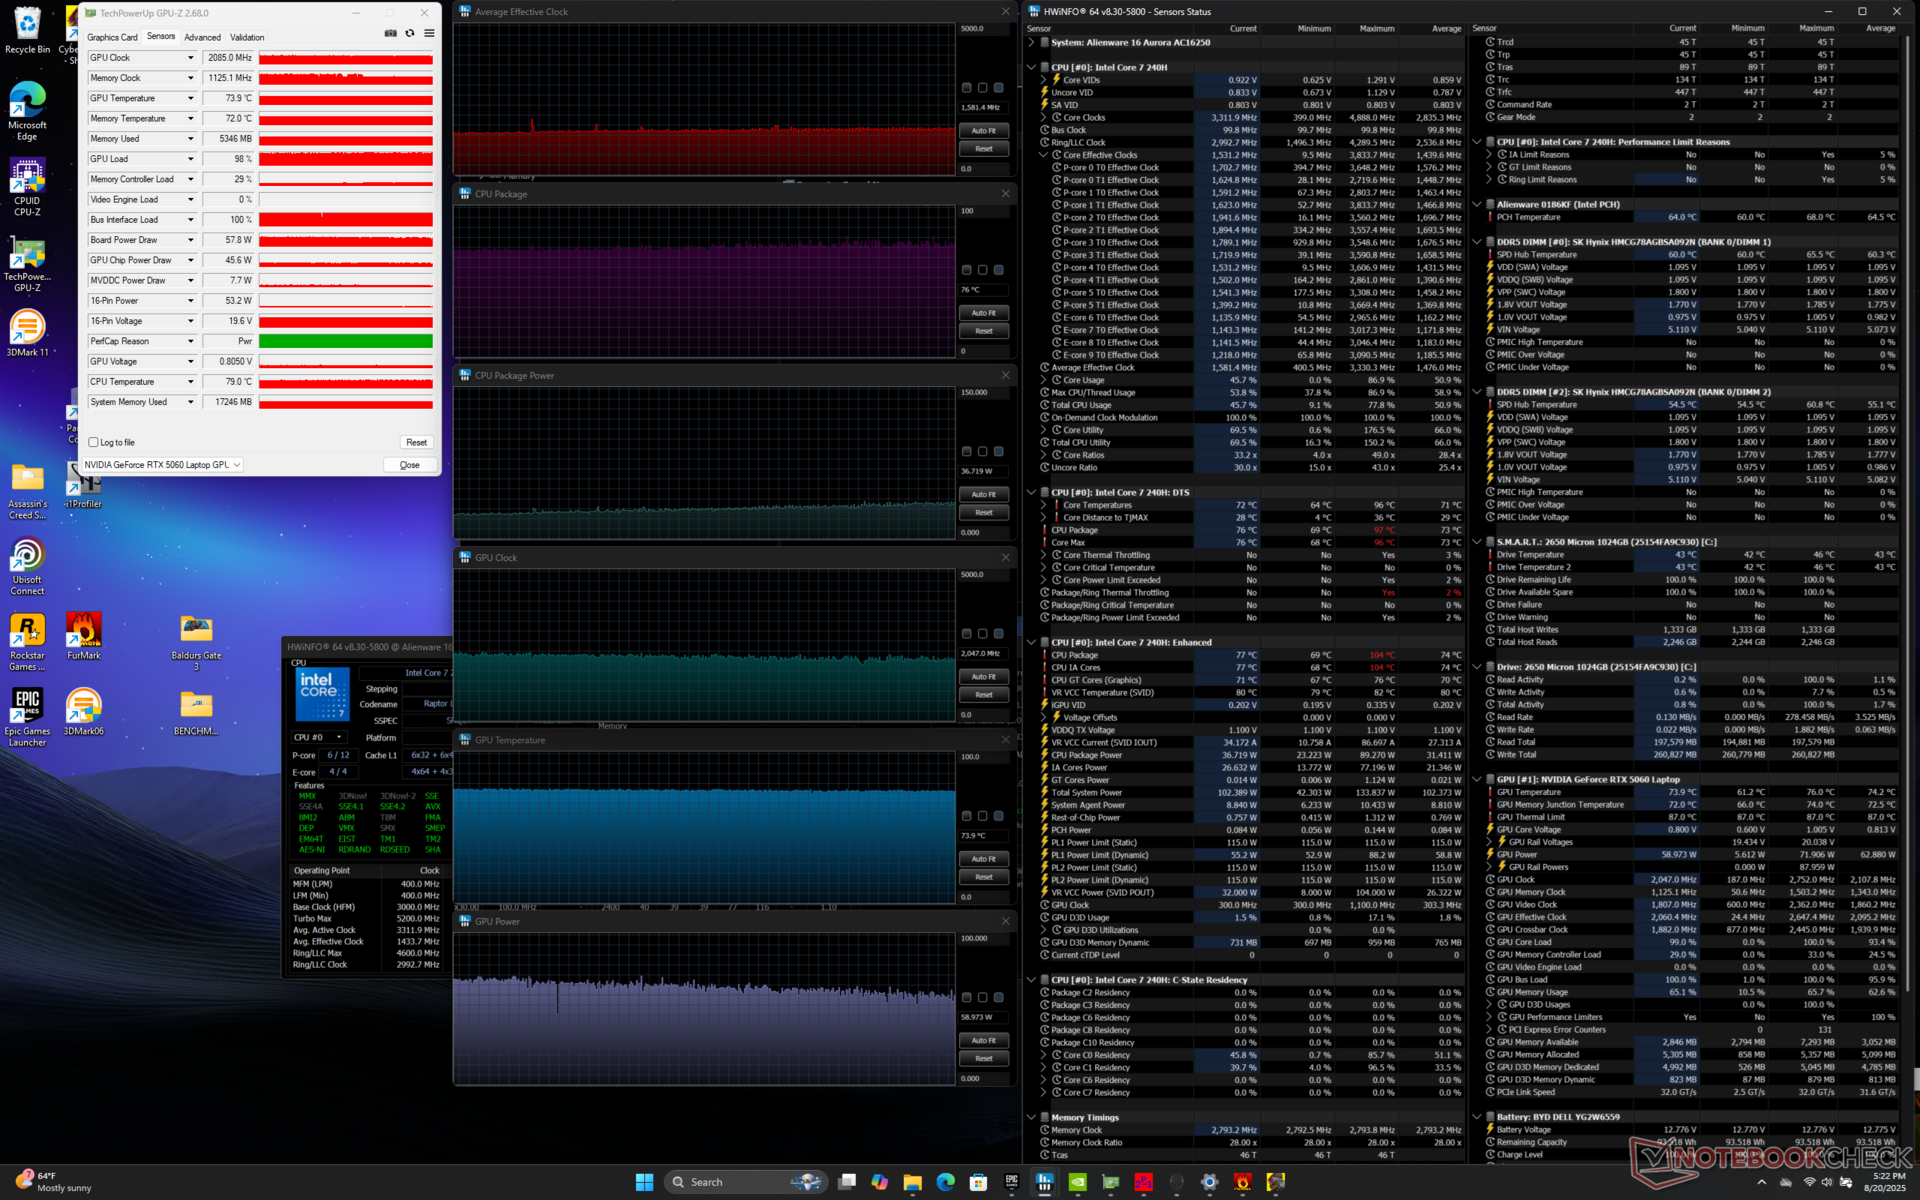
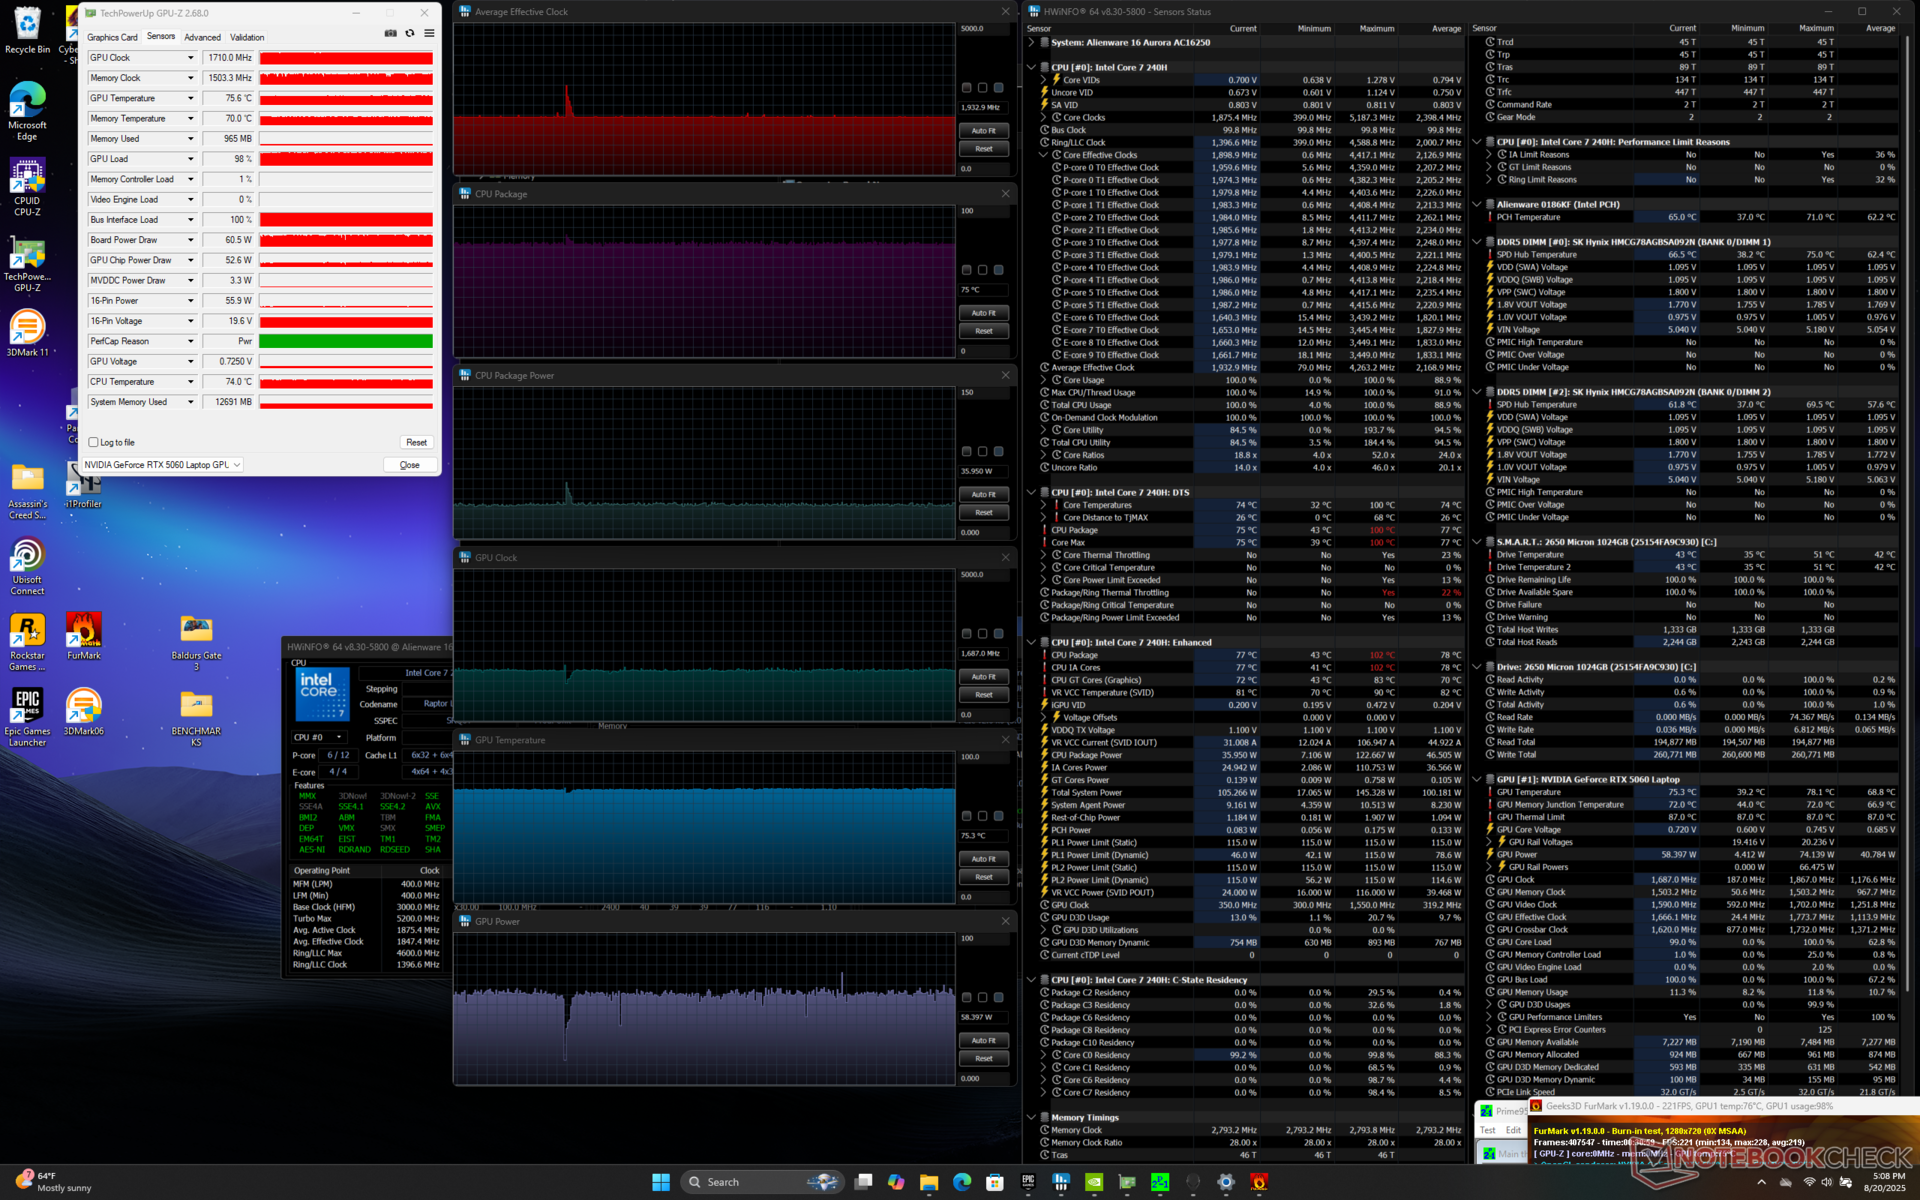
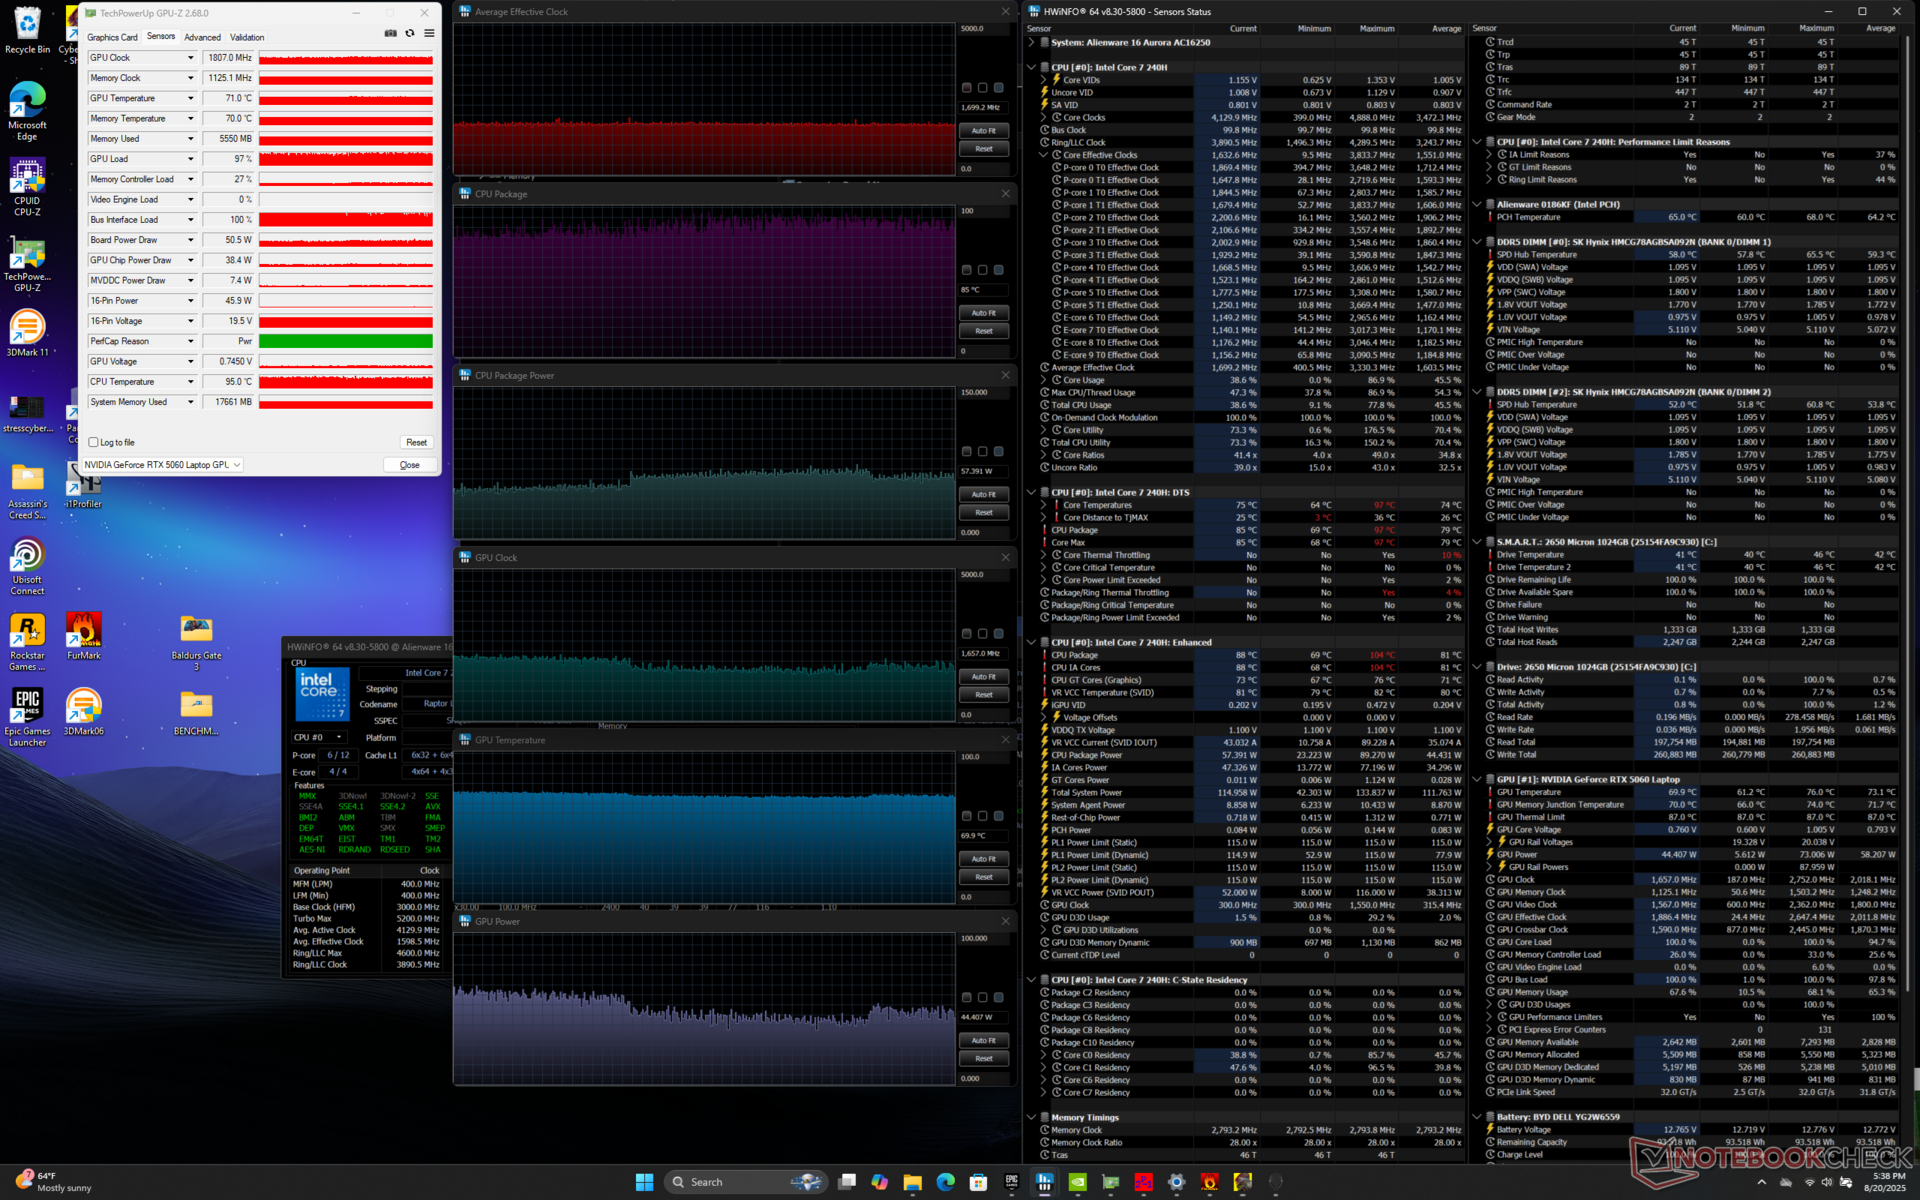
| Horloge moyenne du CPU (GHz) | Horloge du GPU (MHz) | Température moyenne du CPU (°C) | Température moyenne du GPU (°C) | |
| Système en veille | -- | -- | 45 | 39 |
| Prime95 Stress | 3.8 | -- | 100 | 69 |
| Prime95 + FurMark Stress | 1.9 | 1710 | 75 | 75 |
| Cyberpunk 2077 Stress (mode équilibré) | 1.4 | 1402 | 90 | 75 |
| Cyberpunk 2077 Stress (mode Performance) | 1.6 | 2085 | 76 | 74 |
| Cyberpunk 2077 Stress (mode Turbo) | 1.7 | 1807 | 85 | 70 |
Performance du GPU
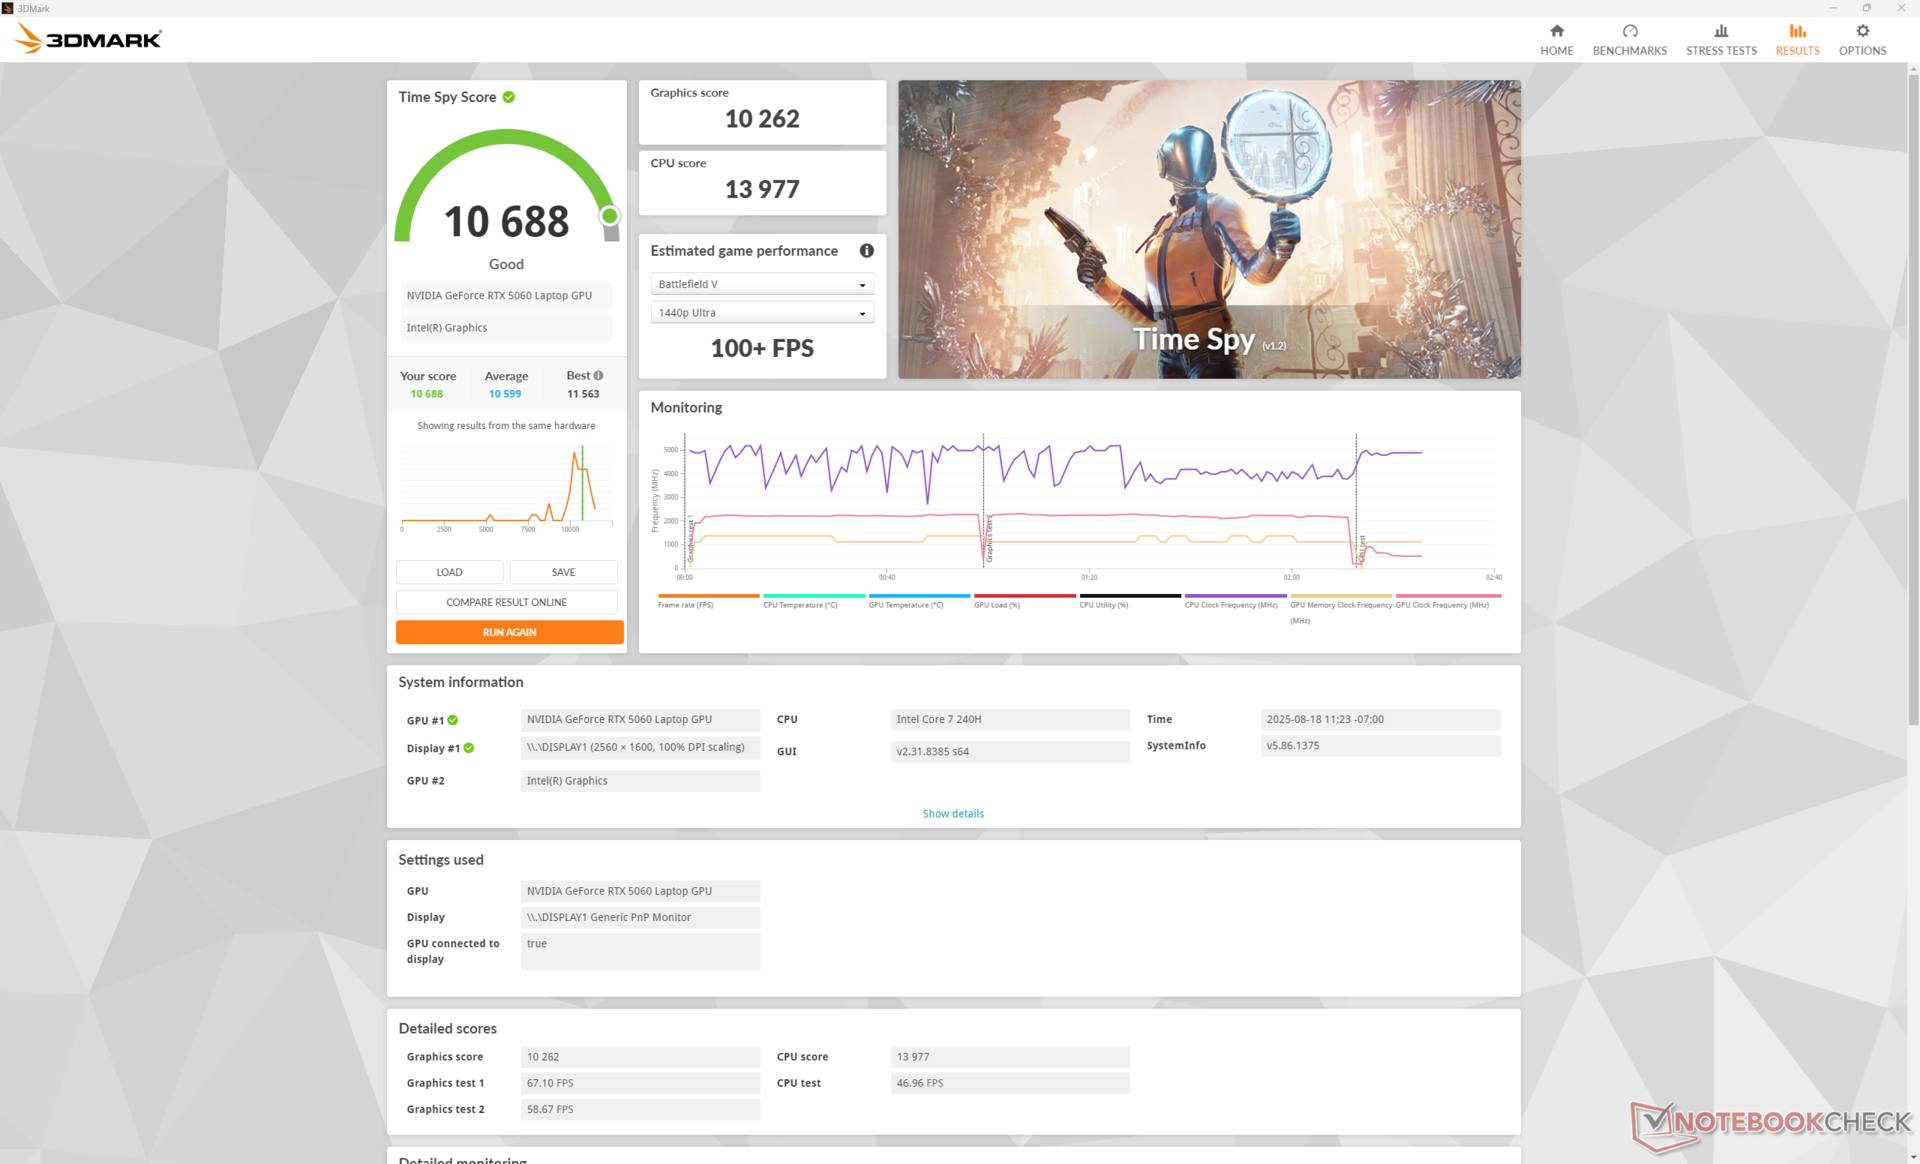
Les performances graphiques brutes de notre rTX 5060 mobile est environ 20 à 30 % plus lente que celle de la rTX 5070 mobile dans l'Aurora 16X. Le déficit de performance entre la RTX 5060 mobile et la rTX 5060 de bureau est également similaire, jusqu'à 30 %.
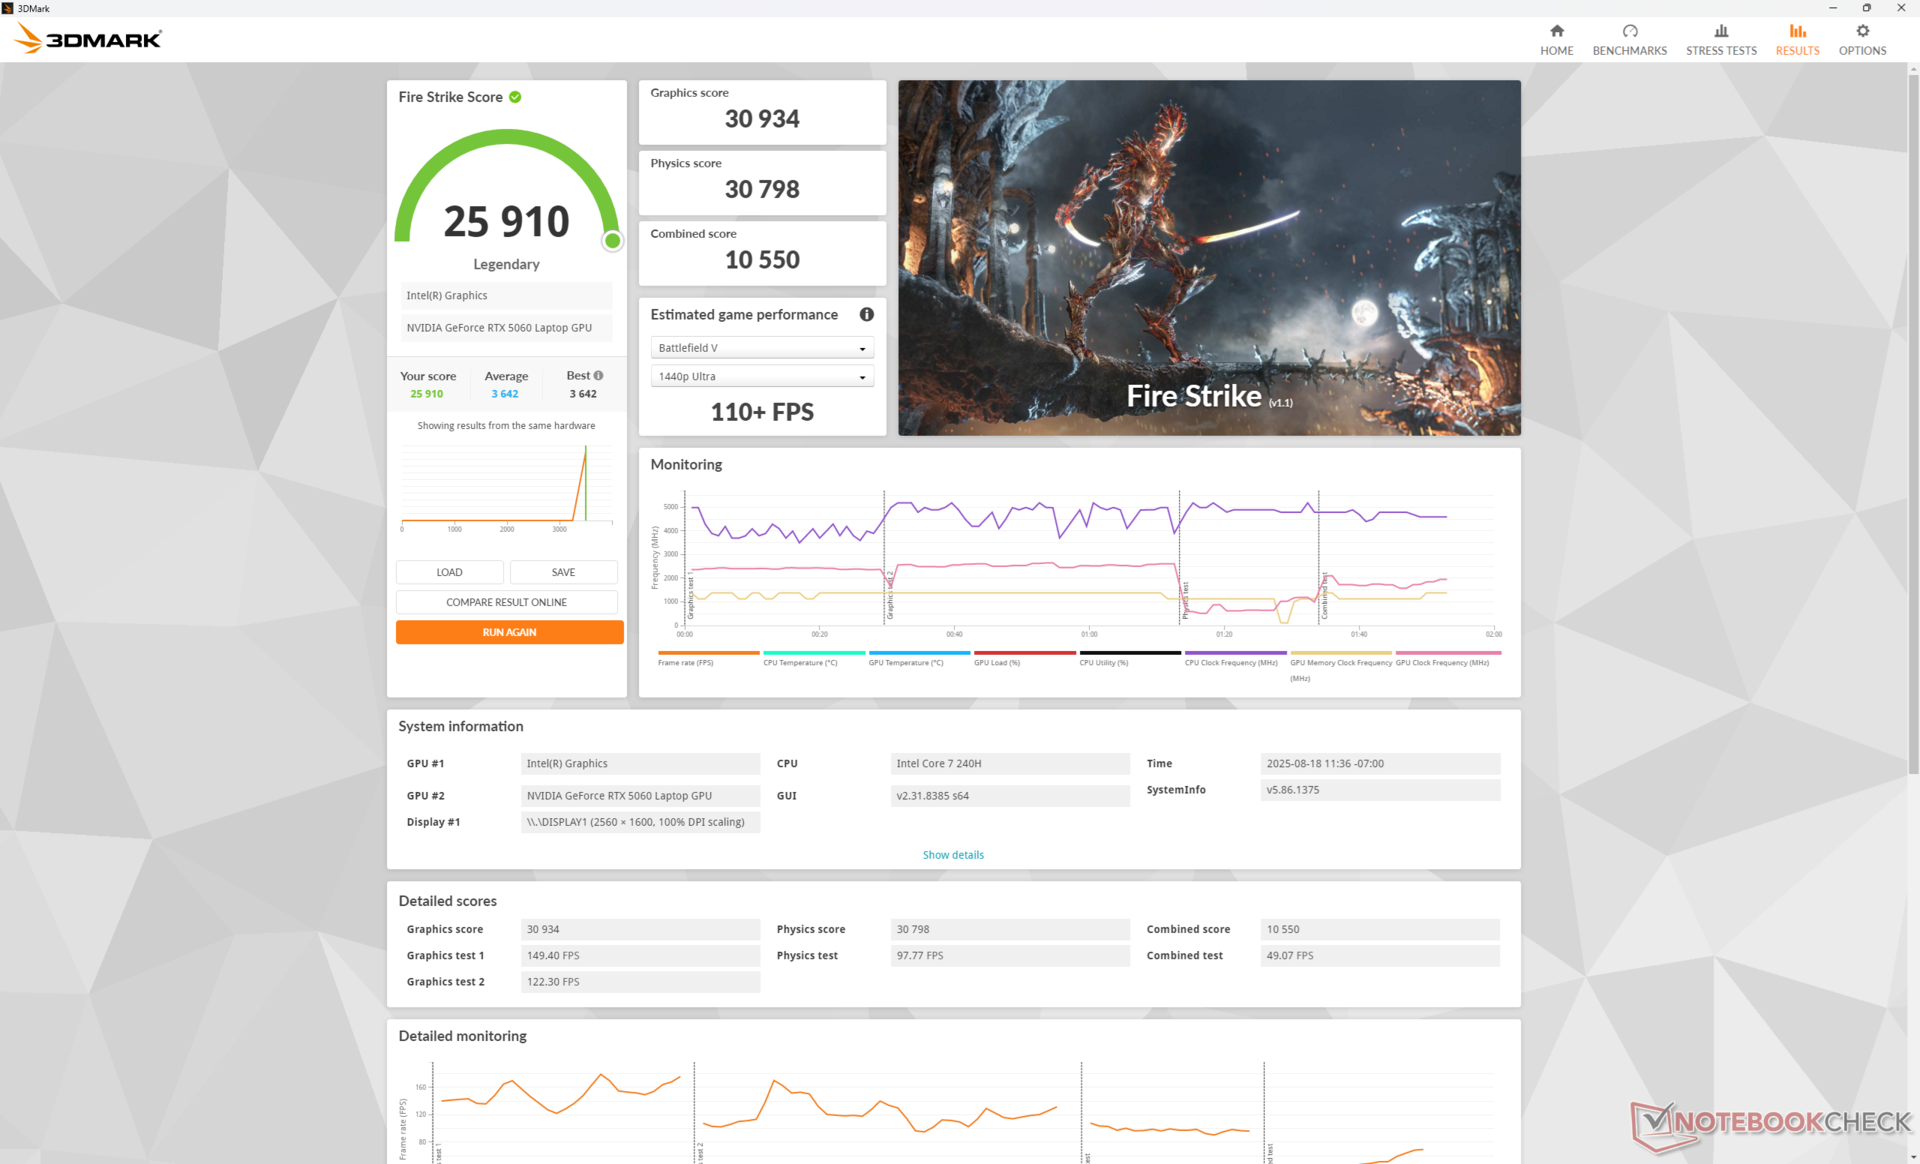
L'exécution en mode Overdrive peut légèrement améliorer les performances graphiques au détriment des performances du processeur, comme le montre notre tableau de résultats Fire Strike ci-dessous.
| Profil de puissance | Score graphique | Score physique | Score combiné |
| Mode Overdrive | 30934 | 30798 | 10550 |
| Mode Performance | 29332 (-5%) | 32145 (+4%) | 8911 (-16%) |
| Mode équilibré | 28162 (-9%) | 31743 (+3%) | 9795 (-7%) |
| Alimentation par batterie | 27155 (-12%) | 21692 (-30%) | 9020 (-15%) |
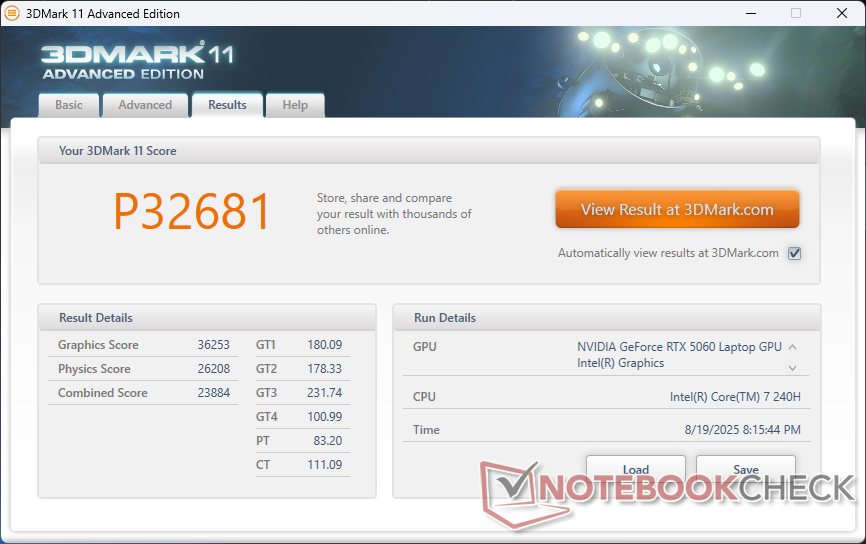
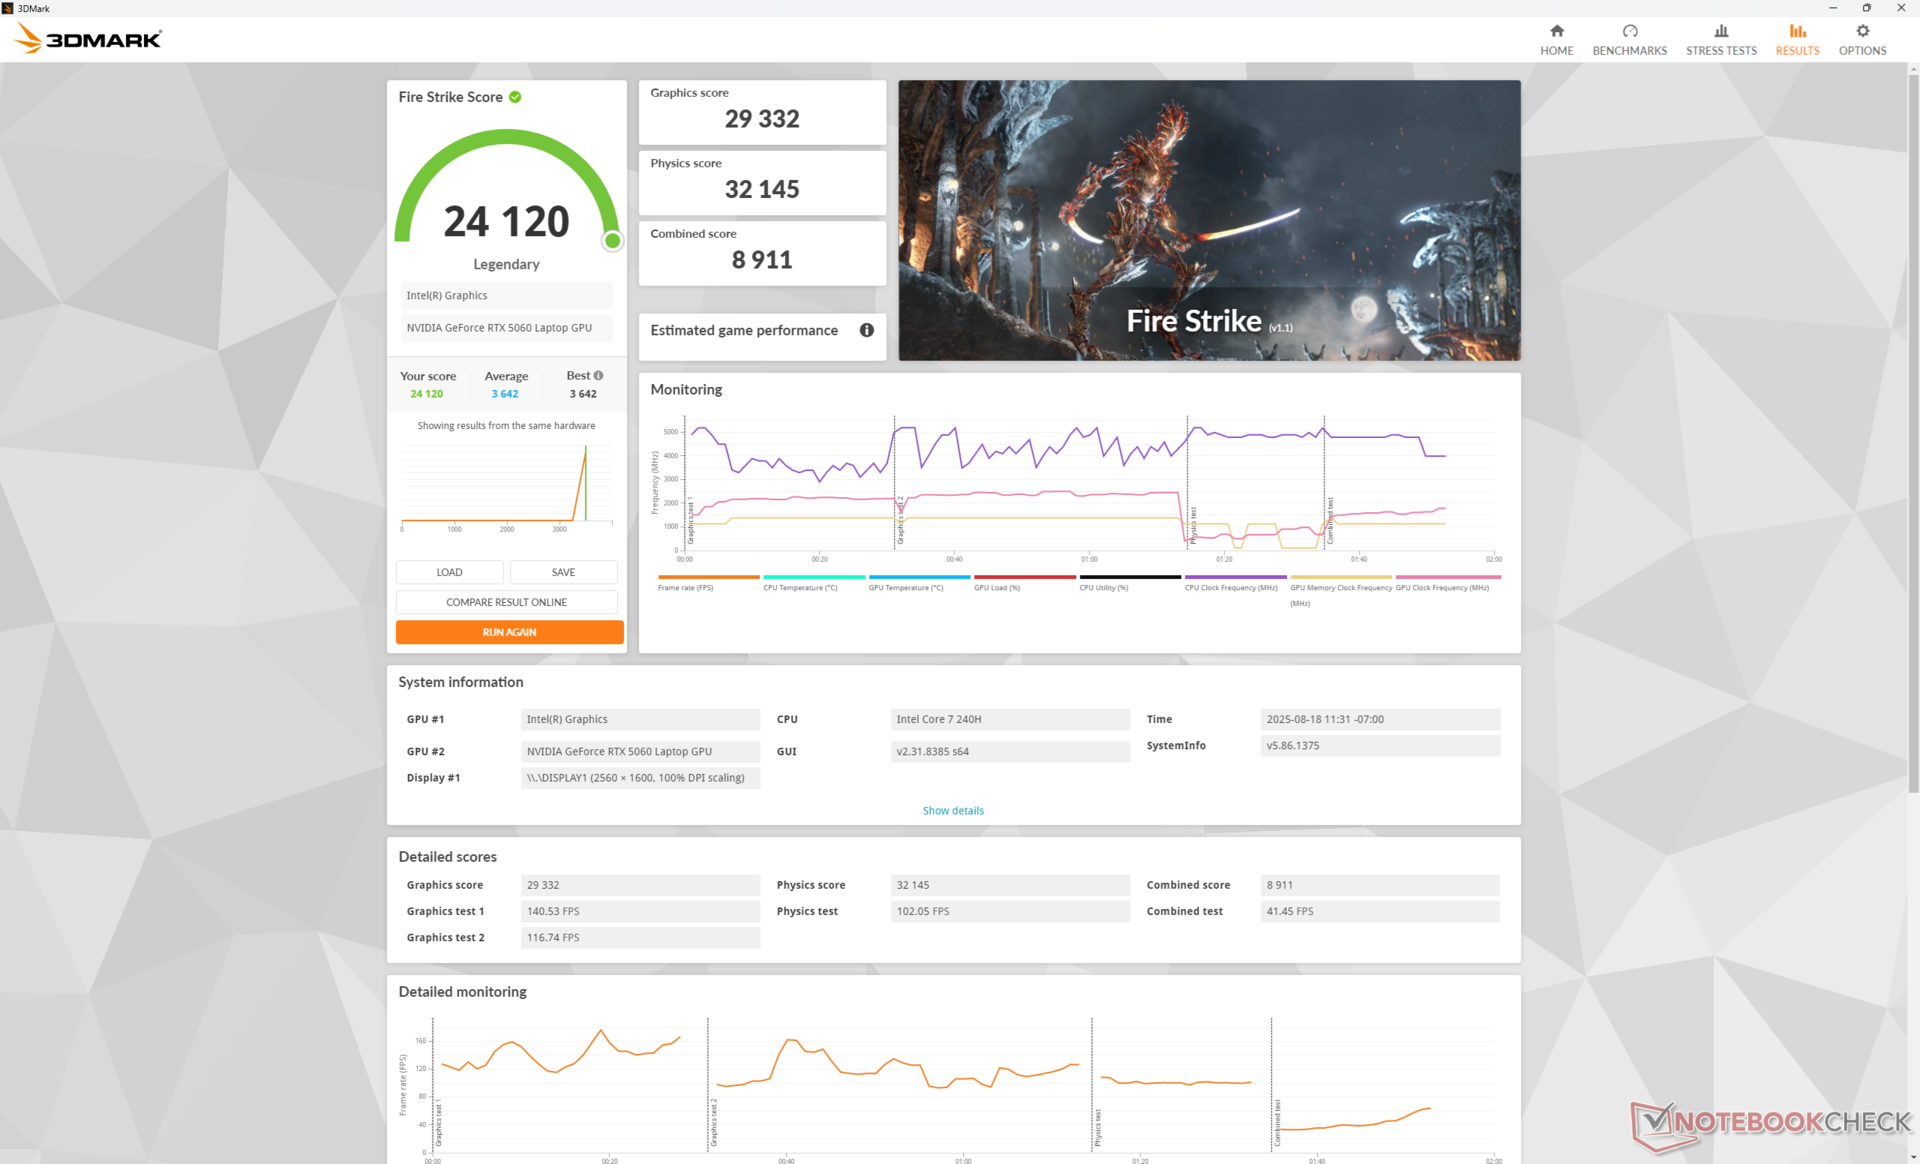
| 3DMark 11 Performance | 32681 points | |
| 3DMark Fire Strike Score | 24120 points | |
| 3DMark Time Spy Score | 10688 points | |
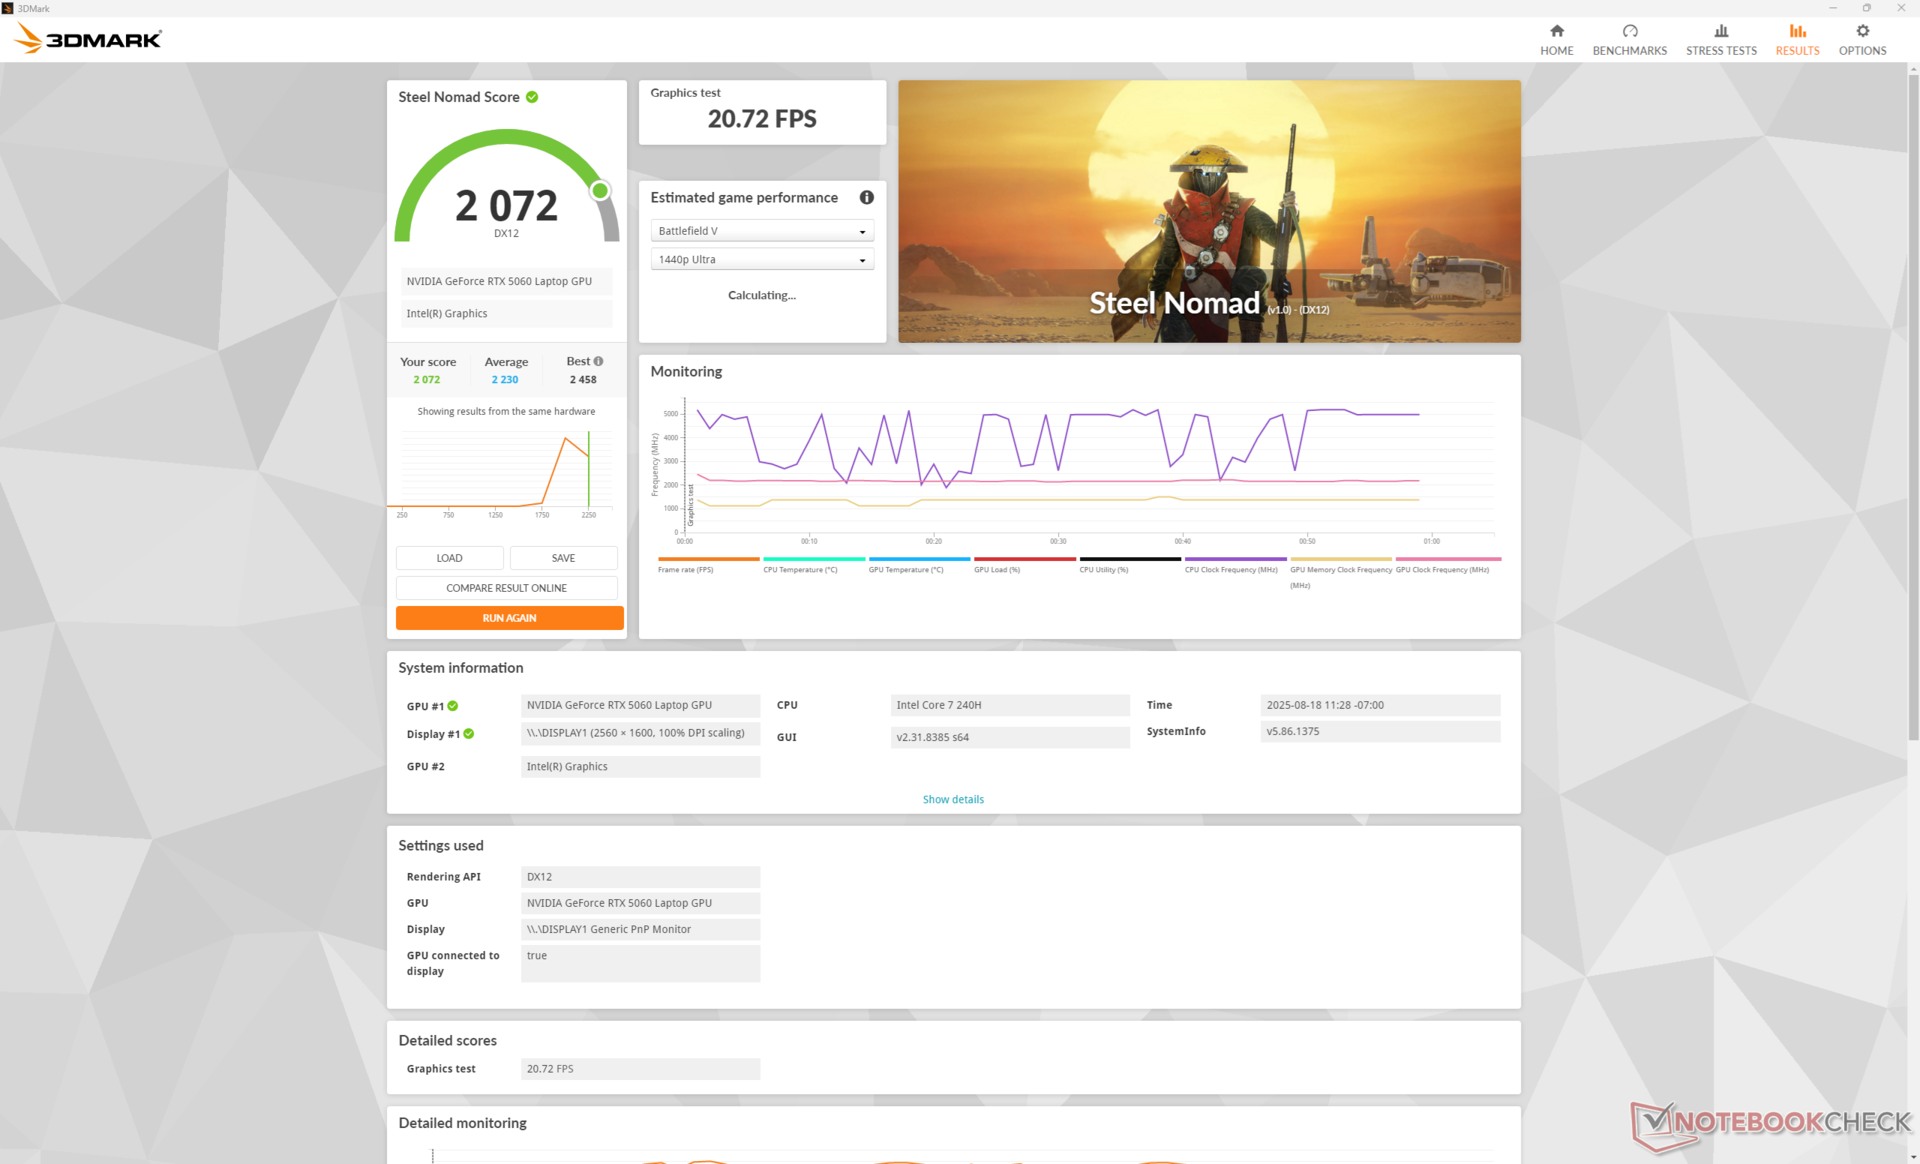
| 3DMark Steel Nomad Score | 2072 points | |
Aide | ||
* ... Moindre est la valeur, meilleures sont les performances
Performances des jeux
La carte mobile GeForce RTX 5060 est presque exclusivement réservée aux jeux en 1080p ou en 1440p si vous jouez à des titres plus exigeants. Par exemple, le simple fait de passer de 1080p à 1440p sur Alan Wake 2 tout en conservant les mêmes paramètres graphiques réduira les taux de rafraîchissement de près de la moitié. Préparez-vous à réduire les paramètres de manière plus significative si vous jouez à des résolutions plus élevées.
Le DLSS et la génération d'images sont recommandés à 1080p si vous souhaitez des paramètres graphiques élevés. Par exemple, si vous jouez à Alan Wake 2 avec des paramètres de ray-trace élevés en 1080p, vous obtiendrez un taux de rafraîchissement moyen de seulement 24 images par seconde. En activant le mode DLSS Quality et 2x FG, le taux d'images moyen passe à 76, mais avec un retard d'entrée notable. Vous devrez conserver la plupart des paramètres à un niveau moyen si vous souhaitez utiliser la résolution 2K native de l'écran.
| Performance rating - Percent | |
| Alienware 16X Aurora, RTX 5070 | |
| Alienware 16 Aurora | |
| Gigabyte Gaming A16 GA6H | |
| Lenovo LOQ 15AHP10 | |
| HP Victus 16 (2024) -1! | |
| Asus TUF Gaming A16 FA608WV | |
| Cyberpunk 2077 - 1920x1080 Ultra Preset (FSR off) | |
| Alienware 16X Aurora, RTX 5070 | |
| Lenovo LOQ 15AHP10 | |
| Gigabyte Gaming A16 GA6H | |
| Alienware 16 Aurora | |
| Asus TUF Gaming A16 FA608WV | |
| HP Victus 16 (2024) | |
| Baldur's Gate 3 - 1920x1080 Ultra Preset AA:T | |
| Alienware 16X Aurora, RTX 5070 | |
| Alienware 16 Aurora | |
| Gigabyte Gaming A16 GA6H | |
| Lenovo LOQ 15AHP10 | |
| Asus TUF Gaming A16 FA608WV | |
| GTA V - 1920x1080 Highest AA:4xMSAA + FX AF:16x | |
| Alienware 16X Aurora, RTX 5070 | |
| Alienware 16 Aurora | |
| Asus TUF Gaming A16 FA608WV | |
| HP Victus 16 (2024) | |
| Lenovo LOQ 15AHP10 | |
| Gigabyte Gaming A16 GA6H | |
| Final Fantasy XV Benchmark - 1920x1080 High Quality | |
| Alienware 16X Aurora, RTX 5070 | |
| Lenovo LOQ 15AHP10 | |
| Alienware 16 Aurora | |
| Asus TUF Gaming A16 FA608WV | |
| HP Victus 16 (2024) | |
| Gigabyte Gaming A16 GA6H | |
| Strange Brigade - 1920x1080 ultra AA:ultra AF:16 | |
| Alienware 16X Aurora, RTX 5070 | |
| Lenovo LOQ 15AHP10 | |
| Gigabyte Gaming A16 GA6H | |
| Asus TUF Gaming A16 FA608WV | |
| Alienware 16 Aurora | |
| HP Victus 16 (2024) | |
| Dota 2 Reborn - 1920x1080 ultra (3/3) best looking | |
| Alienware 16X Aurora, RTX 5070 | |
| Alienware 16 Aurora | |
| HP Victus 16 (2024) | |
| Gigabyte Gaming A16 GA6H | |
| Asus TUF Gaming A16 FA608WV | |
| Lenovo LOQ 15AHP10 | |
| X-Plane 11.11 - 1920x1080 high (fps_test=3) | |
| Alienware 16X Aurora, RTX 5070 | |
| HP Victus 16 (2024) | |
| Gigabyte Gaming A16 GA6H | |
| Alienware 16 Aurora | |
| Lenovo LOQ 15AHP10 | |
| Asus TUF Gaming A16 FA608WV | |
| F1 24 | |
| 1920x1080 Ultra High Preset AA:T AF:16x | |
| Chuwi Gamebook, R9 9955HX | |
| Alienware 16X Aurora, RTX 5070 | |
| Zotac GeForce RTX 5060 AMP | |
| Moyenne NVIDIA GeForce RTX 5060 Laptop (46.1 - 77.5, n=9) | |
| Alienware 16 Aurora | |
| 2560x1440 Ultra High Preset AA:T AF:16x | |
| Chuwi Gamebook, R9 9955HX | |
| Alienware 16X Aurora, RTX 5070 | |
| Zotac GeForce RTX 5060 AMP | |
| Moyenne NVIDIA GeForce RTX 5060 Laptop (29.8 - 49.1, n=9) | |
| Alienware 16 Aurora | |
| 3840x2160 Ultra High Preset AA:T AF:16x | |
| Zotac GeForce RTX 5060 AMP | |
| Alienware 16X Aurora, RTX 5070 | |
| Alienware 16 Aurora | |
| Moyenne NVIDIA GeForce RTX 5060 Laptop (n=1) | |
| 3840x2160 Ultra High Preset + Quality DLSS AF:16x | |
| Zotac GeForce RTX 5060 AMP | |
| Alienware 16X Aurora, RTX 5070 | |
| Alienware 16 Aurora | |
| Moyenne NVIDIA GeForce RTX 5060 Laptop (n=1) | |
| 2560x1440 Ultra High Preset + Quality DLSS AF:16x | |
| Chuwi Gamebook, R9 9955HX | |
| Alienware 16X Aurora, RTX 5070 | |
| Zotac GeForce RTX 5060 AMP | |
| Moyenne NVIDIA GeForce RTX 5060 Laptop (46 - 74.5, n=8) | |
| Alienware 16 Aurora | |
| Indiana Jones and the Great Circle | |
| 1920x1080 High Preset | |
| Chuwi Gamebook, R9 9955HX | |
| Zotac GeForce RTX 5060 AMP | |
| Moyenne NVIDIA GeForce RTX 5060 Laptop (52.8 - 68.1, n=3) | |
| Alienware 16X Aurora, RTX 5070 | |
| Alienware 16 Aurora | |
| 1920x1080 Very Ultra Preset | |
| Chuwi Gamebook, R9 9955HX | |
| Zotac GeForce RTX 5060 AMP | |
| Alienware 16 Aurora | |
| Moyenne NVIDIA GeForce RTX 5060 Laptop (6.3 - 15.6, n=3) | |
| Alienware 16X Aurora, RTX 5070 | |
| 2560x1440 Very Ultra Preset | |
| Chuwi Gamebook, R9 9955HX | |
| Alienware 16 Aurora | |
| Moyenne NVIDIA GeForce RTX 5060 Laptop (4.2 - 10.1, n=3) | |
| Alienware 16X Aurora, RTX 5070 | |
| Zotac GeForce RTX 5060 AMP | |
| Monster Hunter Wilds | |
| 1920x1080 medium, no upscaling | |
| Chuwi Gamebook, R9 9955HX | |
| Alienware 16X Aurora, RTX 5070 | |
| Zotac GeForce RTX 5060 AMP | |
| Moyenne NVIDIA GeForce RTX 5060 Laptop (45.2 - 68.3, n=4) | |
| Alienware 16 Aurora | |
| 1920x1080 ultra, RT: high, no upscaling | |
| Chuwi Gamebook, R9 9955HX | |
| Zotac GeForce RTX 5060 AMP | |
| Alienware 16X Aurora, RTX 5070 | |
| Alienware 16 Aurora | |
| Moyenne NVIDIA GeForce RTX 5060 Laptop (16.6 - 36.5, n=4) | |
| 2560x1440 ultra, RT: high, no upscaling | |
| Chuwi Gamebook, R9 9955HX | |
| Alienware 16X Aurora, RTX 5070 | |
| Alienware 16 Aurora | |
| Moyenne NVIDIA GeForce RTX 5060 Laptop (13.9 - 20.9, n=3) | |
Cyberpunk 2077 ultra FPS Chart
| Bas | Moyen | Élevé | Ultra | QHD DLSS | QHD | 4K DLSS | 4K | |
|---|---|---|---|---|---|---|---|---|
| GTA V (2015) | 186.8 | 186.2 | 179.7 | 120 | 96.7 | 90.2 | ||
| Dota 2 Reborn (2015) | 195.1 | 178.3 | 171.9 | 156.1 | 105.2 | |||
| Final Fantasy XV Benchmark (2018) | 212 | 142 | 109.5 | 79.1 | 45 | |||
| X-Plane 11.11 (2018) | 125.4 | 105.2 | 93.6 | 62.9 | ||||
| Strange Brigade (2018) | 356 | 260 | 219 | 191.1 | 133.7 | 72.8 | ||
| Baldur's Gate 3 (2023) | 135.9 | 117 | 106 | 105.3 | 101.3 | 70.2 | 56.5 | 34.8 |
| Cyberpunk 2077 (2023) | 123.9 | 104.3 | 86.7 | 80.1 | 58.9 | 48.5 | 21.5 | |
| Alan Wake 2 (2023) | 66.2 | 59.1 | 54.6 | 31.2 | 12.1 | |||
| F1 24 (2024) | 181.2 | 176.8 | 154.3 | 46.1 | 46 | 29.8 | 9.21 | 10.7 |
| Black Myth: Wukong (2024) | 83 | 63 | 48 | 26 | 30 | 19 | 9 | |
| Indiana Jones and the Great Circle (2024) | 102.1 | 54.9 | 14.1 | 10.1 | 5.3 | |||
| Monster Hunter Wilds (2025) | 49.4 | 45.2 | 33.5 | 17.8 | 10.6 | |||
| Assassin's Creed Shadows (2025) | 50 | 47 | 45 | 31 | 24 | 26 | 14 |
Émissions
Bruit du système
Le bruit du ventilateur lors de l'exécution de Cyberpunk 2077 se stabilise à 46,8 dB(A), 49,9 dB(A), et 55,6 dB(A) en mode équilibré, mode performance, et mode Overdrive, respectivement. Ces niveaux sont proches de ceux que nous avons observés sur le 16X Aurora.
Degré de la nuisance sonore
| Au repos |
| 24 / 25.6 / 25.6 dB(A) |
| Fortement sollicité |
| 46.8 / 55.6 dB(A) |
 | ||
30 dB silencieux 40 dB(A) audible 50 dB(A) bruyant |
||
min: | ||
| Alienware 16 Aurora GeForce RTX 5060 Laptop, Core 7 240H | Alienware 16X Aurora, RTX 5070 GeForce RTX 5070 Laptop, Ultra 9 275HX | Lenovo LOQ 15AHP10 GeForce RTX 5060 Laptop, R7 250, Micron 2500 1TB MTFDKBA1T0QGN | Gigabyte Gaming A16 GA6H GeForce RTX 5070 Laptop, i7-13620H, Kingston OM8PGP41024Q-A0 | Asus TUF Gaming A16 FA608WV GeForce RTX 4060 Laptop GPU, Ryzen AI 9 HX 370, Micron 2400 MTFDKBA1T0QFM | HP Victus 16 (2024) GeForce RTX 4060 Laptop GPU, i7-14700HX, Kioxia XG8 KXG80ZNV512G | |
|---|---|---|---|---|---|---|
| Noise | 5% | -37% | -5% | 13% | -8% | |
| arrêt / environnement * (dB) | 22.9 | 23.7 -3% | 25 -9% | 24 -5% | 23 -0% | 25 -9% |
| Idle Minimum * (dB) | 24 | 23.9 -0% | 43 -79% | 25 -4% | 23 4% | 28 -17% |
| Idle Average * (dB) | 25.6 | 23.9 7% | 45 -76% | 26 -2% | 23 10% | 29 -13% |
| Idle Maximum * (dB) | 25.6 | 26.1 -2% | 48 -88% | 27 -5% | 29.11 -14% | 33 -29% |
| Load Average * (dB) | 46.8 | 26.8 43% | 53 -13% | 54 -15% | 31 34% | 45 4% |
| Cyberpunk 2077 ultra * (dB) | 49.9 | 51.8 -4% | 51 -2% | 54 -8% | 36.23 27% | |
| Load Maximum * (dB) | 55.6 | 58 -4% | 53 5% | 55 1% | 39.44 29% | 48 14% |
| Witcher 3 ultra * (dB) | 43 |
* ... Moindre est la valeur, meilleures sont les performances
Gestion de l'énergie
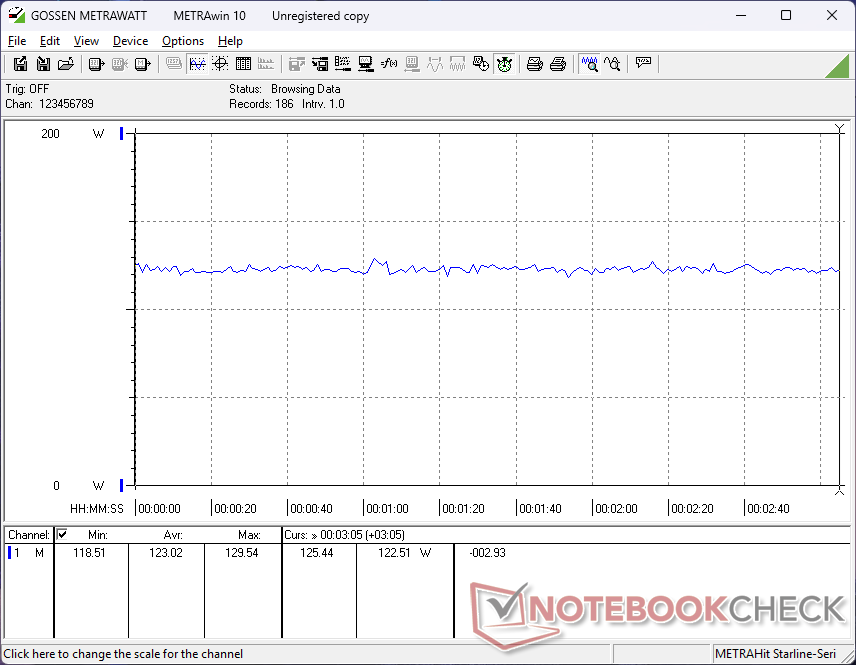
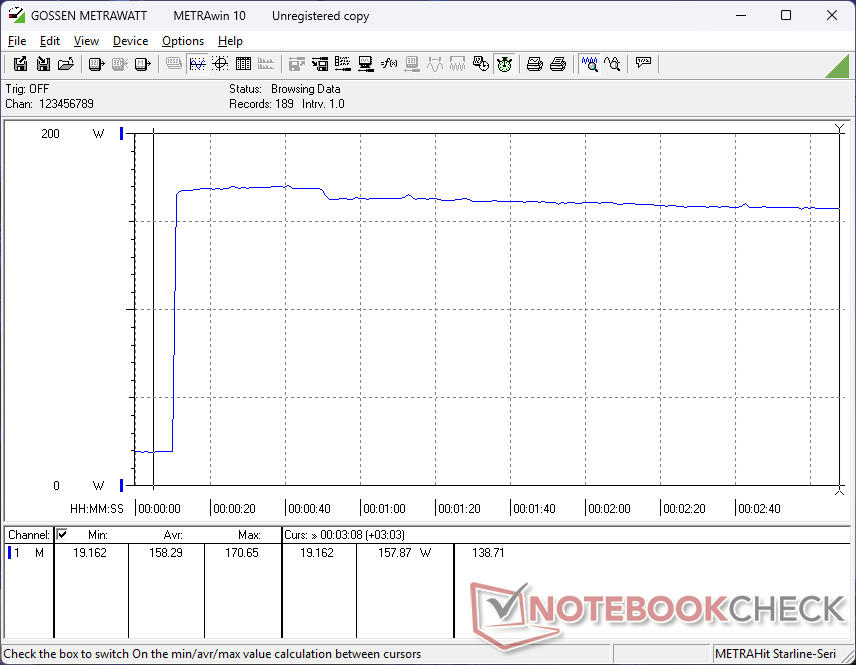
Consommation électrique
Les composants plus lents de la 16 Aurora ont permis de réduire considérablement la consommation d'énergie par rapport à la 16X Aurora. Bien sûr, l'inconvénient est que les performances graphiques sont 30 % plus lentes que celles de l'option RTX 5070 du 16X Aurora dans les jeux.
Plus important encore, l'exécution de Prime95 sur la 16 Aurora demande autant d'énergie que la 16X Aurora, même si le CPU de la 16 Aurora est environ 50 % plus lent. Cela s'explique par le fait que le 16 Aurora utilise un processeur d'ancienne génération avec moins de la moitié des cœurs du 16X Aurora.
Il convient également de noter que le 16 Aurora est livré avec un adaptateur CA plus compact de 180 W, comparé à l'adaptateur CA plus grand de 280 W livré avec le 16X Aurora (~15,5 x 7,5 x 3 cm ~20,5 x 10,5 x 2,5 cm).
| Éteint/en veille | |
| Au repos | |
| Fortement sollicité |
|
Légende:
min: | |
| Alienware 16 Aurora Core 7 240H, GeForce RTX 5060 Laptop, , IPS, 2560x1600, 16" | Alienware 16X Aurora, RTX 5070 Ultra 9 275HX, GeForce RTX 5070 Laptop, , IPS, 2560x1600, 16" | Lenovo LOQ 15AHP10 R7 250, GeForce RTX 5060 Laptop, Micron 2500 1TB MTFDKBA1T0QGN, IPS, 1920x1080, 15.6" | Gigabyte Gaming A16 GA6H i7-13620H, GeForce RTX 5070 Laptop, Kingston OM8PGP41024Q-A0, IPS, 2560x1600, 16" | Asus TUF Gaming A16 FA608WV Ryzen AI 9 HX 370, GeForce RTX 4060 Laptop GPU, Micron 2400 MTFDKBA1T0QFM, IPS, 1920x1200, 16" | HP Victus 16 (2024) i7-14700HX, GeForce RTX 4060 Laptop GPU, Kioxia XG8 KXG80ZNV512G, IPS, 1920x1080, 16.1" | |
|---|---|---|---|---|---|---|
| Power Consumption | -100% | -60% | -14% | -8% | -37% | |
| Idle Minimum * (Watt) | 4.4 | 20.1 -357% | 20 -355% | 9 -105% | 6.8 -55% | 9 -105% |
| Idle Average * (Watt) | 18 | 27.6 -53% | 20.7 -15% | 11 39% | 12.7 29% | 15 17% |
| Idle Maximum * (Watt) | 18.2 | 31.8 -75% | 22.7 -25% | 23 -26% | 15.2 16% | 23 -26% |
| Load Average * (Watt) | 87.1 | 102.7 -18% | 71 18% | 91 -4% | 85 2% | 123 -41% |
| Cyberpunk 2077 ultra external monitor * (Watt) | 120.6 | 192.3 -59% | 151.1 -25% | 130 -8% | 143 -19% | |
| Cyberpunk 2077 ultra * (Watt) | 123 | 217 -76% | 153.1 -24% | 132.5 -8% | 145 -18% | |
| Load Maximum * (Watt) | 183 | 292 -60% | 172 6% | 155 15% | 199 -9% | 241 -32% |
| Witcher 3 ultra * (Watt) | 143.7 |
* ... Moindre est la valeur, meilleures sont les performances
Consommation électrique Cyberpunk / Stress Test
Consommation électrique du moniteur externe
Autonomie de la batterie
Les durées d'utilisation du réseau local sans fil ont augmenté de plus de trois heures en raison des économies d'énergie mentionnées ci-dessus.
| Alienware 16 Aurora Core 7 240H, GeForce RTX 5060 Laptop, 96 Wh | Alienware 16X Aurora, RTX 5070 Ultra 9 275HX, GeForce RTX 5070 Laptop, 96 Wh | Lenovo LOQ 15AHP10 R7 250, GeForce RTX 5060 Laptop, 60 Wh | Gigabyte Gaming A16 GA6H i7-13620H, GeForce RTX 5070 Laptop, 76 Wh | Asus TUF Gaming A16 FA608WV Ryzen AI 9 HX 370, GeForce RTX 4060 Laptop GPU, 90 Wh | HP Victus 16 (2024) i7-14700HX, GeForce RTX 4060 Laptop GPU, 83 Wh | |
|---|---|---|---|---|---|---|
| Autonomie de la batterie | -43% | -40% | 3% | 89% | 13% | |
| WiFi v1.3 (h) | 7.5 | 4.3 -43% | 4.5 -40% | 7.7 3% | 14.2 89% | 8.5 13% |
| Reader / Idle (h) | 6.9 | |||||
| Load (h) | 1.3 | 2.1 | ||||
| H.264 (h) | 14.7 |
Notebookcheck Rating
L'Alienware 16 Aurora concilie les besoins de la rentrée, tels que l'autonomie de la batterie et la finesse, avec les performances requises pour faire tourner confortablement les derniers titres en 1080p.
Alienware 16 Aurora
- 08/27/2025 v8
Allen Ngo
 Total Sustainability Score:
 Comparaison avec des concurrents potentiels
Image | Modèle | Prix | Poids | Épaisseur | Écran |
|---|---|---|---|---|---|
1. 76.2%  | Alienware 16 Aurora Intel Core 7 240H ⎘ NVIDIA GeForce RTX 5060 Laptop ⎘ 32 Go Mémoire | Amazon: Prix de liste: 1100 USD | 2.6 kg | 15.2 mm | 16.00" 2560x1600 189 PPI IPS |
2. 84.9%  | Alienware 16X Aurora, RTX 5070 Intel Core Ultra 9 275HX ⎘ NVIDIA GeForce RTX 5070 Laptop ⎘ 32 Go Mémoire | Amazon: Prix de liste: 1800 USD | 2.5 kg | 23.4 mm | 16.00" 2560x1600 189 PPI IPS |
3. 85.9%  | Asus ROG Zephyrus G16 GA605WV AMD Ryzen AI 9 HX 370 ⎘ NVIDIA GeForce RTX 4060 Laptop GPU ⎘ 32 Go Mémoire, 1024 Go SSD | Amazon: Prix de liste: 2599€ | 1.8 kg | 17.2 mm | 16.00" 2560x1600 189 PPI OLED |
4. 89% v7 (old)  | Lenovo Legion Pro 5 16ARX8 (R5 7645HX, RTX 4050) AMD Ryzen 5 7645HX ⎘ NVIDIA GeForce RTX 4050 Laptop GPU ⎘ 16 Go Mémoire, 512 Go SSD | Amazon: 1. $1,799.00 Lenovo Legion Pro 5 16Arx8 1... 2. $1,779.00 Lenovo Legion Pro 5 16" WQXG... 3. $1,367.40 Lenovo Legion 5 Gen 10 Gamin... Prix de liste: 1500€ | 2.5 kg | 27.3 mm | 16.00" 2560x1600 189 PPI IPS |
5. 89.5% v7 (old)  | Acer Predator Helios 16 PH16-71-731Q Intel Core i7-13700HX ⎘ NVIDIA GeForce RTX 4060 Laptop GPU ⎘ 16 Go Mémoire, 1024 Go SSD | Amazon: 1. $139.99 HOULISE Replacement for Acer... 2. $90.33 LCDBros Screen for Acer Pred... 3. $155.00 Generic Replacement Screen 1... Prix de liste: 2099€ | 2.6 kg | 26.9 mm | 16.00" 2560x1600 189 PPI IPS-LED |
6. 81.9%  | HP Omen Max 16 ah000 Intel Core Ultra 9 275HX ⎘ NVIDIA GeForce RTX 5090 Laptop ⎘ 32 Go Mémoire, 2048 Go SSD | Amazon: Prix de liste: 3800 USD | 2.8 kg | 24.9 mm | 16.00" 2560x1600 189 PPI OLED |
Transparency
La sélection des appareils à examiner est effectuée par notre équipe éditoriale. L'échantillon de test a été prêté à l'auteur par le fabricant ou le détaillant pour les besoins de cet examen. Le prêteur n'a pas eu d'influence sur cette évaluation et le fabricant n'a pas reçu de copie de cette évaluation avant sa publication. Il n'y avait aucune obligation de publier cet article. En tant que média indépendant, Notebookcheck n'est pas soumis à l'autorité des fabricants, des détaillants ou des éditeurs.
Voici comment Notebookcheck teste
Chaque année, Notebookcheck examine de manière indépendante des centaines d'ordinateurs portables et de smartphones en utilisant des procédures standardisées afin de garantir que tous les résultats sont comparables. Nous avons continuellement développé nos méthodes de test depuis environ 20 ans et avons établi des normes industrielles dans le processus. Dans nos laboratoires de test, des équipements de mesure de haute qualité sont utilisés par des techniciens et des rédacteurs expérimentés. Ces tests impliquent un processus de validation en plusieurs étapes. Notre système d'évaluation complexe repose sur des centaines de mesures et de points de référence bien fondés, ce qui garantit l'objectivité.
