Test de l'Eurocom C315 Blitz : Le Core i7-1360P en demi-teinte

Le C315 Blitz est un ordinateur portable multimédia fin et léger d'entrée et de milieu de gamme d'Eurocom, basé sur le châssis Clevo X170KM. Les SKUs varient entre le Core i5-1340P ou le Core i7-1360P avec un écran 1080p ou 2160p (4K). L'appareil que nous avons testé est une configuration haut de gamme avec le Core i7 et les options 4K.
Les alternatives au C315 Blitz comprennent d'autres ordinateurs portables multimédia ou de bureau de 15,6 pouces comme leAcer Aspire 5 A515 ou l'Asus VivoBook S15Asus VivoBook S15.
Plus d'avis Eurocom :
Comparaison avec les concurrents potentiels
Note | Date | Modèle | Poids | Épaisseur | Taille | Résolution | Prix |
|---|---|---|---|---|---|---|---|
| 83.4 % v7 (old) | 11/23 | Eurocom C315 Blitz i7-1360P, Iris Xe G7 96EUs | 1.7 kg | 19.9 mm | 15.60" | 3840x2160 | |
| 84.3 % v7 (old) | 02/22 | Schenker Work 15 Tiger Lake-H i7-11370H, Iris Xe G7 96EUs | 1.7 kg | 19.9 mm | 15.60" | 1920x1080 | |
| 86.6 % v7 (old) | 12/23 | Lenovo ThinkPad L15 Gen 4 21H70021GE R7 PRO 7730U, Vega 8 | 1.9 kg | 19.93 mm | 15.60" | 1920x1080 | |
| 82 % v7 (old) | 09/23 | Acer Aspire 5 A515-58GM-76S8 i7-1355U, GeForce RTX 2050 Mobile | 1.8 kg | 19.7 mm | 15.60" | 1920x1080 | |
| 83.2 % v7 (old) | 02/23 | Asus VivoBook S15 M3502RA-L1029W R7 6800H, Radeon 680M | 1.9 kg | 18.8 mm | 15.60" | 1920x1080 | |
| 79.8 % v7 (old) | 08/22 | Samsung Galaxy Book2 15 i7-1260P, A350M | 1.6 kg | 15 mm | 15.60" | 1920x1080 |
Cas
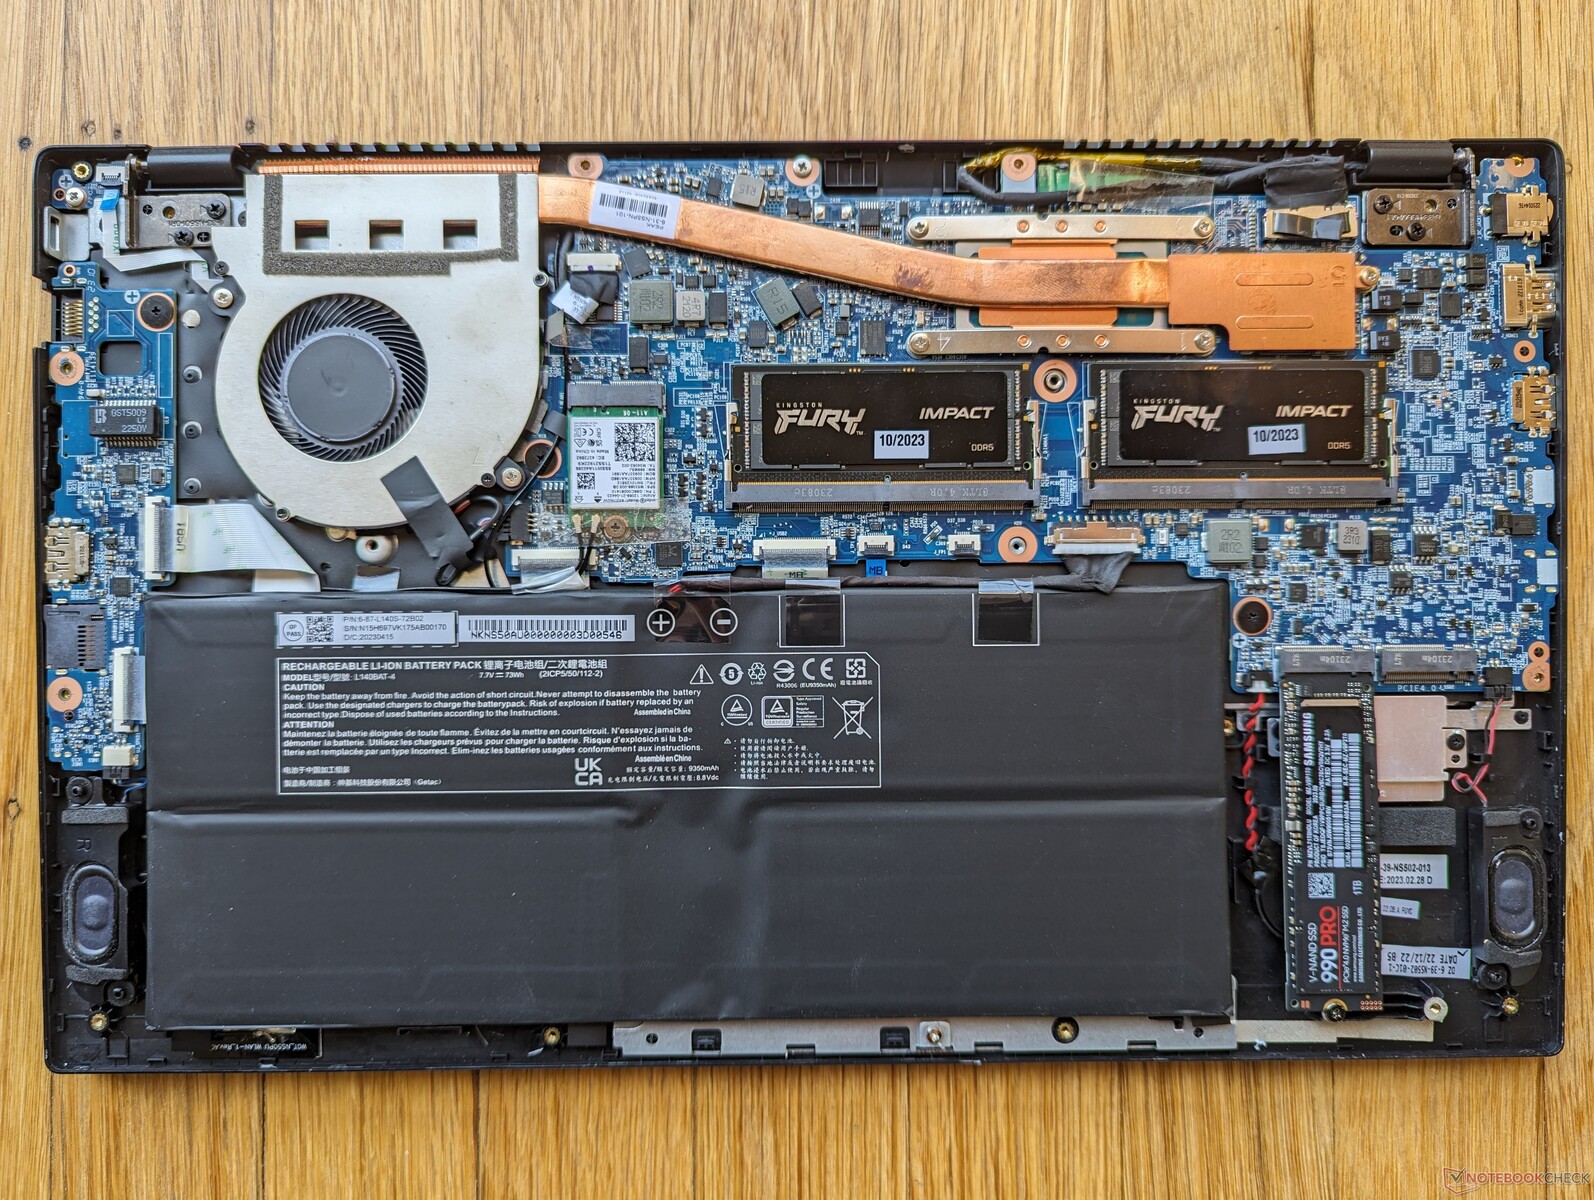
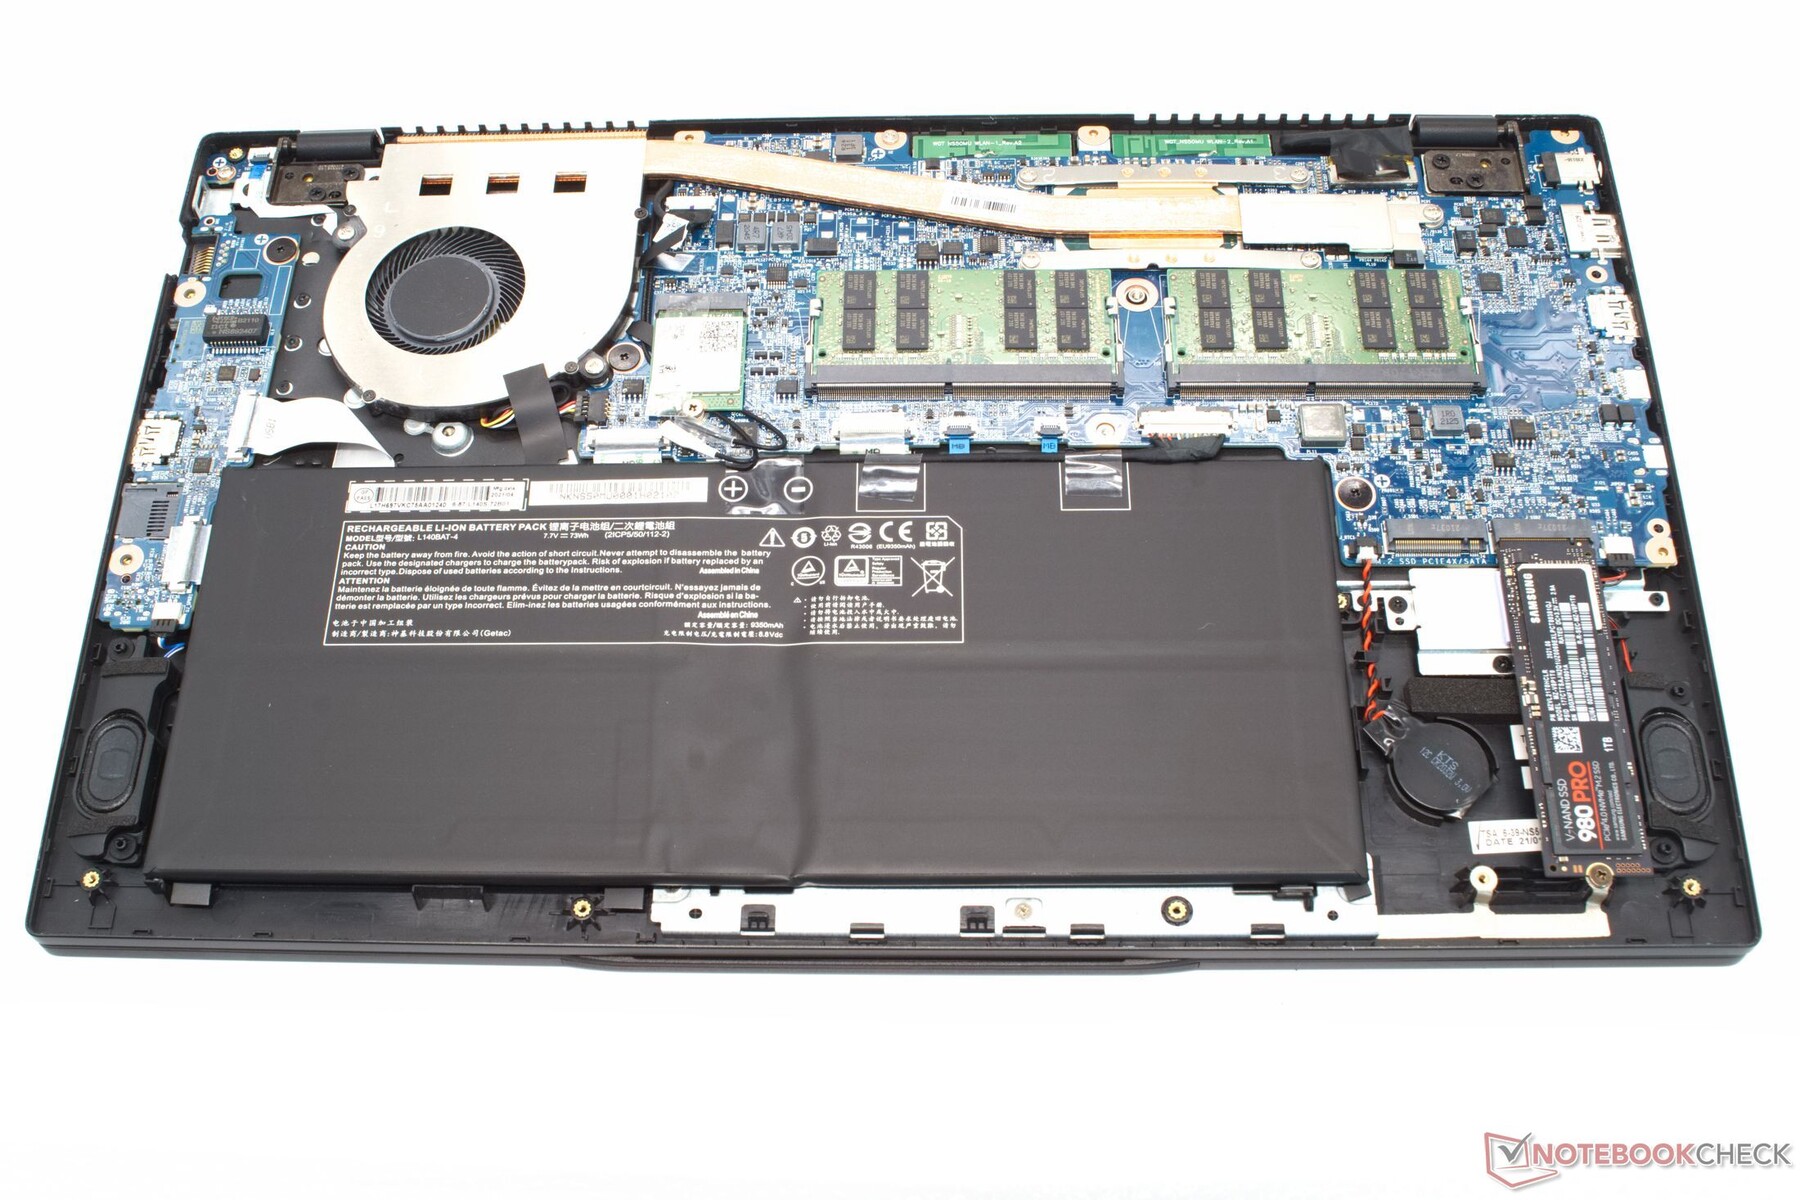
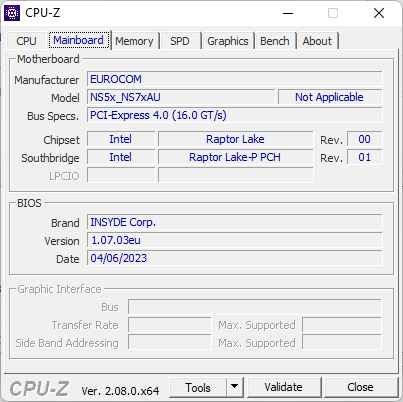
Le châssis reste identique à celui de l'année dernière Schenker Work 15 de l'année dernière, les deux étant basés sur le même châssis X170KM. Notez que seul l'un des deux ports USB-C prend en charge Thunderbolt, la charge USB-C et la sortie DisplayPort.

Lecteur de carte SD
| SD Card Reader | |
| average JPG Copy Test (av. of 3 runs) | |
| Schenker Work 15 Tiger Lake-H (Angelbird AV Pro V60) | |
| Eurocom C315 Blitz (Angelbird AV Pro V60) | |
| Lenovo ThinkPad L15 Gen 4 21H70021GE | |
| Samsung Galaxy Book2 15 (Angelbird AV Pro V60) | |
| maximum AS SSD Seq Read Test (1GB) | |
| Lenovo ThinkPad L15 Gen 4 21H70021GE | |
| Eurocom C315 Blitz (Angelbird AV Pro V60) | |
| Schenker Work 15 Tiger Lake-H (Angelbird AV Pro V60) | |
| Samsung Galaxy Book2 15 (Angelbird AV Pro V60) | |
Communication
| Networking | |
| iperf3 transmit AX12 | |
| Schenker Work 15 Tiger Lake-H | |
| iperf3 receive AX12 | |
| Schenker Work 15 Tiger Lake-H | |
| iperf3 transmit AXE11000 | |
| Samsung Galaxy Book2 15 | |
| Lenovo ThinkPad L15 Gen 4 21H70021GE | |
| Eurocom C315 Blitz | |
| Acer Aspire 5 A515-58GM-76S8 | |
| Asus VivoBook S15 M3502RA-L1029W | |
| iperf3 receive AXE11000 | |
| Lenovo ThinkPad L15 Gen 4 21H70021GE | |
| Samsung Galaxy Book2 15 | |
| Eurocom C315 Blitz | |
| Acer Aspire 5 A515-58GM-76S8 | |
| Asus VivoBook S15 M3502RA-L1029W | |
| iperf3 transmit AXE11000 6GHz | |
| Acer Aspire 5 A515-58GM-76S8 | |
| Lenovo ThinkPad L15 Gen 4 21H70021GE | |
| Eurocom C315 Blitz | |
| iperf3 receive AXE11000 6GHz | |
| Lenovo ThinkPad L15 Gen 4 21H70021GE | |
| Acer Aspire 5 A515-58GM-76S8 | |
| Eurocom C315 Blitz | |
Webcam
Bien qu'Eurocom annonce une webcam de 2 MP, l'application caméra de Windows ne vous permet de sélectionner qu'un enregistrement de 1 MP ou 720p30 au maximum.


Maintenance
Garantie
La garantie limitée standard d'un an s'applique si l'appareil est acheté aux États-Unis. Eurocom propose en option des plans d'extension allant jusqu'à trois ans.
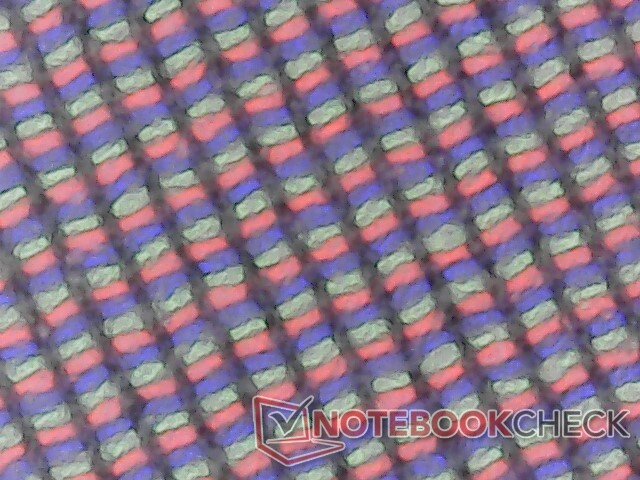
Affichage
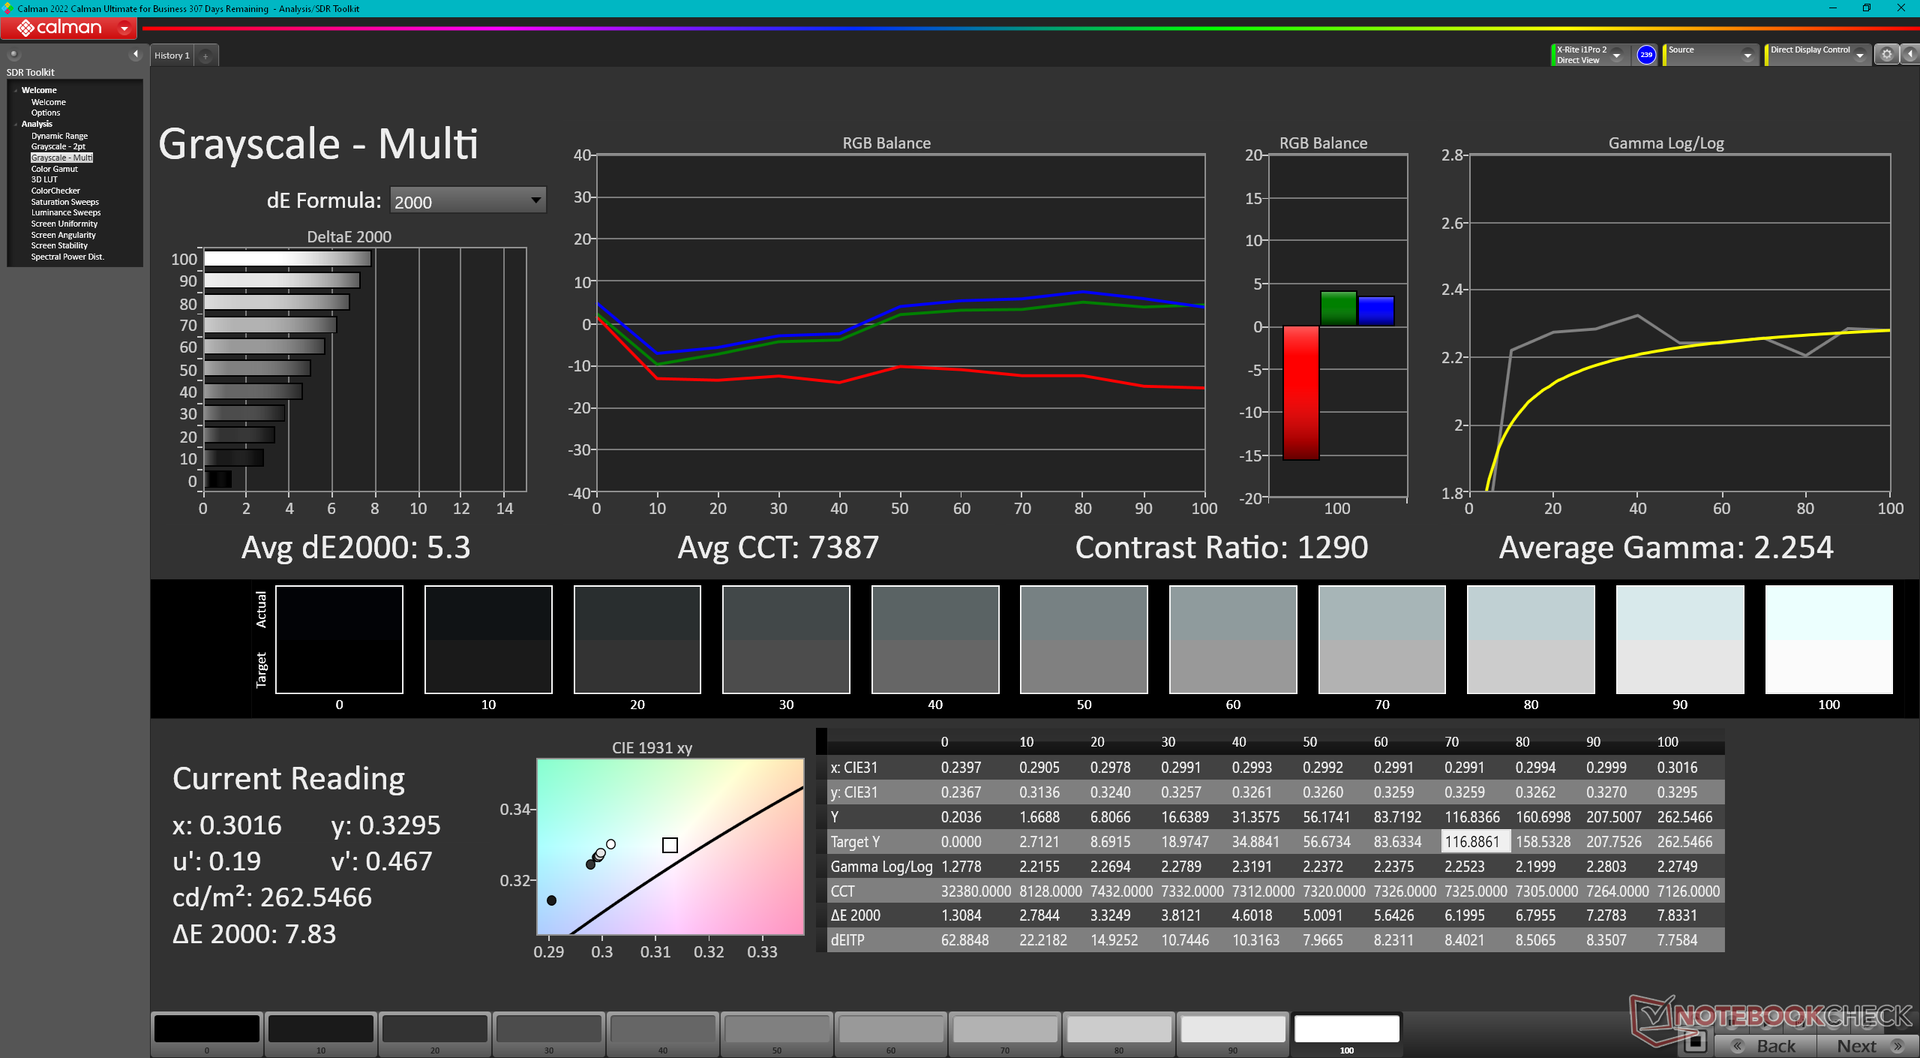
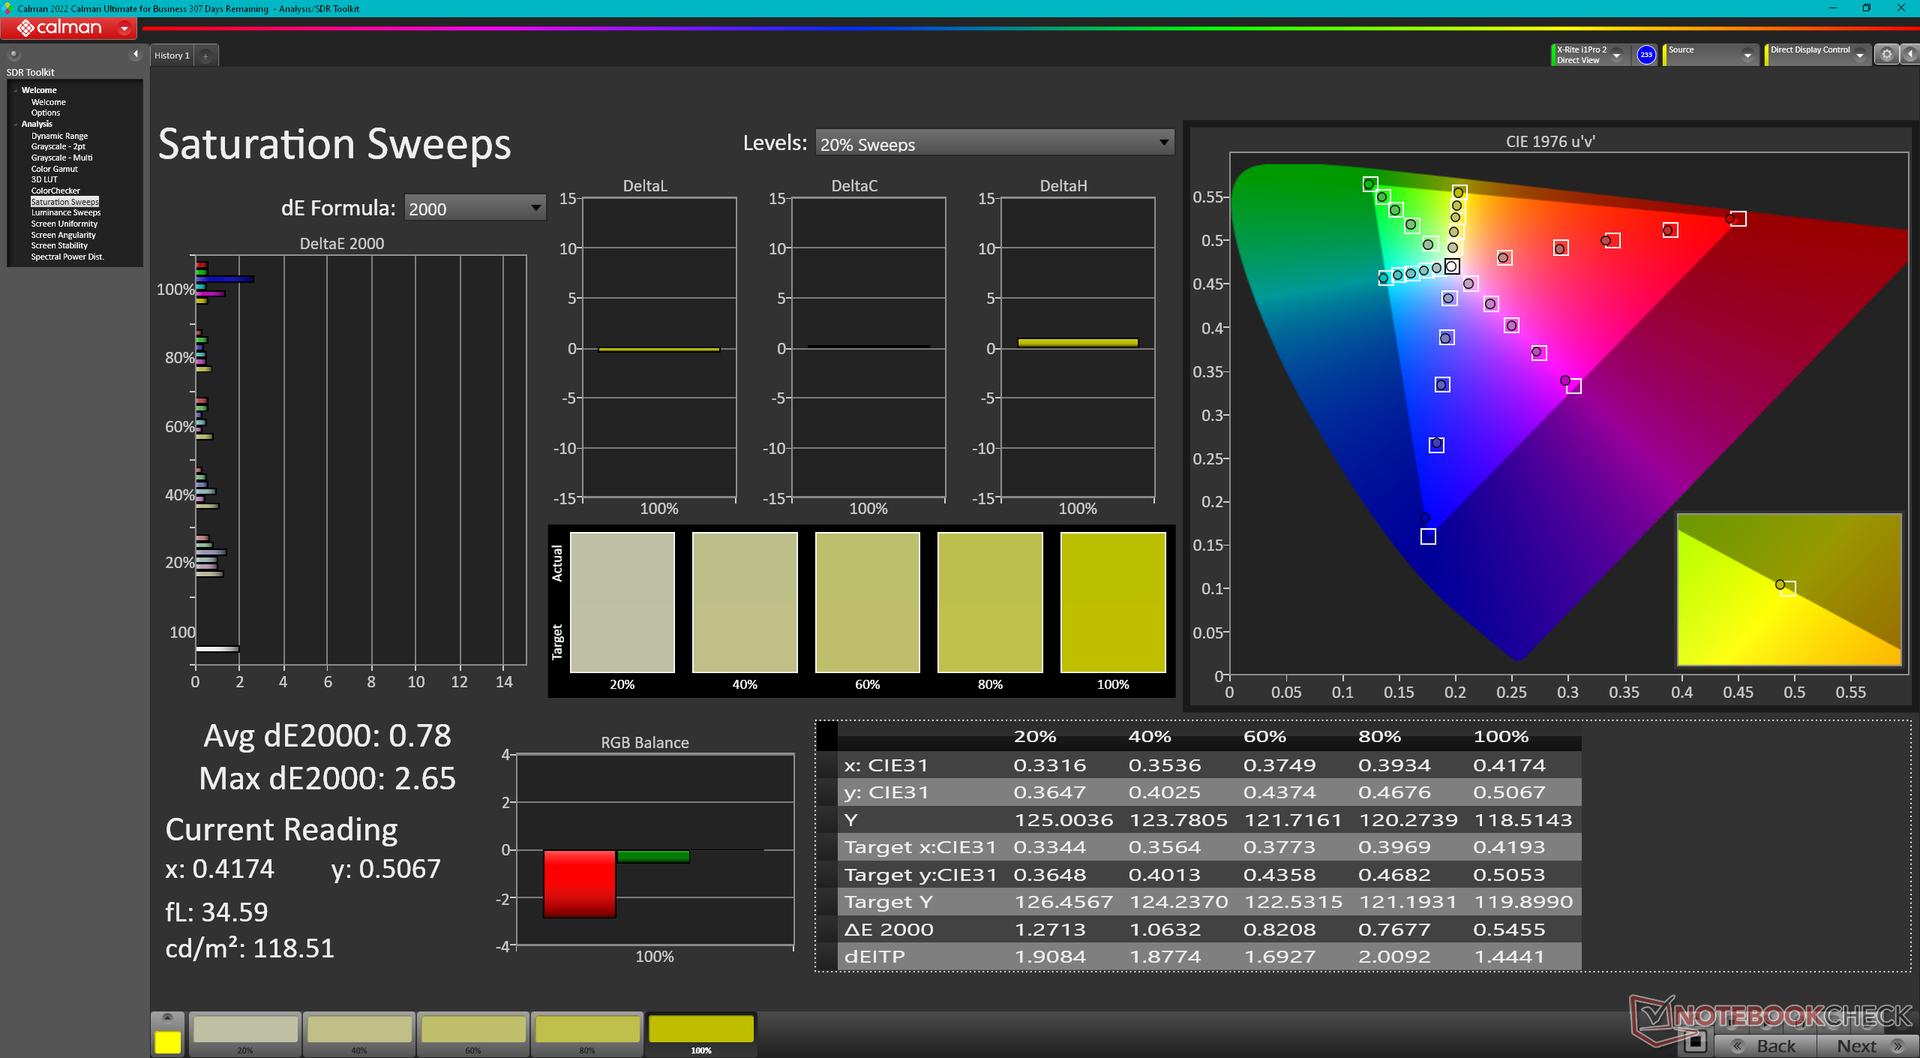
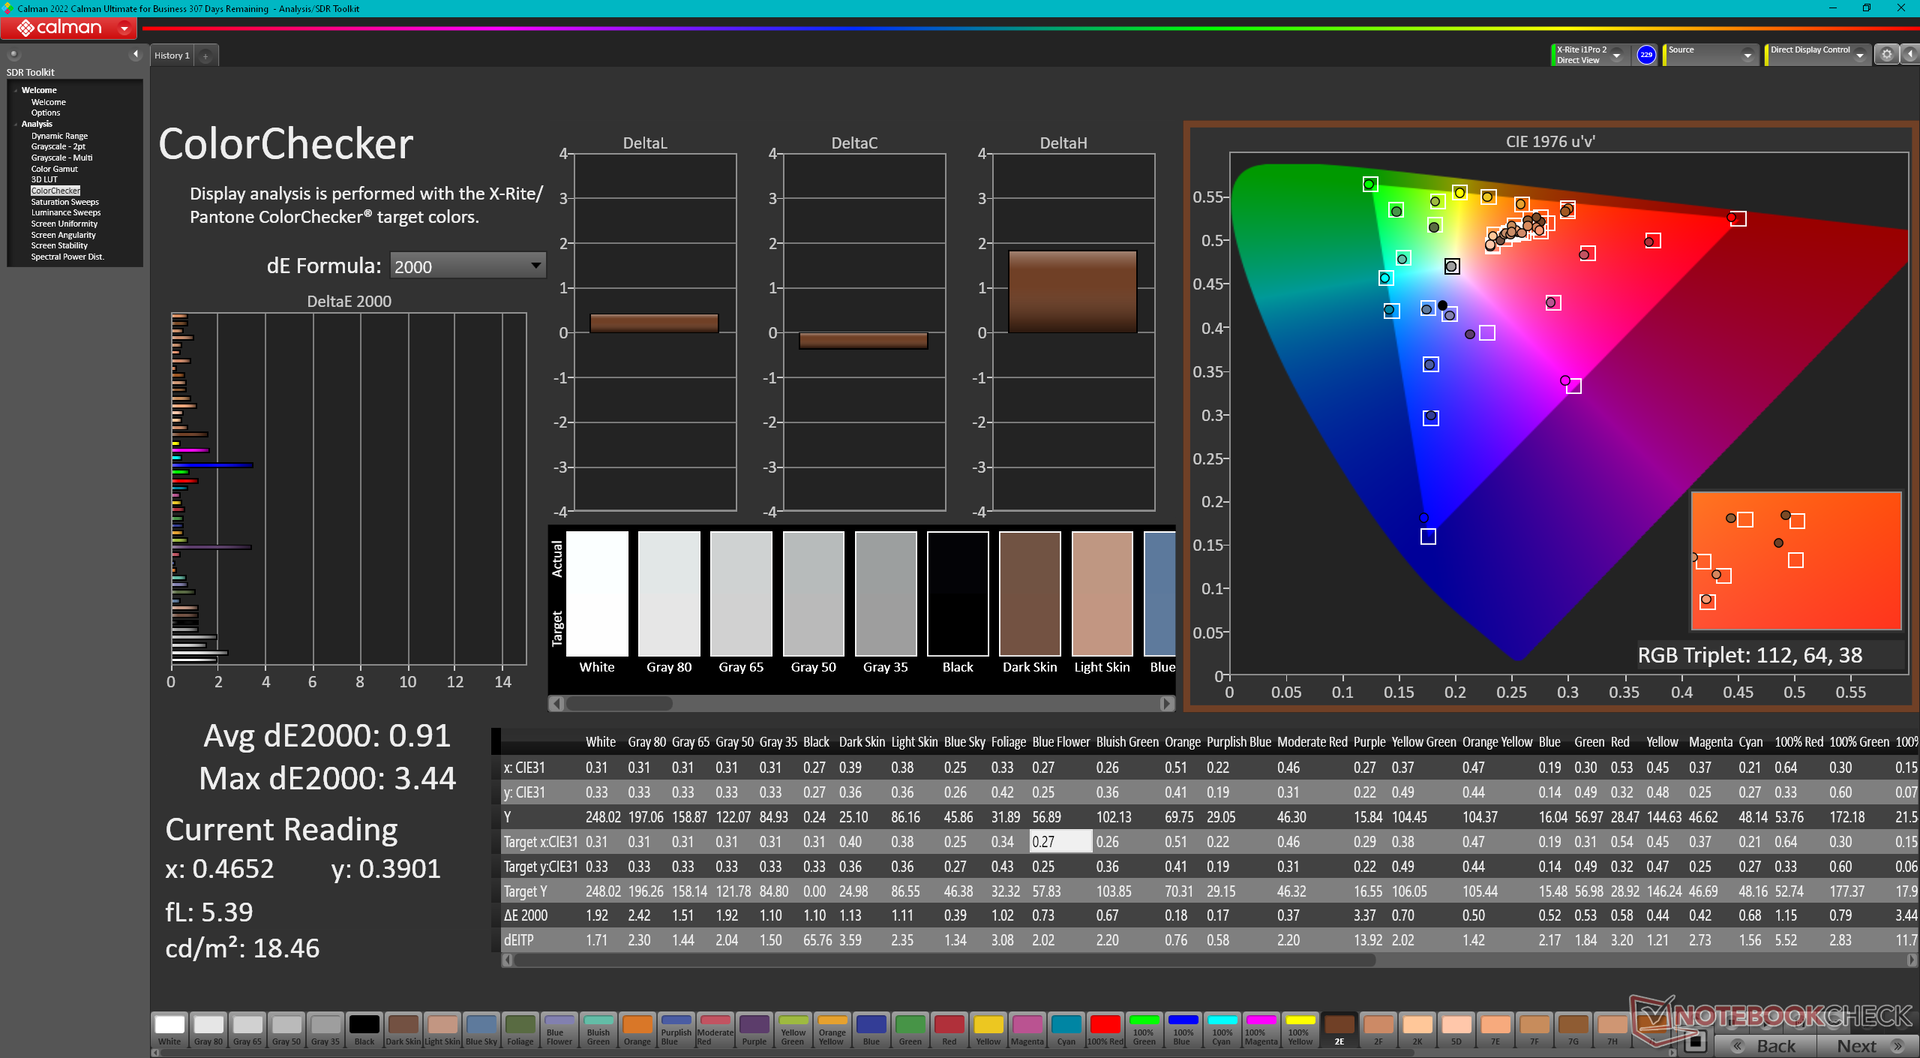
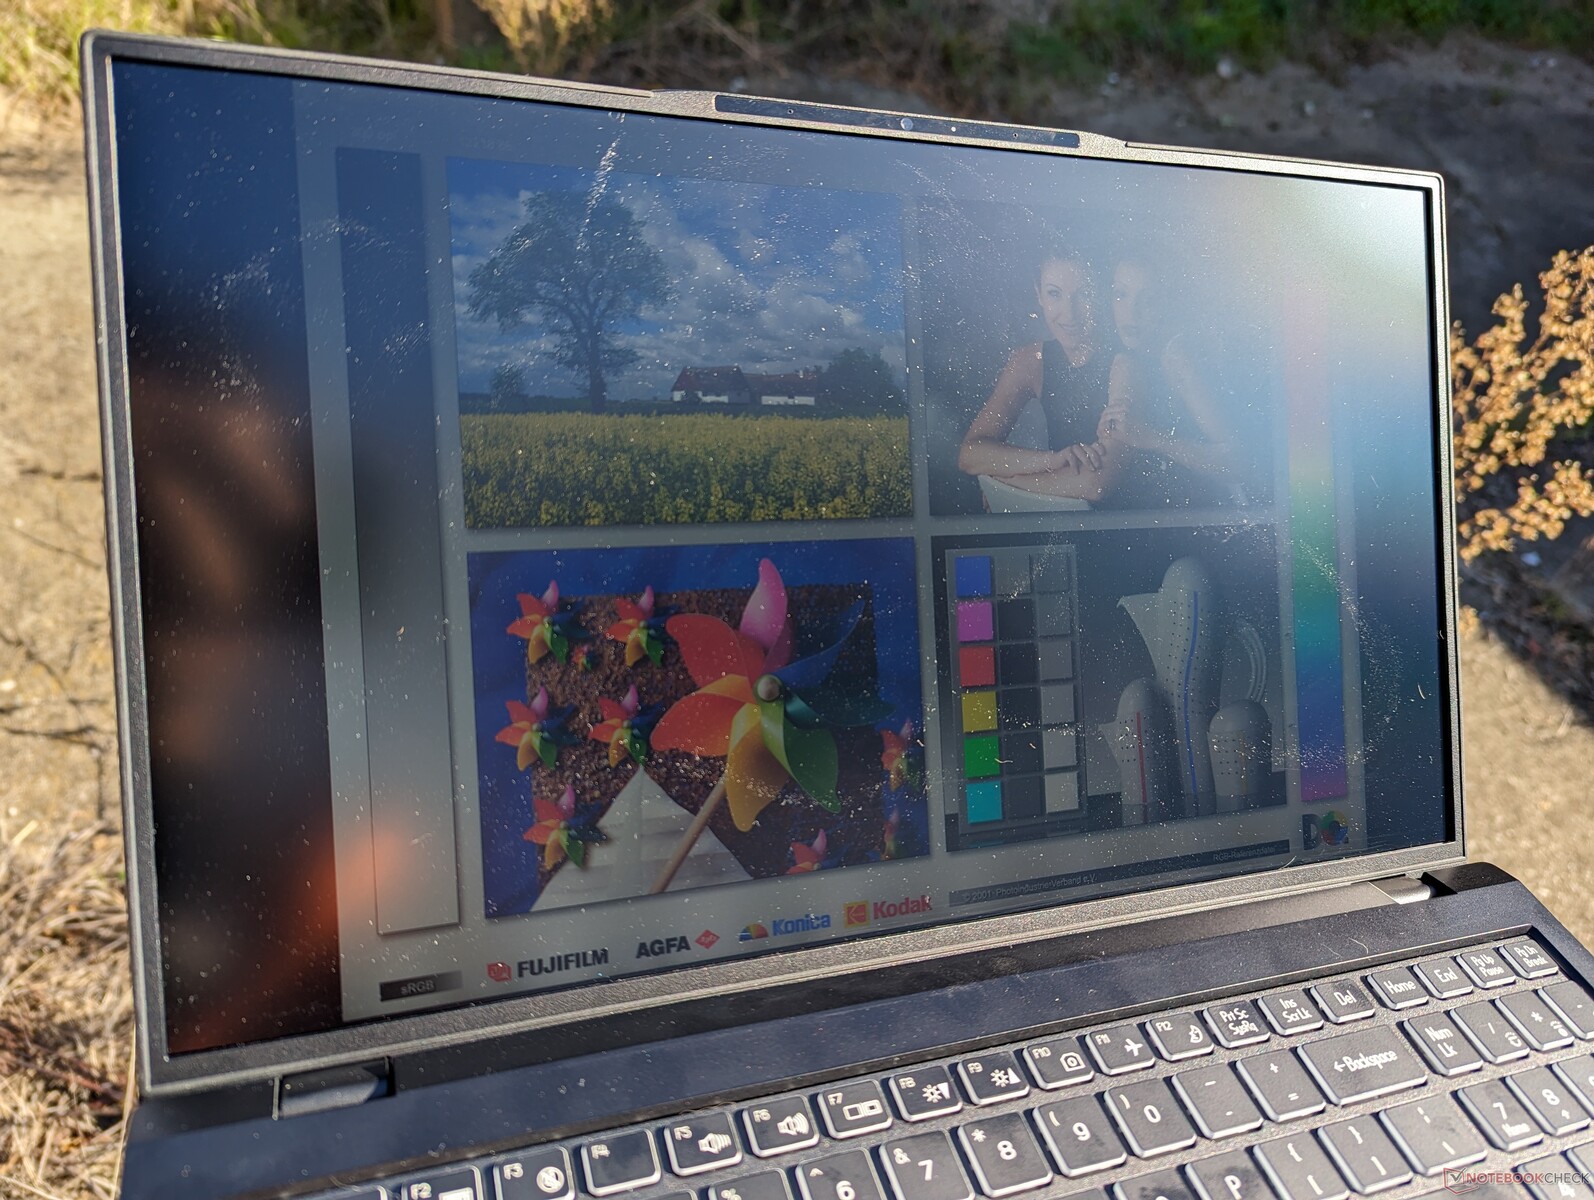
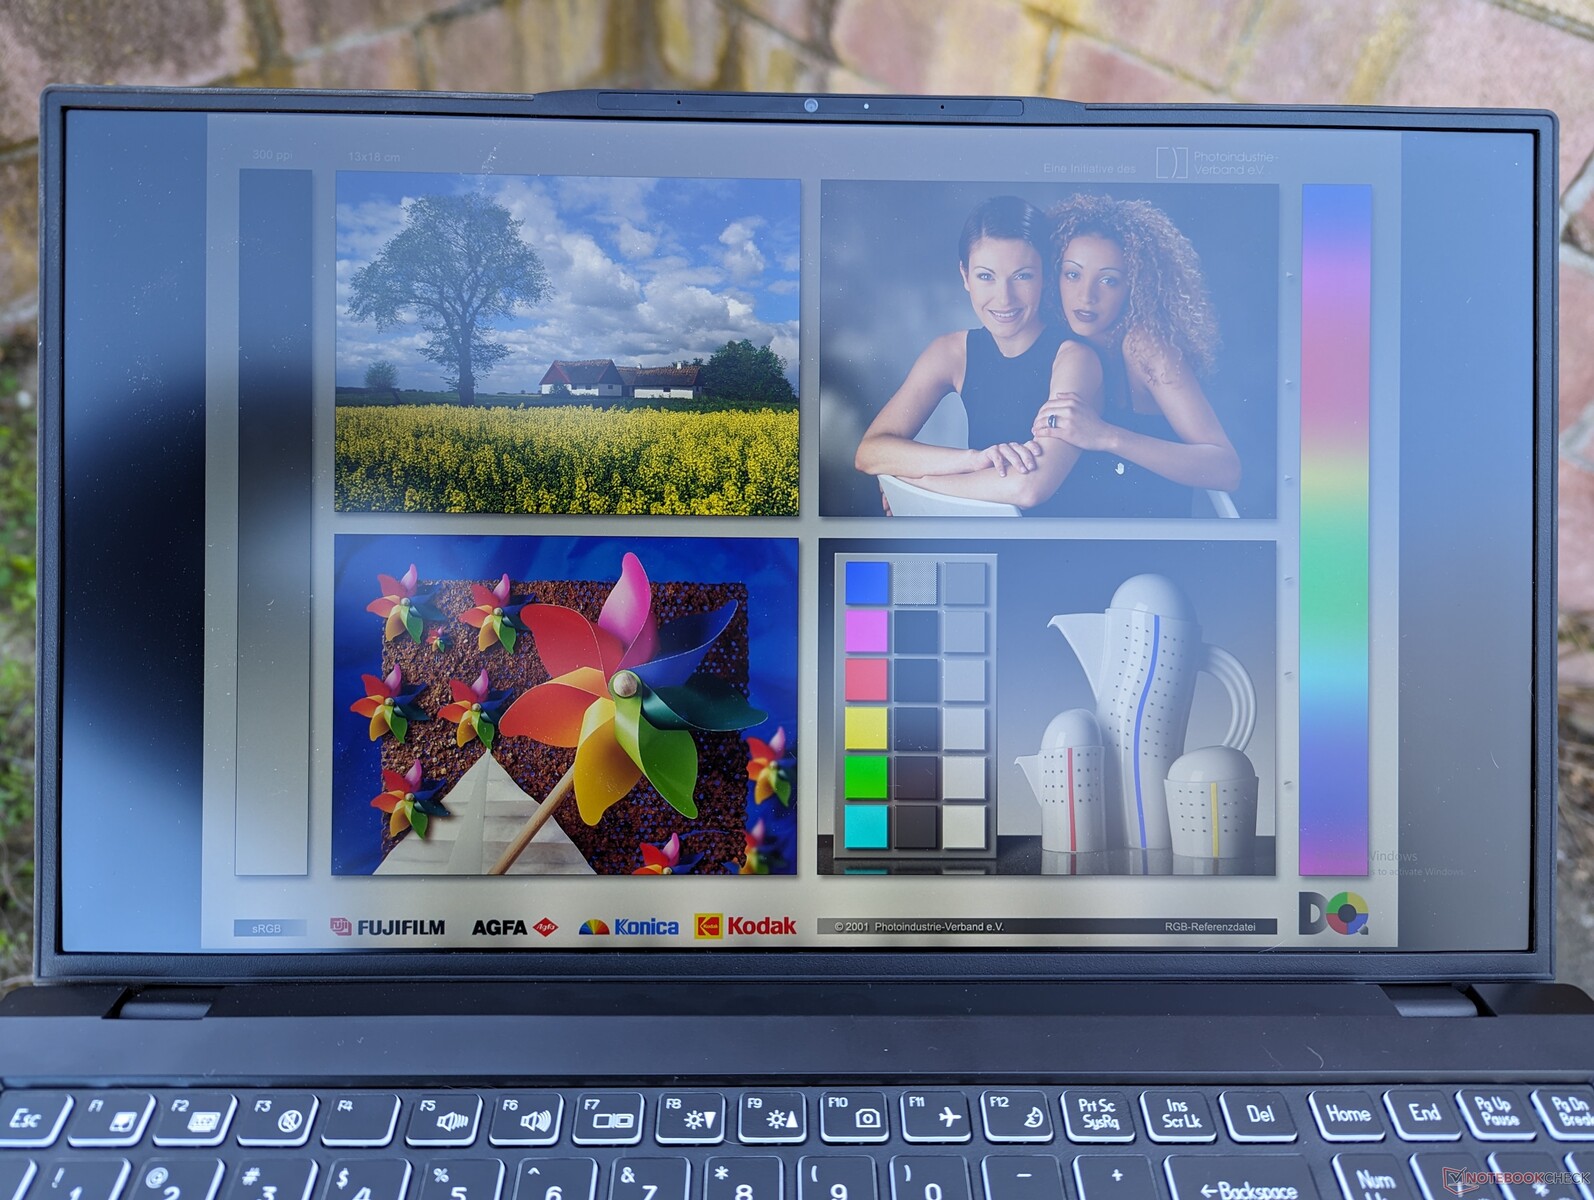
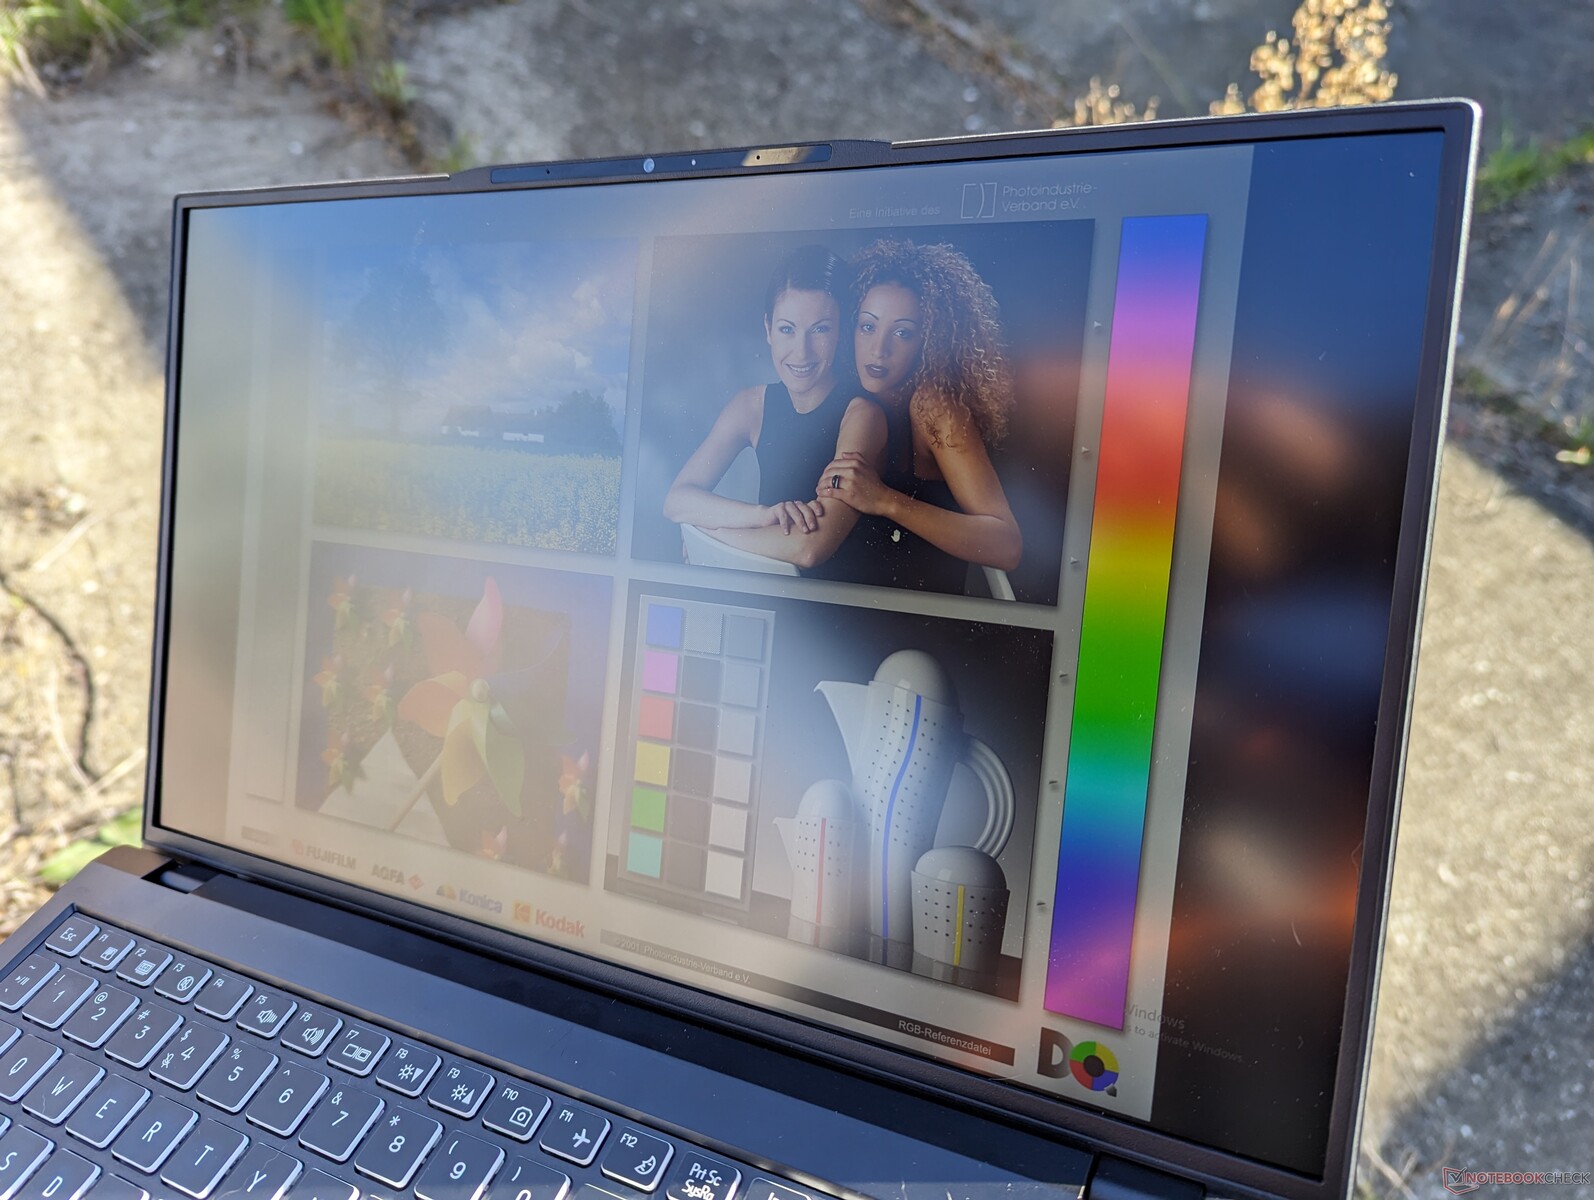
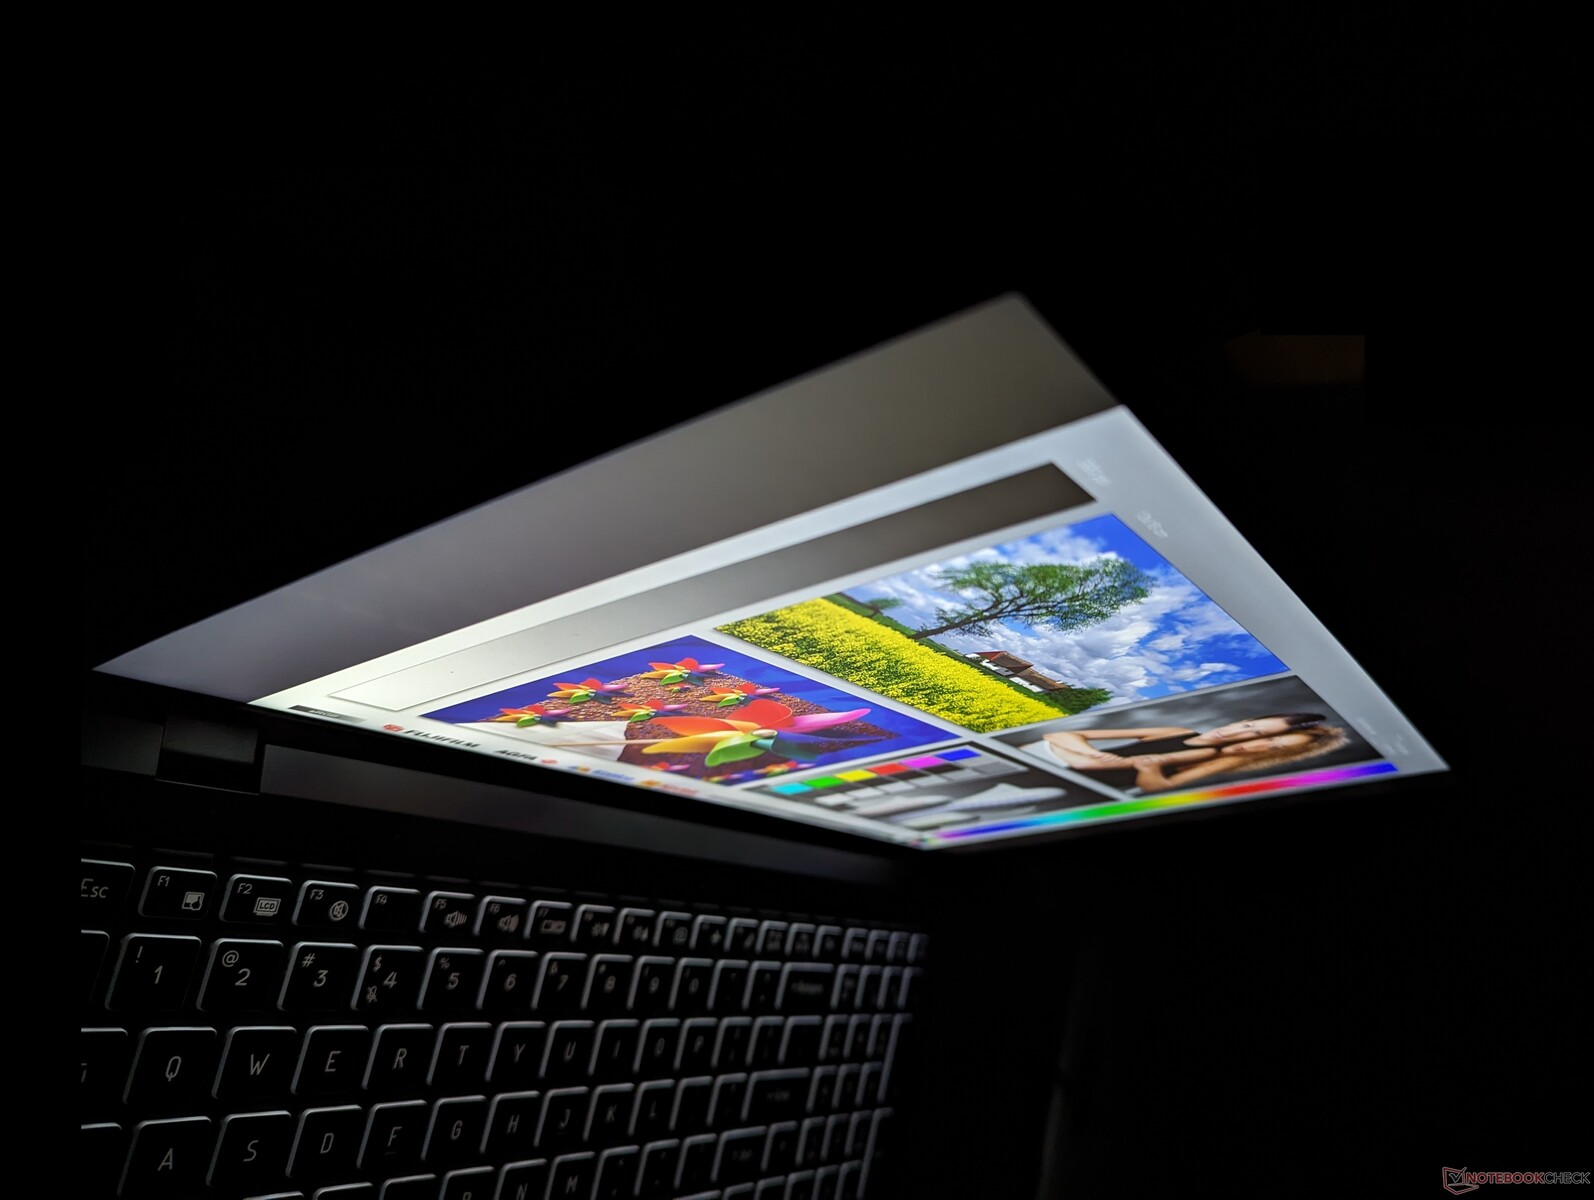
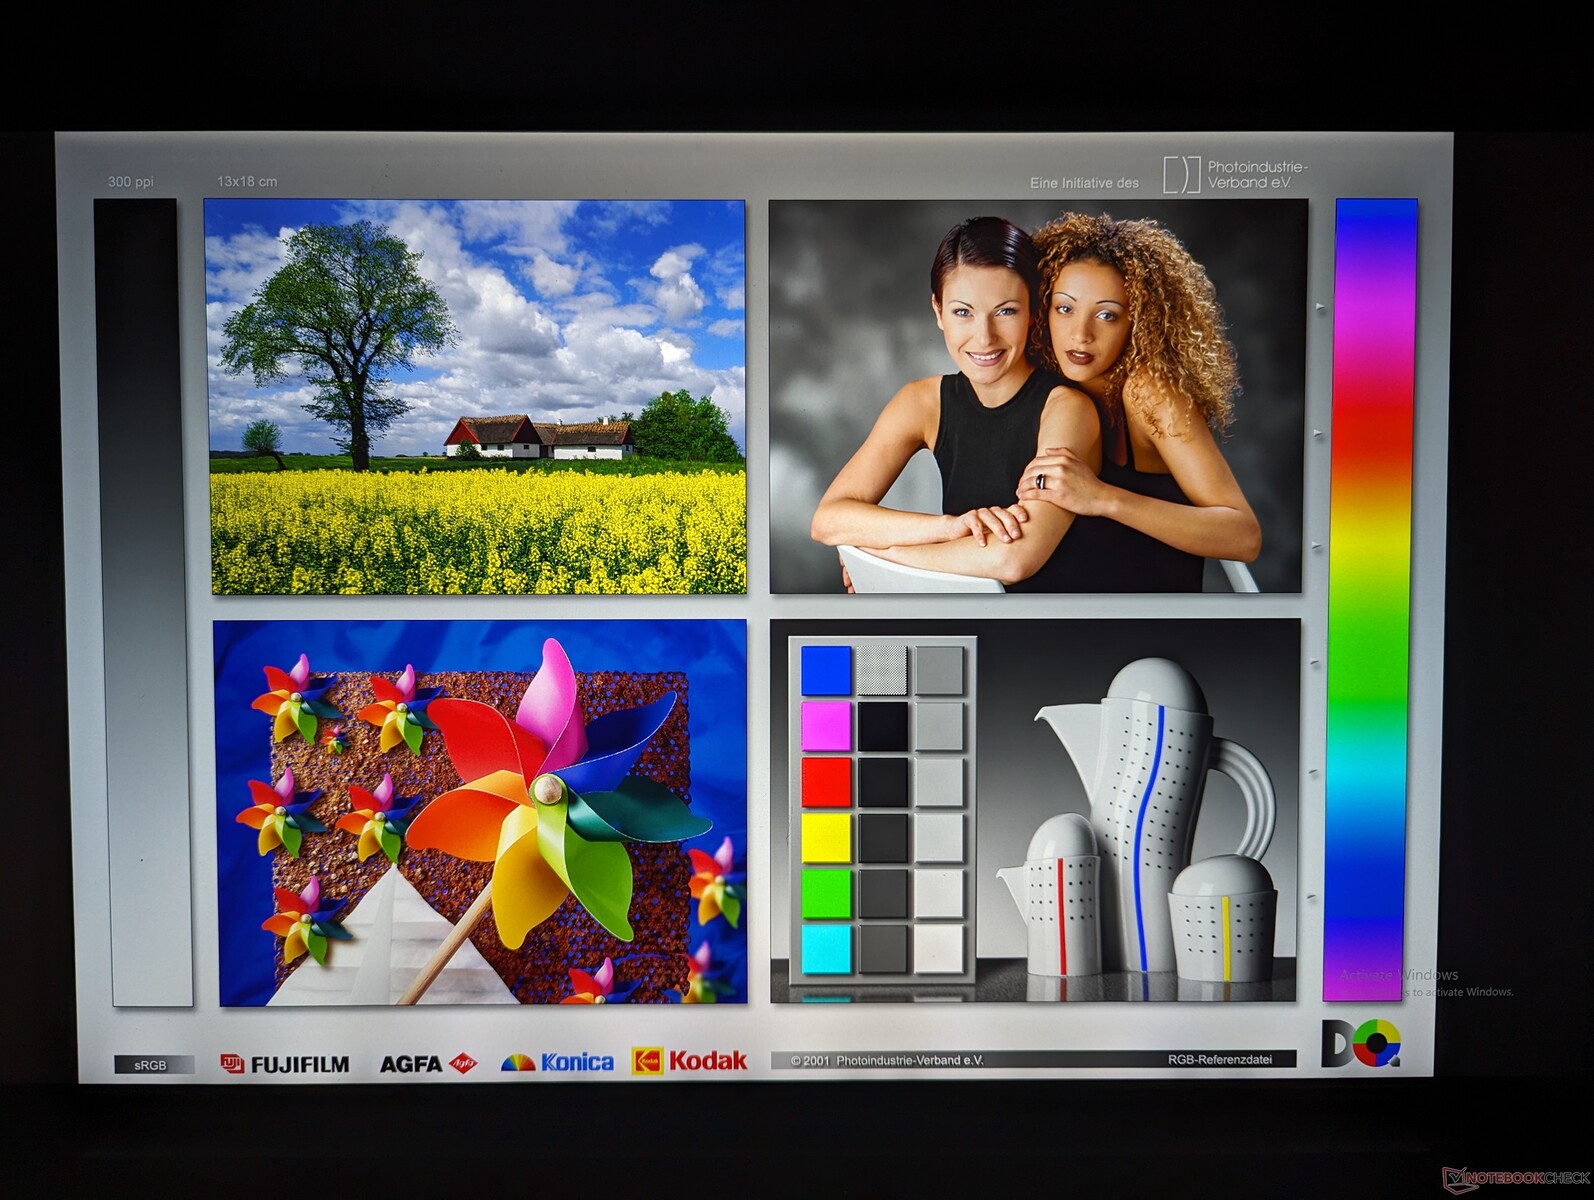
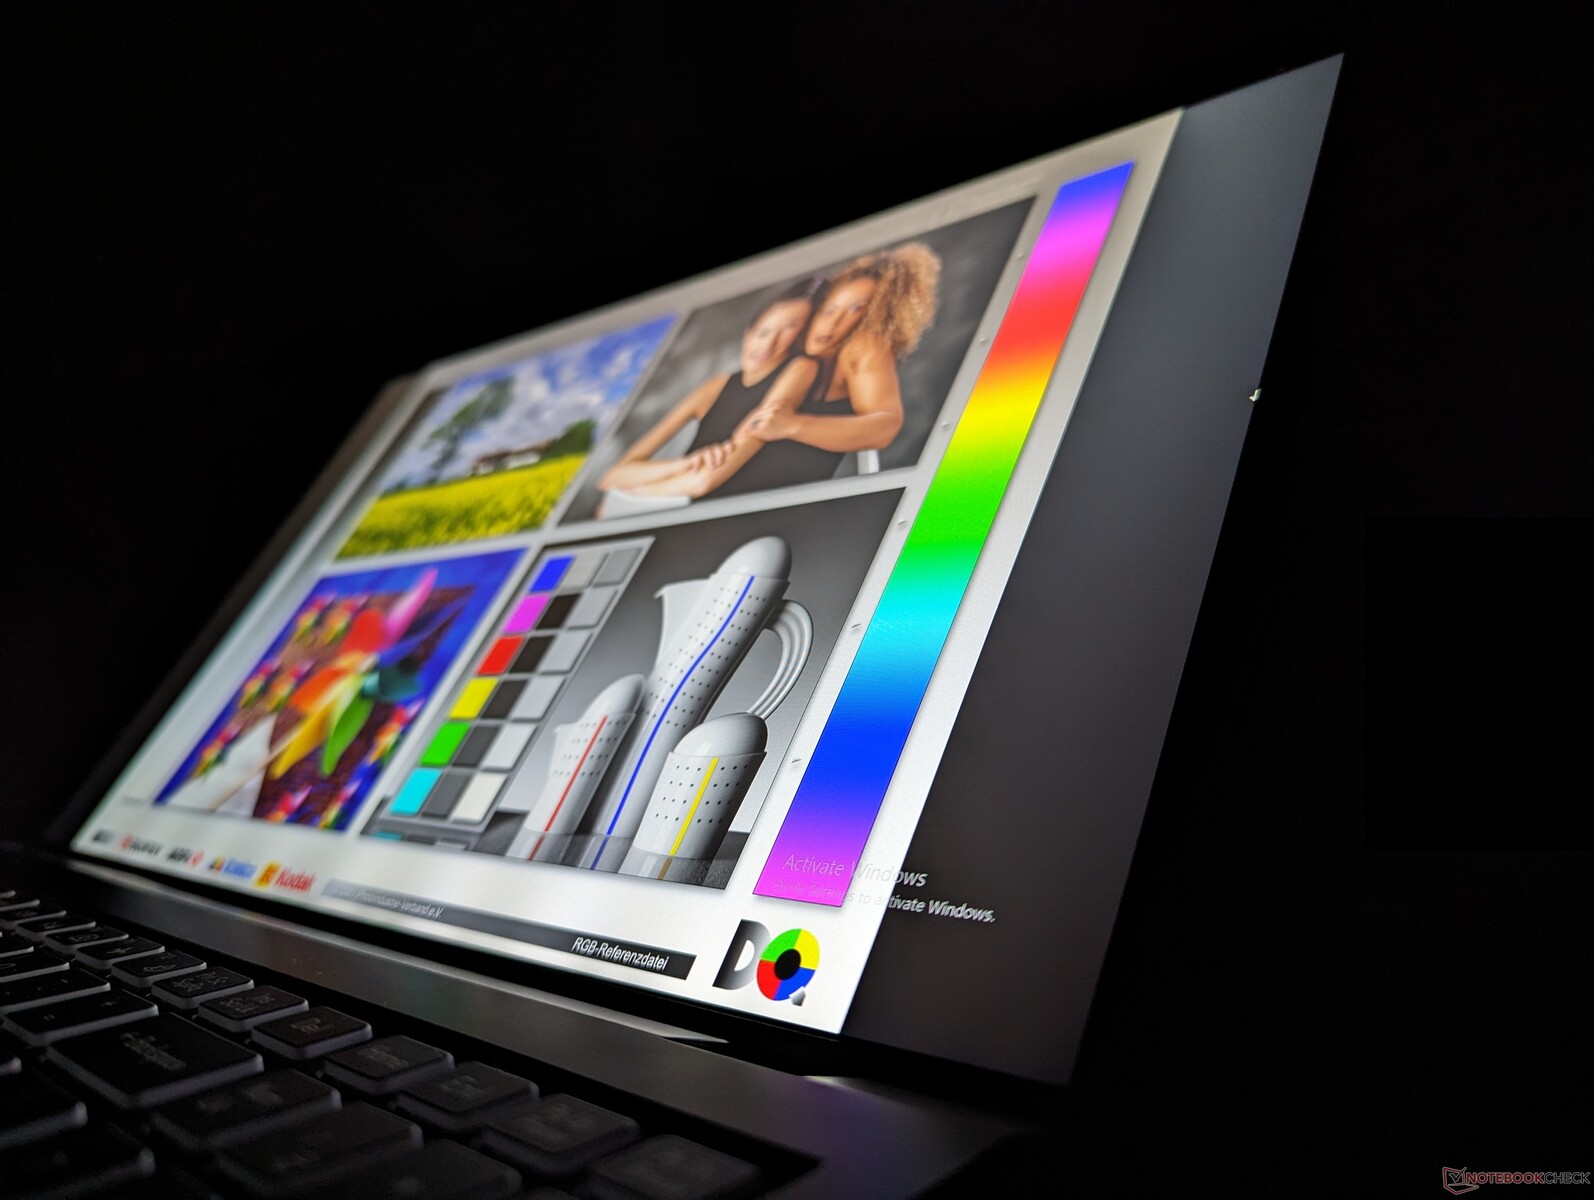
Notre configuration Eurocom est équipée d'un écran 4K à plus haute résolution que l'écran 1080p de notre Schenker. Cependant, les temps de réponse noir-blanc ne se sont pas améliorés et les images fantômes restent perceptibles. Malheureusement, le C315 Blitz n'offre pas d'options HDR, de couverture complète DCI-P3, AdobeRGB ou de panneaux avec des taux de rafraîchissement plus élevés.
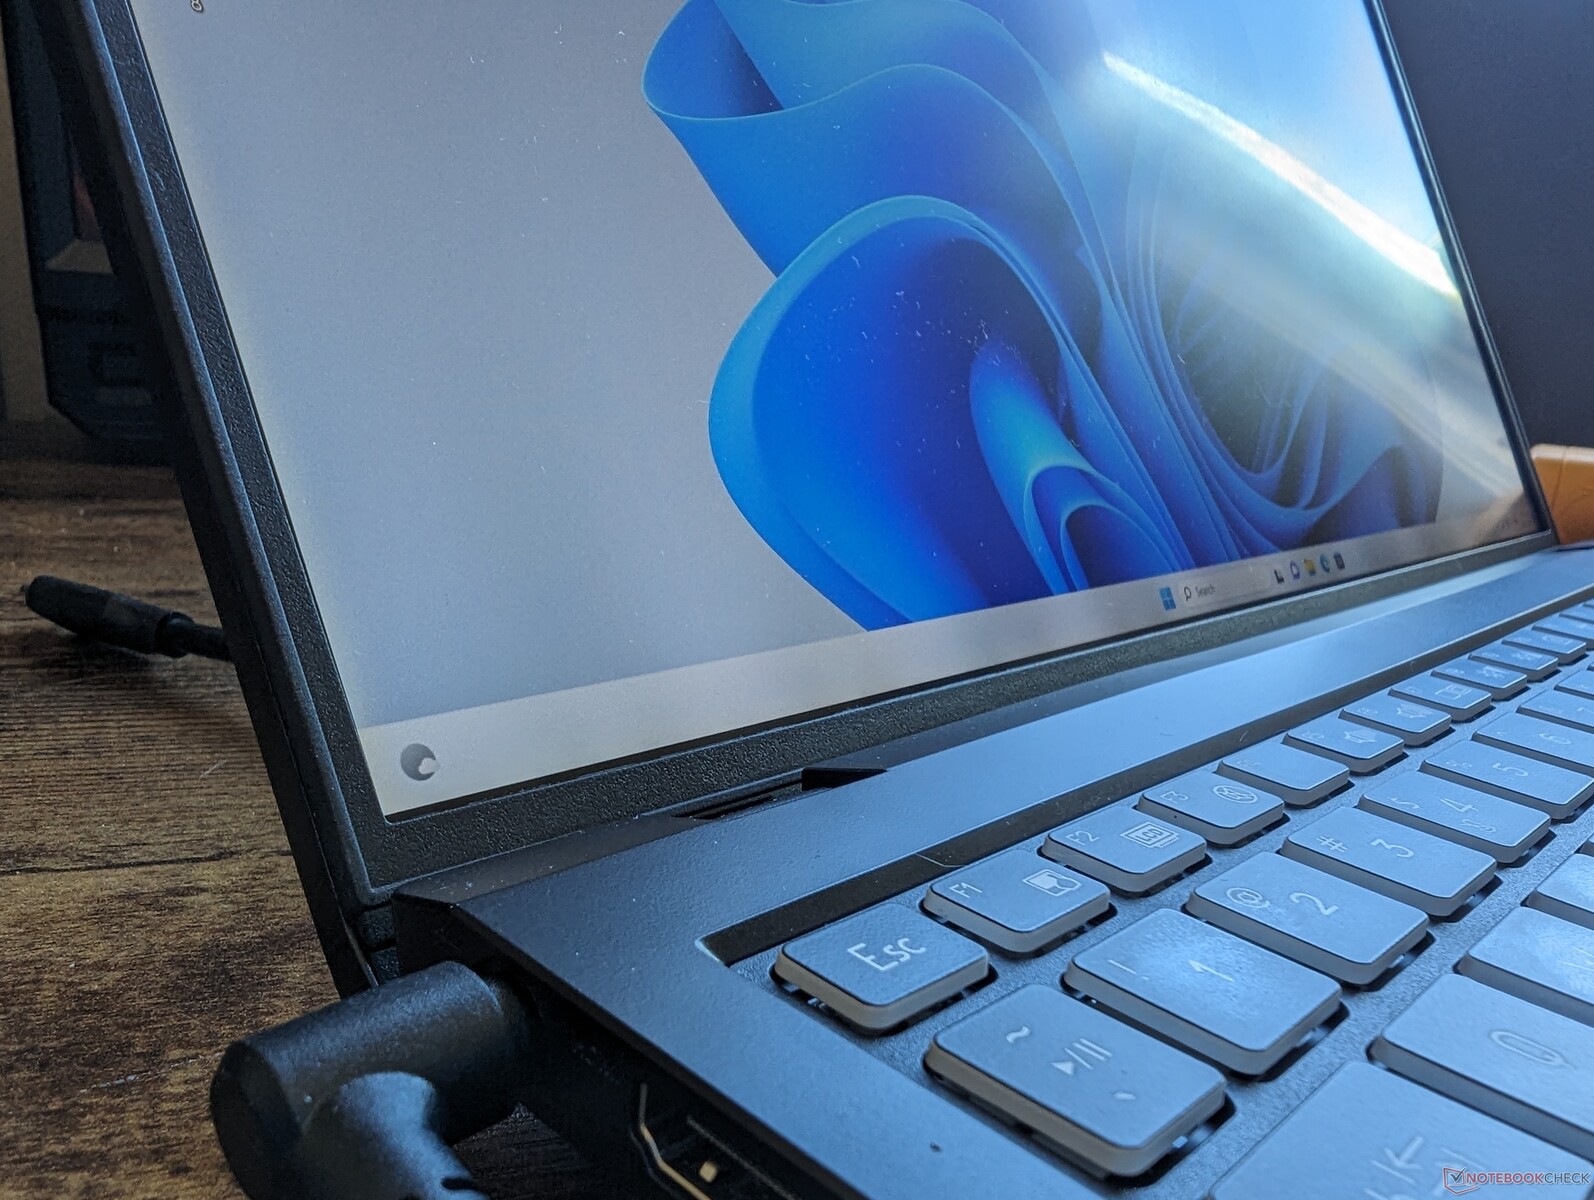
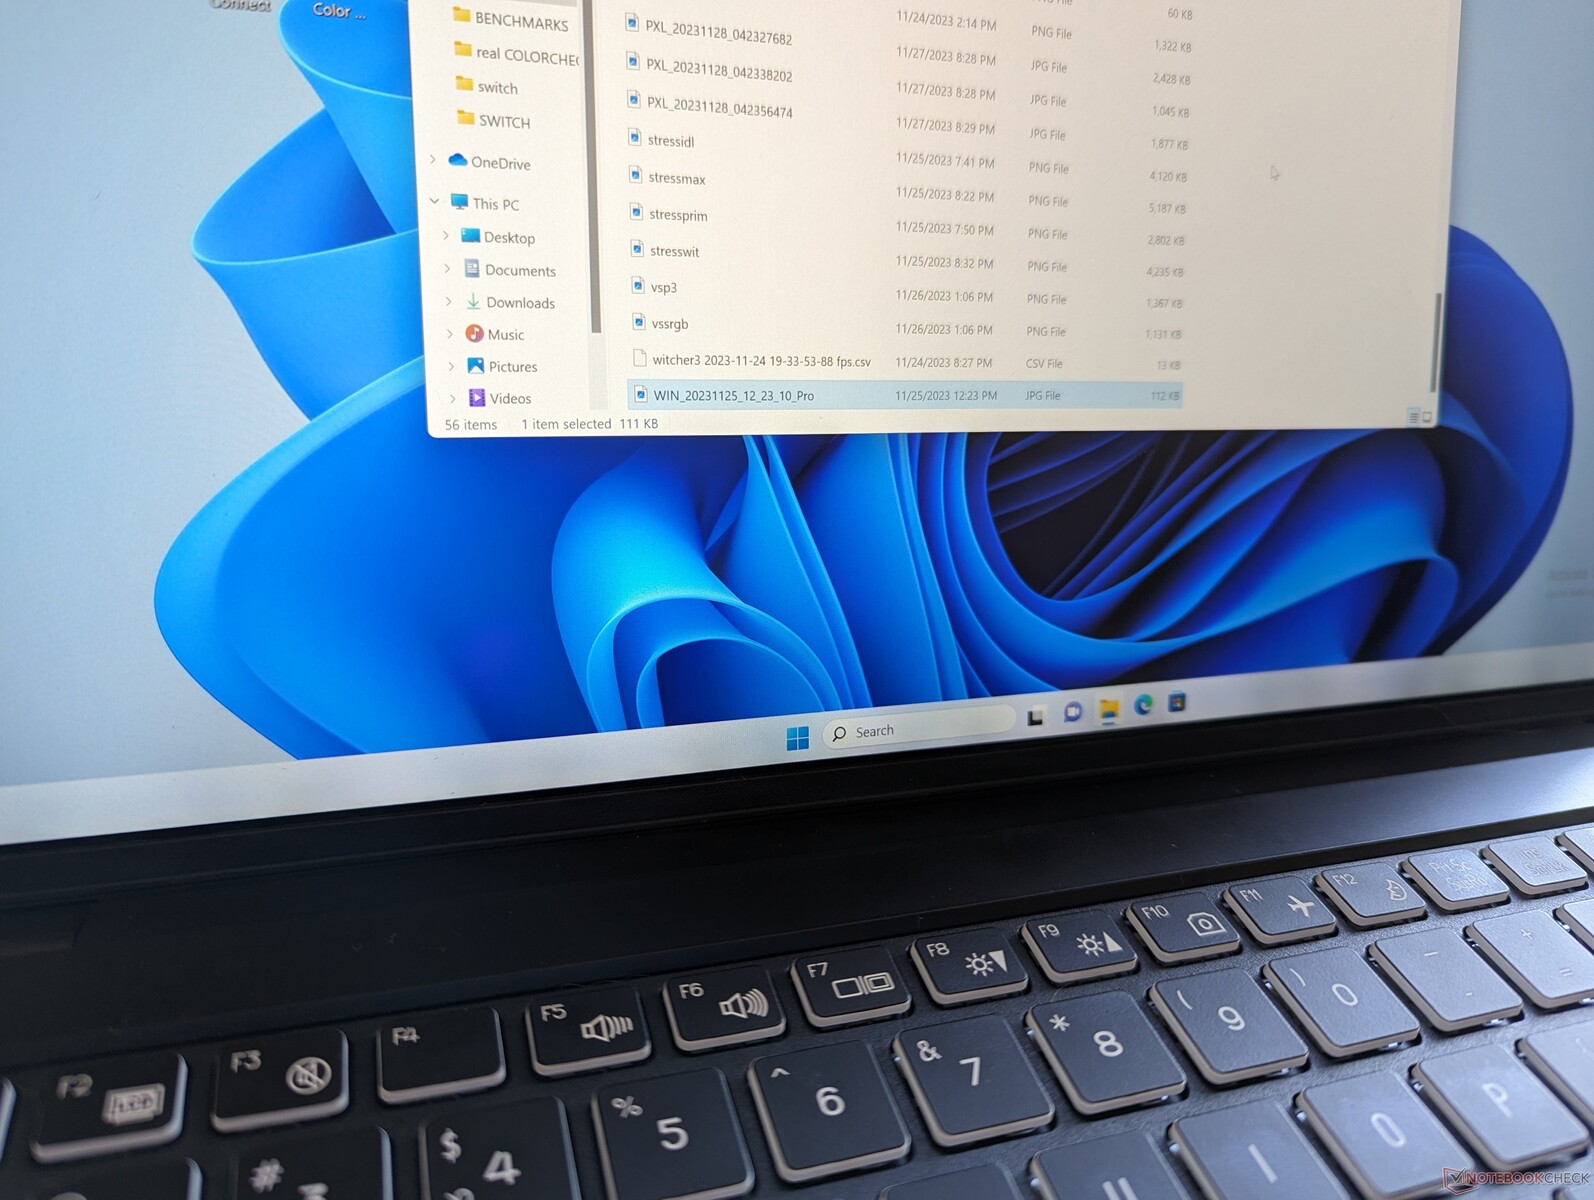
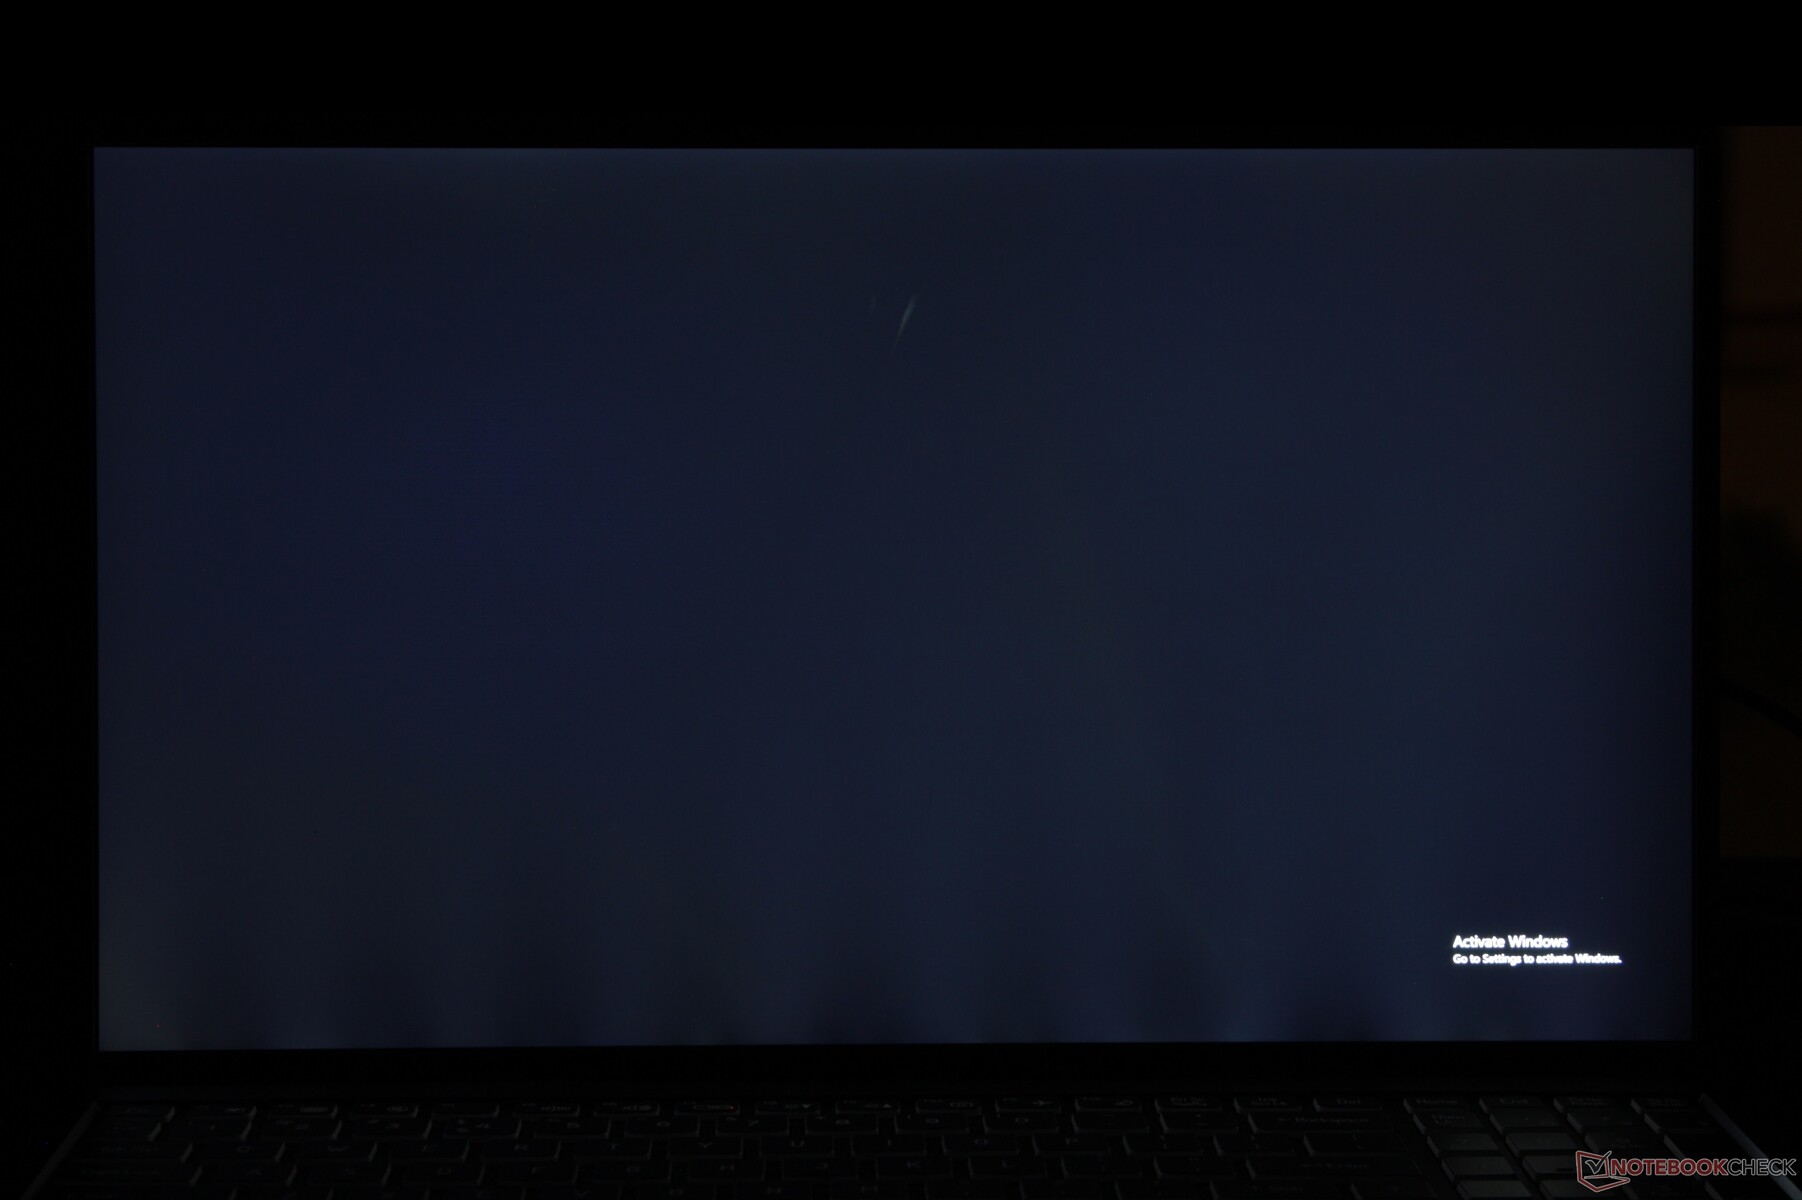
L'écran de notre modèle d'évaluation souffre d'une perte de rétroéclairage extrême le long du bord inférieur, comme le montrent les photos ci-dessous. Nous vous recommandons de vérifier vos achats pour vous assurer qu'il n'y a pas de problème d'écran.
| |||||||||||||||||||||||||
Homogénéité de la luminosité: 85 %
Valeur mesurée au centre, sur batterie: 262.5 cd/m²
Contraste: 1050:1 (Valeurs des noirs: 0.25 cd/m²)
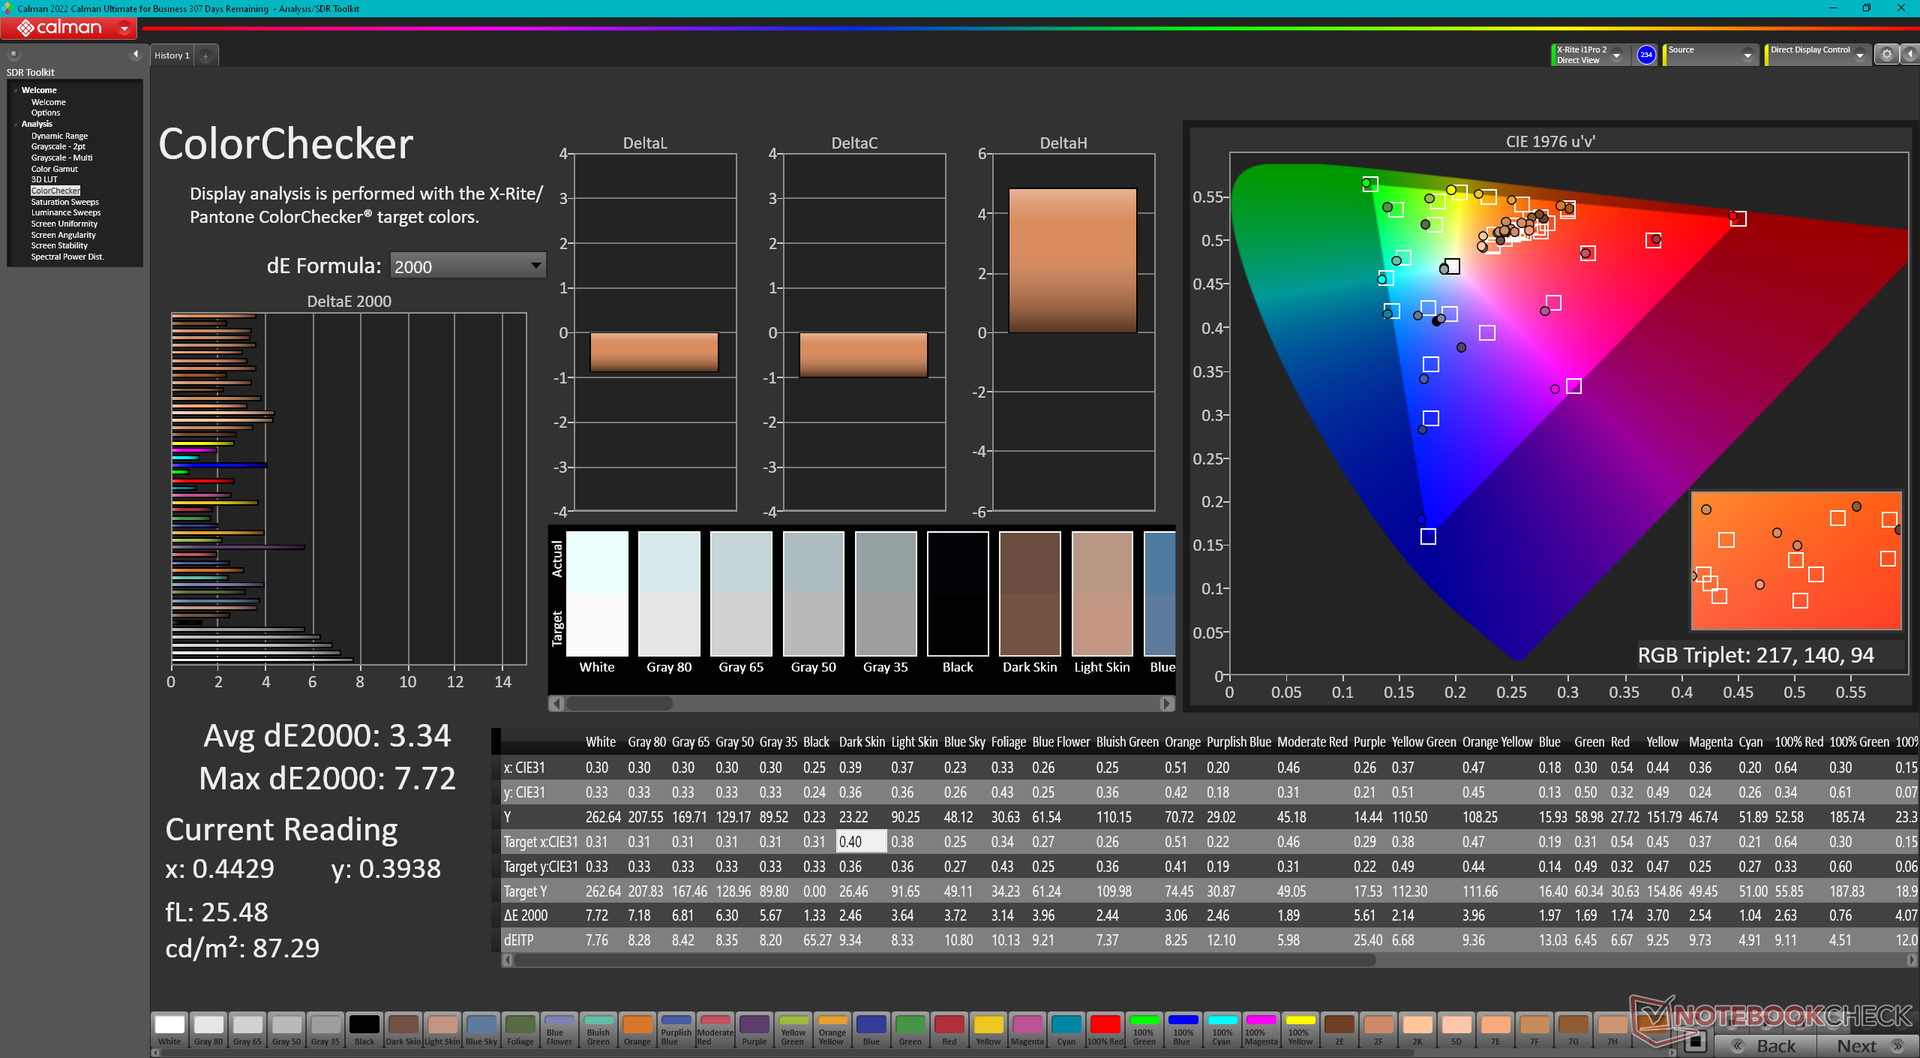
ΔE ColorChecker Calman: 3.34 | ∀{0.5-29.43 Ø4.71}
calibrated: 0.91
ΔE Greyscale Calman: 5.3 | ∀{0.09-98 Ø4.96}
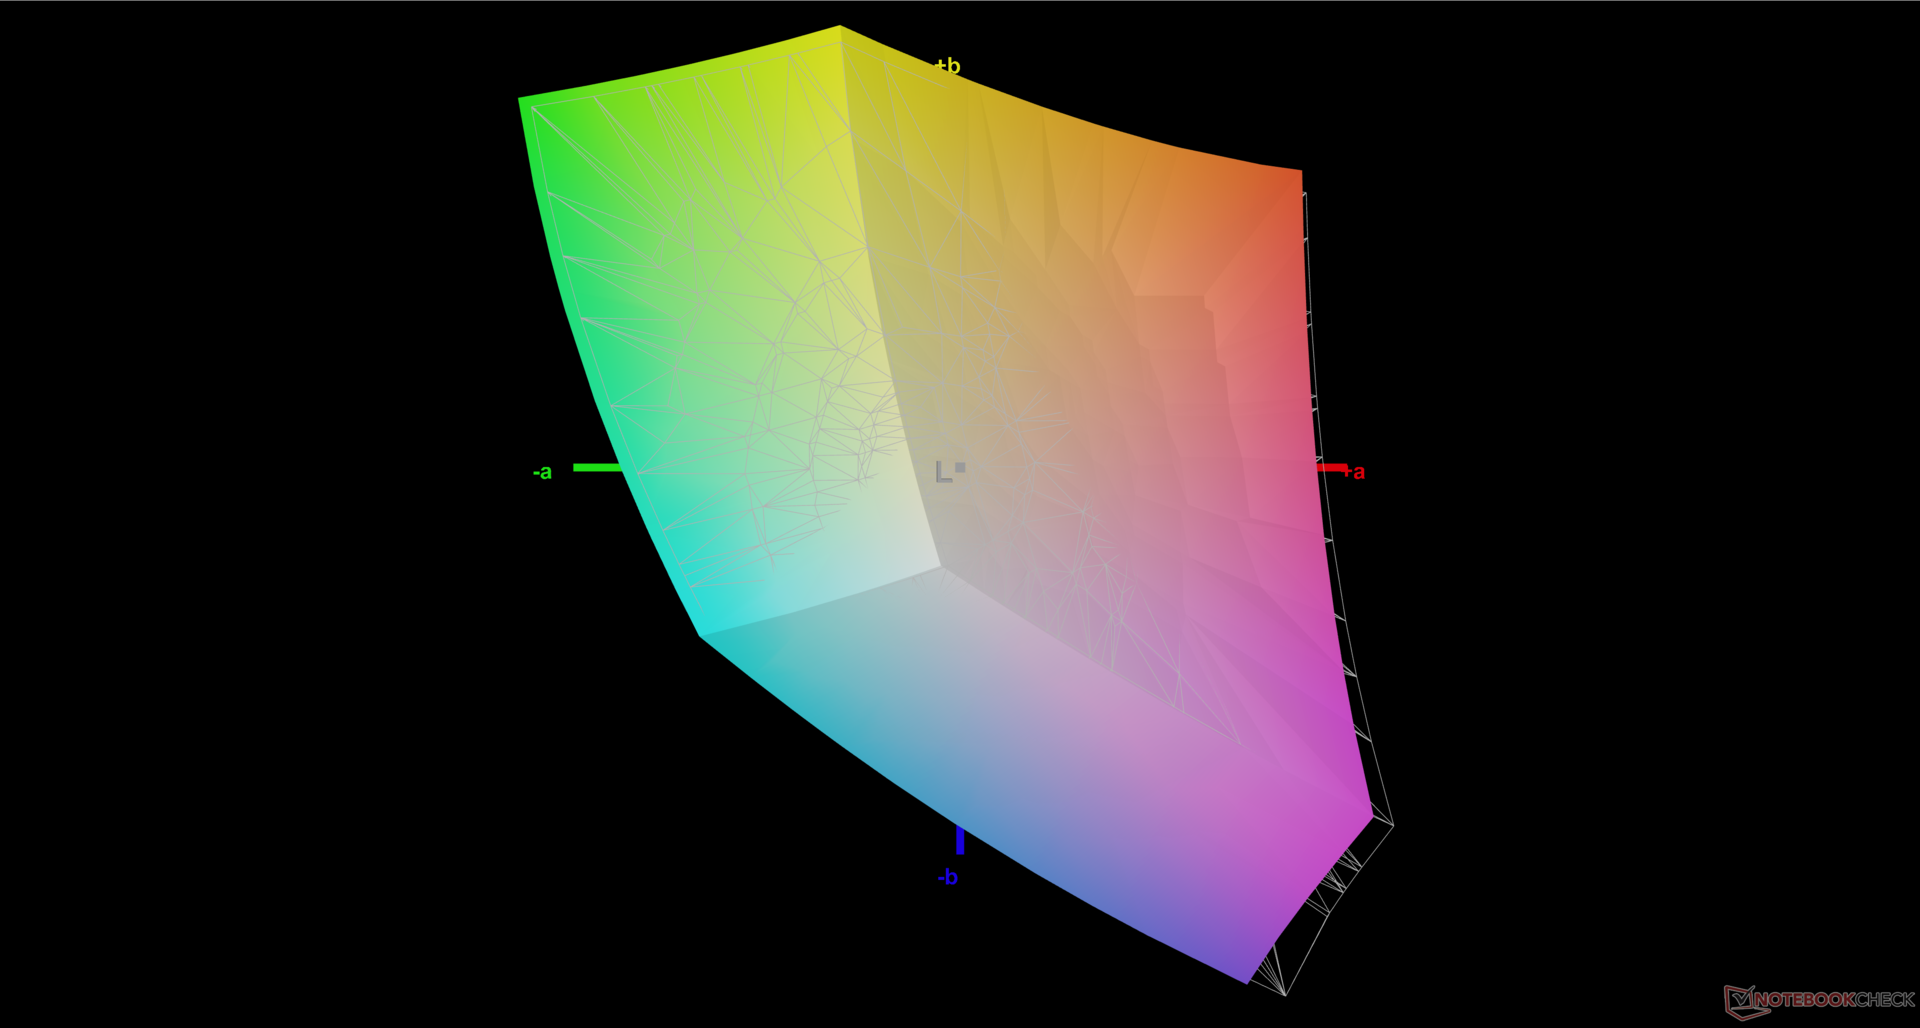
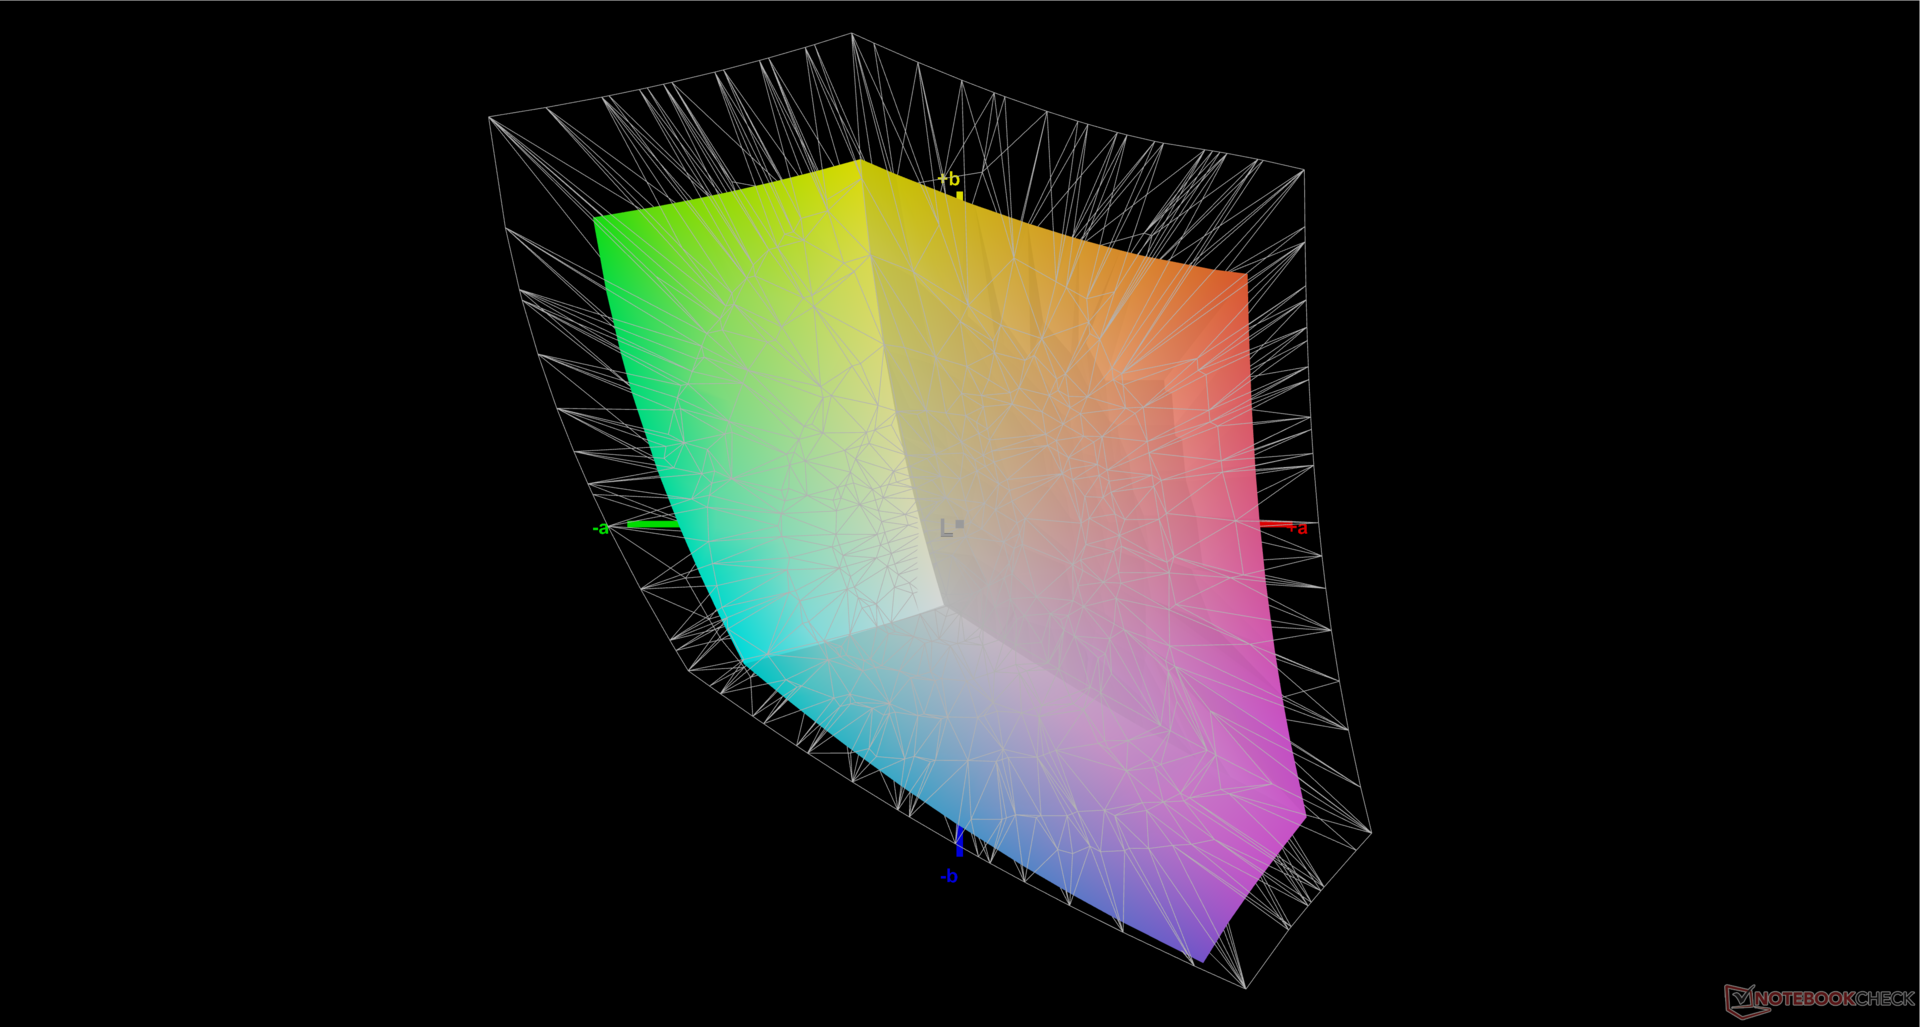
69.8% AdobeRGB 1998 (Argyll 3D)
96.5% sRGB (Argyll 3D)
67.7% Display P3 (Argyll 3D)
Gamma: 2.25
CCT: 7387 K
| Eurocom C315 Blitz BOE HF NE156QUM-N64, IPS, 3840x2160, 15.6" | Schenker Work 15 Tiger Lake-H BOE07D8, IPS, 1920x1080, 15.6" | Lenovo ThinkPad L15 Gen 4 21H70021GE N156HCA-E5B, IPS, 1920x1080, 15.6" | Acer Aspire 5 A515-58GM-76S8 LP156WFH-SPD5, IPS, 1920x1080, 15.6" | Asus VivoBook S15 M3502RA-L1029W Samsung SDC4161, OLED, 1920x1080, 15.6" | Samsung Galaxy Book2 15 NE156FHM-NS0, IPS, 1920x1080, 15.6" | |
|---|---|---|---|---|---|---|
| Display | -9% | -37% | -43% | 31% | -25% | |
| Display P3 Coverage (%) | 67.7 | 64.5 -5% | 41.8 -38% | 38.11 -44% | 99.9 48% | 49.6 -27% |
| sRGB Coverage (%) | 96.5 | 86.2 -11% | 62.5 -35% | 57.7 -40% | 100 4% | 74.8 -22% |
| AdobeRGB 1998 Coverage (%) | 69.8 | 62.9 -10% | 43.2 -38% | 39.41 -44% | 98.6 41% | 51.3 -27% |
| Response Times | -4% | 49% | 34% | 97% | 35% | |
| Response Time Grey 50% / Grey 80% * (ms) | 54.4 ? | 58.4 ? -7% | 24.4 ? 55% | 33.6 ? 38% | 0.74 99% | 32.3 ? 41% |
| Response Time Black / White * (ms) | 34.8 ? | 35.2 ? -1% | 19.7 ? 43% | 24.8 ? 29% | 2 ? 94% | 25 ? 28% |
| PWM Frequency (Hz) | 59 ? | |||||
| Screen | -25% | -53% | -77% | 8% | -42% | |
| Brightness middle (cd/m²) | 262.5 | 329 25% | 275 5% | 257.4 -2% | 378 44% | 337 28% |
| Brightness (cd/m²) | 260 | 316 22% | 252 -3% | 248 -5% | 378 45% | 325 25% |
| Brightness Distribution (%) | 85 | 92 8% | 84 -1% | 88 4% | 98 15% | 89 5% |
| Black Level * (cd/m²) | 0.25 | 0.3 -20% | 0.16 36% | 0.3209 -28% | 0.4 -60% | |
| Contrast (:1) | 1050 | 1097 4% | 1719 64% | 802 -24% | 843 -20% | |
| Colorchecker dE 2000 * | 3.34 | 5.4 -62% | 6.2 -86% | 6.26 -87% | 2.2 34% | 4.7 -41% |
| Colorchecker dE 2000 max. * | 7.72 | 10.1 -31% | 19.2 -149% | 18.28 -137% | 4.87 37% | 15.7 -103% |
| Colorchecker dE 2000 calibrated * | 0.91 | 2.5 -175% | 4.2 -362% | 4.99 -448% | 2.68 -195% | 2.8 -208% |
| Greyscale dE 2000 * | 5.3 | 5.1 4% | 4.1 23% | 3.7 30% | 1.43 73% | 5.4 -2% |
| Gamma | 2.25 98% | 2.1 105% | 1.91 115% | 2.186 101% | 2.47 89% | 2.07 106% |
| CCT | 7387 88% | 7609 85% | 6352 102% | 6606 98% | 6464 101% | 7727 84% |
| Moyenne finale (programmes/paramètres) | -13% /
-19% | -14% /
-35% | -29% /
-54% | 45% /
28% | -11% /
-27% |
* ... Moindre est la valeur, meilleures sont les performances
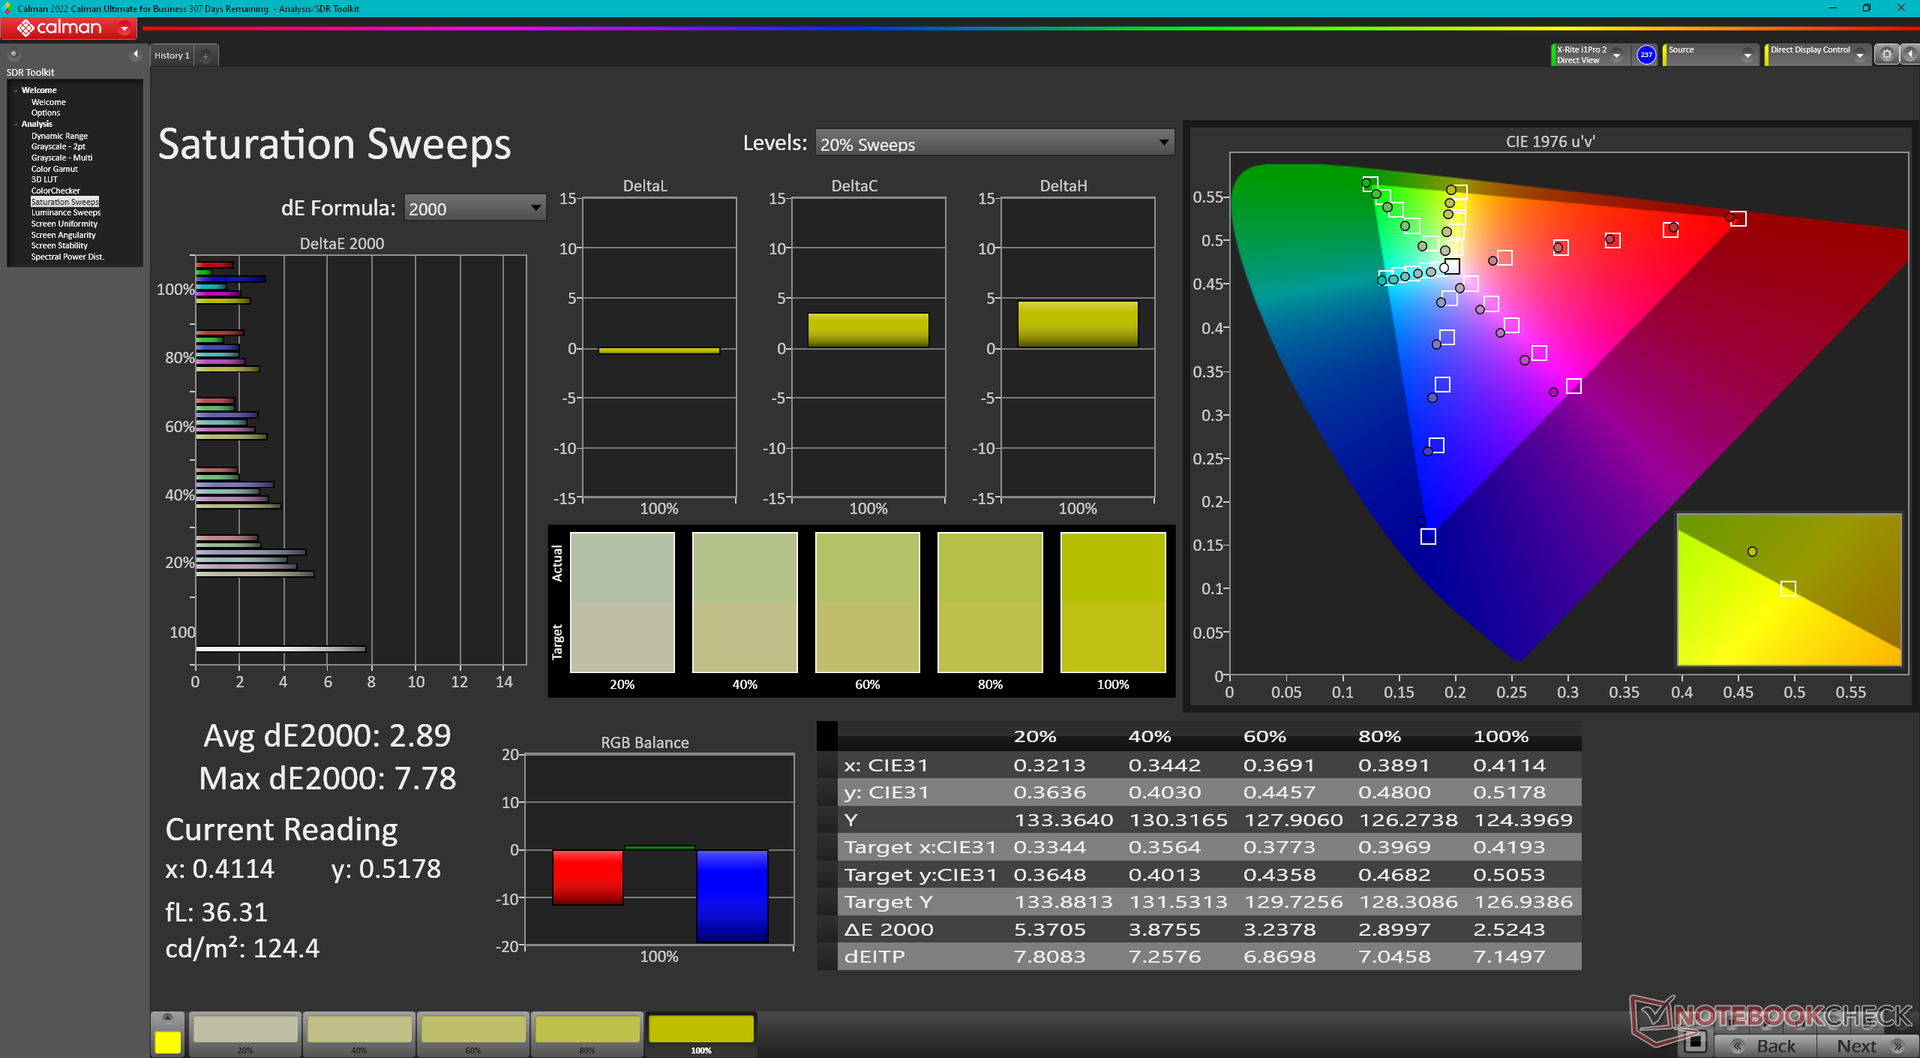
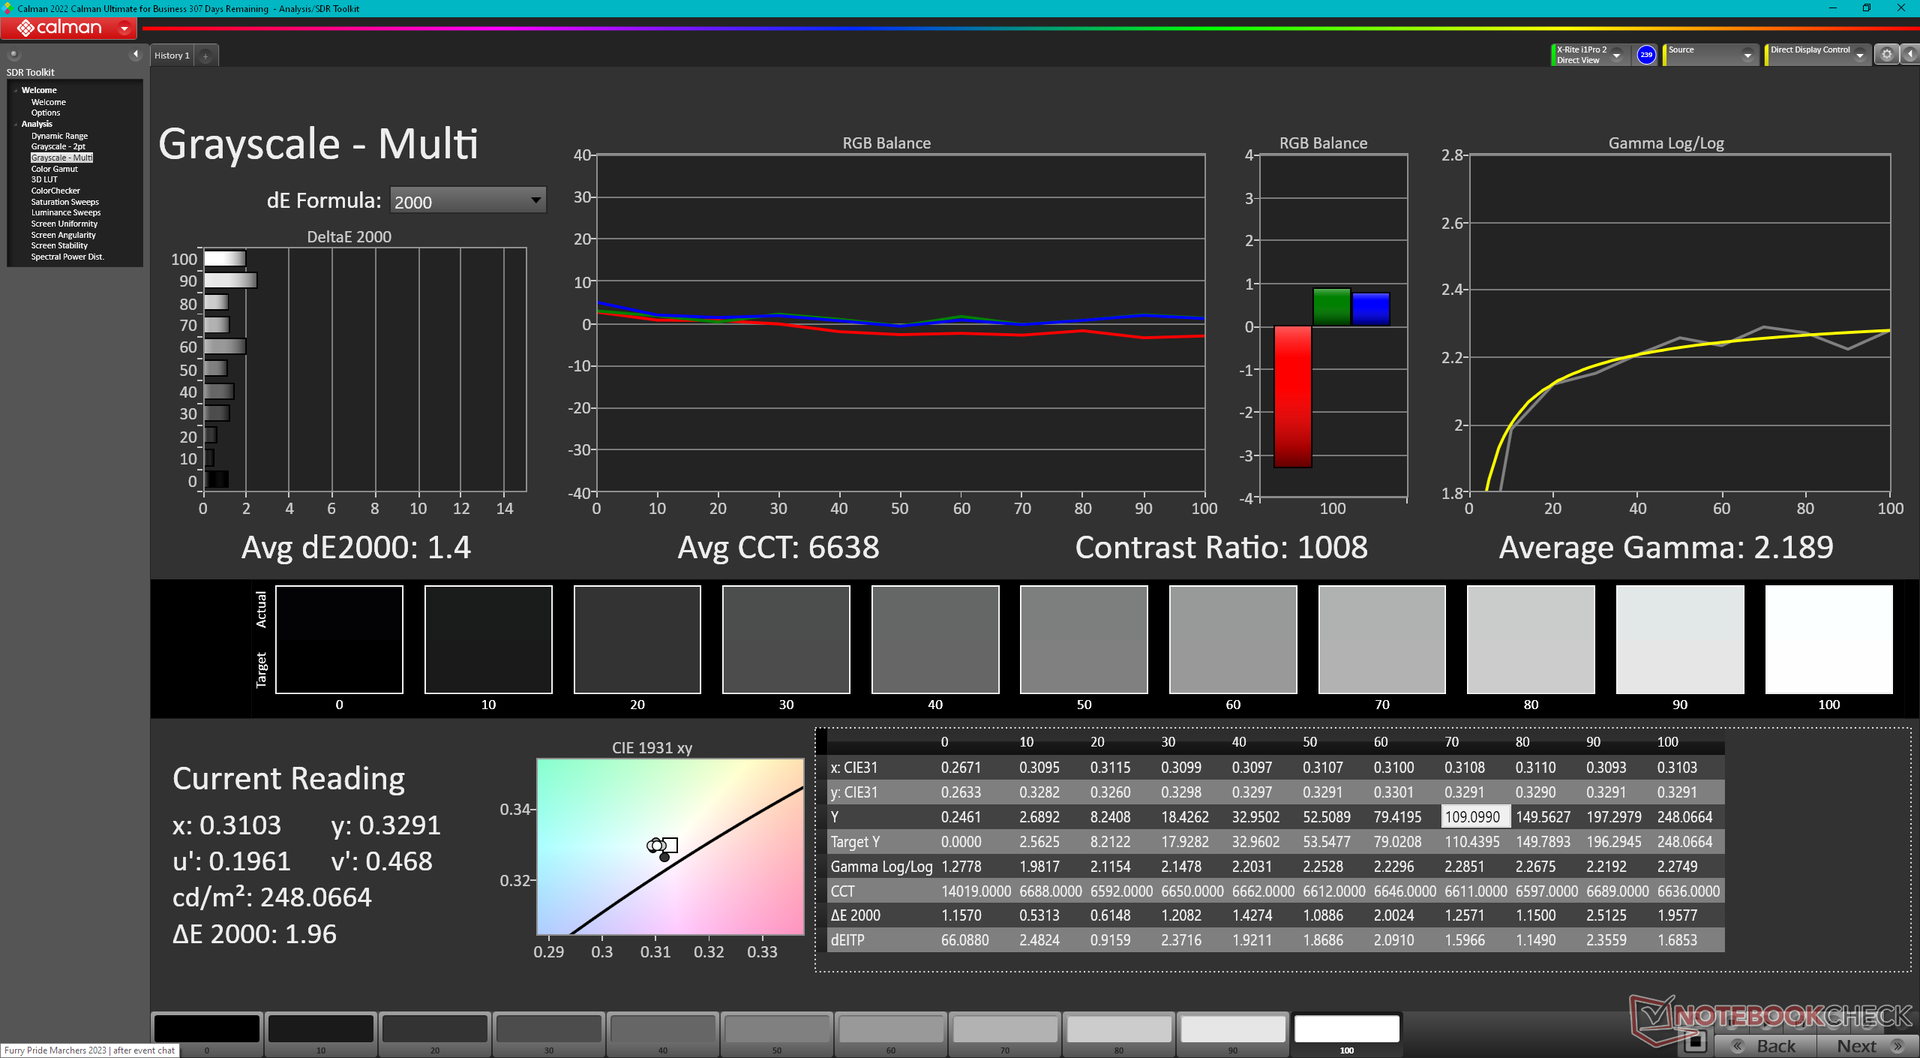
L'écran n'est pas pré-calibré. Cependant, Eurocom propose des services de calibrage en option pour les utilisateurs qui n'ont pas accès à des colorimètres. Nous sommes en mesure d'obtenir des valeurs moyennes de deltaE inférieures à 2 avec notre propre colorimètre X-Rite.
Temps de réponse de l'écran
| ↔ Temps de réponse noir à blanc | ||
|---|---|---|
| 34.8 ms ... hausse ↗ et chute ↘ combinées | ↗ 16.8 ms hausse | 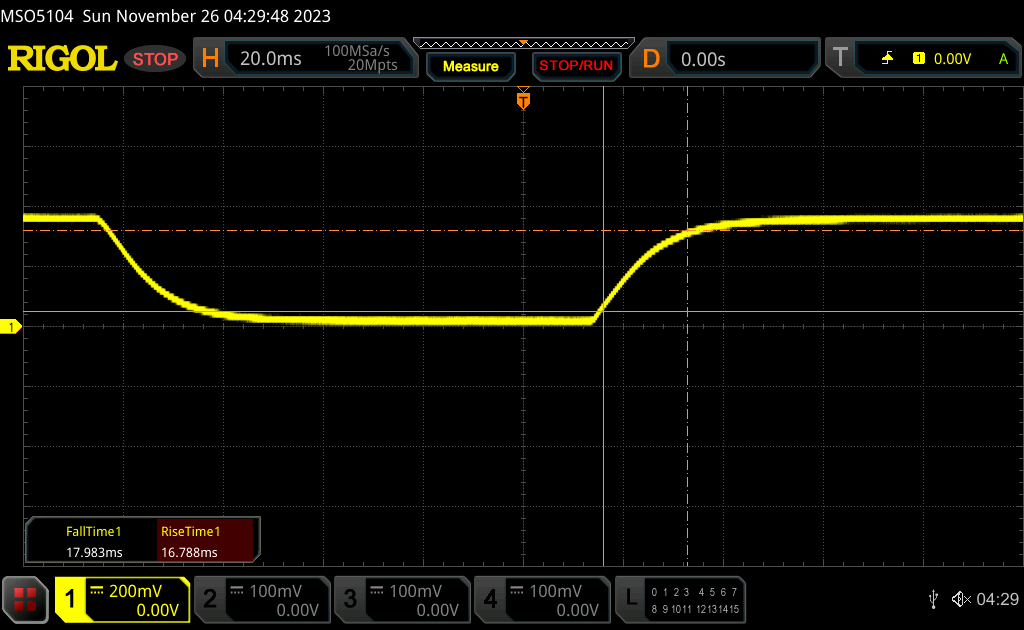 |
| ↘ 18 ms chute | ||
| L'écran souffre de latences très élevées, à éviter pour le jeu. En comparaison, tous les appareils testés affichent entre 0.1 (minimum) et 240 (maximum) ms. » 92 % des appareils testés affichent de meilleures performances. Cela signifie que les latences relevées sont moins bonnes que la moyenne (19.8 ms) de tous les appareils testés. | ||
| ↔ Temps de réponse gris 50% à gris 80% | ||
| 54.4 ms ... hausse ↗ et chute ↘ combinées | ↗ 25.3 ms hausse | 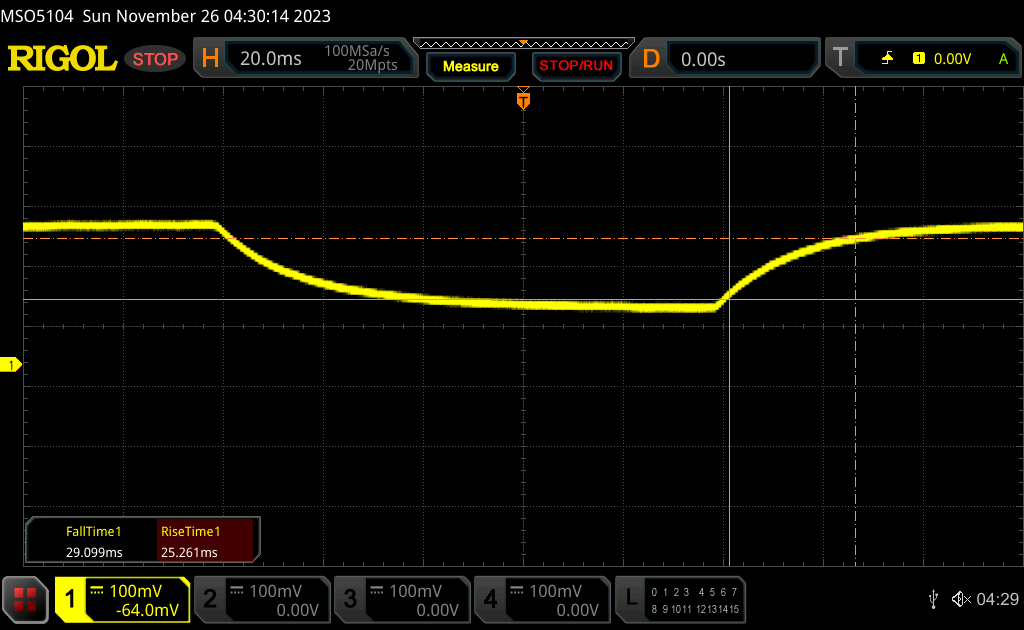 |
| ↘ 29.1 ms chute | ||
| L'écran souffre de latences très élevées, à éviter pour le jeu. En comparaison, tous les appareils testés affichent entre 0.165 (minimum) et 636 (maximum) ms. » 91 % des appareils testés affichent de meilleures performances. Cela signifie que les latences relevées sont moins bonnes que la moyenne (30.9 ms) de tous les appareils testés. | ||
Scintillement / MLI (Modulation de largeur d'impulsion)
| Scintillement / MLI (Modulation de largeur d'impulsion) non décelé | 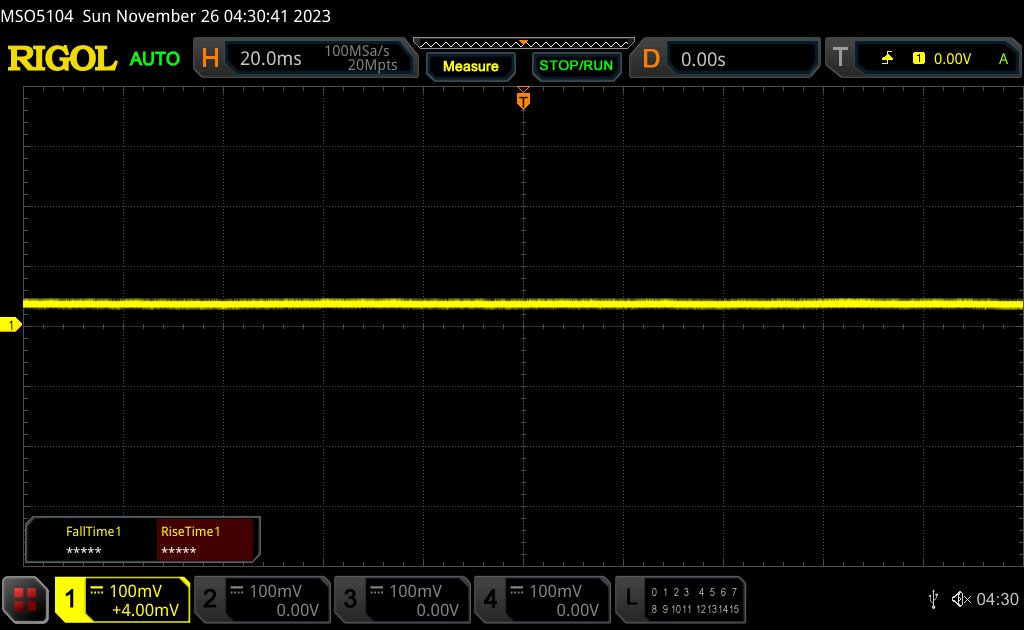 | ||
En comparaison, 52 % des appareils testés n'emploient pas MDI pour assombrir leur écran. Nous avons relevé une moyenne à 7748 (minimum : 5 - maximum : 343500) Hz dans le cas où une MDI était active. | |||
Performance
Conditions d'essai
Nous avons réglé Windows sur le mode Performance avant d'effectuer les tests ci-dessous. Le système ne comprend pas de logiciel de "centre de contrôle" spécialisé permettant de régler des fonctions auxiliaires ou des profils d'alimentation supplémentaires.
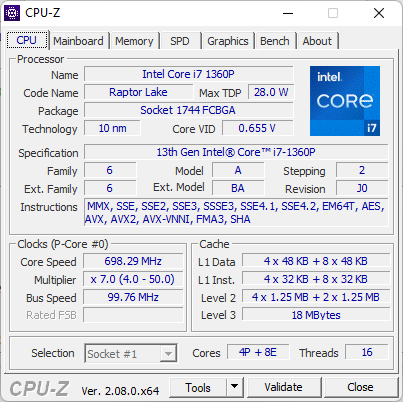
Processeur
Le Core i7-1360P est un peu mitigé. D'une part, il offre des performances similaires à celles de l'ancien et plus exigeantCore i7-11370H du Schenker Work 15. Mais d'un autre côté, il n'est pas à la hauteur d'alternatives telles que leCore i7-1355U ou leRyzen 7 5700U. Il souffre également d'un problème d'étranglement : notre score initial de 1079 points au CineBench R15 xT a chuté d'environ 21 % lorsque le benchmark a été exécuté en boucle.
Le processeur Core i7 est nettement moins performant sur notre Eurocom. LeCore i5-1340P dans leSamsung Galaxy Book3 Pro 360 16le Core i5-1340P du Samsung Bookbook Pro 360 16, par exemple, serait 50 à 70 % plus rapide selon plusieurs benchmarks multithread.
Cinebench R15 Multi Loop
Cinebench R23: Multi Core | Single Core
Cinebench R20: CPU (Multi Core) | CPU (Single Core)
Cinebench R15: CPU Multi 64Bit | CPU Single 64Bit
Blender: v2.79 BMW27 CPU
7-Zip 18.03: 7z b 4 | 7z b 4 -mmt1
Geekbench 5.5: Multi-Core | Single-Core
HWBOT x265 Benchmark v2.2: 4k Preset
LibreOffice : 20 Documents To PDF
R Benchmark 2.5: Overall mean
* ... Moindre est la valeur, meilleures sont les performances
AIDA64: FP32 Ray-Trace | FPU Julia | CPU SHA3 | CPU Queen | FPU SinJulia | FPU Mandel | CPU AES | CPU ZLib | FP64 Ray-Trace | CPU PhotoWorxx
| Performance rating | |
| Asus VivoBook S15 M3502RA-L1029W | |
| Lenovo ThinkPad L15 Gen 4 21H70021GE | |
| Moyenne Intel Core i7-1360P | |
| Acer Aspire 5 A515-58GM-76S8 | |
| Schenker Work 15 Tiger Lake-H | |
| Samsung Galaxy Book2 15 | |
| Eurocom C315 Blitz | |
| AIDA64 / FP32 Ray-Trace | |
| Asus VivoBook S15 M3502RA-L1029W | |
| Lenovo ThinkPad L15 Gen 4 21H70021GE | |
| Moyenne Intel Core i7-1360P (5610 - 11188, n=17) | |
| Acer Aspire 5 A515-58GM-76S8 | |
| Schenker Work 15 Tiger Lake-H | |
| Samsung Galaxy Book2 15 | |
| Eurocom C315 Blitz | |
| AIDA64 / FPU Julia | |
| Asus VivoBook S15 M3502RA-L1029W | |
| Lenovo ThinkPad L15 Gen 4 21H70021GE | |
| Moyenne Intel Core i7-1360P (29251 - 56942, n=16) | |
| Acer Aspire 5 A515-58GM-76S8 | |
| Schenker Work 15 Tiger Lake-H | |
| Eurocom C315 Blitz | |
| Samsung Galaxy Book2 15 | |
| AIDA64 / CPU SHA3 | |
| Asus VivoBook S15 M3502RA-L1029W | |
| Lenovo ThinkPad L15 Gen 4 21H70021GE | |
| Moyenne Intel Core i7-1360P (1444 - 2728, n=16) | |
| Acer Aspire 5 A515-58GM-76S8 | |
| Schenker Work 15 Tiger Lake-H | |
| Eurocom C315 Blitz | |
| Samsung Galaxy Book2 15 | |
| AIDA64 / CPU Queen | |
| Asus VivoBook S15 M3502RA-L1029W | |
| Lenovo ThinkPad L15 Gen 4 21H70021GE | |
| Moyenne Intel Core i7-1360P (65324 - 89266, n=16) | |
| Eurocom C315 Blitz | |
| Samsung Galaxy Book2 15 | |
| Acer Aspire 5 A515-58GM-76S8 | |
| Schenker Work 15 Tiger Lake-H | |
| AIDA64 / FPU SinJulia | |
| Asus VivoBook S15 M3502RA-L1029W | |
| Lenovo ThinkPad L15 Gen 4 21H70021GE | |
| Samsung Galaxy Book2 15 | |
| Moyenne Intel Core i7-1360P (4370 - 7269, n=16) | |
| Acer Aspire 5 A515-58GM-76S8 | |
| Schenker Work 15 Tiger Lake-H | |
| Eurocom C315 Blitz | |
| AIDA64 / FPU Mandel | |
| Asus VivoBook S15 M3502RA-L1029W | |
| Lenovo ThinkPad L15 Gen 4 21H70021GE | |
| Moyenne Intel Core i7-1360P (14104 - 28019, n=16) | |
| Acer Aspire 5 A515-58GM-76S8 | |
| Schenker Work 15 Tiger Lake-H | |
| Eurocom C315 Blitz | |
| Samsung Galaxy Book2 15 | |
| AIDA64 / CPU AES | |
| Asus VivoBook S15 M3502RA-L1029W | |
| Acer Aspire 5 A515-58GM-76S8 | |
| Schenker Work 15 Tiger Lake-H | |
| Moyenne Intel Core i7-1360P (30391 - 99244, n=16) | |
| Lenovo ThinkPad L15 Gen 4 21H70021GE | |
| Samsung Galaxy Book2 15 | |
| Eurocom C315 Blitz | |
| AIDA64 / CPU ZLib | |
| Asus VivoBook S15 M3502RA-L1029W | |
| Lenovo ThinkPad L15 Gen 4 21H70021GE | |
| Samsung Galaxy Book2 15 | |
| Moyenne Intel Core i7-1360P (420 - 807, n=16) | |
| Acer Aspire 5 A515-58GM-76S8 | |
| Eurocom C315 Blitz | |
| Schenker Work 15 Tiger Lake-H | |
| AIDA64 / FP64 Ray-Trace | |
| Asus VivoBook S15 M3502RA-L1029W | |
| Lenovo ThinkPad L15 Gen 4 21H70021GE | |
| Moyenne Intel Core i7-1360P (2906 - 5957, n=16) | |
| Acer Aspire 5 A515-58GM-76S8 | |
| Schenker Work 15 Tiger Lake-H | |
| Samsung Galaxy Book2 15 | |
| Eurocom C315 Blitz | |
| AIDA64 / CPU PhotoWorxx | |
| Moyenne Intel Core i7-1360P (29108 - 49328, n=16) | |
| Samsung Galaxy Book2 15 | |
| Eurocom C315 Blitz | |
| Schenker Work 15 Tiger Lake-H | |
| Asus VivoBook S15 M3502RA-L1029W | |
| Acer Aspire 5 A515-58GM-76S8 | |
| Lenovo ThinkPad L15 Gen 4 21H70021GE | |
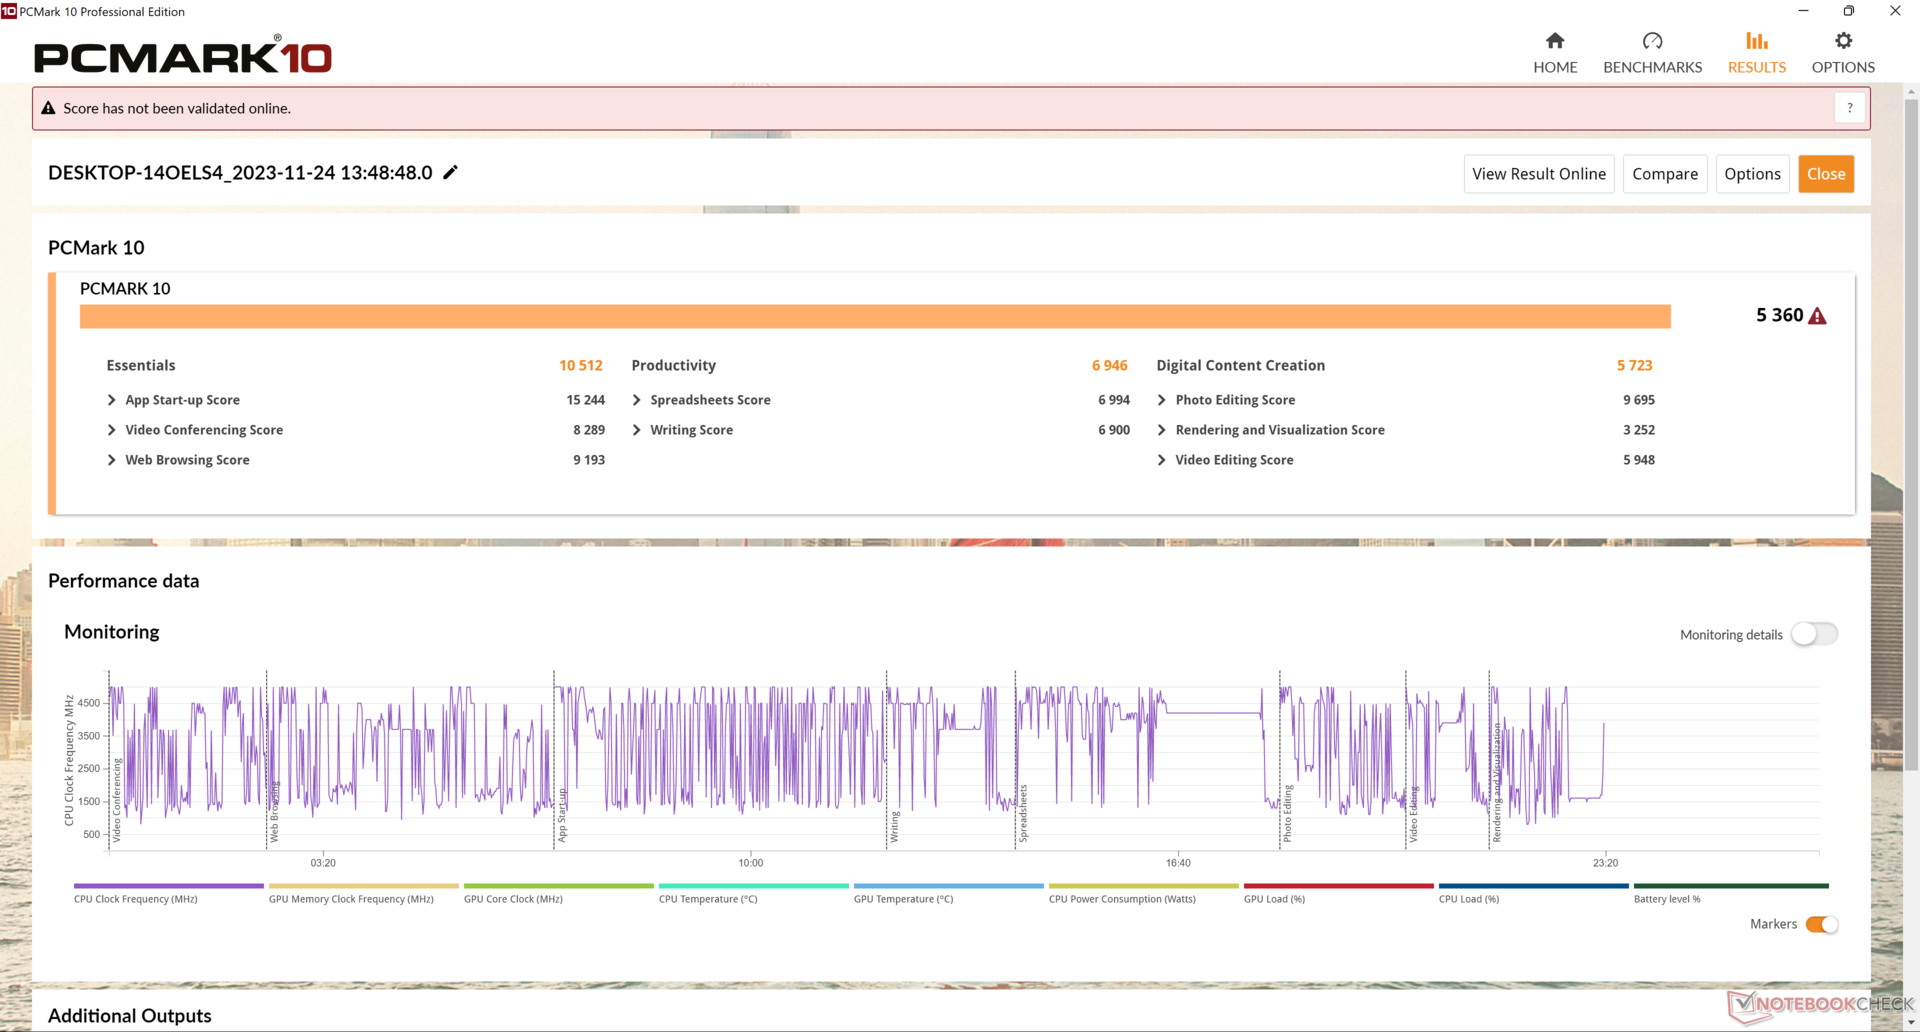
Performance du système
Les résultats de PCMark sont pratiquement identiques à ceux du Schenker Work 15 fonctionnant avec le Core i7-11370H, plus ancien et plus gourmand en énergie.
CrossMark: Overall | Productivity | Creativity | Responsiveness
| PCMark 10 / Score | |
| Asus VivoBook S15 M3502RA-L1029W | |
| Acer Aspire 5 A515-58GM-76S8 | |
| Moyenne Intel Core i7-1360P, Intel Iris Xe Graphics G7 96EUs (5360 - 6281, n=14) | |
| Samsung Galaxy Book2 15 | |
| Schenker Work 15 Tiger Lake-H | |
| Lenovo ThinkPad L15 Gen 4 21H70021GE | |
| Eurocom C315 Blitz | |
| PCMark 10 / Essentials | |
| Acer Aspire 5 A515-58GM-76S8 | |
| Moyenne Intel Core i7-1360P, Intel Iris Xe Graphics G7 96EUs (9883 - 12059, n=14) | |
| Schenker Work 15 Tiger Lake-H | |
| Eurocom C315 Blitz | |
| Asus VivoBook S15 M3502RA-L1029W | |
| Lenovo ThinkPad L15 Gen 4 21H70021GE | |
| Samsung Galaxy Book2 15 | |
| PCMark 10 / Productivity | |
| Asus VivoBook S15 M3502RA-L1029W | |
| Lenovo ThinkPad L15 Gen 4 21H70021GE | |
| Acer Aspire 5 A515-58GM-76S8 | |
| Moyenne Intel Core i7-1360P, Intel Iris Xe Graphics G7 96EUs (6572 - 8161, n=14) | |
| Schenker Work 15 Tiger Lake-H | |
| Eurocom C315 Blitz | |
| Samsung Galaxy Book2 15 | |
| PCMark 10 / Digital Content Creation | |
| Asus VivoBook S15 M3502RA-L1029W | |
| Acer Aspire 5 A515-58GM-76S8 | |
| Moyenne Intel Core i7-1360P, Intel Iris Xe Graphics G7 96EUs (5723 - 7612, n=14) | |
| Samsung Galaxy Book2 15 | |
| Schenker Work 15 Tiger Lake-H | |
| Eurocom C315 Blitz | |
| Lenovo ThinkPad L15 Gen 4 21H70021GE | |
| CrossMark / Overall | |
| Eurocom C315 Blitz | |
| Acer Aspire 5 A515-58GM-76S8 | |
| Moyenne Intel Core i7-1360P, Intel Iris Xe Graphics G7 96EUs (1527 - 1891, n=15) | |
| Asus VivoBook S15 M3502RA-L1029W | |
| Lenovo ThinkPad L15 Gen 4 21H70021GE | |
| CrossMark / Productivity | |
| Acer Aspire 5 A515-58GM-76S8 | |
| Eurocom C315 Blitz | |
| Moyenne Intel Core i7-1360P, Intel Iris Xe Graphics G7 96EUs (1503 - 1842, n=15) | |
| Asus VivoBook S15 M3502RA-L1029W | |
| Lenovo ThinkPad L15 Gen 4 21H70021GE | |
| CrossMark / Creativity | |
| Eurocom C315 Blitz | |
| Moyenne Intel Core i7-1360P, Intel Iris Xe Graphics G7 96EUs (1558 - 2003, n=15) | |
| Asus VivoBook S15 M3502RA-L1029W | |
| Acer Aspire 5 A515-58GM-76S8 | |
| Lenovo ThinkPad L15 Gen 4 21H70021GE | |
| CrossMark / Responsiveness | |
| Acer Aspire 5 A515-58GM-76S8 | |
| Eurocom C315 Blitz | |
| Moyenne Intel Core i7-1360P, Intel Iris Xe Graphics G7 96EUs (1311 - 1899, n=15) | |
| Asus VivoBook S15 M3502RA-L1029W | |
| Lenovo ThinkPad L15 Gen 4 21H70021GE | |
| PCMark 10 Score | 5360 points | |
Aide | ||
| AIDA64 / Memory Copy | |
| Eurocom C315 Blitz | |
| Samsung Galaxy Book2 15 | |
| Moyenne Intel Core i7-1360P (44299 - 72748, n=16) | |
| Asus VivoBook S15 M3502RA-L1029W | |
| Schenker Work 15 Tiger Lake-H | |
| Acer Aspire 5 A515-58GM-76S8 | |
| Lenovo ThinkPad L15 Gen 4 21H70021GE | |
| AIDA64 / Memory Read | |
| Eurocom C315 Blitz | |
| Samsung Galaxy Book2 15 | |
| Moyenne Intel Core i7-1360P (44751 - 68945, n=16) | |
| Asus VivoBook S15 M3502RA-L1029W | |
| Schenker Work 15 Tiger Lake-H | |
| Acer Aspire 5 A515-58GM-76S8 | |
| Lenovo ThinkPad L15 Gen 4 21H70021GE | |
| AIDA64 / Memory Write | |
| Eurocom C315 Blitz | |
| Moyenne Intel Core i7-1360P (45887 - 93331, n=16) | |
| Samsung Galaxy Book2 15 | |
| Asus VivoBook S15 M3502RA-L1029W | |
| Schenker Work 15 Tiger Lake-H | |
| Acer Aspire 5 A515-58GM-76S8 | |
| Lenovo ThinkPad L15 Gen 4 21H70021GE | |
| AIDA64 / Memory Latency | |
| Lenovo ThinkPad L15 Gen 4 21H70021GE | |
| Moyenne Intel Core i7-1360P (85 - 110.5, n=16) | |
| Asus VivoBook S15 M3502RA-L1029W | |
| Eurocom C315 Blitz | |
| Schenker Work 15 Tiger Lake-H | |
| Acer Aspire 5 A515-58GM-76S8 | |
| Samsung Galaxy Book2 15 | |
* ... Moindre est la valeur, meilleures sont les performances
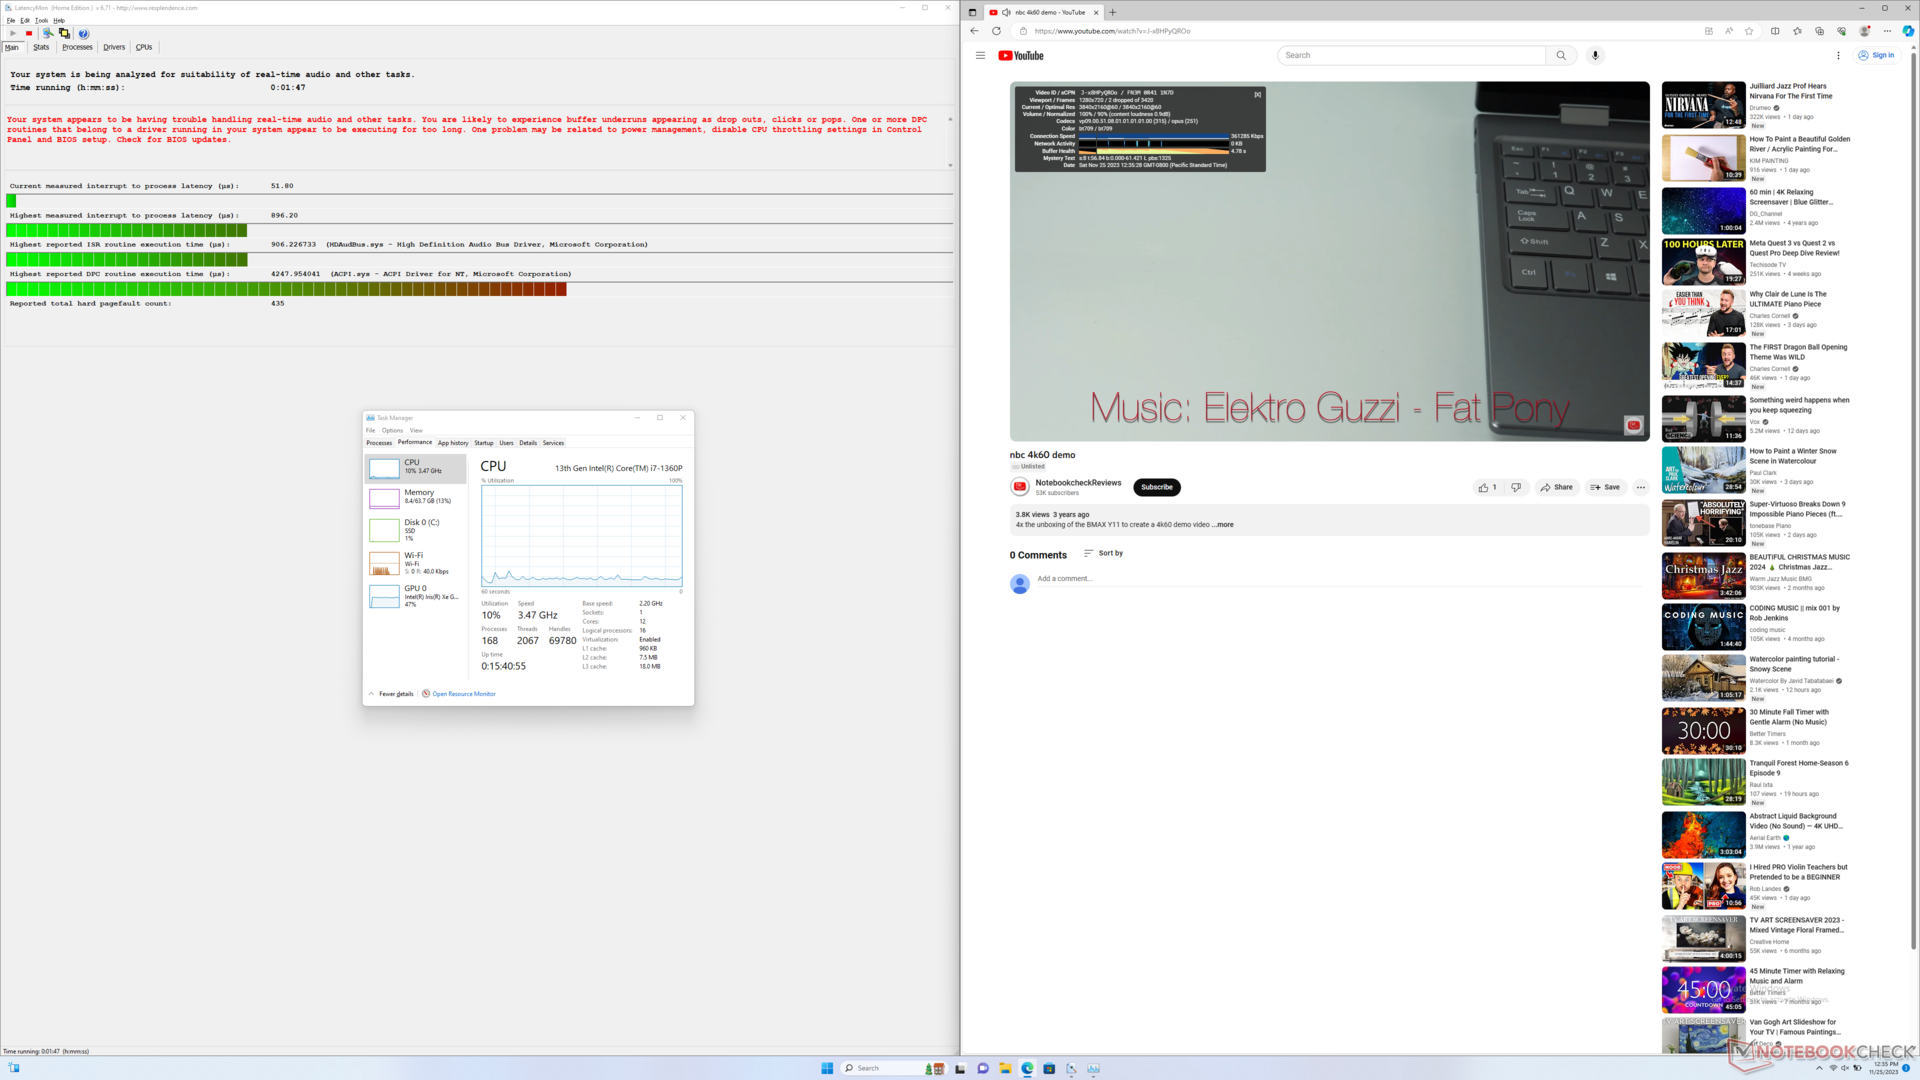
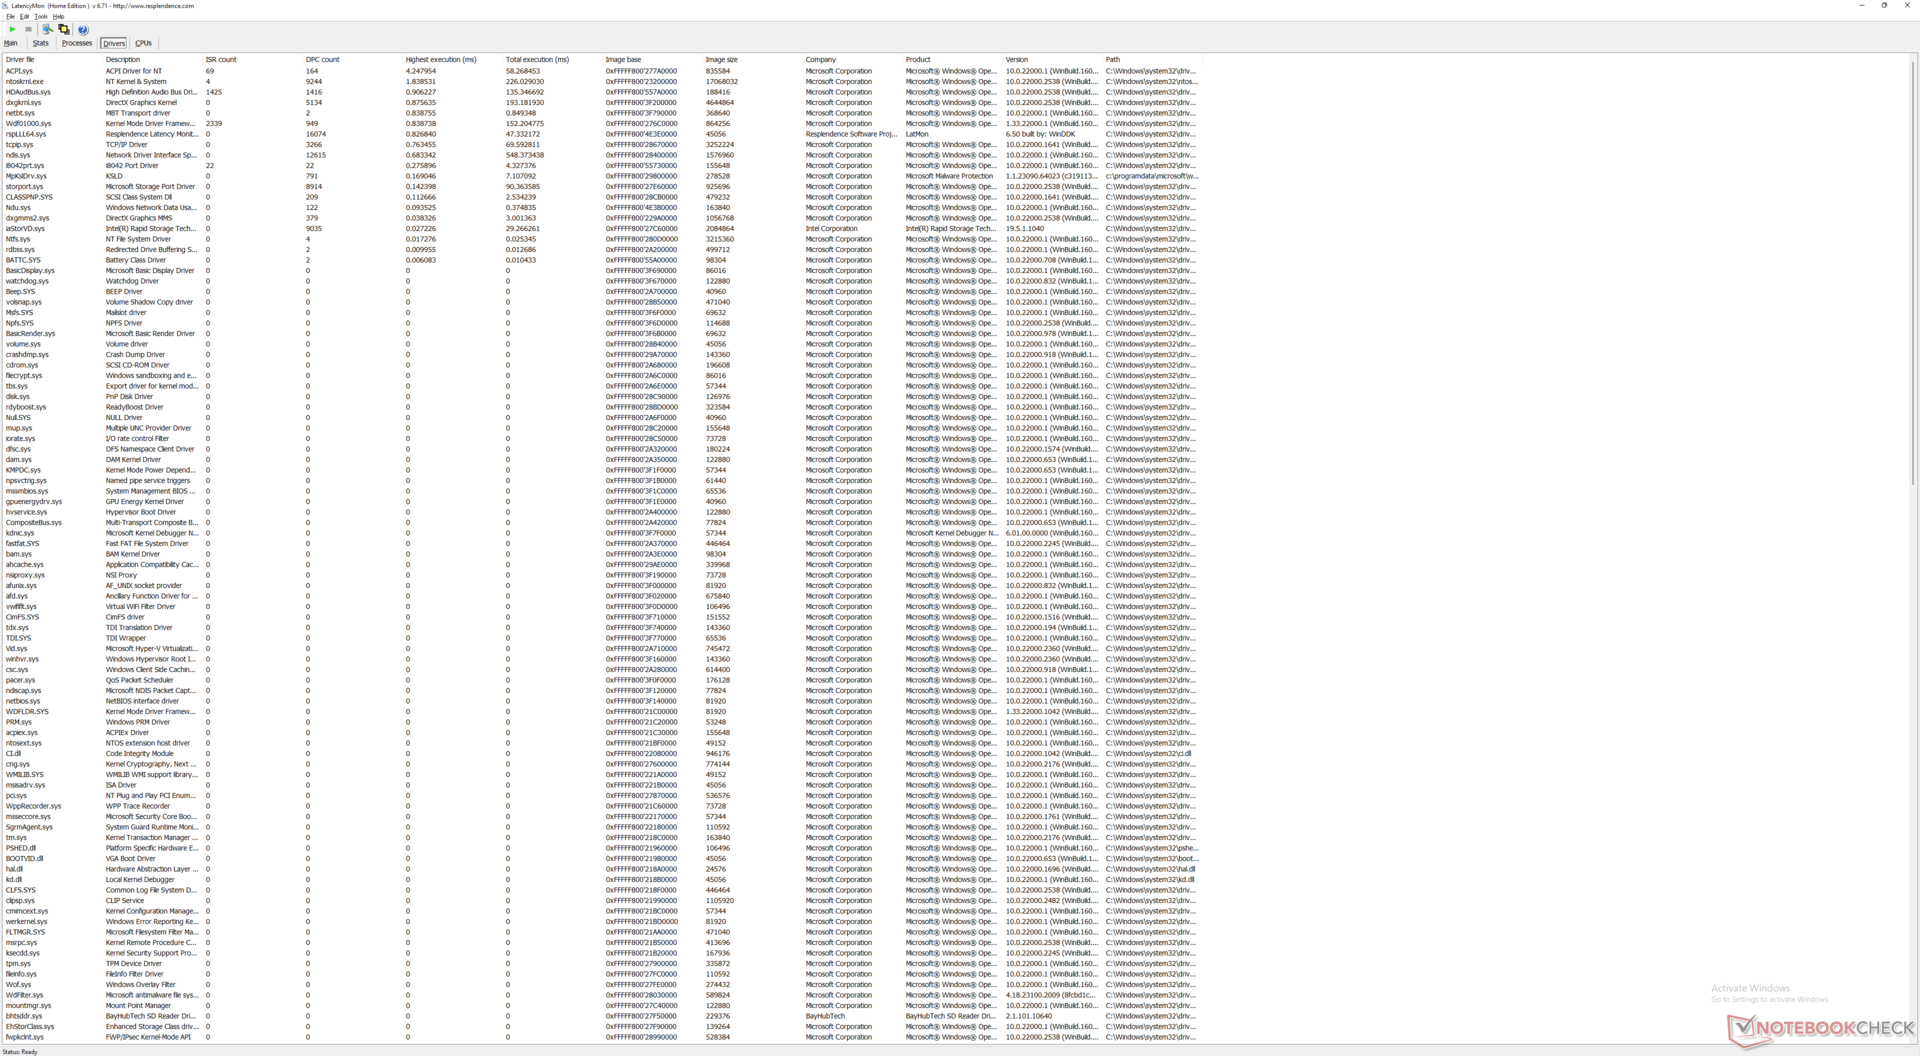
Latence DPC
LatencyMon révèle des problèmes de DPC lors de l'ouverture de plusieurs onglets de notre page d'accueil. la lecture de vidéos 4K à 60 FPS est excellente, avec seulement deux images perdues enregistrées sur une période d'une minute.
| DPC Latencies / LatencyMon - interrupt to process latency (max), Web, Youtube, Prime95 | |
| Lenovo ThinkPad L15 Gen 4 21H70021GE | |
| Schenker Work 15 Tiger Lake-H | |
| Acer Aspire 5 A515-58GM-76S8 | |
| Eurocom C315 Blitz | |
| Samsung Galaxy Book2 15 | |
| Asus VivoBook S15 M3502RA-L1029W | |
* ... Moindre est la valeur, meilleures sont les performances
Dispositifs de stockage
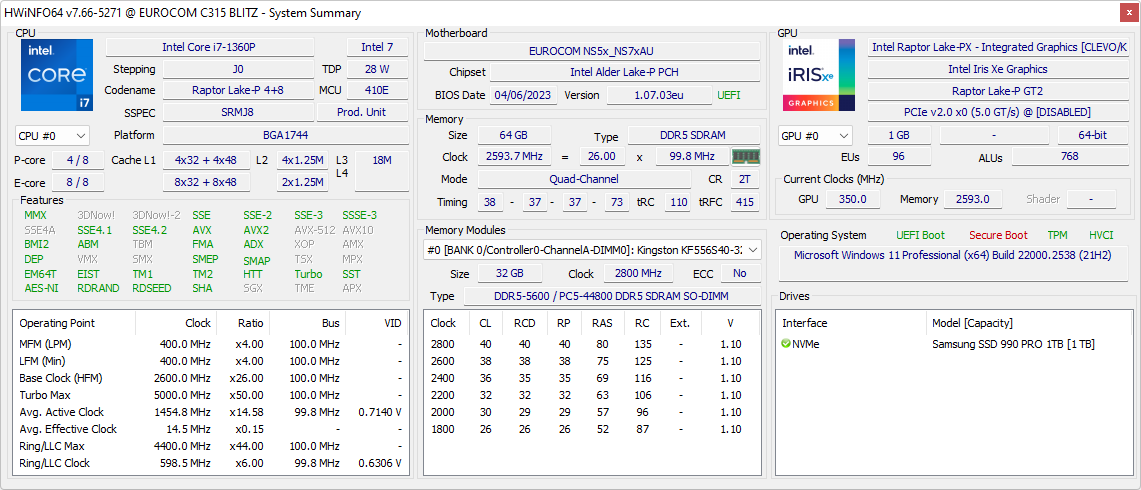
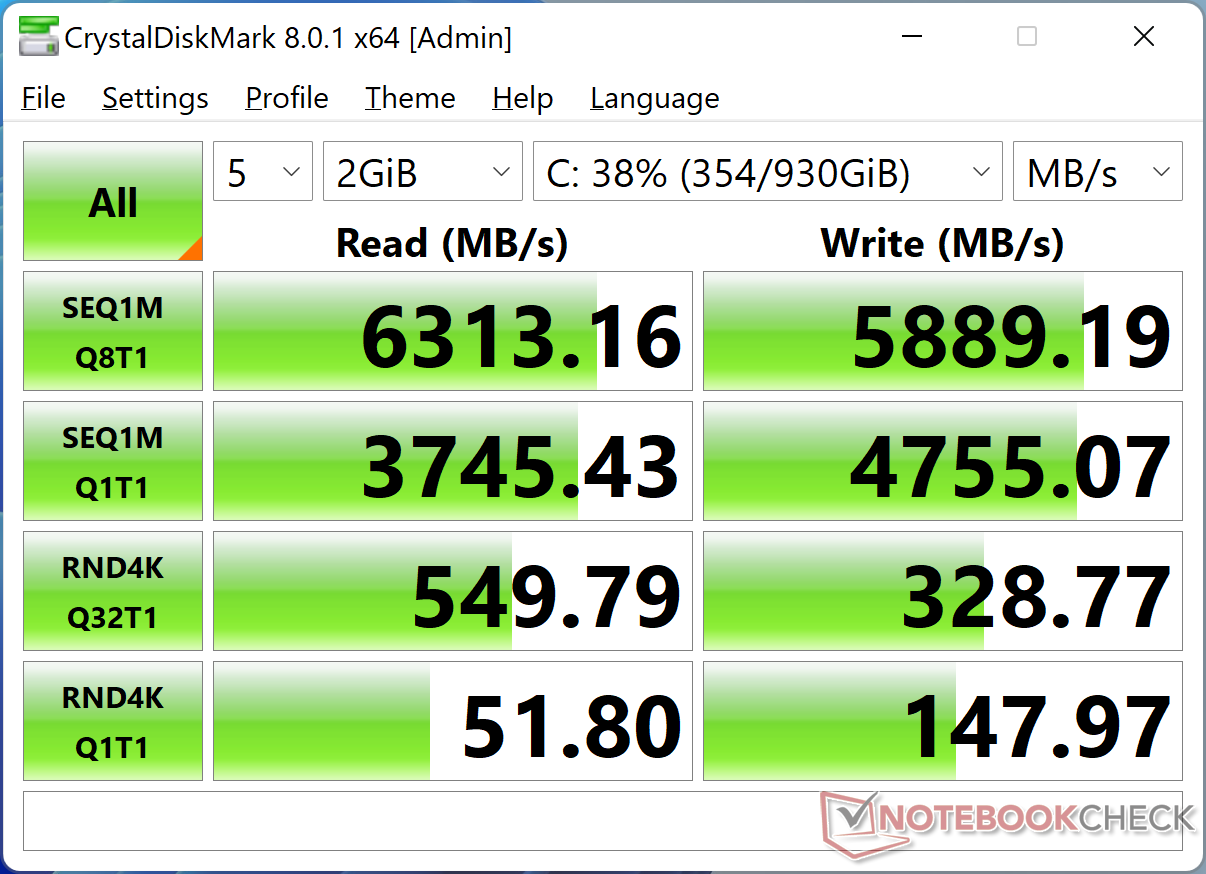
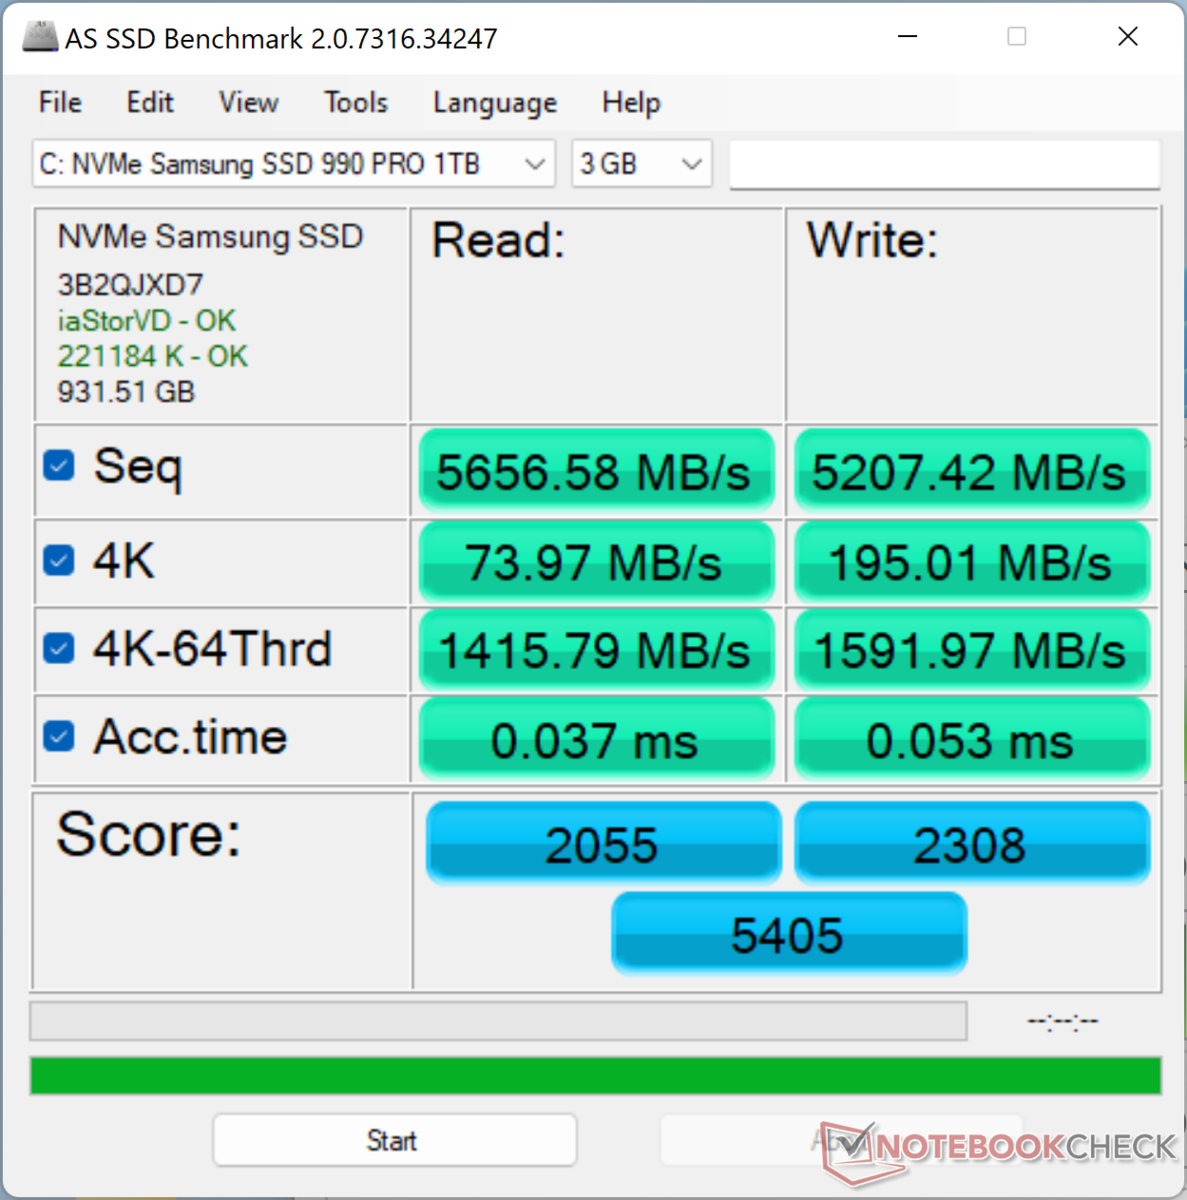
Notre appareil est livré avec un appareil haut de gamme Samsung 990 Pro haut de gamme, qui promet des taux de lecture séquentielle et d'écriture pouvant atteindre respectivement 7450 Mo/s et 6900 Mo/s. Le disque de notre unité est capable de soutenir un maximum de 7100 Mo/s sans problème d'étranglement. Le disque de notre unité est capable de soutenir un maximum de 7100 Mo/s sans aucun problème d'étranglement. Le coussin thermique inclus dans le SSD permet à la chaleur de se dissiper sur la plaque inférieure en métal.

* ... Moindre est la valeur, meilleures sont les performances
Disk Throttling: DiskSpd Read Loop, Queue Depth 8
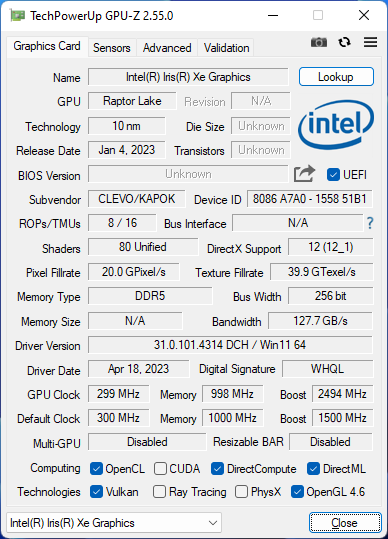
Performance du GPU
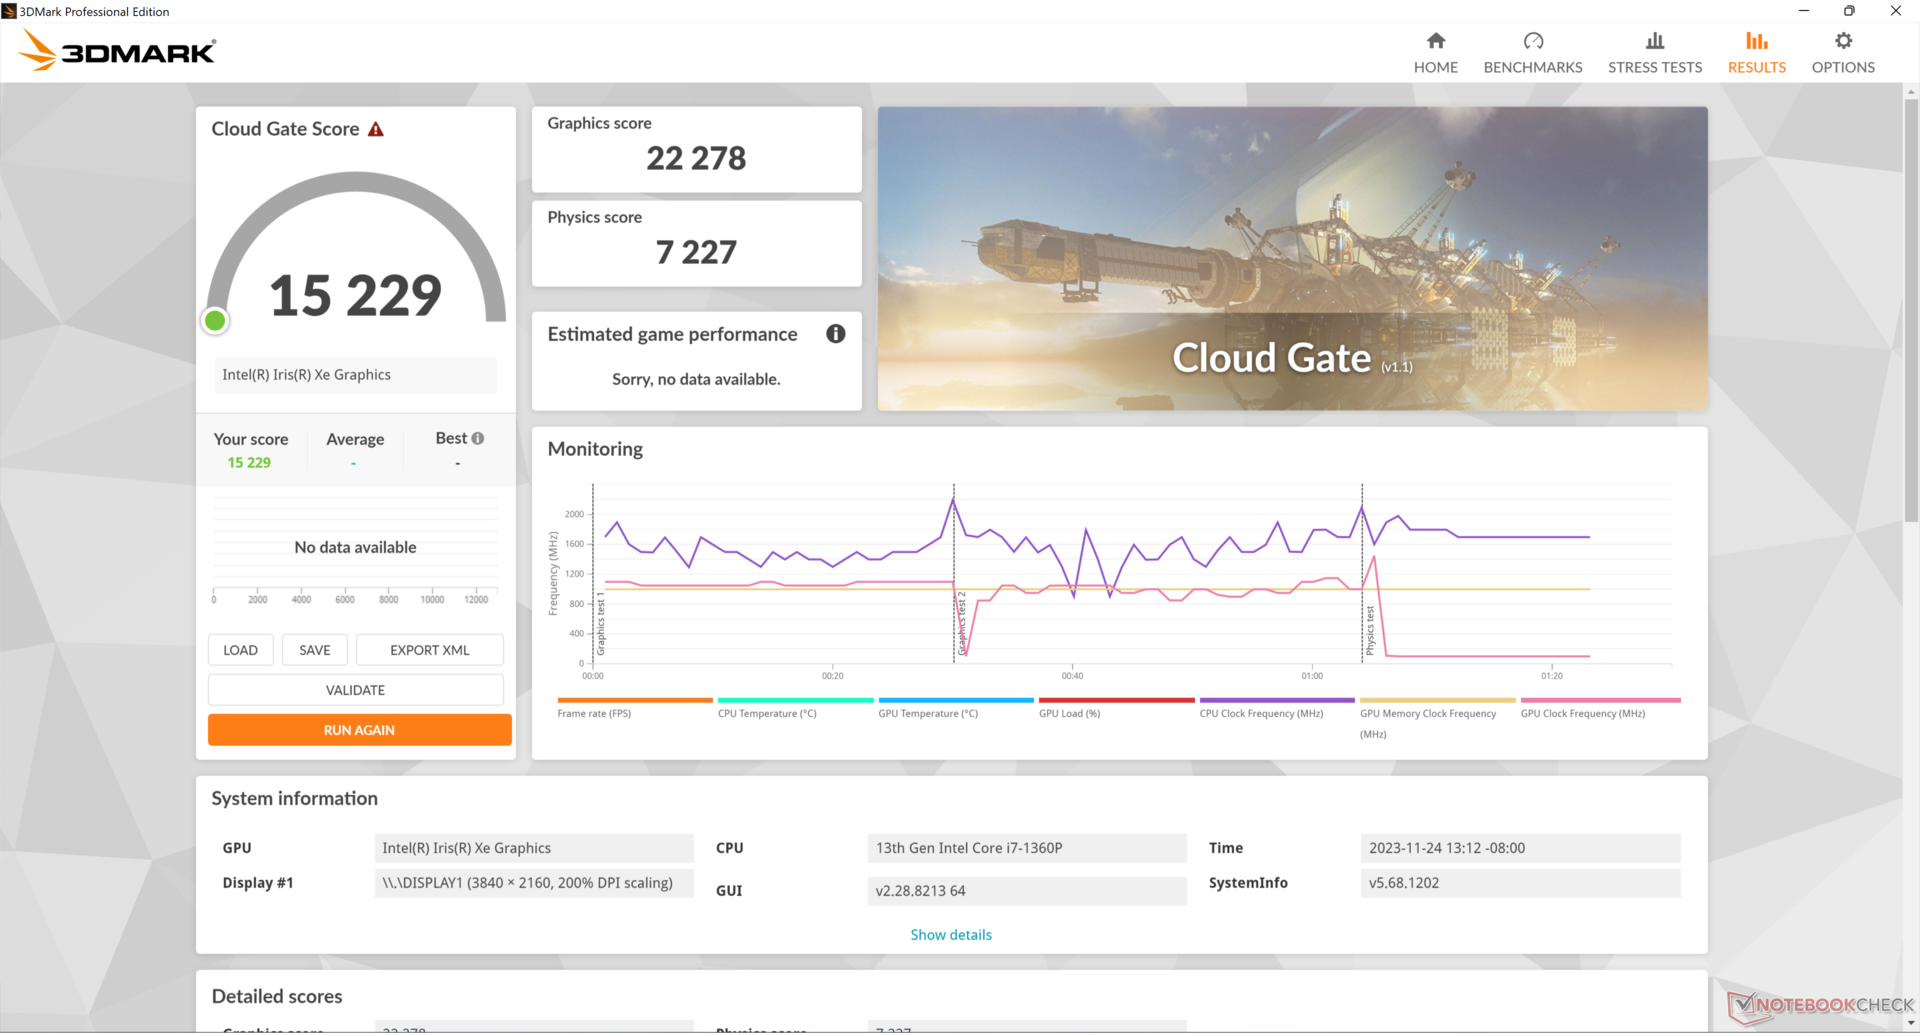
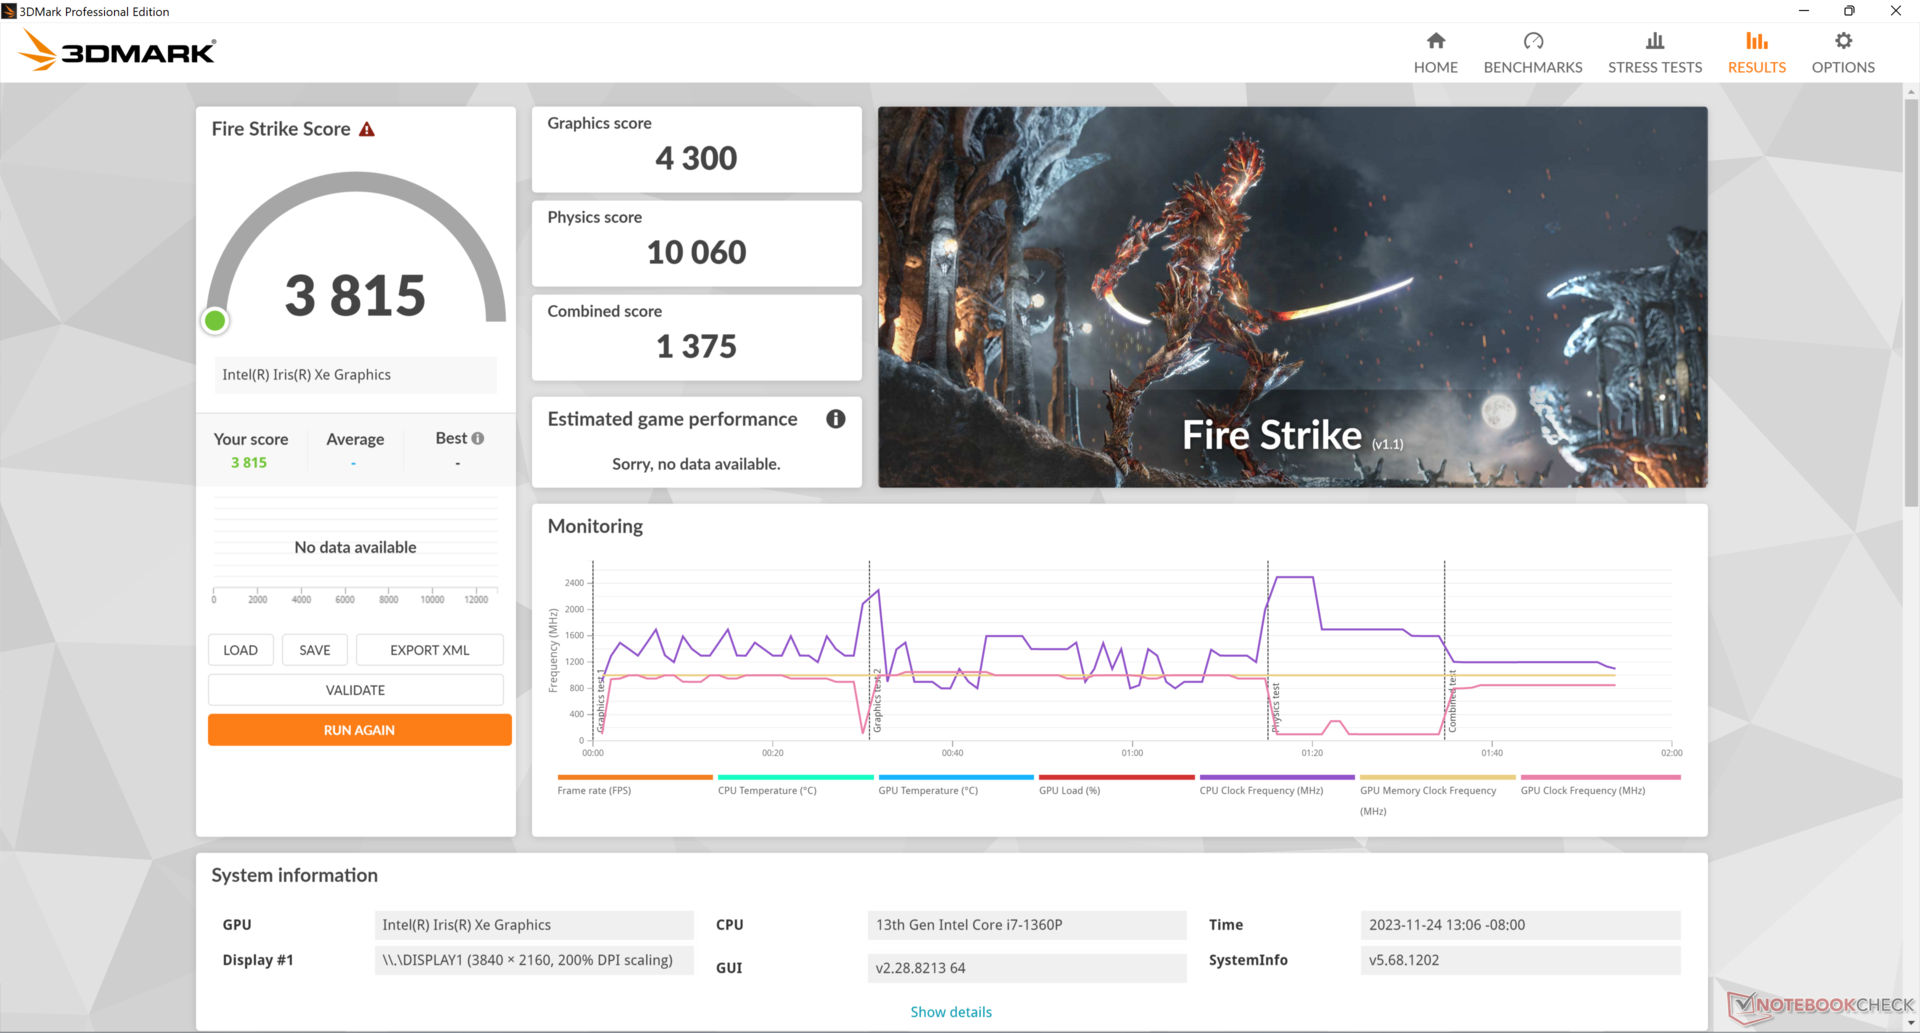
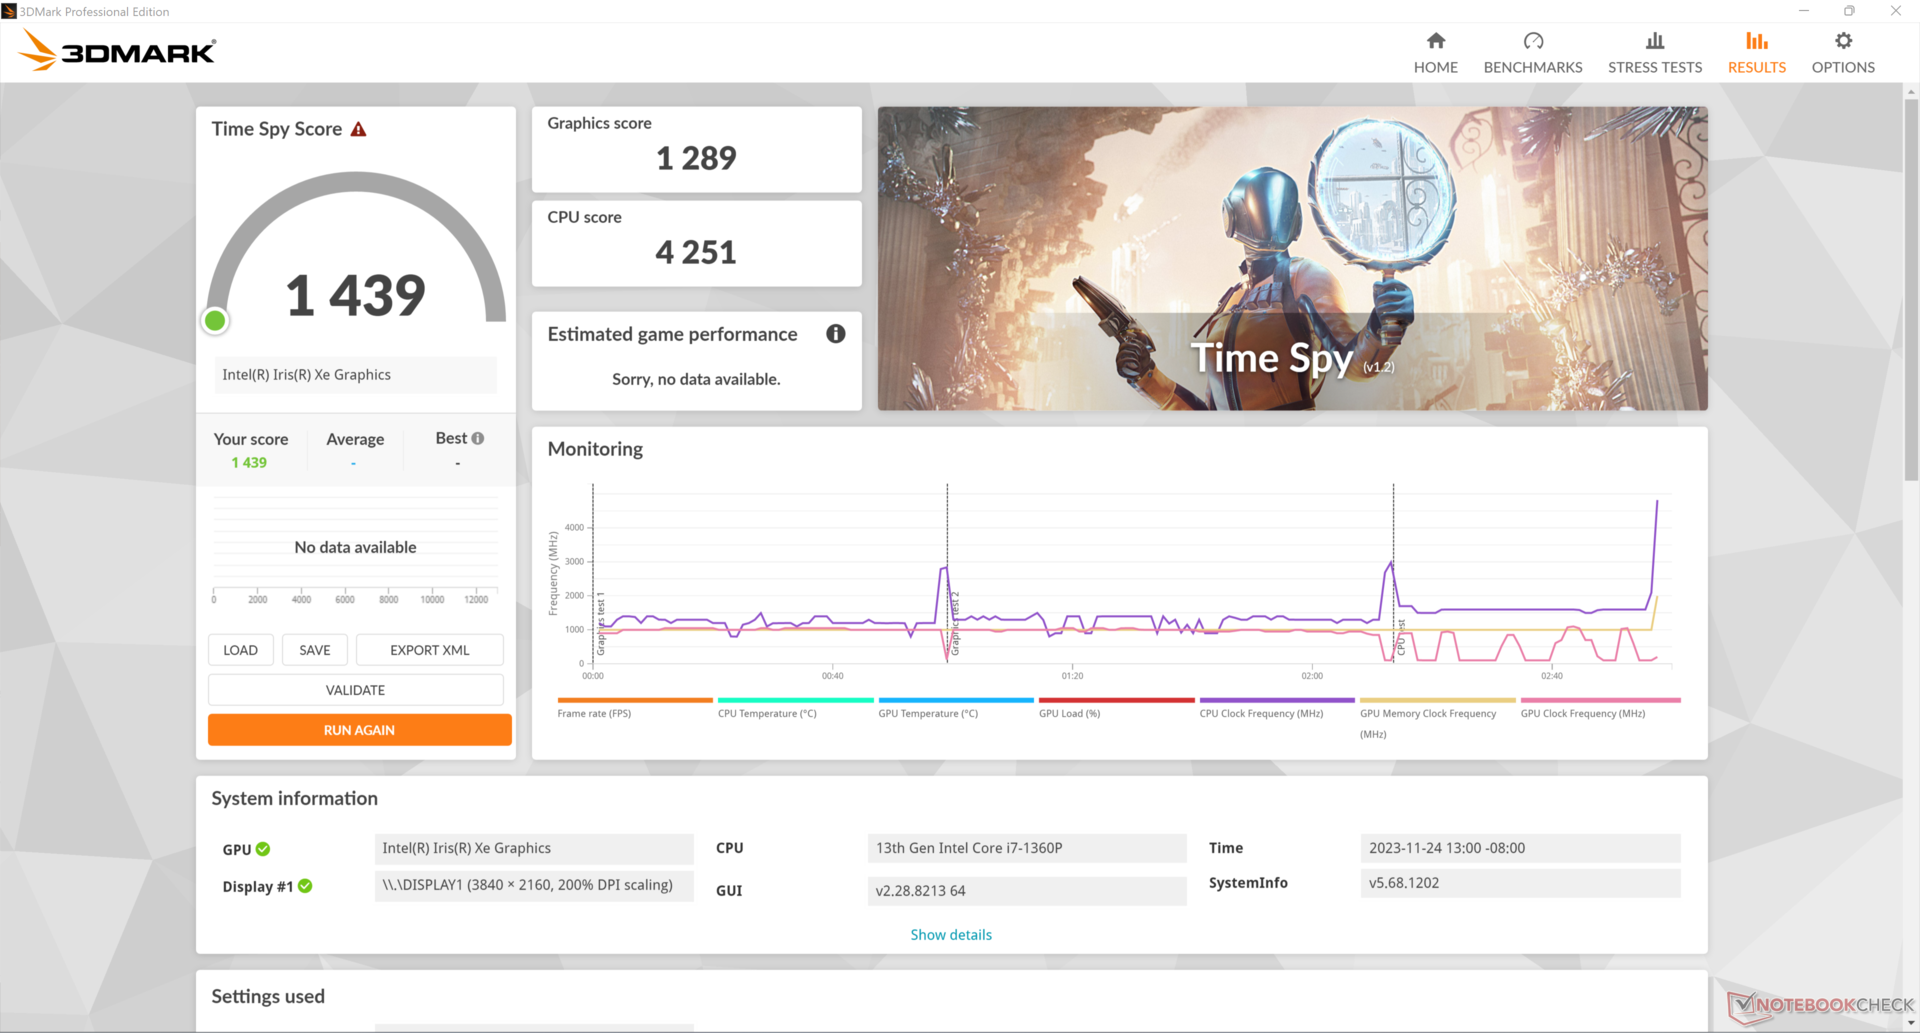
Le système intégré Iris Xe 96 EUs a des performances légèrement inférieures à la moyenne par rapport à d'autres ordinateurs portables équipés du même GPU. En fait, notre Schenker Work 15 avec l'ancien Core i7-11370H obtiendrait de meilleurs scores 3DMark que notre Eurocom malgré leurs GPU similaires.
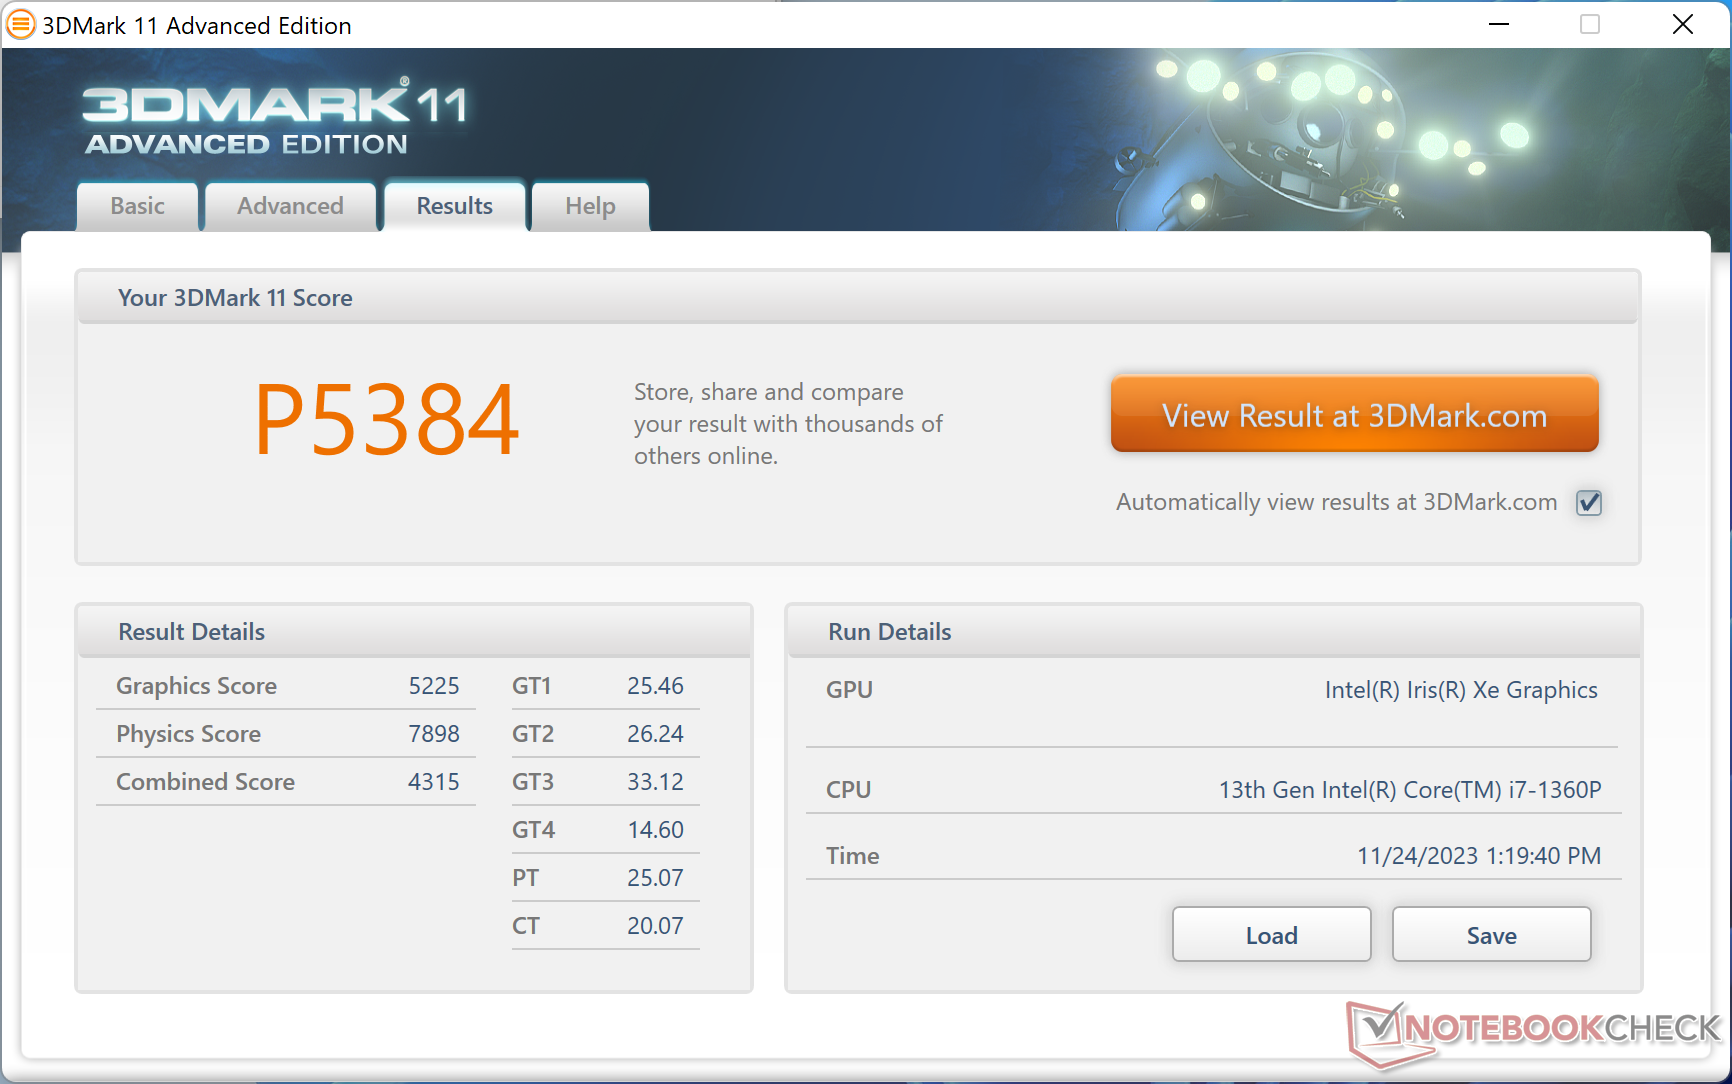
| 3DMark 11 Performance | 5384 points | |
| 3DMark Cloud Gate Standard Score | 15229 points | |
| 3DMark Fire Strike Score | 3815 points | |
| 3DMark Time Spy Score | 1439 points | |
Aide | ||
* ... Moindre est la valeur, meilleures sont les performances
| Tiny Tina's Wonderlands - 1280x720 Lowest Preset (DX12) | |
| Moyenne Intel Iris Xe Graphics G7 96EUs (25.9 - 67.3, n=32) | |
| Eurocom C315 Blitz | |
Witcher 3 FPS Chart
| Bas | Moyen | Élevé | Ultra | |
|---|---|---|---|---|
| GTA V (2015) | 84.7 | 72.7 | 22.5 | 9.68 |
| The Witcher 3 (2015) | 66.7 | 46.9 | 26.3 | 13 |
| Dota 2 Reborn (2015) | 96.8 | 66.3 | 48.6 | 40.9 |
| Final Fantasy XV Benchmark (2018) | 33.4 | 18.8 | 14 | |
| X-Plane 11.11 (2018) | 43.4 | 32.2 | 29.3 | |
| Far Cry 5 (2018) | 36 | 23 | 21 | 20 |
| Strange Brigade (2018) | 76.8 | 34.7 | 28.2 | 23.3 |
| Cyberpunk 2077 1.6 (2022) | 14.1 | |||
| Tiny Tina's Wonderlands (2022) | ||||
| F1 22 (2022) | 38.5 | 34.5 | 25.3 | 19.2 |
Émissions
Bruit du système
Le comportement du bruit du ventilateur doit être amélioré. Lorsqu'il est branché sur le secteur, le ventilateur émet parfois des pulsations entre le silence et 35 dB(A), même lorsqu'il fonctionne au ralenti sur l'ordinateur de bureau en mode d'économie d'énergie. Ce n'est que lorsqu'il fonctionne sur batterie que le ventilateur reste silencieux et n'émet pas de pulsations inutiles. Sinon, le bruit du ventilateur lors de l'exécution de charges exigeantes comme les jeux est presque identique à ce que nous avons observé sur le Schenker Work 15 avec l'ancien CPU Core série H.
Degré de la nuisance sonore
| Au repos |
| 25.1 / 25.1 / 34.9 dB(A) |
| Fortement sollicité |
| 42.1 / 44.2 dB(A) |
 | ||
30 dB silencieux 40 dB(A) audible 50 dB(A) bruyant |
||
min: | ||
| Eurocom C315 Blitz Iris Xe G7 96EUs, i7-1360P, Samsung 990 Pro 1 TB | Schenker Work 15 Tiger Lake-H Iris Xe G7 96EUs, i7-11370H, Samsung SSD 980 Pro 1TB MZ-V8P1T0BW | Lenovo ThinkPad L15 Gen 4 21H70021GE Vega 8, R7 PRO 7730U, SK hynix HFS512GEJ4X113N | Acer Aspire 5 A515-58GM-76S8 GeForce RTX 2050 Mobile, i7-1355U, Micron 2450 1TB MTFDKBA1T0TFK | Asus VivoBook S15 M3502RA-L1029W Radeon 680M, R7 6800H, WD PC SN735 SDBPNHH-512G | Samsung Galaxy Book2 15 A350M, i7-1260P, Samsung PM991 MZVLQ512HBLU | |
|---|---|---|---|---|---|---|
| Noise | 3% | 18% | 2% | -14% | -2% | |
| arrêt / environnement * (dB) | 22.5 | 24.4 -8% | 23.5 -4% | 25.04 -11% | 26 -16% | 24.3 -8% |
| Idle Minimum * (dB) | 25.1 | 24.4 3% | 23.5 6% | 26.3 -5% | 26 -4% | 24.3 3% |
| Idle Average * (dB) | 25.1 | 24.4 3% | 23.5 6% | 26.3 -5% | 26 -4% | 24.3 3% |
| Idle Maximum * (dB) | 34.9 | 26.7 23% | 23.5 33% | 26.3 25% | 28.1 19% | 29.8 15% |
| Load Average * (dB) | 42.1 | 43.8 -4% | 27.5 35% | 32.5 23% | 56.9 -35% | 47.5 -13% |
| Witcher 3 ultra * (dB) | 44.5 | 43.8 2% | 32.7 27% | 46.7 -5% | 47.5 -7% | |
| Load Maximum * (dB) | 44.2 | 44.8 -1% | 32.7 26% | 49 -11% | 62.6 -42% | 47.5 -7% |
* ... Moindre est la valeur, meilleures sont les performances
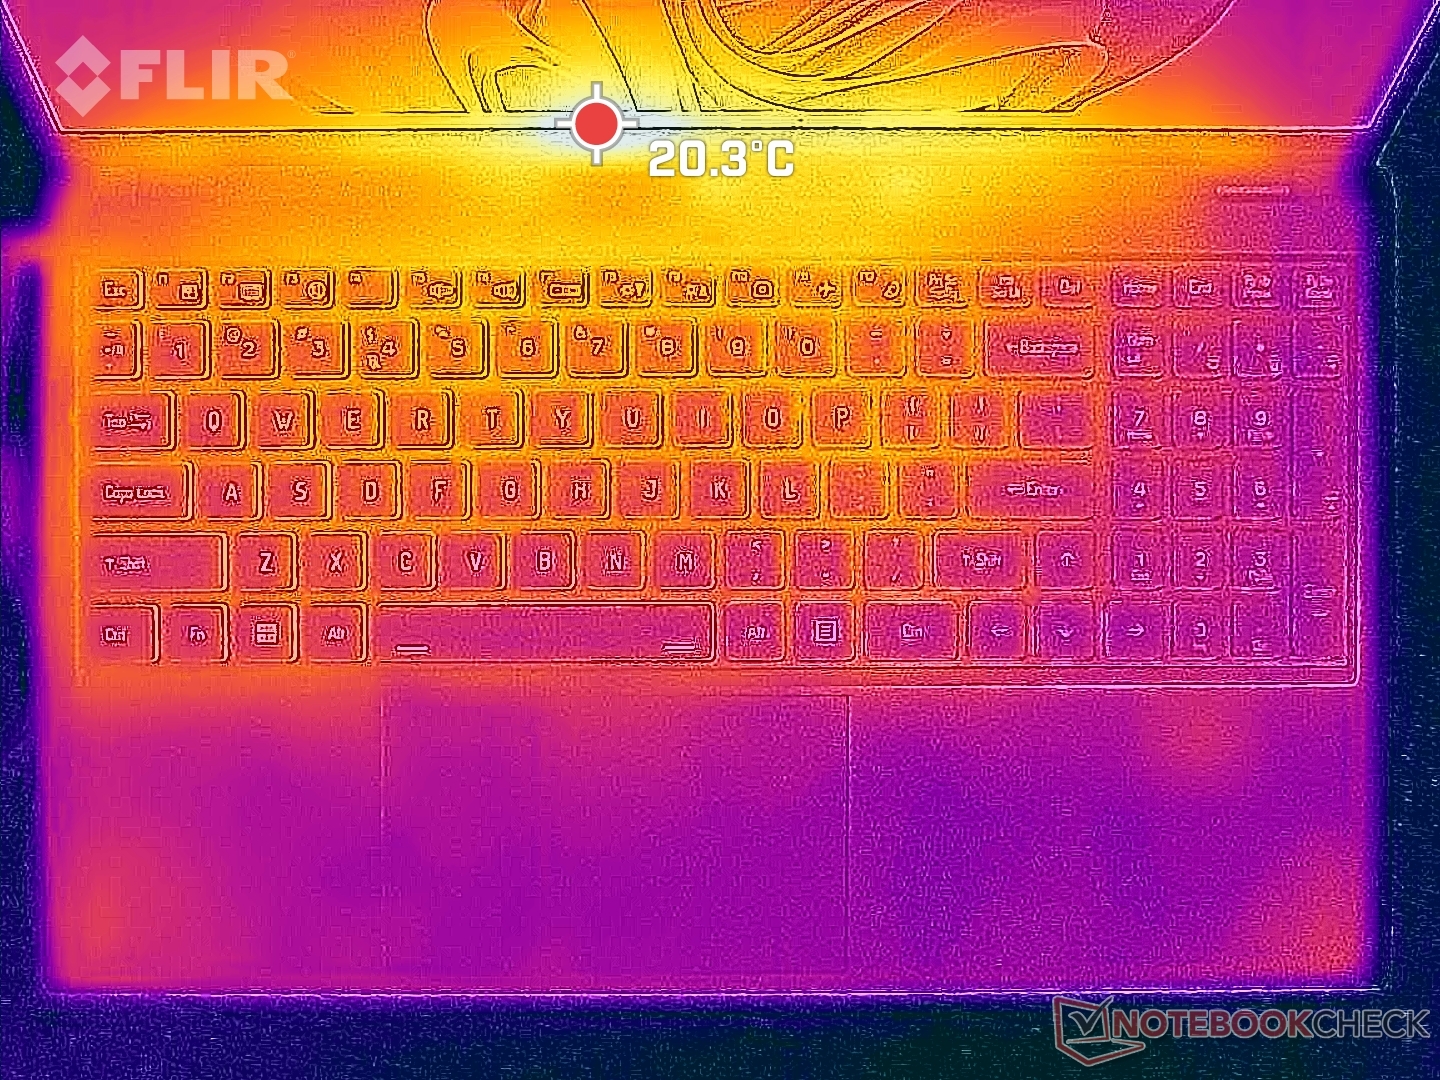
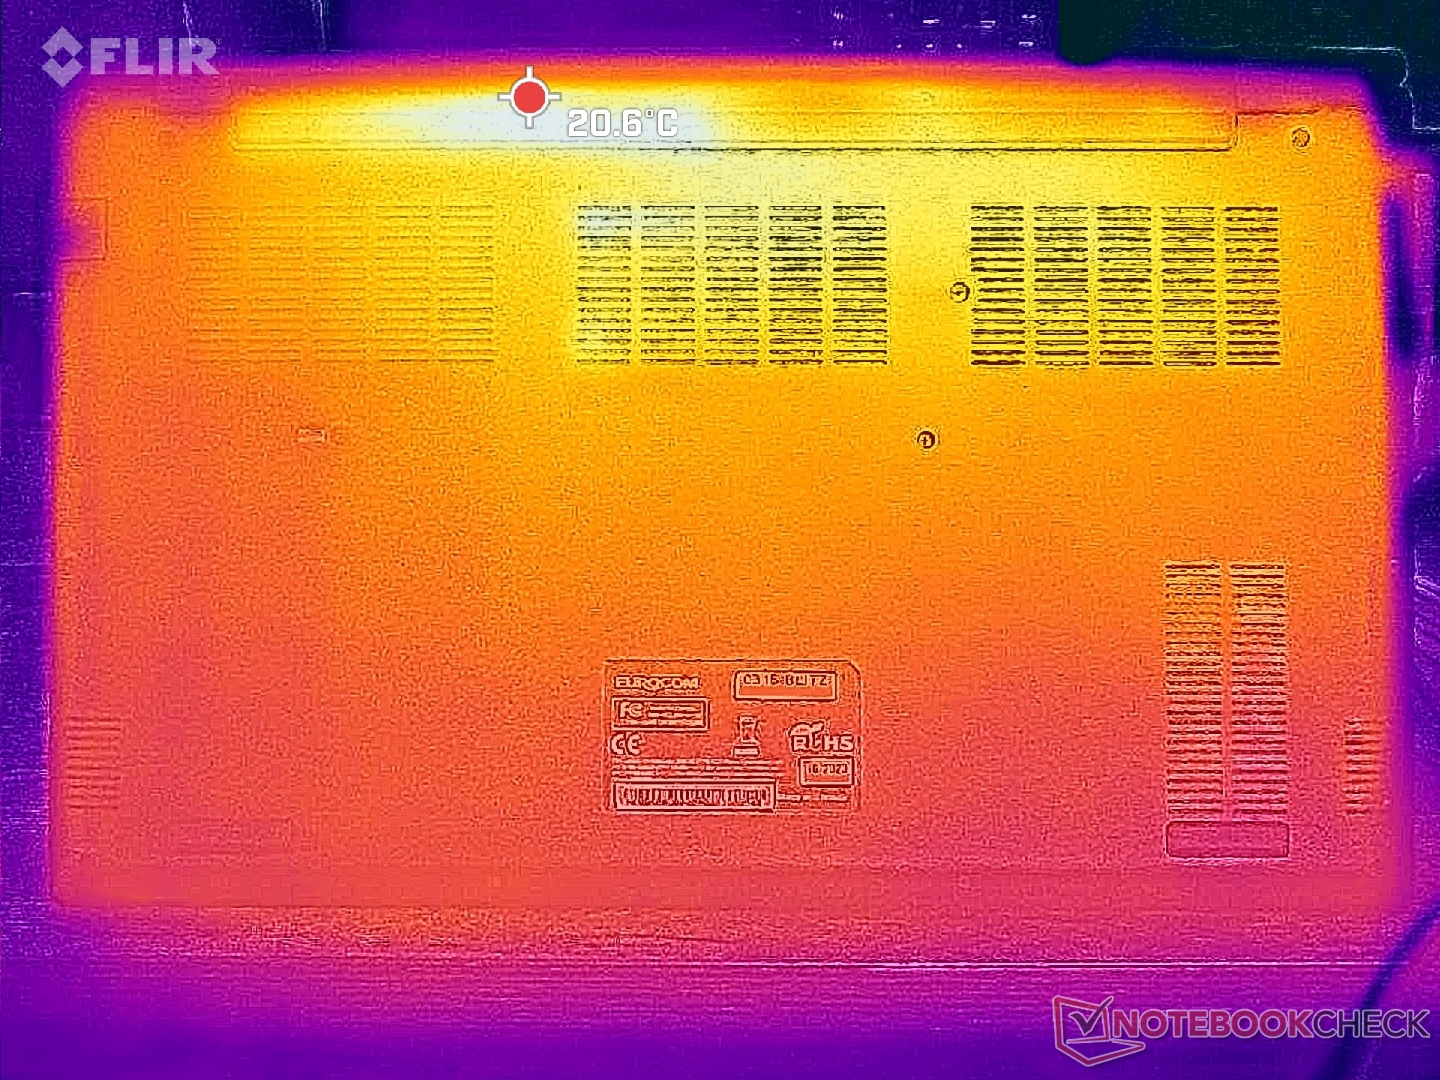
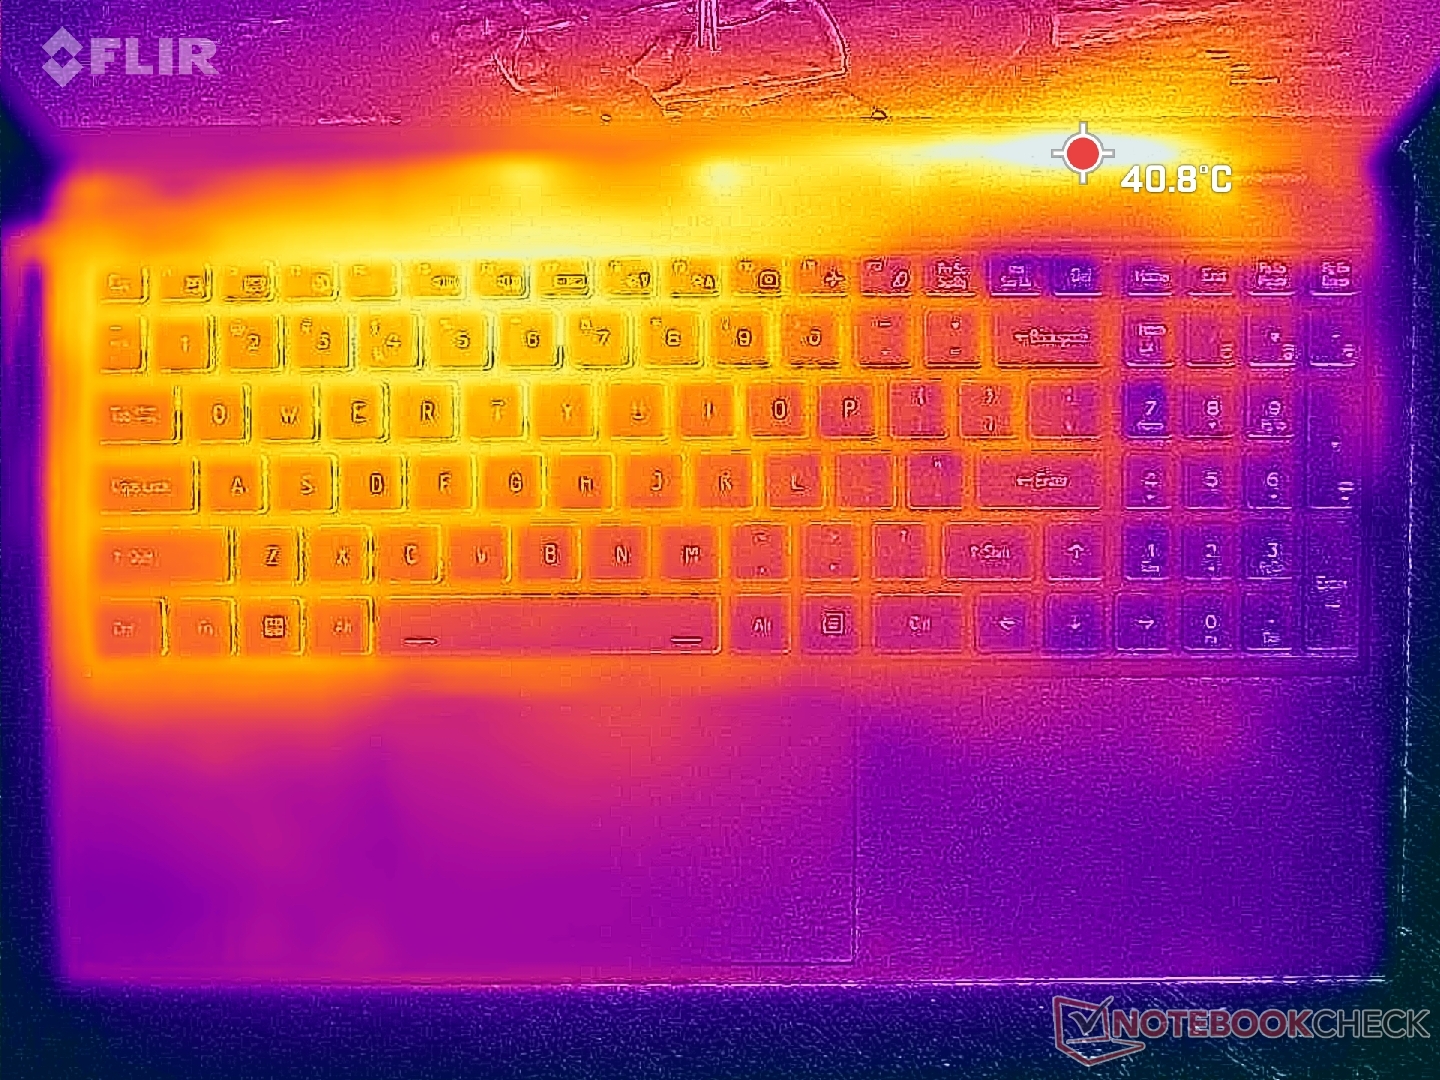
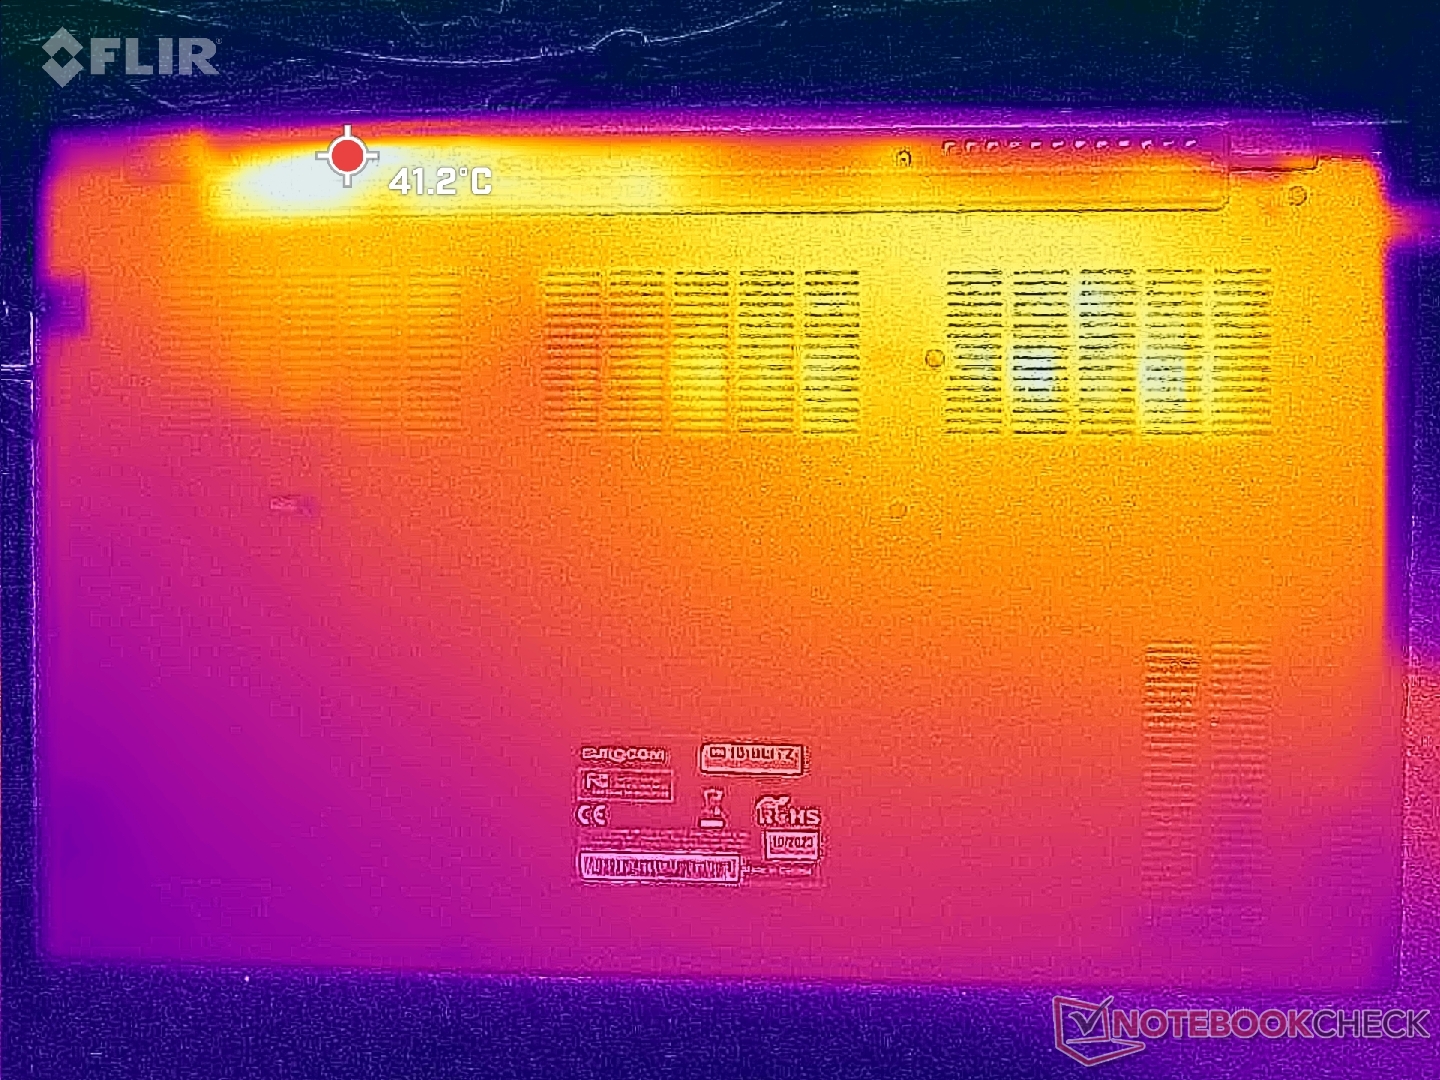
Température
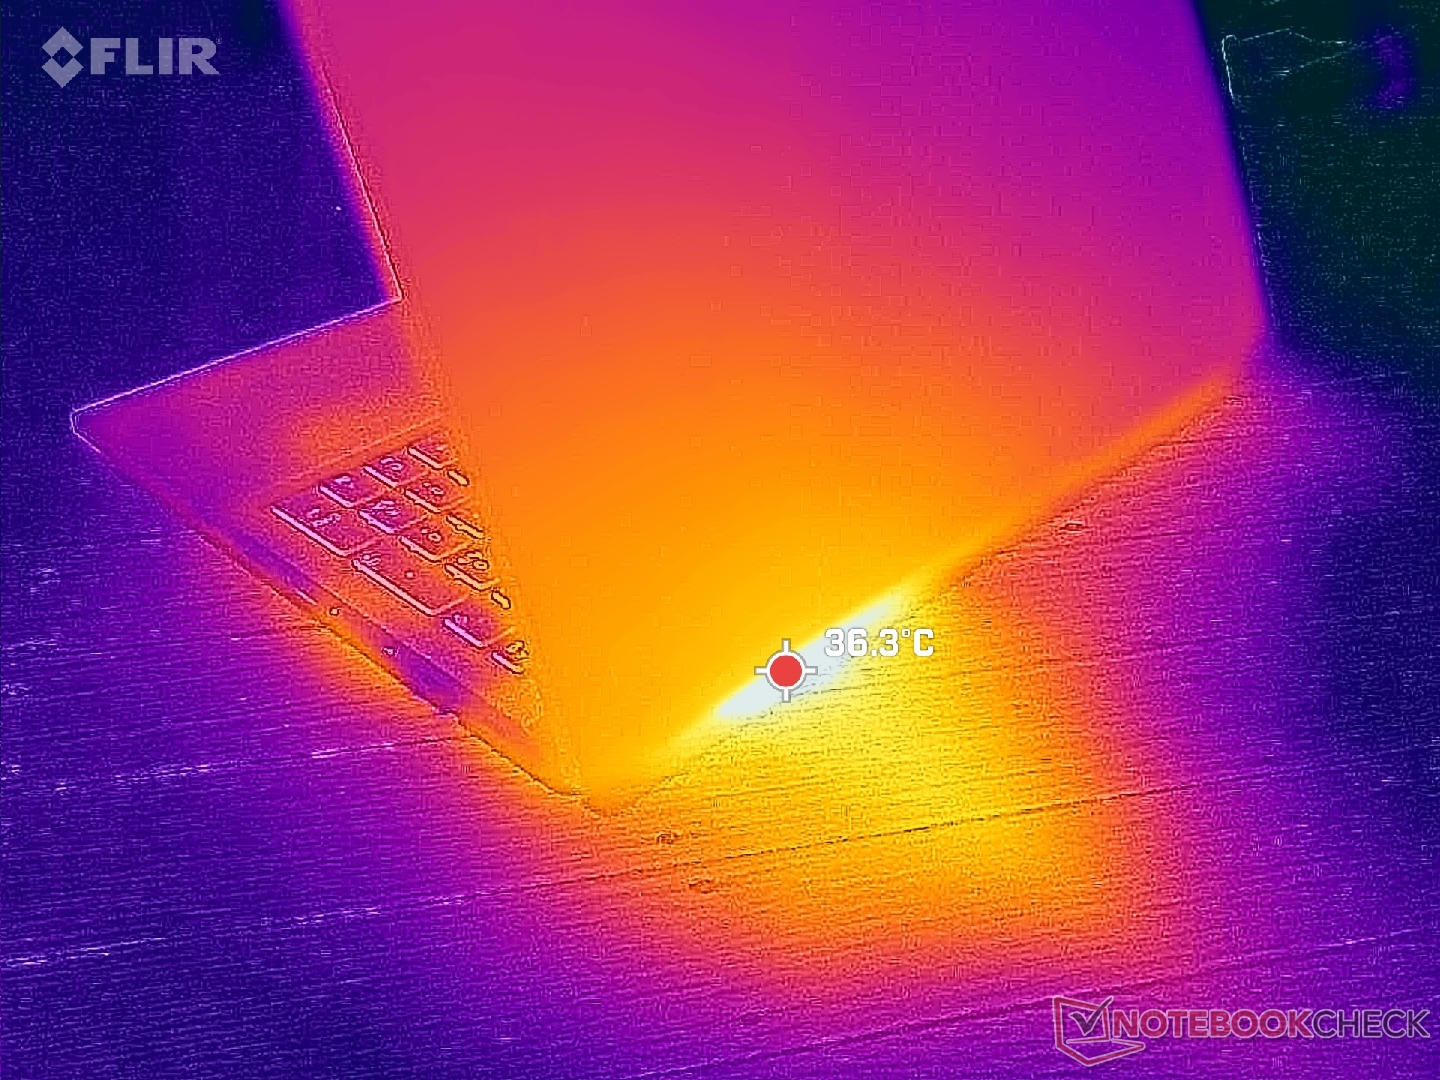
Les températures de surface sont en moyenne un peu plus fraîches que celles observées sur le Schenker Work 15. Lors de l'utilisation de charges exigeantes, par exemple, les points chauds à l'arrière du châssis n'atteignent que 35 à 38°C, contre 43°C sur le Schenker.
(+) La température maximale du côté supérieur est de 35.6 °C / 96 F, par rapport à la moyenne de 34.3 °C / 94 F, allant de 21.2 à 62.5 °C pour la classe Office.
(+) Le fond chauffe jusqu'à un maximum de 37.8 °C / 100 F, contre une moyenne de 36.8 °C / 98 F
(+) En utilisation inactive, la température moyenne du côté supérieur est de 22.8 °C / 73 F, par rapport à la moyenne du dispositif de 29.5 °C / 85 F.
(+) Les repose-poignets et le pavé tactile sont plus froids que la température de la peau avec un maximum de 26.6 °C / 79.9 F et sont donc froids au toucher.
(±) La température moyenne de la zone de l'appui-paume de dispositifs similaires était de 27.5 °C / 81.5 F (+0.9 °C / #1.6 F).
| Eurocom C315 Blitz Intel Core i7-1360P, Intel Iris Xe Graphics G7 96EUs | Schenker Work 15 Tiger Lake-H Intel Core i7-11370H, Intel Iris Xe Graphics G7 96EUs | Lenovo ThinkPad L15 Gen 4 21H70021GE AMD Ryzen 7 PRO 7730U, AMD Radeon RX Vega 8 (Ryzen 4000/5000) | Acer Aspire 5 A515-58GM-76S8 Intel Core i7-1355U, NVIDIA GeForce RTX 2050 Mobile | Asus VivoBook S15 M3502RA-L1029W AMD Ryzen 7 6800H, AMD Radeon 680M | Samsung Galaxy Book2 15 Intel Core i7-1260P, Intel Arc A350M | |
|---|---|---|---|---|---|---|
| Heat | -6% | 0% | -5% | -35% | -15% | |
| Maximum Upper Side * (°C) | 35.6 | 39.1 -10% | 39.1 -10% | 35.7 -0% | 50.2 -41% | 44.6 -25% |
| Maximum Bottom * (°C) | 37.8 | 43.4 -15% | 36.1 4% | 36.8 3% | 50.2 -33% | 47.5 -26% |
| Idle Upper Side * (°C) | 24.2 | 24.3 -0% | 23.1 5% | 27.9 -15% | 32.1 -33% | 25.8 -7% |
| Idle Bottom * (°C) | 26 | 25.1 3% | 25.7 1% | 27.9 -7% | 34.6 -33% | 26.1 -0% |
* ... Moindre est la valeur, meilleures sont les performances
Test de stress
Lors de l'initialisation du stress Prime95, le CPU atteignait 2,4 GHz, 47 W et 85 W pendant quelques secondes avant de redescendre et de se stabiliser à 800 MHz - 1,3 GHz, 15 W et 65 W. La chute brutale des performances correspond aux résultats de la boucle CineBench R15 xT ci-dessus. Nous nous attendions à une meilleure durabilité des performances puisque la série Core P est censée être une étape entre la série U plus lente et la série H plus puissante, mais son comportement dans notre Eurocom est plutôt typique de la plupart des CPU de la série U.
La température du cœur se stabilise autour de 65°C lors de l'exécution de charges exigeantes, contre 78°C sur le Schenker Work 15 avec l'ancien Core i7-11730H.
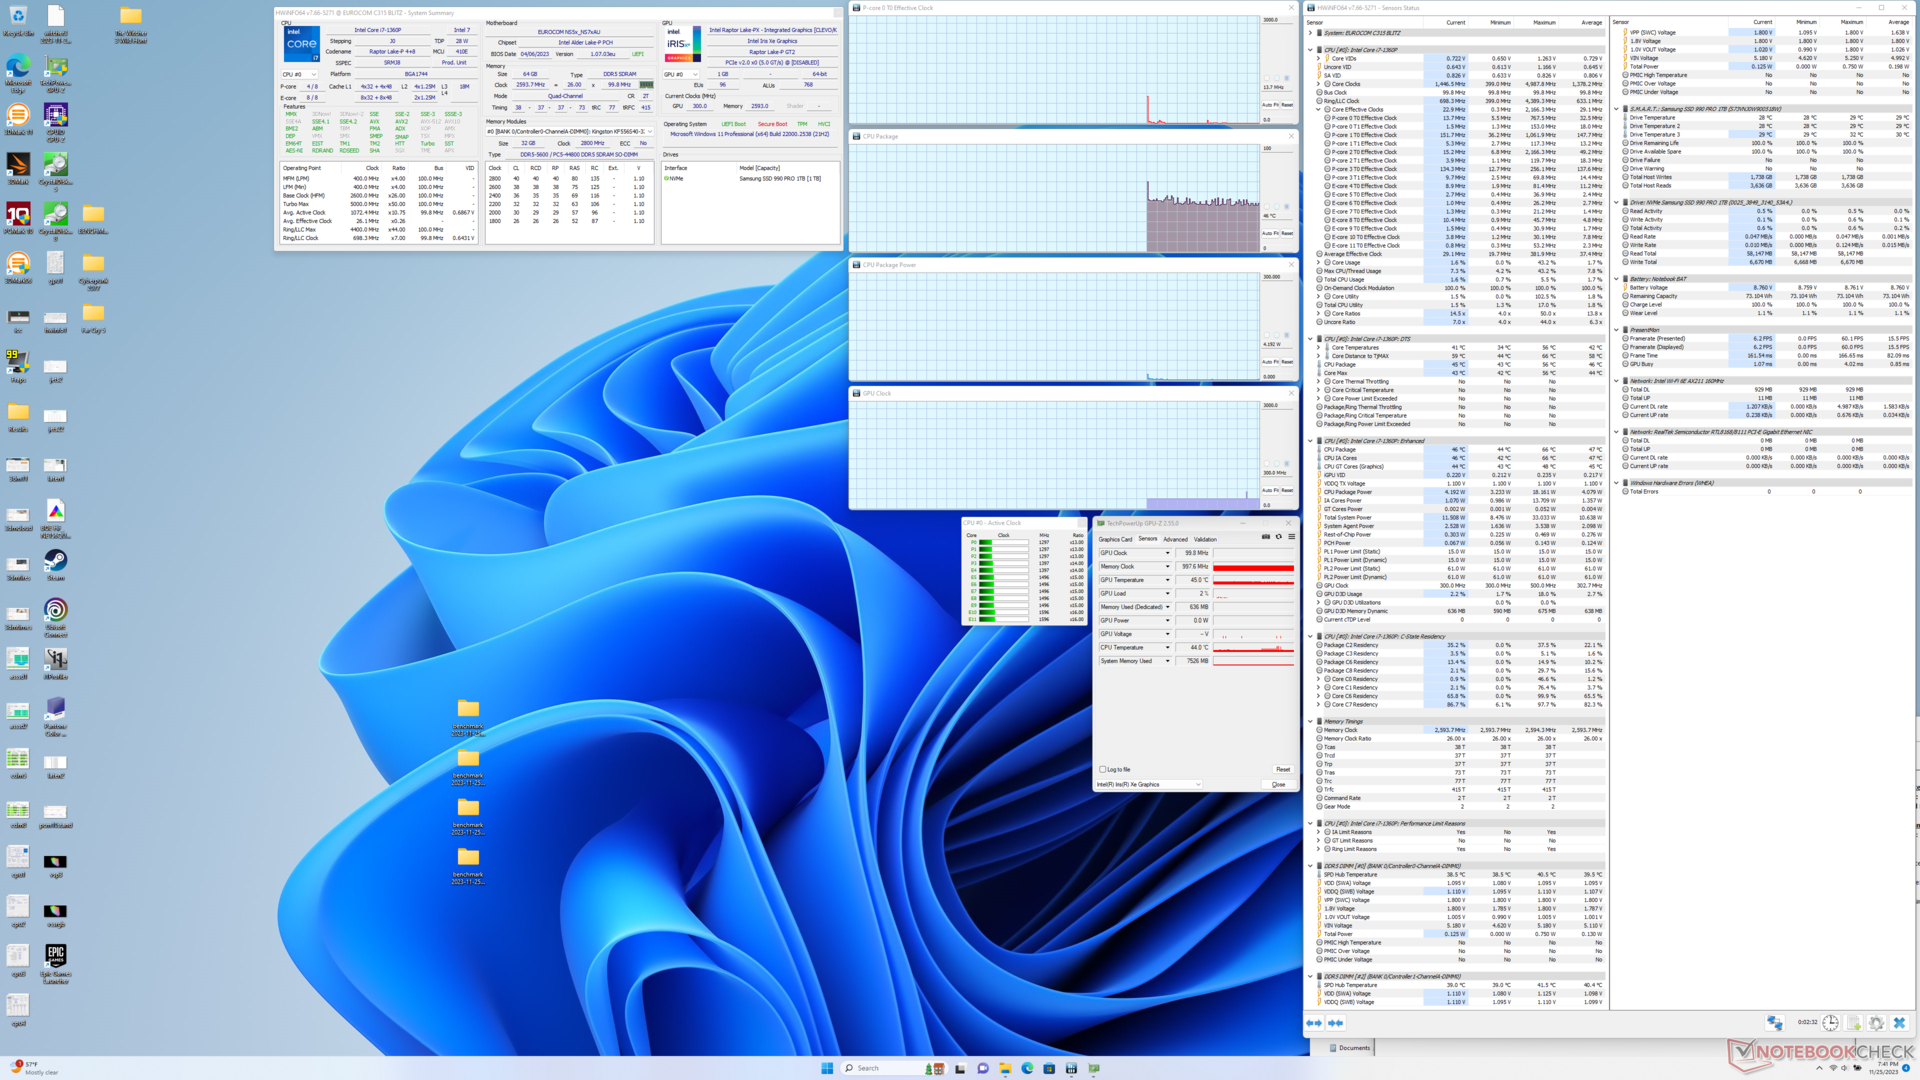
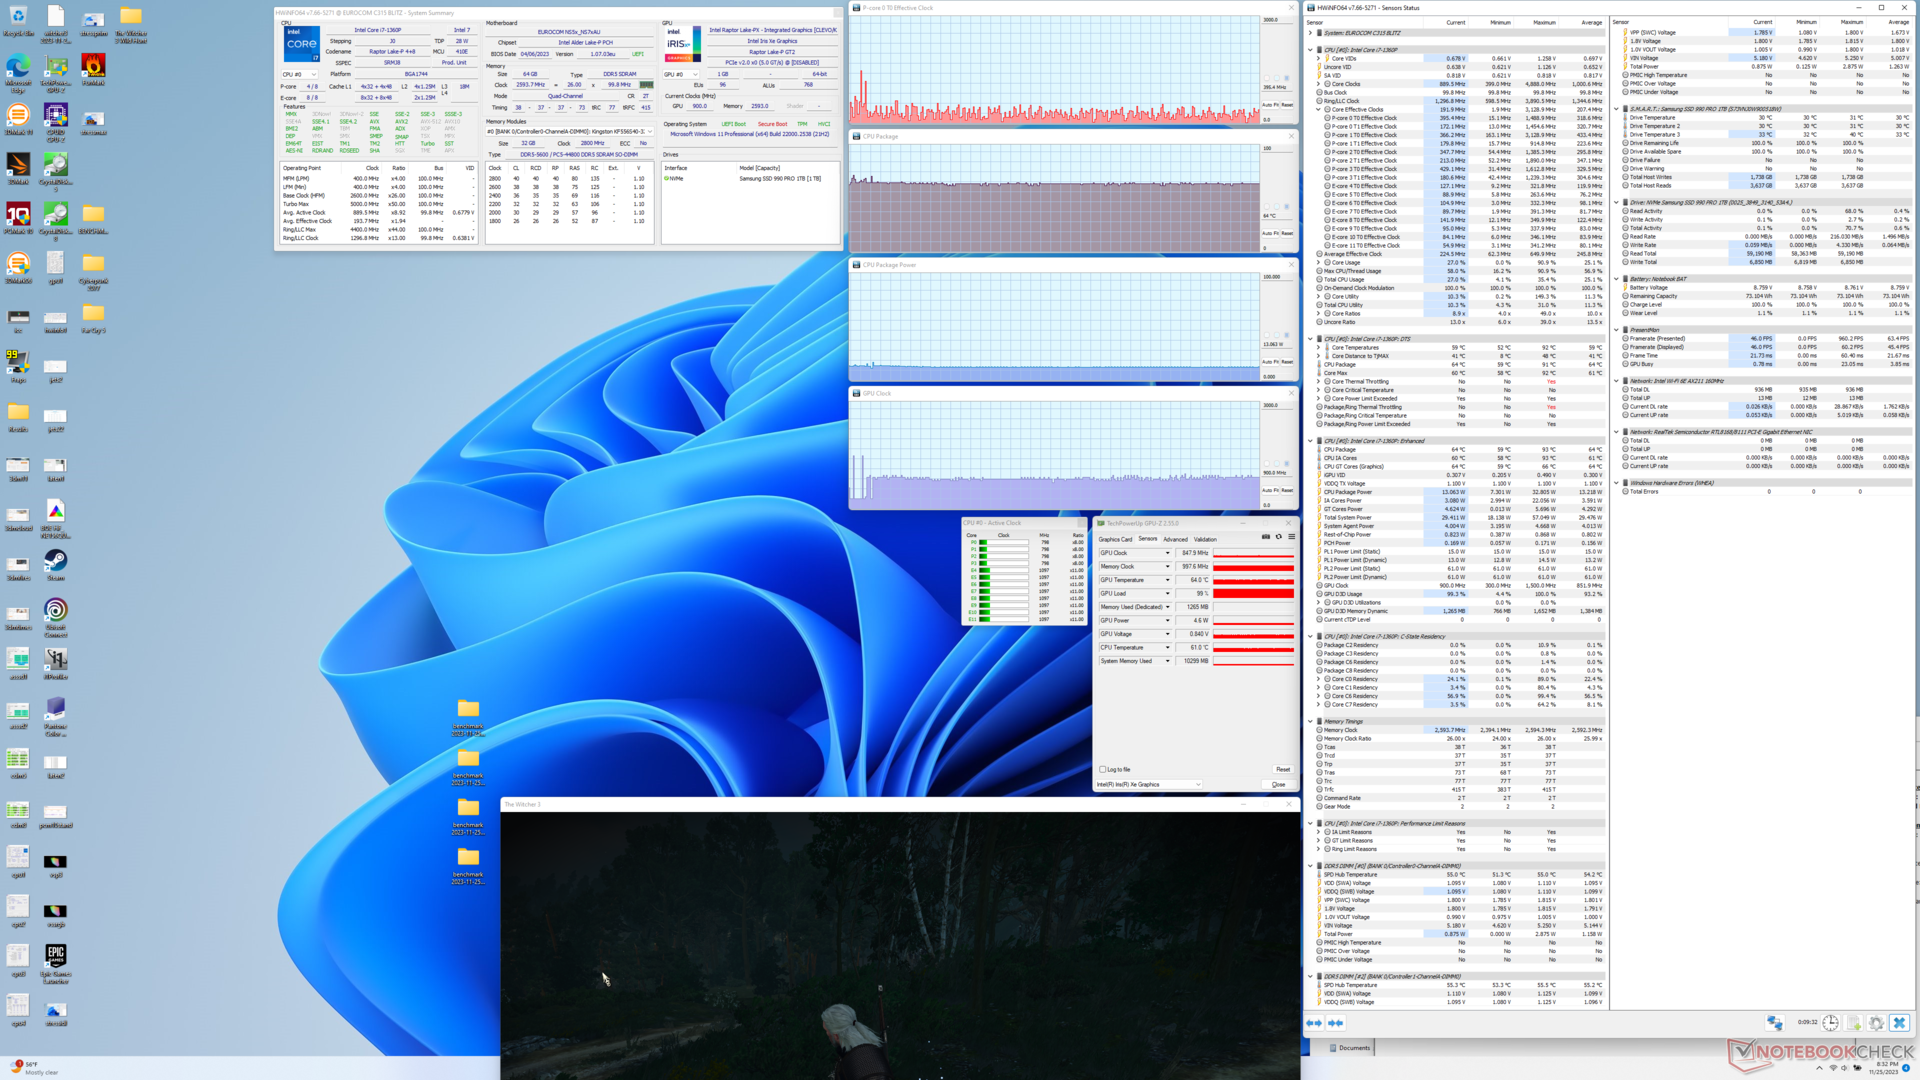
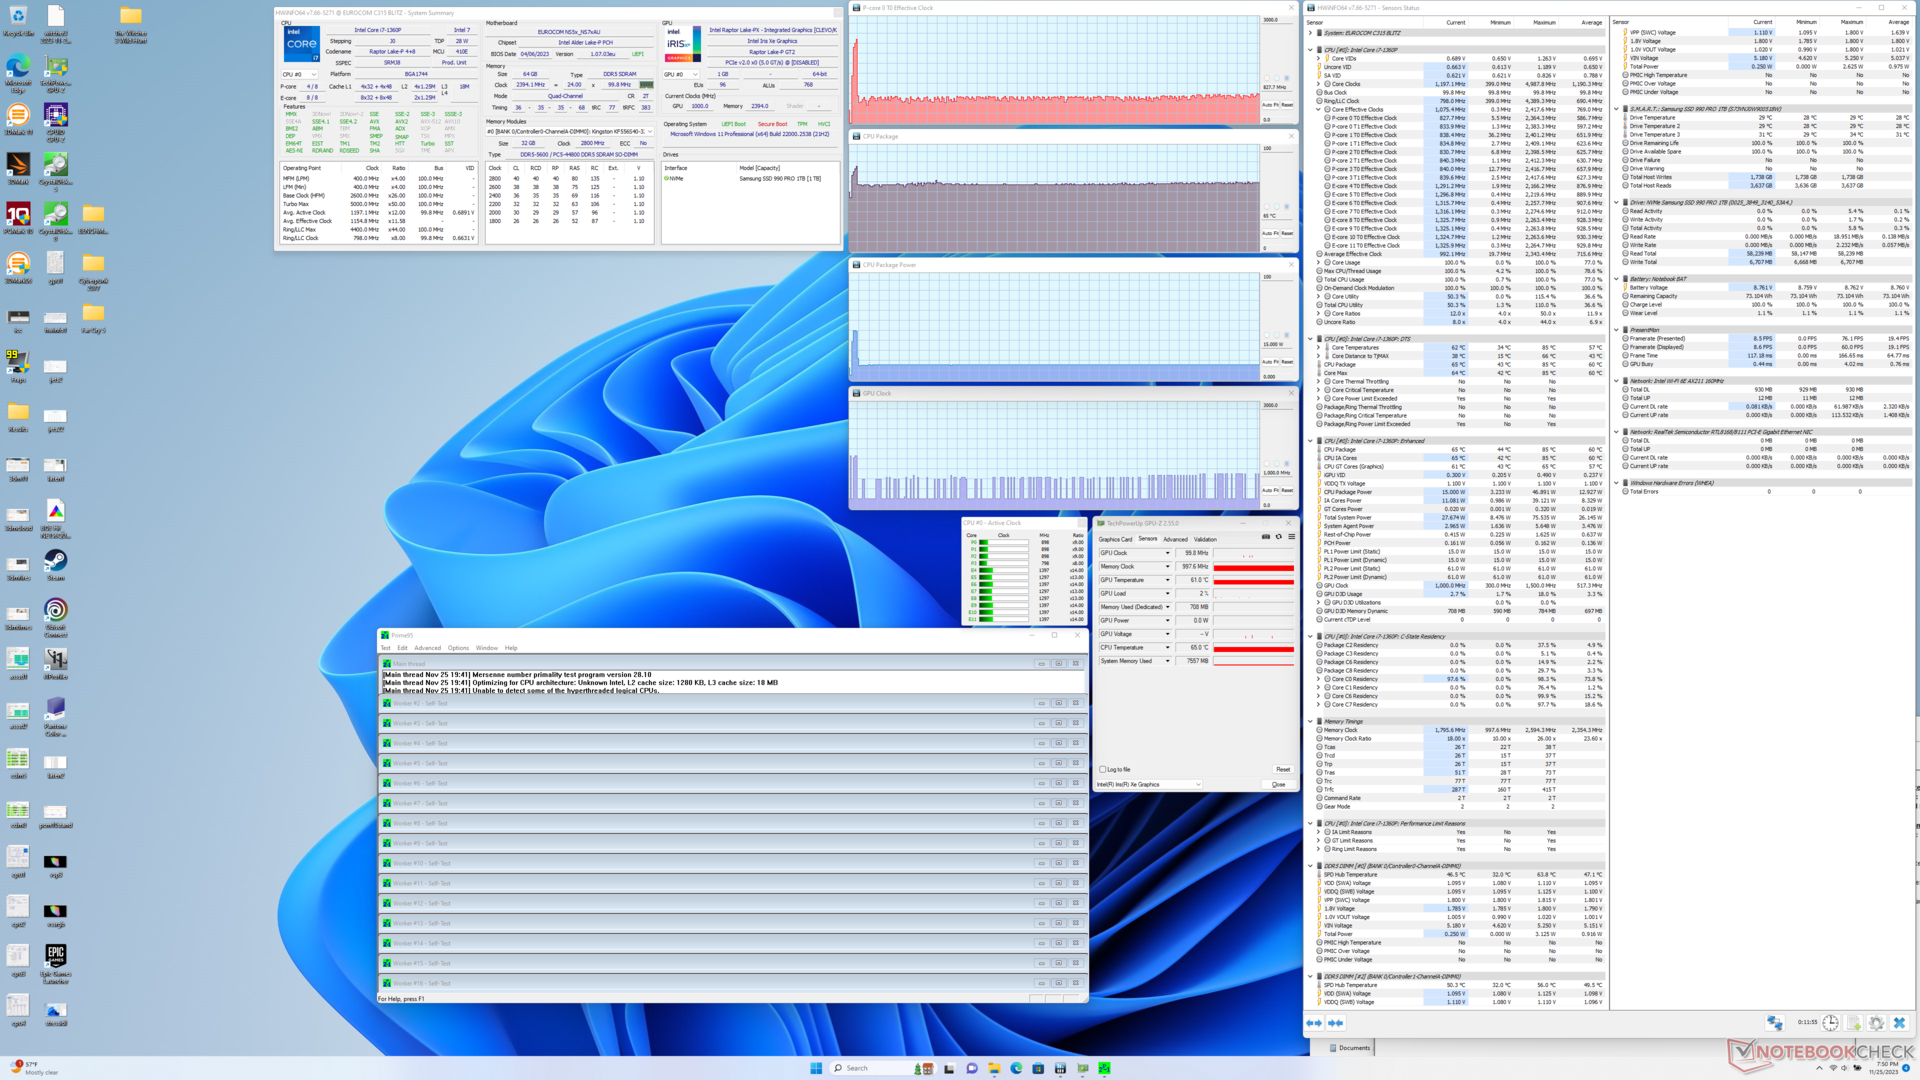
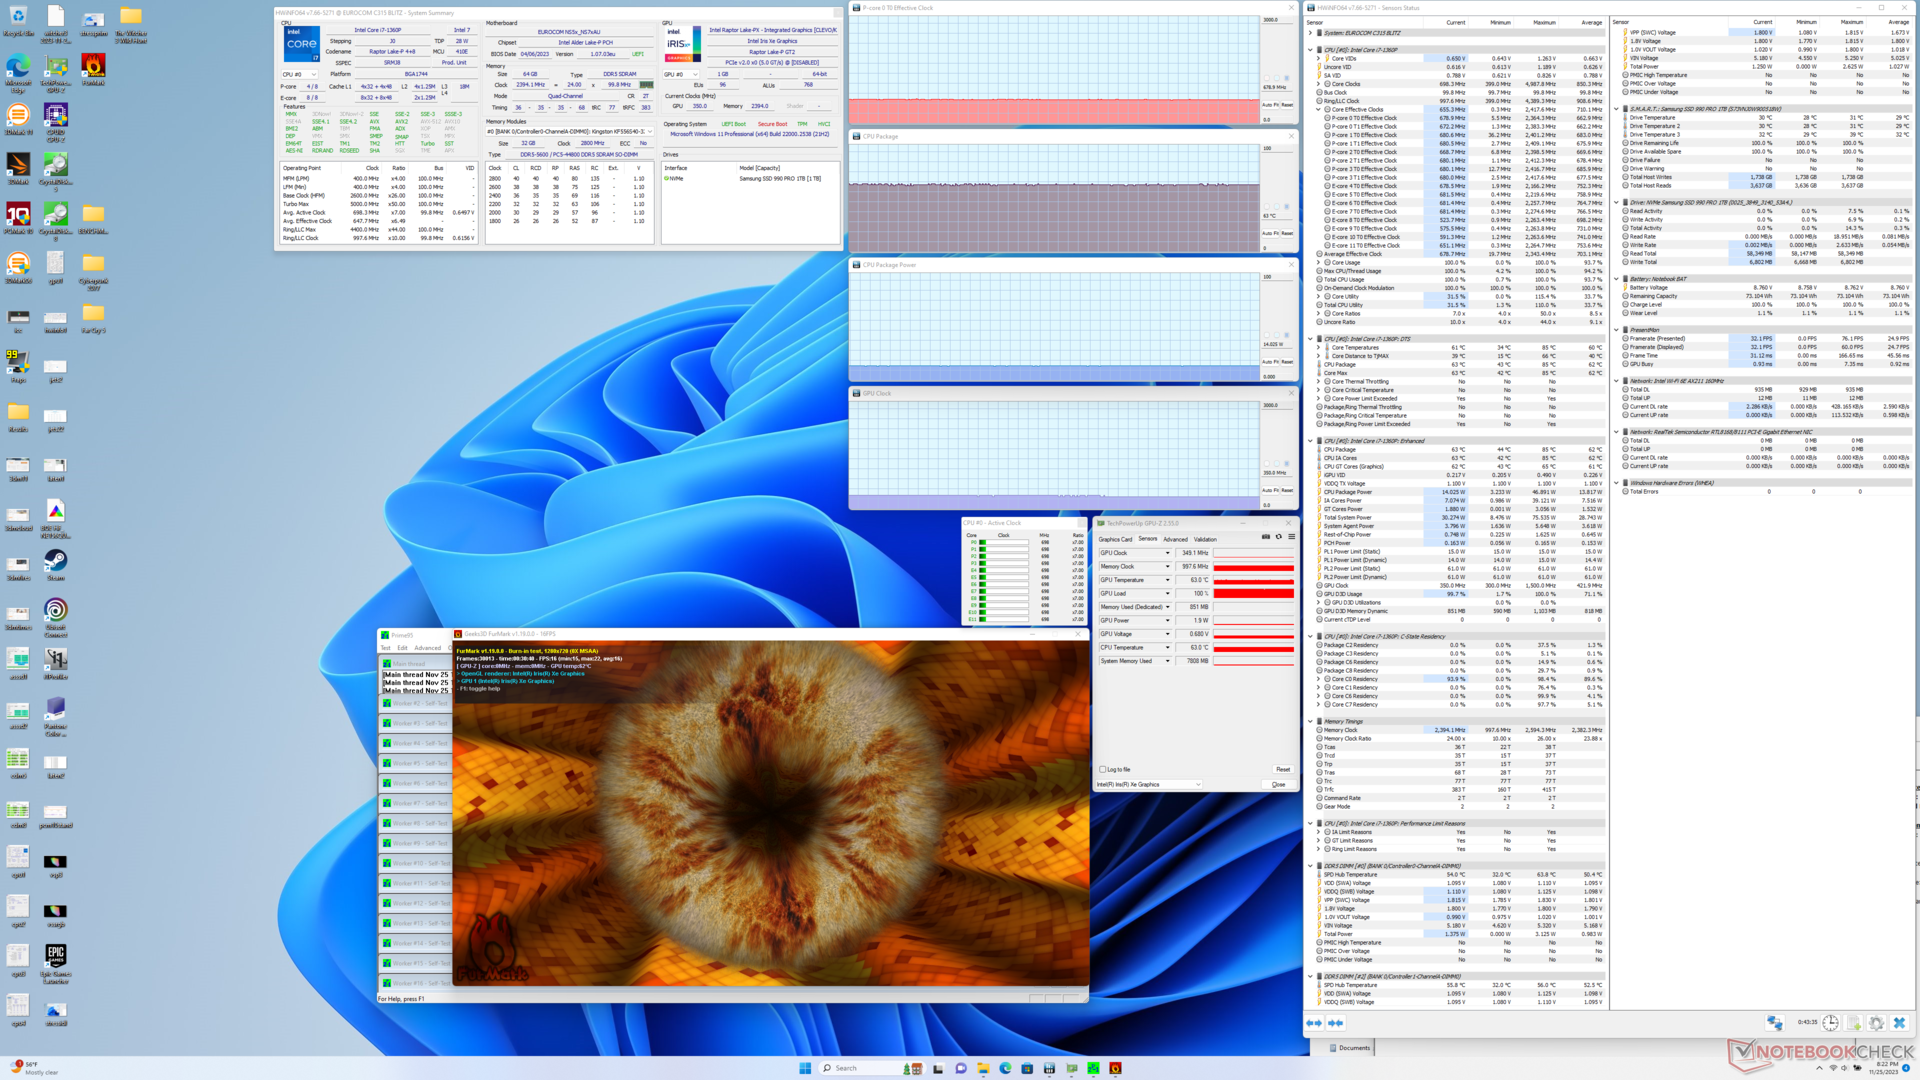
| Horloge du CPU (GHz) | Horloge du GPU (MHz) | Température moyenne du CPU (°C) | |
| Système au repos | -- | -- | 46 |
| Prime95 Stress | 0.7 - 0.8 | -- | 65 |
| Prime95 + FurMark Stress | 0.7 | 350 | 63 |
| Witcher 3 Stress | ~0.4 | 900 | 64 |
Intervenants
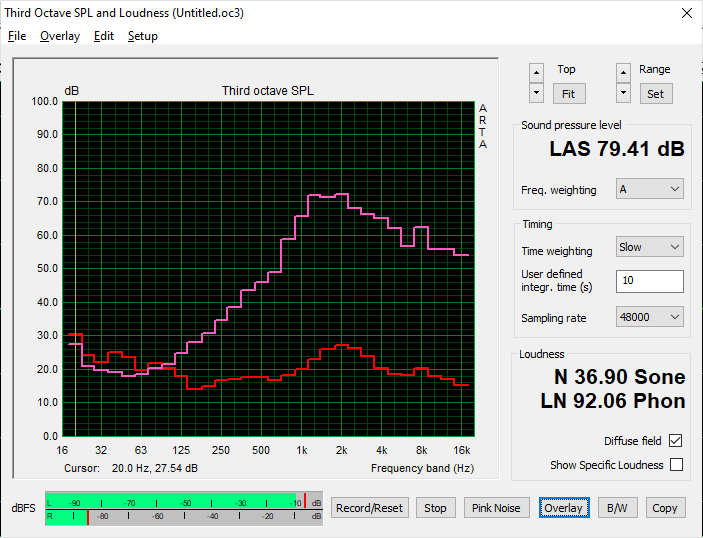
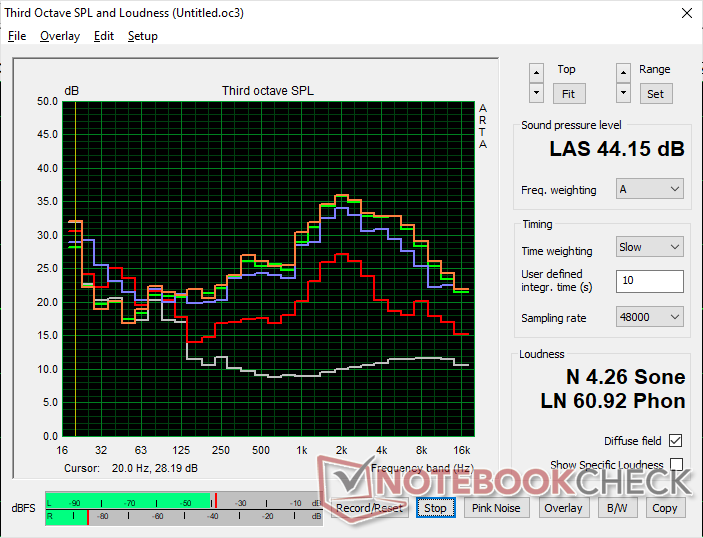
Eurocom C315 Blitz analyse audio
(±) | le niveau sonore du haut-parleur est moyen mais bon (79.4# dB)
Basses 100 - 315 Hz
(-) | presque aucune basse - en moyenne 26.1% plus bas que la médiane
(±) | la linéarité des basses est moyenne (8% delta à la fréquence précédente)
Médiums 400 - 2000 Hz
(±) | médiane supérieure - en moyenne 11.2% supérieure à la médiane
(±) | la linéarité des médiums est moyenne (11.5% delta à la fréquence précédente)
Aiguës 2 - 16 kHz
(±) | sommets plus élevés - en moyenne 6.6% plus élevés que la médiane
(±) | la linéarité des aigus est moyenne (10.4% delta à la fréquence précédente)
Globalement 100 - 16 000 Hz
(-) | le son global n'est pas linéaire (35.6% de différence à la médiane)
Par rapport à la même classe
» 97% de tous les appareils testés de cette catégorie étaient meilleurs, 1% similaires, 2% pires
» Le meilleur avait un delta de 7%, la moyenne était de 21%, le pire était de 53%.
Par rapport à tous les appareils testés
» 94% de tous les appareils testés étaient meilleurs, 1% similaires, 5% pires
» Le meilleur avait un delta de 4%, la moyenne était de 23%, le pire était de 134%.
Apple MacBook Pro 16 2021 M1 Pro analyse audio
(+) | les haut-parleurs peuvent jouer relativement fort (84.7# dB)
Basses 100 - 315 Hz
(+) | bonne basse - seulement 3.8% loin de la médiane
(+) | les basses sont linéaires (5.2% delta à la fréquence précédente)
Médiums 400 - 2000 Hz
(+) | médiane équilibrée - seulement 1.3% de la médiane
(+) | les médiums sont linéaires (2.1% delta à la fréquence précédente)
Aiguës 2 - 16 kHz
(+) | des sommets équilibrés - à seulement 1.9% de la médiane
(+) | les aigus sont linéaires (2.7% delta à la fréquence précédente)
Globalement 100 - 16 000 Hz
(+) | le son global est linéaire (4.6% différence à la médiane)
Par rapport à la même classe
» 0% de tous les appareils testés de cette catégorie étaient meilleurs, 0% similaires, 100% pires
» Le meilleur avait un delta de 5%, la moyenne était de 17%, le pire était de 45%.
Par rapport à tous les appareils testés
» 0% de tous les appareils testés étaient meilleurs, 0% similaires, 100% pires
» Le meilleur avait un delta de 4%, la moyenne était de 23%, le pire était de 134%.
Gestion de l'énergie
Consommation électrique
Le fonctionnement au ralenti sur l'ordinateur de bureau consomme quelques watts de plus que sur le Schenker Work 15, probablement en raison de notre écran 4K à plus haute résolution. Cependant, la consommation serait à peu près la même en moyenne lorsque les charges sont plus élevées, malgré les différences de performances ou de température entre le Core i7-1360P et le Core i7-11370H.
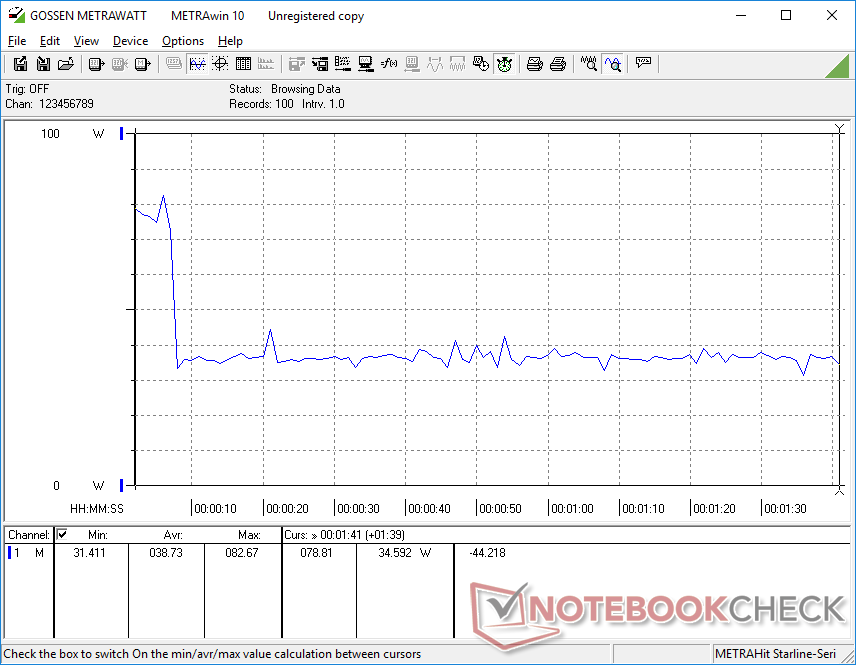
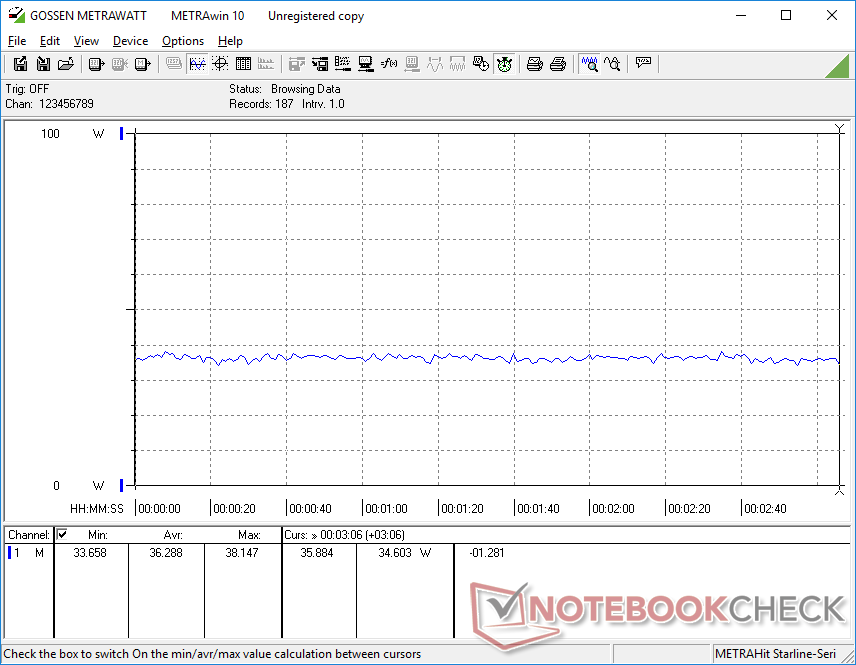
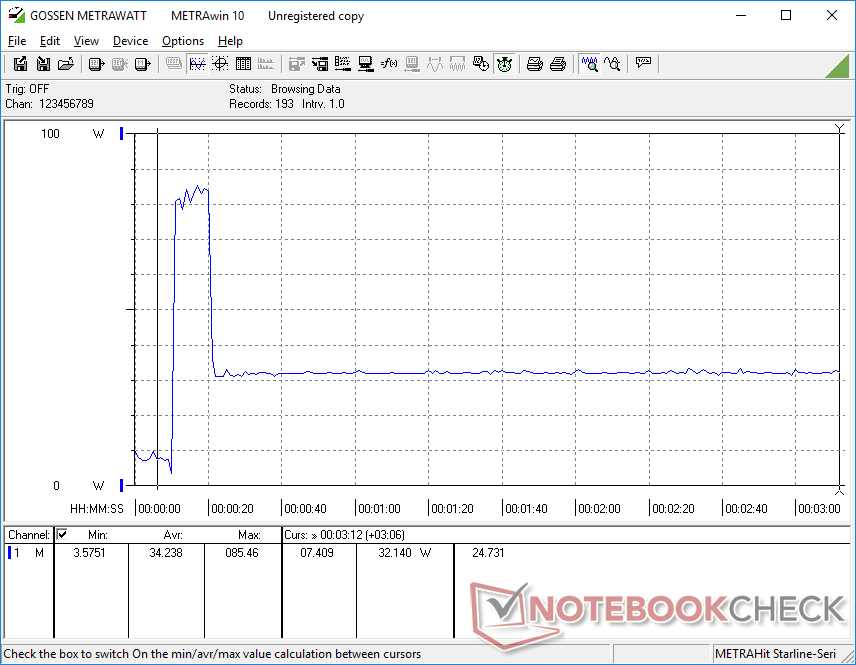
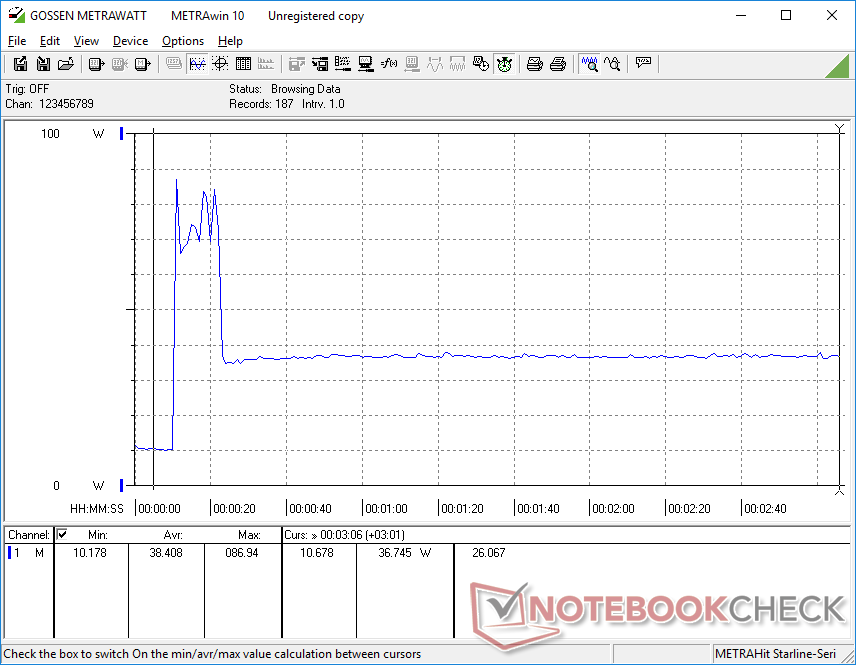
Nous avons pu enregistrer une consommation maximale de 87 W sur le petit adaptateur secteur de 90 W (~12,5 x 4,8 x 3 cm) lorsque le CPU est utilisé à 100 %. Cette demande n'est que temporaire avant que l'étranglement ne se mette en place, comme le montrent nos graphiques de consommation d'énergie ci-dessous.
| Éteint/en veille | |
| Au repos | |
| Fortement sollicité |
|
Légende:
min: | |
| Eurocom C315 Blitz i7-1360P, Iris Xe G7 96EUs, Samsung 990 Pro 1 TB, IPS, 3840x2160, 15.6" | Schenker Work 15 Tiger Lake-H i7-11370H, Iris Xe G7 96EUs, Samsung SSD 980 Pro 1TB MZ-V8P1T0BW, IPS, 1920x1080, 15.6" | Lenovo ThinkPad L15 Gen 4 21H70021GE R7 PRO 7730U, Vega 8, SK hynix HFS512GEJ4X113N, IPS, 1920x1080, 15.6" | Acer Aspire 5 A515-58GM-76S8 i7-1355U, GeForce RTX 2050 Mobile, Micron 2450 1TB MTFDKBA1T0TFK, IPS, 1920x1080, 15.6" | Asus VivoBook S15 M3502RA-L1029W R7 6800H, Radeon 680M, WD PC SN735 SDBPNHH-512G, OLED, 1920x1080, 15.6" | Samsung Galaxy Book2 15 i7-1260P, A350M, Samsung PM991 MZVLQ512HBLU, IPS, 1920x1080, 15.6" | |
|---|---|---|---|---|---|---|
| Power Consumption | 18% | 22% | -6% | -5% | 6% | |
| Idle Minimum * (Watt) | 9.4 | 4.5 52% | 4.5 52% | 4.31 54% | 4.4 53% | 4 57% |
| Idle Average * (Watt) | 11.5 | 8.5 26% | 8.5 26% | 6.52 43% | 5.1 56% | 7.8 32% |
| Idle Maximum * (Watt) | 12.1 | 9.1 25% | 10.5 13% | 8.037 34% | 9.3 23% | 8.5 30% |
| Load Average * (Watt) | 38.7 | 43.5 -12% | 35.6 8% | 75.2 -94% | 67 -73% | 59.1 -53% |
| Witcher 3 ultra * (Watt) | 36.3 | 37.5 -3% | 37.4 -3% | 60.8 -67% | 66.4 -83% | 56.7 -56% |
| Load Maximum * (Watt) | 87 | 69.4 20% | 57.9 33% | 89.5 -3% | 93.5 -7% | 62.4 28% |
* ... Moindre est la valeur, meilleures sont les performances
Power Consumption Witcher 3 / Stresstest
Power Consumption external Monitor
Autonomie de la batterie
L'autonomie du réseau local sans fil est nettement inférieure à celle de l'ancien Schenker Work 15, de plus de 2 heures. Cet écart peut être attribué à notre écran 4K à plus haute résolution. Notre processeur Core-P atteindrait également des fréquences d'horloge et des niveaux de consommation plus élevés que l'ancien Core i7 de 11e génération, ce qui aurait un impact encore plus important sur l'autonomie de la batterie.
Il faut un peu plus de 90 minutes pour recharger l'ordinateur de sa batterie vide à sa pleine capacité.
| Eurocom C315 Blitz i7-1360P, Iris Xe G7 96EUs, 73 Wh | Schenker Work 15 Tiger Lake-H i7-11370H, Iris Xe G7 96EUs, 73 Wh | Lenovo ThinkPad L15 Gen 4 21H70021GE R7 PRO 7730U, Vega 8, 57 Wh | Acer Aspire 5 A515-58GM-76S8 i7-1355U, GeForce RTX 2050 Mobile, 48 Wh | Asus VivoBook S15 M3502RA-L1029W R7 6800H, Radeon 680M, 70 Wh | Samsung Galaxy Book2 15 i7-1260P, A350M, 54 Wh | |
|---|---|---|---|---|---|---|
| Autonomie de la batterie | 27% | 49% | 9% | 44% | 2% | |
| WiFi v1.3 (h) | 8 | 10.2 27% | 11.9 49% | 8.7 9% | 11.5 44% | 8.2 2% |
| Reader / Idle (h) | 24.5 | 25.1 | ||||
| H.264 (h) | 9.6 | 9.5 | 6.6 | 12.8 | 10.6 | |
| Load (h) | 2.2 | 2.2 | 2 | 1 | 1.5 |
Points positifs
Points négatifs
Verdict - Les performances du processeur pourraient être améliorées
Le Core i7-1360P permet de distinguer l'Eurocom C315 Blitz de la plupart des autres ordinateurs portables, car cette option de processeur est assez rare. Malheureusement, le processeur est trop sollicité sur l'Eurocom au point que les performances globales peuvent être identiques à celles du Core i7-11370H ou même plus lentes que celles du Core i5-1340P, moins cher. LeLG Gram 2-en-1 16qui est livré avec la même option Core i7-1360P, est capable de faire fonctionner le CPU jusqu'à 80 % plus vite que notre Eurocom.
L'Eurocom C315 Blitz est freiné par le processeur Core i7-1360P et le manque d'options d'affichage.
D'autres aspects importants du modèle manquent de fonctionnalités. La dalle 4K, par exemple, n'offre pas de couleurs DCI-P3, de taux de rafraîchissement élevé ou de support HDR que certains professionnels ou utilisateurs multimédias pourraient apprécier. L'autonomie de la batterie et la qualité de la webcam sont également moyennes ou décevantes.
La base du Clevo X170KM aurait certainement besoin d'une cure de rajeunissement avec un réglage des performances, un réglage du bruit du ventilateur et des fonctions d'affichage supplémentaires, surtout si vous considérez le prix de départ de 1300 USD. La gamme de 1000 à 1500 dollars est déjà extrêmement compétitive dans cet espace avec des options professionnelles comme le Lenovo ThinkPad L15, HP ProBook, ou la série Dell Latitude.
Prix et disponibilité
Eurocom livre maintenant le C315 Blitz le C315 Blitz à partir de $1300 USD pour la configuration de base jusqu'à plus de $2500 s'il est configuré avec 64 GB de RAM et un SSD de 1 TB comme le nôtre.
Eurocom C315 Blitz
- 11/29/2023 v7 (old)
Allen Ngo
Transparency
La sélection des appareils à examiner est effectuée par notre équipe éditoriale. L'échantillon de test a été prêté à l'auteur par le fabricant ou le détaillant pour les besoins de cet examen. Le prêteur n'a pas eu d'influence sur cette évaluation et le fabricant n'a pas reçu de copie de cette évaluation avant sa publication. Il n'y avait aucune obligation de publier cet article. En tant que média indépendant, Notebookcheck n'est pas soumis à l'autorité des fabricants, des détaillants ou des éditeurs.
Voici comment Notebookcheck teste
Chaque année, Notebookcheck examine de manière indépendante des centaines d'ordinateurs portables et de smartphones en utilisant des procédures standardisées afin de garantir que tous les résultats sont comparables. Nous avons continuellement développé nos méthodes de test depuis environ 20 ans et avons établi des normes industrielles dans le processus. Dans nos laboratoires de test, des équipements de mesure de haute qualité sont utilisés par des techniciens et des rédacteurs expérimentés. Ces tests impliquent un processus de validation en plusieurs étapes. Notre système d'évaluation complexe repose sur des centaines de mesures et de points de référence bien fondés, ce qui garantit l'objectivité.Price comparison

