Test de l'Eurocom RX315 : l'alternative au GS66 Stealth de MSI
")
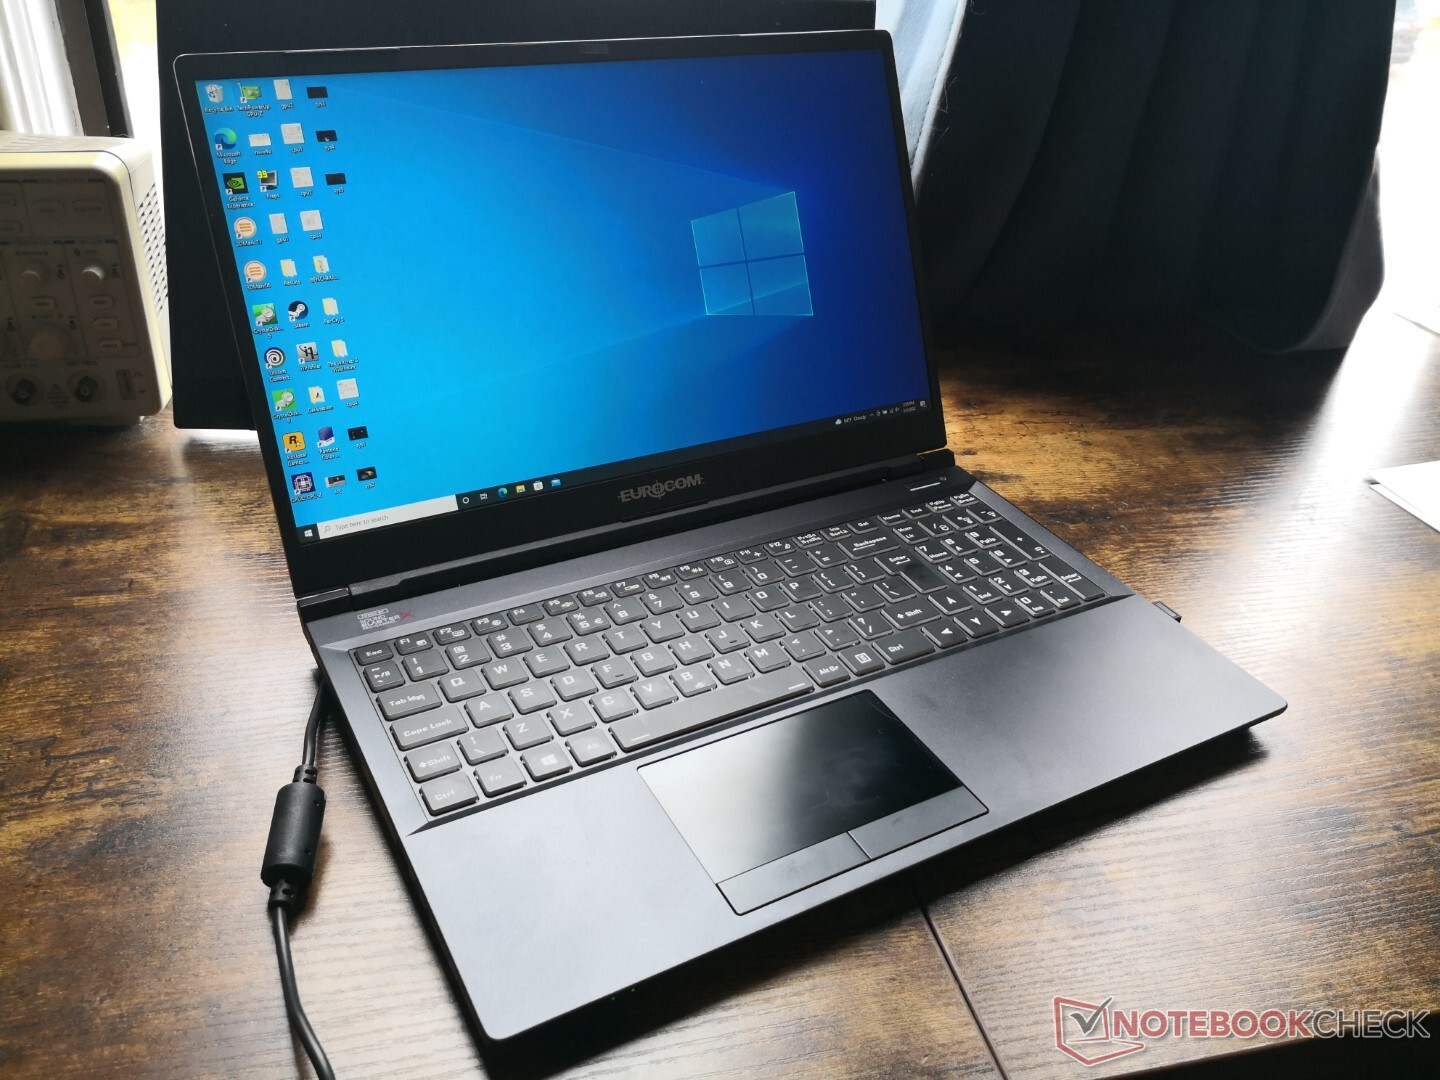
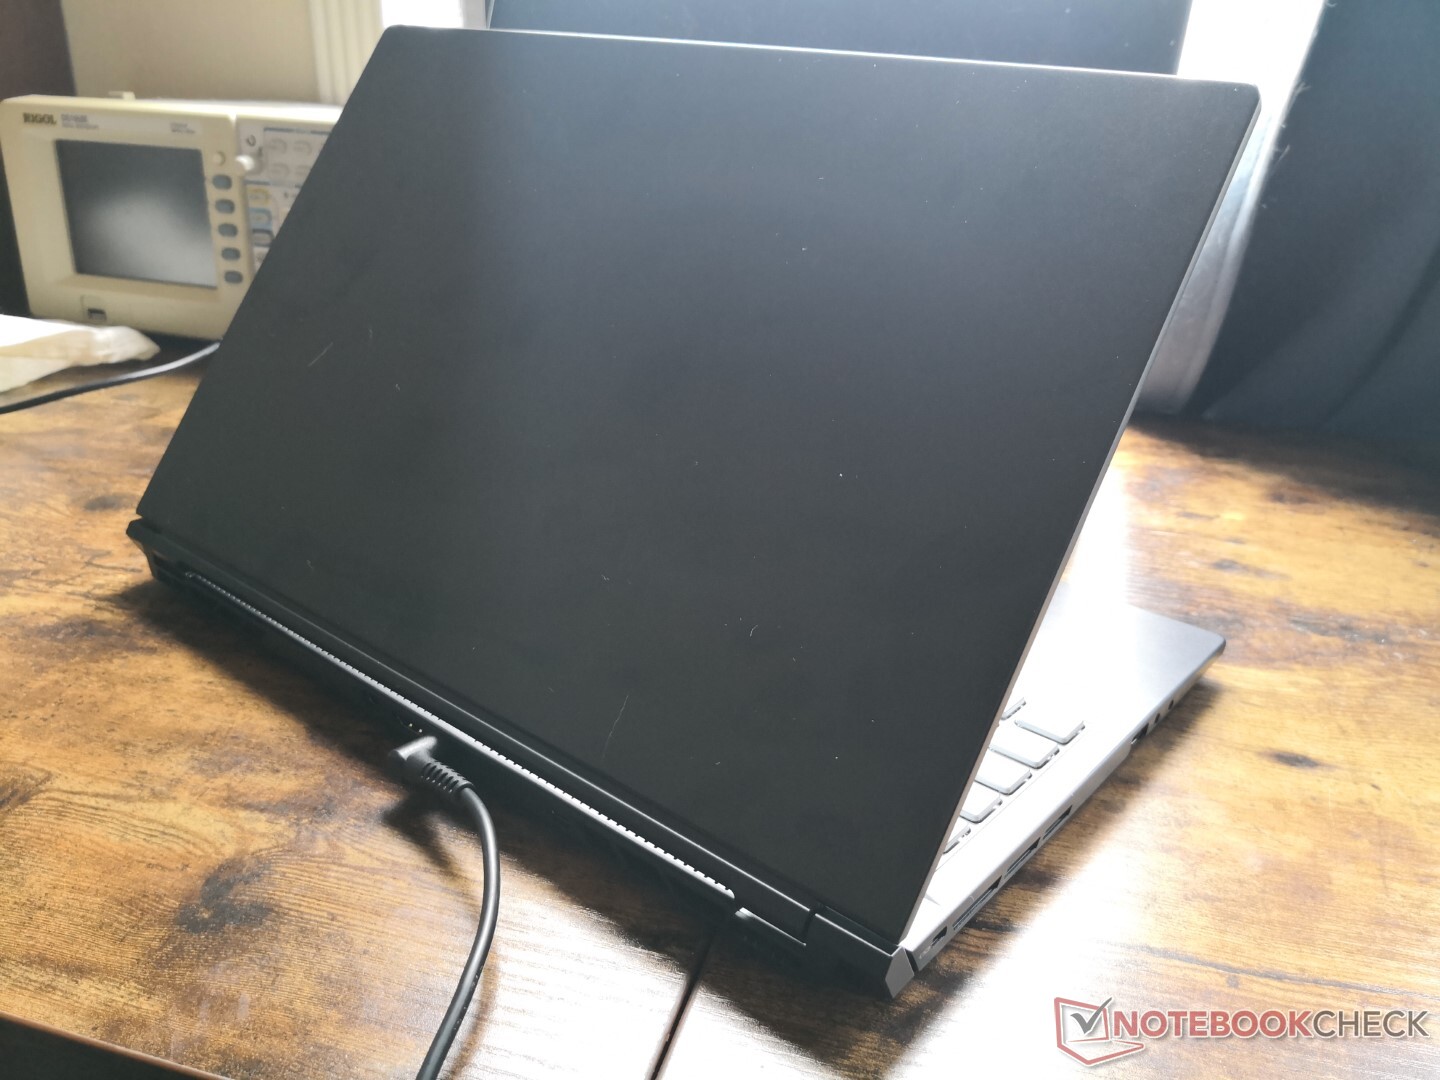
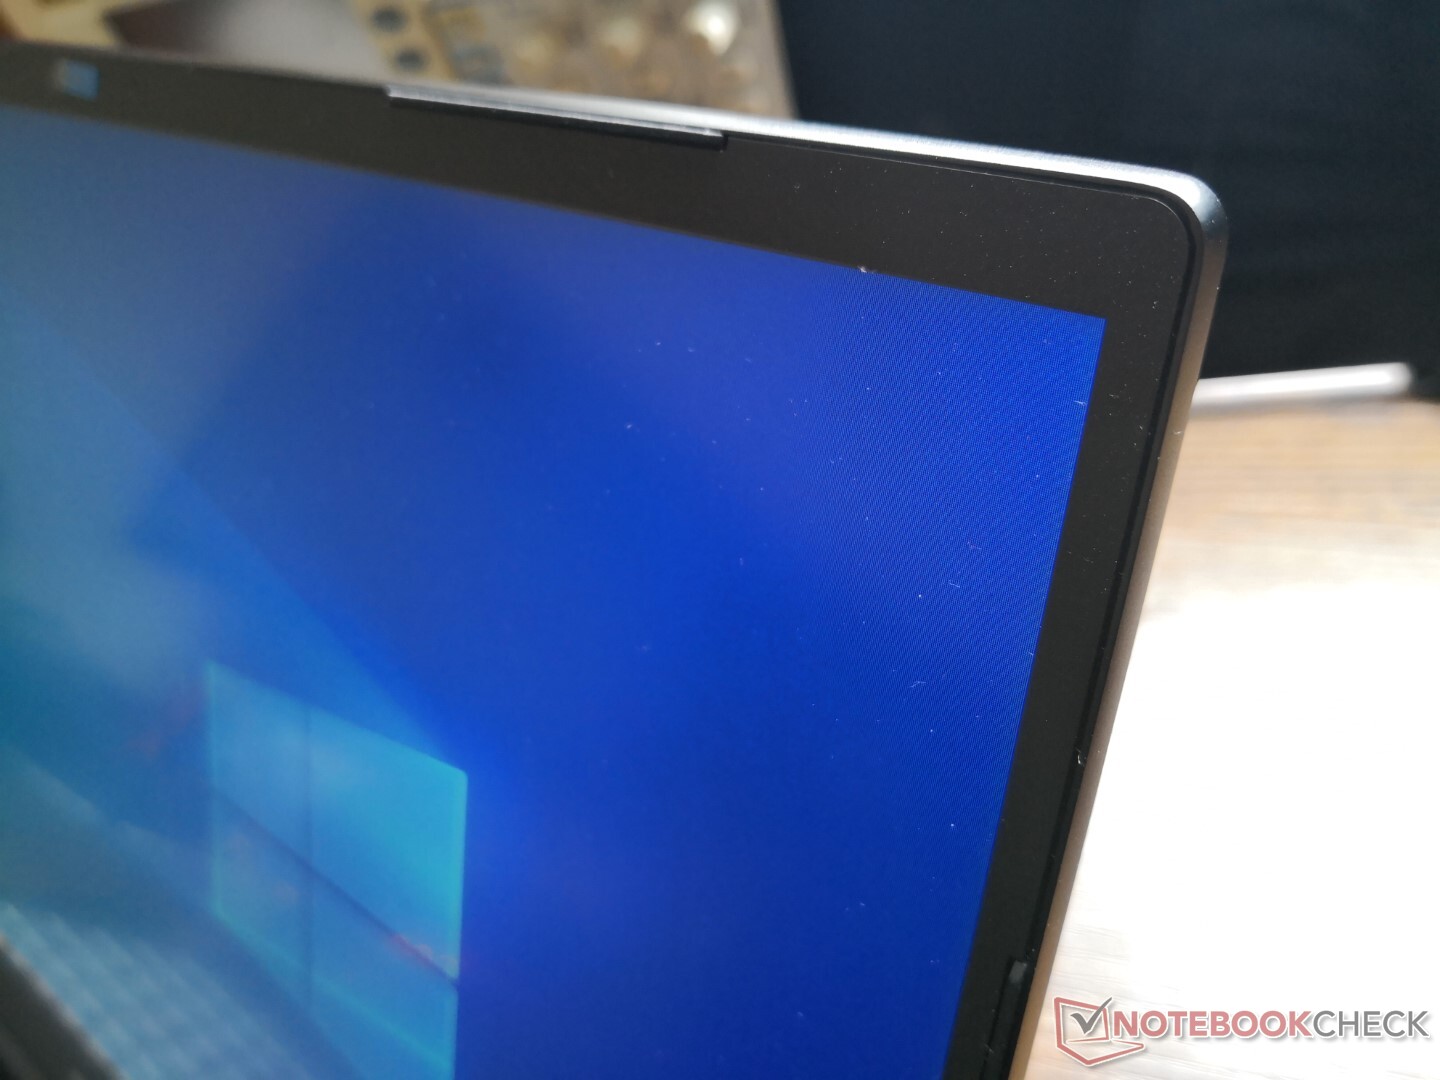
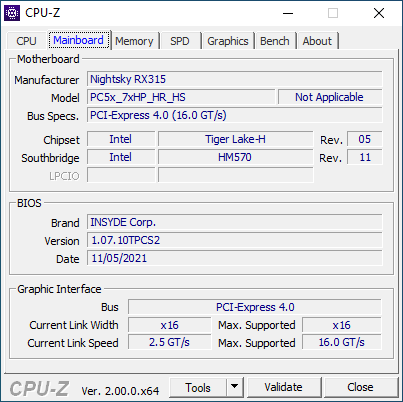
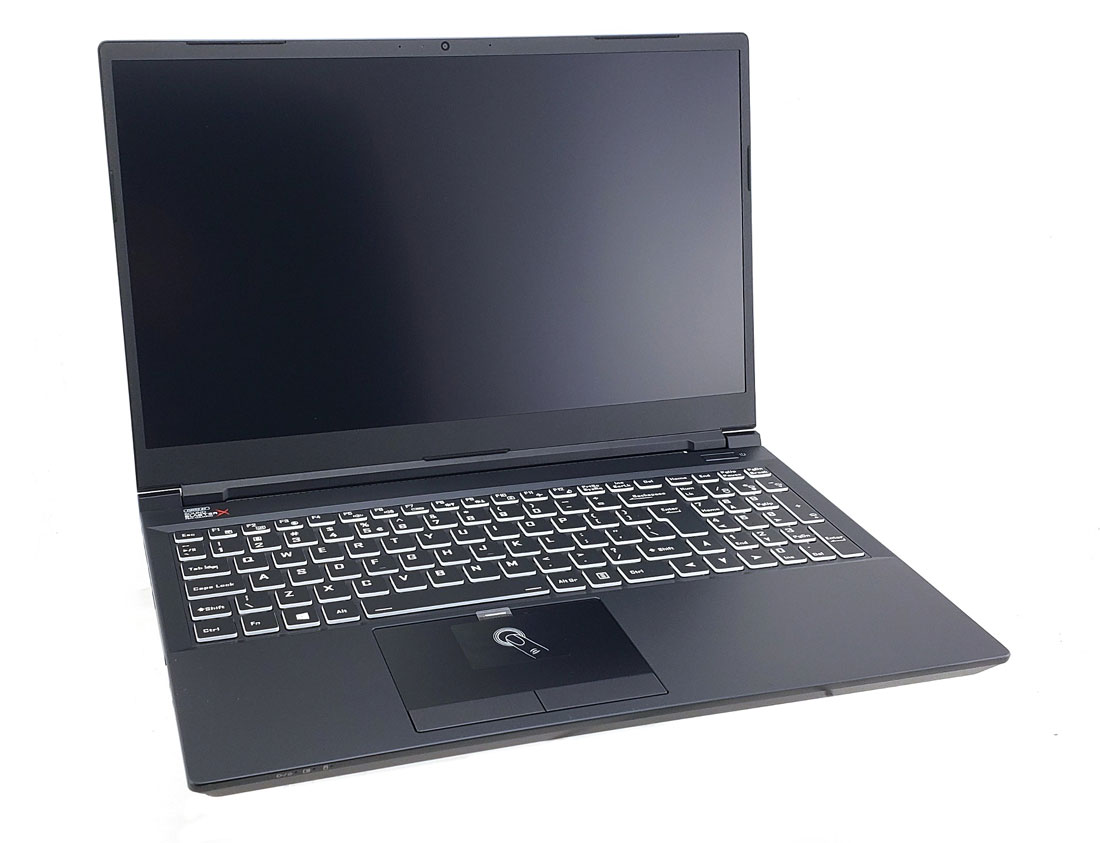
L'Eurocom RX315 NH57AF1 est une configuration différente du Schenker XMG Pro 15 que nous avons examiné plus tôt cette année. Nous vous recommandons donc de consulter notre article sur le Schenker pour en savoir plus sur son châssis et ses caractéristiques physiques, car les deux modèles sont visuellement identiques. Cette page se concentrera plutôt sur les performances que les utilisateurs peuvent attendre du RX315.
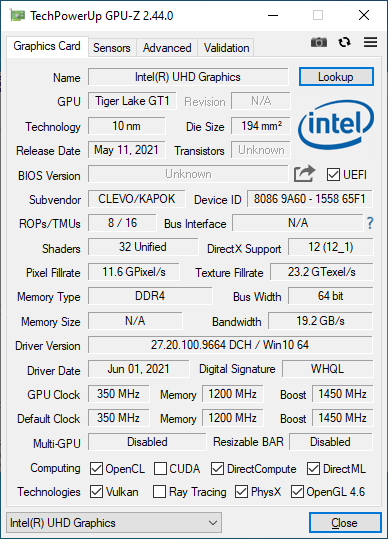
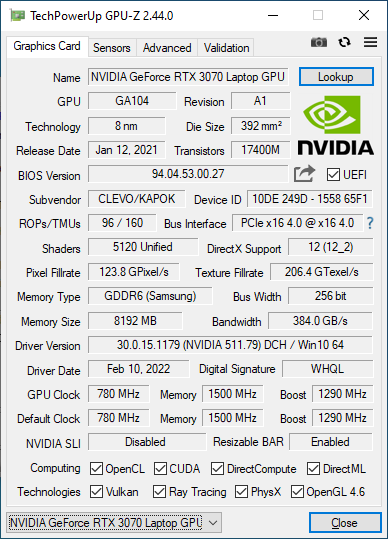
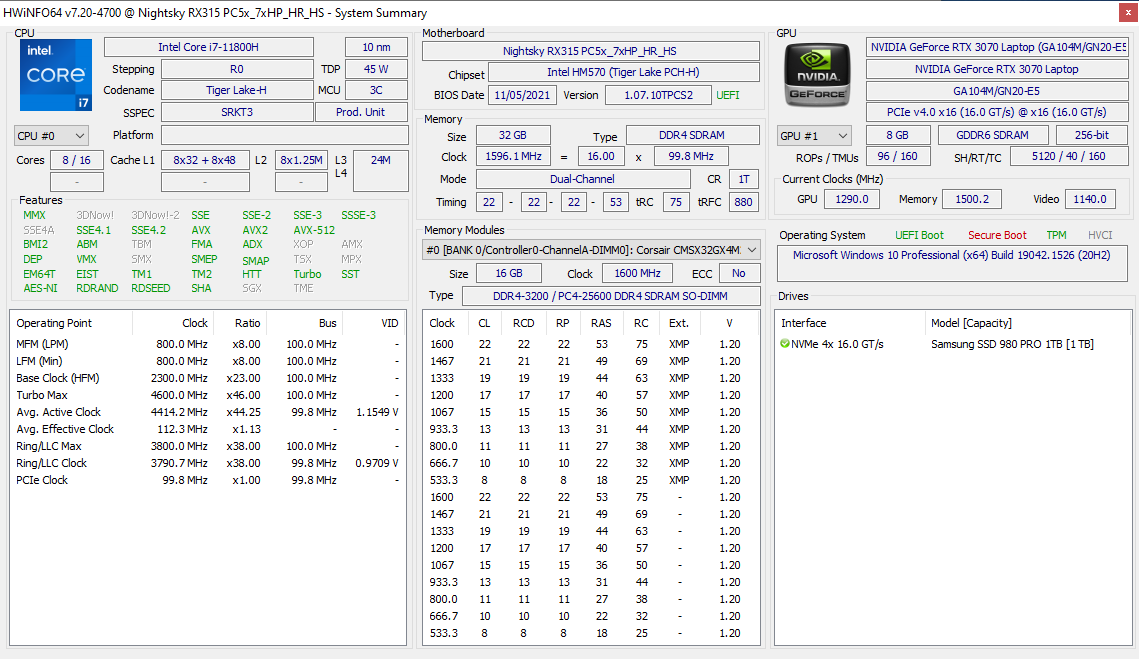
L'unité que nous avons examinée est équipée d'un processeur Core i7-11800H de 11e génération, d'un GPU RTX 3070 de 105 W TGP GeForce et d'un écran IPS de 240 Hz. Des options de configuration supplémentaires sont disponibles sur ici. Eurocom affirme que les CPU Intel de 12e génération et la RTX 3080 Ti seront disponibles dans un avenir proche.
Parmi les alternatives au RX315, on trouve d'autres ordinateurs portables de 15,6 pouces ultrafins destinés aux jeux, comme le MSI GS66, Asus Zephyrus S15 series, Razer Blade 15ou l'Alienware X15. L'Eurocom RX315 ne doit pas être confondu avec l'ARX15 ou l'ARX315, plus épais.
Plus de commentaires sur Eurocom :
Comparaison avec les concurrents potentiels
Note | Date | Modèle | Poids | Épaisseur | Taille | Résolution | Prix |
|---|---|---|---|---|---|---|---|
| 85.2 % v7 (old) | 03/22 | Eurocom RX315 NH57AF1 i7-11800H, GeForce RTX 3070 Laptop GPU | 2 kg | 20 mm | 15.60" | 1920x1080 | |
| 84.5 % v7 (old) | 02/22 | MSI Stealth GS66 12UGS i7-12700H, GeForce RTX 3070 Ti Laptop GPU | 2.2 kg | 19.8 mm | 15.60" | 2560x1440 | |
| 83 % v7 (old) | 01/22 | Eurocom Nightsky ARX315 R9 5900X, GeForce RTX 3070 Laptop GPU | 2.6 kg | 32.5 mm | 15.60" | 1920x1080 | |
| 86.1 % v7 (old) | 11/21 | Alienware m15 R6, i7-11800H RTX 3080 i7-11800H, GeForce RTX 3080 Laptop GPU | 2.5 kg | 22.85 mm | 15.60" | 1920x1080 | |
| 82.7 % v7 (old) | 10/21 | Dell G15 5515 R7 5800H, GeForce RTX 3050 Ti Laptop GPU | 2.4 kg | 24.9 mm | 15.60" | 1920x1080 | |
| 88.9 % v7 (old) | 07/21 | Razer Blade 15 Advanced (Mid 2021) i7-11800H, GeForce RTX 3080 Laptop GPU | 2 kg | 16.99 mm | 15.60" | 1920x1080 |
Cas
Communication
Webcam


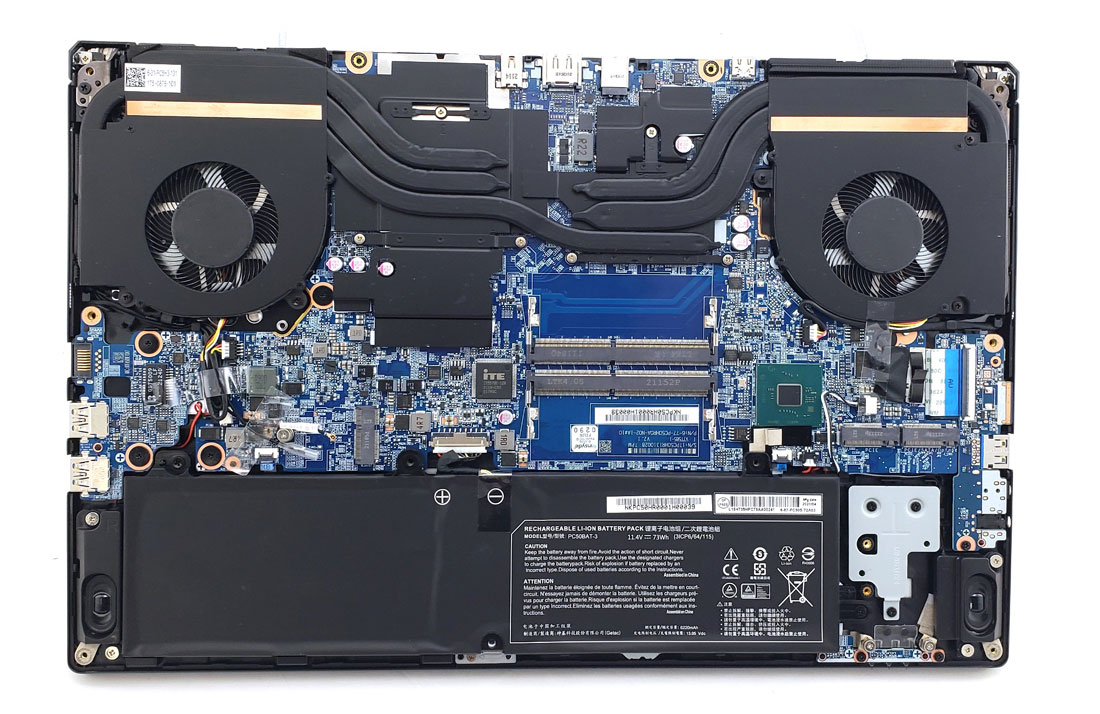
Maintenance
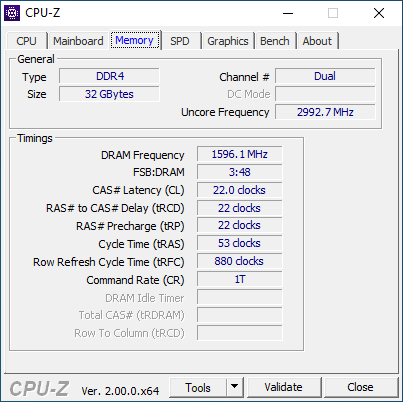
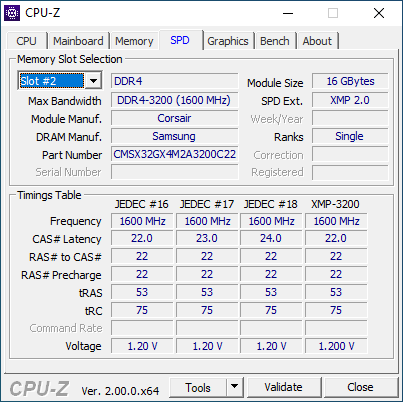
Les utilisateurs peuvent installer jusqu'à deux modules de RAM SODIMM DDR4, deux SSD NVMe PCIe4 x4 M.2 2280 et un module WLAN.
Afficher
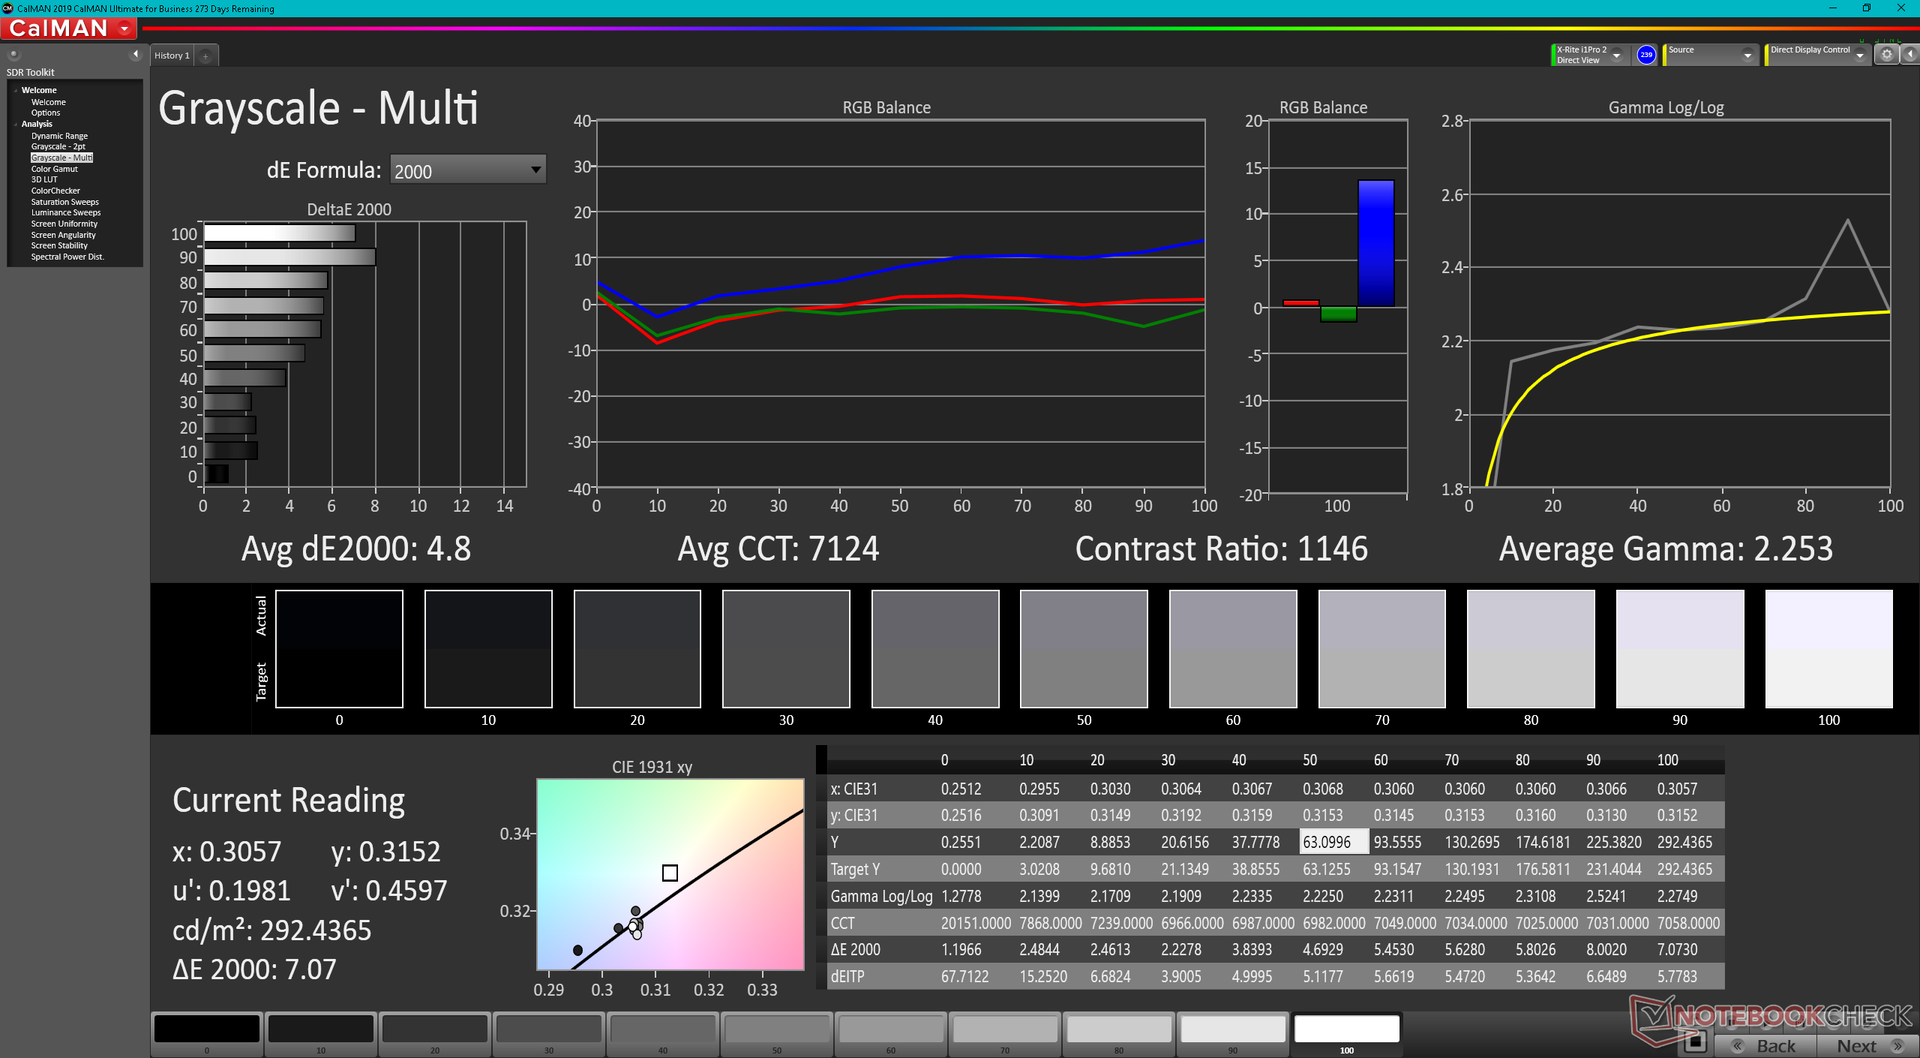
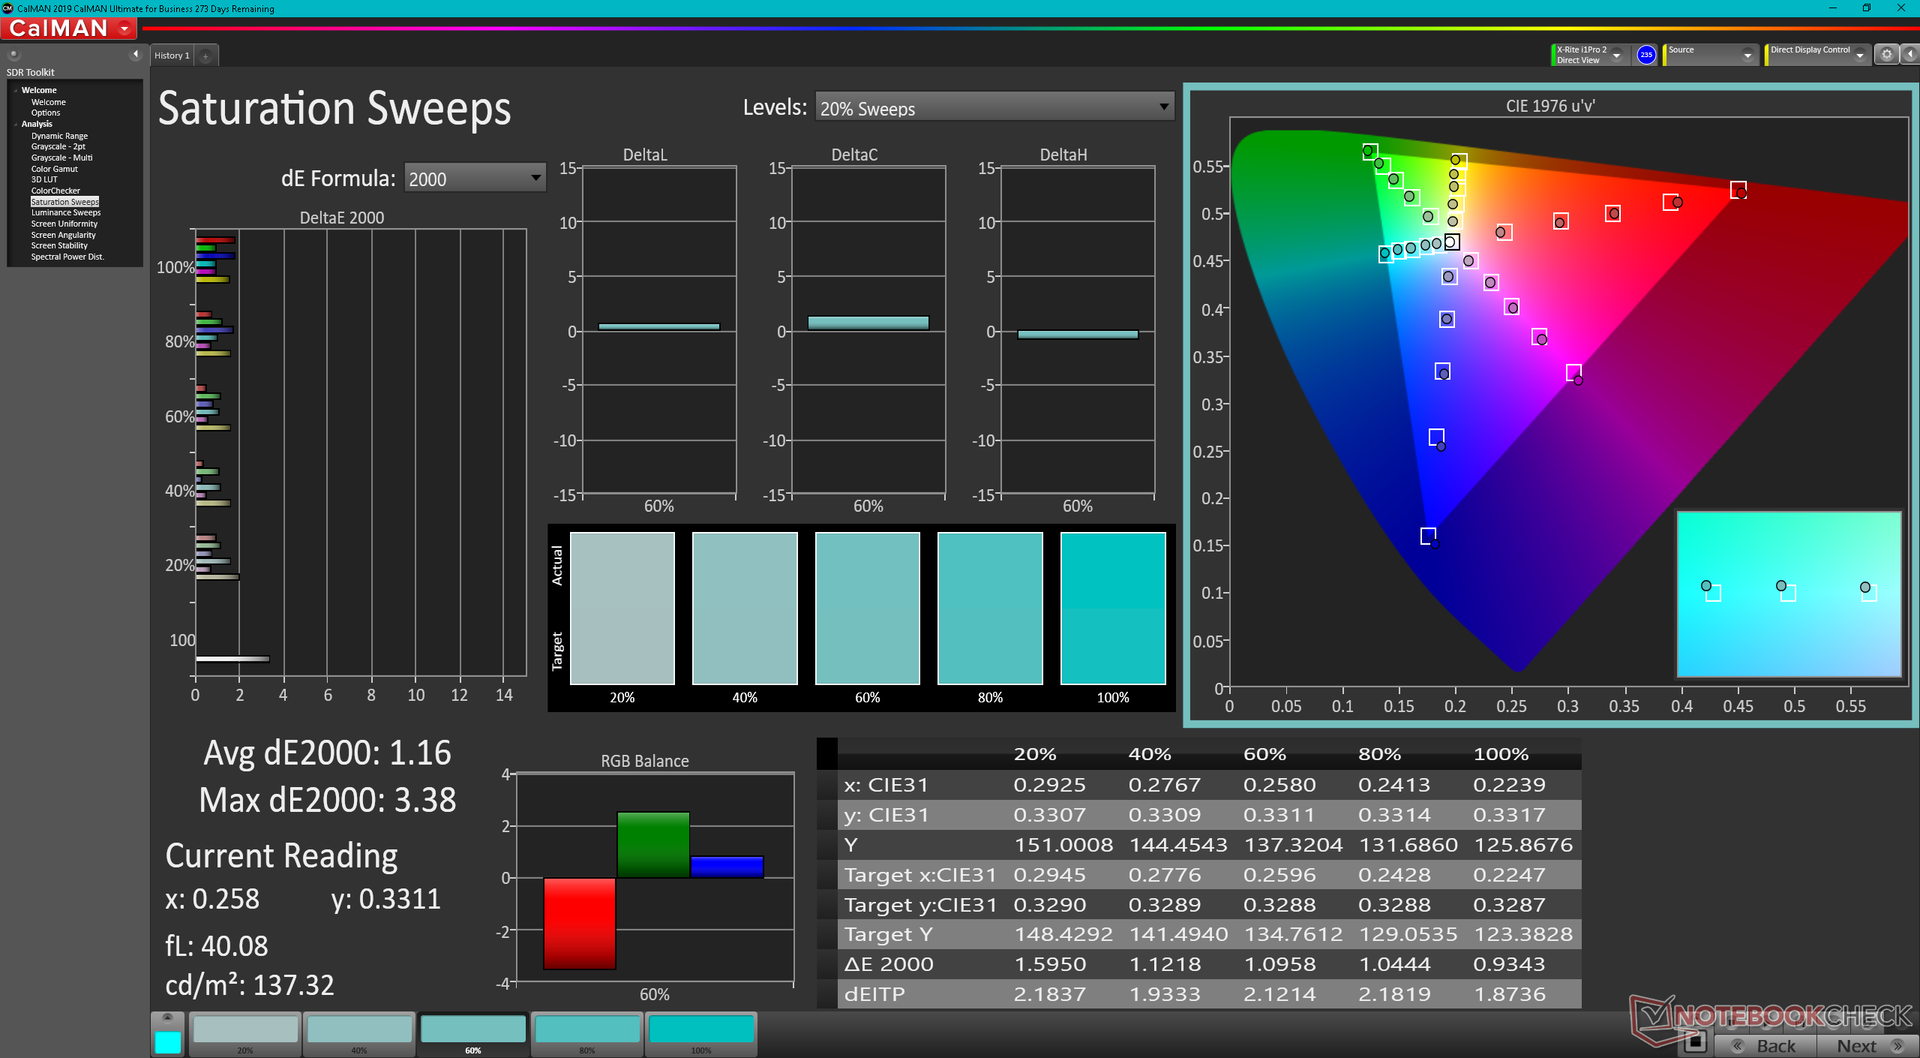
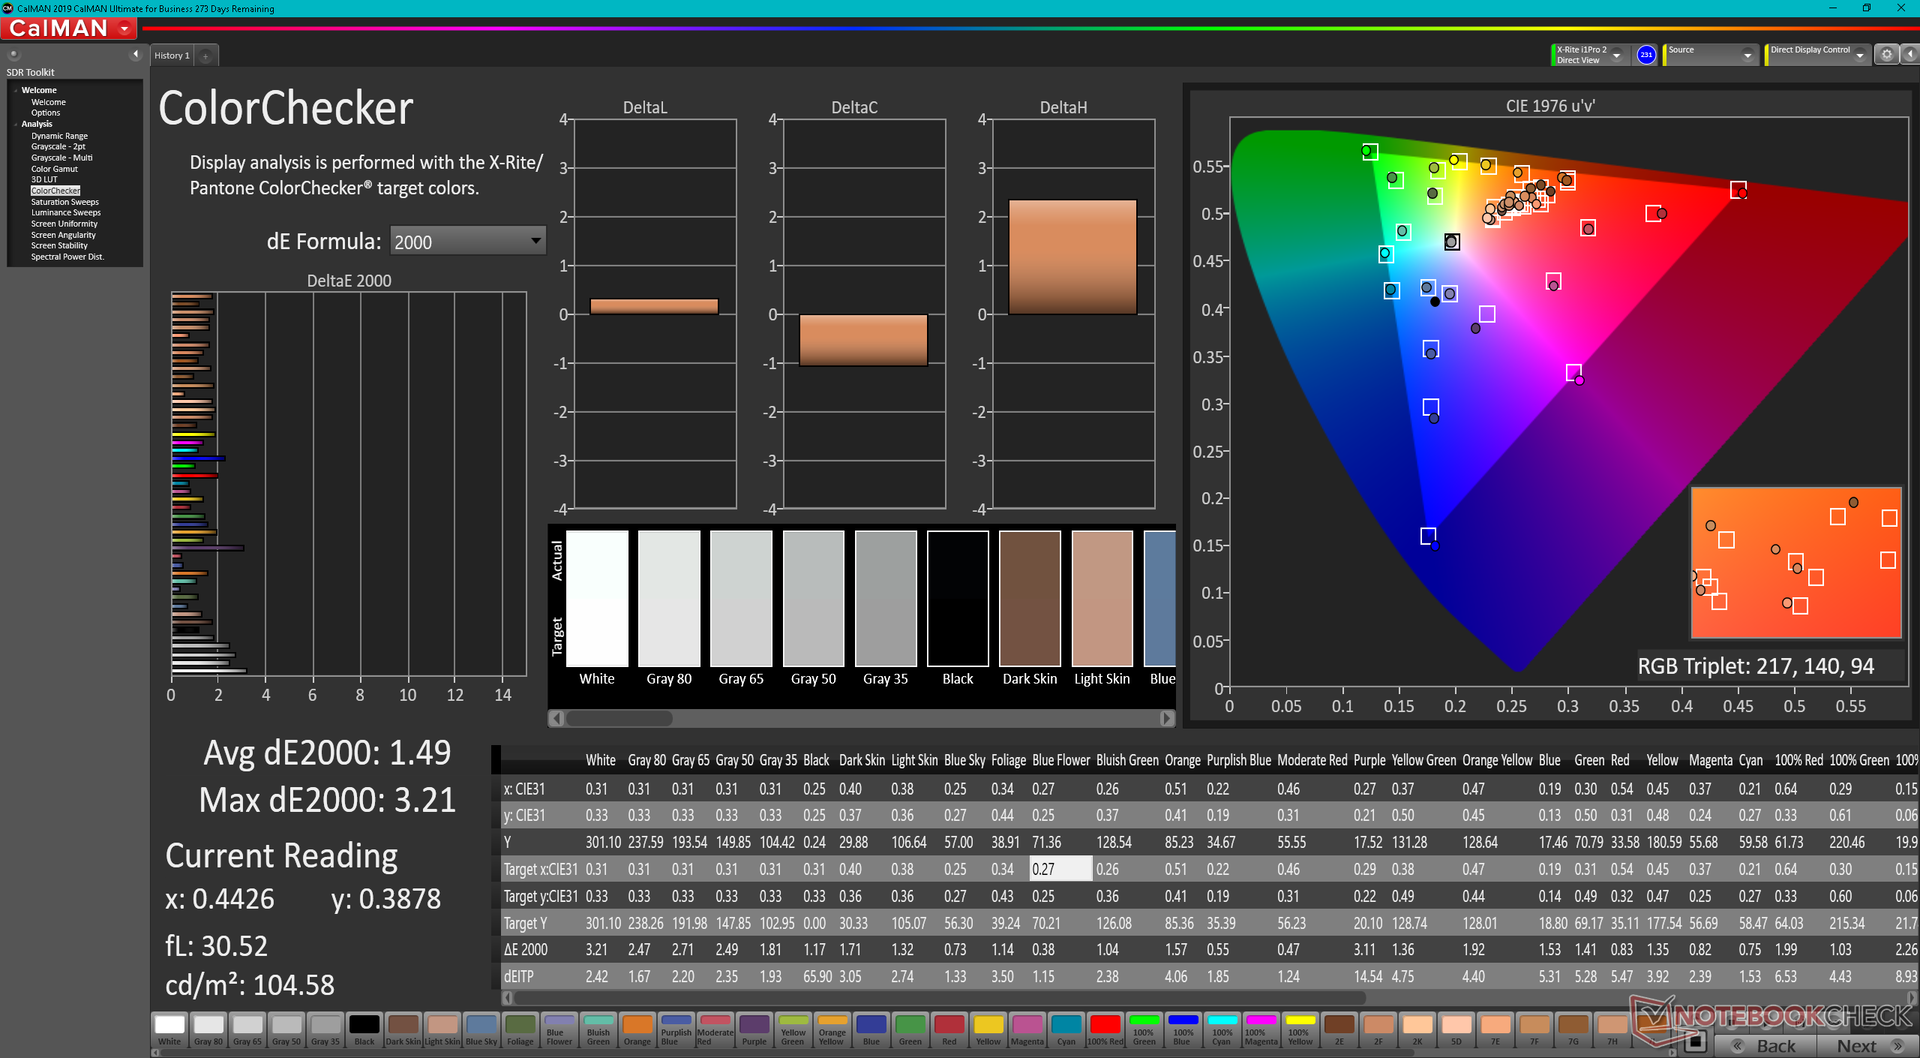
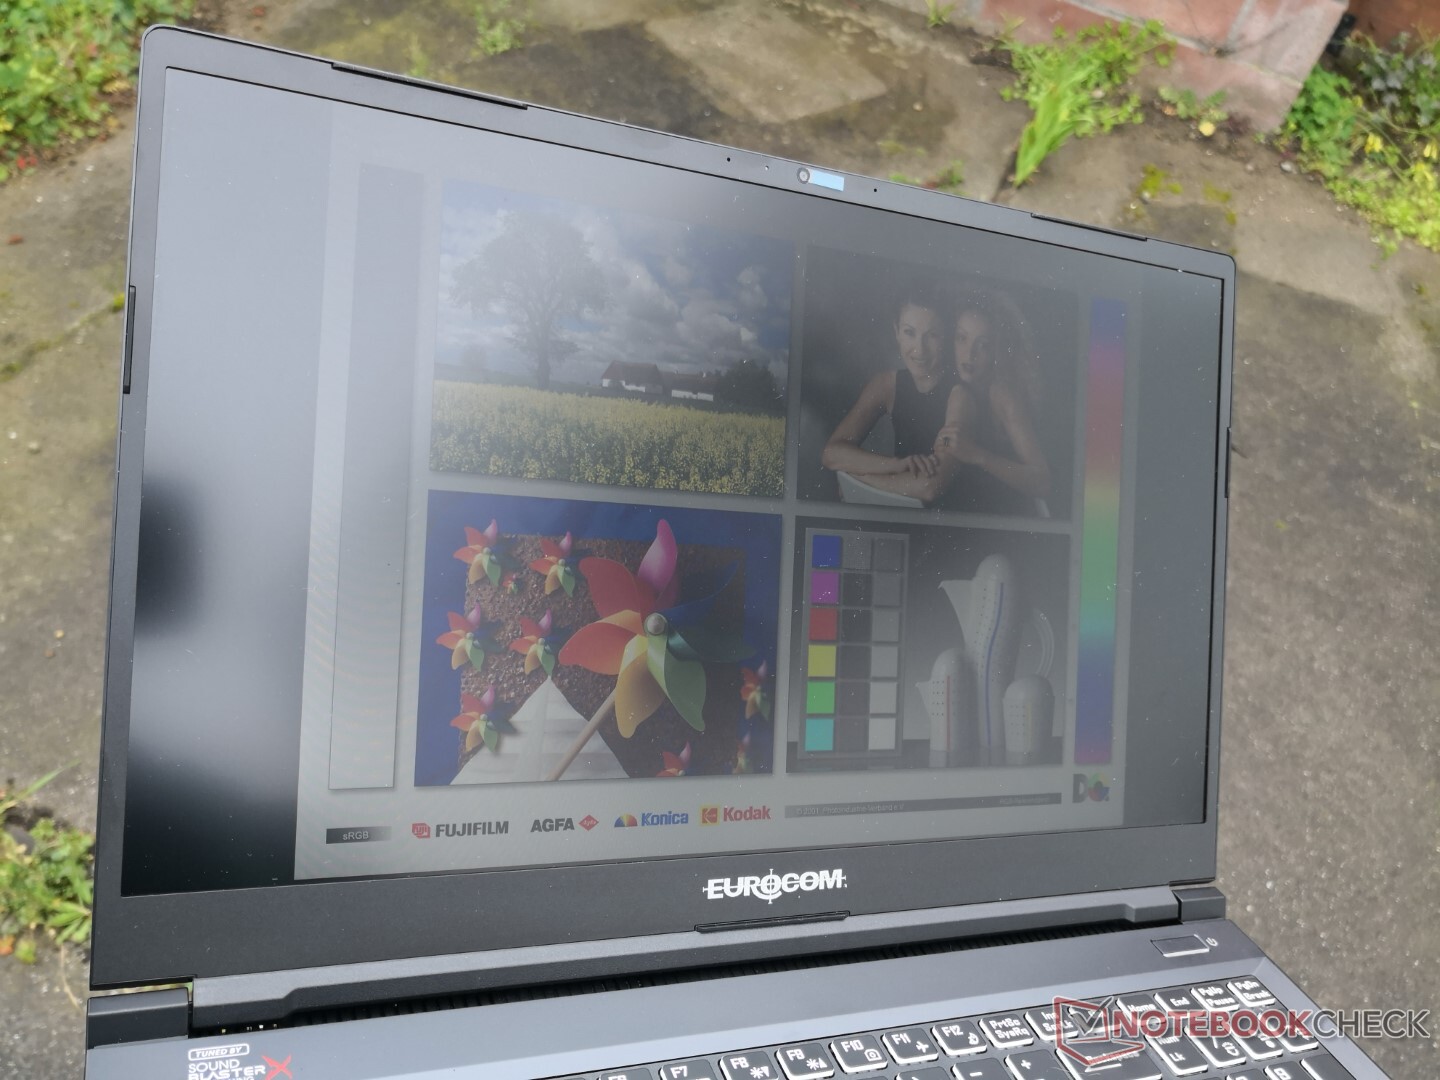
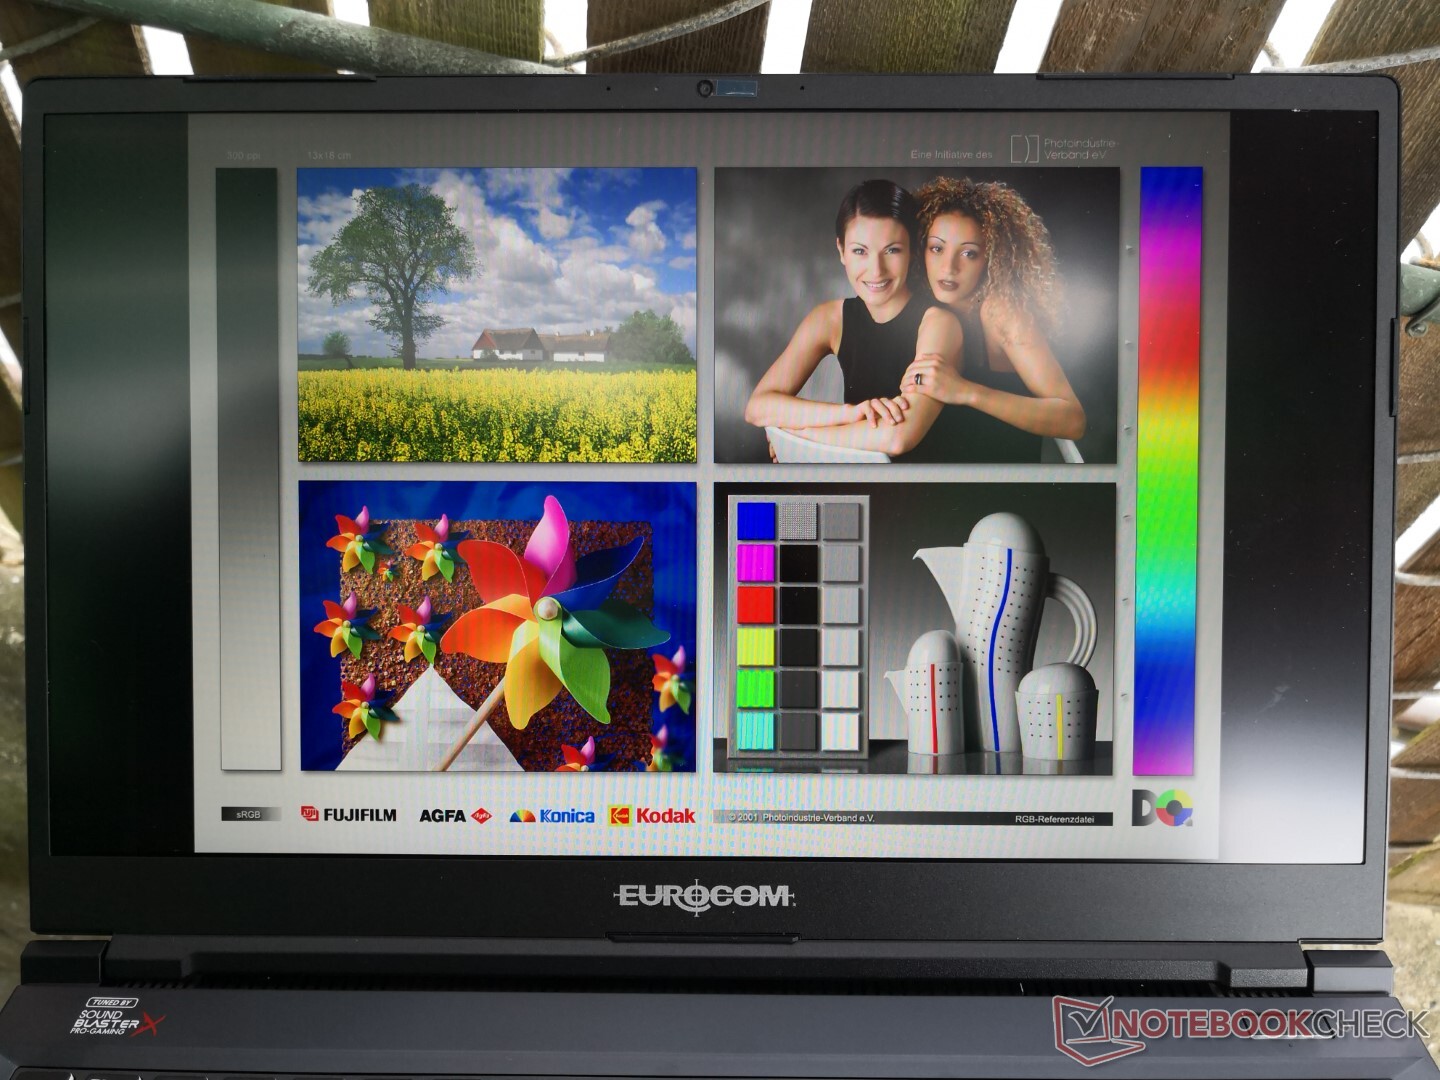
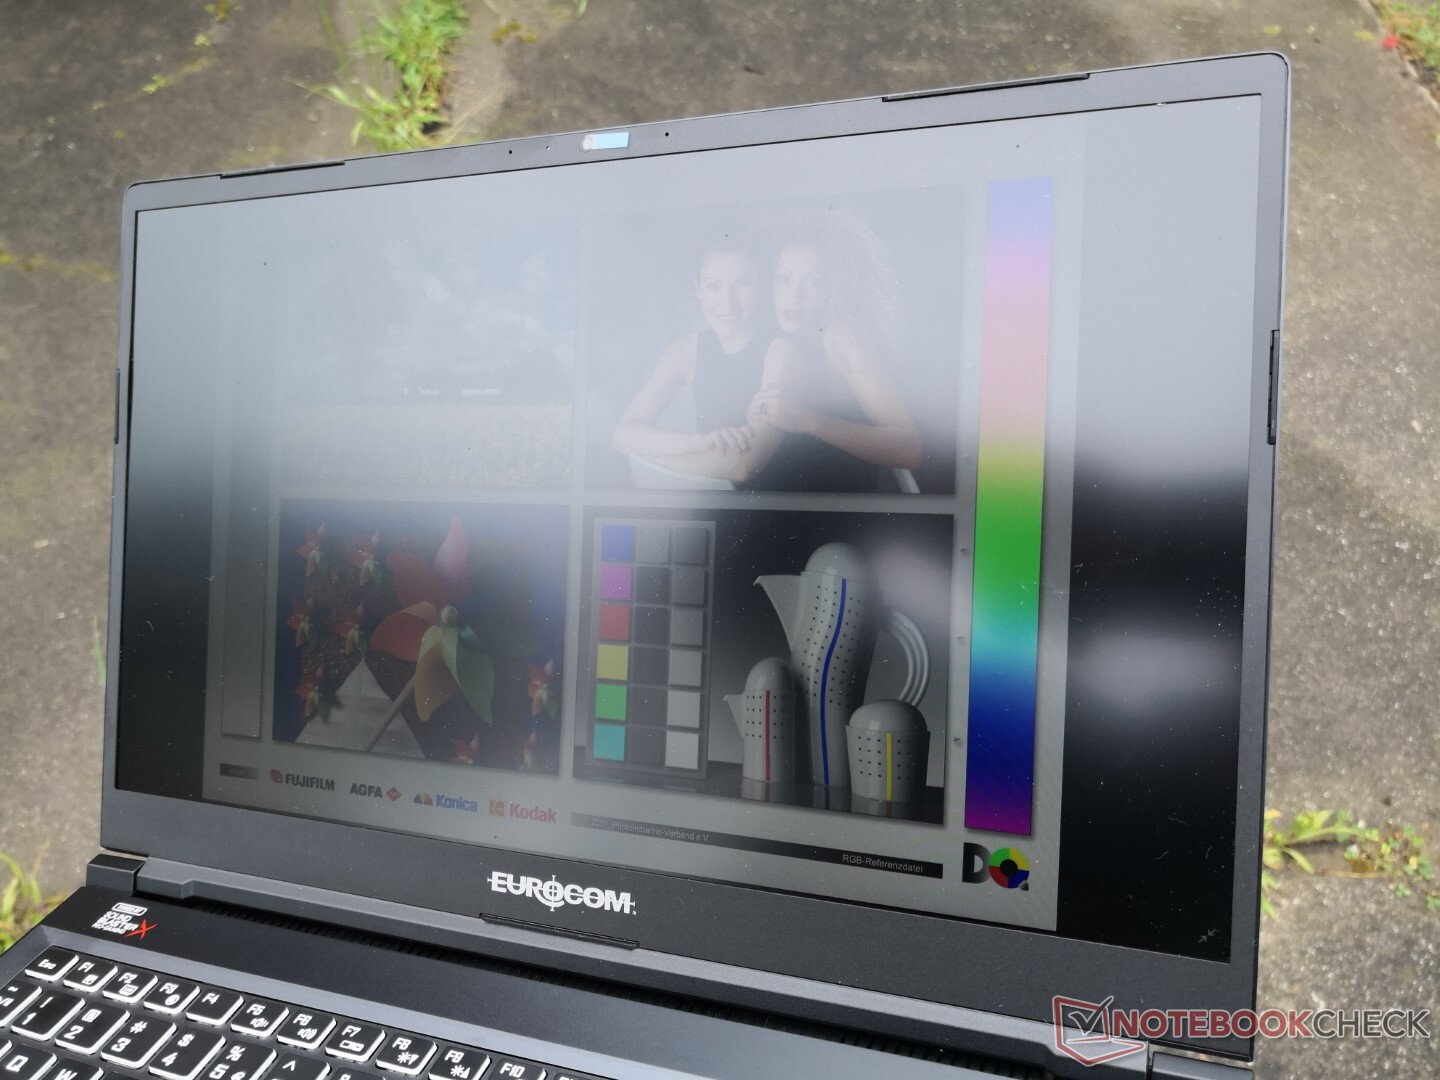
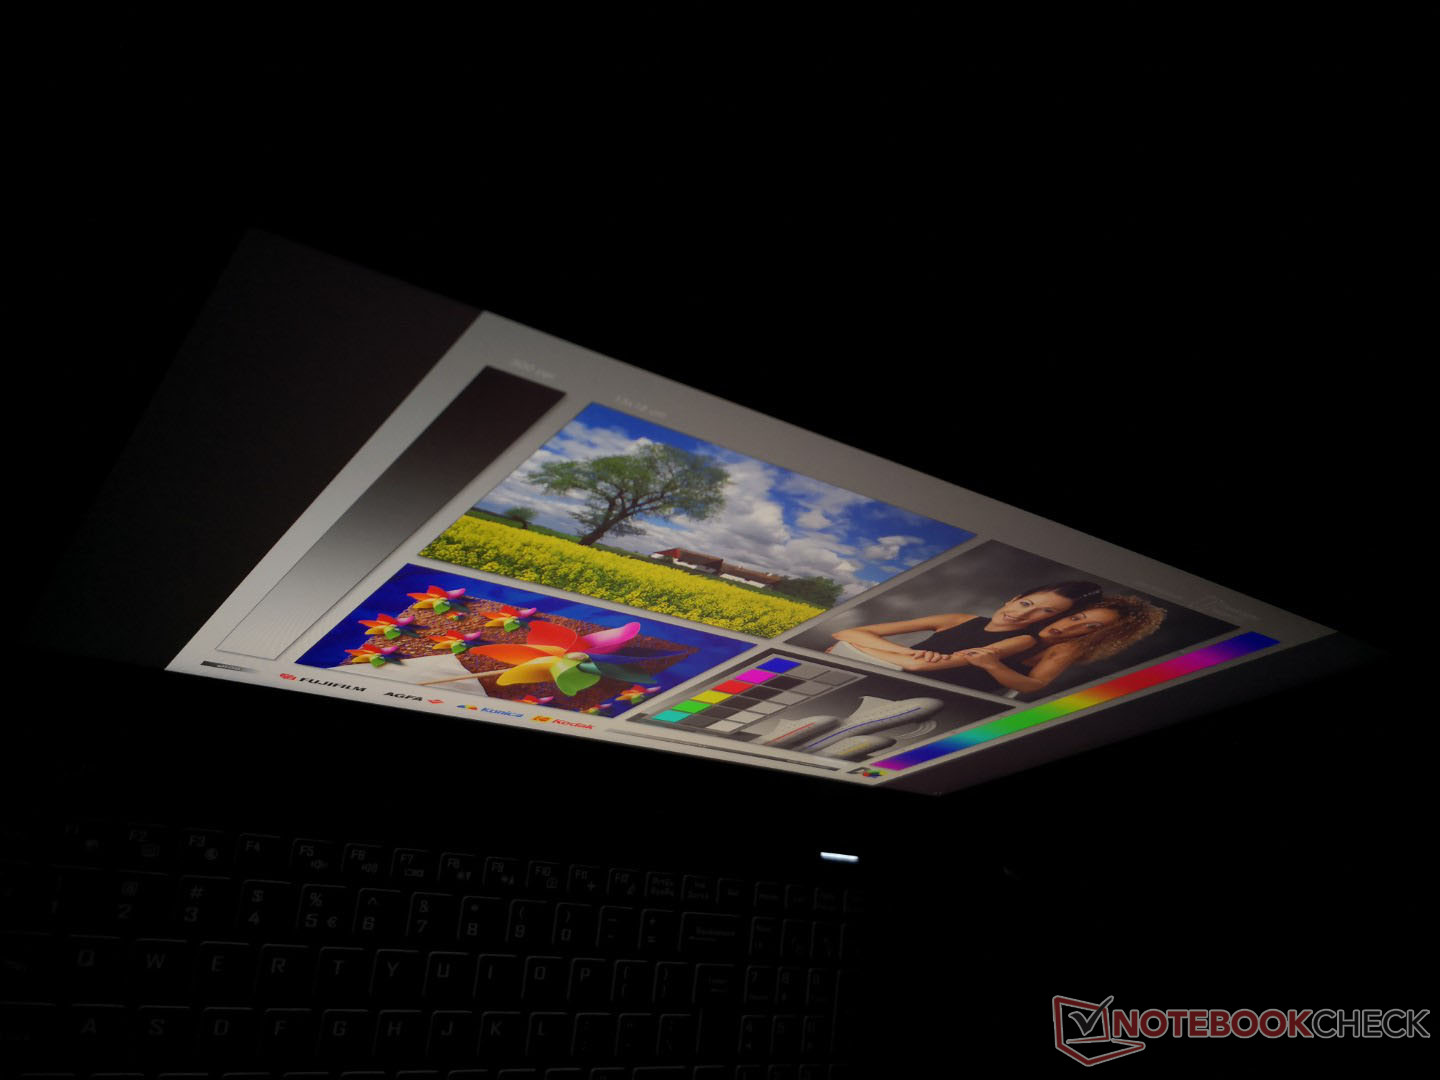
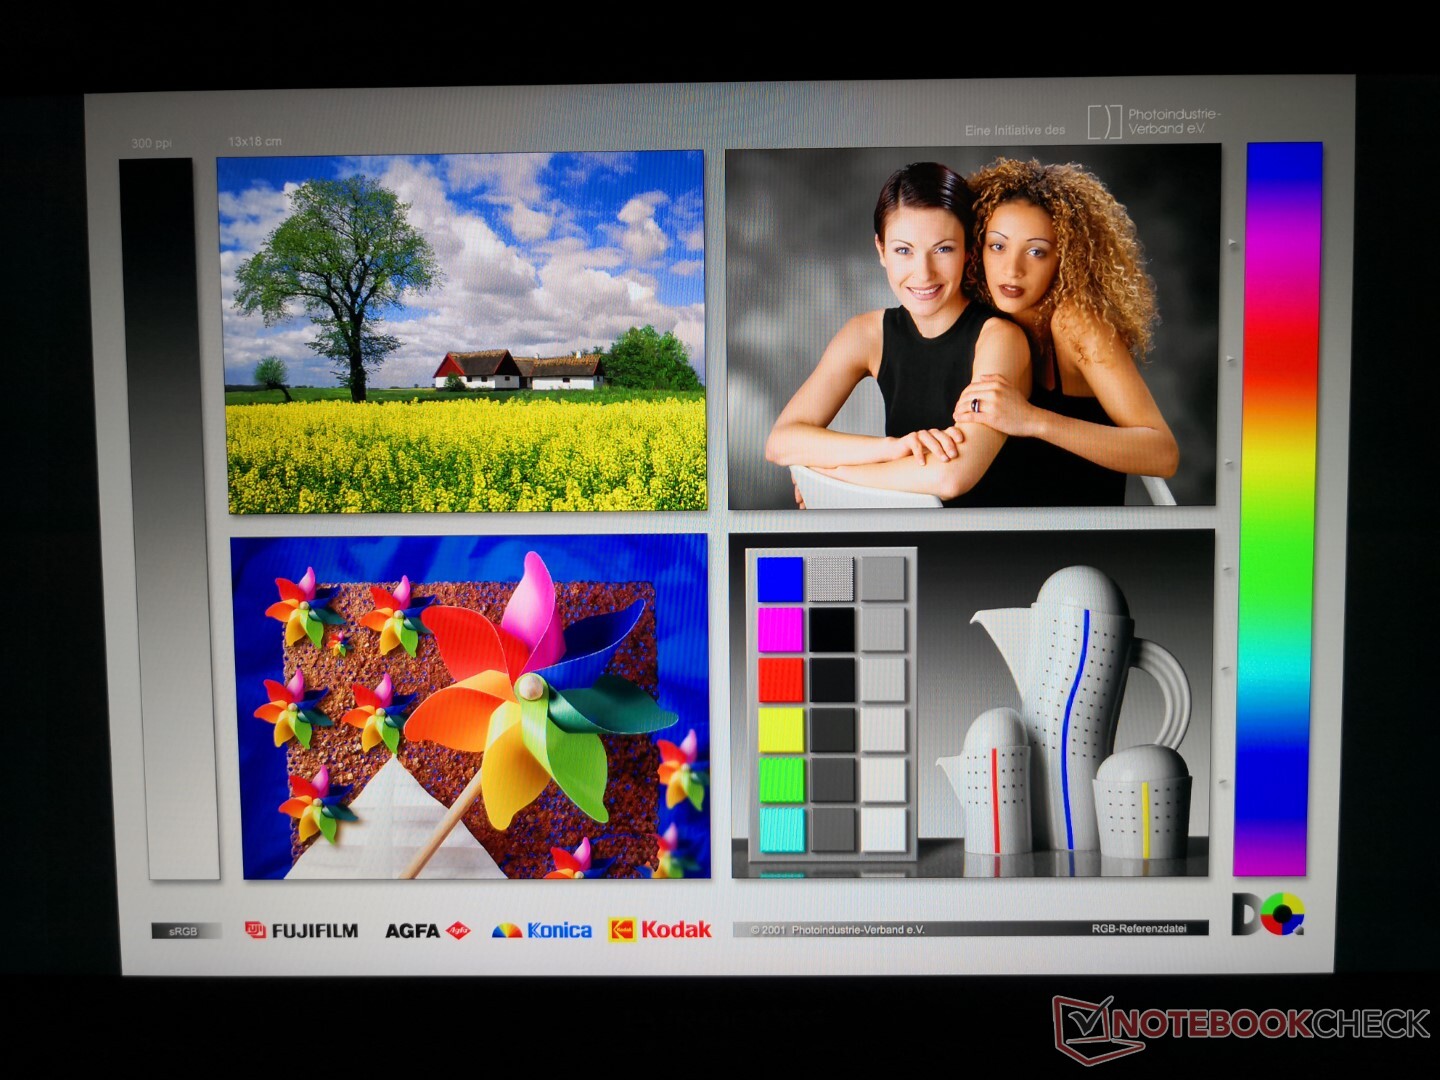
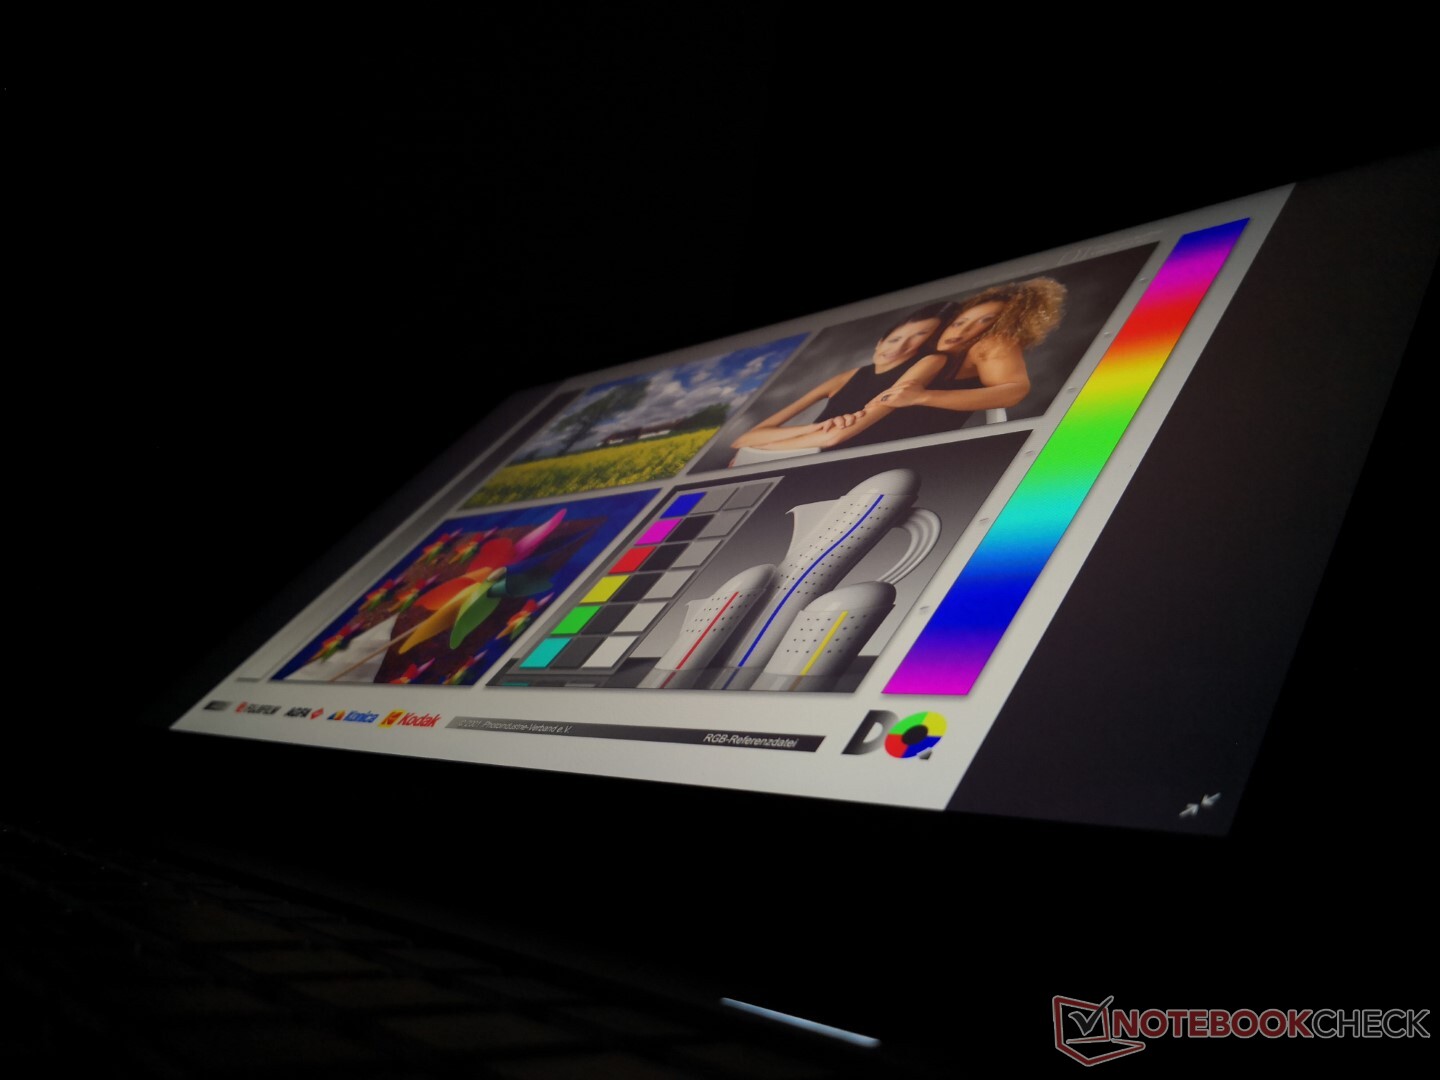
Comparée à l'option OLED 4K, notre dalle IPS FHD présente des temps de réponse noir-blanc et gris-gris plus lents, un rétroéclairage plus faible, un taux de contraste plus bas et une gamme plus étroite pour une qualité d'image globalement inférieure. En contrepartie, les utilisateurs bénéficient d'un taux de rafraîchissement natif de 240 Hz beaucoup plus rapide, ce qui réduit le déchirement de l'écran et rend le jeu plus fluide. G-Sync n'est toutefois pas pris en charge sur le moniteur interne.

| |||||||||||||||||||||||||
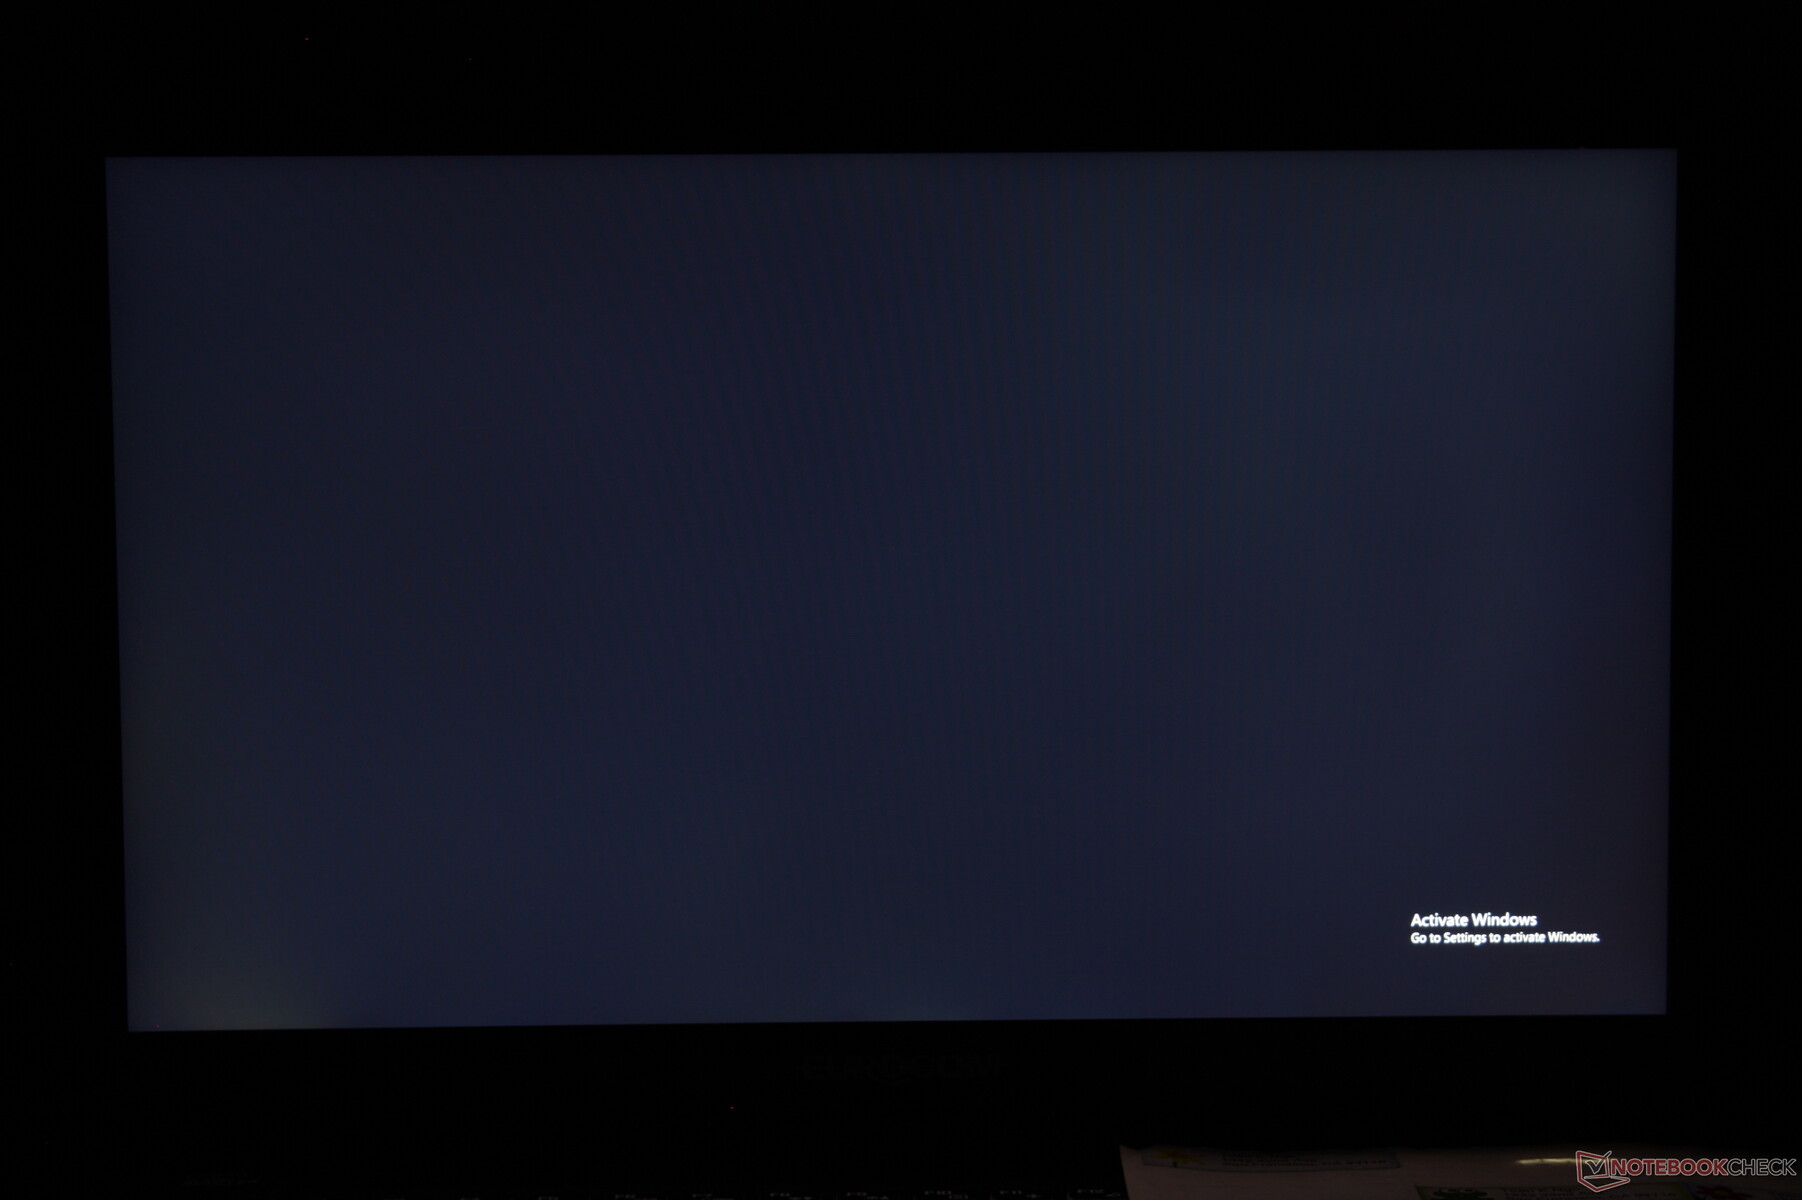
Homogénéité de la luminosité: 91 %
Valeur mesurée au centre, sur batterie: 291.3 cd/m²
Contraste: 832:1 (Valeurs des noirs: 0.35 cd/m²)
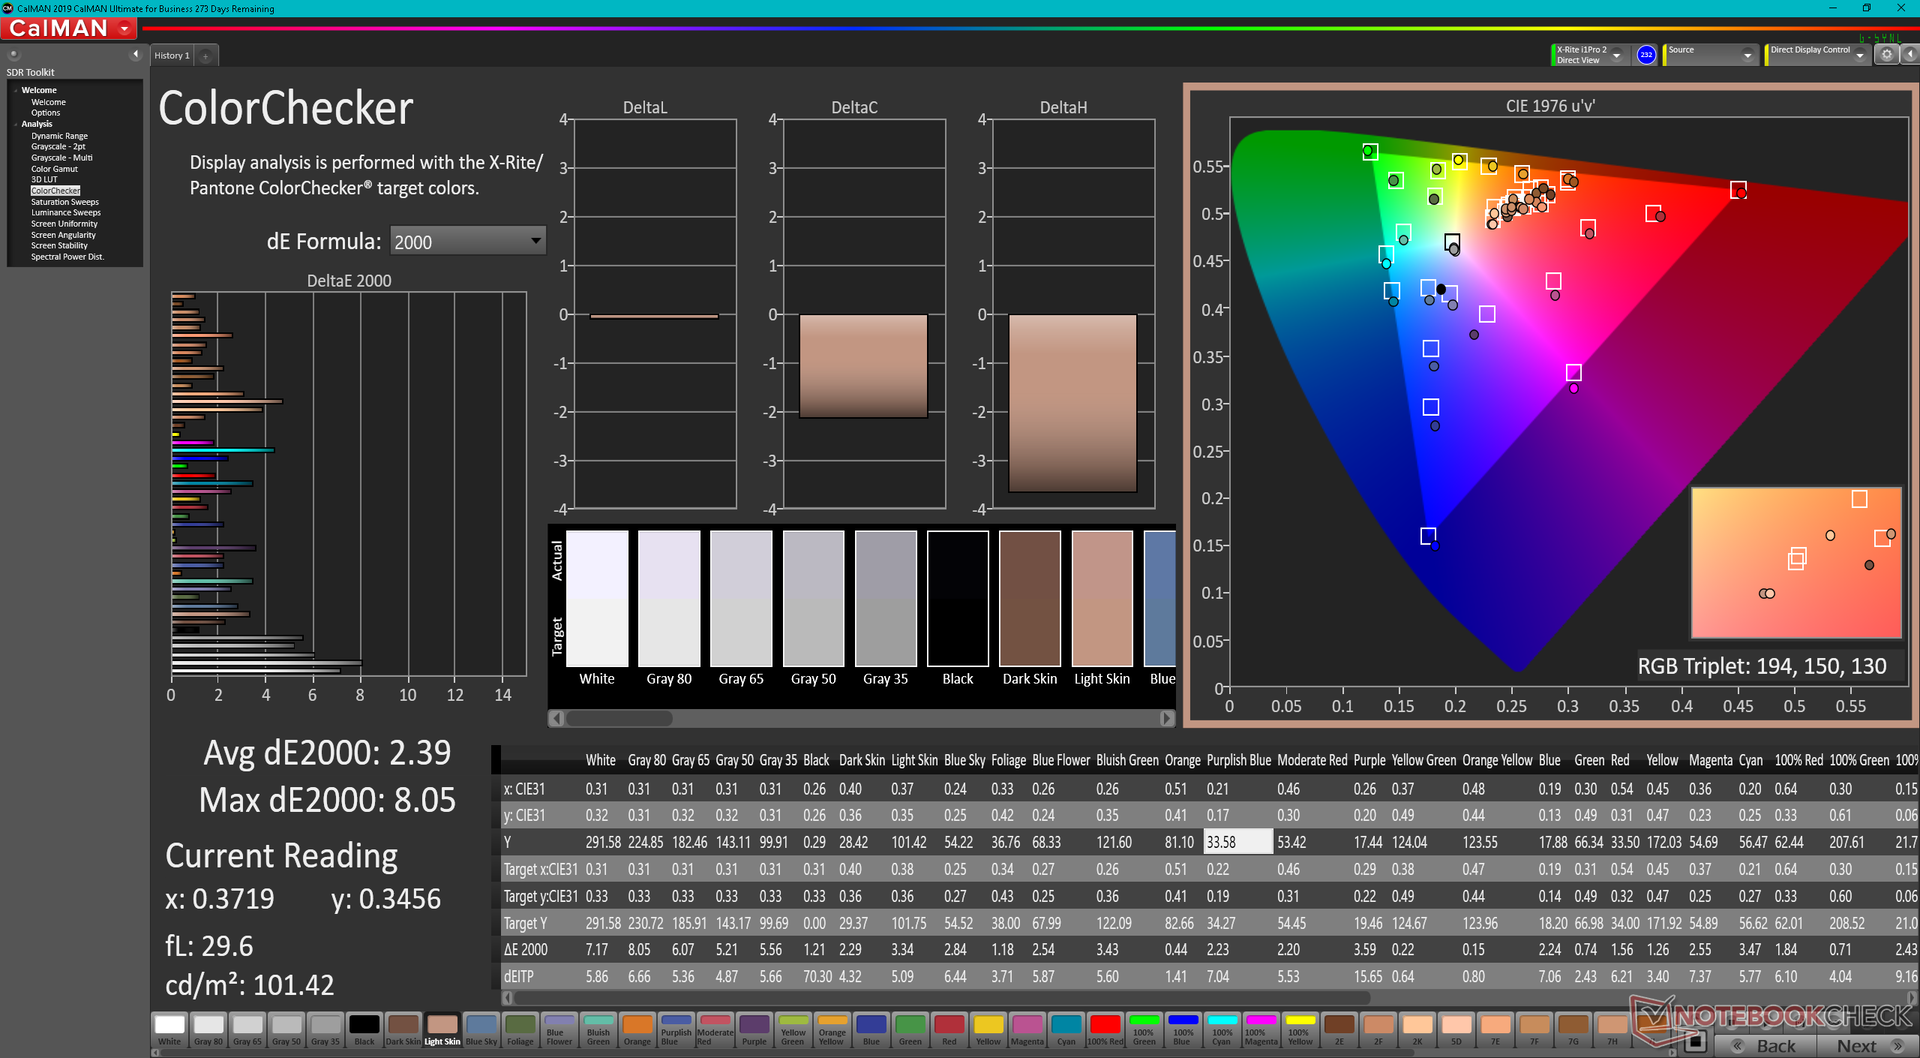
ΔE ColorChecker Calman: 2.39 | ∀{0.5-29.43 Ø4.71}
calibrated: 1.49
ΔE Greyscale Calman: 4.8 | ∀{0.09-98 Ø4.96}
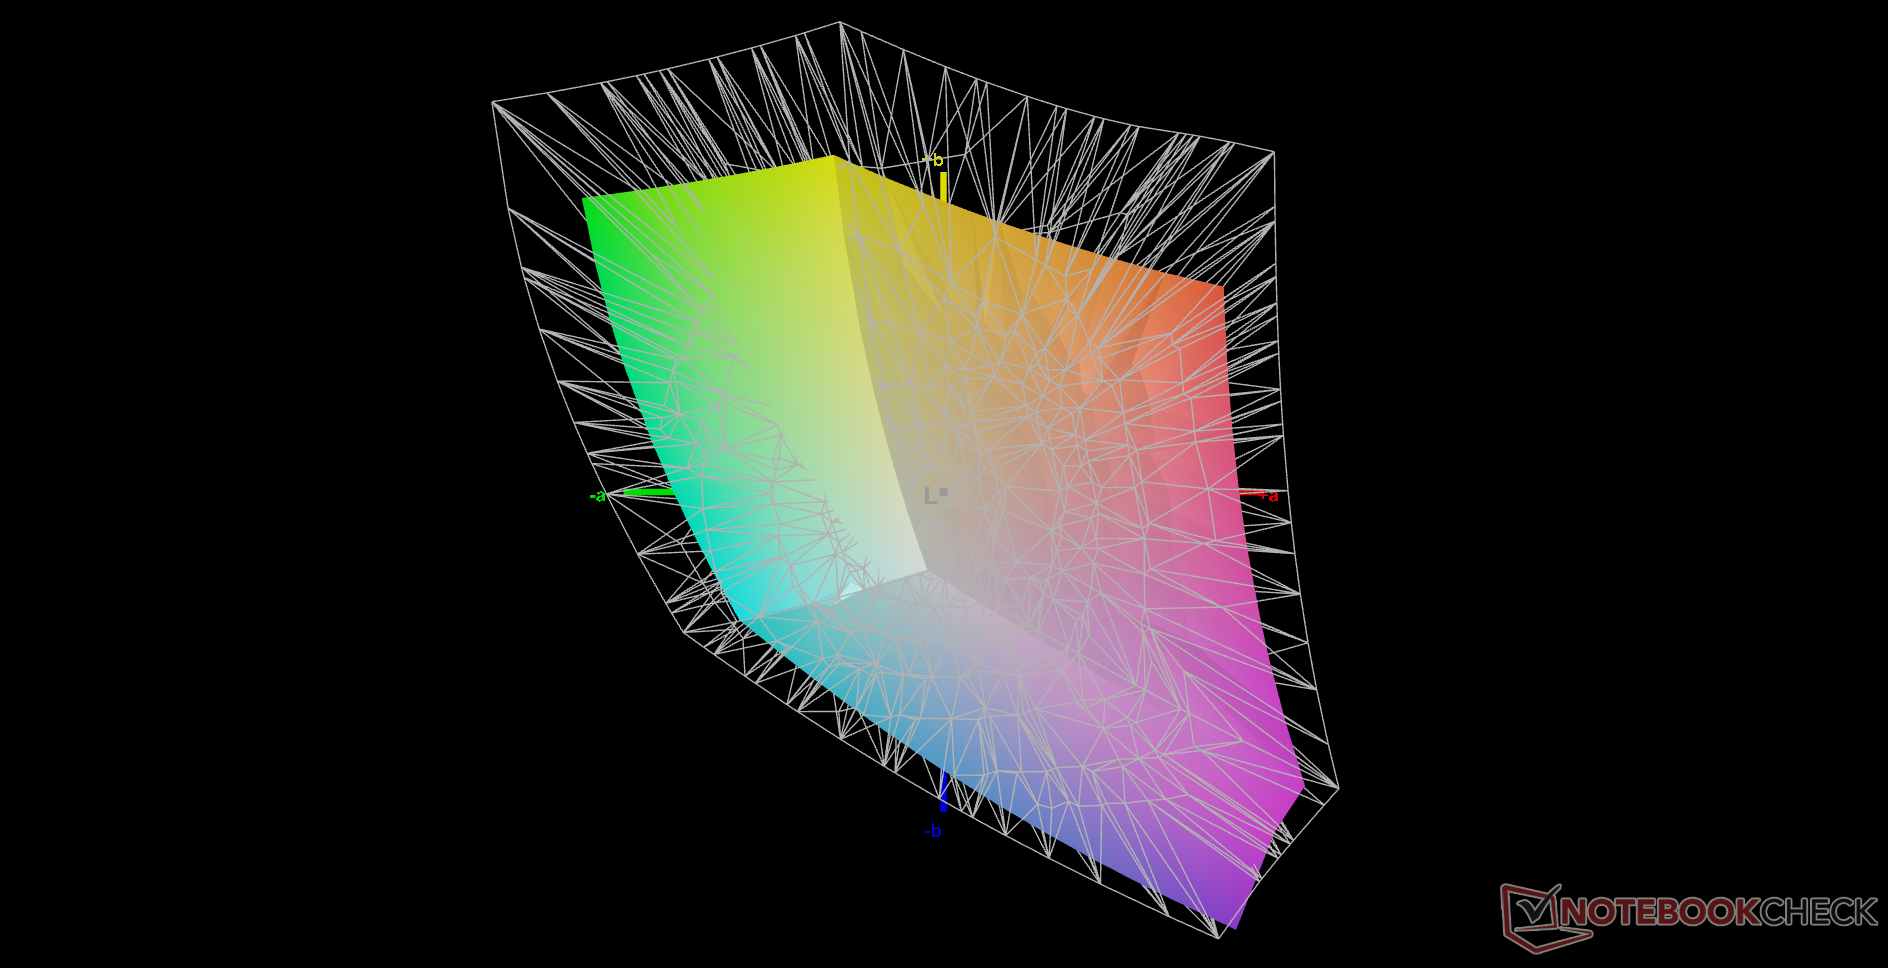
68.5% AdobeRGB 1998 (Argyll 3D)
98% sRGB (Argyll 3D)
67.5% Display P3 (Argyll 3D)
Gamma: 2.25
CCT: 7124 K
| Eurocom RX315 NH57AF1 Sharp LQ156M1JW03, IPS, 1920x1080, 15.6" | MSI Stealth GS66 12UGS Sharp LQ156T1JW04 (SHP153C), IPS-Level, 2560x1440, 15.6" | Eurocom Nightsky ARX315 Sharp LQ156M1JW03, IPS, 1920x1080, 15.6" | Alienware m15 R6, i7-11800H RTX 3080 AU Optronics AUO9092 (B156HAN), IPS, 1920x1080, 15.6" | Dell G15 5515 BOE092A, IPS, 1920x1080, 15.6" | Razer Blade 15 Advanced (Mid 2021) TL156VDXP02-0, IPS, 1920x1080, 15.6" | |
|---|---|---|---|---|---|---|
| Display | 23% | 4% | 8% | -42% | -0% | |
| Display P3 Coverage (%) | 67.5 | 96.4 43% | 67.9 1% | 74.1 10% | 39.1 -42% | 66.9 -1% |
| sRGB Coverage (%) | 98 | 99.7 2% | 99.7 2% | 99.5 2% | 56.9 -42% | 97.1 -1% |
| AdobeRGB 1998 Coverage (%) | 68.5 | 85.6 25% | 73.7 8% | 75.7 11% | 40.4 -41% | 69 1% |
| Response Times | 35% | -22% | 63% | -94% | 37% | |
| Response Time Grey 50% / Grey 80% * (ms) | 10.4 ? | 6 ? 42% | 15.2 ? -46% | 2.8 73% | 25.2 ? -142% | 4.2 ? 60% |
| Response Time Black / White * (ms) | 11.6 ? | 8.4 ? 28% | 11.2 ? 3% | 5.6 52% | 16.8 ? -45% | 10 ? 14% |
| PWM Frequency (Hz) | 22730 ? | 23150 ? | 200 ? | |||
| Screen | -4% | 10% | -3% | -55% | 21% | |
| Brightness middle (cd/m²) | 291.3 | 272 -7% | 312.8 7% | 359 23% | 278 -5% | 353.4 21% |
| Brightness (cd/m²) | 273 | 253 -7% | 294 8% | 344 26% | 262 -4% | 340 25% |
| Brightness Distribution (%) | 91 | 87 -4% | 90 -1% | 85 -7% | 83 -9% | 92 1% |
| Black Level * (cd/m²) | 0.35 | 0.25 29% | 0.28 20% | 0.35 -0% | 0.36 -3% | 0.31 11% |
| Contrast (:1) | 832 | 1088 31% | 1117 34% | 1026 23% | 772 -7% | 1140 37% |
| Colorchecker dE 2000 * | 2.39 | 3.73 -56% | 2.96 -24% | 3.3 -38% | 5.74 -140% | 2.17 9% |
| Colorchecker dE 2000 max. * | 8.05 | 9.43 -17% | 6.23 23% | 4.84 40% | 19.63 -144% | 5.69 29% |
| Colorchecker dE 2000 calibrated * | 1.49 | 0.98 34% | 3.28 -120% | 4.7 -215% | 1.05 30% | |
| Greyscale dE 2000 * | 4.8 | 6.5 -35% | 4.2 12% | 3.66 24% | 3.1 35% | 3.4 29% |
| Gamma | 2.25 98% | 2.172 101% | 2.32 95% | 2.43 91% | 2.011 109% | 2.2 100% |
| CCT | 7124 91% | 6485 100% | 7145 91% | 5896 110% | 6207 105% | 6830 95% |
| Moyenne finale (programmes/paramètres) | 18% /
8% | -3% /
4% | 23% /
9% | -64% /
-57% | 19% /
19% |
* ... Moindre est la valeur, meilleures sont les performances
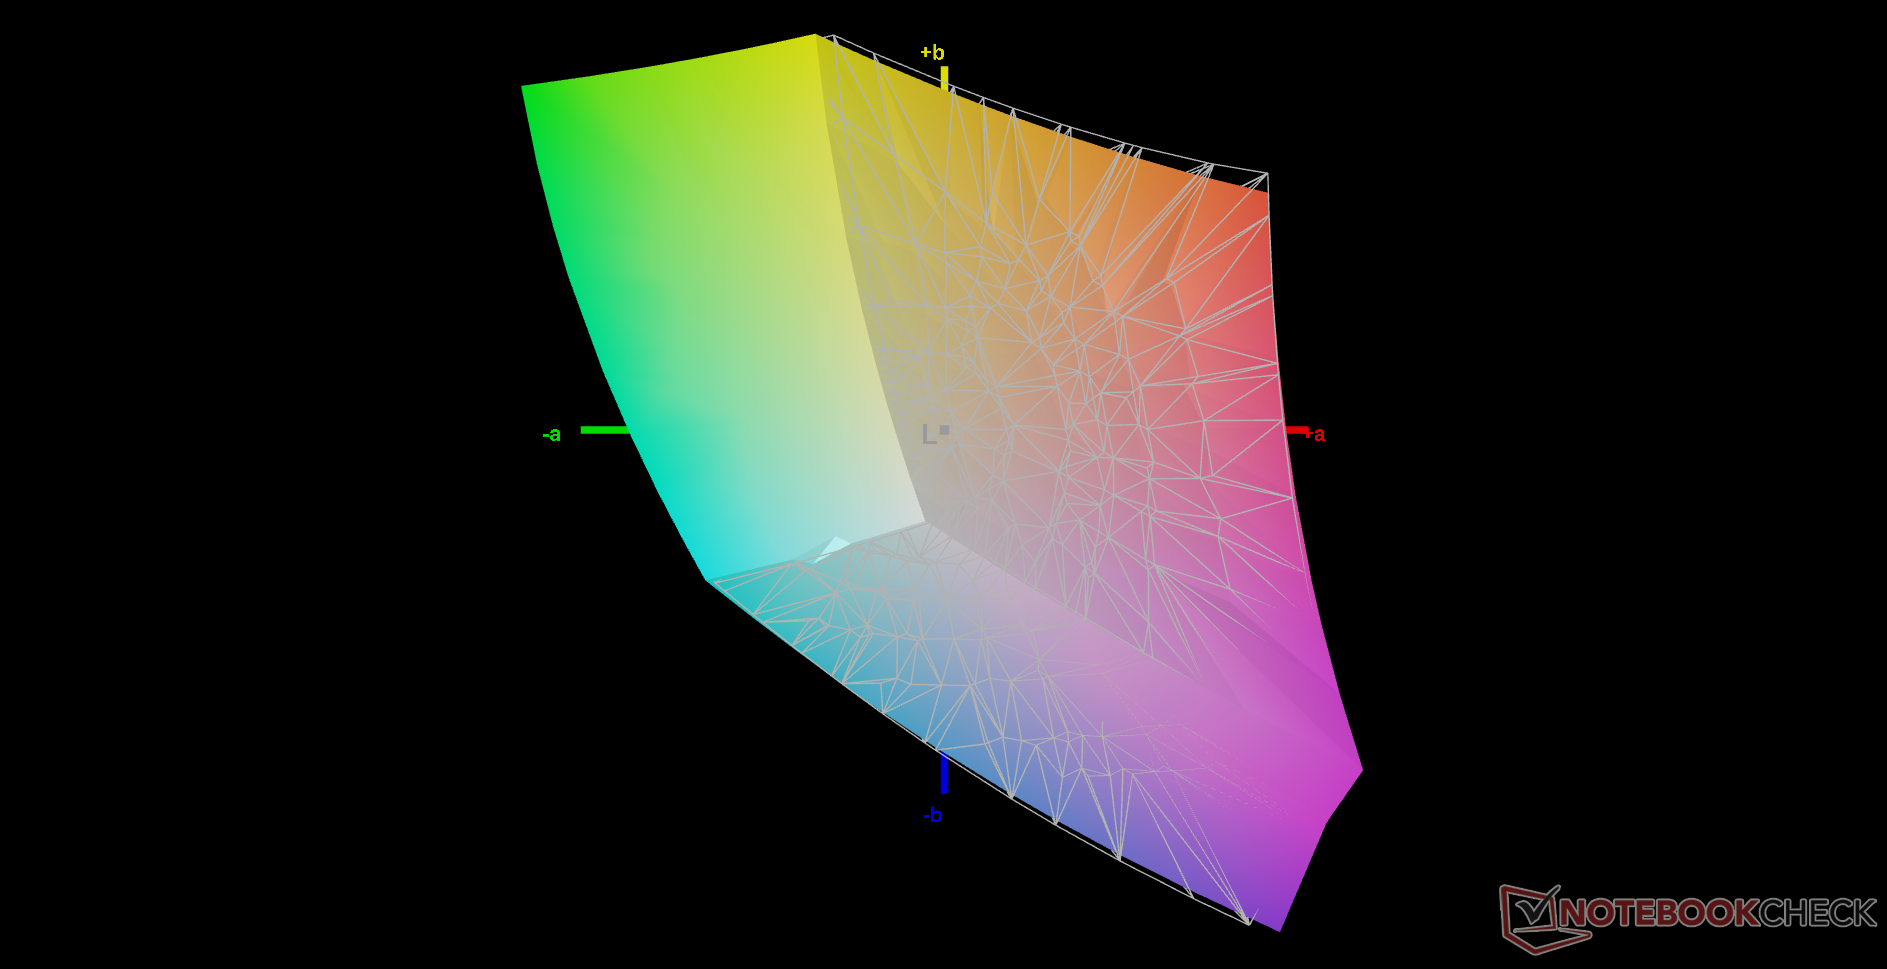
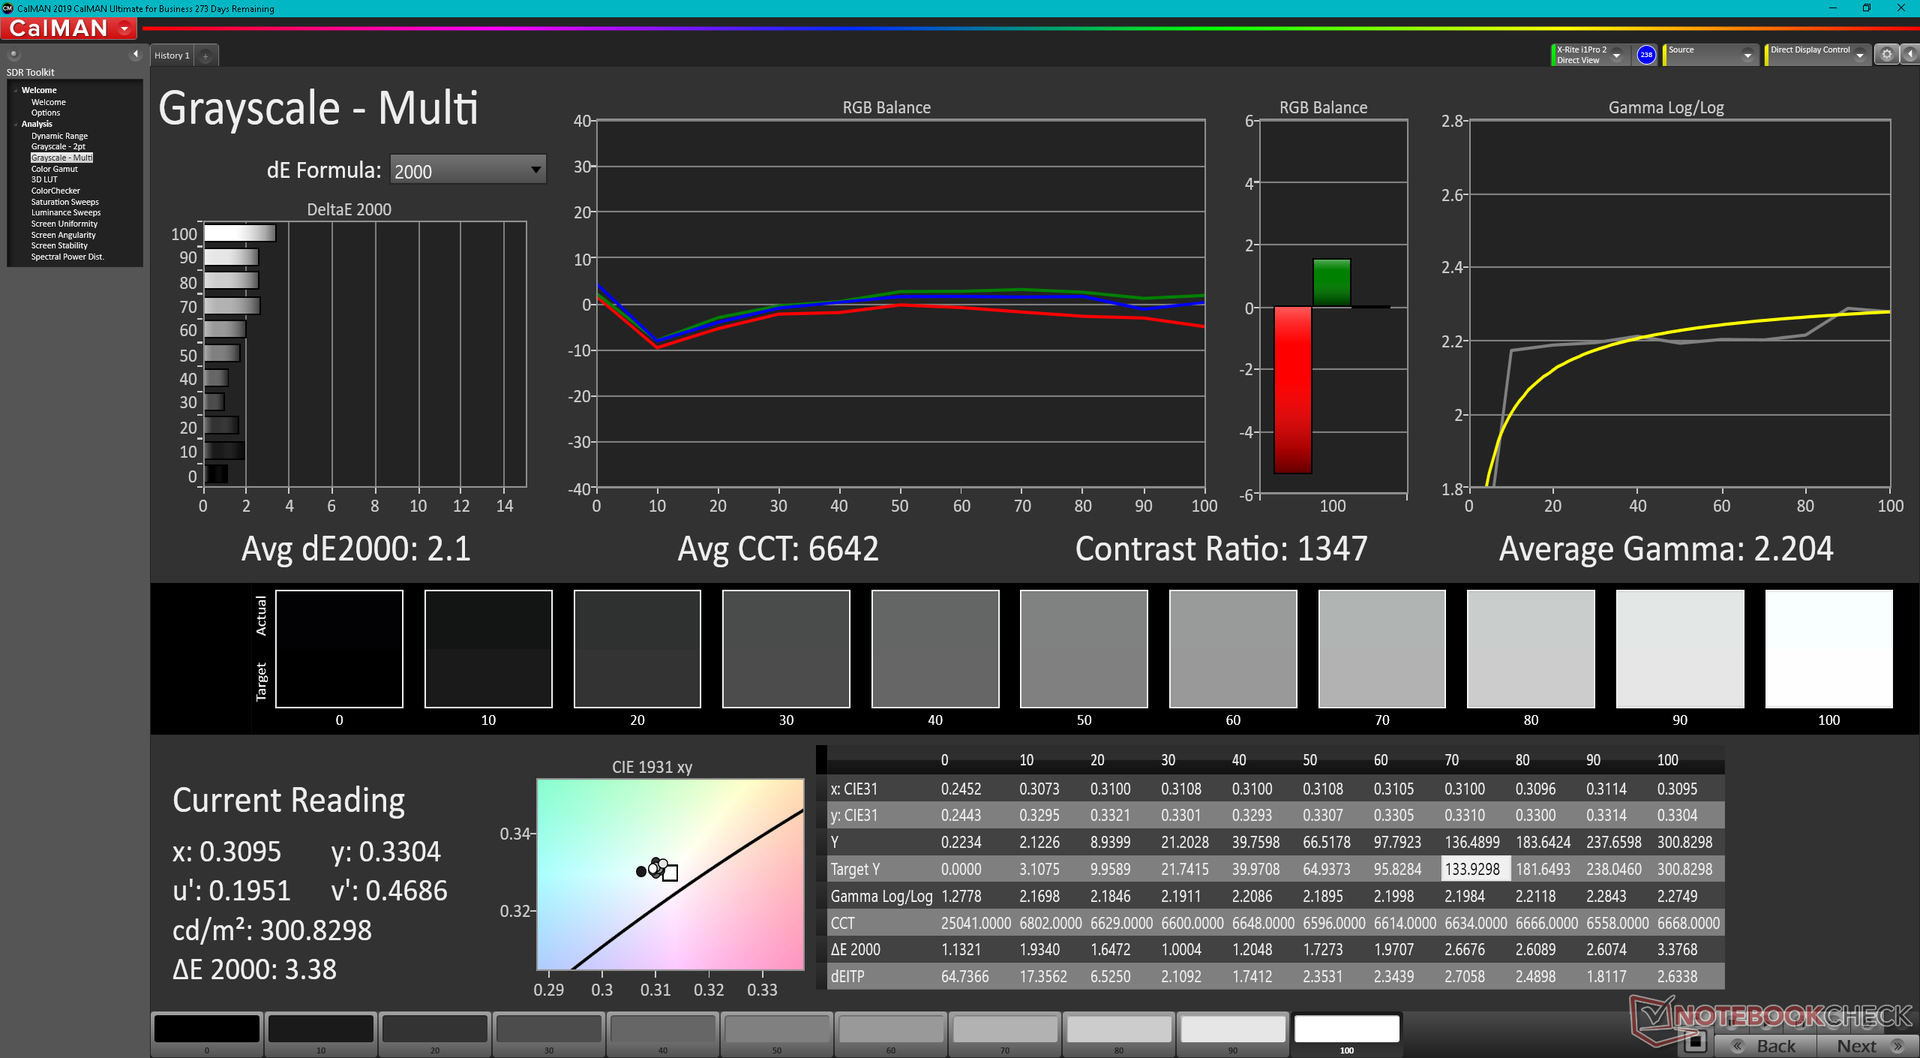
La température des couleurs est légèrement trop froide. Les valeurs moyennes du deltaE des niveaux de gris et des couleurs s'amélioreraient de 4,8 et 2,39 à 2,1 et 1,49, respectivement, après étalonnage avec notre colorimètre X-Rite.
Temps de réponse de l'écran
| ↔ Temps de réponse noir à blanc | ||
|---|---|---|
| 11.6 ms ... hausse ↗ et chute ↘ combinées | ↗ 5.6 ms hausse | 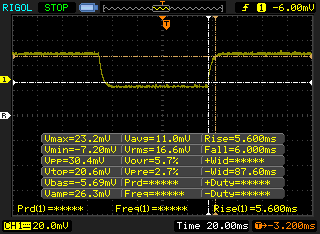 |
| ↘ 6 ms chute | ||
| L'écran montre de bons temps de réponse, mais insuffisant pour du jeu compétitif. En comparaison, tous les appareils testés affichent entre 0.1 (minimum) et 240 (maximum) ms. » 31 % des appareils testés affichent de meilleures performances. Cela signifie que les latences relevées sont meilleures que la moyenne (19.8 ms) de tous les appareils testés. | ||
| ↔ Temps de réponse gris 50% à gris 80% | ||
| 10.4 ms ... hausse ↗ et chute ↘ combinées | ↗ 5.2 ms hausse | 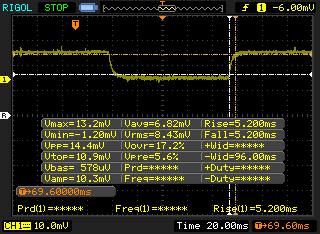 |
| ↘ 5.2 ms chute | ||
| L'écran montre de bons temps de réponse, mais insuffisant pour du jeu compétitif. En comparaison, tous les appareils testés affichent entre 0.165 (minimum) et 636 (maximum) ms. » 24 % des appareils testés affichent de meilleures performances. Cela signifie que les latences relevées sont meilleures que la moyenne (31 ms) de tous les appareils testés. | ||
Scintillement / MLI (Modulation de largeur d'impulsion)
| Scintillement / MLI (Modulation de largeur d'impulsion) décelé | 22730 Hz | ≤ 24 Niveau de luminosité | 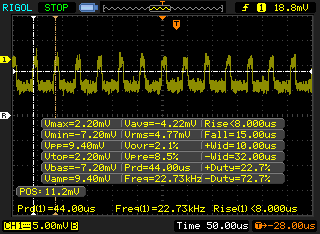 |
Le rétroéclairage de l'écran scintille à la fréquence de 22730 Hz (certainement du fait de l'utilisation d'une MDI - Modulation de largeur d'impulsion) à un niveau de luminosité inférieur ou égal à 24 % . Aucun scintillement ne devrait être perceptible au-dessus de cette valeur. La fréquence de rafraîchissement de 22730 Hz est élevée, la grande majorité des utilisateurs ne devrait pas percevoir de scintillements et être sujette à une fatigue oculaire accrue. En comparaison, 52 % des appareils testés n'emploient pas MDI pour assombrir leur écran. Nous avons relevé une moyenne à 7754 (minimum : 5 - maximum : 343500) Hz dans le cas où une MDI était active. | |||
Performance
Conditions d'essai
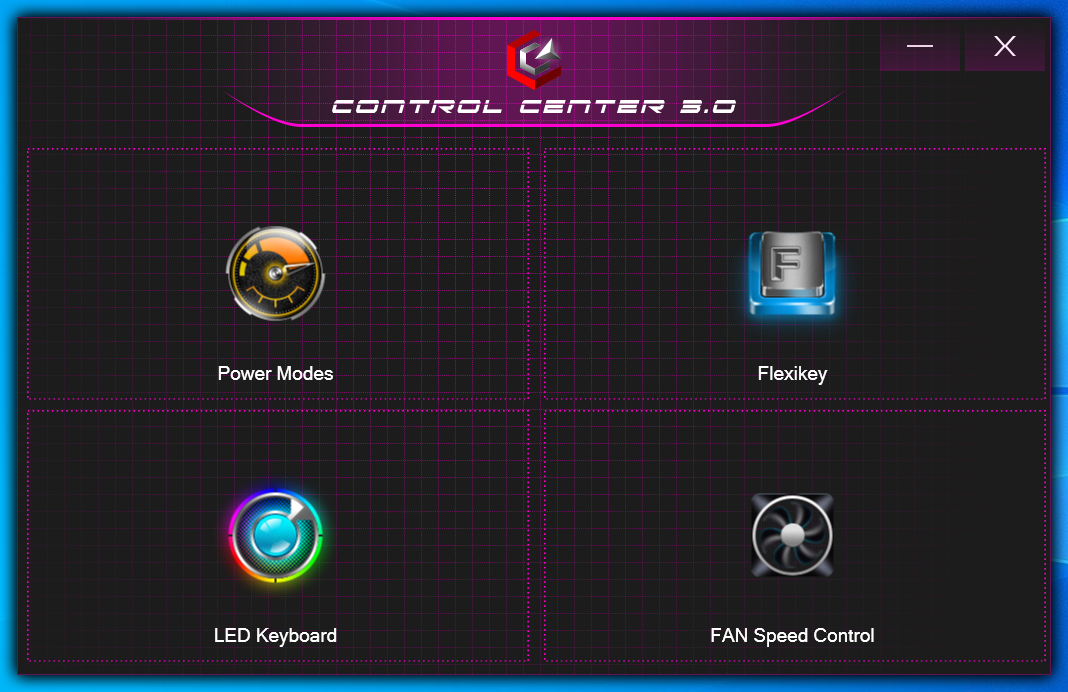
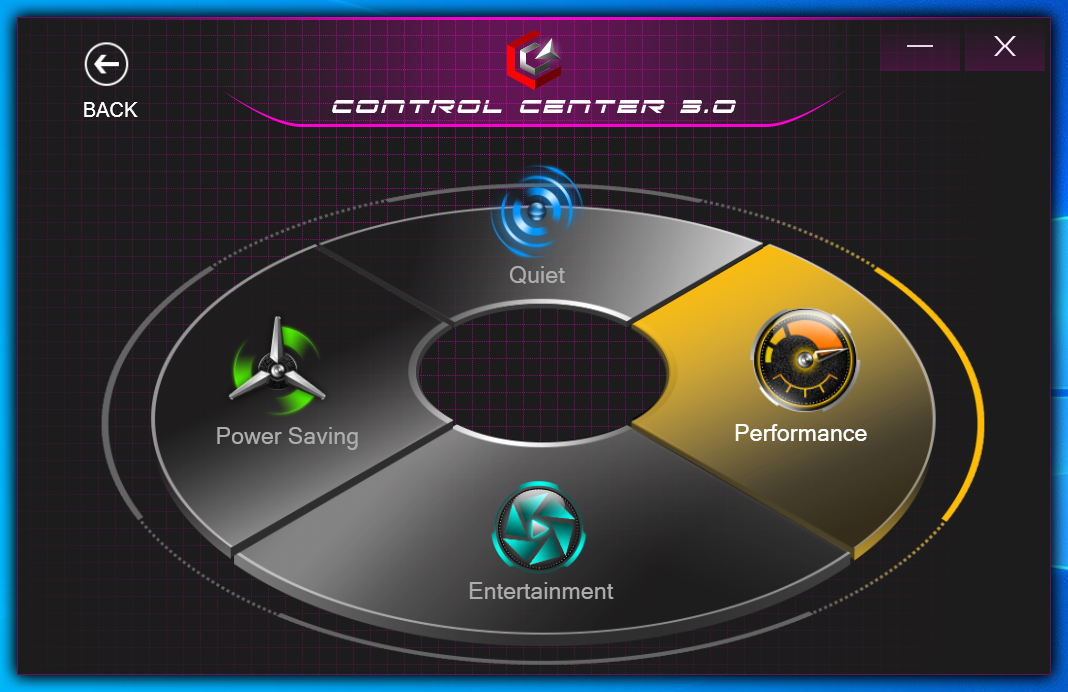
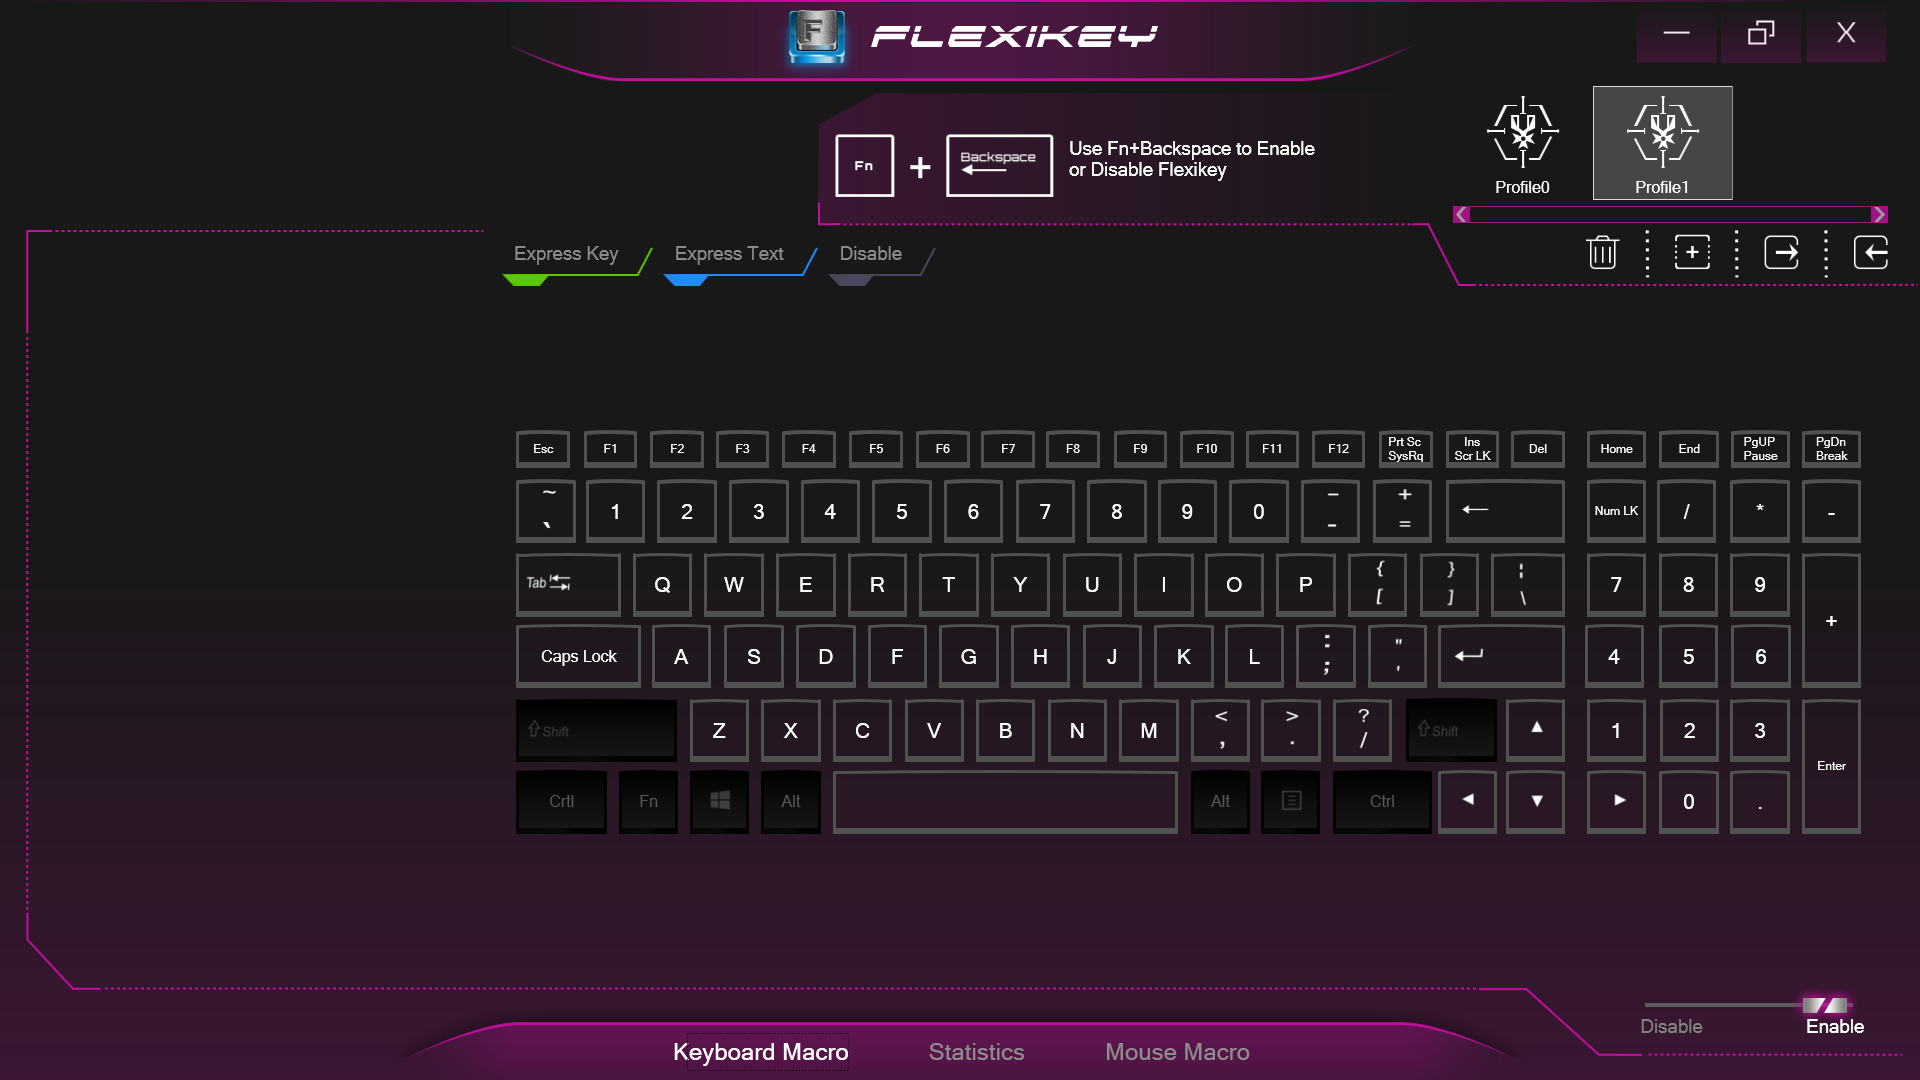
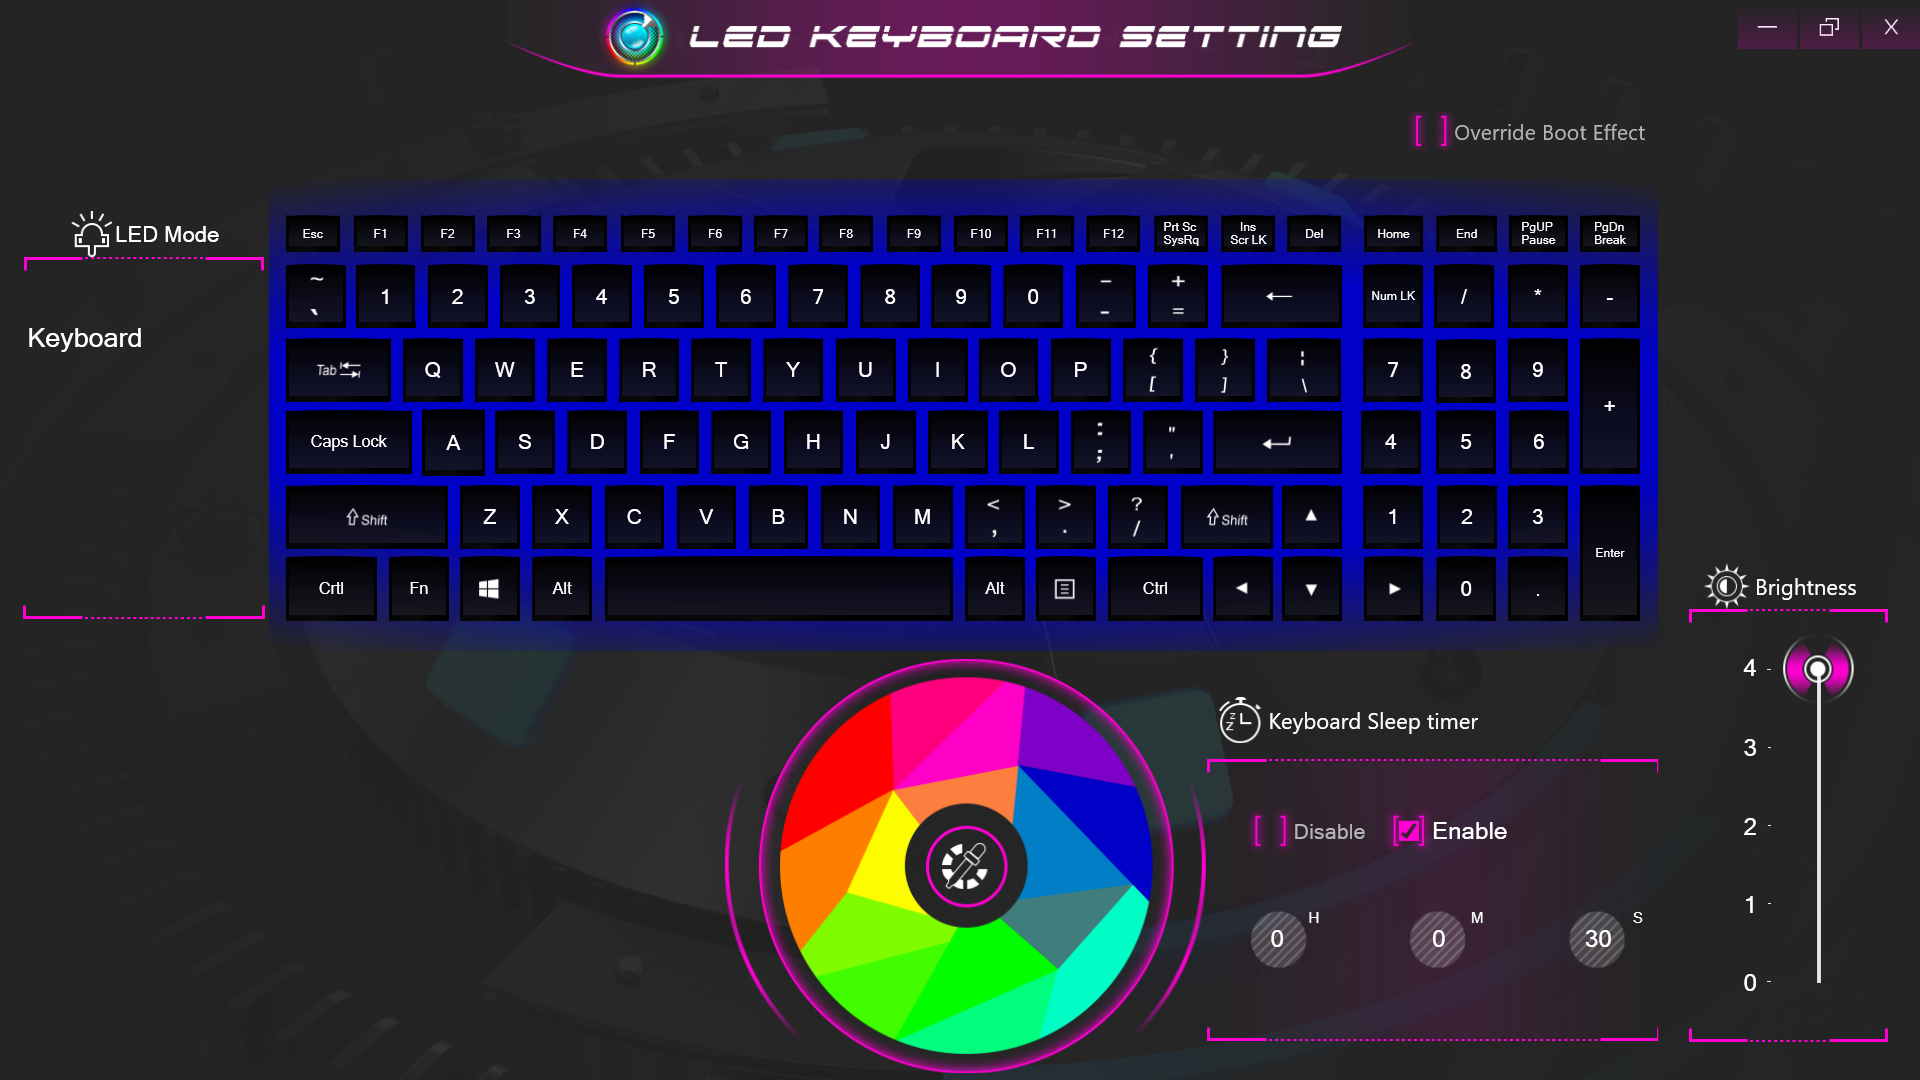
Notre appareil a été réglé en mode Performance via le logiciel Control Center 3.0 avant d'effectuer nos tests de performances ci-dessous pour obtenir les meilleurs résultats possibles. Les utilisateurs doivent se familiariser avec ce logiciel car des fonctions importantes sont activées ici, notamment l'éclairage du clavier, le contrôle du ventilateur, etc.
Gardez à l'esprit qu'il n'y a pas de MUX sur le RX315.

Processeur
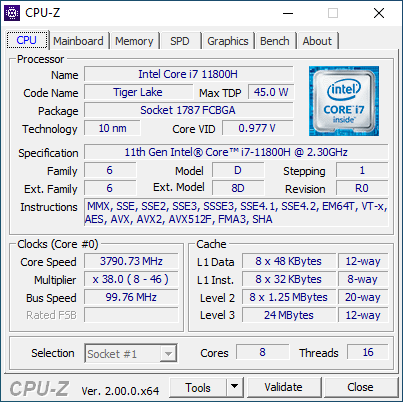
Le site Core i7-11800H a les performances que nous attendons par rapport aux autres ordinateurs portables équipés du même processeur. Aucune autre option de processeur n'est actuellement disponible.
Cinebench R15 Multi Loop
Cinebench R20: CPU (Multi Core) | CPU (Single Core)
Cinebench R15: CPU Multi 64Bit | CPU Single 64Bit
Blender: v2.79 BMW27 CPU
7-Zip 18.03: 7z b 4 | 7z b 4 -mmt1
Geekbench 5.5: Multi-Core | Single-Core
HWBOT x265 Benchmark v2.2: 4k Preset
LibreOffice : 20 Documents To PDF
R Benchmark 2.5: Overall mean
| Cinebench R20 / CPU (Multi Core) | |
| Corsair One i300 | |
| MSI Stealth GS66 12UGS | |
| MSI Vector GP66 12UGS | |
| Eurocom Nightsky ARX315 | |
| Schenker XMG Apex 15 NH57E PS | |
| Eurocom RX315 NH57AF1 | |
| Moyenne Intel Core i7-11800H (2498 - 5408, n=50) | |
| Schenker XMG Core 15 Ampere | |
| Alienware m15 R4 RTX 3080 | |
| Gigabyte G5 GD | |
| Razer Blade 15 Advanced Model Early 2021 | |
| Cinebench R20 / CPU (Single Core) | |
| Corsair One i300 | |
| MSI Vector GP66 12UGS | |
| MSI Stealth GS66 12UGS | |
| Eurocom Nightsky ARX315 | |
| Eurocom RX315 NH57AF1 | |
| Moyenne Intel Core i7-11800H (520 - 586, n=47) | |
| Gigabyte G5 GD | |
| Schenker XMG Apex 15 NH57E PS | |
| Schenker XMG Core 15 Ampere | |
| Alienware m15 R4 RTX 3080 | |
| Razer Blade 15 Advanced Model Early 2021 | |
| Cinebench R15 / CPU Single 64Bit | |
| Corsair One i300 | |
| MSI Vector GP66 12UGS | |
| MSI Stealth GS66 12UGS | |
| Eurocom Nightsky ARX315 | |
| Schenker XMG Apex 15 NH57E PS | |
| Eurocom RX315 NH57AF1 | |
| Moyenne Intel Core i7-11800H (201 - 231, n=46) | |
| Gigabyte G5 GD | |
| Razer Blade 15 Advanced Model Early 2021 | |
| Alienware m15 R4 RTX 3080 | |
| Schenker XMG Core 15 Ampere | |
| HWBOT x265 Benchmark v2.2 / 4k Preset | |
| Corsair One i300 | |
| MSI Vector GP66 12UGS | |
| MSI Stealth GS66 12UGS | |
| Eurocom Nightsky ARX315 | |
| Schenker XMG Apex 15 NH57E PS | |
| Eurocom RX315 NH57AF1 | |
| Moyenne Intel Core i7-11800H (7.38 - 17.4, n=46) | |
| Schenker XMG Core 15 Ampere | |
| Alienware m15 R4 RTX 3080 | |
| Gigabyte G5 GD | |
| Razer Blade 15 Advanced Model Early 2021 | |
| LibreOffice / 20 Documents To PDF | |
| Alienware m15 R4 RTX 3080 | |
| Schenker XMG Core 15 Ampere | |
| Razer Blade 15 Advanced Model Early 2021 | |
| Schenker XMG Apex 15 NH57E PS | |
| Eurocom RX315 NH57AF1 | |
| Eurocom Nightsky ARX315 | |
| Moyenne Intel Core i7-11800H (38.6 - 59.9, n=45) | |
| Gigabyte G5 GD | |
| MSI Stealth GS66 12UGS | |
| MSI Vector GP66 12UGS | |
| Corsair One i300 | |
* ... Moindre est la valeur, meilleures sont les performances
AIDA64: FP32 Ray-Trace | FPU Julia | CPU SHA3 | CPU Queen | FPU SinJulia | FPU Mandel | CPU AES | CPU ZLib | FP64 Ray-Trace | CPU PhotoWorxx
| Performance rating | |
| Eurocom Nightsky ARX315 | |
| Alienware m15 R6, i7-11800H RTX 3080 | |
| Eurocom RX315 NH57AF1 | |
| Dell G15 5515 | |
| MSI Stealth GS66 12UGS | |
| Moyenne Intel Core i7-11800H | |
| Razer Blade 15 Advanced (Mid 2021) -9! | |
| AIDA64 / FP32 Ray-Trace | |
| Alienware m15 R6, i7-11800H RTX 3080 | |
| Eurocom RX315 NH57AF1 | |
| Dell G15 5515 | |
| Moyenne Intel Core i7-11800H (8772 - 15961, n=20) | |
| Eurocom Nightsky ARX315 | |
| MSI Stealth GS66 12UGS | |
| AIDA64 / FPU Julia | |
| Eurocom Nightsky ARX315 | |
| Dell G15 5515 | |
| Alienware m15 R6, i7-11800H RTX 3080 | |
| Eurocom RX315 NH57AF1 | |
| Moyenne Intel Core i7-11800H (39404 - 65636, n=20) | |
| MSI Stealth GS66 12UGS | |
| AIDA64 / CPU SHA3 | |
| Alienware m15 R6, i7-11800H RTX 3080 | |
| Eurocom RX315 NH57AF1 | |
| Moyenne Intel Core i7-11800H (2599 - 4439, n=20) | |
| MSI Stealth GS66 12UGS | |
| Eurocom Nightsky ARX315 | |
| Dell G15 5515 | |
| AIDA64 / CPU Queen | |
| Eurocom Nightsky ARX315 | |
| MSI Stealth GS66 12UGS | |
| Dell G15 5515 | |
| Alienware m15 R6, i7-11800H RTX 3080 | |
| Eurocom RX315 NH57AF1 | |
| Moyenne Intel Core i7-11800H (85233 - 91941, n=20) | |
| AIDA64 / FPU SinJulia | |
| Eurocom Nightsky ARX315 | |
| Dell G15 5515 | |
| MSI Stealth GS66 12UGS | |
| Alienware m15 R6, i7-11800H RTX 3080 | |
| Eurocom RX315 NH57AF1 | |
| Moyenne Intel Core i7-11800H (6420 - 9792, n=20) | |
| AIDA64 / FPU Mandel | |
| Eurocom Nightsky ARX315 | |
| Dell G15 5515 | |
| Alienware m15 R6, i7-11800H RTX 3080 | |
| Eurocom RX315 NH57AF1 | |
| Moyenne Intel Core i7-11800H (23365 - 39464, n=20) | |
| MSI Stealth GS66 12UGS | |
| AIDA64 / CPU AES | |
| Alienware m15 R6, i7-11800H RTX 3080 | |
| Eurocom RX315 NH57AF1 | |
| Eurocom Nightsky ARX315 | |
| Moyenne Intel Core i7-11800H (74617 - 149388, n=20) | |
| Dell G15 5515 | |
| MSI Stealth GS66 12UGS | |
| AIDA64 / CPU ZLib | |
| MSI Stealth GS66 12UGS | |
| Eurocom Nightsky ARX315 | |
| Alienware m15 R6, i7-11800H RTX 3080 | |
| Eurocom RX315 NH57AF1 | |
| Dell G15 5515 | |
| Moyenne Intel Core i7-11800H (461 - 830, n=43) | |
| Razer Blade 15 Advanced (Mid 2021) | |
| AIDA64 / FP64 Ray-Trace | |
| Alienware m15 R6, i7-11800H RTX 3080 | |
| Eurocom RX315 NH57AF1 | |
| Dell G15 5515 | |
| Moyenne Intel Core i7-11800H (4545 - 8717, n=21) | |
| Eurocom Nightsky ARX315 | |
| MSI Stealth GS66 12UGS | |
| AIDA64 / CPU PhotoWorxx | |
| MSI Stealth GS66 12UGS | |
| Alienware m15 R6, i7-11800H RTX 3080 | |
| Eurocom RX315 NH57AF1 | |
| Moyenne Intel Core i7-11800H (11898 - 26757, n=21) | |
| Eurocom Nightsky ARX315 | |
| Dell G15 5515 | |
Performance du système
| PCMark 10 / Score | |
| MSI Stealth GS66 12UGS | |
| Razer Blade 15 Advanced (Mid 2021) | |
| Eurocom Nightsky ARX315 | |
| Alienware m15 R6, i7-11800H RTX 3080 | |
| Eurocom RX315 NH57AF1 | |
| Moyenne Intel Core i7-11800H, NVIDIA GeForce RTX 3070 Laptop GPU (6126 - 7311, n=11) | |
| Dell G15 5515 | |
| PCMark 10 / Essentials | |
| Razer Blade 15 Advanced (Mid 2021) | |
| MSI Stealth GS66 12UGS | |
| Eurocom Nightsky ARX315 | |
| Eurocom RX315 NH57AF1 | |
| Moyenne Intel Core i7-11800H, NVIDIA GeForce RTX 3070 Laptop GPU (9248 - 10832, n=11) | |
| Alienware m15 R6, i7-11800H RTX 3080 | |
| Dell G15 5515 | |
| PCMark 10 / Productivity | |
| MSI Stealth GS66 12UGS | |
| Eurocom Nightsky ARX315 | |
| Alienware m15 R6, i7-11800H RTX 3080 | |
| Eurocom RX315 NH57AF1 | |
| Moyenne Intel Core i7-11800H, NVIDIA GeForce RTX 3070 Laptop GPU (8571 - 9669, n=11) | |
| Razer Blade 15 Advanced (Mid 2021) | |
| Dell G15 5515 | |
| PCMark 10 / Digital Content Creation | |
| MSI Stealth GS66 12UGS | |
| Razer Blade 15 Advanced (Mid 2021) | |
| Alienware m15 R6, i7-11800H RTX 3080 | |
| Eurocom Nightsky ARX315 | |
| Eurocom RX315 NH57AF1 | |
| Moyenne Intel Core i7-11800H, NVIDIA GeForce RTX 3070 Laptop GPU (7627 - 10851, n=11) | |
| Dell G15 5515 | |
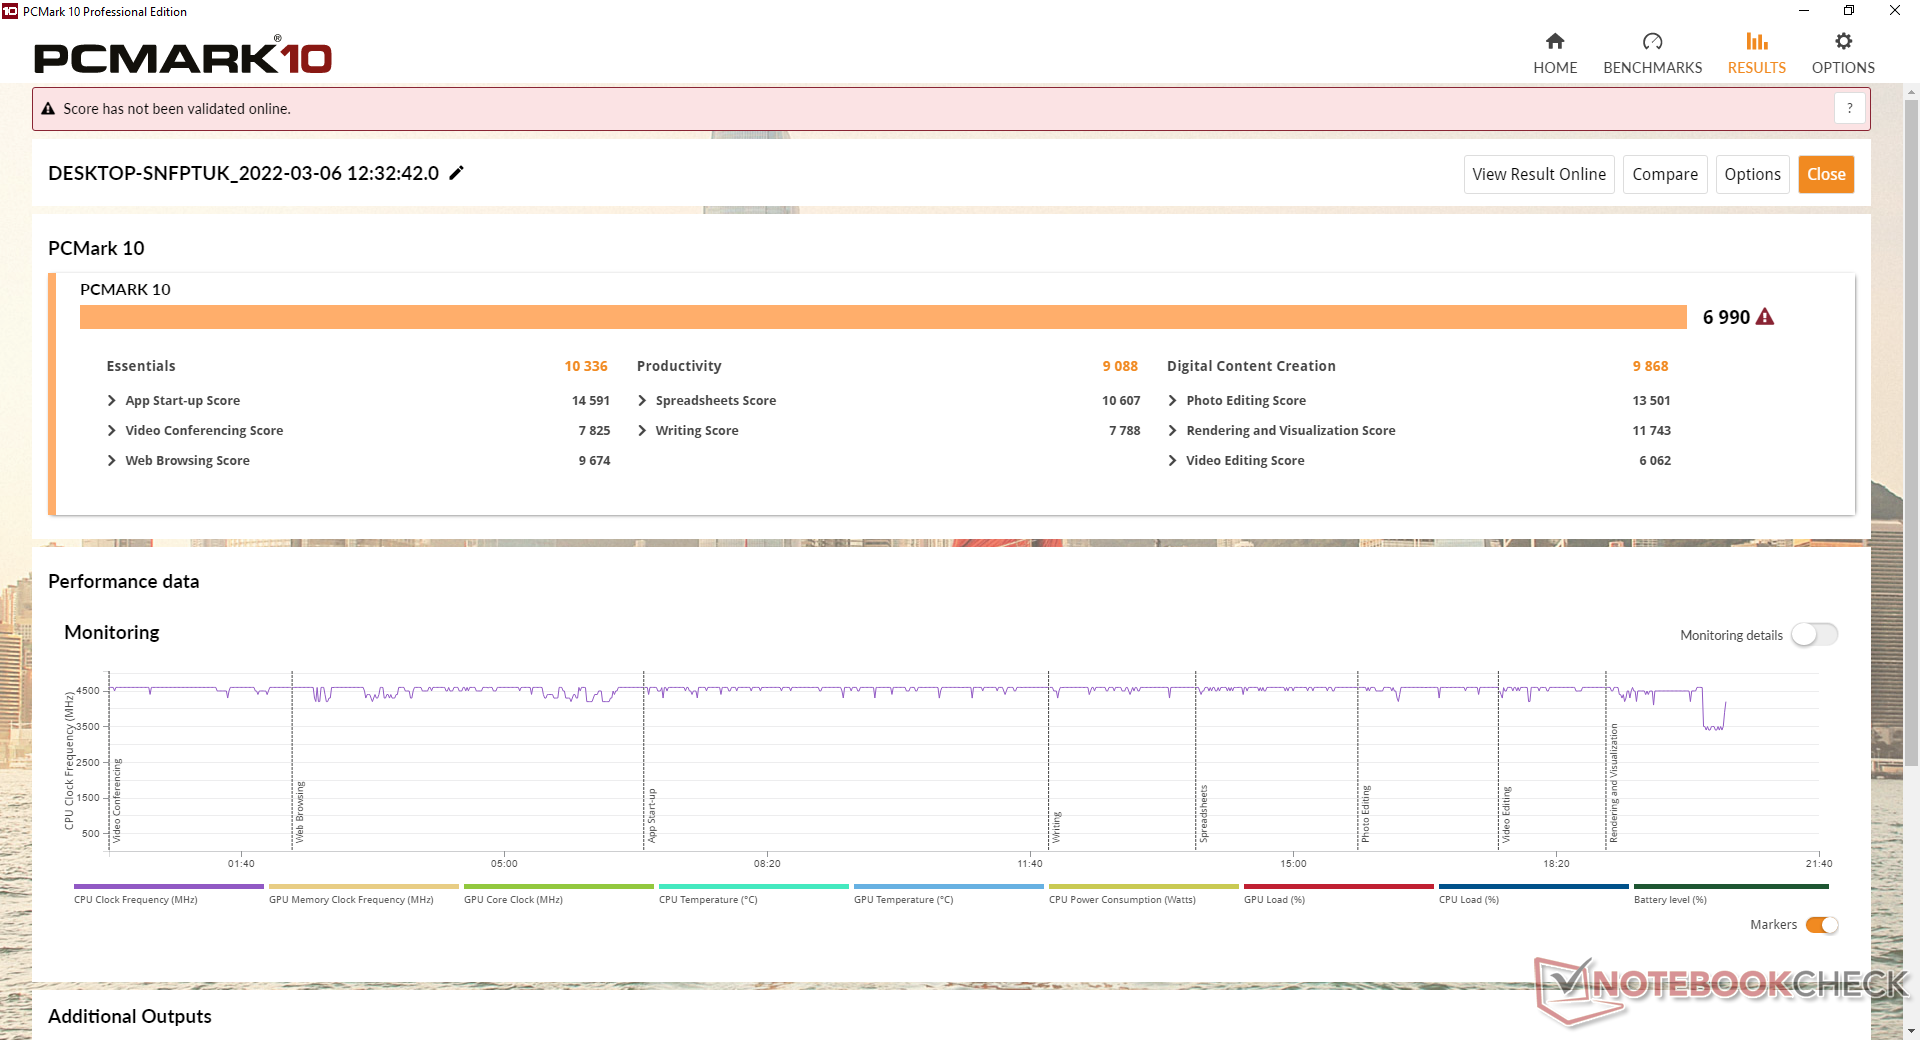
| PCMark 10 Score | 6990 points | |
Aide | ||
| AIDA64 / Memory Copy | |
| MSI Stealth GS66 12UGS | |
| Alienware m15 R6, i7-11800H RTX 3080 | |
| Eurocom RX315 NH57AF1 | |
| Moyenne Intel Core i7-11800H (24508 - 48144, n=21) | |
| Eurocom Nightsky ARX315 | |
| Dell G15 5515 | |
| AIDA64 / Memory Read | |
| MSI Stealth GS66 12UGS | |
| Alienware m15 R6, i7-11800H RTX 3080 | |
| Eurocom RX315 NH57AF1 | |
| Eurocom Nightsky ARX315 | |
| Moyenne Intel Core i7-11800H (25882 - 50365, n=20) | |
| Dell G15 5515 | |
| AIDA64 / Memory Write | |
| MSI Stealth GS66 12UGS | |
| Eurocom Nightsky ARX315 | |
| Alienware m15 R6, i7-11800H RTX 3080 | |
| Eurocom RX315 NH57AF1 | |
| Moyenne Intel Core i7-11800H (22240 - 46214, n=20) | |
| Dell G15 5515 | |
| AIDA64 / Memory Latency | |
| Alienware m15 R6, i7-11800H RTX 3080 | |
| MSI Stealth GS66 12UGS | |
| Eurocom RX315 NH57AF1 | |
| Dell G15 5515 | |
| Eurocom Nightsky ARX315 | |
| Moyenne Intel Core i7-11800H (71.9 - 104.1, n=44) | |
| Razer Blade 15 Advanced (Mid 2021) | |
* ... Moindre est la valeur, meilleures sont les performances
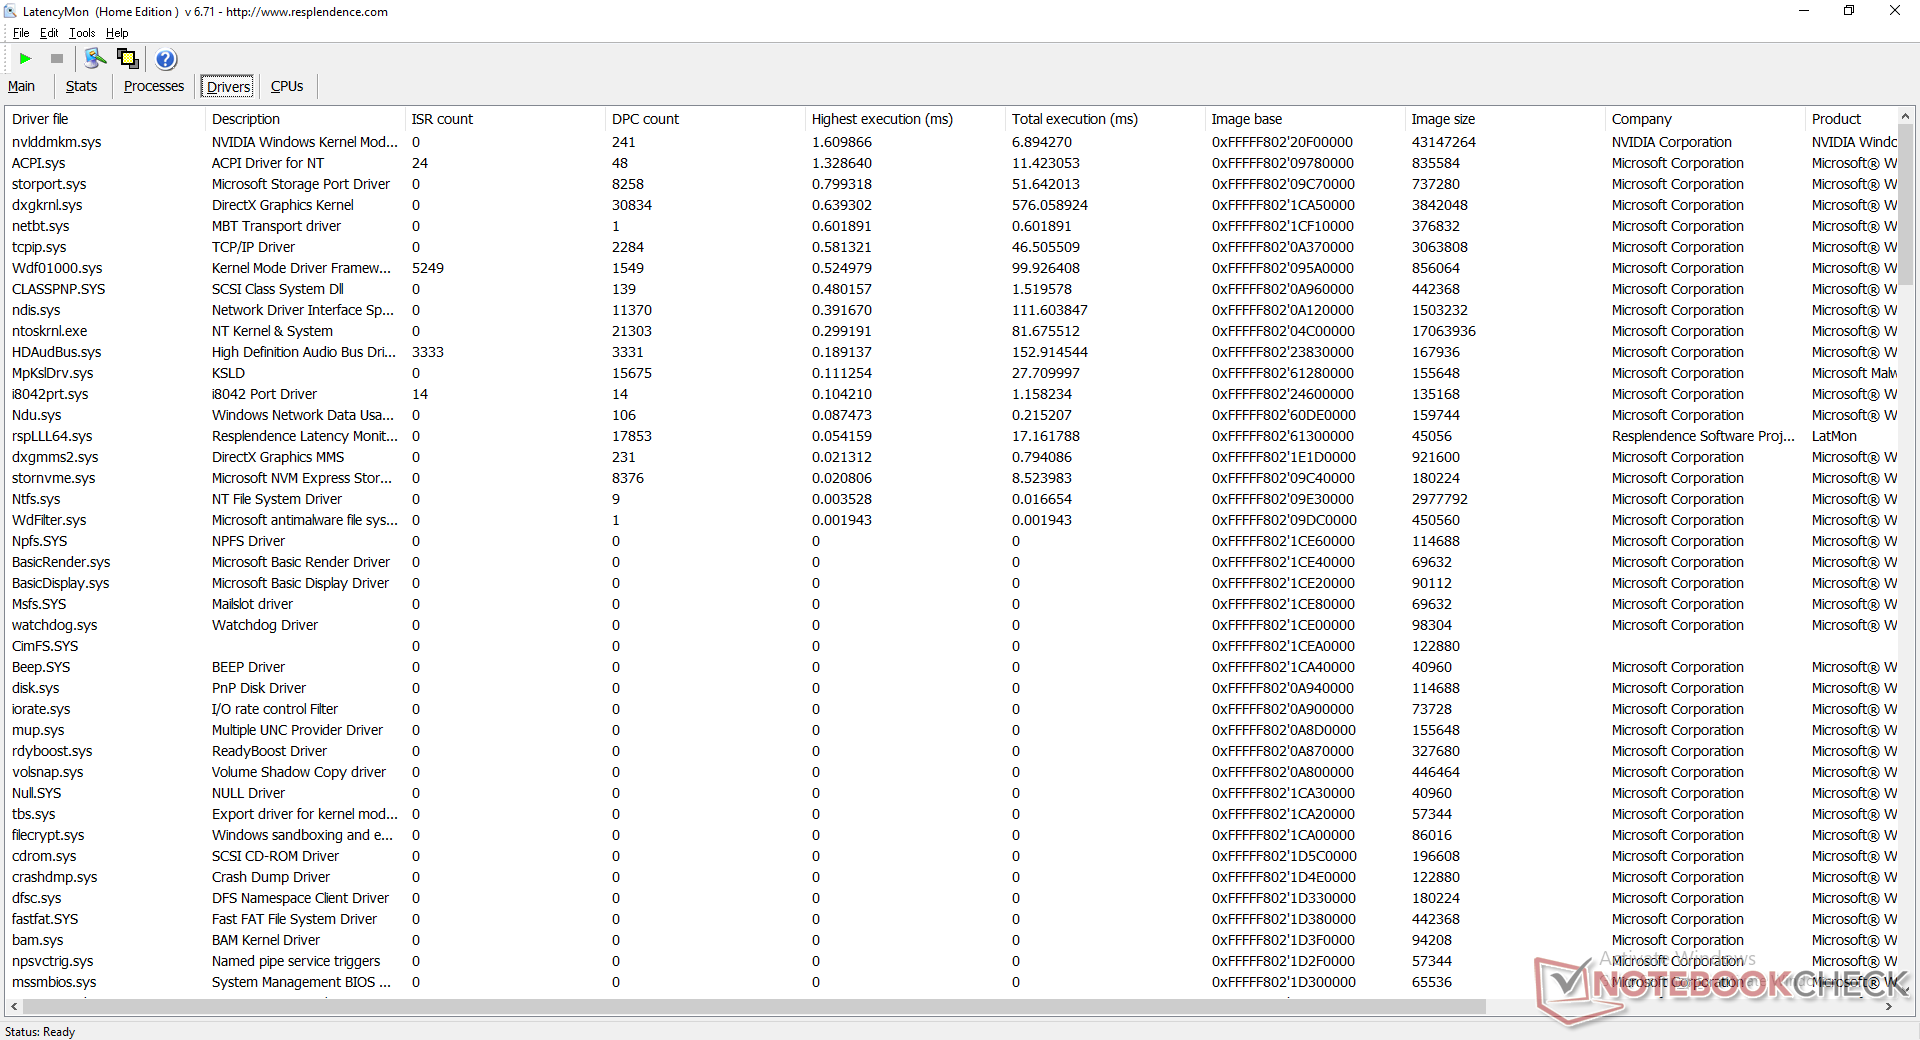
Latence DPC
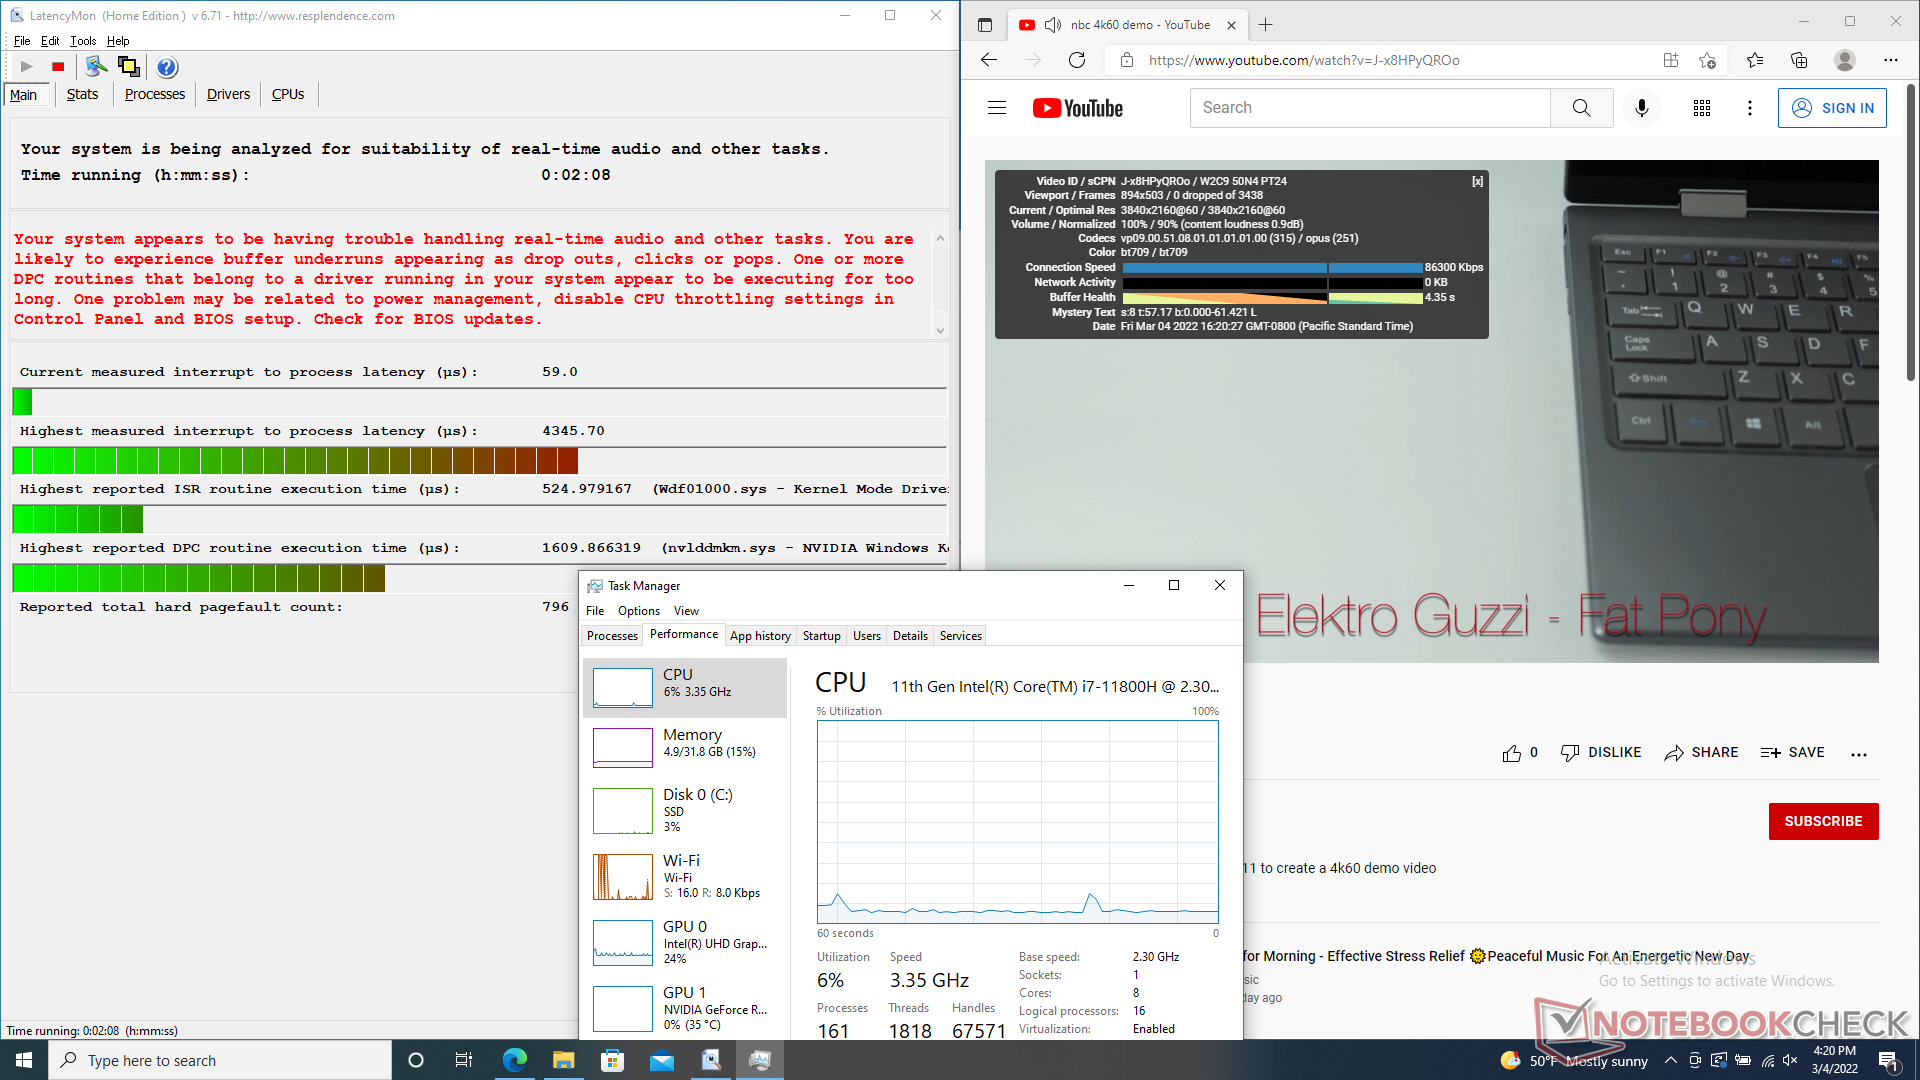
LatencyMon révèle des problèmes de DPC lors de l'ouverture de plusieurs onglets de navigateur sur notre page d'accueil. la lecture de vidéos 4K UHD à 60 FPS est par ailleurs fluide, sans perte d'images.
| DPC Latencies / LatencyMon - interrupt to process latency (max), Web, Youtube, Prime95 | |
| Razer Blade 15 Advanced (Mid 2021) | |
| Eurocom RX315 NH57AF1 | |
| MSI Stealth GS66 12UGS | |
| Alienware m15 R6, i7-11800H RTX 3080 | |
| Dell G15 5515 | |
| Eurocom Nightsky ARX315 | |
* ... Moindre est la valeur, meilleures sont les performances
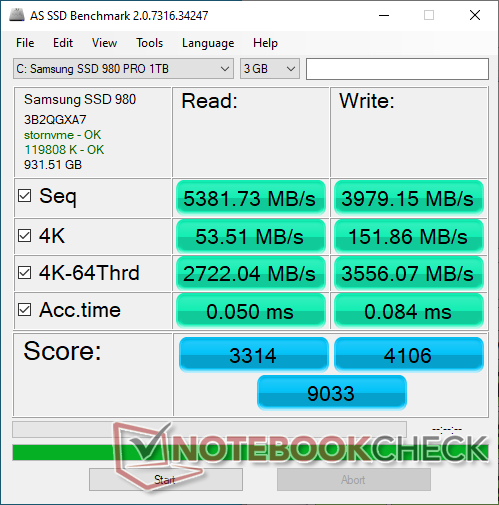
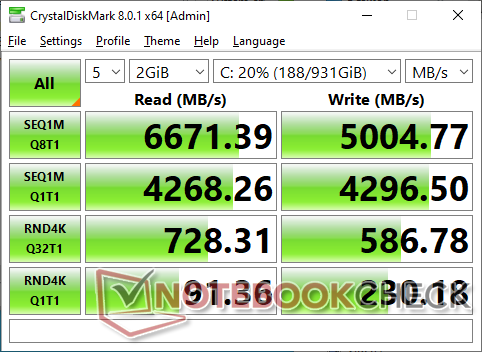
Périphériques de stockage
Le Samsung SSD 980 Pro 1 To PCIe4 x4 de notre unité peut atteindre des taux de transfert allant jusqu'à 6500 Mo/s. La durabilité des performances est également assez bonne, puisque ce taux maximal ne tombe que légèrement à 5900 Mo/s au cours du dernier tiers de notre test de stress DiskSpd.

* ... Moindre est la valeur, meilleures sont les performances
Disk Throttling: DiskSpd Read Loop, Queue Depth 8
Performances du GPU
La 105 W GeForce RTX 3070 est environ 15 à 20 % plus lente que la nouvelle GeForce RTX 3070 Ti. Les performances globales sont conformes à nos attentes par rapport aux autres ordinateurs portables équipés du même GPU RTX 3070.
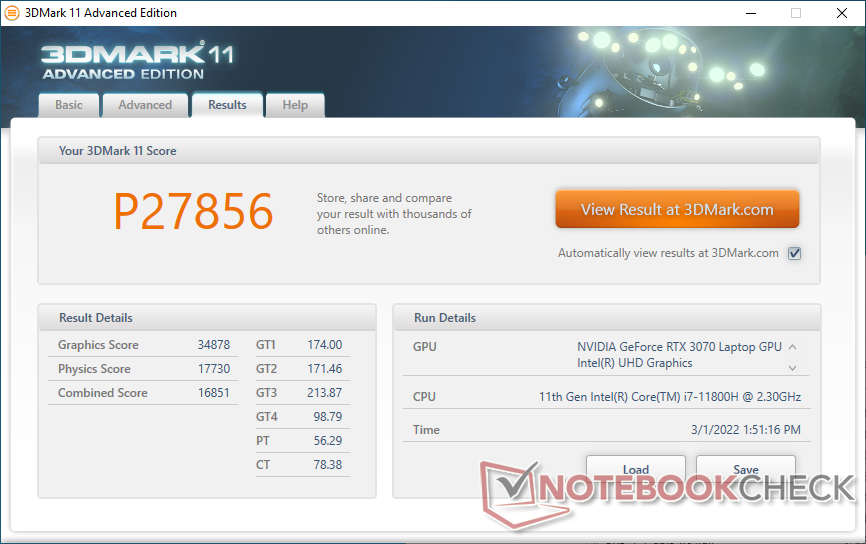
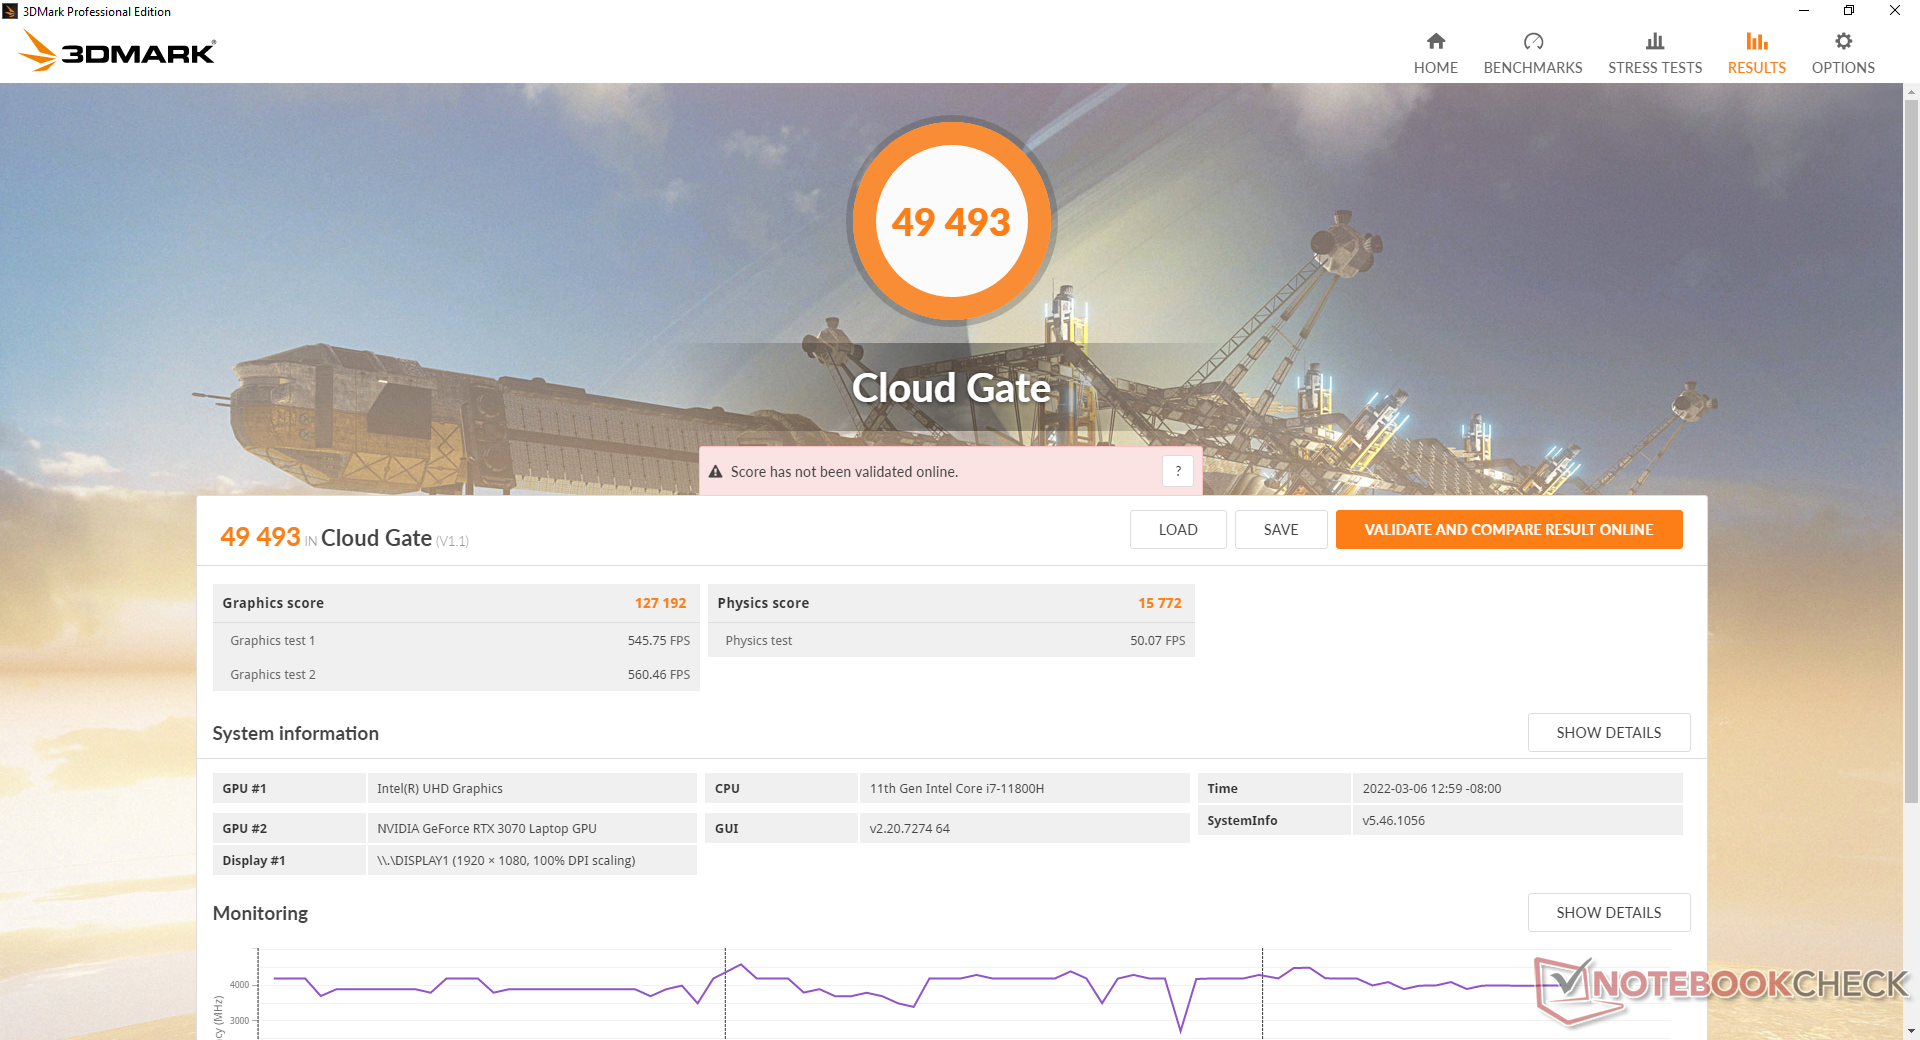
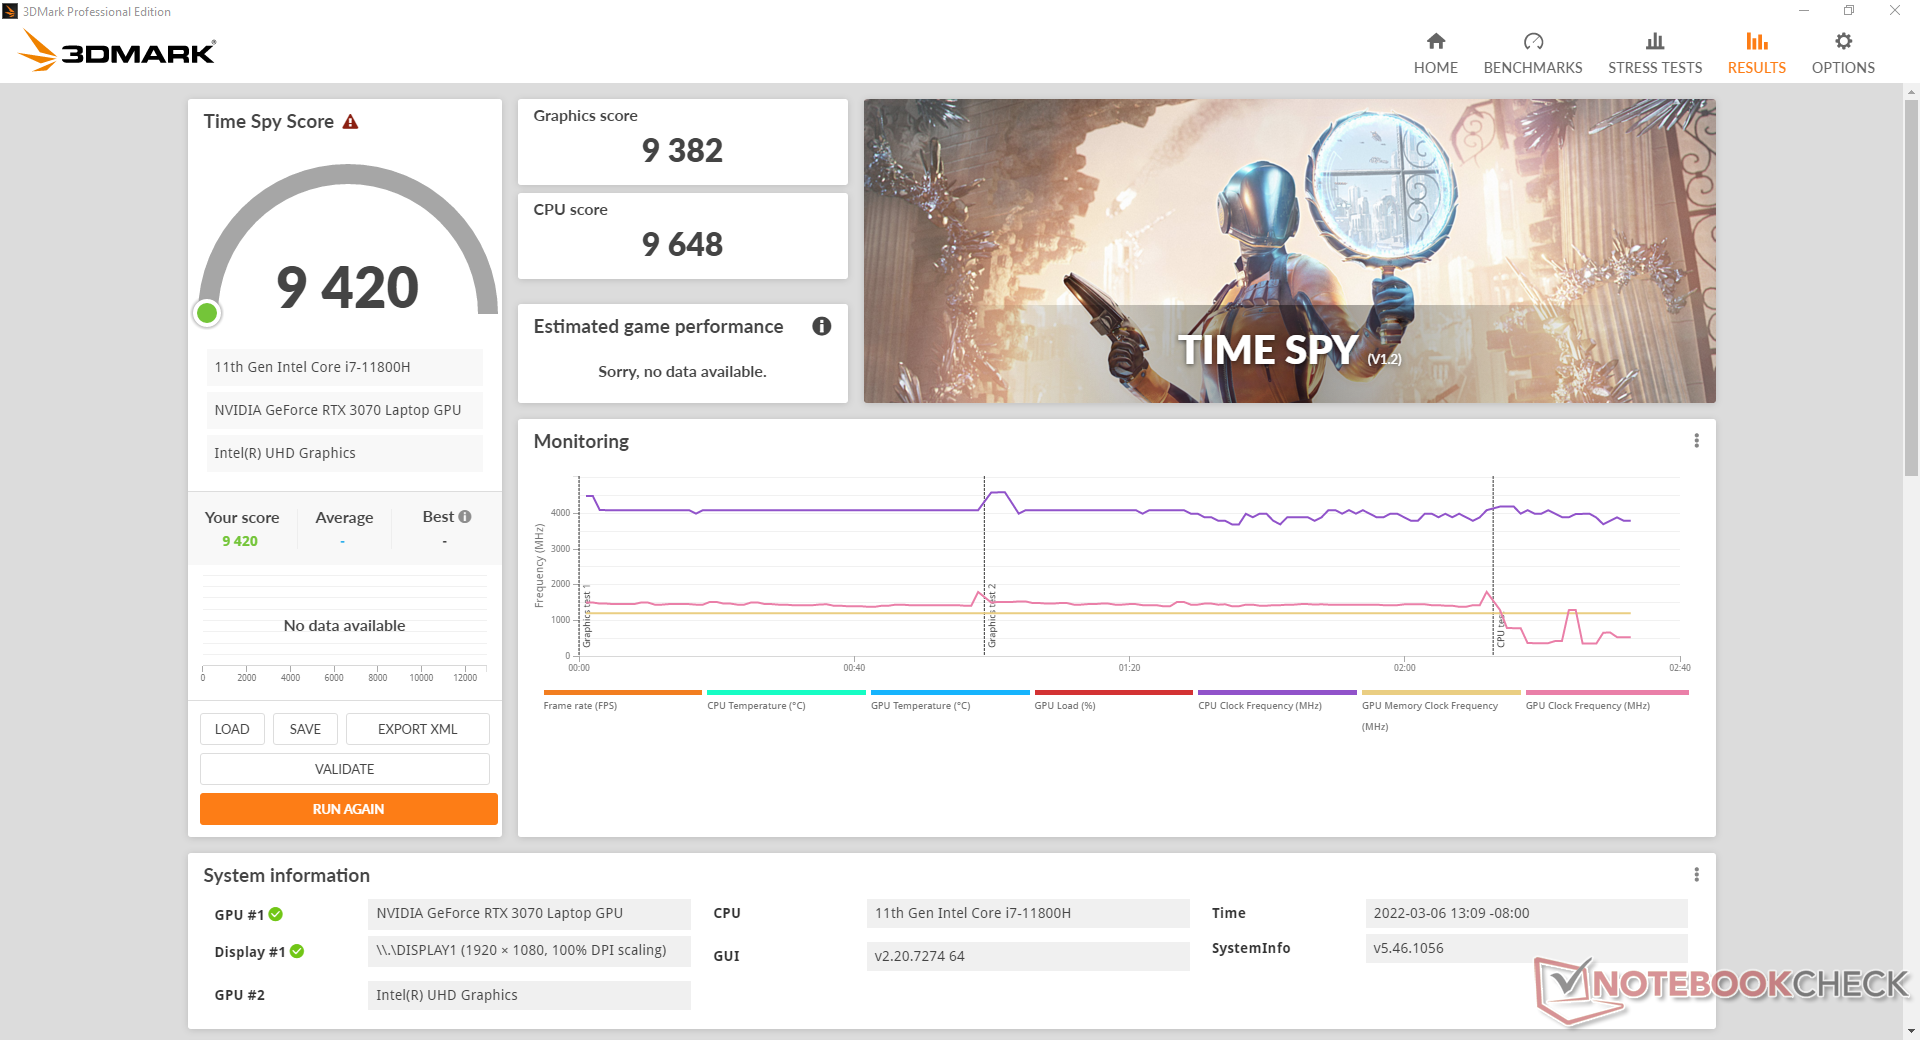
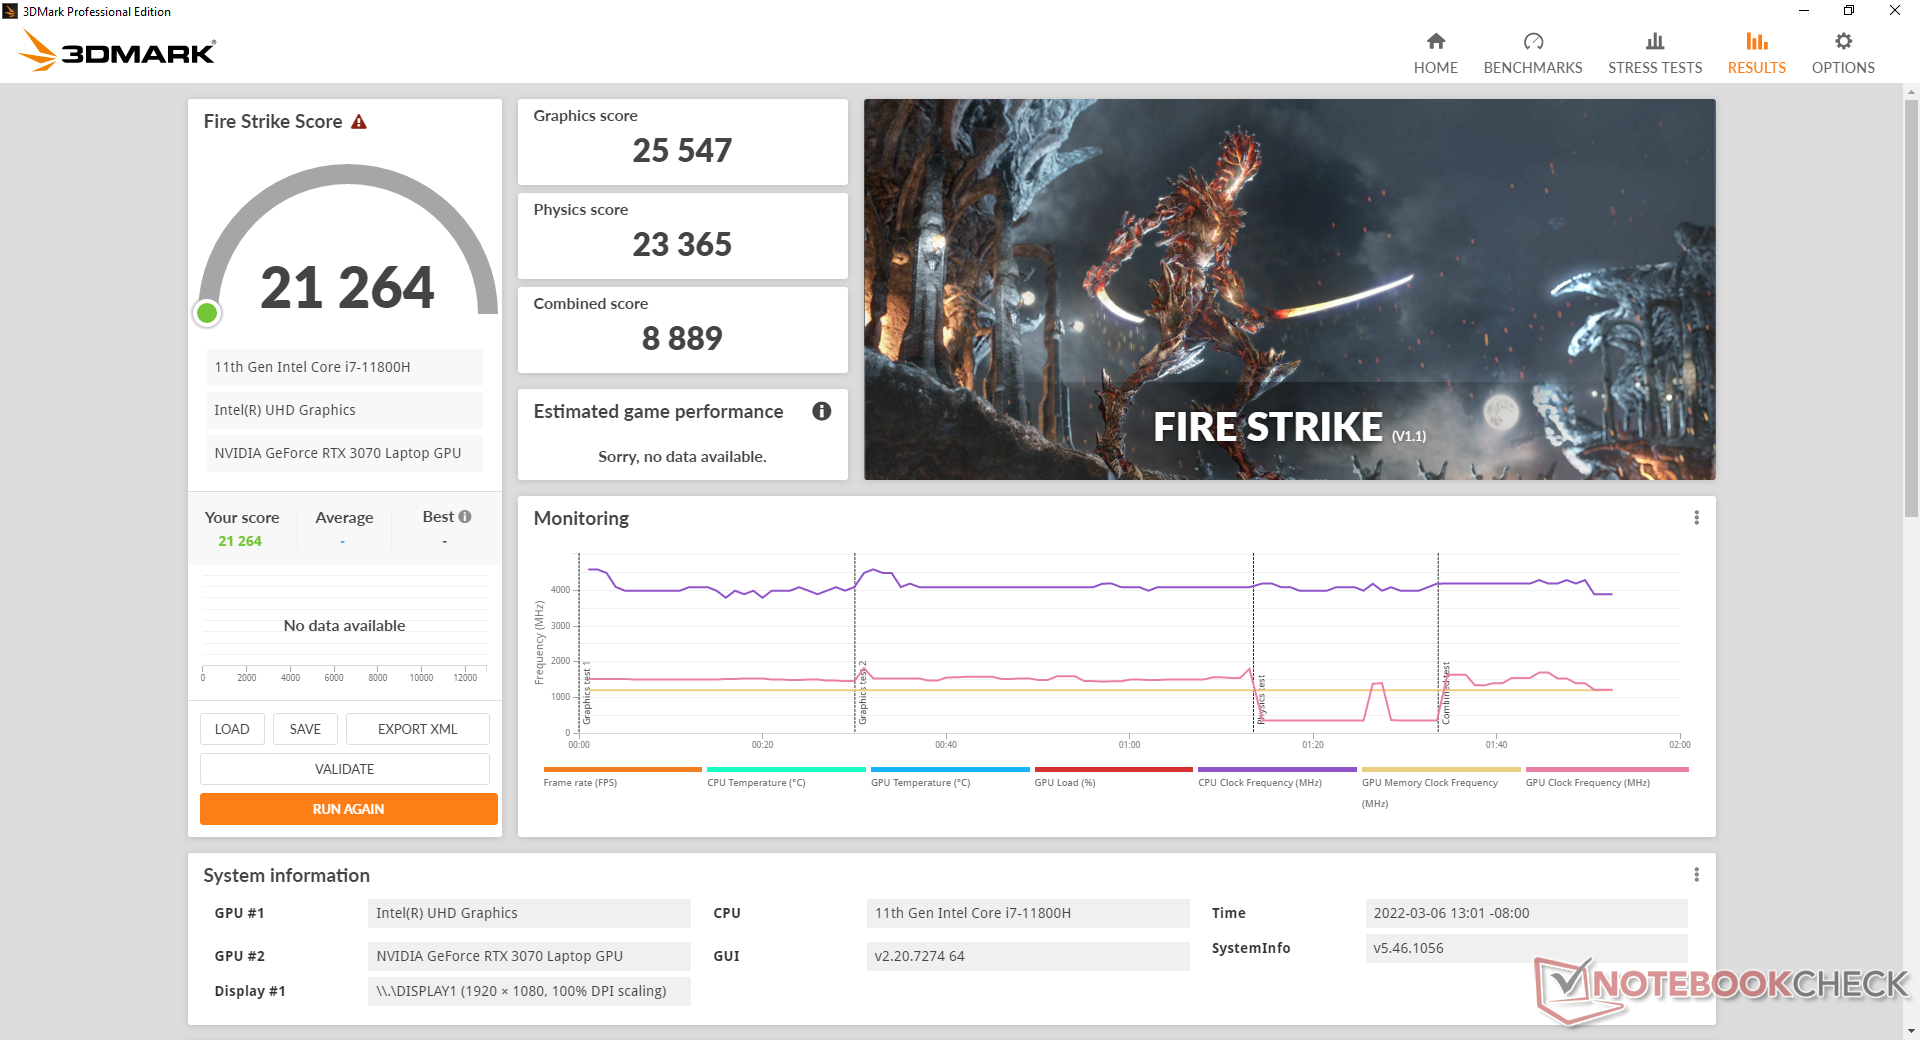
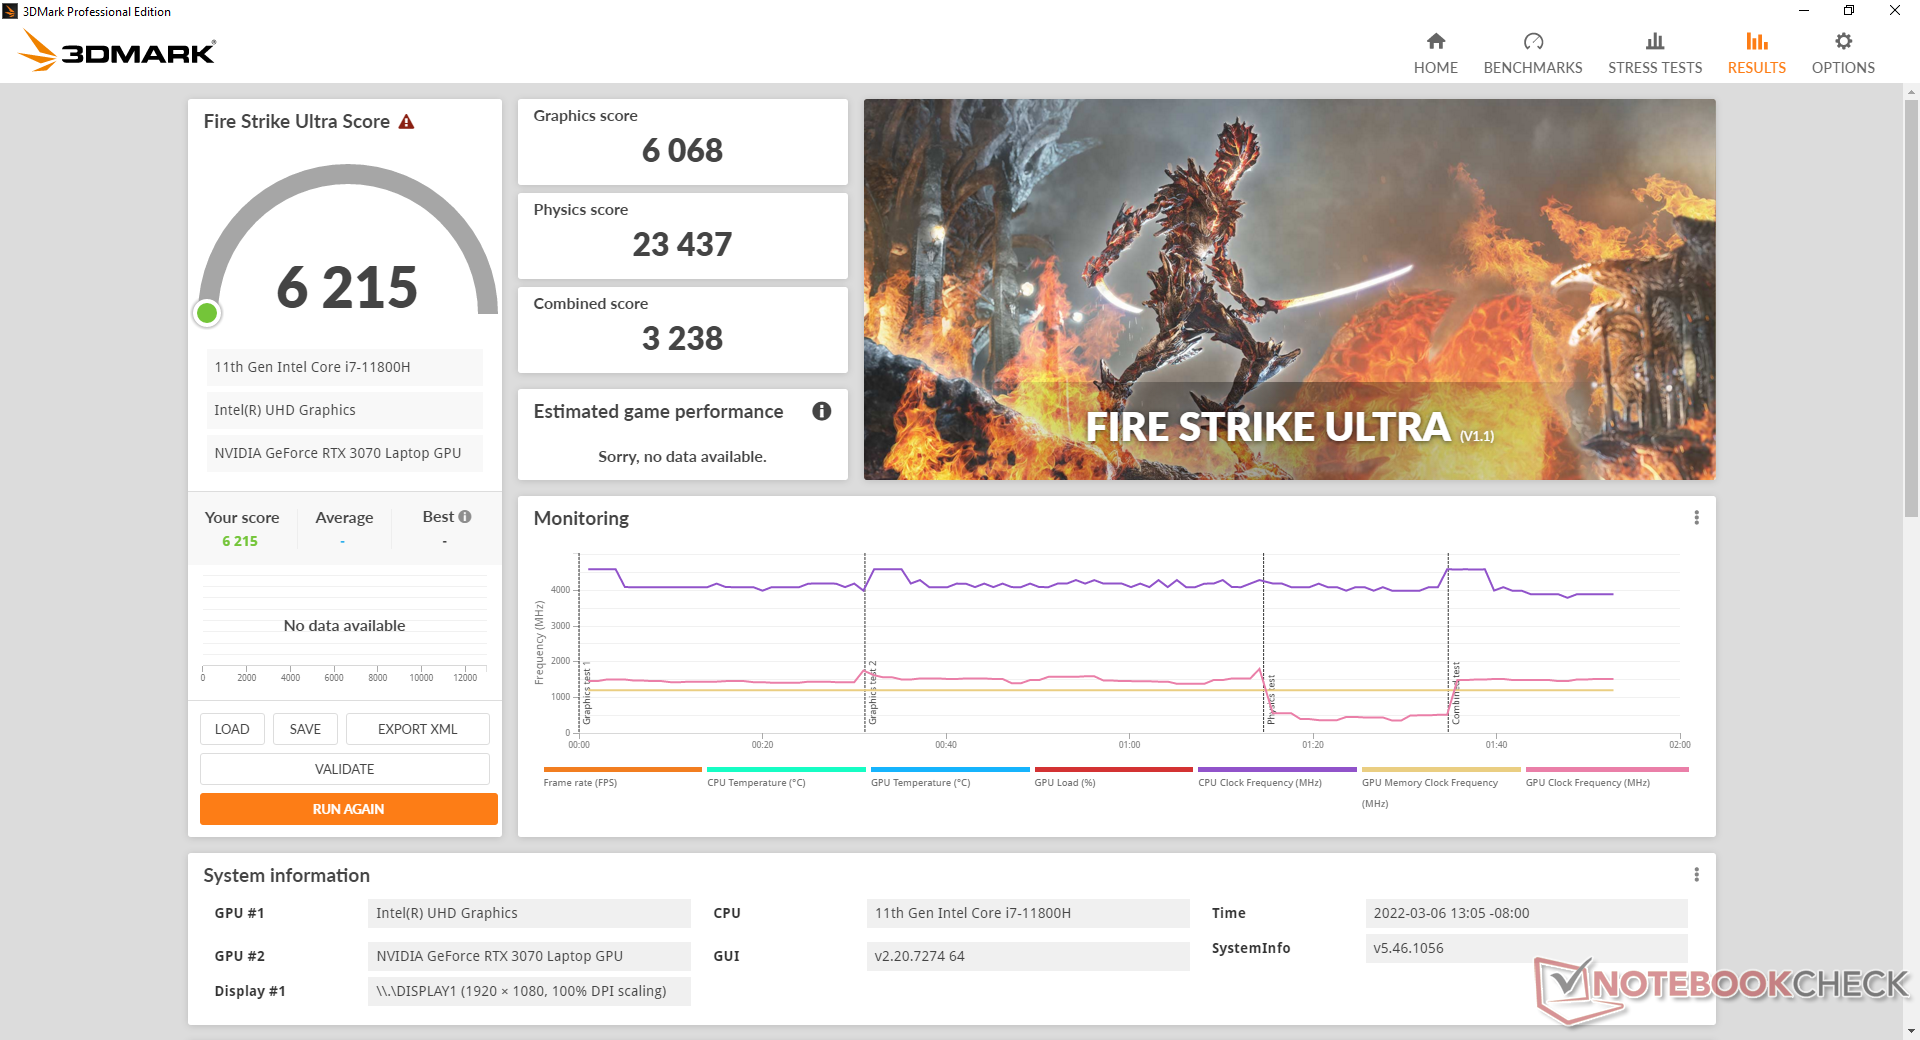
| 3DMark 11 Performance | 27856 points | |
| 3DMark Cloud Gate Standard Score | 49493 points | |
| 3DMark Fire Strike Score | 21264 points | |
| 3DMark Time Spy Score | 9420 points | |
Aide | ||
Witcher 3 FPS Chart
| Bas | Moyen | Élevé | Ultra | |
|---|---|---|---|---|
| GTA V (2015) | 182 | 176 | 159 | 95.5 |
| The Witcher 3 (2015) | 388.1 | 279.3 | 177.8 | 96.5 |
| Dota 2 Reborn (2015) | 163 | 146 | 137 | 129 |
| Final Fantasy XV Benchmark (2018) | 162 | 116 | 90.4 | |
| X-Plane 11.11 (2018) | 125 | 104 | 82.9 | |
| Far Cry 5 (2018) | 148 | 120 | 114 | 107 |
| Strange Brigade (2018) | 442 | 236 | 193 | 171 |
Émissions
Bruit du système
Le bruit du ventilateur dépend fortement des quatre paramètres du centre de contrôle du profil d'alimentation : Quiet, Power Saving, Entertainment et Performance. Il existe également un cinquième réglage manuel du mode de ventilation maximale qui fixe les ventilateurs à leur niveau le plus élevé, soit 57 dB(A), quelle que soit la charge à l'écran.
Il est recommandé de faire fonctionner le système en mode Économie d'énergie si vous vous contentez de naviguer sur le Web ou de faire du traitement de texte, car les ventilateurs ont tendance à pulser très fréquemment entre 26 et 34 dB(A) en mode Performances. Le jeu en mode Performance est plus bruyant que ce que nous avons enregistré sur leRazer Blade 15 Advanced ou le MSI GS66.
Degré de la nuisance sonore
| Au repos |
| 26.4 / 31 / 34 dB(A) |
| Fortement sollicité |
| 47.8 / 57.1 dB(A) |
 | ||
30 dB silencieux 40 dB(A) audible 50 dB(A) bruyant |
||
min: | ||
| Eurocom RX315 NH57AF1 GeForce RTX 3070 Laptop GPU, i7-11800H, Samsung SSD 980 Pro 1TB MZ-V8P1T0BW | MSI Stealth GS66 12UGS GeForce RTX 3070 Ti Laptop GPU, i7-12700H, WDC PC SN810 1TB | Eurocom Nightsky ARX315 GeForce RTX 3070 Laptop GPU, R9 5900X, Samsung SSD 980 Pro 1TB MZ-V8P1T0BW | Alienware m15 R6, i7-11800H RTX 3080 GeForce RTX 3080 Laptop GPU, i7-11800H, Samsung PM9A1 MZVL21T0HCLR | Dell G15 5515 GeForce RTX 3050 Ti Laptop GPU, R7 5800H, Samsung PM991a MZ9LQ512HBLU-00BD1 | Razer Blade 15 Advanced (Mid 2021) GeForce RTX 3080 Laptop GPU, i7-11800H, SSSTC CA6-8D1024 | |
|---|---|---|---|---|---|---|
| Noise | 3% | -4% | 12% | 12% | 12% | |
| arrêt / environnement * (dB) | 26.3 | 24 9% | 25.3 4% | 23 13% | 24 9% | 25.1 5% |
| Idle Minimum * (dB) | 26.4 | 31 -17% | 25.9 2% | 23 13% | 25 5% | 25.3 4% |
| Idle Average * (dB) | 31 | 32 -3% | 27.9 10% | 23 26% | 26 16% | 25.3 18% |
| Idle Maximum * (dB) | 34 | 35 -3% | 40.8 -20% | 30 12% | 30 12% | 25.3 26% |
| Load Average * (dB) | 47.8 | 48 -0% | 55.2 -15% | 41.26 14% | 44 8% | 42 12% |
| Witcher 3 ultra * (dB) | 51.7 | 43 17% | 52.4 -1% | 53.4 -3% | 44 15% | 45.6 12% |
| Load Maximum * (dB) | 57.1 | 48 16% | 60.3 -6% | 53.37 7% | 48 16% | 51.6 10% |
* ... Moindre est la valeur, meilleures sont les performances
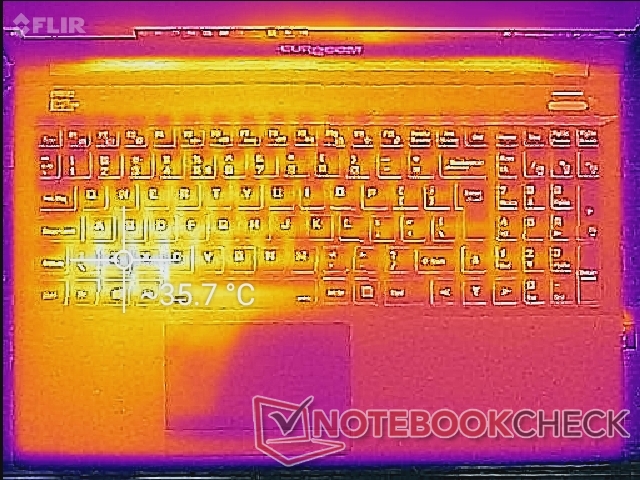
Température
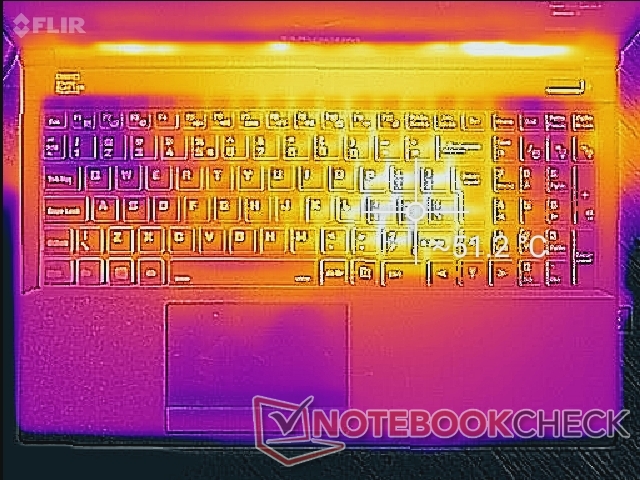
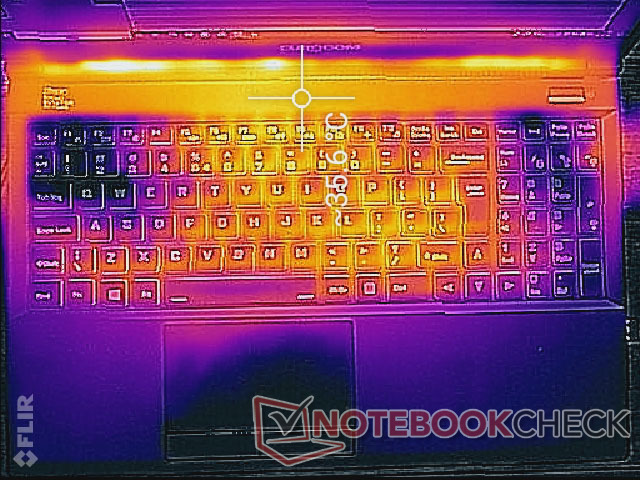
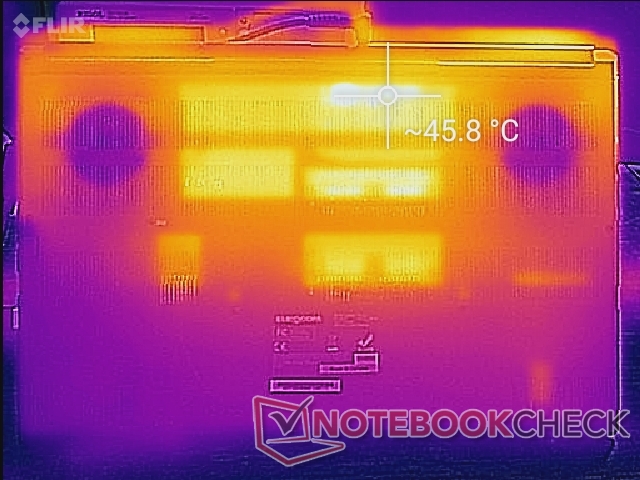
Les températures de surface lors des jeux peuvent atteindre 51°C près du centre du clavier, contre 44°C sur le Razer Blade 15. Comme sur la plupart des ordinateurs portables de jeu, les deux ventilateurs sont positionnés sous les touches WASD et numpad pour garder ces sections de l'ordinateur portable relativement fraîches, quelle que soit la charge.
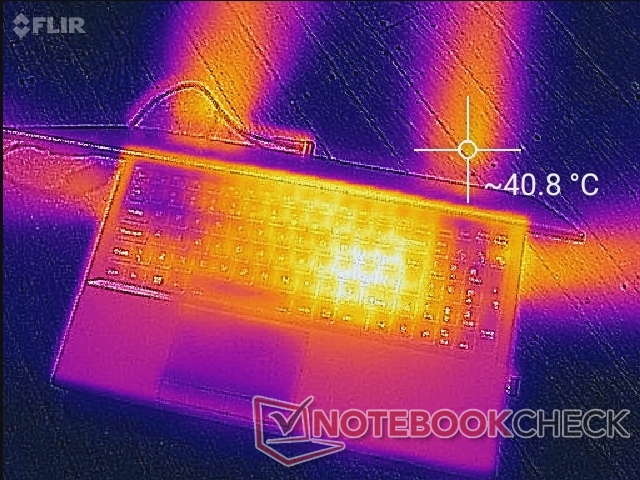
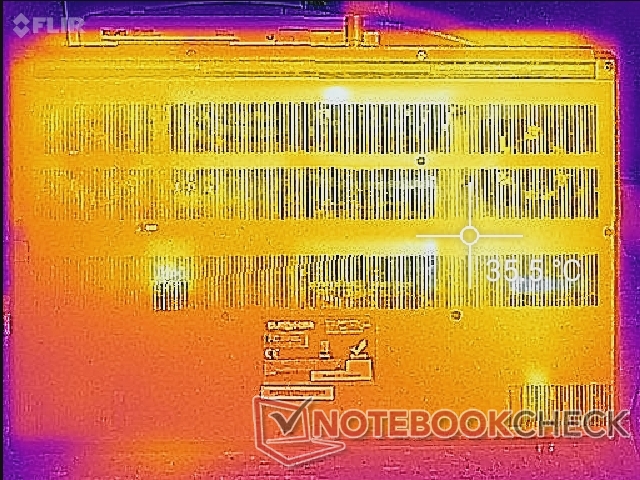
(+) La température maximale du côté supérieur est de 36 °C / 97 F, par rapport à la moyenne de 40.4 °C / 105 F, allant de 21.2 à 68.8 °C pour la classe Gaming.
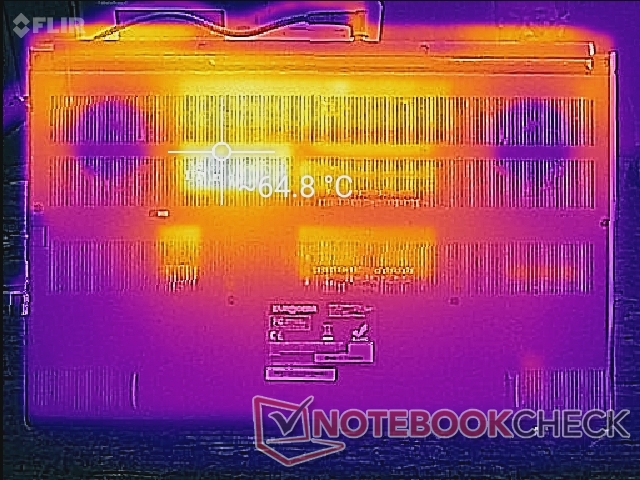
(-) Le fond chauffe jusqu'à un maximum de 46 °C / 115 F, contre une moyenne de 43.2 °C / 110 F
(+) En utilisation inactive, la température moyenne du côté supérieur est de 31.4 °C / 89 F, par rapport à la moyenne du dispositif de 33.9 °C / 93 F.
(±) En jouant à The Witcher 3, la température moyenne du côté supérieur est de 37.1 °C / 99 F, alors que la moyenne de l'appareil est de 33.9 °C / 93 F.
(+) Les repose-poignets et le pavé tactile sont plus froids que la température de la peau avec un maximum de 31.2 °C / 88.2 F et sont donc froids au toucher.
(-) La température moyenne de la zone de l'appui-paume de dispositifs similaires était de 28.8 °C / 83.8 F (-2.4 °C / #-4.4 F).
| Eurocom RX315 NH57AF1 Intel Core i7-11800H, NVIDIA GeForce RTX 3070 Laptop GPU | MSI Stealth GS66 12UGS Intel Core i7-12700H, NVIDIA GeForce RTX 3070 Ti Laptop GPU | Eurocom Nightsky ARX315 AMD Ryzen 9 5900X, NVIDIA GeForce RTX 3070 Laptop GPU | Alienware m15 R6, i7-11800H RTX 3080 Intel Core i7-11800H, NVIDIA GeForce RTX 3080 Laptop GPU | Dell G15 5515 AMD Ryzen 7 5800H, NVIDIA GeForce RTX 3050 Ti Laptop GPU | Razer Blade 15 Advanced (Mid 2021) Intel Core i7-11800H, NVIDIA GeForce RTX 3080 Laptop GPU | |
|---|---|---|---|---|---|---|
| Heat | -6% | -5% | -25% | 3% | -14% | |
| Maximum Upper Side * (°C) | 36 | 54 -50% | 36.2 -1% | 61 -69% | 50 -39% | 51 -42% |
| Maximum Bottom * (°C) | 46 | 59 -28% | 49.6 -8% | 58 -26% | 49 -7% | 52 -13% |
| Idle Upper Side * (°C) | 35.6 | 26 27% | 32.6 8% | 38 -7% | 26 27% | 35.2 1% |
| Idle Bottom * (°C) | 36.8 | 27 27% | 43.2 -17% | 36 2% | 26 29% | 37.8 -3% |
* ... Moindre est la valeur, meilleures sont les performances
Test de stress
Lors de l'exécution de Prime95, le processeur montait à 3,5 ou 3,7 GHz pendant les 70 premières secondes, à une consommation de 95 W et une température centrale de 99 C. Ensuite, le CPU se stabilise à une température plus confortable de 76 C et 54 W de consommation, bien qu'à une fréquence d'horloge inférieure de 2,8 GHz.
Lors de l'exécution de Witcher 3le GPU se stabilise à 1575 MHz et 87 C. GPU-Z indique que la consommation électrique de la carte est de 102 W, ce qui est très proche de la cible TGP de 105 W annoncée.
Le fonctionnement sur batterie limite les performances. Un test de Fire Strike sur batteries donnerait des scores de physique et de graphisme de 15083 et 2154 points, respectivement, contre 23365 et 25547 points sur secteur.
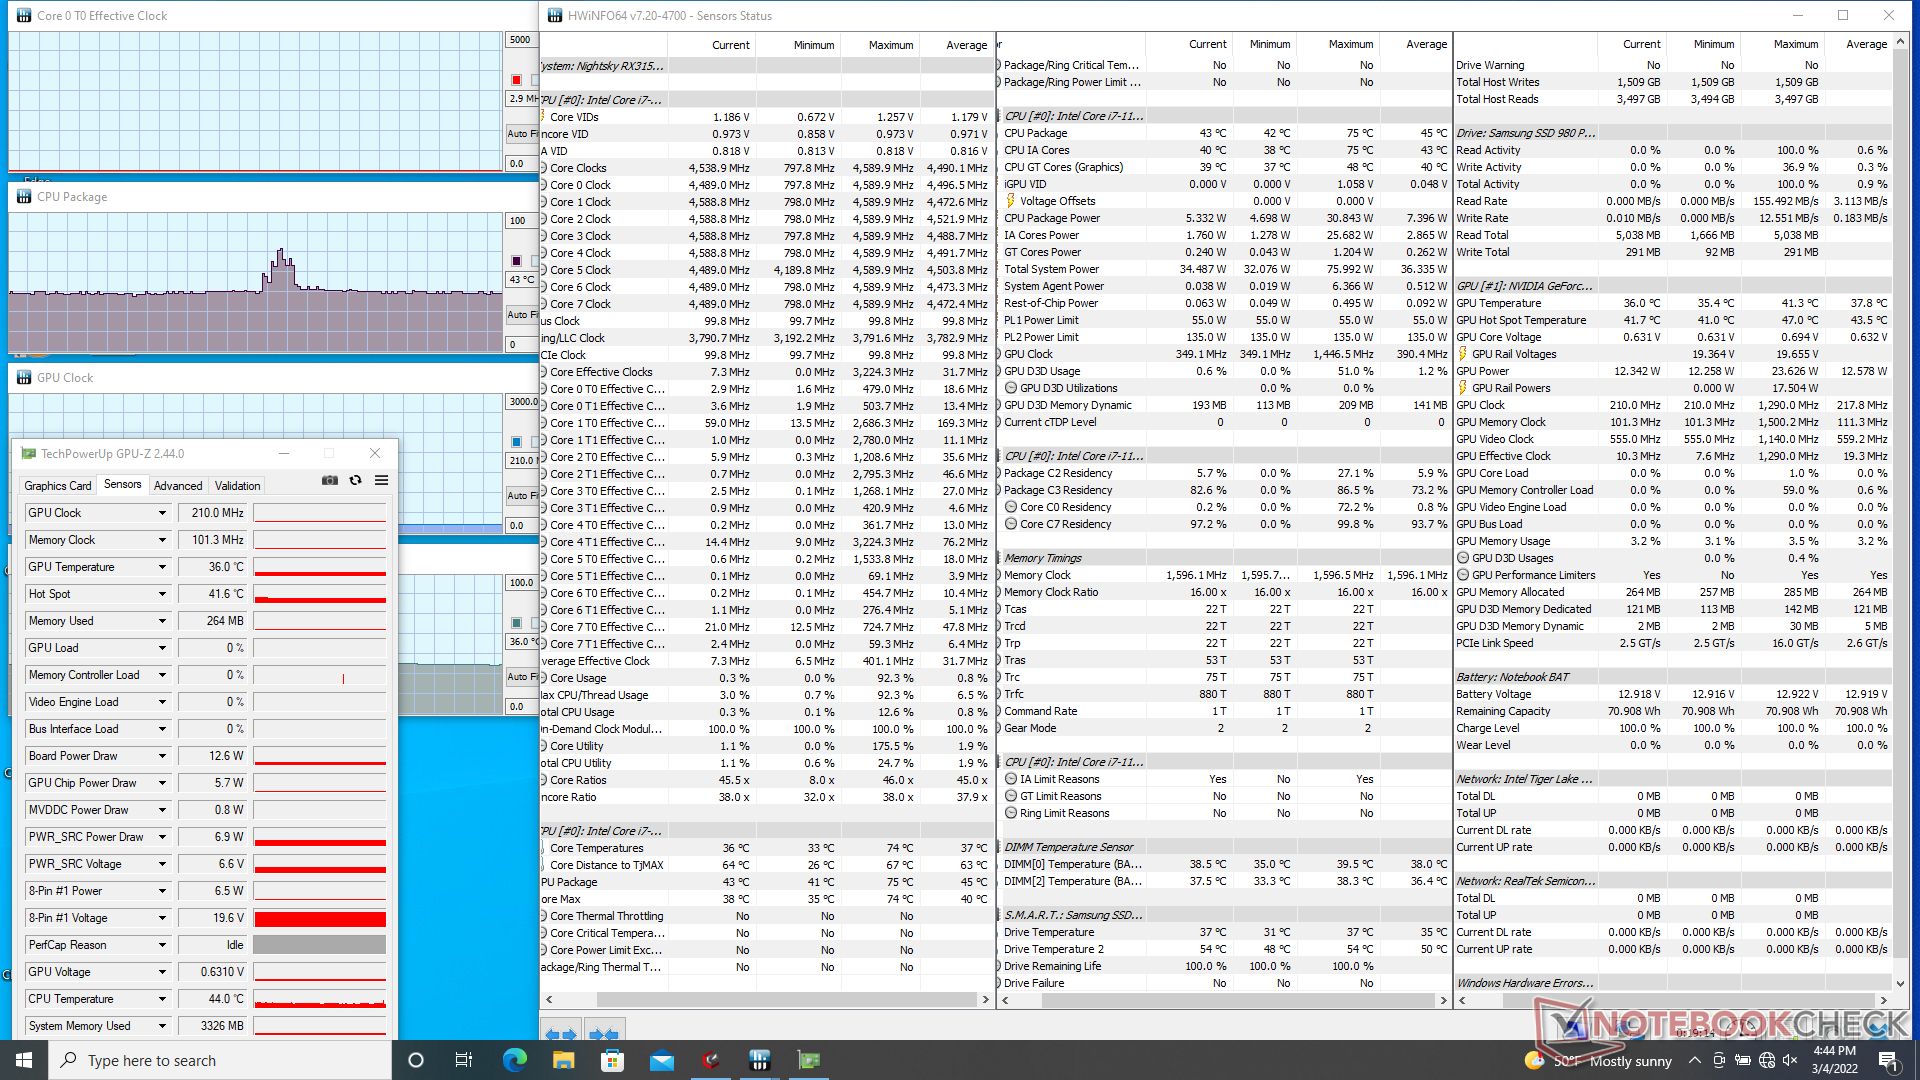
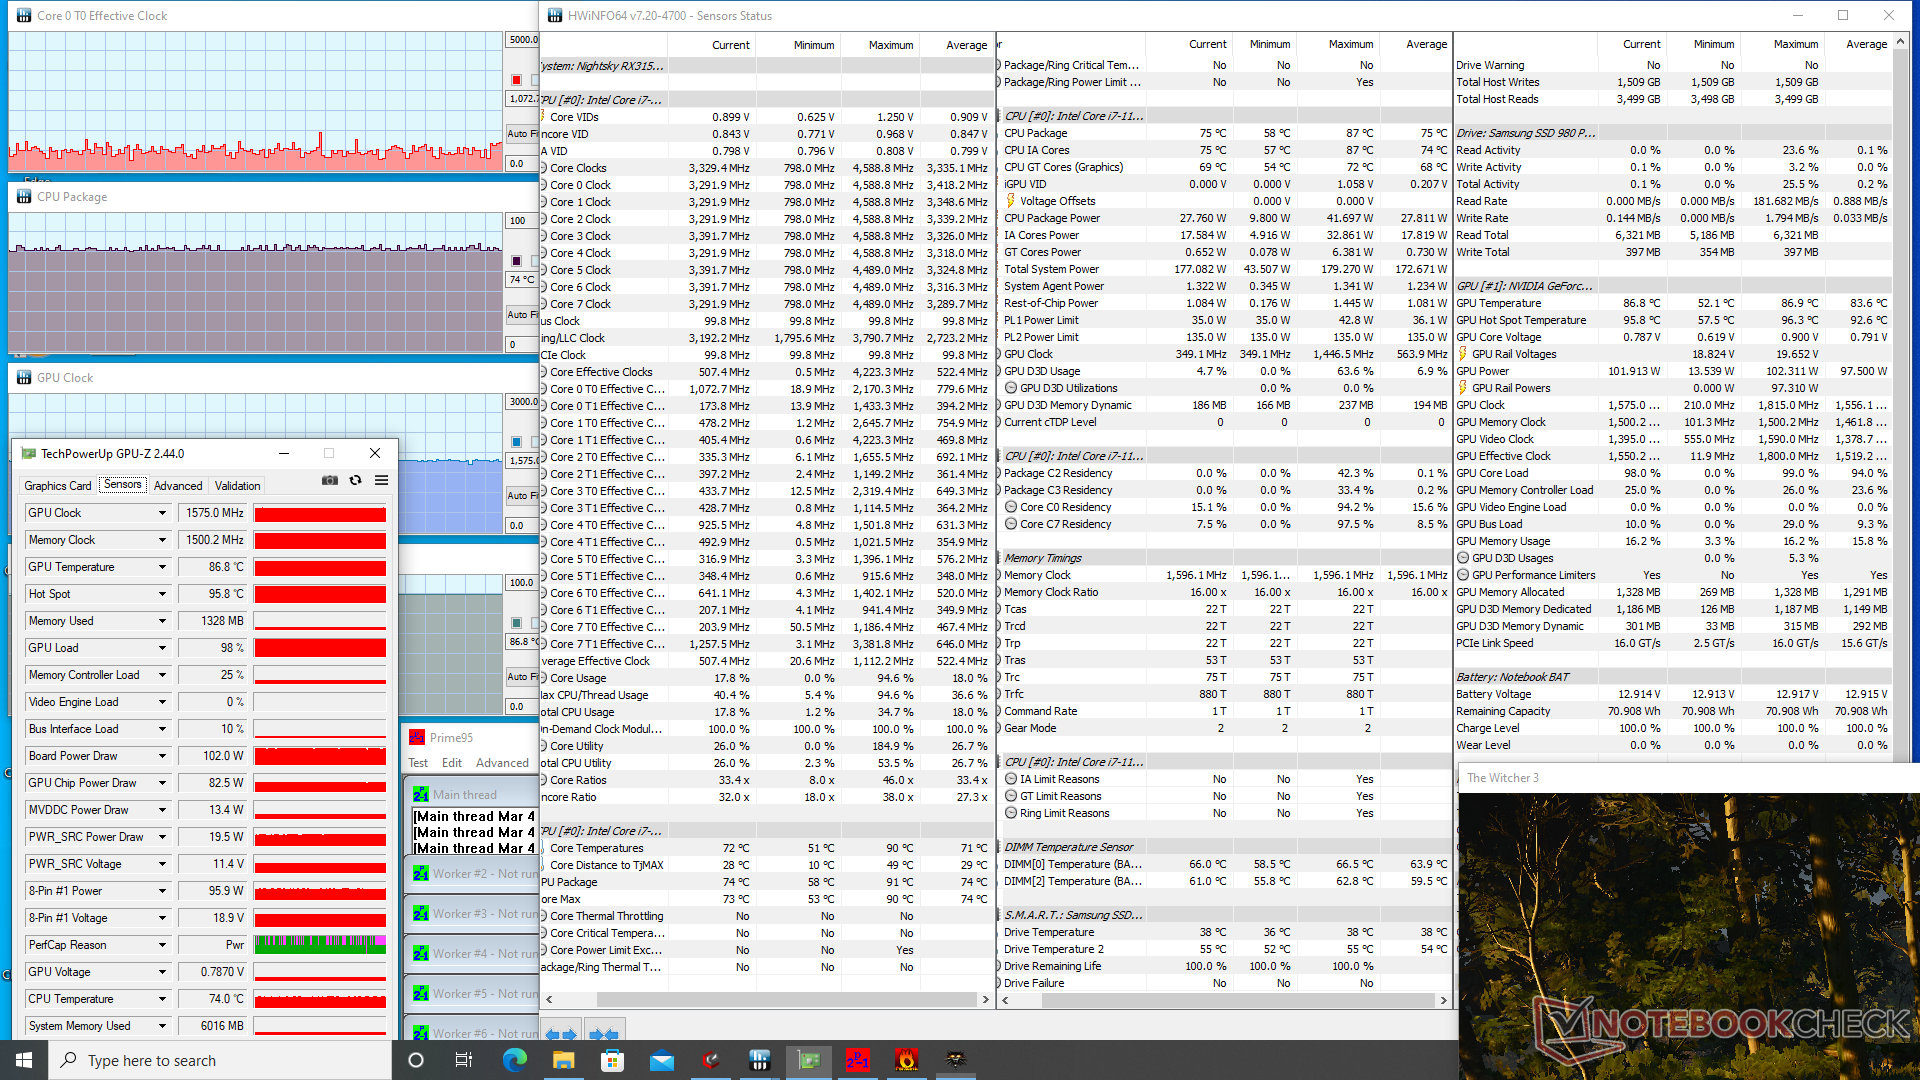
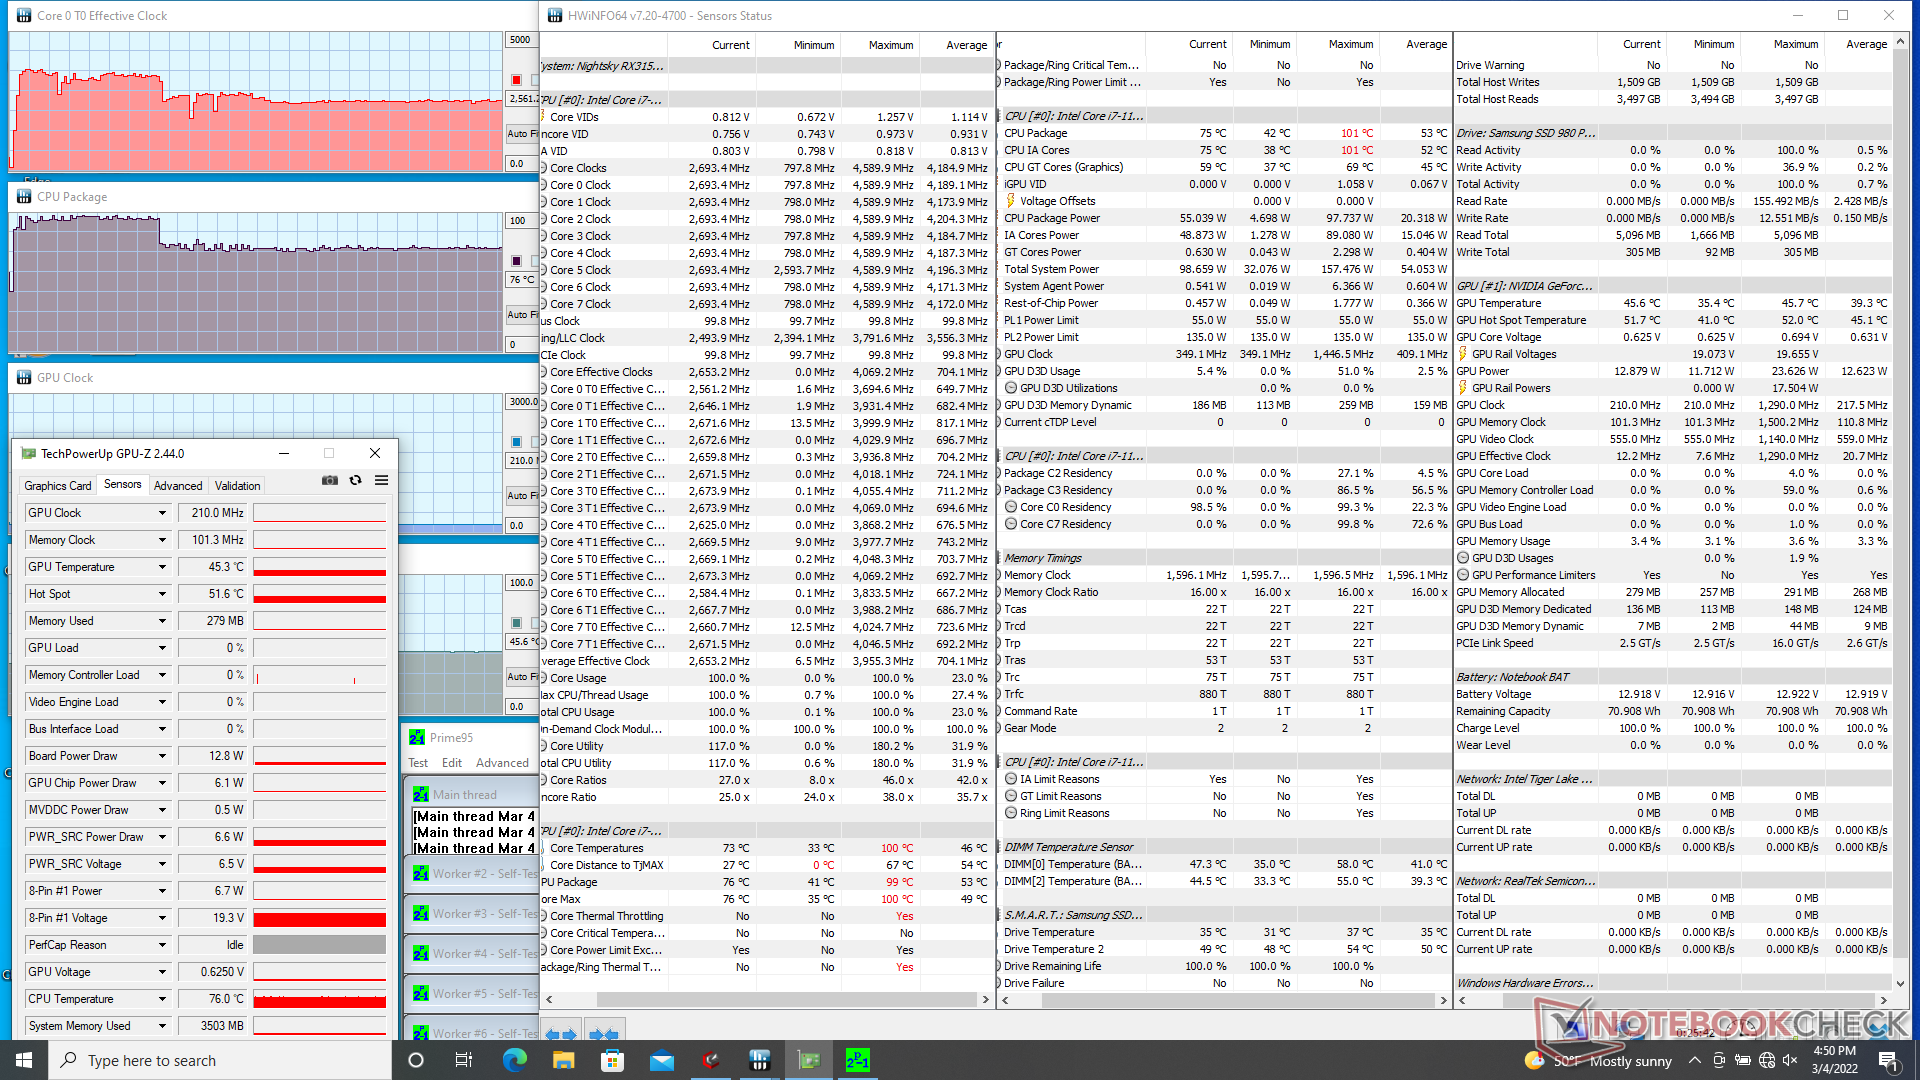
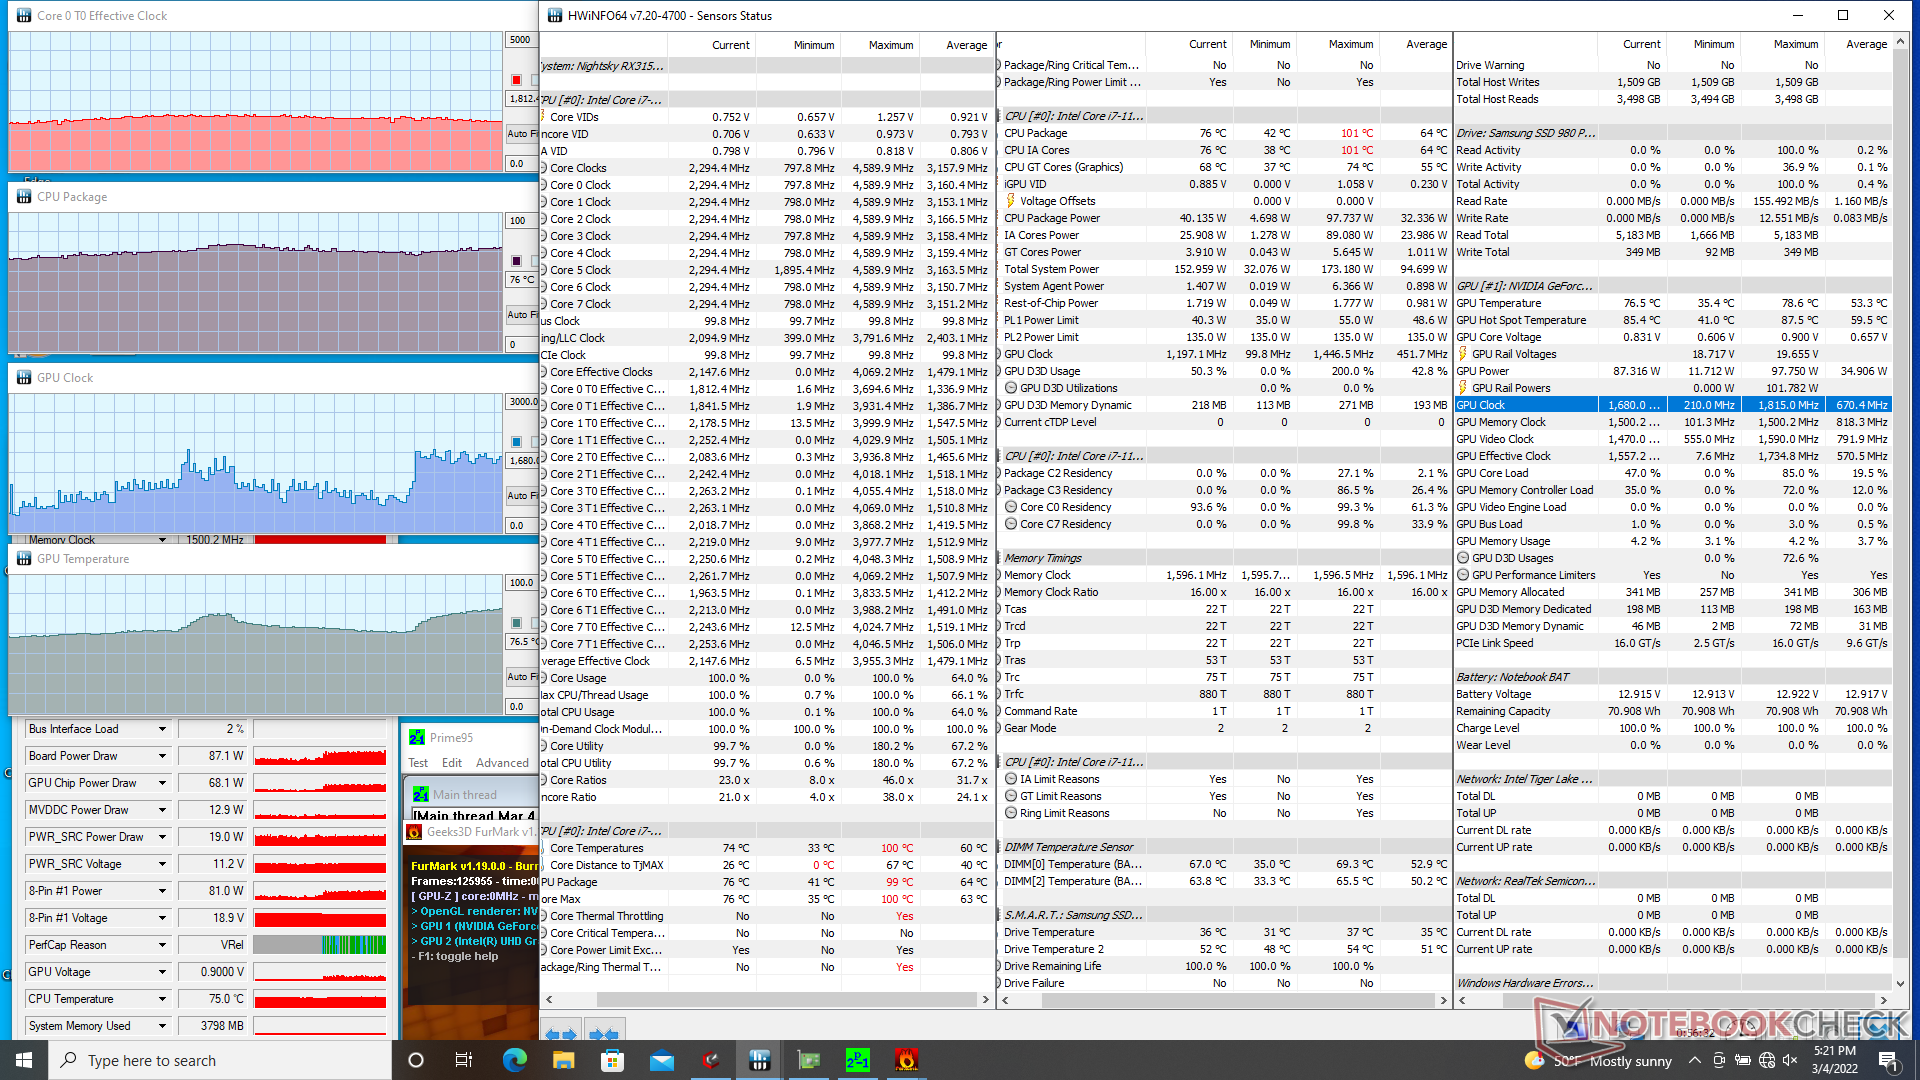
| Fréquence du CPU (GHz) | Fréquence du GPU (MHz) | Température moyenne du CPU (°C) | Température moyenne du GPU (°C) | |
| Système au repos | -- | -- | 43 | 36 |
| Prime95 Stress | 2.6 | -- | 76 | 46 |
| Prime95 + FurMark Stress | 1.6 - 2.1 | 700 - 1800 | 70 - 78 | 60 - 77 |
| Witcher 3 Stress | ~1.0 | 1575 | 74 | 87 |
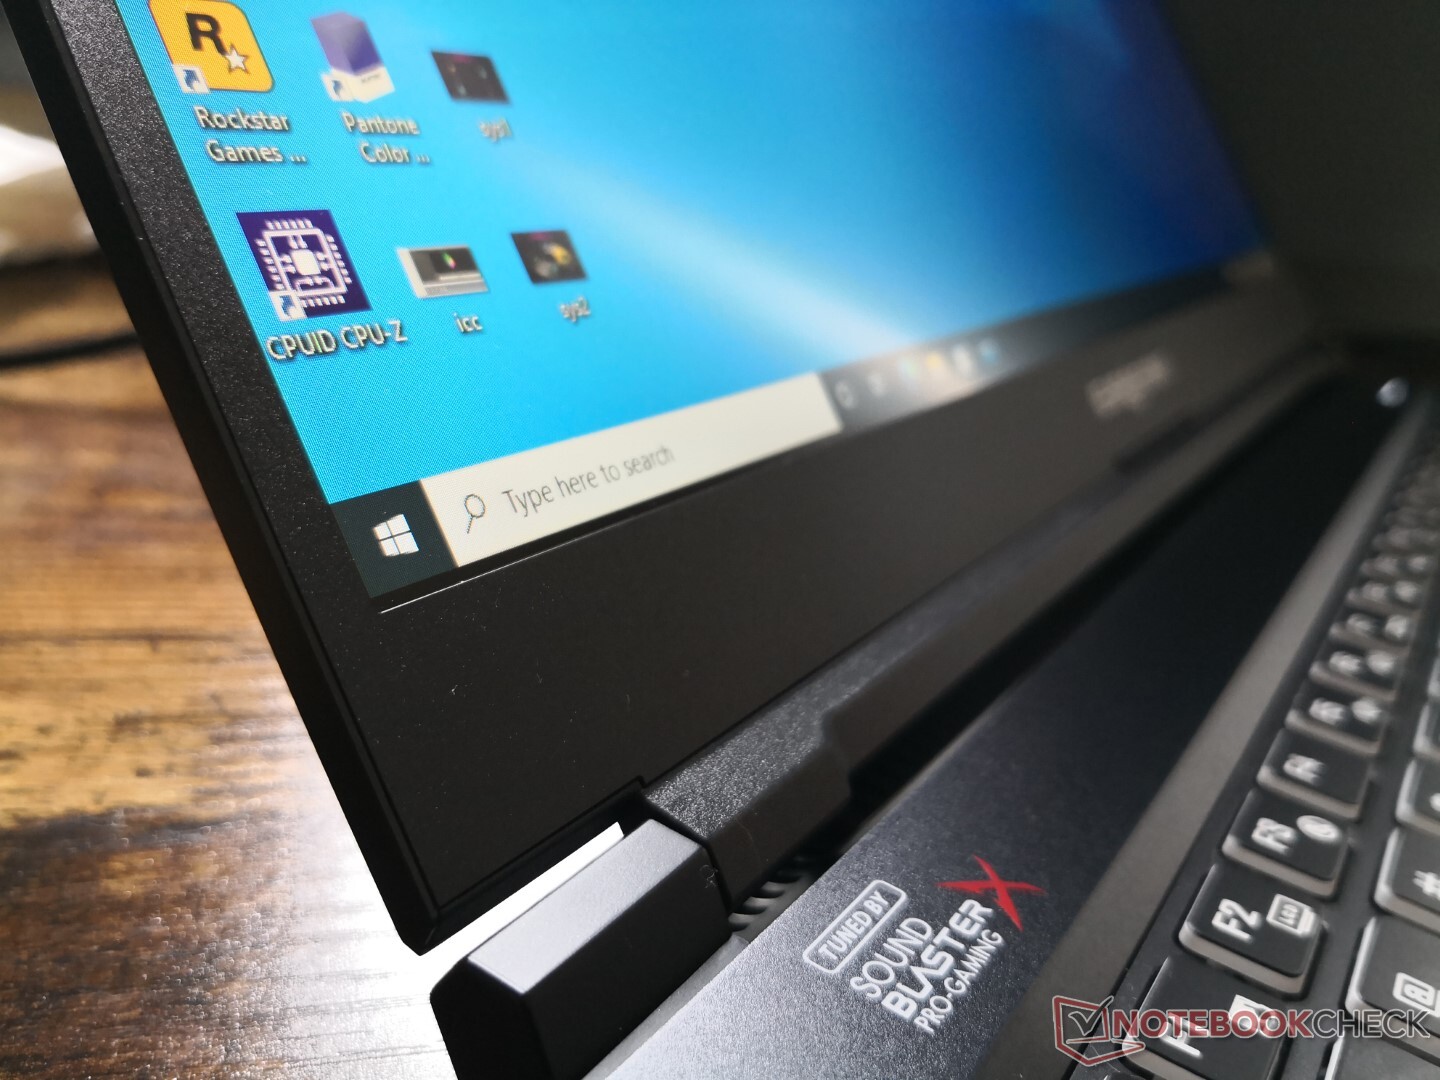
Haut-parleurs
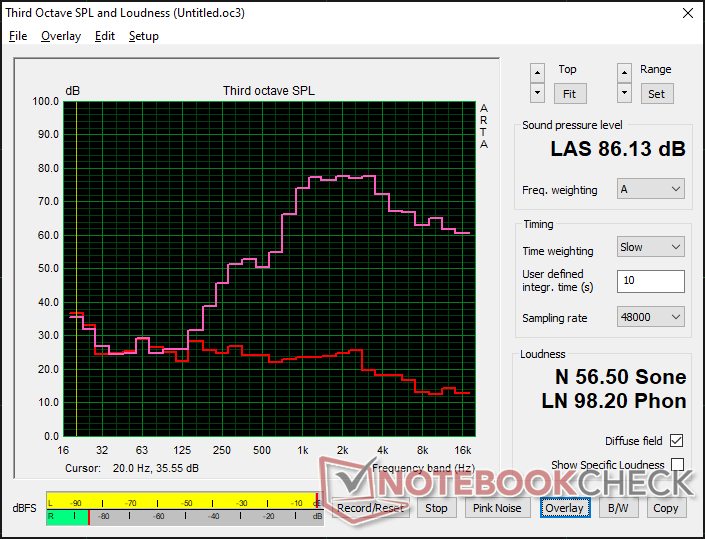
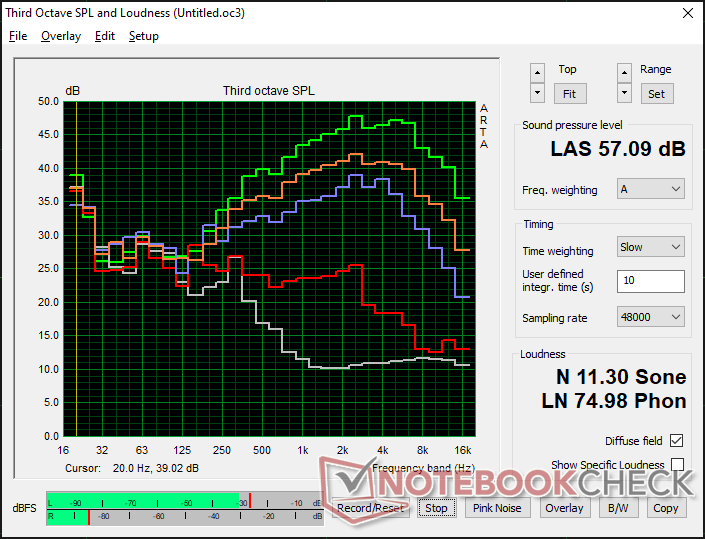
Eurocom RX315 NH57AF1 analyse audio
(+) | les haut-parleurs peuvent jouer relativement fort (86.1# dB)
Basses 100 - 315 Hz
(-) | presque aucune basse - en moyenne 26.3% plus bas que la médiane
(±) | la linéarité des basses est moyenne (11.2% delta à la fréquence précédente)
Médiums 400 - 2000 Hz
(±) | médiane supérieure - en moyenne 11% supérieure à la médiane
(±) | la linéarité des médiums est moyenne (10.3% delta à la fréquence précédente)
Aiguës 2 - 16 kHz
(±) | sommets plus élevés - en moyenne 6.9% plus élevés que la médiane
(+) | les aigus sont linéaires (6.7% delta à la fréquence précédente)
Globalement 100 - 16 000 Hz
(-) | le son global n'est pas linéaire (33.3% de différence à la médiane)
Par rapport à la même classe
» 98% de tous les appareils testés de cette catégorie étaient meilleurs, 1% similaires, 1% pires
» Le meilleur avait un delta de 6%, la moyenne était de 18%, le pire était de 132%.
Par rapport à tous les appareils testés
» 92% de tous les appareils testés étaient meilleurs, 1% similaires, 6% pires
» Le meilleur avait un delta de 4%, la moyenne était de 23%, le pire était de 134%.
Apple MacBook Pro 16 2021 M1 Pro analyse audio
(+) | les haut-parleurs peuvent jouer relativement fort (84.7# dB)
Basses 100 - 315 Hz
(+) | bonne basse - seulement 3.8% loin de la médiane
(+) | les basses sont linéaires (5.2% delta à la fréquence précédente)
Médiums 400 - 2000 Hz
(+) | médiane équilibrée - seulement 1.3% de la médiane
(+) | les médiums sont linéaires (2.1% delta à la fréquence précédente)
Aiguës 2 - 16 kHz
(+) | des sommets équilibrés - à seulement 1.9% de la médiane
(+) | les aigus sont linéaires (2.7% delta à la fréquence précédente)
Globalement 100 - 16 000 Hz
(+) | le son global est linéaire (4.6% différence à la médiane)
Par rapport à la même classe
» 0% de tous les appareils testés de cette catégorie étaient meilleurs, 0% similaires, 100% pires
» Le meilleur avait un delta de 5%, la moyenne était de 17%, le pire était de 45%.
Par rapport à tous les appareils testés
» 0% de tous les appareils testés étaient meilleurs, 0% similaires, 100% pires
» Le meilleur avait un delta de 4%, la moyenne était de 23%, le pire était de 134%.
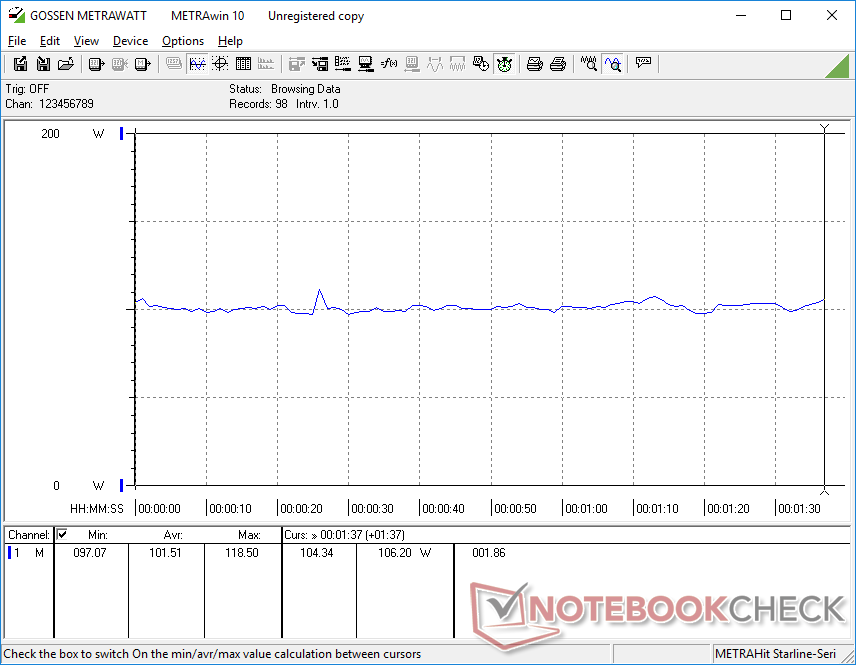
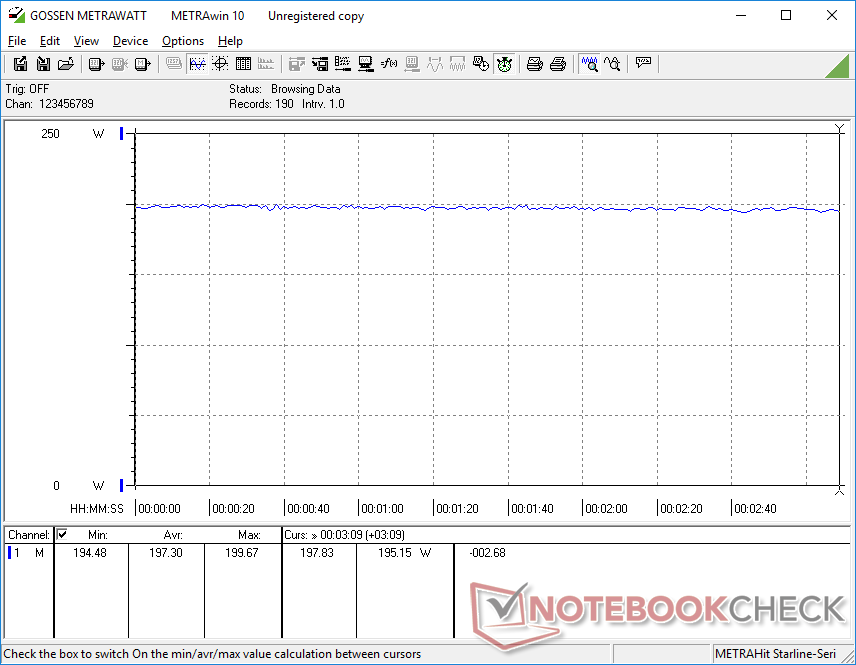
Gestion de l'énergie
Consommation d'énergie
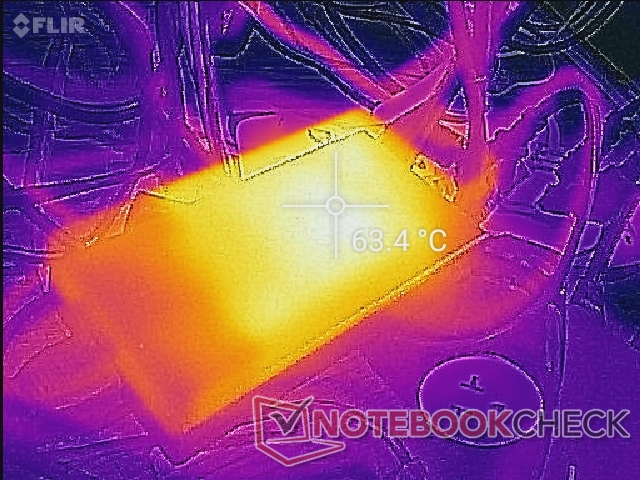
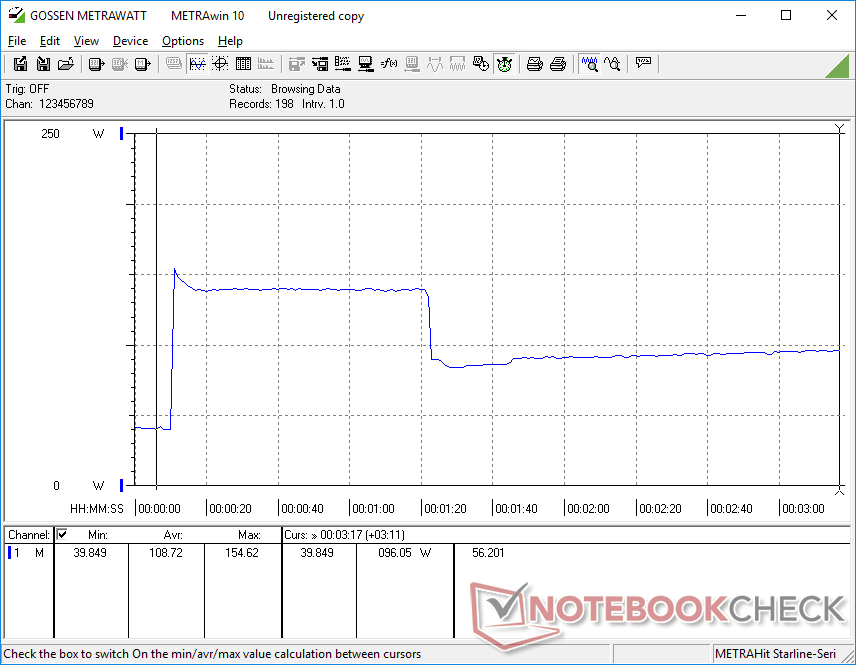
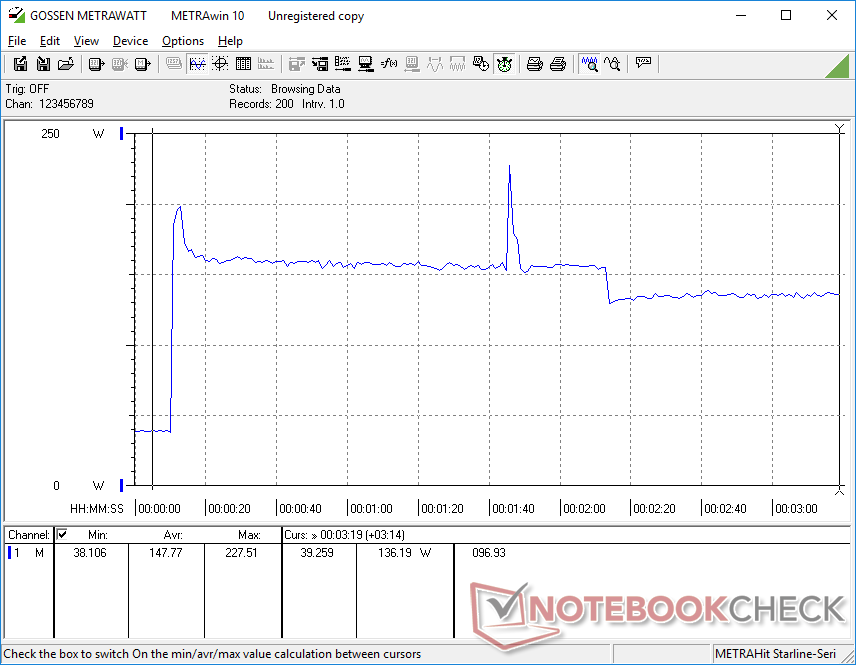
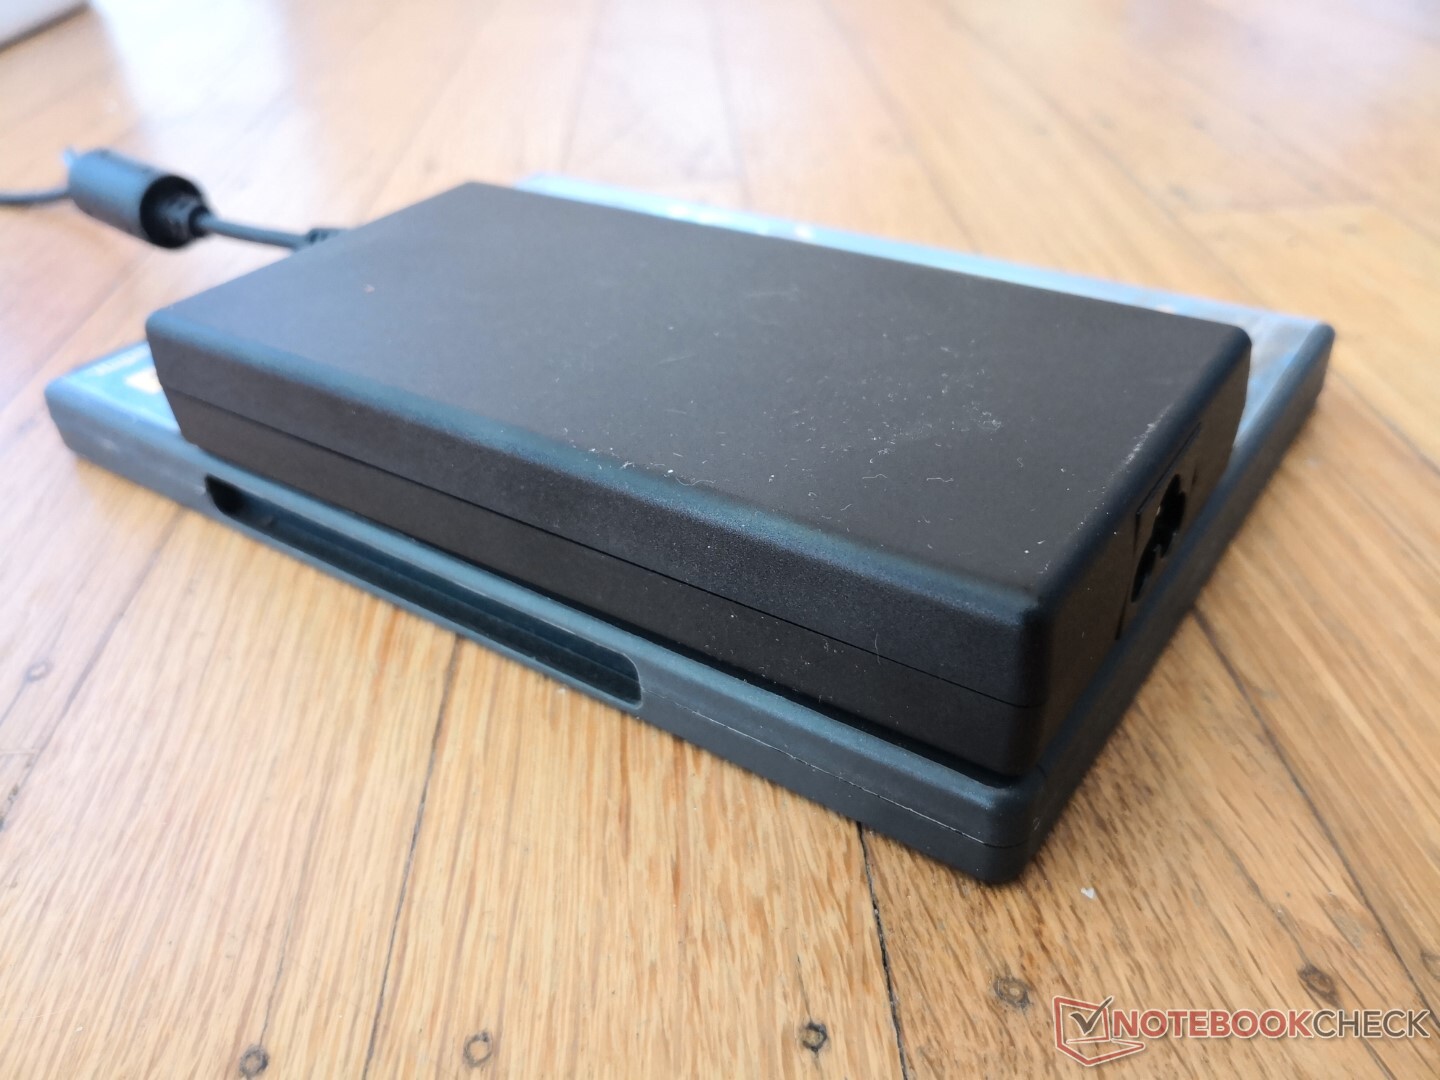
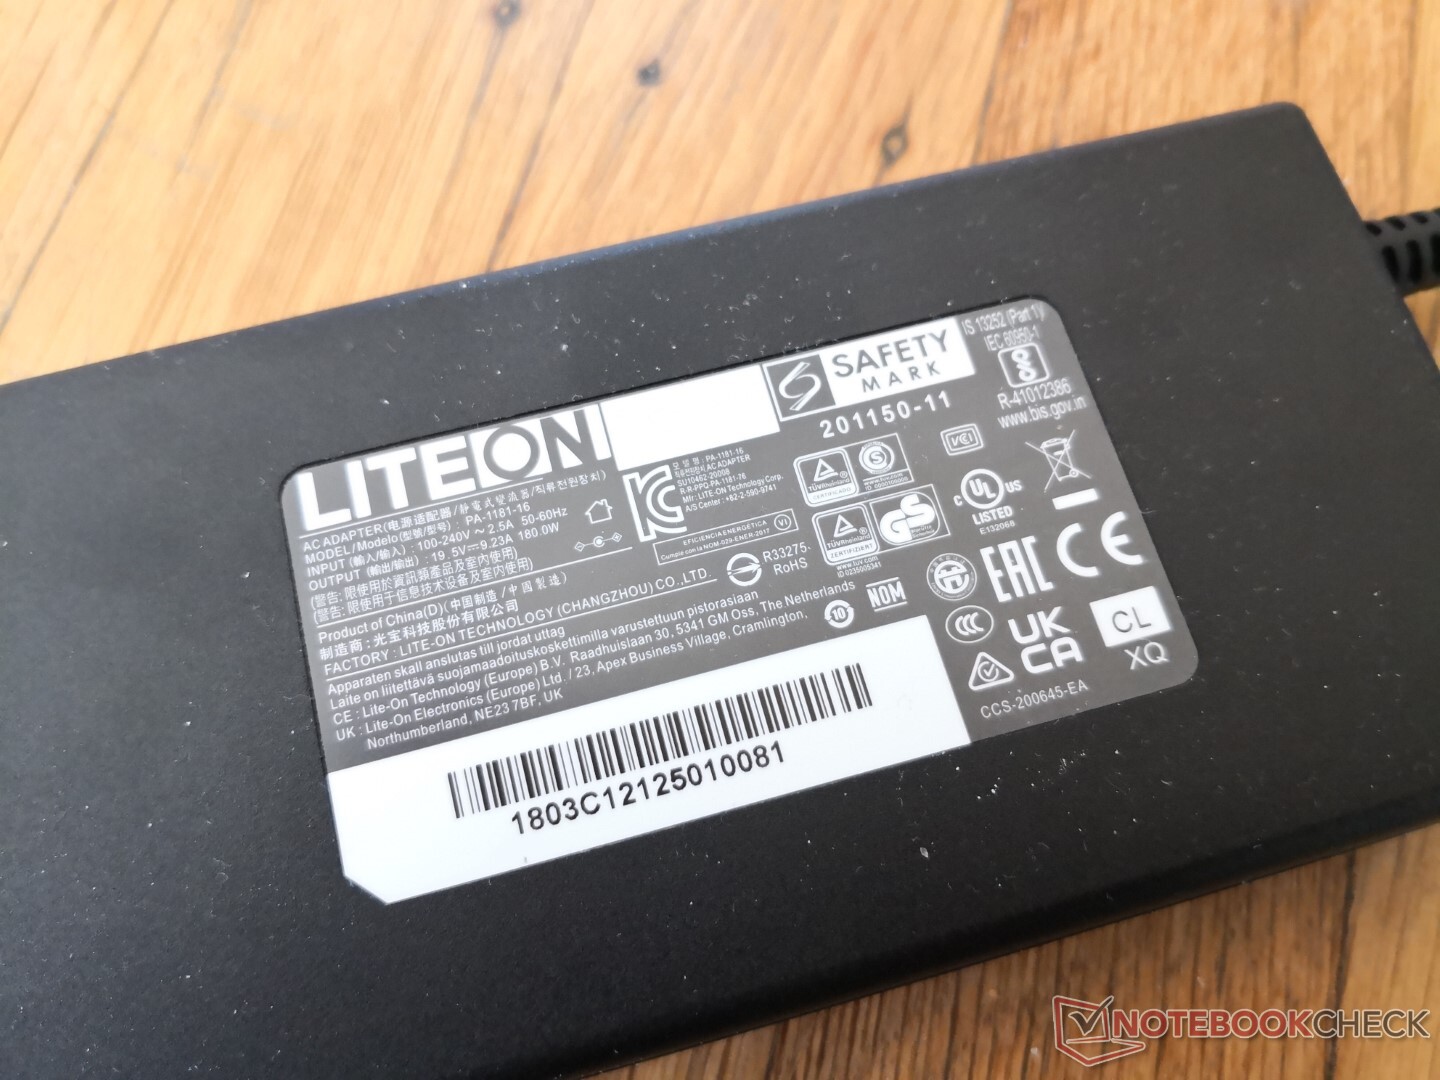
Le système demande plus de puissance que ce que l'adaptateur secteur limité de 180 W est censé fournir. En faisant fonctionner Witcher 3par exemple, la consommation d'énergie est de 197 W. Le petit adaptateur de 180 W (~14,5 x 7,4 x 2,5 cm) est certainement plus portable que la plupart des autres adaptateurs secteur pour ordinateurs portables de jeu, mais un adaptateur plus grand et plus performant aurait pu permettre des performances soutenues plus élevées et des taux de charge plus rapides lors des jeux.
| Éteint/en veille | |
| Au repos | |
| Fortement sollicité |
|
Légende:
min: | |
| Eurocom RX315 NH57AF1 i7-11800H, GeForce RTX 3070 Laptop GPU, Samsung SSD 980 Pro 1TB MZ-V8P1T0BW, IPS, 1920x1080, 15.6" | MSI Stealth GS66 12UGS i7-12700H, GeForce RTX 3070 Ti Laptop GPU, WDC PC SN810 1TB, IPS-Level, 2560x1440, 15.6" | Eurocom Nightsky ARX315 R9 5900X, GeForce RTX 3070 Laptop GPU, Samsung SSD 980 Pro 1TB MZ-V8P1T0BW, IPS, 1920x1080, 15.6" | Alienware m15 R6, i7-11800H RTX 3080 i7-11800H, GeForce RTX 3080 Laptop GPU, Samsung PM9A1 MZVL21T0HCLR, IPS, 1920x1080, 15.6" | Dell G15 5515 R7 5800H, GeForce RTX 3050 Ti Laptop GPU, Samsung PM991a MZ9LQ512HBLU-00BD1, IPS, 1920x1080, 15.6" | Razer Blade 15 Advanced (Mid 2021) i7-11800H, GeForce RTX 3080 Laptop GPU, SSSTC CA6-8D1024, IPS, 1920x1080, 15.6" | |
|---|---|---|---|---|---|---|
| Power Consumption | 8% | -141% | 1% | 35% | -17% | |
| Idle Minimum * (Watt) | 12.7 | 11 13% | 55 -333% | 14 -10% | 5 61% | 19.5 -54% |
| Idle Average * (Watt) | 16.4 | 16 2% | 68.2 -316% | 18 -10% | 9 45% | 23.3 -42% |
| Idle Maximum * (Watt) | 36.1 | 23 36% | 72.5 -101% | 29 20% | 20 45% | 40.1 -11% |
| Load Average * (Watt) | 101.5 | 110 -8% | 149.2 -47% | 93 8% | 94 7% | 98.9 3% |
| Witcher 3 ultra * (Watt) | 197 | 151 23% | 233 -18% | 190 4% | 123 38% | 174 12% |
| Load Maximum * (Watt) | 196.1 | 230 -17% | 255.8 -30% | 203 -4% | 172 12% | 214 -9% |
* ... Moindre est la valeur, meilleures sont les performances
Power Consumption Witcher 3 / Stresstest
Power Consumption external Monitor
Autonomie de la batterie
Attendez-vous à un peu moins de 5 heures d'utilisation du WLAN dans le monde réel sur le profil équilibré avec le GPU intégré actif. La charge avec l'adaptateur secteur inclus prend environ 2,5 heures, mais cela ralentira à une vitesse de croisière lors de l'exécution de jeux en raison de la faible sortie de 180 W. La charge via des adaptateurs USB-C n'est pas prise en charge.
| Eurocom RX315 NH57AF1 i7-11800H, GeForce RTX 3070 Laptop GPU, 71 Wh | MSI Stealth GS66 12UGS i7-12700H, GeForce RTX 3070 Ti Laptop GPU, 99.9 Wh | Eurocom Nightsky ARX315 R9 5900X, GeForce RTX 3070 Laptop GPU, 62 Wh | Alienware m15 R6, i7-11800H RTX 3080 i7-11800H, GeForce RTX 3080 Laptop GPU, 84 Wh | Dell G15 5515 R7 5800H, GeForce RTX 3050 Ti Laptop GPU, 56 Wh | Razer Blade 15 Advanced (Mid 2021) i7-11800H, GeForce RTX 3080 Laptop GPU, 80 Wh | |
|---|---|---|---|---|---|---|
| Autonomie de la batterie | 13% | -79% | 4% | 67% | 23% | |
| WiFi v1.3 (h) | 4.8 | 5.4 13% | 1 -79% | 5 4% | 8 67% | 5.9 23% |
| Reader / Idle (h) | 7.8 | 13.5 | ||||
| Load (h) | 1.6 | 1.6 | 1.5 | |||
| H.264 (h) | 5.6 | 8.8 |
Points positifs
Points négatifs
Verdict
Principaux avantages de l'Eurocom RX315 par rapport aux ordinateurs portables ultrafins concurrents tels que le Razer Blade 15 ou MSI GS66 sont son poids réduit et sa facilité d'entretien. Les propriétaires peuvent facilement installer jusqu'à deux disques SSD M.2 contre un seul sur le Blade 15, tandis que le GS66 est un modèle à la fois plus grand et plus lourd. Ces caractéristiques peuvent être souhaitables pour les utilisateurs qui voyagent beaucoup et qui souhaitent installer un deuxième SSD M.2.
Un exécutant solide et ultra-fin avec une facilité d'entretien et des touches de clavier confortables.
La solution de refroidissement et la batterie du RX315 ne sont pas aussi efficaces ou grandes, respectivement, que celles des alternatives Razer ou MSI susmentionnées. Le bruit du ventilateur est donc plus fort sur l'Eurocom pour compenser, tandis que l'autonomie de la batterie est généralement plus courte dans l'ensemble. La rigidité du châssis est également un cran ou deux en dessous du Blade 15 ou du GS66 pour des premières impressions un peu plus faibles.
Prix et disponibilité
Le Eurocom Nightsky RX315 est actuellement en cours d'expédition à partir de 2750 USD avec le processeur Core i7-11800H et le GPU GeForce RTX 3070.
Eurocom RX315 NH57AF1
- 03/08/2022 v7 (old)
Allen Ngo
Price comparison

