Test de l'Eurocom Raptor X17 : l'alternative aux MSI et autres Asus ROG

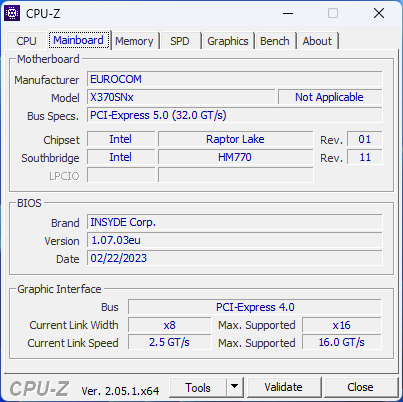
Après avoir récemment testé le 15,6 pouces Raptor X15nous sommes maintenant prêts à nous attaquer à son grand frère, le Raptor X17 de 17,3 pouces. Son châssis est un nouveau design (X370) que nous n'avons pas encore vu chez d'autres marques au moment de l'examen. Néanmoins, nous nous attendons à ce que d'autres revendeurs comme Schenker proposent ce même châssis sous une marque différente pour les marchés étrangers.
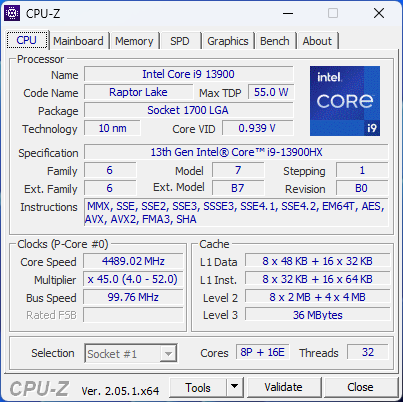
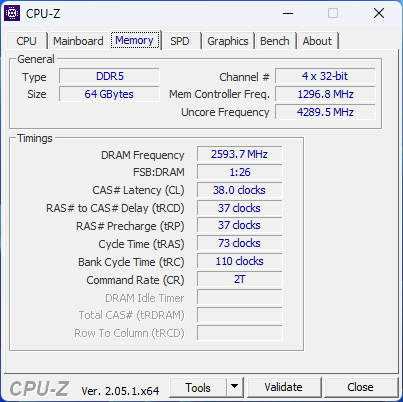
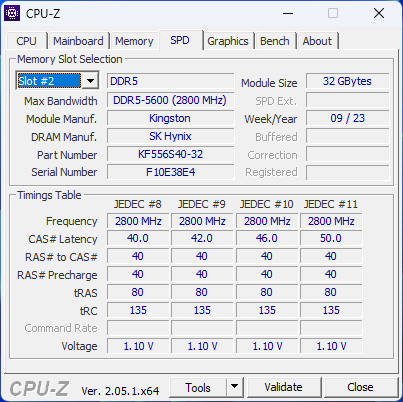
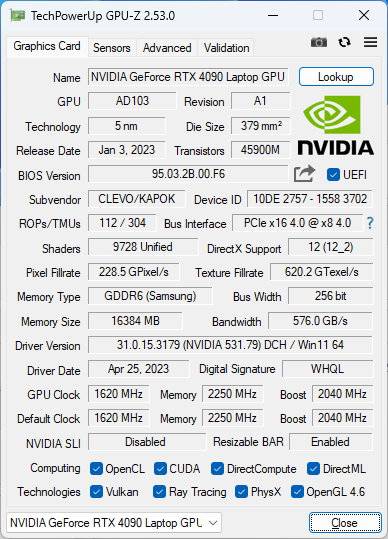
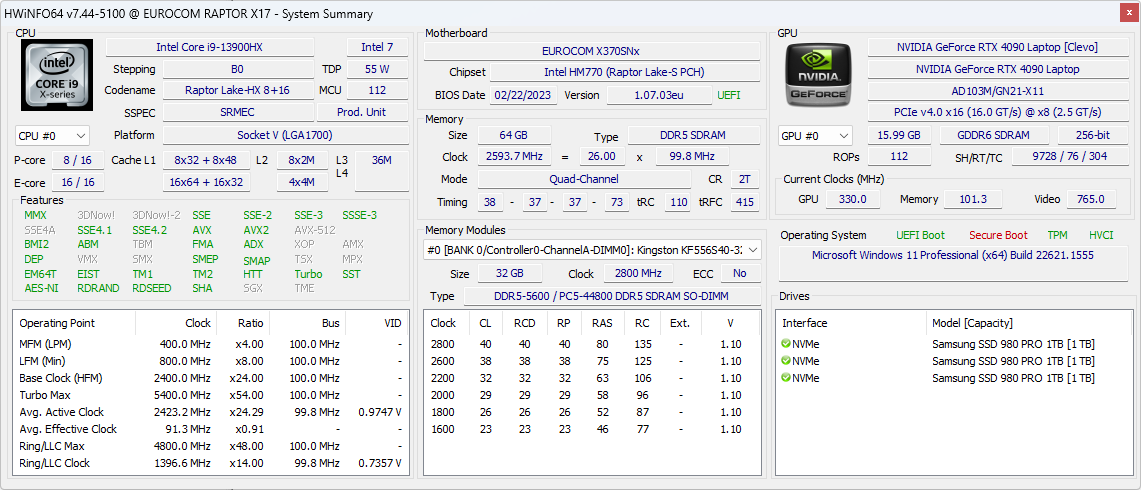
Notre configuration est un SKU haut de gamme avec le CPU Raptor Lake Core i9-13900HX de 13ème génération, le GPU RTX 4090 de 175 W GeForce, 64 Go de RAM DDR5, 3 disques durs de 1 To, et un écran 1440p 240 Hz pour environ $6600 USD. Bien entendu, les utilisateurs peuvent configurer l'ordinateur avec moins de RAM et de stockage et un i7-13700HX ou une RTX 4080 pour des prix de départ inférieurs.
Parmi les concurrents du Raptor X17, on trouve d'autres ordinateurs portables de jeu de 17 pouces, fins ou moyens, comme le Razer Blade 17, Asus ROG Strix Scar 17, Gigabyte Aorus 17Xou le MSI GS77.
Plus de commentaires sur Eurocom :
Comparaison avec les concurrents potentiels
Note | Date | Modèle | Poids | Épaisseur | Taille | Résolution | Prix |
|---|---|---|---|---|---|---|---|
| 82.8 % v7 (old) | 05/23 | Eurocom Raptor X17 i9-13900HX, GeForce RTX 4090 Laptop GPU | 3.5 kg | 24.9 mm | 17.30" | 2560x1440 | |
| 88.3 % v7 (old) | 04/23 | Asus ROG Strix Scar 17 G733PY-XS96 R9 7945HX, GeForce RTX 4090 Laptop GPU | 2.9 kg | 28.3 mm | 17.30" | 2560x1440 | |
| 86 % v7 (old) | 04/23 | Aorus 17X AZF i9-13900HX, GeForce RTX 4090 Laptop GPU | 2.9 kg | 21.8 mm | 17.30" | 2560x1440 | |
| 88.3 % v7 (old) | 03/23 | MSI GE78HX 13VH-070US i9-13950HX, GeForce RTX 4080 Laptop GPU | 3 kg | 23 mm | 17.00" | 2560x1600 | |
| 89.9 % v7 (old) | 03/23 | Eluktronics Mech-17 GP2 i9-13900HX, GeForce RTX 4090 Laptop GPU | 2.9 kg | 27 mm | 17.00" | 2560x1600 | |
| 86.1 % v7 (old) | 01/23 | Alienware m17 R5 (R9 6900HX, RX 6850M XT) R9 6900HX, Radeon RX 6850M XT | 3.4 kg | 26.7 mm | 17.00" | 3840x2160 |
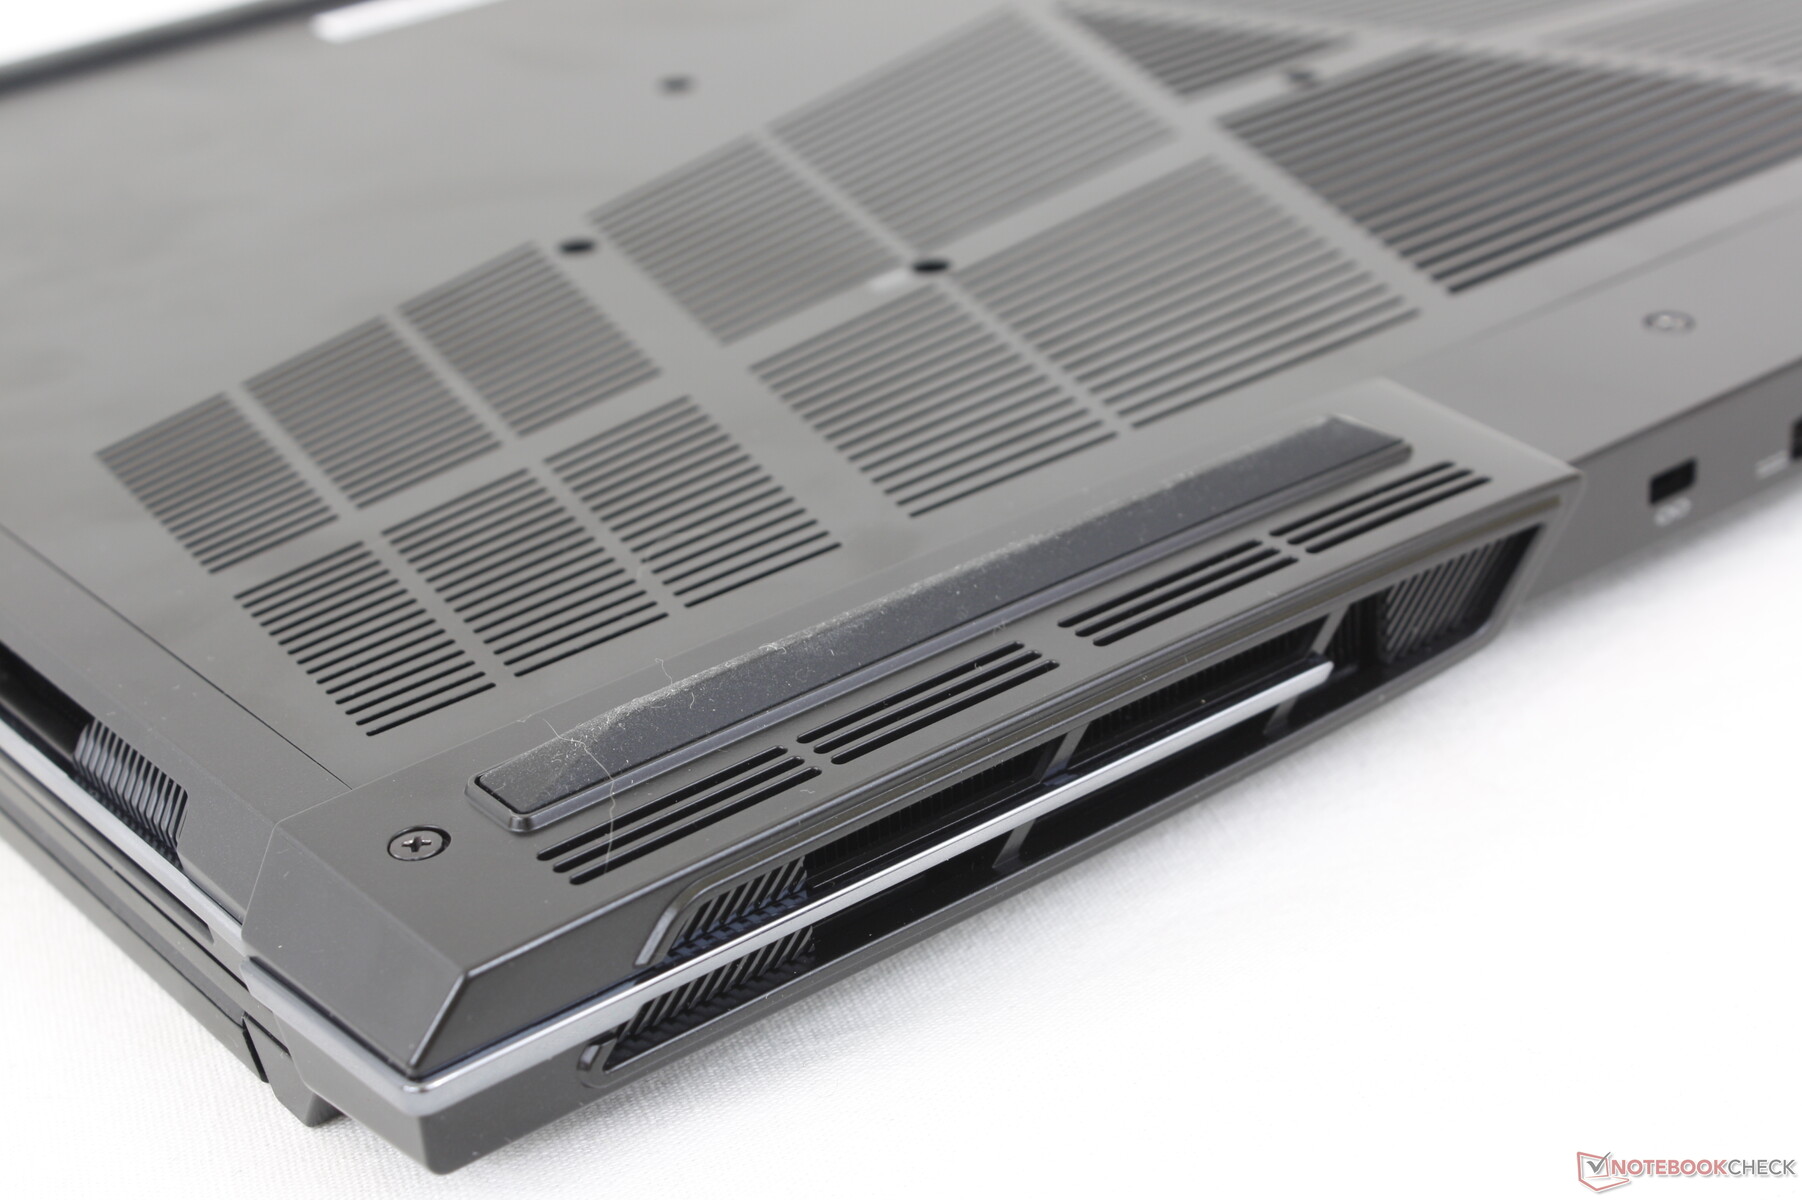
Cas - Un nouveau départ
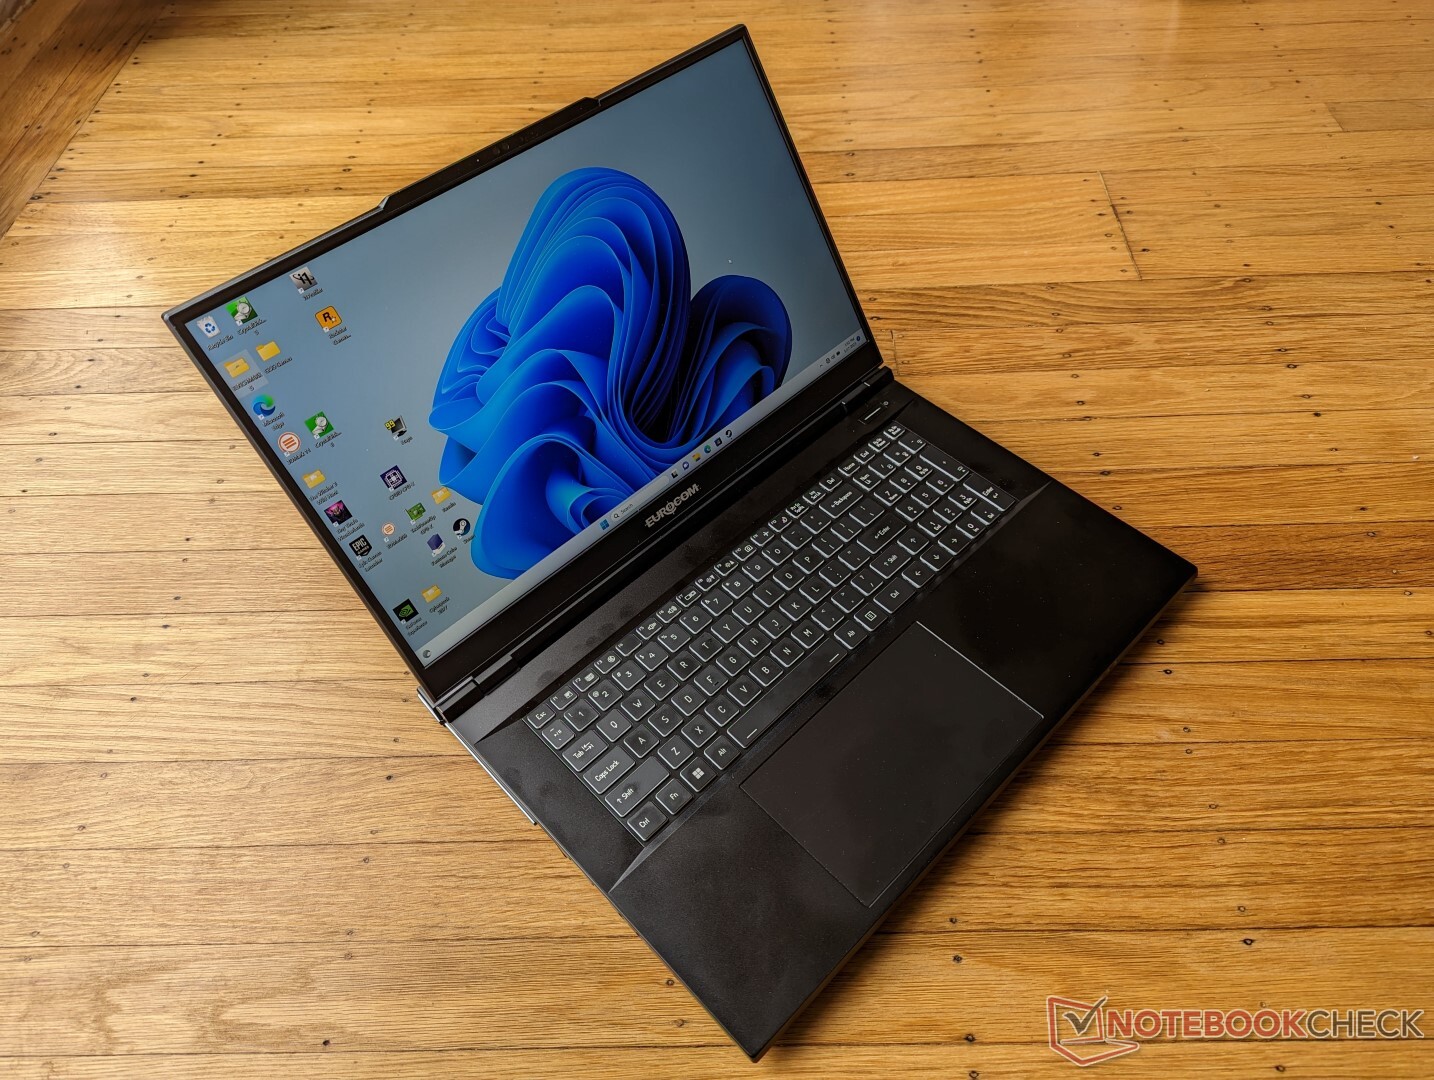
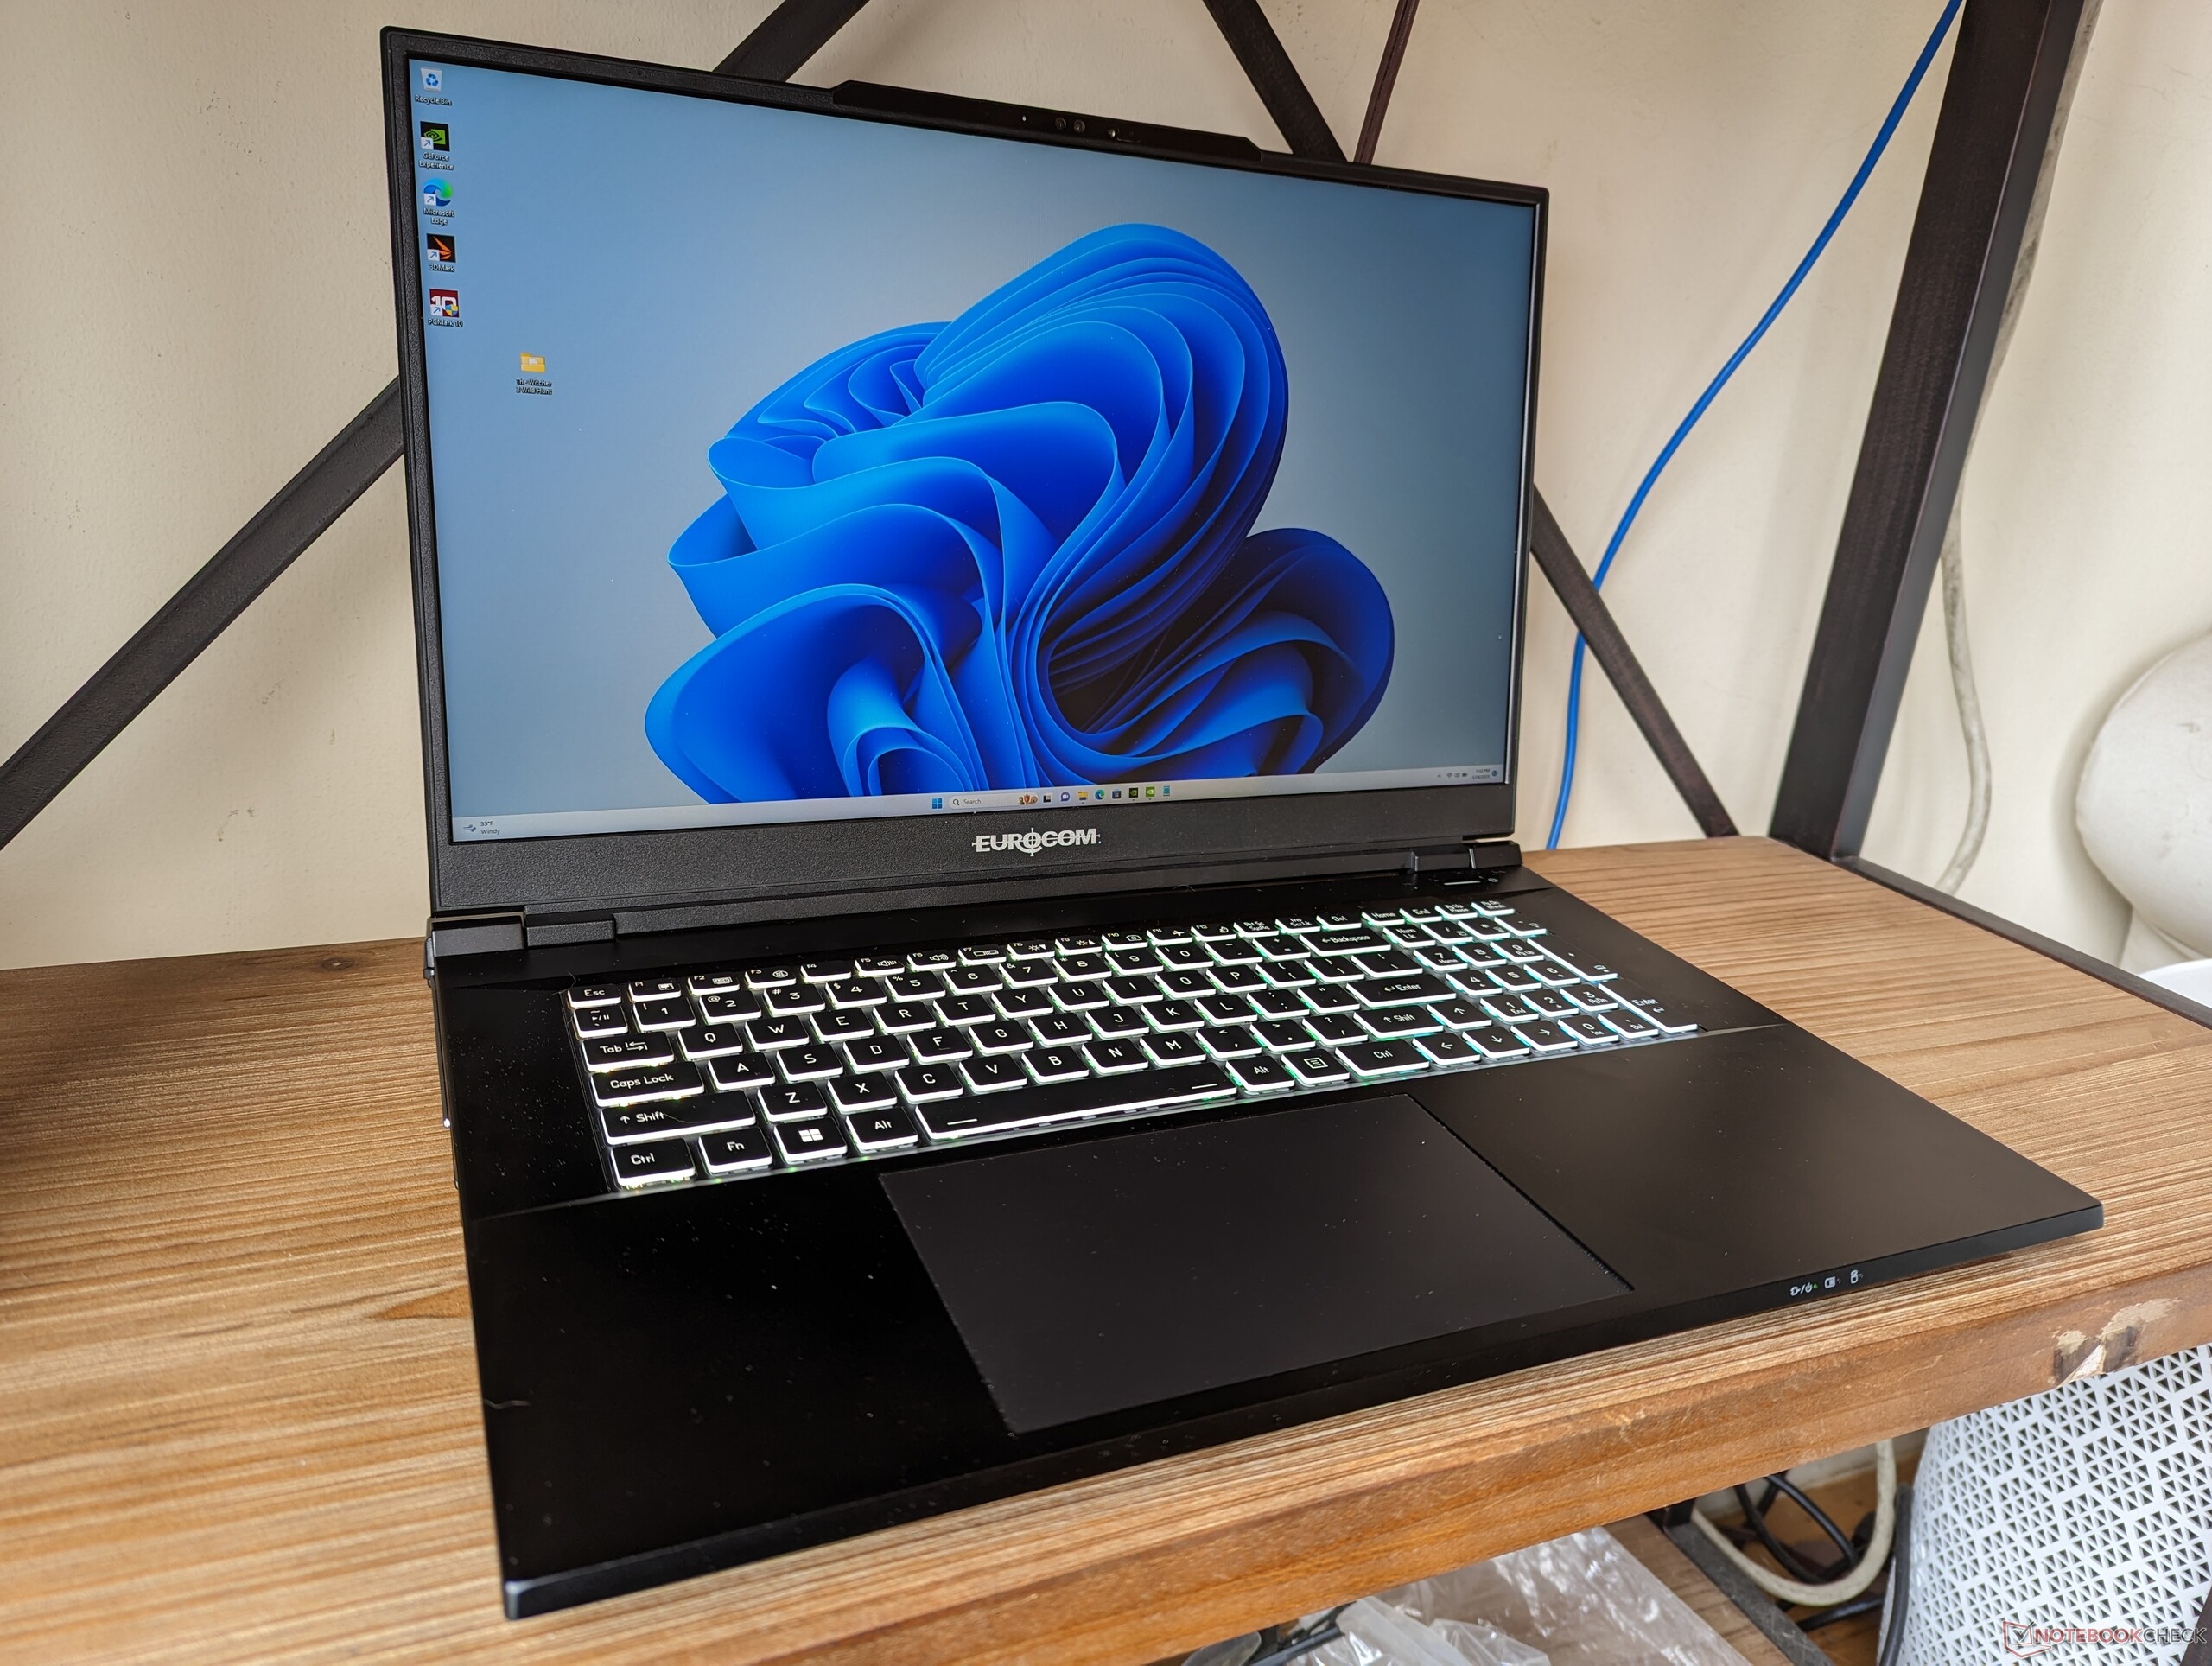
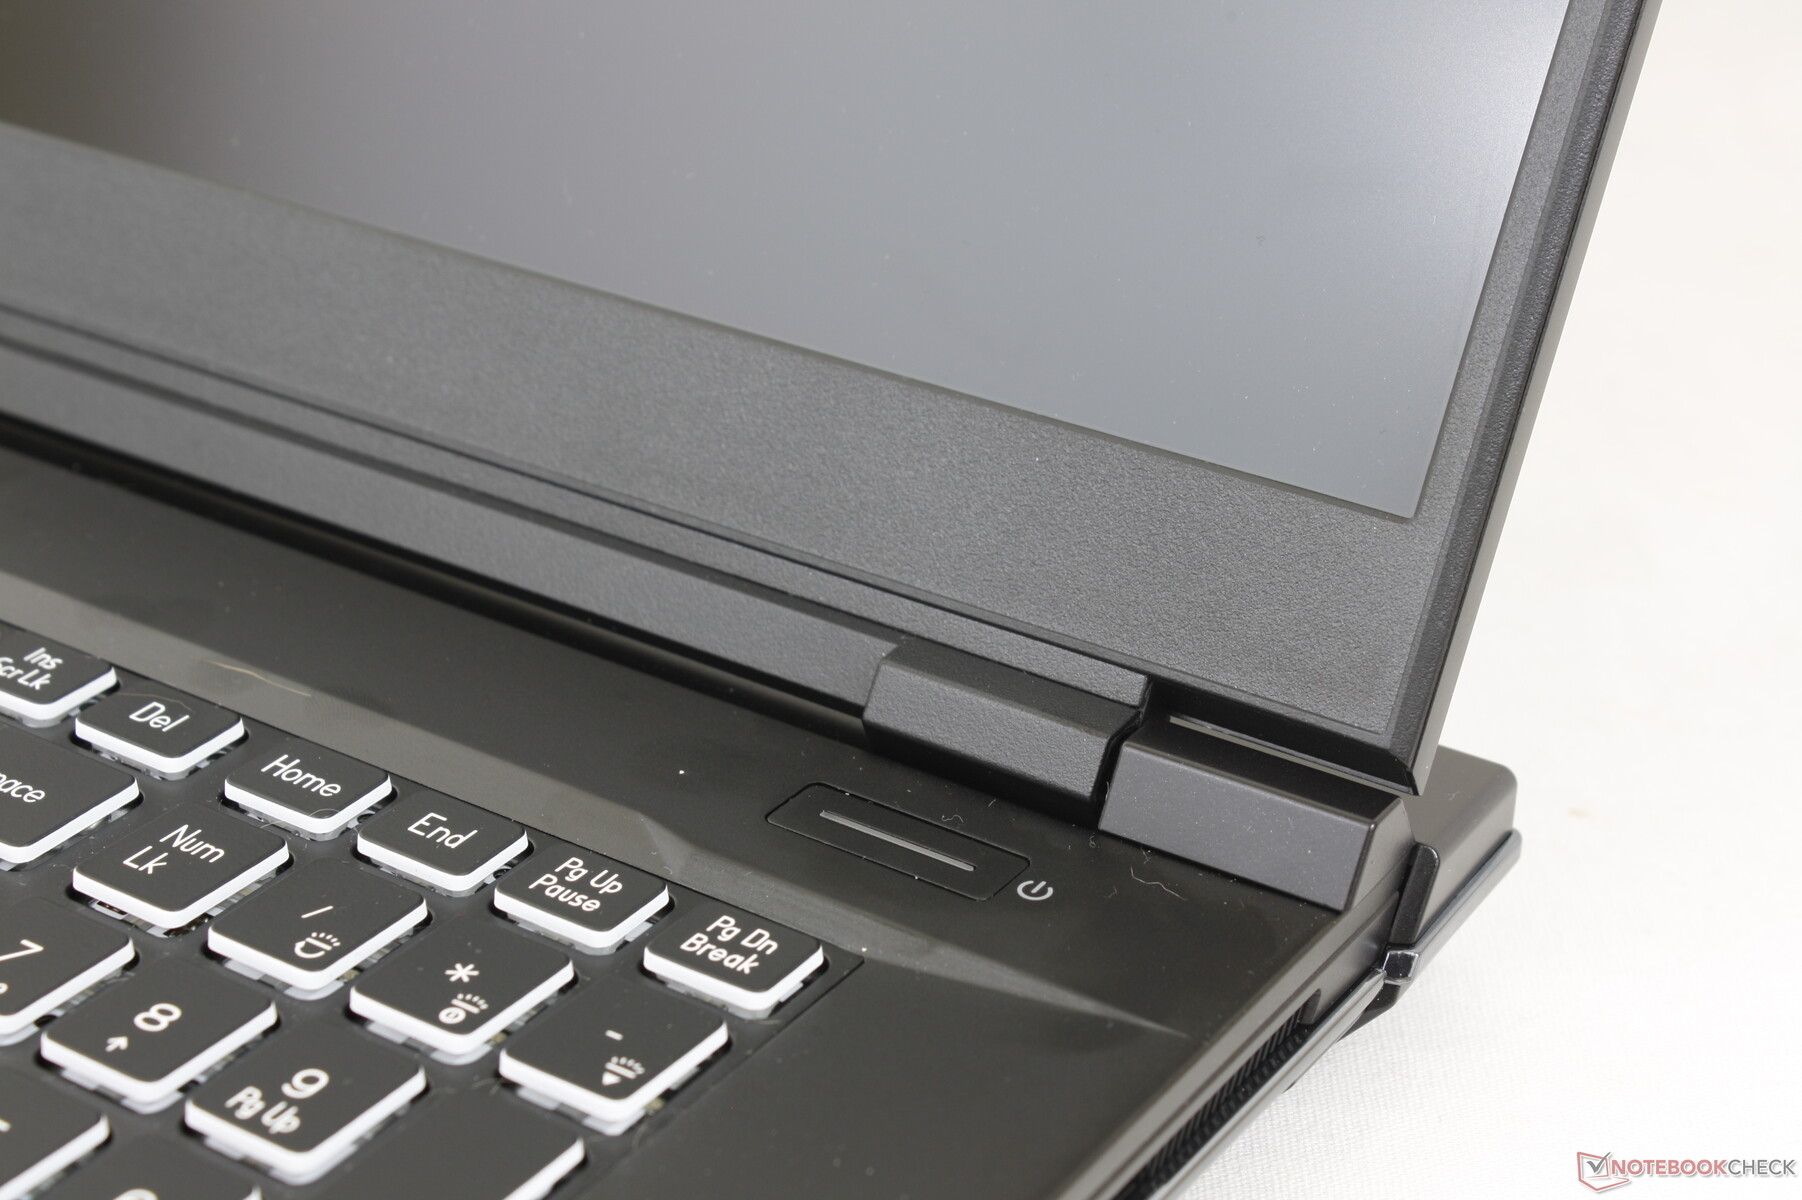
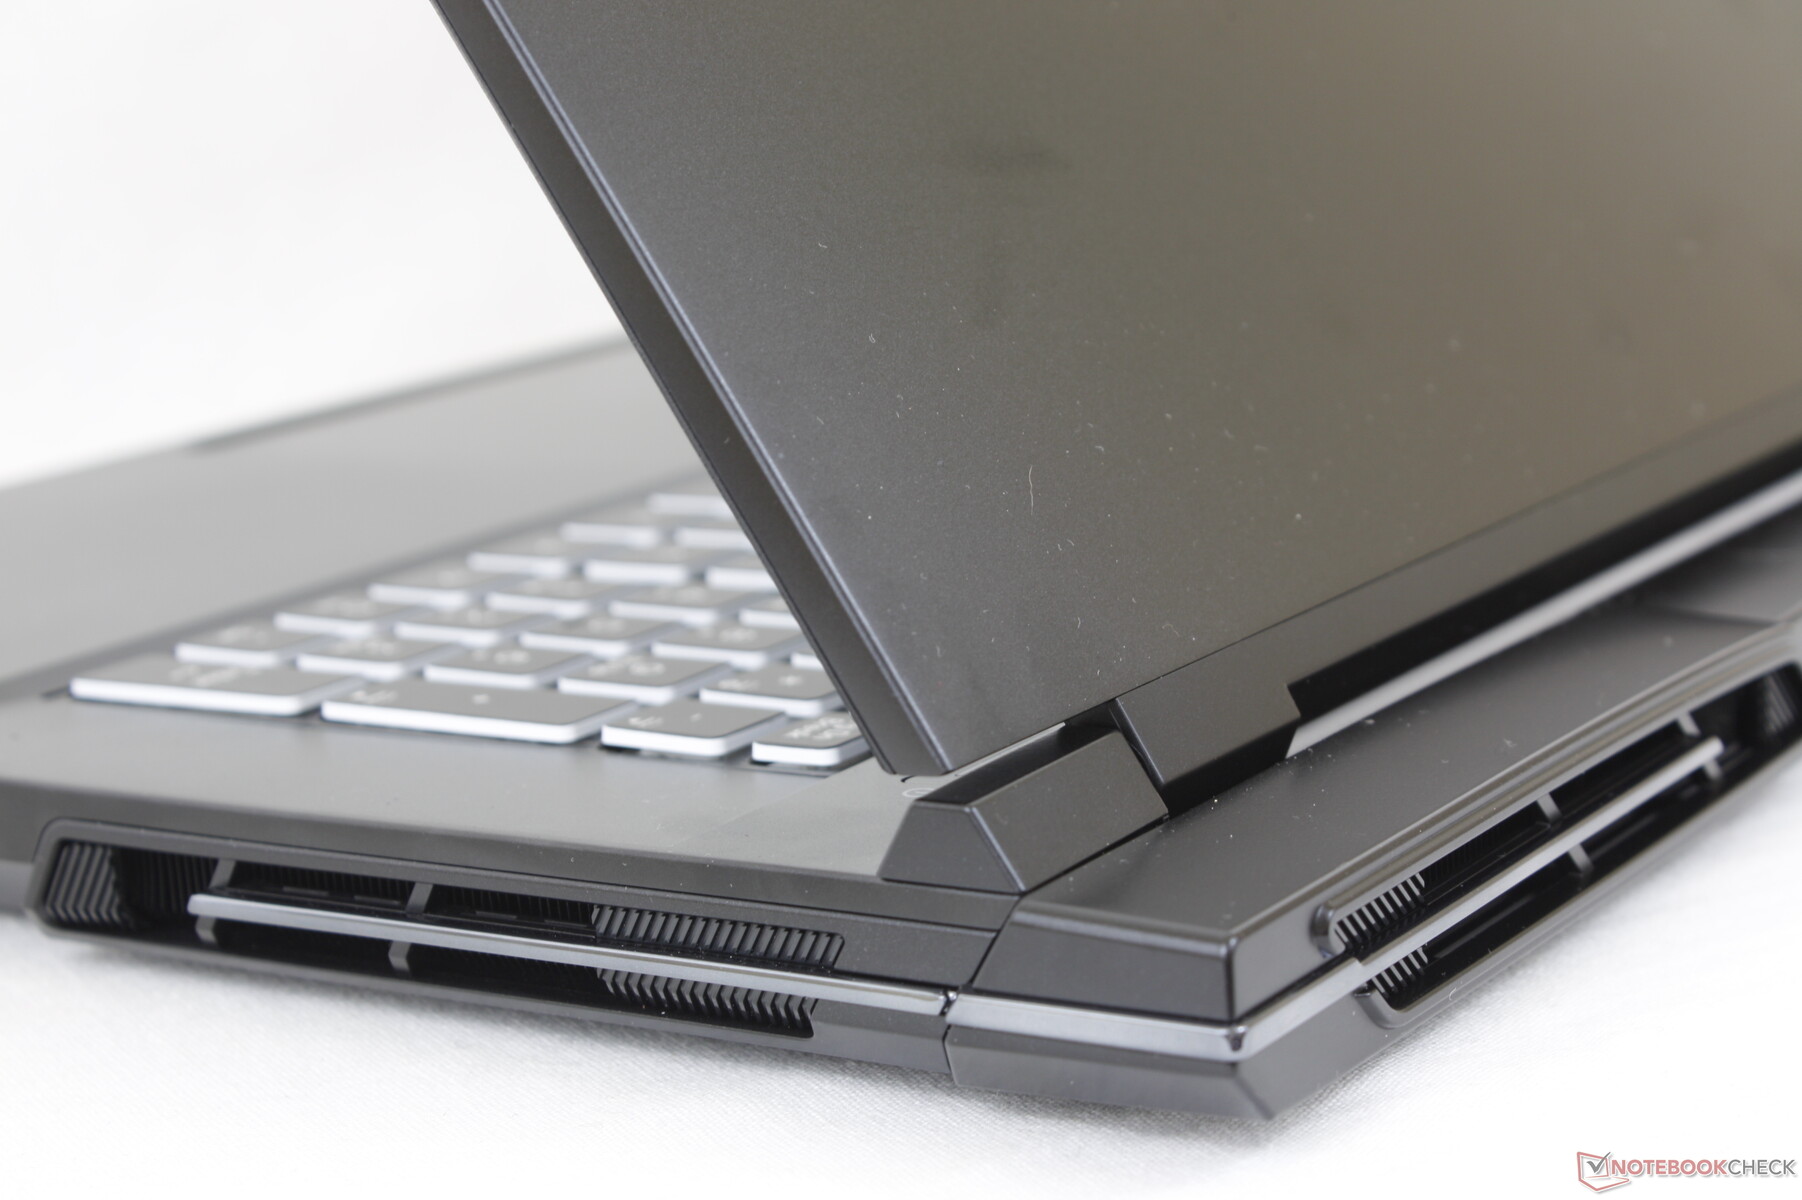
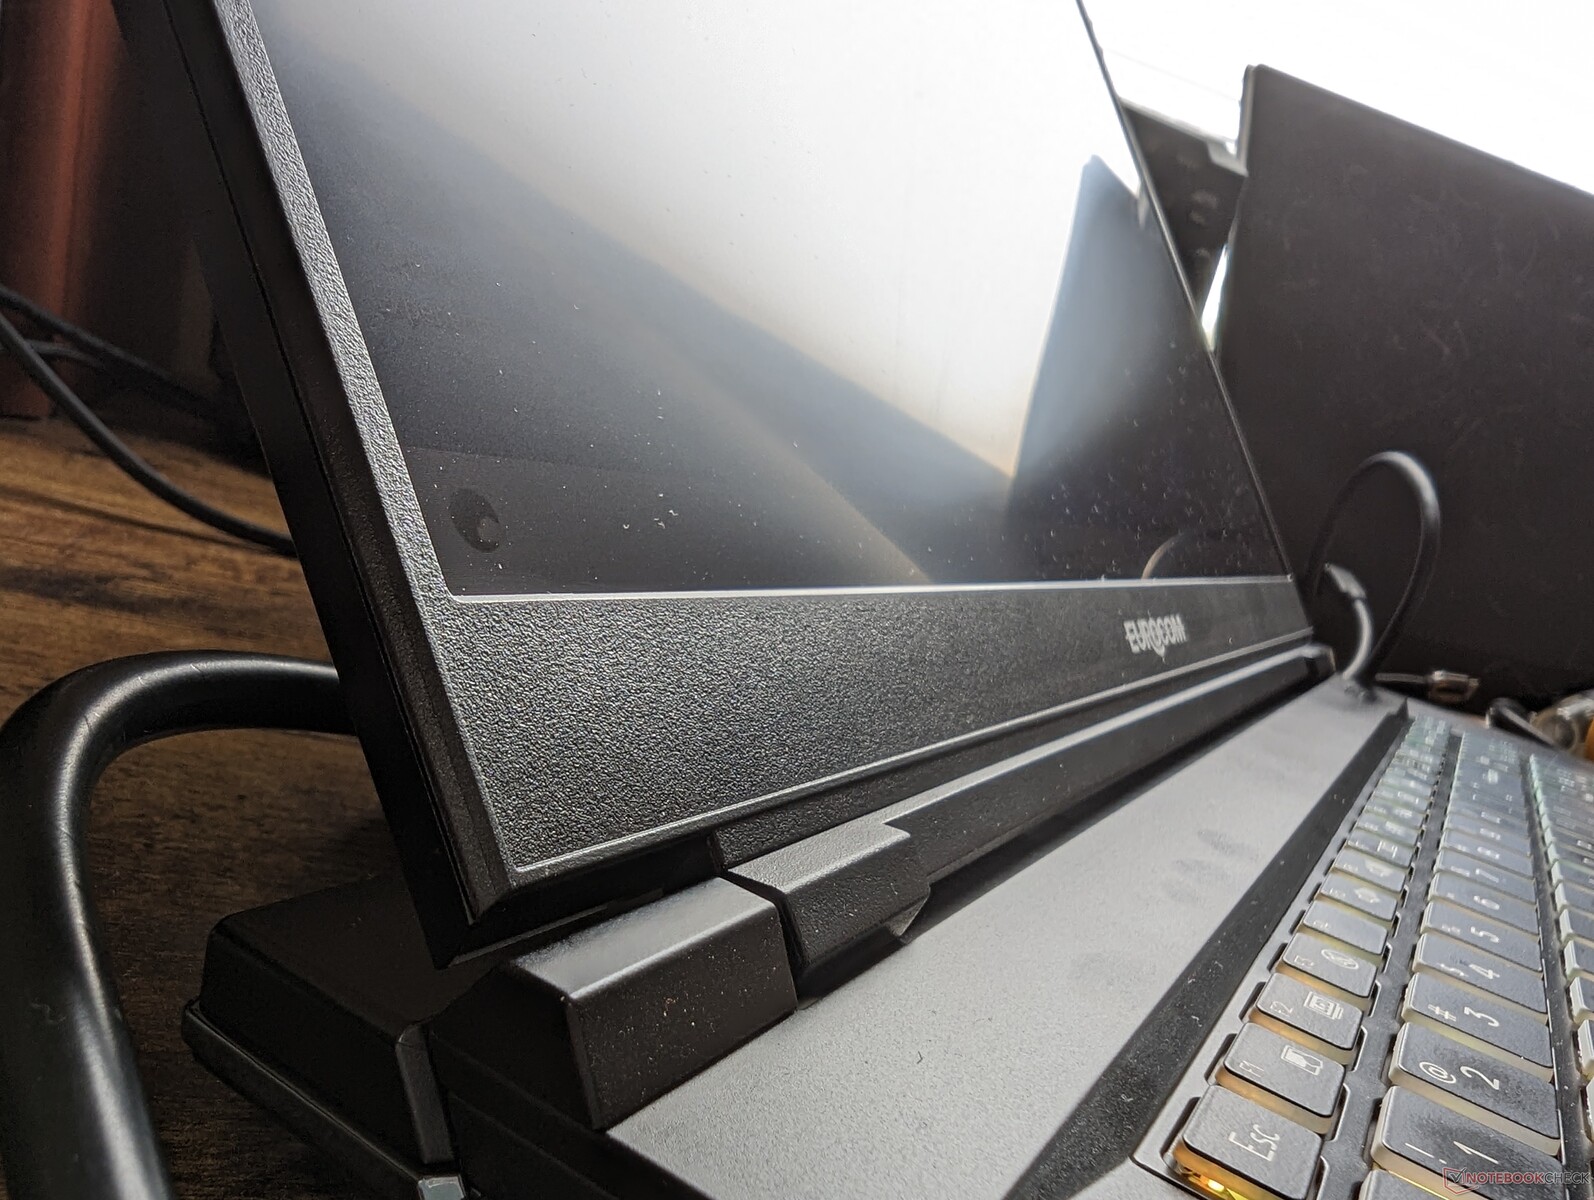
Le Raptor X17 est probablement l'ordinateur portable le plus élégant que nous ayons vu de la part d'Eurocom. Le squelette très lisse et principalement en métal contraste fortement avec les designs ABS plus anciens et plus épais de la même société. La rigidité du châssis est également excellente avec une flexion minimale le long de la base et du couvercle extérieur pour une première impression solide.
L'aspect le plus faible du châssis est peut-être la charnière, car l'écran vacille un peu plus agressivement lors de l'ajustement des angles par rapport aux charnières plus rigides et plus grandes d'un ordinateur portable Asus ROG Asus ROG. Le centre du clavier fléchit également légèrement lorsqu'on applique une pression avec un doigt, ce qui a un impact négatif sur le retour d'information des touches pendant la frappe. Espérons que les prochains modèles répondront à ces préoccupations.
Avec ses 3,5 kg, le Raptor X17 est l'un des ordinateurs portables de jeu les plus lourds de sa catégorie, devançant même l'Alienware m17 de 3,4 kg Alienware m17 R5. Le Raptor X17 est légèrement plus petit que le ROG Strix Scar 17 G733, mais il est 20 % plus lourd, ce qui lui confère une sensation de densité. Pour un modèle nettement plus léger et plus petit, les utilisateurs peuvent se tourner vers le Razer Blade 17 à la place.
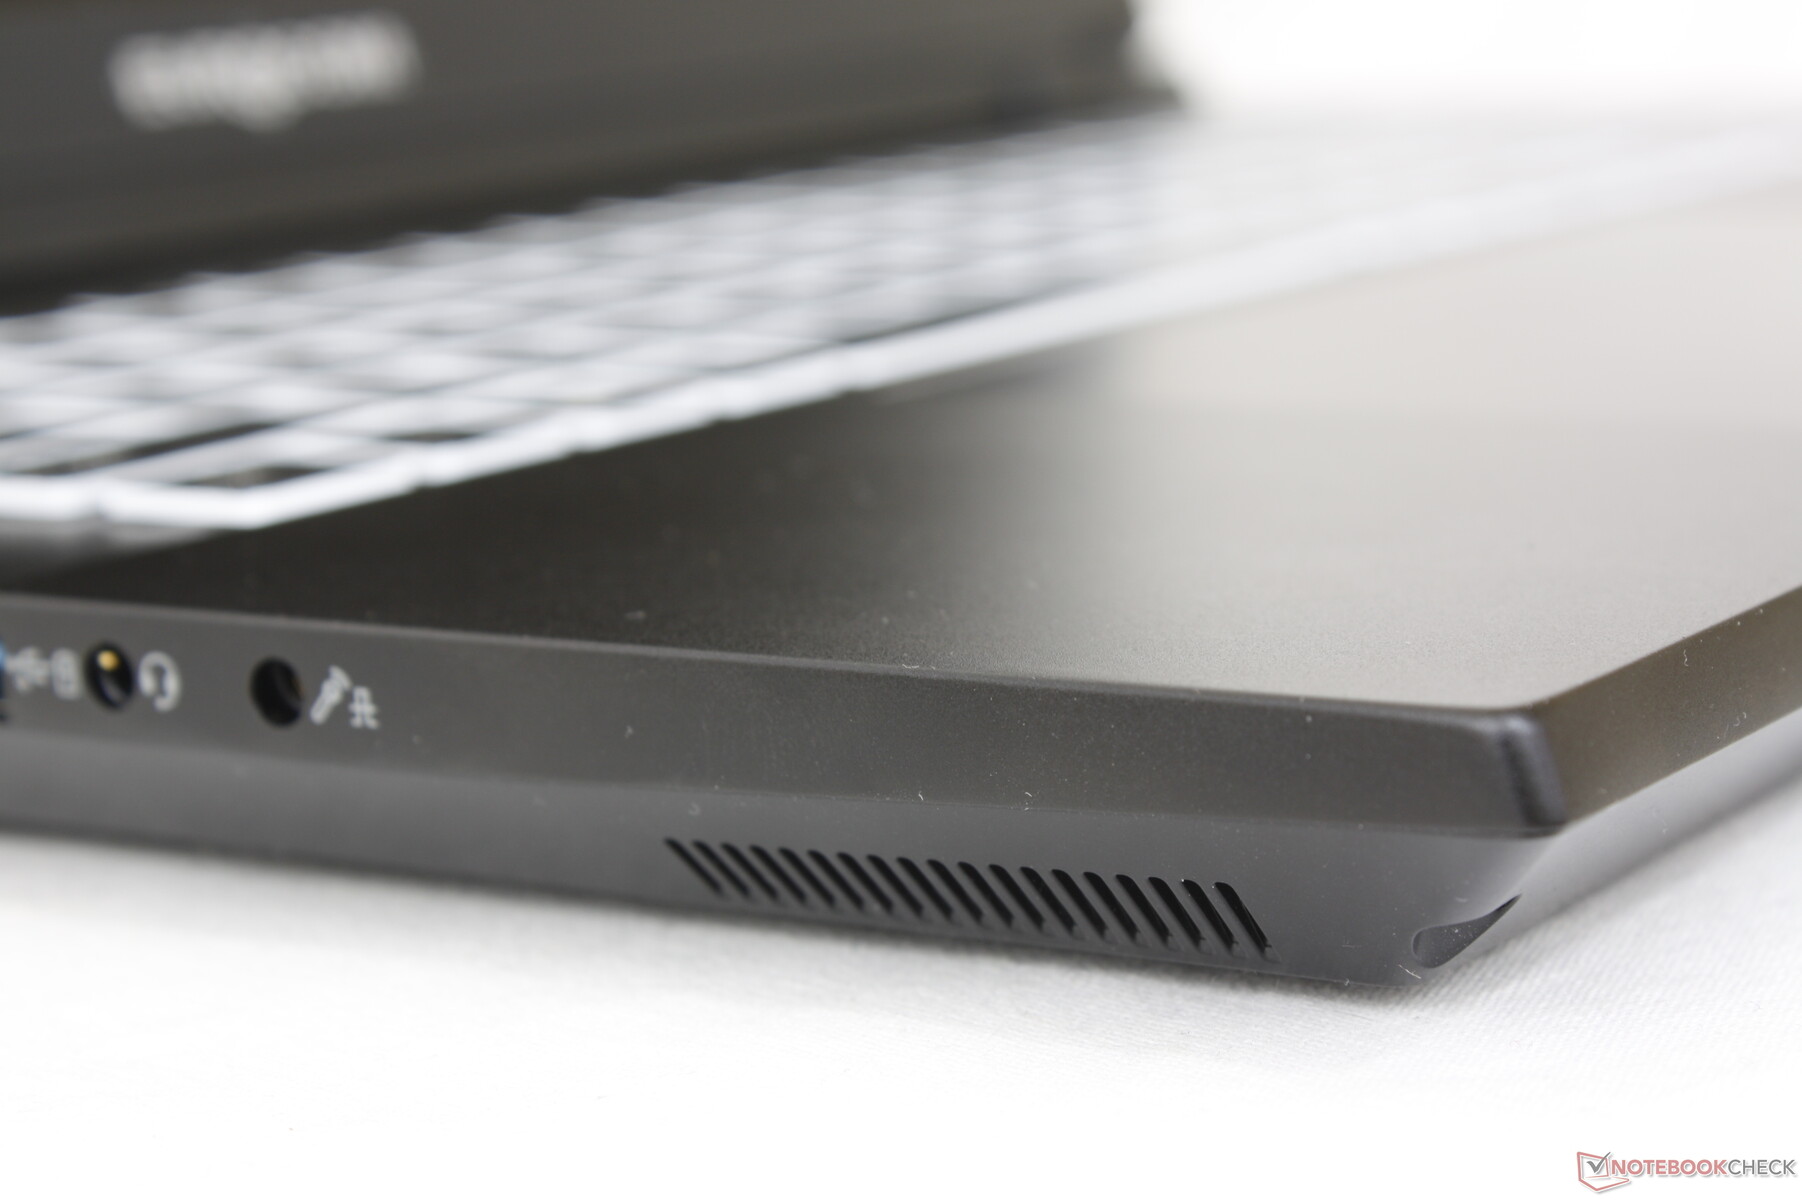
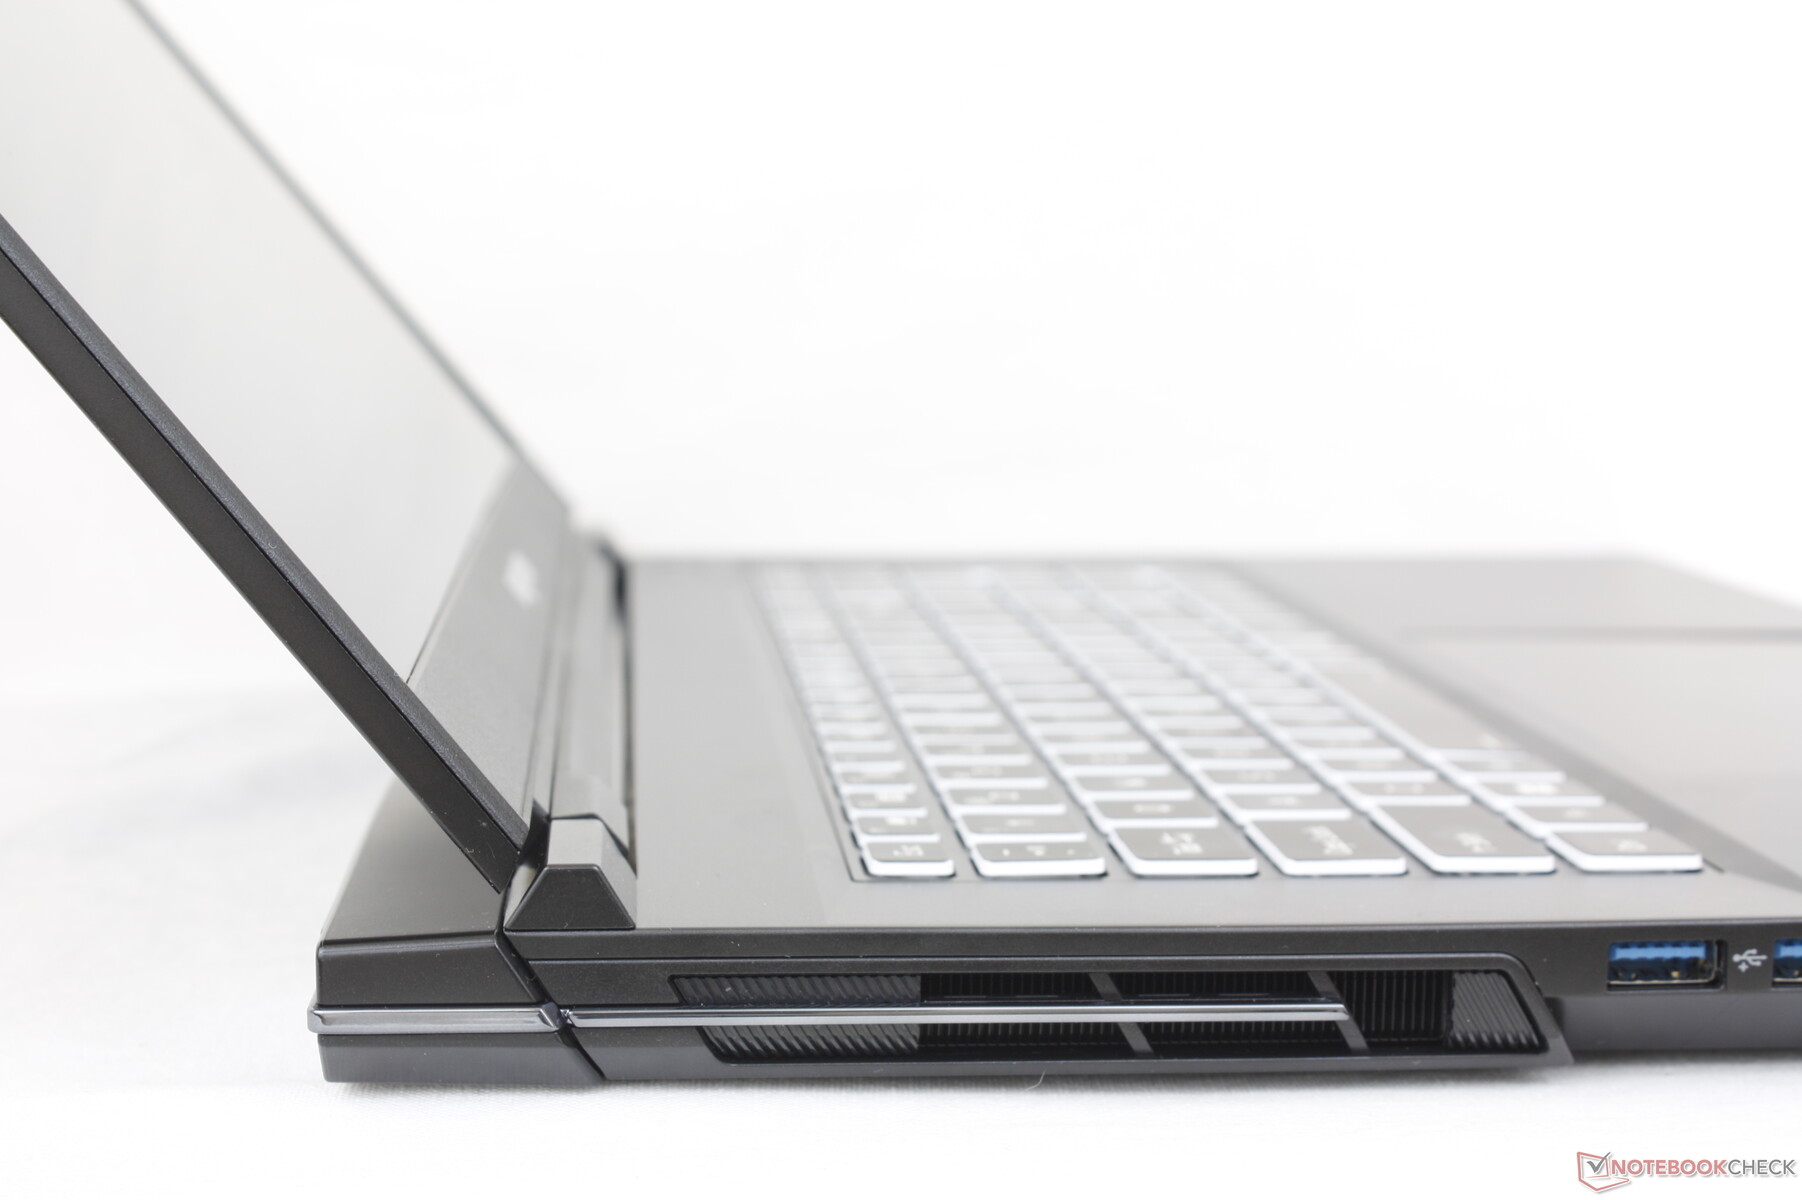
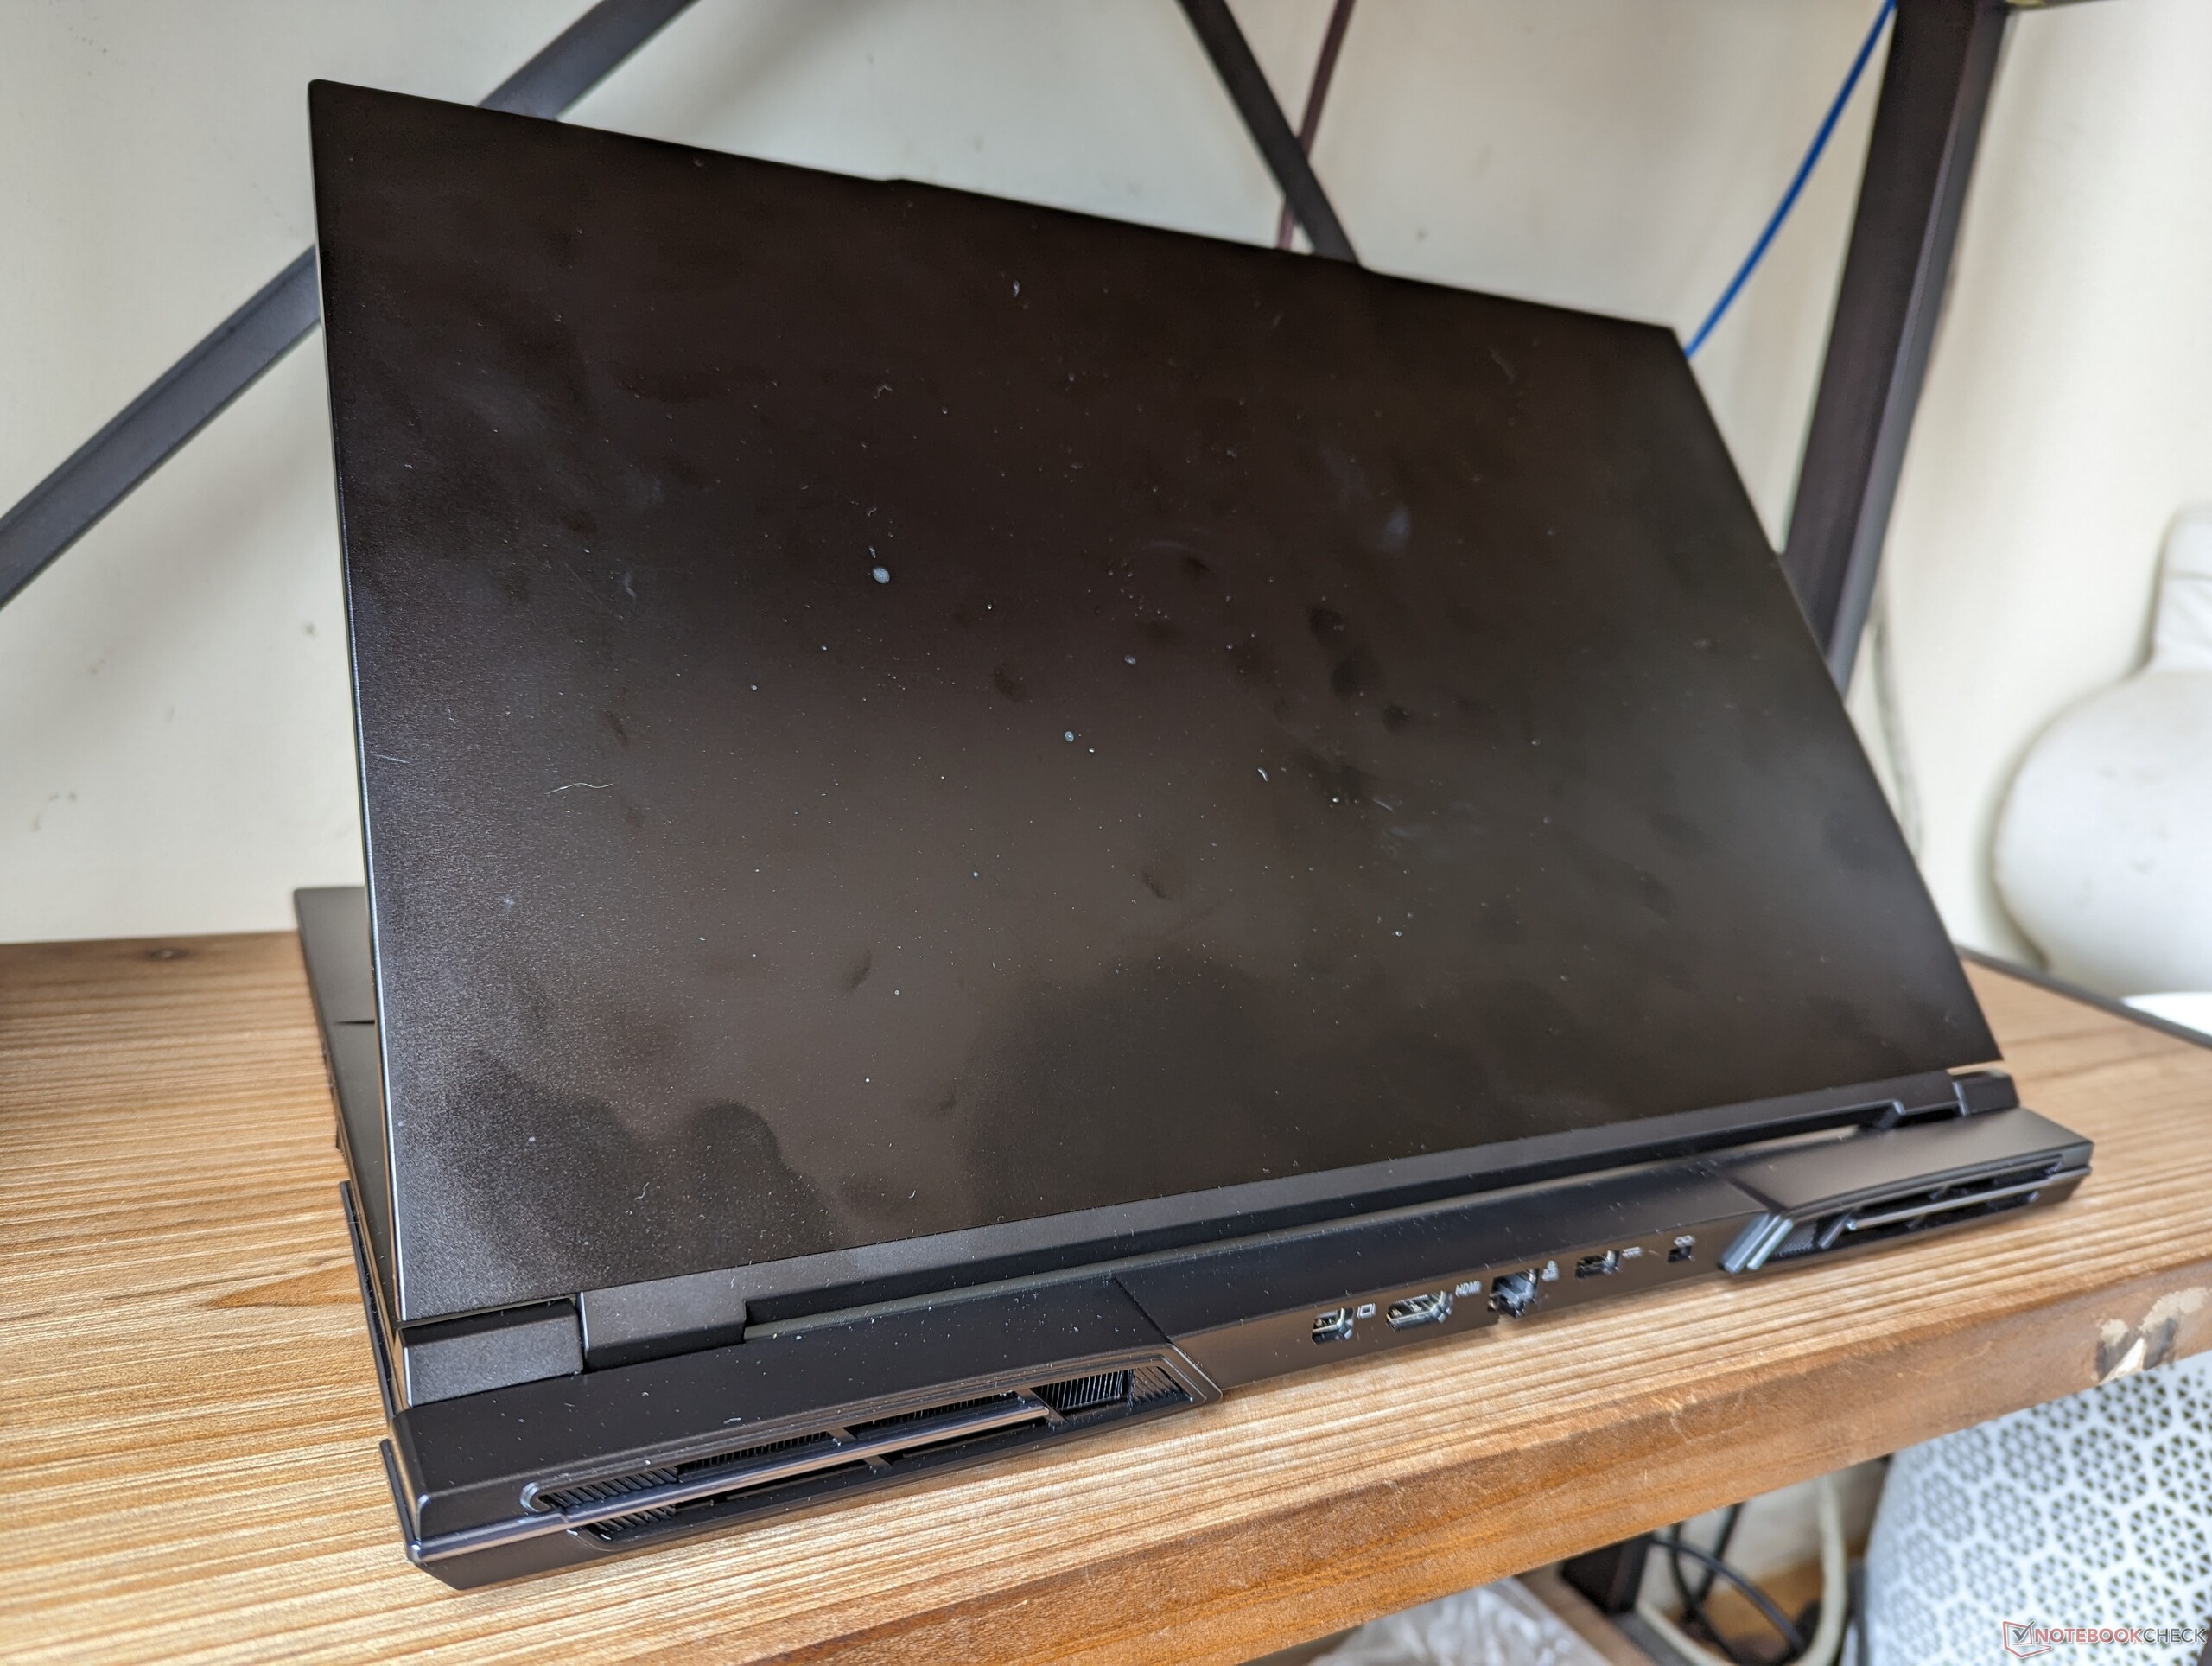
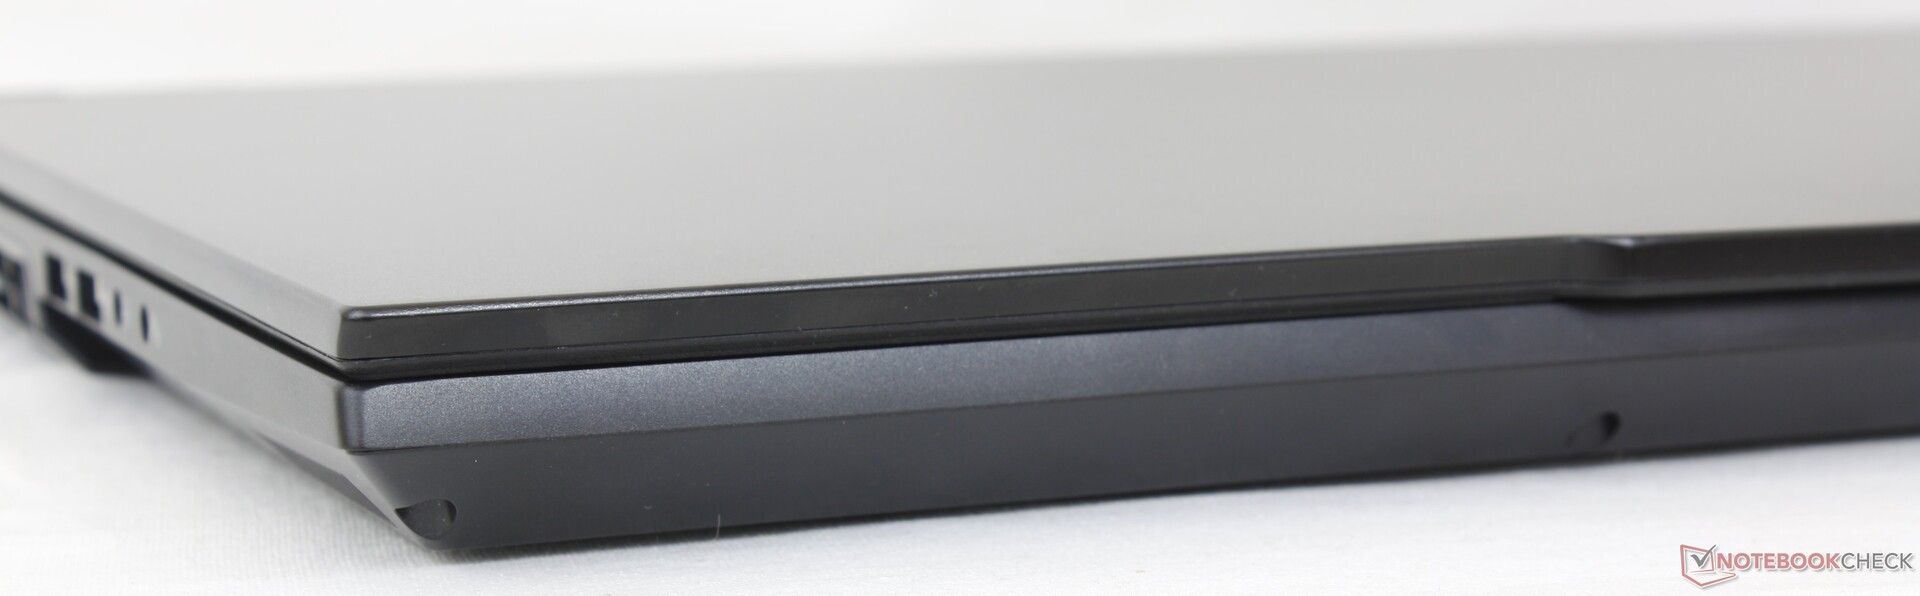
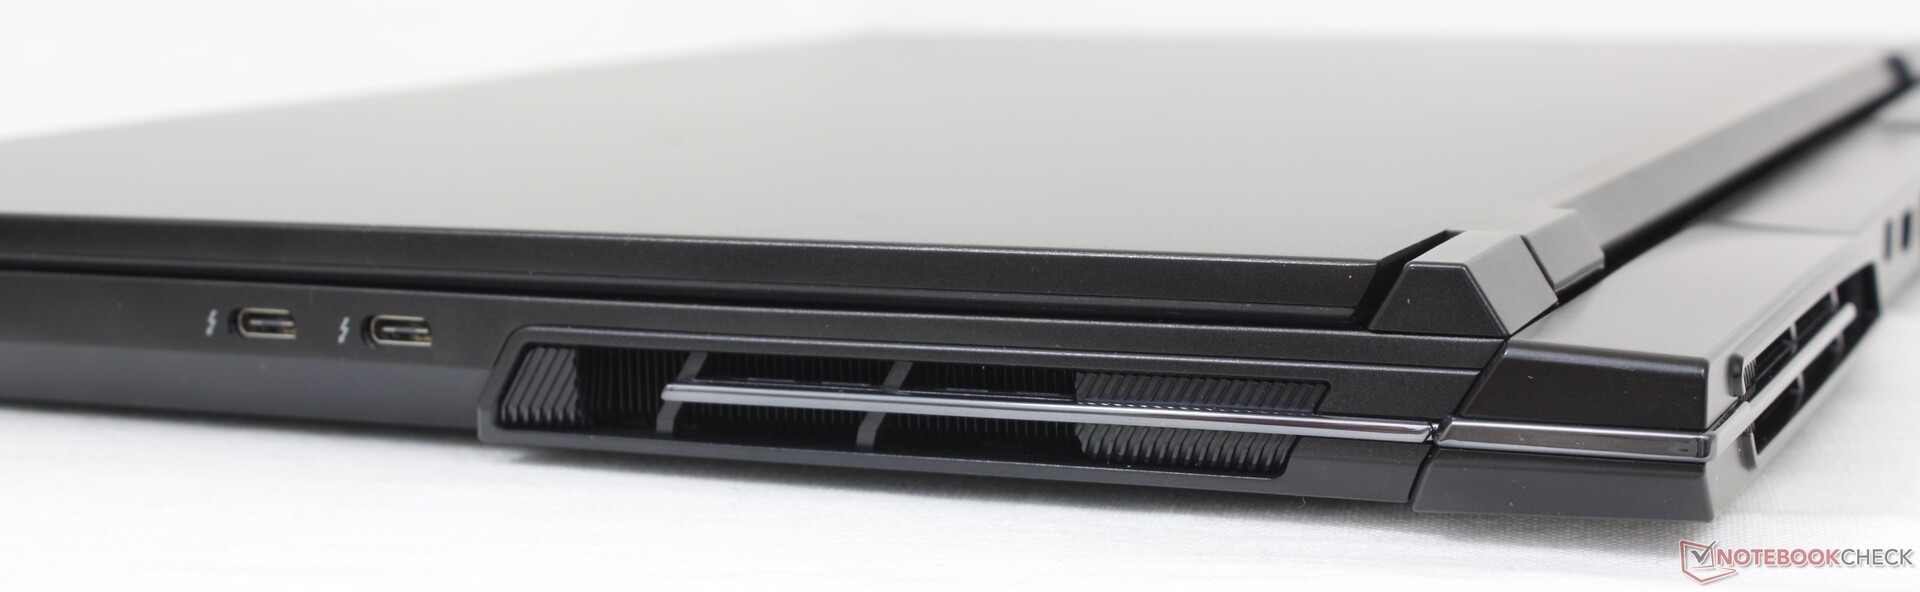
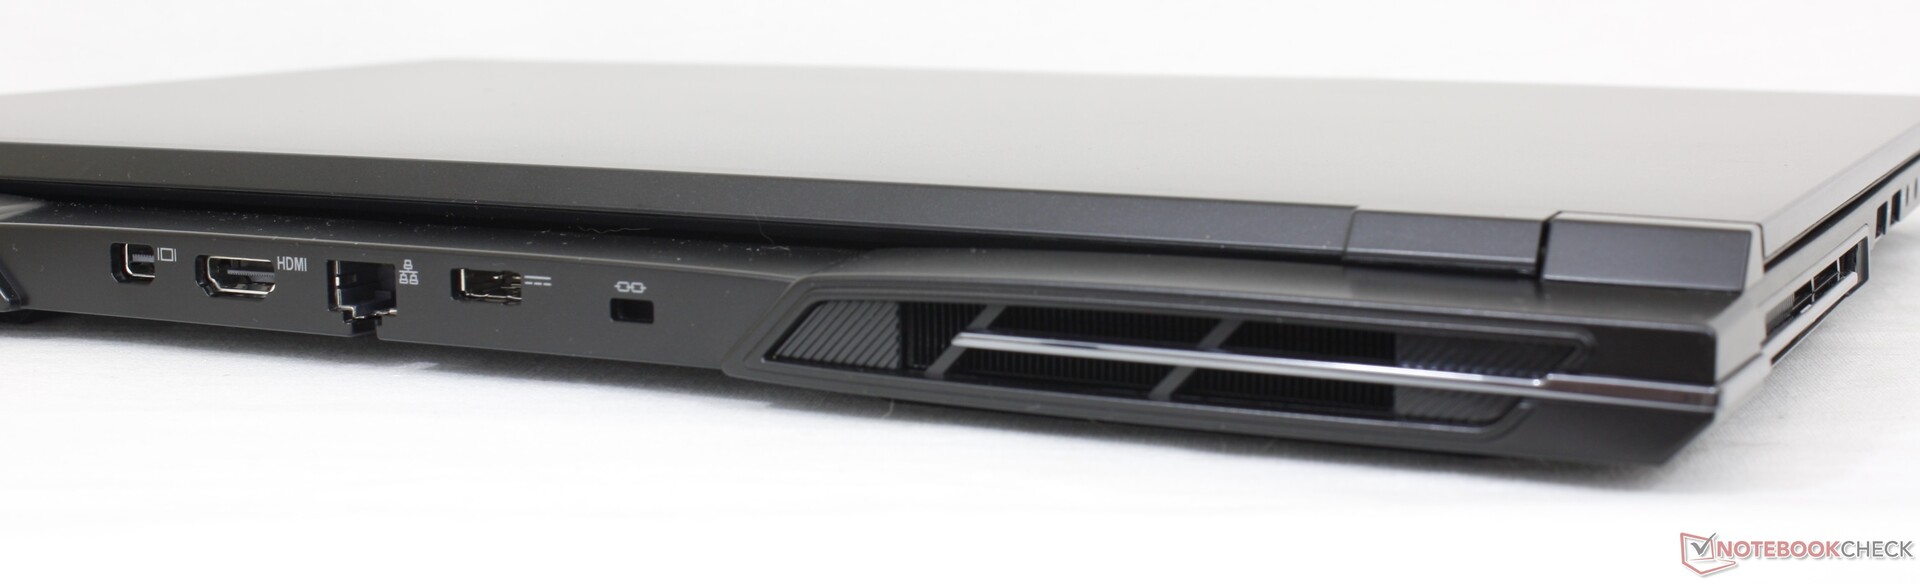
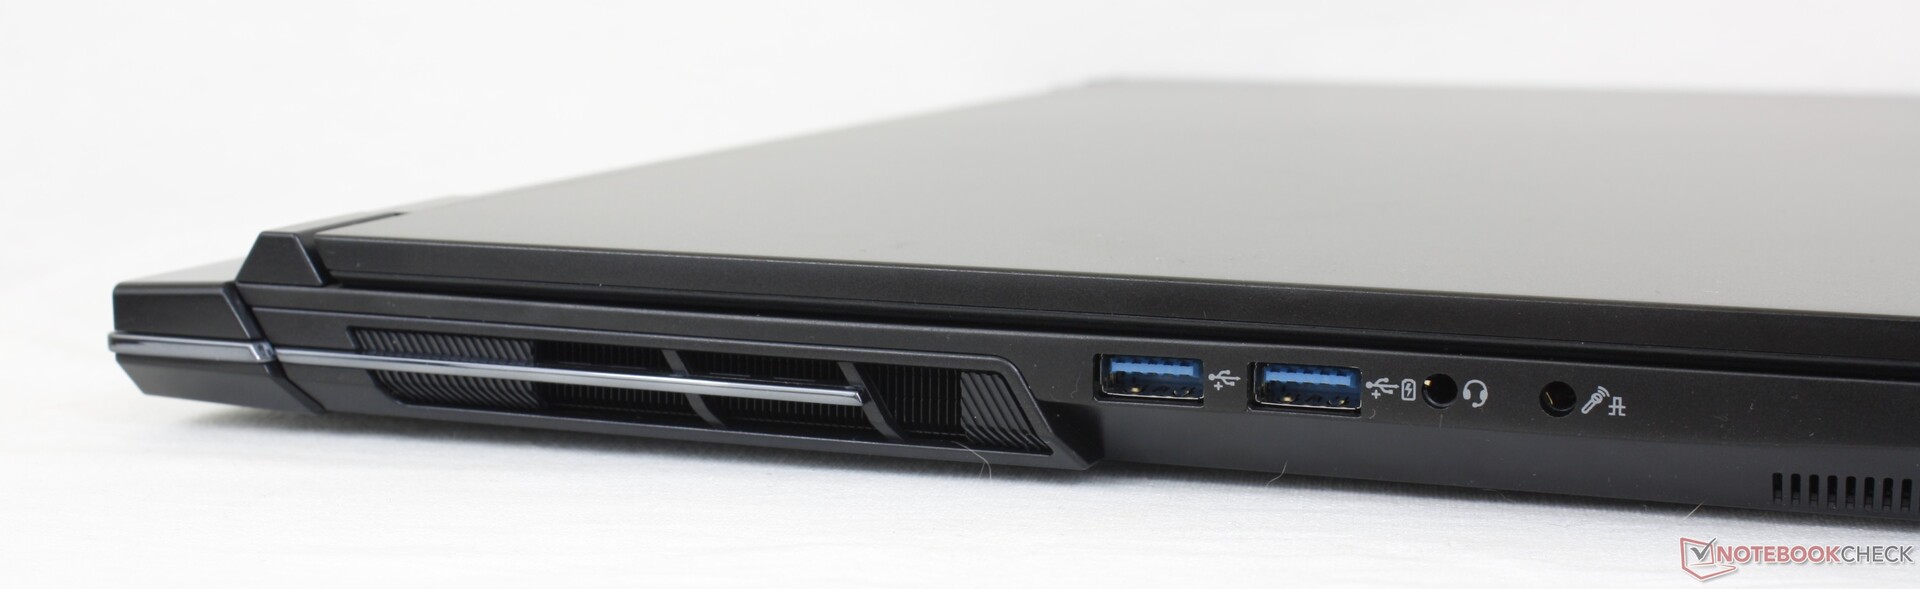
Connectivité - Un peu de tout
Les options de port sont plus variées que sur la plupart des autres ordinateurs portables de jeu de 17 pouces. Par exemple, il est rare de trouver un modèle qui intègre à la fois le mini DisplayPort et le RJ-45. Tous les ports USB se trouvent sur les côtés du châssis, tandis que l'arrière abrite presque tout le reste.
Communication
| Networking | |
| iperf3 transmit AXE11000 | |
| Aorus 17X AZF | |
| Eluktronics Mech-17 GP2 | |
| MSI GE78HX 13VH-070US | |
| Eurocom Raptor X17 | |
| Alienware m17 R5 (R9 6900HX, RX 6850M XT) | |
| Asus ROG Strix Scar 17 G733PY-XS96 | |
| iperf3 receive AXE11000 | |
| Aorus 17X AZF | |
| Eluktronics Mech-17 GP2 | |
| Asus ROG Strix Scar 17 G733PY-XS96 | |
| MSI GE78HX 13VH-070US | |
| Eurocom Raptor X17 | |
| Alienware m17 R5 (R9 6900HX, RX 6850M XT) | |
| iperf3 transmit AXE11000 6GHz | |
| Asus ROG Strix Scar 17 G733PY-XS96 | |
| MSI GE78HX 13VH-070US | |
| Eurocom Raptor X17 | |
| iperf3 receive AXE11000 6GHz | |
| MSI GE78HX 13VH-070US | |
| Asus ROG Strix Scar 17 G733PY-XS96 | |
| Eurocom Raptor X17 | |
Webcam
La webcam de 2 mégapixels est typique de la plupart des autres ordinateurs portables, quel que soit leur prix. Au moins, l'infrarouge est intégré pour la prise en charge de Hello et il y a un obturateur électronique pour le respect de la vie privée. Espérons que les modèles de la prochaine génération intégreront des webcams de 5 MP, comme sur les derniers modèles de la gamme Razer Blade Razer Blade 18.

")
")
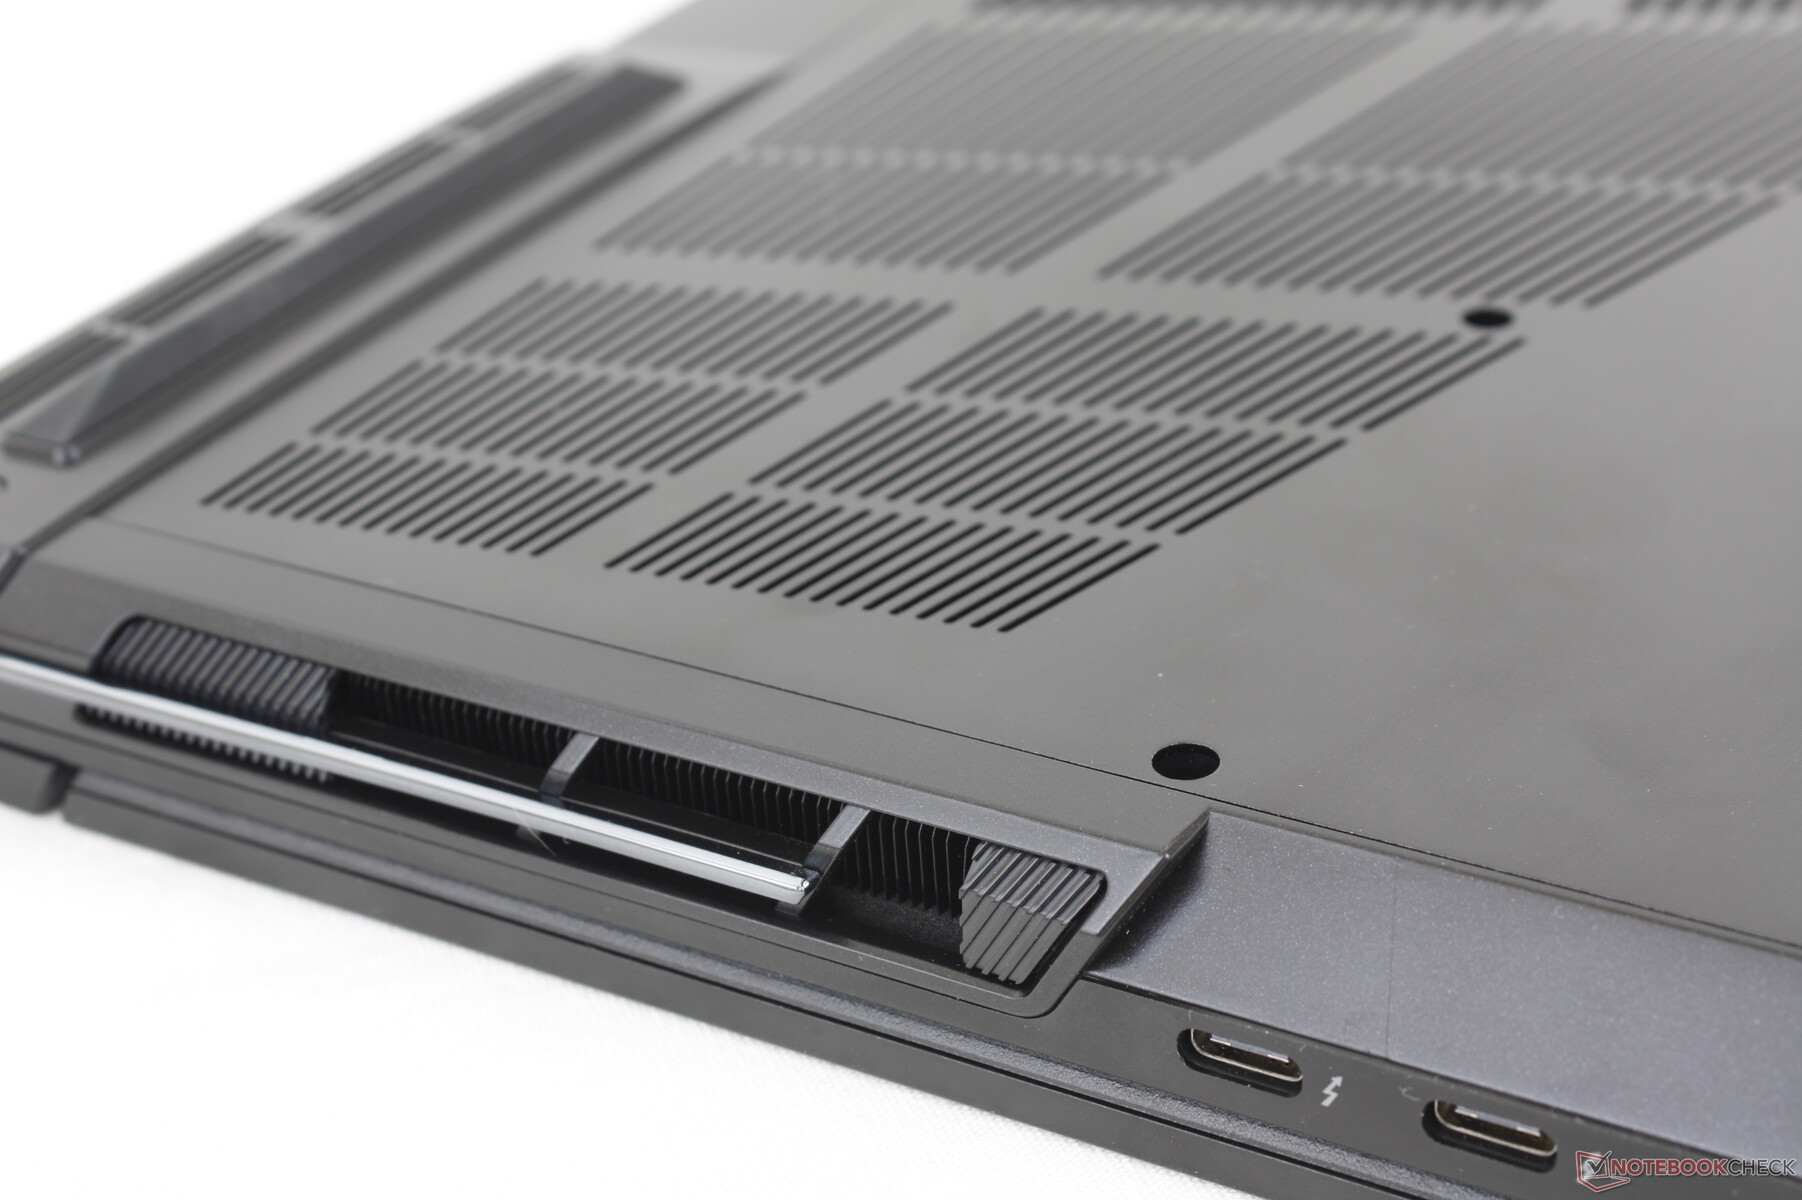
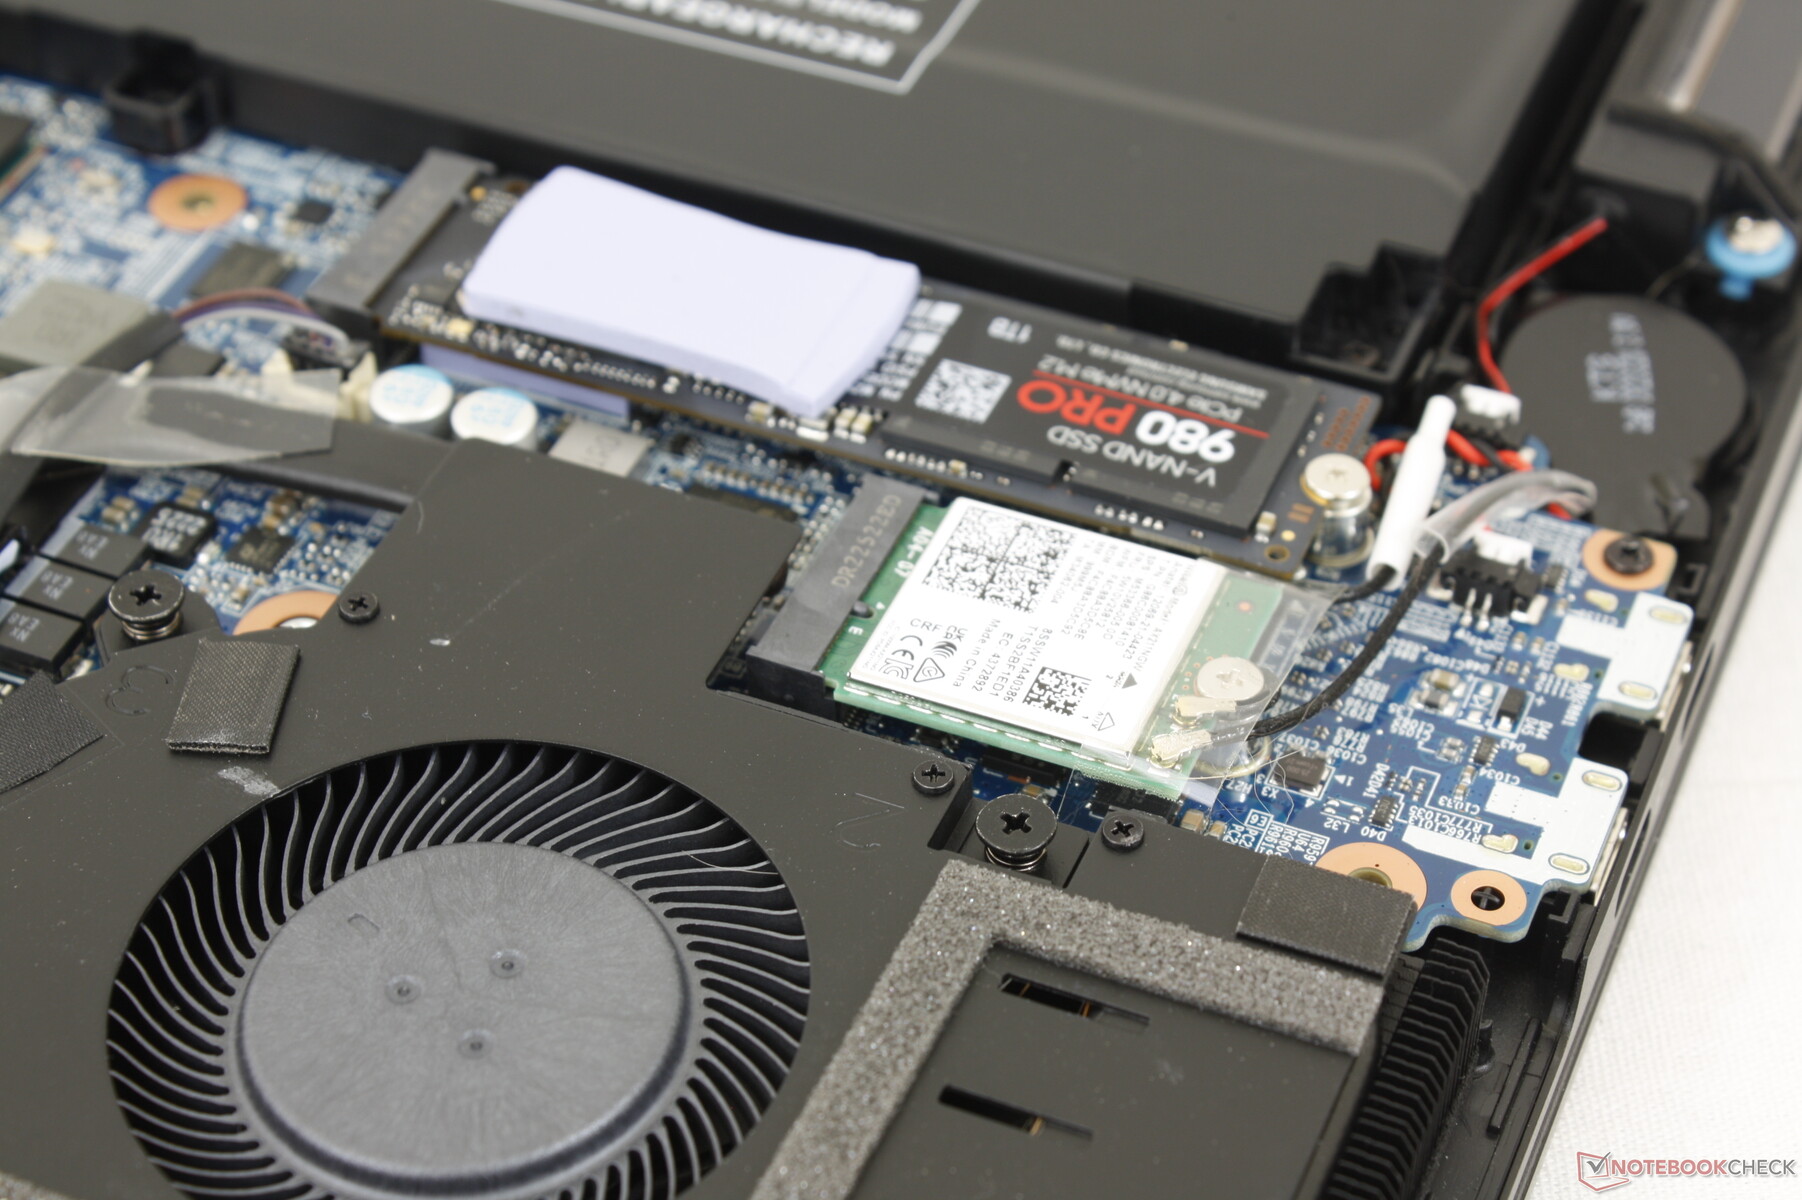
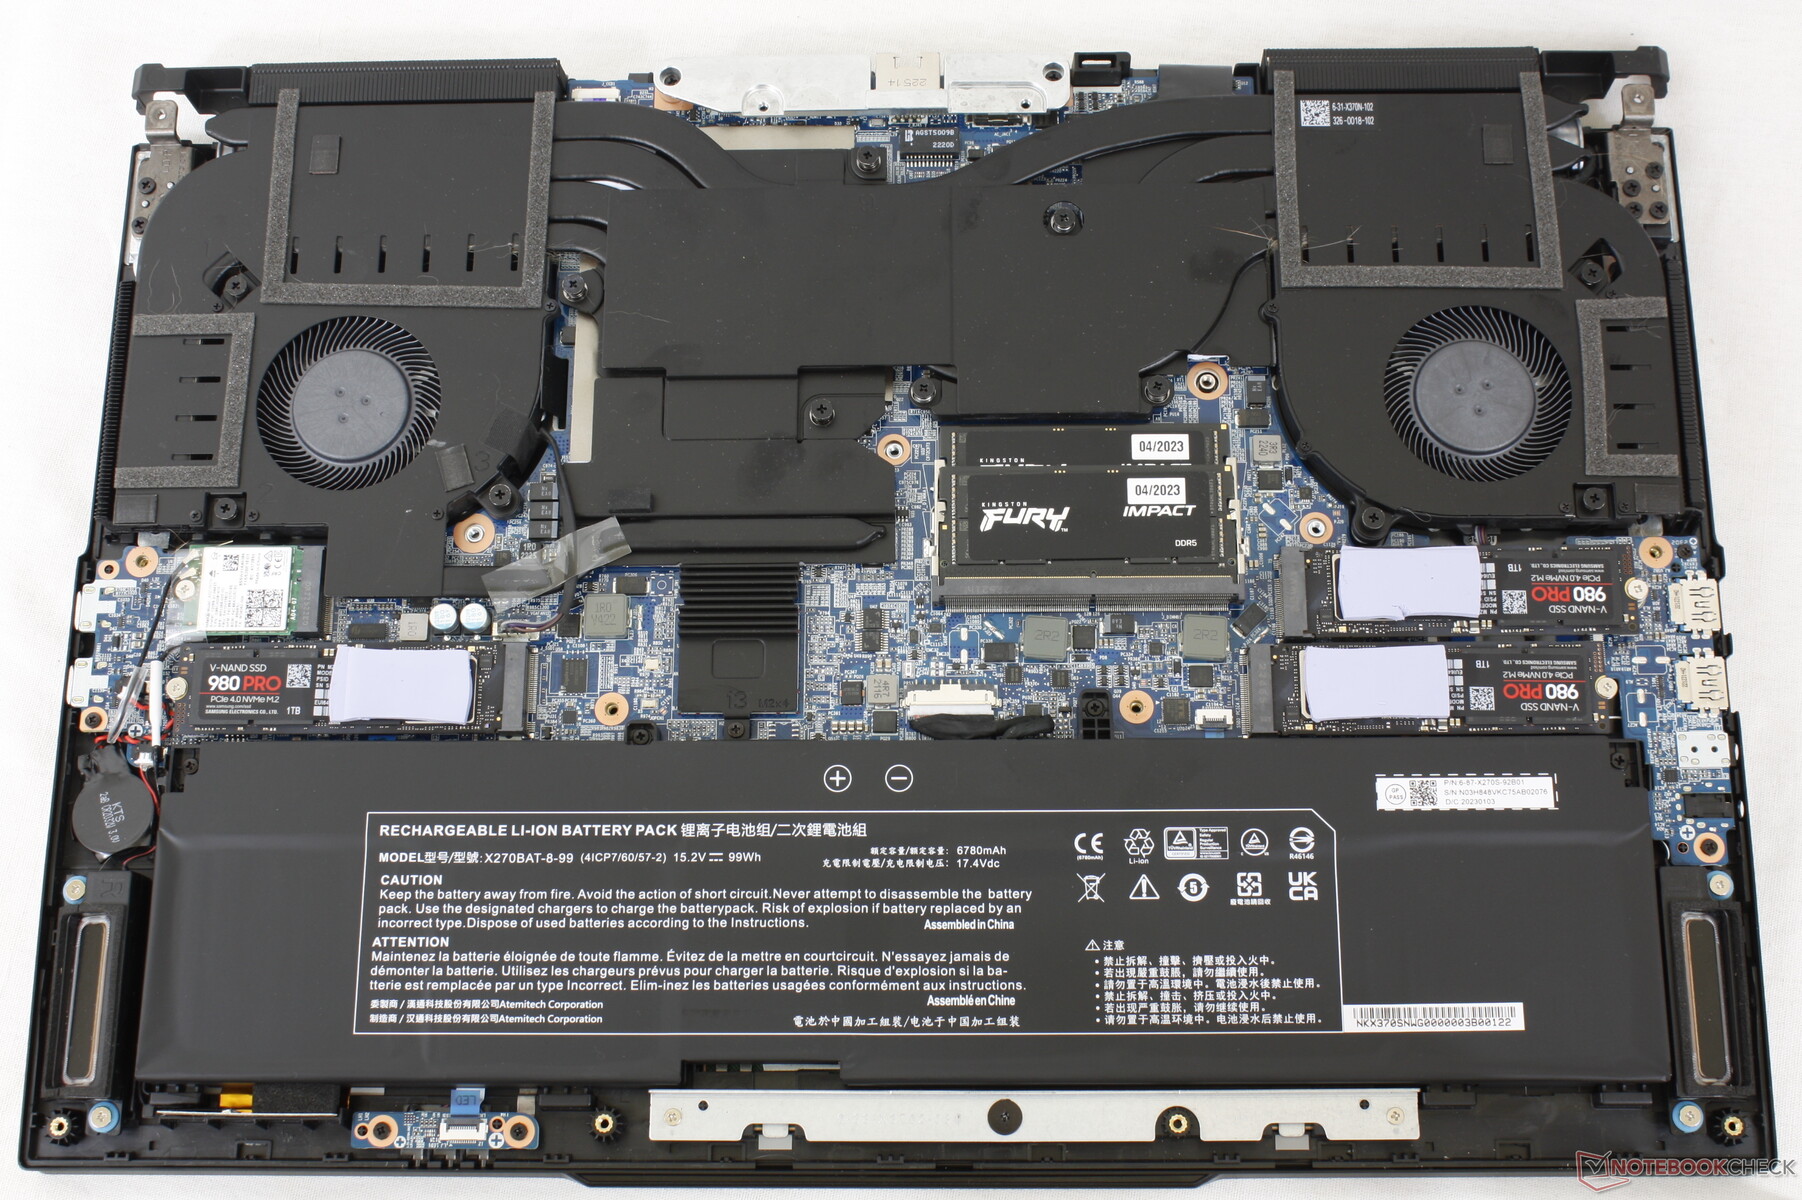
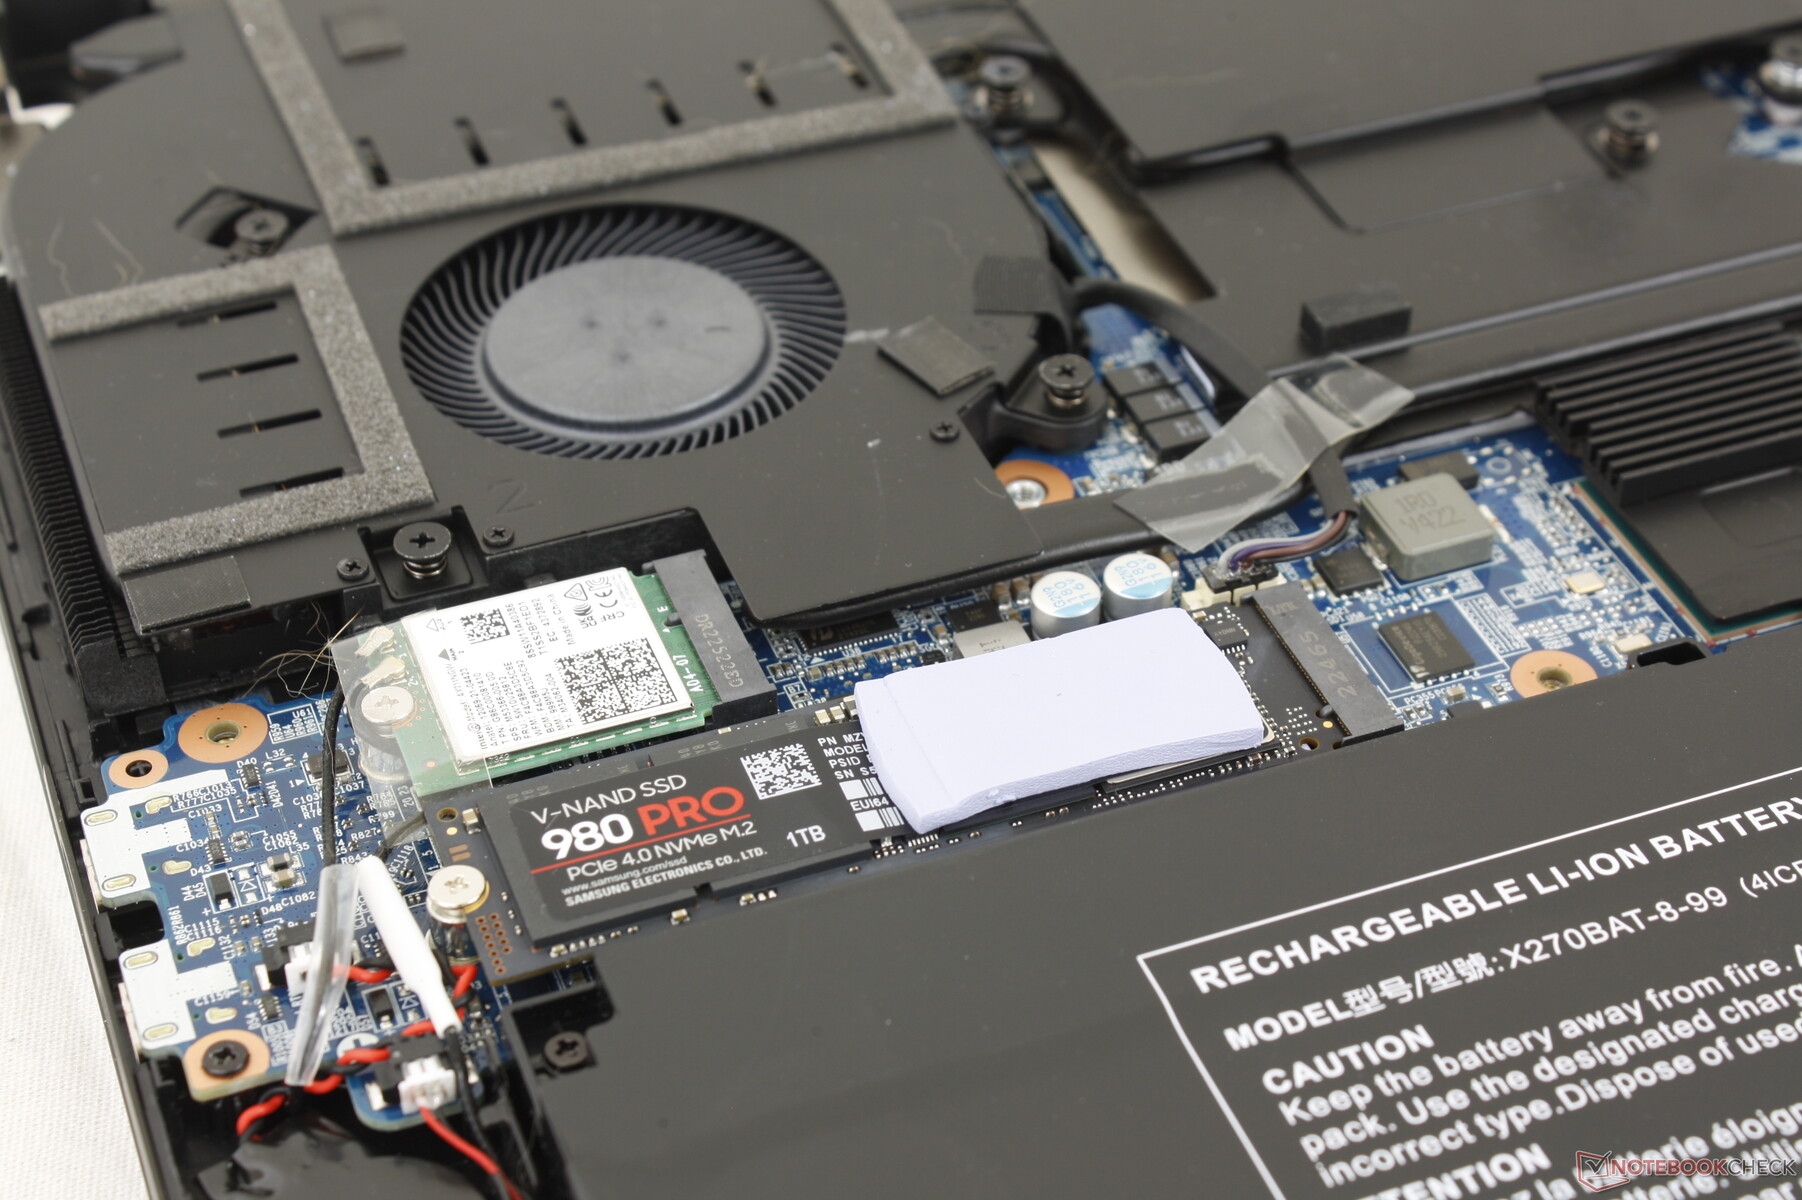
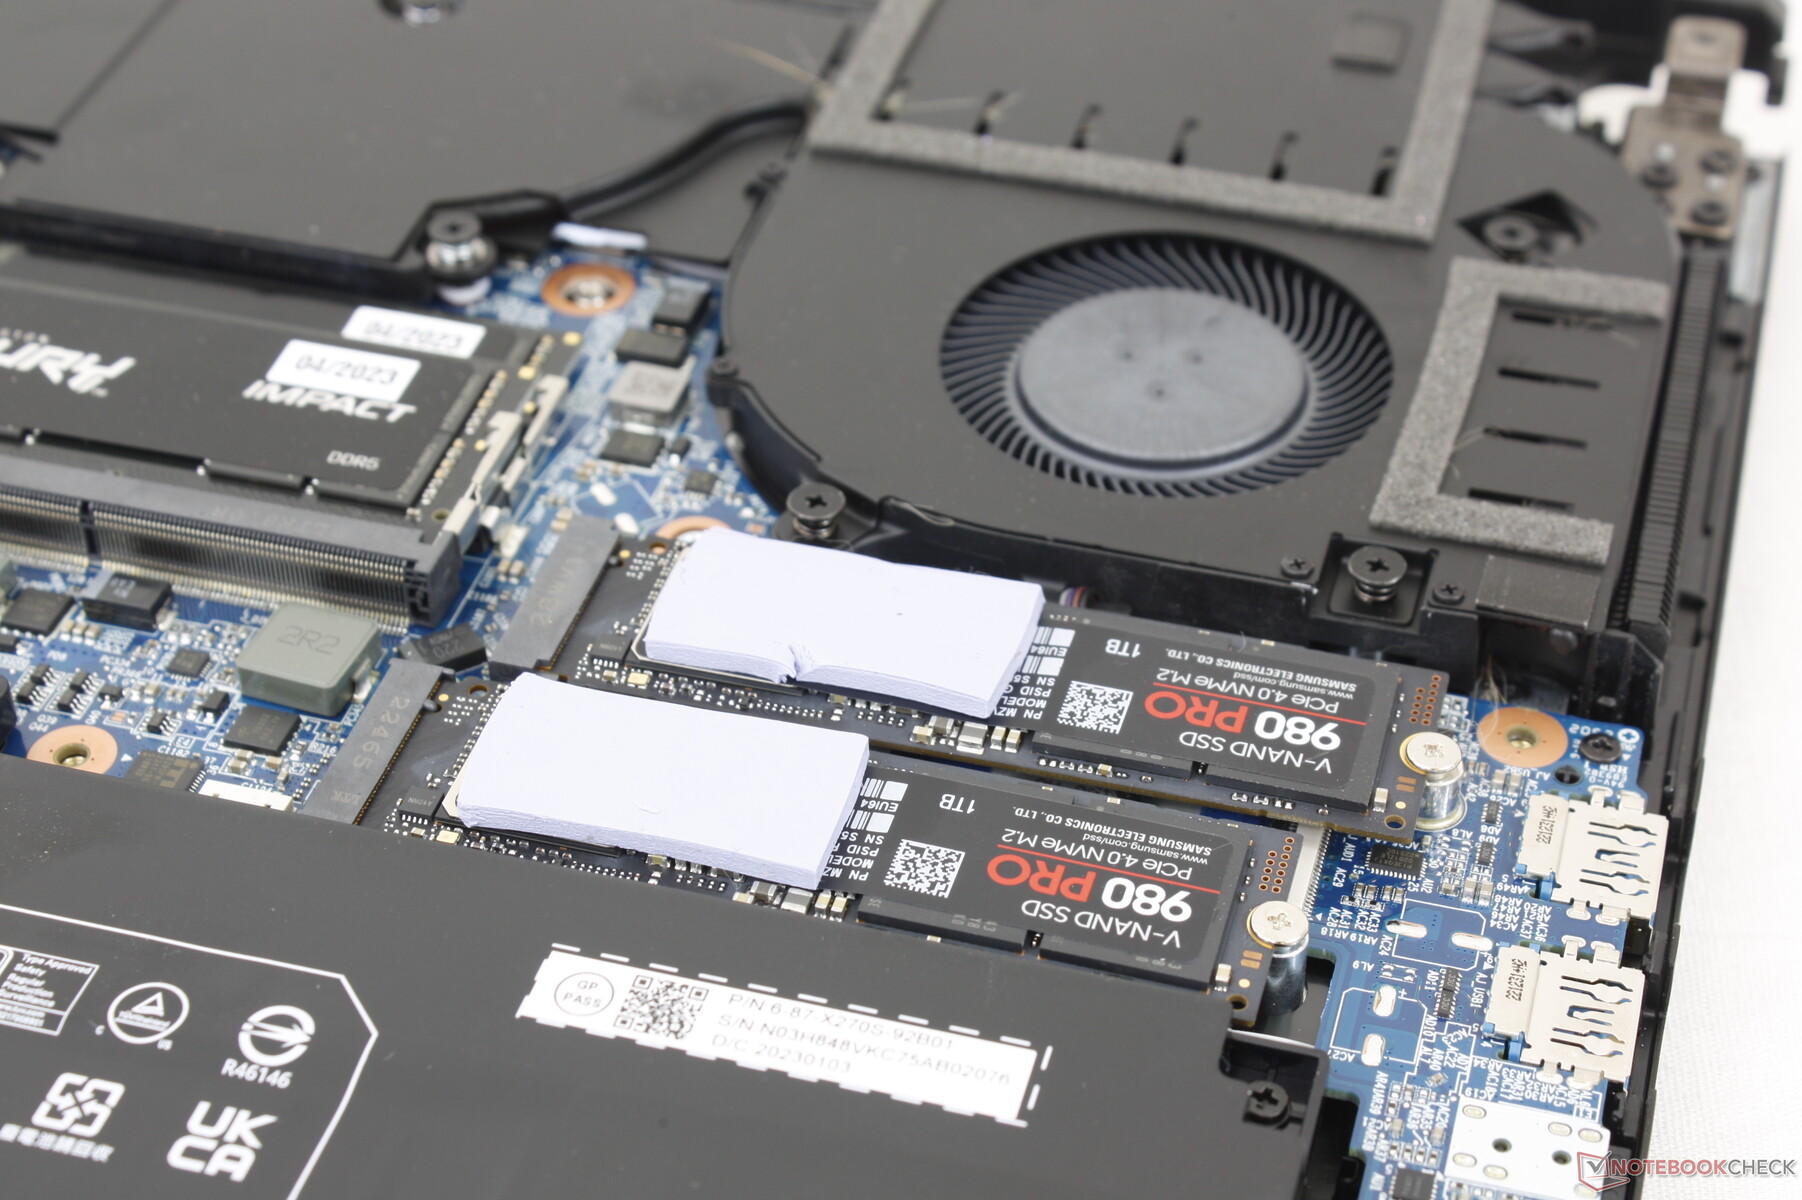
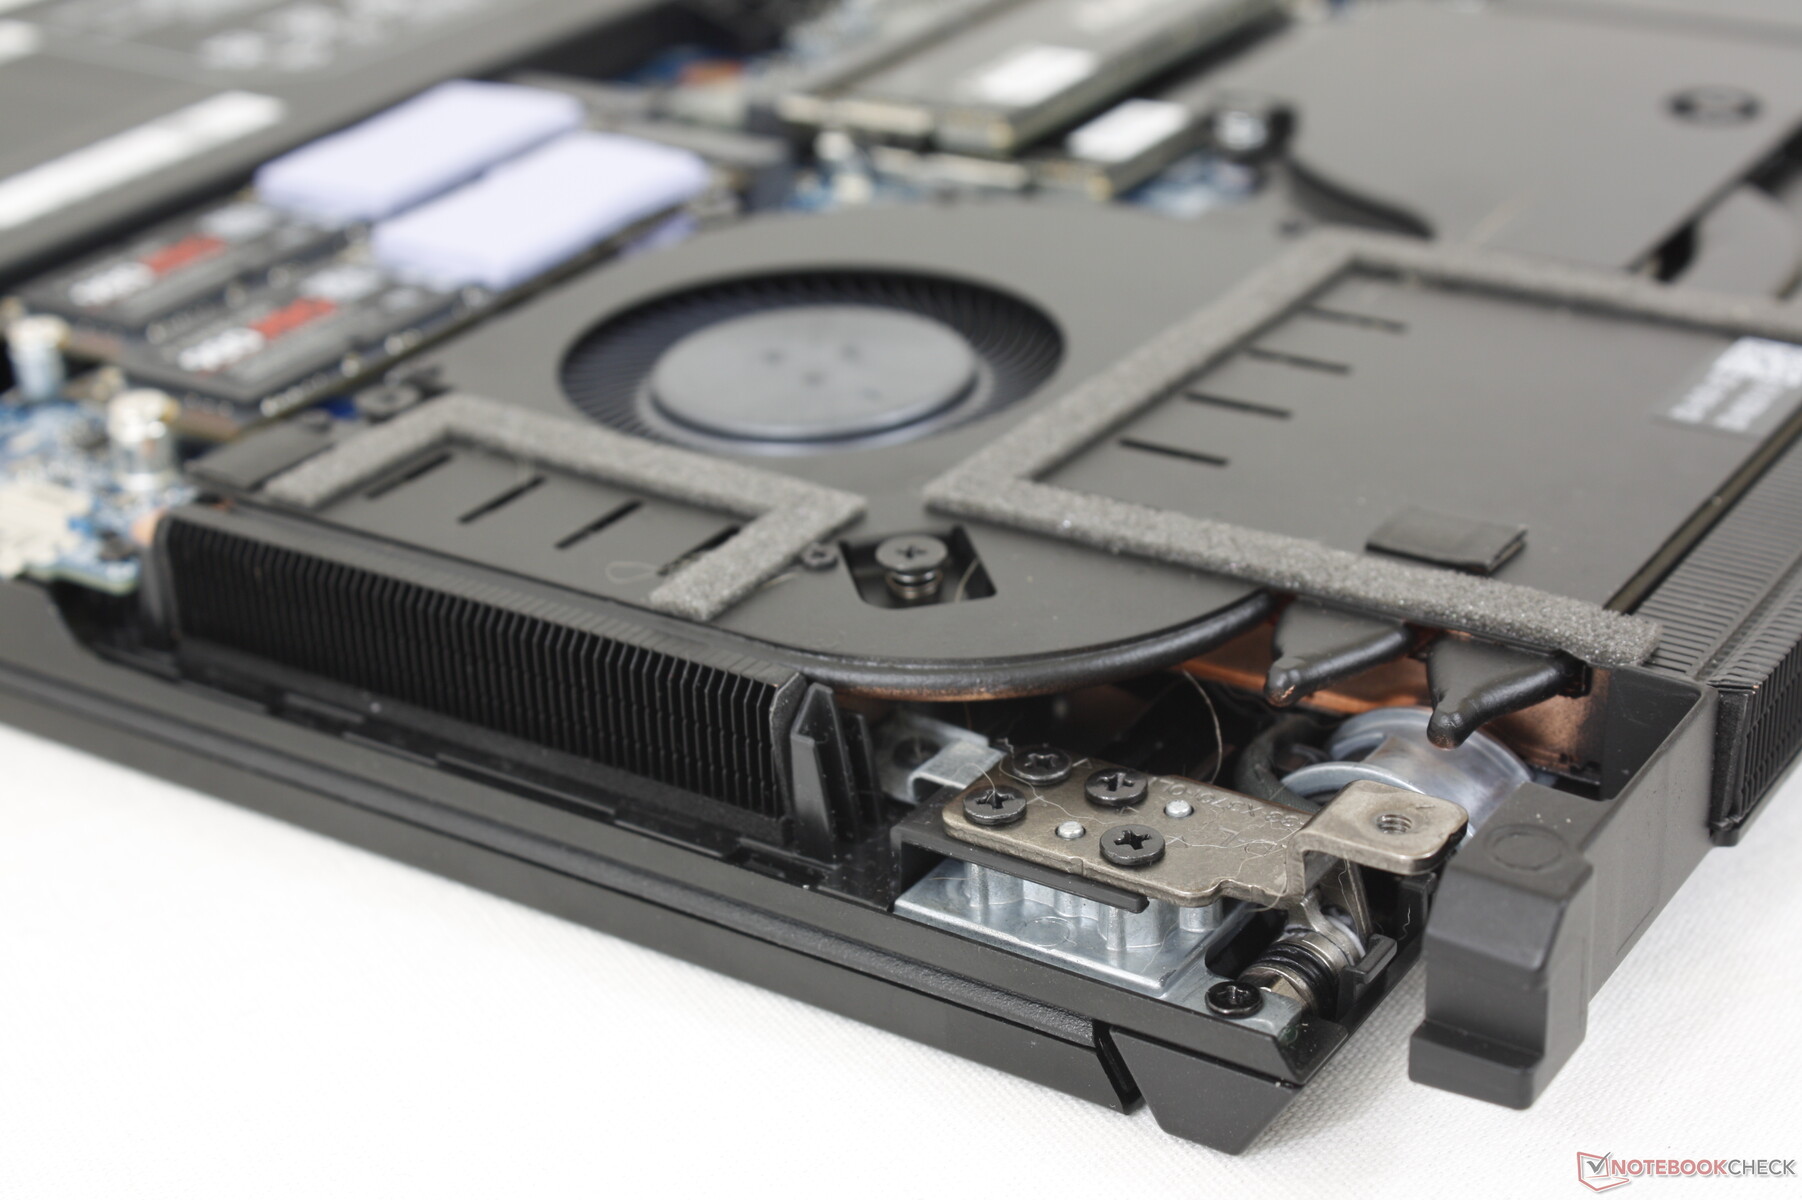
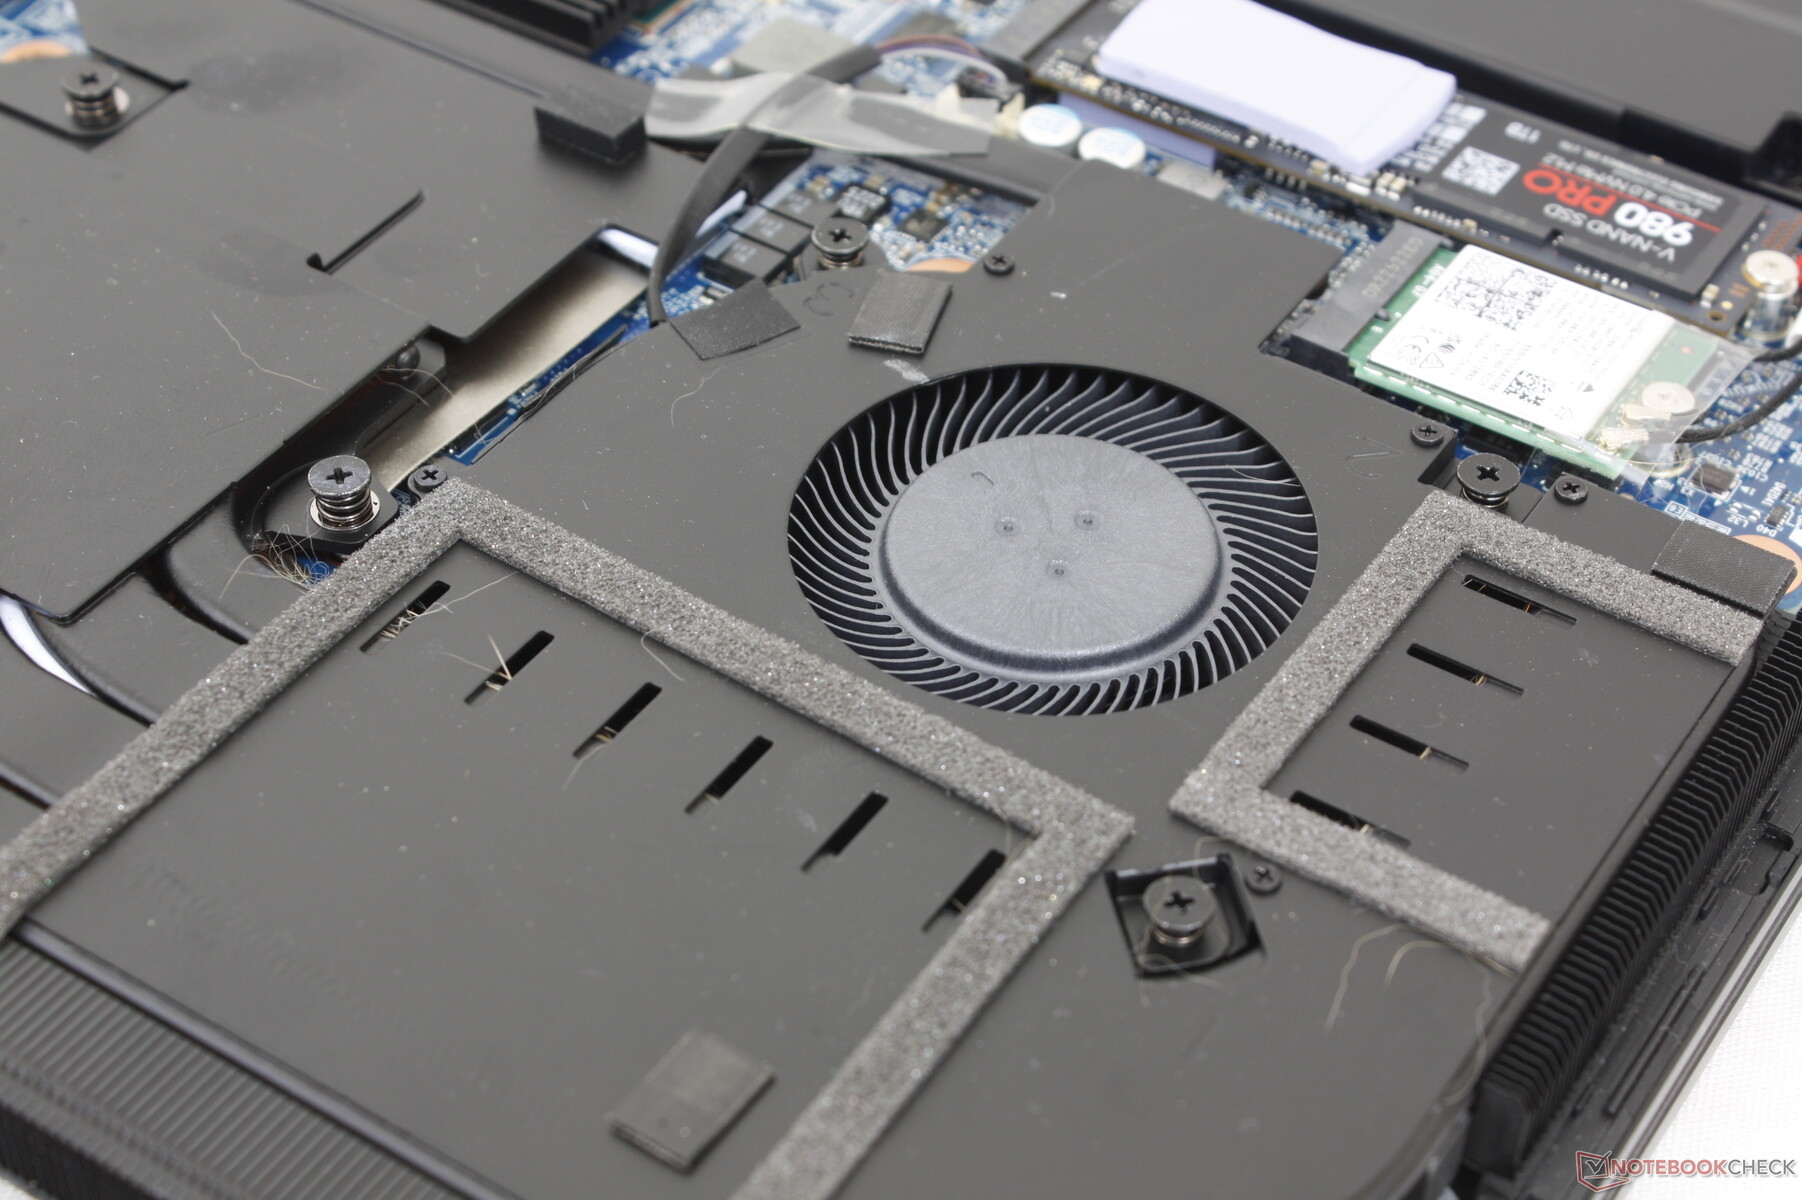
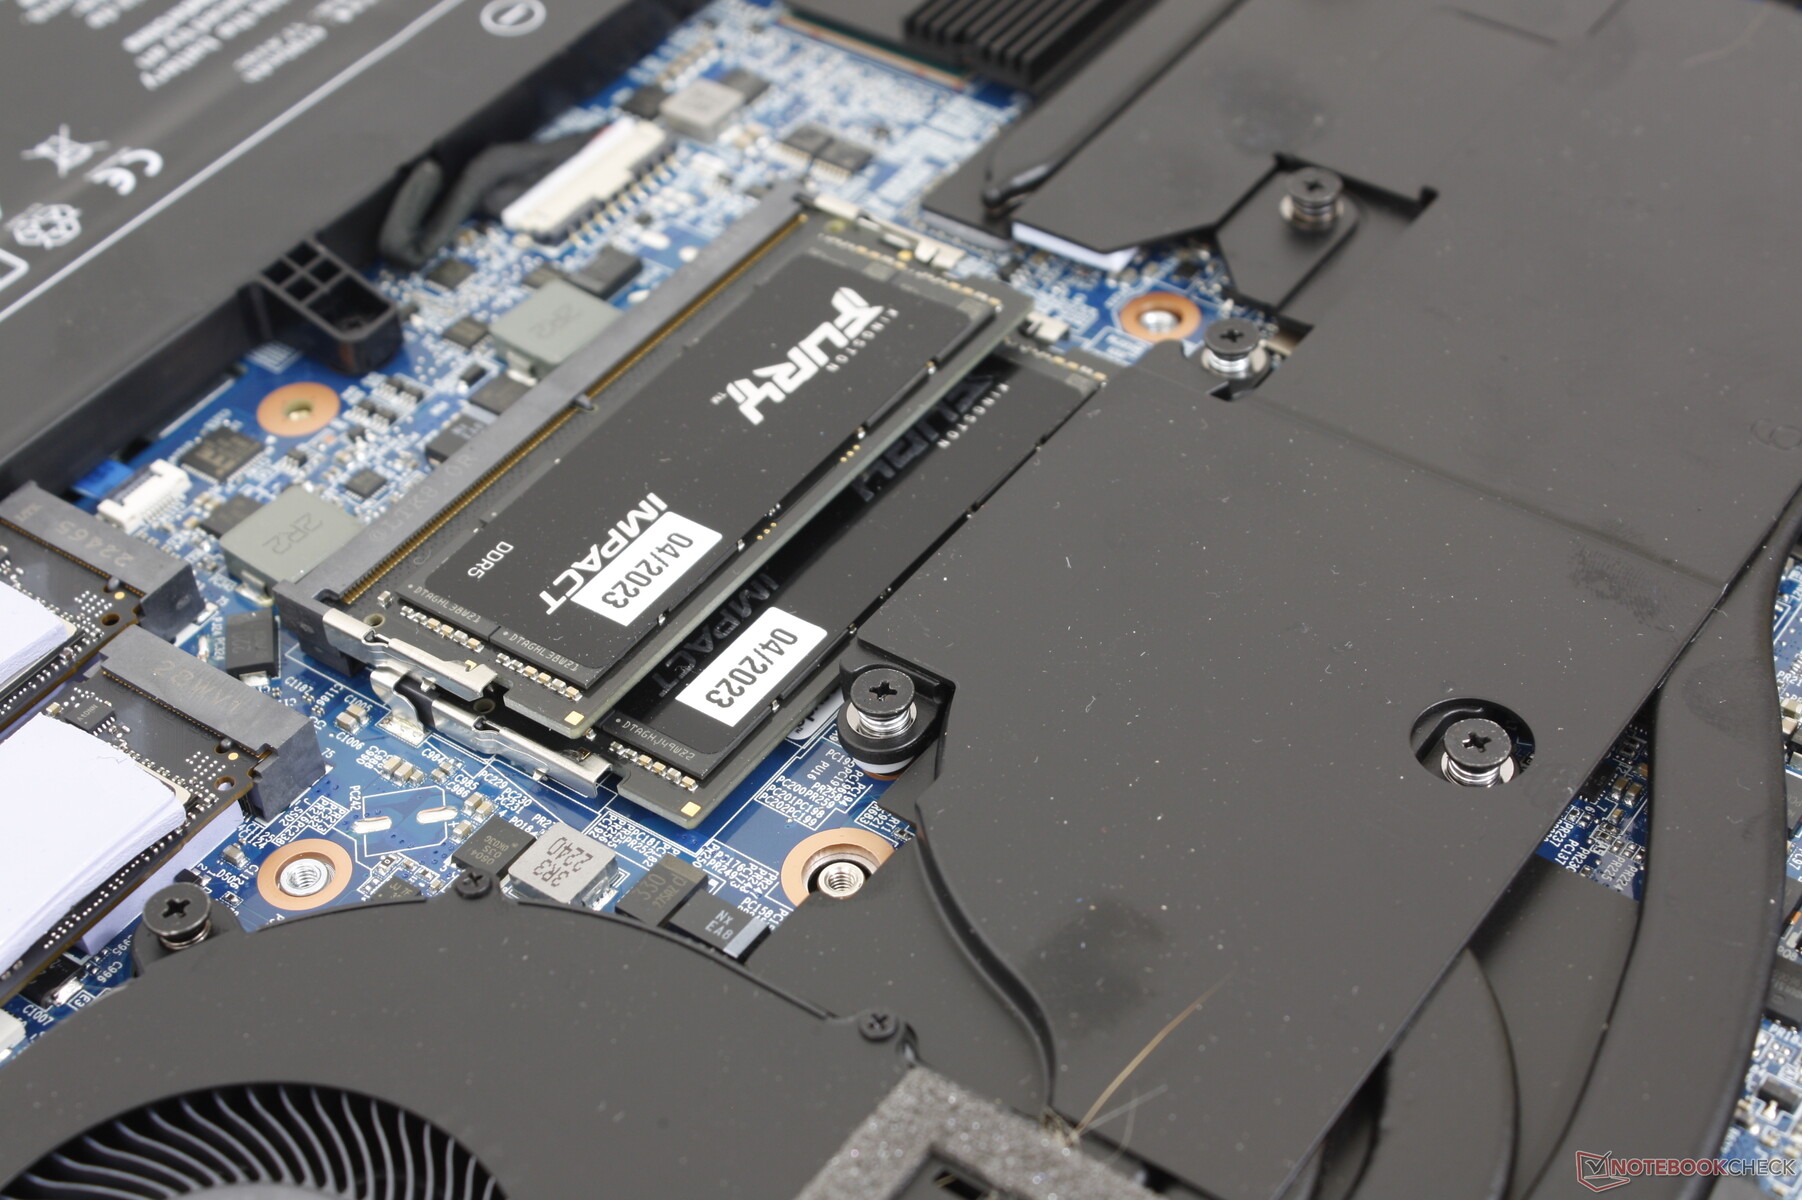
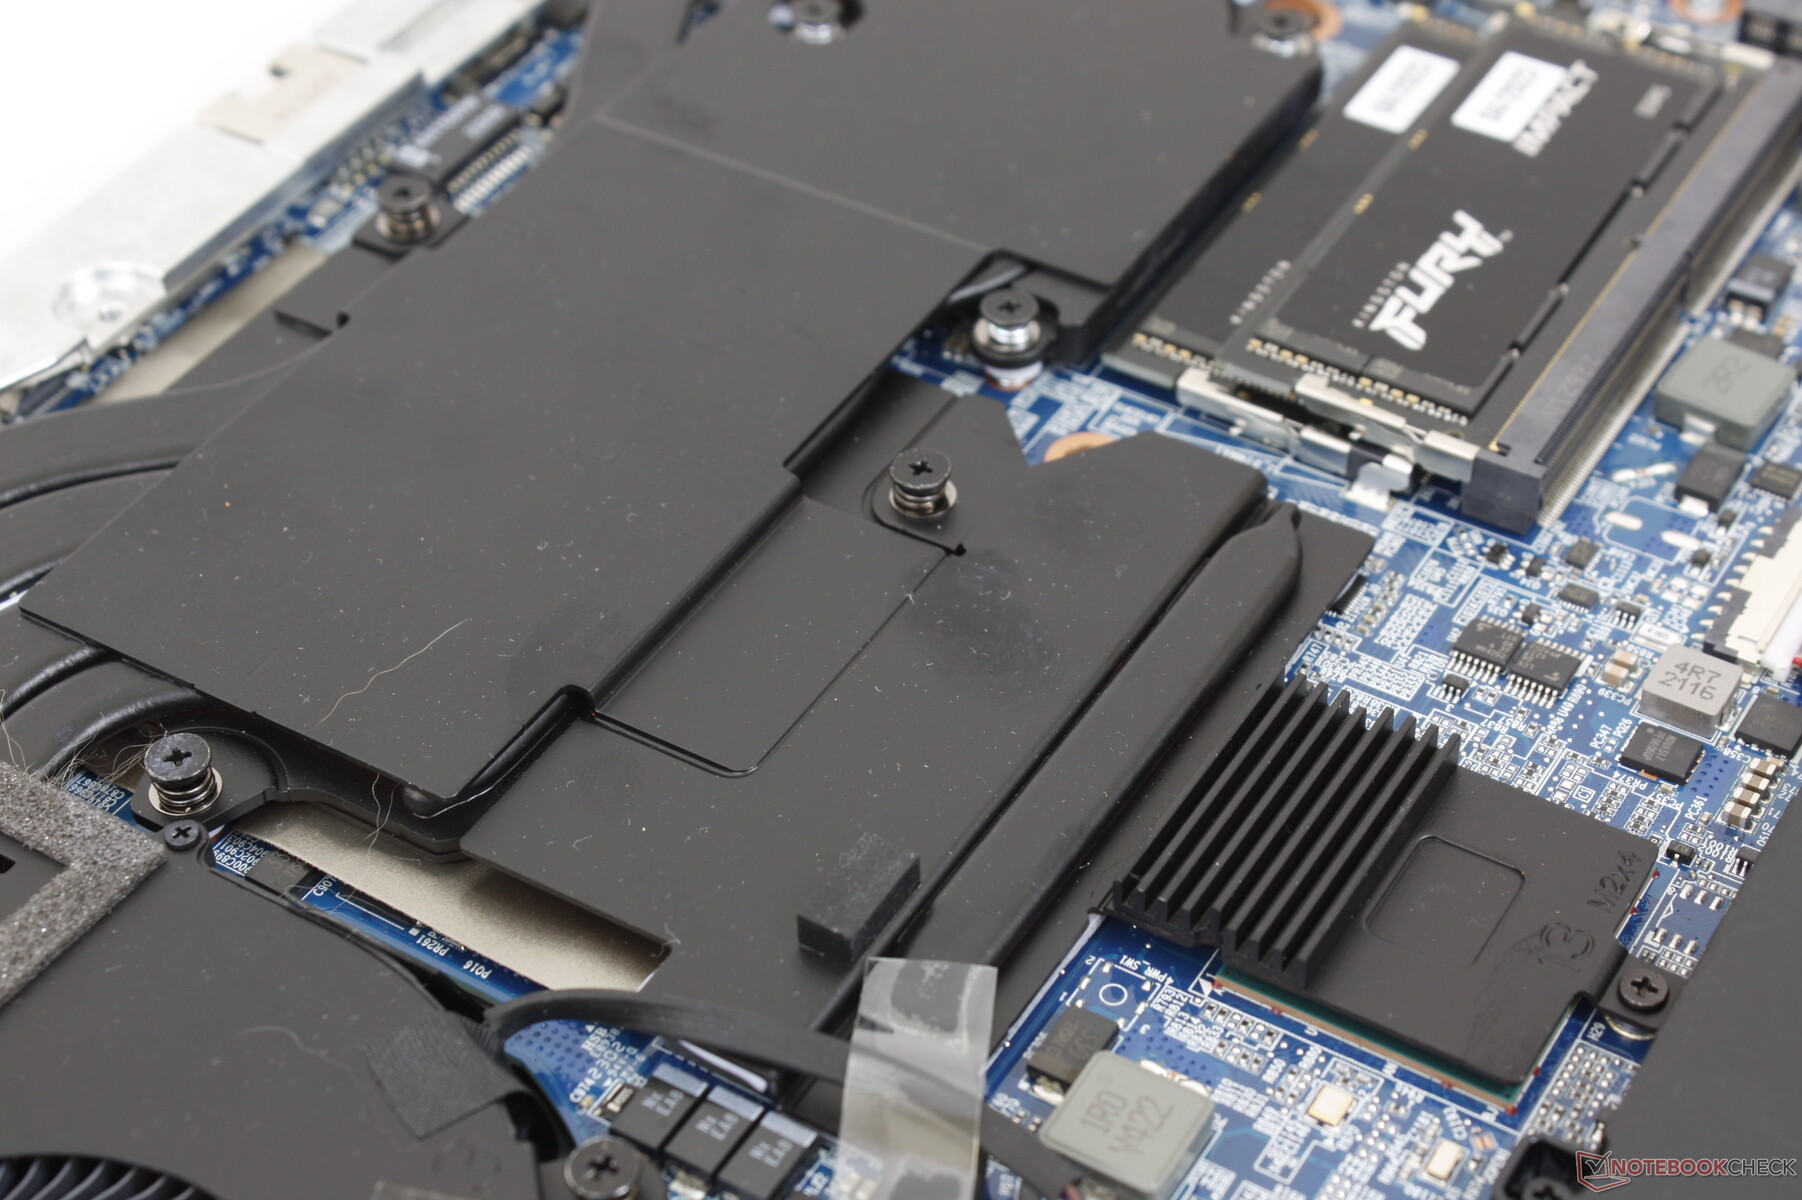
Maintenance
Le panneau inférieur est fixé par 16 vis Philips pour un retrait relativement facile. Une fois à l'intérieur, les utilisateurs ont accès au module WLAN amovible, à deux emplacements SODIMM et à trois emplacements PCIe4 x4 M.280. Le système ne supporte pas les vitesses PCIe5 contrairement aux récents MSI GE et GT refresh.
Accessoires et garantie
La boîte contient un CD de pilotes, une clé USB de pilotes Windows 11 et une lingette en velours, en plus de la documentation habituelle et de l'adaptateur secteur. La garantie limitée standard d'un an s'applique, avec des options d'extension jusqu'à trois ans.
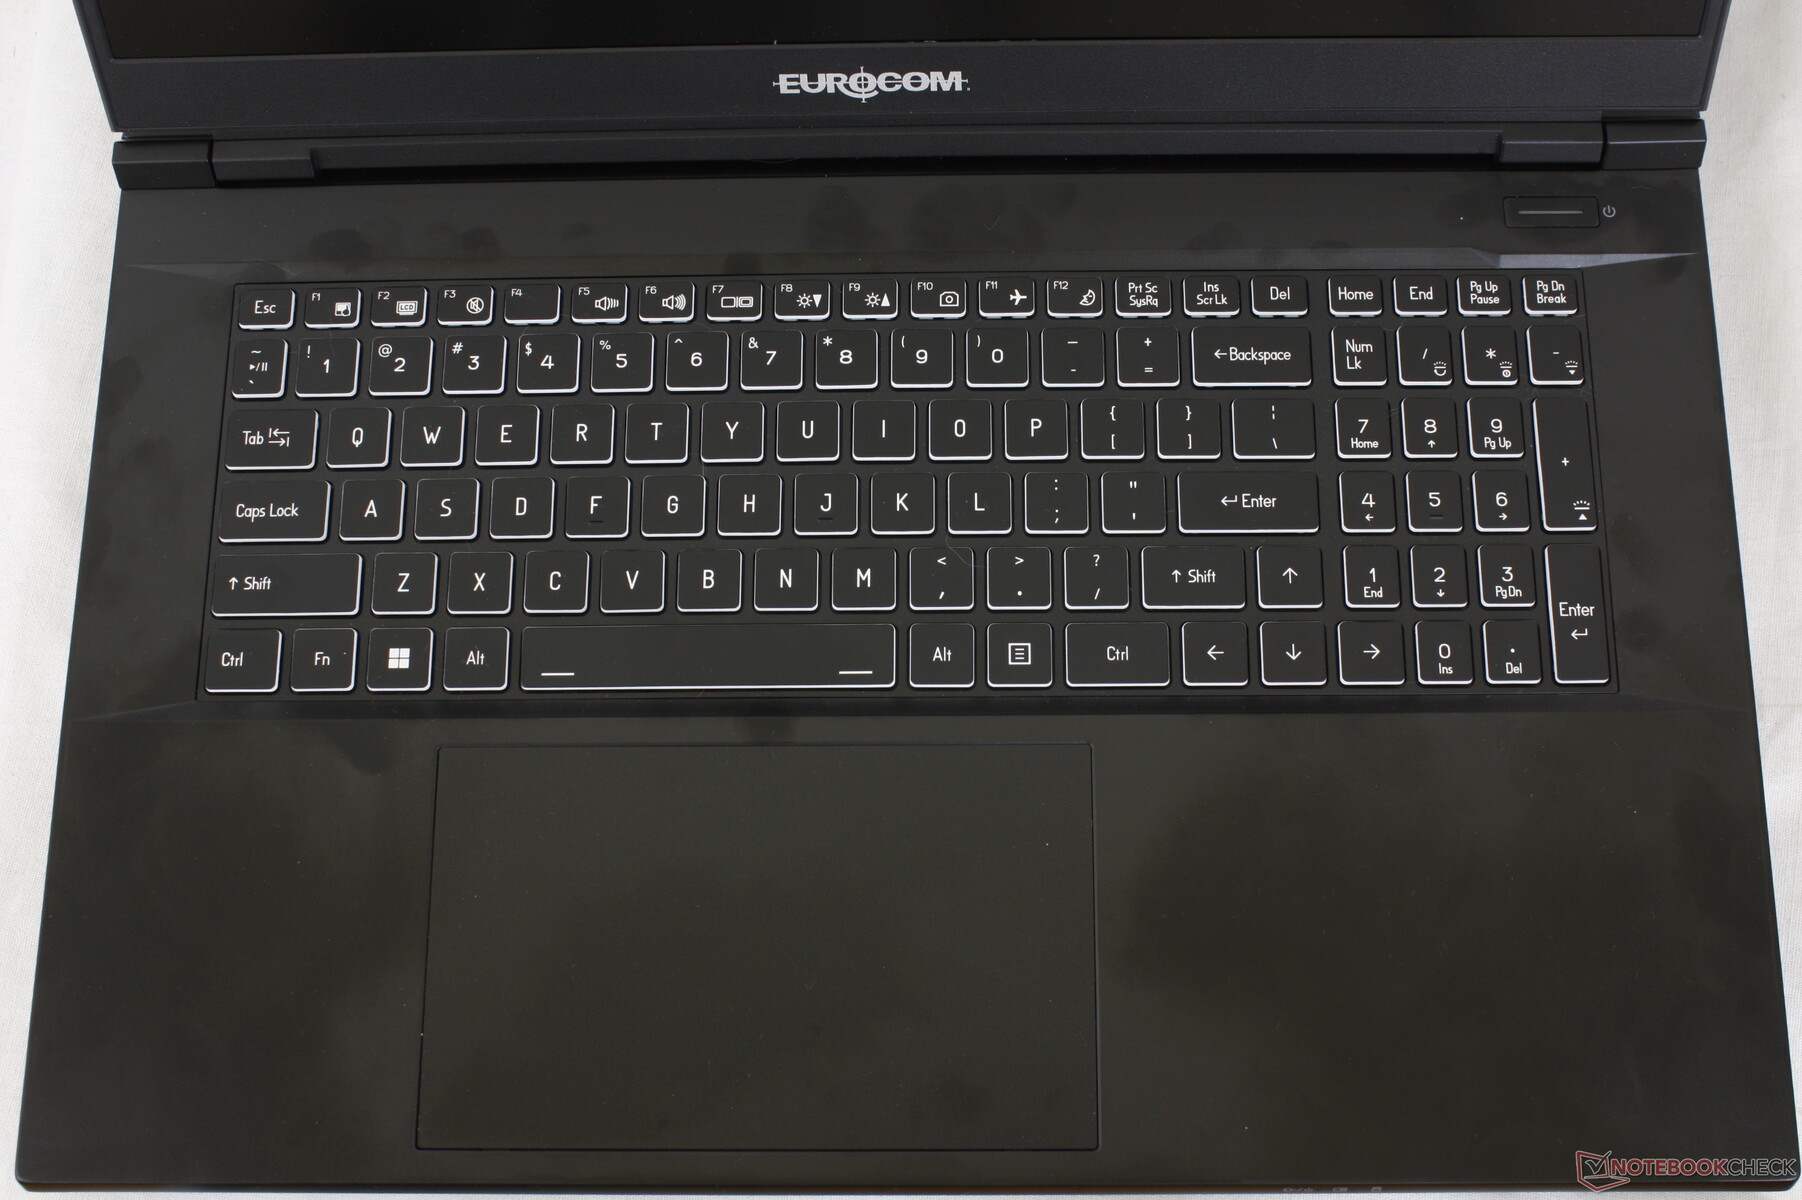
Périphériques d'entrée - Traditional Eurocom
Clavier
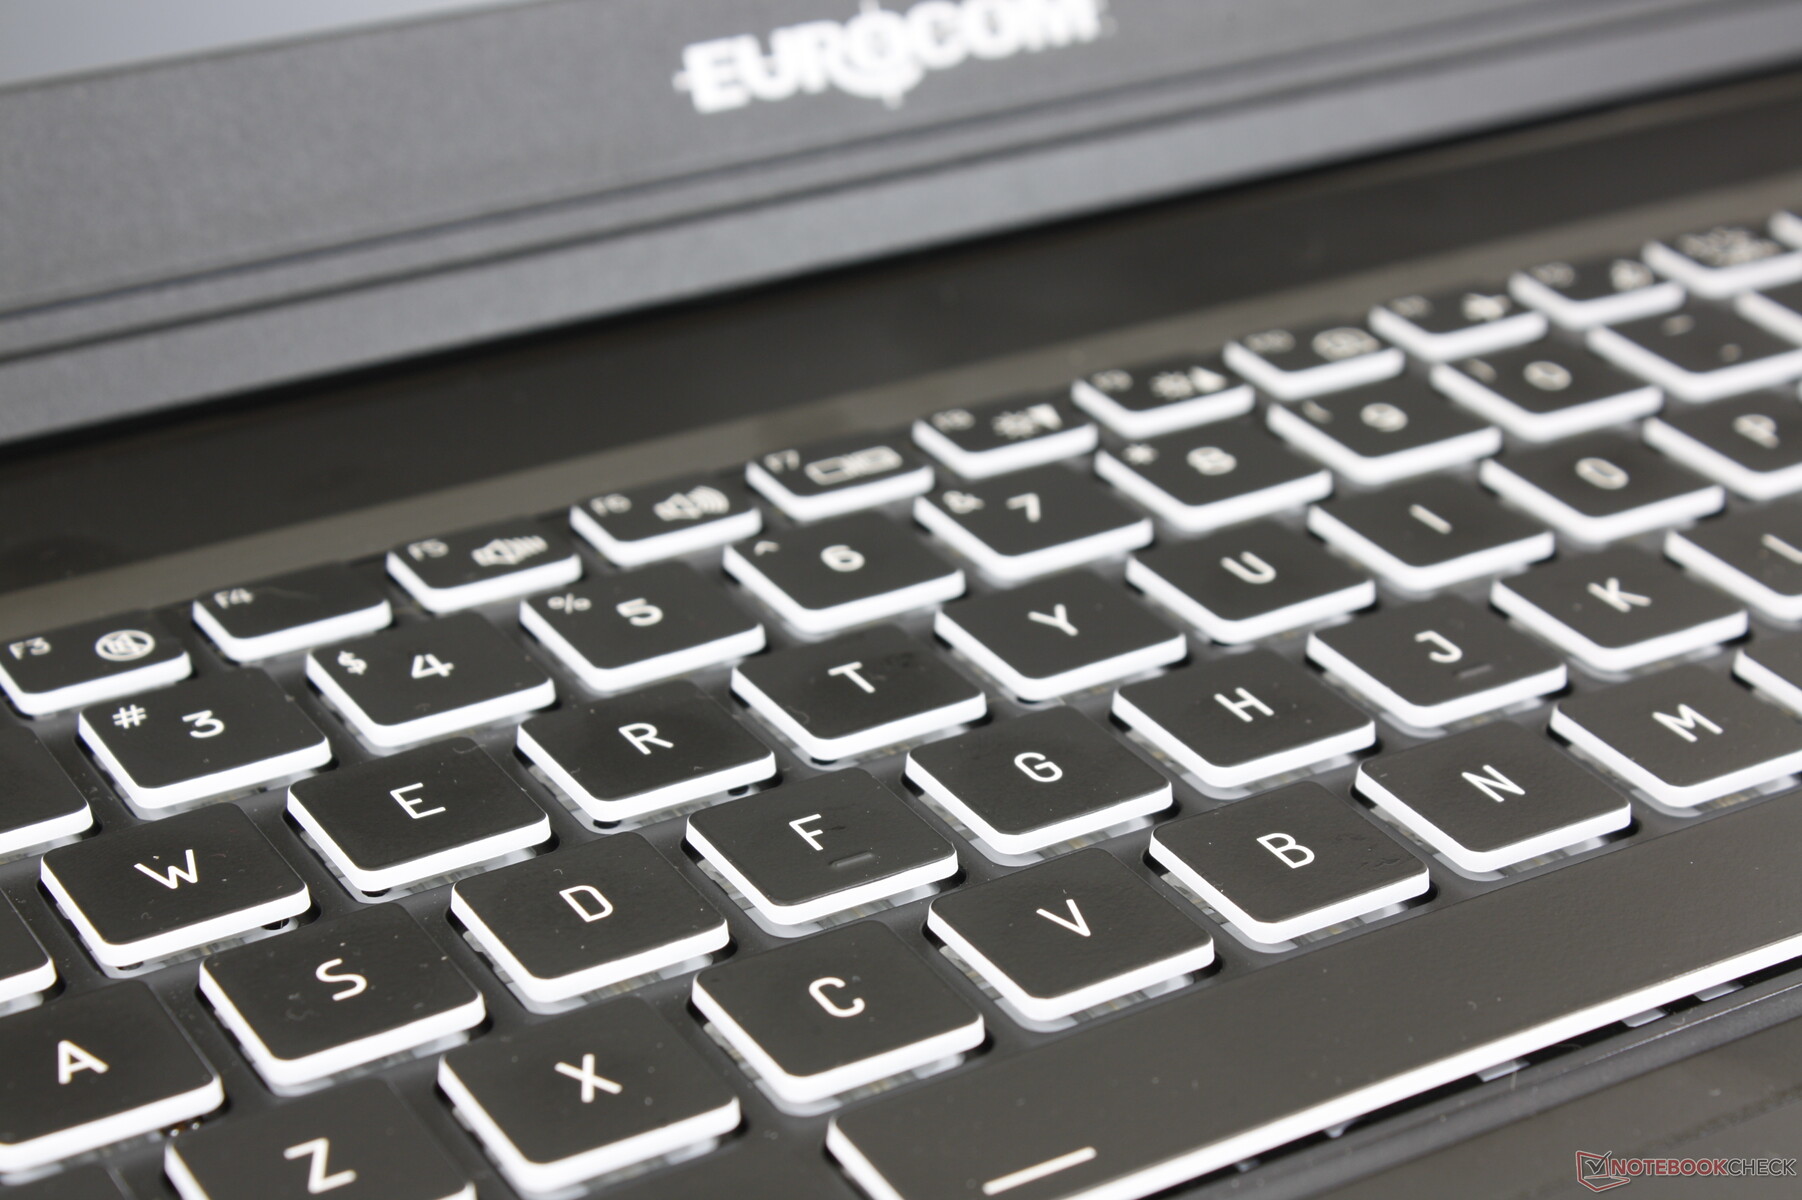
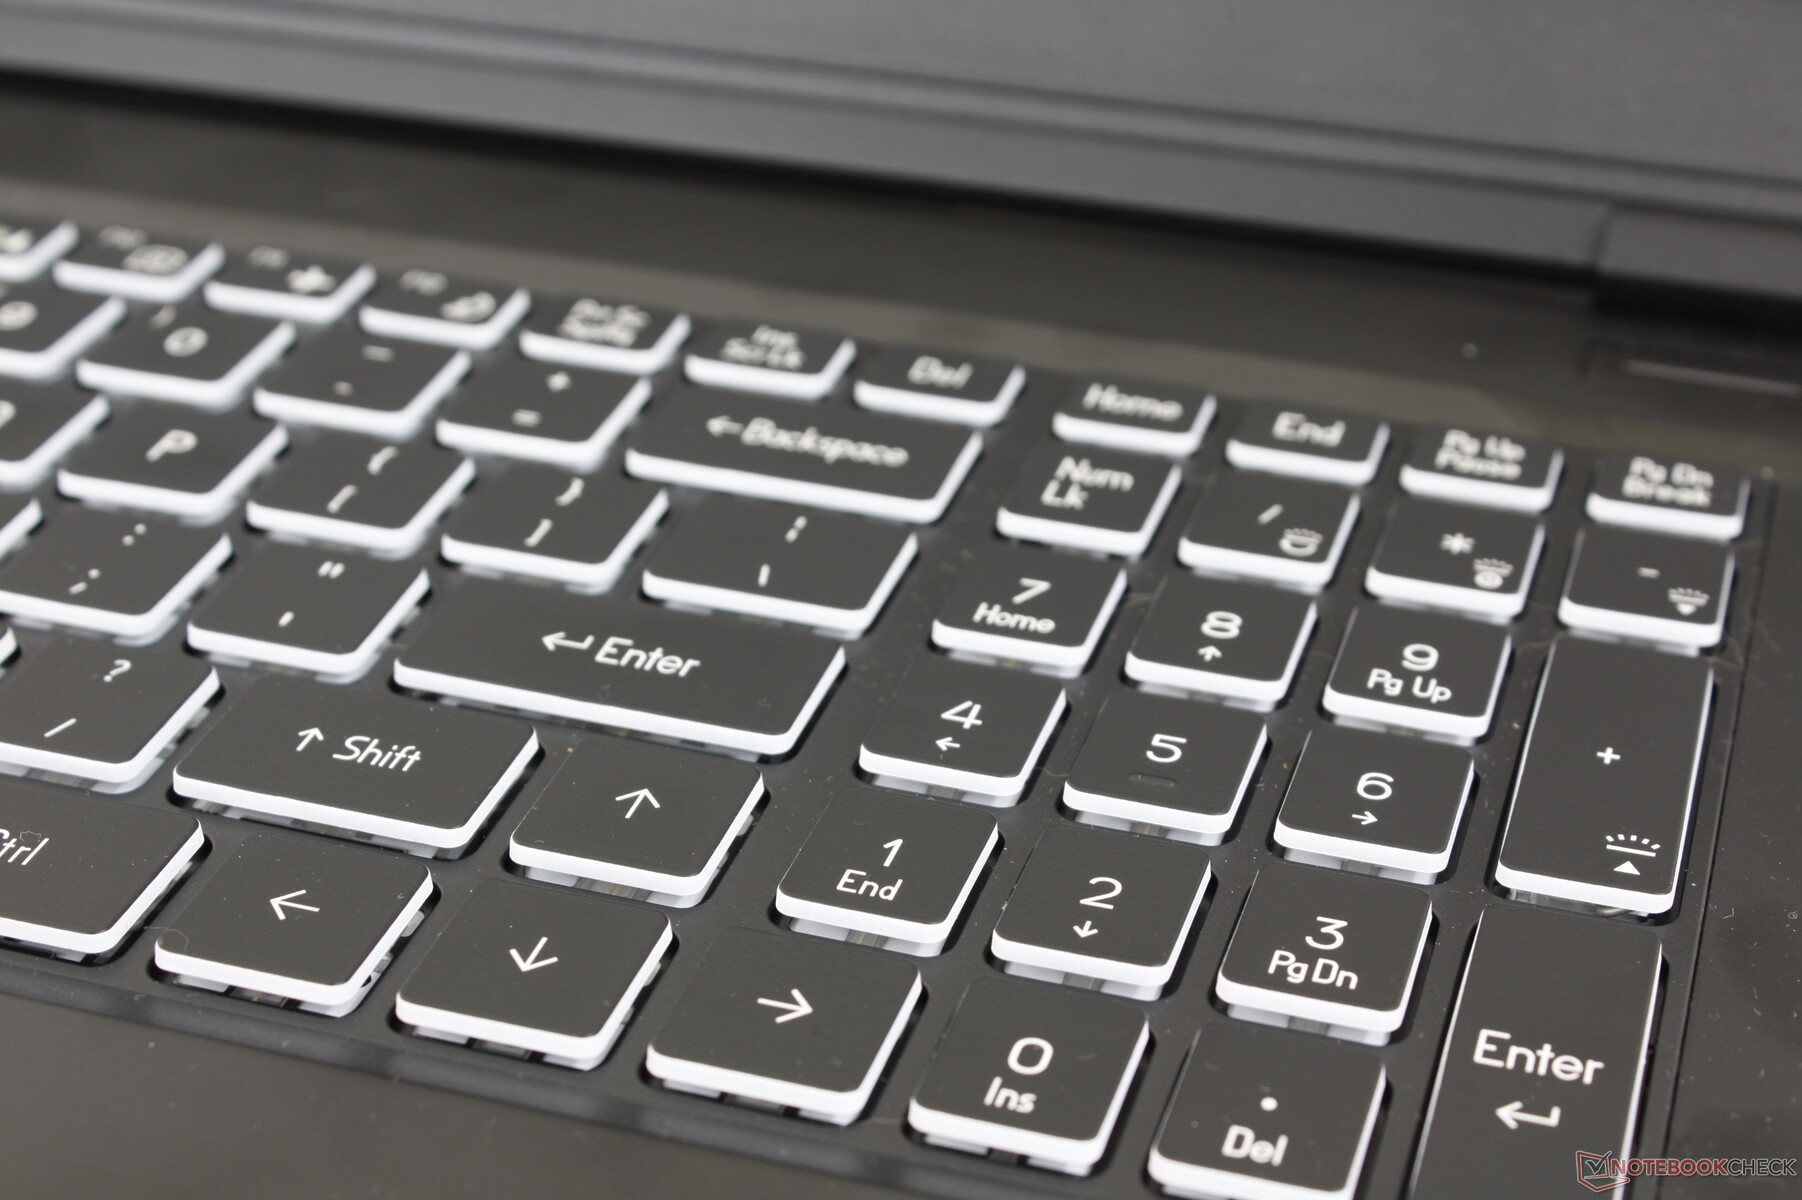
L'expérience de frappe est cohérente sur la plupart des modèles Eurocom puisque l'ODM sous-jacent reste le même. Le Raptor X17 possède le même clavier à membrane que le Raptor X15 malgré les différences de taille d'écran, ce qui est dommage car les touches du pavé numérique sont toujours plus étroites et plus exiguës que les touches QWERTY principales.
Le feedback des touches est plus doux que celui des touches du MSI GE78 ou de l'Asus ROG Strix Scar 17. Les claquements sont donc relativement silencieux, ce que certains dactylographes préféreront, mais les joueurs invétérés risquent d'être déçus par l'absence de "clics".
Pavé tactile
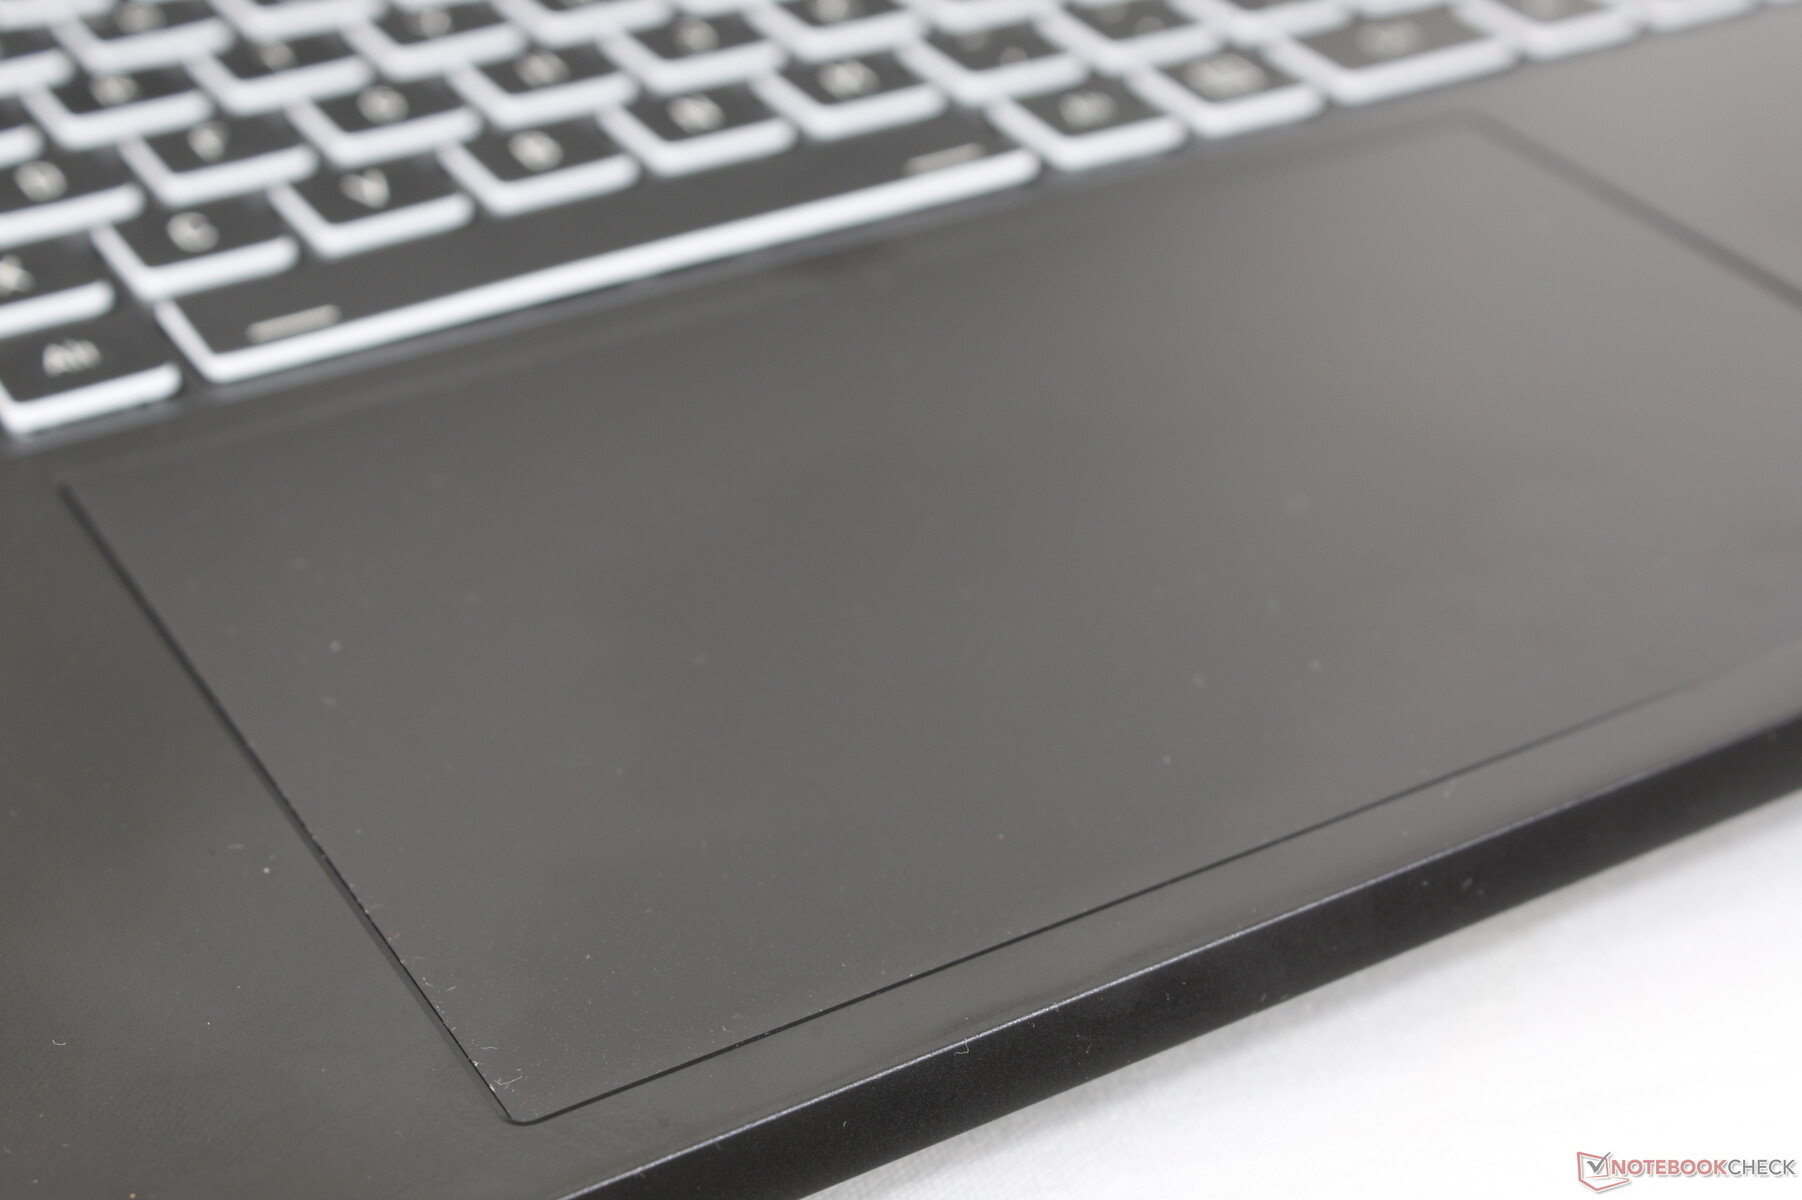
Le pavé tactile est large (15 x 9 cm) par rapport au pavé tactile plus petit (13 x 8,2 cm) du MSI GE78 HX. La glisse est fluide à des vitesses moyennes et élevées, tandis qu'il y a un peu d'adhérence à des vitesses plus lentes pour aider à la précision.
Le retour d'information lorsque l'on clique sur le pavé tactile est un peu mou, avec une faible course, comme sur le Razer Blade 17. Les actions de glisser-déposer sont donc un peu difficiles à réaliser malgré la grande surface du pavé. Dans la mesure du possible, il est préférable d'utiliser une souris USB dédiée.
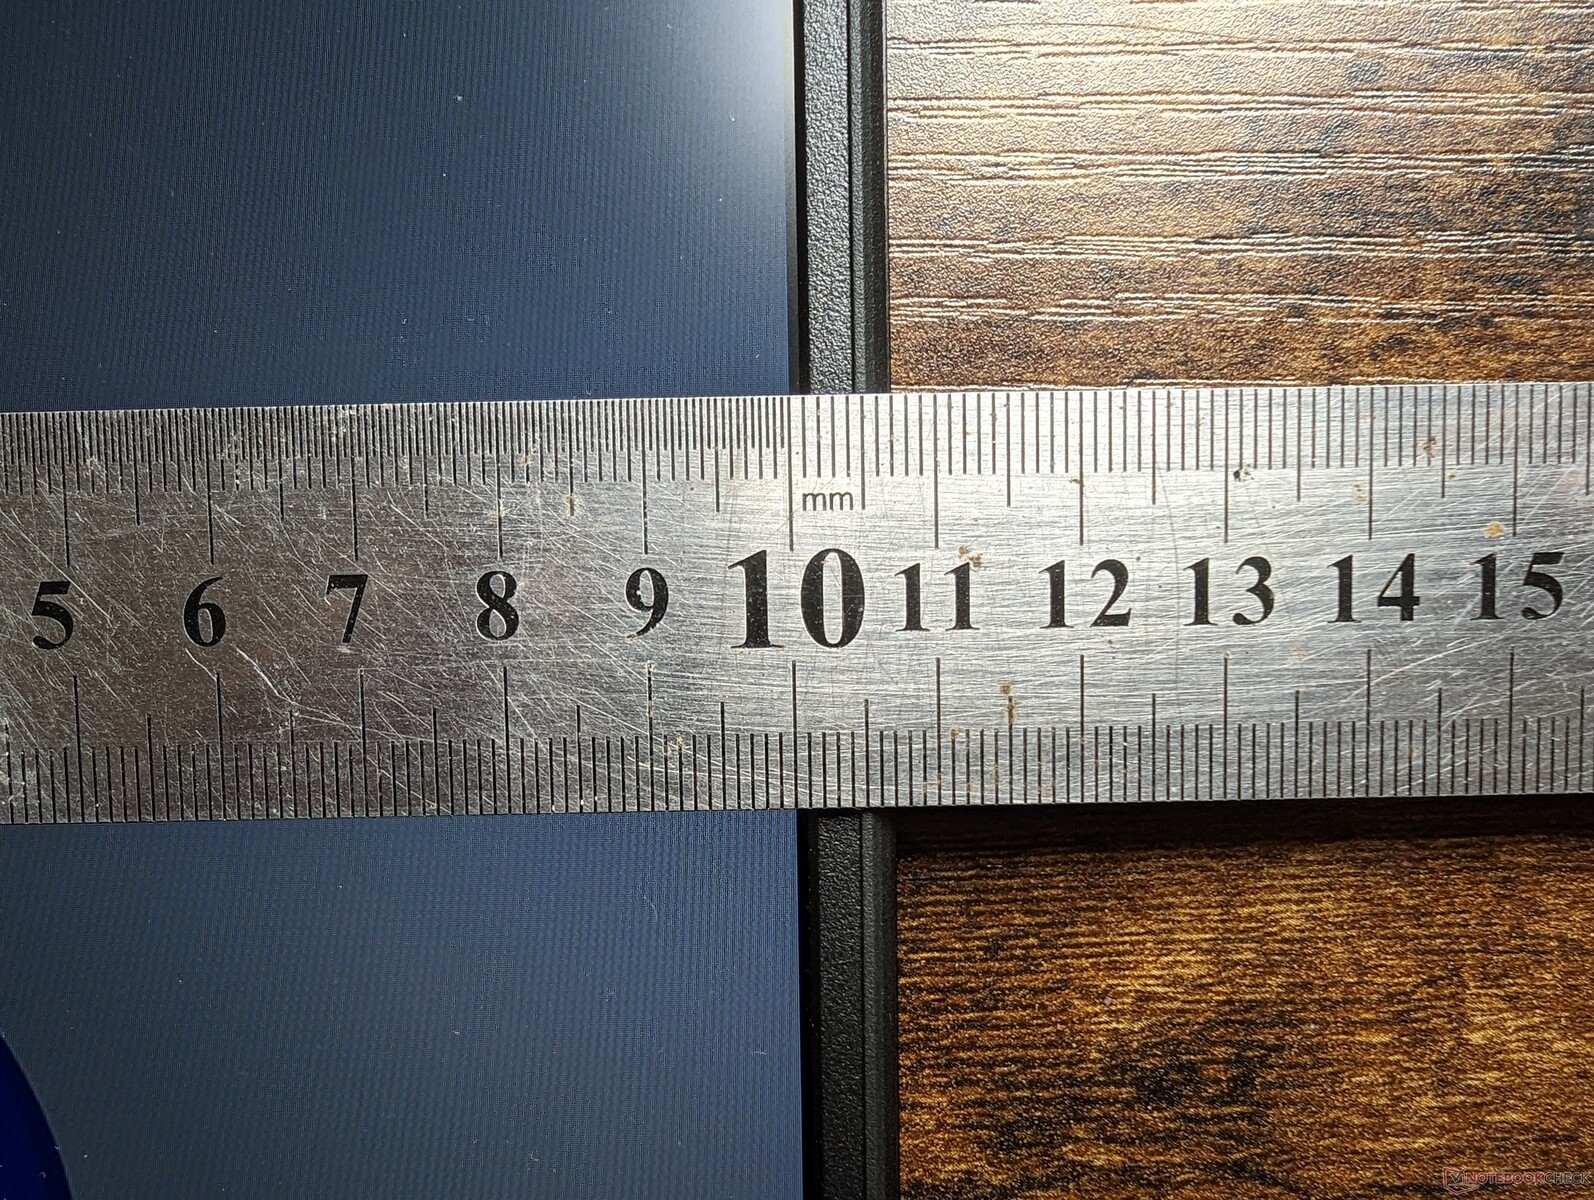
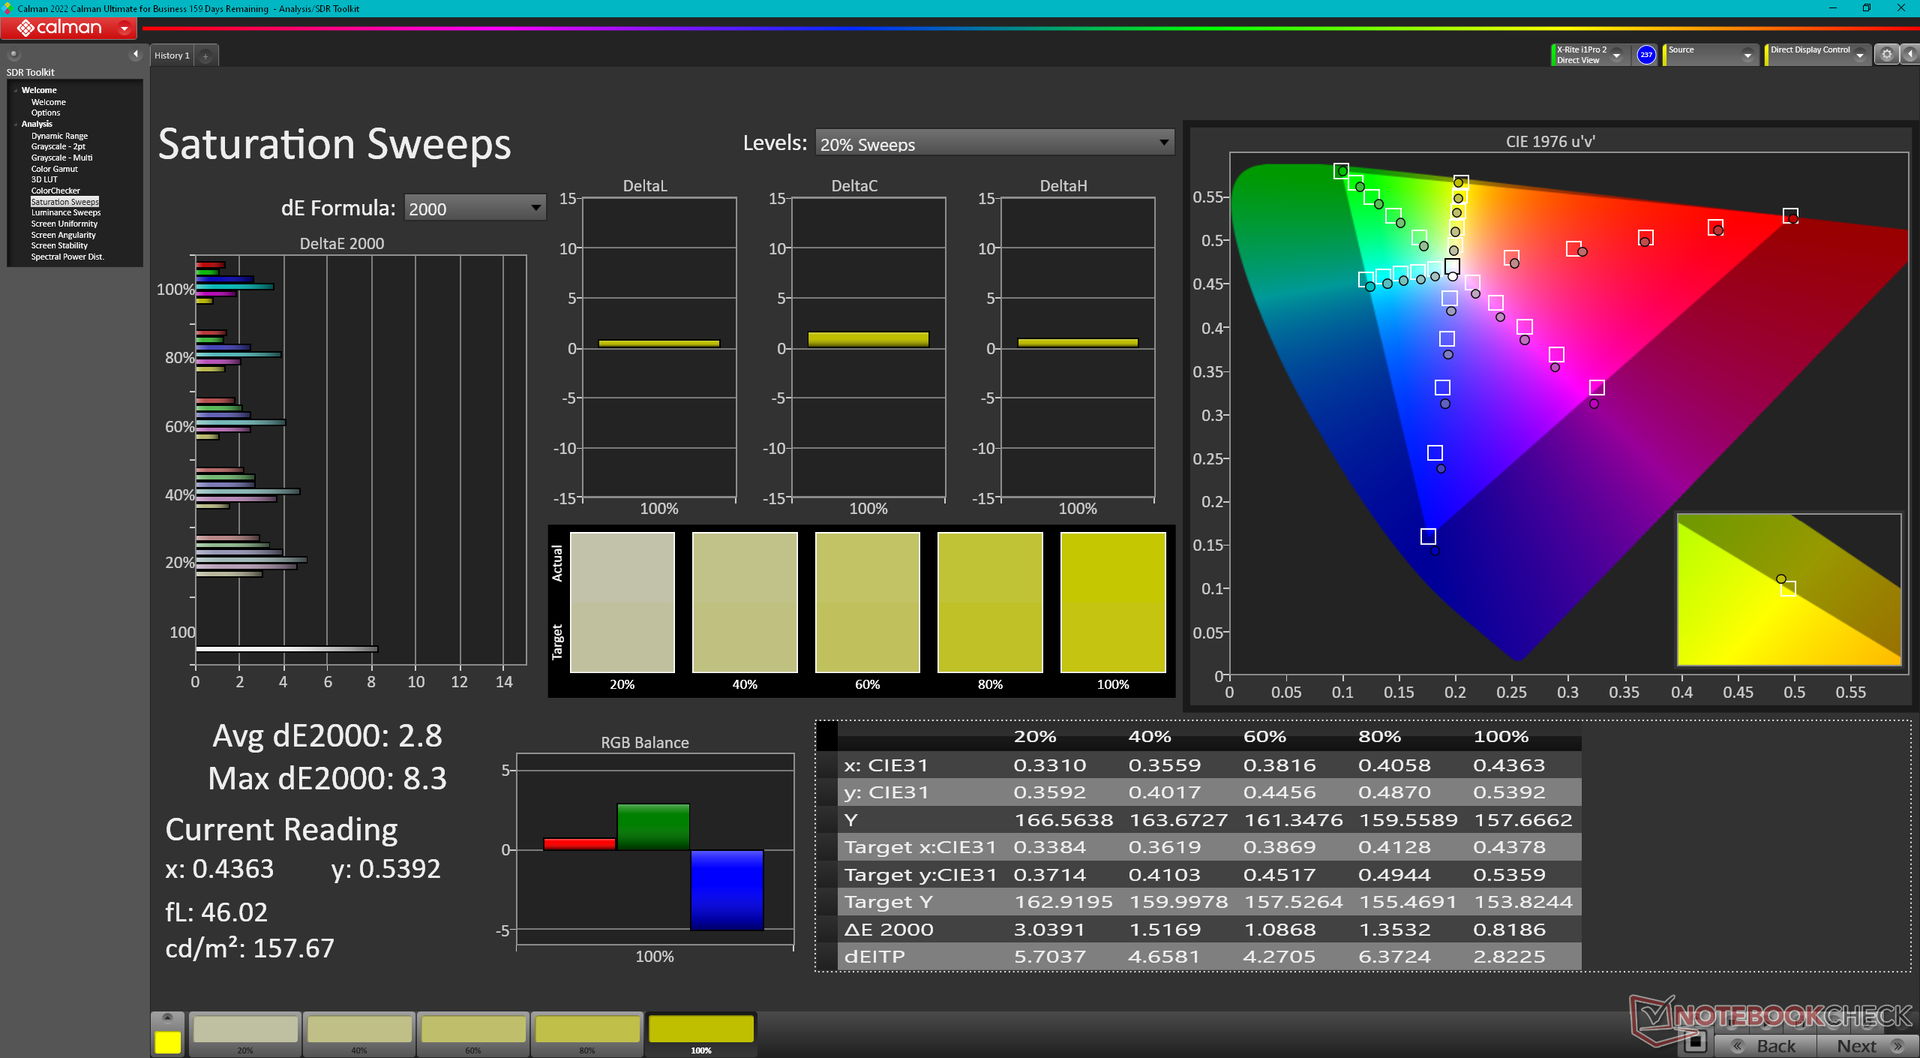
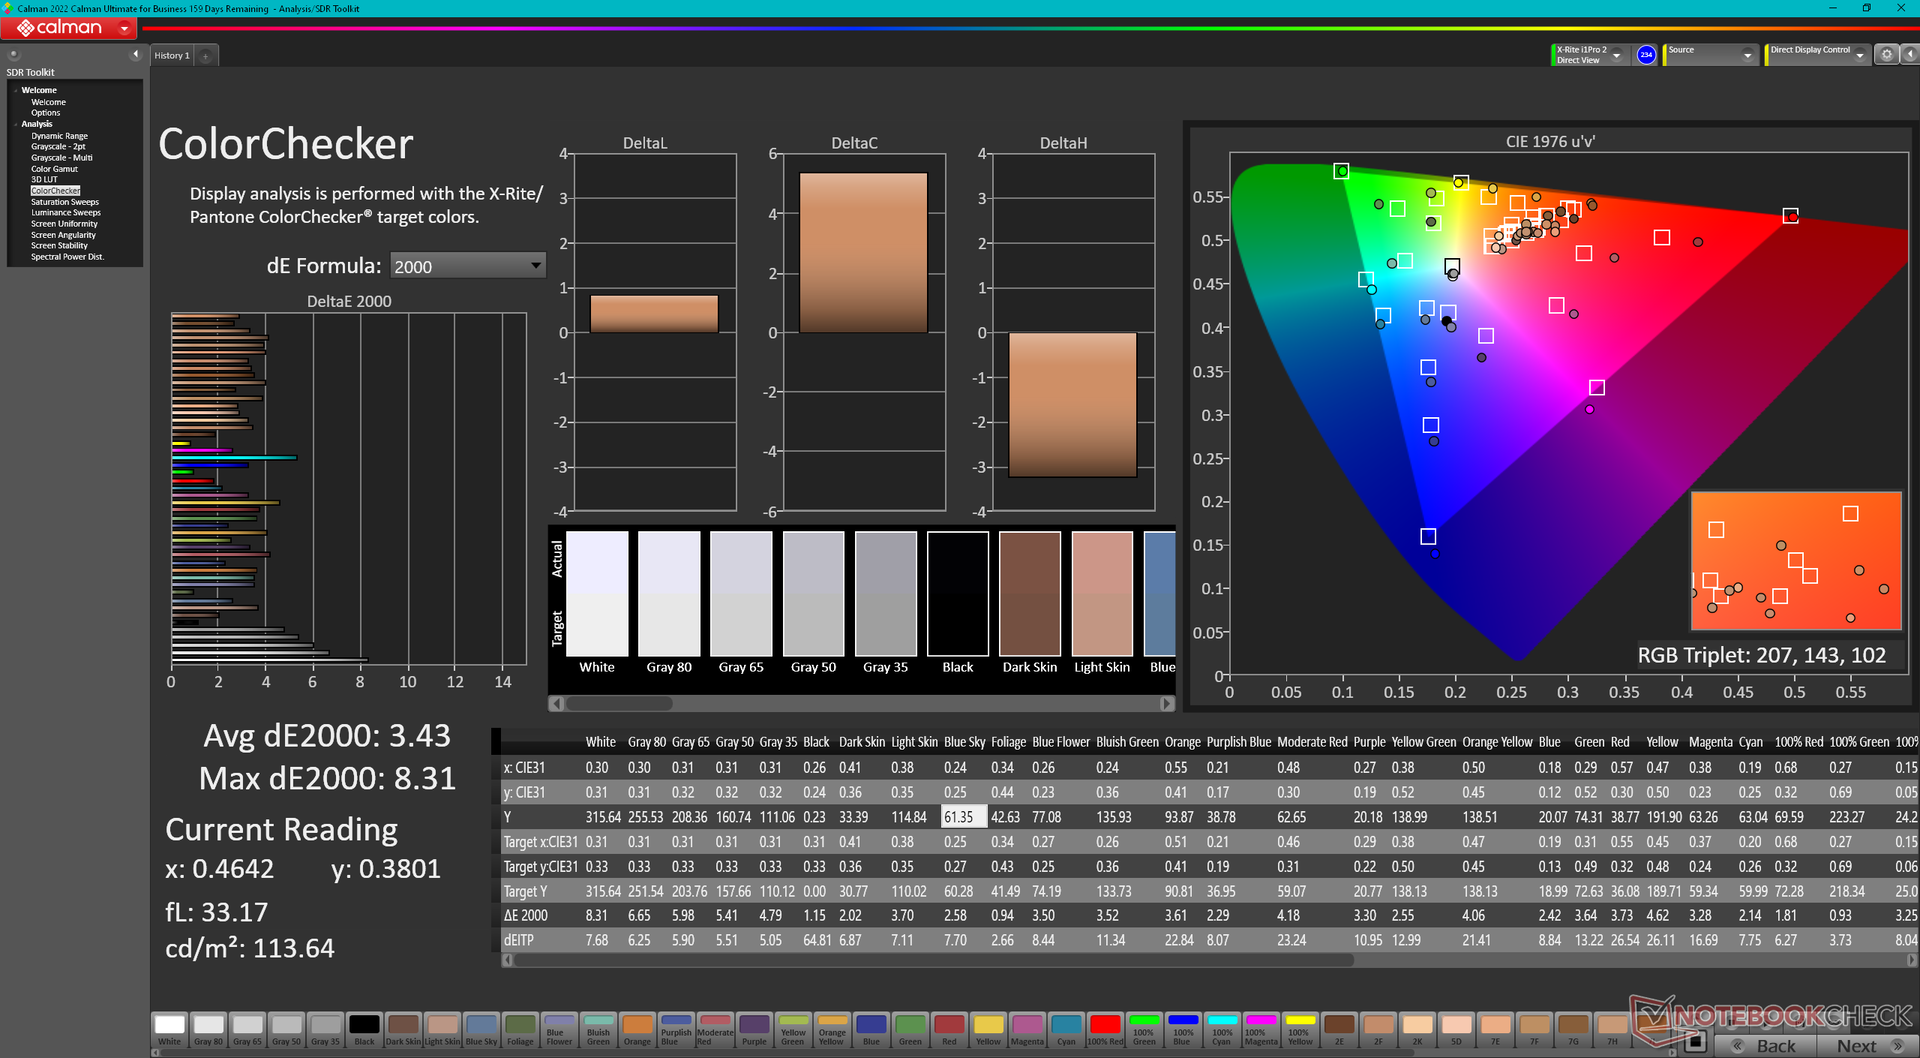
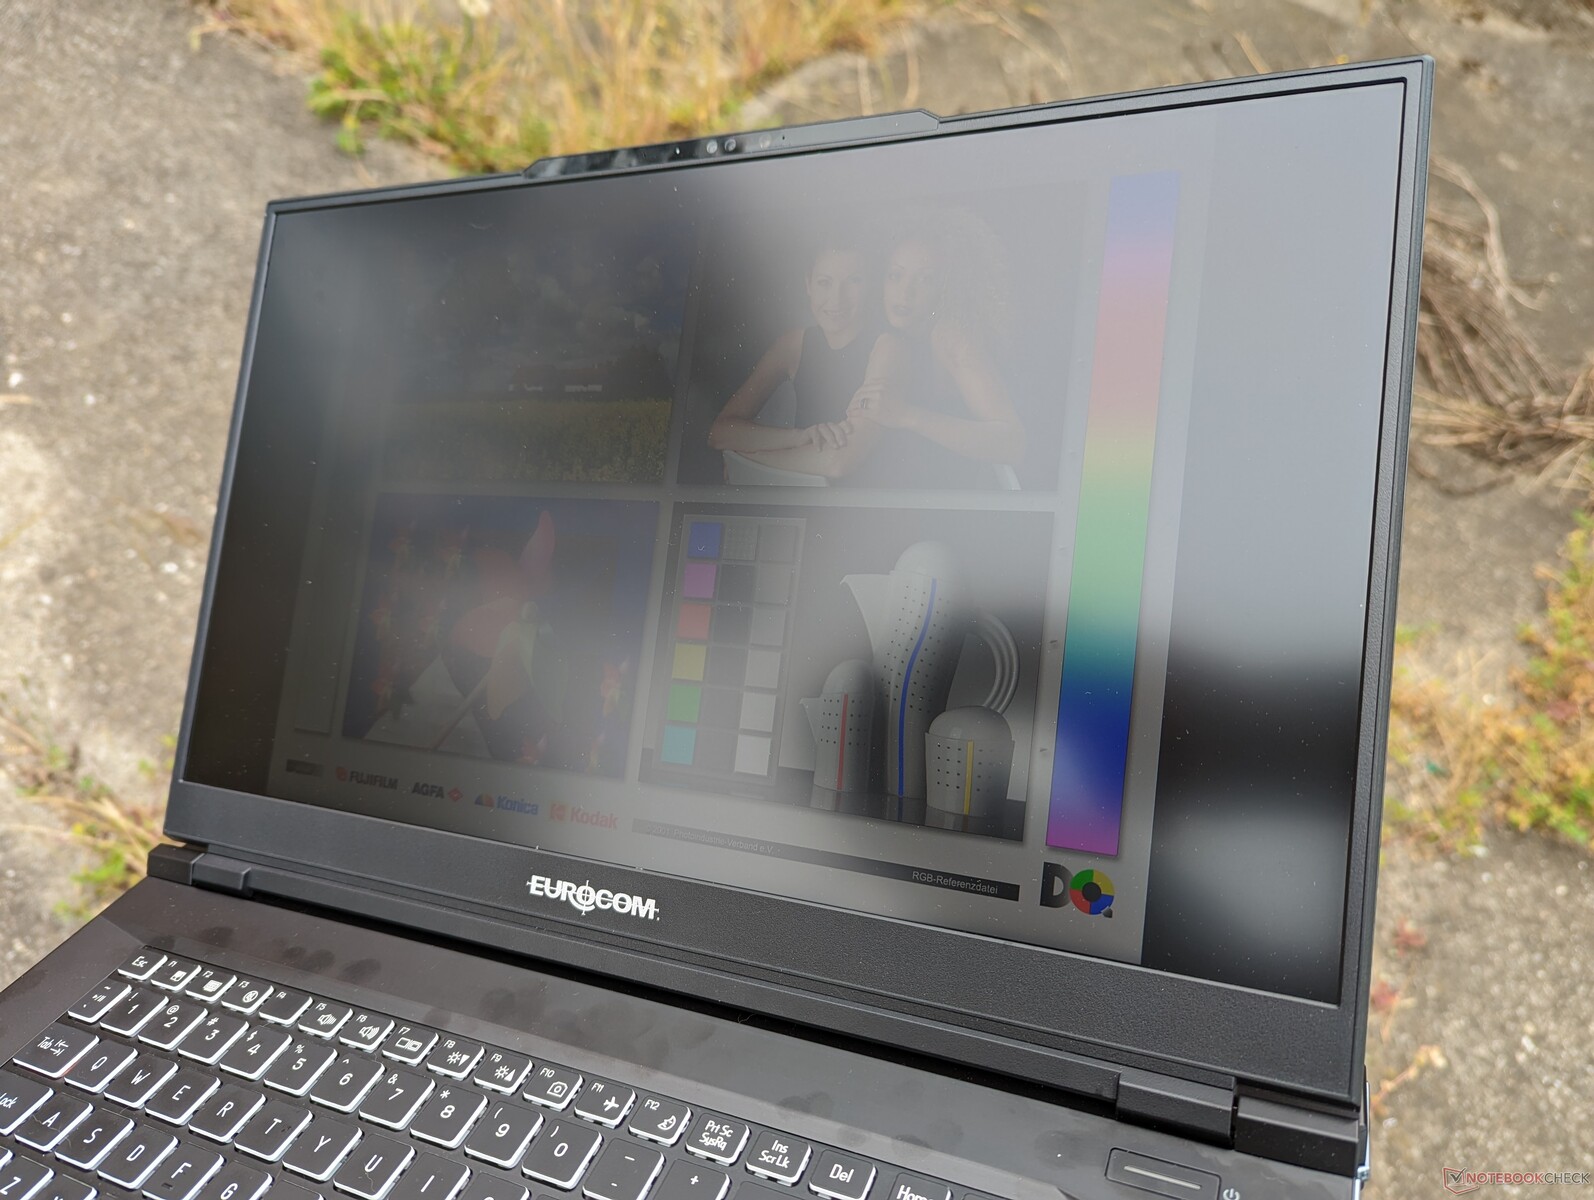
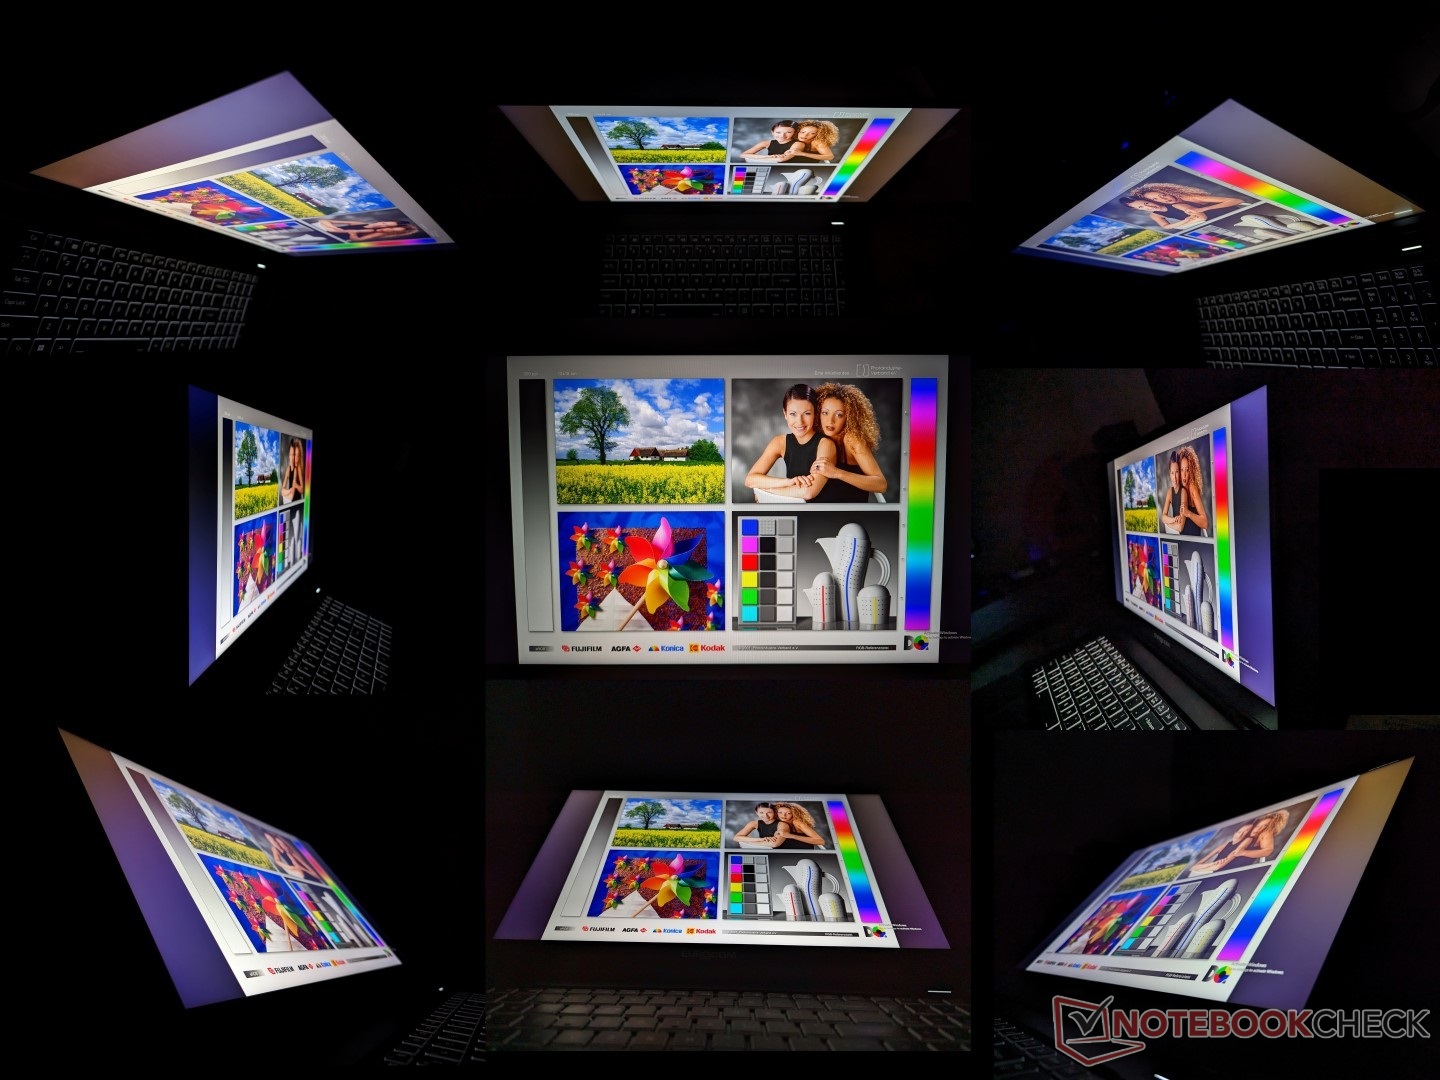
Affichage - 240 Hz, QHD, G-Sync, couleurs DCI-P3 complètes
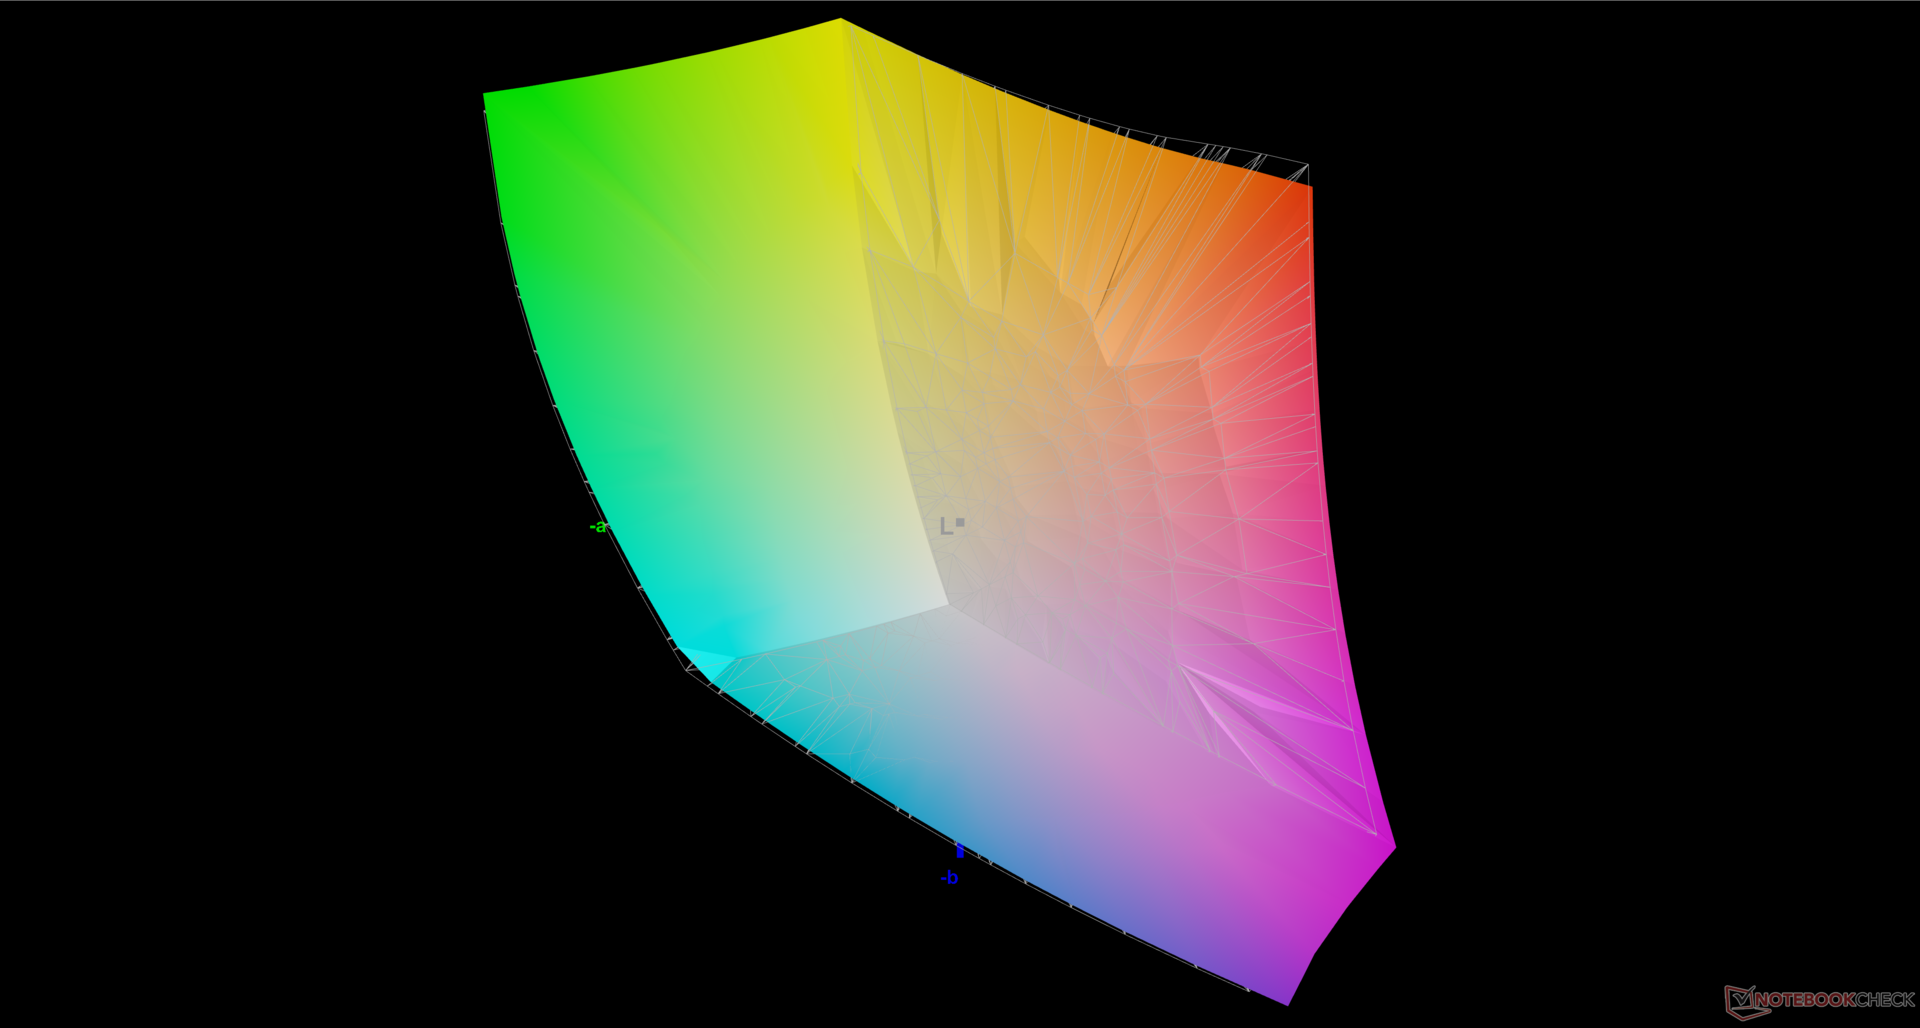
Deux options d'affichage sont disponibles : QHD à 240 Hz ou 4K UHD à 144 Hz, chacune avec 100 % des couleurs DCI-P3 et la prise en charge de G-Sync. Notre unité de test spécifique est livrée avec la première option.
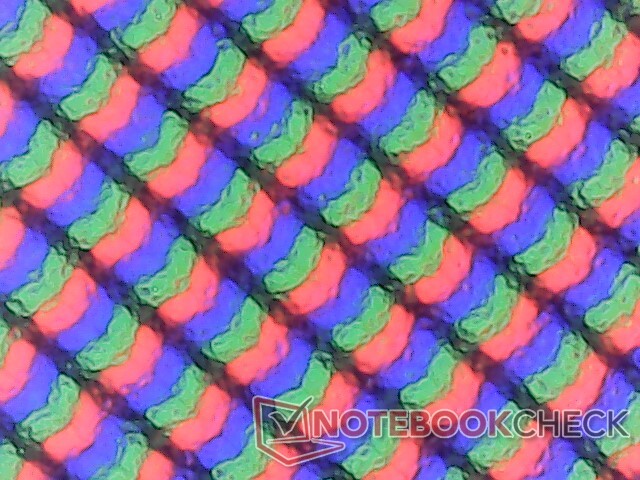
Notre système utilise une dalle IPS de BOE très similaire à celle que l'on trouve sur leROG Strix Scar 17 (NE173QHM-NZ1 vs. NE173QHM-NZ2). Nous ne remarquons pas de différences majeures entre les deux panneaux, notamment au niveau du taux de rafraîchissement, du temps de réponse, de la couverture des couleurs, de la luminosité et du taux de contraste. Il s'agit d'un écran haut de gamme adapté aux jeux et à l'édition de contenu.
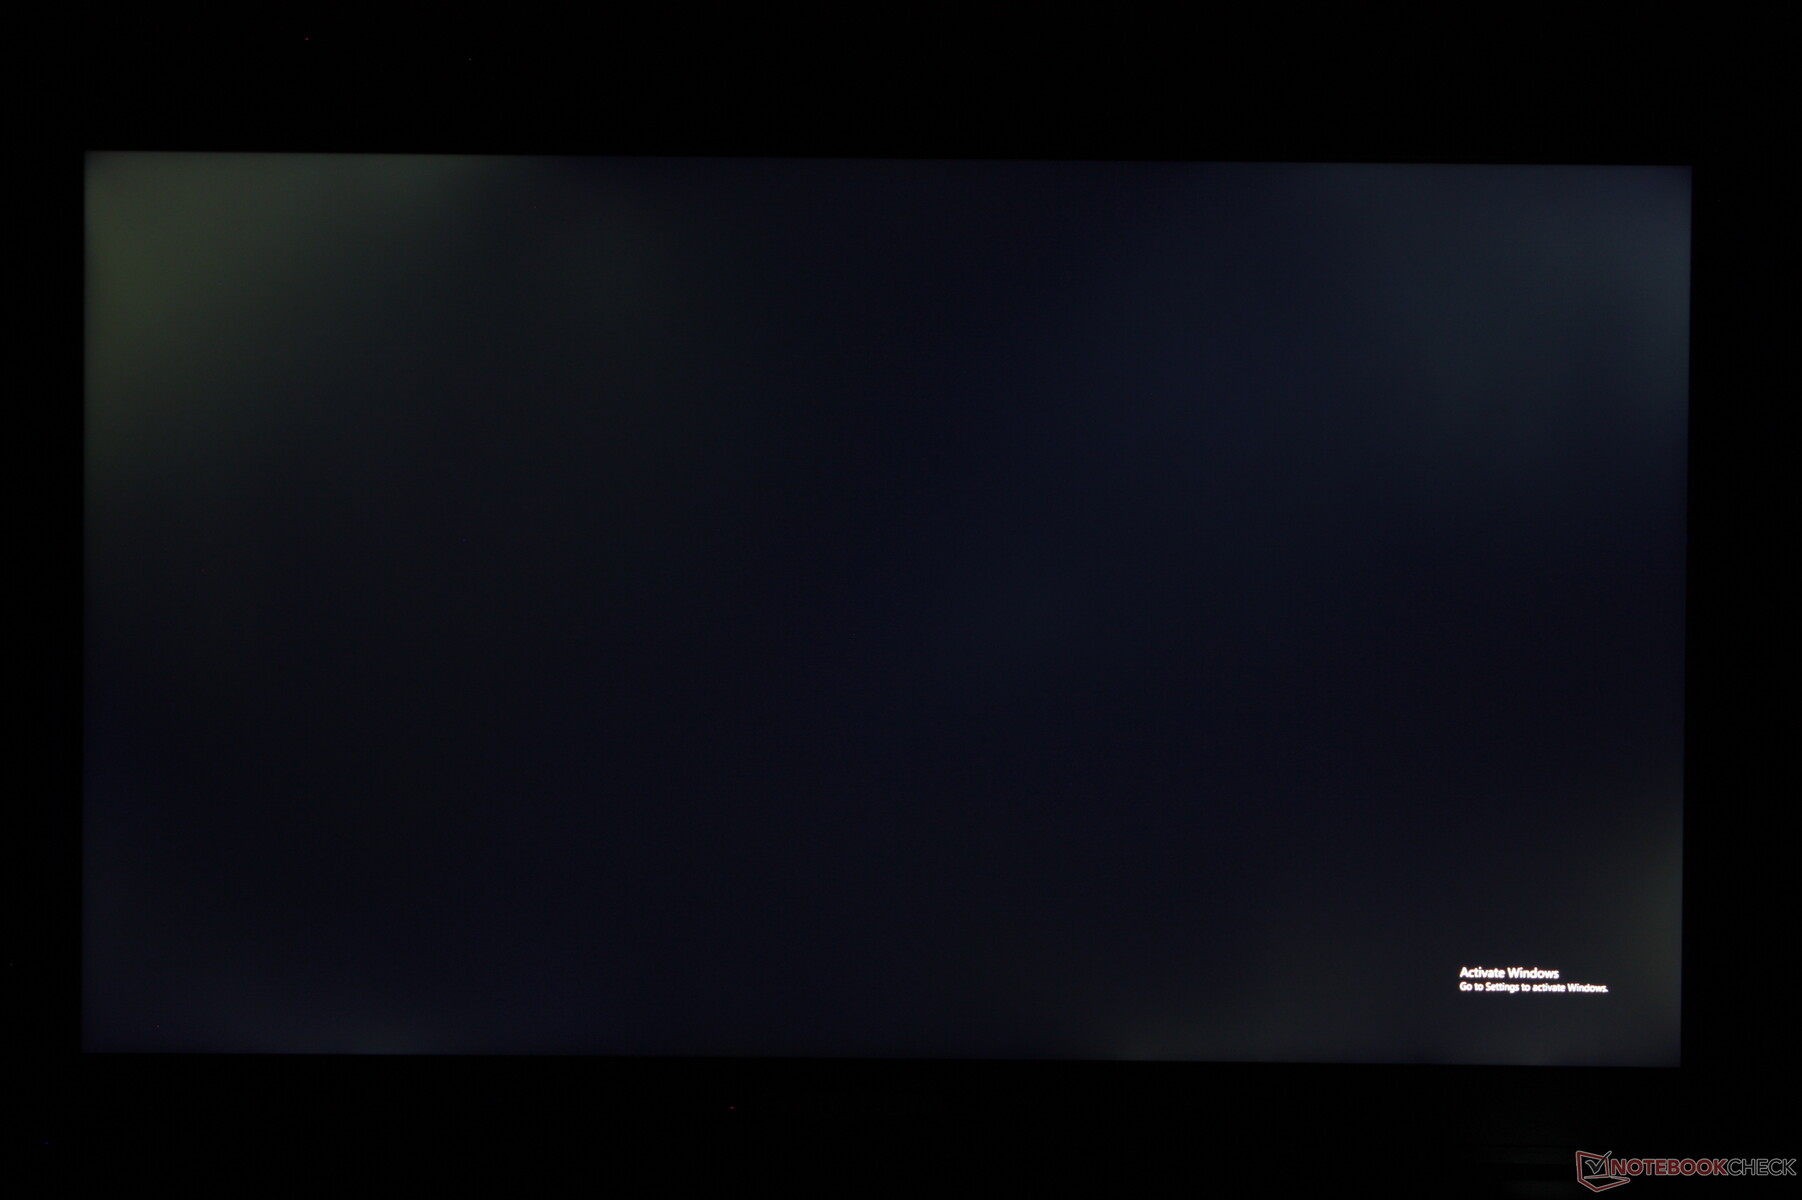
L'un de nos reproches porte sur l'affaiblissement sensible du rétroéclairage sur notre unité de test. Bien qu'il faille s'attendre à une certaine décoloration sur la plupart des écrans IPS, elle est plus importante ici que sur d'autres ordinateurs portables que nous avons testés et qui coûtent moins de la moitié du prix.
| |||||||||||||||||||||||||
Homogénéité de la luminosité: 75 %
Valeur mesurée au centre, sur batterie: 312.6 cd/m²
Contraste: 1202:1 (Valeurs des noirs: 0.26 cd/m²)
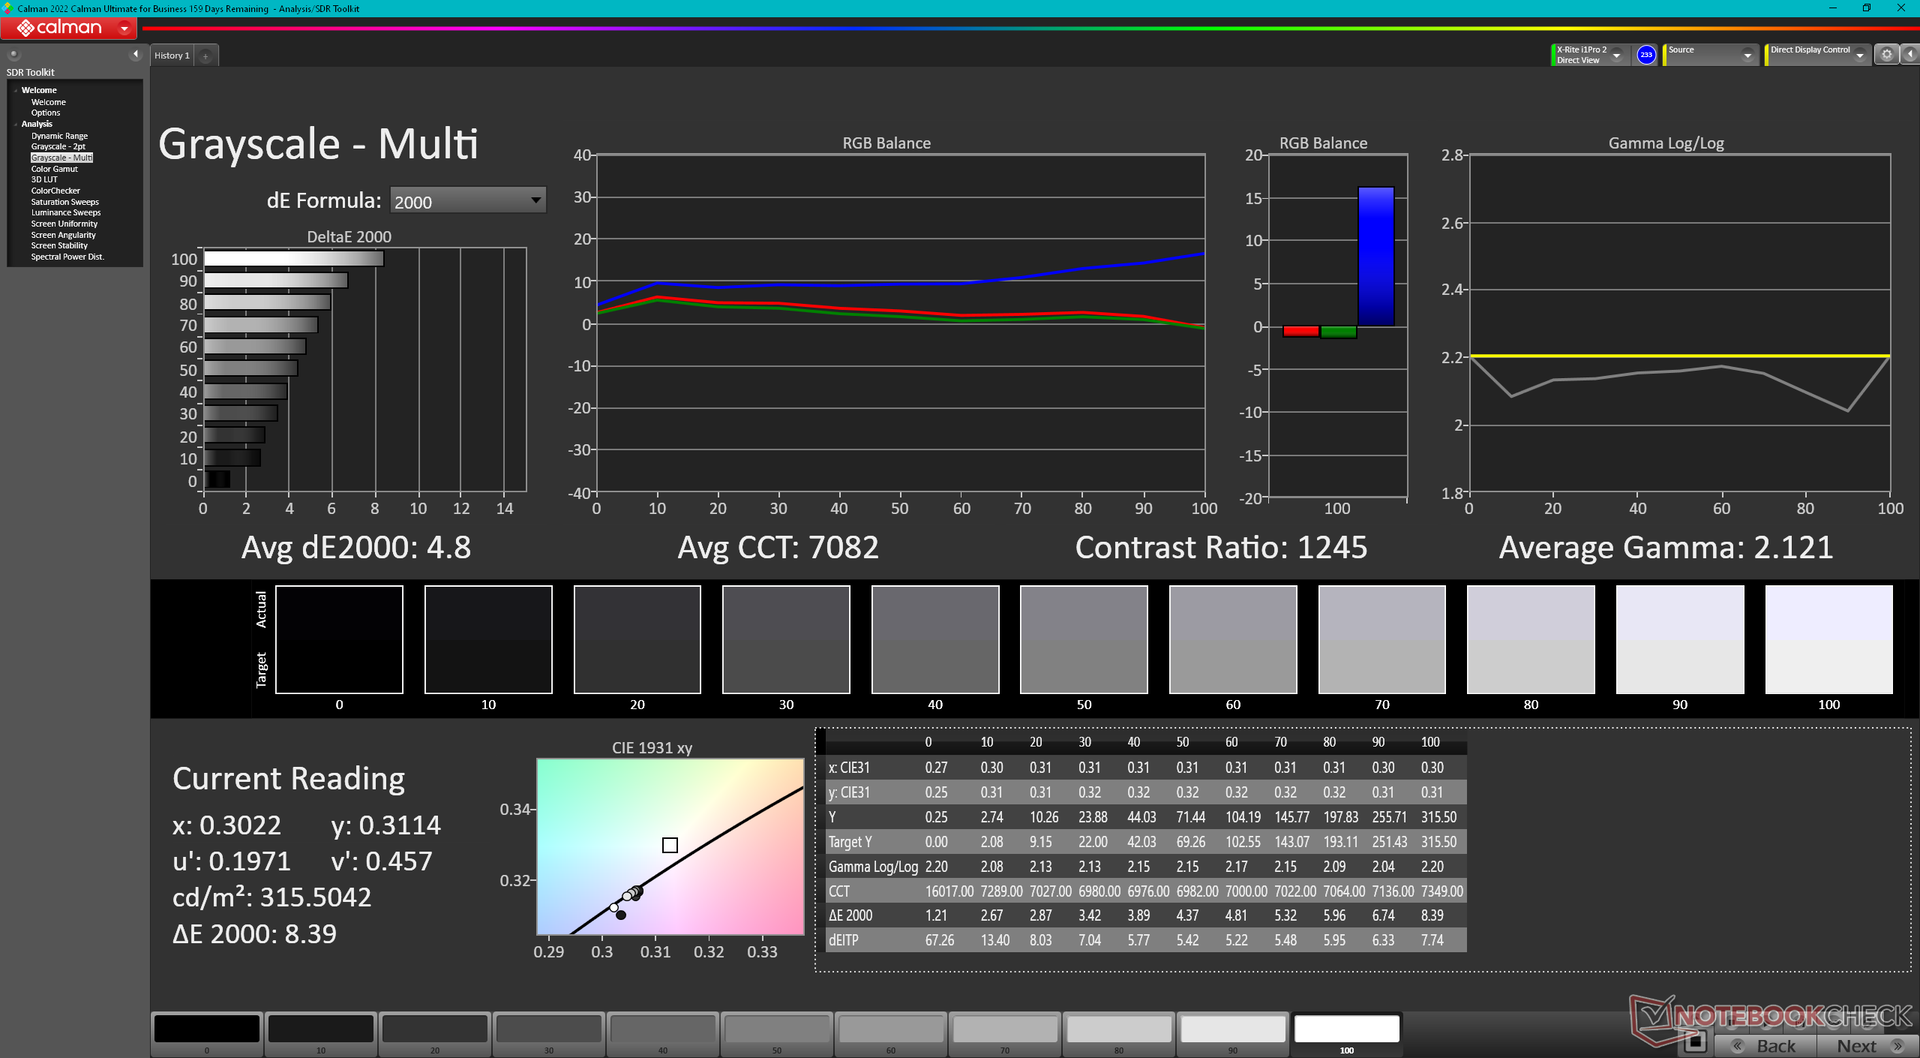
ΔE ColorChecker Calman: 3.43 | ∀{0.5-29.43 Ø4.71}
calibrated: 0.74
ΔE Greyscale Calman: 4.8 | ∀{0.09-98 Ø4.96}
85.4% AdobeRGB 1998 (Argyll 3D)
99.9% sRGB (Argyll 3D)
97.8% Display P3 (Argyll 3D)
Gamma: 2.12
CCT: 7082 K
| Eurocom Raptor X17 BOE NE173QHM-NZ1, IPS, 2560x1440, 17.3" | Asus ROG Strix Scar 17 G733PY-XS96 NE173QHM-NZ2, IPS, 2560x1440, 17.3" | Aorus 17X AZF BOE09F9, IPS, 2560x1440, 17.3" | MSI GE78HX 13VH-070US AU Optronics B170QAN01.2, IPS, 2560x1600, 17" | Eluktronics Mech-17 GP2 BOE NE170QDM-NZ1, IPS, 2560x1600, 17" | Alienware m17 R5 (R9 6900HX, RX 6850M XT) AU Optronics AUODBA3, IPS, 3840x2160, 17" | |
|---|---|---|---|---|---|---|
| Display | 0% | -1% | 0% | -16% | 1% | |
| Display P3 Coverage (%) | 97.8 | 98 0% | 96.7 -1% | 97.6 0% | 69.1 -29% | 97.2 -1% |
| sRGB Coverage (%) | 99.9 | 100 0% | 99.9 0% | 99.9 0% | 99.7 0% | 99.6 0% |
| AdobeRGB 1998 Coverage (%) | 85.4 | 85.6 0% | 84.5 -1% | 86.5 1% | 69.8 -18% | 88.4 4% |
| Response Times | 20% | -3% | 52% | 8% | -20% | |
| Response Time Grey 50% / Grey 80% * (ms) | 13.3 ? | 6.2 ? 53% | 14 ? -5% | 4.2 ? 68% | 12 ? 10% | 16.4 ? -23% |
| Response Time Black / White * (ms) | 10 ? | 11.4 ? -14% | 10.1 ? -1% | 6.4 ? 36% | 9.4 ? 6% | 11.6 ? -16% |
| PWM Frequency (Hz) | ||||||
| Screen | 25% | 6% | -13% | 19% | -67% | |
| Brightness middle (cd/m²) | 312.6 | 322.5 3% | 294 -6% | 398.6 28% | 417.3 33% | 484 55% |
| Brightness (cd/m²) | 292 | 317 9% | 276 -5% | 384 32% | 387 33% | 449 54% |
| Brightness Distribution (%) | 75 | 86 15% | 90 20% | 89 19% | 87 16% | 87 16% |
| Black Level * (cd/m²) | 0.26 | 0.29 -12% | 0.28 -8% | 0.46 -77% | 0.42 -62% | 0.55 -112% |
| Contrast (:1) | 1202 | 1112 -7% | 1050 -13% | 867 -28% | 994 -17% | 880 -27% |
| Colorchecker dE 2000 * | 3.43 | 1.15 66% | 2.81 18% | 4.05 -18% | 2.14 38% | 4.8 -40% |
| Colorchecker dE 2000 max. * | 8.31 | 3.03 64% | 5.7 31% | 8.68 -4% | 4.09 51% | 7.48 10% |
| Colorchecker dE 2000 calibrated * | 0.74 | 0.56 24% | 0.86 -16% | 1.02 -38% | 0.42 43% | 4.74 -541% |
| Greyscale dE 2000 * | 4.8 | 1.7 65% | 3.4 29% | 6.5 -35% | 3.1 35% | 5.5 -15% |
| Gamma | 2.12 104% | 2.27 97% | 2.301 96% | 2.11 104% | 2.19 100% | 2.42 91% |
| CCT | 7082 92% | 6299 103% | 7389 88% | 7518 86% | 6040 108% | 6148 106% |
| Moyenne finale (programmes/paramètres) | 15% /
19% | 1% /
3% | 13% /
-1% | 4% /
10% | -29% /
-45% |
* ... Moindre est la valeur, meilleures sont les performances

L'écran n'est pas livré pré-calibré. Au lieu de cela, Eurocom facture un supplément pour le calibrage en usine, ce qui nous semble absurde compte tenu du prix déjà élevé. D'autres fabricants comme MSI, Asus, Dell, et d'autres encore proposent un pré-calibrage en standard pour la plupart de leurs modèles respectifs.
Temps de réponse de l'écran
| ↔ Temps de réponse noir à blanc | ||
|---|---|---|
| 10 ms ... hausse ↗ et chute ↘ combinées | ↗ 5 ms hausse | 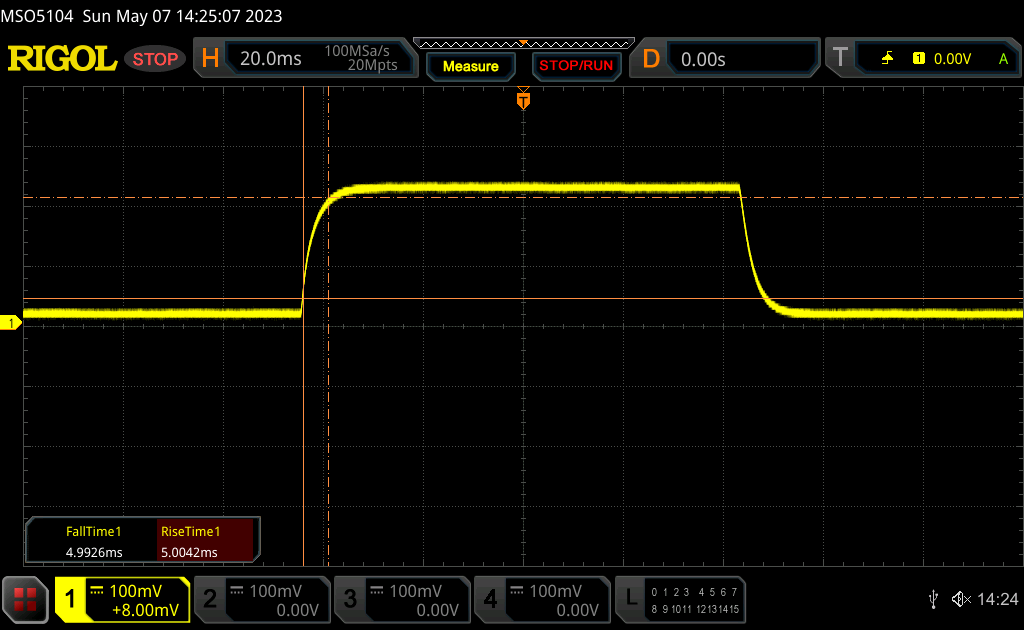 |
| ↘ 5 ms chute | ||
| L'écran montre de bons temps de réponse, mais insuffisant pour du jeu compétitif. En comparaison, tous les appareils testés affichent entre 0.1 (minimum) et 240 (maximum) ms. » 27 % des appareils testés affichent de meilleures performances. Cela signifie que les latences relevées sont meilleures que la moyenne (19.8 ms) de tous les appareils testés. | ||
| ↔ Temps de réponse gris 50% à gris 80% | ||
| 13.3 ms ... hausse ↗ et chute ↘ combinées | ↗ 6 ms hausse | 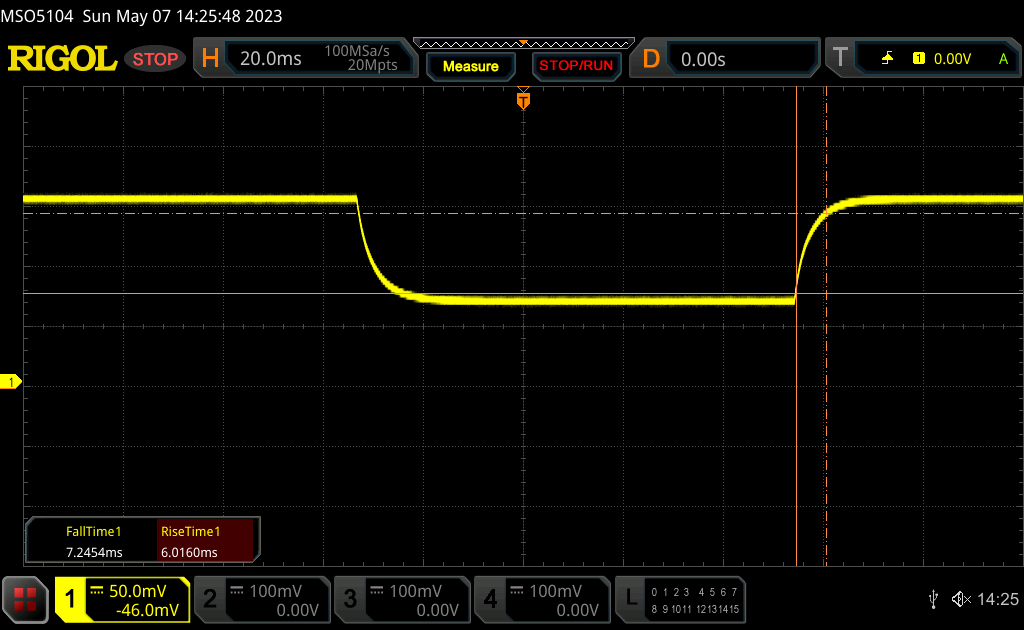 |
| ↘ 7.3 ms chute | ||
| L'écran montre de bons temps de réponse, mais insuffisant pour du jeu compétitif. En comparaison, tous les appareils testés affichent entre 0.165 (minimum) et 636 (maximum) ms. » 27 % des appareils testés affichent de meilleures performances. Cela signifie que les latences relevées sont meilleures que la moyenne (31 ms) de tous les appareils testés. | ||
Scintillement / MLI (Modulation de largeur d'impulsion)
| Scintillement / MLI (Modulation de largeur d'impulsion) non décelé | 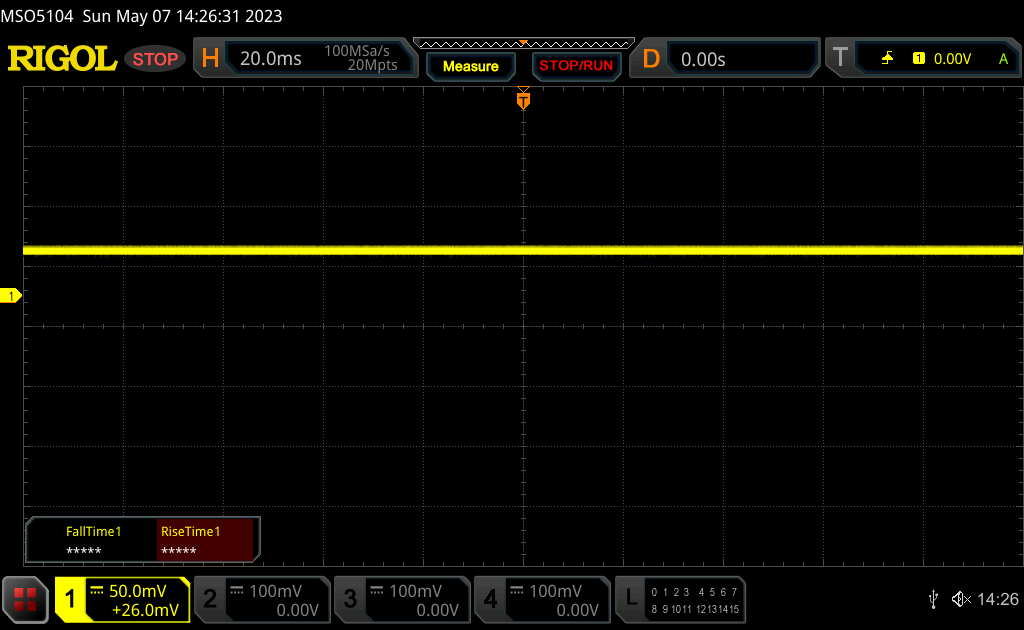 | ||
En comparaison, 52 % des appareils testés n'emploient pas MDI pour assombrir leur écran. Nous avons relevé une moyenne à 7757 (minimum : 5 - maximum : 343500) Hz dans le cas où une MDI était active. | |||
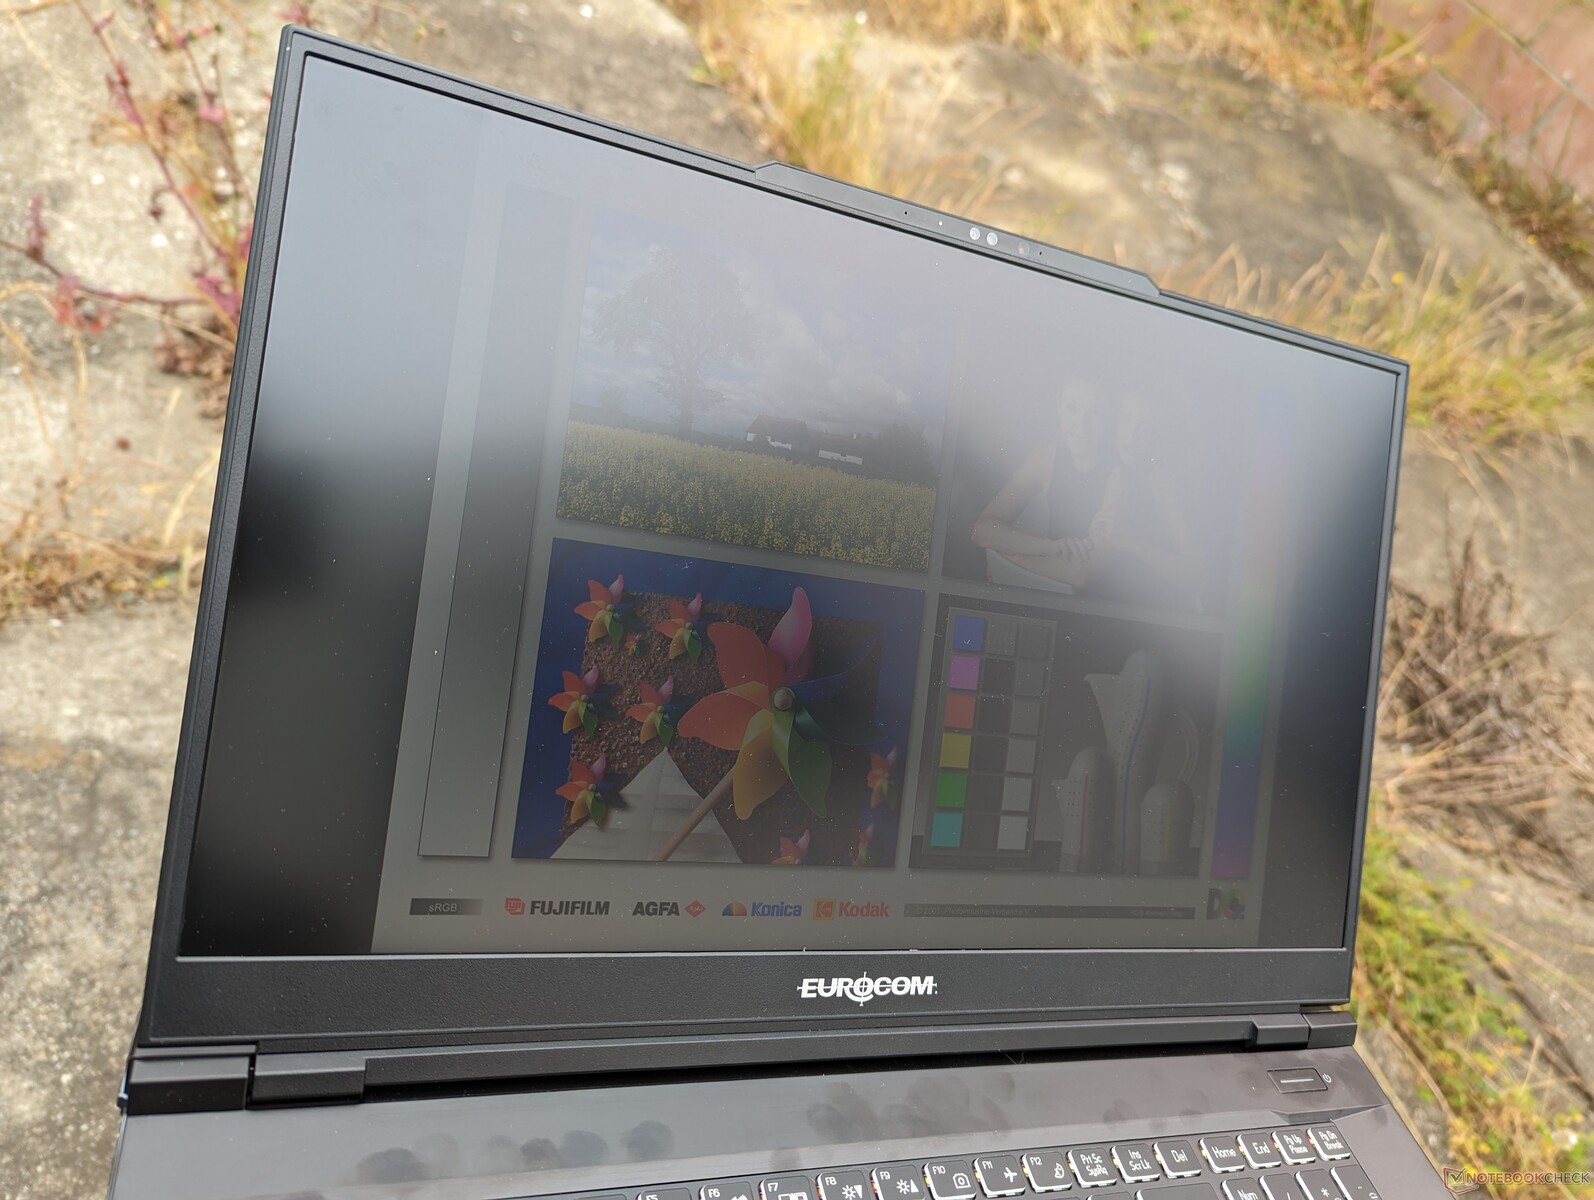
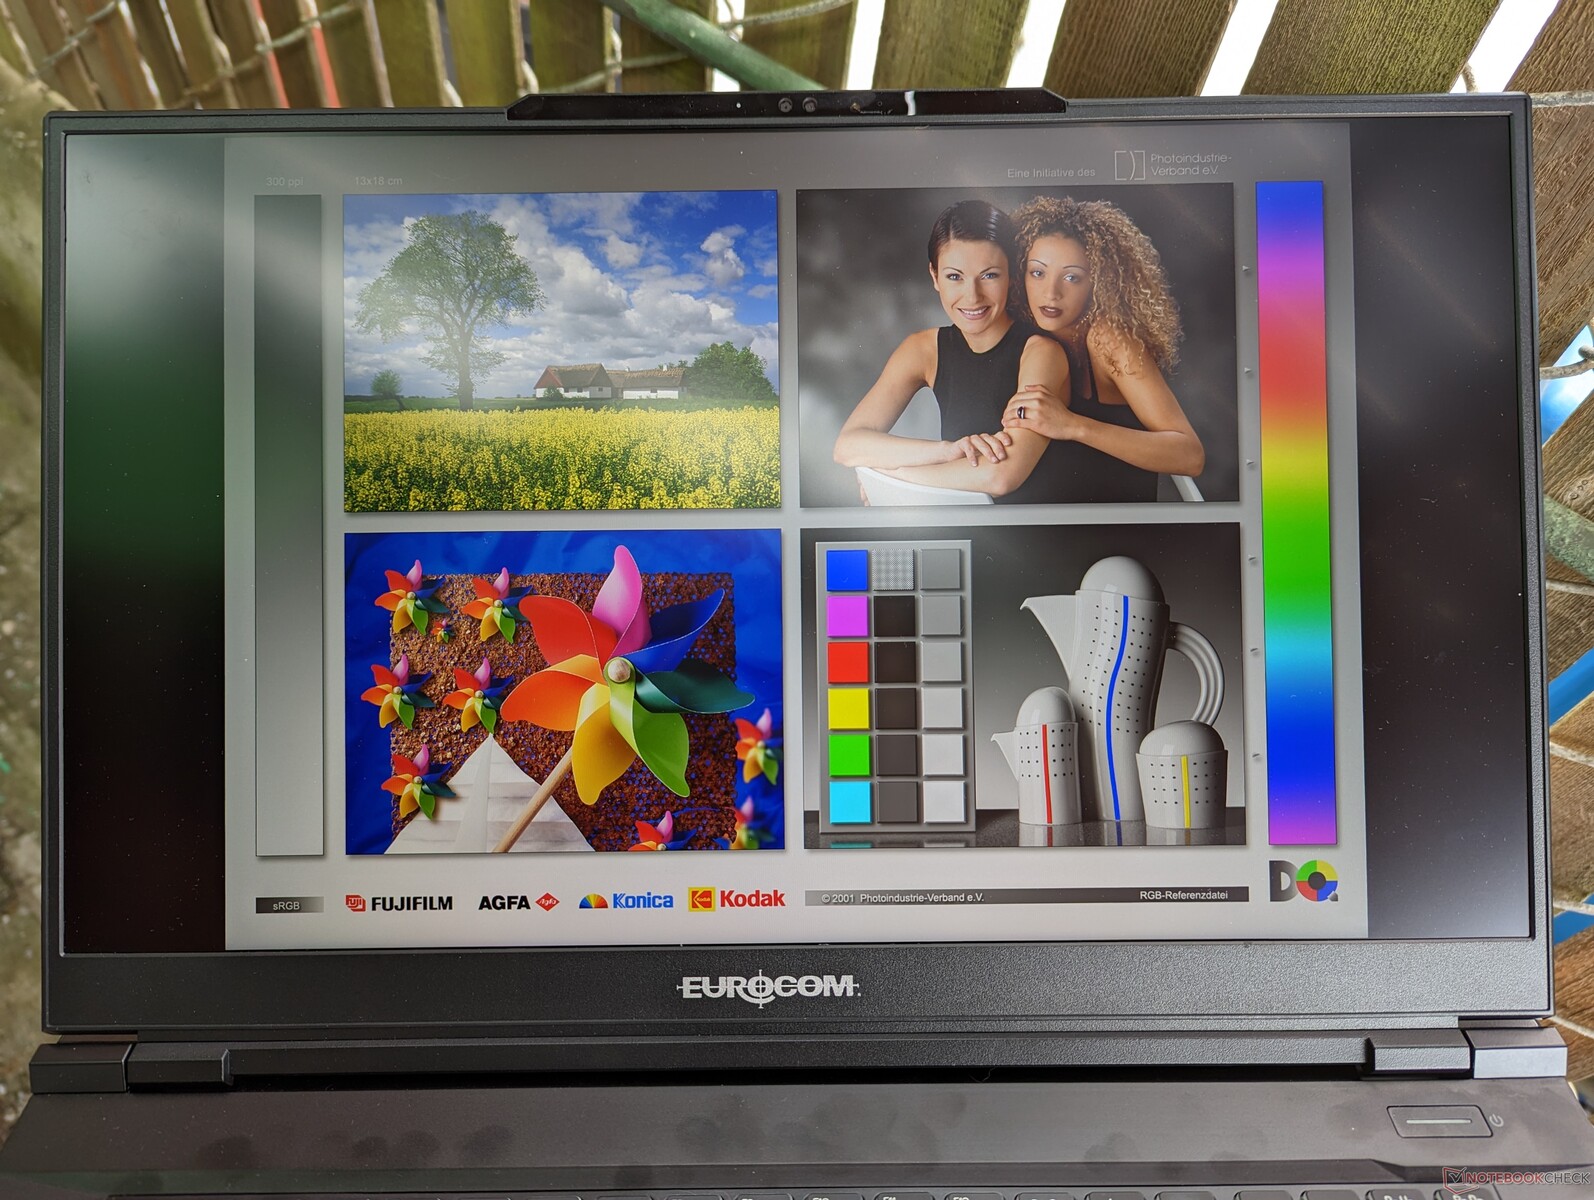
La visibilité extérieure est typique de la plupart des ordinateurs portables de jeu, puisque 300 nits est une moyenne pour la catégorie. Les panneaux de certains modèles concurrents peuvent atteindre jusqu'à 500 nits, comme c'est le cas pour le modèleAlienware m17 R5 ou le Razer Blade 17 pour une meilleure visibilité à l'extérieur, mais nous ne voyons pas cela comme un avantage énorme par rapport à l'Eurocom compte tenu de la taille et du poids des ordinateurs portables de jeu de 17 pouces.
Performance - Raptor Lake pour le Raptor X17
Conditions d'essai
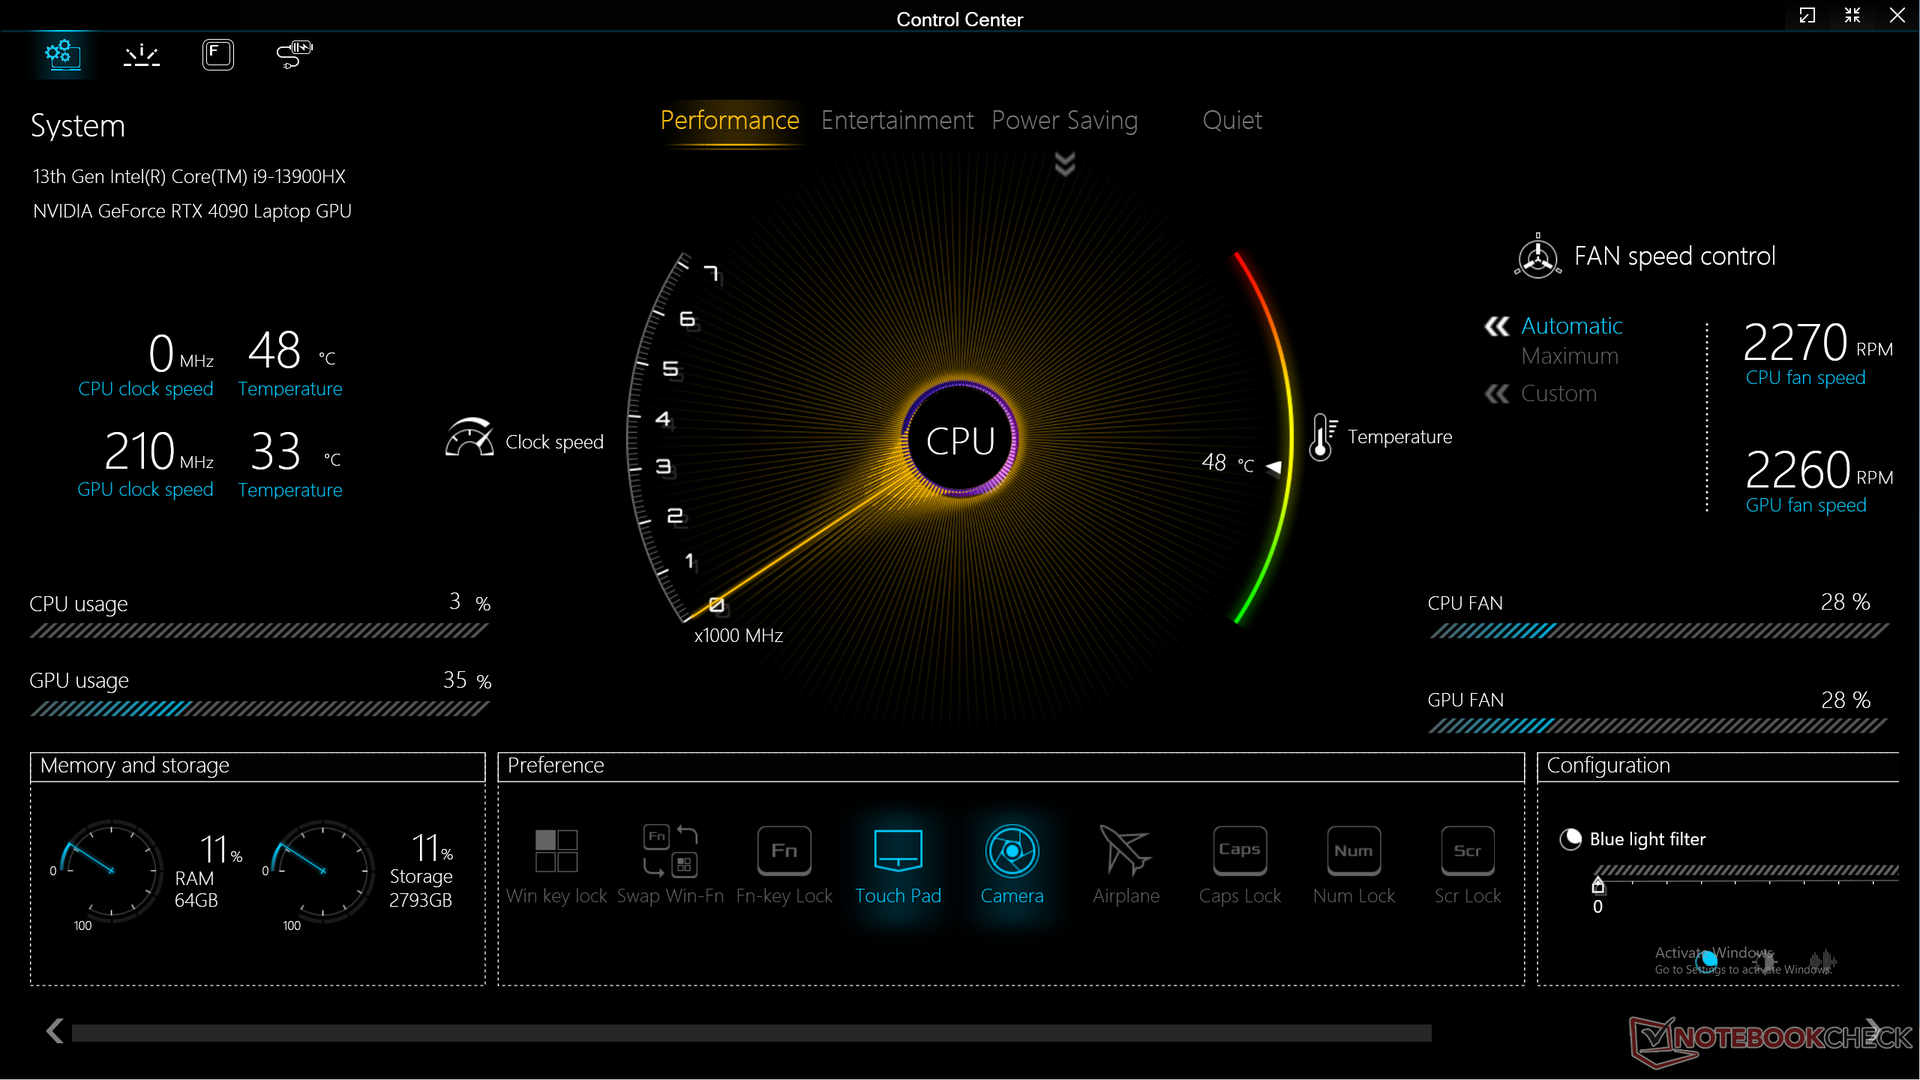
Nous avons réglé notre appareil en mode Performance via le Centre de contrôle et Windows avant d'effectuer les tests de référence ci-dessous. Malheureusement, les paramètres d'alimentation du centre de contrôle ne sont pas liés à ceux de Windows, ce qui signifie qu'il peut y avoir des conflits si les deux paramètres ne sont pas identiques. Par exemple, il est possible de régler Windows en mode économie d'énergie et le centre de contrôle en mode performance simultanément. Des équipementiers comme Dell ont déjà résolu ce problème sur leur série Alienware.
Nous avons également réglé notre unité en mode dGPU avant de procéder à l'analyse comparative. Le Raptor X17 prend en charge le mode graphique hybride (Optimus), le mode dGPU et le mode dynamique (Advanced Optimus). Bien que nous apprécions les options, les paramètres sont enfouis dans plusieurs couches de sous-menus dans le BIOS. En comparaison, des concurrents comme MSI et Asus proposent des paramètres similaires dans leurs applications Control Center respectives pour un accès plus facile.
Processeur
LeCore i9-13900HX de notre appareil est légèrement plus lent que les autres ordinateurs portables équipés du même processeur, de l'ordre de 5 %. Quoi qu'il en soit, il reste l'un des processeurs de série H les plus rapides du marché, rivalisant avec les processeurs concurrents Ryzen 9 7945HX. Mise à niveau par rapport au Core i9-12900HX de l'année dernière, les performances multithread augmenteront d'environ 20 %.
La durabilité des performances est excellente, surtout si on la compare à celle de l'Aorus 17X qui est livré avec le même Core i9-13900HX. Les scores de la boucle CineBench R15 xT ont été plus stables sur notre unité tout au long du test de stress, comme le montre le graphique de comparaison ci-dessous.
Le passage de notre Core i9-13900HX à la configuration Core i7-13700HX devrait réduire les performances multithread d'environ 20 à 25 %.
Cinebench R15 Multi Loop
Cinebench R23: Multi Core | Single Core
Cinebench R20: CPU (Multi Core) | CPU (Single Core)
Cinebench R15: CPU Multi 64Bit | CPU Single 64Bit
Blender: v2.79 BMW27 CPU
7-Zip 18.03: 7z b 4 | 7z b 4 -mmt1
Geekbench 5.5: Multi-Core | Single-Core
HWBOT x265 Benchmark v2.2: 4k Preset
LibreOffice : 20 Documents To PDF
R Benchmark 2.5: Overall mean
* ... Moindre est la valeur, meilleures sont les performances
AIDA64: FP32 Ray-Trace | FPU Julia | CPU SHA3 | CPU Queen | FPU SinJulia | FPU Mandel | CPU AES | CPU ZLib | FP64 Ray-Trace | CPU PhotoWorxx
| Performance rating | |
| Asus ROG Strix Scar 17 G733PY-XS96 | |
| Eluktronics Mech-17 GP2 | |
| MSI GE78HX 13VH-070US | |
| Moyenne Intel Core i9-13900HX | |
| Eurocom Raptor X17 | |
| Aorus 17X AZF | |
| Alienware m17 R5 (R9 6900HX, RX 6850M XT) | |
| AIDA64 / FP32 Ray-Trace | |
| Asus ROG Strix Scar 17 G733PY-XS96 | |
| MSI GE78HX 13VH-070US | |
| Eluktronics Mech-17 GP2 | |
| Moyenne Intel Core i9-13900HX (17589 - 27615, n=22) | |
| Eurocom Raptor X17 | |
| Aorus 17X AZF | |
| Alienware m17 R5 (R9 6900HX, RX 6850M XT) | |
| AIDA64 / FPU Julia | |
| Asus ROG Strix Scar 17 G733PY-XS96 | |
| MSI GE78HX 13VH-070US | |
| Eluktronics Mech-17 GP2 | |
| Eurocom Raptor X17 | |
| Moyenne Intel Core i9-13900HX (88686 - 137015, n=22) | |
| Alienware m17 R5 (R9 6900HX, RX 6850M XT) | |
| Aorus 17X AZF | |
| AIDA64 / CPU SHA3 | |
| Asus ROG Strix Scar 17 G733PY-XS96 | |
| Eluktronics Mech-17 GP2 | |
| MSI GE78HX 13VH-070US | |
| Eurocom Raptor X17 | |
| Moyenne Intel Core i9-13900HX (4362 - 7029, n=22) | |
| Aorus 17X AZF | |
| Alienware m17 R5 (R9 6900HX, RX 6850M XT) | |
| AIDA64 / CPU Queen | |
| Asus ROG Strix Scar 17 G733PY-XS96 | |
| Eluktronics Mech-17 GP2 | |
| MSI GE78HX 13VH-070US | |
| Eurocom Raptor X17 | |
| Moyenne Intel Core i9-13900HX (125644 - 141385, n=22) | |
| Aorus 17X AZF | |
| Alienware m17 R5 (R9 6900HX, RX 6850M XT) | |
| AIDA64 / FPU SinJulia | |
| Asus ROG Strix Scar 17 G733PY-XS96 | |
| Eluktronics Mech-17 GP2 | |
| MSI GE78HX 13VH-070US | |
| Moyenne Intel Core i9-13900HX (12334 - 17179, n=22) | |
| Eurocom Raptor X17 | |
| Aorus 17X AZF | |
| Alienware m17 R5 (R9 6900HX, RX 6850M XT) | |
| AIDA64 / FPU Mandel | |
| Asus ROG Strix Scar 17 G733PY-XS96 | |
| MSI GE78HX 13VH-070US | |
| Eluktronics Mech-17 GP2 | |
| Moyenne Intel Core i9-13900HX (43850 - 69202, n=22) | |
| Eurocom Raptor X17 | |
| Alienware m17 R5 (R9 6900HX, RX 6850M XT) | |
| Aorus 17X AZF | |
| AIDA64 / CPU AES | |
| Eluktronics Mech-17 GP2 | |
| Asus ROG Strix Scar 17 G733PY-XS96 | |
| Aorus 17X AZF | |
| Moyenne Intel Core i9-13900HX (89413 - 237881, n=22) | |
| MSI GE78HX 13VH-070US | |
| Eurocom Raptor X17 | |
| Alienware m17 R5 (R9 6900HX, RX 6850M XT) | |
| AIDA64 / CPU ZLib | |
| Asus ROG Strix Scar 17 G733PY-XS96 | |
| MSI GE78HX 13VH-070US | |
| Eluktronics Mech-17 GP2 | |
| Eurocom Raptor X17 | |
| Moyenne Intel Core i9-13900HX (1284 - 1958, n=22) | |
| Aorus 17X AZF | |
| Alienware m17 R5 (R9 6900HX, RX 6850M XT) | |
| AIDA64 / FP64 Ray-Trace | |
| Asus ROG Strix Scar 17 G733PY-XS96 | |
| MSI GE78HX 13VH-070US | |
| Eluktronics Mech-17 GP2 | |
| Moyenne Intel Core i9-13900HX (9481 - 15279, n=22) | |
| Eurocom Raptor X17 | |
| Aorus 17X AZF | |
| Alienware m17 R5 (R9 6900HX, RX 6850M XT) | |
| AIDA64 / CPU PhotoWorxx | |
| Eurocom Raptor X17 | |
| Aorus 17X AZF | |
| MSI GE78HX 13VH-070US | |
| Moyenne Intel Core i9-13900HX (42994 - 51994, n=22) | |
| Eluktronics Mech-17 GP2 | |
| Asus ROG Strix Scar 17 G733PY-XS96 | |
| Alienware m17 R5 (R9 6900HX, RX 6850M XT) | |
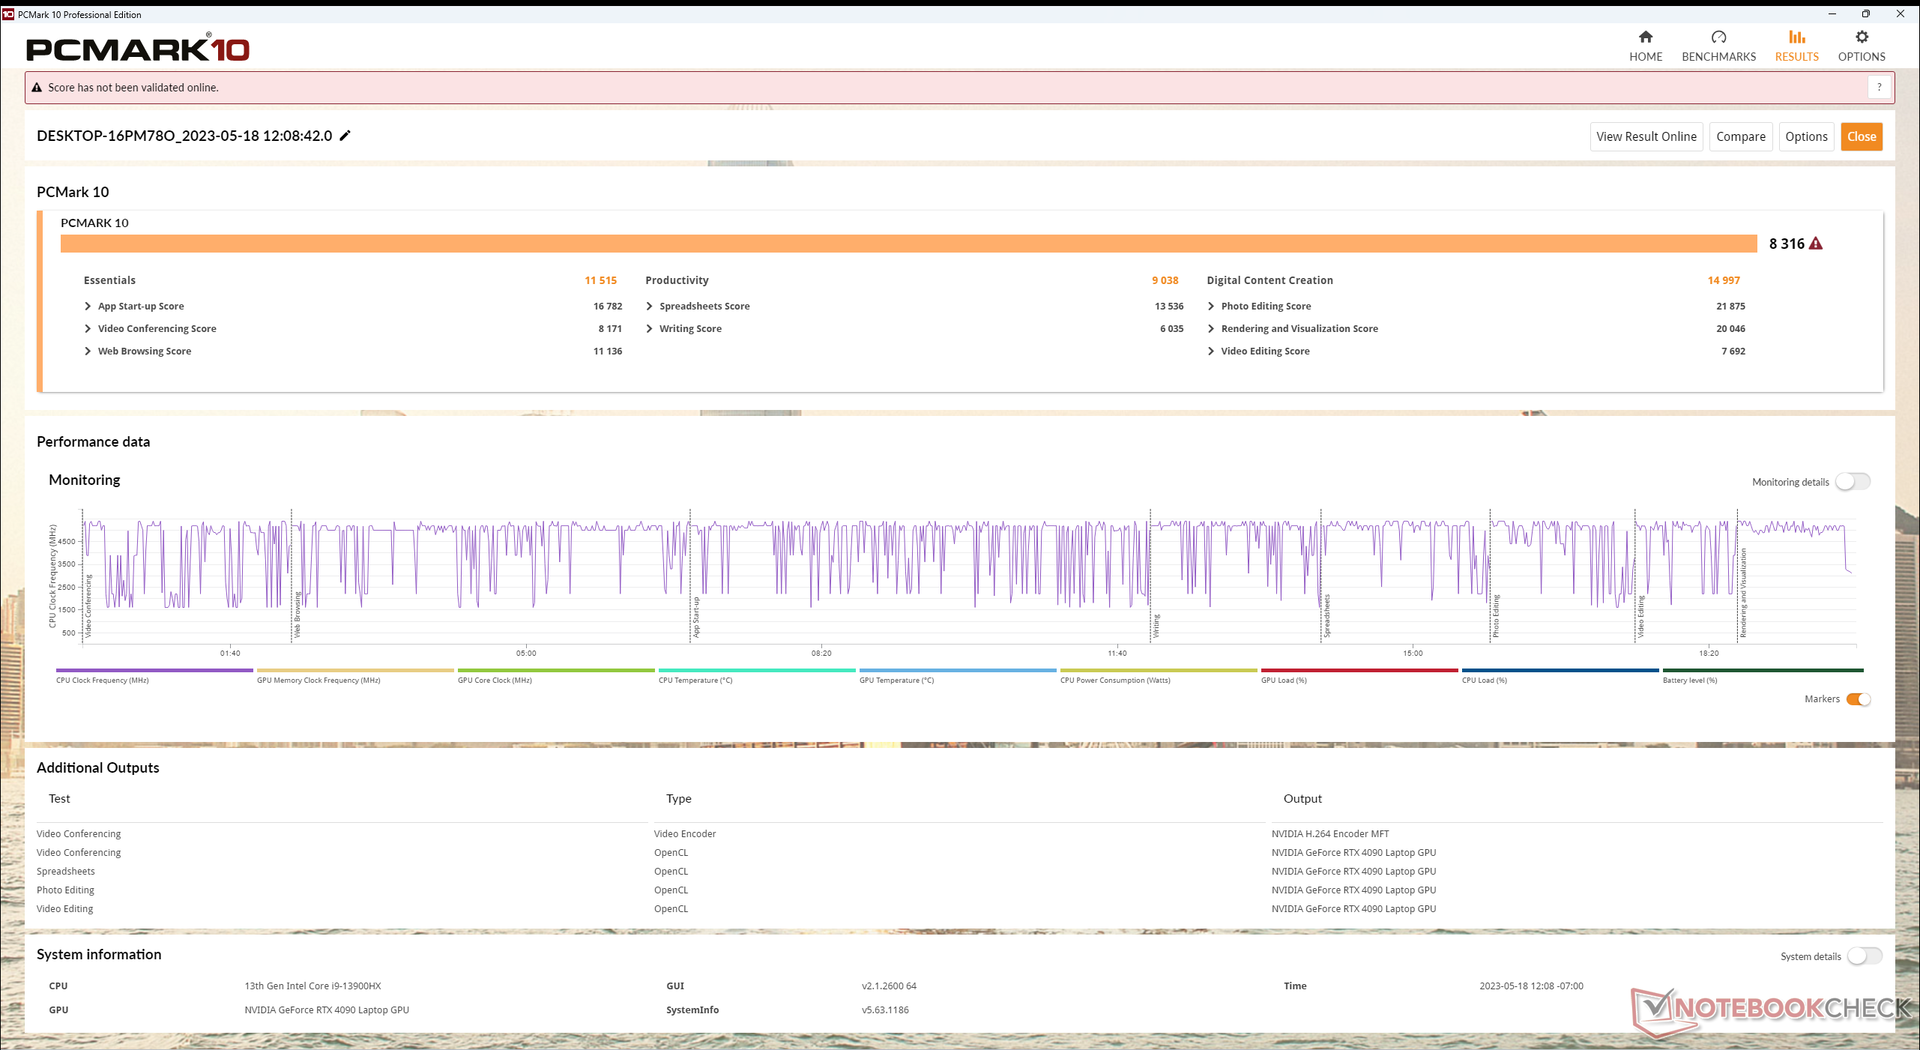
Performance du système
CrossMark: Overall | Productivity | Creativity | Responsiveness
| PCMark 10 / Score | |
| Eluktronics Mech-17 GP2 | |
| MSI GE78HX 13VH-070US | |
| Asus ROG Strix Scar 17 G733PY-XS96 | |
| Moyenne Intel Core i9-13900HX, NVIDIA GeForce RTX 4090 Laptop GPU (7690 - 9331, n=8) | |
| Eurocom Raptor X17 | |
| Aorus 17X AZF | |
| Alienware m17 R5 (R9 6900HX, RX 6850M XT) | |
| PCMark 10 / Essentials | |
| Eluktronics Mech-17 GP2 | |
| Eurocom Raptor X17 | |
| MSI GE78HX 13VH-070US | |
| Moyenne Intel Core i9-13900HX, NVIDIA GeForce RTX 4090 Laptop GPU (10972 - 11983, n=8) | |
| Aorus 17X AZF | |
| Asus ROG Strix Scar 17 G733PY-XS96 | |
| Alienware m17 R5 (R9 6900HX, RX 6850M XT) | |
| PCMark 10 / Productivity | |
| Eluktronics Mech-17 GP2 | |
| MSI GE78HX 13VH-070US | |
| Moyenne Intel Core i9-13900HX, NVIDIA GeForce RTX 4090 Laptop GPU (9038 - 11680, n=8) | |
| Aorus 17X AZF | |
| Asus ROG Strix Scar 17 G733PY-XS96 | |
| Alienware m17 R5 (R9 6900HX, RX 6850M XT) | |
| Eurocom Raptor X17 | |
| PCMark 10 / Digital Content Creation | |
| Asus ROG Strix Scar 17 G733PY-XS96 | |
| Eluktronics Mech-17 GP2 | |
| MSI GE78HX 13VH-070US | |
| Eurocom Raptor X17 | |
| Moyenne Intel Core i9-13900HX, NVIDIA GeForce RTX 4090 Laptop GPU (10605 - 16395, n=8) | |
| Alienware m17 R5 (R9 6900HX, RX 6850M XT) | |
| Aorus 17X AZF | |
| CrossMark / Overall | |
| Eluktronics Mech-17 GP2 | |
| Aorus 17X AZF | |
| Moyenne Intel Core i9-13900HX, NVIDIA GeForce RTX 4090 Laptop GPU (1825 - 2295, n=8) | |
| Asus ROG Strix Scar 17 G733PY-XS96 | |
| MSI GE78HX 13VH-070US | |
| Eurocom Raptor X17 | |
| Alienware m17 R5 (R9 6900HX, RX 6850M XT) | |
| CrossMark / Productivity | |
| Aorus 17X AZF | |
| Eluktronics Mech-17 GP2 | |
| Moyenne Intel Core i9-13900HX, NVIDIA GeForce RTX 4090 Laptop GPU (1666 - 2166, n=8) | |
| MSI GE78HX 13VH-070US | |
| Asus ROG Strix Scar 17 G733PY-XS96 | |
| Eurocom Raptor X17 | |
| Alienware m17 R5 (R9 6900HX, RX 6850M XT) | |
| CrossMark / Creativity | |
| Eluktronics Mech-17 GP2 | |
| Moyenne Intel Core i9-13900HX, NVIDIA GeForce RTX 4090 Laptop GPU (2162 - 2514, n=8) | |
| Asus ROG Strix Scar 17 G733PY-XS96 | |
| Aorus 17X AZF | |
| Eurocom Raptor X17 | |
| MSI GE78HX 13VH-070US | |
| Alienware m17 R5 (R9 6900HX, RX 6850M XT) | |
| CrossMark / Responsiveness | |
| Aorus 17X AZF | |
| Eluktronics Mech-17 GP2 | |
| Moyenne Intel Core i9-13900HX, NVIDIA GeForce RTX 4090 Laptop GPU (1441 - 2275, n=8) | |
| MSI GE78HX 13VH-070US | |
| Asus ROG Strix Scar 17 G733PY-XS96 | |
| Eurocom Raptor X17 | |
| Alienware m17 R5 (R9 6900HX, RX 6850M XT) | |
| PCMark 10 Score | 8316 points | |
Aide | ||
| AIDA64 / Memory Copy | |
| Aorus 17X AZF | |
| MSI GE78HX 13VH-070US | |
| Eurocom Raptor X17 | |
| Moyenne Intel Core i9-13900HX (67716 - 79193, n=22) | |
| Eluktronics Mech-17 GP2 | |
| Alienware m17 R5 (R9 6900HX, RX 6850M XT) | |
| Asus ROG Strix Scar 17 G733PY-XS96 | |
| AIDA64 / Memory Read | |
| Aorus 17X AZF | |
| MSI GE78HX 13VH-070US | |
| Moyenne Intel Core i9-13900HX (73998 - 88462, n=22) | |
| Eurocom Raptor X17 | |
| Eluktronics Mech-17 GP2 | |
| Asus ROG Strix Scar 17 G733PY-XS96 | |
| Alienware m17 R5 (R9 6900HX, RX 6850M XT) | |
| AIDA64 / Memory Write | |
| Aorus 17X AZF | |
| MSI GE78HX 13VH-070US | |
| Eurocom Raptor X17 | |
| Moyenne Intel Core i9-13900HX (65472 - 77045, n=22) | |
| Eluktronics Mech-17 GP2 | |
| Asus ROG Strix Scar 17 G733PY-XS96 | |
| Alienware m17 R5 (R9 6900HX, RX 6850M XT) | |
| AIDA64 / Memory Latency | |
| Alienware m17 R5 (R9 6900HX, RX 6850M XT) | |
| Eluktronics Mech-17 GP2 | |
| Moyenne Intel Core i9-13900HX (75.3 - 91.1, n=22) | |
| MSI GE78HX 13VH-070US | |
| Eurocom Raptor X17 | |
| Asus ROG Strix Scar 17 G733PY-XS96 | |
| Aorus 17X AZF | |
* ... Moindre est la valeur, meilleures sont les performances
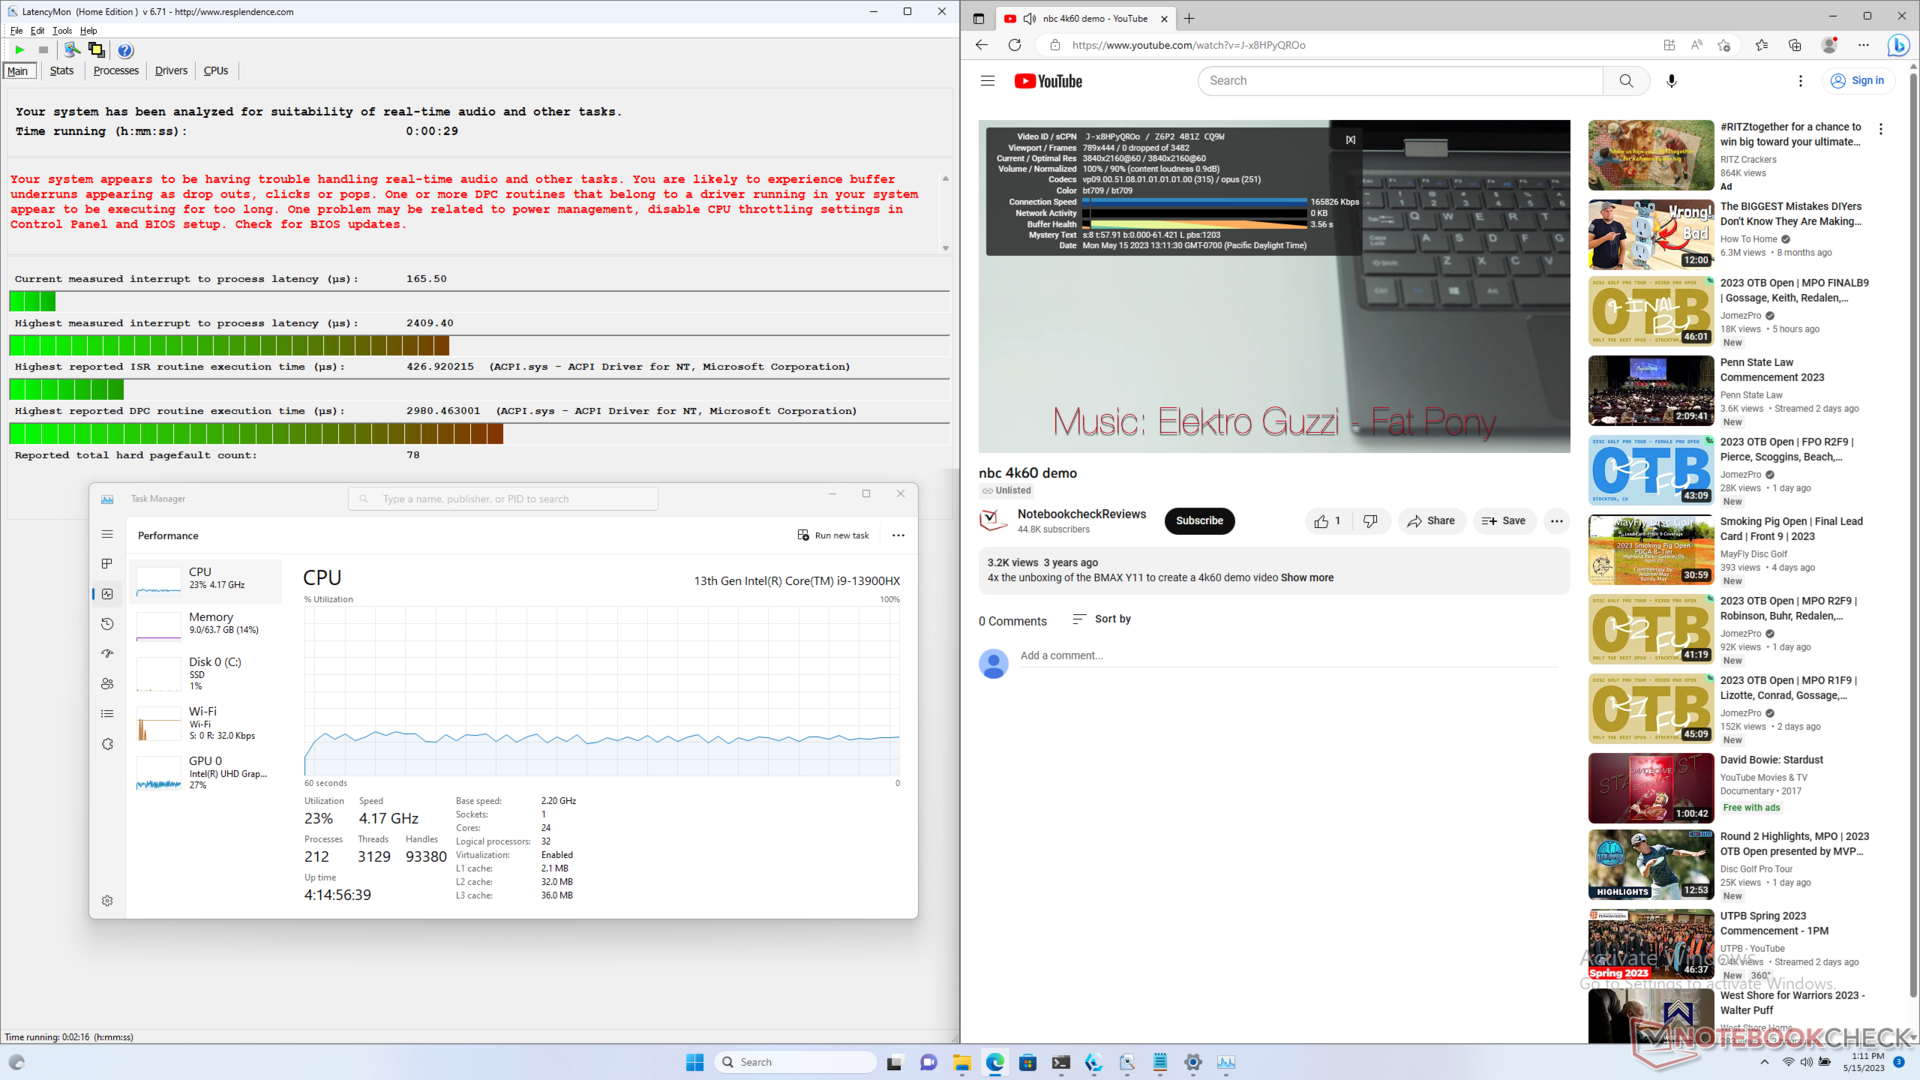
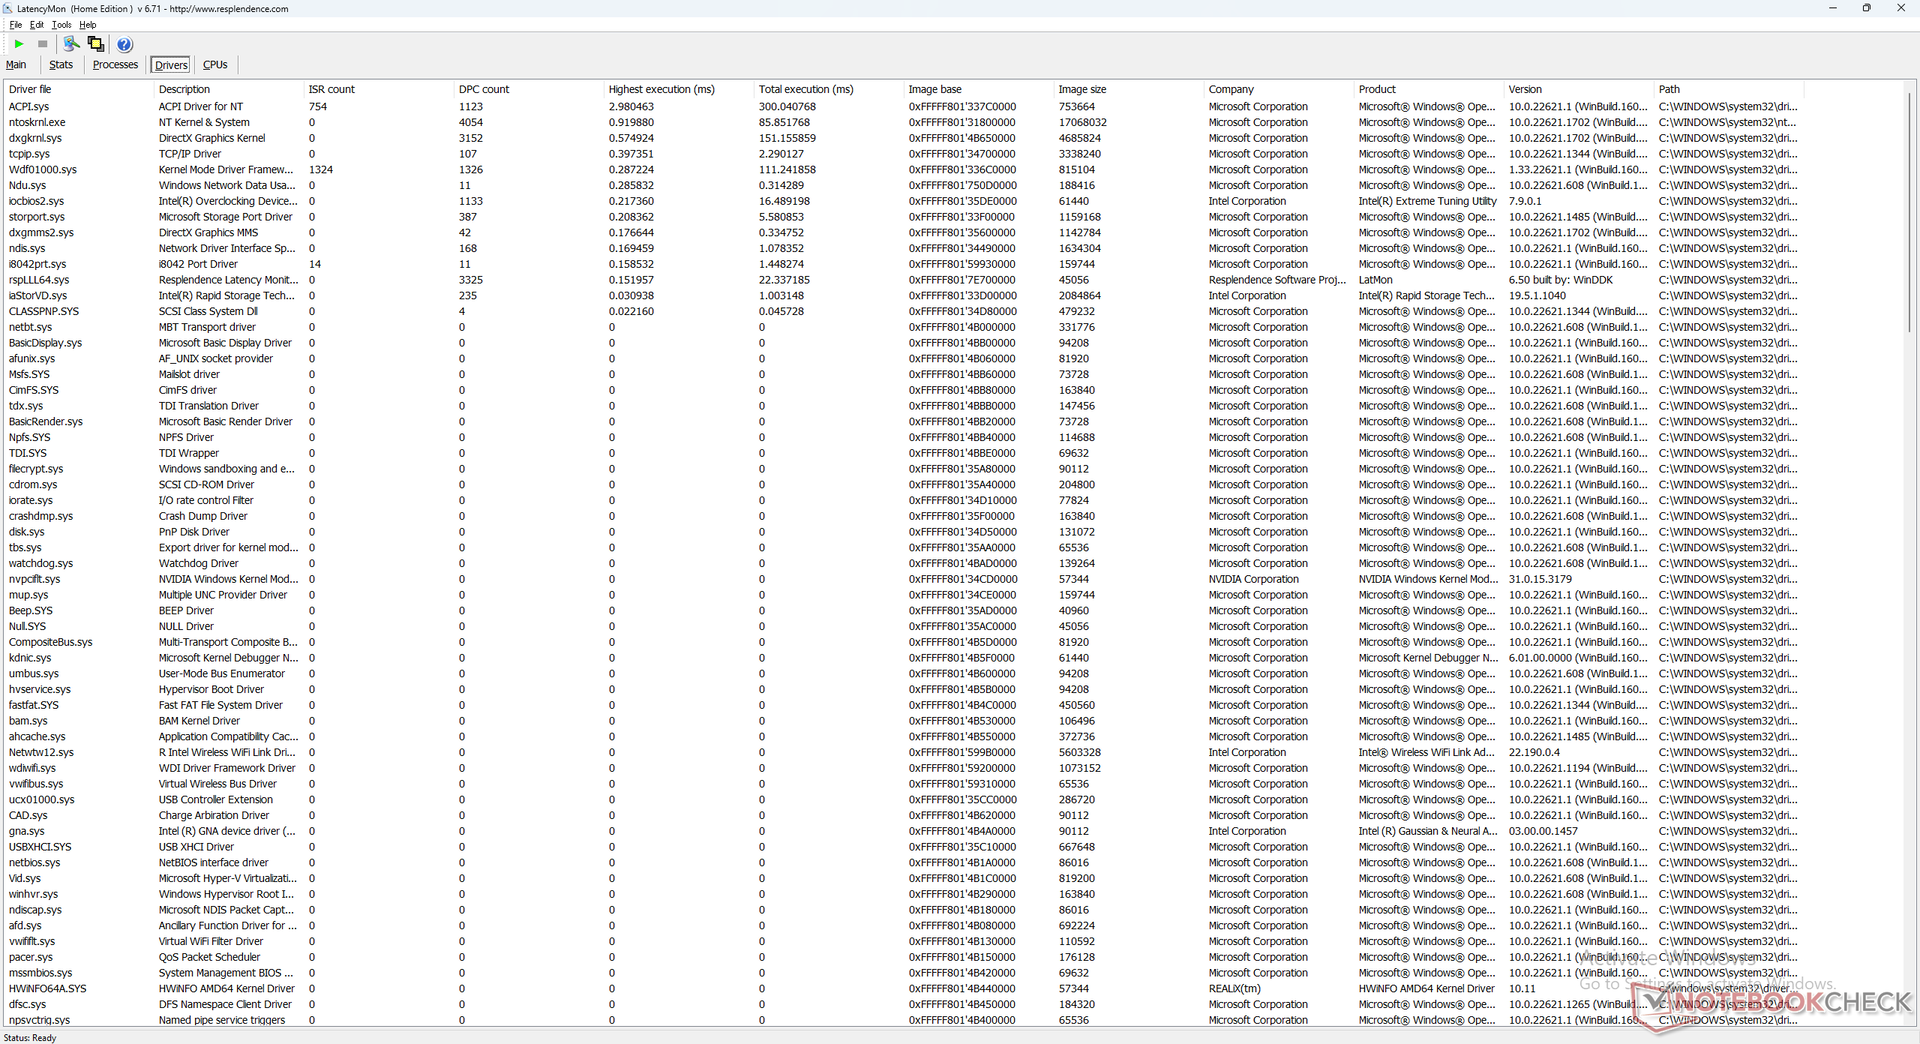
Latence DPC
LatencyMon révèle des problèmes de DPC lors de l'ouverture de plusieurs onglets de notre page d'accueil. la lecture de vidéos 4K à 60 FPS est par ailleurs parfaite, avec une faible utilisation du processeur et aucune perte d'images.
| DPC Latencies / LatencyMon - interrupt to process latency (max), Web, Youtube, Prime95 | |
| Aorus 17X AZF | |
| MSI GE78HX 13VH-070US | |
| Eurocom Raptor X17 | |
| Asus ROG Strix Scar 17 G733PY-XS96 | |
| Alienware m17 R5 (R9 6900HX, RX 6850M XT) | |
| Eluktronics Mech-17 GP2 | |
* ... Moindre est la valeur, meilleures sont les performances
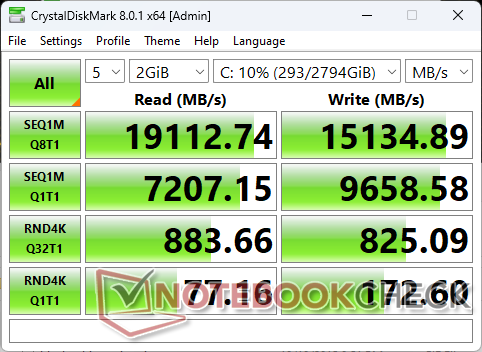
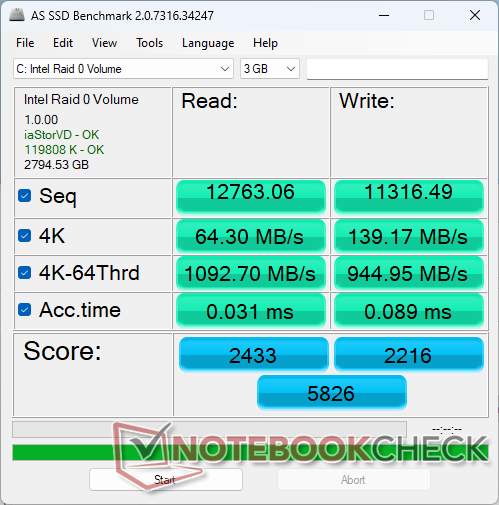
Périphériques de stockage - 3x PCIe4 x4 NVMe SSDs
Notre unité est configurée avec trois SSD Samsung 980 Pro PCIe4 x4 NVMe SSD en RAID 0 pour maximiser les performances. En fait, il s'agit de l'un des rares ordinateurs portables de jeu à prendre en charge autant de disques en configuration RAID. Les taux de transfert maximaux atteignent environ 19 000 Mo/s, mais attendez-vous à ce que les performances oscillent entre 15 000 et 18 000 Mo/s en cas de stress, ce qui est toujours impressionnant. Nous ne constatons aucun problème majeur d'étranglement à cet égard.

| Drive Performance rating - Percent | |
| Aorus 17X AZF | |
| MSI GE78HX 13VH-070US | |
| Eurocom Raptor X17 | |
| Asus ROG Strix Scar 17 G733PY-XS96 | |
| Eluktronics Mech-17 GP2 | |
| Alienware m17 R5 (R9 6900HX, RX 6850M XT) | |
* ... Moindre est la valeur, meilleures sont les performances
Disk Throttling: DiskSpd Read Loop, Queue Depth 8
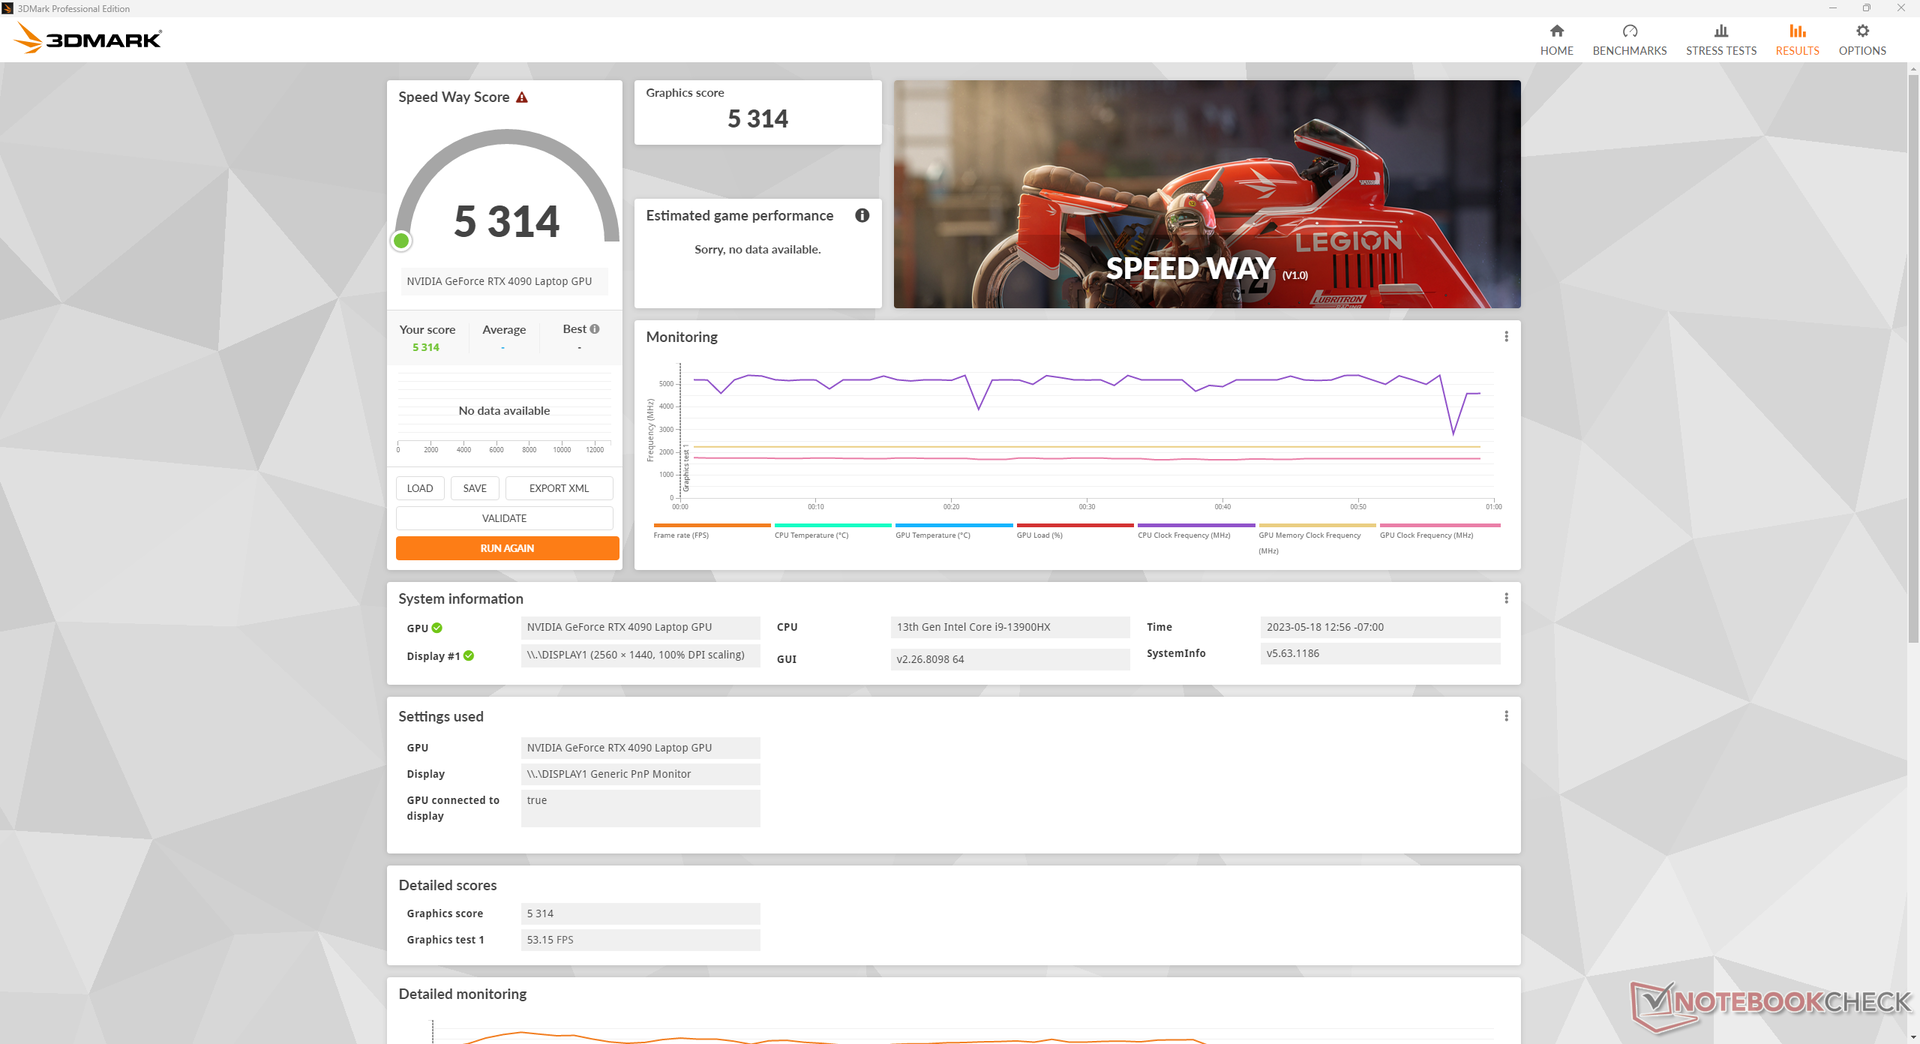
Performance du GPU - 175 W TGP Graphics
Les performances graphiques se situent à quelques points de pourcentage près par rapport à la moyenne des ordinateurs portables de notre base de données dotés de la même carte graphique même GeForce RTX 4090 GPU. L'exécution en mode Divertissement au lieu du mode Performance diminuerait les performances graphiques d'environ 4 à 5 %. Un ordinateur de bureau ordinateur de bureau GeForce RTX 4090 est toujours significativement plus rapide que notre RTX 4090 mobile d'environ 60 à 80 % en raison des lourdes limitations thermiques des GPU mobiles.
Notez que la rétrogradation vers la mobile GeForce RTX 4080 ne diminuerait les performances graphiques que de 5 à 10 %. La RTX 4080 mobile peut donc être envisagée puisque les performances sont similaires entre les deux GPU.
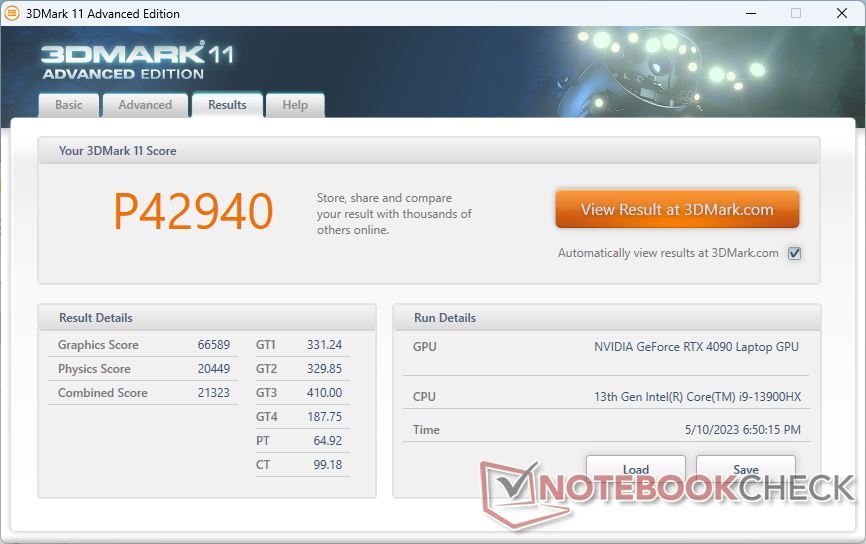
| 3DMark 11 Performance | 42940 points | |
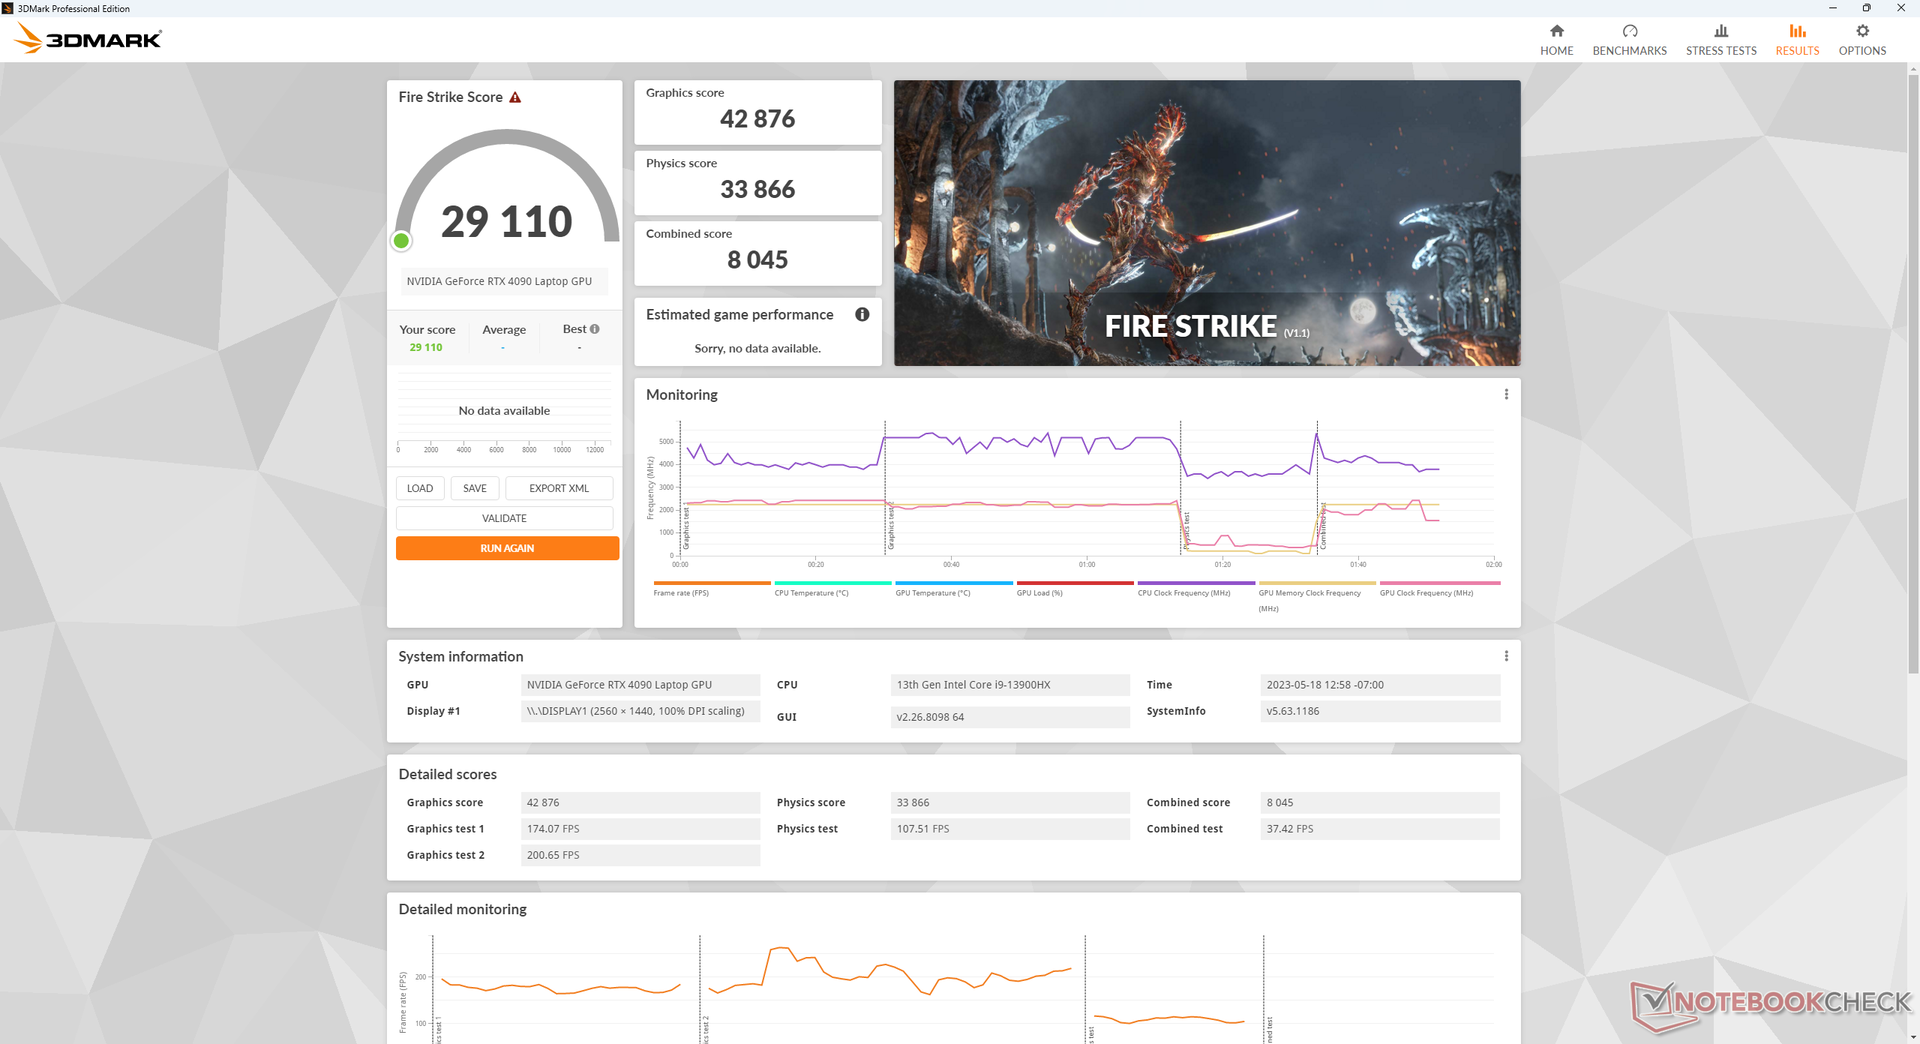
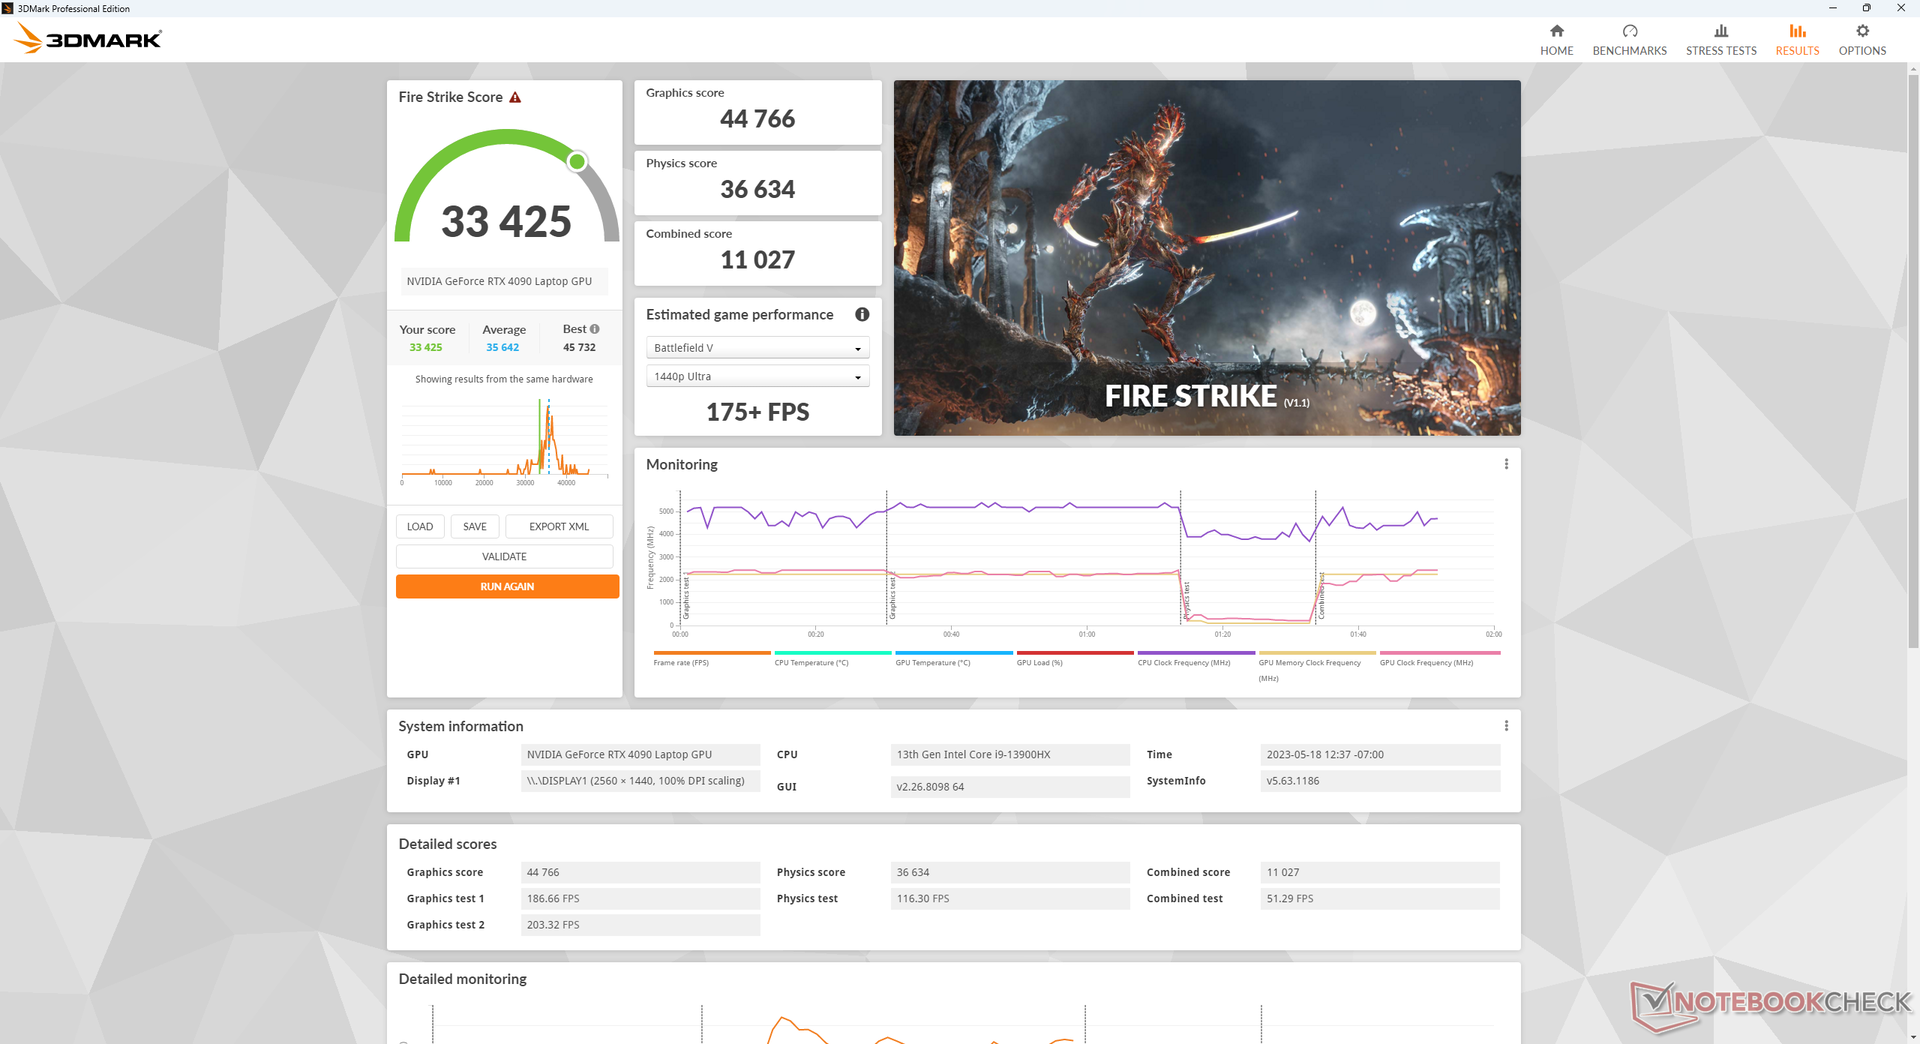
| 3DMark Fire Strike Score | 33425 points | |
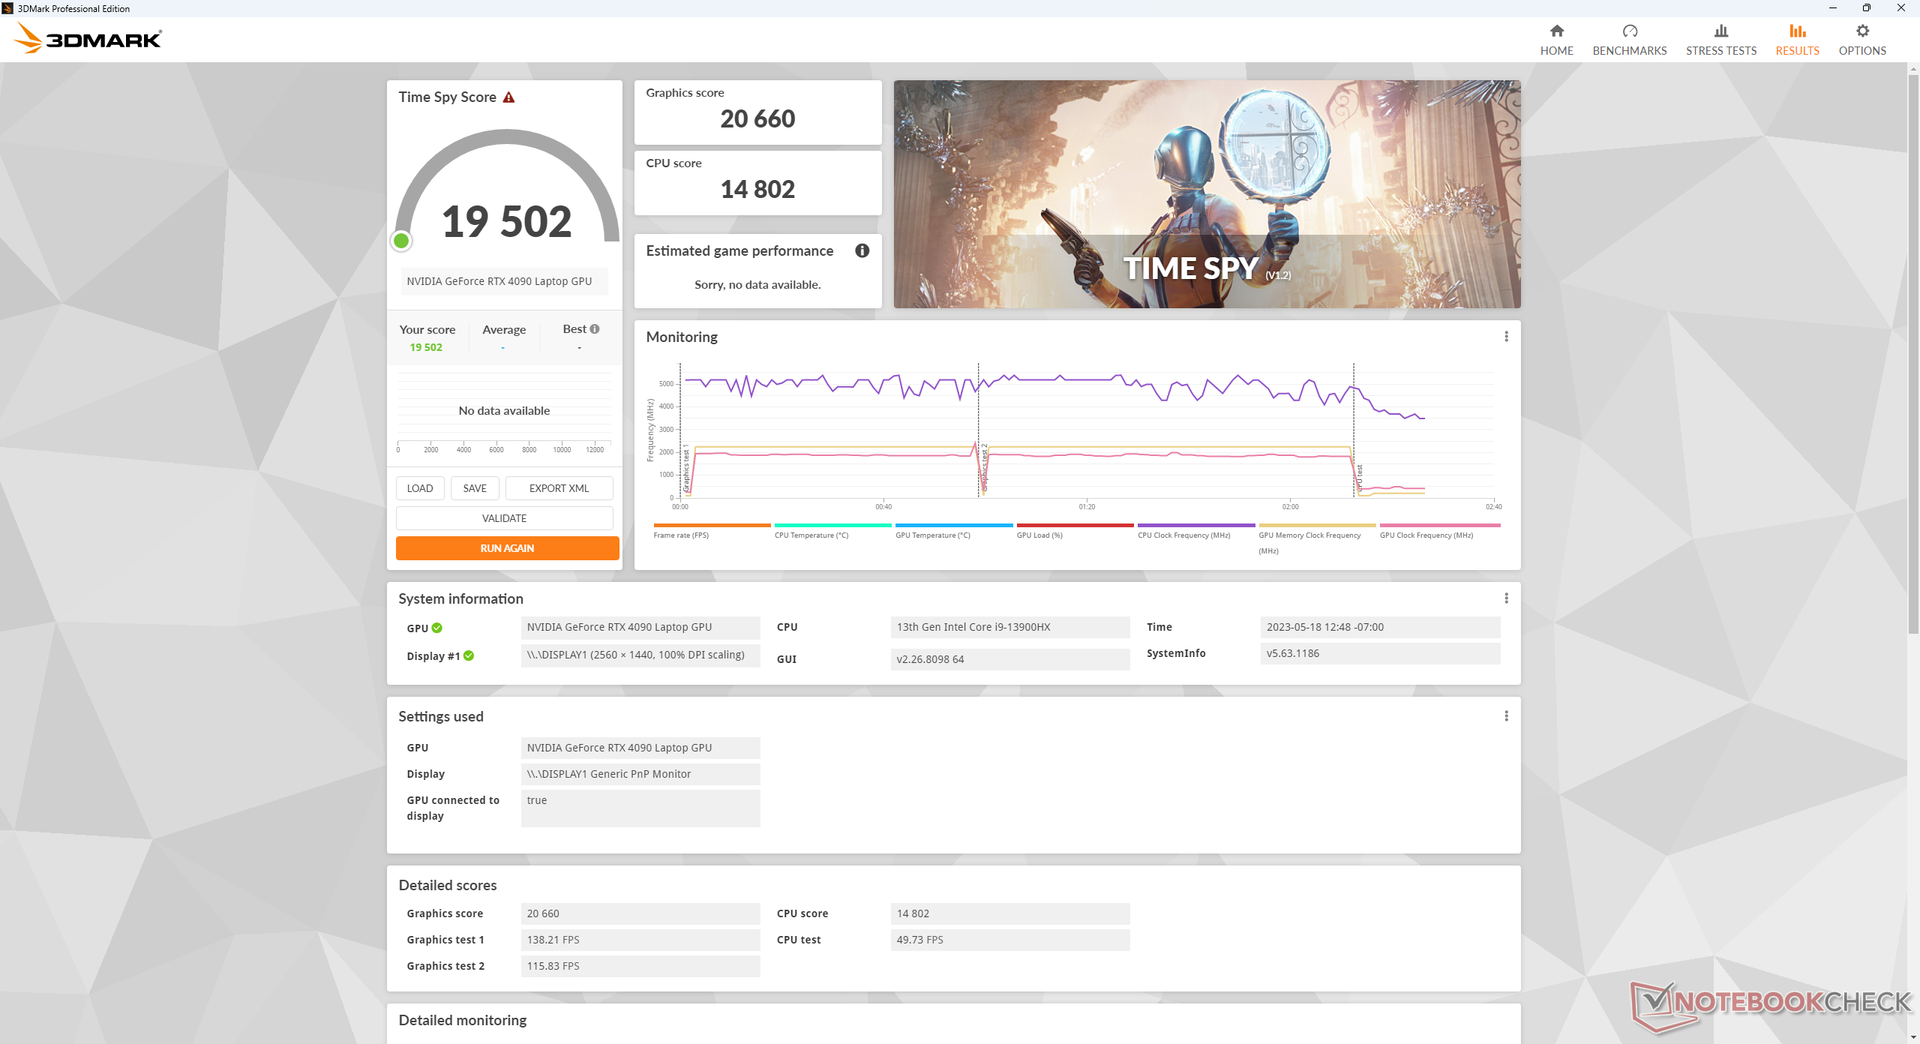
| 3DMark Time Spy Score | 19502 points | |
Aide | ||
* ... Moindre est la valeur, meilleures sont les performances
Performance des jeux
Bien que la RTX 4090 mobile soit loin d'être aussi rapide qu'une RTX 4090 de bureau, elle reste puissante même pour les titres les plus exigeants comme F1 22, Returnal, ou Cyberpunk 2077. Plus précisément, la RTX 4090 mobile semble être idéale pour cibler 1440p à 120 FPS ou 4K à 60 FPS avec des paramètres élevés à ultra. Il est préférable d'utiliser le mode dGPU ou le mode Advanced Optimus dans la mesure du possible, d'autant plus que G-Sync n'est pas disponible en mode graphique hybride.
Witcher 3 FPS Chart
| Bas | Moyen | Élevé | Ultra | QHD | 4K | |
|---|---|---|---|---|---|---|
| GTA V (2015) | 187.2 | 186.4 | 183.7 | 139.5 | 134.3 | 173.6 |
| The Witcher 3 (2015) | 512.8 | 448.8 | 388.1 | 207.2 | 163.8 | |
| Dota 2 Reborn (2015) | 234 | 207 | 199.4 | 184.9 | 178.5 | |
| Final Fantasy XV Benchmark (2018) | 219 | 204 | 172.2 | 149 | 88.8 | |
| X-Plane 11.11 (2018) | 192.9 | 172.1 | 136.2 | 117.3 | ||
| Strange Brigade (2018) | 439 | 351 | 341 | 328 | 300 | 155.2 |
| Cyberpunk 2077 1.6 (2022) | 114 | 109.4 | 103.7 | 91 | 87.3 | 47.3 |
| Tiny Tina's Wonderlands (2022) | 271.8 | 238.8 | 203.3 | 183.1 | 130.7 | 68.7 |
| F1 22 (2022) | 210 | 209 | 199 | 120.8 | 90.2 | 44.3 |
| Returnal (2023) | 145 | 153 | 159 | 141 | 115 | 69 |
Émissions
Bruit du système - Très fort lors des jeux
Les ventilateurs sont toujours actifs, quel que soit le réglage de la puissance ou la charge à l'écran. Même en mode silencieux, par exemple, le ventilateur émet un bruit minimum de 33 dB(A) sur un fond silencieux de 23 dB(A). Ce niveau est plus élevé que sur la plupart des autres ordinateurs portables de jeu et il est audible dans les environnements de bureau. En mode Performance ou Divertissement, les ventilateurs tournent régulièrement, même si l'on se contente de naviguer ou de regarder des vidéos en streaming. Dans la mesure du possible, il est préférable d'opter pour un réglage de puissance plus faible lorsque la puissance supplémentaire n'est pas nécessaire.
En mode Performance, le bruit des ventilateurs atteint presque 61 dB(A), ce qui est nettement plus fort que les ordinateurs portables de jeu concurrents tels que l'Alienware m17 R5 ou leMSI GE78HX. La plage de 50+ dB(A) est bruyante mais tolérable avec une bonne paire d'écouteurs, mais 60+ dB(A) rend extrêmement difficile de jouer à des jeux sensibles au bruit comme Fortnite ou Overwatch où les bruits de pas et autres queues audio sont vitaux pour le gameplay.
En passant du mode Performance au mode Divertissement, le bruit du ventilateur passe légèrement de 60,7 dB(A) à 59,7 dB(A). La différence est si minime que vous pouvez tout aussi bien utiliser le mode Performance lorsque vous jouez et ignorer le mode Divertissement.
Degré de la nuisance sonore
| Au repos |
| 33.1 / 33.1 / 40.7 dB(A) |
| Fortement sollicité |
| 59.9 / 61 dB(A) |
 | ||
30 dB silencieux 40 dB(A) audible 50 dB(A) bruyant |
||
min: | ||
| Eurocom Raptor X17 GeForce RTX 4090 Laptop GPU, i9-13900HX, 3x Samsung SSD 980 Pro 1TB (RAID 0) | Asus ROG Strix Scar 17 G733PY-XS96 GeForce RTX 4090 Laptop GPU, R9 7945HX, SK hynix PC801 HFS001TEJ9X101N | Aorus 17X AZF GeForce RTX 4090 Laptop GPU, i9-13900HX, Gigabyte AG470S1TB-SI B10 | MSI GE78HX 13VH-070US GeForce RTX 4080 Laptop GPU, i9-13950HX, Samsung PM9A1 MZVL22T0HBLB | Eluktronics Mech-17 GP2 GeForce RTX 4090 Laptop GPU, i9-13900HX, Samsung PM9A1 MZVL21T0HCLR | Alienware m17 R5 (R9 6900HX, RX 6850M XT) Radeon RX 6850M XT, R9 6900HX, SSSTC CA6-8D1024 | |
|---|---|---|---|---|---|---|
| Noise | 22% | 10% | 16% | 16% | 23% | |
| arrêt / environnement * (dB) | 23.3 | 22.7 3% | 25 -7% | 23.4 -0% | 25.2 -8% | 23 1% |
| Idle Minimum * (dB) | 33.1 | 23.5 29% | 28 15% | 24.2 27% | 28 15% | 23 31% |
| Idle Average * (dB) | 33.1 | 27.7 16% | 29 12% | 25.6 23% | 28 15% | 28.11 15% |
| Idle Maximum * (dB) | 40.7 | 27.7 32% | 34 16% | 31 24% | 30.4 25% | 28.11 31% |
| Load Average * (dB) | 59.9 | 30.5 49% | 51 15% | 43.3 28% | 41 32% | 30.62 49% |
| Witcher 3 ultra * (dB) | 60.8 | 51.4 15% | 57 6% | 56.3 7% | 50.7 17% | 49.75 18% |
| Load Maximum * (dB) | 61 | 54.1 11% | 54 11% | 59.1 3% | 52.6 14% | 50.17 18% |
* ... Moindre est la valeur, meilleures sont les performances
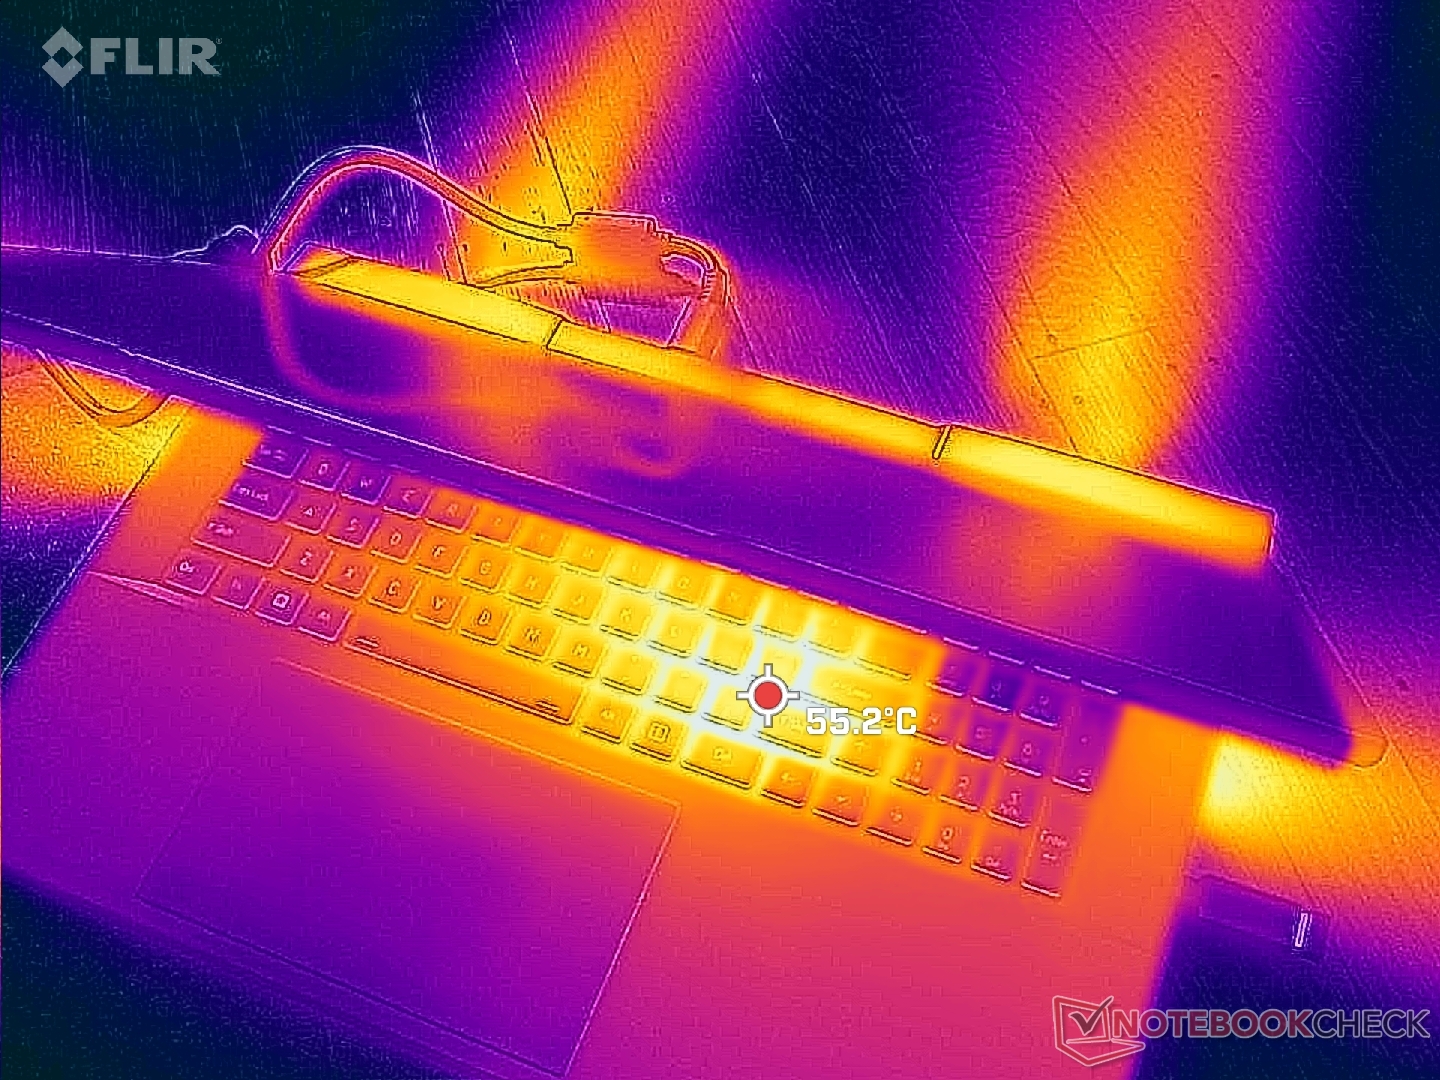
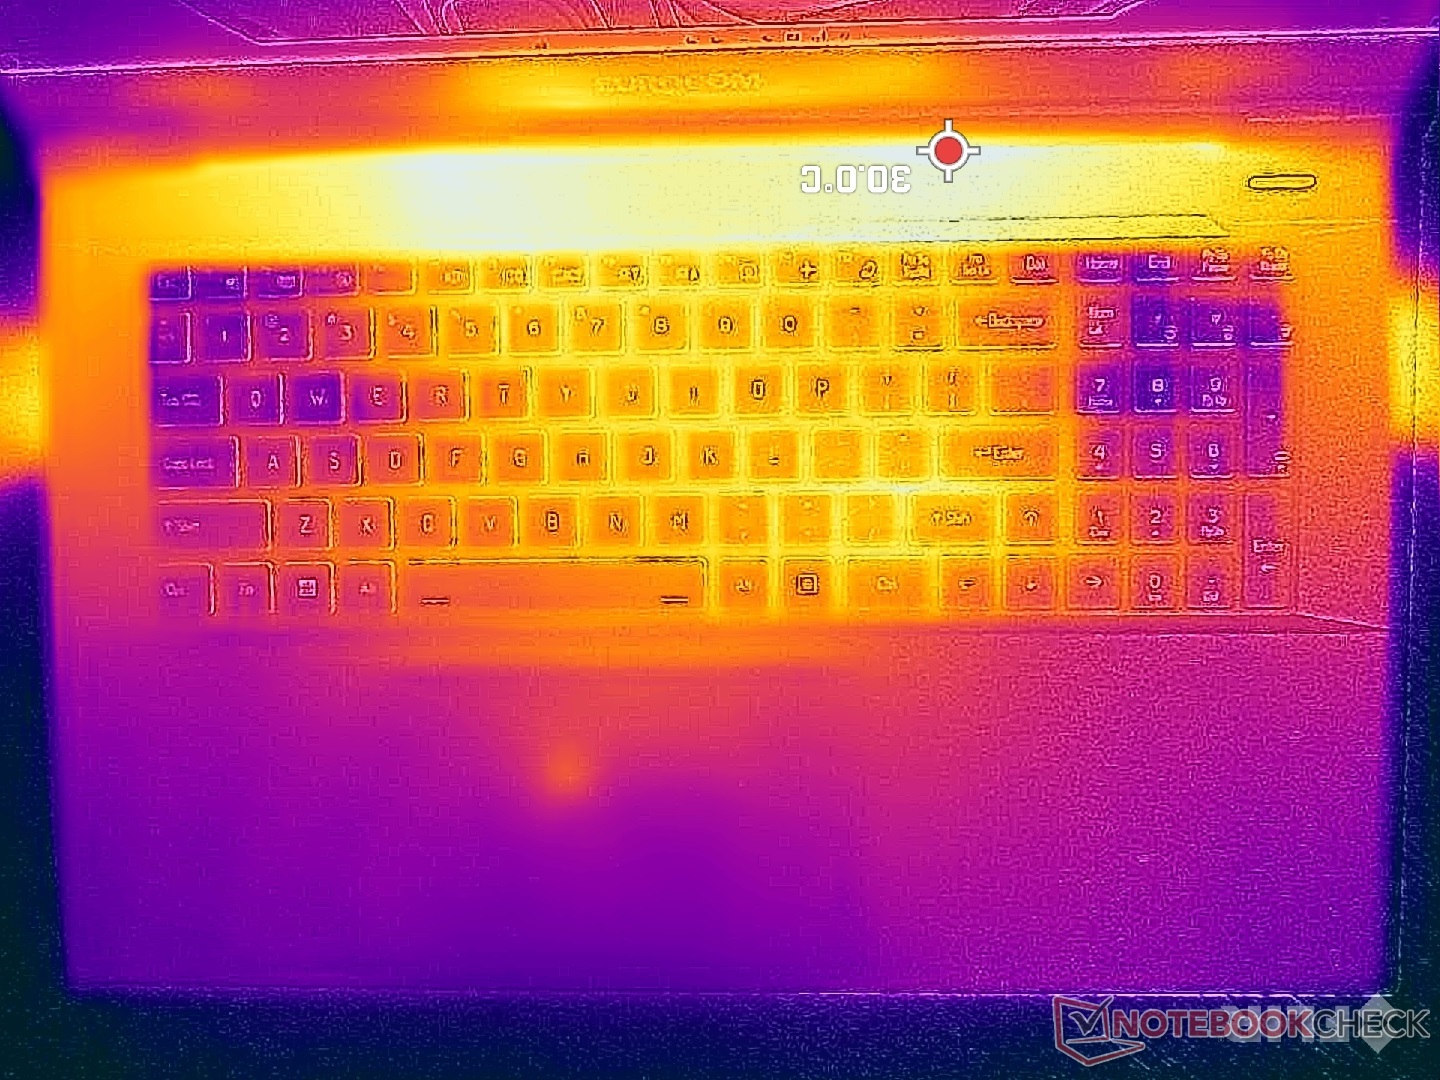
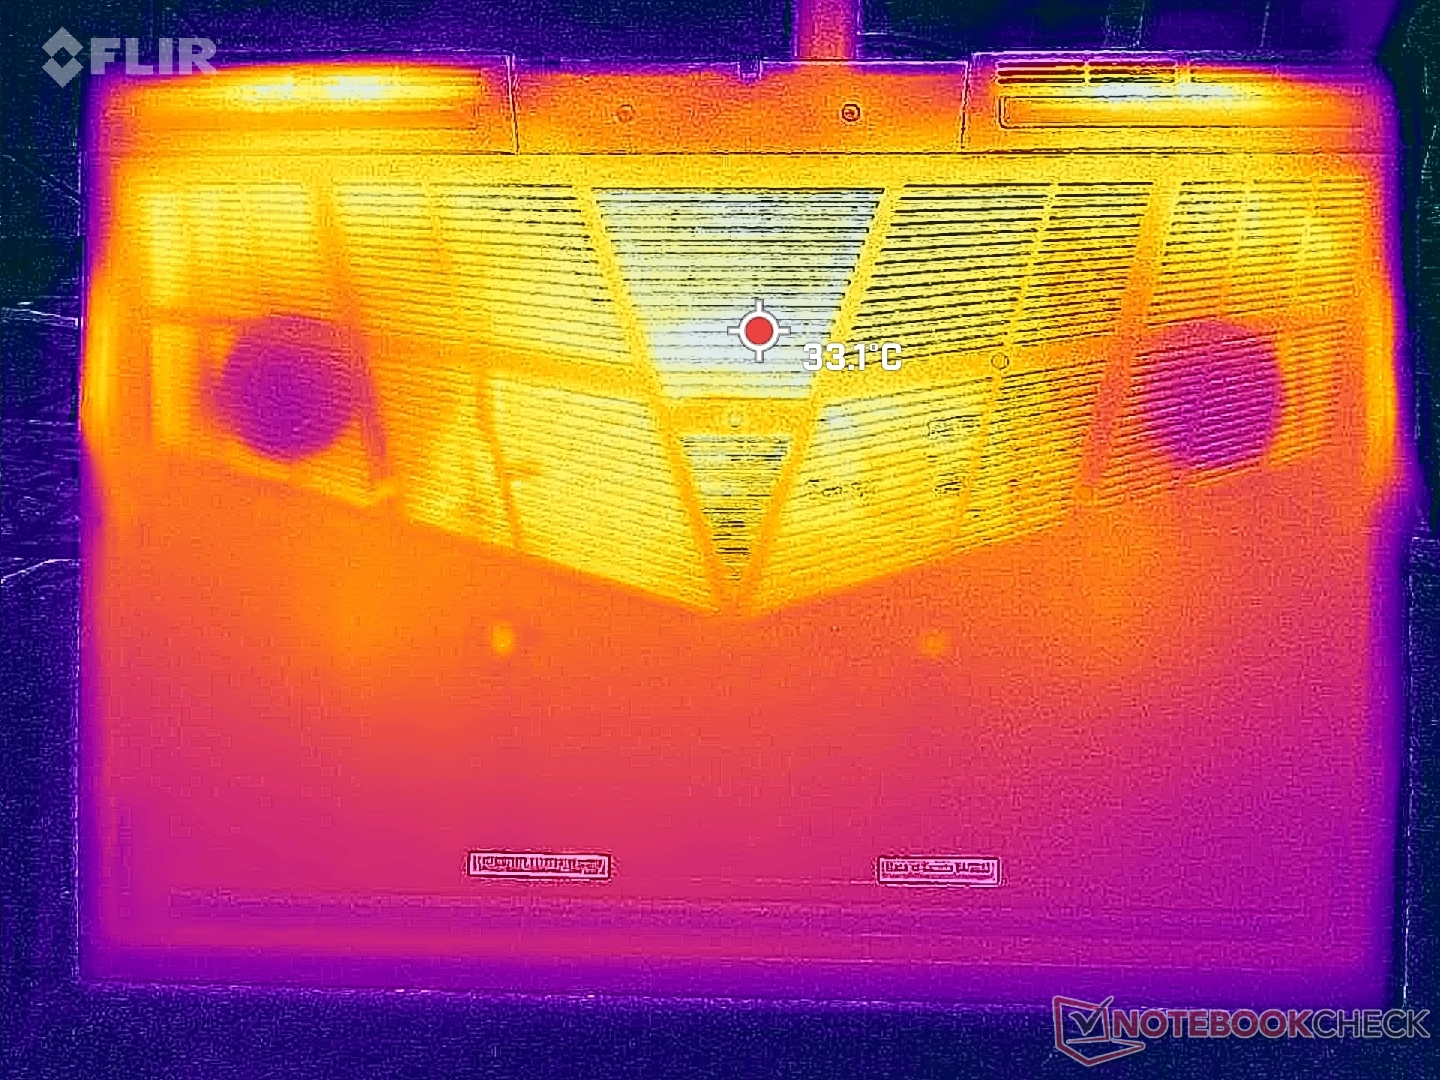
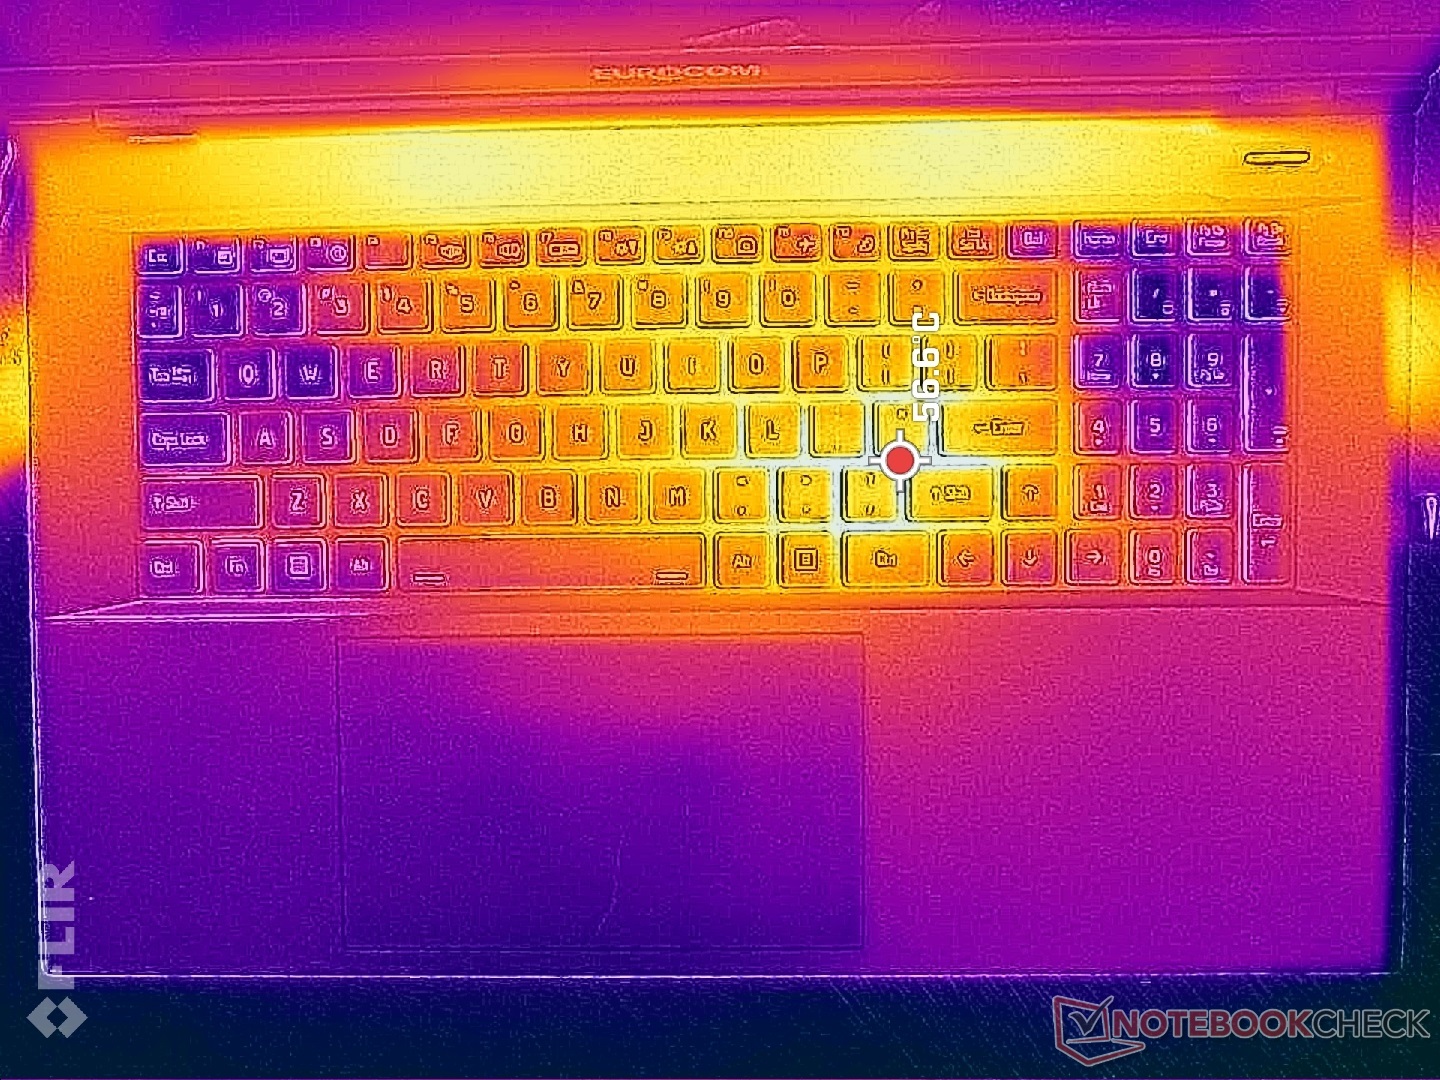
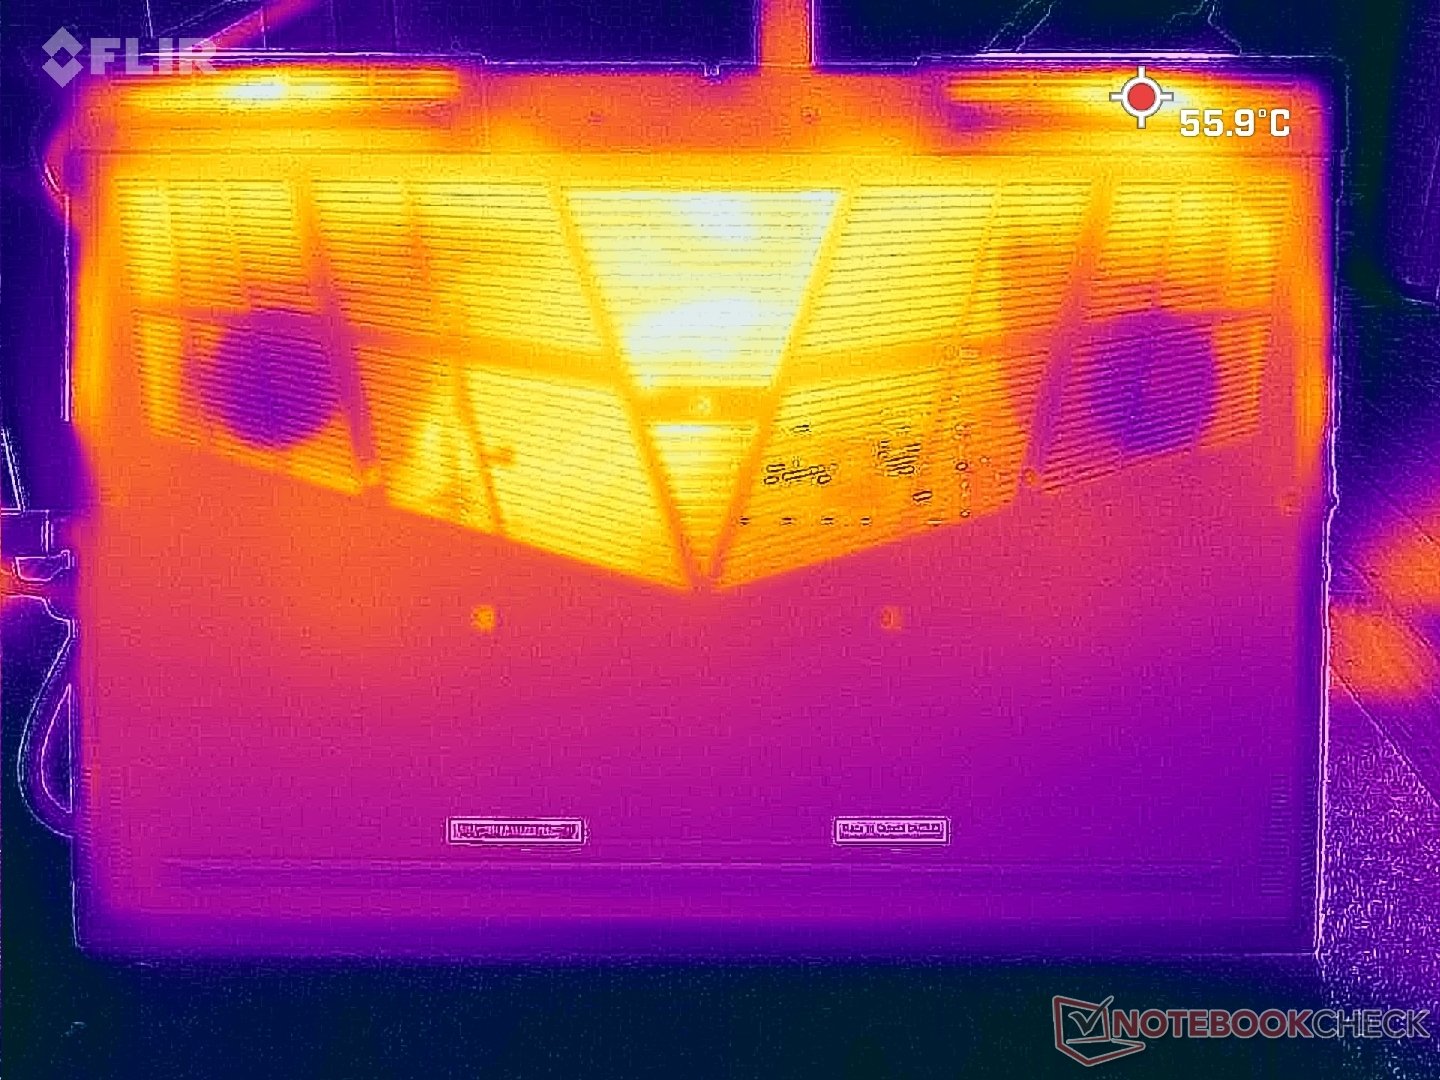
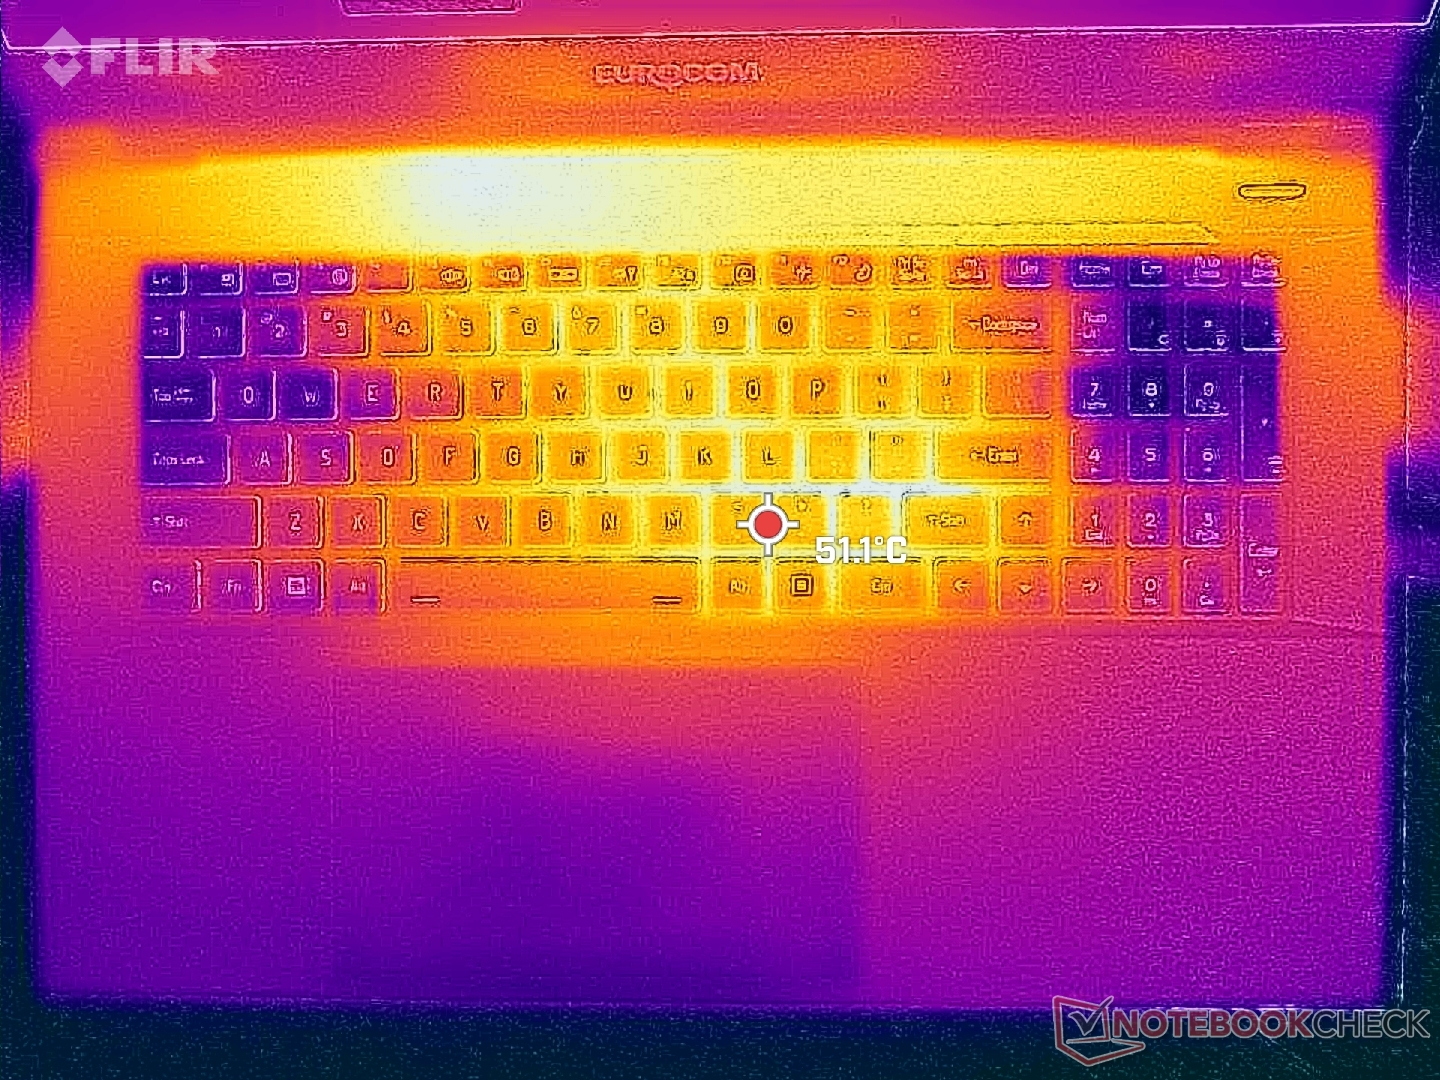
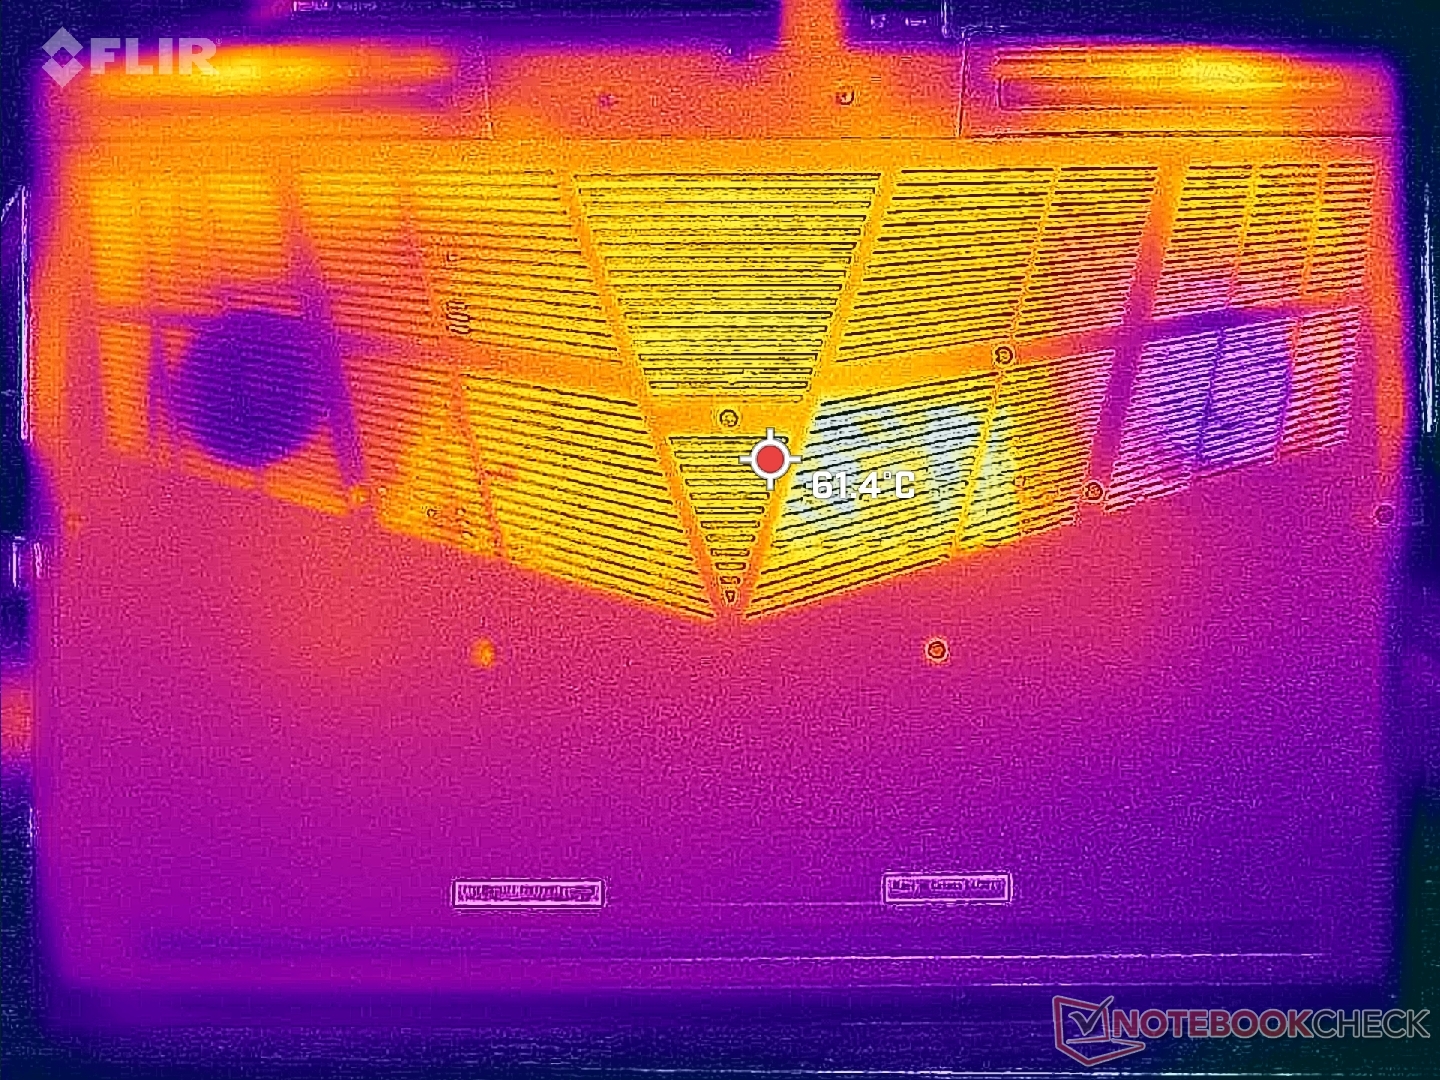
Température
Les températures de surface sont les plus élevées au centre du clavier, car le processeur et le processeur graphique se trouvent directement en dessous. Les points chauds peuvent atteindre plus de 56°C dans cette région, contre 46°C et 35°C sur l'Aorus 17X.Aorus 17X et MSI Raider GE78 HX, respectivement. Heureusement, les appuis palmaires, les touches WASD et les zones du pavé numérique ne sont pas aussi chauds, ce qui permet de garder les mains à l'aise pendant le jeu.
(-) La température maximale du côté supérieur est de 49.4 °C / 121 F, par rapport à la moyenne de 40.4 °C / 105 F, allant de 21.2 à 68.8 °C pour la classe Gaming.
(-) Le fond chauffe jusqu'à un maximum de 55.2 °C / 131 F, contre une moyenne de 43.2 °C / 110 F
(+) En utilisation inactive, la température moyenne du côté supérieur est de 28.8 °C / 84 F, par rapport à la moyenne du dispositif de 33.9 °C / 93 F.
(-) En jouant à The Witcher 3, la température moyenne du côté supérieur est de 40.4 °C / 105 F, alors que la moyenne de l'appareil est de 33.9 °C / 93 F.
(+) Les repose-poignets et le pavé tactile sont plus froids que la température de la peau avec un maximum de 31.2 °C / 88.2 F et sont donc froids au toucher.
(-) La température moyenne de la zone de l'appui-paume de dispositifs similaires était de 28.8 °C / 83.8 F (-2.4 °C / #-4.4 F).
| Eurocom Raptor X17 Intel Core i9-13900HX, NVIDIA GeForce RTX 4090 Laptop GPU | Asus ROG Strix Scar 17 G733PY-XS96 AMD Ryzen 9 7945HX, NVIDIA GeForce RTX 4090 Laptop GPU | Aorus 17X AZF Intel Core i9-13900HX, NVIDIA GeForce RTX 4090 Laptop GPU | MSI GE78HX 13VH-070US Intel Core i9-13950HX, NVIDIA GeForce RTX 4080 Laptop GPU | Eluktronics Mech-17 GP2 Intel Core i9-13900HX, NVIDIA GeForce RTX 4090 Laptop GPU | Alienware m17 R5 (R9 6900HX, RX 6850M XT) AMD Ryzen 9 6900HX, AMD Radeon RX 6850M XT | |
|---|---|---|---|---|---|---|
| Heat | 24% | 8% | 14% | 15% | 4% | |
| Maximum Upper Side * (°C) | 49.4 | 34.6 30% | 47 5% | 37.4 24% | 39 21% | 53 -7% |
| Maximum Bottom * (°C) | 55.2 | 35.6 36% | 51 8% | 45 18% | 44 20% | 56 -1% |
| Idle Upper Side * (°C) | 33.4 | 27.2 19% | 30 10% | 29.8 11% | 31 7% | 30 10% |
| Idle Bottom * (°C) | 33.4 | 30 10% | 31 7% | 32.4 3% | 29.8 11% | 29 13% |
* ... Moindre est la valeur, meilleures sont les performances
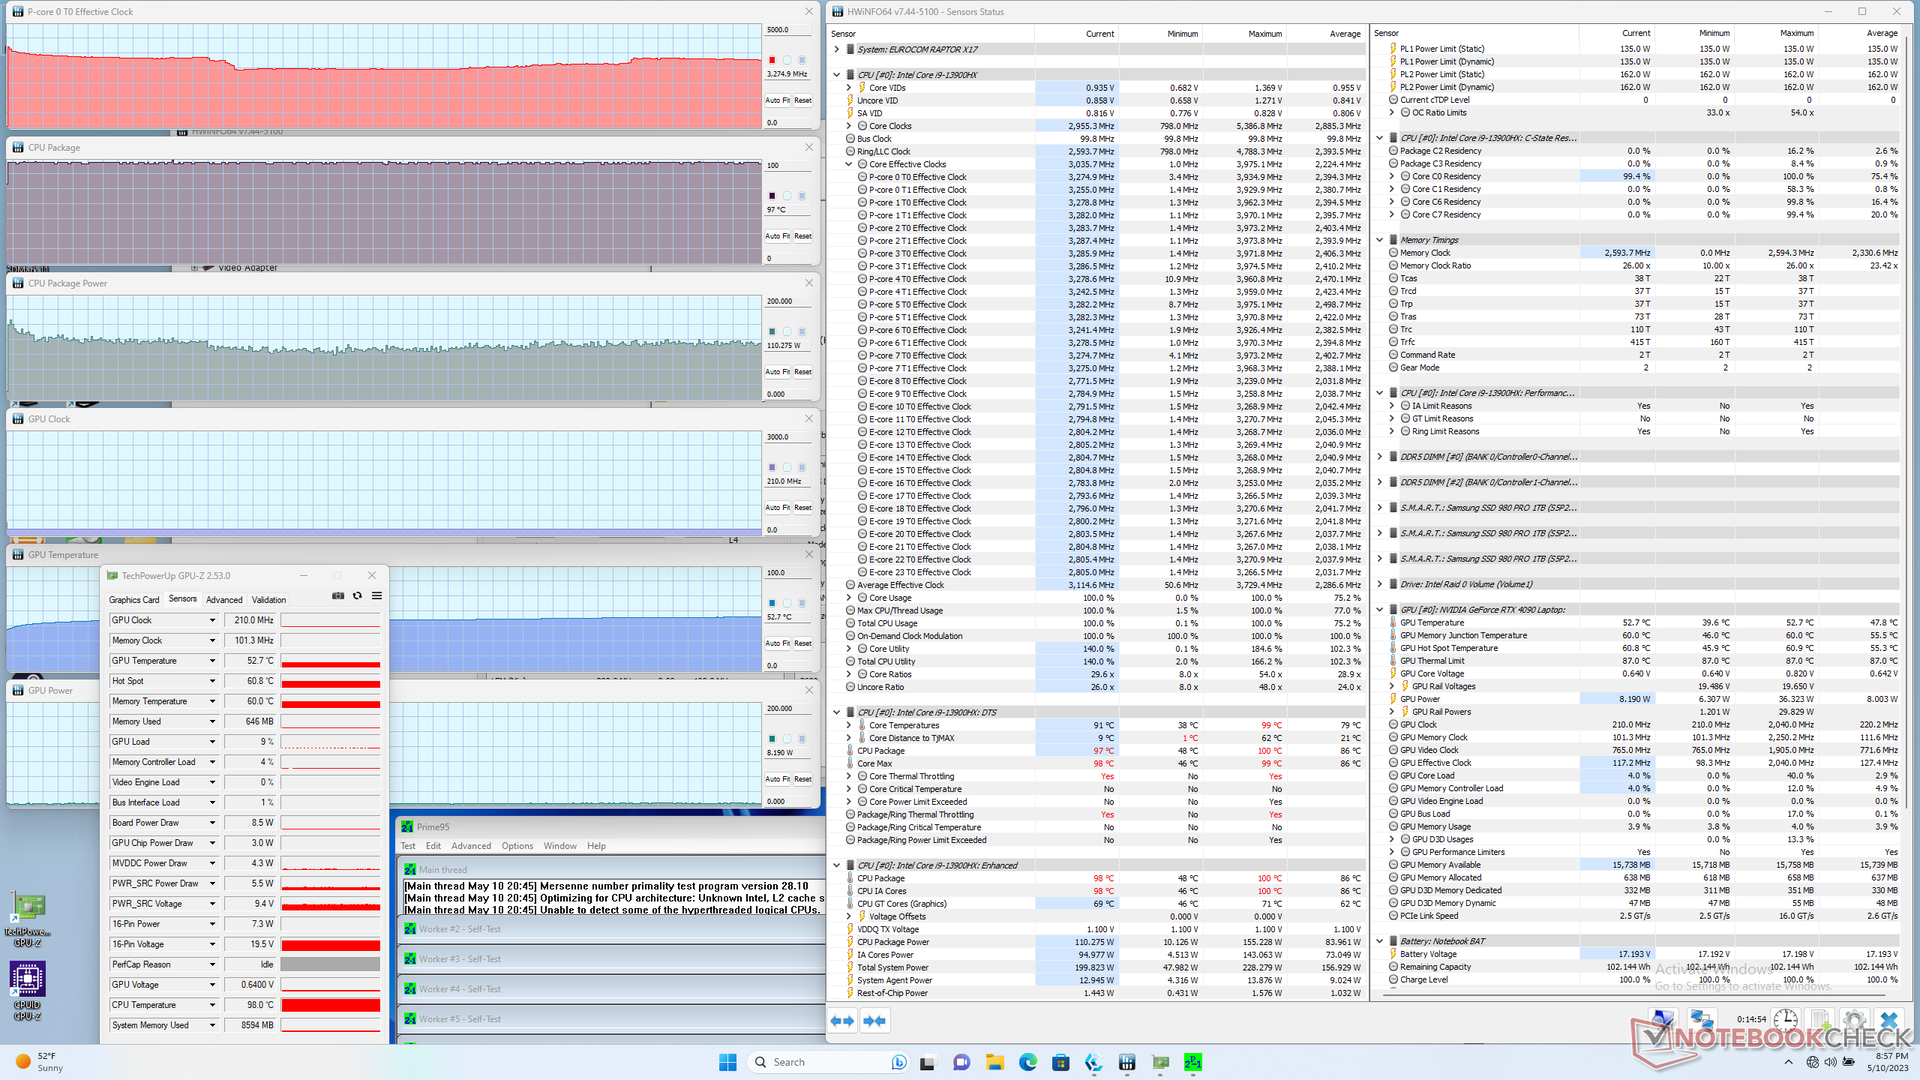
Test de stress
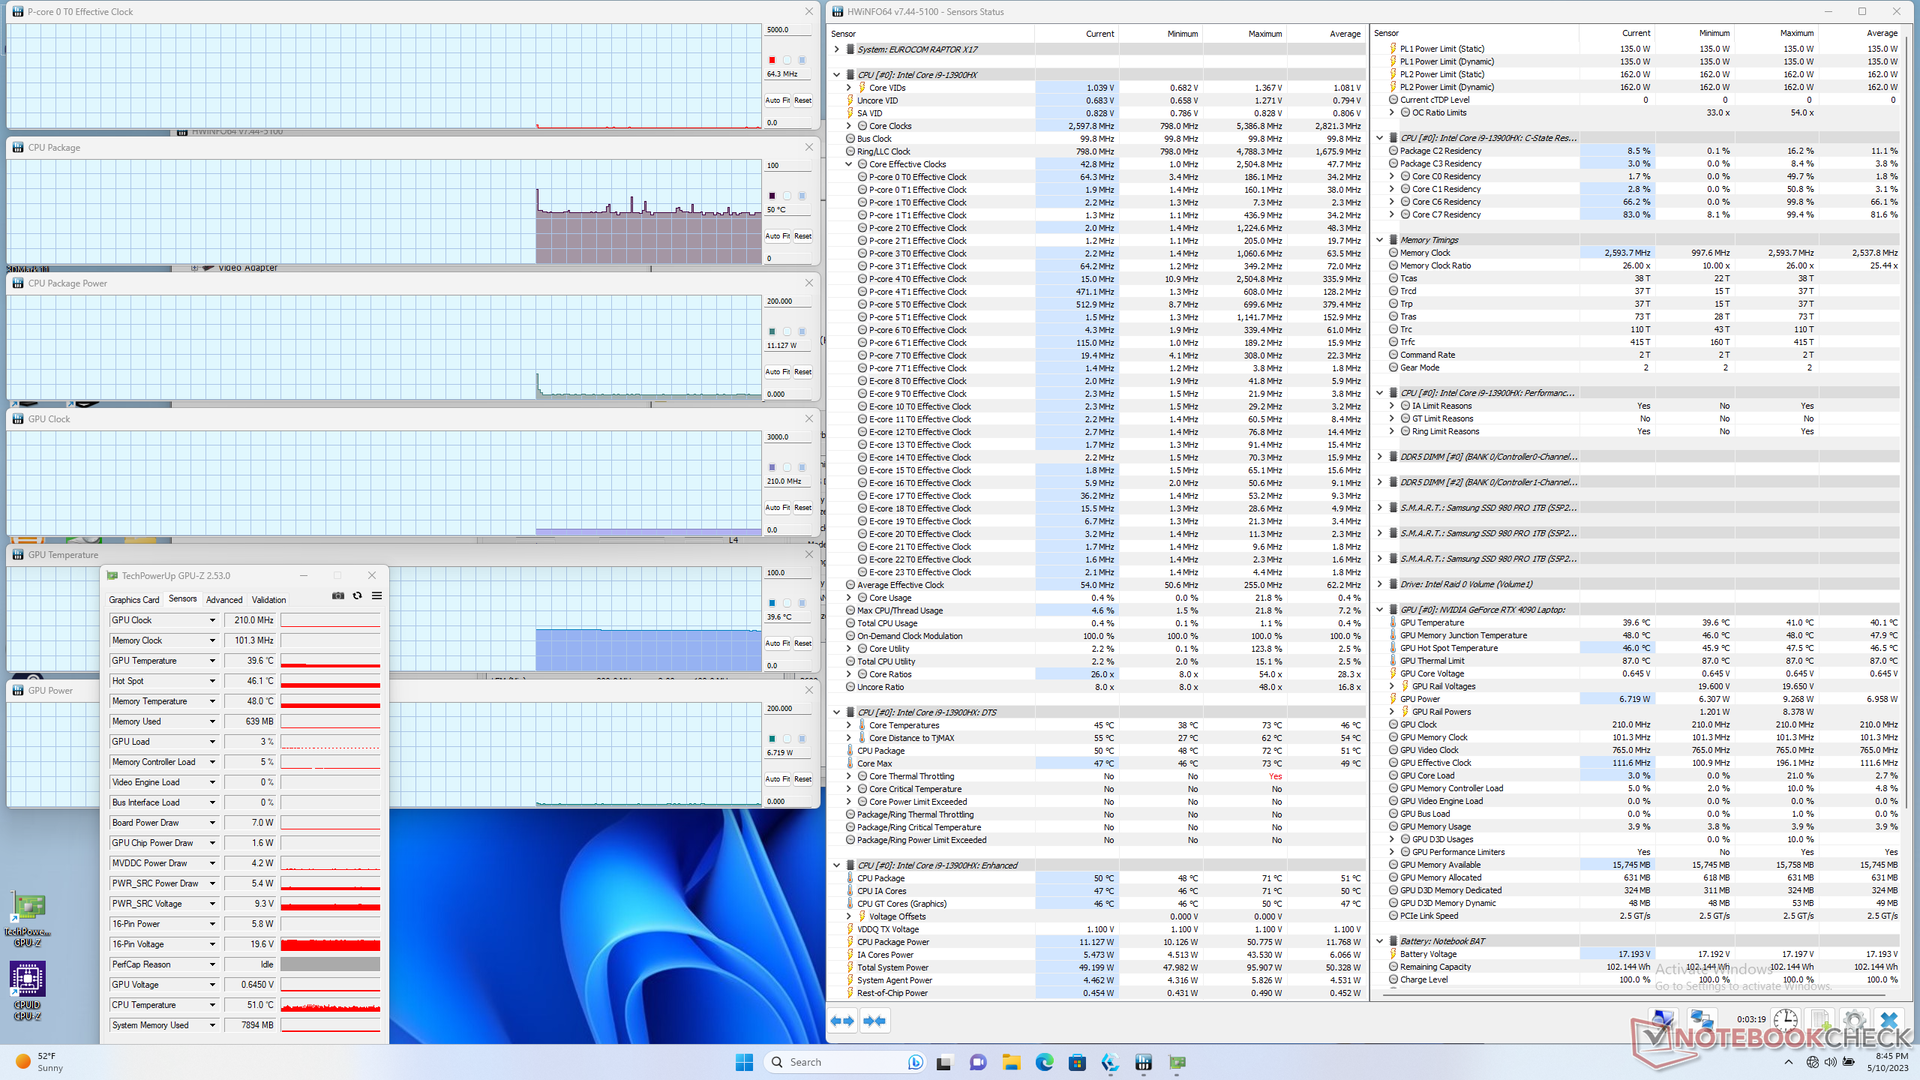
Lors de l'exécution de Prime95 pour stresser le CPU, les fréquences d'horloge et la consommation d'énergie de la carte montaient jusqu'à 4 GHz et 155 W, respectivement, pendant un moment avant de redescendre rapidement à 3,3 GHz et 110 W. La température du cœur reste très élevée (97 °C), ce qui explique probablement l'éphémère Turbo Boost maximal. En répétant ce test sur le MSI GE78HX ou le Eluktronics Mech-17 GP2 auraient obtenu des températures similaires de plus de 90°C, ce qui suggère que la plupart des processeurs de la série H de la 13ème génération sont généralement plus chauds que la moyenne lorsqu'ils sont en charge.
En mode Witcher 3 en mode Performance pour représenter des charges de jeu typiques, le GPU se stabiliserait à 2235 MHz, 81 C, et 170 W de consommation d'énergie pour un objectif TGP de 175 W. En réglant le système en mode Équilibré (ou mode Divertissement), le GPU tomberait à 2055 MHz, 76 C, et seulement 146 W. Vous devrez donc activer le mode Performance et supporter son bruit de ventilateur plus fort si vous souhaitez tirer le meilleur parti du GPU.
L'utilisation de la batterie limite les performances. Un test Fire Strike sur batterie donnerait des scores en physique et en graphique de 12863 et 10075 points, respectivement, contre 36634 et 44766 points sur secteur.
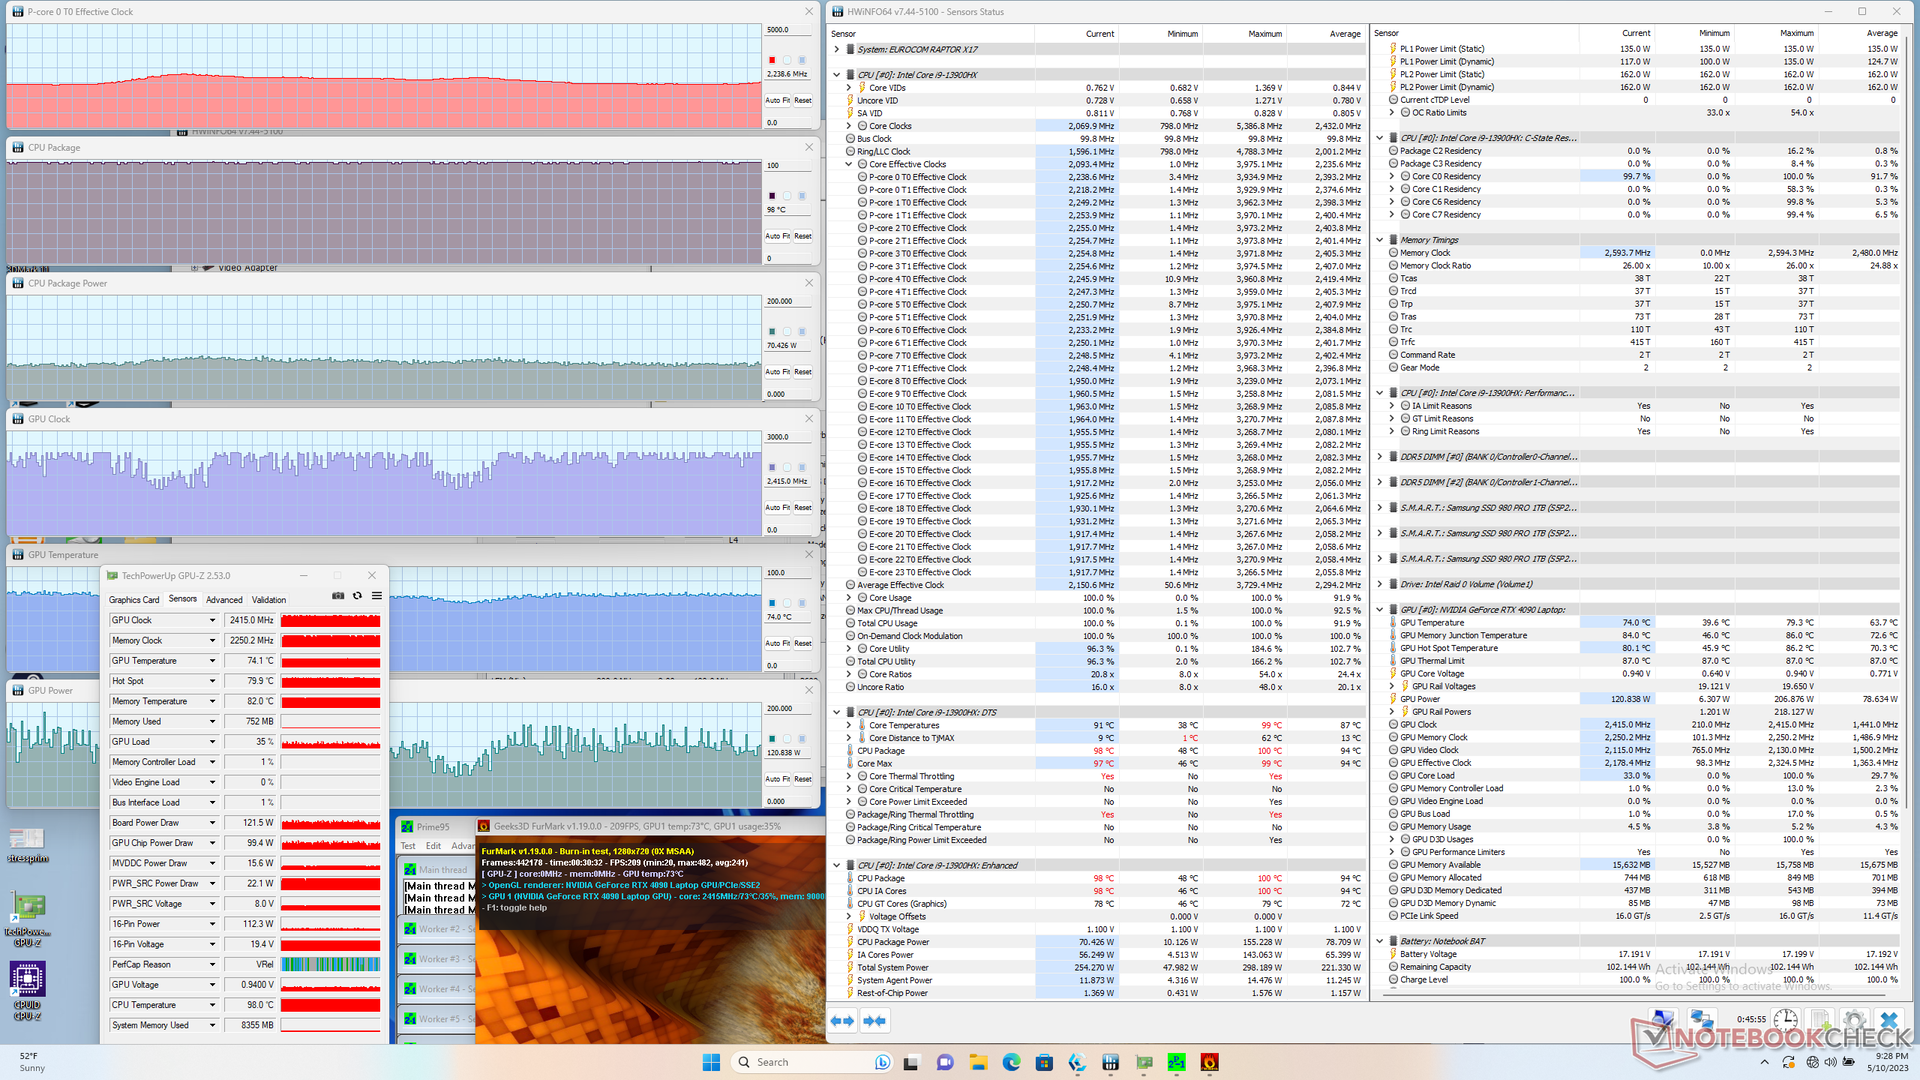

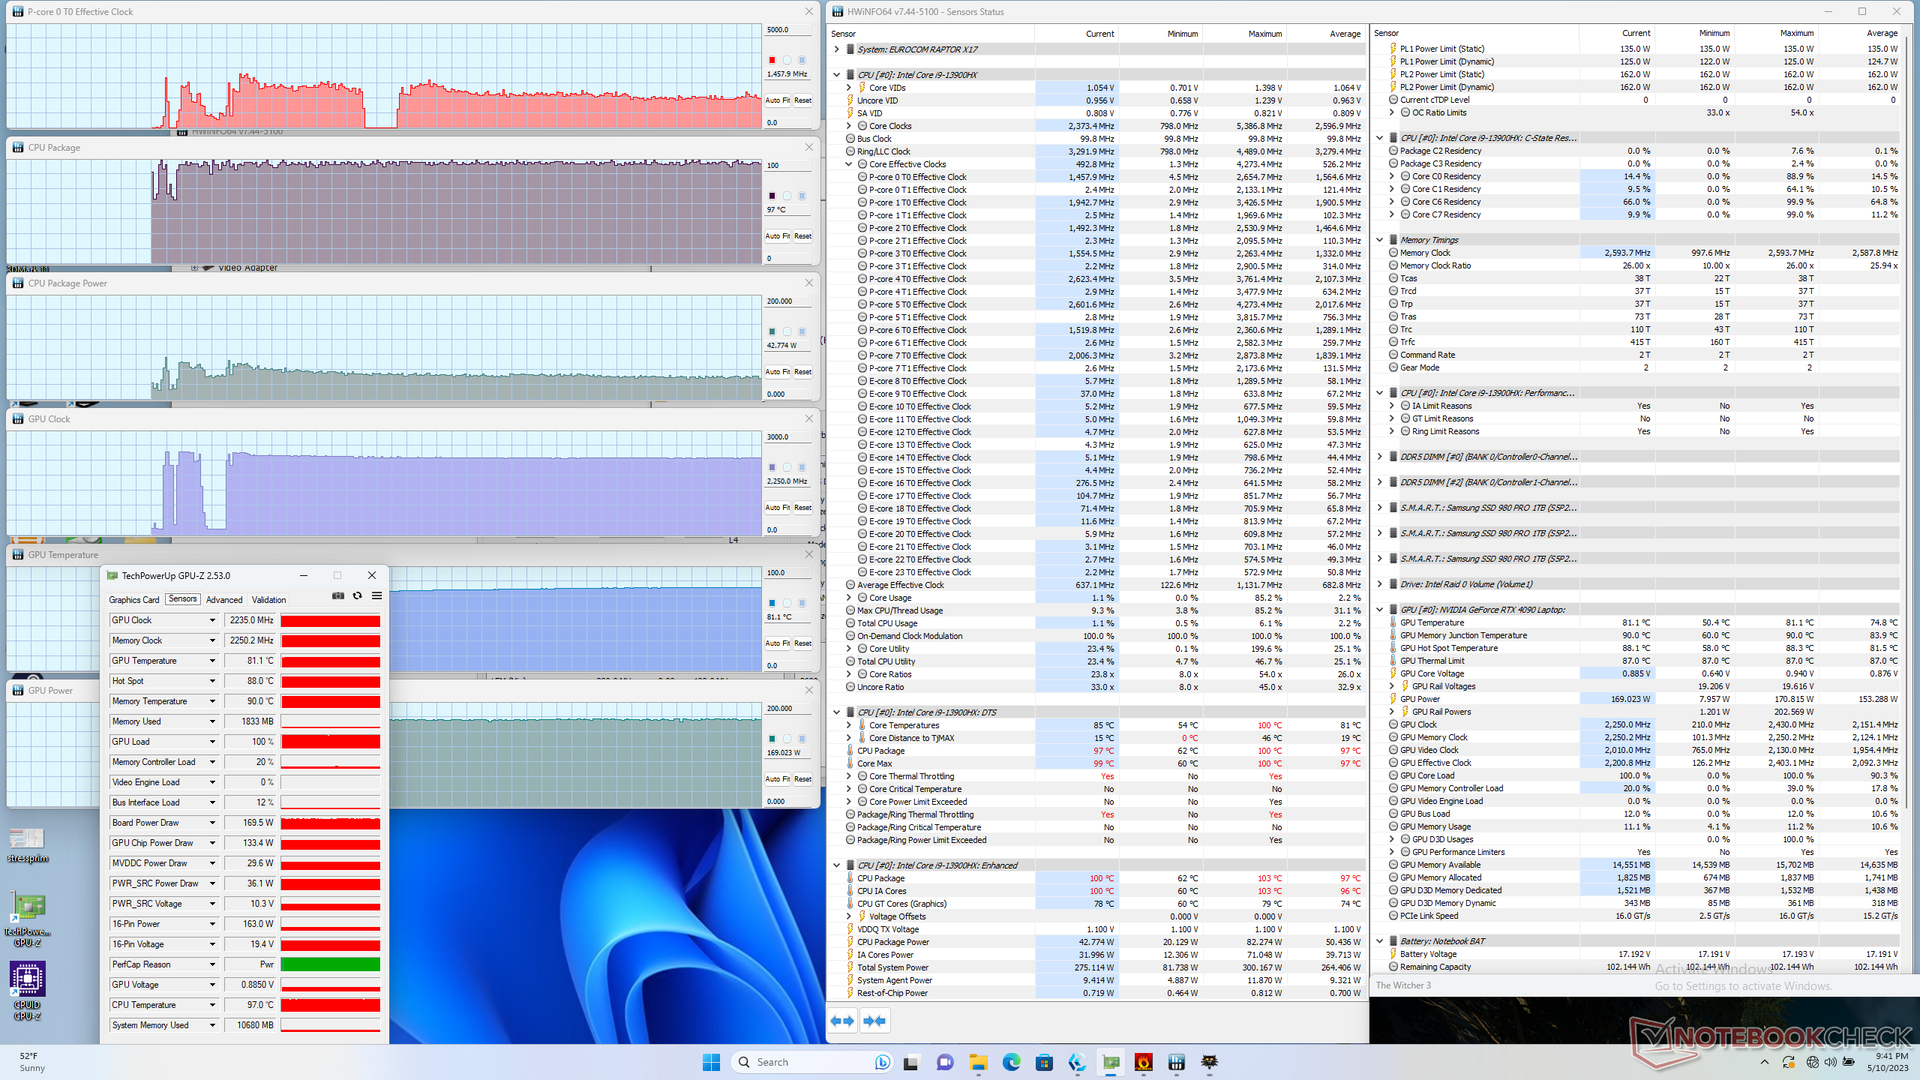
| Horloge du CPU (GHz) | Horloge du GPU (MHz) | Température moyenne du CPU (°C) | Température moyenne du GPU (°C) | |
| Système au repos | -- | -- | 50 | 40 |
| Prime95 Stress | 3.3 | -- | 97 | 53 |
| Prime95 + FurMark Stress | 2.2 | 840 - 2400 | 98 | 74 |
| Witcher 3 Stress(mode équilibré) | 1.4 | 2055 | 92 | 76 |
| Witcher 3 Stress (mode Performance) | 1.5 | 2250 | 97 | 81 |
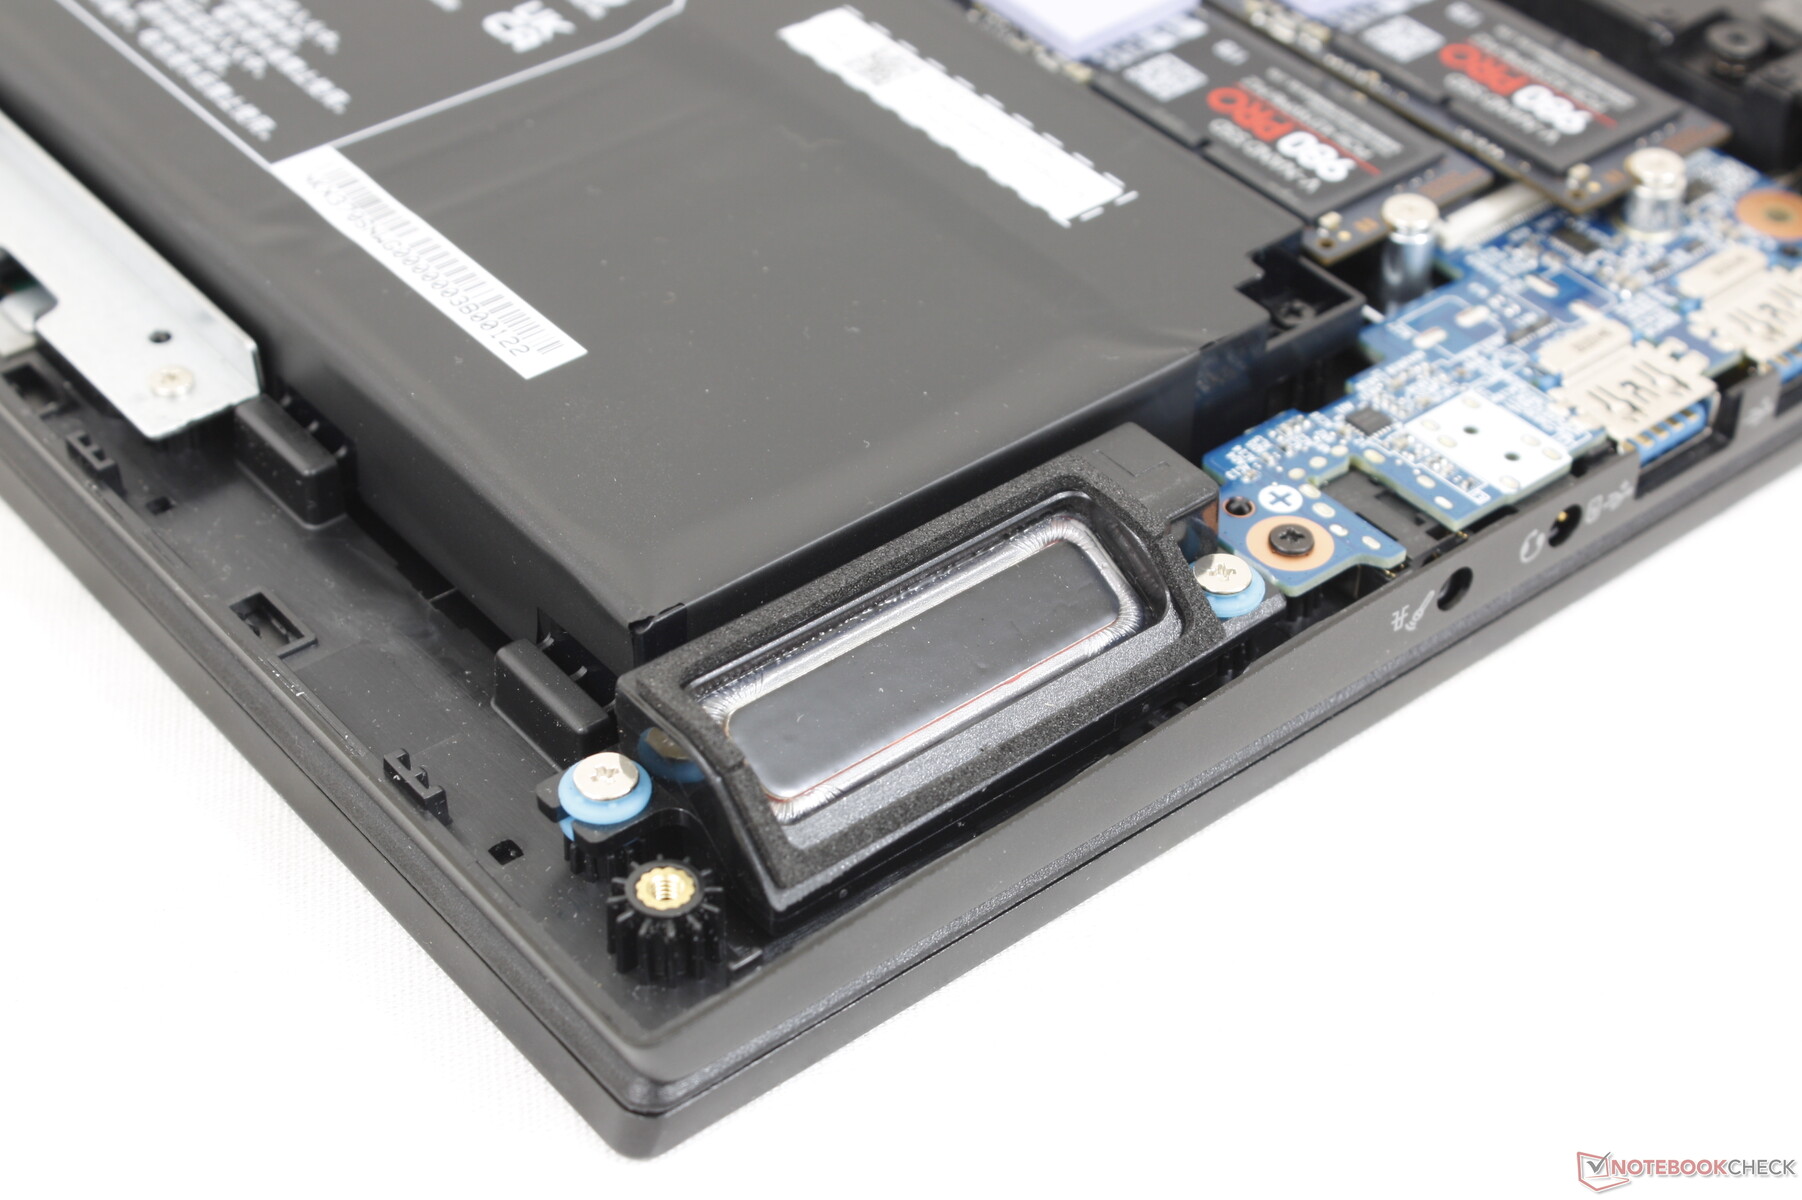
Intervenants
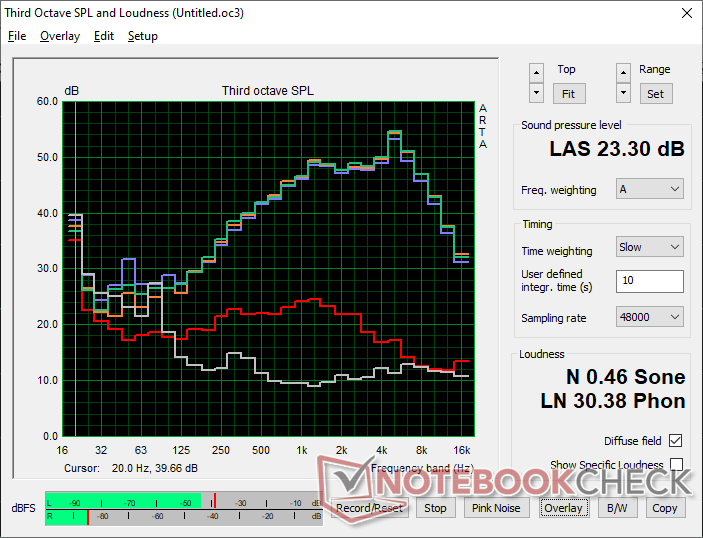
Les haut-parleurs intégrés sont décevants. Non seulement la reproduction des basses est médiocre, mais le volume maximal de 71 dB(A) est nettement plus faible que celui de la plupart des autres ordinateurs portables de jeu, qui atteignent généralement 80 dB(A) ou plus. C'est un peu comme si on avait rogné sur le design de ce nouveau châssis.
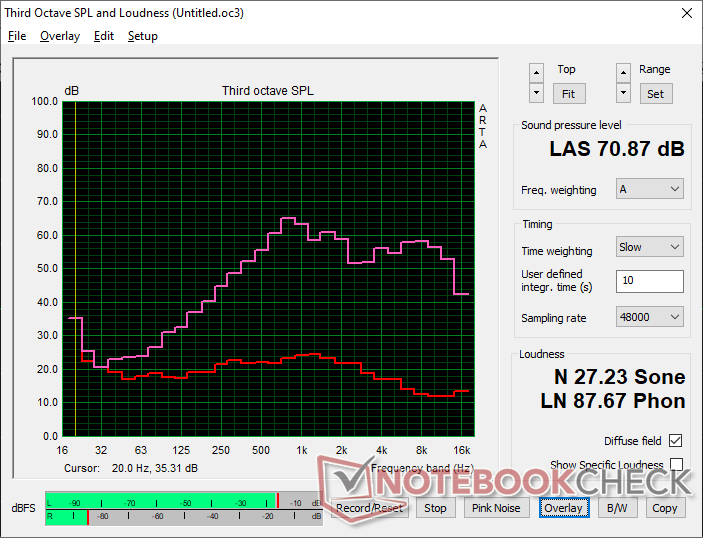
Eurocom Raptor X17 analyse audio
(-) | haut-parleurs pas très forts (70.9 dB)
Basses 100 - 315 Hz
(-) | presque aucune basse - en moyenne 15.5% plus bas que la médiane
(±) | la linéarité des basses est moyenne (10.3% delta à la fréquence précédente)
Médiums 400 - 2000 Hz
(±) | médiane supérieure - en moyenne 5.4% supérieure à la médiane
(±) | la linéarité des médiums est moyenne (9.6% delta à la fréquence précédente)
Aiguës 2 - 16 kHz
(+) | des sommets équilibrés - à seulement 2.3% de la médiane
(±) | la linéarité des aigus est moyenne (7.5% delta à la fréquence précédente)
Globalement 100 - 16 000 Hz
(±) | la linéarité du son global est moyenne (23.7% de différence avec la médiane)
Par rapport à la même classe
» 86% de tous les appareils testés de cette catégorie étaient meilleurs, 5% similaires, 10% pires
» Le meilleur avait un delta de 6%, la moyenne était de 18%, le pire était de 132%.
Par rapport à tous les appareils testés
» 71% de tous les appareils testés étaient meilleurs, 6% similaires, 23% pires
» Le meilleur avait un delta de 4%, la moyenne était de 23%, le pire était de 134%.
Apple MacBook Pro 16 2021 M1 Pro analyse audio
(+) | les haut-parleurs peuvent jouer relativement fort (84.7# dB)
Basses 100 - 315 Hz
(+) | bonne basse - seulement 3.8% loin de la médiane
(+) | les basses sont linéaires (5.2% delta à la fréquence précédente)
Médiums 400 - 2000 Hz
(+) | médiane équilibrée - seulement 1.3% de la médiane
(+) | les médiums sont linéaires (2.1% delta à la fréquence précédente)
Aiguës 2 - 16 kHz
(+) | des sommets équilibrés - à seulement 1.9% de la médiane
(+) | les aigus sont linéaires (2.7% delta à la fréquence précédente)
Globalement 100 - 16 000 Hz
(+) | le son global est linéaire (4.6% différence à la médiane)
Par rapport à la même classe
» 0% de tous les appareils testés de cette catégorie étaient meilleurs, 0% similaires, 100% pires
» Le meilleur avait un delta de 5%, la moyenne était de 17%, le pire était de 45%.
Par rapport à tous les appareils testés
» 0% de tous les appareils testés étaient meilleurs, 0% similaires, 100% pires
» Le meilleur avait un delta de 4%, la moyenne était de 23%, le pire était de 134%.
Gestion de l'énergie
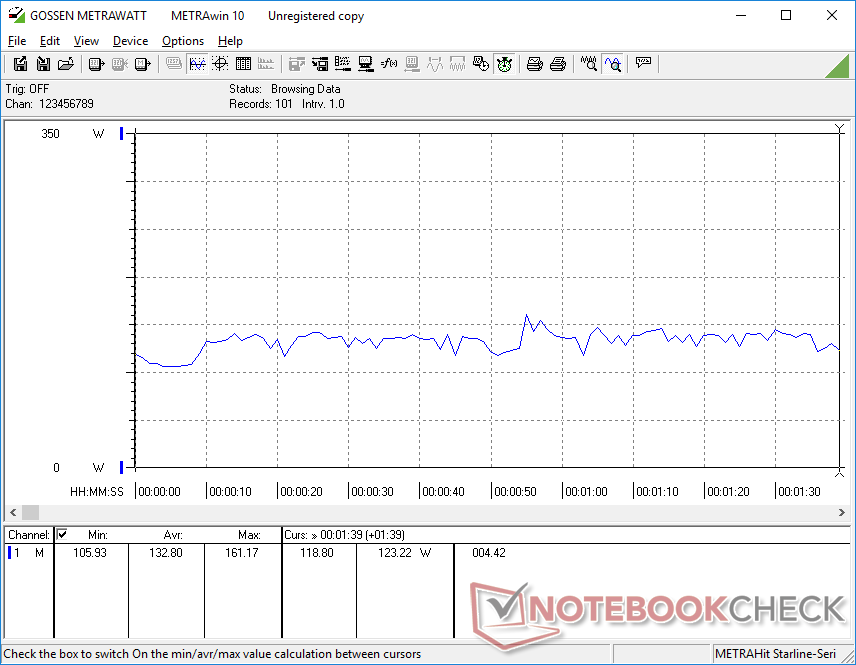
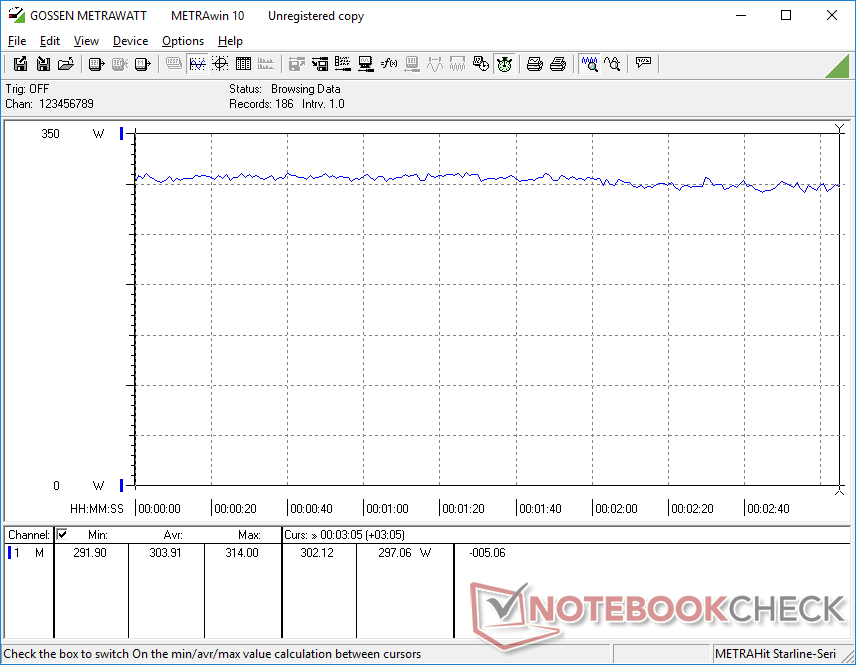
Consommation d'énergie - Plus de 300 W en jeu
Le fonctionnement au ralenti sur le bureau consomme entre 13 et 43 W en fonction du profil d'alimentation, des paramètres du GPU et de la luminosité de l'écran. En fait, 43 W est à peu près la même chose qu'un Ultrabook équipé d'un Core U comme le Samsung Galaxy Book3 15 en charge maximale. Le simple fait de passer du mode iGPU au mode dGPU augmenterait la consommation d'énergie d'environ 9 W sur l'Eurocom. La consommation d'énergie est donc très sensible au profil de puissance active.
La consommation moyenne en mode jeu est très élevée avec 304 W contre 278 W pour les modèles concurrents.Asus ROG Strix Scar 17 ou Aorus 17X avec le même GPU GeForce RTX 4090. Le triple SSD, le taux de rafraîchissement rapide de 240 Hz, la capacité élevée de la RAM et la consommation légèrement plus élevée du GPU contribuent tous à la consommation plus élevée de l'Eurocom.
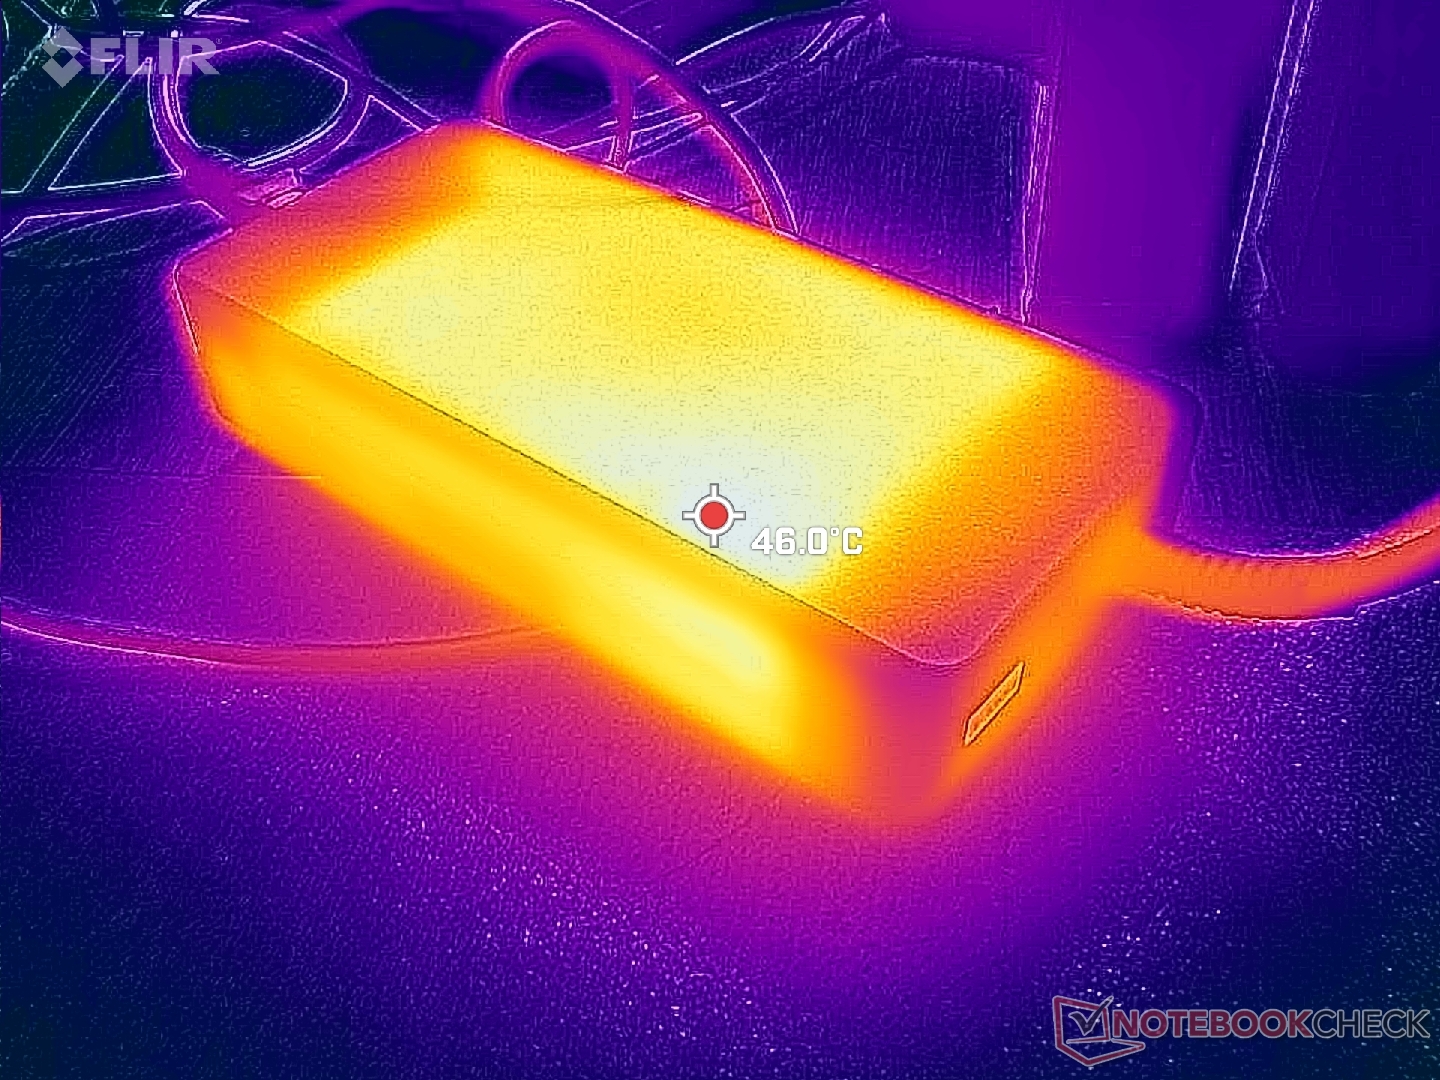
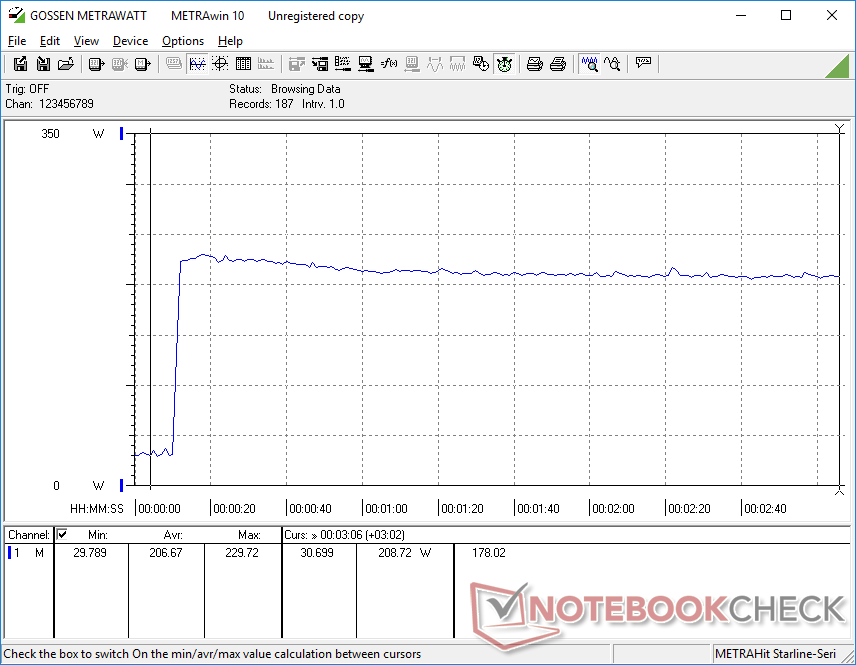
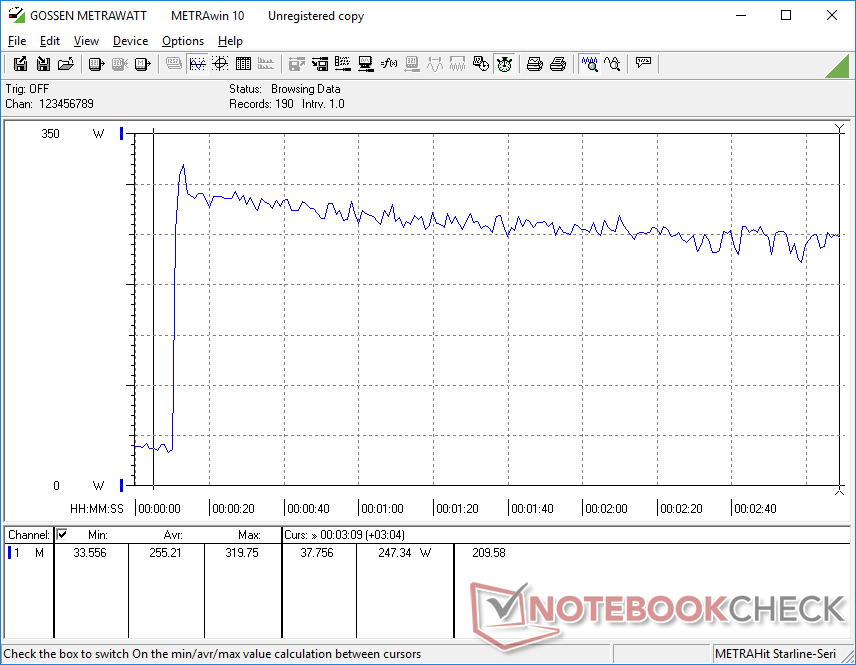
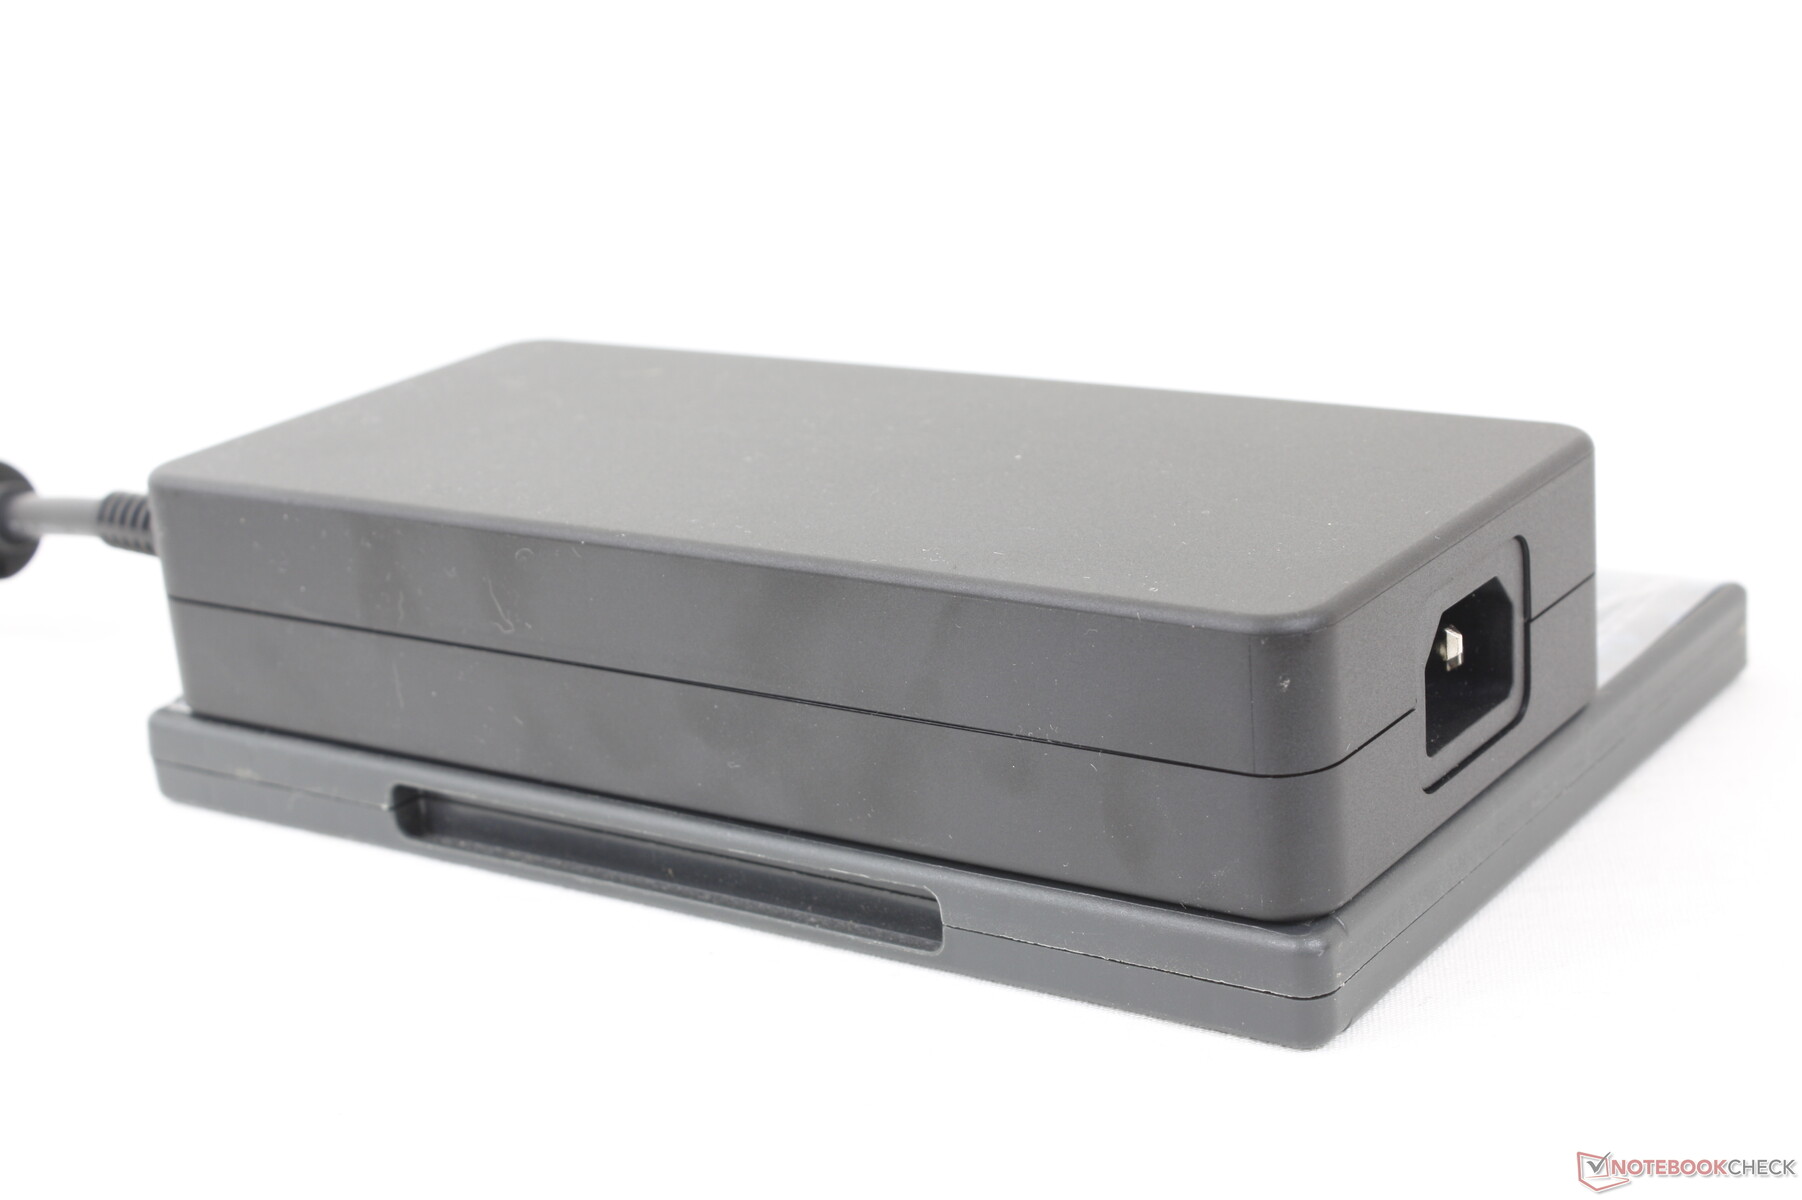
Nous avons enregistré une consommation maximale de 320 W sur le grand adaptateur secteur de 330 W (~18,5 x 8,5 x 3,5 cm) lorsque le CPU et le GPU sont utilisés à 100 %. Ce taux diminue avec le temps, comme le montre le graphique ci-dessous, en raison des limitations thermiques.
| Éteint/en veille | |
| Au repos | |
| Fortement sollicité |
|
Légende:
min: | |
| Eurocom Raptor X17 i9-13900HX, GeForce RTX 4090 Laptop GPU, 3x Samsung SSD 980 Pro 1TB (RAID 0), IPS, 2560x1440, 17.3" | Asus ROG Strix Scar 17 G733PY-XS96 R9 7945HX, GeForce RTX 4090 Laptop GPU, SK hynix PC801 HFS001TEJ9X101N, IPS, 2560x1440, 17.3" | Aorus 17X AZF i9-13900HX, GeForce RTX 4090 Laptop GPU, Gigabyte AG470S1TB-SI B10, IPS, 2560x1440, 17.3" | MSI GE78HX 13VH-070US i9-13950HX, GeForce RTX 4080 Laptop GPU, Samsung PM9A1 MZVL22T0HBLB, IPS, 2560x1600, 17" | Eluktronics Mech-17 GP2 i9-13900HX, GeForce RTX 4090 Laptop GPU, Samsung PM9A1 MZVL21T0HCLR, IPS, 2560x1600, 17" | Alienware m17 R5 (R9 6900HX, RX 6850M XT) R9 6900HX, Radeon RX 6850M XT, SSSTC CA6-8D1024, IPS, 3840x2160, 17" | |
|---|---|---|---|---|---|---|
| Power Consumption | 5% | 13% | 3% | 5% | 27% | |
| Idle Minimum * (Watt) | 13.4 | 14.5 -8% | 11 18% | 16.1 -20% | 14 -4% | 13 3% |
| Idle Average * (Watt) | 22.2 | 21.1 5% | 17 23% | 24 -8% | 19.3 13% | 16.5 26% |
| Idle Maximum * (Watt) | 42.4 | 42.8 -1% | 29 32% | 34 20% | 36.8 13% | 17 60% |
| Load Average * (Watt) | 132.8 | 116.7 12% | 134 -1% | 123.6 7% | 117.2 12% | 93 30% |
| Witcher 3 ultra * (Watt) | 304 | 278 9% | 278 9% | 286 6% | 304 -0% | 239 21% |
| Load Maximum * (Watt) | 319.8 | 279.6 13% | 334 -4% | 285.7 11% | 342.5 -7% | 251 22% |
* ... Moindre est la valeur, meilleures sont les performances
Power Consumption Witcher 3 / Stresstest
Power Consumption external Monitor
Autonomie de la batterie
Les durées d'utilisation sont plutôt bonnes compte tenu de la puissance des composants internes. Nous avons pu enregistrer un peu moins de 5 heures de navigation WLAN dans le monde réel avec le profil d'alimentation équilibré et l'iGPU actif. Malgré cela, des modèles concurrents comme l'Aorus 17X ou le MSI GE78HX sont capables de tenir plus d'une heure de plus que notre Eurocom.
La charge du vide à la pleine capacité avec l'adaptateur secteur de 330 W inclus est relativement lente, avec 2 à 2,5 heures. La charge via des adaptateurs secteur USB-C tiers est prise en charge, mais notez qu'elle ne fonctionne que sur un seul des deux ports USB-C (le port le plus proche de l'arrière).
| Eurocom Raptor X17 i9-13900HX, GeForce RTX 4090 Laptop GPU, 99 Wh | Asus ROG Strix Scar 17 G733PY-XS96 R9 7945HX, GeForce RTX 4090 Laptop GPU, 90 Wh | Aorus 17X AZF i9-13900HX, GeForce RTX 4090 Laptop GPU, 99 Wh | MSI GE78HX 13VH-070US i9-13950HX, GeForce RTX 4080 Laptop GPU, 99 Wh | Eluktronics Mech-17 GP2 i9-13900HX, GeForce RTX 4090 Laptop GPU, 99 Wh | Alienware m17 R5 (R9 6900HX, RX 6850M XT) R9 6900HX, Radeon RX 6850M XT, 97 Wh | |
|---|---|---|---|---|---|---|
| Autonomie de la batterie | -18% | 19% | -2% | 2% | 8% | |
| Reader / Idle (h) | 10.2 | 9 -12% | 7.3 -28% | |||
| WiFi v1.3 (h) | 5 | 4.1 -18% | 6.5 30% | 6.1 22% | 5.1 2% | 4.8 -4% |
| Load (h) | 1.5 | 2.1 40% | 1.5 0% | 1.8 20% | ||
| H.264 (h) | 6.7 | 4.9 |
Points positifs
Points négatifs
Verdict - La performance est au rendez-vous, mais pourrait être améliorée

Le meilleur aspect du Raptor X17 est sa performance très rapide par rapport à son profil fin. Il fonctionnera très chaud et très bruyant afin de tirer le maximum de performances du CPU et du GPU. Les chasseurs de performance en particulier apprécieront probablement cette approche ainsi que le support de trois SSD NVMe PCIe4 x4.
Malheureusement, il y a quelques inconvénients à garder à l'esprit. Avec plus de 60 dB(A) en jeu, le système est nettement plus bruyant que la plupart des autres ordinateurs portables de jeu du marché. Lorsque des modèles concurrents comme leMSI GE78HX ou le Asus ROG Strix Scar 17 peuvent offrir des options de processeur similaires tout en étant 10 dB(A) plus silencieux en jeu, il devient plus difficile de préférer le Raptor X17 à de nombreuses alternatives sur le marché. Le poids beaucoup plus élevé ne lui rend pas service non plus.
Le matériel et les performances sont solides, mais d'autres aspects comme les faibles haut-parleurs, les ventilateurs très bruyants et le logiciel Control Center peu raffiné ne reflètent pas correctement le prix élevé demandé.
Nous pensons que certains détails auraient pu être améliorés. Les profils d'alimentation confus, le comportement des ventilateurs, les modes cachés du GPU, la décoloration modérée du rétroéclairage et l'écran calibré en option sont tous regrettables pour un ordinateur portable haut de gamme dont le prix dépasse largement les 3 000 dollars. Eurocom indique qu'il est actuellement en train de redessiner le menu du BIOS et le logiciel Control Center, ce qui devrait, espérons-le, répondre à certaines de nos plaintes.
Prix et disponibilité
Eurocom livre maintenant le Raptor X17 en Amérique du Nord le Raptor X17 en Amérique du Nord à partir de $3550 USD pour la configuration de base jusqu'à plus de $6000 pour la configuration de notre unité de test.
Eurocom Raptor X17
- 05/18/2023 v7 (old)
Allen Ngo
Transparency
La sélection des appareils à examiner est effectuée par notre équipe éditoriale. L'échantillon de test a été prêté à l'auteur par le fabricant ou le détaillant pour les besoins de cet examen. Le prêteur n'a pas eu d'influence sur cette évaluation et le fabricant n'a pas reçu de copie de cette évaluation avant sa publication. Il n'y avait aucune obligation de publier cet article. En tant que média indépendant, Notebookcheck n'est pas soumis à l'autorité des fabricants, des détaillants ou des éditeurs.
Voici comment Notebookcheck teste
Chaque année, Notebookcheck examine de manière indépendante des centaines d'ordinateurs portables et de smartphones en utilisant des procédures standardisées afin de garantir que tous les résultats sont comparables. Nous avons continuellement développé nos méthodes de test depuis environ 20 ans et avons établi des normes industrielles dans le processus. Dans nos laboratoires de test, des équipements de mesure de haute qualité sont utilisés par des techniciens et des rédacteurs expérimentés. Ces tests impliquent un processus de validation en plusieurs étapes. Notre système d'évaluation complexe repose sur des centaines de mesures et de points de référence bien fondés, ce qui garantit l'objectivité.Price comparison

