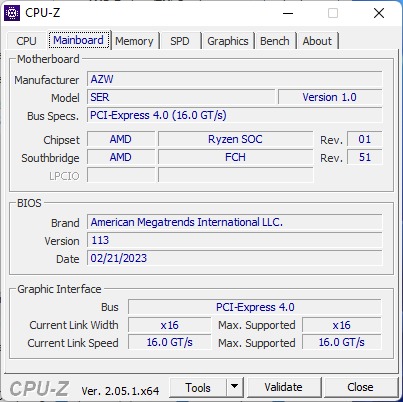
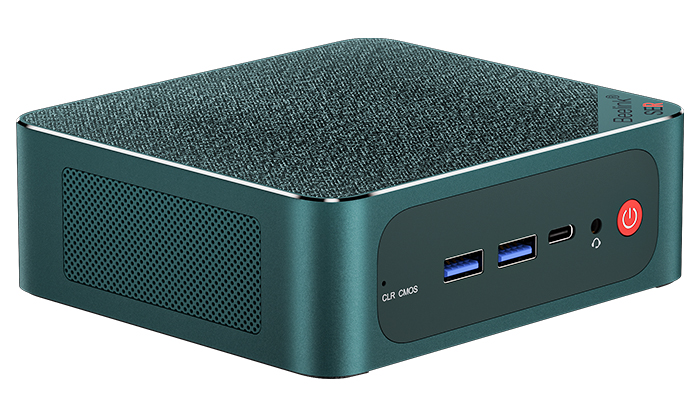
Test du Beelink SER6 Pro Ryzen 7 7735HS : mini PC avec maintenant le DisplayPort intégré

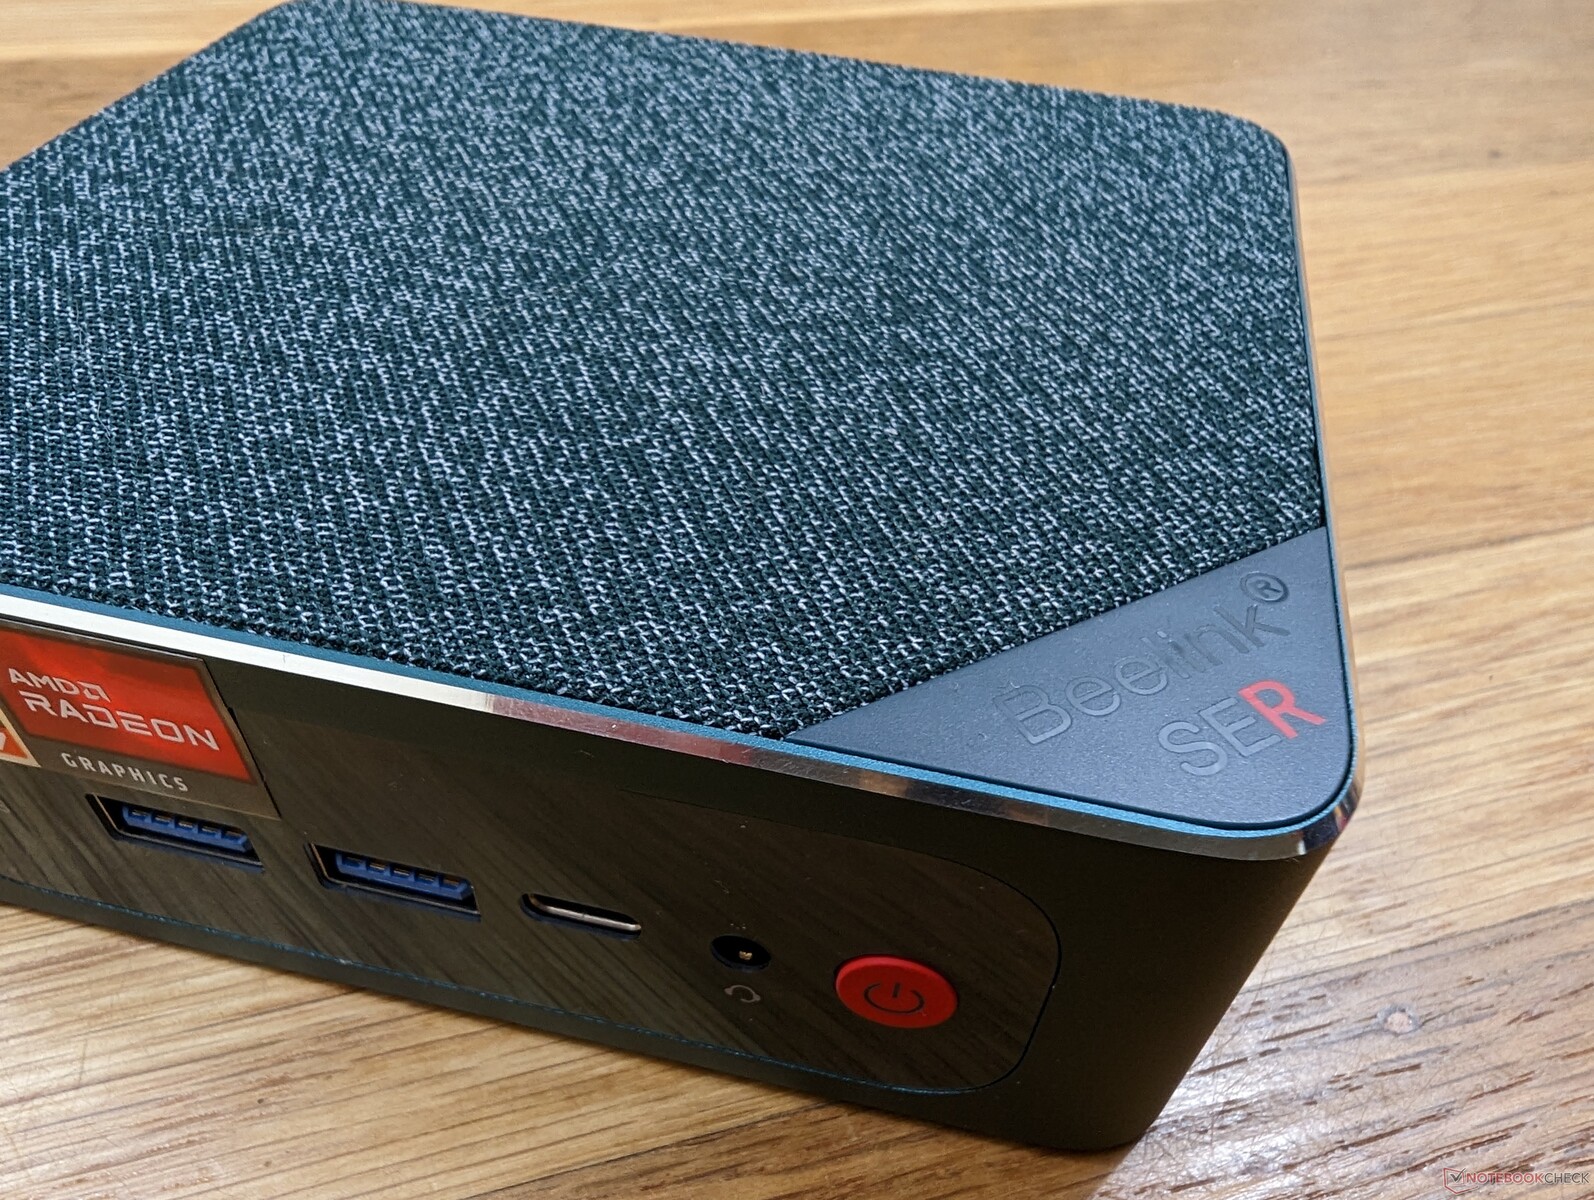
Le Beelink SER6 Pro 2023 est une mise à jour du SER6 Pro 2022. Il remplace les options Ryzen 7 6800 ou Ryzen 9 6900HS du modèle de l'année dernière par le nouveau Ryzen 7 7735HS. Outre la mise à jour du processeur, le châssis reste identique, avec un seul changement notable.
Notre unité de test avec le Ryzen 7 7735HS, 32 Go de RAM, 500 Go de SSD NVMe et Windows 10 Pro préinstallé peut être trouvée en ligne pour environ 650 $ USD ou 550 $ s'il est en vente. Ce modèle est en concurrence directe avec d'autres mini PC, notamment la série Intel NUC.
Plus d'avis sur Beelink :
- SEi12
- SEi11
- SER5 Pro
- GTR6
- U59
Comparaison avec les concurrents potentiels
Note | Date | Modèle | Poids | Épaisseur | Taille | Résolution | Prix |
|---|---|---|---|---|---|---|---|
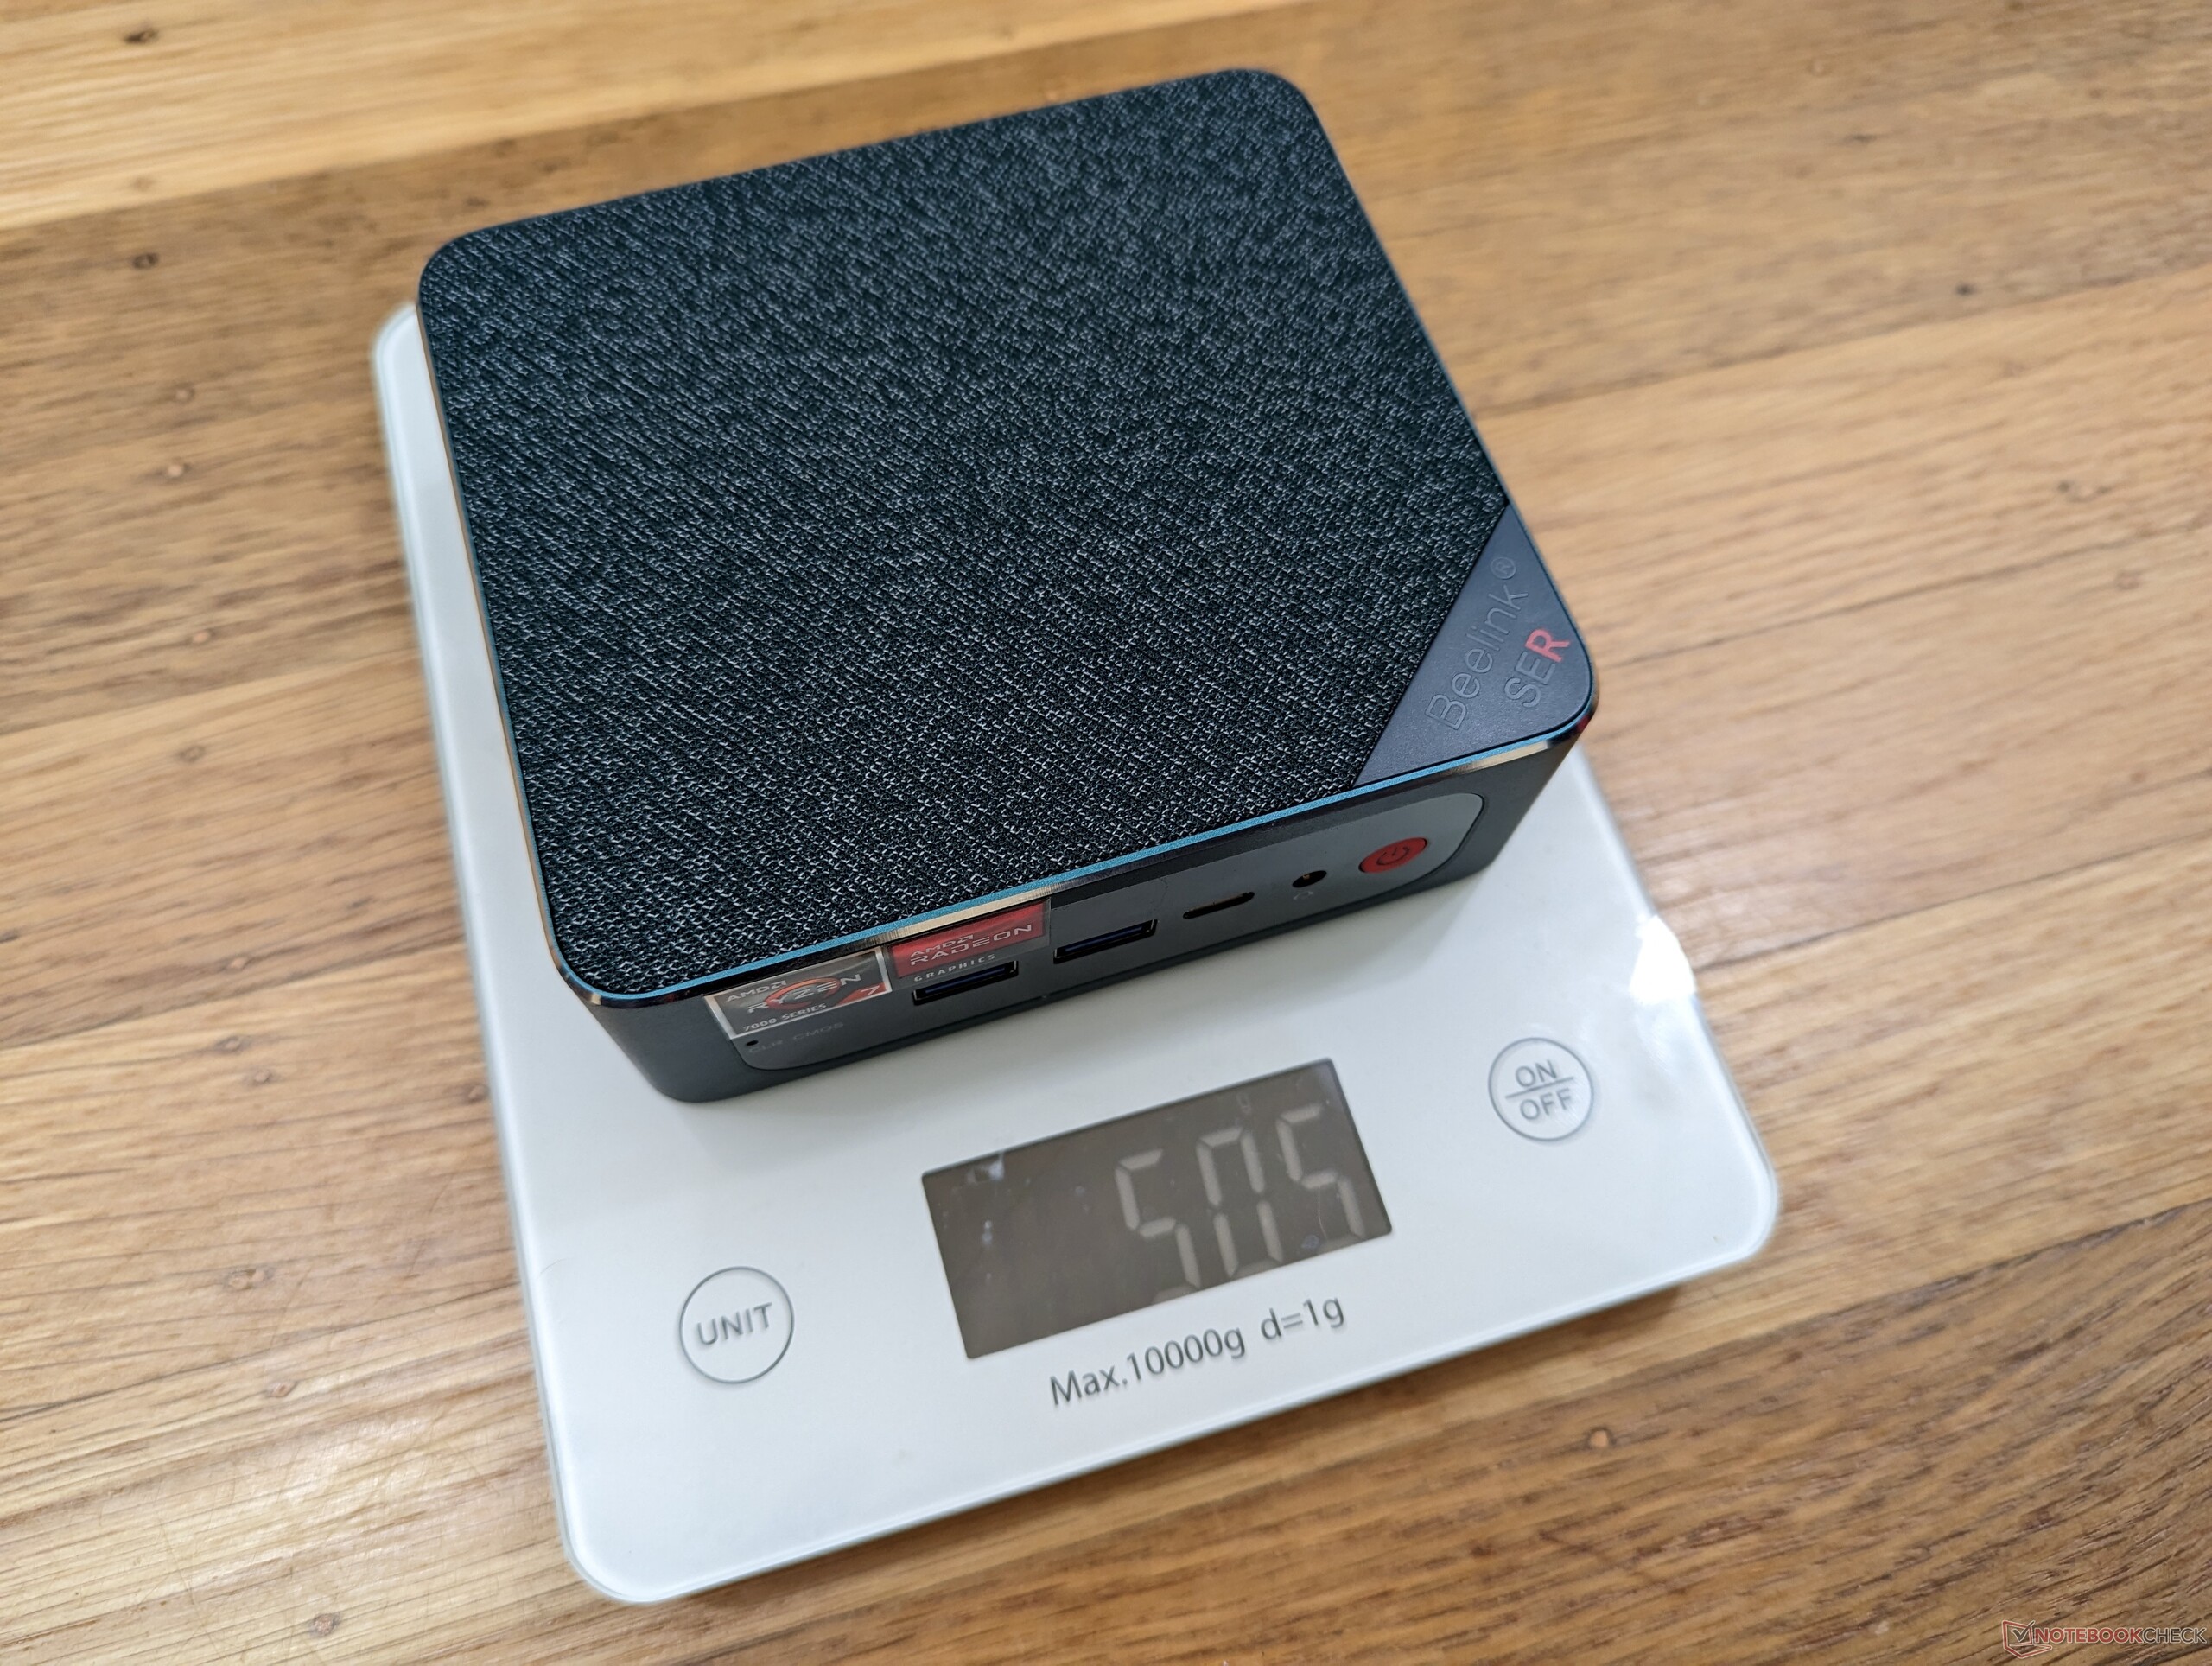
| 84.8 % v7 (old) | 04/23 | Beelink SER6 Pro Ryzen 7 7735HS R7 7735HS, Radeon 680M | 506 g | 42 mm | x | ||
v (old) | 01/23 | Beelink SER6 Pro R7 6800H, Radeon 680M | 511 g | 42 mm | x | ||
v (old) | 11/22 | Beelink GTR6 R9 6900HX, Radeon 680M | 815 g | 43 mm | x | ||
| 80.8 % v7 (old) | 04/23 | Intel NUC 13 Pro Kit NUC13ANK i7-1360P, Iris Xe G7 96EUs | 538 g | 37 mm | x | ||
v (old) | 03/23 | Intel NUC 12 Pro Kit NUC12WSBi5 i5-1240P, Iris Xe G7 80EUs | 549 g | 45.6 mm | x | ||
| 86.1 % v7 (old) | 02/23 | Minisforum Venus Series UM690 R9 6900HX, Radeon 680M | 621 g | 48 mm | x |
Cas
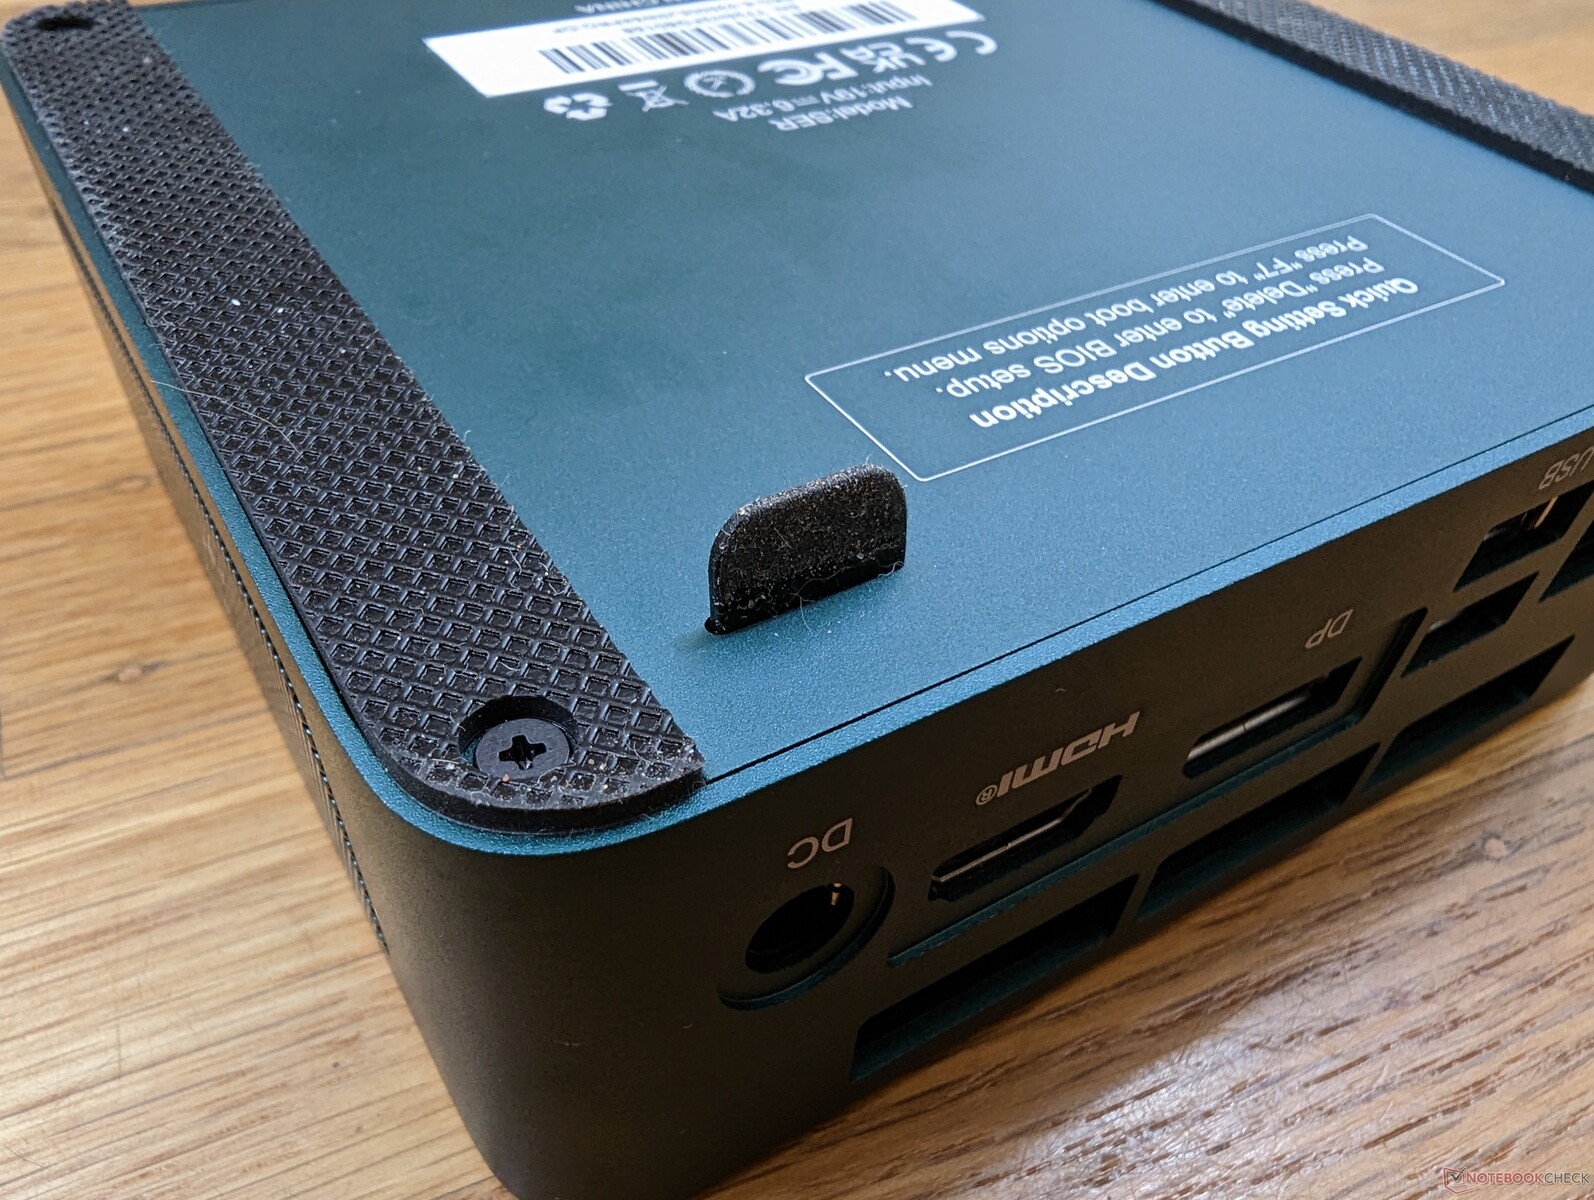
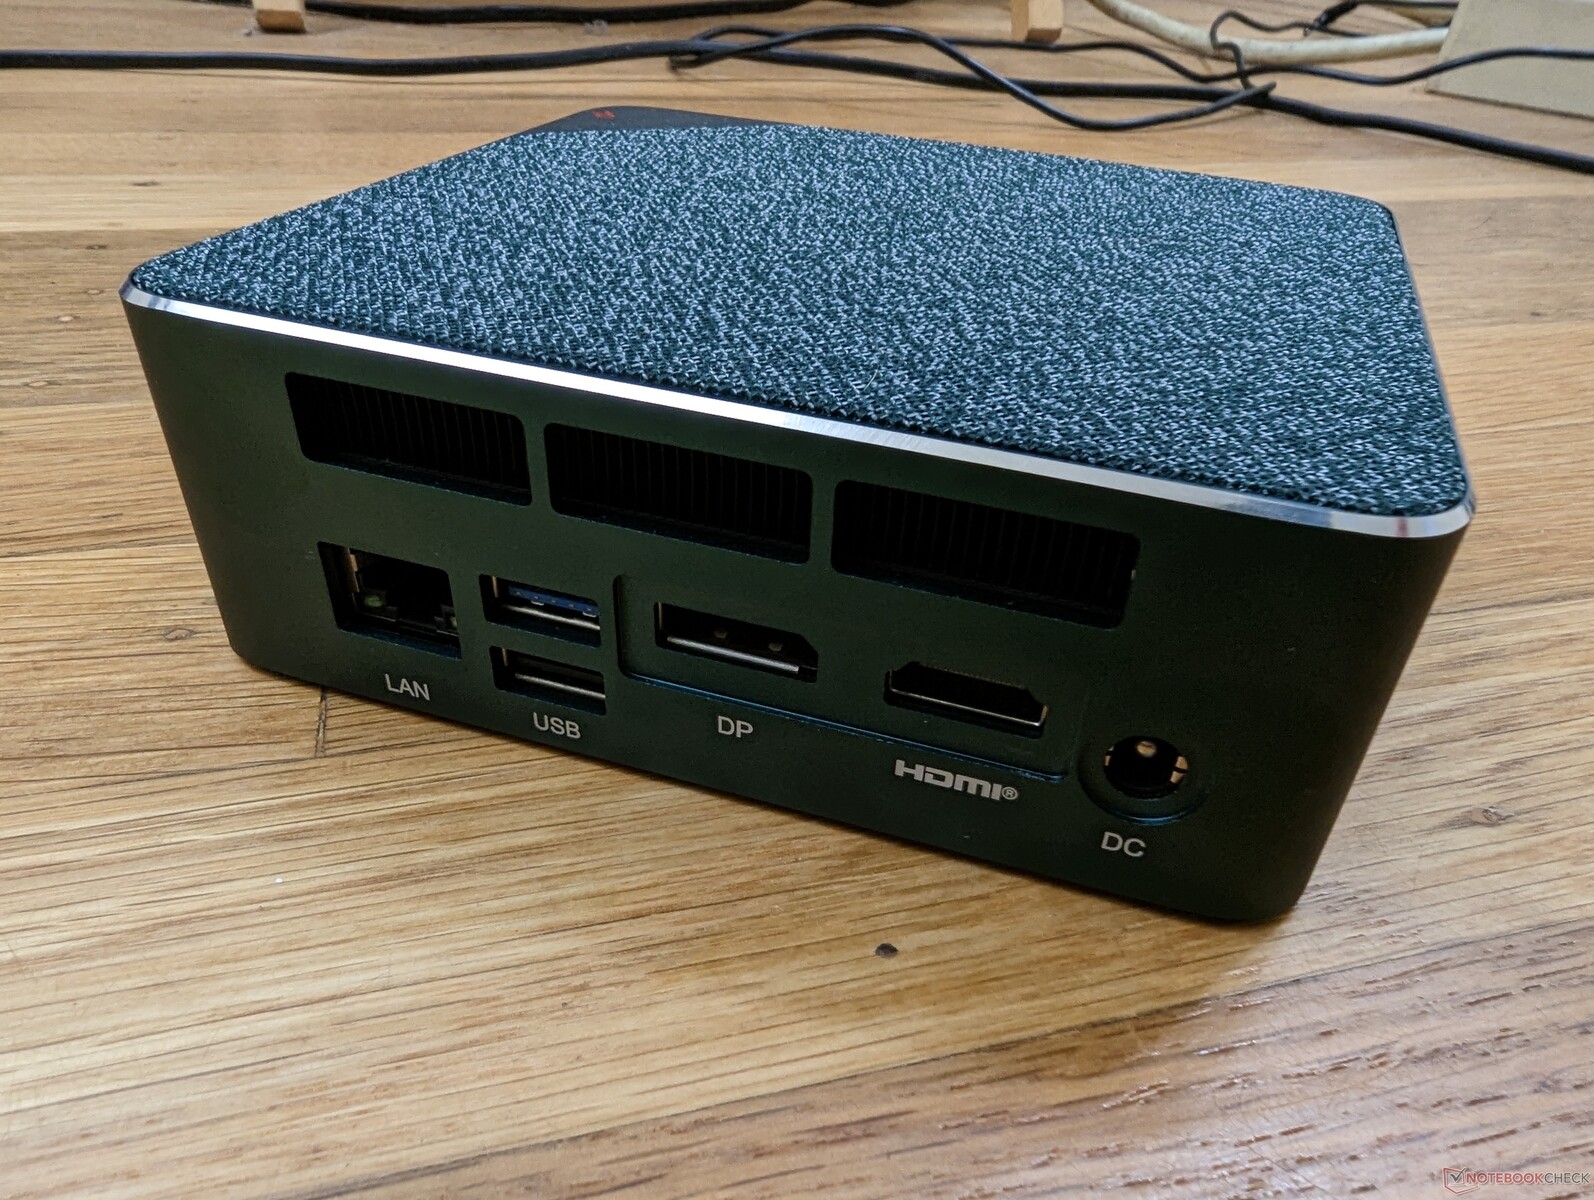
Le châssis n'a pas subi de modifications majeures, à une exception près : le second port HDMI du modèle de l'année dernière a été remplacé par un port DisplayPort de taille normale. C'est en fait préférable, car le port DisplayPort est plus compatible avec les taux de rafraîchissement plus élevés et les moniteurs à synchronisation adaptative que le port HDMI.
Communication
Modules de communication filaires et sans fil intégrés, comparaison des données de test du réseau avec celles des concurrents, solutions alternatives disponibles (5G/LTE), irrégularités (réception radio), etc
| Networking | |
| iperf3 transmit AXE11000 | |
| Beelink SER6 Pro | |
| Beelink SER6 Pro Ryzen 7 7735HS | |
| Minisforum Venus Series UM690 | |
| Beelink GTR6 | |
| Intel NUC 13 Pro Kit NUC13ANK | |
| iperf3 receive AXE11000 | |
| Beelink SER6 Pro Ryzen 7 7735HS | |
| Beelink SER6 Pro | |
| Minisforum Venus Series UM690 | |
| Intel NUC 13 Pro Kit NUC13ANK | |
| Beelink GTR6 | |
| iperf3 transmit AXE11000 6GHz | |
| Intel NUC 13 Pro Kit NUC13ANK | |
| Beelink GTR6 | |
| Minisforum Venus Series UM690 | |
| iperf3 receive AXE11000 6GHz | |
| Intel NUC 13 Pro Kit NUC13ANK | |
| Minisforum Venus Series UM690 | |
| Beelink GTR6 | |
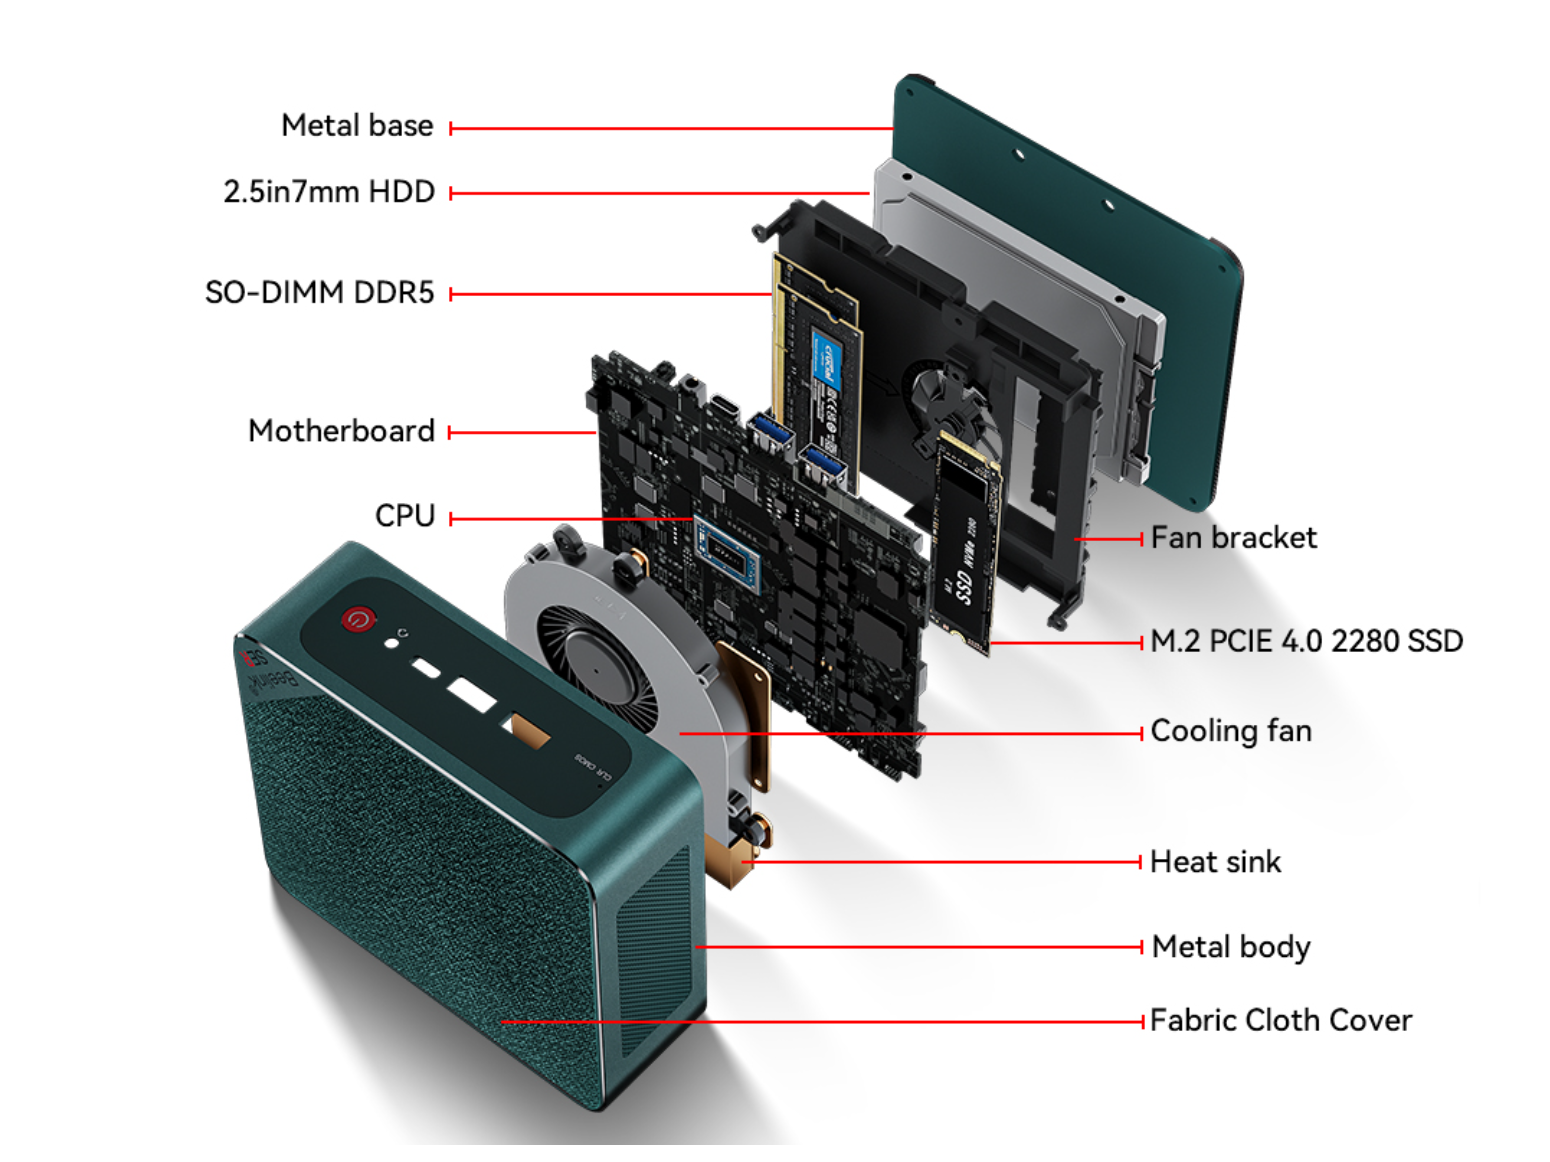
Maintenance
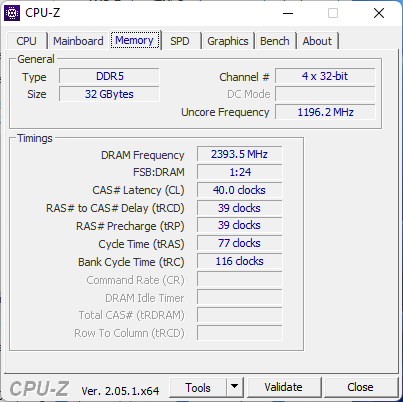
La facilité d'entretien reste la même que sur le modèle de l'année dernière. Les utilisateurs disposent de 2 baies de stockage (1 PCIe4 x4 M.280, 1 SATA III de 2,5 pouces) et de 2 emplacements DDR5 SODIMM pour l'extension.
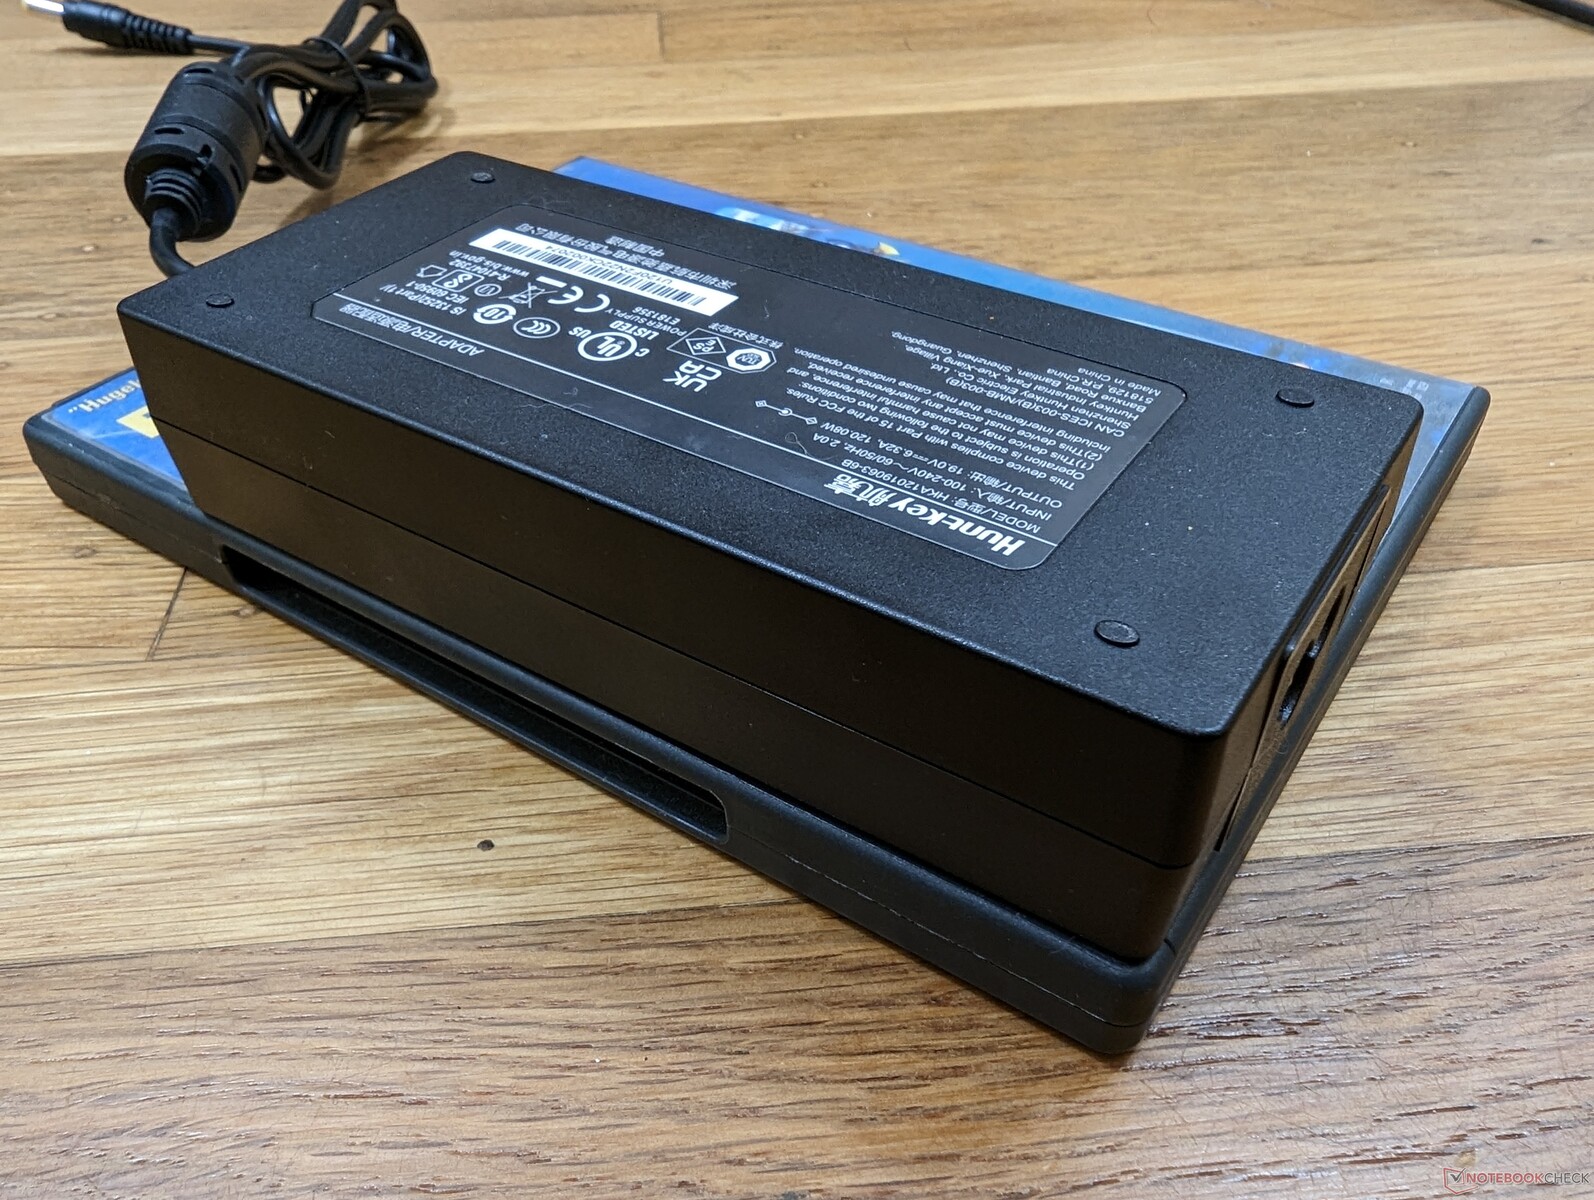
Accessoires et garantie
La garantie limitée standard d'un an s'applique si l'appareil est acheté aux États-Unis. L'emballage comprend un manuel, un support VESA mural amovible, deux câbles HDMI et l'adaptateur secteur.
Performance
Conditions d'essai
Nous avons réglé notre appareil en mode Performance via Windows avant d'effectuer les tests de performance ci-dessous. Il n'y a pas d'application préinstallée de type "Command Center", contrairement à de nombreux autres ordinateurs portables ou PC de grandes marques.
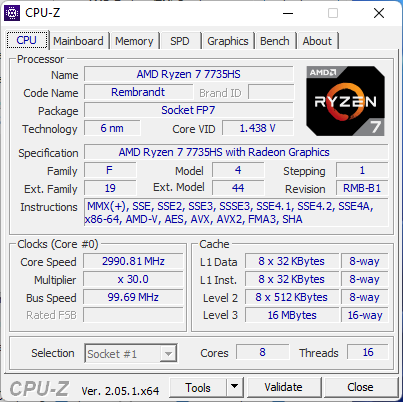
Processeur
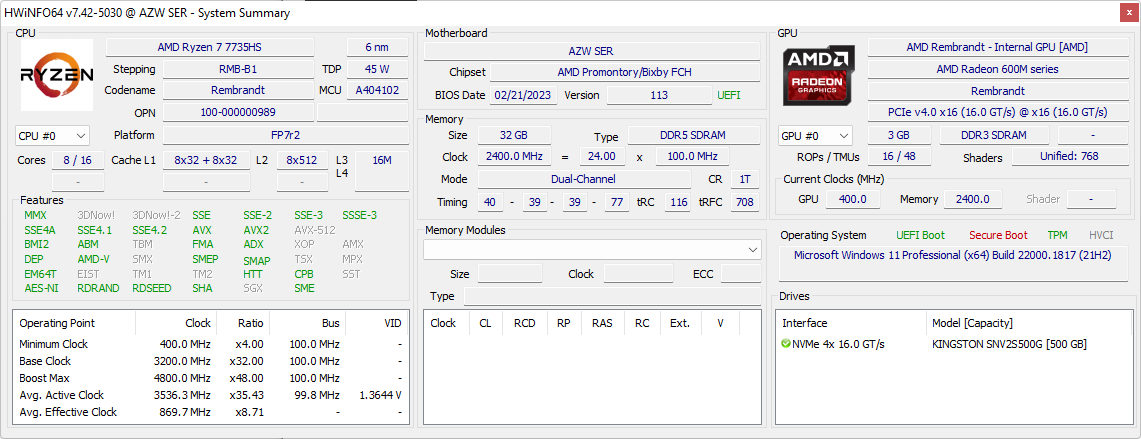
Comme nous l'avons découvert sur le Lenovo Slim 7 Pro, le Ryzen 7 7735HS 2023 a des performances presque identiques à celles des Ryzen 7 6800H ou Ryzen 9 6900HS. En effet, le Ryzen 7 7735HS est en grande partie un rebranding de l'ancienne série Zen 3+, malgré son lancement récent au début du mois dernier. Par conséquent, même l'ancien Core i7-12700H de 12ème génération peut surpasser le Ryzen 7 7735HS dans presque tous les domaines, à l'exception des performances graphiques intégrées.
Pour un "vrai" processeur AMD de la dernière génération, il faudrait plutôt opter pour le Zen 4 Ryzen 9 7945HX. Malheureusement, cette option n'est pas disponible sur le SER6 Pro.
Cinebench R15 Multi Loop
Cinebench R23: Multi Core | Single Core
Cinebench R20: CPU (Multi Core) | CPU (Single Core)
Cinebench R15: CPU Multi 64Bit | CPU Single 64Bit
Blender: v2.79 BMW27 CPU
7-Zip 18.03: 7z b 4 | 7z b 4 -mmt1
Geekbench 5.5: Multi-Core | Single-Core
HWBOT x265 Benchmark v2.2: 4k Preset
LibreOffice : 20 Documents To PDF
R Benchmark 2.5: Overall mean
| Cinebench R20 / CPU (Multi Core) | |
| Intel NUC13 Raptor Canyon | |
| Asus ROG Strix Scar 17 G733PY-XS96 | |
| Intel NUC 12, NUC12SNKi72_Serpent Canyon | |
| Moyenne AMD Ryzen 7 7735HS (3968 - 5502, n=15) | |
| Intel NUC 13 Pro Kit NUC13ANK | |
| Beelink GTR6 | |
| Beelink SER6 Pro Ryzen 7 7735HS | |
| Beelink SER6 Pro | |
| Intel NUC 12 Pro Kit NUC12WSBi5 | |
| Intel NUC Pro Chassis_i7_1265U | |
| Intel NUC Pro Chassis_i5_1245U | |
| Trigkey Speed S | |
| Cinebench R20 / CPU (Single Core) | |
| Intel NUC13 Raptor Canyon | |
| Intel NUC 13 Pro Kit NUC13ANK | |
| Asus ROG Strix Scar 17 G733PY-XS96 | |
| Intel NUC 12, NUC12SNKi72_Serpent Canyon | |
| Intel NUC Pro Chassis_i7_1265U | |
| Intel NUC 12 Pro Kit NUC12WSBi5 | |
| Intel NUC Pro Chassis_i5_1245U | |
| Beelink GTR6 | |
| Beelink SER6 Pro Ryzen 7 7735HS | |
| Moyenne AMD Ryzen 7 7735HS (502 - 613, n=15) | |
| Beelink SER6 Pro | |
| Trigkey Speed S | |
| Geekbench 5.5 / Multi-Core | |
| Intel NUC13 Raptor Canyon | |
| Asus ROG Strix Scar 17 G733PY-XS96 | |
| Intel NUC 13 Pro Kit NUC13ANK | |
| Intel NUC 12, NUC12SNKi72_Serpent Canyon | |
| Beelink SER6 Pro Ryzen 7 7735HS | |
| Beelink GTR6 | |
| Beelink SER6 Pro | |
| Moyenne AMD Ryzen 7 7735HS (7151 - 10258, n=15) | |
| Intel NUC Pro Chassis_i5_1245U | |
| Intel NUC Pro Chassis_i7_1265U | |
| Trigkey Speed S | |
| Geekbench 5.5 / Single-Core | |
| Intel NUC13 Raptor Canyon | |
| Asus ROG Strix Scar 17 G733PY-XS96 | |
| Intel NUC 13 Pro Kit NUC13ANK | |
| Intel NUC Pro Chassis_i7_1265U | |
| Intel NUC Pro Chassis_i5_1245U | |
| Beelink GTR6 | |
| Intel NUC 12, NUC12SNKi72_Serpent Canyon | |
| Beelink SER6 Pro Ryzen 7 7735HS | |
| Beelink SER6 Pro | |
| Moyenne AMD Ryzen 7 7735HS (1327 - 1615, n=15) | |
| Trigkey Speed S | |
| HWBOT x265 Benchmark v2.2 / 4k Preset | |
| Asus ROG Strix Scar 17 G733PY-XS96 | |
| Intel NUC13 Raptor Canyon | |
| Intel NUC 12, NUC12SNKi72_Serpent Canyon | |
| Moyenne AMD Ryzen 7 7735HS (10.8 - 17.9, n=15) | |
| Beelink GTR6 | |
| Beelink SER6 Pro Ryzen 7 7735HS | |
| Beelink SER6 Pro | |
| Intel NUC 13 Pro Kit NUC13ANK | |
| Intel NUC 12 Pro Kit NUC12WSBi5 | |
| Intel NUC Pro Chassis_i7_1265U | |
| Intel NUC Pro Chassis_i5_1245U | |
| Trigkey Speed S | |
| LibreOffice / 20 Documents To PDF | |
| Moyenne AMD Ryzen 7 7735HS (44.3 - 63.9, n=15) | |
| Intel NUC Pro Chassis_i5_1245U | |
| Intel NUC 12 Pro Kit NUC12WSBi5 | |
| Intel NUC Pro Chassis_i7_1265U | |
| Beelink SER6 Pro | |
| Beelink GTR6 | |
| Intel NUC 12, NUC12SNKi72_Serpent Canyon | |
| Beelink SER6 Pro Ryzen 7 7735HS | |
| Trigkey Speed S | |
| Intel NUC 13 Pro Kit NUC13ANK | |
| Intel NUC13 Raptor Canyon | |
| Asus ROG Strix Scar 17 G733PY-XS96 | |
| R Benchmark 2.5 / Overall mean | |
| Trigkey Speed S | |
| Beelink SER6 Pro Ryzen 7 7735HS | |
| Intel NUC Pro Chassis_i5_1245U | |
| Moyenne AMD Ryzen 7 7735HS (0.4822 - 0.585, n=15) | |
| Beelink SER6 Pro | |
| Intel NUC 12 Pro Kit NUC12WSBi5 | |
| Intel NUC Pro Chassis_i7_1265U | |
| Intel NUC 12, NUC12SNKi72_Serpent Canyon | |
| Beelink GTR6 | |
| Intel NUC 13 Pro Kit NUC13ANK | |
| Asus ROG Strix Scar 17 G733PY-XS96 | |
| Intel NUC13 Raptor Canyon | |
* ... Moindre est la valeur, meilleures sont les performances
* ... Moindre est la valeur, meilleures sont les performances
AIDA64: FP32 Ray-Trace | FPU Julia | CPU SHA3 | CPU Queen | FPU SinJulia | FPU Mandel | CPU AES | CPU ZLib | FP64 Ray-Trace | CPU PhotoWorxx
| Performance rating | |
| Minisforum Venus Series UM690 | |
| Beelink GTR6 | |
| Beelink SER6 Pro Ryzen 7 7735HS | |
| Beelink SER6 Pro | |
| Intel NUC 13 Pro Kit NUC13ANK | |
| Intel NUC 12 Pro Kit NUC12WSBi5 | |
| AIDA64 / FP32 Ray-Trace | |
| Minisforum Venus Series UM690 | |
| Beelink GTR6 | |
| Beelink SER6 Pro Ryzen 7 7735HS | |
| Beelink SER6 Pro | |
| Intel NUC 13 Pro Kit NUC13ANK | |
| Intel NUC 12 Pro Kit NUC12WSBi5 | |
| AIDA64 / FPU Julia | |
| Minisforum Venus Series UM690 | |
| Beelink GTR6 | |
| Beelink SER6 Pro Ryzen 7 7735HS | |
| Beelink SER6 Pro | |
| Intel NUC 13 Pro Kit NUC13ANK | |
| Intel NUC 12 Pro Kit NUC12WSBi5 | |
| AIDA64 / CPU SHA3 | |
| Minisforum Venus Series UM690 | |
| Beelink GTR6 | |
| Beelink SER6 Pro | |
| Beelink SER6 Pro Ryzen 7 7735HS | |
| Intel NUC 13 Pro Kit NUC13ANK | |
| Intel NUC 12 Pro Kit NUC12WSBi5 | |
| AIDA64 / CPU Queen | |
| Minisforum Venus Series UM690 | |
| Beelink SER6 Pro Ryzen 7 7735HS | |
| Beelink GTR6 | |
| Beelink SER6 Pro | |
| Intel NUC 13 Pro Kit NUC13ANK | |
| Intel NUC 12 Pro Kit NUC12WSBi5 | |
| AIDA64 / FPU SinJulia | |
| Minisforum Venus Series UM690 | |
| Beelink GTR6 | |
| Beelink SER6 Pro Ryzen 7 7735HS | |
| Beelink SER6 Pro | |
| Intel NUC 13 Pro Kit NUC13ANK | |
| Intel NUC 12 Pro Kit NUC12WSBi5 | |
| AIDA64 / FPU Mandel | |
| Minisforum Venus Series UM690 | |
| Beelink GTR6 | |
| Beelink SER6 Pro Ryzen 7 7735HS | |
| Beelink SER6 Pro | |
| Intel NUC 13 Pro Kit NUC13ANK | |
| Intel NUC 12 Pro Kit NUC12WSBi5 | |
| AIDA64 / CPU AES | |
| Minisforum Venus Series UM690 | |
| Beelink GTR6 | |
| Beelink SER6 Pro | |
| Beelink SER6 Pro Ryzen 7 7735HS | |
| Intel NUC 13 Pro Kit NUC13ANK | |
| Intel NUC 12 Pro Kit NUC12WSBi5 | |
| AIDA64 / CPU ZLib | |
| Minisforum Venus Series UM690 | |
| Intel NUC 12 Pro Kit NUC12WSBi5 | |
| Intel NUC 13 Pro Kit NUC13ANK | |
| Beelink GTR6 | |
| Beelink SER6 Pro | |
| Beelink SER6 Pro Ryzen 7 7735HS | |
| AIDA64 / FP64 Ray-Trace | |
| Minisforum Venus Series UM690 | |
| Beelink GTR6 | |
| Beelink SER6 Pro Ryzen 7 7735HS | |
| Beelink SER6 Pro | |
| Intel NUC 13 Pro Kit NUC13ANK | |
| Intel NUC 12 Pro Kit NUC12WSBi5 | |
| AIDA64 / CPU PhotoWorxx | |
| Beelink GTR6 | |
| Beelink SER6 Pro Ryzen 7 7735HS | |
| Beelink SER6 Pro | |
| Intel NUC 13 Pro Kit NUC13ANK | |
| Intel NUC 12 Pro Kit NUC12WSBi5 | |
| Minisforum Venus Series UM690 | |
Performance du système
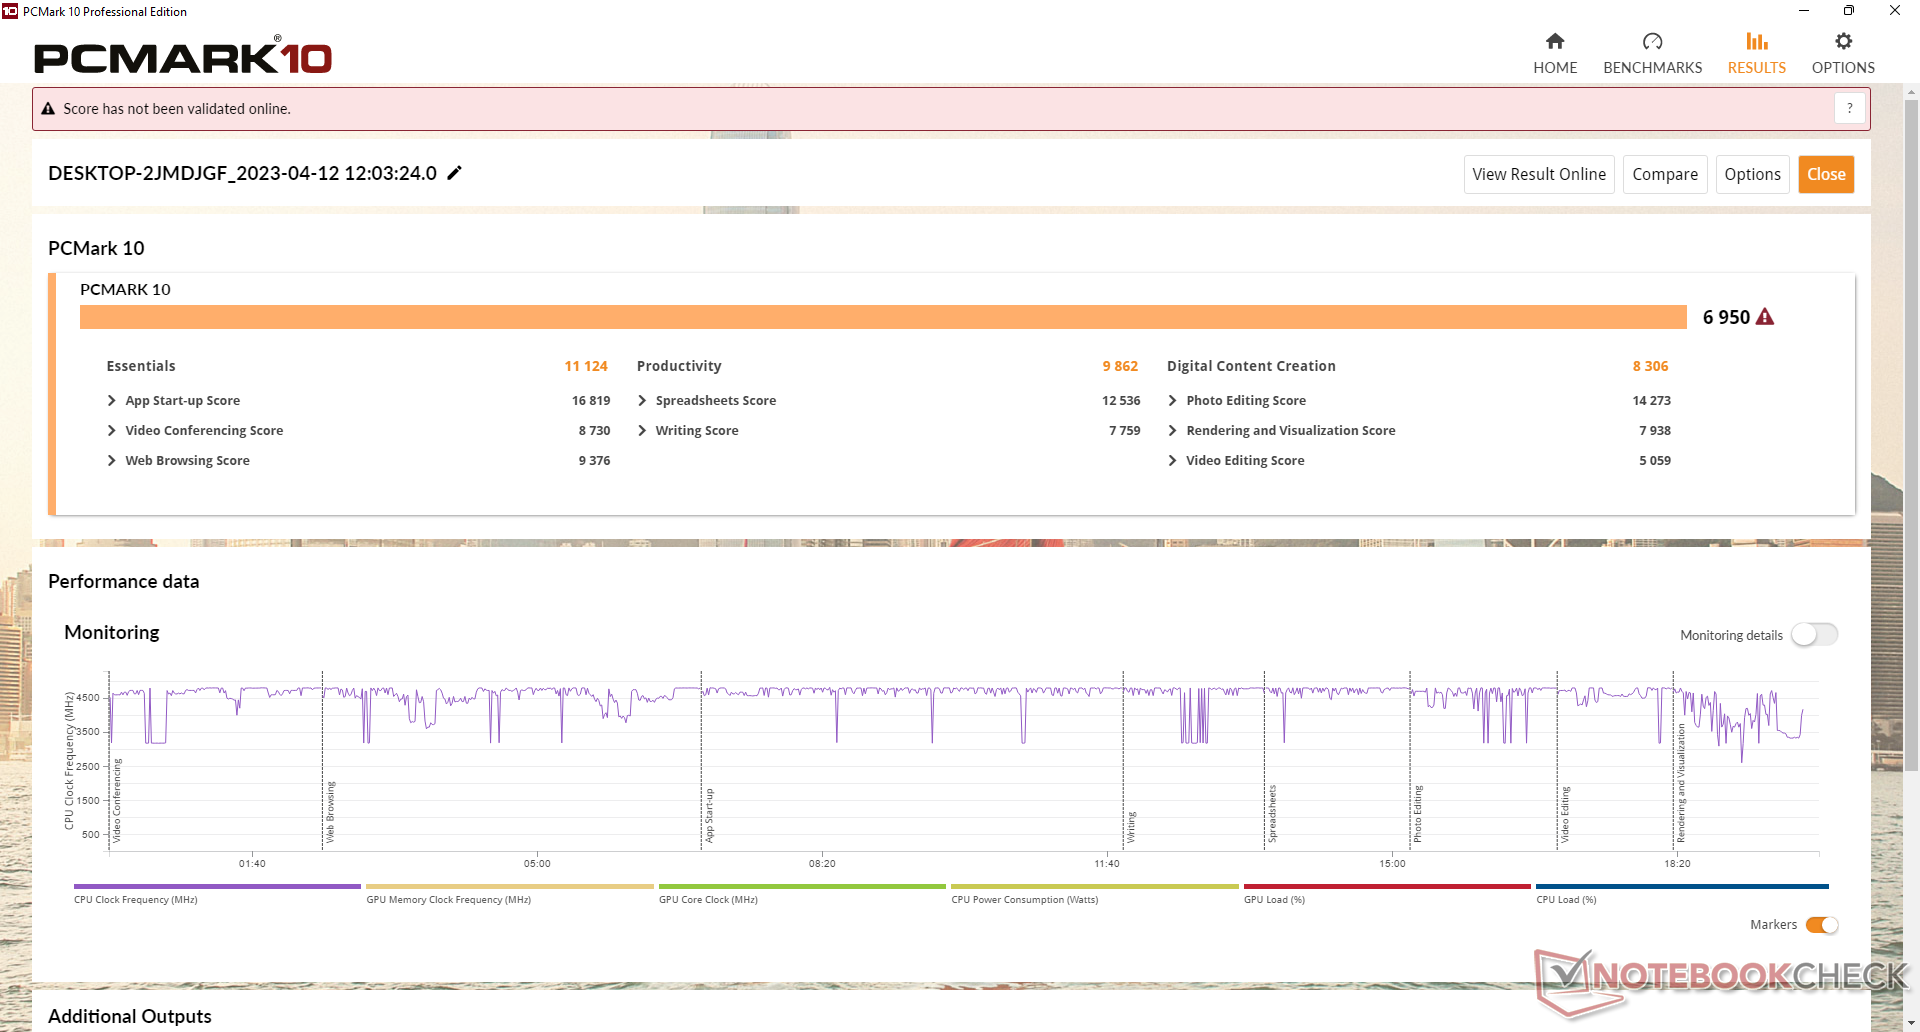
Les benchmarks PCMark sont à nouveau essentiellement identiques à ceux que nous avons enregistrés sur la 2022 SER6 Pro, puisque leurs processeurs sont très similaires.
CrossMark: Overall | Productivity | Creativity | Responsiveness
| PCMark 10 / Score | |
| Beelink GTR6 | |
| Minisforum Venus Series UM690 | |
| Beelink SER6 Pro Ryzen 7 7735HS | |
| Beelink SER6 Pro | |
| Moyenne AMD Ryzen 7 7735HS, AMD Radeon 680M (5722 - 7000, n=8) | |
| Intel NUC 13 Pro Kit NUC13ANK | |
| Intel NUC 12 Pro Kit NUC12WSBi5 | |
| PCMark 10 / Essentials | |
| Intel NUC 13 Pro Kit NUC13ANK | |
| Beelink GTR6 | |
| Beelink SER6 Pro | |
| Beelink SER6 Pro Ryzen 7 7735HS | |
| Minisforum Venus Series UM690 | |
| Intel NUC 12 Pro Kit NUC12WSBi5 | |
| Moyenne AMD Ryzen 7 7735HS, AMD Radeon 680M (8648 - 11124, n=8) | |
| PCMark 10 / Productivity | |
| Beelink GTR6 | |
| Minisforum Venus Series UM690 | |
| Beelink SER6 Pro Ryzen 7 7735HS | |
| Beelink SER6 Pro | |
| Moyenne AMD Ryzen 7 7735HS, AMD Radeon 680M (8428 - 12153, n=8) | |
| Intel NUC 13 Pro Kit NUC13ANK | |
| Intel NUC 12 Pro Kit NUC12WSBi5 | |
| PCMark 10 / Digital Content Creation | |
| Minisforum Venus Series UM690 | |
| Beelink GTR6 | |
| Beelink SER6 Pro | |
| Beelink SER6 Pro Ryzen 7 7735HS | |
| Moyenne AMD Ryzen 7 7735HS, AMD Radeon 680M (5798 - 8726, n=8) | |
| Intel NUC 13 Pro Kit NUC13ANK | |
| Intel NUC 12 Pro Kit NUC12WSBi5 | |
| CrossMark / Overall | |
| Intel NUC 13 Pro Kit NUC13ANK | |
| Beelink SER6 Pro Ryzen 7 7735HS | |
| Minisforum Venus Series UM690 | |
| Beelink SER6 Pro | |
| Beelink GTR6 | |
| Moyenne AMD Ryzen 7 7735HS, AMD Radeon 680M (1280 - 1736, n=8) | |
| CrossMark / Productivity | |
| Intel NUC 13 Pro Kit NUC13ANK | |
| Minisforum Venus Series UM690 | |
| Beelink SER6 Pro Ryzen 7 7735HS | |
| Beelink GTR6 | |
| Beelink SER6 Pro | |
| Moyenne AMD Ryzen 7 7735HS, AMD Radeon 680M (1336 - 1725, n=8) | |
| CrossMark / Creativity | |
| Intel NUC 13 Pro Kit NUC13ANK | |
| Beelink SER6 Pro Ryzen 7 7735HS | |
| Beelink SER6 Pro | |
| Minisforum Venus Series UM690 | |
| Beelink GTR6 | |
| Moyenne AMD Ryzen 7 7735HS, AMD Radeon 680M (1273 - 1785, n=8) | |
| CrossMark / Responsiveness | |
| Minisforum Venus Series UM690 | |
| Beelink SER6 Pro Ryzen 7 7735HS | |
| Beelink GTR6 | |
| Beelink SER6 Pro | |
| Intel NUC 13 Pro Kit NUC13ANK | |
| Moyenne AMD Ryzen 7 7735HS, AMD Radeon 680M (1144 - 1653, n=8) | |
| PCMark 10 Score | 6950 points | |
Aide | ||
| AIDA64 / Memory Copy | |
| Beelink SER6 Pro Ryzen 7 7735HS | |
| Beelink SER6 Pro | |
| Beelink GTR6 | |
| Minisforum Venus Series UM690 | |
| Moyenne AMD Ryzen 7 7735HS (30324 - 52012, n=16) | |
| Intel NUC 13 Pro Kit NUC13ANK | |
| Intel NUC 12 Pro Kit NUC12WSBi5 | |
| AIDA64 / Memory Read | |
| Beelink GTR6 | |
| Beelink SER6 Pro Ryzen 7 7735HS | |
| Beelink SER6 Pro | |
| Minisforum Venus Series UM690 | |
| Intel NUC 12 Pro Kit NUC12WSBi5 | |
| Moyenne AMD Ryzen 7 7735HS (33938 - 51856, n=16) | |
| Intel NUC 13 Pro Kit NUC13ANK | |
| AIDA64 / Memory Write | |
| Beelink GTR6 | |
| Beelink SER6 Pro Ryzen 7 7735HS | |
| Beelink SER6 Pro | |
| Minisforum Venus Series UM690 | |
| Moyenne AMD Ryzen 7 7735HS (33175 - 55284, n=16) | |
| Intel NUC 12 Pro Kit NUC12WSBi5 | |
| Intel NUC 13 Pro Kit NUC13ANK | |
| AIDA64 / Memory Latency | |
| Intel NUC 13 Pro Kit NUC13ANK | |
| Moyenne AMD Ryzen 7 7735HS (78.2 - 109.8, n=16) | |
| Intel NUC 12 Pro Kit NUC12WSBi5 | |
| Beelink SER6 Pro | |
| Minisforum Venus Series UM690 | |
| Beelink GTR6 | |
| Beelink SER6 Pro Ryzen 7 7735HS | |
* ... Moindre est la valeur, meilleures sont les performances
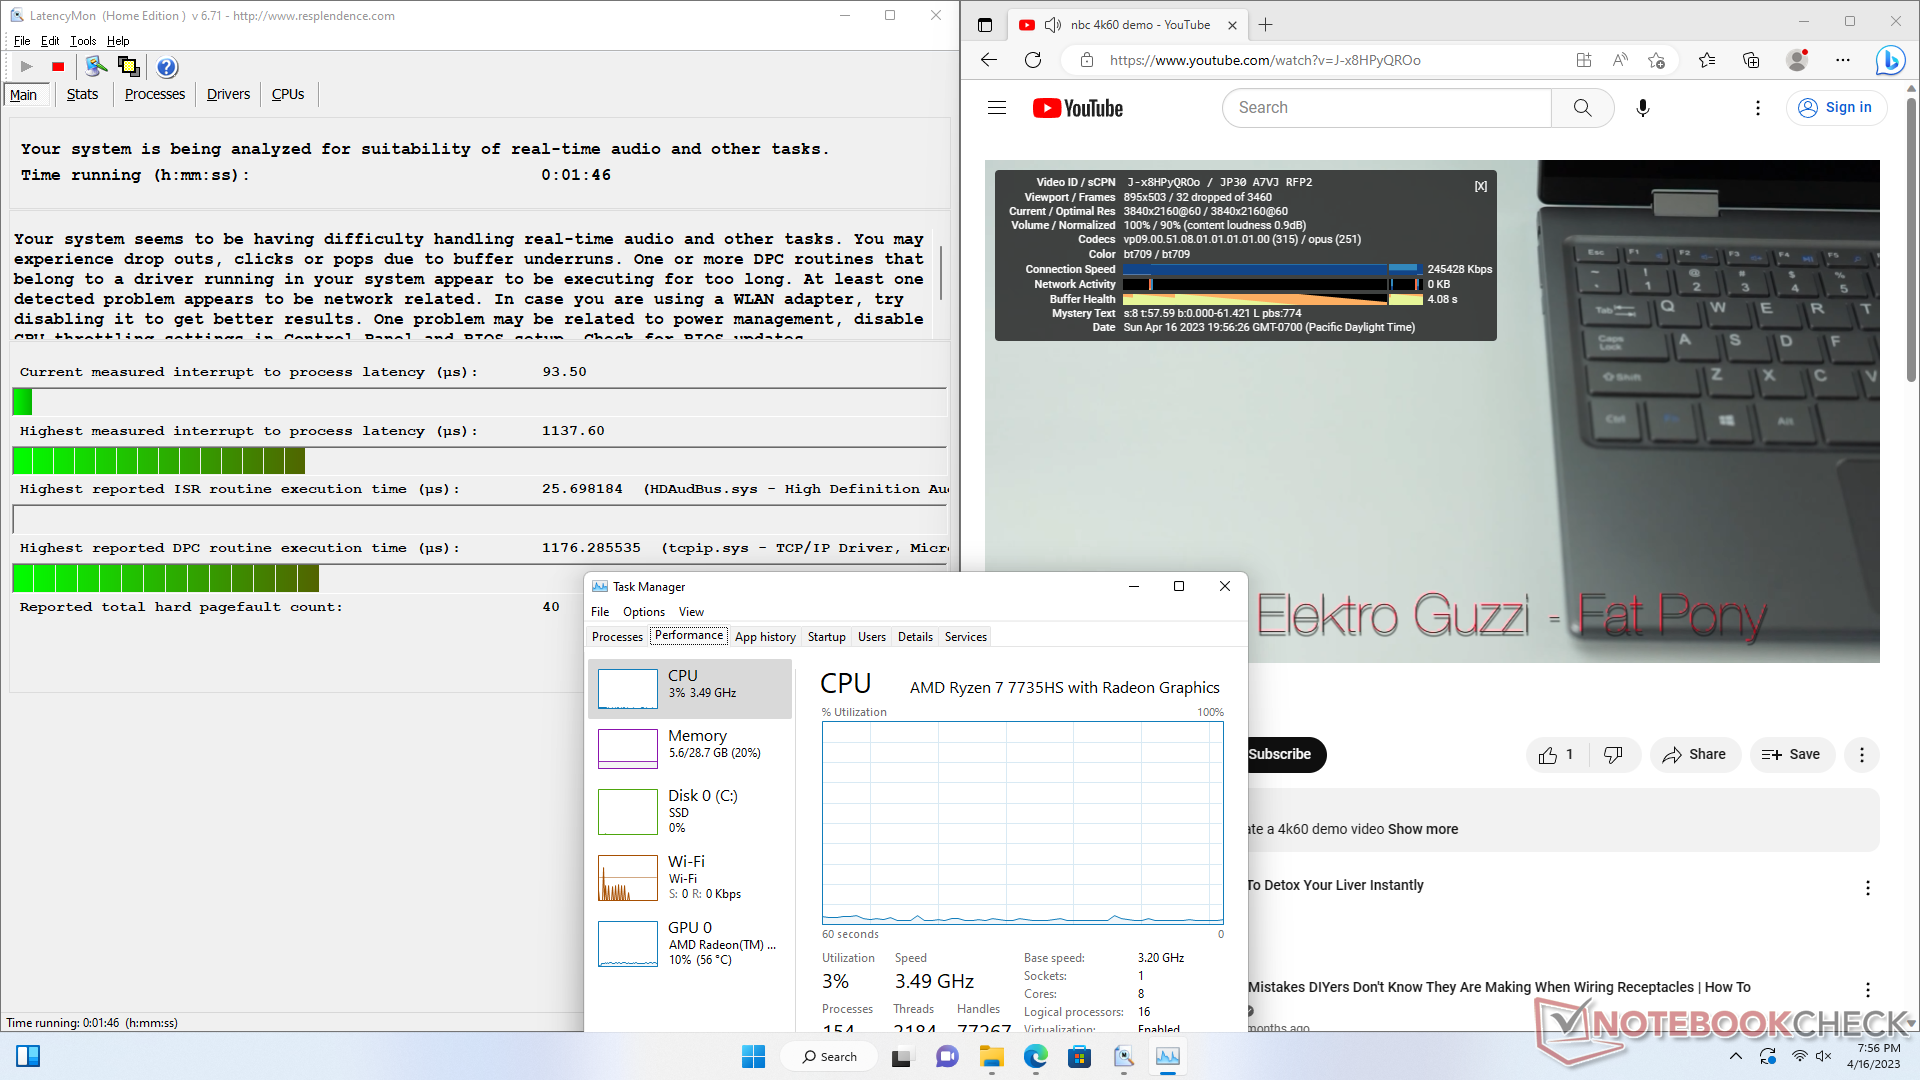
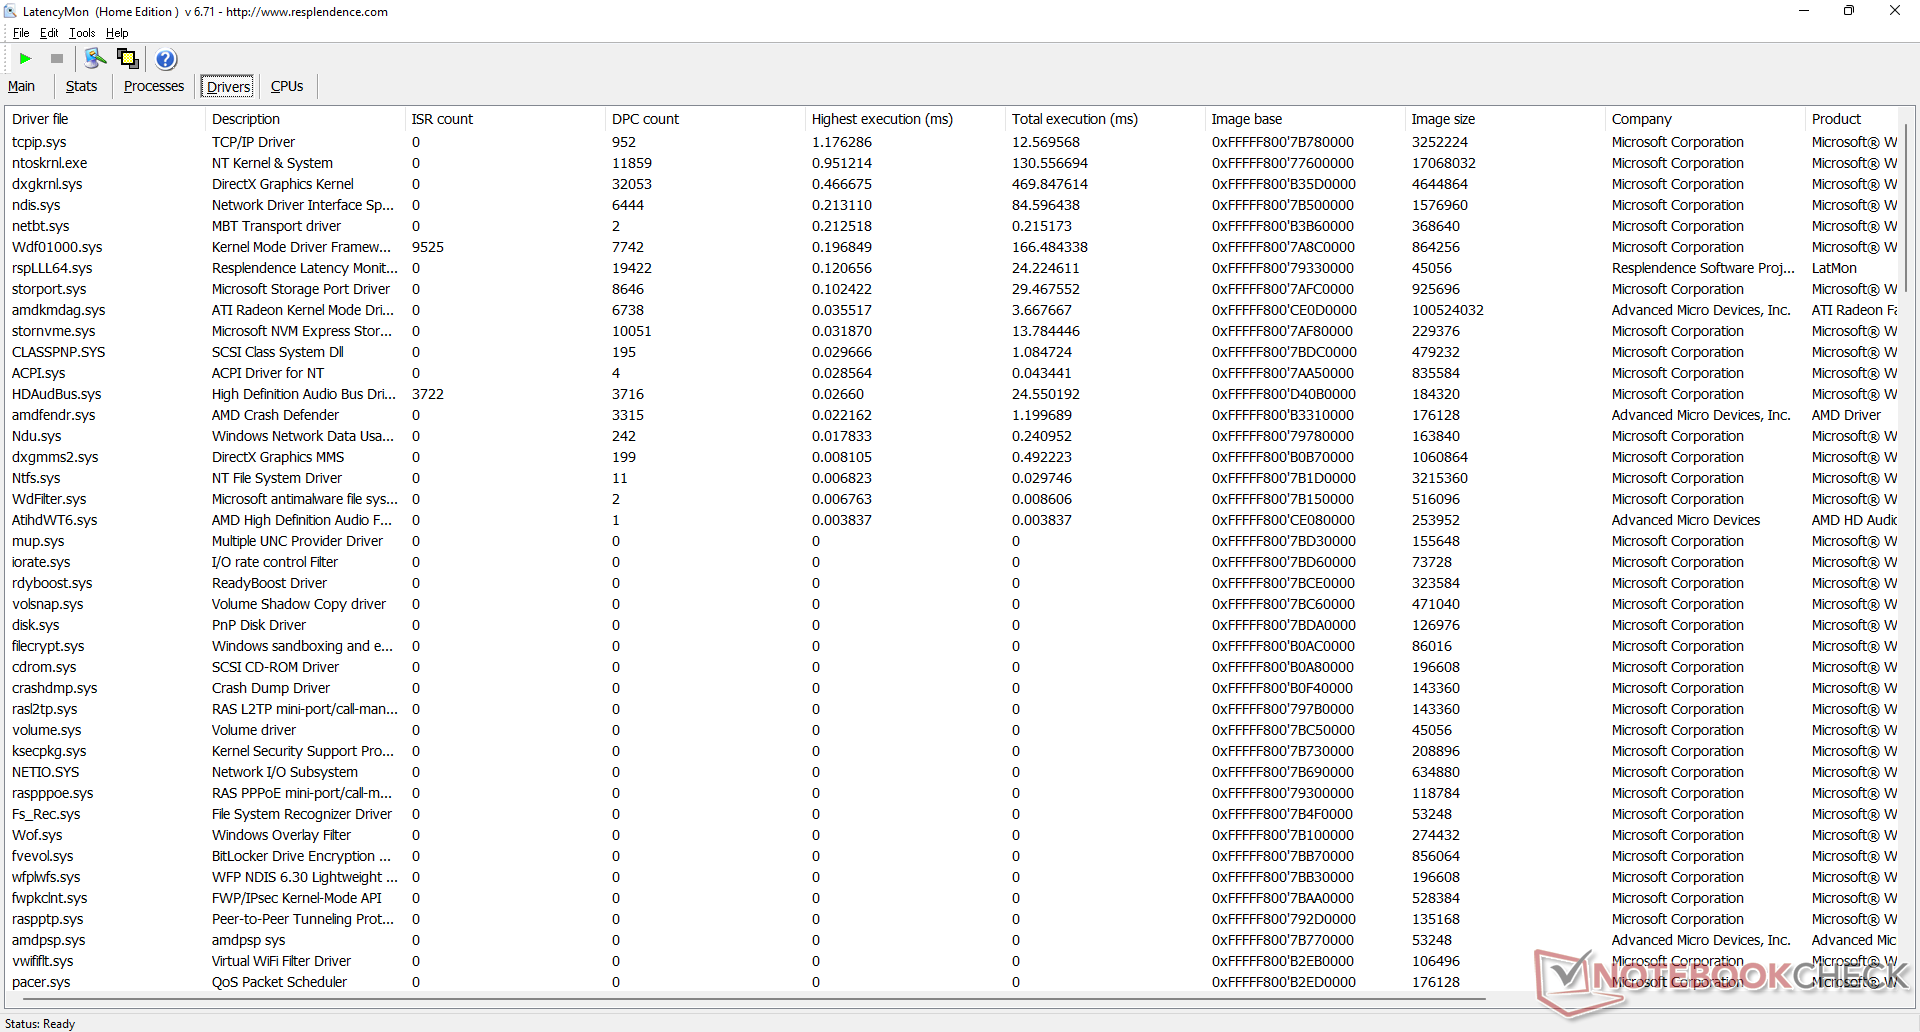
Latence DPC
LatencyMon révèle des problèmes de DPC lors de l'ouverture de plusieurs onglets de notre page d'accueil. En outre, notre appareil présentait des problèmes de lecture vidéo 4K60 avec 32 images perdues au cours de notre vidéo de test d'une durée d'une minute.
| DPC Latencies / LatencyMon - interrupt to process latency (max), Web, Youtube, Prime95 | |
| Minisforum Venus Series UM690 | |
| Beelink SER6 Pro | |
| Beelink SER6 Pro Ryzen 7 7735HS | |
| Intel NUC 13 Pro Kit NUC13ANK | |
| Intel NUC 12 Pro Kit NUC12WSBi5 | |
| Beelink GTR6 | |
* ... Moindre est la valeur, meilleures sont les performances
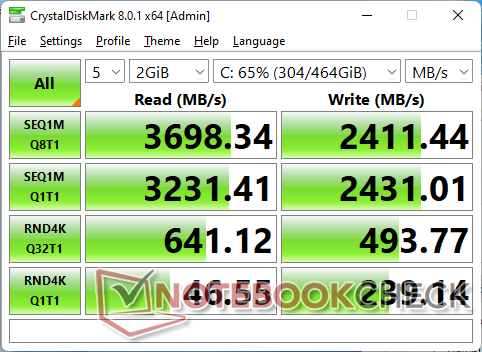
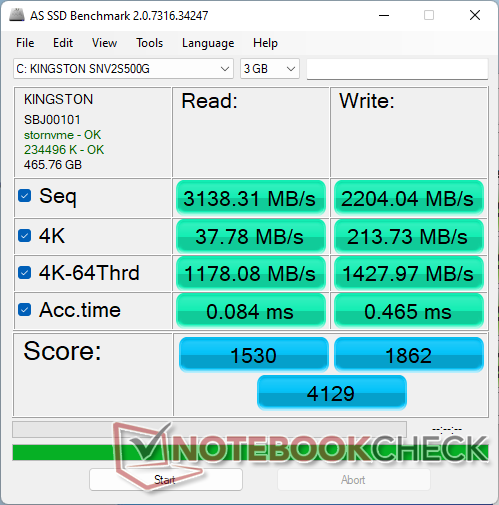
Dispositifs de stockage
Notre unité 2023 SER6 Pro est livrée avec le même Kingston NV2 500GB SNV2S/500G que le modèle de l'année dernière.

| Drive Performance rating - Percent | |
| Beelink GTR6 | |
| Minisforum Venus Series UM690 | |
| Intel NUC 13 Pro Kit NUC13ANK | |
| Beelink SER6 Pro | |
| Beelink SER6 Pro Ryzen 7 7735HS | |
| Intel NUC 12 Pro Kit NUC12WSBi5 | |
* ... Moindre est la valeur, meilleures sont les performances
Disk Throttling: DiskSpd Read Loop, Queue Depth 8
Performance du GPU
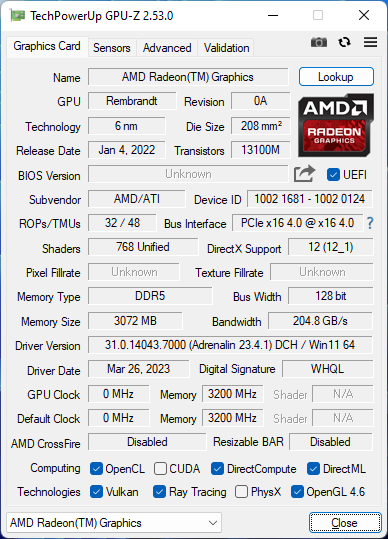
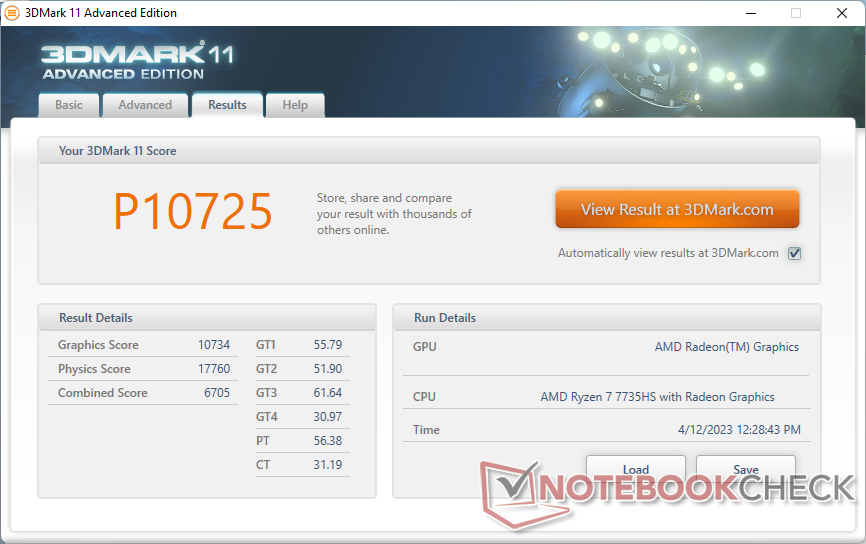
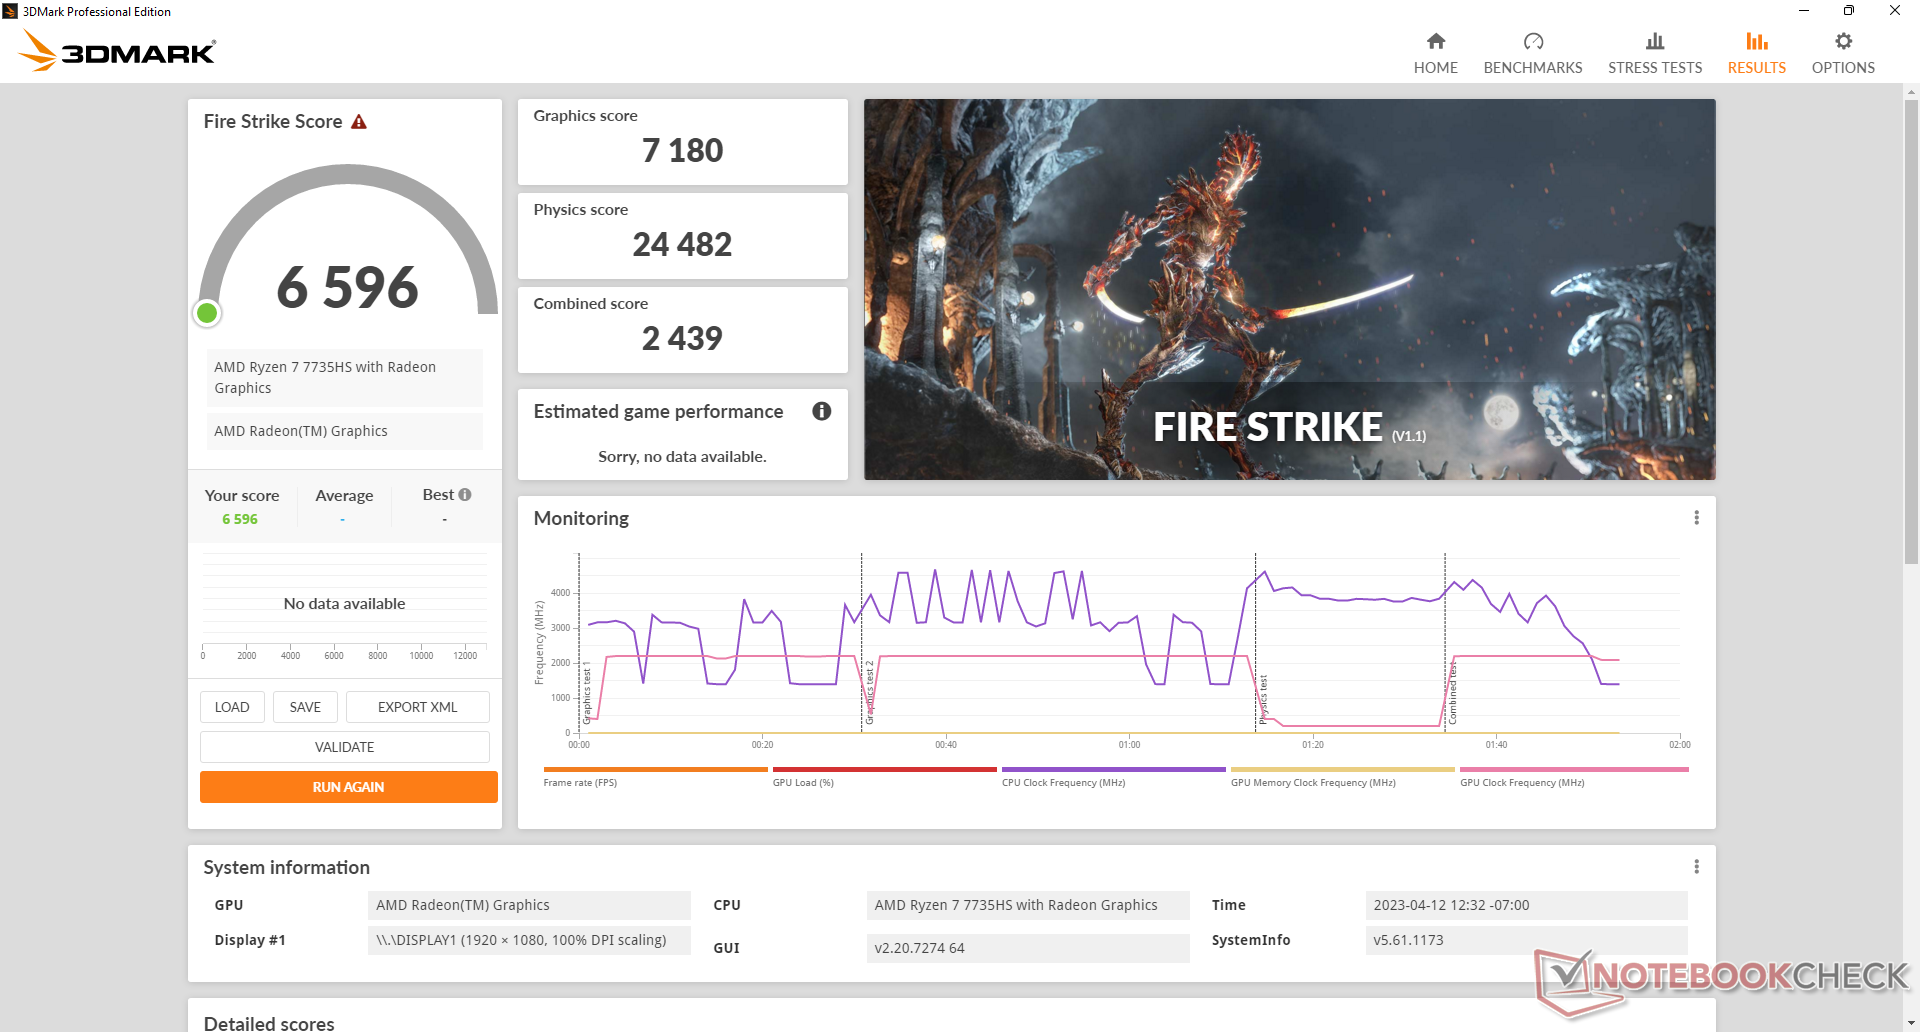
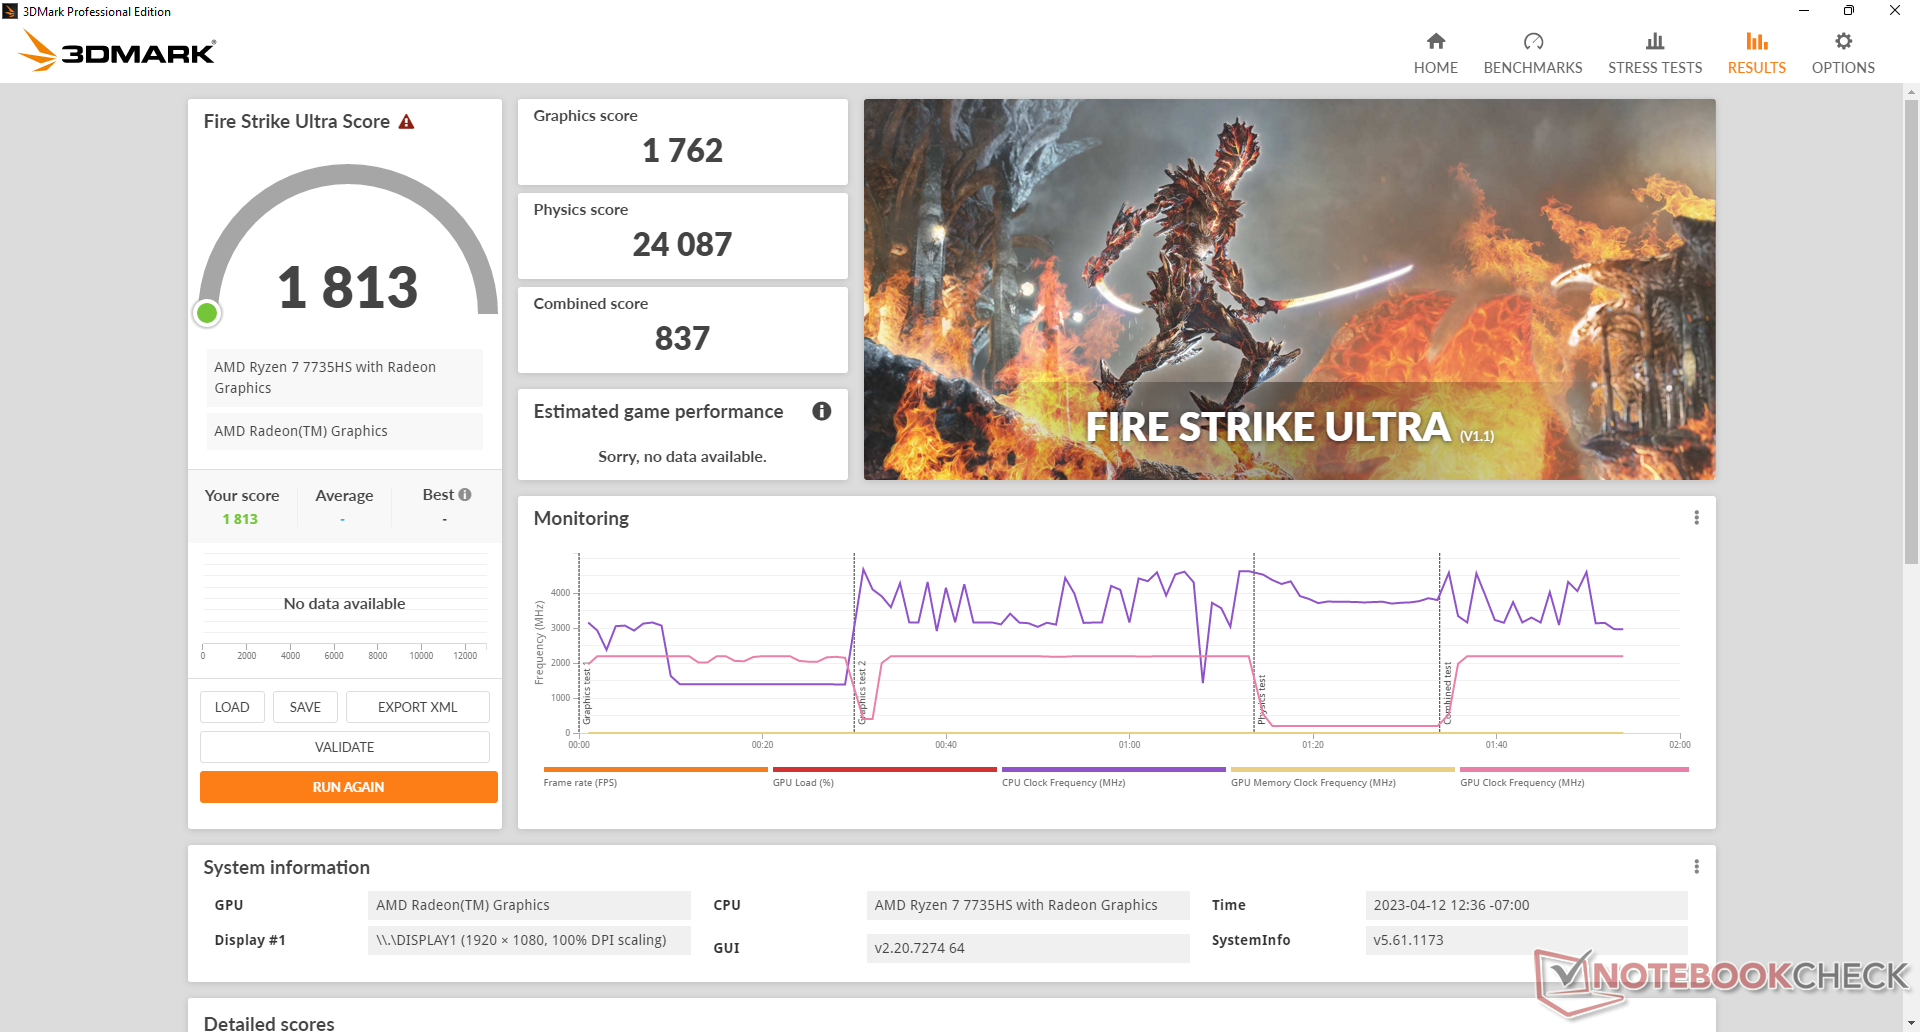
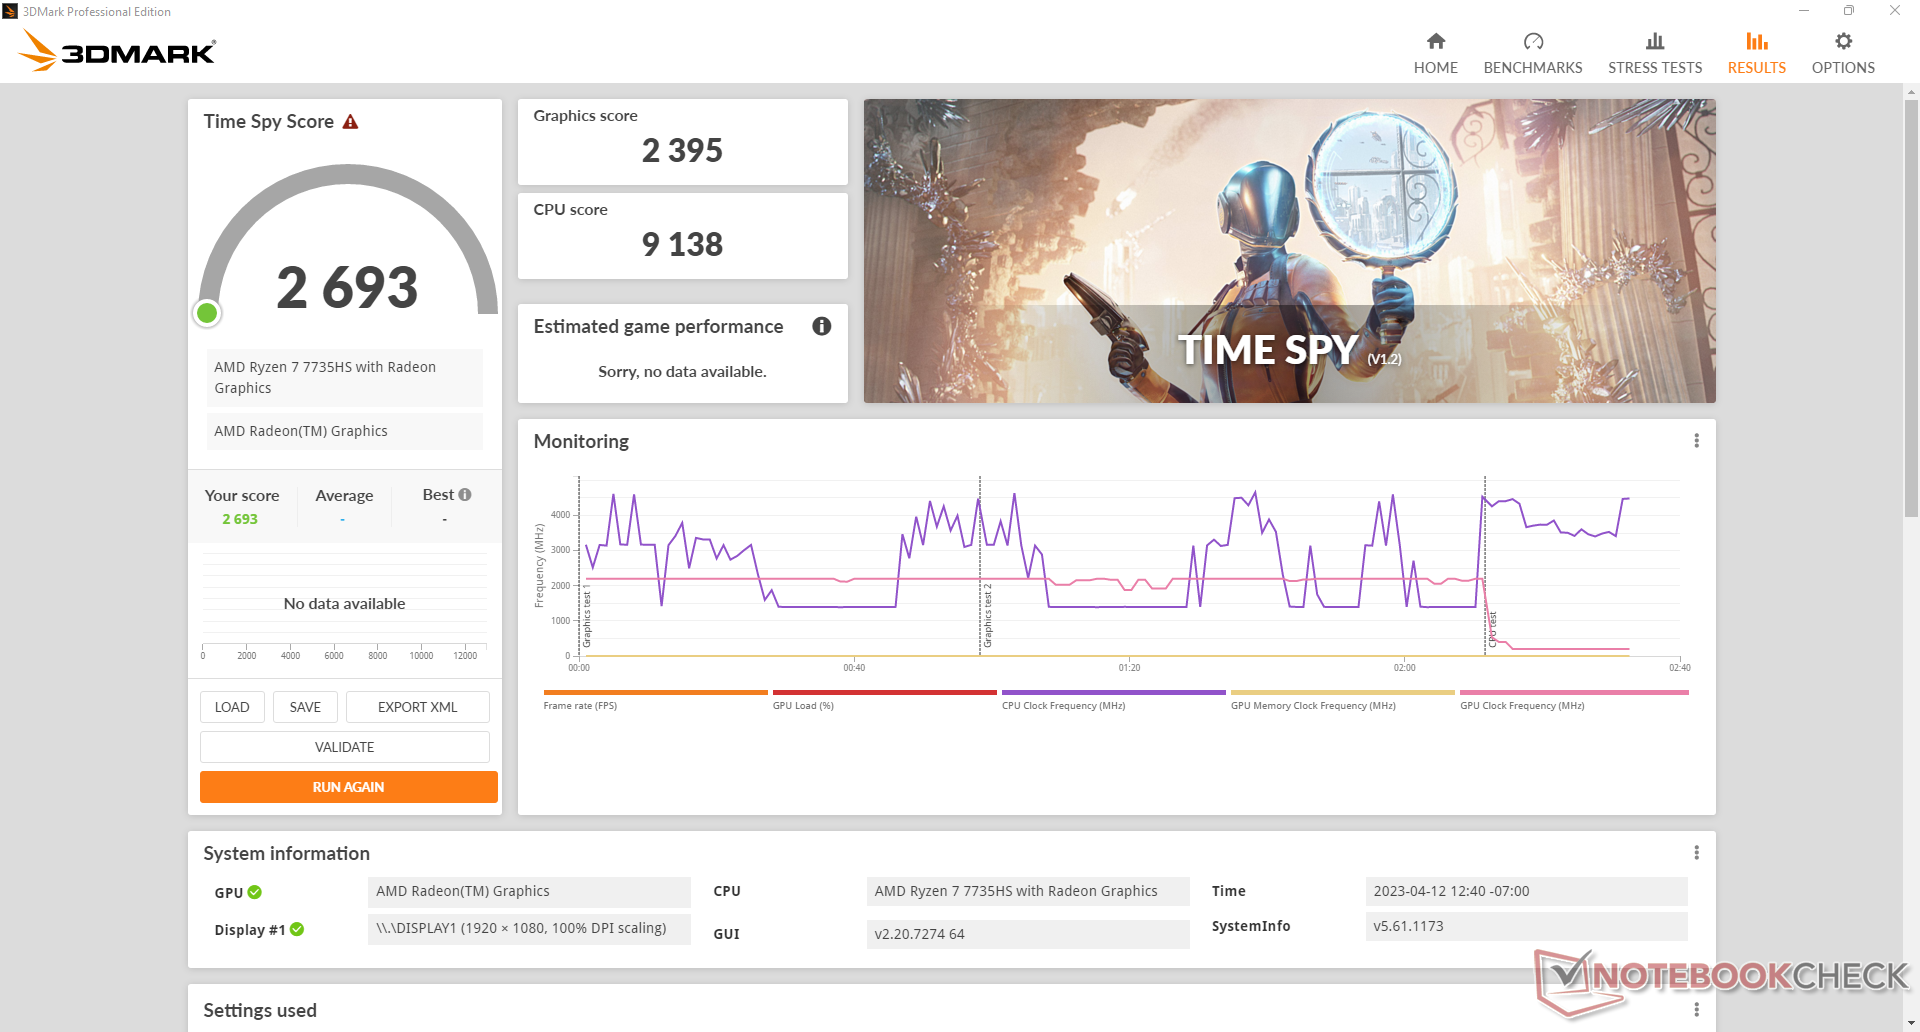
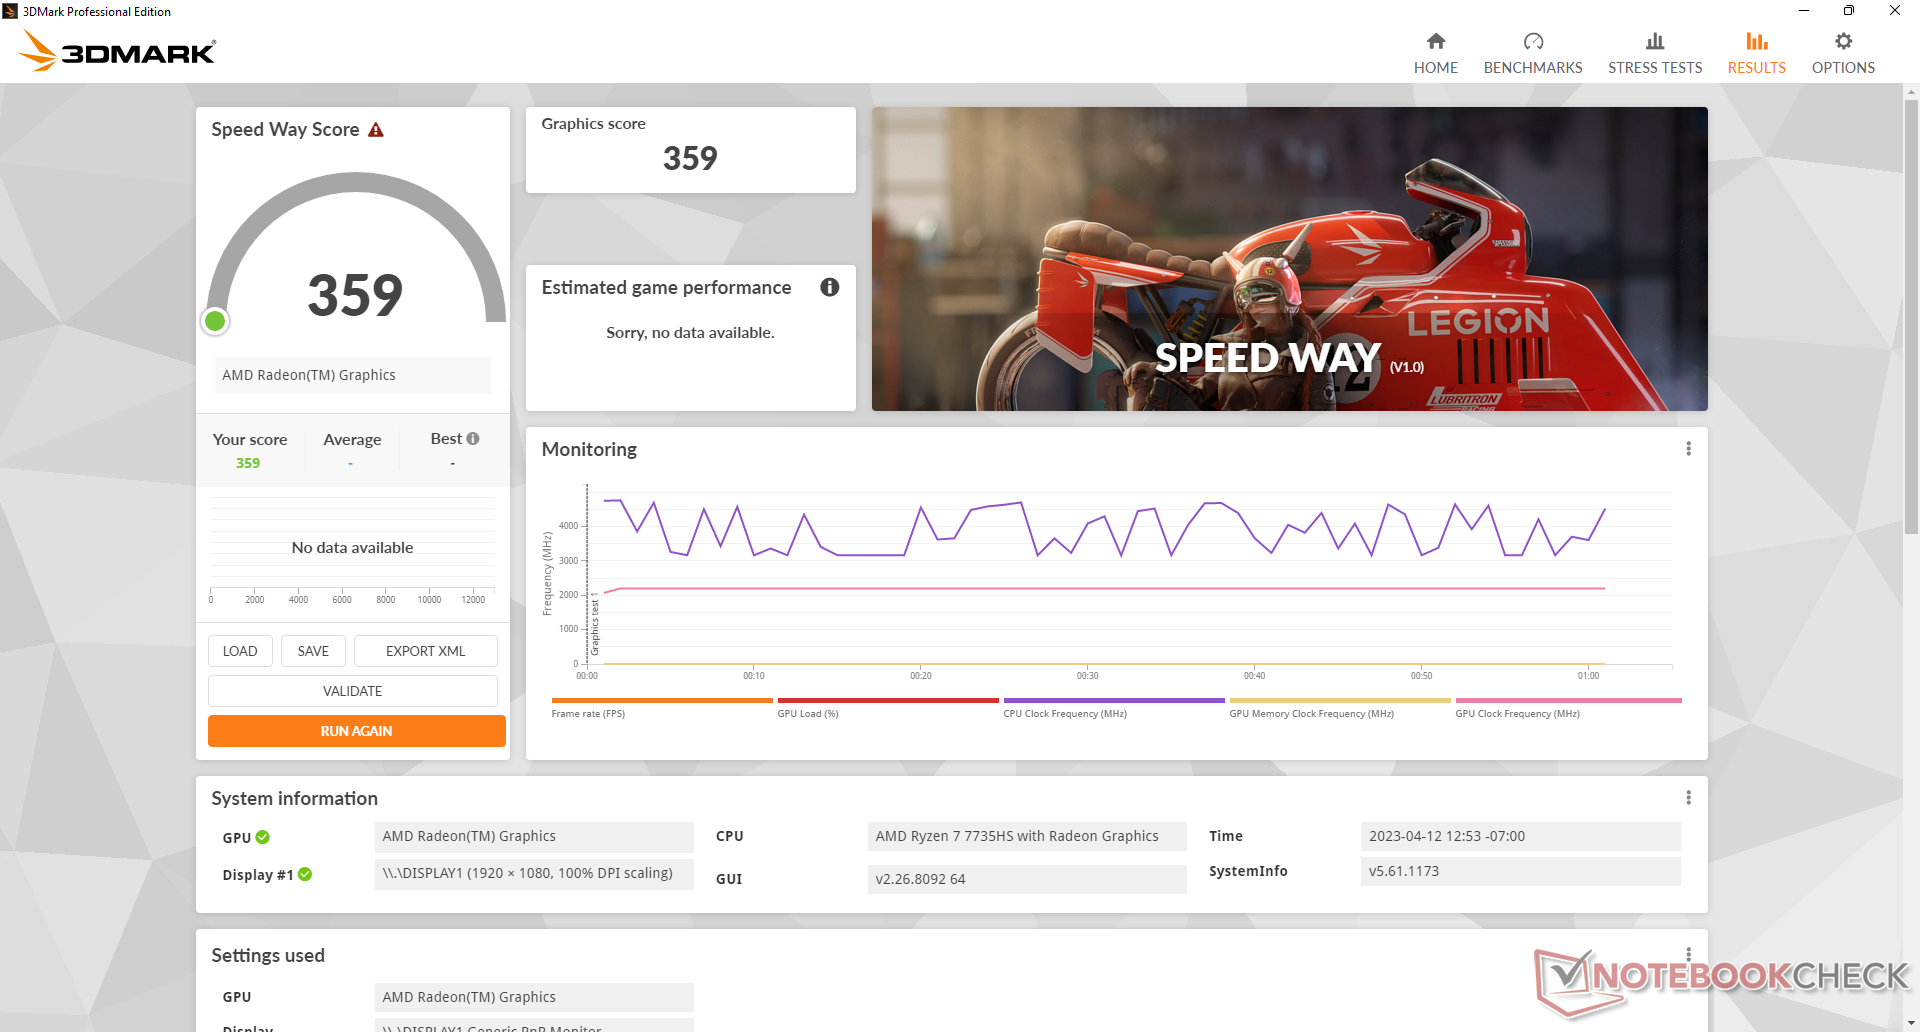
Les performances graphiques sont les mêmes que sur les Ryzen 7 6800H ou Ryzen 9 6900HX de l'année dernière, puisque tous ces processeurs intègrent le même GPU Radeon 680M. Ce n'est pas nécessairement une mauvaise chose car la Radeon 680M est déjà bien plus performante que l'Intel Iris Xe 96 EU de 40 à 60 %, mais les utilisateurs qui s'attendaient à un coup de pouce cette année seront déçus.
Le ralenti sur Witcher 3 révèle des problèmes de stabilité des performances, les taux d'images chutant fréquemment sans raison apparente, comme le montre notre graphique ci-dessous. Ce comportement suggère une mauvaise priorisation des activités en arrière-plan ou des problèmes de pilotes avec le GPU intégré. Nous avons mis à jour nos pilotes Radeon avec les dernières versions à la date de publication.
| 3DMark Performance rating - Percent | |
| Beelink SER6 Pro | |
| Beelink SER6 Pro Ryzen 7 7735HS | |
| Beelink GTR6 | |
| Moyenne AMD Radeon 680M | |
| Intel NUC 13 Pro Kit NUC13ANK | |
| Intel NUC Pro Chassis_i7_1265U | |
| Trigkey Speed S | |
| Intel NUC 12 Pro Kit NUC12WSBi5 -2! | |
| Intel NUC Pro Chassis_i5_1245U | |
| 3DMark 11 - 1280x720 Performance GPU | |
| Beelink SER6 Pro | |
| Beelink SER6 Pro Ryzen 7 7735HS | |
| Beelink GTR6 | |
| Moyenne AMD Radeon 680M (6858 - 11755, n=39) | |
| Intel NUC 13 Pro Kit NUC13ANK | |
| Trigkey Speed S | |
| Intel NUC Pro Chassis_i7_1265U | |
| Intel NUC 12 Pro Kit NUC12WSBi5 | |
| Intel NUC Pro Chassis_i5_1245U | |
| 3DMark 11 Performance | 10725 points | |
| 3DMark Fire Strike Score | 6596 points | |
| 3DMark Time Spy Score | 2693 points | |
Aide | ||
| Performance rating - Percent | |
| Beelink SER6 Pro | |
| Beelink GTR6 | |
| Beelink SER6 Pro Ryzen 7 7735HS | |
| Intel NUC Pro Chassis_i7_1265U -1! | |
| Intel NUC 13 Pro Kit NUC13ANK -2! | |
| Trigkey Speed S | |
| Intel NUC Pro Chassis_i5_1245U -1! | |
| Intel NUC 12 Pro Kit NUC12WSBi5 -4! | |
| The Witcher 3 - 1920x1080 Ultra Graphics & Postprocessing (HBAO+) | |
| Beelink GTR6 | |
| Beelink SER6 Pro | |
| Beelink SER6 Pro Ryzen 7 7735HS | |
| Intel NUC 13 Pro Kit NUC13ANK | |
| Trigkey Speed S | |
| Final Fantasy XV Benchmark - 1920x1080 High Quality | |
| Intel NUC Pro Chassis_i7_1265U | |
| Beelink SER6 Pro Ryzen 7 7735HS | |
| Beelink SER6 Pro | |
| Beelink GTR6 | |
| Trigkey Speed S | |
| Intel NUC Pro Chassis_i5_1245U | |
| Dota 2 Reborn - 1920x1080 ultra (3/3) best looking | |
| Beelink SER6 Pro | |
| Beelink SER6 Pro Ryzen 7 7735HS | |
| Beelink GTR6 | |
| Intel NUC Pro Chassis_i7_1265U | |
| Intel NUC 13 Pro Kit NUC13ANK | |
| Trigkey Speed S | |
| Intel NUC Pro Chassis_i5_1245U | |
| Intel NUC 12 Pro Kit NUC12WSBi5 | |
| X-Plane 11.11 - 1920x1080 high (fps_test=3) | |
| Beelink SER6 Pro | |
| Beelink SER6 Pro Ryzen 7 7735HS | |
| Beelink GTR6 | |
| Trigkey Speed S | |
| Intel NUC Pro Chassis_i7_1265U | |
| Intel NUC Pro Chassis_i5_1245U | |
| Strange Brigade - 1920x1080 ultra AA:ultra AF:16 | |
| Beelink SER6 Pro | |
| Beelink GTR6 | |
| Beelink SER6 Pro Ryzen 7 7735HS | |
| Intel NUC 13 Pro Kit NUC13ANK | |
| Intel NUC Pro Chassis_i7_1265U | |
| Trigkey Speed S | |
| Intel NUC Pro Chassis_i5_1245U | |
| Final Fantasy XV Benchmark | |
| 1280x720 Lite Quality | |
| Beelink GTR6 | |
| Beelink SER6 Pro | |
| Beelink SER6 Pro Ryzen 7 7735HS | |
| Moyenne AMD Radeon 680M (34.4 - 74.7, n=39) | |
| Intel NUC Pro Chassis_i7_1265U | |
| Intel NUC Pro Chassis_i5_1245U | |
| Trigkey Speed S | |
| Intel NUC 12 Pro Kit NUC12WSBi5 | |
| 1920x1080 Standard Quality | |
| Beelink GTR6 | |
| Beelink SER6 Pro | |
| Beelink SER6 Pro Ryzen 7 7735HS | |
| Moyenne AMD Radeon 680M (18.3 - 36.9, n=40) | |
| Intel NUC Pro Chassis_i7_1265U | |
| Intel NUC Pro Chassis_i5_1245U | |
| Trigkey Speed S | |
| Intel NUC 12 Pro Kit NUC12WSBi5 | |
| 1920x1080 High Quality | |
| Intel NUC Pro Chassis_i7_1265U | |
| Beelink SER6 Pro Ryzen 7 7735HS | |
| Beelink SER6 Pro | |
| Beelink GTR6 | |
| Moyenne AMD Radeon 680M (12.9 - 26.2, n=40) | |
| Trigkey Speed S | |
| Intel NUC Pro Chassis_i5_1245U | |
| X-Plane 11.11 | |
| 1280x720 low (fps_test=1) | |
| Beelink SER6 Pro | |
| Beelink SER6 Pro Ryzen 7 7735HS | |
| Beelink GTR6 | |
| Moyenne AMD Radeon 680M (26.8 - 66.7, n=41) | |
| Trigkey Speed S | |
| Intel NUC Pro Chassis_i5_1245U | |
| Intel NUC Pro Chassis_i7_1265U | |
| 1920x1080 med (fps_test=2) | |
| Beelink SER6 Pro | |
| Beelink GTR6 | |
| Beelink SER6 Pro Ryzen 7 7735HS | |
| Trigkey Speed S | |
| Moyenne AMD Radeon 680M (21.1 - 53.1, n=41) | |
| Intel NUC Pro Chassis_i7_1265U | |
| Intel NUC Pro Chassis_i5_1245U | |
| 1920x1080 high (fps_test=3) | |
| Beelink SER6 Pro | |
| Beelink SER6 Pro Ryzen 7 7735HS | |
| Beelink GTR6 | |
| Trigkey Speed S | |
| Moyenne AMD Radeon 680M (16.6 - 44.5, n=41) | |
| Intel NUC Pro Chassis_i7_1265U | |
| Intel NUC Pro Chassis_i5_1245U | |
| Strange Brigade | |
| 1280x720 lowest AF:1 | |
| Beelink GTR6 | |
| Beelink SER6 Pro | |
| Beelink SER6 Pro Ryzen 7 7735HS | |
| Moyenne AMD Radeon 680M (72.9 - 167.5, n=38) | |
| Intel NUC 13 Pro Kit NUC13ANK | |
| Intel NUC Pro Chassis_i7_1265U | |
| Trigkey Speed S | |
| Intel NUC Pro Chassis_i5_1245U | |
| 1920x1080 medium AA:medium AF:4 | |
| Beelink SER6 Pro | |
| Beelink GTR6 | |
| Beelink SER6 Pro Ryzen 7 7735HS | |
| Moyenne AMD Radeon 680M (30 - 63, n=38) | |
| Intel NUC Pro Chassis_i7_1265U | |
| Intel NUC 13 Pro Kit NUC13ANK | |
| Trigkey Speed S | |
| Intel NUC Pro Chassis_i5_1245U | |
| 1920x1080 high AA:high AF:8 | |
| Beelink SER6 Pro | |
| Beelink GTR6 | |
| Beelink SER6 Pro Ryzen 7 7735HS | |
| Moyenne AMD Radeon 680M (25.3 - 53.1, n=38) | |
| Intel NUC 13 Pro Kit NUC13ANK | |
| Intel NUC Pro Chassis_i7_1265U | |
| Trigkey Speed S | |
| Intel NUC Pro Chassis_i5_1245U | |
| 1920x1080 ultra AA:ultra AF:16 | |
| Beelink SER6 Pro | |
| Beelink GTR6 | |
| Beelink SER6 Pro Ryzen 7 7735HS | |
| Moyenne AMD Radeon 680M (22 - 46, n=38) | |
| Intel NUC 13 Pro Kit NUC13ANK | |
| Intel NUC Pro Chassis_i7_1265U | |
| Trigkey Speed S | |
| Intel NUC Pro Chassis_i5_1245U | |
| Cyberpunk 2077 1.6 | |
| 1920x1080 Low Preset | |
| Beelink SER6 Pro | |
| Beelink GTR6 | |
| Beelink SER6 Pro Ryzen 7 7735HS | |
| Moyenne AMD Radeon 680M (26 - 50.6, n=15) | |
| 1920x1080 Medium Preset | |
| Beelink SER6 Pro | |
| Beelink GTR6 | |
| Beelink SER6 Pro Ryzen 7 7735HS | |
| Moyenne AMD Radeon 680M (20.1 - 41.8, n=15) | |
| 1280x720 Low Preset | |
| Beelink SER6 Pro | |
| Beelink GTR6 | |
| Beelink SER6 Pro Ryzen 7 7735HS | |
| Moyenne AMD Radeon 680M (46.1 - 77.6, n=14) | |
| 1920x1080 High Preset | |
| Beelink GTR6 | |
| Beelink SER6 Pro Ryzen 7 7735HS | |
| Moyenne AMD Radeon 680M (16.3 - 33.6, n=15) | |
| Beelink SER6 Pro | |
| 1920x1080 Ultra Preset | |
| Beelink GTR6 | |
| Beelink SER6 Pro Ryzen 7 7735HS | |
| Moyenne AMD Radeon 680M (14 - 23.8, n=15) | |
| Beelink SER6 Pro | |
| F1 22 | |
| 1280x720 Ultra Low Preset AA:T AF:16x | |
| Beelink SER6 Pro Ryzen 7 7735HS | |
| Moyenne AMD Radeon 680M (75.5 - 147.3, n=19) | |
| Intel NUC 13 Pro Kit NUC13ANK | |
| Intel NUC Pro Chassis_i7_1265U | |
| Intel NUC Pro Chassis_i5_1245U | |
| 1920x1080 Low Preset AA:T AF:16x | |
| Beelink SER6 Pro Ryzen 7 7735HS | |
| Moyenne AMD Radeon 680M (44.1 - 85.4, n=25) | |
| Intel NUC 13 Pro Kit NUC13ANK | |
| Intel NUC Pro Chassis_i7_1265U | |
| Intel NUC Pro Chassis_i5_1245U | |
| 1920x1080 Medium Preset AA:T AF:16x | |
| Beelink SER6 Pro Ryzen 7 7735HS | |
| Moyenne AMD Radeon 680M (38 - 75.1, n=25) | |
| Intel NUC 13 Pro Kit NUC13ANK | |
| Intel NUC Pro Chassis_i7_1265U | |
| Intel NUC Pro Chassis_i5_1245U | |
| 1920x1080 High Preset AA:T AF:16x | |
| Beelink SER6 Pro Ryzen 7 7735HS | |
| Moyenne AMD Radeon 680M (30 - 56.2, n=25) | |
| Intel NUC 13 Pro Kit NUC13ANK | |
| Intel NUC Pro Chassis_i7_1265U | |
| Intel NUC Pro Chassis_i5_1245U | |
| 1920x1080 Ultra High Preset AA:T AF:16x | |
| Intel NUC 13 Pro Kit NUC13ANK | |
| Intel NUC Pro Chassis_i7_1265U | |
| Beelink SER6 Pro Ryzen 7 7735HS | |
| Moyenne AMD Radeon 680M (7.85 - 14.7, n=22) | |
Witcher 3 FPS Chart
| Bas | Moyen | Élevé | Ultra | |
|---|---|---|---|---|
| The Witcher 3 (2015) | 115.6 | 79.8 | 42.4 | 25.2 |
| Dota 2 Reborn (2015) | 142.2 | 113.5 | 89.1 | 72.8 |
| Final Fantasy XV Benchmark (2018) | 62.2 | 33 | 24.7 | |
| X-Plane 11.11 (2018) | 65.2 | 52.3 | 42.2 | |
| Strange Brigade (2018) | 137.8 | 56.4 | 47.1 | 40.7 |
| Cyberpunk 2077 1.6 (2022) | 40.8 | 31.8 | 21.8 | 17.5 |
| Tiny Tina's Wonderlands (2022) | 58.6 | 44.4 | 29.9 | 23.1 |
| F1 22 (2022) | 80.1 | 69.5 | 52.9 | 13.9 |
Émissions
Bruit du système
Il y a de légères différences dans le bruit du ventilateur par rapport au modèle de l'année dernière, mais ils atteignent tous les deux un maximum similaire de ~40 dB(A) lorsqu'ils fonctionnent avec des charges très exigeantes comme les jeux. Lors de l'utilisation de charges plus faibles comme les navigateurs, le nouveau modèle semble fonctionner plus silencieusement pendant de plus longues périodes avant de recourir à des vitesses de rotation plus élevées du ventilateur.
Degré de la nuisance sonore
| Au repos |
| 23.3 / 23.3 / 26.2 dB(A) |
| Fortement sollicité |
| 40.2 / 40.2 dB(A) |
 | ||
30 dB silencieux 40 dB(A) audible 50 dB(A) bruyant |
||
min: | ||
| Beelink SER6 Pro Ryzen 7 7735HS Radeon 680M, R7 7735HS, Kingston NV2 500GB SNV2S/500G | Beelink SER6 Pro Radeon 680M, R7 6800H, Kingston NV2 500GB SNV2S/500G | Beelink GTR6 Radeon 680M, R9 6900HX, Kingston KC3000 512G SKC3000S512G | Intel NUC 13 Pro Kit NUC13ANK Iris Xe G7 96EUs, i7-1360P, Samsung PM9A1 MZVL2512HCJQ | Intel NUC 12 Pro Kit NUC12WSBi5 Iris Xe G7 80EUs, i5-1240P, Lexar 512GB NM6A1 LNM6A1X512G-HNNG | Minisforum Venus Series UM690 Radeon 680M, R9 6900HX, Kingston OM8PGP4512Q-A0 | |
|---|---|---|---|---|---|---|
| Noise | -5% | -8% | -19% | -16% | ||
| arrêt / environnement * (dB) | 23.3 | 22.8 2% | 23.2 -0% | 29.8 -28% | 30.5 -31% | |
| Idle Minimum * (dB) | 23.3 | 24.1 -3% | 23.6 -1% | 30.2 -30% | 31.6 -36% | |
| Idle Average * (dB) | 23.3 | 24.1 -3% | 23.8 -2% | 31.1 -33% | 31.6 -36% | |
| Idle Maximum * (dB) | 26.2 | 33.8 -29% | 36.2 -38% | 31.9 -22% | 31.6 -21% | |
| Load Average * (dB) | 40.2 | 40.1 -0% | 39.7 1% | 40 -0% | 33.9 16% | |
| Witcher 3 ultra * (dB) | 37 | 38.7 -5% | 41 -11% | |||
| Load Maximum * (dB) | 40.2 | 40.1 -0% | 43 -7% | 40.5 -1% | 34.4 14% |
* ... Moindre est la valeur, meilleures sont les performances
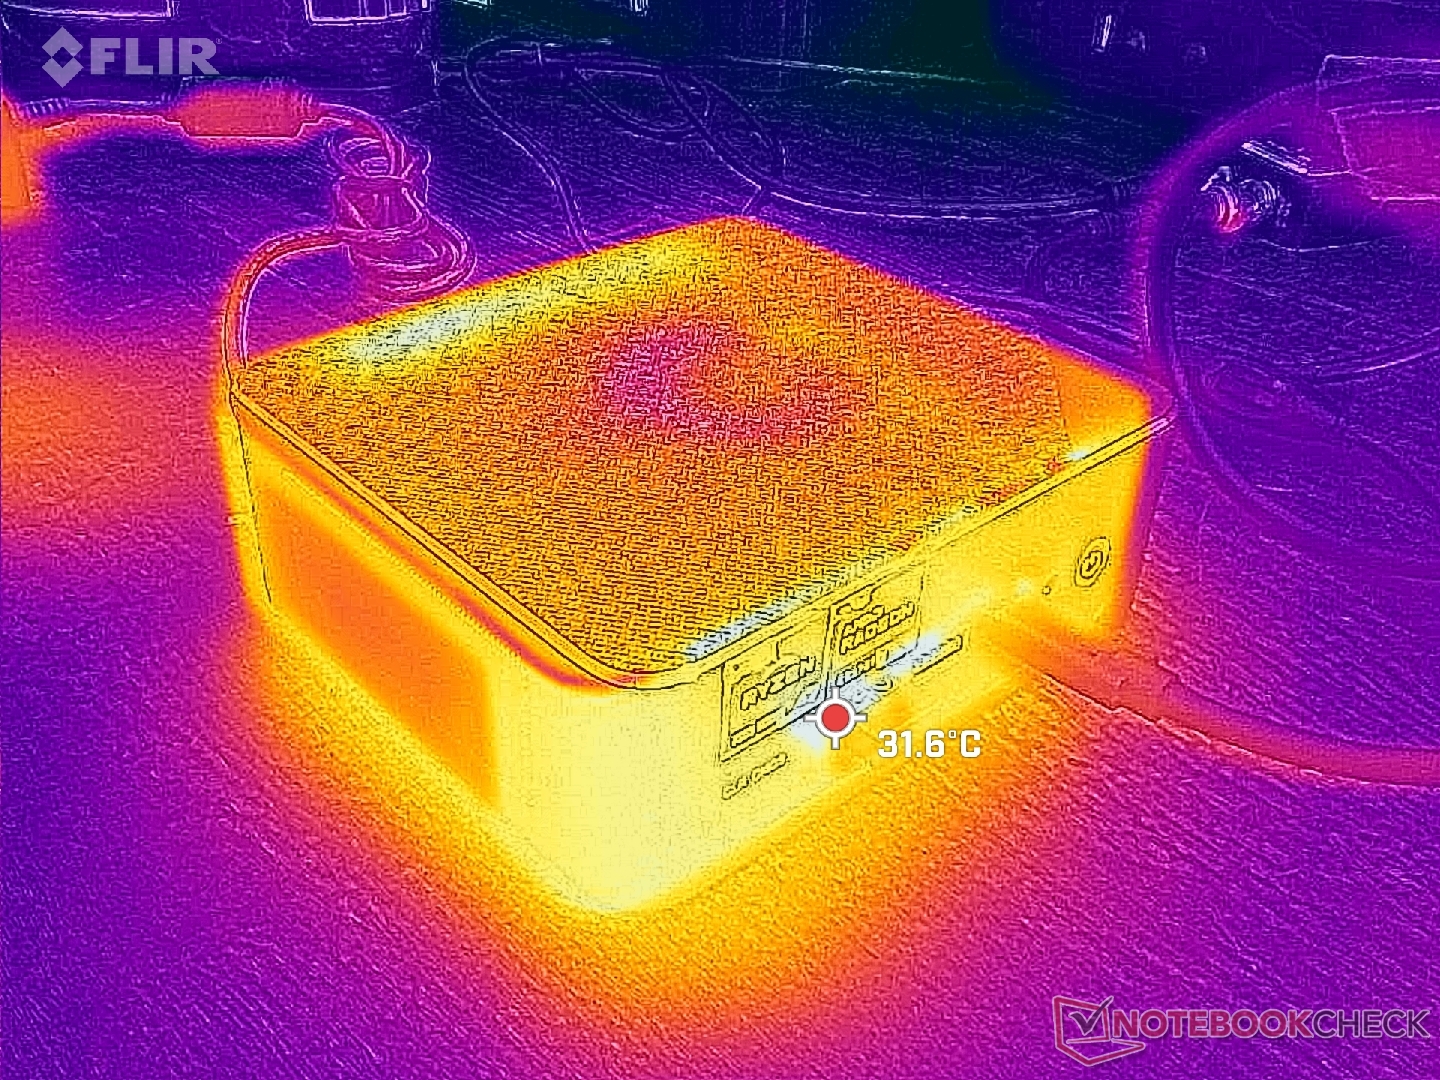
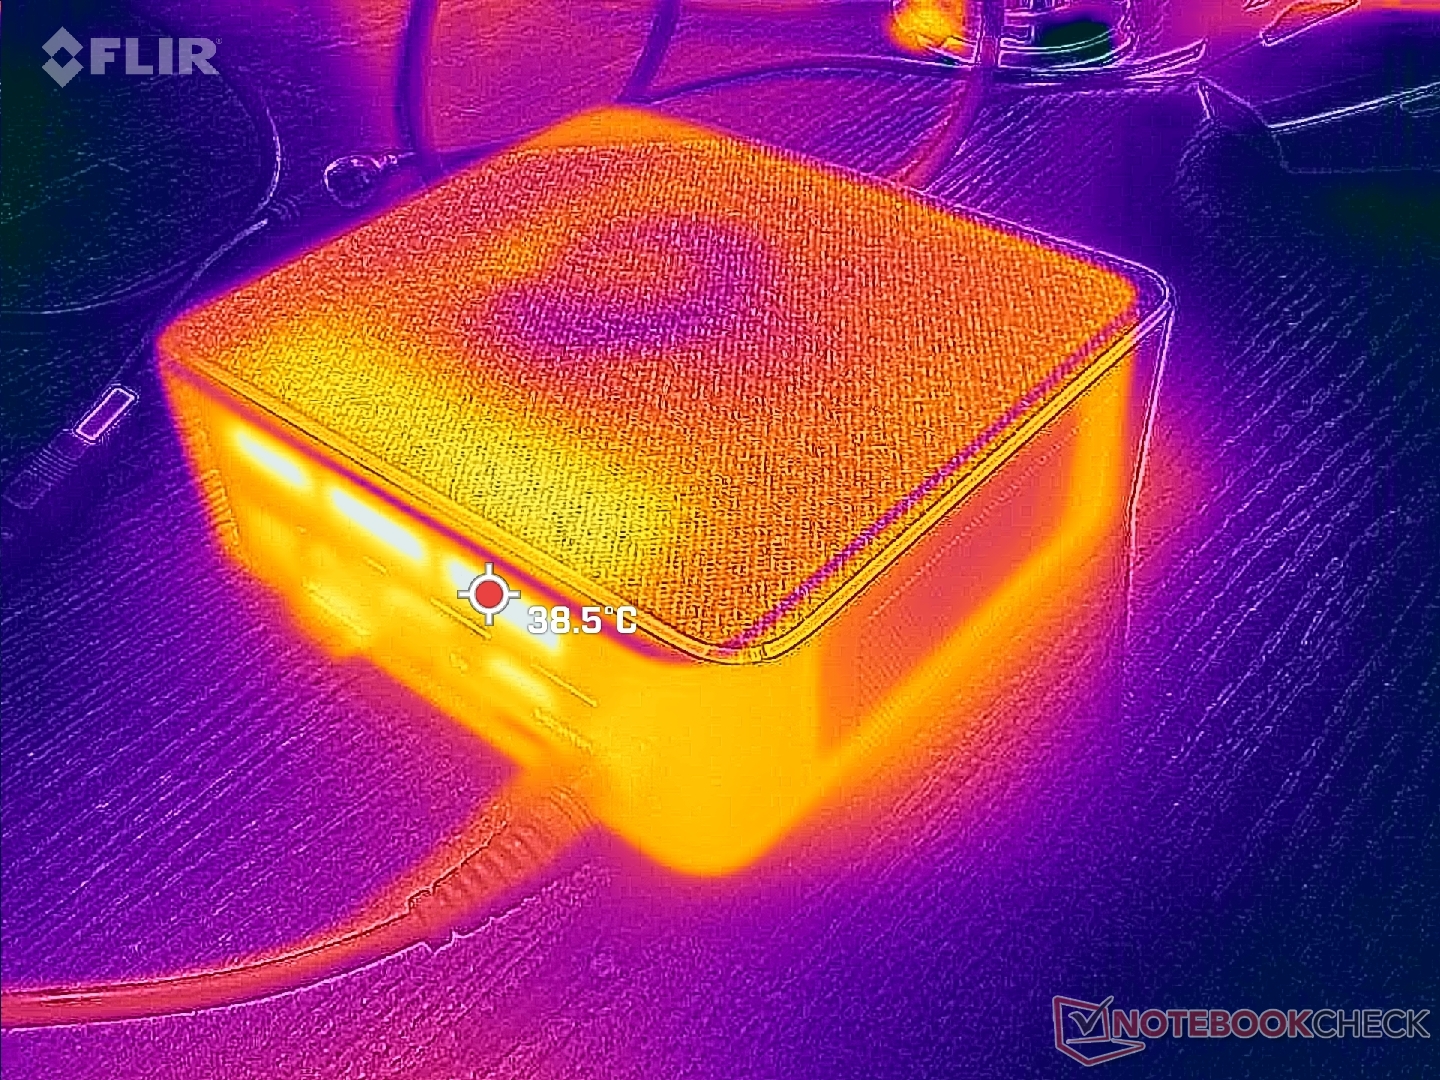
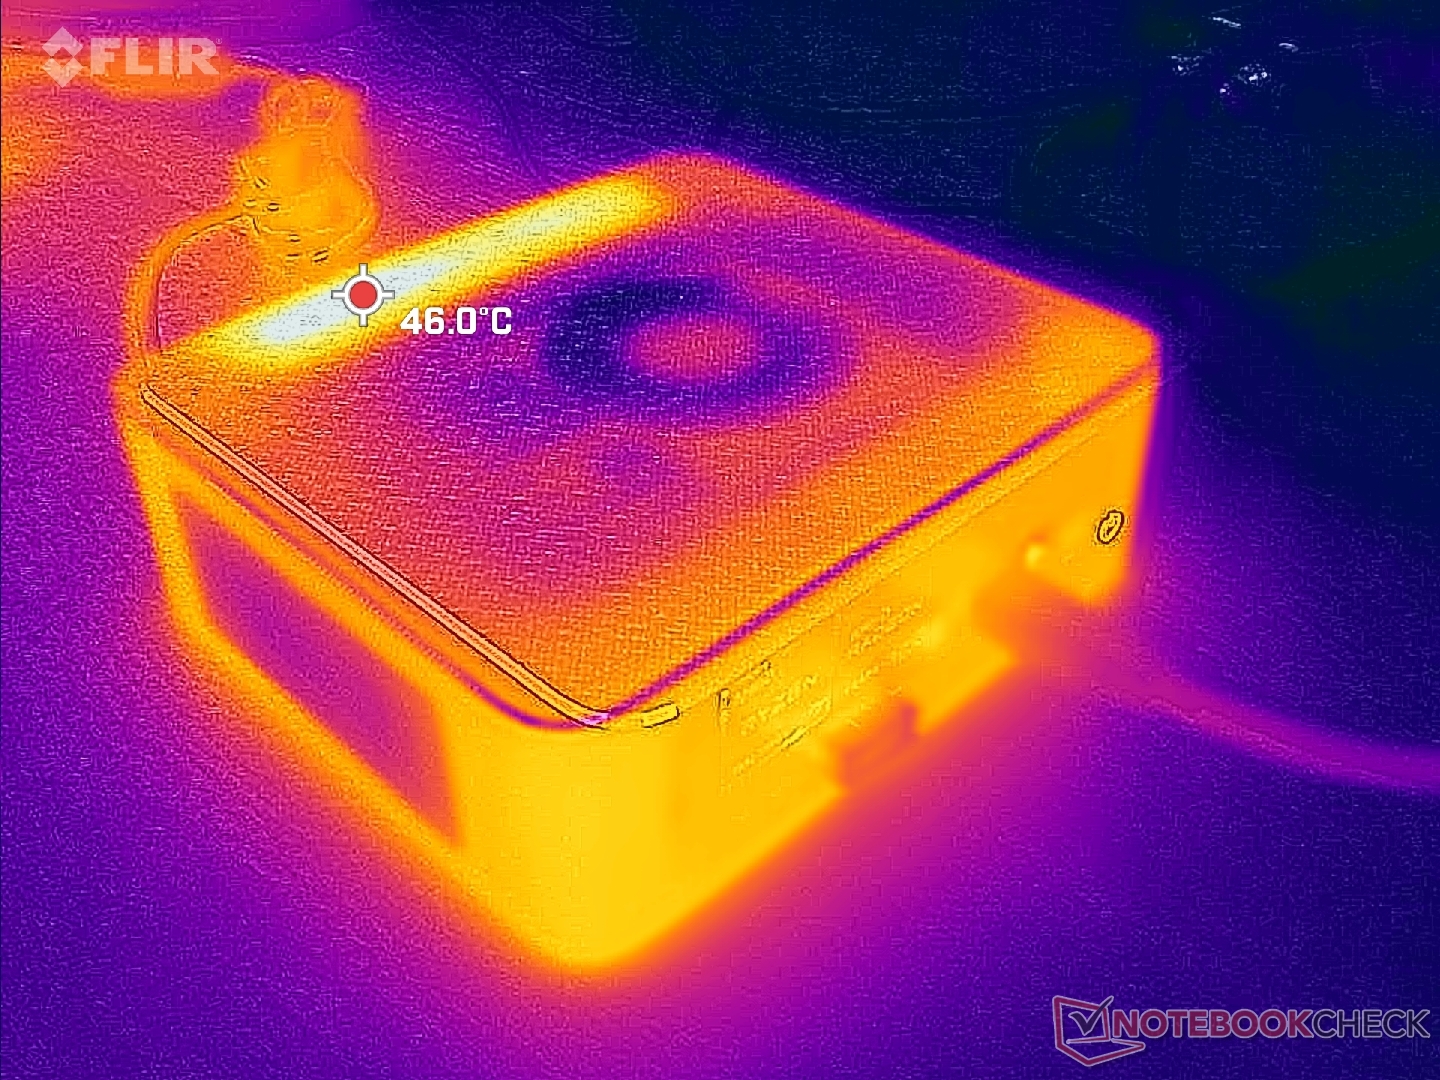
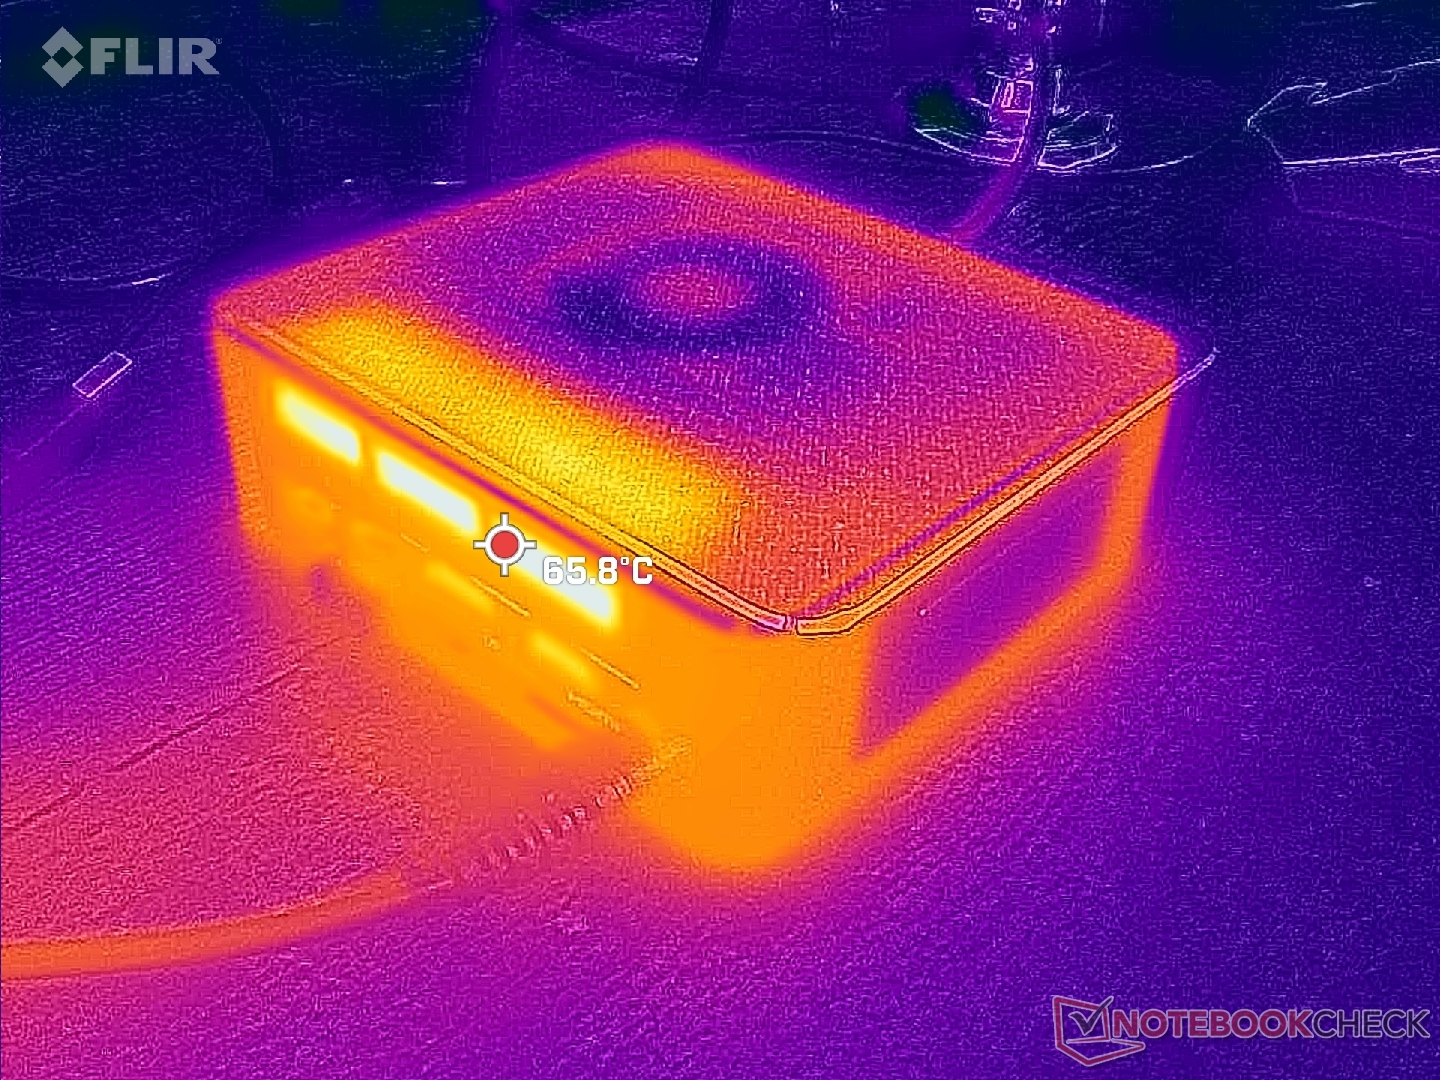
Température
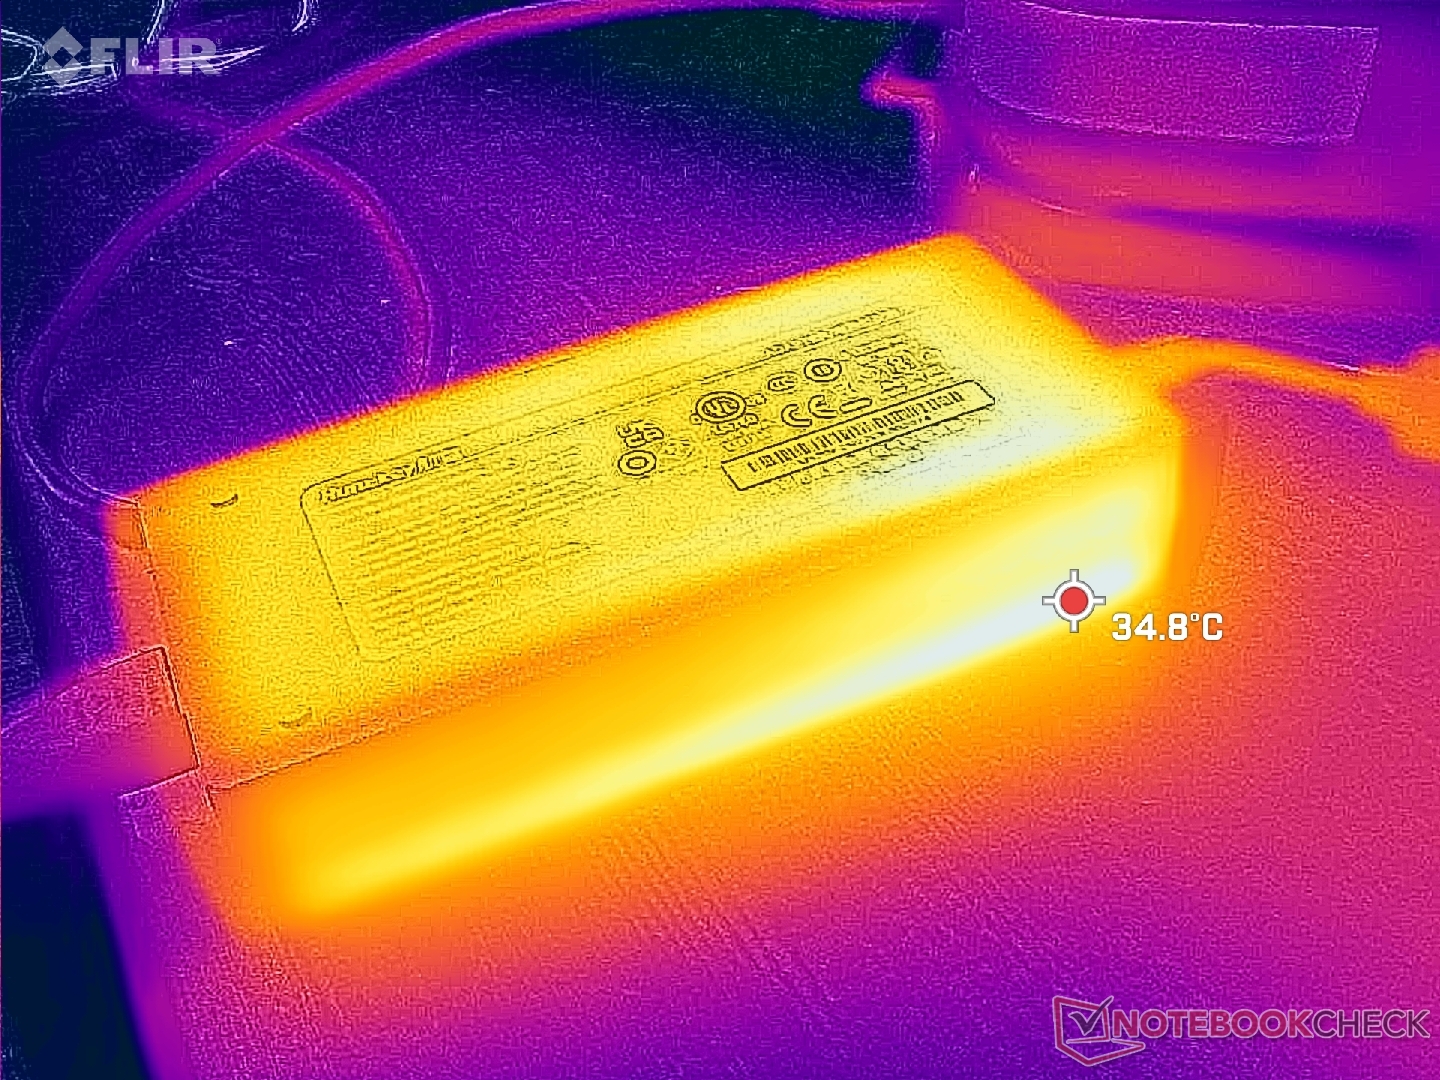
Les températures de surface ne posent pas de problème sur la SER6 Pro. Cependant, gardez à l'esprit que l'air frais pénètre par la surface supérieure et qu'il ne faut donc pas placer de papiers, de livres ou d'objets dessus. Laissez un peu d'espace à l'arrière pour que la chaleur perdue puisse également s'échapper.
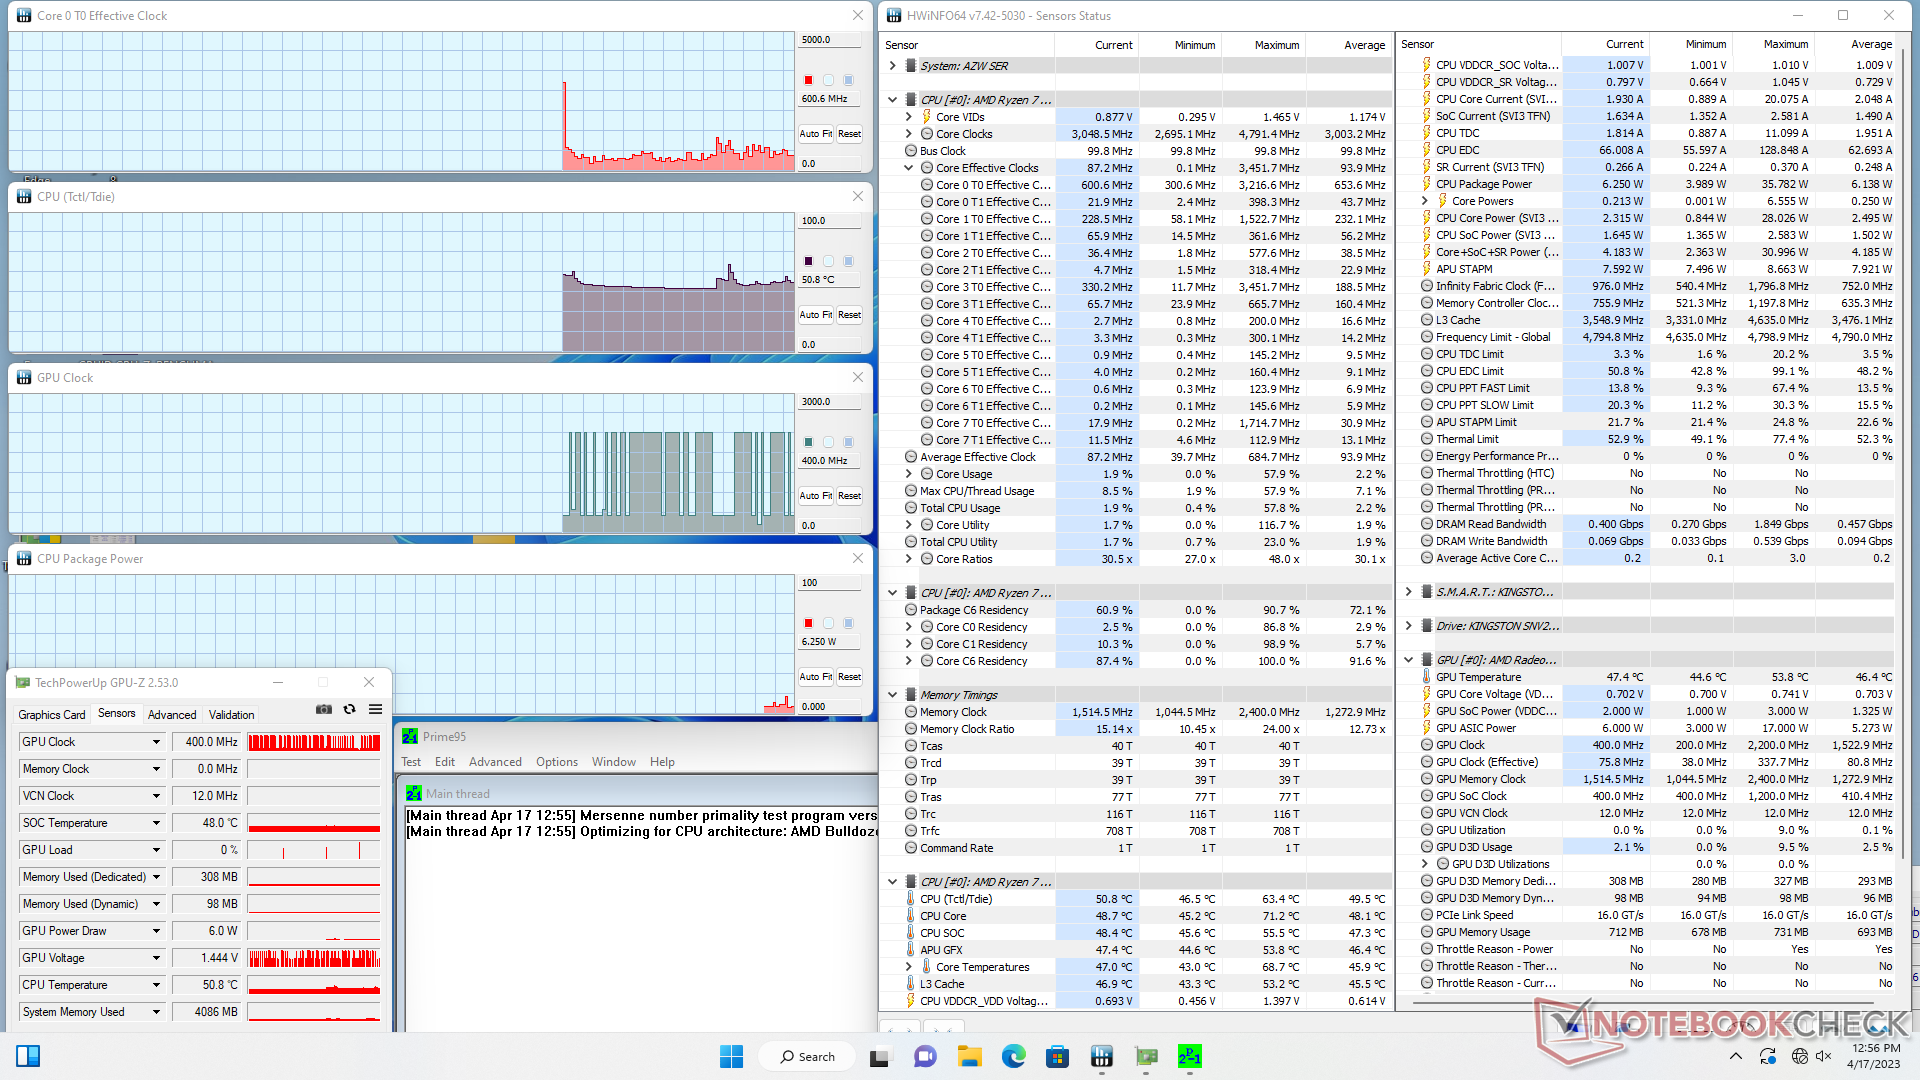
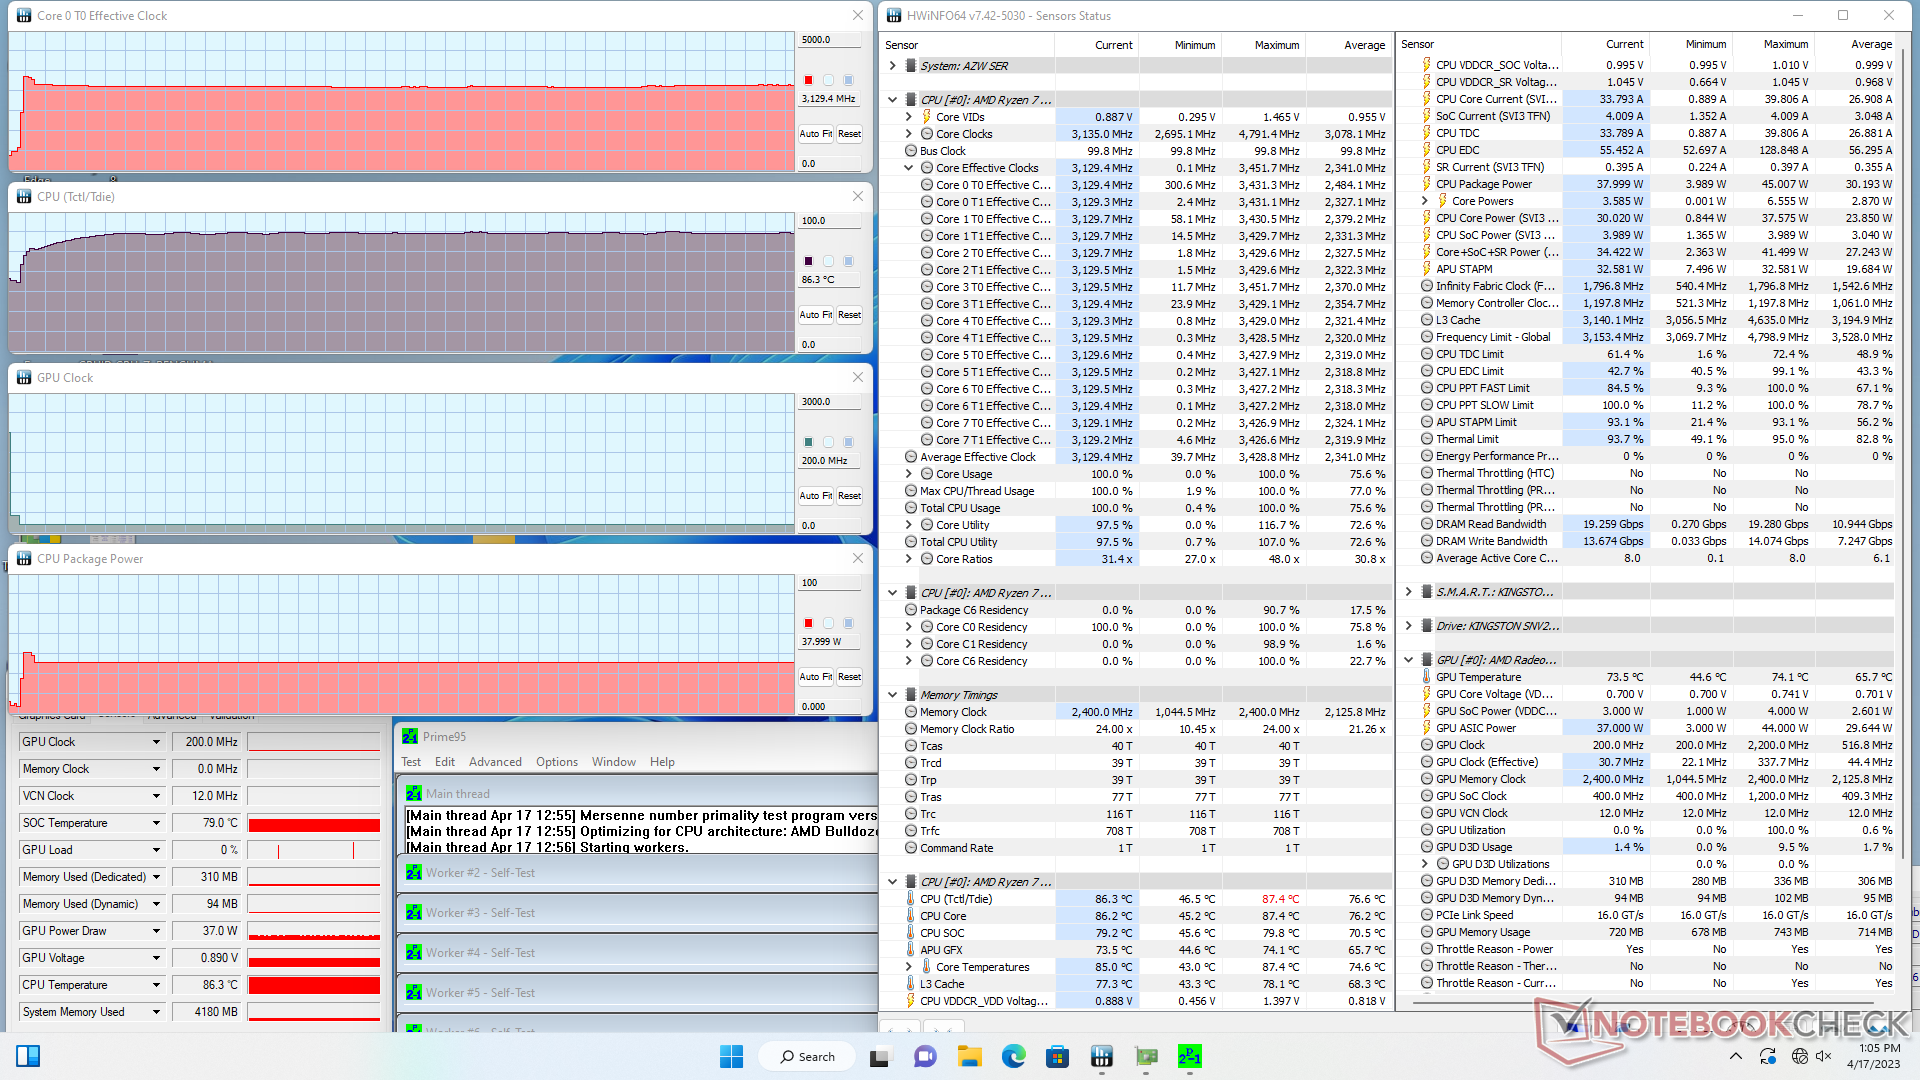
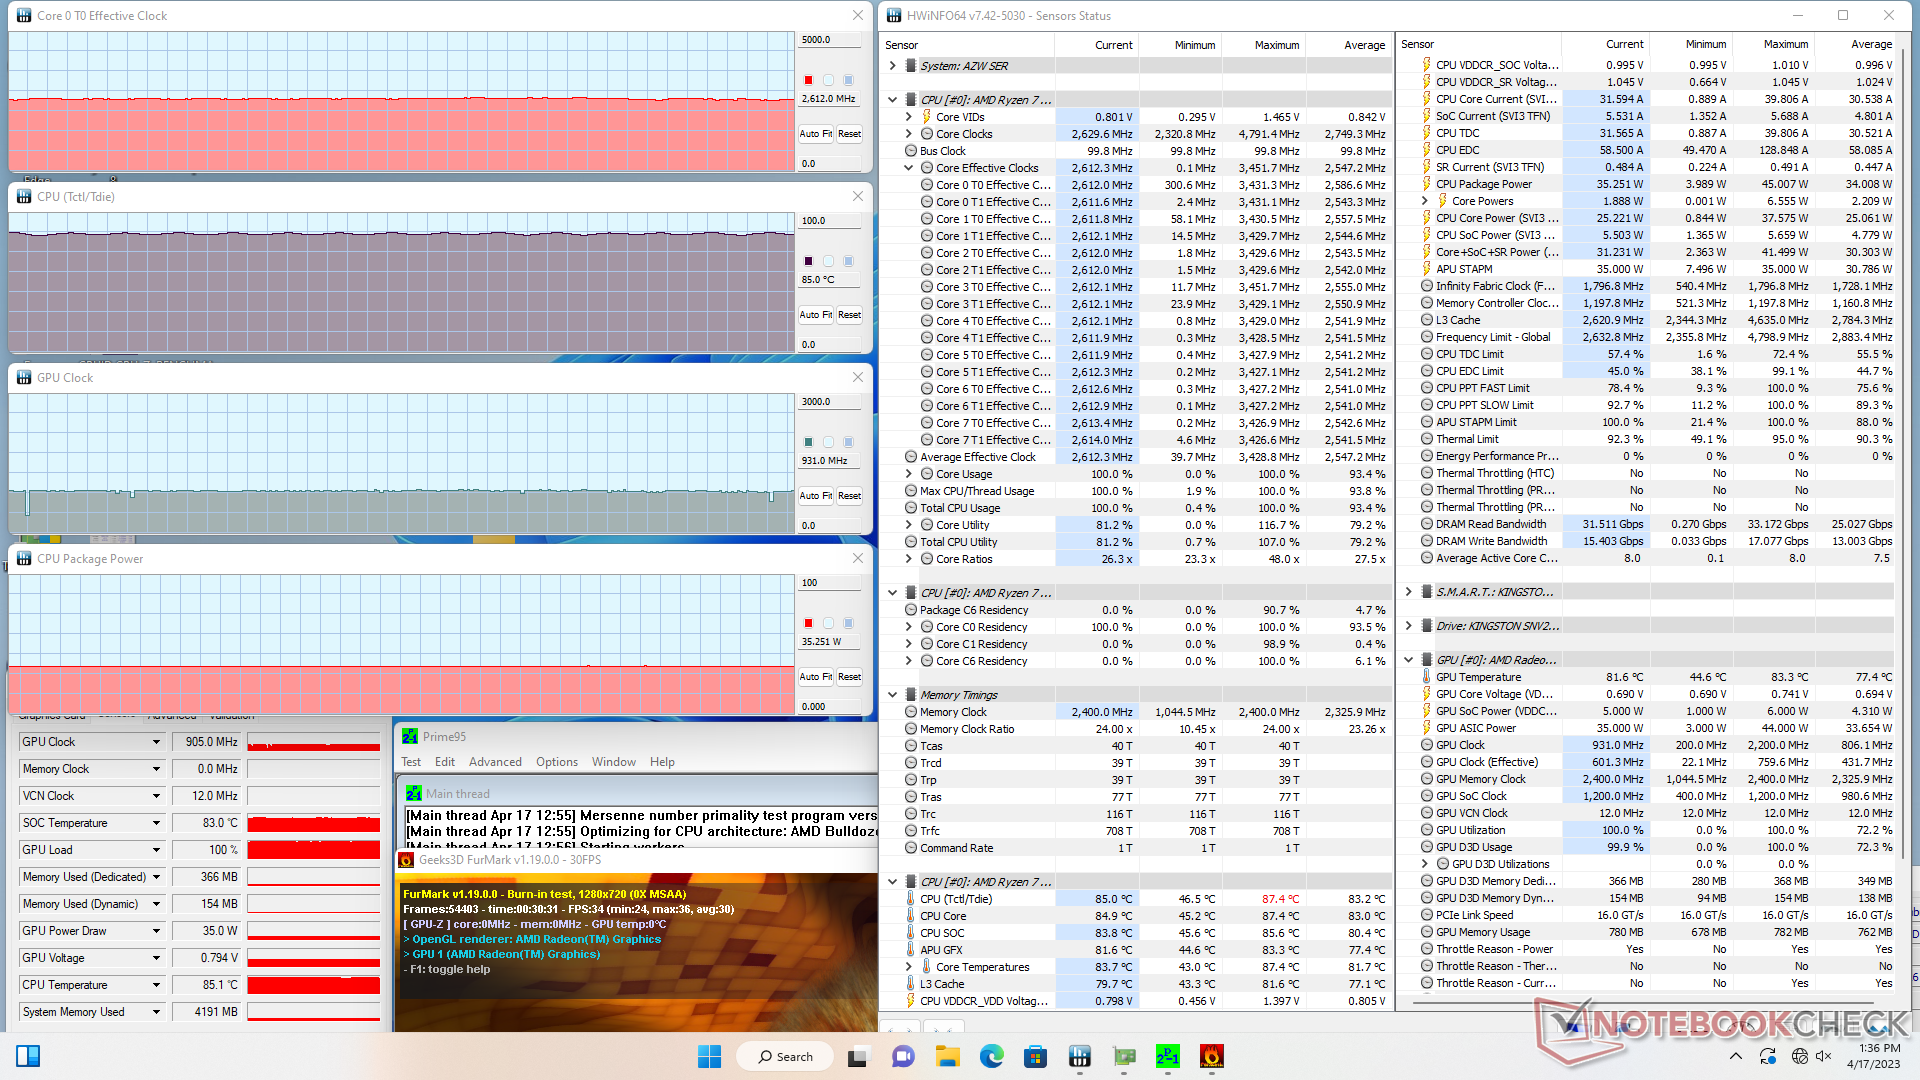
Test de stress
La fréquence d'horloge du CPU et la consommation d'énergie de la carte lors de l'exécution de Prime95 augmentent respectivement jusqu'à 3,4 GHz et 45 W, pendant quelques secondes. Le CPU se stabilise ensuite rapidement à 3,1 GHz, 38 W et 86 C, ce qui est légèrement plus chaud et plus rapide que ce que nous avons enregistré sur la SER6 Pro de l'année dernière.
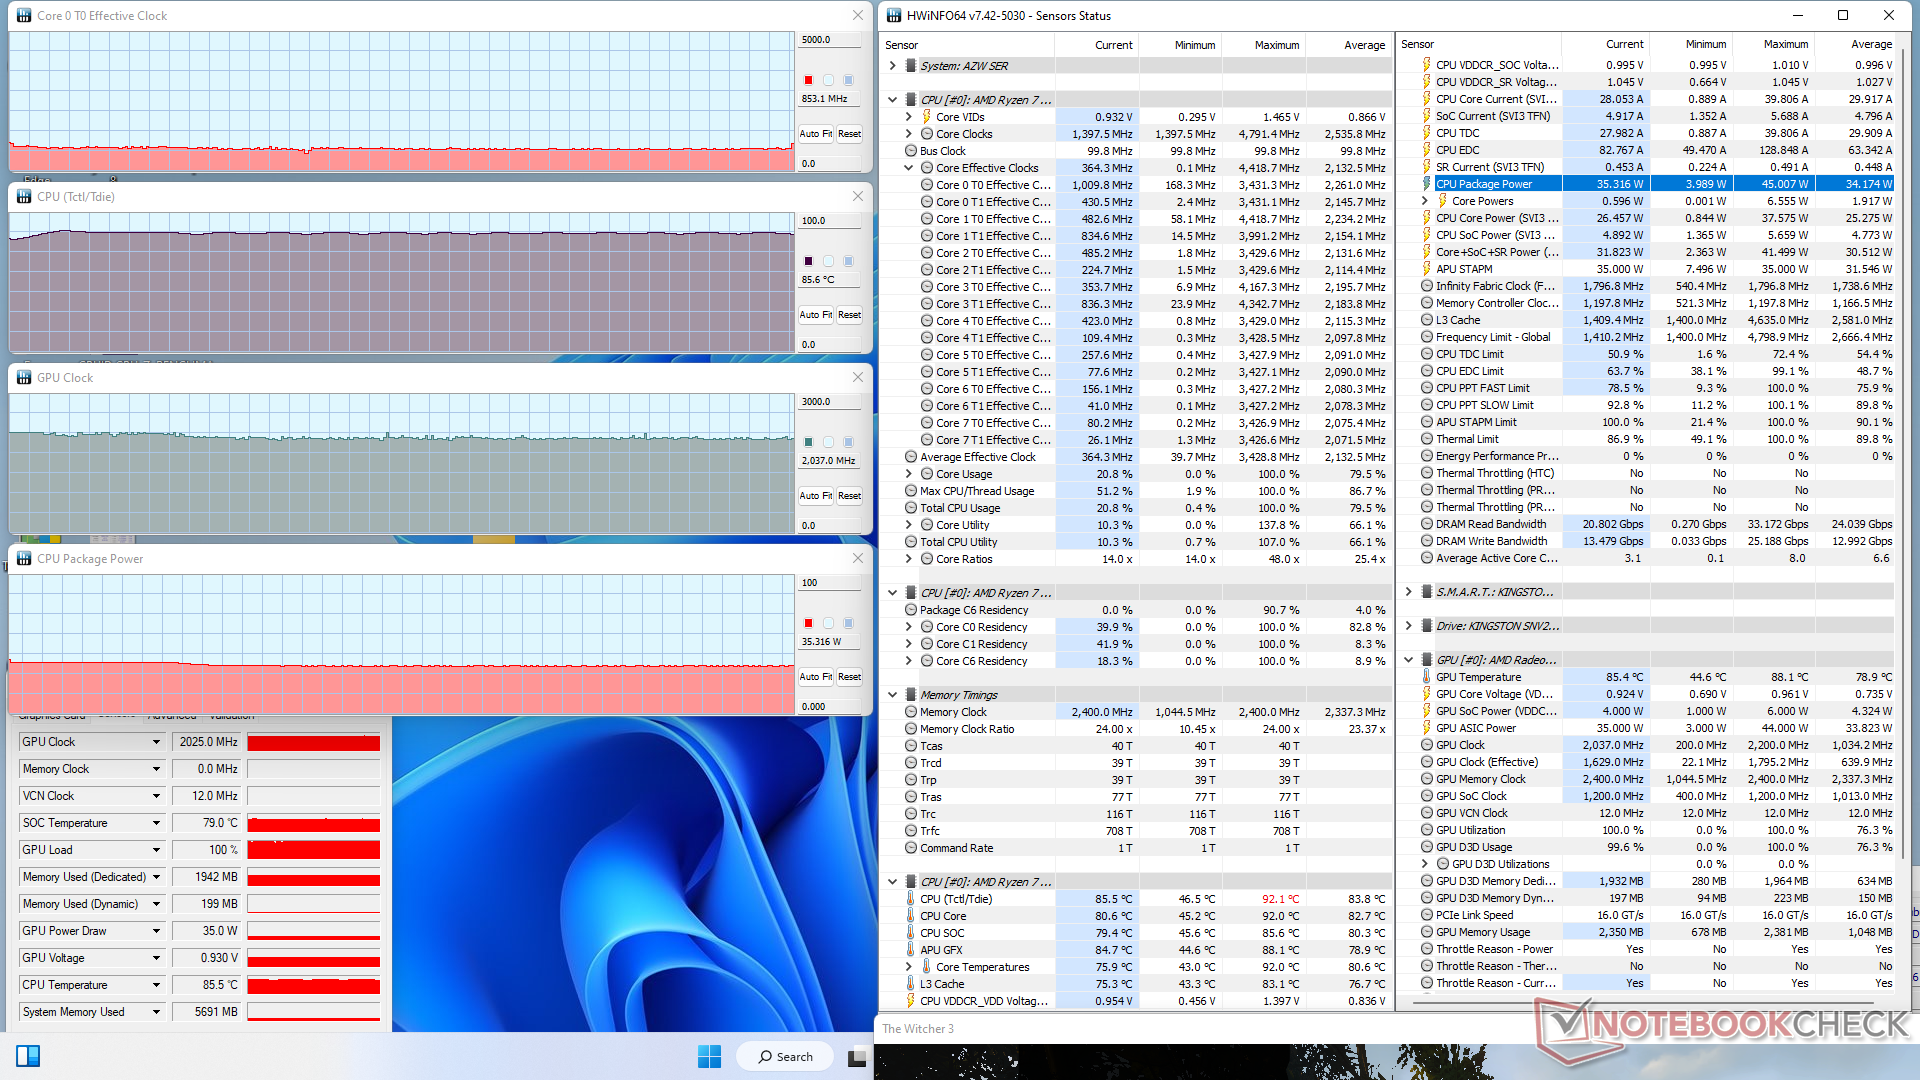
Sur le site Witcher 3, la fréquence d'horloge et la température du GPU se stabilisent respectivement à 2037 MHz et 86 °C, contre 1150 MHz et seulement 68 °C sur la SEi12, plus lente et équipée d'Intel.
| Horloge du CPU (GHz) | Horloge du GPU (MHz) | Température moyenne du CPU (°C) | |
| Système au repos | -- | -- | 51 |
| Prime95 Stress | 3.1 | -- | 86 |
| Prime95 + FurMark Stress | 2.6 | 931 | 85 |
| Witcher 3 Stress | 0.8 | 2037 | 86 |
Gestion de l'énergie
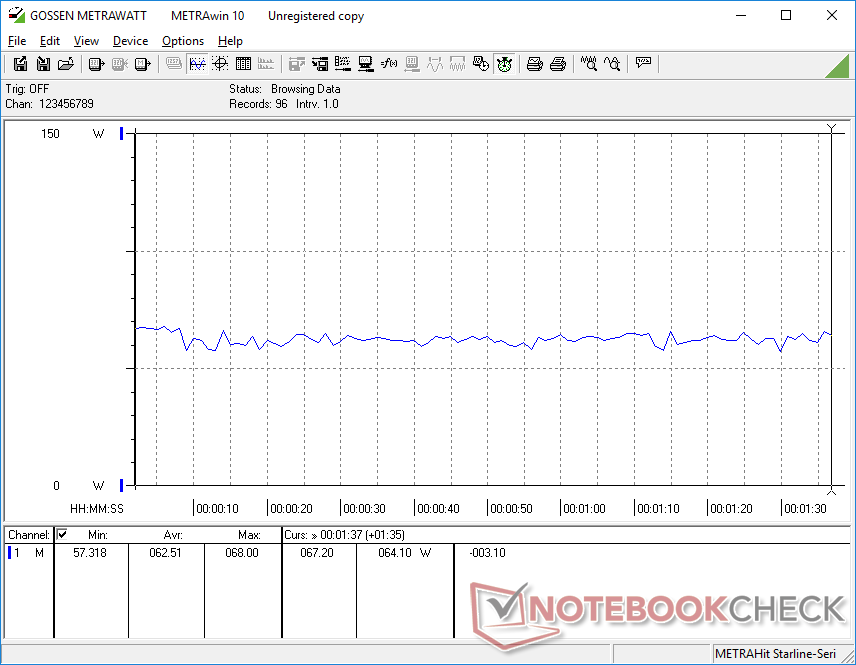
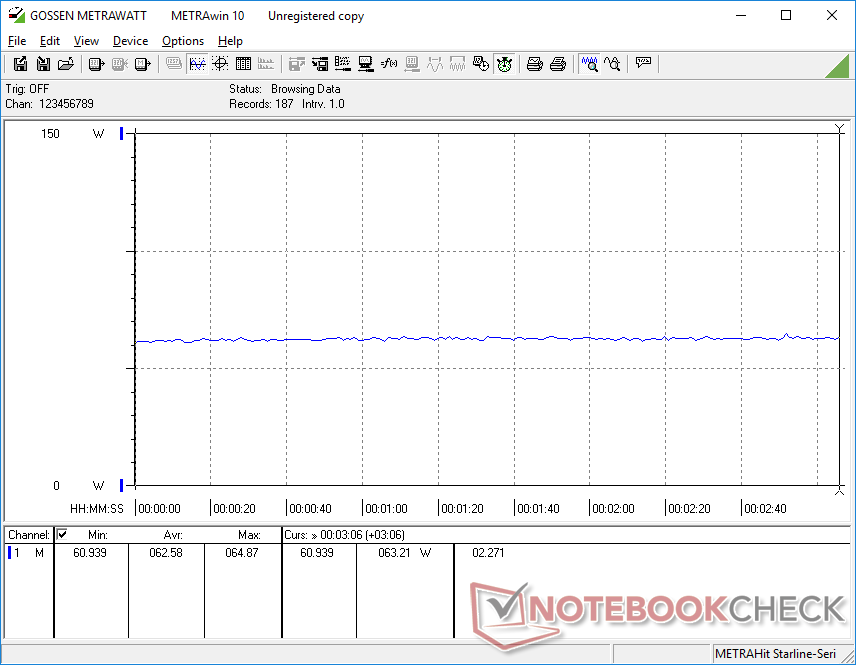
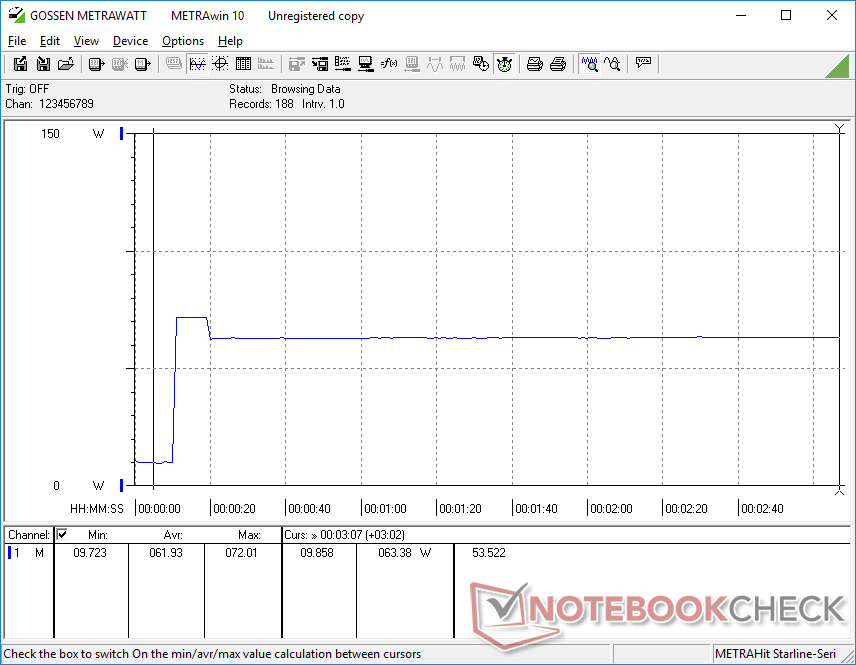
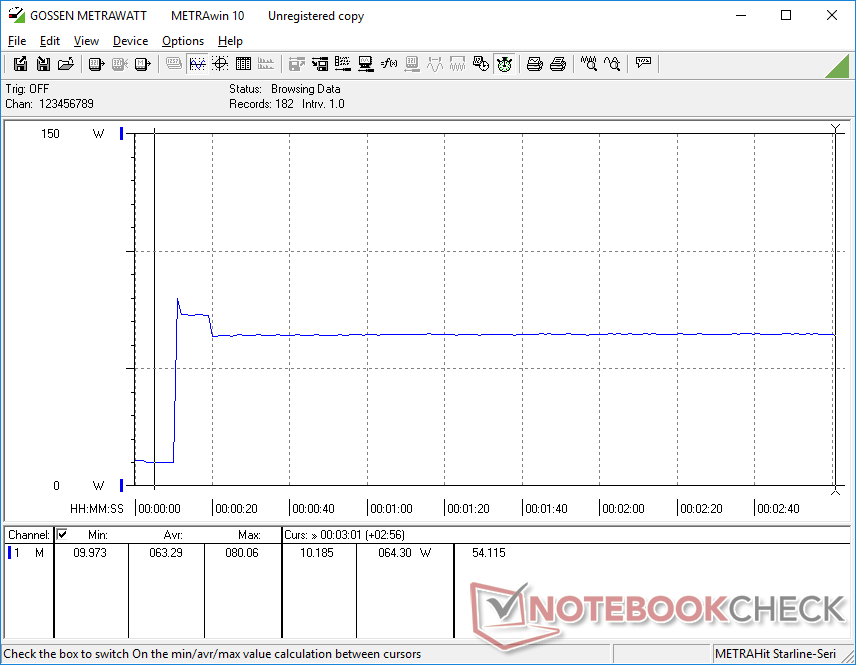
Consommation électrique
La consommation d'énergie est presque identique à celle de la Ryzen 7 6800H de l'année dernière, comme le montrent nos graphiques de comparaison ci-dessous. Ainsi, les performances par watt ne sont malheureusement pas meilleures lorsque l'on passe de l'ancienne Ryzen 6 6800H à la nouvelle Ryzen 7 7735HS.
| Éteint/en veille | |
| Au repos | |
| Fortement sollicité |
|
Légende:
min: | |
| Beelink SER6 Pro Ryzen 7 7735HS R7 7735HS, Radeon 680M, Kingston NV2 500GB SNV2S/500G, , x, | Beelink SER6 Pro R7 6800H, Radeon 680M, Kingston NV2 500GB SNV2S/500G, , x, | Beelink GTR6 R9 6900HX, Radeon 680M, Kingston KC3000 512G SKC3000S512G, , x, | Intel NUC 13 Pro Kit NUC13ANK i7-1360P, Iris Xe G7 96EUs, Samsung PM9A1 MZVL2512HCJQ, , x, | Minisforum Venus Series UM690 R9 6900HX, Radeon 680M, Kingston OM8PGP4512Q-A0, , x, | Intel Hades Canyon NUC8i7HVK i7-8809G, Vega M GH, Intel Optane 120 GB SSDPEK1W120GA, , x, | |
|---|---|---|---|---|---|---|
| Power Consumption | 6% | -4% | 5% | -8% | -79% | |
| Idle Minimum * (Watt) | 8.9 | 8.3 7% | 7.6 15% | 5.1 43% | 8.7 2% | 15.5 -74% |
| Idle Average * (Watt) | 9 | 8.4 7% | 9.9 -10% | 5.8 36% | 9.6 -7% | 16.2 -80% |
| Idle Maximum * (Watt) | 9.3 | 8.7 6% | 10.6 -14% | 10.2 -10% | 10.5 -13% | 16.5 -77% |
| Load Average * (Watt) | 62.5 | 60.8 3% | 64 -2% | 68.1 -9% | 65.8 -5% | 83.4 -33% |
| Witcher 3 ultra * (Watt) | 62.6 | 61.4 2% | 69 -10% | 121.7 -94% | ||
| Load Maximum * (Watt) | 80.1 | 72 10% | 80.4 -0% | 108.3 -35% | 94.5 -18% | 173.5 -117% |
* ... Moindre est la valeur, meilleures sont les performances
Power Consumption Witcher 3 / Stresstest
Power Consumption external Monitor
Points positifs
Points négatifs
Verdict - Rien de plus qu'un rebranding du Zen 3+
Le meilleur aspect du SER6 Pro Ryzen 7 7735HS est que l'ancien SER6 Pro Ryzen 7 6800H est désormais moins cher. Les deux processeurs sont trop similaires en termes de performances et de consommation d'énergie, ce qui signifie que vous pouvez simplement acheter l'ancien modèle sans craindre de manquer de fonctionnalités majeures.
Les performances du Ryzen 7 7735HS sont identiques à celles de l'ancien Ryzen 7 6800H. Il est donc difficile de recommander le 2023 SER6 Pro par rapport au modèle 2022, car il n'offre pratiquement aucun autre changement.
Le DisplayPort intégré est un ajout appréciable, mais nous pensons que Beelink aurait pu apporter plus de changements pour séduire les acheteurs. Un deuxième port USB-C, par exemple, un lecteur d'empreintes digitales intégré ou un verrou Kensington auraient pu aider à différencier le modèle 2023 du modèle 2022. En outre, les problèmes de latence du DPC et les chutes d'images lors de la lecture de vidéos 4K devraient être résolus, car de nombreux utilisateurs sont susceptibles d'utiliser le SER6 Pro à des fins HTC.
Prix et disponibilité
Amazon livre dès à présent le Beelink SER6 Pro tel qu'il est configuré, au prix de 550 USD.
Beelink SER6 Pro Ryzen 7 7735HS
- 04/20/2023 v7 (old)
Allen Ngo
Transparency
La sélection des appareils à examiner est effectuée par notre équipe éditoriale. L'échantillon de test a été prêté à l'auteur par le fabricant ou le détaillant pour les besoins de cet examen. Le prêteur n'a pas eu d'influence sur cette évaluation et le fabricant n'a pas reçu de copie de cette évaluation avant sa publication. Il n'y avait aucune obligation de publier cet article. En tant que média indépendant, Notebookcheck n'est pas soumis à l'autorité des fabricants, des détaillants ou des éditeurs.
Voici comment Notebookcheck teste
Chaque année, Notebookcheck examine de manière indépendante des centaines d'ordinateurs portables et de smartphones en utilisant des procédures standardisées afin de garantir que tous les résultats sont comparables. Nous avons continuellement développé nos méthodes de test depuis environ 20 ans et avons établi des normes industrielles dans le processus. Dans nos laboratoires de test, des équipements de mesure de haute qualité sont utilisés par des techniciens et des rédacteurs expérimentés. Ces tests impliquent un processus de validation en plusieurs étapes. Notre système d'évaluation complexe repose sur des centaines de mesures et de points de référence bien fondés, ce qui garantit l'objectivité.Price comparison

