Test du Beelink SER9 : le Zen 5 d'AMD rend ce mini PC plus rapide que jamais
Le nouveau processeur Ryzen AI 9 améliore encore les performances.
Beelink fait monter les enchères dans le domaine des mini-PC en intégrant le dernier CPU Ryzen 9 d'AMD avant la plupart des autres concurrents. Le prix a également augmenté en conséquence, ce qui en fait l'une des offres les plus chères du fabricant.Allen Ngo, 👁 Allen Ngo (traduit par DeepL / Ninh Duy) Publié 🇺🇸 🇪🇸 ...
Verdict
Le SER8 était déjà un excellent mini PC avec sa refonte complète, son processeur moderne AMD Zen 4 et ses ports révisés. Le SER9 double les performances en passant à un processeur Zen 5 encore plus rapide que les utilisateurs intensifs apprécieront. Le nouveau processeur Ryzen 9 AI est plus rapide et plus silencieux que prévu compte tenu de la taille du SER9.
Le SER9 n'est pas parfait, bien sûr, car des fonctions communes à d'autres mini-PC comme le montage VESA, la RAM évolutive ou le verrouillage Kensington sont toutes absentes sur le Beelink. En outre, le système est légèrement plus grand et plus lourd que de nombreux concurrents, en partie à cause des haut-parleurs stéréo intégrés et du refroidissement par chambre à vapeur. Il est certainement plus rapide que beaucoup d'autres options disponibles, mais vous en paierez le prix en termes de taille et de consommation d'énergie.
Points positifs
Points négatifs
Comparaison des alternatives possibles
Image | Modèle | Prix | Poids | Épaisseur | Écran |
|---|---|---|---|---|---|
1. 77.1% 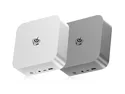 | Beelink SER9 AMD Ryzen AI 9 HX 370 ⎘ AMD Radeon 890M ⎘ 32 Go Mémoire, 1024 Go SSD | Amazon: Prix de liste: 1000 USD | 814 g | 44.7 mm | x |
2. 74.9%  | Beelink SER8 AMD Ryzen 7 8845HS ⎘ AMD Radeon 780M ⎘ 32 Go Mémoire, 1024 Go SSD | Amazon: 1. $889.00 Beelink SER8 Mini PC, AMD Ry... 2. $639.00 Beelink SER8 Mini PC, AMD Ry... 3. $829.00 Beelink SER8 Mini PC, AMD Ry... Prix de liste: 650 USD | 776 g | 44.7 mm | x |
3.  | Beelink SEi11 Pro Intel Core i5-11320H ⎘ Intel Iris Xe Graphics G7 96EUs ⎘ 16 Go Mémoire, 500 Go SSD | Amazon: 1. $659.00 Beelink EQI13 Mini PC W11 Pr... 2. $339.00 Beelink Mini PC, MINI S12 Pr... 3. $659.00 Beelink Mini PC SER9 Pro AMD... Prix de liste: 430 USD | 440 g | 40 mm | x |
4. 66.1%  | MSI Cubi NUC 1M Intel Core 7 150U ⎘ Intel Iris Xe Graphics G7 96EUs ⎘ 16 Go Mémoire, 1024 Go SSD | Amazon: Prix de liste: 950 USD | 660 g | 50.1 mm | x |
5. 67.3%  | GMK NucBox K9 Intel Core Ultra 5 125H ⎘ Intel Arc 7-Core iGPU ⎘ 32 Go Mémoire, 1024 Go SSD | Amazon: Prix de liste: 560 USD | 528 g | 47 mm | x |
6. 75.3%  | Asus NUC 14 Pro+ Intel Core Ultra 9 185H ⎘ Intel Arc 8-Core iGPU ⎘ 32 Go Mémoire, 1024 Go SSD | Amazon: Prix de liste: 1250 EUR | 622 g | 41 mm | x |
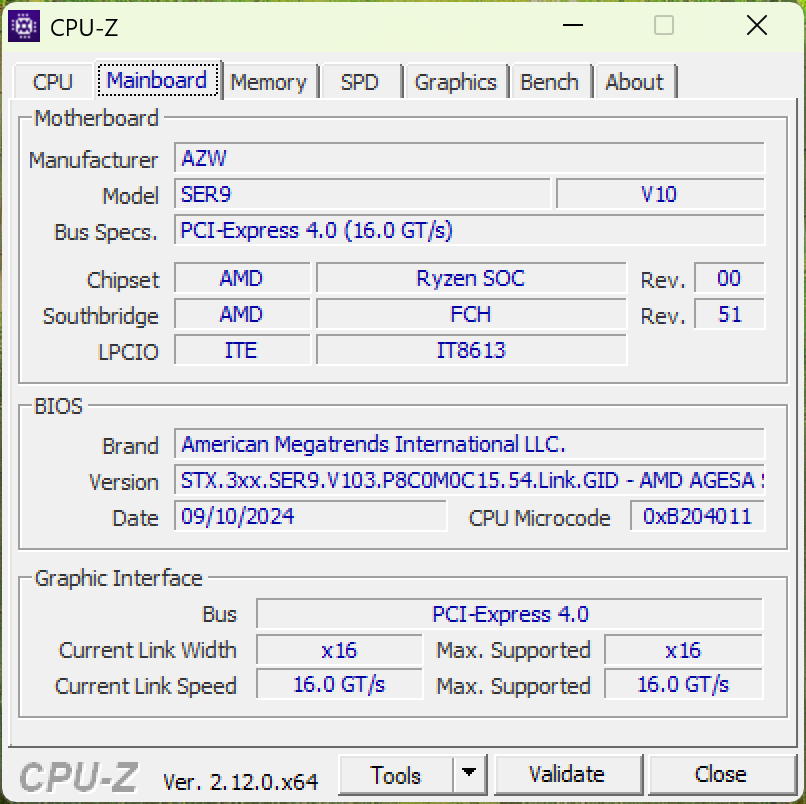
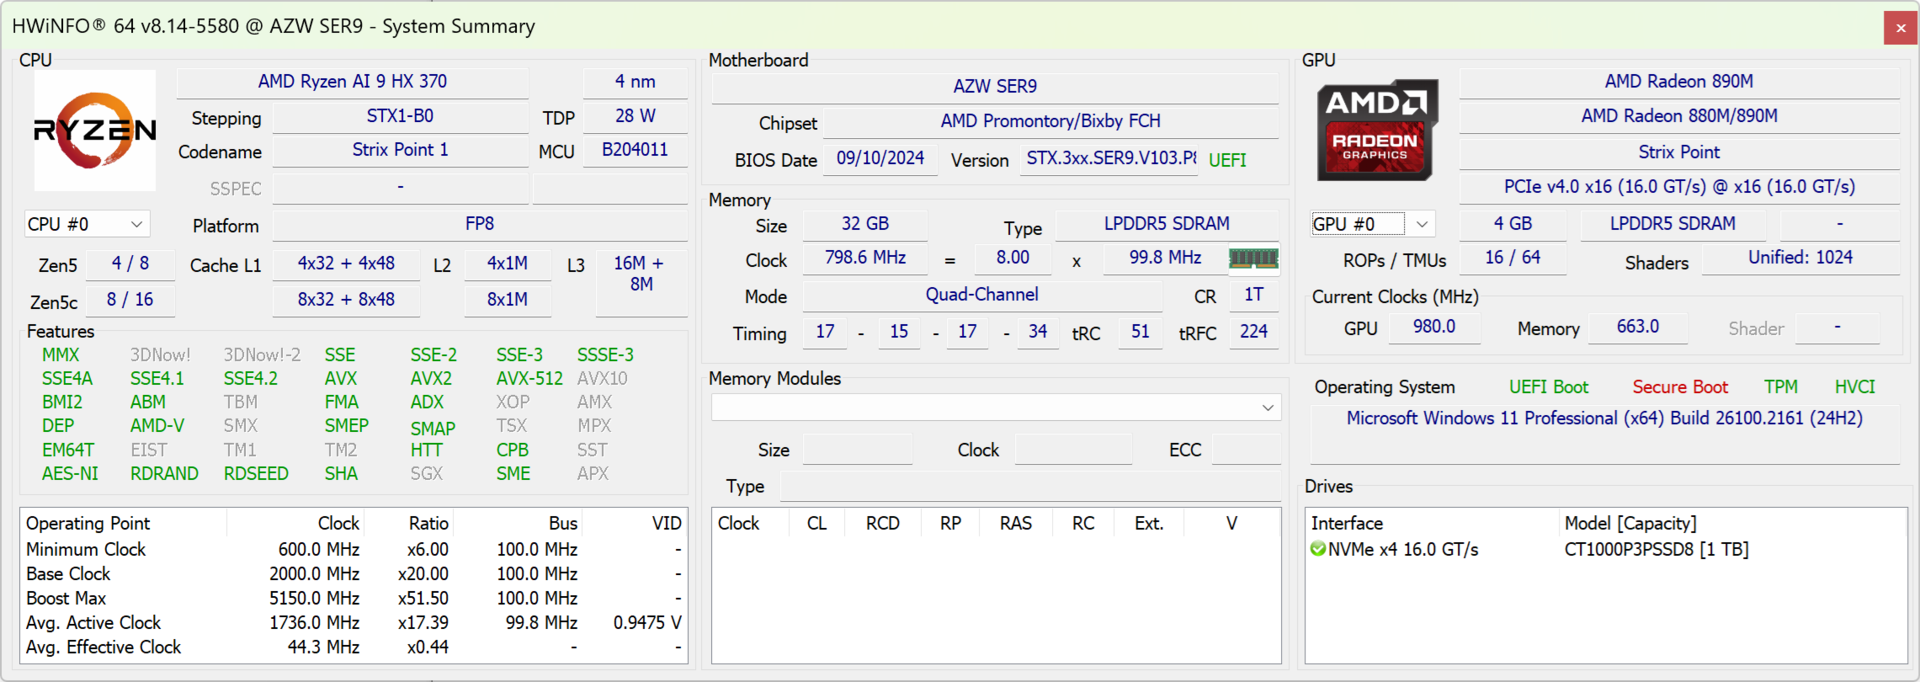
Le SER9 succède au SER8 en remplaçant le CPU Zen 4 Ryzen 7 8845HS par le plus récent Zen 5 Ryzen AI 9 HX 370. Le châssis est par ailleurs identique.
Notre configuration est équipée du CPU Zen 5 susmentionné, de 32 Go de RAM et d'un SSD NVMe de 1 To pour un prix de détail de 1000 USD. Aucun autre SKU n'est disponible à l'heure où nous écrivons ces lignes.
Les alternatives au SER9 comprennent d'autres mini PC haut de gamme de la série H, comme le GMK NucBox K9, Asus NUC 14 Proou le Bosgame M1.
Plus d'avis sur Beelink :
Spécifications
Cas
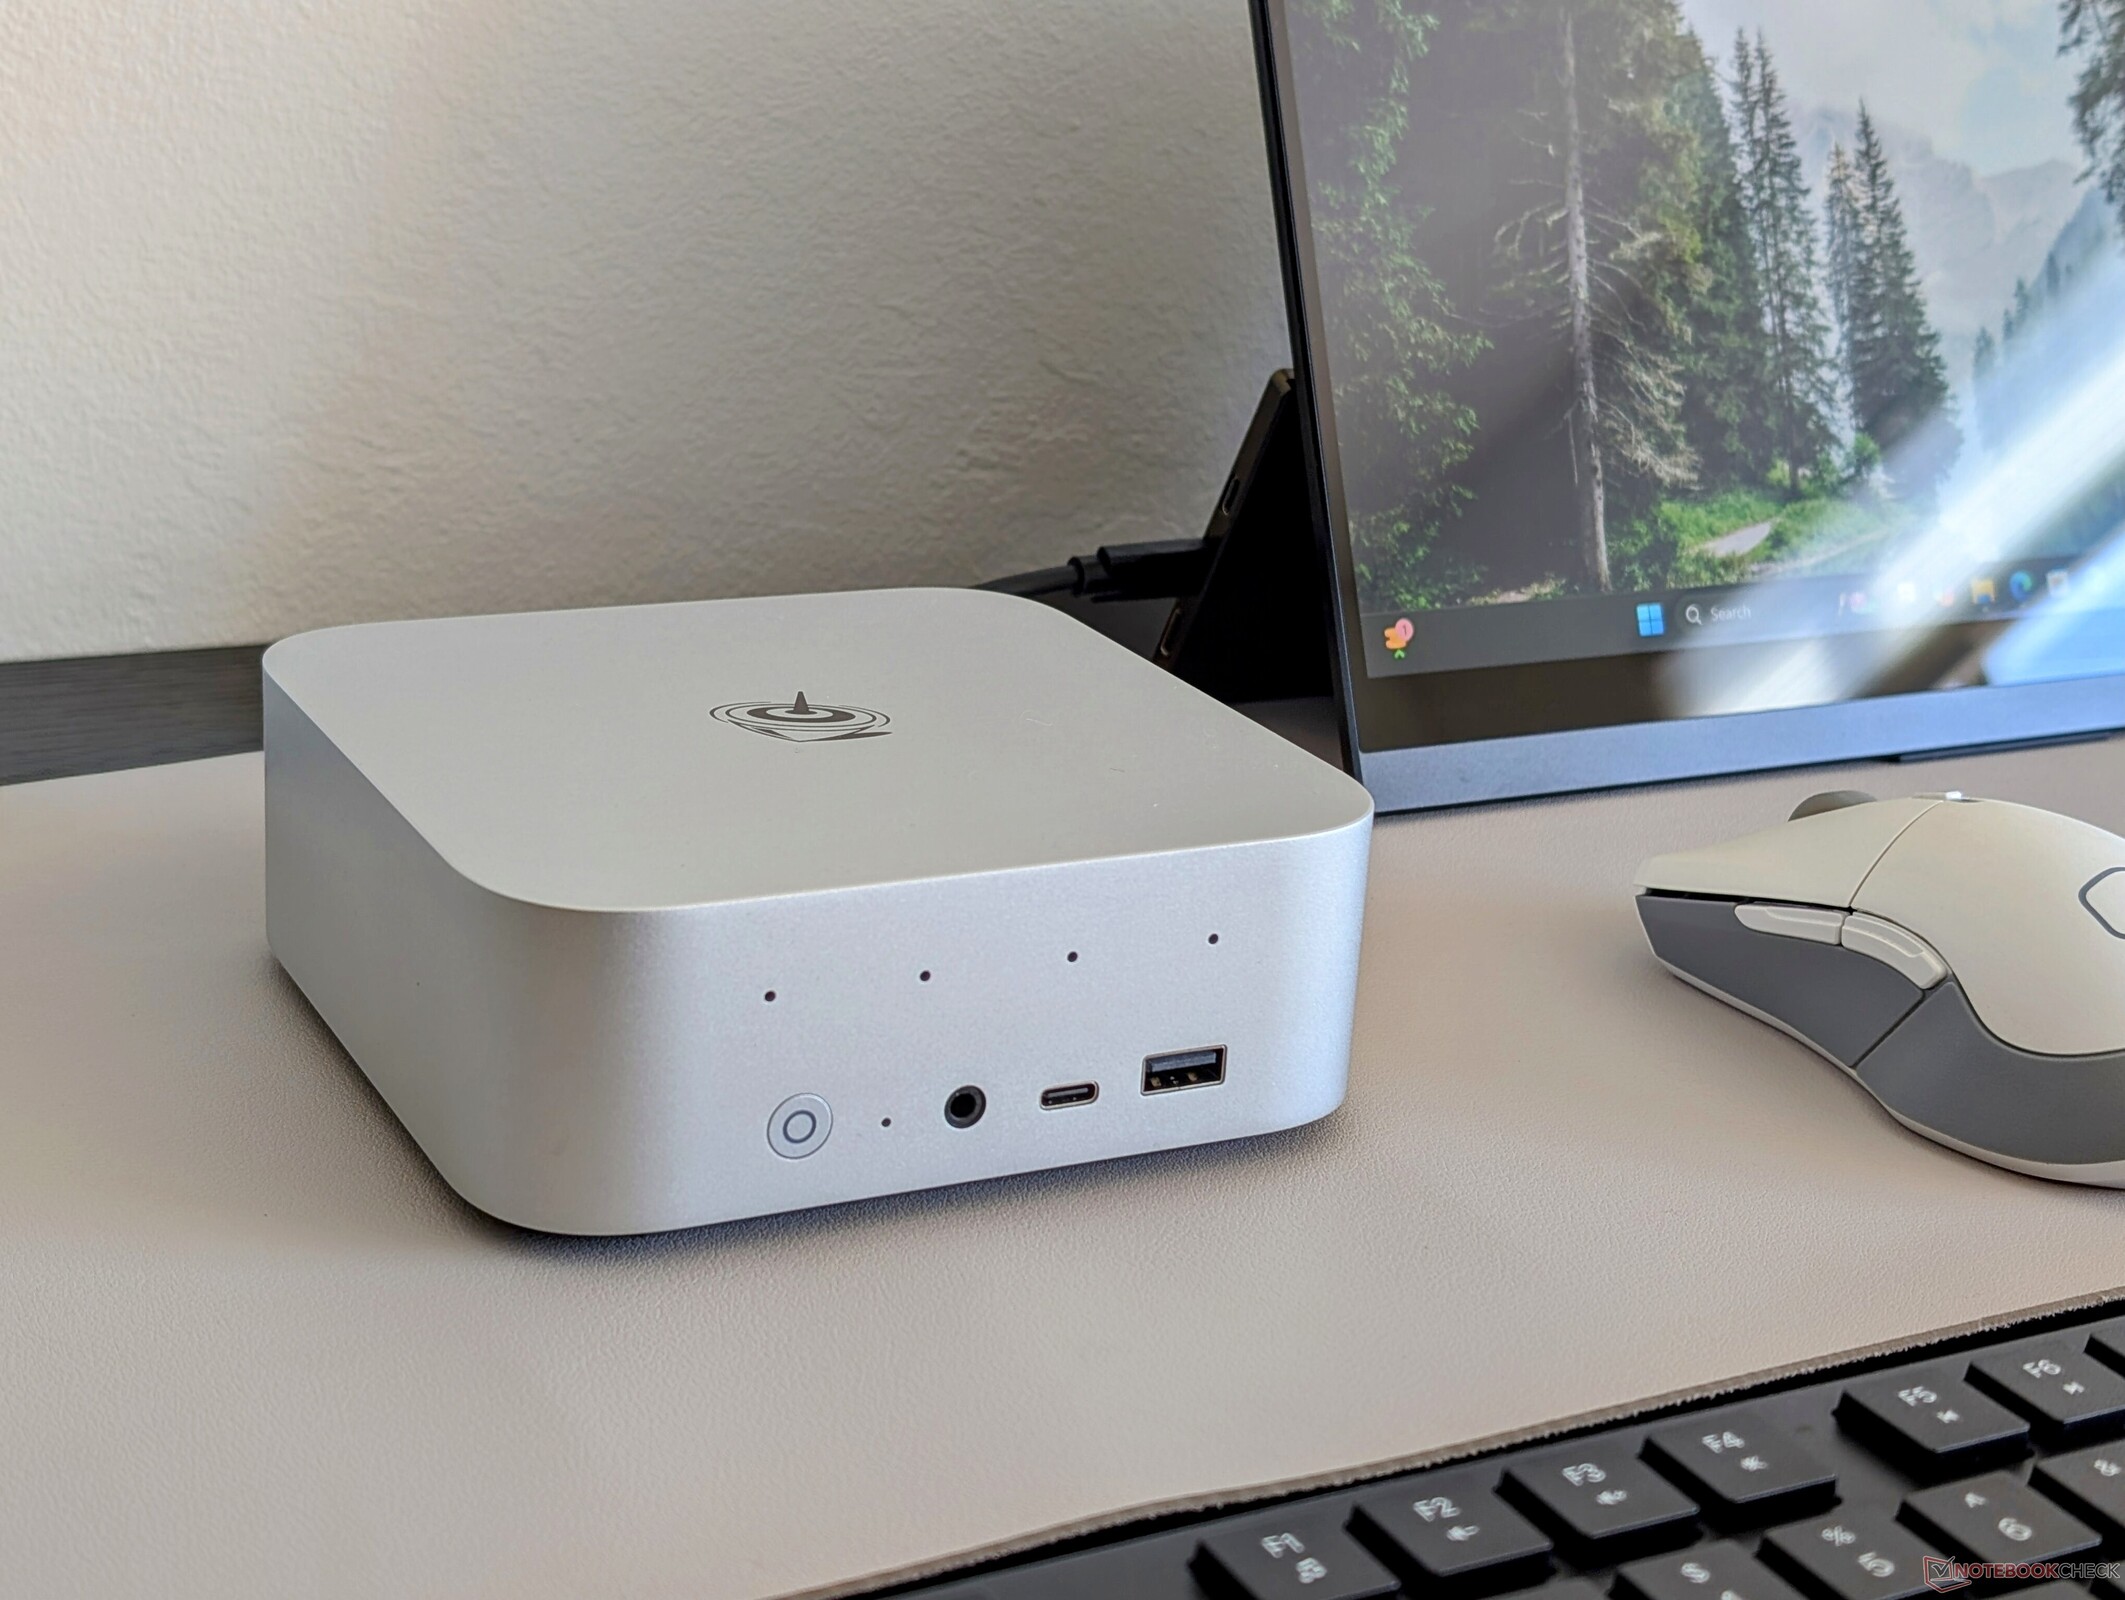
Le SER8 était déjà un changement complet par rapport au SER7 et le SER9 n'est donc qu'un petit rafraîchissement du SER8, sans différences physiques majeures. Le châssis métallique gris et le fond en plastique sont beaucoup plus professionnels que l'ancien design de l'ère SER7.
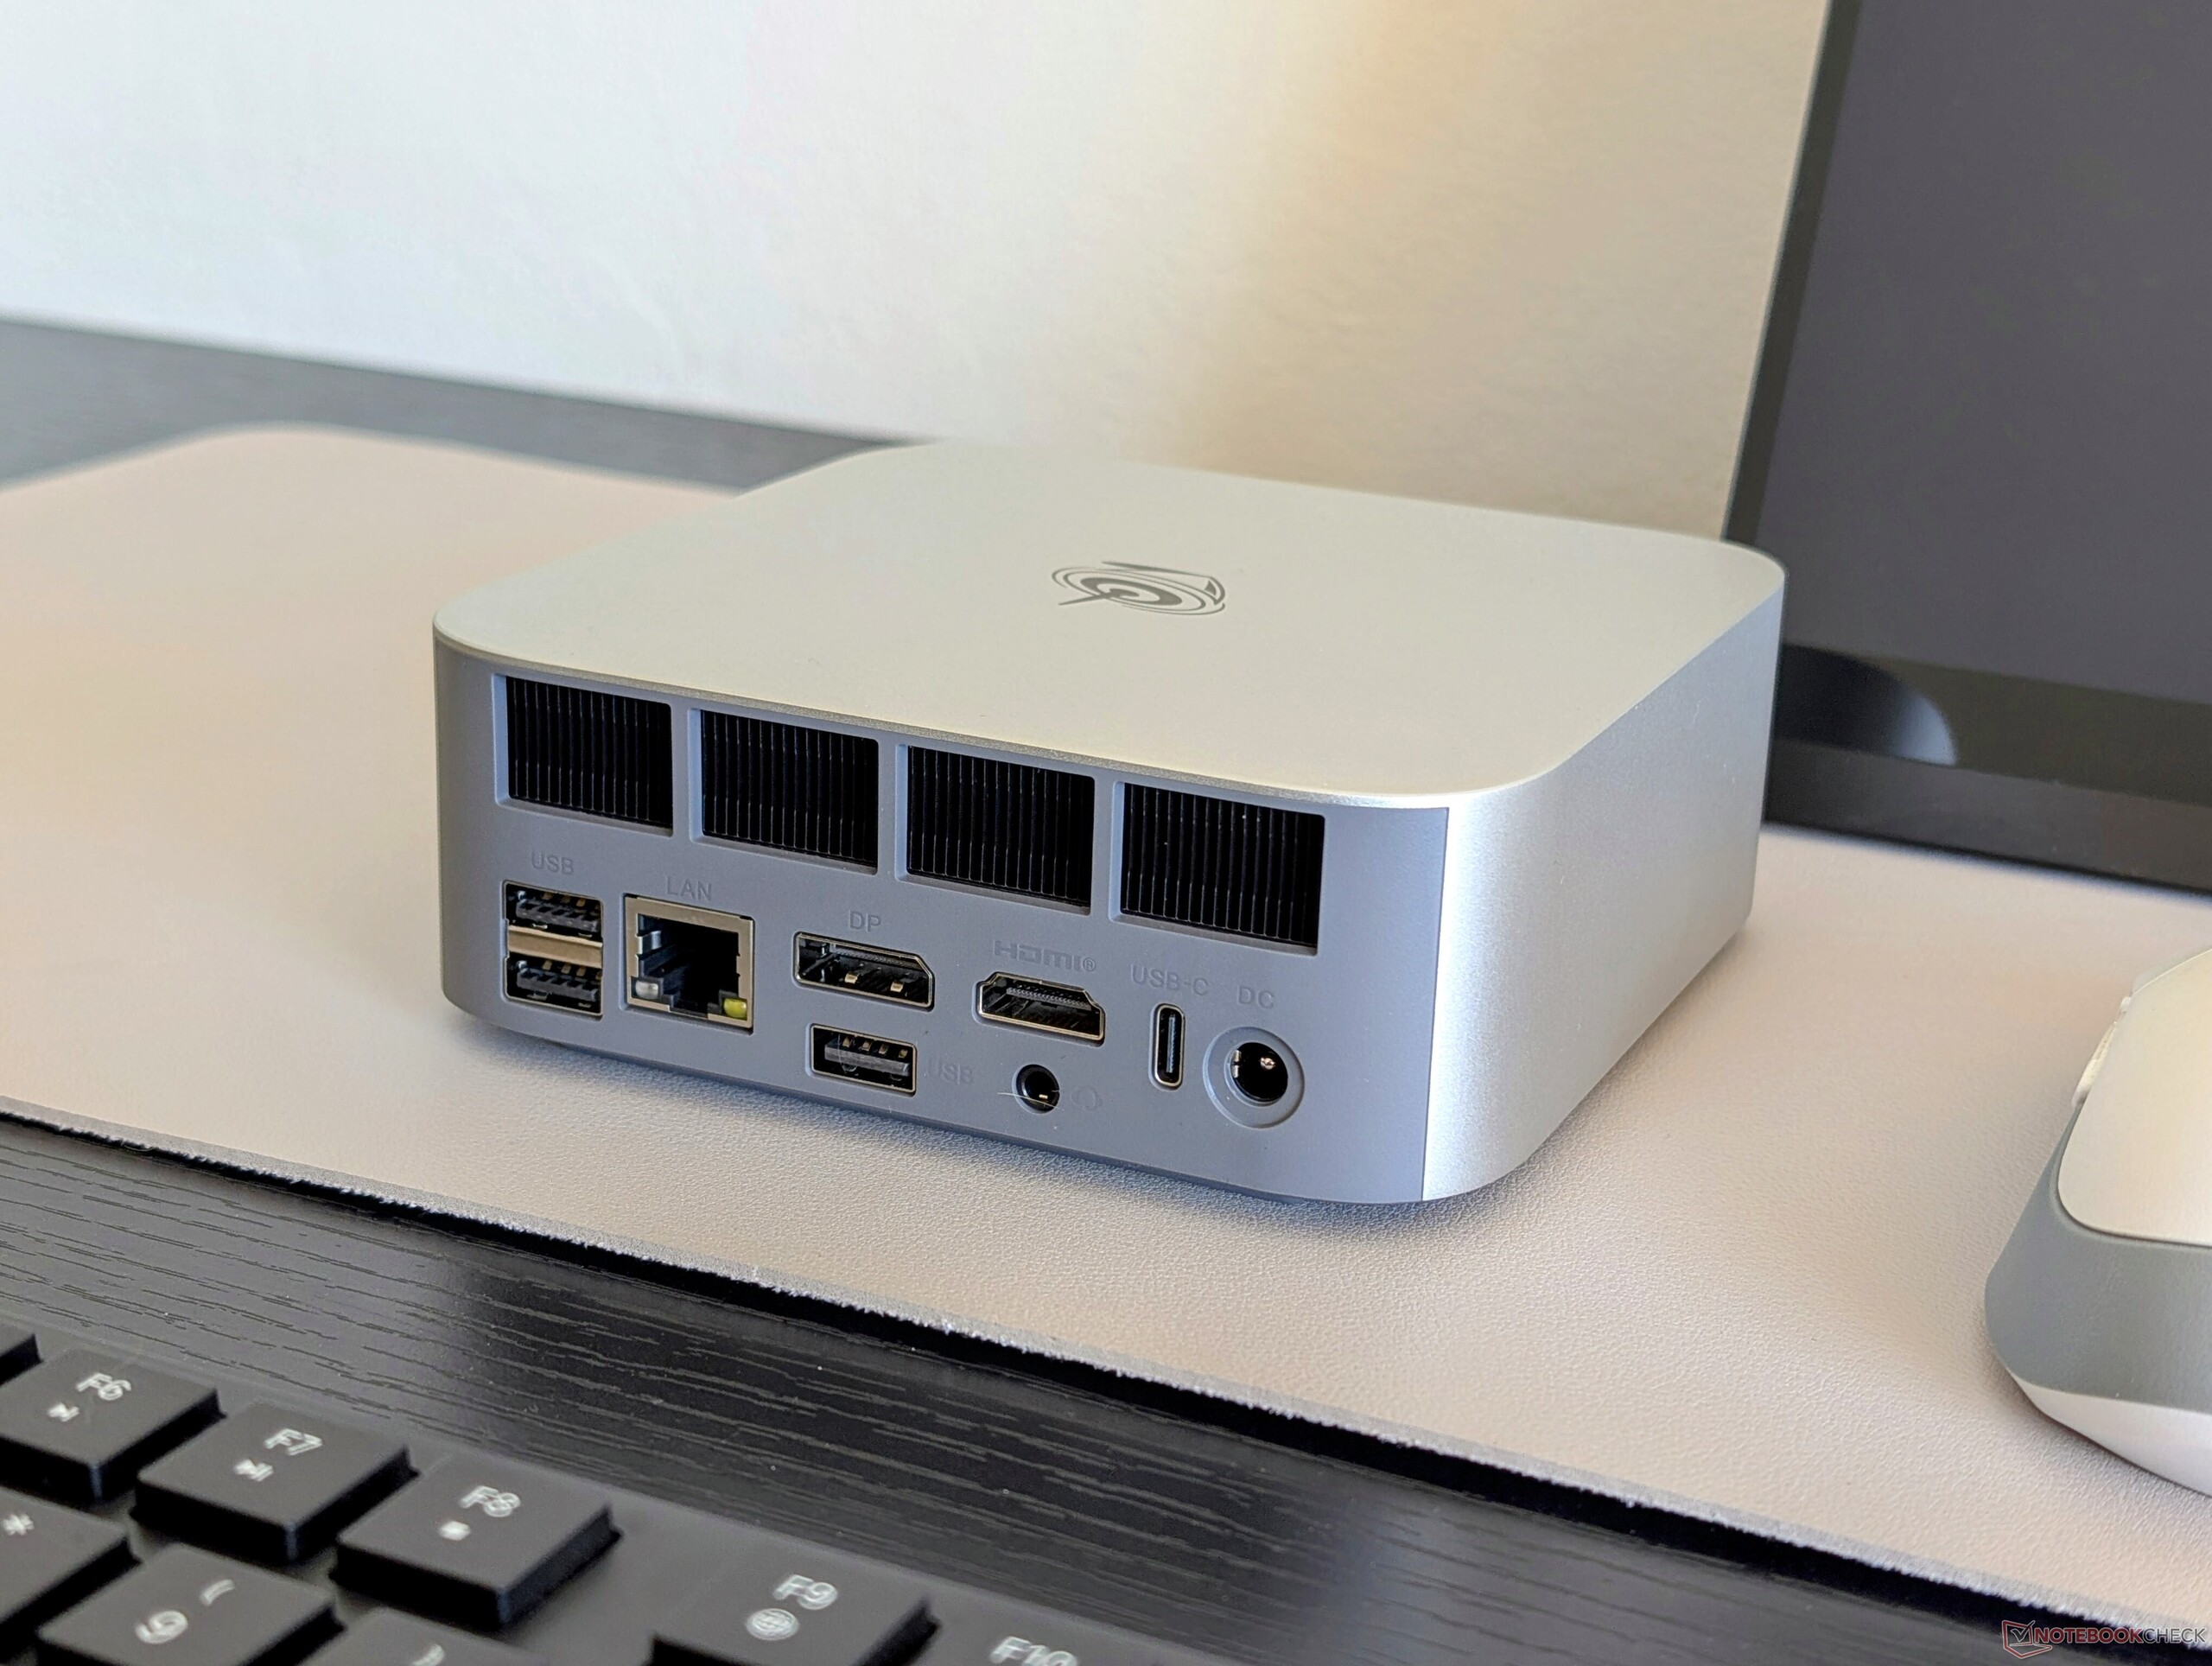
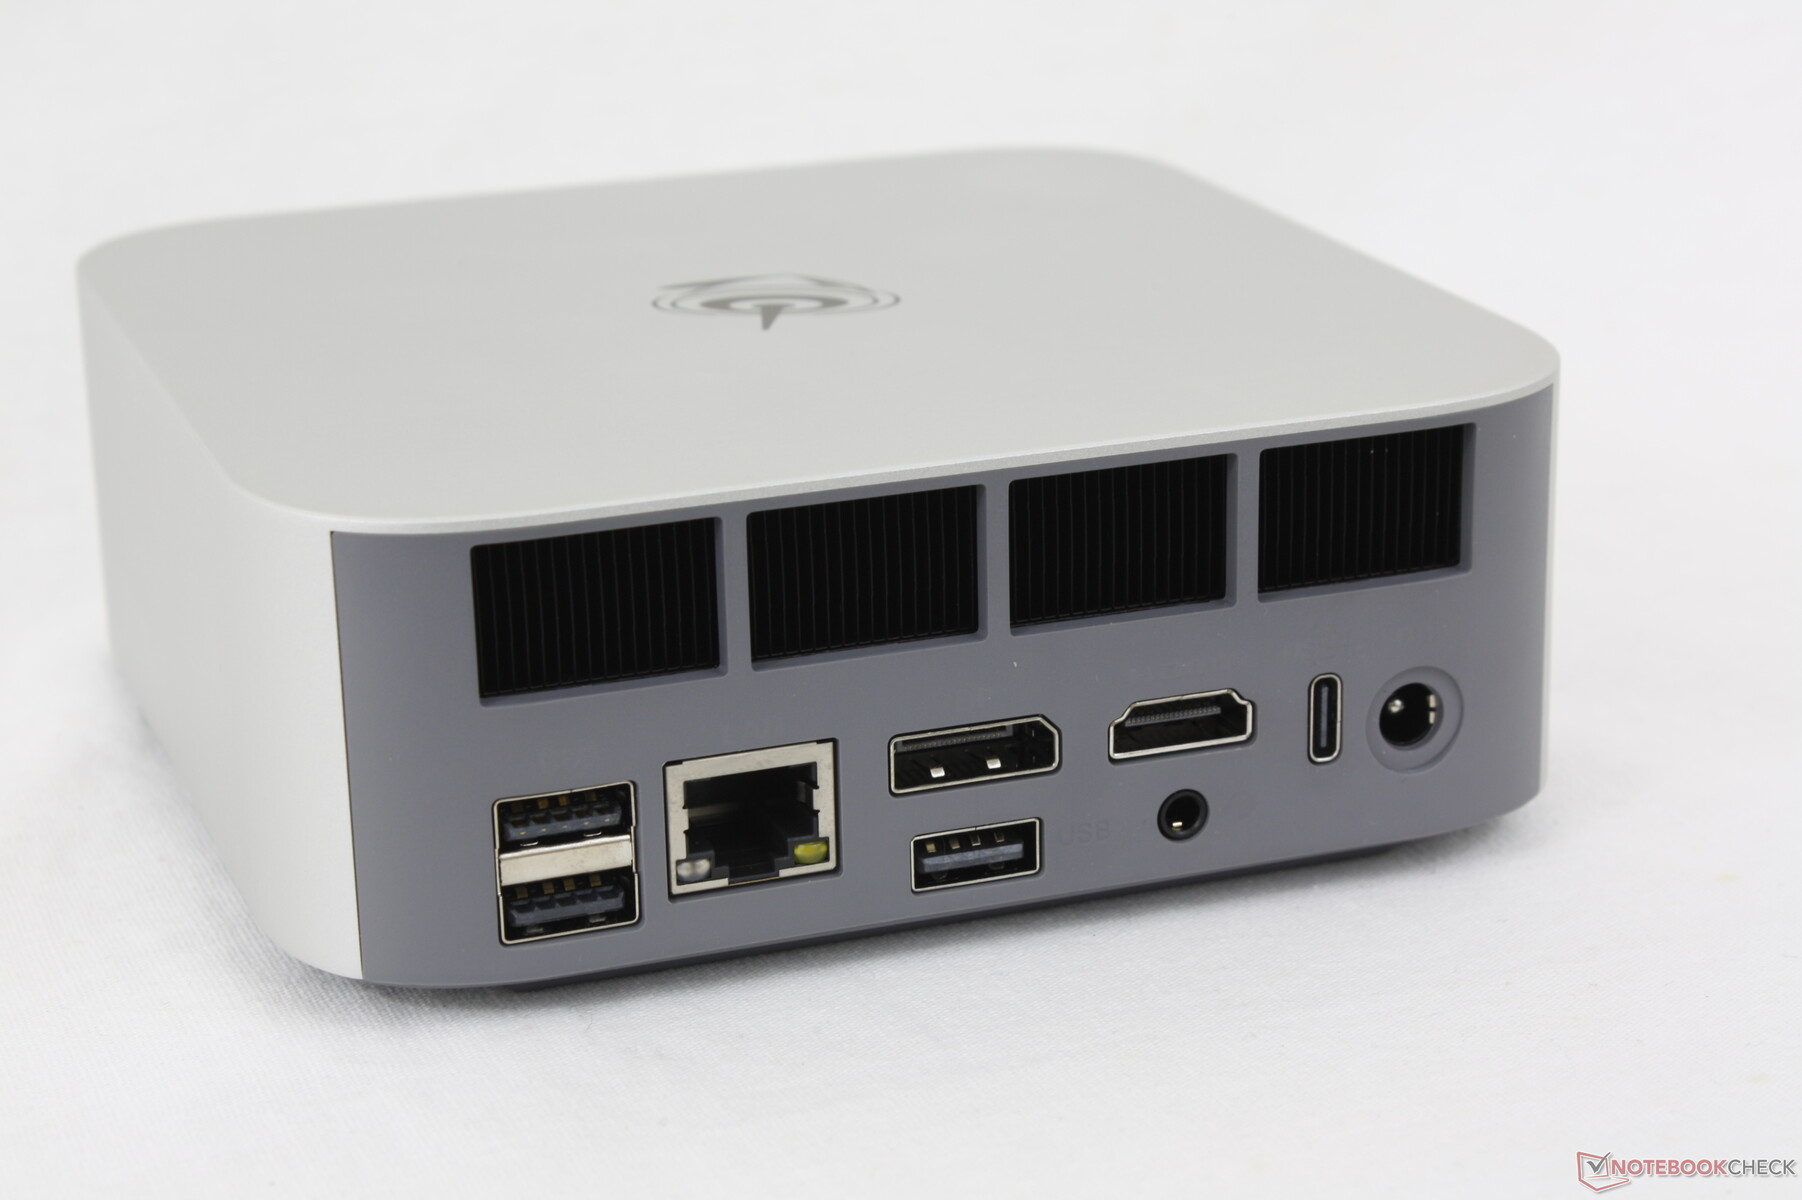
Connectivité
Les options de port n'ont pas changé par rapport au SER8. Notez que le système peut être alimenté par des adaptateurs secteur USB-C tiers à la place de l'adaptateur secteur de type tonneau livré dans la boîte.

Communication
L'Intel AX200 est livré en standard avec la prise en charge du Wi-Fi 6 et du Bluetooth 5.2. Le Wi-Fi 6E et le Wi-Fi 7 ne sont pas pris en charge.
| Networking | |
| iperf3 transmit AXE11000 | |
| GMK NucBox K9 | |
| Beelink SER8 | |
| Asus NUC 14 Pro+ | |
| MSI Cubi NUC 1M | |
| Beelink SER9 | |
| iperf3 receive AXE11000 | |
| Asus NUC 14 Pro+ | |
| Beelink SER9 | |
| Beelink SER8 | |
| GMK NucBox K9 | |
| MSI Cubi NUC 1M | |
| iperf3 transmit AXE11000 6GHz | |
| MSI Cubi NUC 1M | |
| Asus NUC 14 Pro+ | |
| Beelink SEi11 Pro | |
| iperf3 receive AXE11000 6GHz | |
| MSI Cubi NUC 1M | |
| Asus NUC 14 Pro+ | |
| Beelink SEi11 Pro | |
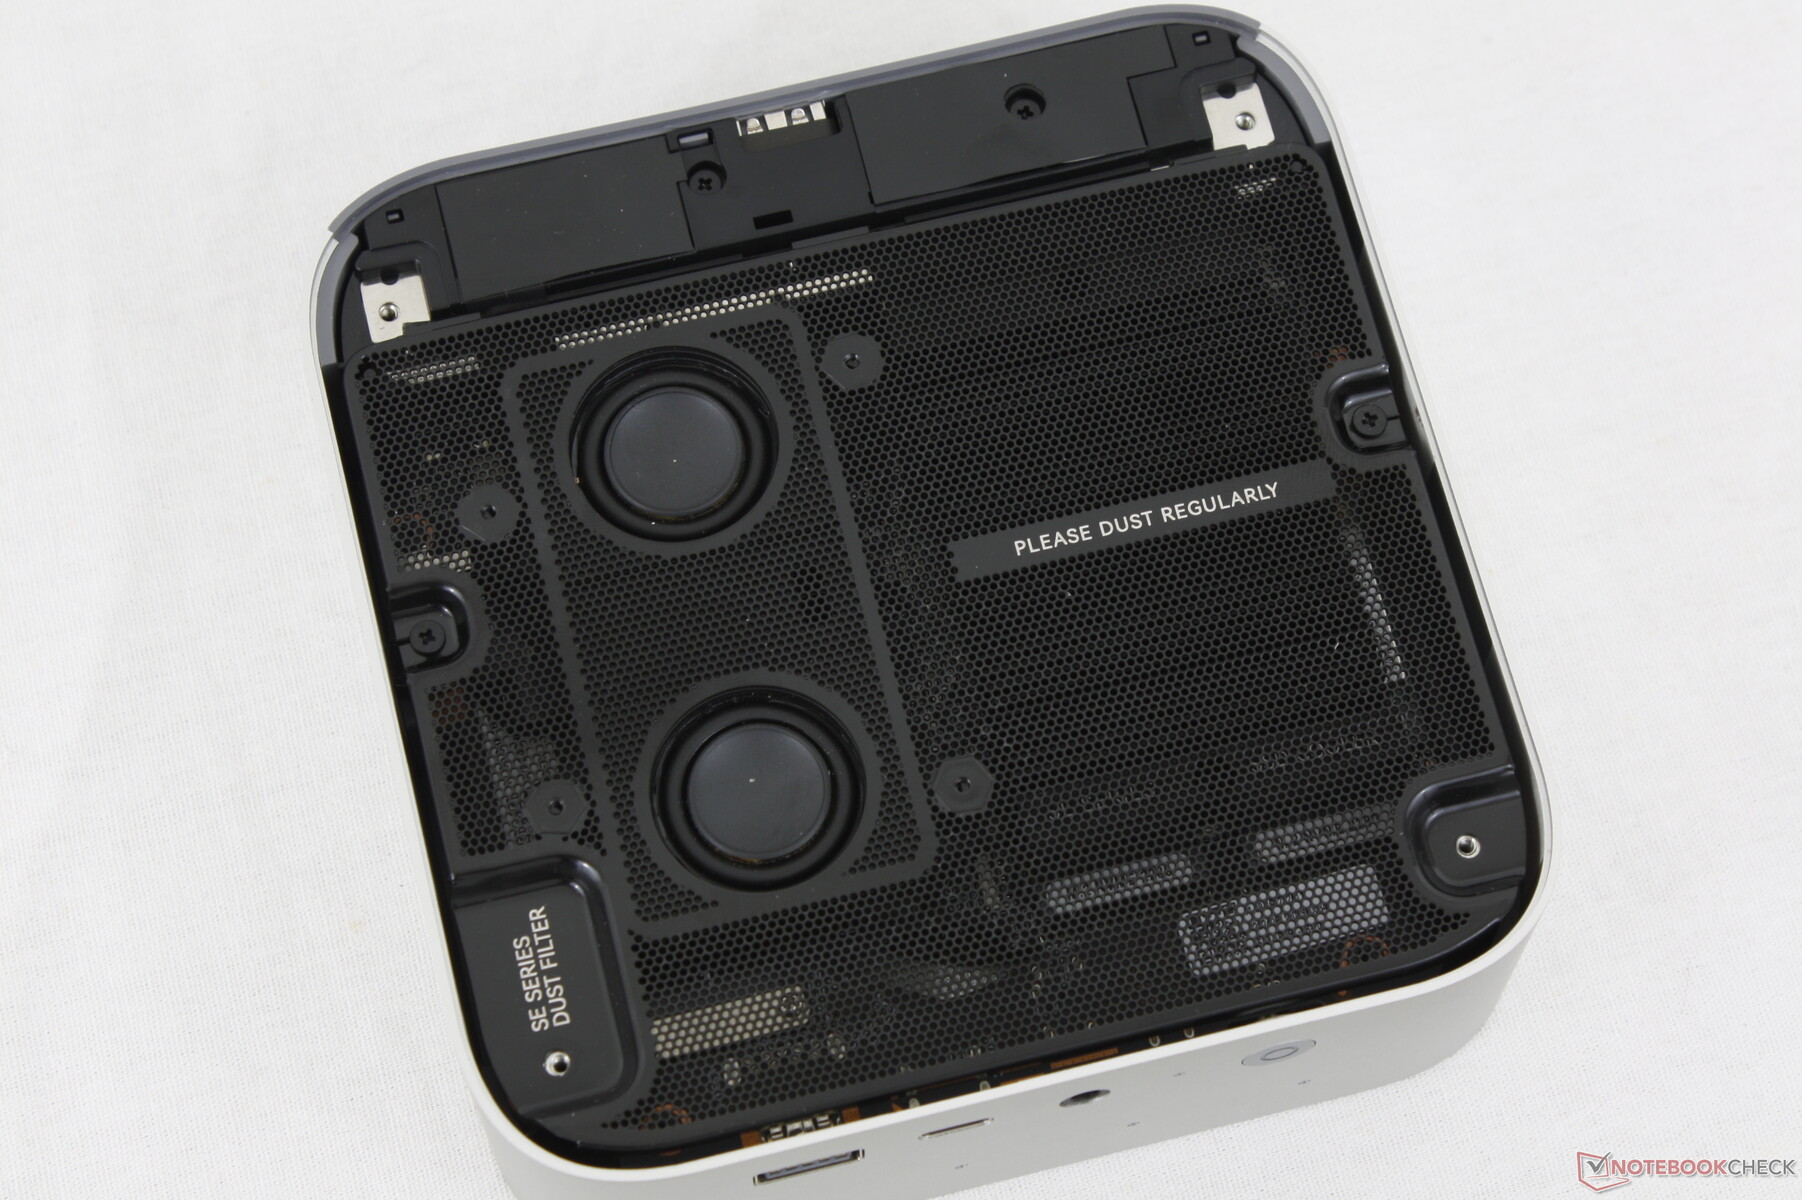
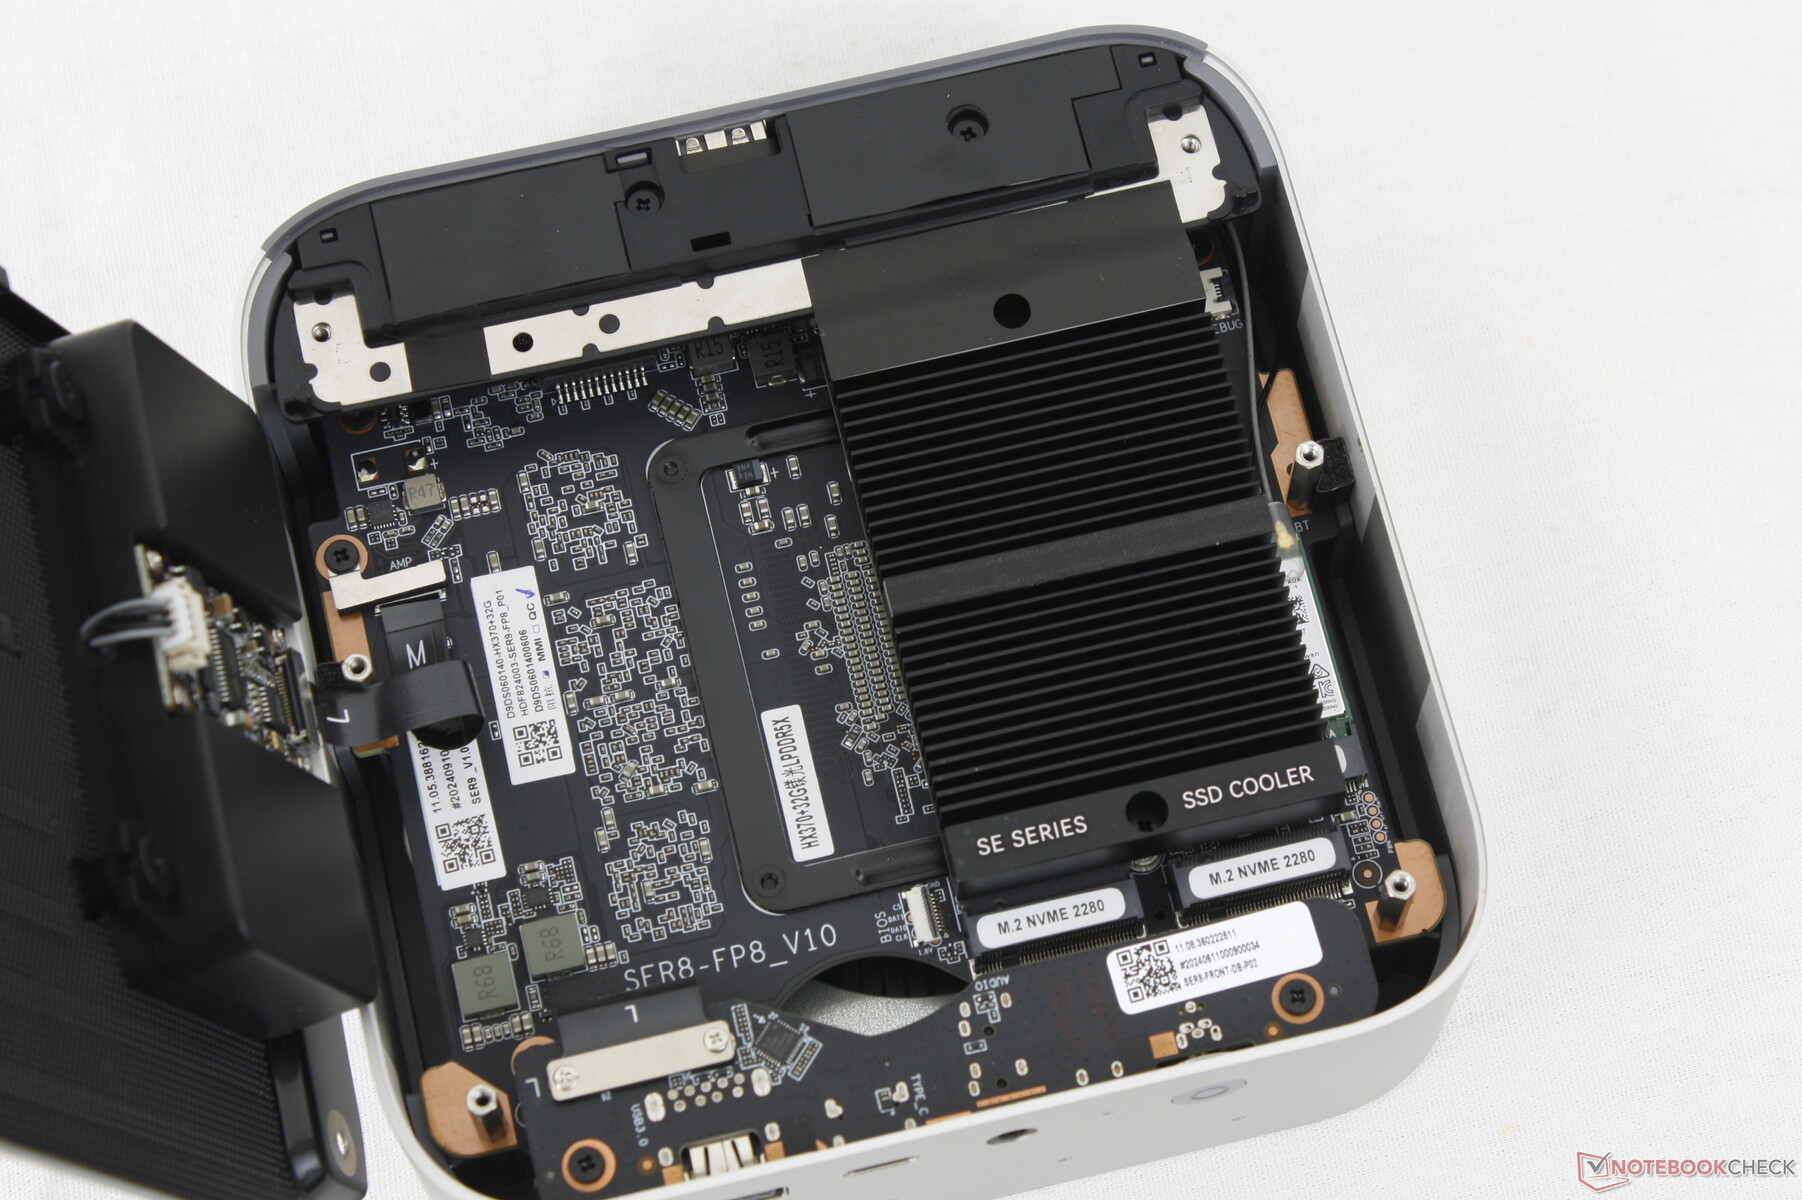
Maintenance
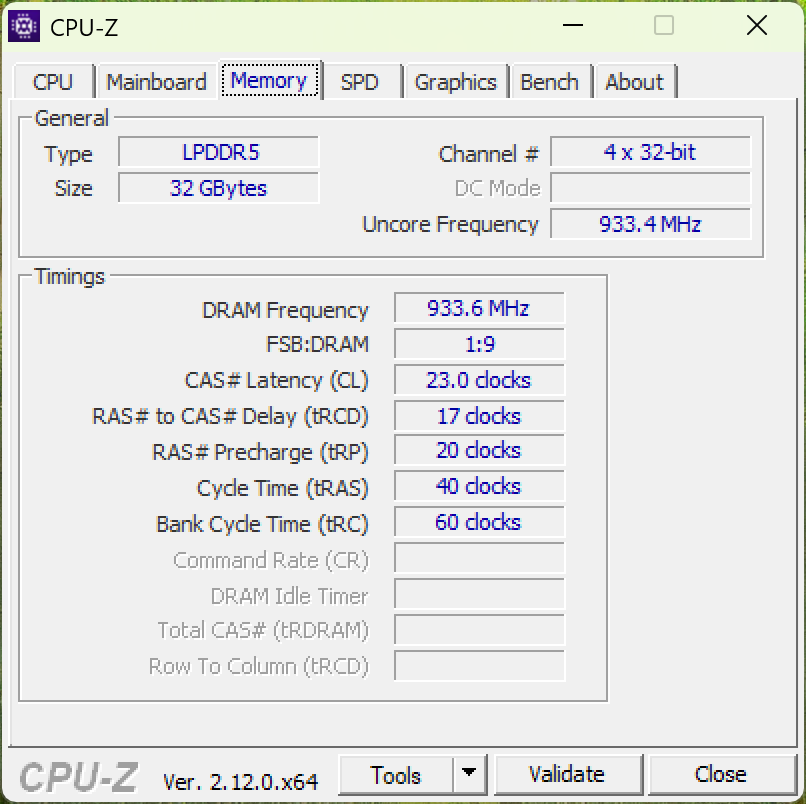
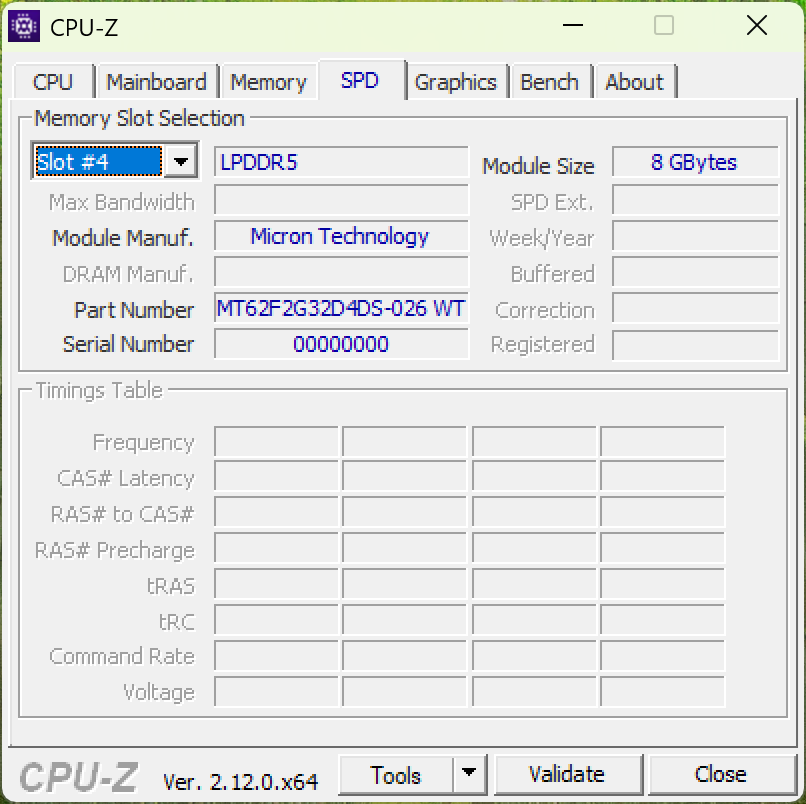
L'entretien est similaire à celui du SER8, mais avec une différence notable : il n'y a plus d'emplacements SODIMM puisque la RAM est soudée sur le SER9.
Durabilité
L'emballage est principalement composé de papier et de carton, avec un peu d'emballage plastique pour les accessoires. Le fabricant n'annonce aucune autre mesure de développement durable.
Accessoires et garantie
L'emballage comprend un câble HDMI, les documents habituels et un adaptateur secteur. Il n'y a pas de fixation VESA.
Une garantie constructeur d'un an s'applique si vous l'achetez aux États-Unis.
Performance
Conditions d'essai
Nous avons réglé Windows sur le mode Performance avant d'effectuer les tests ci-dessous.
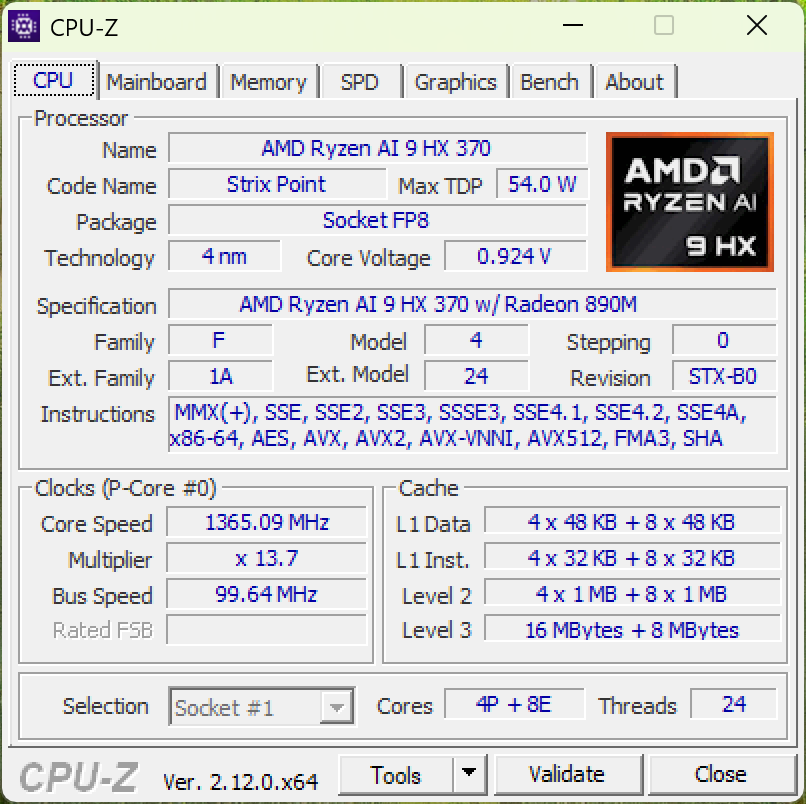
Processeur
Les performances brutes du processeur sont excellentes, avec des performances Turbo Boost constantes et une amélioration sensible par rapport à la génération précédente Ryzen 7 8845HS d'environ 30 %. Il en va de même pour le Core Ultra 9 185H qui est environ 10 à 15 % plus lent que notre Core Ultra 9 185H Ryzen AI 9 HX 370.
Cinebench R15 Multi Loop
Cinebench R23: Multi Core | Single Core
Cinebench R20: CPU (Multi Core) | CPU (Single Core)
Cinebench R15: CPU Multi 64Bit | CPU Single 64Bit
Blender: v2.79 BMW27 CPU
7-Zip 18.03: 7z b 4 | 7z b 4 -mmt1
Geekbench 6.7: Multi-Core | Single-Core
Geekbench 5.5: Multi-Core | Single-Core
HWBOT x265 Benchmark v2.2: 4k Preset
LibreOffice : 20 Documents To PDF
R Benchmark 2.5: Overall mean
| CPU Performance rating | |
| Lenovo ThinkStation P3 Tiny-30H0006AGE | |
| Beelink SER9 | |
| Moyenne AMD Ryzen AI 9 HX 370 | |
| Minisforum MS-A1 | |
| Beelink SER8 | |
| GMK NucBox K6 | |
| BOSGAME M1 | |
| Geekom AX8 Pro | |
| Asus NUC 14 Pro+ | |
| Geekom XT13 Pro | |
| GMK NucBox K9 -1! | |
| HP Pro Mini 400 G9-937U0EA | |
| Khadas Mind 2 | |
| MSI Cubi NUC 1M | |
| GMK NucBox M6 | |
| Beelink SEi11 Pro -2! | |
| Cinebench R20 / CPU (Multi Core) | |
| Lenovo ThinkStation P3 Tiny-30H0006AGE | |
| Beelink SER9 | |
| Moyenne AMD Ryzen AI 9 HX 370 (6449 - 9280, n=24) | |
| Asus NUC 14 Pro+ | |
| Minisforum MS-A1 | |
| Beelink SER8 | |
| BOSGAME M1 | |
| GMK NucBox K6 | |
| Geekom AX8 Pro | |
| Khadas Mind 2 | |
| GMK NucBox K9 | |
| Geekom XT13 Pro | |
| HP Pro Mini 400 G9-937U0EA | |
| GMK NucBox M6 | |
| MSI Cubi NUC 1M | |
| Beelink SEi11 Pro | |
| Cinebench R20 / CPU (Single Core) | |
| Lenovo ThinkStation P3 Tiny-30H0006AGE | |
| Beelink SER9 | |
| Moyenne AMD Ryzen AI 9 HX 370 (737 - 804, n=24) | |
| MSI Cubi NUC 1M | |
| HP Pro Mini 400 G9-937U0EA | |
| Minisforum MS-A1 | |
| Geekom AX8 Pro | |
| Asus NUC 14 Pro+ | |
| Beelink SER8 | |
| GMK NucBox K6 | |
| BOSGAME M1 | |
| GMK NucBox K9 | |
| Geekom XT13 Pro | |
| Khadas Mind 2 | |
| GMK NucBox M6 | |
| Beelink SEi11 Pro | |
| Cinebench R15 / CPU Single 64Bit | |
| Lenovo ThinkStation P3 Tiny-30H0006AGE | |
| Beelink SER9 | |
| Moyenne AMD Ryzen AI 9 HX 370 (188.8 - 315, n=24) | |
| Minisforum MS-A1 | |
| Geekom AX8 Pro | |
| Beelink SER8 | |
| GMK NucBox K6 | |
| BOSGAME M1 | |
| Asus NUC 14 Pro+ | |
| MSI Cubi NUC 1M | |
| HP Pro Mini 400 G9-937U0EA | |
| GMK NucBox K9 | |
| Geekom XT13 Pro | |
| GMK NucBox M6 | |
| Khadas Mind 2 | |
| Beelink SEi11 Pro | |
| HWBOT x265 Benchmark v2.2 / 4k Preset | |
| Lenovo ThinkStation P3 Tiny-30H0006AGE | |
| Beelink SER9 | |
| Moyenne AMD Ryzen AI 9 HX 370 (20.3 - 28.7, n=24) | |
| Minisforum MS-A1 | |
| Beelink SER8 | |
| Geekom AX8 Pro | |
| GMK NucBox K6 | |
| BOSGAME M1 | |
| Asus NUC 14 Pro+ | |
| Khadas Mind 2 | |
| Geekom XT13 Pro | |
| GMK NucBox M6 | |
| GMK NucBox K9 | |
| HP Pro Mini 400 G9-937U0EA | |
| MSI Cubi NUC 1M | |
| Beelink SEi11 Pro | |
| LibreOffice / 20 Documents To PDF | |
| Khadas Mind 2 | |
| Moyenne AMD Ryzen AI 9 HX 370 (46.8 - 66.6, n=24) | |
| GMK NucBox M6 | |
| Asus NUC 14 Pro+ | |
| Beelink SER9 | |
| Geekom AX8 Pro | |
| Beelink SEi11 Pro | |
| HP Pro Mini 400 G9-937U0EA | |
| BOSGAME M1 | |
| Geekom XT13 Pro | |
| Beelink SER8 | |
| Minisforum MS-A1 | |
| GMK NucBox K6 | |
| GMK NucBox K9 | |
| Lenovo ThinkStation P3 Tiny-30H0006AGE | |
| MSI Cubi NUC 1M | |
Cinebench R23: Multi Core | Single Core
Cinebench R20: CPU (Multi Core) | CPU (Single Core)
Cinebench R15: CPU Multi 64Bit | CPU Single 64Bit
Blender: v2.79 BMW27 CPU
7-Zip 18.03: 7z b 4 | 7z b 4 -mmt1
Geekbench 6.7: Multi-Core | Single-Core
Geekbench 5.5: Multi-Core | Single-Core
HWBOT x265 Benchmark v2.2: 4k Preset
LibreOffice : 20 Documents To PDF
R Benchmark 2.5: Overall mean
* ... Moindre est la valeur, meilleures sont les performances
AIDA64: FP32 Ray-Trace | FPU Julia | CPU SHA3 | CPU Queen | FPU SinJulia | FPU Mandel | CPU AES | CPU ZLib | FP64 Ray-Trace | CPU PhotoWorxx
| Performance rating | |
| Beelink SER9 | |
| Moyenne AMD Ryzen AI 9 HX 370 | |
| Beelink SER8 | |
| Asus NUC 14 Pro+ | |
| GMK NucBox K9 | |
| MSI Cubi NUC 1M | |
| Beelink SEi11 Pro | |
| AIDA64 / FP32 Ray-Trace | |
| Beelink SER9 | |
| Moyenne AMD Ryzen AI 9 HX 370 (24673 - 37804, n=25) | |
| Beelink SER8 | |
| Asus NUC 14 Pro+ | |
| GMK NucBox K9 | |
| Beelink SEi11 Pro | |
| MSI Cubi NUC 1M | |
| AIDA64 / FPU Julia | |
| Beelink SER9 | |
| Moyenne AMD Ryzen AI 9 HX 370 (95655 - 148045, n=26) | |
| Beelink SER8 | |
| Asus NUC 14 Pro+ | |
| GMK NucBox K9 | |
| MSI Cubi NUC 1M | |
| Beelink SEi11 Pro | |
| AIDA64 / CPU SHA3 | |
| Beelink SER9 | |
| Moyenne AMD Ryzen AI 9 HX 370 (4421 - 5932, n=26) | |
| Beelink SER8 | |
| Asus NUC 14 Pro+ | |
| GMK NucBox K9 | |
| Beelink SEi11 Pro | |
| MSI Cubi NUC 1M | |
| AIDA64 / CPU Queen | |
| Beelink SER8 | |
| Beelink SER9 | |
| Asus NUC 14 Pro+ | |
| Moyenne AMD Ryzen AI 9 HX 370 (41744 - 99088, n=24) | |
| GMK NucBox K9 | |
| MSI Cubi NUC 1M | |
| Beelink SEi11 Pro | |
| AIDA64 / FPU SinJulia | |
| Beelink SER9 | |
| Moyenne AMD Ryzen AI 9 HX 370 (16445 - 19120, n=26) | |
| Beelink SER8 | |
| Asus NUC 14 Pro+ | |
| GMK NucBox K9 | |
| Beelink SEi11 Pro | |
| MSI Cubi NUC 1M | |
| AIDA64 / FPU Mandel | |
| Beelink SER9 | |
| Moyenne AMD Ryzen AI 9 HX 370 (50357 - 93798, n=25) | |
| Beelink SER8 | |
| Asus NUC 14 Pro+ | |
| GMK NucBox K9 | |
| Beelink SEi11 Pro | |
| MSI Cubi NUC 1M | |
| AIDA64 / CPU AES | |
| Beelink SER8 | |
| GMK NucBox K9 | |
| Moyenne AMD Ryzen AI 9 HX 370 (67015 - 118993, n=26) | |
| Beelink SER9 | |
| Asus NUC 14 Pro+ | |
| Beelink SEi11 Pro | |
| MSI Cubi NUC 1M | |
| AIDA64 / CPU ZLib | |
| Beelink SER9 | |
| Moyenne AMD Ryzen AI 9 HX 370 (1077 - 1530, n=26) | |
| Asus NUC 14 Pro+ | |
| Beelink SER8 | |
| GMK NucBox K9 | |
| MSI Cubi NUC 1M | |
| Beelink SEi11 Pro | |
| AIDA64 / FP64 Ray-Trace | |
| Beelink SER9 | |
| Moyenne AMD Ryzen AI 9 HX 370 (13665 - 20648, n=26) | |
| Beelink SER8 | |
| Asus NUC 14 Pro+ | |
| GMK NucBox K9 | |
| Beelink SEi11 Pro | |
| MSI Cubi NUC 1M | |
| AIDA64 / CPU PhotoWorxx | |
| Beelink SER9 | |
| Moyenne AMD Ryzen AI 9 HX 370 (36752 - 52671, n=26) | |
| GMK NucBox K9 | |
| Asus NUC 14 Pro+ | |
| Beelink SER8 | |
| MSI Cubi NUC 1M | |
| Beelink SEi11 Pro | |
Performance du système
CrossMark: Overall | Productivity | Creativity | Responsiveness
WebXPRT 3: Overall
WebXPRT 4: Overall
Mozilla Kraken 1.1: Total
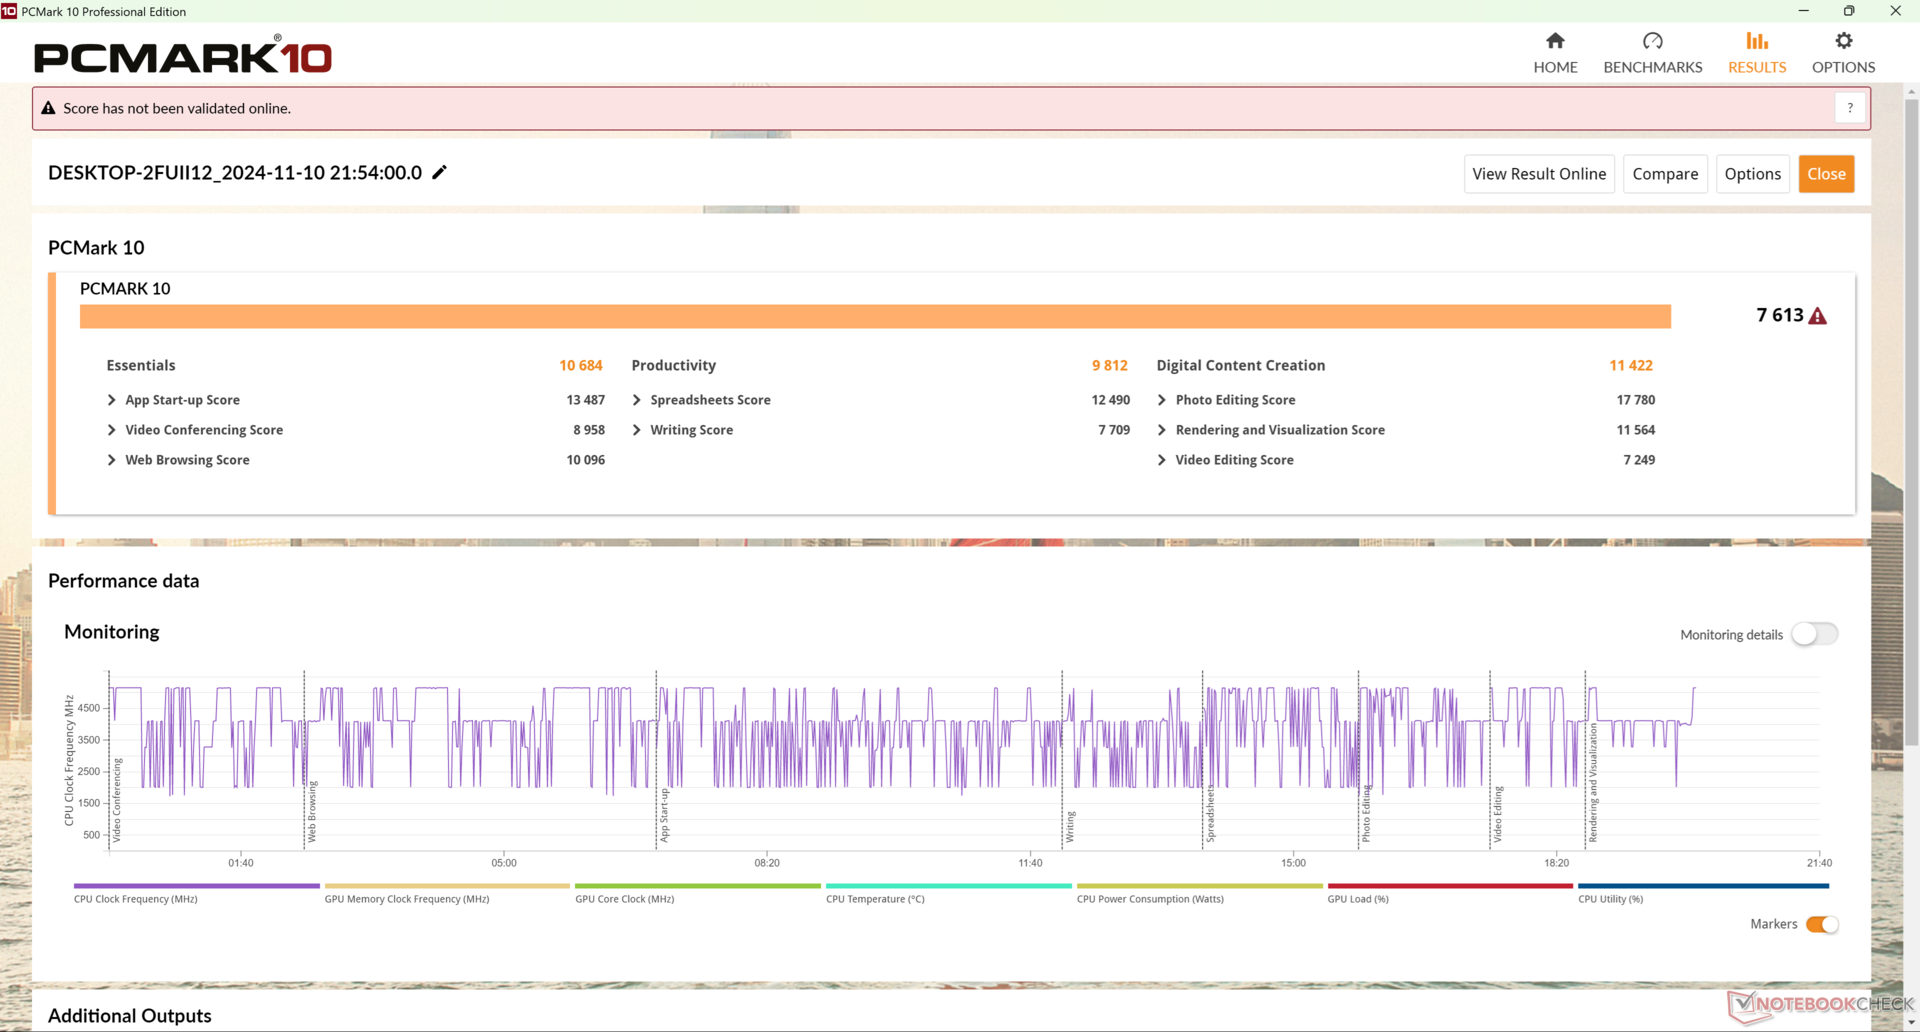
| PCMark 10 / Score | |
| Beelink SER8 | |
| Beelink SER9 | |
| Moyenne AMD Ryzen AI 9 HX 370, AMD Radeon 890M (6577 - 7755, n=14) | |
| Asus NUC 14 Pro+ | |
| GMK NucBox K9 | |
| MSI Cubi NUC 1M | |
| Beelink SEi11 Pro | |
| PCMark 10 / Essentials | |
| Beelink SER8 | |
| MSI Cubi NUC 1M | |
| GMK NucBox K9 | |
| Beelink SER9 | |
| Moyenne AMD Ryzen AI 9 HX 370, AMD Radeon 890M (9277 - 11262, n=14) | |
| Beelink SEi11 Pro | |
| Asus NUC 14 Pro+ | |
| PCMark 10 / Productivity | |
| Beelink SER8 | |
| Moyenne AMD Ryzen AI 9 HX 370, AMD Radeon 890M (8497 - 10615, n=14) | |
| Beelink SER9 | |
| Asus NUC 14 Pro+ | |
| MSI Cubi NUC 1M | |
| GMK NucBox K9 | |
| Beelink SEi11 Pro | |
| PCMark 10 / Digital Content Creation | |
| Beelink SER9 | |
| Asus NUC 14 Pro+ | |
| Moyenne AMD Ryzen AI 9 HX 370, AMD Radeon 890M (9334 - 11422, n=14) | |
| Beelink SER8 | |
| GMK NucBox K9 | |
| MSI Cubi NUC 1M | |
| Beelink SEi11 Pro | |
| CrossMark / Overall | |
| Beelink SER8 | |
| MSI Cubi NUC 1M | |
| Moyenne AMD Ryzen AI 9 HX 370, AMD Radeon 890M (1344 - 2040, n=13) | |
| Asus NUC 14 Pro+ | |
| Beelink SER9 | |
| GMK NucBox K9 | |
| Beelink SEi11 Pro | |
| CrossMark / Productivity | |
| Beelink SER8 | |
| MSI Cubi NUC 1M | |
| GMK NucBox K9 | |
| Asus NUC 14 Pro+ | |
| Beelink SER9 | |
| Moyenne AMD Ryzen AI 9 HX 370, AMD Radeon 890M (1166 - 1833, n=13) | |
| Beelink SEi11 Pro | |
| CrossMark / Creativity | |
| Moyenne AMD Ryzen AI 9 HX 370, AMD Radeon 890M (1672 - 2439, n=13) | |
| Beelink SER8 | |
| Asus NUC 14 Pro+ | |
| Beelink SER9 | |
| GMK NucBox K9 | |
| MSI Cubi NUC 1M | |
| Beelink SEi11 Pro | |
| CrossMark / Responsiveness | |
| Beelink SER8 | |
| MSI Cubi NUC 1M | |
| GMK NucBox K9 | |
| Beelink SER9 | |
| Moyenne AMD Ryzen AI 9 HX 370, AMD Radeon 890M (1067 - 1667, n=13) | |
| Asus NUC 14 Pro+ | |
| Beelink SEi11 Pro | |
| WebXPRT 3 / Overall | |
| Beelink SER8 | |
| MSI Cubi NUC 1M | |
| Moyenne AMD Ryzen AI 9 HX 370, AMD Radeon 890M (252 - 363, n=13) | |
| Beelink SER9 | |
| Asus NUC 14 Pro+ | |
| Beelink SEi11 Pro | |
| GMK NucBox K9 | |
| WebXPRT 4 / Overall | |
| MSI Cubi NUC 1M | |
| Beelink SER8 | |
| Asus NUC 14 Pro+ | |
| Moyenne AMD Ryzen AI 9 HX 370, AMD Radeon 890M (210 - 277, n=14) | |
| GMK NucBox K9 | |
| Beelink SER9 | |
| Beelink SEi11 Pro | |
| Mozilla Kraken 1.1 / Total | |
| Beelink SEi11 Pro | |
| GMK NucBox K9 | |
| Asus NUC 14 Pro+ | |
| Beelink SER8 | |
| MSI Cubi NUC 1M | |
| Beelink SER9 | |
| Moyenne AMD Ryzen AI 9 HX 370, AMD Radeon 890M (308 - 503, n=15) | |
* ... Moindre est la valeur, meilleures sont les performances
| PCMark 10 Score | 7613 points | |
Aide | ||
| AIDA64 / Memory Copy | |
| Beelink SER9 | |
| Moyenne AMD Ryzen AI 9 HX 370 (71902 - 93640, n=26) | |
| Asus NUC 14 Pro+ | |
| Beelink SER8 | |
| GMK NucBox K9 | |
| MSI Cubi NUC 1M | |
| Beelink SEi11 Pro | |
| AIDA64 / Memory Read | |
| Beelink SER9 | |
| Moyenne AMD Ryzen AI 9 HX 370 (81367 - 102937, n=26) | |
| Asus NUC 14 Pro+ | |
| GMK NucBox K9 | |
| MSI Cubi NUC 1M | |
| Beelink SER8 | |
| Beelink SEi11 Pro | |
| AIDA64 / Memory Write | |
| Beelink SER9 | |
| Moyenne AMD Ryzen AI 9 HX 370 (78939 - 108954, n=26) | |
| Beelink SER8 | |
| Asus NUC 14 Pro+ | |
| GMK NucBox K9 | |
| MSI Cubi NUC 1M | |
| Beelink SEi11 Pro | |
| AIDA64 / Memory Latency | |
| GMK NucBox K9 | |
| Asus NUC 14 Pro+ | |
| Beelink SER9 | |
| Moyenne AMD Ryzen AI 9 HX 370 (86.7 - 119.4, n=26) | |
| Beelink SER8 | |
| Beelink SEi11 Pro | |
| MSI Cubi NUC 1M | |
* ... Moindre est la valeur, meilleures sont les performances
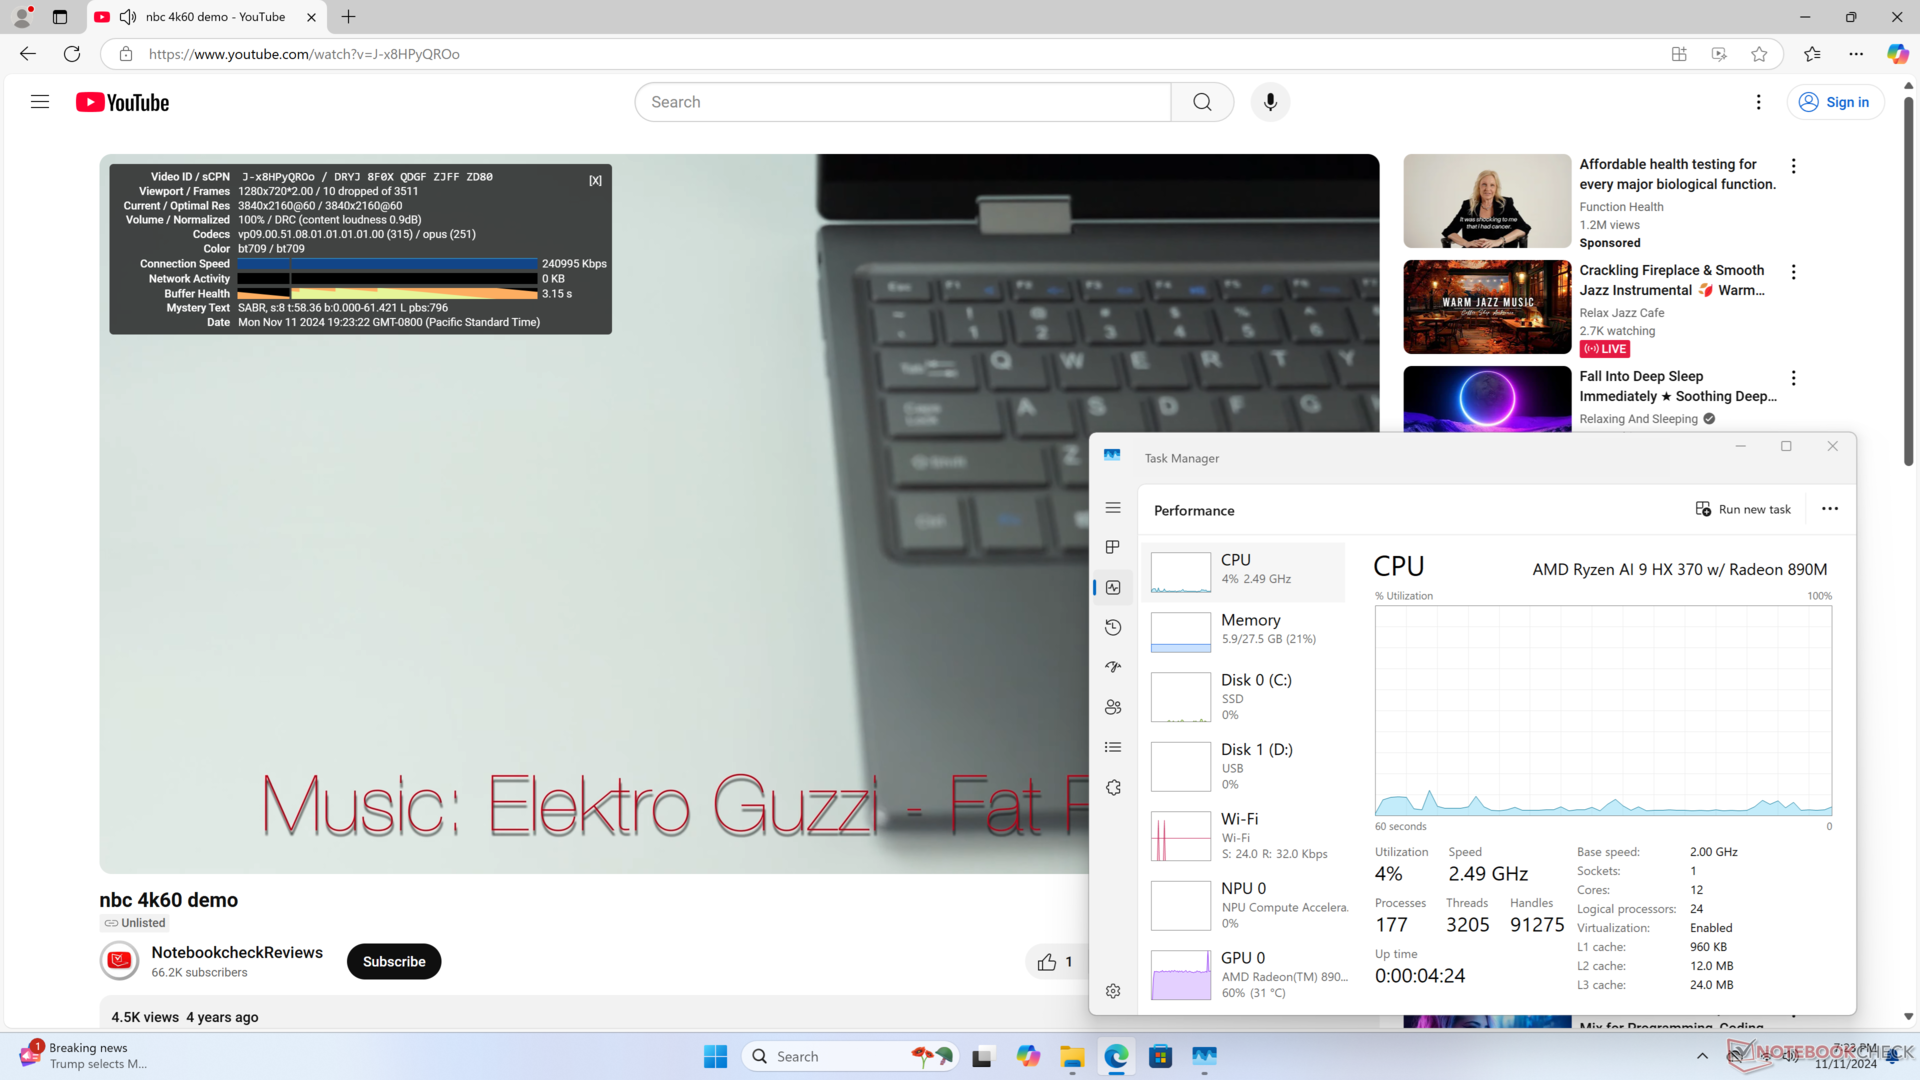
Latence DPC
la lecture de vidéos 4K à 60 FPS est malheureusement imparfaite, avec 10 images perdues enregistrées sur une période de 60 secondes. En comparaison, la plupart des mini PC équipés de processeurs Intel, comme le MSI Cubi NUC 1M ne renvoient aucune image perdue.
LatencyMon est incompatible avec le processeur Strix Point.
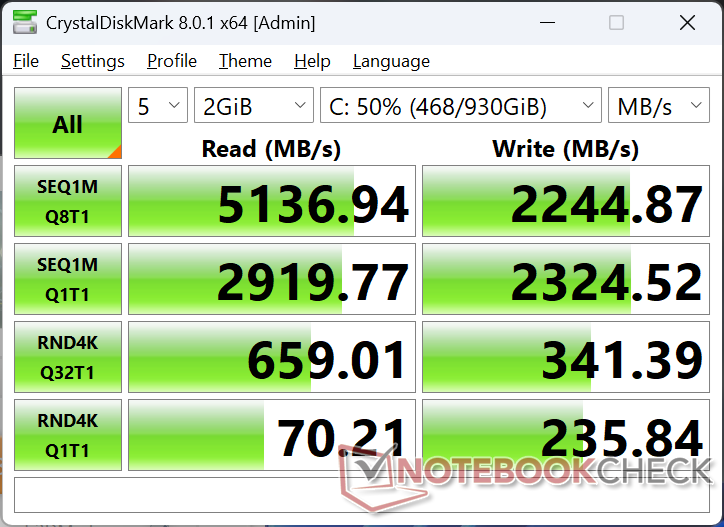
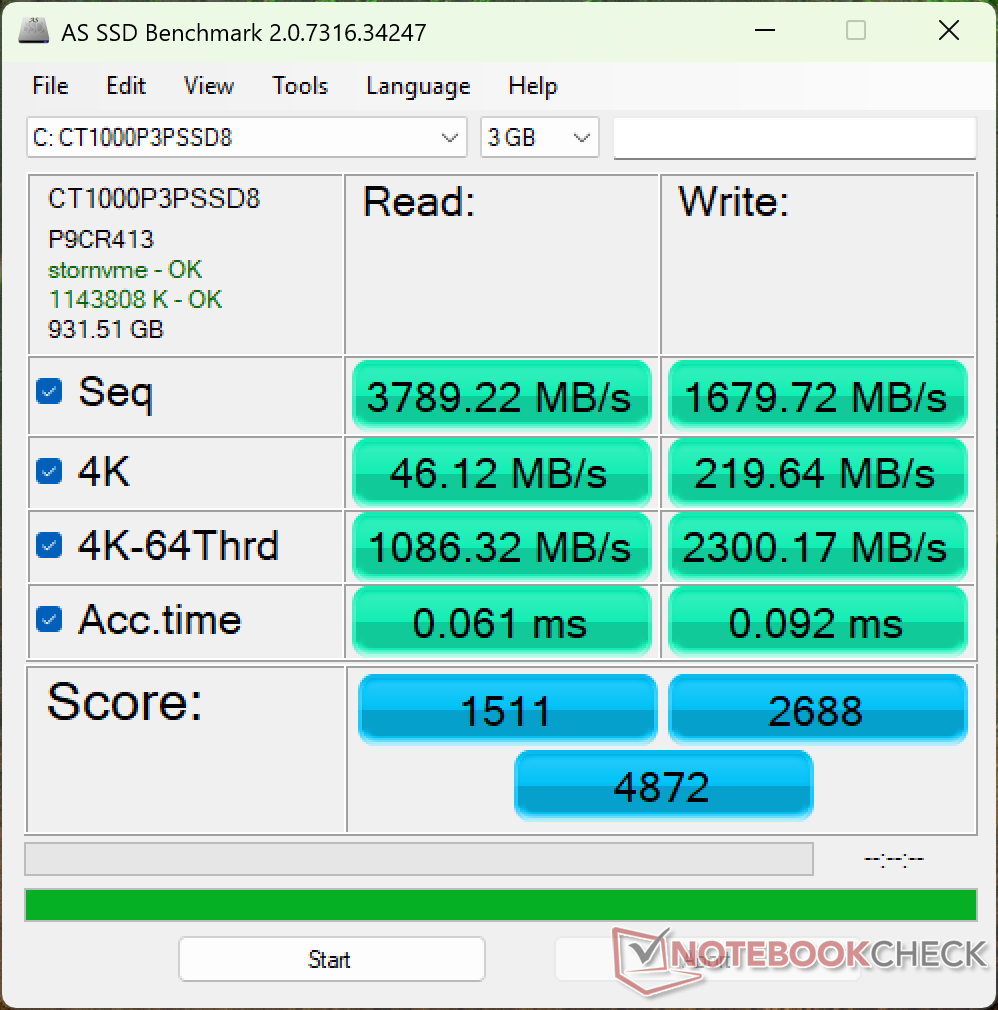
Dispositifs de stockage
Le système est livré avec le même CT1000P3PSSD8 PCIe4 x4 NVMe SSD que l'on trouve sur le SER8. Les taux de transfert sont légèrement plus lents à ~4500 Mo/s contre ~5000 Mo/s sur le SER8.

| Drive Performance rating - Percent | |
| GMK NucBox K9 | |
| Beelink SER8 | |
| Asus NUC 14 Pro | |
| Beelink SER9 | |
| MSI Cubi NUC 1M | |
| Beelink SEi11 Pro | |
* ... Moindre est la valeur, meilleures sont les performances
Disk Throttling: DiskSpd Read Loop, Queue Depth 8
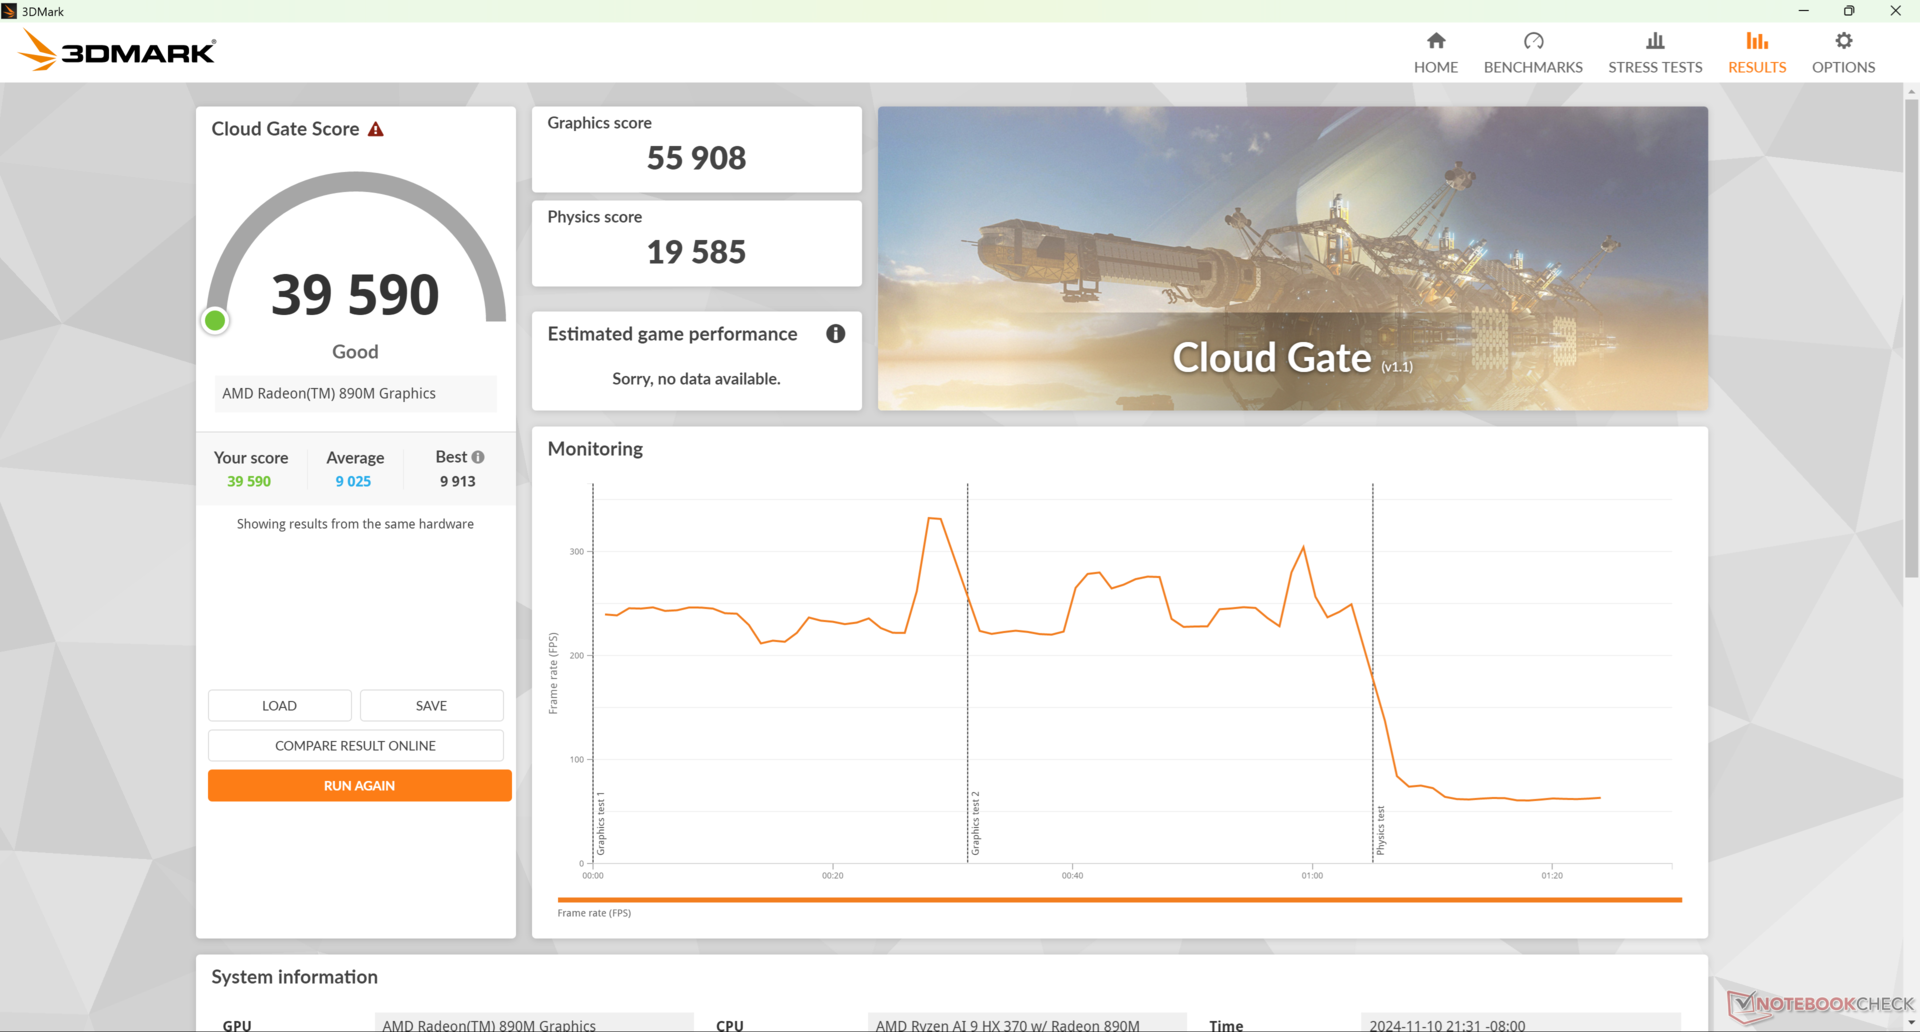
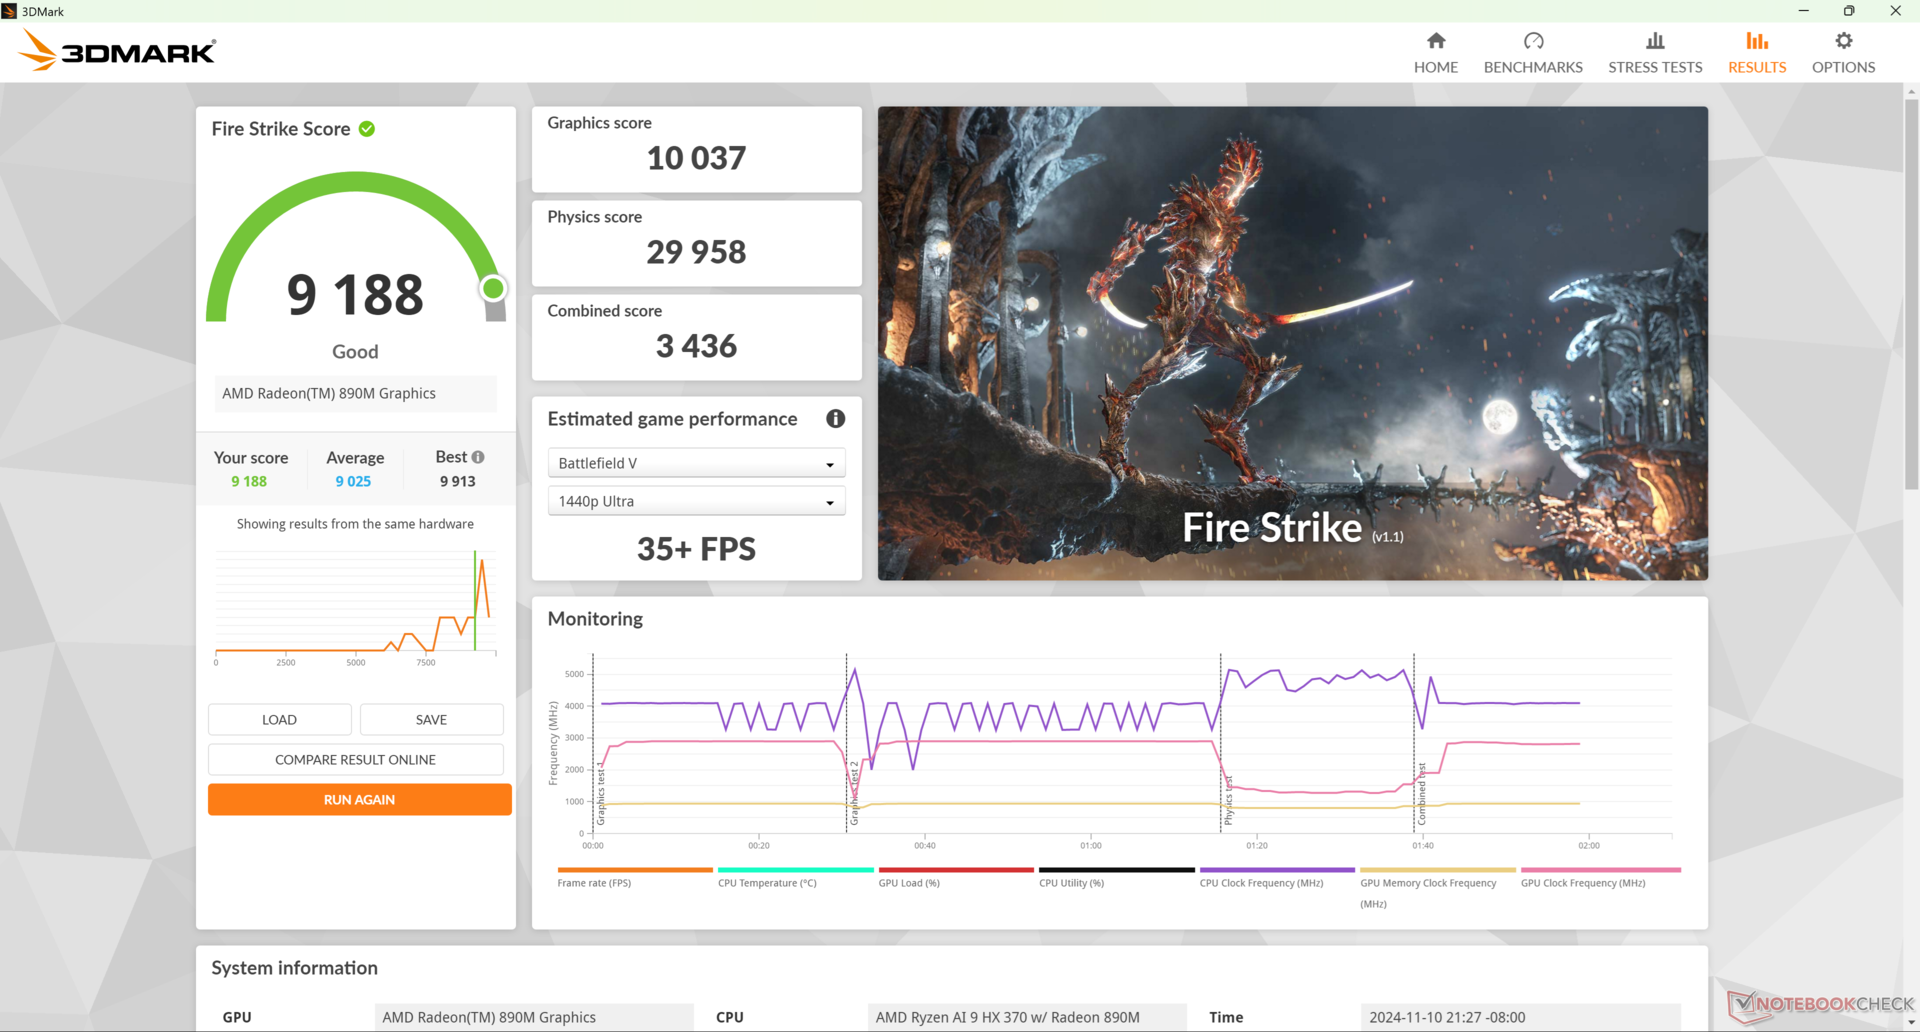
Performance du GPU
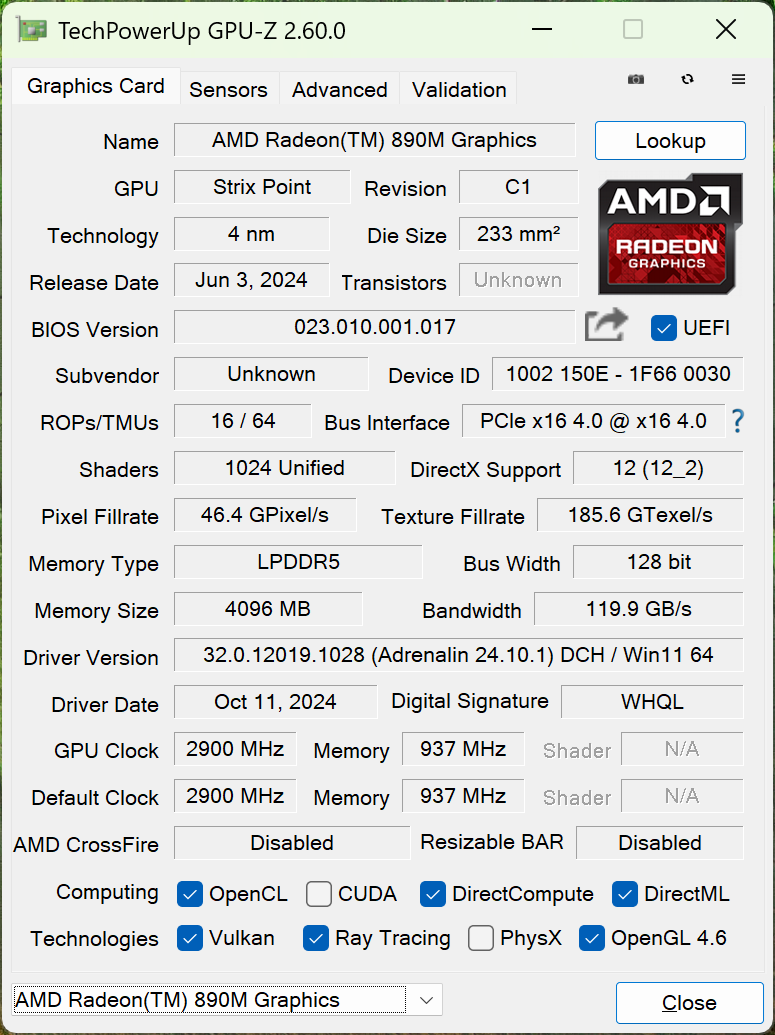
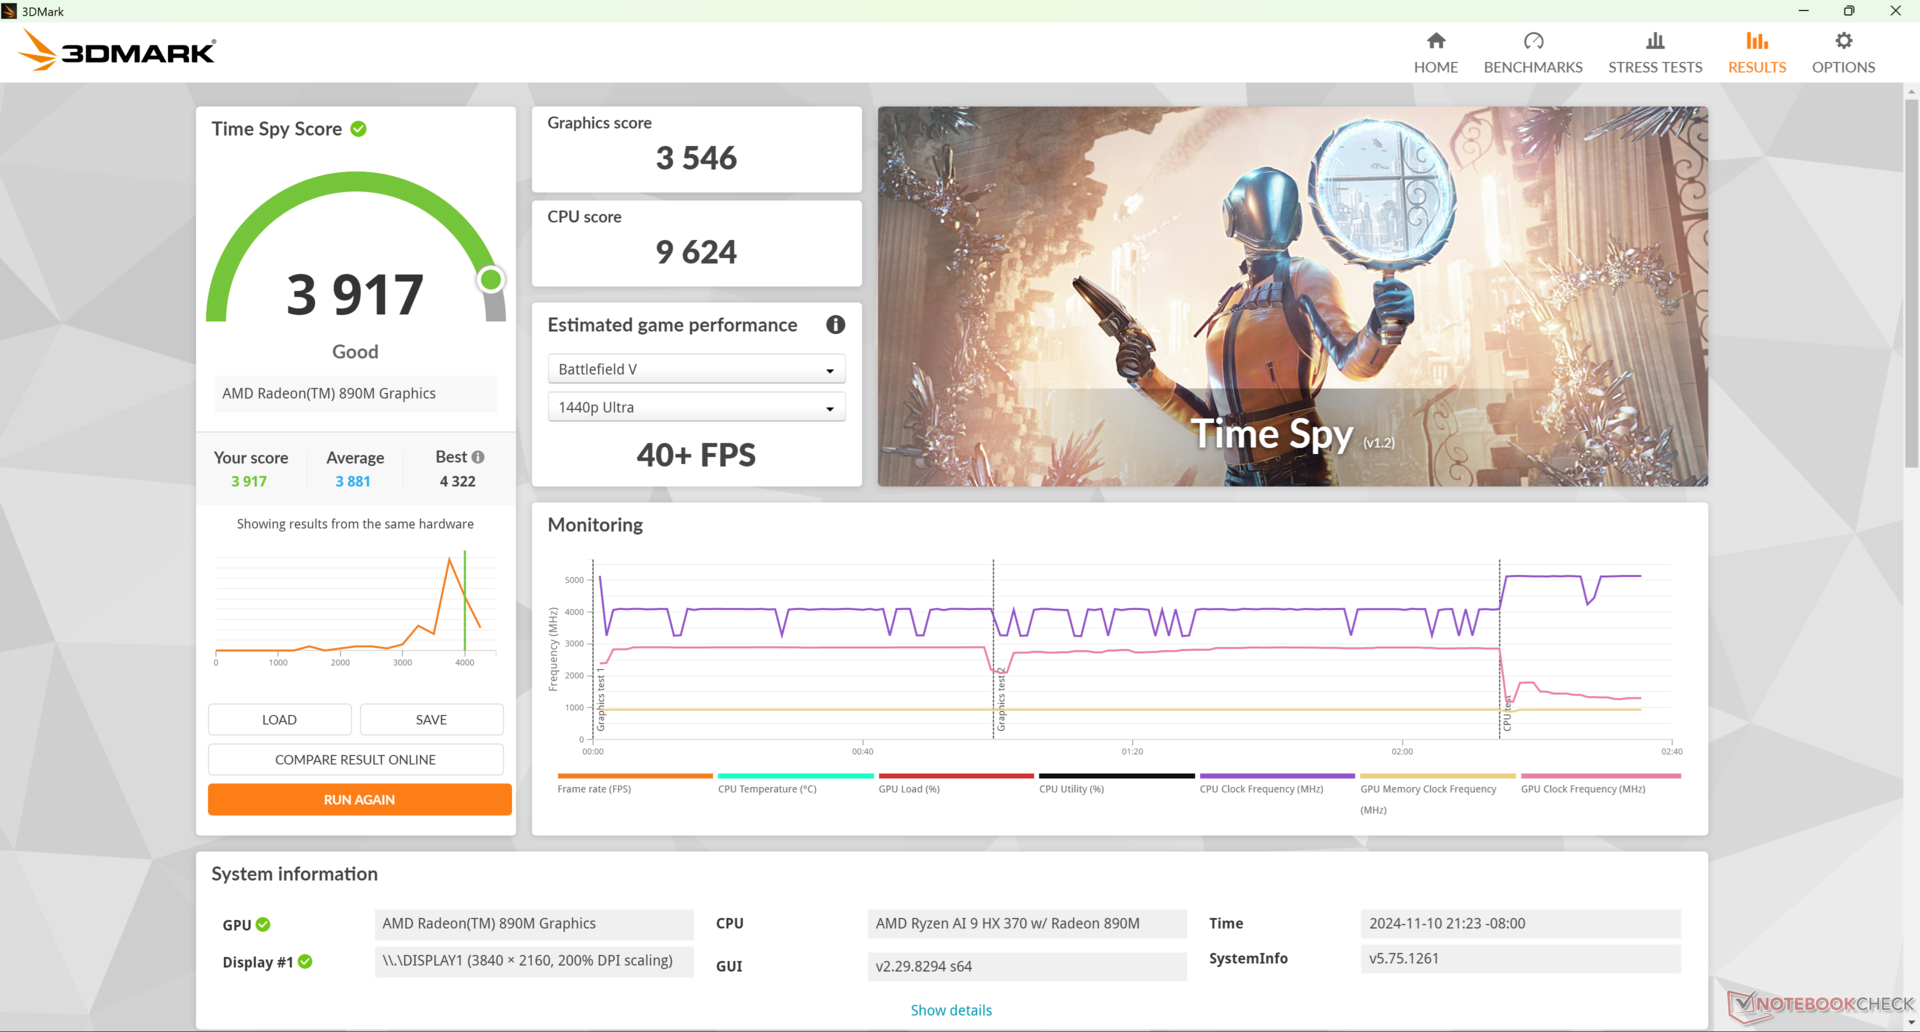
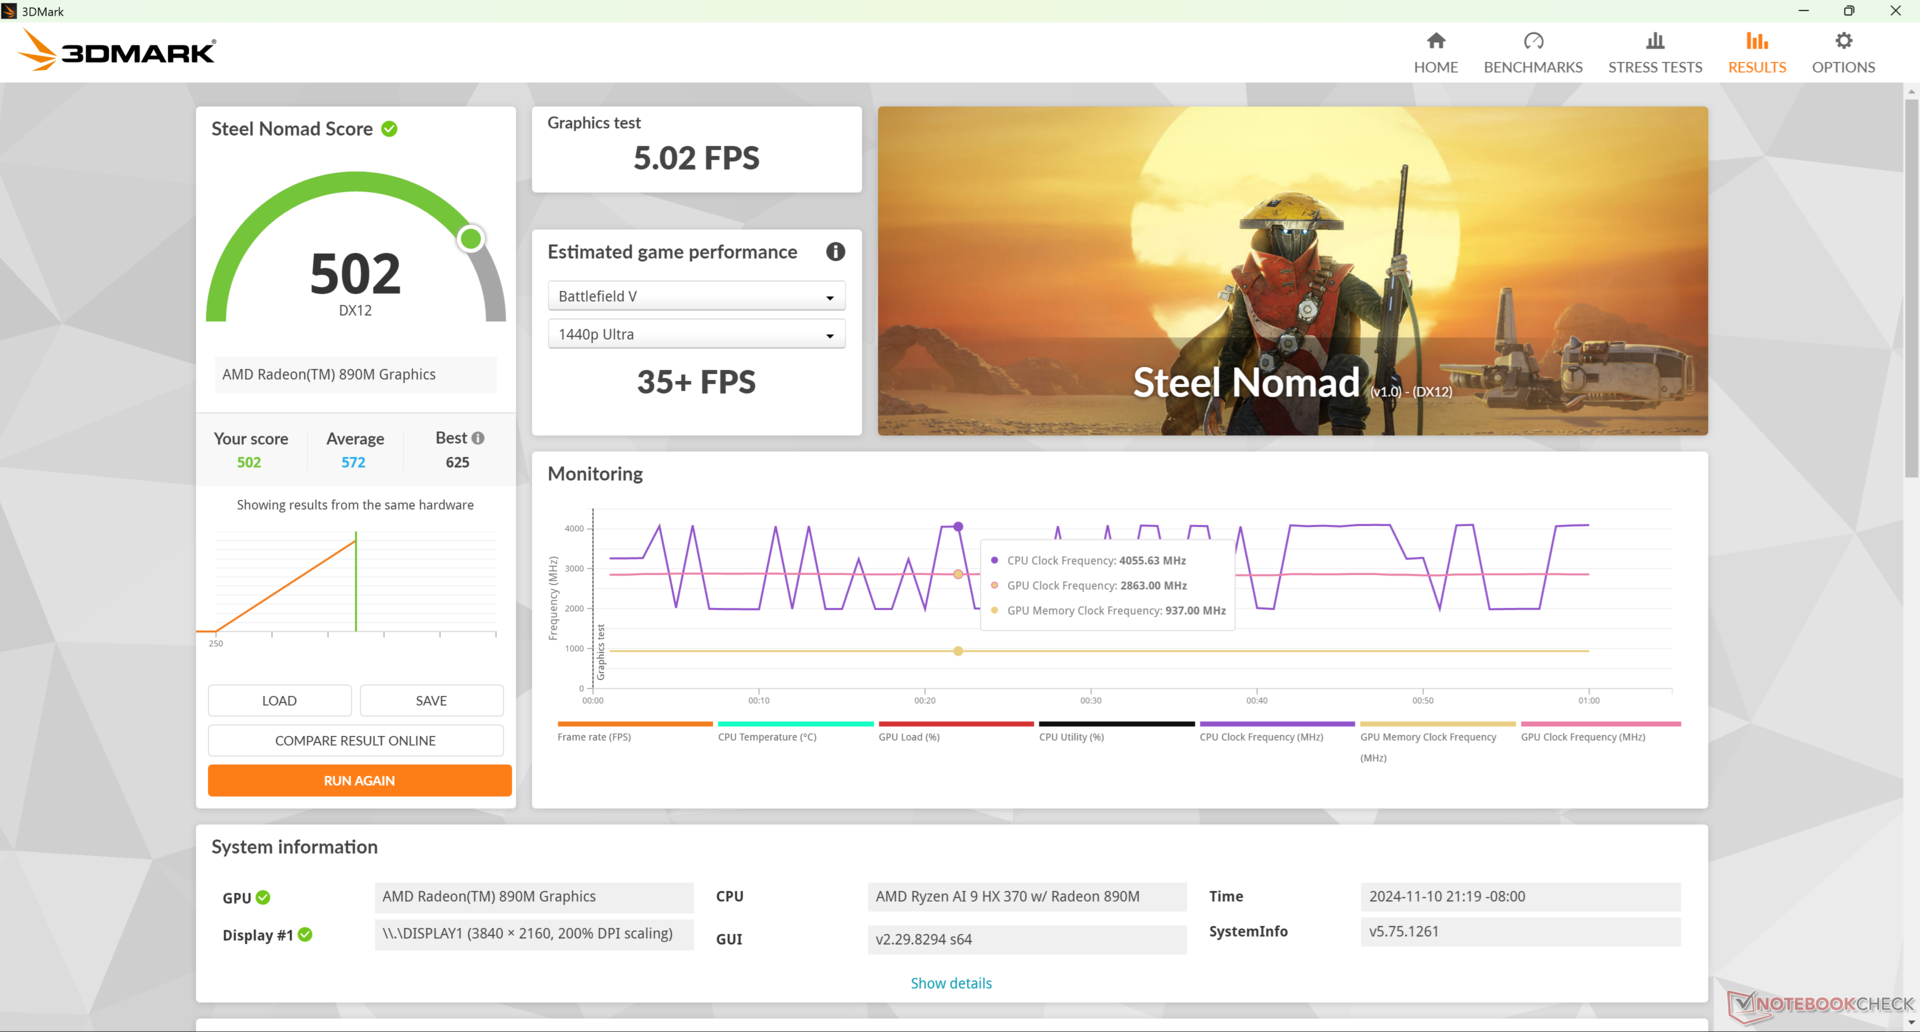
Les performances graphiques sont parmi les plus rapides de tous les mini-PC à carte graphique intégrée. Notre Radeon 890M surpasse la machine concurrente Arc 8 ou Arc 140V dans les jeux. AMD a également mis à jour les pilotes afin de corriger les problèmes de performances que nous avons rencontrés lors de l'exécution de DOTA 2 Reborn.
Malheureusement, les taux de rafraîchissement dans les jeux peuvent souffrir de chutes périodiques. Lorsque vous jouez à Cyberpunk 2077 en configuration 1080p Ultra, par exemple, le taux de rafraîchissement passe parfois de 25 à 22 au lieu de rester constant à 25.
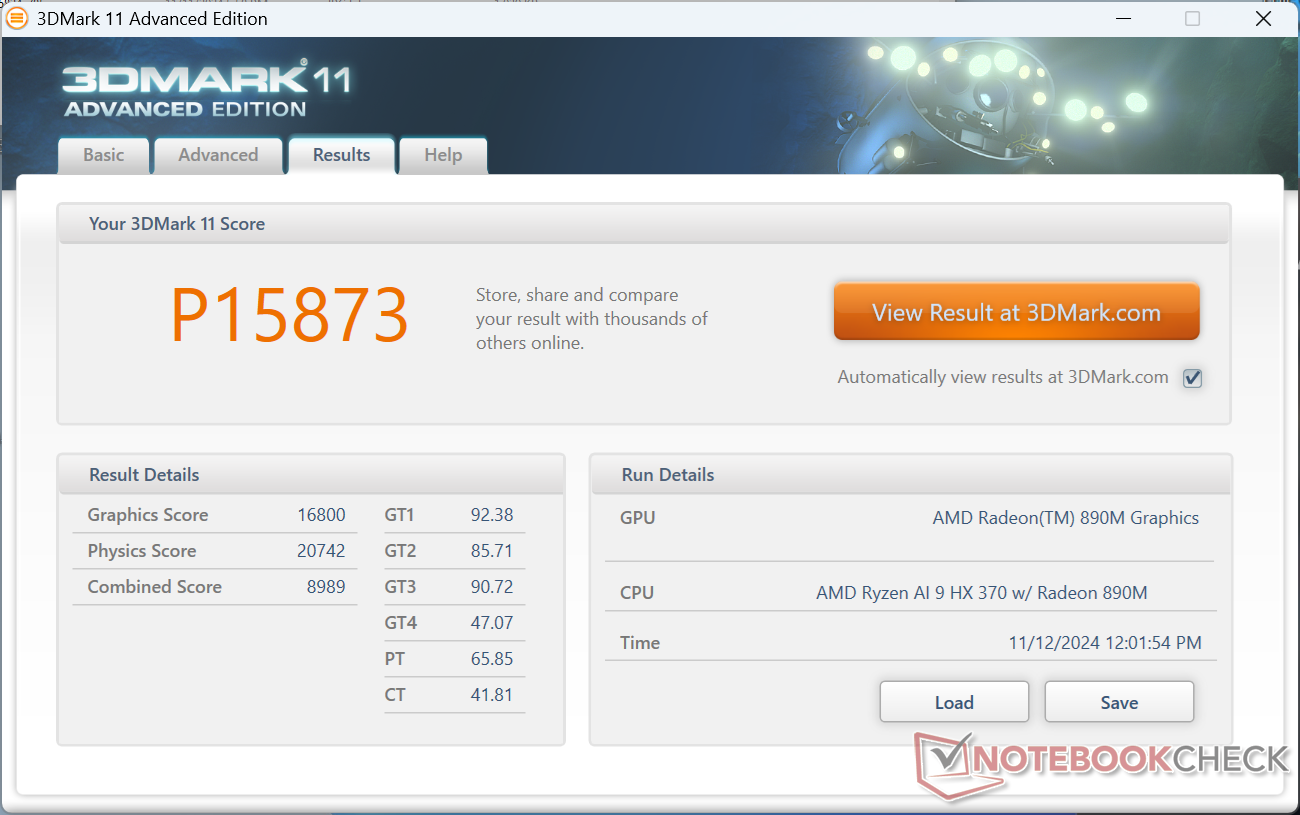

| 3DMark 11 Performance | 15873 points | |
| 3DMark Cloud Gate Standard Score | 39590 points | |
| 3DMark Fire Strike Score | 9188 points | |
| 3DMark Time Spy Score | 3917 points | |
| 3DMark Steel Nomad Score | 502 points | |
Aide | ||
| Blender | |
| v3.3 Classroom OPTIX/RTX | |
| Lenovo ThinkStation P3 Tiny-30H0006AGE | |
| v3.3 Classroom CUDA | |
| Lenovo ThinkStation P3 Tiny-30H0006AGE | |
| v3.3 Classroom CPU | |
| Beelink SEi11 Pro | |
| MSI Cubi NUC 1M | |
| HP Pro Mini 400 G9-937U0EA | |
| GMK NucBox M6 | |
| Geekom XT13 Pro | |
| Khadas Mind 2 | |
| GMK NucBox K9 | |
| GMK NucBox K6 | |
| Geekom AX8 Pro | |
| Asus NUC 14 Pro+ | |
| BOSGAME M1 | |
| Beelink SER8 | |
| Minisforum MS-A1 | |
| Moyenne AMD Radeon 890M (211 - 475, n=26) | |
| Lenovo ThinkStation P3 Tiny-30H0006AGE | |
| Beelink SER9 | |
| v3.3 Classroom oneAPI/Intel | |
| GMK NucBox K9 | |
| Khadas Mind 2 | |
| Asus NUC 14 Pro+ | |
* ... Moindre est la valeur, meilleures sont les performances
| Performance rating - Percent | |
| Beelink SER9 -1! | |
| Beelink SER8 -1! | |
| Asus NUC 14 Pro -1! | |
| GMK NucBox K9 | |
| Beelink SEi11 Pro -3! | |
| MSI Cubi NUC 1M -2! | |
| Cyberpunk 2077 - 1920x1080 Ultra Preset (FSR off) | |
| Beelink SER9 | |
| Beelink SER8 | |
| Asus NUC 14 Pro | |
| GMK NucBox K9 | |
| MSI Cubi NUC 1M | |
| Baldur's Gate 3 - 1920x1080 Ultra Preset AA:T | |
| Beelink SER8 | |
| GMK NucBox K9 | |
| Asus NUC 14 Pro | |
| GTA V - 1920x1080 Highest AA:4xMSAA + FX AF:16x | |
| Beelink SER9 | |
| Asus NUC 14 Pro | |
| GMK NucBox K9 | |
| MSI Cubi NUC 1M | |
| Final Fantasy XV Benchmark - 1920x1080 High Quality | |
| Beelink SER9 | |
| Beelink SER8 | |
| Asus NUC 14 Pro | |
| GMK NucBox K9 | |
| MSI Cubi NUC 1M | |
| Beelink SEi11 Pro | |
| Strange Brigade - 1920x1080 ultra AA:ultra AF:16 | |
| Beelink SER9 | |
| Beelink SER8 | |
| GMK NucBox K9 | |
| MSI Cubi NUC 1M | |
| Beelink SEi11 Pro | |
| Dota 2 Reborn - 1920x1080 ultra (3/3) best looking | |
| Beelink SER8 | |
| Beelink SER9 | |
| GMK NucBox K9 | |
| Asus NUC 14 Pro | |
| MSI Cubi NUC 1M | |
| Beelink SEi11 Pro | |
| X-Plane 11.11 - 1920x1080 high (fps_test=3) | |
| Beelink SER9 | |
| Beelink SER8 | |
| Beelink SEi11 Pro | |
| GMK NucBox K9 | |
| Asus NUC 14 Pro | |
| F1 22 | |
| 1280x720 Ultra Low Preset AA:T AF:16x | |
| Beelink SER9 | |
| BOSGAME M1 | |
| Moyenne AMD Radeon 890M (160.9 - 186.8, n=6) | |
| GMK NucBox K6 | |
| Beelink SER8 | |
| GMK NucBox K9 | |
| GMK NucBox M6 | |
| MSI Cubi NUC 1M | |
| 1920x1080 Low Preset AA:T AF:16x | |
| Beelink SER9 | |
| BOSGAME M1 | |
| Moyenne AMD Radeon 890M (81 - 111.2, n=9) | |
| GMK NucBox K6 | |
| Beelink SER8 | |
| GMK NucBox K9 | |
| GMK NucBox M6 | |
| MSI Cubi NUC 1M | |
| 1920x1080 Medium Preset AA:T AF:16x | |
| Beelink SER9 | |
| Moyenne AMD Radeon 890M (76.8 - 102.9, n=9) | |
| BOSGAME M1 | |
| GMK NucBox K6 | |
| Beelink SER8 | |
| GMK NucBox K9 | |
| GMK NucBox M6 | |
| MSI Cubi NUC 1M | |
| 1920x1080 High Preset AA:T AF:16x | |
| Beelink SER9 | |
| Moyenne AMD Radeon 890M (64.2 - 78.1, n=9) | |
| BOSGAME M1 | |
| GMK NucBox K6 | |
| Beelink SER8 | |
| GMK NucBox K9 | |
| GMK NucBox M6 | |
| MSI Cubi NUC 1M | |
| 1920x1080 Ultra High Preset AA:T AF:16x | |
| MSI Cubi NUC 1M | |
| Beelink SER9 | |
| Moyenne AMD Radeon 890M (16.7 - 22, n=9) | |
| BOSGAME M1 | |
| GMK NucBox K6 | |
| Beelink SER8 | |
| GMK NucBox M6 | |
Cyberpunk 2077 ultra FPS Chart
| Bas | Moyen | Élevé | Ultra | |
|---|---|---|---|---|
| GTA V (2015) | 166.1 | 158.9 | 79 | 31.5 |
| Dota 2 Reborn (2015) | 175.6 | 133.6 | 100 | 89.8 |
| Final Fantasy XV Benchmark (2018) | 94.6 | 47.5 | 33.3 | |
| X-Plane 11.11 (2018) | 85.1 | 67.6 | 51.6 | |
| Far Cry 5 (2018) | 101 | 60 | 55 | 52 |
| Strange Brigade (2018) | 199.8 | 82 | 69.8 | 59.7 |
| Tiny Tina's Wonderlands (2022) | 88.3 | 62.3 | 41.8 | 32.5 |
| F1 22 (2022) | 110.1 | 100.8 | 76.8 | 21.2 |
| Baldur's Gate 3 (2023) | 35 | 29.1 | 28.2 | |
| Cyberpunk 2077 (2023) | 49.6 | 40.5 | 28.7 | 25.5 |
Émissions
Bruit du système
Les caractéristiques et le plafond du bruit du ventilateur sont très proches de ce que nous avons enregistré sur le SER8 de l'année dernière, ce qui signifie que les performances supplémentaires fournies par le nouveau processeur Zen 5 ne se traduisent heureusement pas par un mini PC plus bruyant.
Degré de la nuisance sonore
| Au repos |
| 26.6 / 26.8 / 26.8 dB(A) |
| Fortement sollicité |
| 33.4 / 33.8 dB(A) |
 | ||
30 dB silencieux 40 dB(A) audible 50 dB(A) bruyant |
||
min: | ||
| Beelink SER9 Radeon 890M, Ryzen AI 9 HX 370, Crucial P3 Plus CT1000P3PSSD8 | Beelink SER8 Radeon 780M, R7 8845HS, Crucial P3 Plus CT1000P3PSSD8 | Beelink SEi11 Pro Iris Xe G7 96EUs, i5-11320H, Kingston NV1 SNVS/500GCN | MSI Cubi NUC 1M Iris Xe G7 96EUs, Core 7 150U, WD PC SN560 SDDPNQE-1T00 | GMK NucBox K9 Arc 7-Core, Ultra 5 125H, MasonSemi 1TB MC7000 | Asus NUC 14 Pro+ Arc 8-Core, Ultra 9 185H, Samsung PM9A1a MZVL21T0HDLU | |
|---|---|---|---|---|---|---|
| Noise | -5% | 2% | -11% | -23% | -19% | |
| arrêt / environnement * (dB) | 23.2 | 23.6 -2% | 22.8 2% | 23.5 -1% | 23 1% | 24.6 -6% |
| Idle Minimum * (dB) | 26.6 | 28.8 -8% | 24.7 7% | 29.9 -12% | 29.8 -12% | 24.7 7% |
| Idle Average * (dB) | 26.8 | 28.8 -7% | 24.7 8% | 29.9 -12% | 35.7 -33% | 29.6 -10% |
| Idle Maximum * (dB) | 26.8 | 30.5 -14% | 25.3 6% | 32 -19% | 35.7 -33% | 29.8 -11% |
| Load Average * (dB) | 33.4 | 34.6 -4% | 33.2 1% | 33.5 -0% | 41.9 -25% | 45.7 -37% |
| Cyberpunk 2077 ultra * (dB) | 34.6 | 34.1 1% | 39.1 -13% | 43.8 -27% | 47.7 -38% | |
| Load Maximum * (dB) | 33.8 | 34.5 -2% | 37.8 -12% | 40.5 -20% | 44 -30% | 47.4 -40% |
| Witcher 3 ultra * (dB) | 34.5 |
* ... Moindre est la valeur, meilleures sont les performances
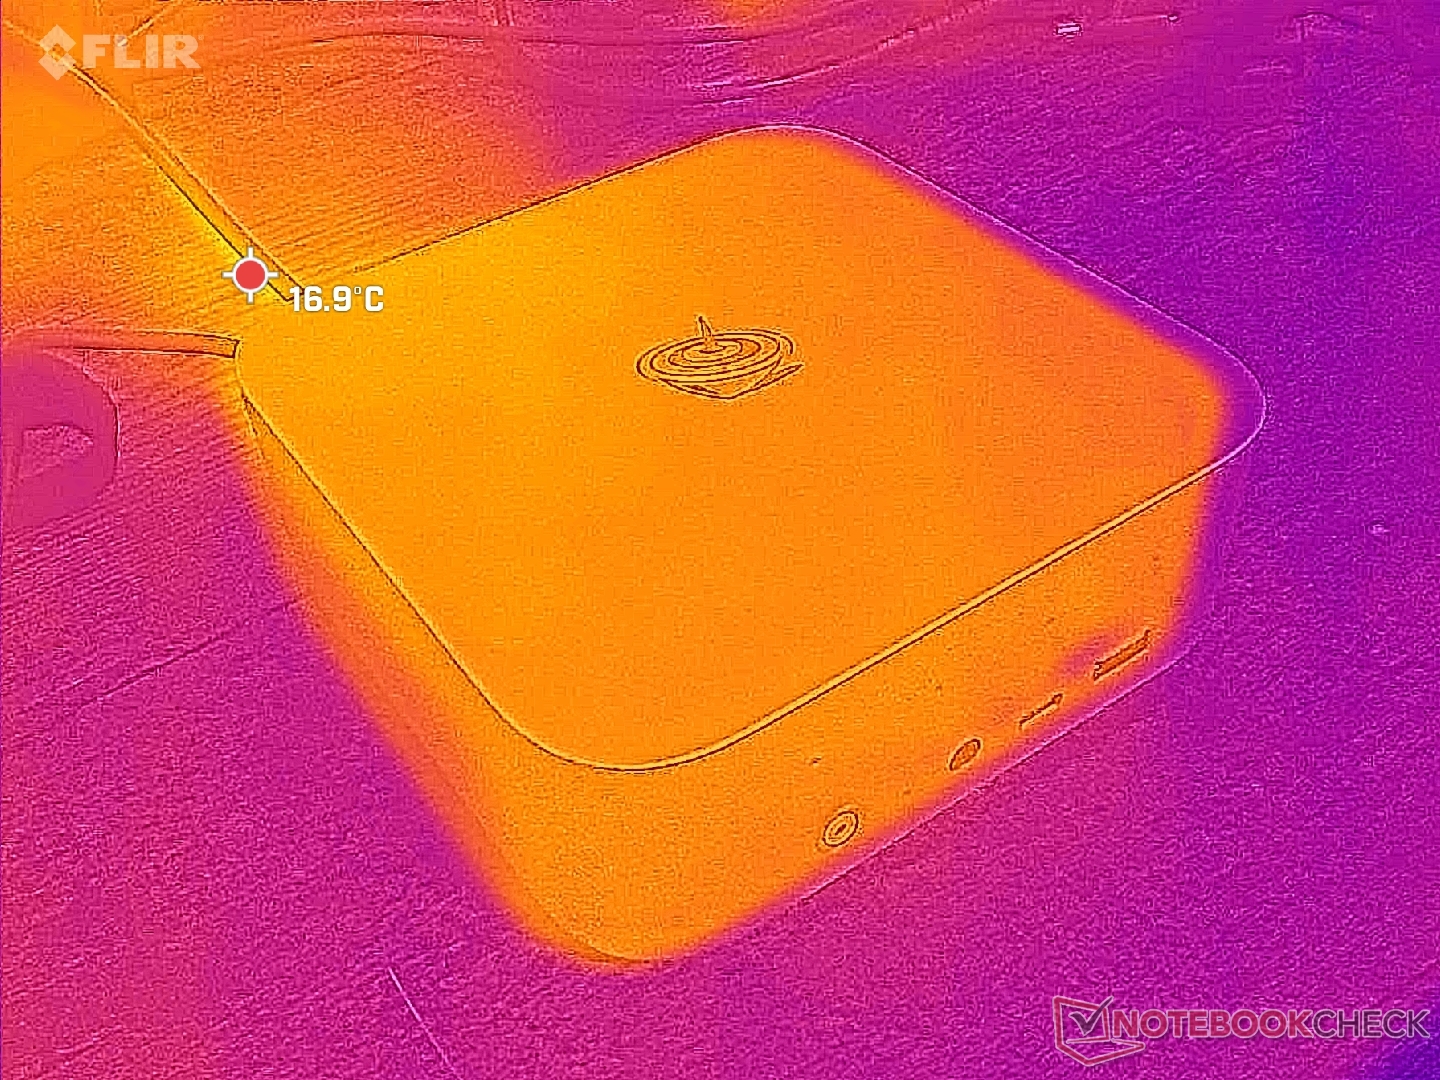
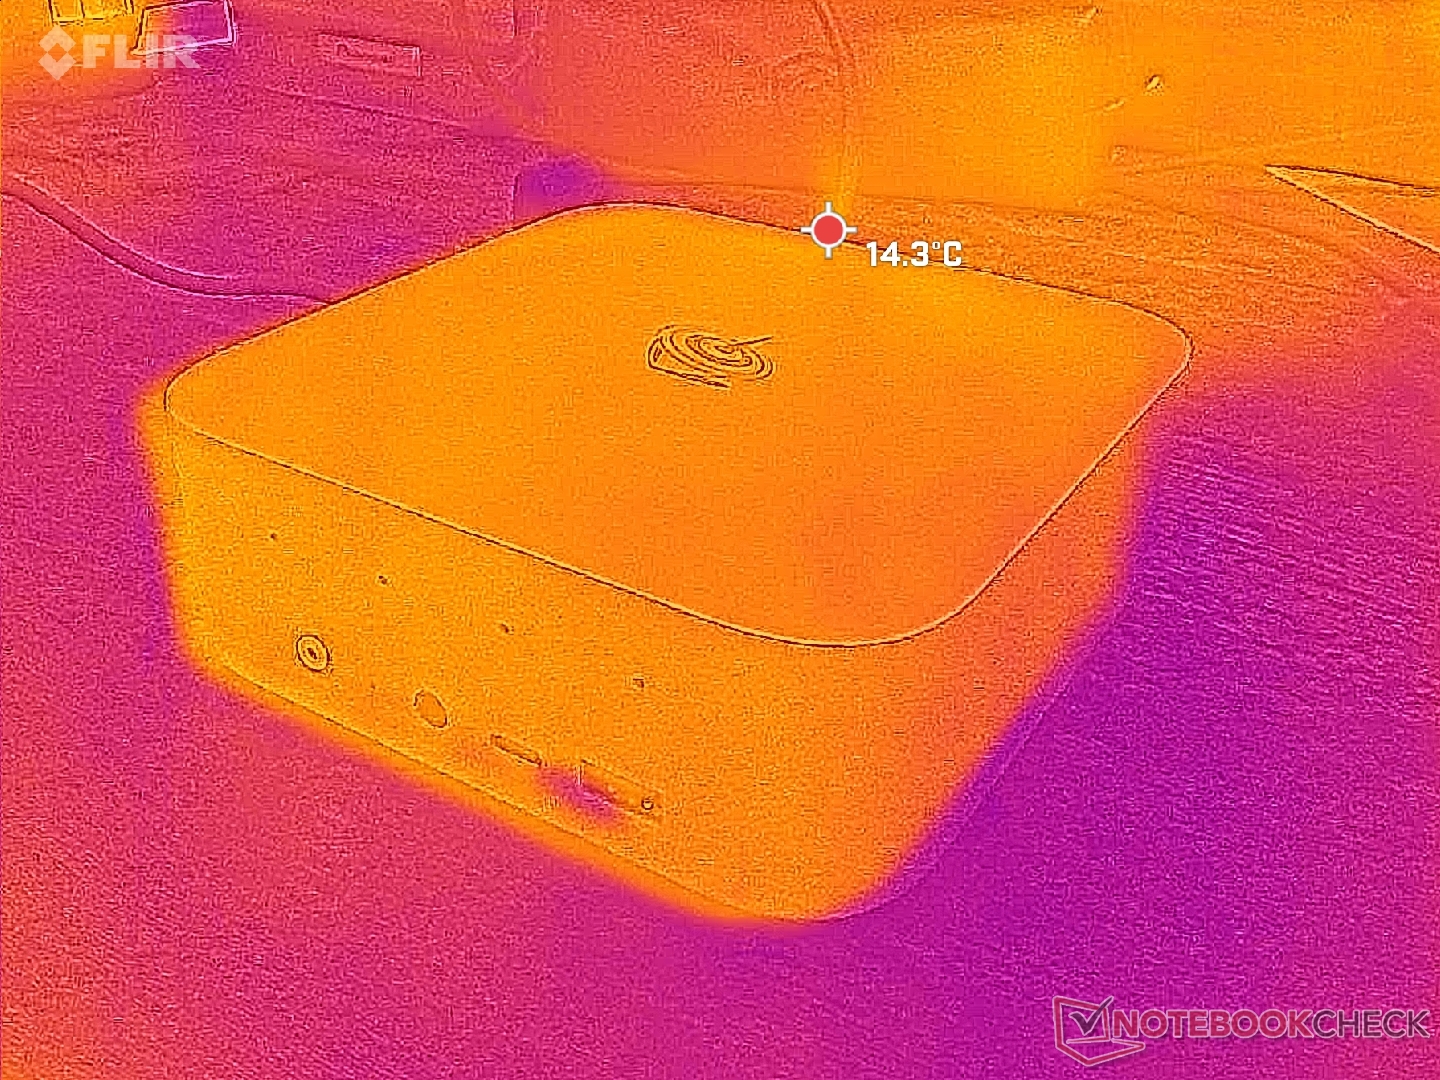
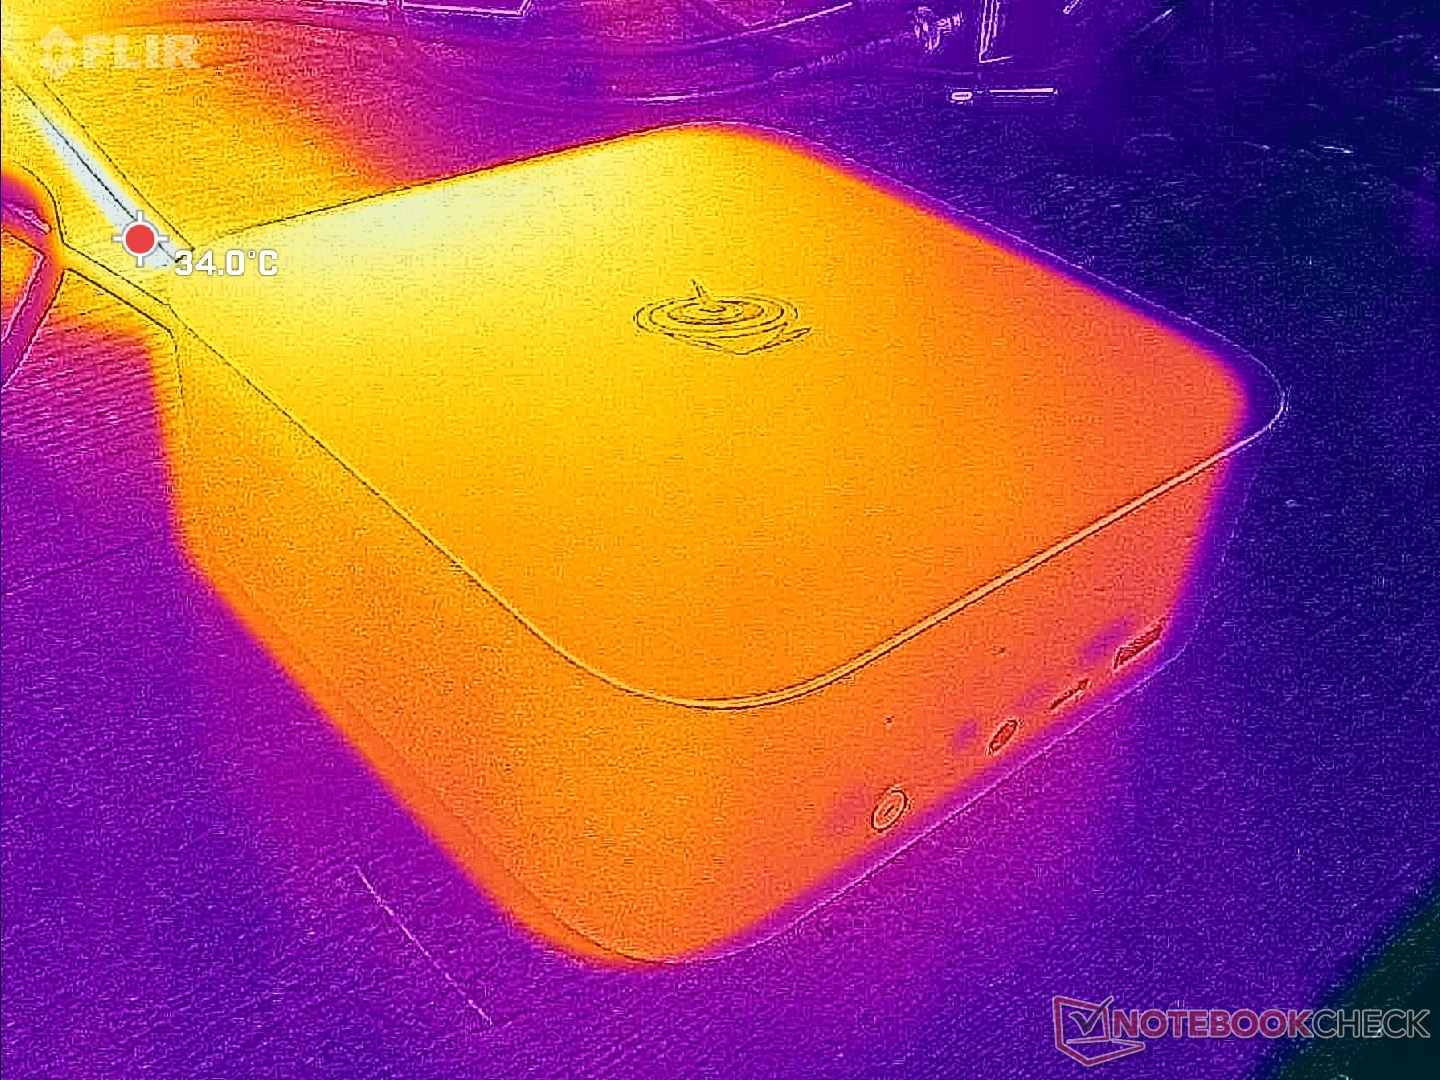
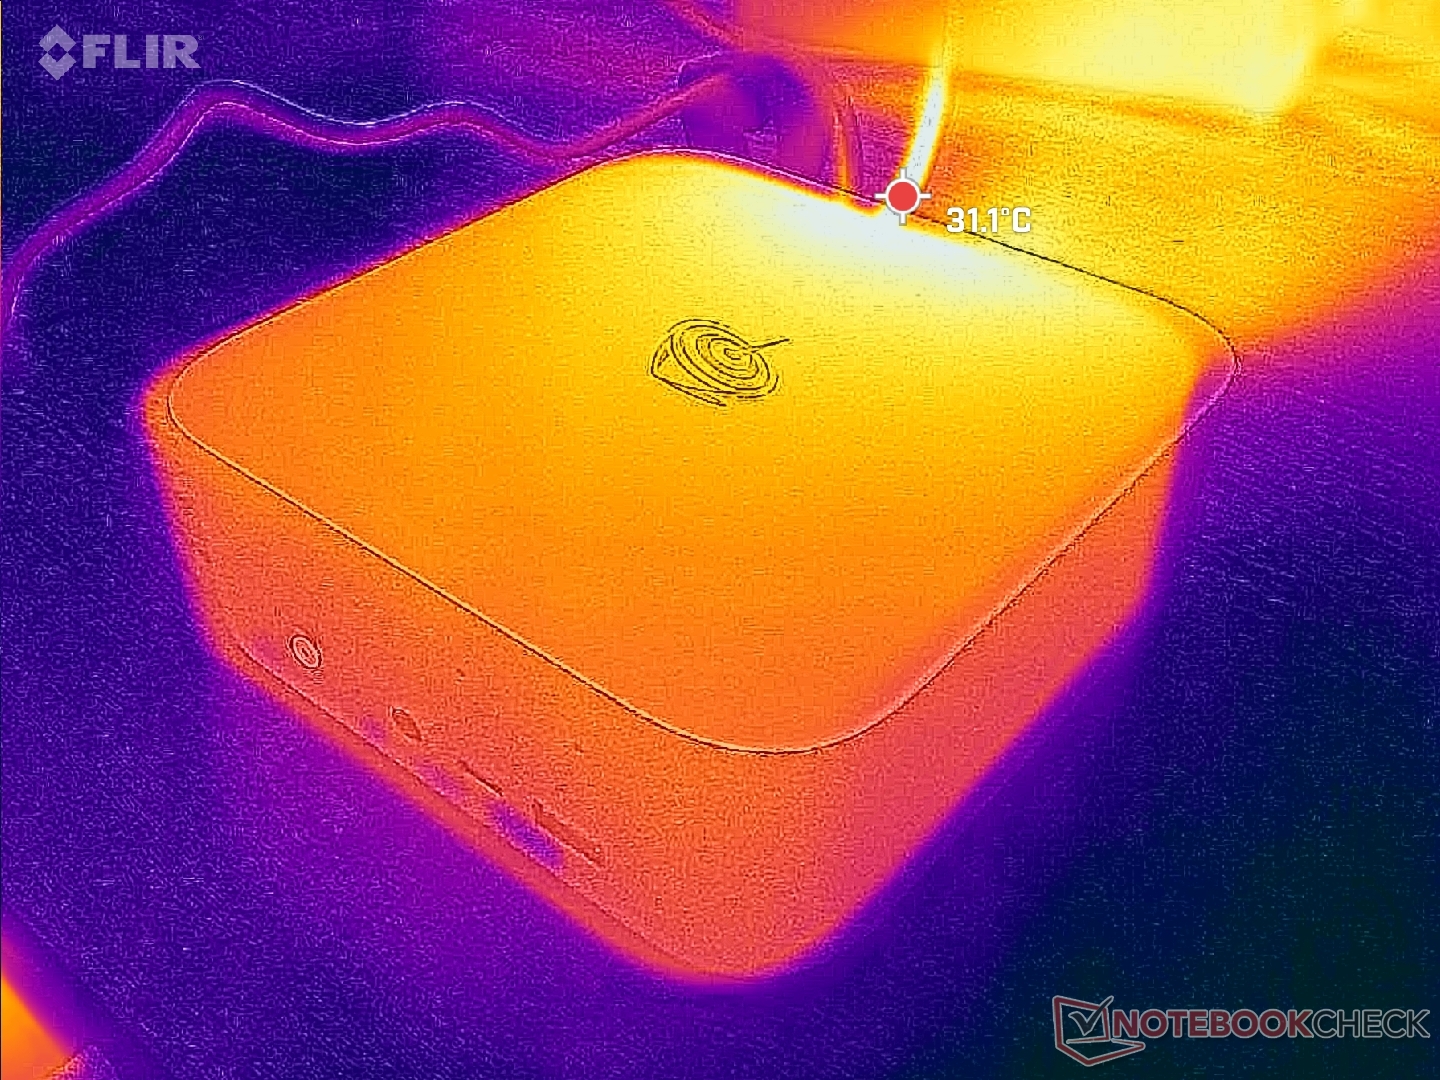
Température
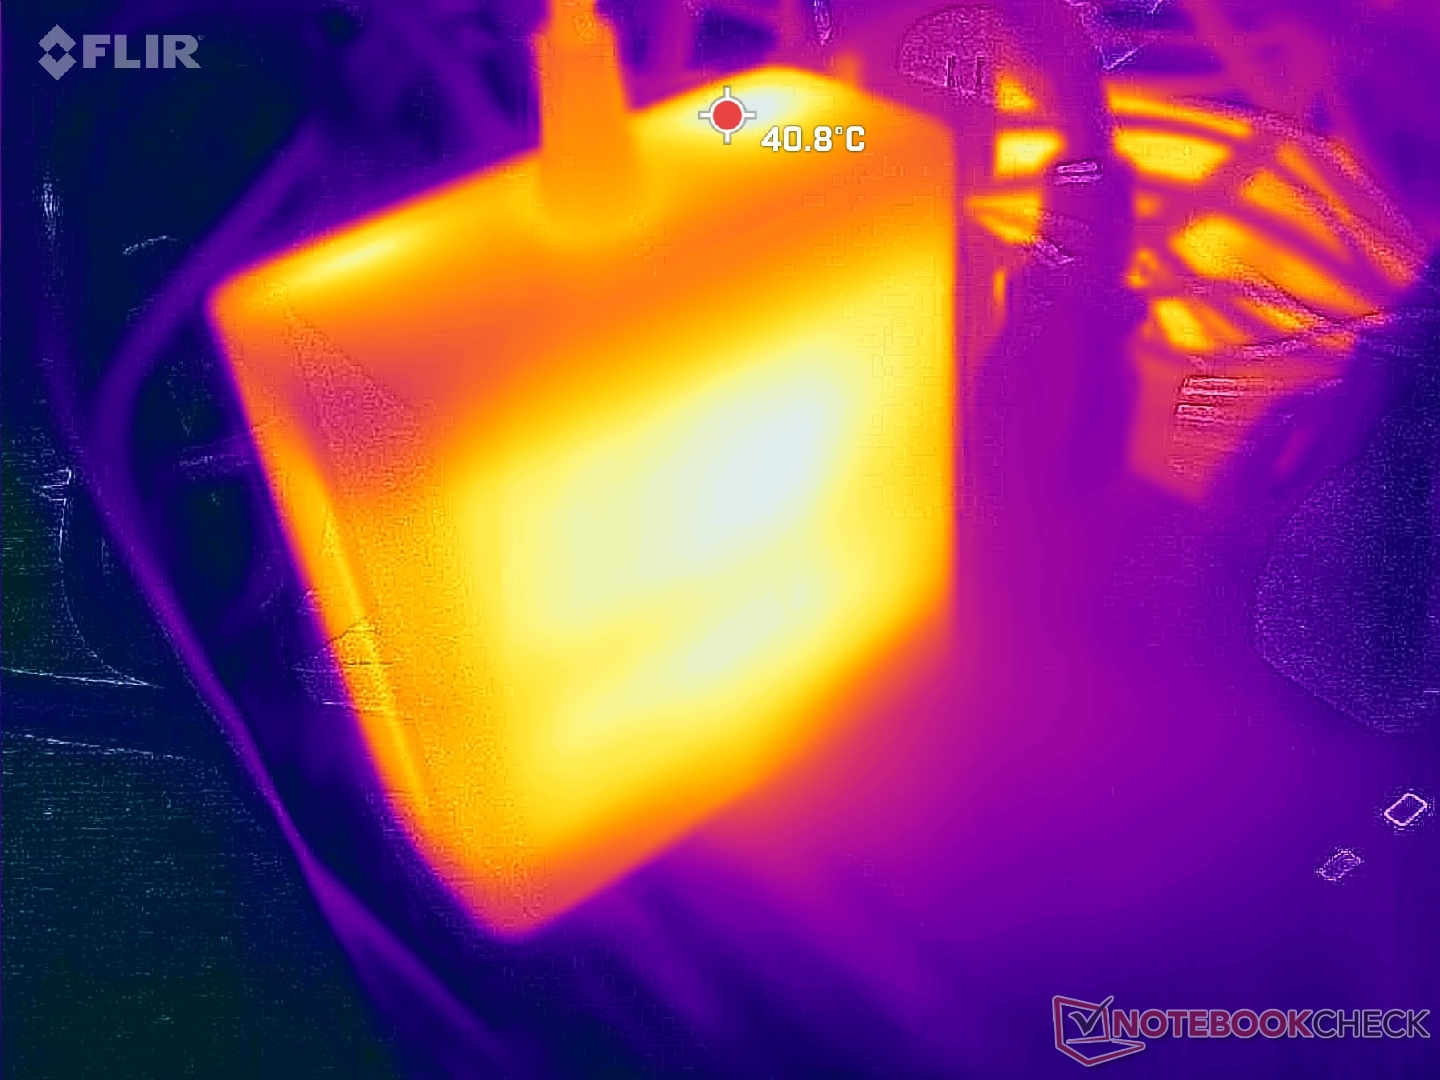
Les températures de surface ne posent pas de problème malgré l'absence de grilles d'aération sur les côtés et les bords. La partie supérieure n'atteint que ~30 C lors de l'exécution de charges exigeantes, tandis que l'adaptateur secteur peut devenir plus chaud à plus de 40 C.
Test de stress
Le processeur se stabilise à 3,3 GHz, 71 C et 54 W lors de l'exécution du stress Prime95. La température du cœur se stabilise à seulement 68 °C lors de l'exécution de Cyberpunk 2077, contre 62 °C sur la SER8 de l'année dernière.
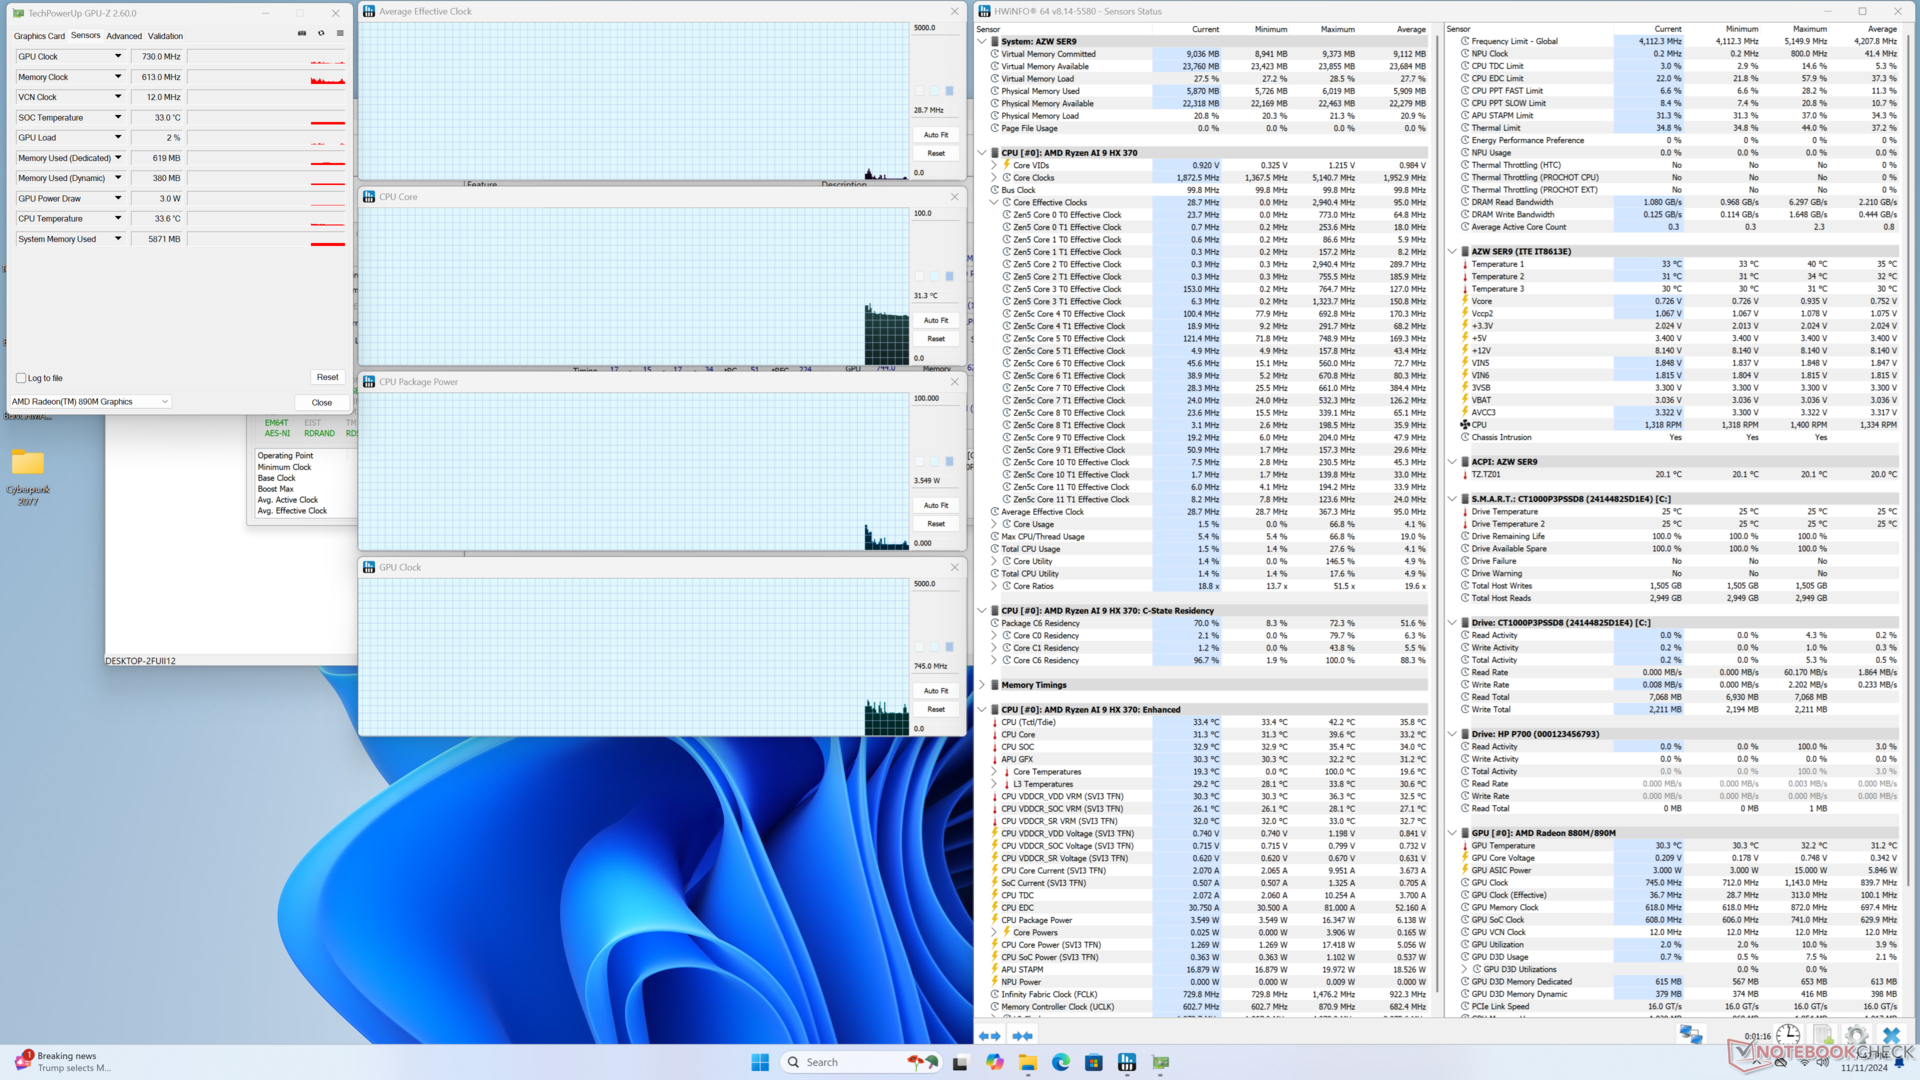
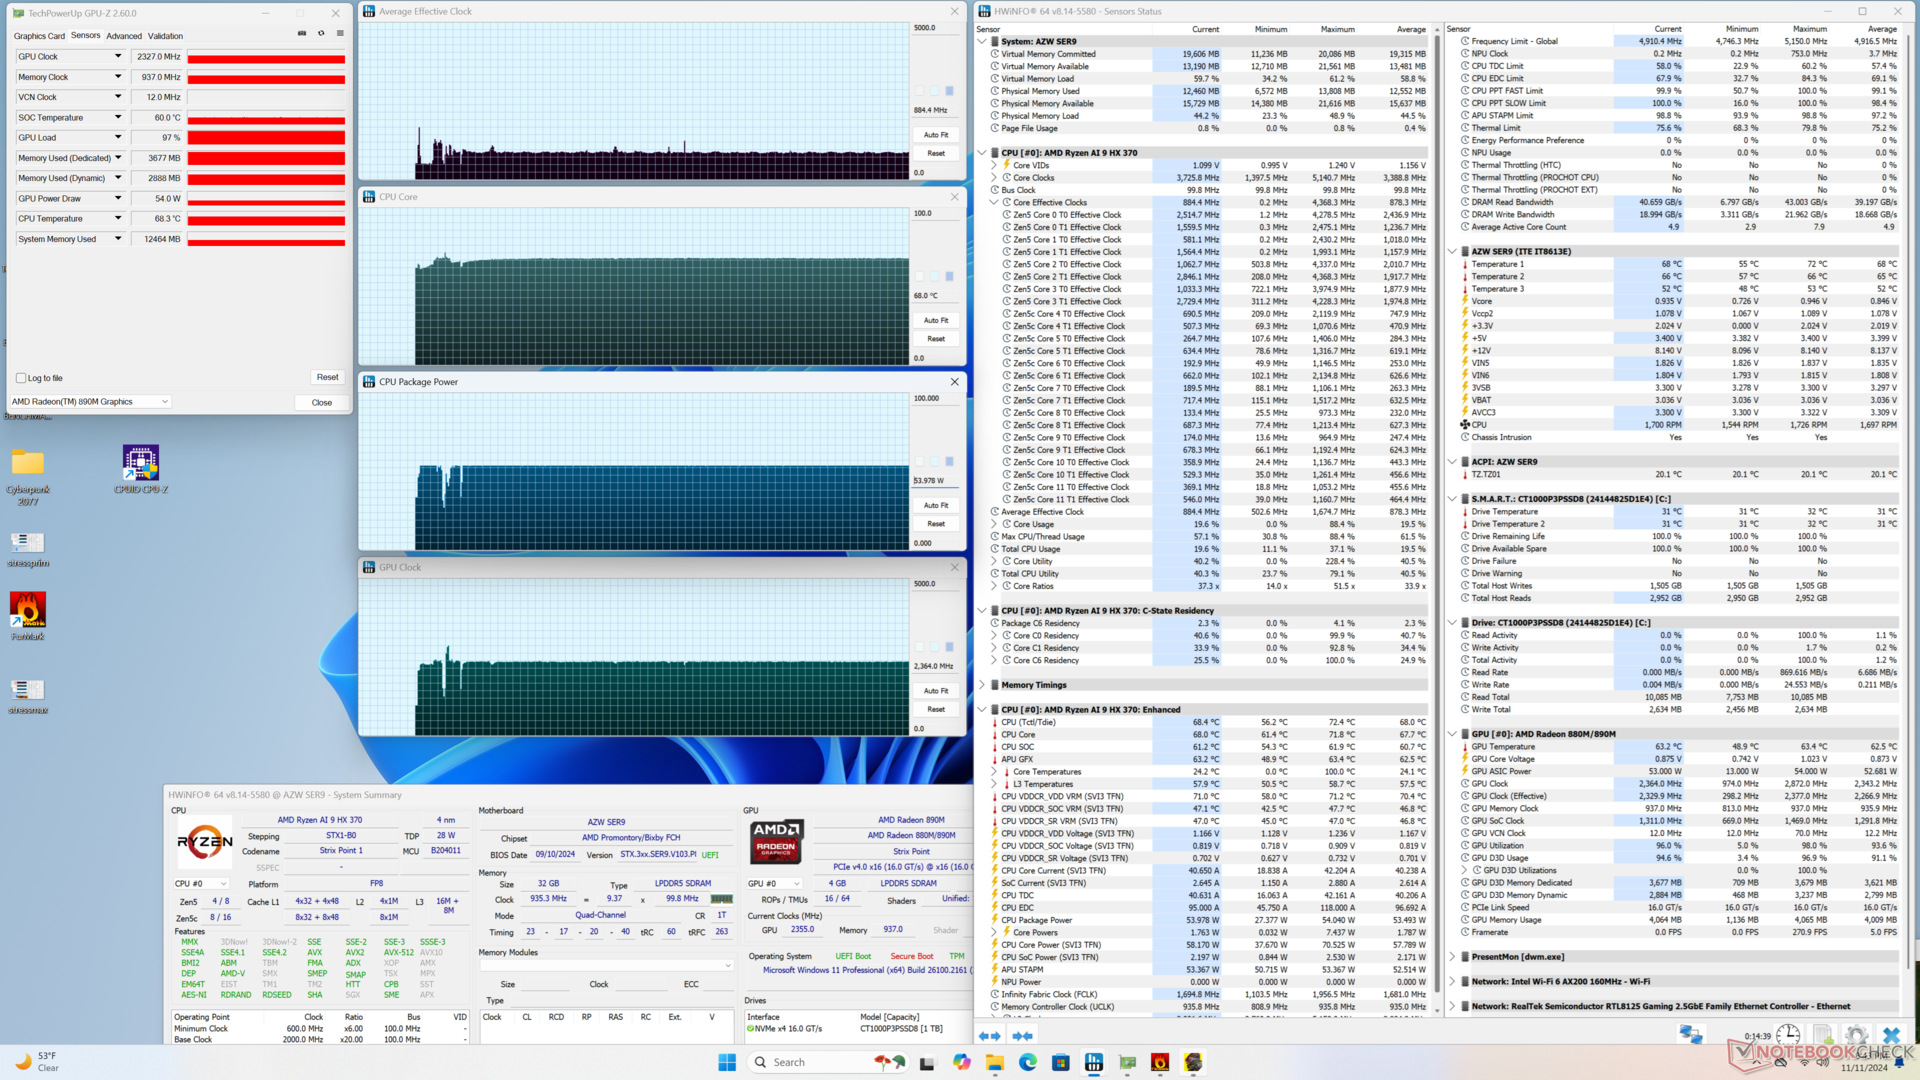
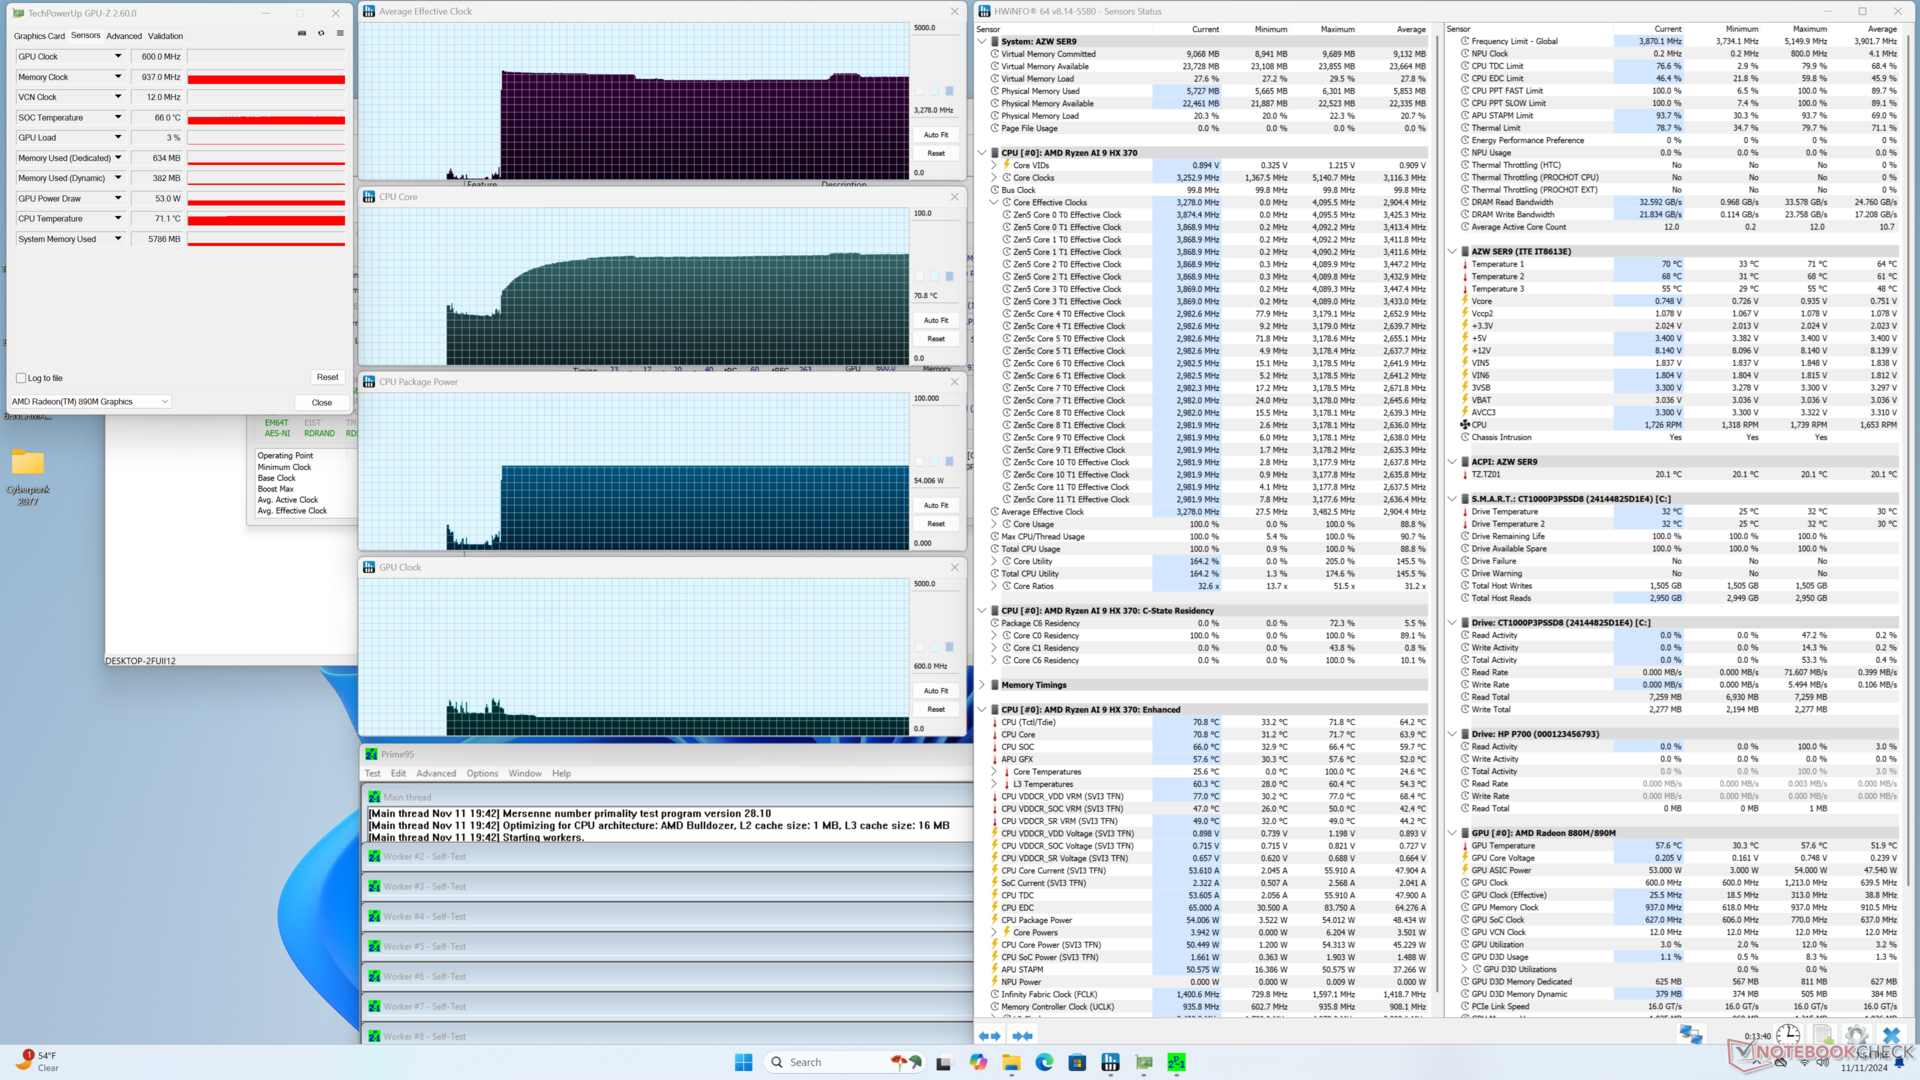
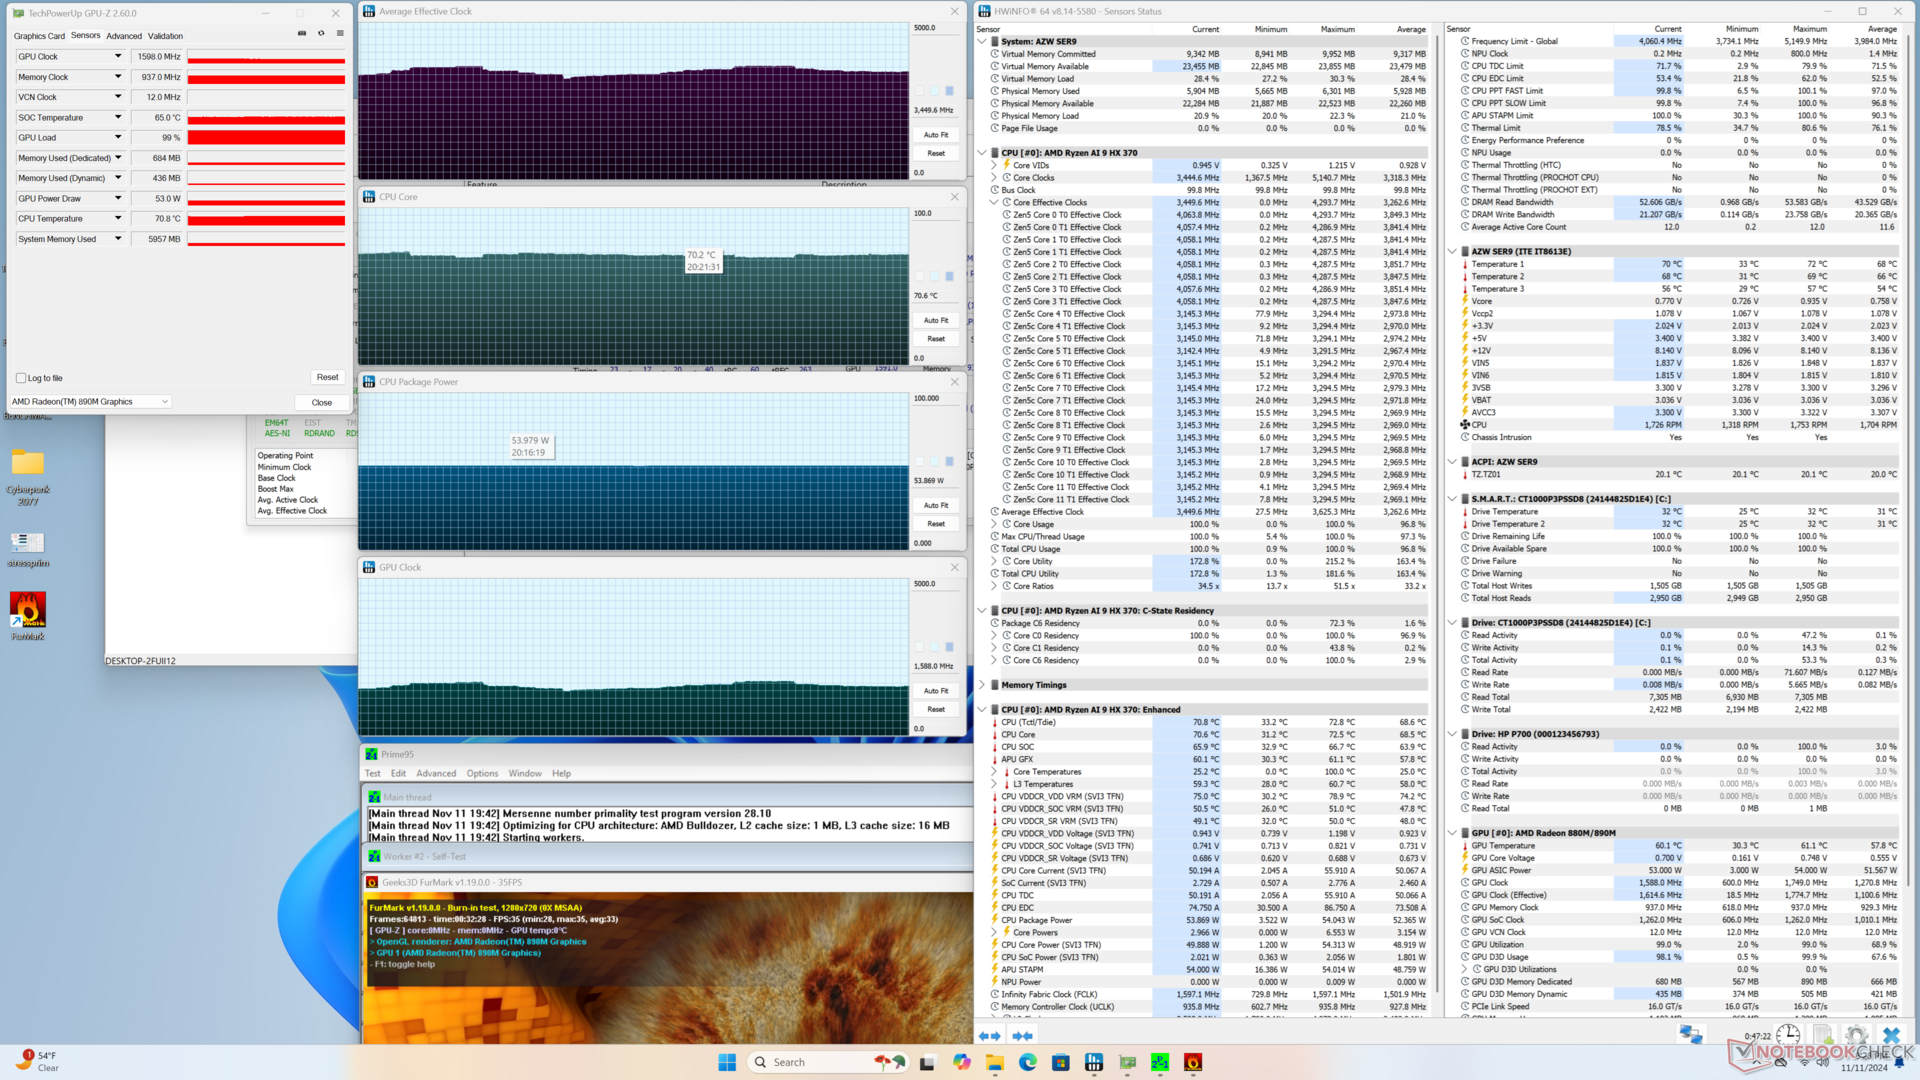
| Horloge moyenne du CPU (GHz) | Horloge du GPU (MHz) | Température moyenne du CPU (°C) | |
| Système au repos | -- | -- | 31 |
| Prime95 Stress | 3.3 | -- | 71 |
| Prime95 + FurMark Stress | 3.5 | 1598 | 71 |
| Cyberpunk 2077 Stress | 0.9 | 2327 | 68 |
Intervenants
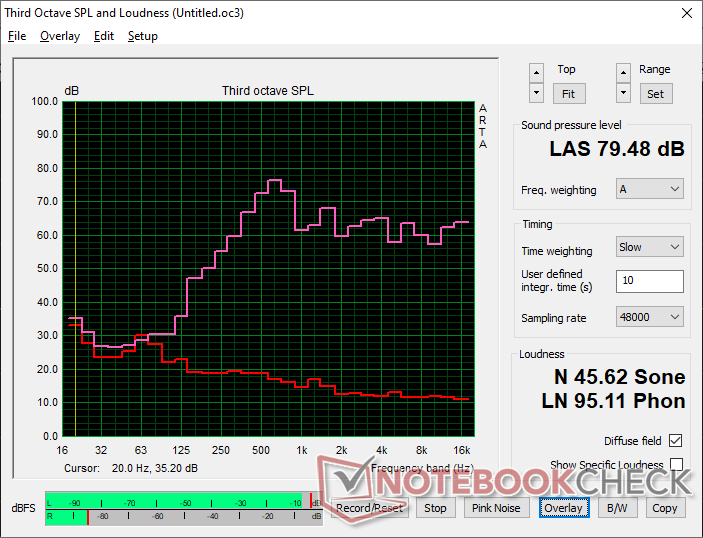
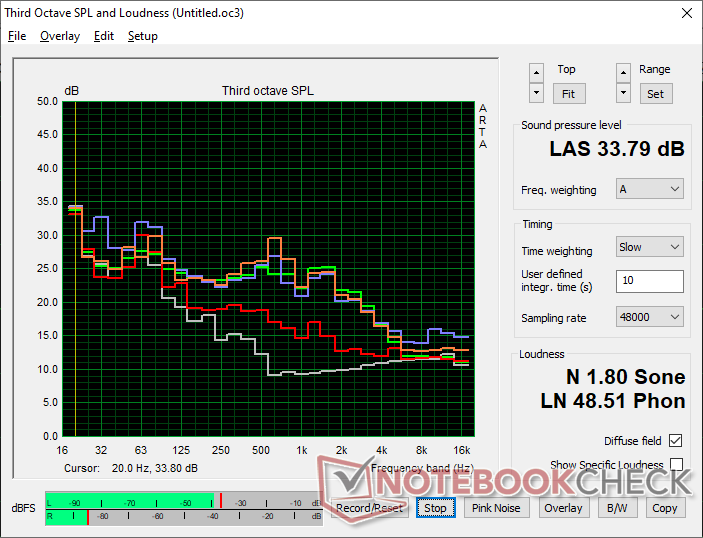
Beelink SER9 analyse audio
(±) | le niveau sonore du haut-parleur est moyen mais bon (79.5# dB)
Basses 100 - 315 Hz
(-) | presque aucune basse - en moyenne 16% plus bas que la médiane
(±) | la linéarité des basses est moyenne (10.3% delta à la fréquence précédente)
Médiums 400 - 2000 Hz
(±) | médiane supérieure - en moyenne 6.2% supérieure à la médiane
(±) | la linéarité des médiums est moyenne (12.3% delta à la fréquence précédente)
Aiguës 2 - 16 kHz
(+) | des sommets équilibrés - à seulement 2.6% de la médiane
(±) | la linéarité des aigus est moyenne (7.3% delta à la fréquence précédente)
Globalement 100 - 16 000 Hz
(±) | la linéarité du son global est moyenne (16.7% de différence avec la médiane)
Par rapport à la même classe
» 11% de tous les appareils testés de cette catégorie étaient meilleurs, 11% similaires, 79% pires
» Le meilleur avait un delta de 13%, la moyenne était de 24%, le pire était de 64%.
Par rapport à tous les appareils testés
» 29% de tous les appareils testés étaient meilleurs, 7% similaires, 64% pires
» Le meilleur avait un delta de 4%, la moyenne était de 24%, le pire était de 134%.
Apple MacBook Pro 16 2021 M1 Pro analyse audio
(+) | les haut-parleurs peuvent jouer relativement fort (84.7# dB)
Basses 100 - 315 Hz
(+) | bonne basse - seulement 3.8% loin de la médiane
(+) | les basses sont linéaires (5.2% delta à la fréquence précédente)
Médiums 400 - 2000 Hz
(+) | médiane équilibrée - seulement 1.3% de la médiane
(+) | les médiums sont linéaires (2.1% delta à la fréquence précédente)
Aiguës 2 - 16 kHz
(+) | des sommets équilibrés - à seulement 1.9% de la médiane
(+) | les aigus sont linéaires (2.7% delta à la fréquence précédente)
Globalement 100 - 16 000 Hz
(+) | le son global est linéaire (4.6% différence à la médiane)
Par rapport à la même classe
» 0% de tous les appareils testés de cette catégorie étaient meilleurs, 0% similaires, 100% pires
» Le meilleur avait un delta de 5%, la moyenne était de 17%, le pire était de 45%.
Par rapport à tous les appareils testés
» 0% de tous les appareils testés étaient meilleurs, 0% similaires, 100% pires
» Le meilleur avait un delta de 4%, la moyenne était de 24%, le pire était de 134%.
Gestion de l'énergie
Consommation électrique
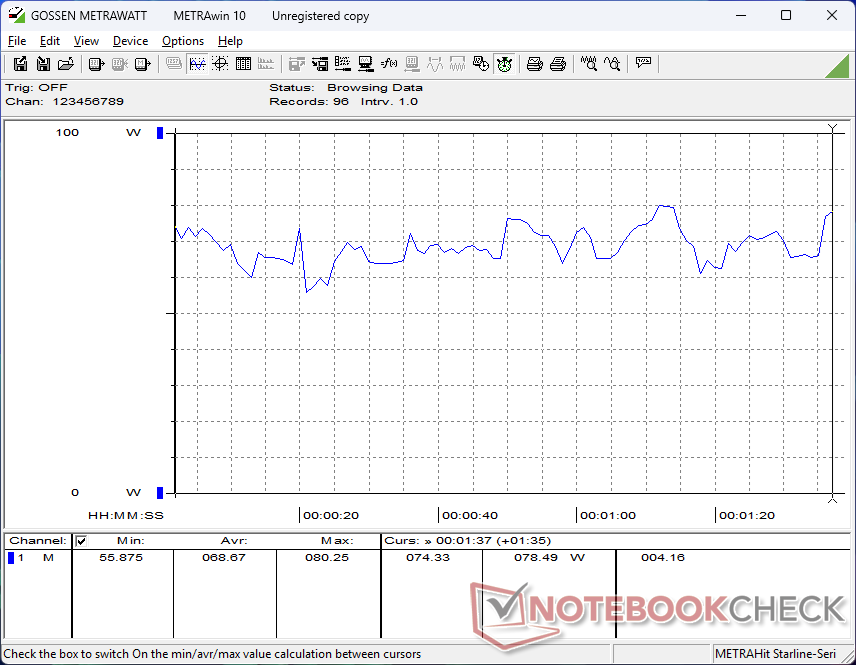
Le Beelink est nettement plus exigeant que beaucoup d'autres mini PC, ce qui est le prix à payer pour ses performances supérieures. Dans les jeux, par exemple, notre SER9 demande deux fois plus d'énergie que le MSI Cubi NUC 1M qui est plus de deux fois plus lent.
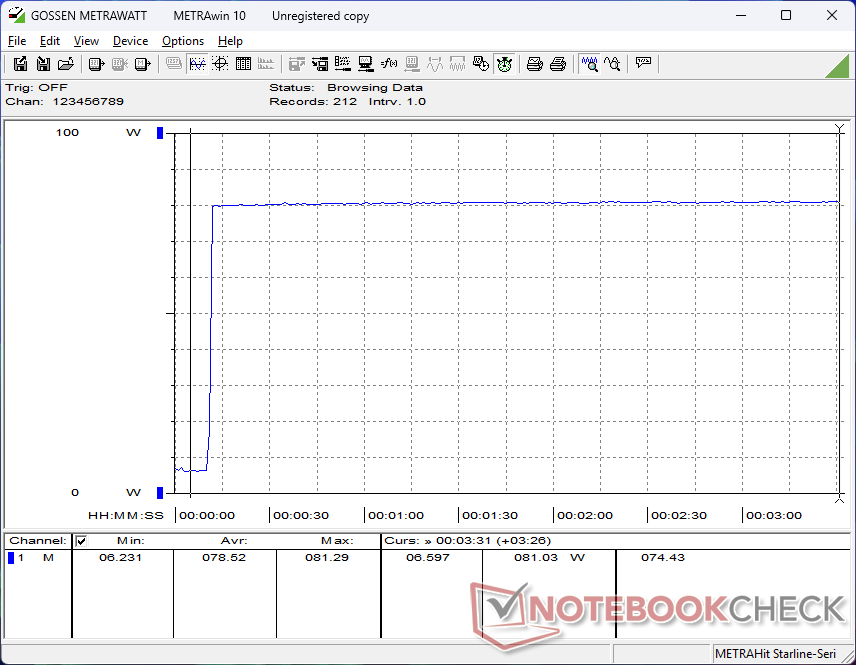
Le petit adaptateur secteur mural de 100 W (7 x 7 x 3 cm) est suffisant lorsque le système est soumis à un stress de traitement élevé et qu'il peut demander un peu plus de 80 W.

| Éteint/en veille | |
| Au repos | |
| Fortement sollicité |
|
Légende:
min: | |
| Beelink SER9 Ryzen AI 9 HX 370, Radeon 890M, Crucial P3 Plus CT1000P3PSSD8, , x, | Beelink SER8 R7 8845HS, Radeon 780M, Crucial P3 Plus CT1000P3PSSD8, , x, | Beelink SEi11 Pro i5-11320H, Iris Xe G7 96EUs, Kingston NV1 SNVS/500GCN, , x, | MSI Cubi NUC 1M Core 7 150U, Iris Xe G7 96EUs, WD PC SN560 SDDPNQE-1T00, , x, | GMK NucBox K9 Ultra 5 125H, Arc 7-Core, MasonSemi 1TB MC7000, , x, | Asus NUC 14 Pro Ultra 5 125H, Arc 7-Core, Kingston KC3000 2048G SKC3000D2048G, , x, | |
|---|---|---|---|---|---|---|
| Power Consumption | -19% | -35% | 1% | -34% | -21% | |
| Idle Minimum * (Watt) | 5.7 | 7.3 -28% | 9.8 -72% | 6.4 -12% | 10.9 -91% | 5.1 11% |
| Idle Average * (Watt) | 5.9 | 7.3 -24% | 10.3 -75% | 8.3 -41% | 11 -86% | 6.4 -8% |
| Idle Maximum * (Watt) | 6 | 8.4 -40% | 10.5 -75% | 10.4 -73% | 11.4 -90% | 14.7 -145% |
| Load Average * (Watt) | 68.7 | 68.2 1% | 54.2 21% | 38.5 44% | 52.8 23% | 55.5 19% |
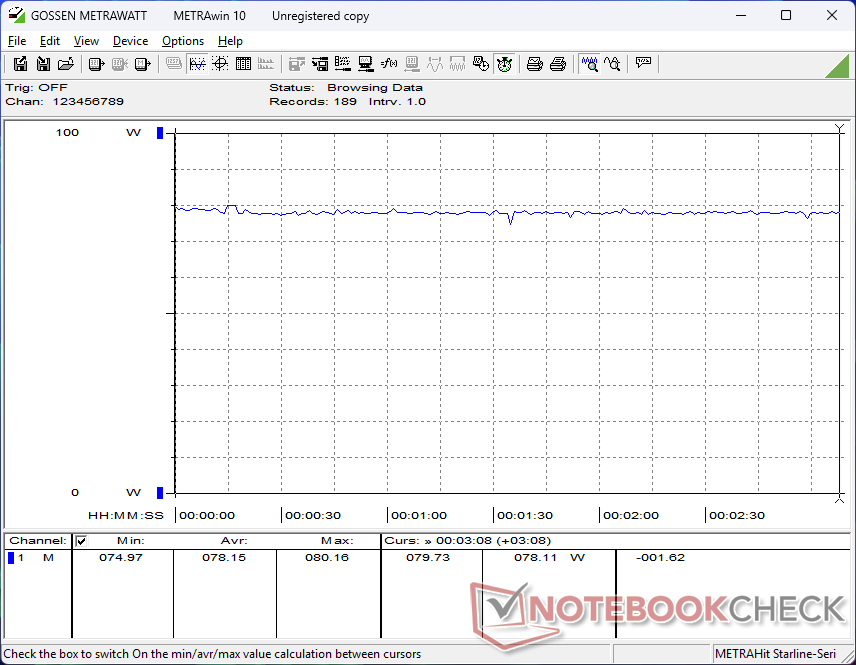
| Cyberpunk 2077 ultra external monitor * (Watt) | 78.2 | 36.1 54% | 57.1 27% | 59.1 24% | ||
| Load Maximum * (Watt) | 82 | 84.3 -3% | 59 28% | 52.5 36% | 72.2 12% | 103.3 -26% |
| Witcher 3 ultra * (Watt) | 75.1 | 53.1 |
* ... Moindre est la valeur, meilleures sont les performances
Power Consumption Cyberpunk / Stress Test
Power Consumption external Monitor
Notebookcheck Rating
Beelink SER9
- 11/14/2024 v8
Allen Ngo
 Total Sustainability Score:
 Transparency
La sélection des appareils à examiner est effectuée par notre équipe éditoriale. L'échantillon de test a été prêté à l'auteur par le fabricant ou le détaillant pour les besoins de cet examen. Le prêteur n'a pas eu d'influence sur cette évaluation et le fabricant n'a pas reçu de copie de cette évaluation avant sa publication. Il n'y avait aucune obligation de publier cet article. En tant que média indépendant, Notebookcheck n'est pas soumis à l'autorité des fabricants, des détaillants ou des éditeurs.
Voici comment Notebookcheck teste
Chaque année, Notebookcheck examine de manière indépendante des centaines d'ordinateurs portables et de smartphones en utilisant des procédures standardisées afin de garantir que tous les résultats sont comparables. Nous avons continuellement développé nos méthodes de test depuis environ 20 ans et avons établi des normes industrielles dans le processus. Dans nos laboratoires de test, des équipements de mesure de haute qualité sont utilisés par des techniciens et des rédacteurs expérimentés. Ces tests impliquent un processus de validation en plusieurs étapes. Notre système d'évaluation complexe repose sur des centaines de mesures et de points de référence bien fondés, ce qui garantit l'objectivité.
