Test du Beelink SER6 Pro : l'AMD Radeon 680M est époustouflant sur un mini PC
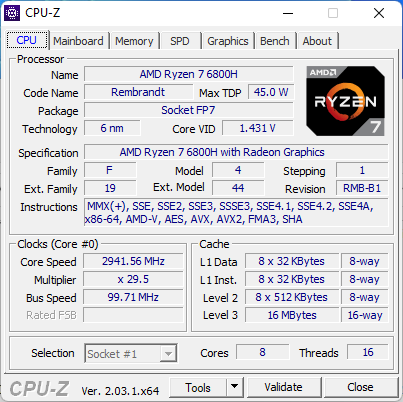
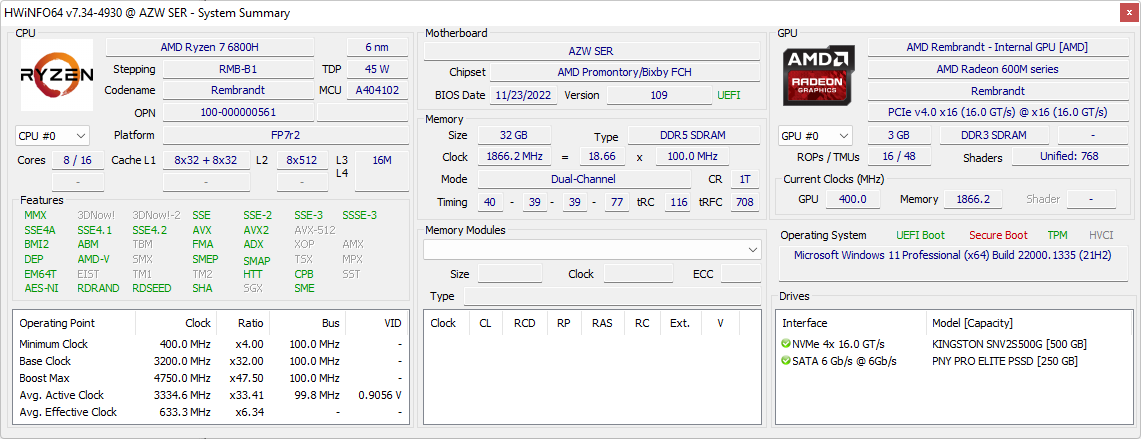
Le Beelink SER6 Pro succède à l'ancienne génération Beelink SER5 Pro. Il introduit de nouveaux changements externes et un processeur Zen 3+ Ryzen 7 6800H amélioré pour remplacer le Zen 3 Ryzen 7 5800H sur le modèle sortant. Aucune autre option de CPU n'est disponible pour le SER6 Pro pour le moment.
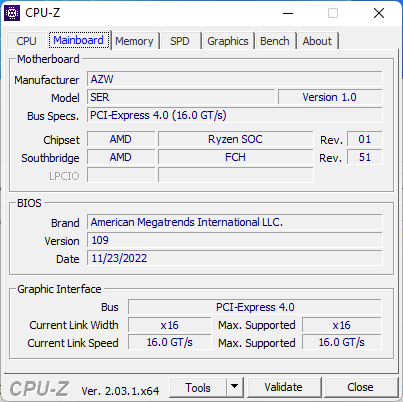
Le SER6 Pro est en concurrence directe avec de nombreuses solutions Intel NUC Test du Kit Intel NUC 12 Pro Canyon Wall Street : Mini PC avancé avec Intel Core i7-1260P ainsi qu'avec le Zotac ZBox ou la série MSI Cubi MSI Cubi 5 12M now selling from US$449 with choice of Intel Alder Lake-U series processors . Notre configuration spécifique de Beelink se vend entre $600 et $700 USD.
Plus de commentaires sur Beelink :
Comparaison avec les concurrents potentiels
Note | Date | Modèle | Poids | Épaisseur | Taille | Résolution | Prix |
|---|---|---|---|---|---|---|---|
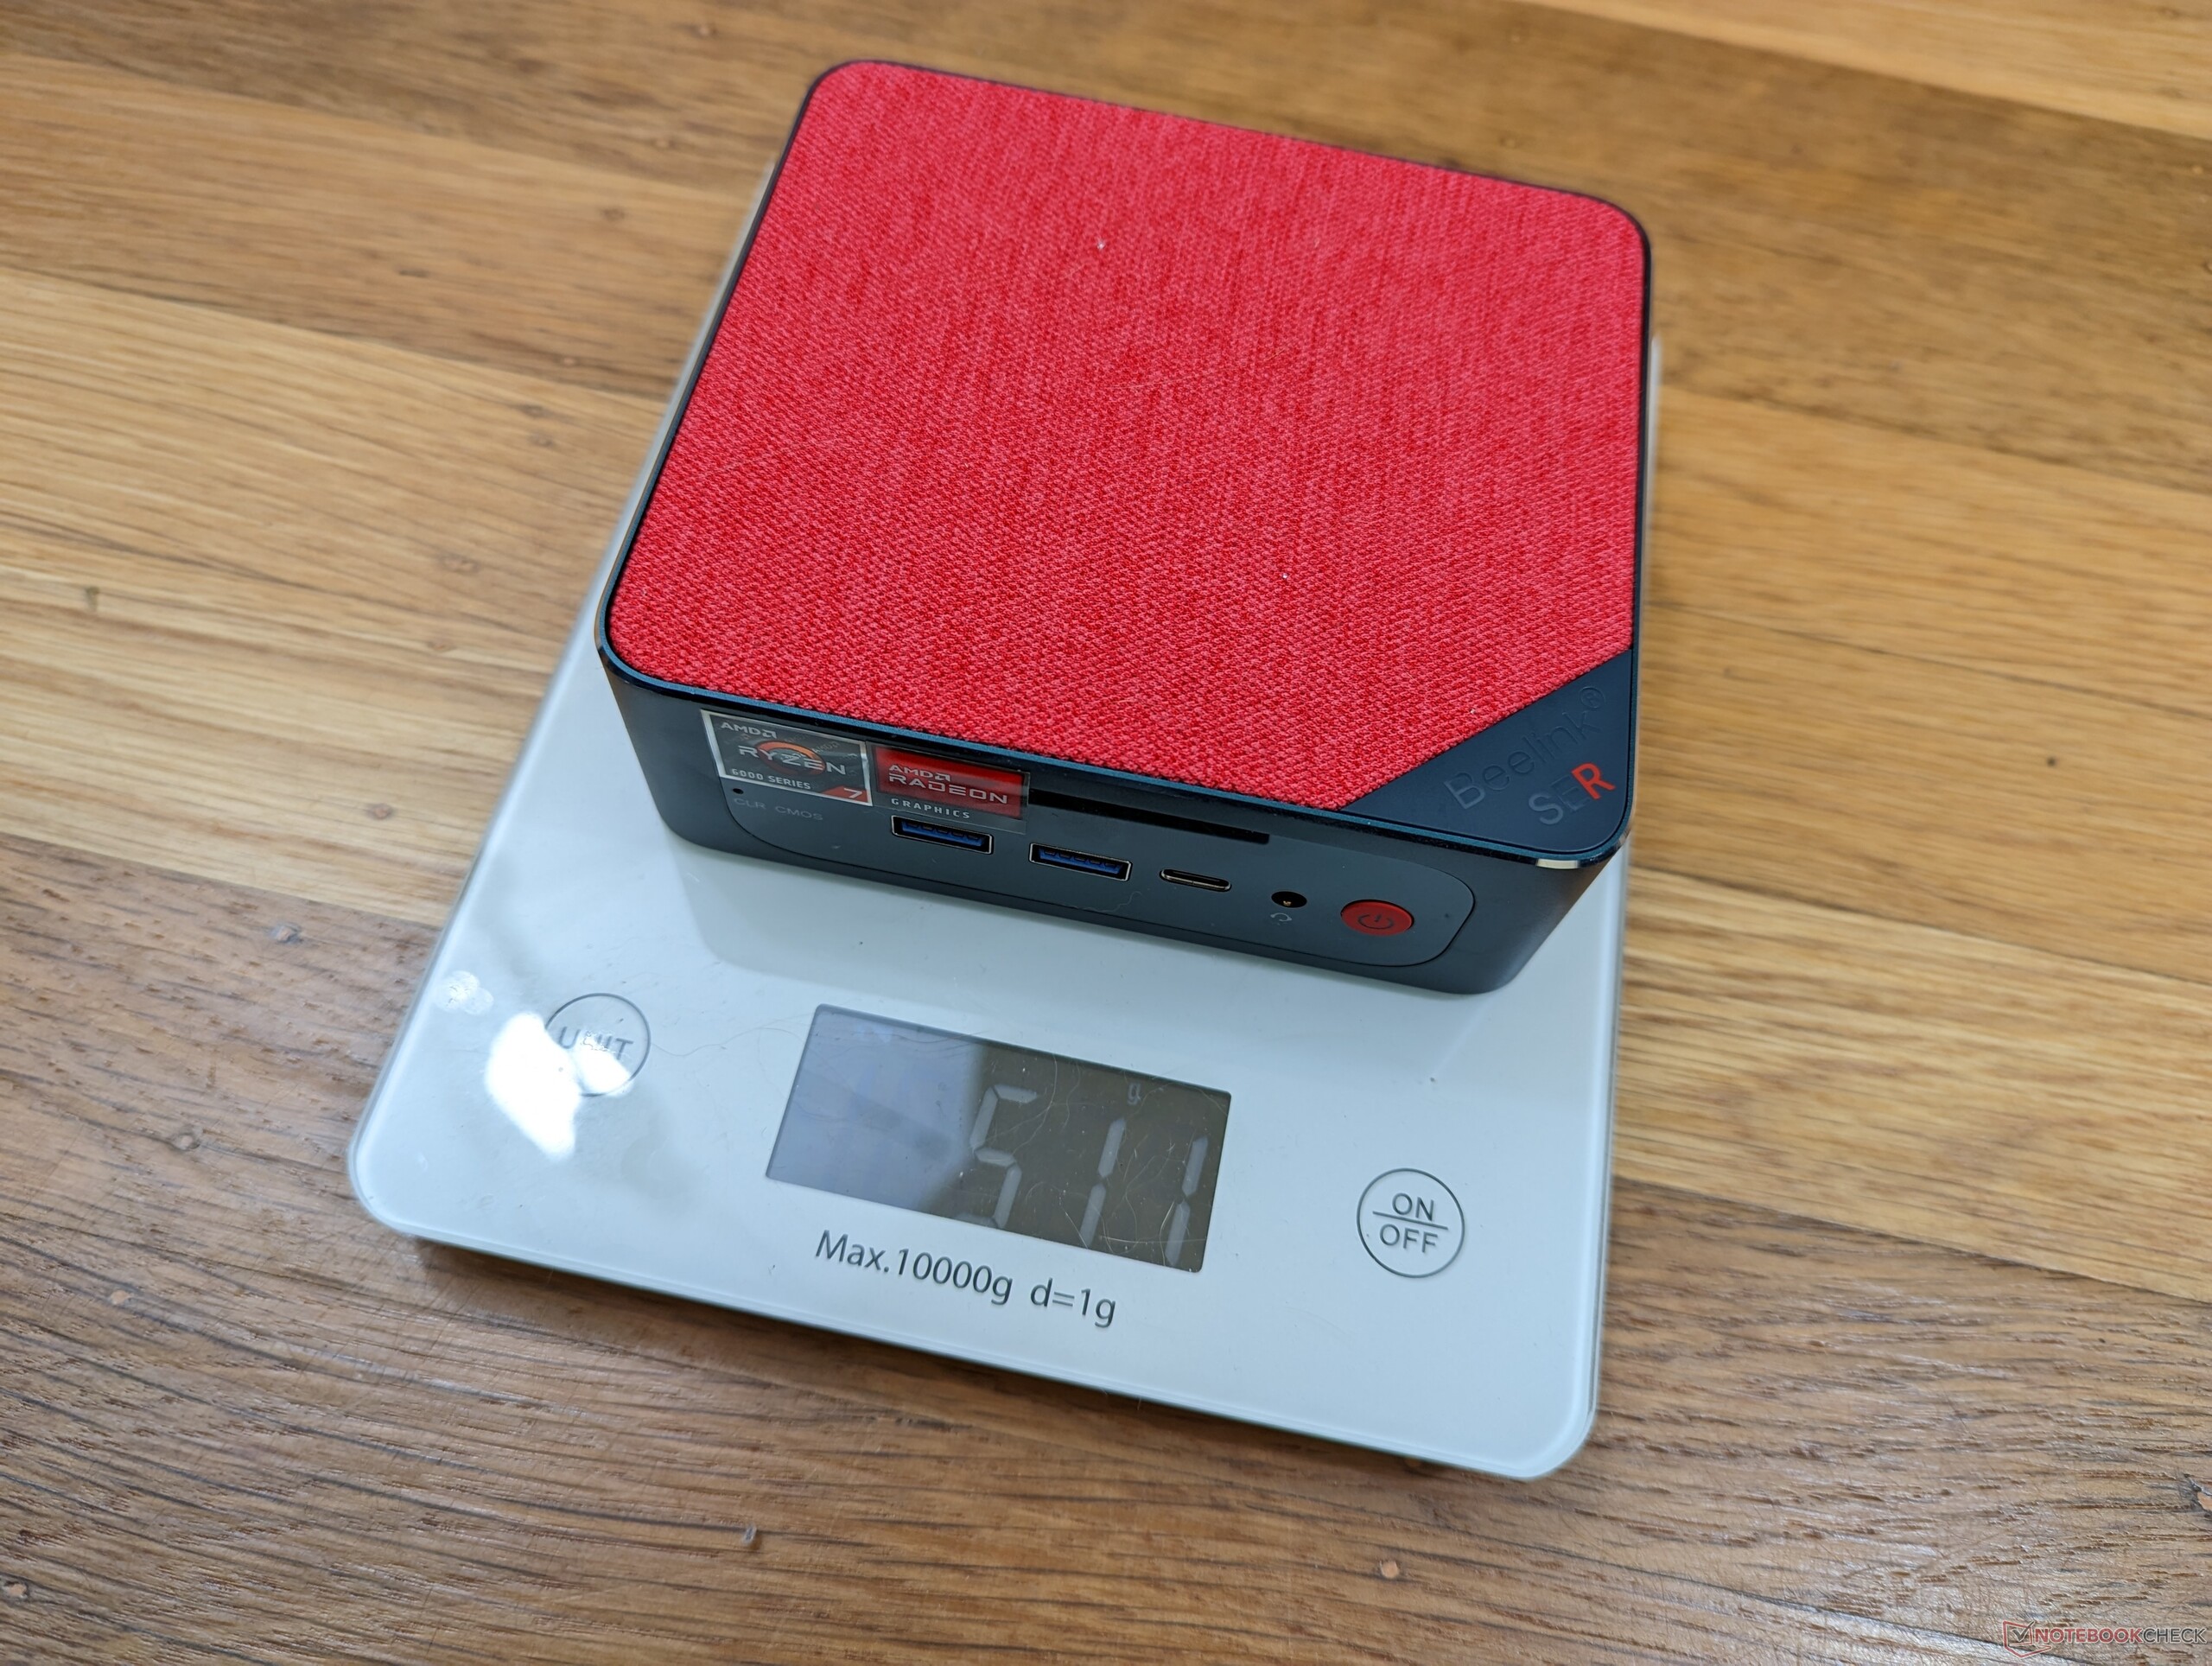
v (old) | 01/23 | Beelink SER6 Pro R7 6800H, Radeon 680M | 511 g | 42 mm | x | ||
v (old) | 11/22 | Beelink GTR6 R9 6900HX, Radeon 680M | 815 g | 43 mm | x | ||
v (old) | 09/22 | Beelink SEi11 Pro i5-11320H, Iris Xe G7 96EUs | 440 g | 40 mm | x | ||
| 78.9 % v7 (old) | 11/22 | Intel NUC 12 Pro Kit NUC12WSKi7 i7-1260P, Iris Xe G7 96EUs | 511 g | 37 mm | x | ||
v (old) | 04/21 | Intel NUC11PHKi7C i7-1165G7, GeForce RTX 2060 Mobile | 1.4 kg | 42 mm | x | ||
v (old) | 04/18 | Intel Hades Canyon NUC8i7HVK i7-8809G, Vega M GH | 1.3 kg | 39 mm | x |
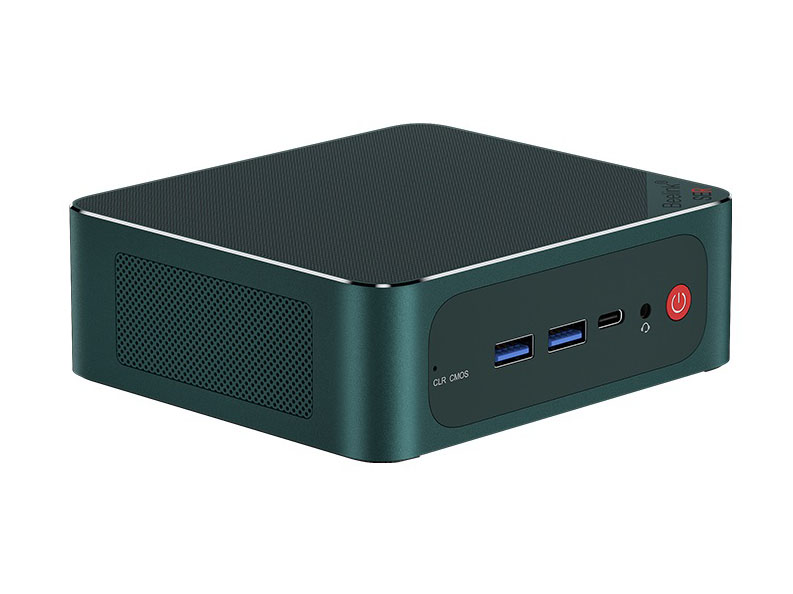
Cas
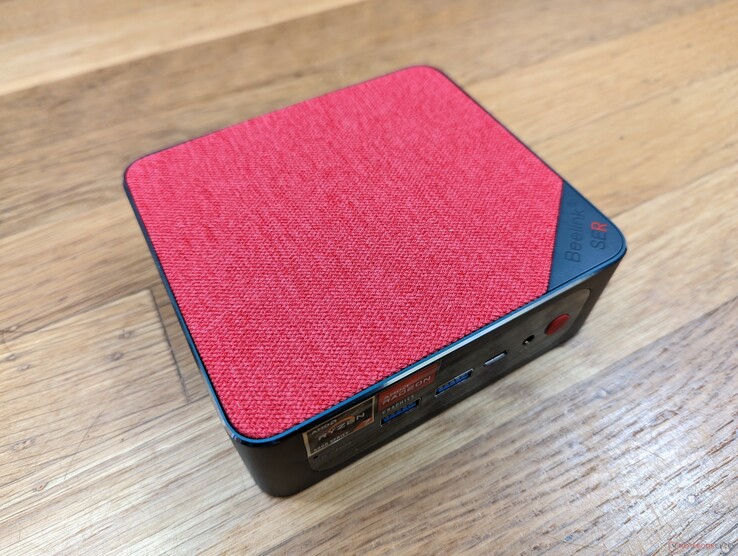
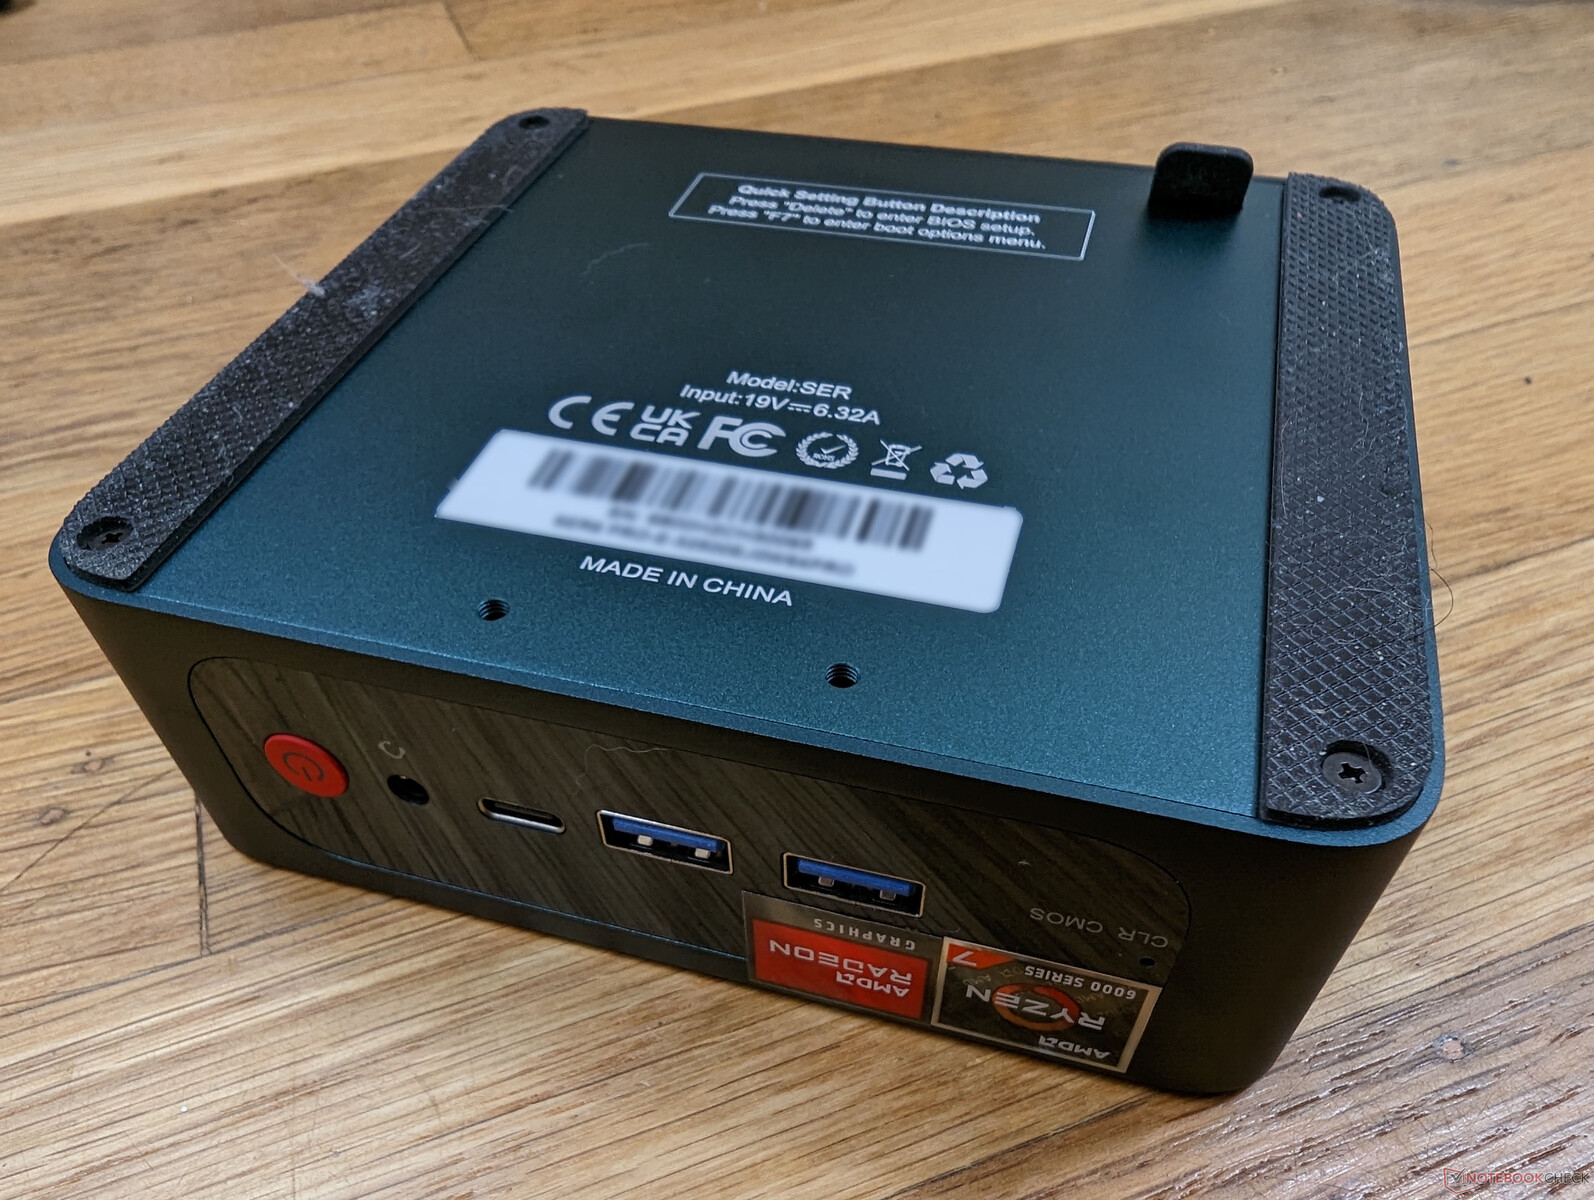
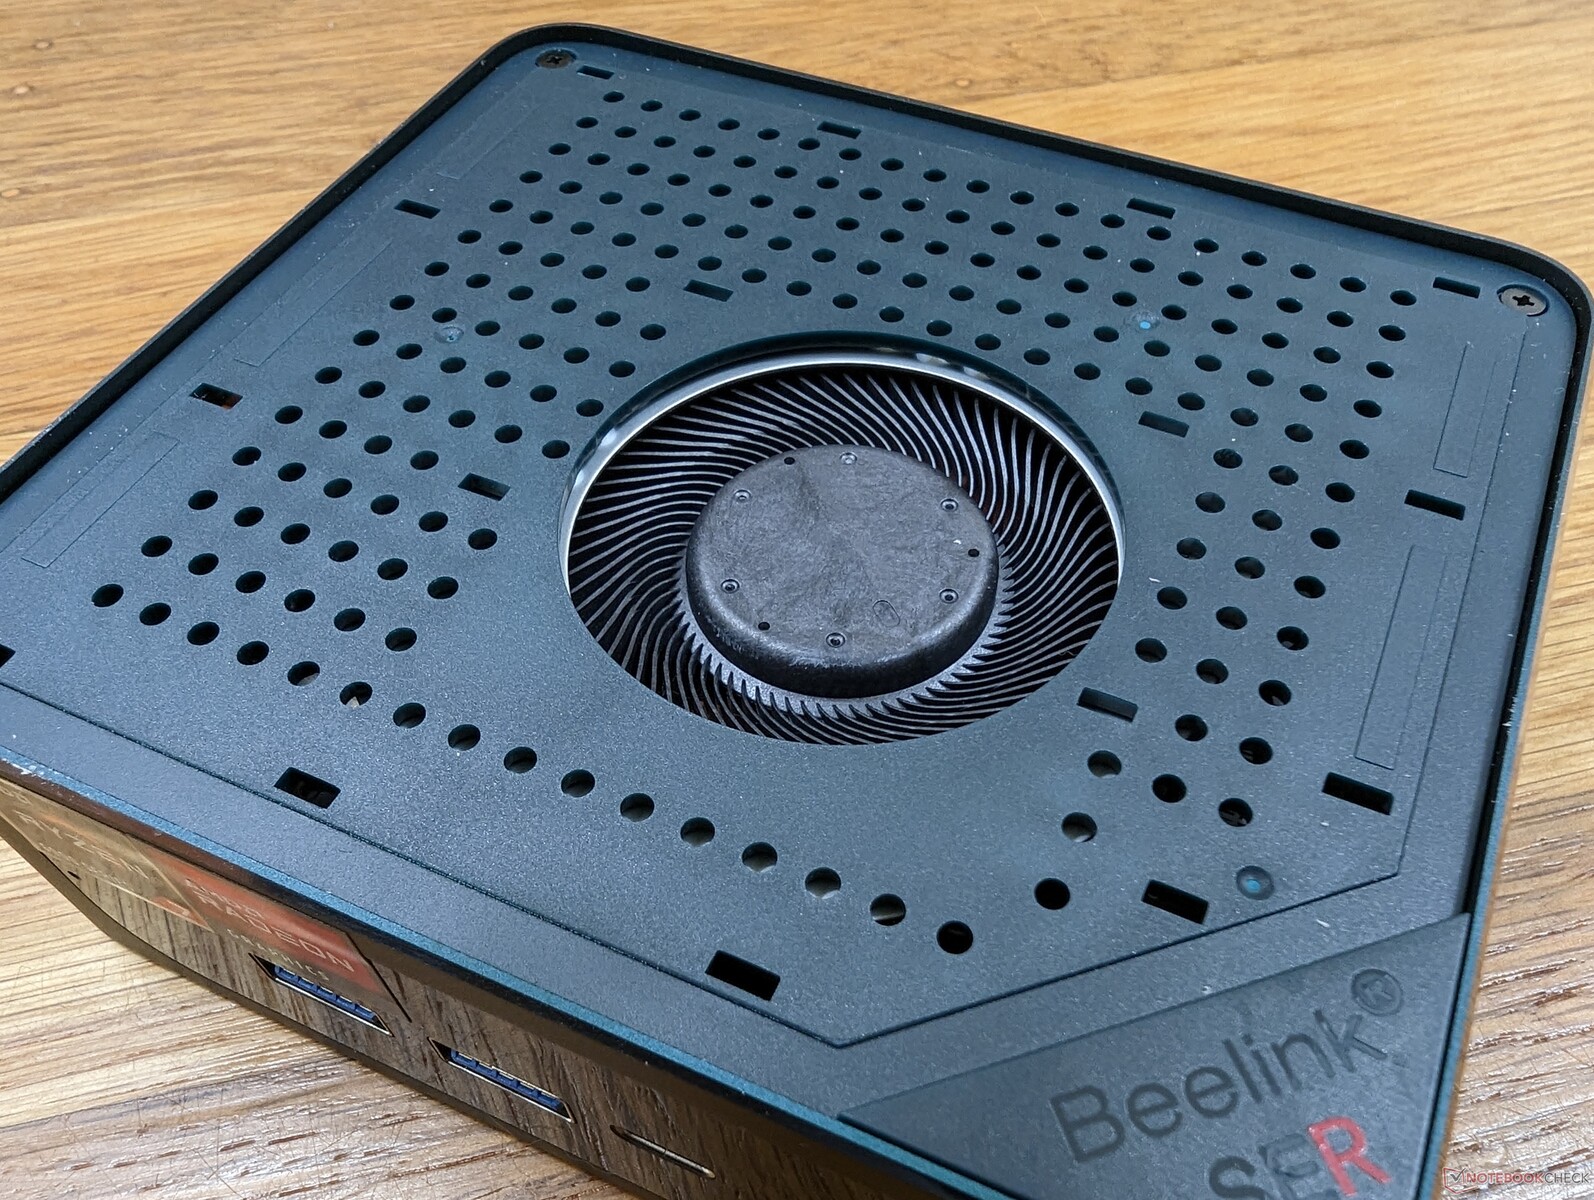
Le châssis est en métal sur toutes ses faces, à l'exception du couvercle supérieur amovible en tissu. Ses dimensions générales sont très similaires à celles duSEi11 Pro bien que légèrement plus lourd en raison de la révision des composants internes. Étonnamment, le SER6 Pro pèse autant que le NUC 12 Pro même si le NUC est plus petit.
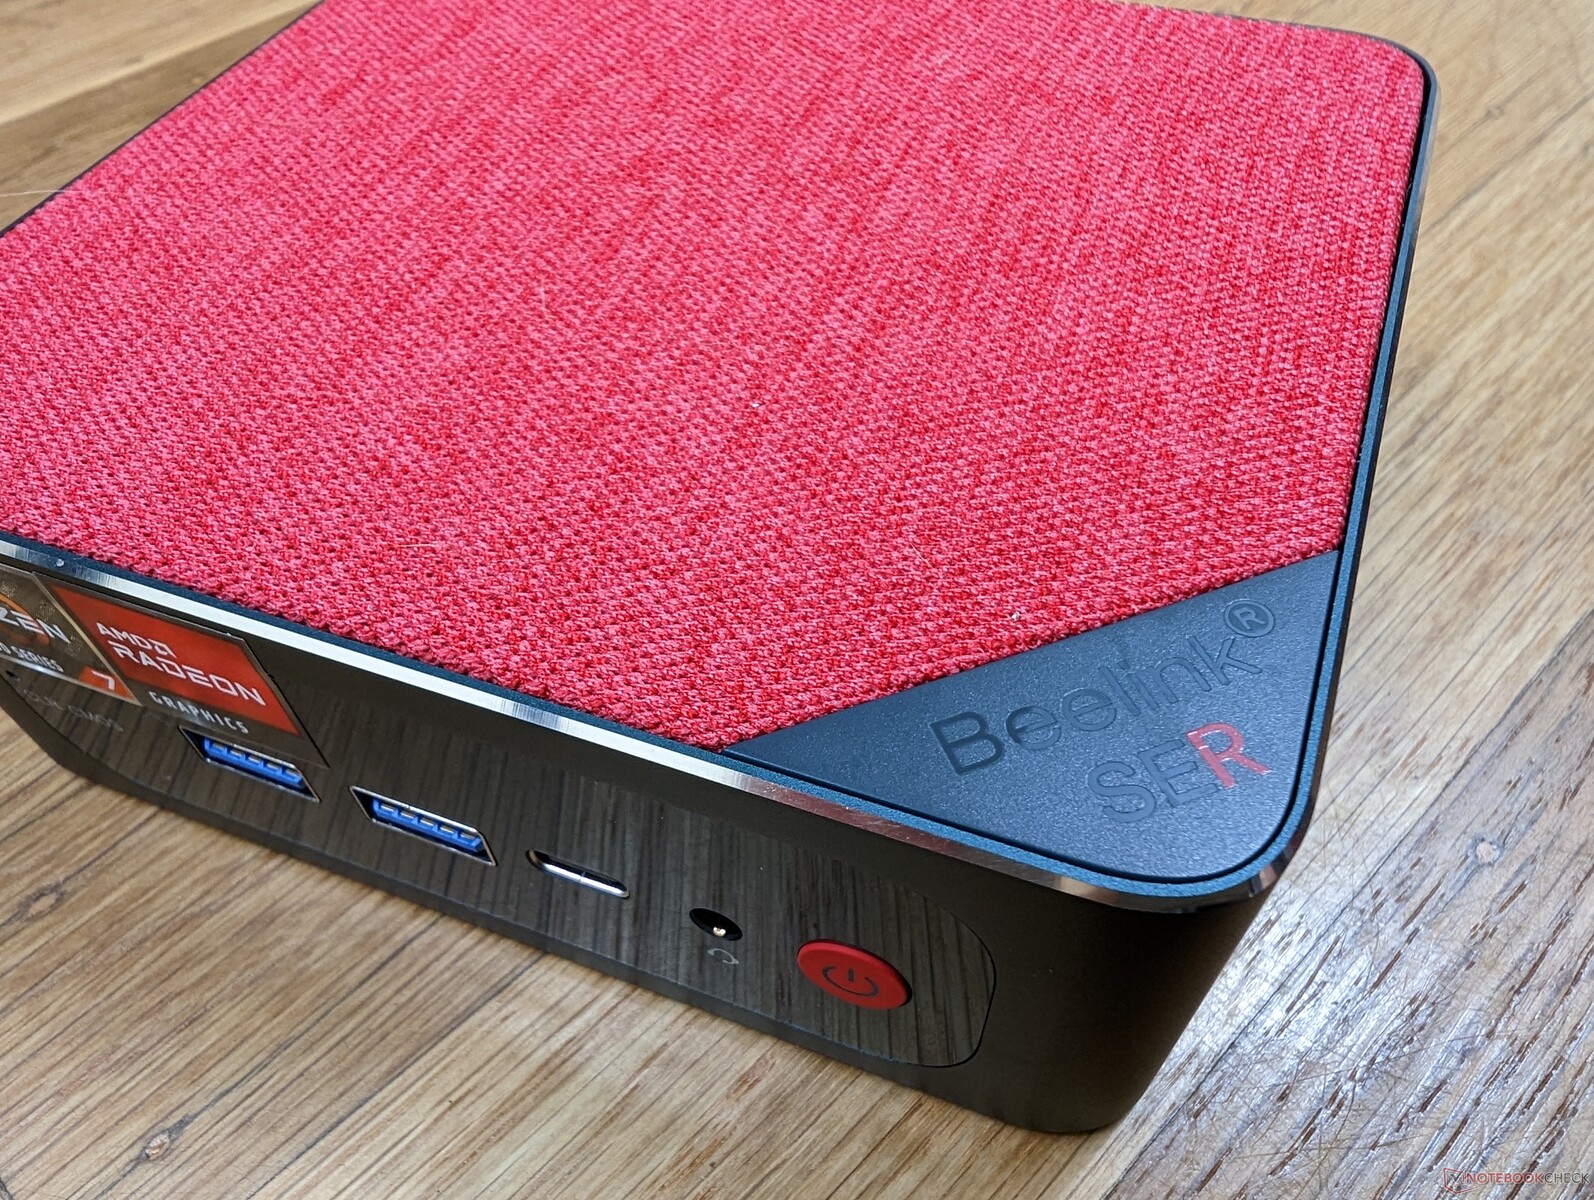
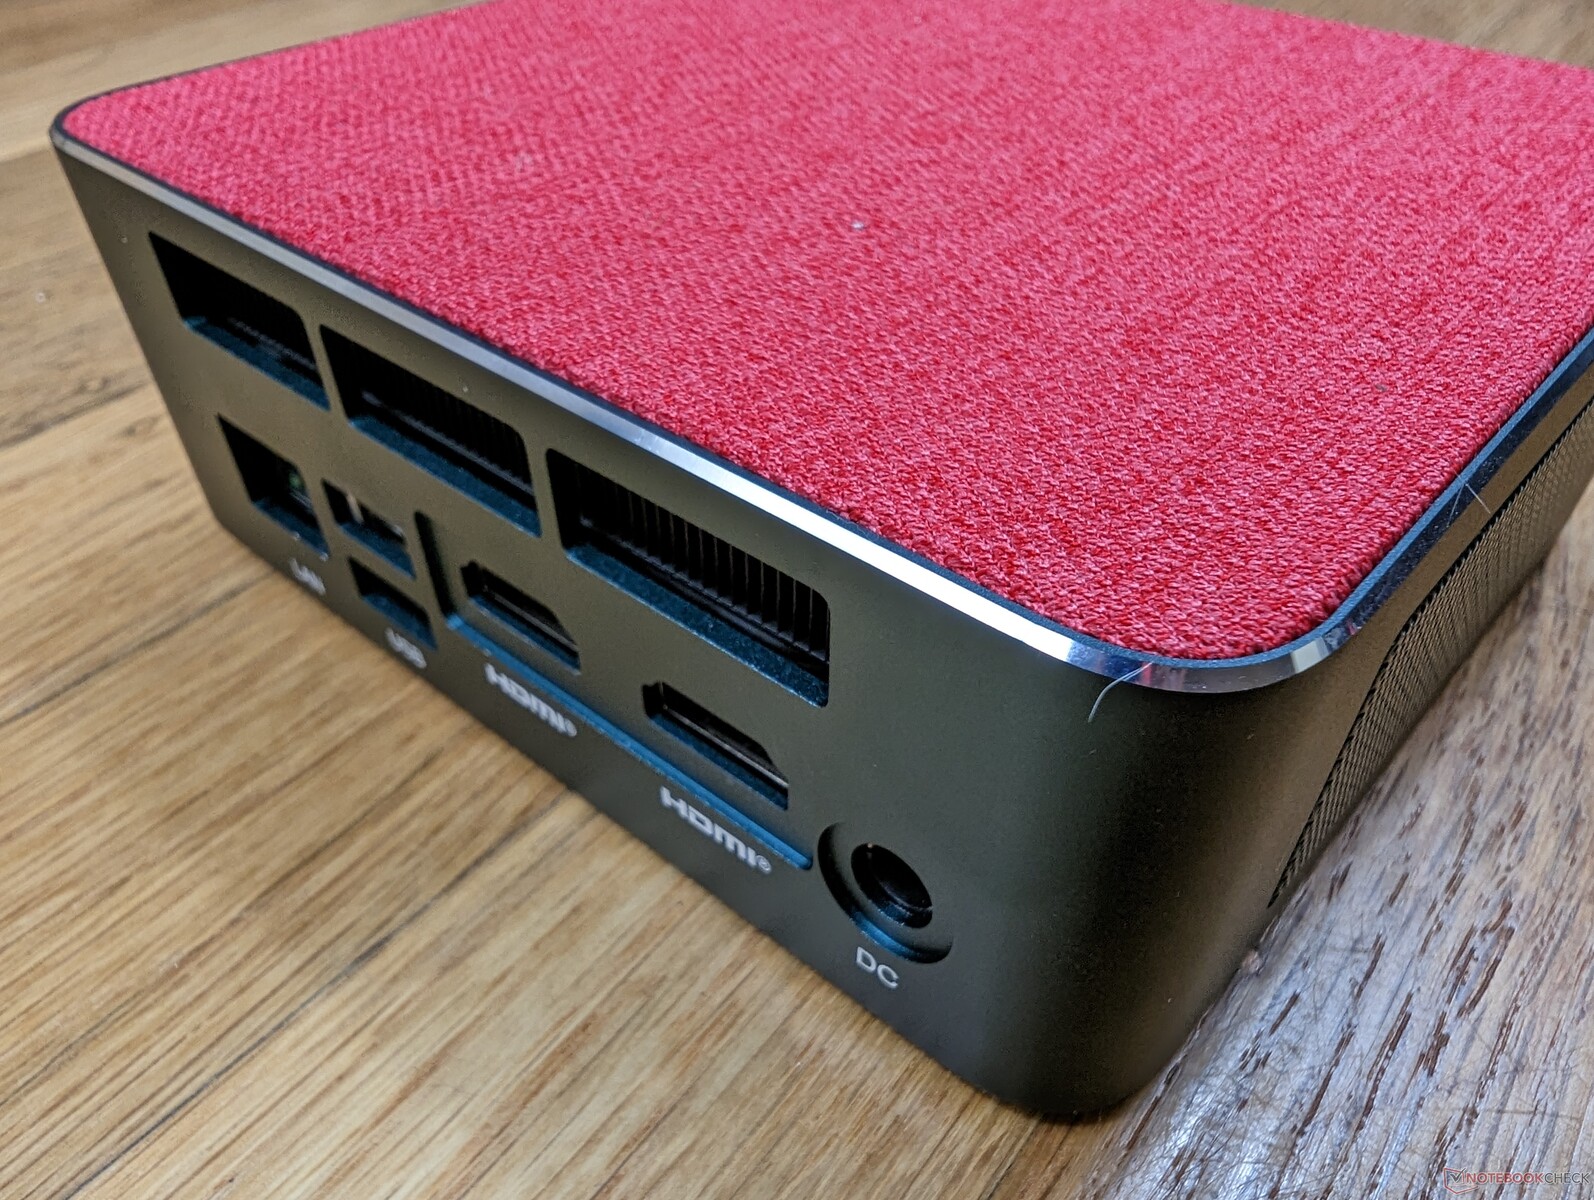
Connectivité
Les options de port et le positionnement sont identiques à ceux du SER5 Pro, mais avec une mise à niveau notable : le port RJ-45 prend désormais en charge des vitesses de 2,5 Gbps au lieu de seulement 1 Gbps. Le système peut également être alimenté par des adaptateurs secteur USB-C tiers si jamais vous perdez l'adaptateur propriétaire fourni dans la boîte de détail. Notre adaptateur secteur 130 W livré avec le Dell XPS 17par exemple, alimente notre SER6 Pro sans aucun problème.
Communication
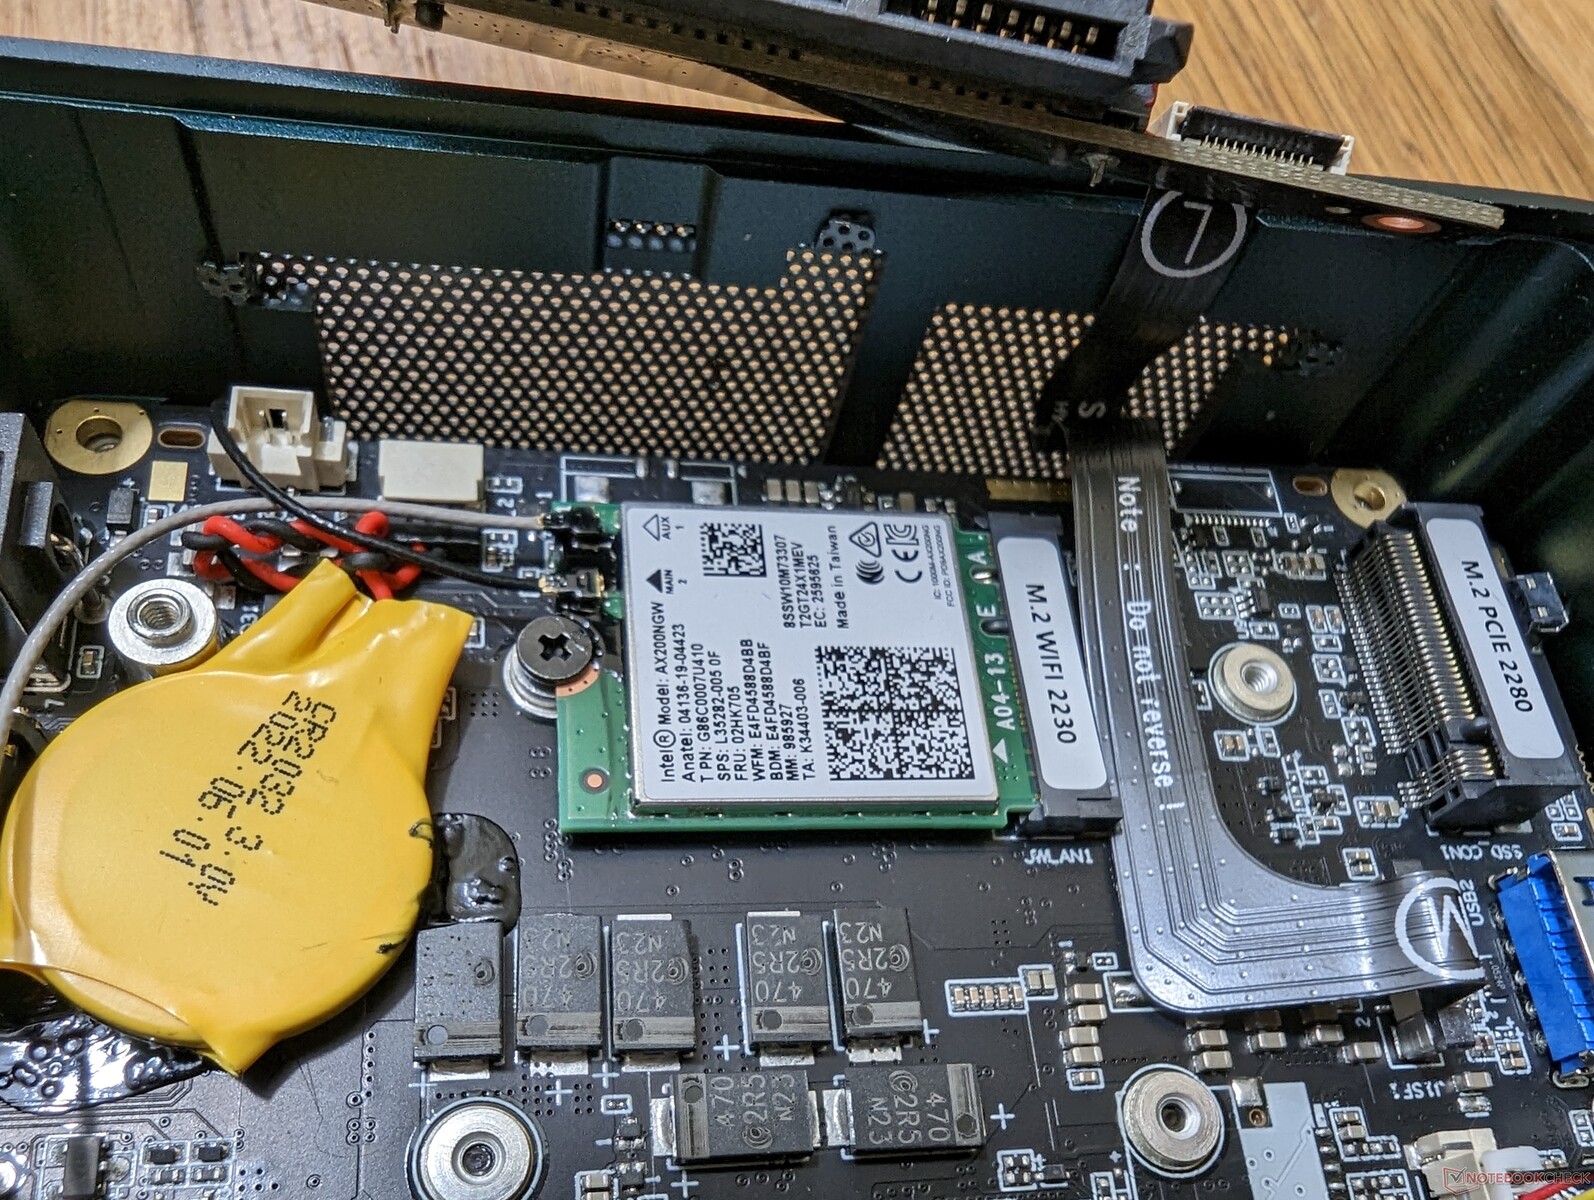
Beelink a remplacé le MediaTek RZ608 du SER5 Pro par le module Intel AX200, plus courant. Ce module Intel particulier n'a pas de capacités Wi-Fi 6E, mais les taux de transfert sont néanmoins rapides à environ 1200 Mbps en moyenne lorsqu'il est couplé à notre routeur de test Asus AXE11000.
| Networking | |
| iperf3 transmit AX12 | |
| Intel NUC11PHKi7C | |
| Intel Hades Canyon NUC8i7HVK | |
| iperf3 receive AX12 | |
| Intel NUC11PHKi7C | |
| Intel Hades Canyon NUC8i7HVK | |
| iperf3 receive AXE11000 6GHz | |
| Intel NUC 12 Pro Kit NUC12WSKi7 | |
| Beelink GTR6 | |
| Beelink SEi11 Pro | |
| iperf3 receive AXE11000 | |
| Beelink SER6 Pro | |
| Beelink GTR6 | |
| iperf3 transmit AXE11000 | |
| Beelink SER6 Pro | |
| Beelink GTR6 | |
| iperf3 transmit AXE11000 6GHz | |
| Beelink GTR6 | |
| Intel NUC 12 Pro Kit NUC12WSKi7 | |
| Beelink SEi11 Pro | |
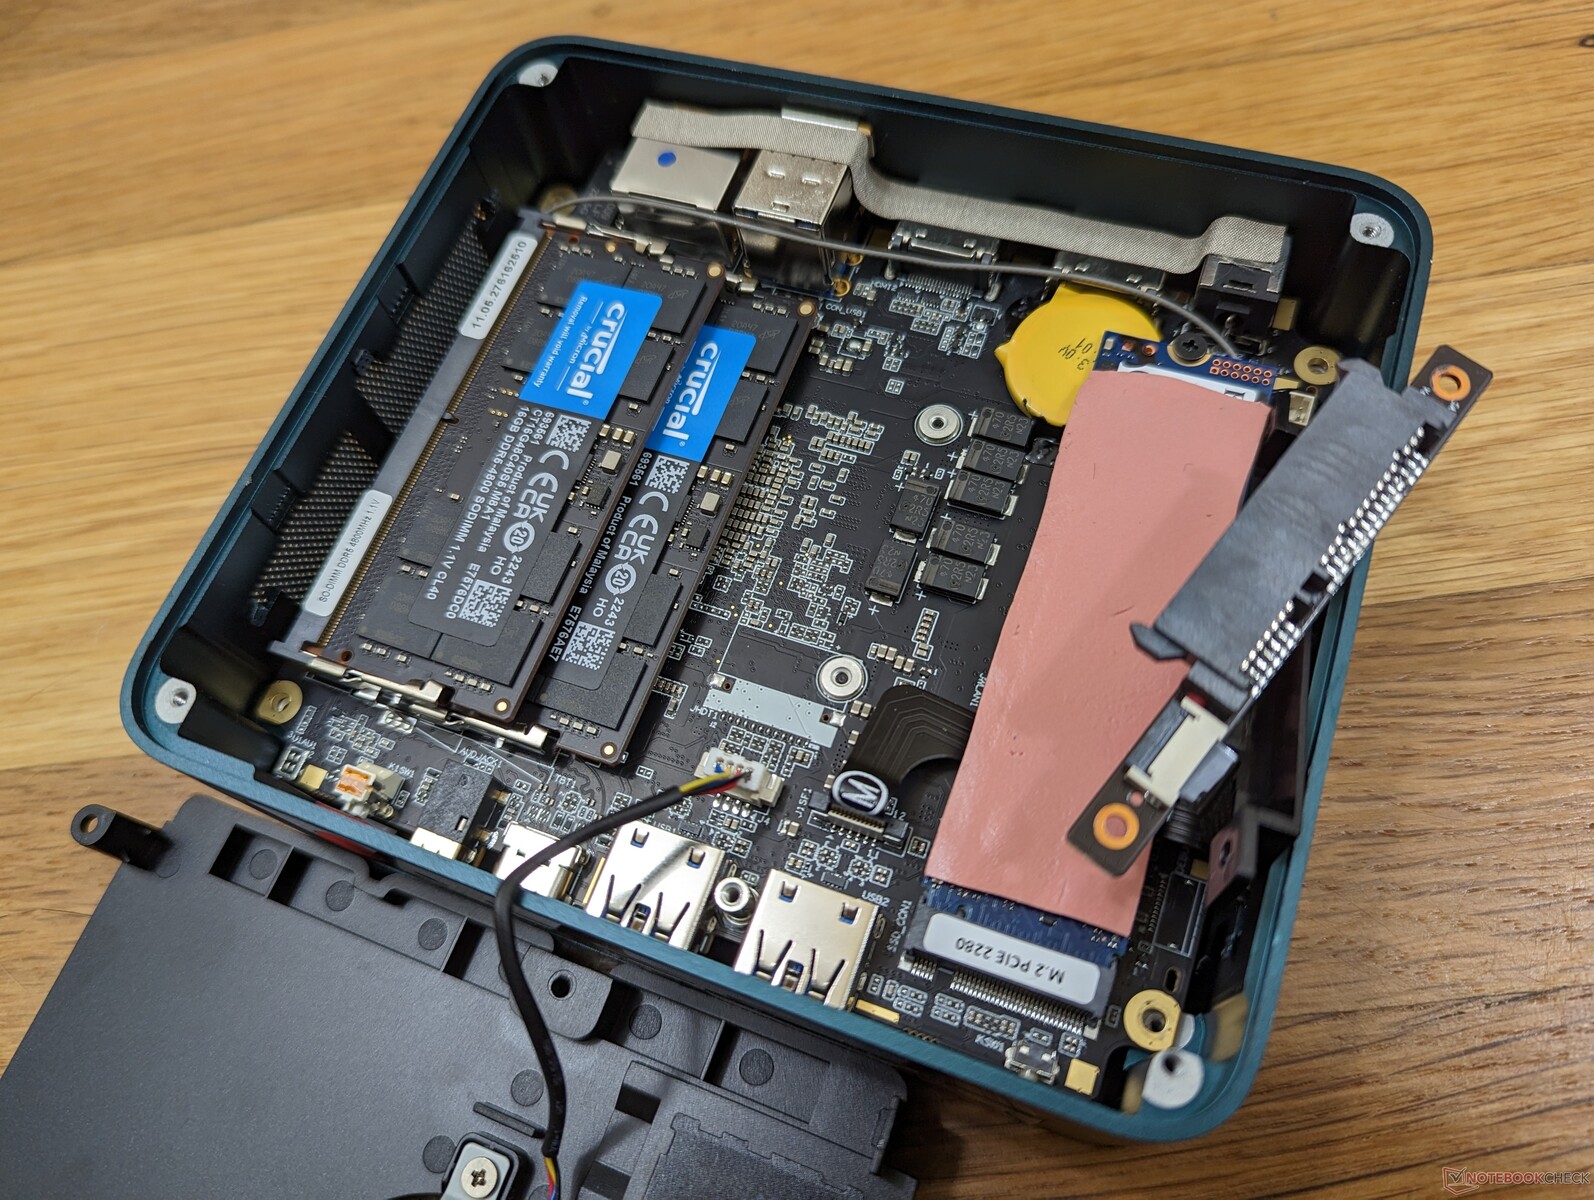
Maintenance
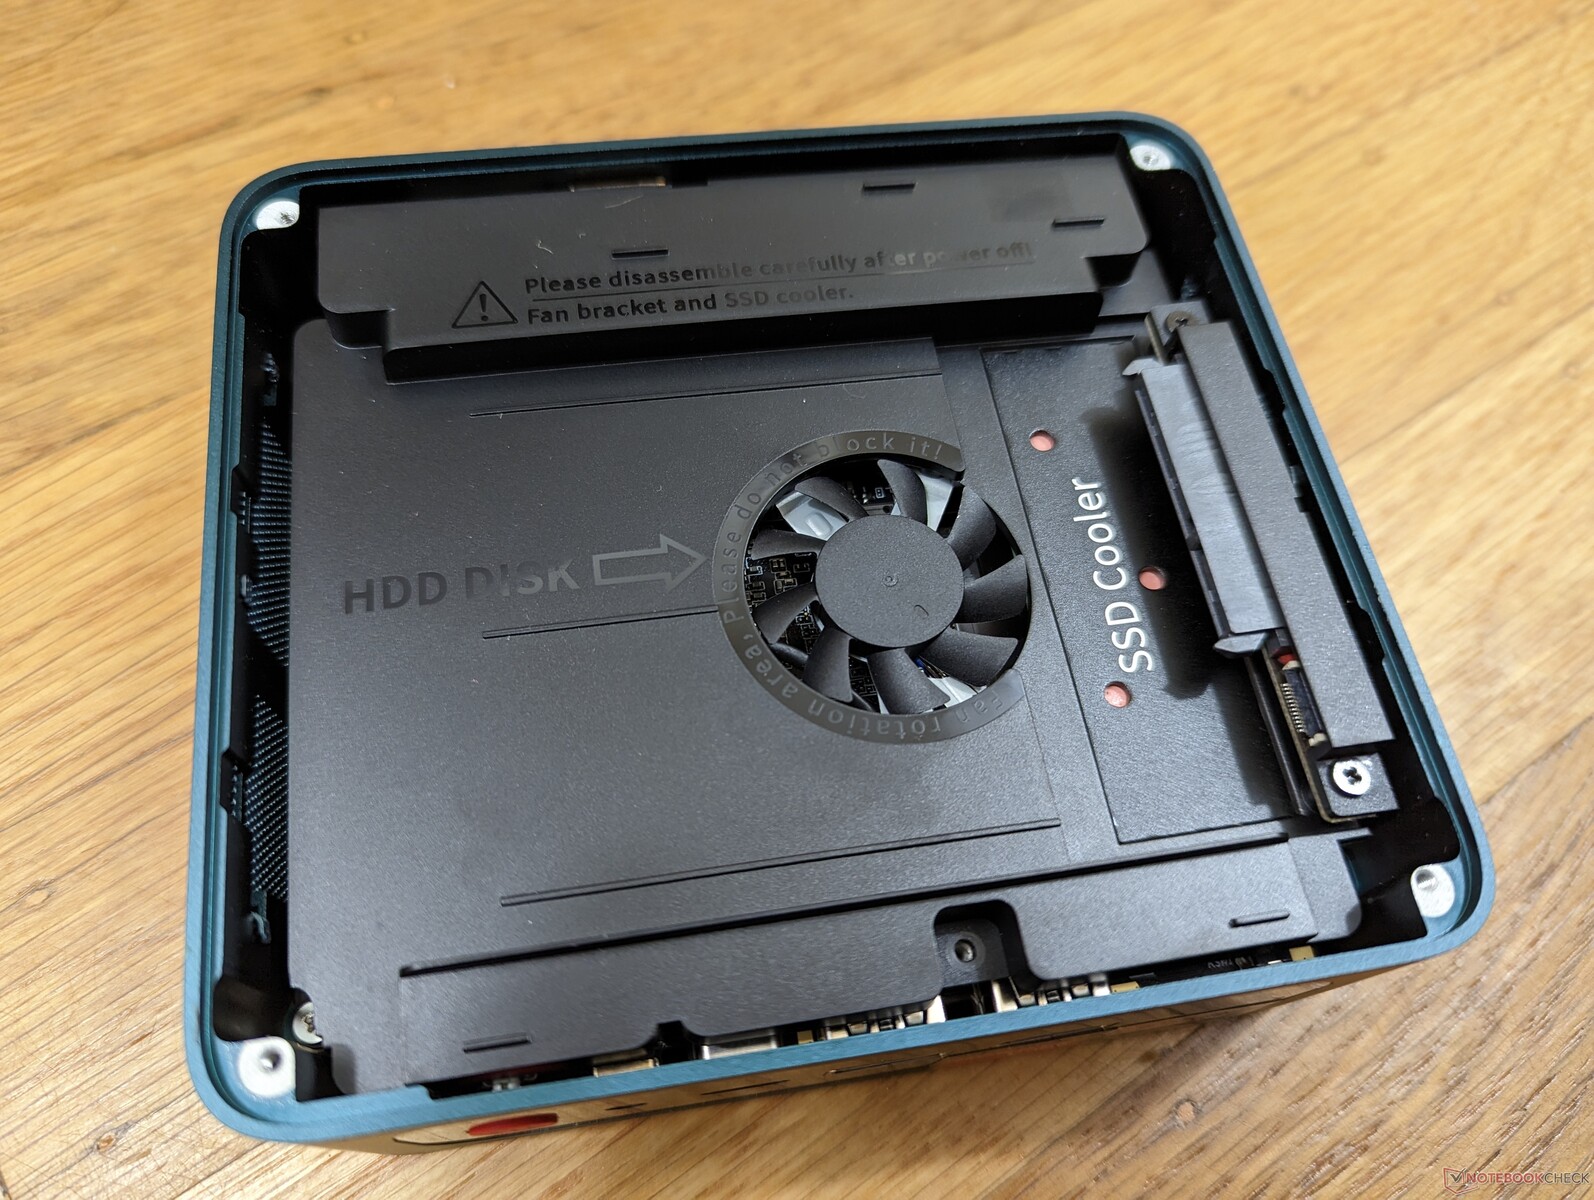
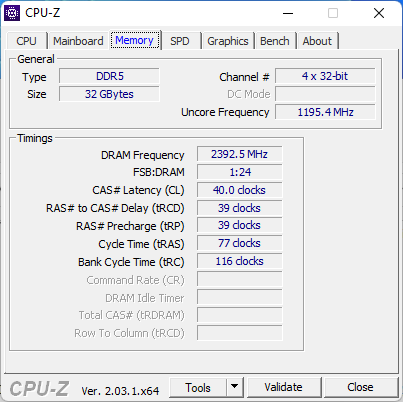
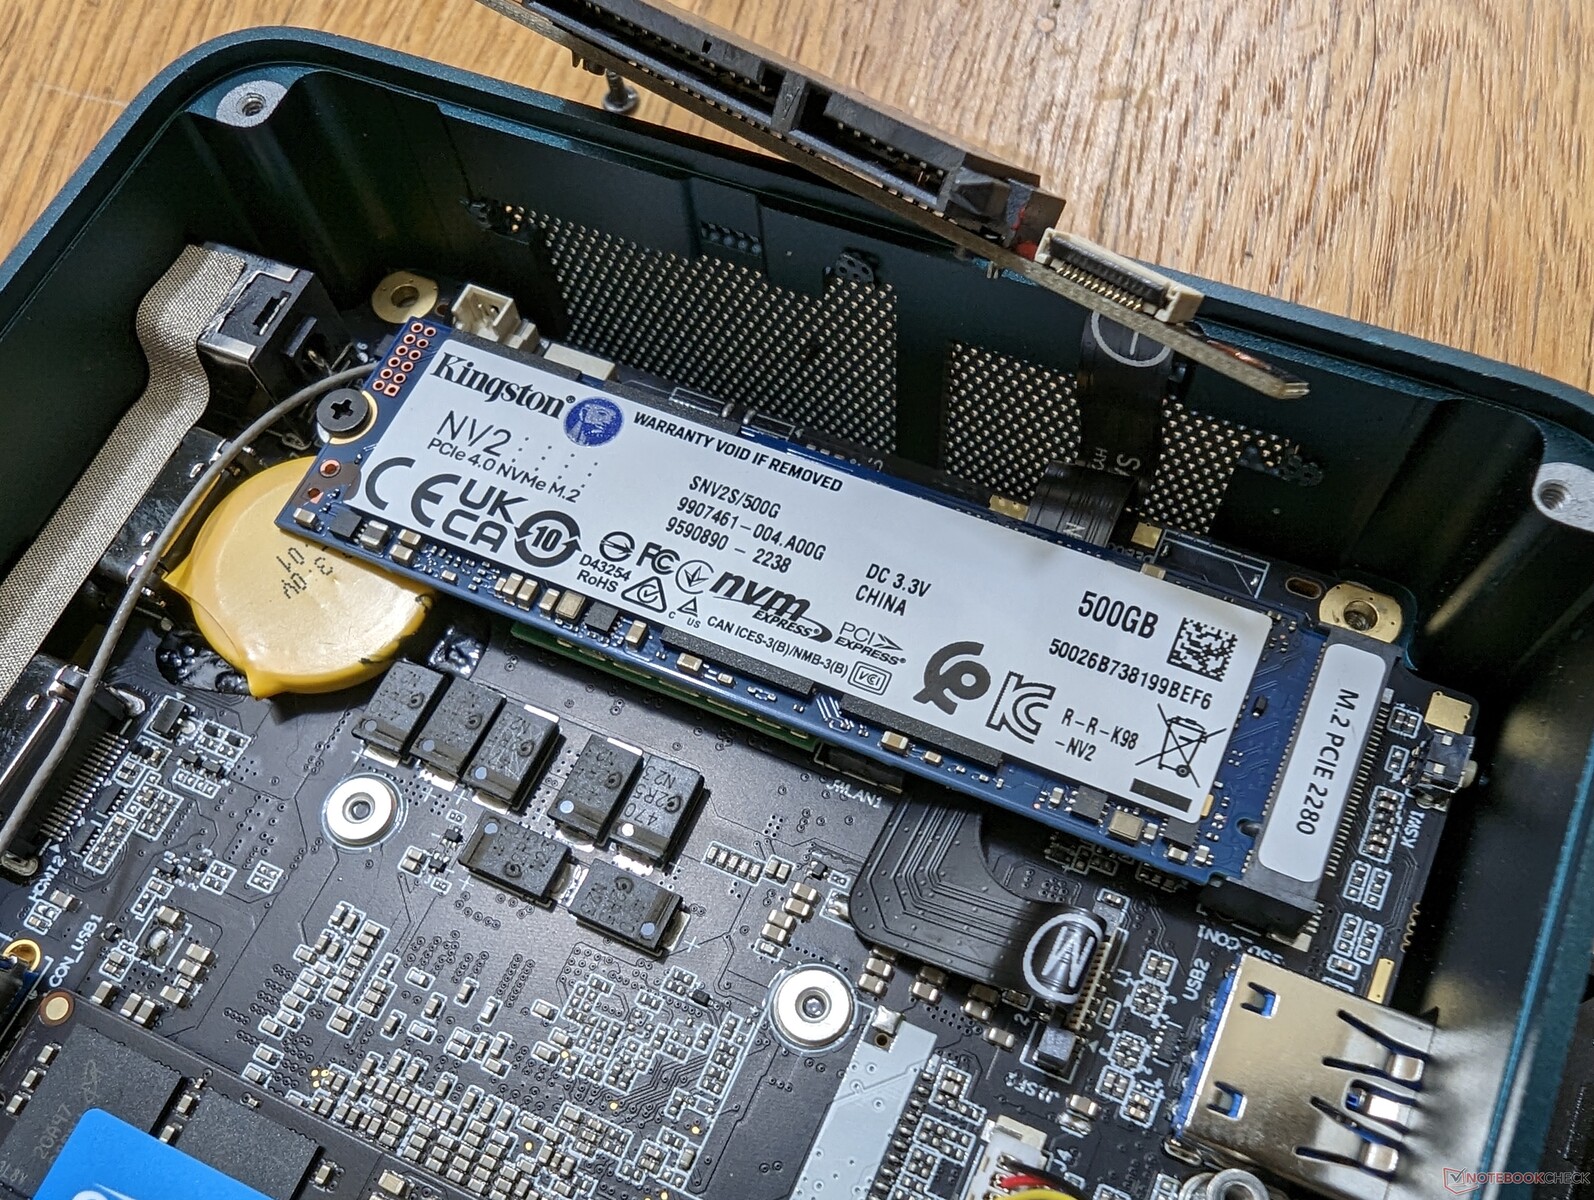
Les mises à niveau de la RAM et du stockage sont faciles et ne nécessitent qu'un tournevis Philips. Les utilisateurs peuvent installer jusqu'à deux modules de RAM SODIMM et deux disques (1x M.2 PCIe4 x4 + 1x 2,5 pouces SATA III).
Accessoires et garantie
La boîte de détail comprend deux câbles HDMI, un support de montage VESA amovible, des couvercles en tissu noir et rouge, un adaptateur secteur et des documents. La garantie limitée habituelle d'un an du fabricant s'applique si l'achat est effectué aux États-Unis.
Performance
Conditions d'essai
Nous avons réglé notre appareil en mode Performance avant d'effectuer les tests de référence ci-dessous. Il n'y a pas d'applications préinstallées de type centre de contrôle.
Processeur
Les performances brutes du processeur sont presque identiques à celles de la génération précédente Ryzen 7 5800H. Les performances en single-thread peuvent être jusqu'à 5 % plus rapides, mais les différences sont au mieux marginales. Au lieu de cela, la plus grande amélioration entre les deux processeurs est liée à leurs GPU intégrés, comme le démontre notre section GPU ci-dessous.
Cinebench R15 Multi Loop
Cinebench R23: Multi Core | Single Core
Cinebench R15: CPU Multi 64Bit | CPU Single 64Bit
Blender: v2.79 BMW27 CPU
7-Zip 18.03: 7z b 4 | 7z b 4 -mmt1
Geekbench 5.5: Multi-Core | Single-Core
HWBOT x265 Benchmark v2.2: 4k Preset
LibreOffice : 20 Documents To PDF
R Benchmark 2.5: Overall mean
Cinebench R23: Multi Core | Single Core
Cinebench R15: CPU Multi 64Bit | CPU Single 64Bit
Blender: v2.79 BMW27 CPU
7-Zip 18.03: 7z b 4 | 7z b 4 -mmt1
Geekbench 5.5: Multi-Core | Single-Core
HWBOT x265 Benchmark v2.2: 4k Preset
LibreOffice : 20 Documents To PDF
R Benchmark 2.5: Overall mean
* ... Moindre est la valeur, meilleures sont les performances
AIDA64: FP32 Ray-Trace | FPU Julia | CPU SHA3 | CPU Queen | FPU SinJulia | FPU Mandel | CPU AES | CPU ZLib | FP64 Ray-Trace | CPU PhotoWorxx
| Performance rating | |
| Moyenne AMD Ryzen 7 6800H | |
| Beelink GTR6 | |
| Beelink SER6 Pro | |
| Intel NUC 12 Pro Kit NUC12WSKi7 | |
| Intel NUC11PHKi7C | |
| Beelink SEi11 Pro | |
| AIDA64 / FP32 Ray-Trace | |
| Moyenne AMD Ryzen 7 6800H (12876 - 17031, n=8) | |
| Beelink GTR6 | |
| Beelink SER6 Pro | |
| Intel NUC 12 Pro Kit NUC12WSKi7 | |
| Intel NUC11PHKi7C | |
| Beelink SEi11 Pro | |
| AIDA64 / FPU Julia | |
| Moyenne AMD Ryzen 7 6800H (82673 - 105987, n=8) | |
| Beelink GTR6 | |
| Beelink SER6 Pro | |
| Intel NUC 12 Pro Kit NUC12WSKi7 | |
| Intel NUC11PHKi7C | |
| Beelink SEi11 Pro | |
| AIDA64 / CPU SHA3 | |
| Moyenne AMD Ryzen 7 6800H (2886 - 3634, n=8) | |
| Beelink GTR6 | |
| Beelink SER6 Pro | |
| Intel NUC 12 Pro Kit NUC12WSKi7 | |
| Intel NUC11PHKi7C | |
| Beelink SEi11 Pro | |
| AIDA64 / CPU Queen | |
| Moyenne AMD Ryzen 7 6800H (75117 - 106322, n=8) | |
| Beelink GTR6 | |
| Beelink SER6 Pro | |
| Intel NUC 12 Pro Kit NUC12WSKi7 | |
| Intel NUC11PHKi7C | |
| Beelink SEi11 Pro | |
| AIDA64 / FPU SinJulia | |
| Moyenne AMD Ryzen 7 6800H (11771 - 13120, n=8) | |
| Beelink GTR6 | |
| Beelink SER6 Pro | |
| Intel NUC 12 Pro Kit NUC12WSKi7 | |
| Intel NUC11PHKi7C | |
| Beelink SEi11 Pro | |
| AIDA64 / FPU Mandel | |
| Moyenne AMD Ryzen 7 6800H (45287 - 58327, n=8) | |
| Beelink GTR6 | |
| Beelink SER6 Pro | |
| Intel NUC 12 Pro Kit NUC12WSKi7 | |
| Intel NUC11PHKi7C | |
| Beelink SEi11 Pro | |
| AIDA64 / CPU AES | |
| Beelink GTR6 | |
| Moyenne AMD Ryzen 7 6800H (67816 - 137383, n=8) | |
| Beelink SER6 Pro | |
| Intel NUC 12 Pro Kit NUC12WSKi7 | |
| Intel NUC11PHKi7C | |
| Beelink SEi11 Pro | |
| AIDA64 / CPU ZLib | |
| Moyenne AMD Ryzen 7 6800H (732 - 901, n=8) | |
| Beelink GTR6 | |
| Beelink SER6 Pro | |
| Intel NUC 12 Pro Kit NUC12WSKi7 | |
| Intel NUC11PHKi7C | |
| Beelink SEi11 Pro | |
| AIDA64 / FP64 Ray-Trace | |
| Moyenne AMD Ryzen 7 6800H (6917 - 8980, n=8) | |
| Beelink GTR6 | |
| Beelink SER6 Pro | |
| Intel NUC 12 Pro Kit NUC12WSKi7 | |
| Intel NUC11PHKi7C | |
| Beelink SEi11 Pro | |
| AIDA64 / CPU PhotoWorxx | |
| Beelink GTR6 | |
| Beelink SER6 Pro | |
| Moyenne AMD Ryzen 7 6800H (26496 - 30360, n=8) | |
| Intel NUC 12 Pro Kit NUC12WSKi7 | |
| Intel NUC11PHKi7C | |
| Beelink SEi11 Pro | |
Performance du système
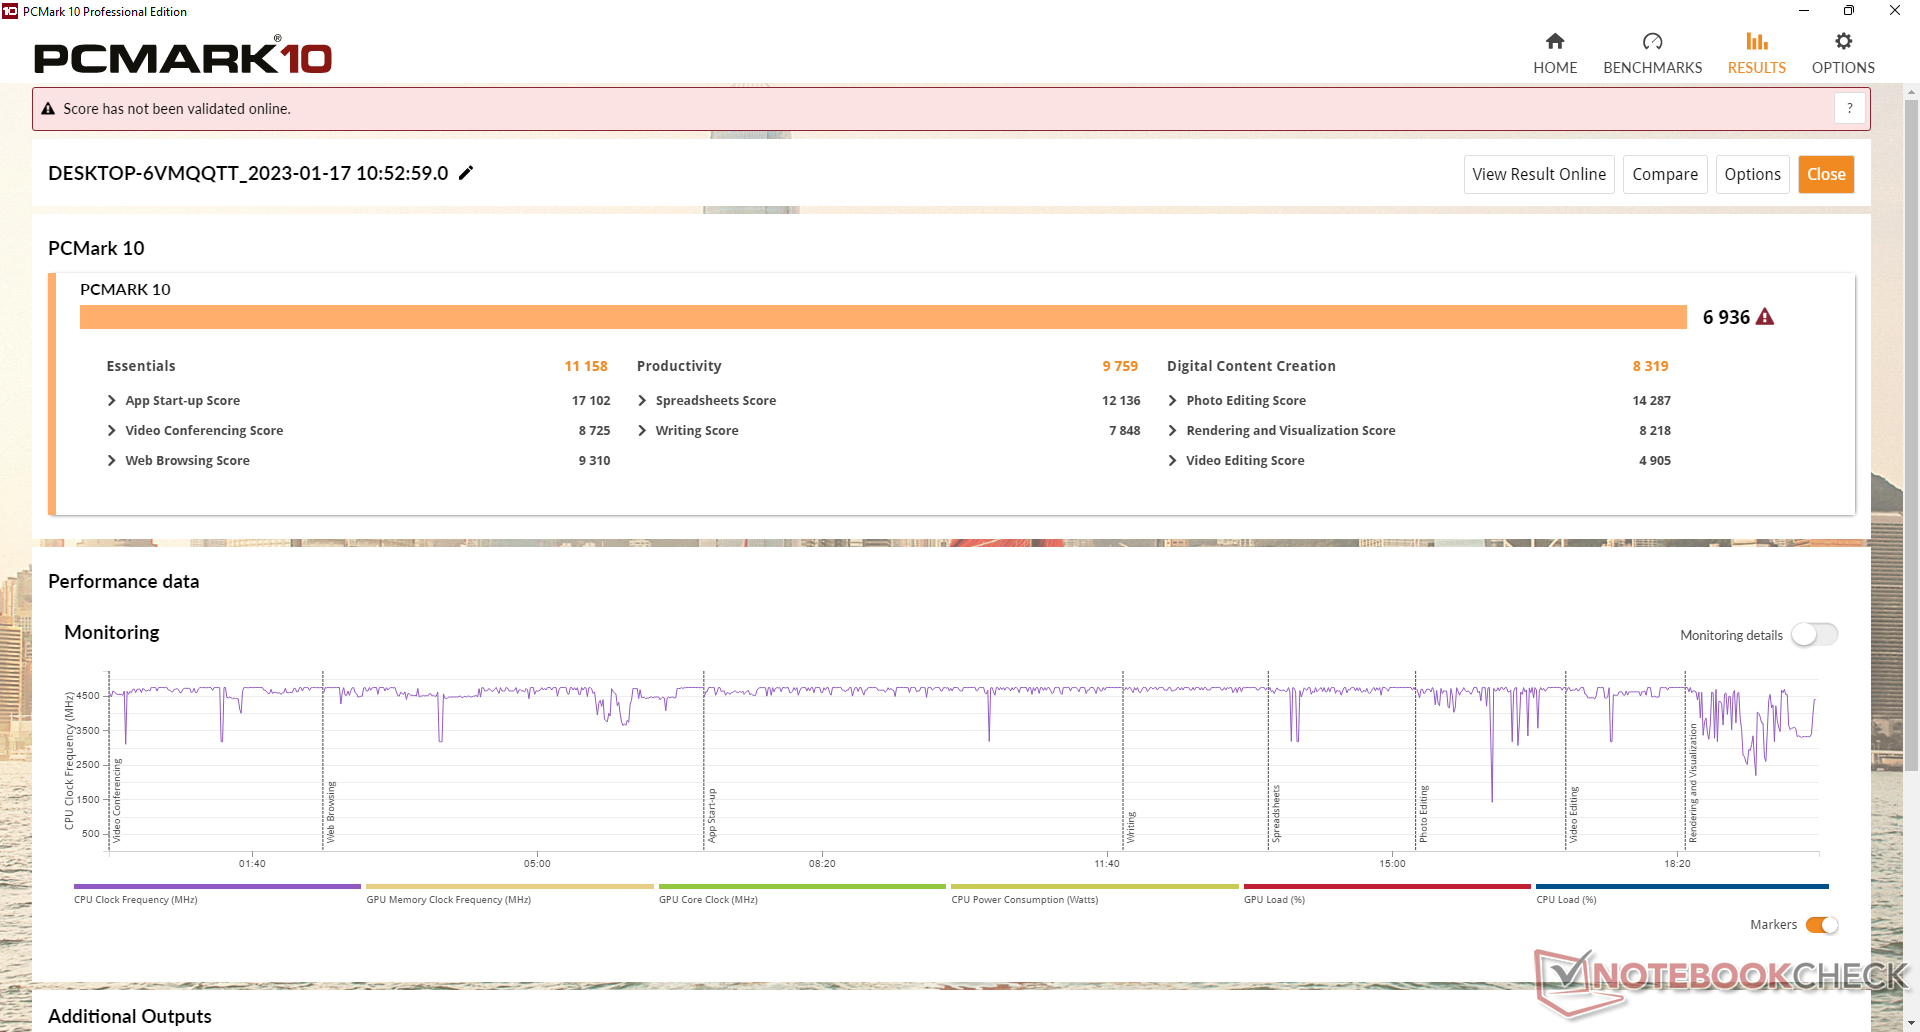
Les résultats de PCMark sont parmi les plus élevés pour un mini PC sans carte graphique dédiée. Ces scores élevés sont attribués à la nouvelle Radeon 680M qui représente un saut substantiel par rapport aux anciennes cartes intégrées de la série Radeon RX Vega series ou Série Iris Xe.
CrossMark: Overall | Productivity | Creativity | Responsiveness
| PCMark 10 / Score | |
| Beelink GTR6 | |
| Beelink SER6 Pro | |
| Moyenne AMD Ryzen 7 6800H, AMD Radeon 680M (6591 - 6936, n=4) | |
| Intel NUC11PHKi7C | |
| Intel NUC 12 Pro Kit NUC12WSKi7 | |
| Beelink SER Pro Ryzen 5 5600H | |
| Intel Hades Canyon NUC8i7HVK | |
| Beelink SEi11 Pro | |
| PCMark 10 / Essentials | |
| Beelink GTR6 | |
| Beelink SER6 Pro | |
| Intel NUC 12 Pro Kit NUC12WSKi7 | |
| Moyenne AMD Ryzen 7 6800H, AMD Radeon 680M (10381 - 11158, n=4) | |
| Beelink SER Pro Ryzen 5 5600H | |
| Beelink SEi11 Pro | |
| Intel NUC11PHKi7C | |
| Intel Hades Canyon NUC8i7HVK | |
| PCMark 10 / Productivity | |
| Beelink GTR6 | |
| Beelink SER6 Pro | |
| Moyenne AMD Ryzen 7 6800H, AMD Radeon 680M (9140 - 9759, n=4) | |
| Beelink SER Pro Ryzen 5 5600H | |
| Intel NUC11PHKi7C | |
| Intel Hades Canyon NUC8i7HVK | |
| Intel NUC 12 Pro Kit NUC12WSKi7 | |
| Beelink SEi11 Pro | |
| PCMark 10 / Digital Content Creation | |
| Beelink GTR6 | |
| Moyenne AMD Ryzen 7 6800H, AMD Radeon 680M (8092 - 8485, n=4) | |
| Beelink SER6 Pro | |
| Intel NUC11PHKi7C | |
| Intel NUC 12 Pro Kit NUC12WSKi7 | |
| Beelink SER Pro Ryzen 5 5600H | |
| Intel Hades Canyon NUC8i7HVK | |
| Beelink SEi11 Pro | |
| CrossMark / Overall | |
| Beelink SER6 Pro | |
| Beelink GTR6 | |
| Intel NUC 12 Pro Kit NUC12WSKi7 | |
| Moyenne AMD Ryzen 7 6800H, AMD Radeon 680M (1590 - 1704, n=3) | |
| Beelink SEi11 Pro | |
| Beelink SER Pro Ryzen 5 5600H | |
| CrossMark / Productivity | |
| Beelink GTR6 | |
| Beelink SER6 Pro | |
| Intel NUC 12 Pro Kit NUC12WSKi7 | |
| Moyenne AMD Ryzen 7 6800H, AMD Radeon 680M (1566 - 1674, n=3) | |
| Beelink SEi11 Pro | |
| Beelink SER Pro Ryzen 5 5600H | |
| CrossMark / Creativity | |
| Intel NUC 12 Pro Kit NUC12WSKi7 | |
| Beelink SER6 Pro | |
| Moyenne AMD Ryzen 7 6800H, AMD Radeon 680M (1696 - 1763, n=3) | |
| Beelink GTR6 | |
| Beelink SER Pro Ryzen 5 5600H | |
| Beelink SEi11 Pro | |
| CrossMark / Responsiveness | |
| Beelink GTR6 | |
| Beelink SER6 Pro | |
| Moyenne AMD Ryzen 7 6800H, AMD Radeon 680M (1340 - 1625, n=3) | |
| Intel NUC 12 Pro Kit NUC12WSKi7 | |
| Beelink SEi11 Pro | |
| Beelink SER Pro Ryzen 5 5600H | |
| PCMark 10 Score | 6936 points | |
Aide | ||
| AIDA64 / Memory Copy | |
| Beelink SER6 Pro | |
| Beelink GTR6 | |
| Moyenne AMD Ryzen 7 6800H (48209 - 51186, n=8) | |
| Intel NUC 12 Pro Kit NUC12WSKi7 | |
| Beelink SEi11 Pro | |
| Intel NUC11PHKi7C | |
| AIDA64 / Memory Read | |
| Beelink GTR6 | |
| Beelink SER6 Pro | |
| Moyenne AMD Ryzen 7 6800H (43828 - 51778, n=8) | |
| Intel NUC 12 Pro Kit NUC12WSKi7 | |
| Beelink SEi11 Pro | |
| Intel NUC11PHKi7C | |
| AIDA64 / Memory Write | |
| Beelink GTR6 | |
| Beelink SER6 Pro | |
| Moyenne AMD Ryzen 7 6800H (51116 - 55307, n=8) | |
| Beelink SEi11 Pro | |
| Intel NUC 12 Pro Kit NUC12WSKi7 | |
| Intel NUC11PHKi7C | |
| AIDA64 / Memory Latency | |
| Intel NUC 12 Pro Kit NUC12WSKi7 | |
| Intel NUC11PHKi7C | |
| Moyenne AMD Ryzen 7 6800H (83.1 - 104.1, n=8) | |
| Beelink SER6 Pro | |
| Beelink GTR6 | |
| Beelink SEi11 Pro | |
* ... Moindre est la valeur, meilleures sont les performances
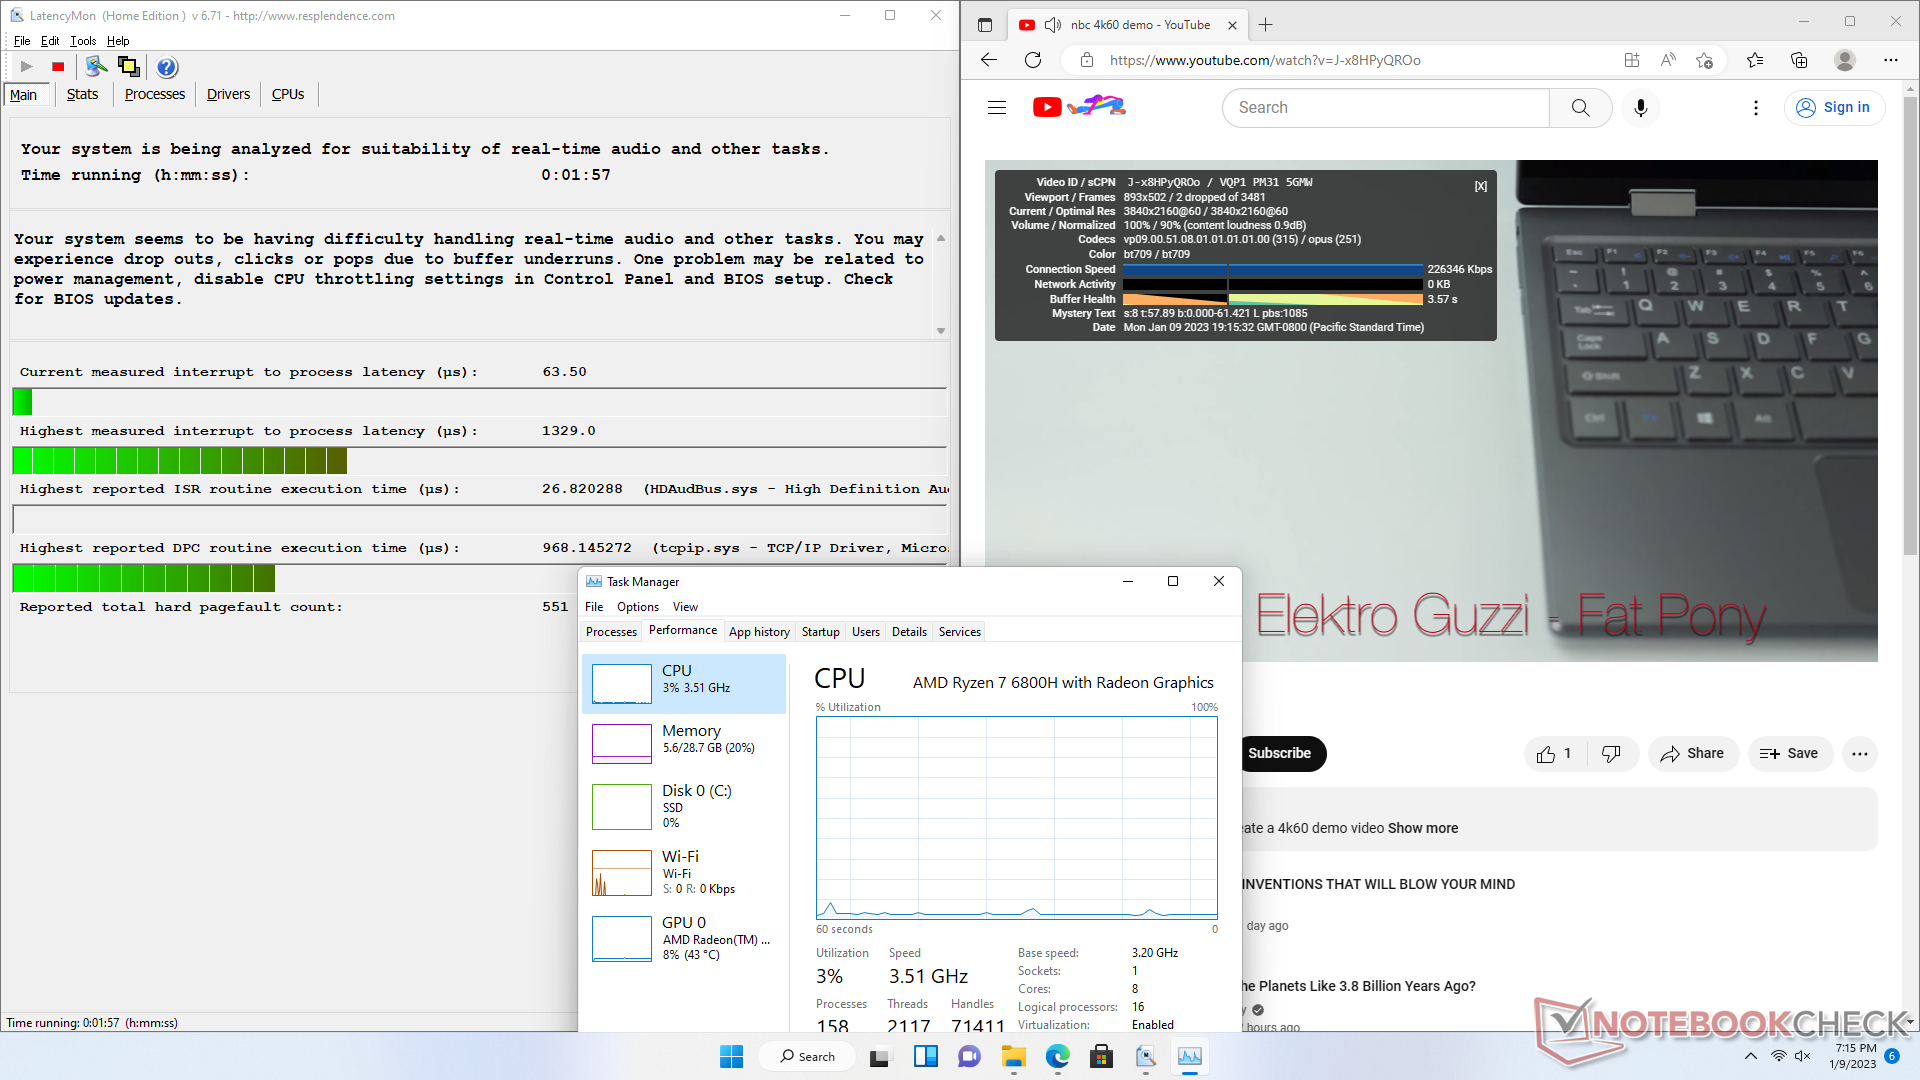
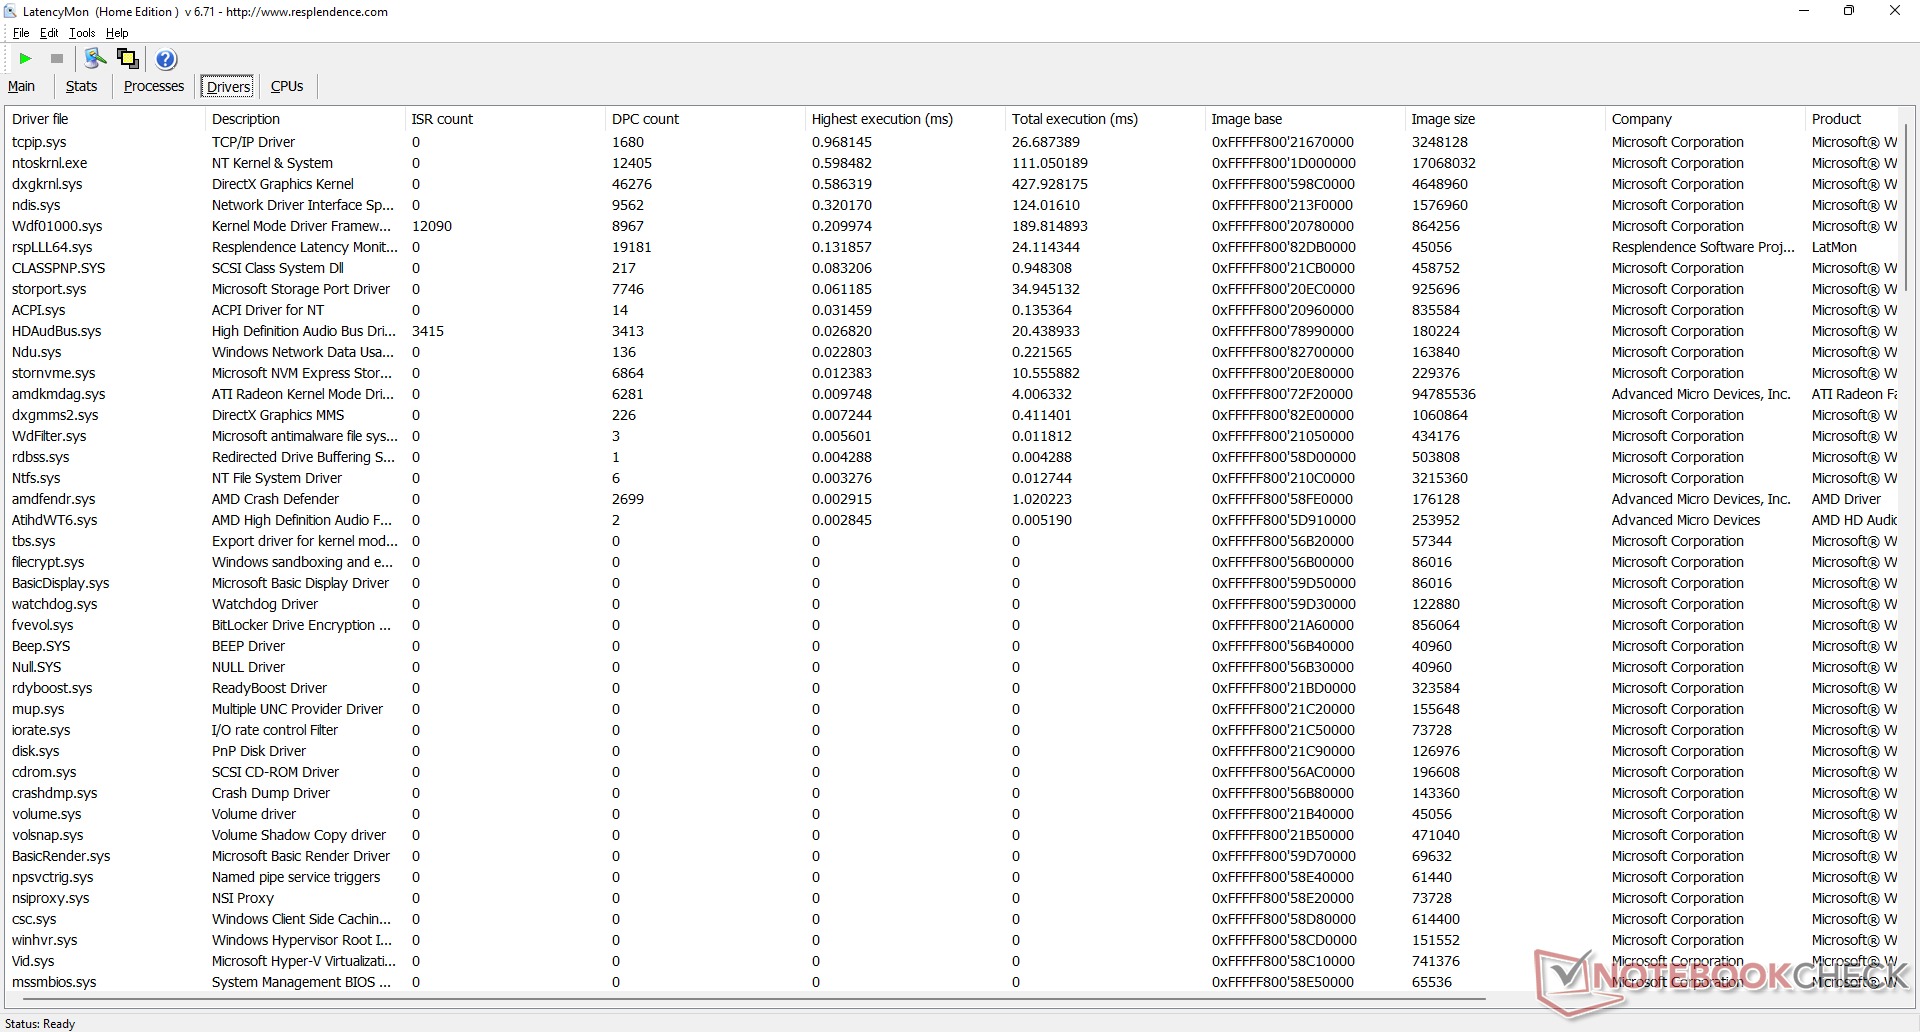
Latence DPC
LatencyMon révèle des problèmes de CPD lors de l'ouverture de plusieurs onglets de navigateur de notre page d'accueil. la lecture de vidéos 4K à 60 FPS est autrement fluide avec seulement deux images perdues pendant notre vidéo de test d'une minute.
| DPC Latencies / LatencyMon - interrupt to process latency (max), Web, Youtube, Prime95 | |
| Beelink SER6 Pro | |
| Intel NUC11PHKi7C | |
| Intel NUC 12 Pro Kit NUC12WSKi7 | |
| Beelink GTR6 | |
| Beelink SEi11 Pro | |
* ... Moindre est la valeur, meilleures sont les performances
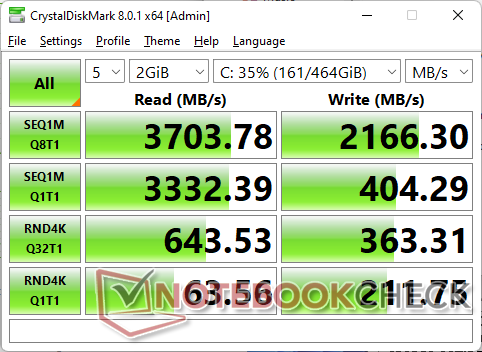
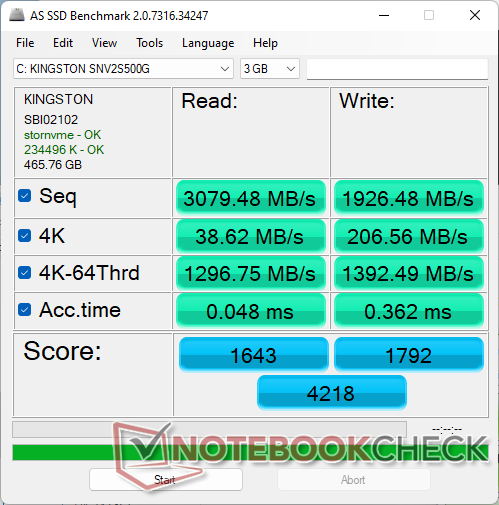
Périphériques de stockage
le site Kingston SNV2S PCIe4 x4 de Kingston est un disque NVMe de milieu de gamme avec des taux de lecture séquentielle d'environ 3700 Mo/s et 2200 Mo/s, respectivement, contre 5000 Mo/s ou plus avec des alternatives comme le Samsung PM9A1. Le disque entre en contact avec une plaque métallique interne sous l'emplacement SATA III de 2,5 pouces pour la dissipation de la chaleur.

| Drive Performance rating - Percent | |
| Beelink GTR6 | |
| Beelink SER6 Pro | |
| Intel Hades Canyon NUC8i7HVK -8! | |
| Intel NUC11PHKi7C | |
| Beelink SEi11 Pro | |
| Intel NUC 12 Pro Kit NUC12WSKi7 | |
* ... Moindre est la valeur, meilleures sont les performances
Disk Throttling: DiskSpd Read Loop, Queue Depth 8
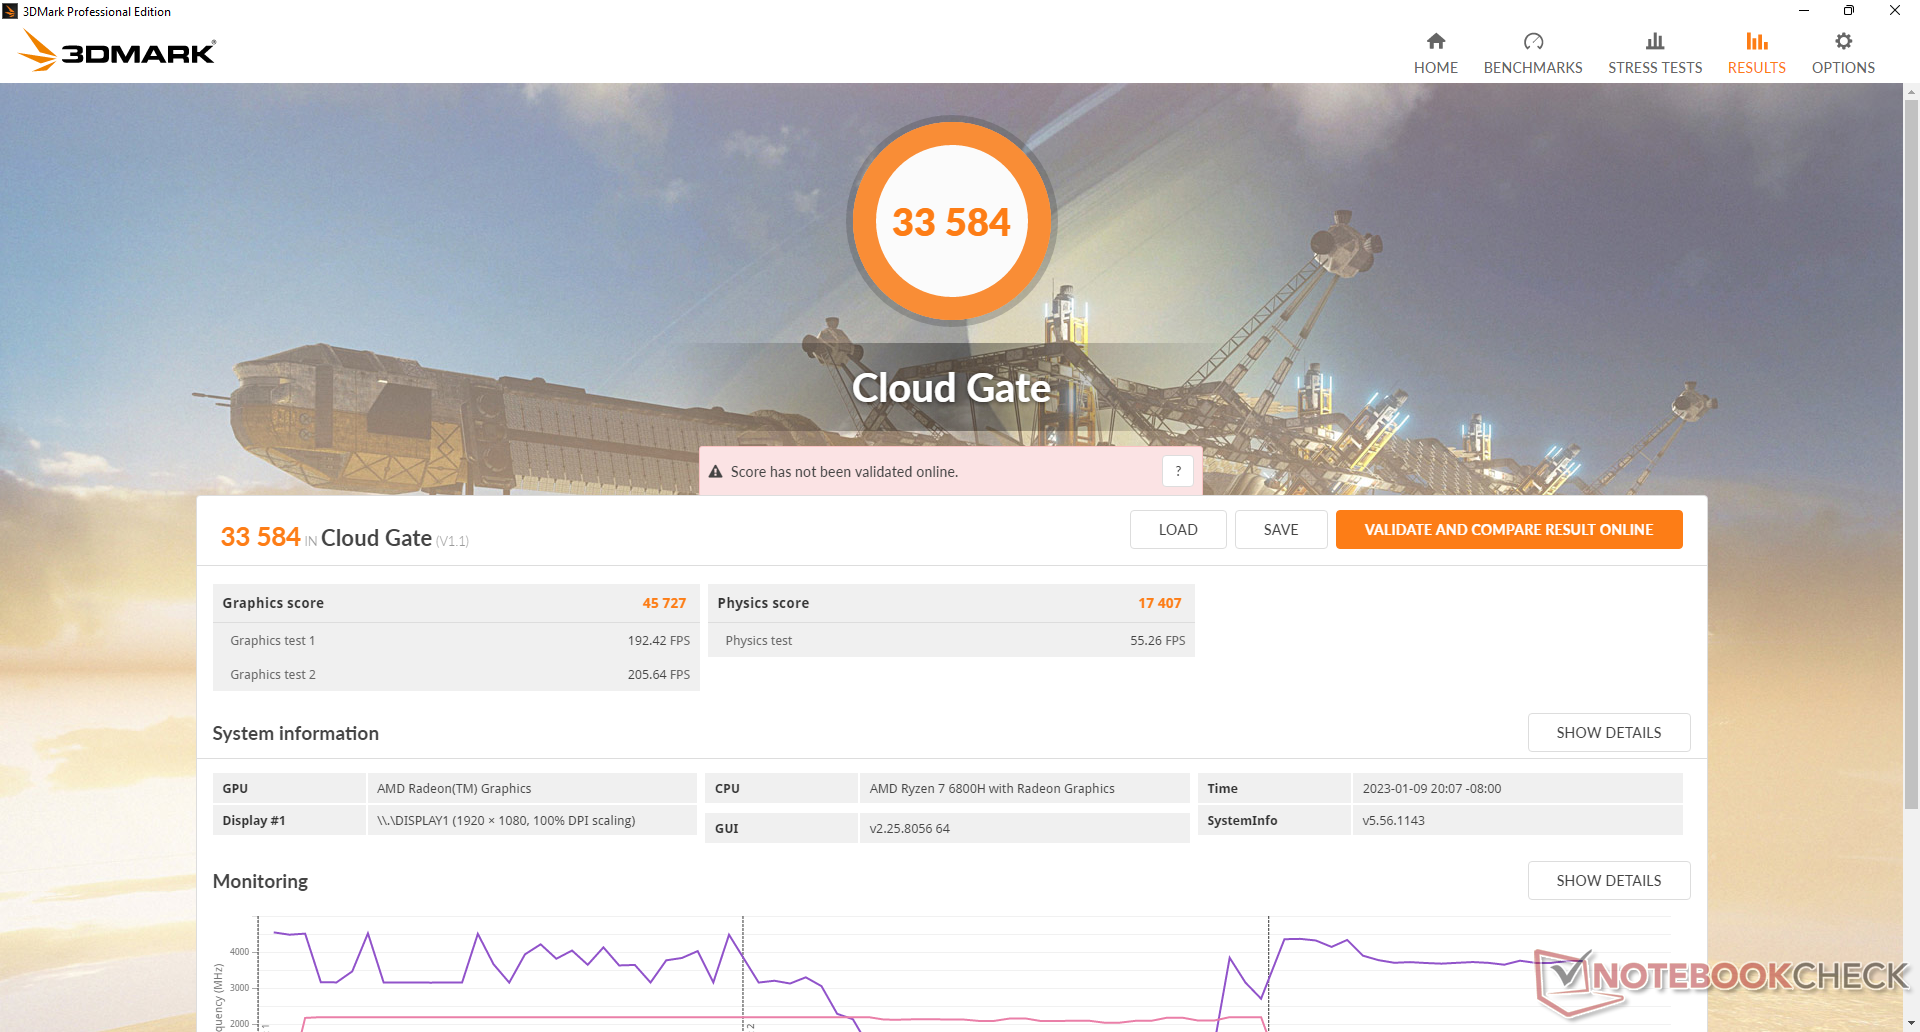
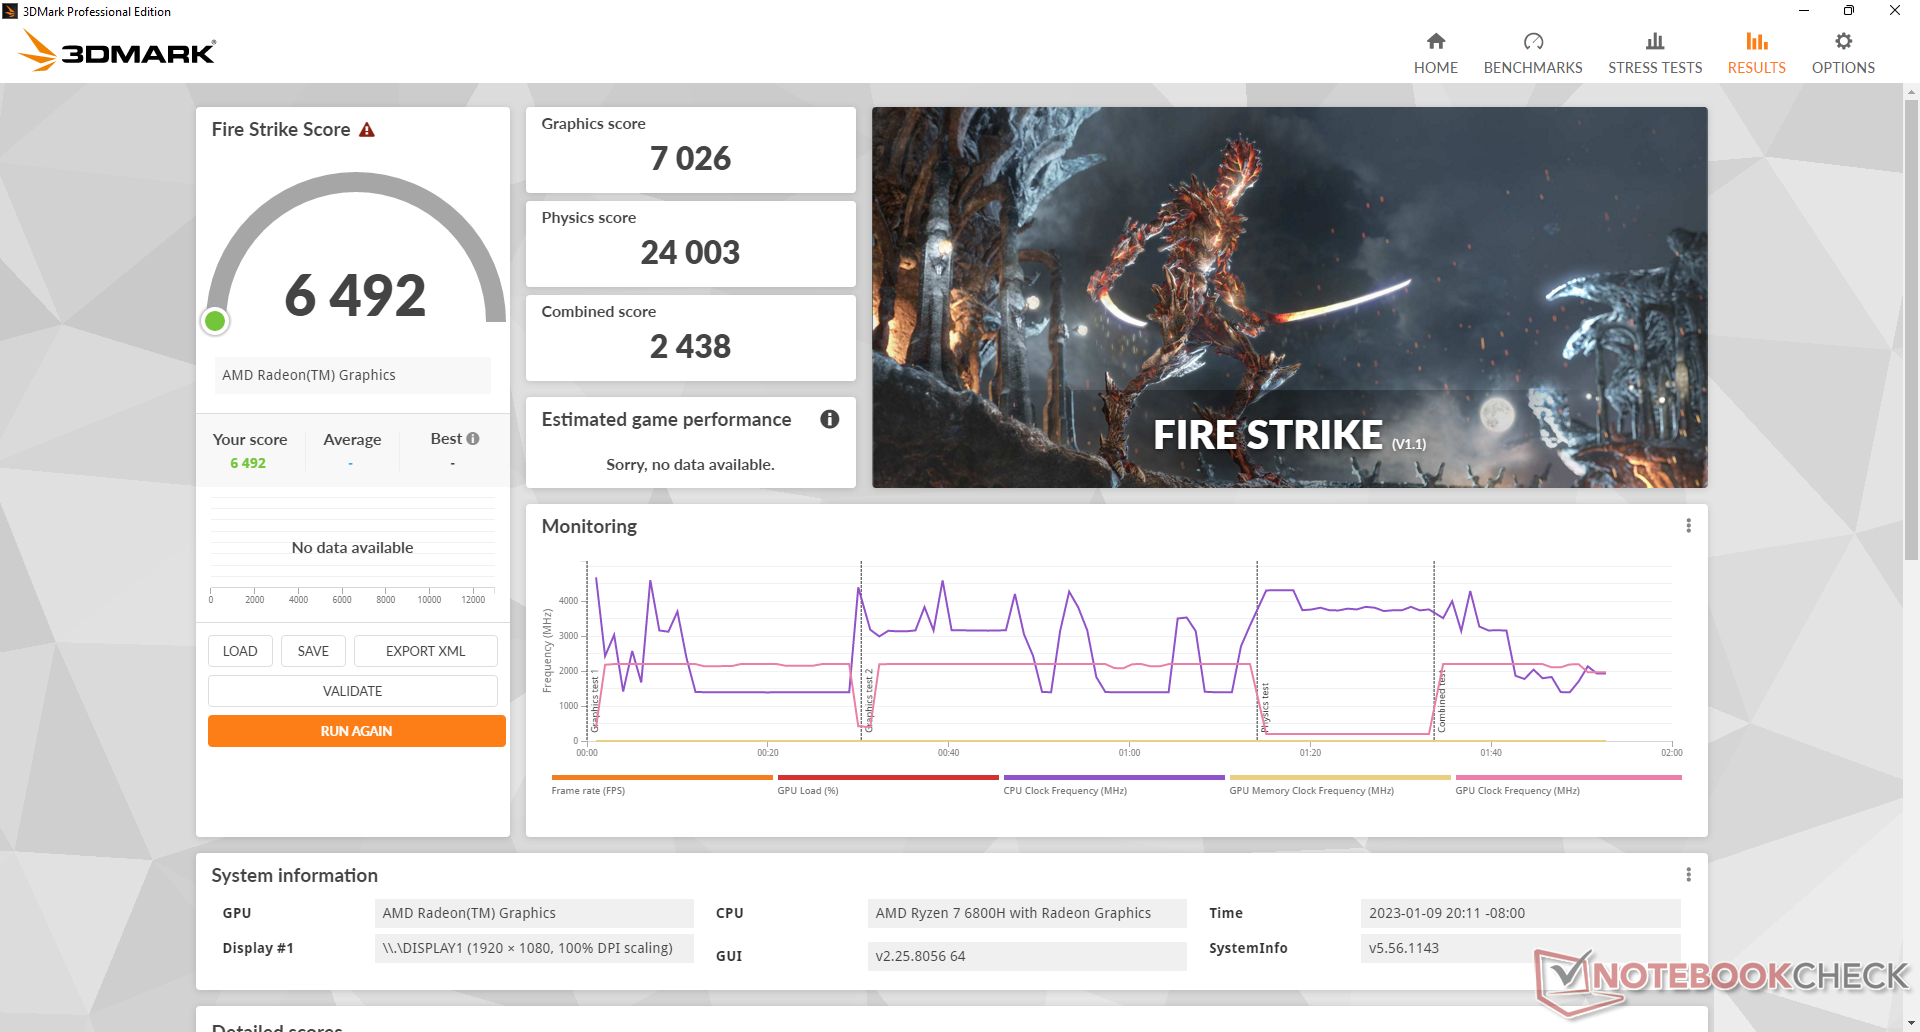
Performances du GPU
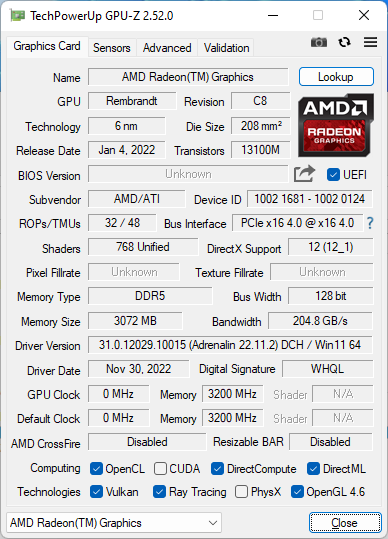
La carte intégrée Radeon 680M intégré est une mise à niveau significative par rapport à la génération précédente de Radeon RX Vega 7 ou Vega 8 que l'on trouve sur le Ryzen 5 5600H ou le Ryzen 7 5800H, respectivement. Les performances brutes sont 70 à 100 % plus rapides pour une expérience de jeu nettement meilleure. Cela ne veut pas dire que le SER6 Pro est une machine de jeu, car il est toujours deux fois plus lent qu'un ordinateur portable équipé de la technologie GeForce Ordinateur portable équipé d'une RTX 2060mais il a toujours assez de puissance pour faire tourner la plupart des jeux confortablement à 1080p avec des réglages bas à bas-moyens.
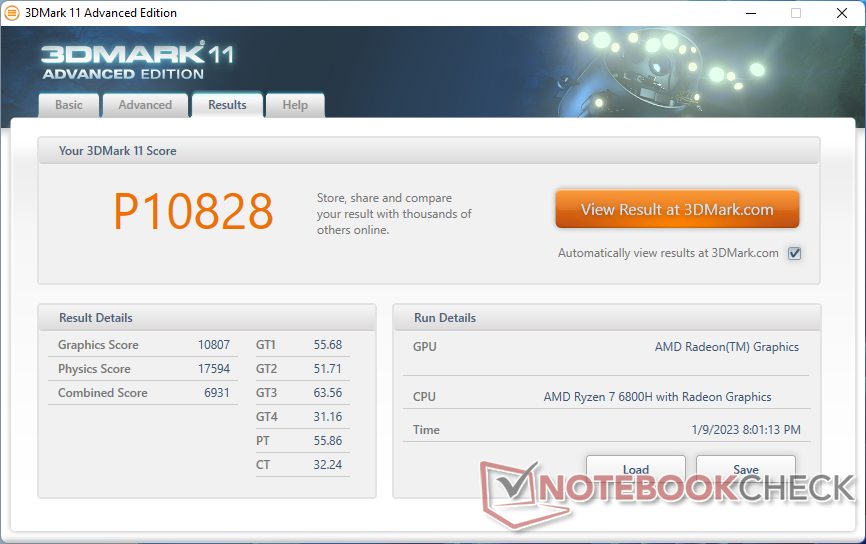
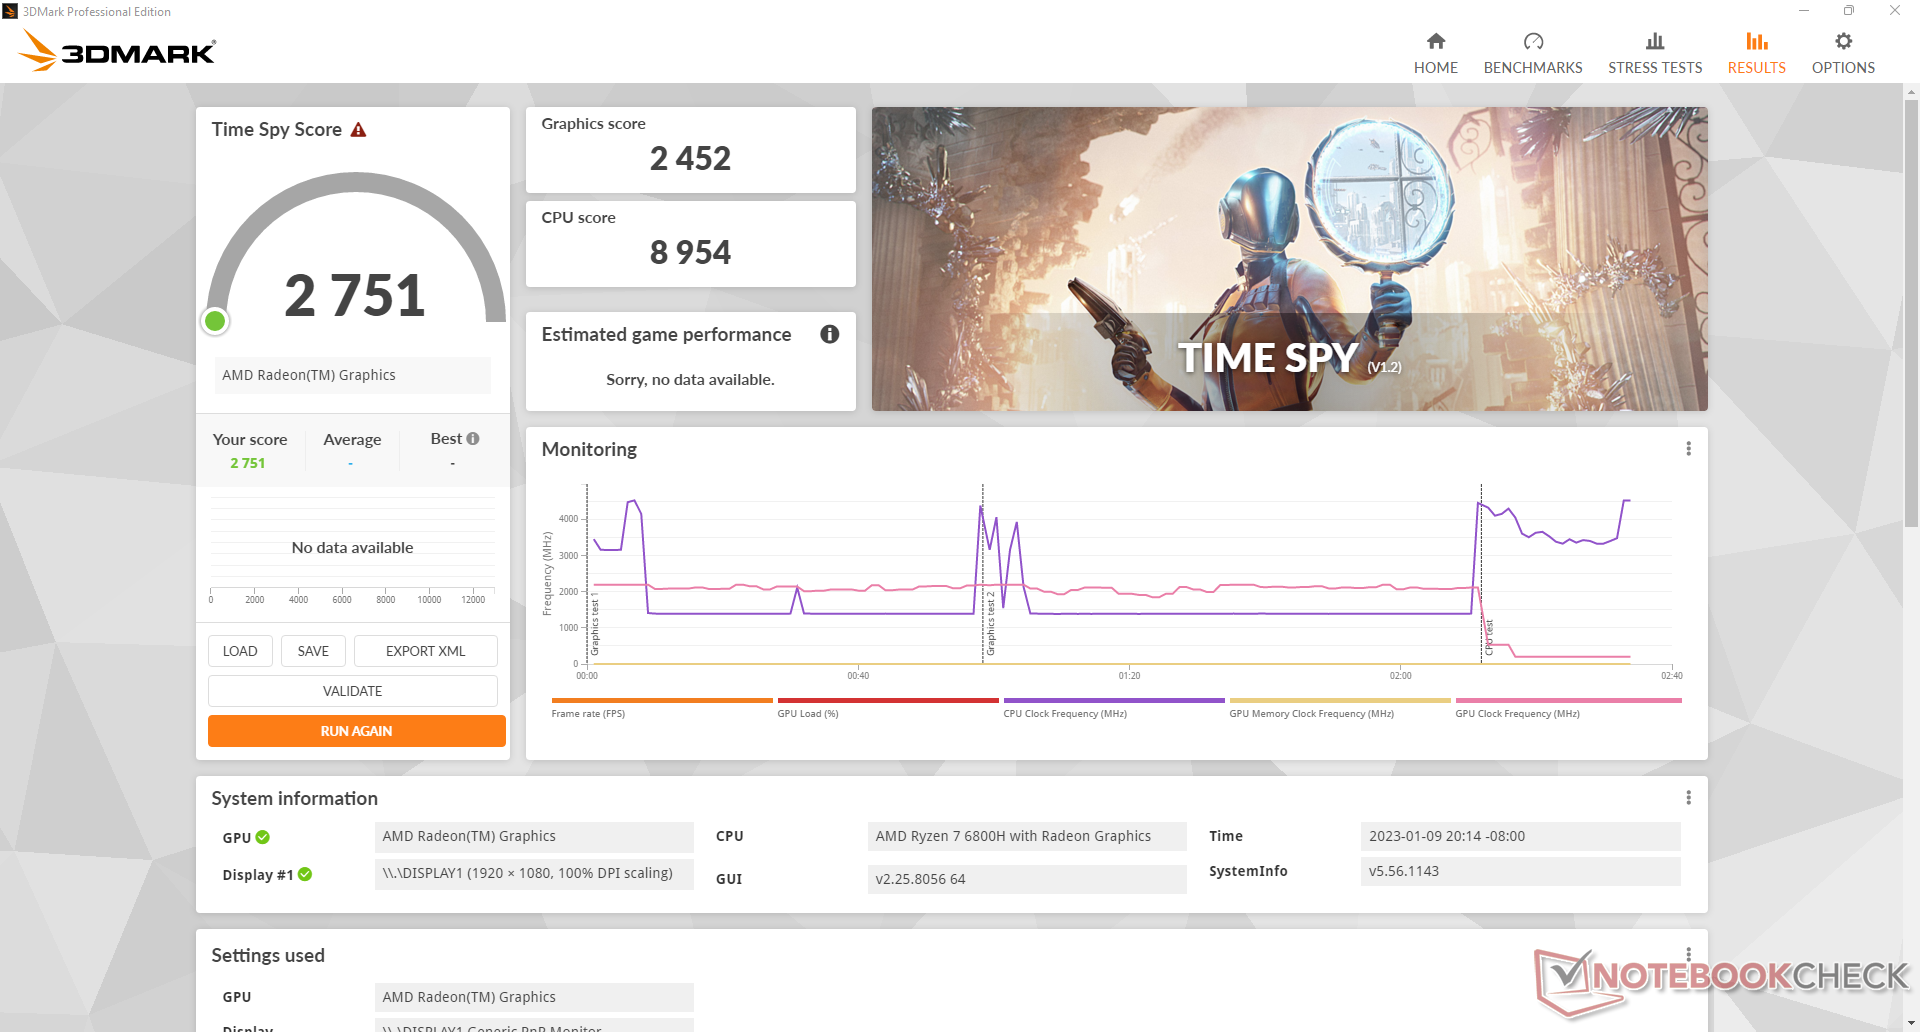
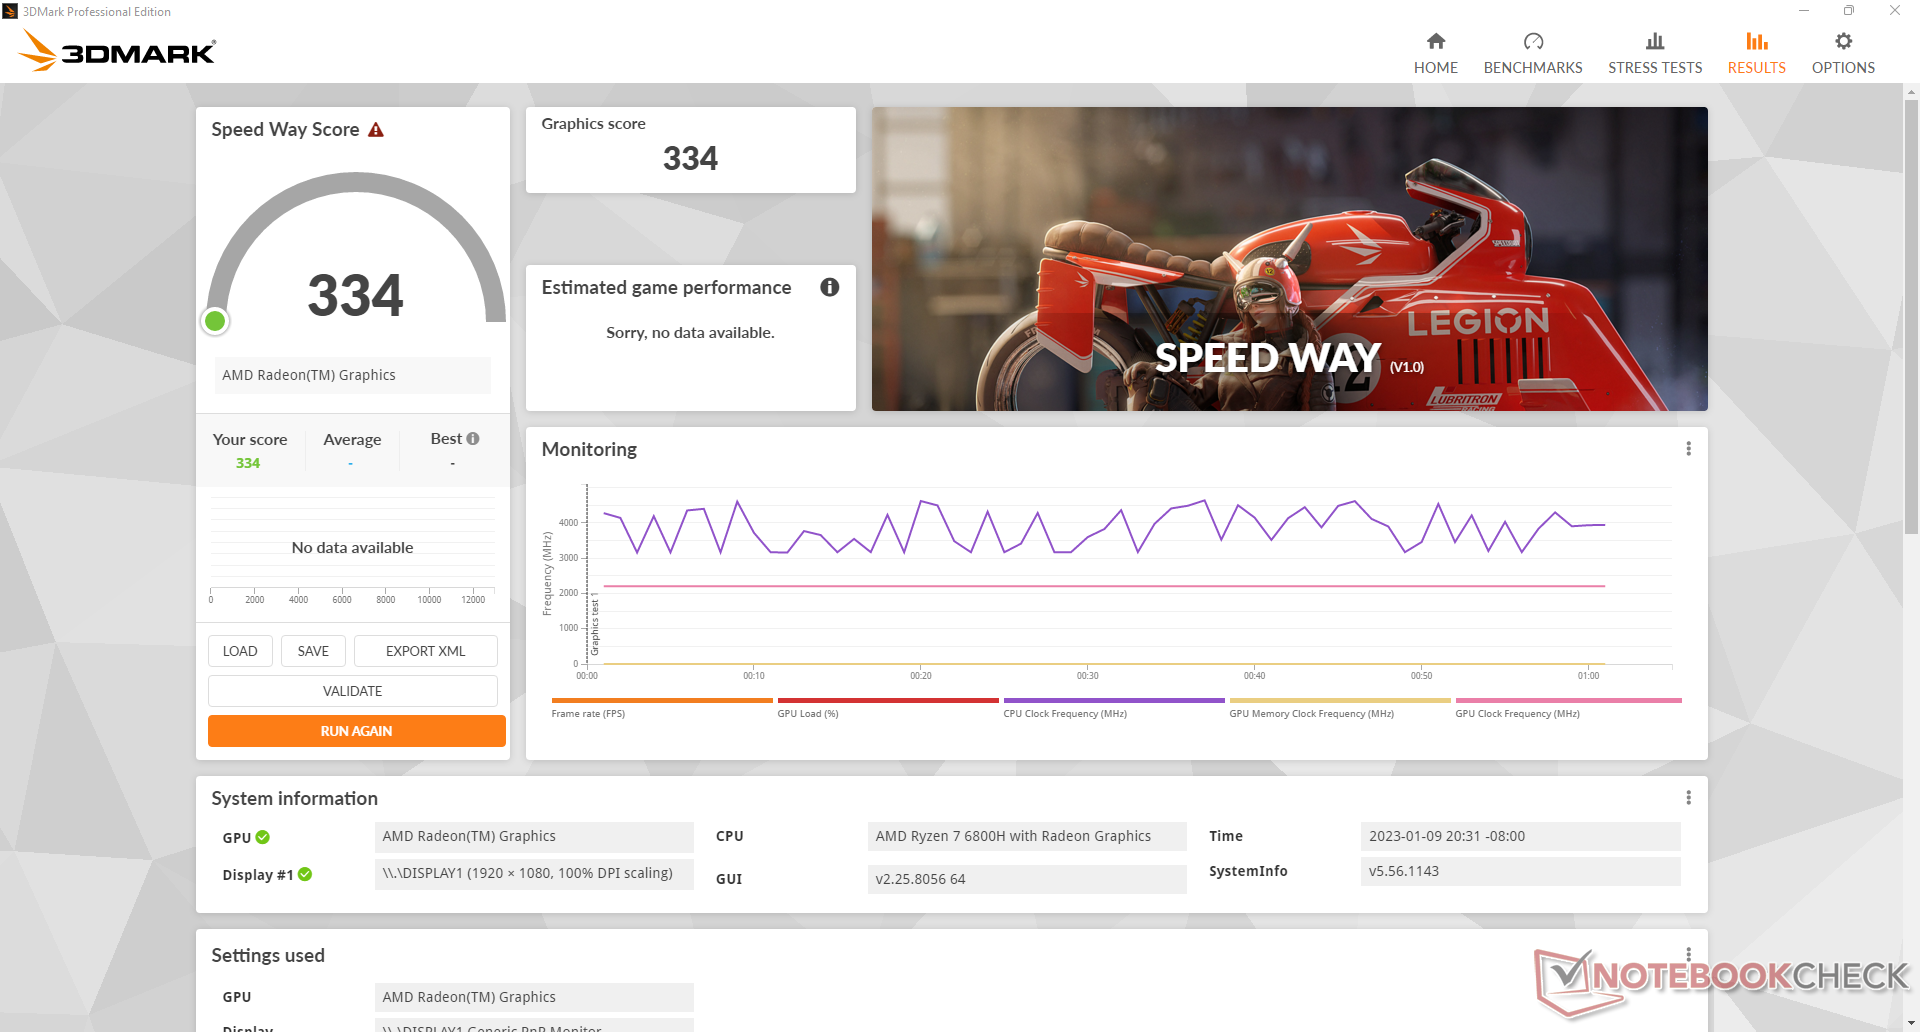
| 3DMark 11 Performance | 10825 points | |
| 3DMark Cloud Gate Standard Score | 33584 points | |
| 3DMark Fire Strike Score | 6492 points | |
| 3DMark Time Spy Score | 2751 points | |
Aide | ||
* ... Moindre est la valeur, meilleures sont les performances
Notre unité présentait des problèmes de maintien de la fréquence d'images. Lorsqu'il tourne au ralenti sur Witcher 3les taux d'images passaient périodiquement de ~80 FPS à ~70 FPS sans raison apparente. Nous avons même connu une chute jusqu'à 18 FPS comme le montre le graphique ci-dessous. Cette instabilité suggère une interruption de l'activité en arrière-plan ou une mauvaise gestion des applications en arrière-plan.
Witcher 3 FPS Chart
| Bas | Moyen | Élevé | Ultra | |
|---|---|---|---|---|
| GTA V (2015) | 152.3 | 139.7 | 51.9 | 23.7 |
| The Witcher 3 (2015) | 138.1 | 85.1 | 43.3 | 27 |
| Dota 2 Reborn (2015) | 143.3 | 113.4 | 83.9 | 73.1 |
| Final Fantasy XV Benchmark (2018) | 68.1 | 34.7 | 24.6 | |
| X-Plane 11.11 (2018) | 66.4 | 52.9 | 43 | |
| Strange Brigade (2018) | 141.9 | 57.8 | 48.6 | 41.9 |
| Cyberpunk 2077 1.6 (2022) | 43.3 | 33.1 | 21.3 | 17.2 |
Émissions
Bruit du système
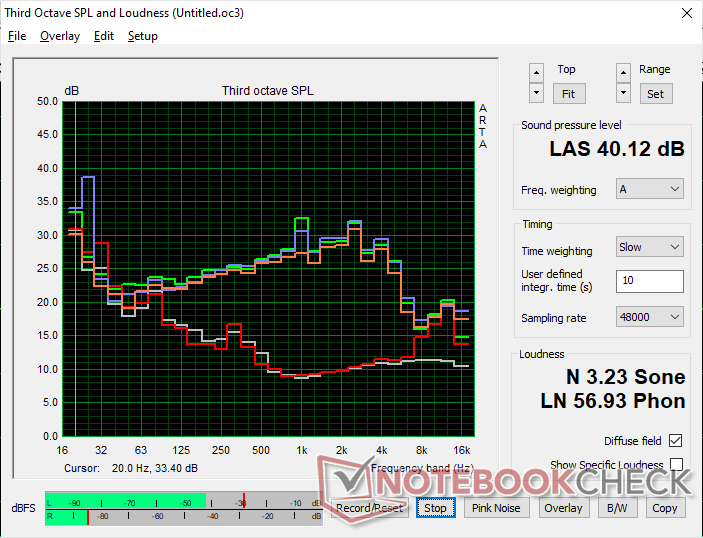
Les ventilateurs internes sont sensibles aux charges à l'écran. Lors de la navigation sur le Web ou de la diffusion de vidéos en continu, par exemple, le bruit du ventilateur peut occasionnellement atteindre 33 dB(A) pendant de courtes périodes. Le bruit du ventilateur atteint également son maximum d'environ 40 dB(A) plus rapidement que sur la plupart des autres mini-PC.
Nous avons ressenti un léger bruit électronique ou un grincement de bobine sur notre unité de test. Ainsi, nous avons pu enregistrer un bruit de 24,1 dB(A) contre un fond silencieux de 22,8 dB(A) même lorsque le ventilateur était au repos.
Degré de la nuisance sonore
| Au repos |
| 24.1 / 24.1 / 33.8 dB(A) |
| Fortement sollicité |
| 40.1 / 40.1 dB(A) |
 | ||
30 dB silencieux 40 dB(A) audible 50 dB(A) bruyant |
||
min: | ||
| Beelink SER6 Pro Radeon 680M, R7 6800H, Kingston NV2 500GB SNV2S/500G | Beelink GTR6 Radeon 680M, R9 6900HX, Kingston KC3000 512G SKC3000S512G | Beelink SEi11 Pro Iris Xe G7 96EUs, i5-11320H, Kingston NV1 SNVS/500GCN | Intel NUC 12 Pro Kit NUC12WSKi7 Iris Xe G7 96EUs, i7-1260P, Transcend M.2 SSD 2200S TS512GMTE220S | Intel NUC11PHKi7C GeForce RTX 2060 Mobile, i7-1165G7, Samsung SSD 980 Pro 500GB MZ-V8P500BW | Intel Hades Canyon NUC8i7HVK Vega M GH, i7-8809G, Intel Optane 120 GB SSDPEK1W120GA | |
|---|---|---|---|---|---|---|
| Noise | -3% | 8% | -18% | -1% | -11% | |
| arrêt / environnement * (dB) | 22.8 | 23.2 -2% | 22.8 -0% | 30.4 -33% | 24.5 -7% | 28.7 -26% |
| Idle Minimum * (dB) | 24.1 | 23.6 2% | 24.7 -2% | 33.1 -37% | 25.3 -5% | 29 -20% |
| Idle Average * (dB) | 24.1 | 23.8 1% | 24.7 -2% | 33.1 -37% | 25.3 -5% | 29 -20% |
| Idle Maximum * (dB) | 33.8 | 36.2 -7% | 25.3 25% | 33.1 2% | 25.3 25% | 29 14% |
| Load Average * (dB) | 40.1 | 39.7 1% | 33.2 17% | 38.1 5% | 36.4 9% | 36 10% |
| Witcher 3 ultra * (dB) | 38.7 | 41 -6% | 34.5 11% | 39.7 -3% | 42 -9% | |
| Load Maximum * (dB) | 40.1 | 43 -7% | 37.8 6% | 43.6 -9% | 47.9 -19% | 49.4 -23% |
* ... Moindre est la valeur, meilleures sont les performances
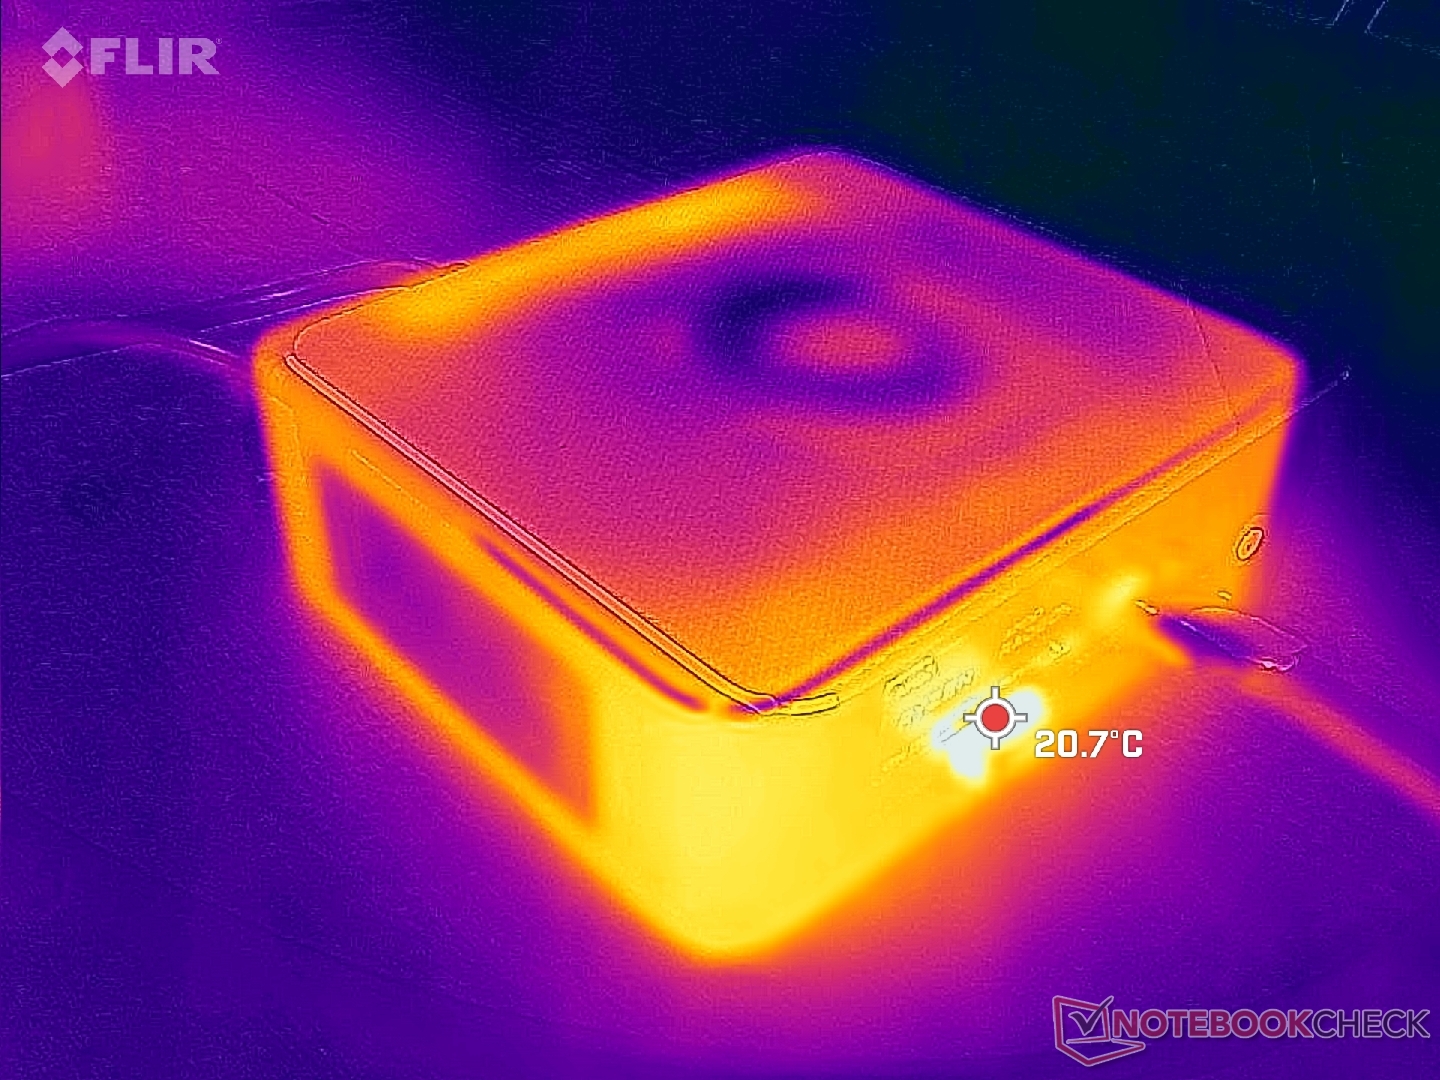
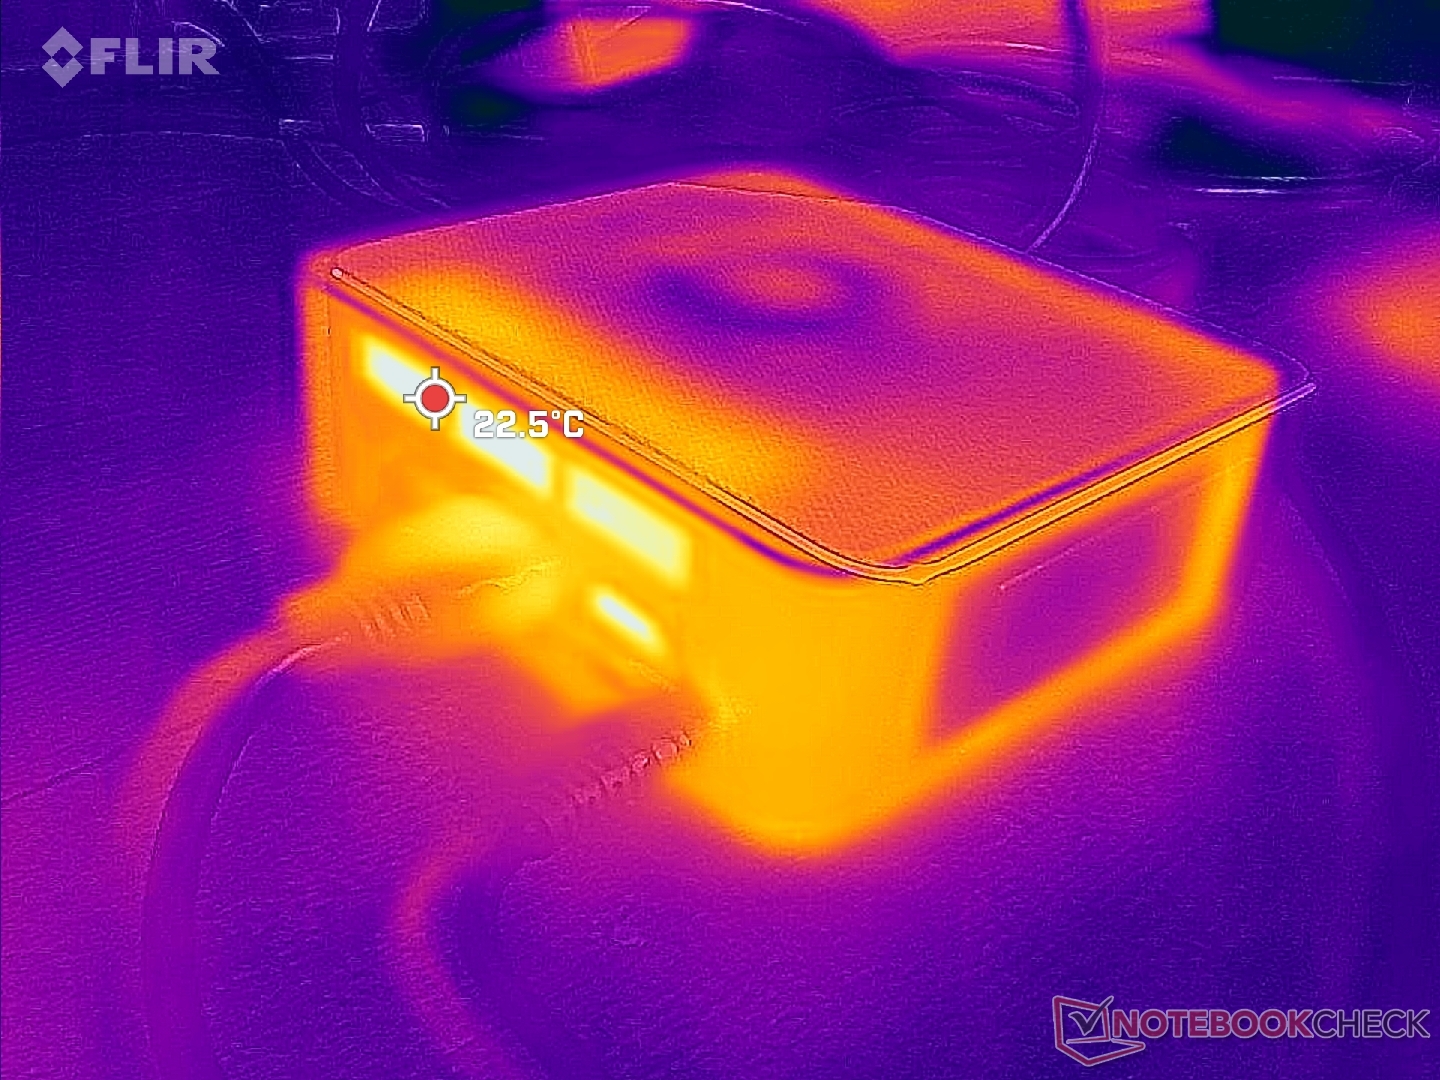
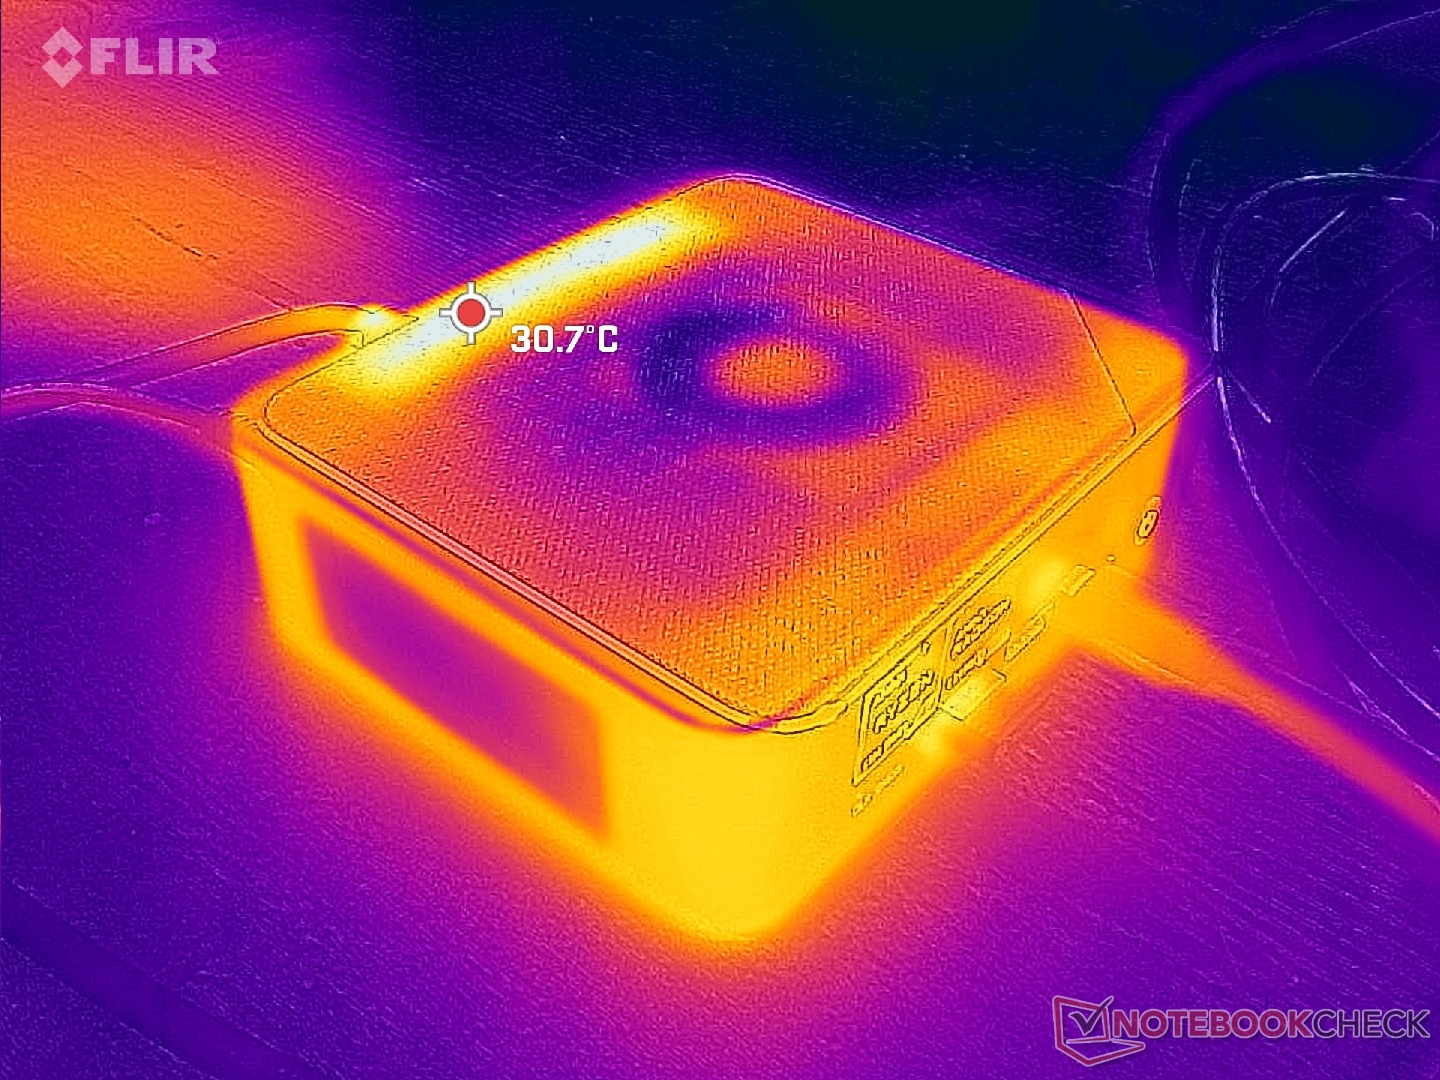
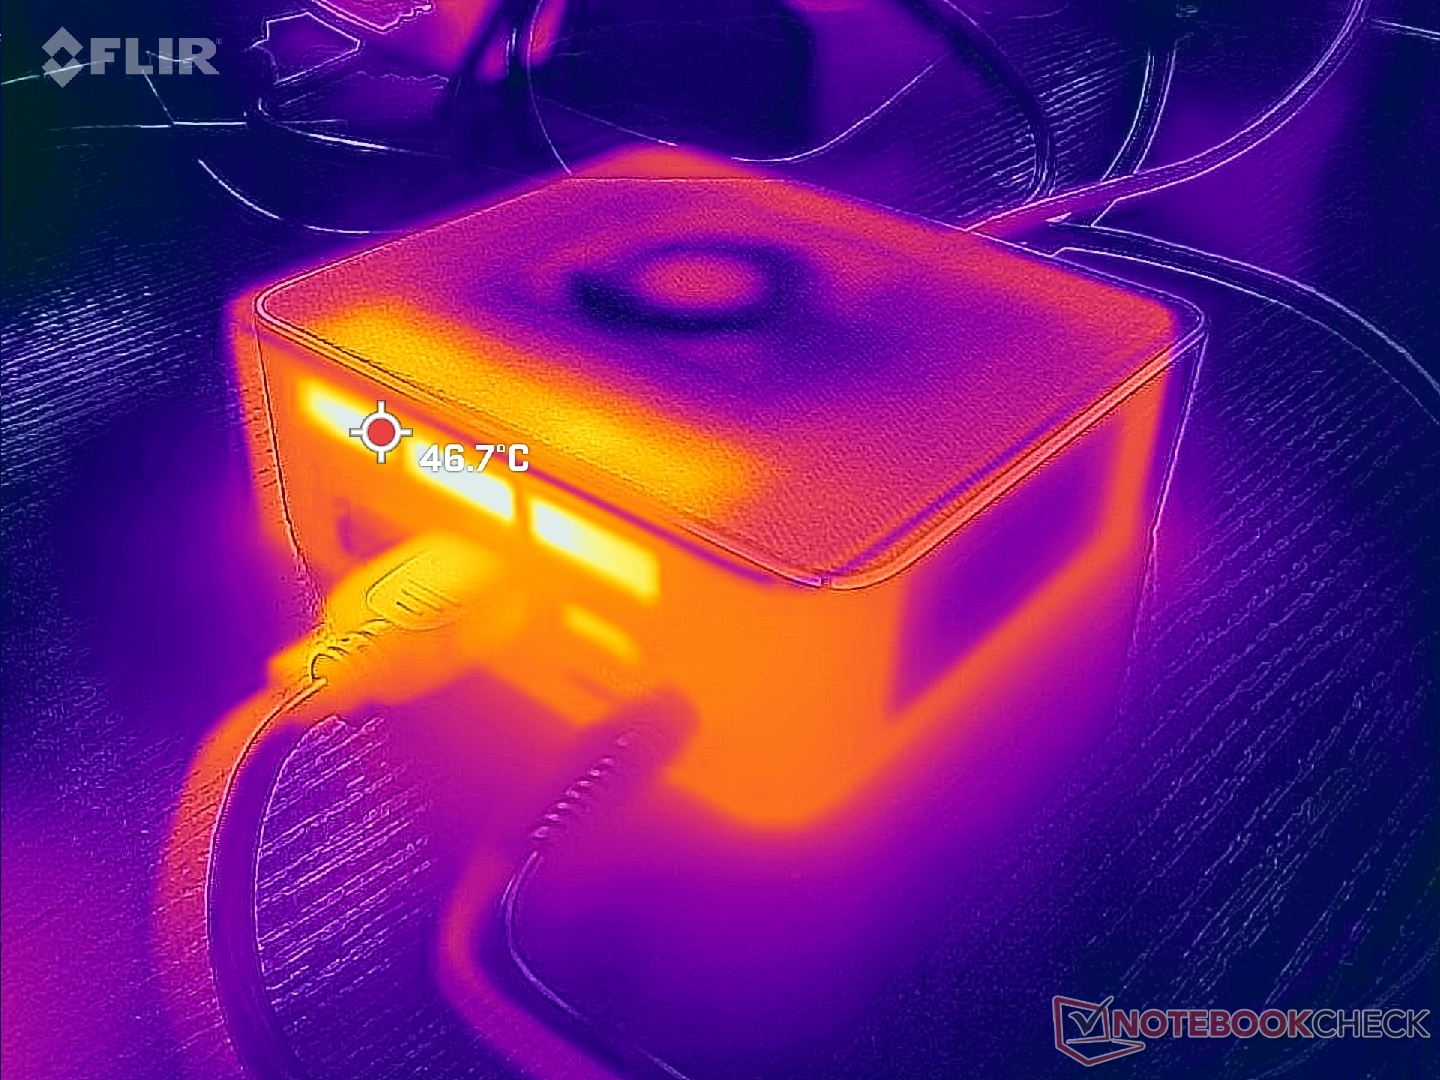
Température
Les températures de surface ne sont pas un problème. Contrairement à de nombreux autres mini-PC, le SER6 Pro intègre deux ventilateurs pour un meilleur potentiel de refroidissement. L'air frais entre par les côtés et le haut tandis que l'air chaud sort par l'arrière. Si vous placez des objets sur le dessus du mini PC ou si vous le positionnez verticalement, vous risquez d'entraver le flux d'air.
Test de stress
Lors de l'exécution de Prime95 pour stresser le CPU, les fréquences d'horloge et la consommation d'énergie de la carte ont augmenté jusqu'à 3,3 GHz et 45 W, respectivement, pendant quelques secondes seulement. Le CPU se stabilise ensuite rapidement à 3 GHz, 38 W, et 82 C par la suite. En répétant ce même test sur la carteBeelink SEi11 alimenté par le Core i5-11320H plus lent, on obtient une température centrale plus chaude de 89 C.
Lors de l'exécution Witcher 3 pour représenter les charges de jeu typiques, la fréquence d'horloge et la température du GPU se stabilisent à 1956 MHz et 70 C, respectivement, contre 83 C sur le SEi11. Le SER6 Pro n'est pas seulement plus rapide, mais il est aussi plus froid.
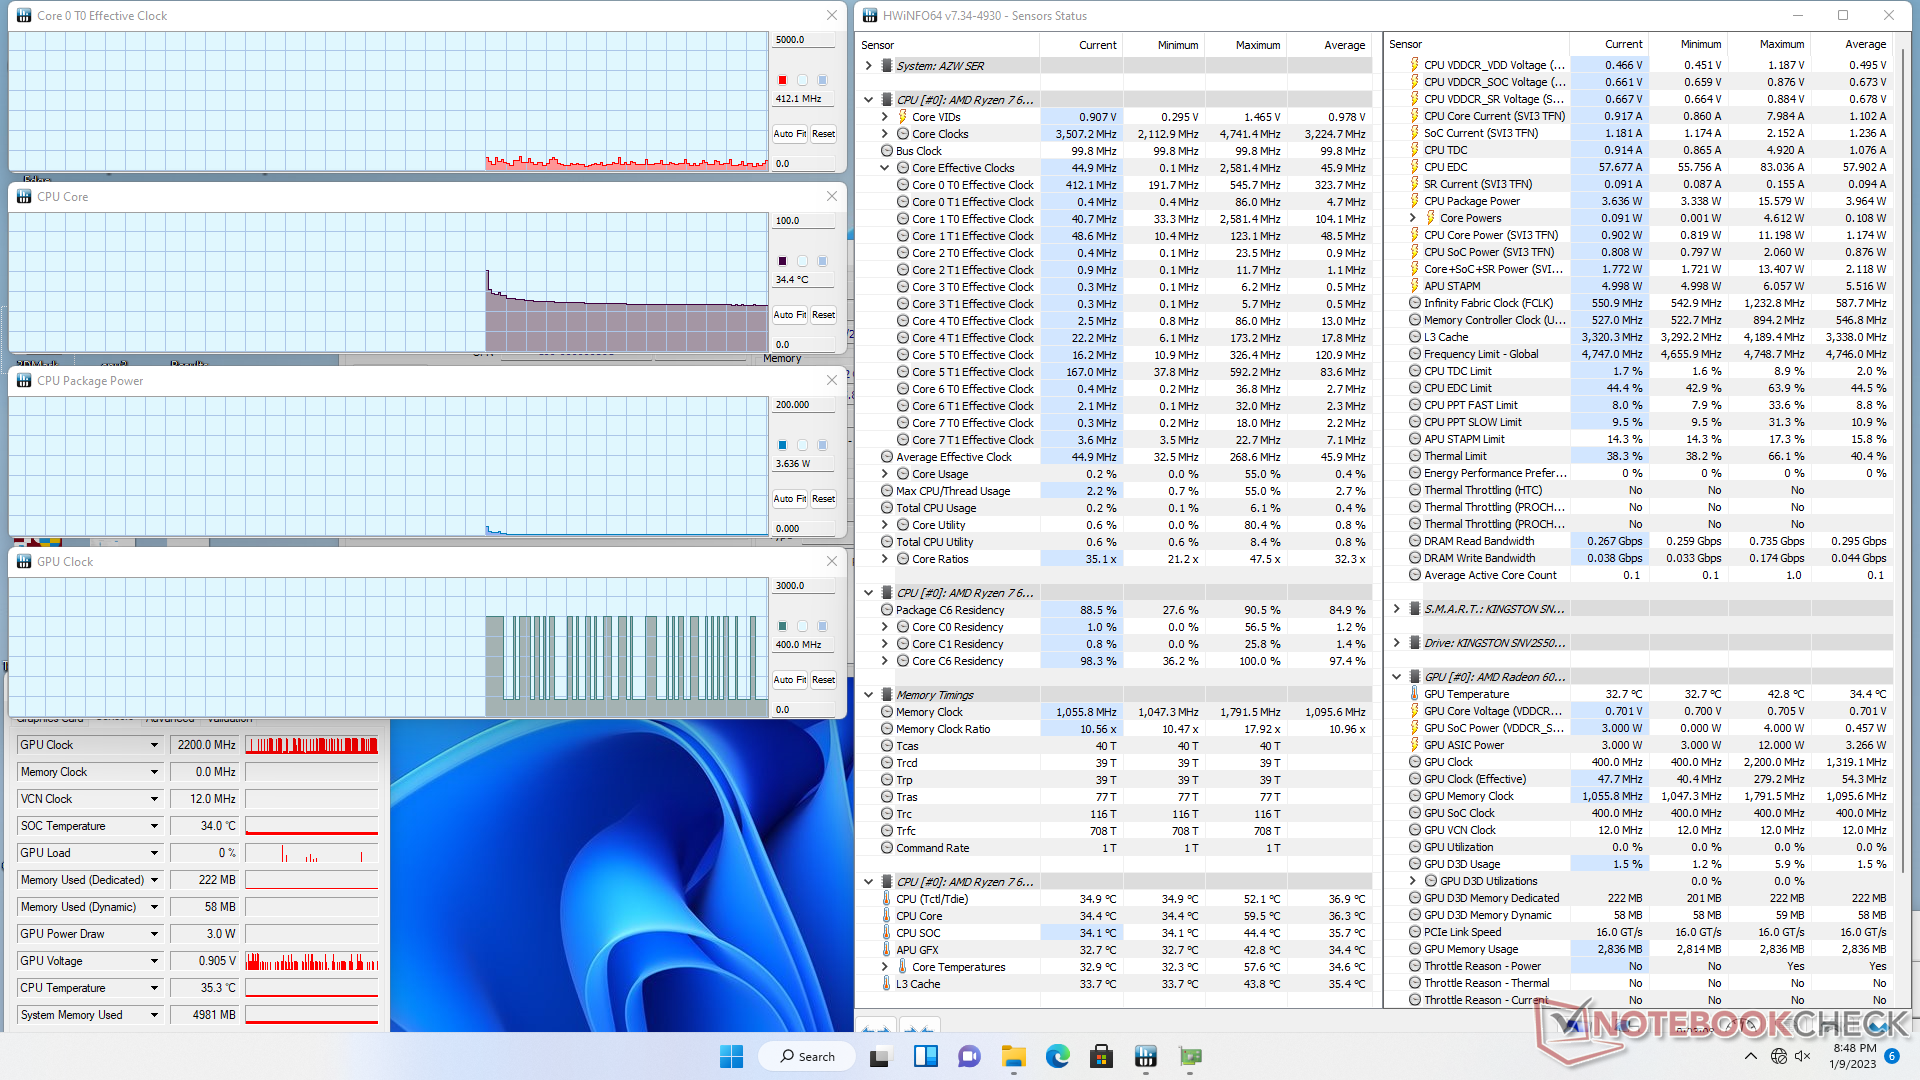
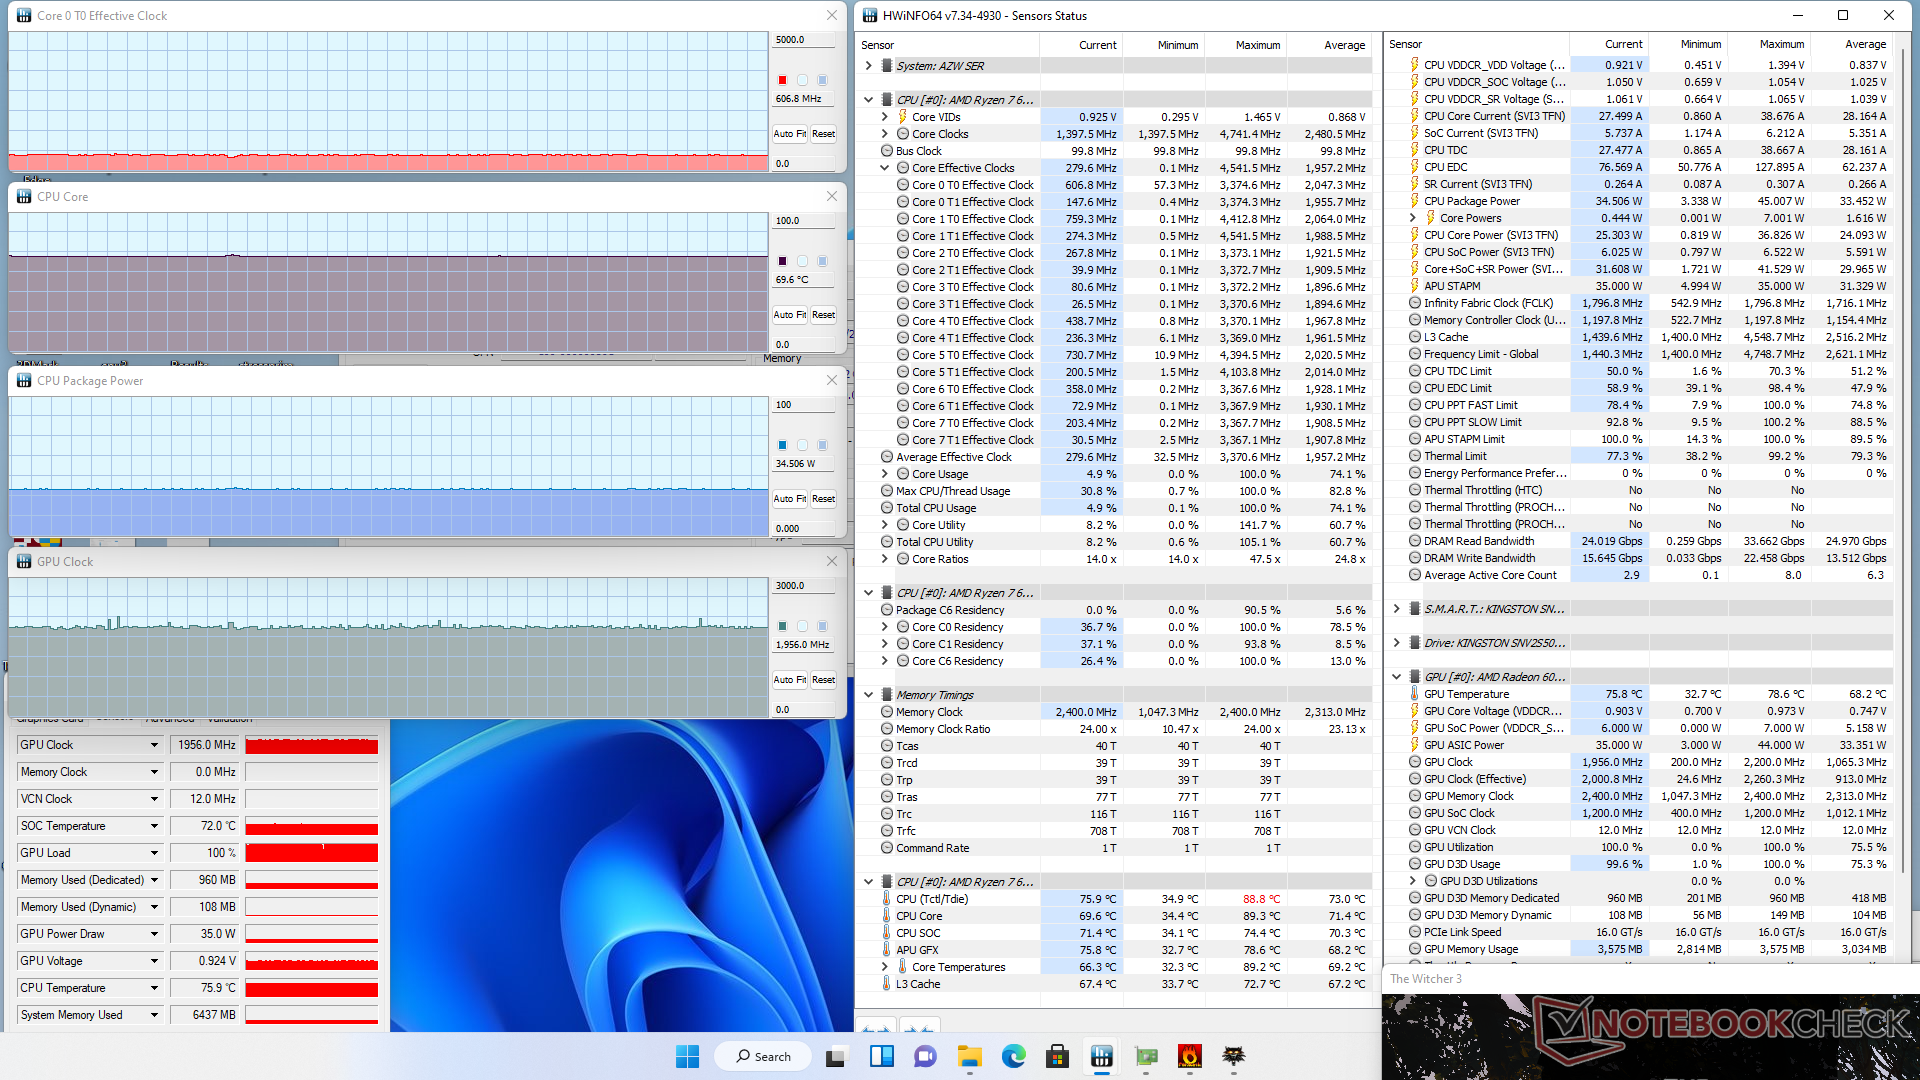
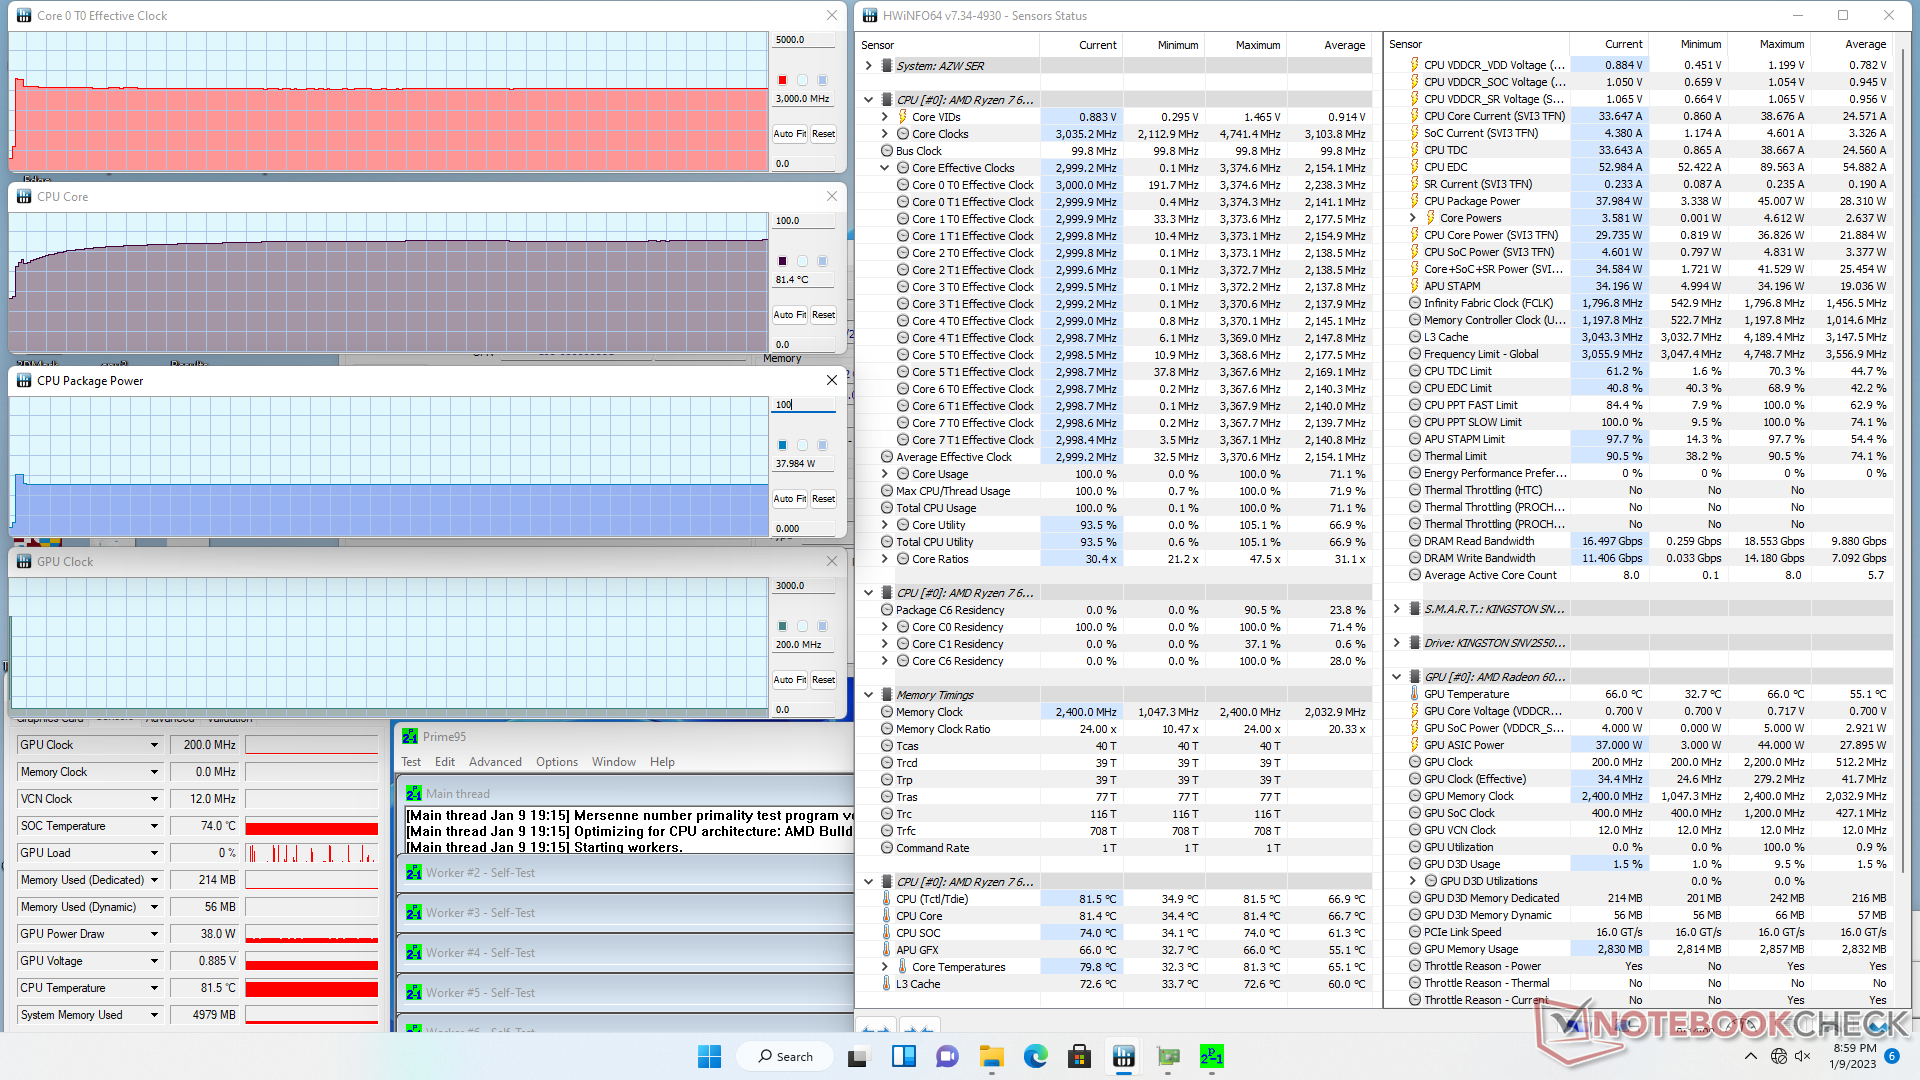
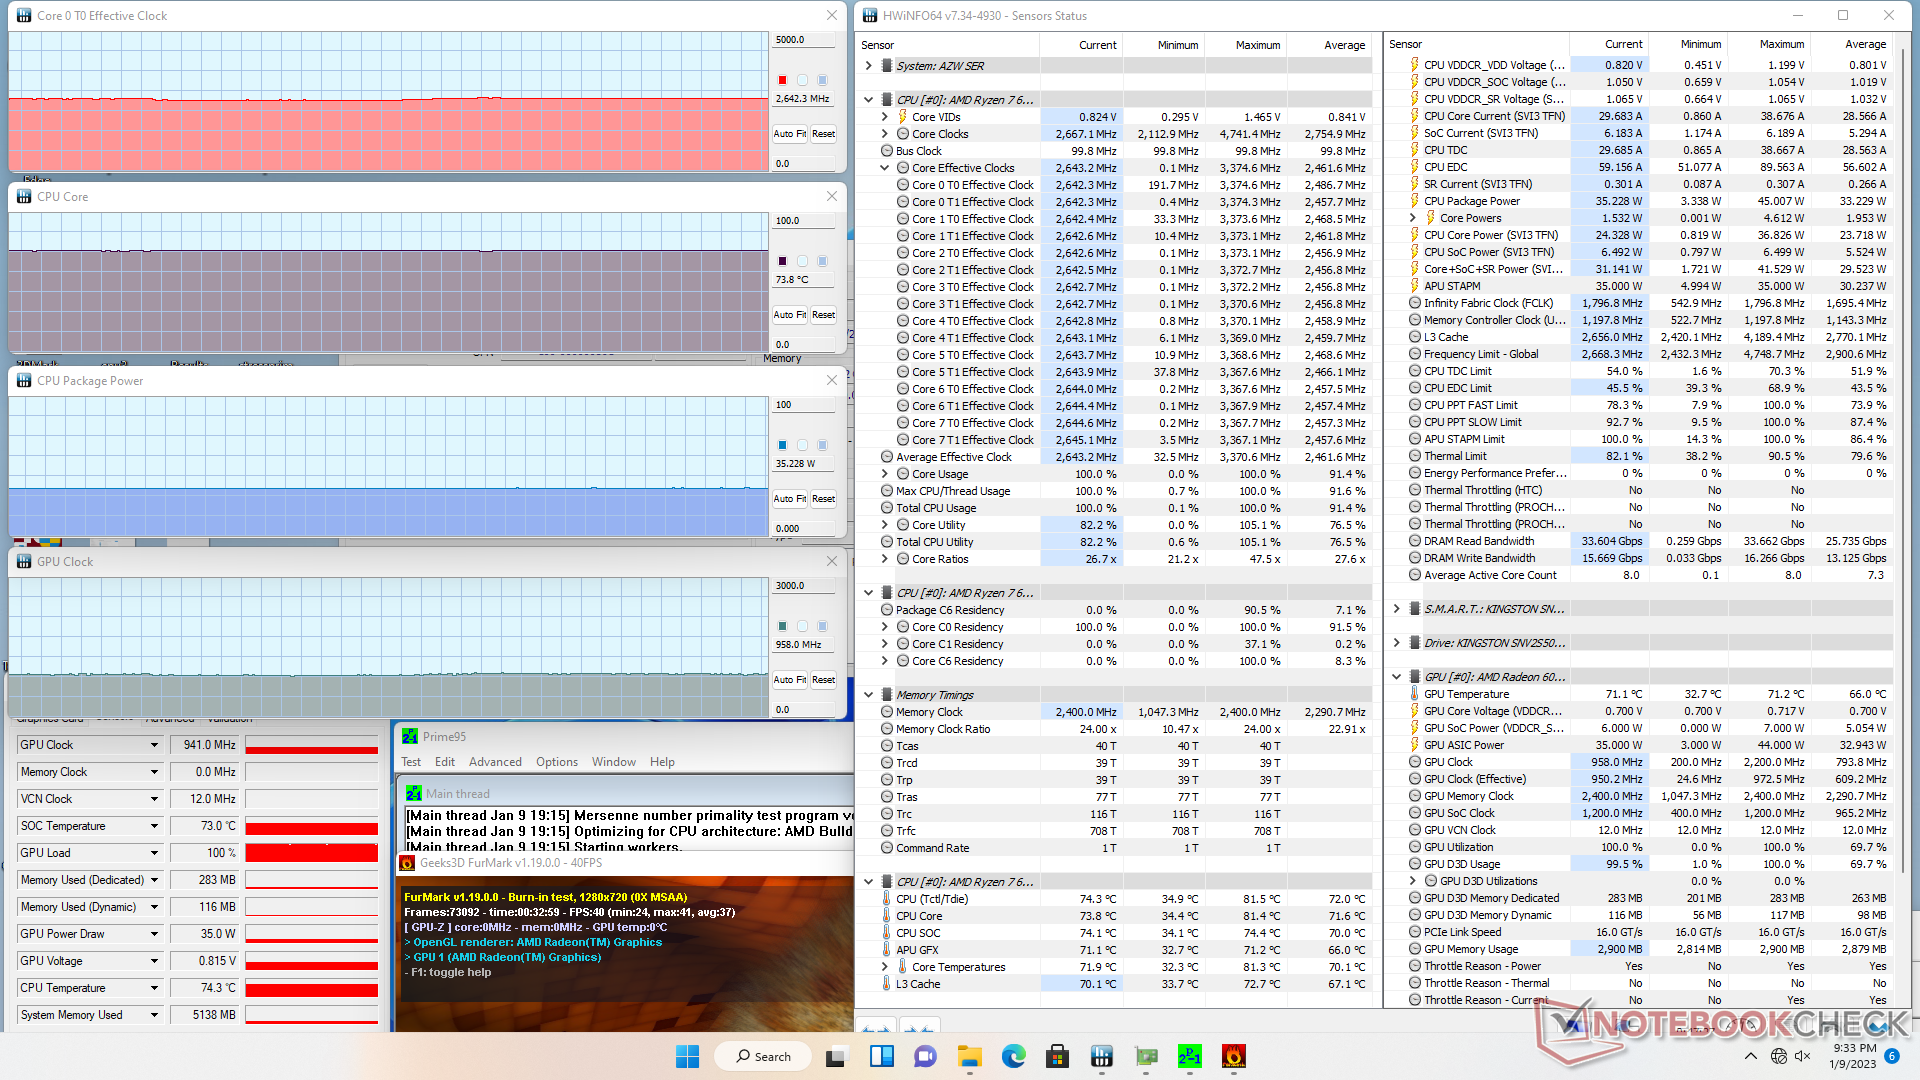
| Fréquence du CPU (GHz) | Fréquence du GPU (MHz) | Température moyenne du CPU (°C) | |
| Système au repos | -- | -- | 34 |
| Prime95 Stress | 3.0 | -- | 82 |
| Prime95 + FurMark Stress | 2.7 | 941 | 74 |
| Witcher 3 Stress | ~0.6 | 1956 | 70 |
Gestion de l'énergie
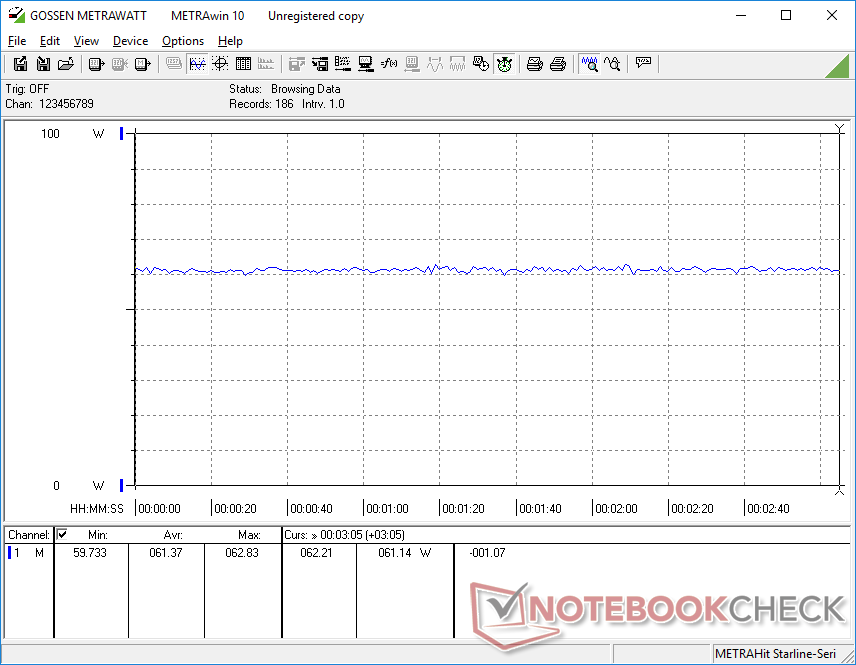
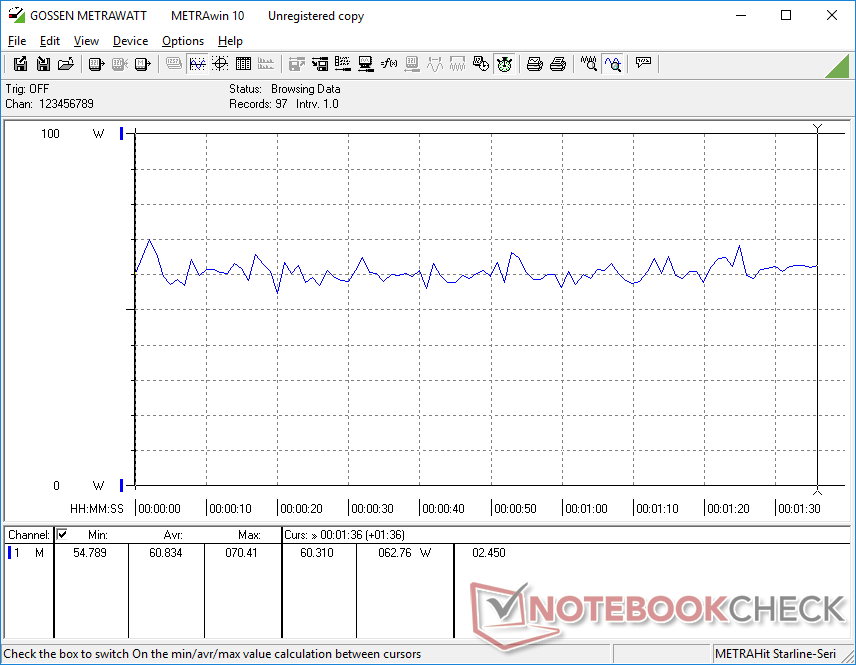
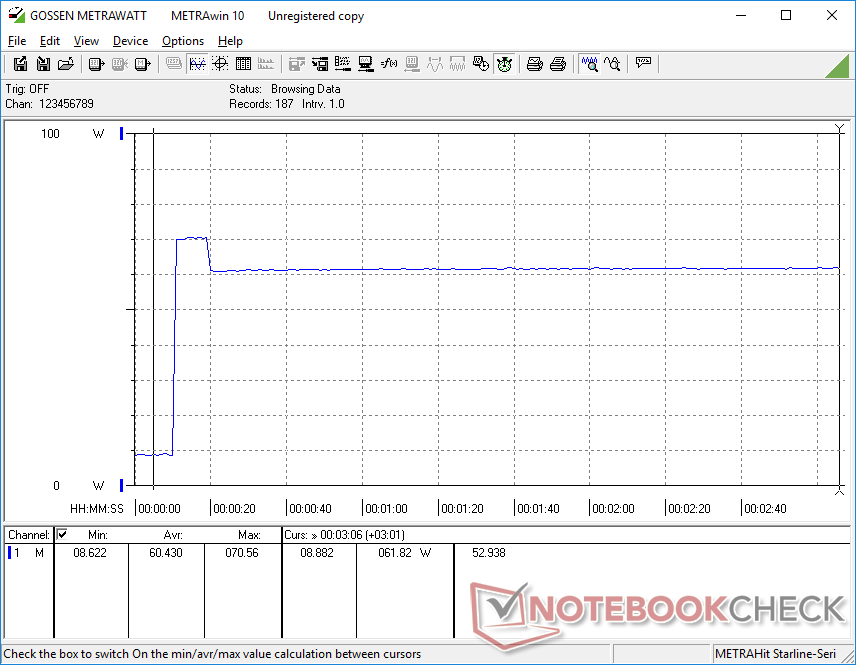
Consommation d'énergie
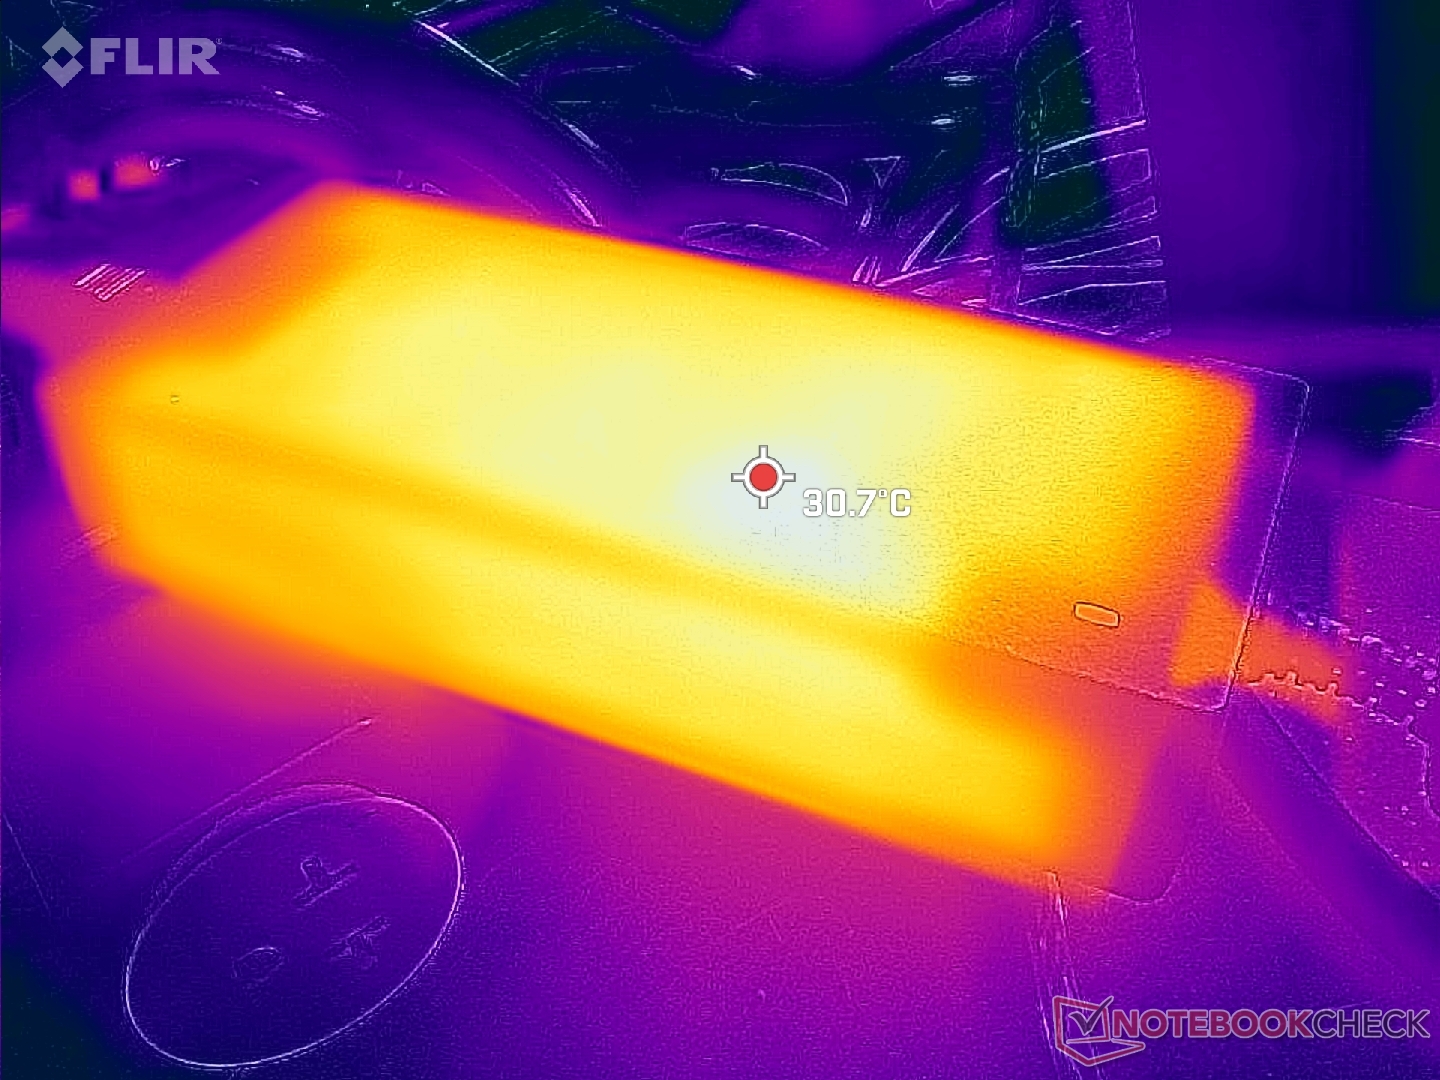
La consommation d'énergie pour les jeux est supérieure d'environ 33 % à celle du SER5 Pro fonctionnant sur la dernière génération de Ryzen 5 56H Ryzen 5 5600H et aussi légèrement plus élevée que le SEi11 Pro fonctionnant avec un CPU Intel Core H-series de 12ème génération. Si l'on considère que notre Radeon 680M peut offrir jusqu'à deux fois les performances de la Radeon RX Vega 7, la consommation d'énergie plus élevée en vaut certainement la peine. La marche au ralenti sur un ordinateur de bureau consomme toujours autant d'énergie que sur le modèle de l'année dernière, malgré les graphiques améliorés.
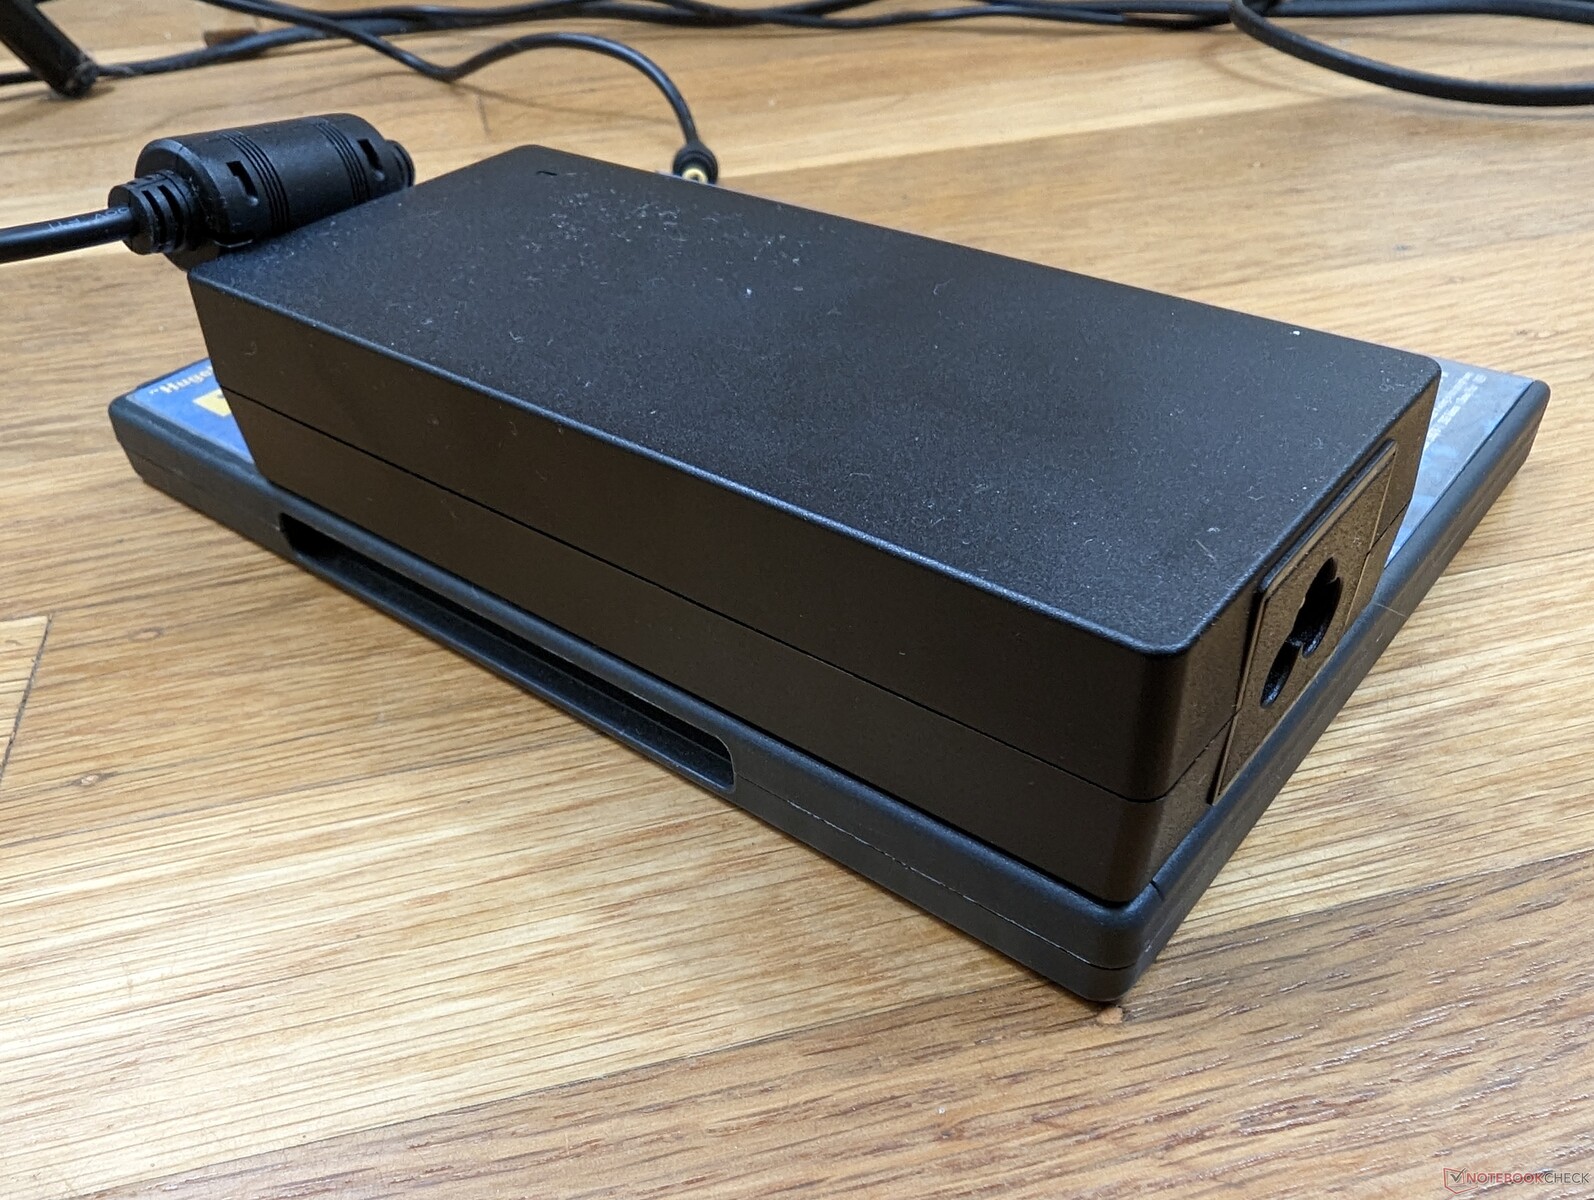
Nous avons pu enregistrer une consommation maximale de 72 W sur l'adaptateur secteur de 120 W lorsque le CPU est utilisé à 100 %. Cette consommation élevée permet au mini-PC d'alimenter ou de charger certains périphériques USB-C au détriment d'un adaptateur secteur plus encombrant.

| Éteint/en veille | |
| Au repos | |
| Fortement sollicité |
|
Légende:
min: | |
| Beelink SER6 Pro R7 6800H, Radeon 680M, Kingston NV2 500GB SNV2S/500G, , x, | Beelink SER Pro Ryzen 5 5600H R5 5600H, Vega 7, Kingston NV1 SNVS/500GCN, , x, | Beelink SEi11 Pro i5-11320H, Iris Xe G7 96EUs, Kingston NV1 SNVS/500GCN, , x, | Intel NUC 12 Pro Kit NUC12WSKi7 i7-1260P, Iris Xe G7 96EUs, Transcend M.2 SSD 2200S TS512GMTE220S, , x, | Intel NUC11PHKi7C i7-1165G7, GeForce RTX 2060 Mobile, Samsung SSD 980 Pro 500GB MZ-V8P500BW, , x, | Intel Hades Canyon NUC8i7HVK i7-8809G, Vega M GH, Intel Optane 120 GB SSDPEK1W120GA, , x, | |
|---|---|---|---|---|---|---|
| Power Consumption | 19% | -3% | -35% | -93% | -91% | |
| Idle Minimum * (Watt) | 8.3 | 5.4 35% | 9.8 -18% | 12.1 -46% | 5.8 30% | 15.5 -87% |
| Idle Average * (Watt) | 8.4 | 8.2 2% | 10.3 -23% | 12.2 -45% | 5.9 30% | 16.2 -93% |
| Idle Maximum * (Watt) | 8.7 | 8.3 5% | 10.5 -21% | 12.3 -41% | 20.7 -138% | 16.5 -90% |
| Load Average * (Watt) | 60.8 | 49.3 19% | 54.2 11% | 64 -5% | 130.8 -115% | 83.4 -37% |
| Witcher 3 ultra * (Watt) | 61.4 | 46.1 25% | 53.1 14% | 154.4 -151% | 121.7 -98% | |
| Load Maximum * (Watt) | 72 | 50.2 30% | 59 18% | 98.8 -37% | 225.2 -213% | 173.5 -141% |
* ... Moindre est la valeur, meilleures sont les performances
Power Consumption Witcher 3 / Stresstest
Power Consumption external Monitor
Points positifs
Points négatifs
Verdict : un succès inattendu
La SER6 Pro partage bon nombre des avantages et des inconvénients de la récente Test du mini PC Beelink GTR6 Ryzen 9 6900HX : Plus rapide que la plupart des NUC d'Intel. Plus précisément, les performances sont particulièrement bonnes par rapport à d'autres mini-PC équipés de cartes graphiques intégrées, mais le bruit du ventilateur et la consommation d'énergie sont respectivement plus bruyants et légèrement plus élevés. Ses deux principaux inconvénients n'enlèvent rien à la valeur incroyable que les acheteurs obtiendront : 32 Go de RAM, 500 Go de SSD NVMe, Windows 11 Pro, et l'un des mini-PC les plus rapides à graphisme intégré, le tout pour seulement 650 dollars américains.
Le SER6 Pro de Beelink bat un NUC Intel Core U-series de prix équivalent en termes de performance et de valeur, et ce, par une large marge.
Pour les futures révisions, nous aimerions voir un adaptateur secteur plus petit et un seul grand ventilateur interne au lieu de deux petits. L'adaptateur secteur actuel est plus lourd que le mini PC lui-même, tandis qu'un ventilateur plus grand permettrait d'obtenir un bruit de ventilateur plus faible et moins perceptible. Les utilisateurs doivent également faire attention aux problèmes potentiels de stabilité du taux de trame lors des jeux. A part cela, Beelink a fait des merveilles avec son SEi et SER en termes de performance et de valeur.
Prix et disponibilité
Amazon expédie actuellement notre configuration SER6 Pro exacte pour 650 USD. Les utilisateurs peuvent également acheter directement directement auprès du fabricant pour 659 $.
Transparency
La sélection des appareils à examiner est effectuée par notre équipe éditoriale. L'échantillon de test a été prêté à l'auteur par le fabricant ou le détaillant pour les besoins de cet examen. Le prêteur n'a pas eu d'influence sur cette évaluation et le fabricant n'a pas reçu de copie de cette évaluation avant sa publication. Il n'y avait aucune obligation de publier cet article. En tant que média indépendant, Notebookcheck n'est pas soumis à l'autorité des fabricants, des détaillants ou des éditeurs.
Voici comment Notebookcheck teste
Chaque année, Notebookcheck examine de manière indépendante des centaines d'ordinateurs portables et de smartphones en utilisant des procédures standardisées afin de garantir que tous les résultats sont comparables. Nous avons continuellement développé nos méthodes de test depuis environ 20 ans et avons établi des normes industrielles dans le processus. Dans nos laboratoires de test, des équipements de mesure de haute qualité sont utilisés par des techniciens et des rédacteurs expérimentés. Ces tests impliquent un processus de validation en plusieurs étapes. Notre système d'évaluation complexe repose sur des centaines de mesures et de points de référence bien fondés, ce qui garantit l'objectivité.Price comparison

