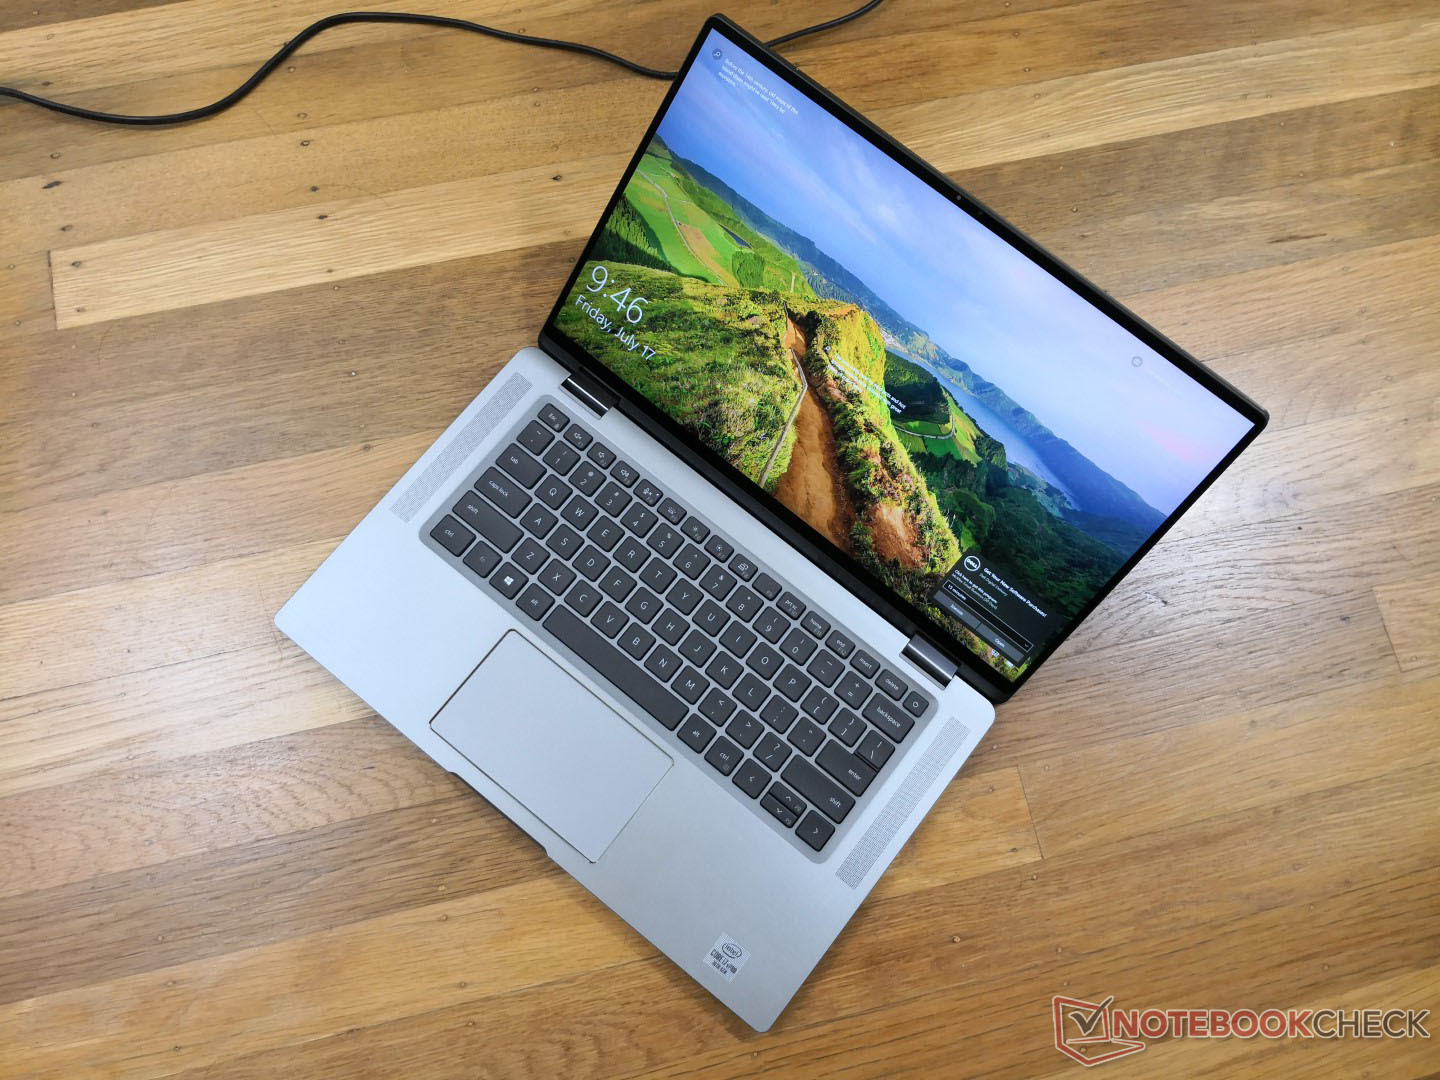
Test du Dell Latitude 9510 2-en-1 (i7-10810U, UHD 620, FHD) : un convertible 5G de 15 pouces ni énorme ni maniable
Note | Date | Modèle | Poids | Épaisseur | Taille | Résolution | Prix |
|---|---|---|---|---|---|---|---|
| 88.6 % v7 (old) | 08/20 | Dell Latitude 9510 2-in-1 i7-10810U, UHD Graphics 620 | 1.7 kg | 13.99 mm | 15.00" | 1920x1080 | |
| 87.2 % v7 (old) | 08/20 | Lenovo ThinkPad T15 Gen1-20S7S02U00 i7-10510U, GeForce MX330 | 1.8 kg | 19.95 mm | 15.60" | 3840x2160 | |
| 81.8 % v7 (old) | 02/20 | Lenovo ThinkBook 15 i5-10210U, UHD Graphics 620 | 1.9 kg | 18.9 mm | 15.60" | 1920x1080 | |
| 82.9 % v7 (old) | 11/19 | Dynabook Tecra X50-F i7-8665U, UHD Graphics 620 | 1.4 kg | 17.6 mm | 15.60" | 1920x1080 | |
| 80.4 % v7 (old) | 07/20 | HP Envy x360 15-dr1679cl i7-10510U, UHD Graphics 620 | 2.1 kg | 17.2 mm | 15.60" | 1920x1080 | |
| 84.2 % v6 (old) | 08/18 | Dell Latitude 5591 i7-8850H, GeForce MX130 | 2.3 kg | 24.3 mm | 15.60" | 1920x1080 |
| SD Card Reader | |
| average JPG Copy Test (av. of 3 runs) | |
| Dell Latitude 5591 (Toshiba Exceria Pro SDXC 64 GB UHS-II) | |
| Dell Latitude 9510 2-in-1 (Toshiba Exceria Pro M501 64 GB UHS-II) | |
| Lenovo ThinkPad T15 Gen1-20S7S02U00 (Toshiba Exceria Pro M501 64 GB UHS-II) | |
| HP Envy x360 15-dr1679cl (Toshiba Exceria Pro SDXC 64 GB UHS-II) | |
| Lenovo ThinkBook 15 (Toshiba Exceria Pro SDXC 64 GB UHS-II) | |
| Dynabook Tecra X50-F | |
| maximum AS SSD Seq Read Test (1GB) | |
| Dell Latitude 5591 (Toshiba Exceria Pro SDXC 64 GB UHS-II) | |
| Dell Latitude 9510 2-in-1 (Toshiba Exceria Pro M501 64 GB UHS-II) | |
| Lenovo ThinkPad T15 Gen1-20S7S02U00 (Toshiba Exceria Pro M501 64 GB UHS-II) | |
| Lenovo ThinkBook 15 (Toshiba Exceria Pro SDXC 64 GB UHS-II) | |
| HP Envy x360 15-dr1679cl (Toshiba Exceria Pro SDXC 64 GB UHS-II) | |
| Dynabook Tecra X50-F | |
| Networking | |
| iperf3 transmit AX12 | |
| HP Envy x360 15-dr1679cl | |
| Dell Latitude 9510 2-in-1 | |
| Lenovo ThinkPad T15 Gen1-20S7S02U00 | |
| Honor MagicBook 15 | |
| iperf3 receive AX12 | |
| Lenovo ThinkPad T15 Gen1-20S7S02U00 | |
| Dell Latitude 9510 2-in-1 | |
| HP Envy x360 15-dr1679cl | |
| Honor MagicBook 15 | |


| |||||||||||||||||||||||||
Homogénéité de la luminosité: 87 %
Valeur mesurée au centre, sur batterie: 426.7 cd/m²
Contraste: 1422:1 (Valeurs des noirs: 0.3 cd/m²)
ΔE ColorChecker Calman: 4.28 | ∀{0.5-29.43 Ø4.71}
calibrated: 1.46
ΔE Greyscale Calman: 8.1 | ∀{0.09-98 Ø4.96}
99.2% sRGB (Argyll 1.6.3 3D)
65.2% AdobeRGB 1998 (Argyll 1.6.3 3D)
71.3% AdobeRGB 1998 (Argyll 3D)
99.3% sRGB (Argyll 3D)
71.2% Display P3 (Argyll 3D)
Gamma: 2.26
CCT: 7993 K
| Dell Latitude 9510 2-in-1 AU Optronics B150HAN, IPS, 15", 1920x1080 | Lenovo ThinkPad T15 Gen1-20S7S02U00 NE156QUM-N66, IPS LED, 15.6", 3840x2160 | Lenovo ThinkBook 15 LP156WFC-SPD1, IPS, 15.6", 1920x1080 | Dynabook Tecra X50-F Toshiba TOS508F, IPS, 15.6", 1920x1080 | HP Envy x360 15-dr1679cl AU Optronics B156HW02, IPS, 15.6", 1920x1080 | Dell Latitude 5591 AU Optronics B156HW03, IPS, 15.6", 1920x1080 | |
|---|---|---|---|---|---|---|
| Display | 15% | -44% | -47% | -43% | -44% | |
| Display P3 Coverage (%) | 71.2 | 80.7 13% | 38.38 -46% | 36.68 -48% | 39.28 -45% | 38.74 -46% |
| sRGB Coverage (%) | 99.3 | 98.1 -1% | 57.7 -42% | 55 -45% | 58.8 -41% | 58.1 -41% |
| AdobeRGB 1998 Coverage (%) | 71.3 | 95.5 34% | 39.67 -44% | 37.92 -47% | 40.58 -43% | 40.03 -44% |
| Response Times | 26% | 21% | 24% | 26% | 17% | |
| Response Time Grey 50% / Grey 80% * (ms) | 52.8 ? | 42 ? 20% | 37.6 ? 29% | 38 ? 28% | 39.6 ? 25% | 45.2 ? 14% |
| Response Time Black / White * (ms) | 32 ? | 21.6 ? 32% | 28 ? 12% | 25.6 ? 20% | 23.6 ? 26% | 26 ? 19% |
| PWM Frequency (Hz) | ||||||
| Screen | 21% | -40% | -54% | -39% | -38% | |
| Brightness middle (cd/m²) | 426.7 | 489 15% | 245 -43% | 295.9 -31% | 261.2 -39% | 245.4 -42% |
| Brightness (cd/m²) | 394 | 501 27% | 239 -39% | 270 -31% | 248 -37% | 234 -41% |
| Brightness Distribution (%) | 87 | 91 5% | 82 -6% | 86 -1% | 92 6% | 88 1% |
| Black Level * (cd/m²) | 0.3 | 0.35 -17% | 0.25 17% | 0.3 -0% | 0.38 -27% | 0.26 13% |
| Contrast (:1) | 1422 | 1397 -2% | 980 -31% | 986 -31% | 687 -52% | 944 -34% |
| Colorchecker dE 2000 * | 4.28 | 3 30% | 5.6 -31% | 6.55 -53% | 5.4 -26% | 5.36 -25% |
| Colorchecker dE 2000 max. * | 10.43 | 5.1 51% | 15.6 -50% | 21.52 -106% | 16.31 -56% | 19.31 -85% |
| Colorchecker dE 2000 calibrated * | 1.46 | 0.8 45% | 4.8 -229% | 5.73 -292% | 3.81 -161% | 4.06 -178% |
| Greyscale dE 2000 * | 8.1 | 4 51% | 3.4 58% | 4.3 47% | 4.1 49% | 3.5 57% |
| Gamma | 2.26 97% | 2.24 98% | 2.3 96% | 2.475 89% | 2.53 87% | 2.53 87% |
| CCT | 7993 81% | 7400 88% | 7156 91% | 7002 93% | 6611 98% | 6430 101% |
| Color Space (Percent of AdobeRGB 1998) (%) | 65.2 | 84.7 30% | 36.5 -44% | 35 -46% | 37.4 -43% | 40 -39% |
| Color Space (Percent of sRGB) (%) | 99.2 | 98.1 -1% | 57.5 -42% | 54 -46% | 58.7 -41% | 58.1 -41% |
| Moyenne finale (programmes/paramètres) | 21% /
21% | -21% /
-33% | -26% /
-43% | -19% /
-32% | -22% /
-32% |
* ... Moindre est la valeur, meilleures sont les performances
Temps de réponse de l'écran
| ↔ Temps de réponse noir à blanc | ||
|---|---|---|
| 32 ms ... hausse ↗ et chute ↘ combinées | ↗ 16.4 ms hausse | 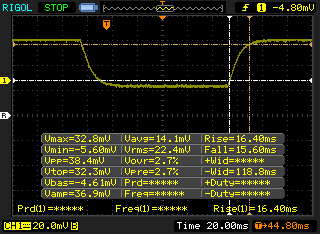 |
| ↘ 15.6 ms chute | ||
| L'écran souffre de latences très élevées, à éviter pour le jeu. En comparaison, tous les appareils testés affichent entre 0.1 (minimum) et 240 (maximum) ms. » 86 % des appareils testés affichent de meilleures performances. Cela signifie que les latences relevées sont moins bonnes que la moyenne (19.8 ms) de tous les appareils testés. | ||
| ↔ Temps de réponse gris 50% à gris 80% | ||
| 52.8 ms ... hausse ↗ et chute ↘ combinées | ↗ 25.2 ms hausse | 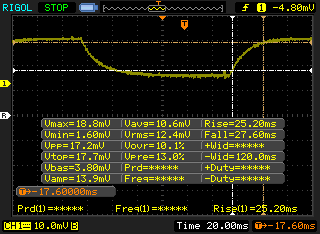 |
| ↘ 27.6 ms chute | ||
| L'écran souffre de latences très élevées, à éviter pour le jeu. En comparaison, tous les appareils testés affichent entre 0.165 (minimum) et 636 (maximum) ms. » 89 % des appareils testés affichent de meilleures performances. Cela signifie que les latences relevées sont moins bonnes que la moyenne (30.9 ms) de tous les appareils testés. | ||
Scintillement / MLI (Modulation de largeur d'impulsion)
| Scintillement / MLI (Modulation de largeur d'impulsion) non décelé | 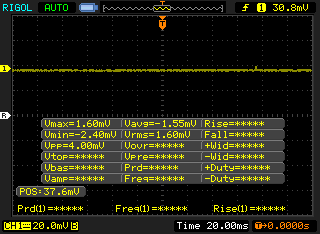 | ||
En comparaison, 52 % des appareils testés n'emploient pas MDI pour assombrir leur écran. Nous avons relevé une moyenne à 7741 (minimum : 5 - maximum : 343500) Hz dans le cas où une MDI était active. | |||
Cinebench R15: CPU Multi 64Bit | CPU Single 64Bit
Blender: v2.79 BMW27 CPU
7-Zip 18.03: 7z b 4 -mmt1 | 7z b 4
Geekbench 5.5: Single-Core | Multi-Core
HWBOT x265 Benchmark v2.2: 4k Preset
LibreOffice : 20 Documents To PDF
R Benchmark 2.5: Overall mean
Cinebench R15: CPU Multi 64Bit | CPU Single 64Bit
Blender: v2.79 BMW27 CPU
7-Zip 18.03: 7z b 4 -mmt1 | 7z b 4
Geekbench 5.5: Single-Core | Multi-Core
HWBOT x265 Benchmark v2.2: 4k Preset
LibreOffice : 20 Documents To PDF
R Benchmark 2.5: Overall mean
* ... Moindre est la valeur, meilleures sont les performances
| PCMark 8 | |
| Home Score Accelerated v2 | |
| Lenovo ThinkBook 15 | |
| Dell Latitude 5591 | |
| Dell Latitude 9510 2-in-1 | |
| HP Envy x360 15-dr1679cl | |
| Lenovo ThinkPad T15 Gen1-20S7S02U00 | |
| Work Score Accelerated v2 | |
| Dell Latitude 5591 | |
| HP Envy x360 15-dr1679cl | |
| Dell Latitude 9510 2-in-1 | |
| Lenovo ThinkBook 15 | |
| Lenovo ThinkPad T15 Gen1-20S7S02U00 | |
| PCMark 8 Home Score Accelerated v2 | 3969 points | |
| PCMark 8 Work Score Accelerated v2 | 5149 points | |
| PCMark 10 Score | 4335 points | |
Aide | ||
| DPC Latencies / LatencyMon - interrupt to process latency (max), Web, Youtube, Prime95 | |
| Dell Latitude 9510 2-in-1 | |
| HP Envy x360 15-dr1679cl | |
| Lenovo ThinkPad T15 Gen1-20S7S02U00 | |
| Honor Magicbook 14 | |
| HP EliteBook 735 G6 7KN29EA | |
| Honor MagicBook 15 | |
| HP Envy x360 13-ay0010nr | |
| Microsoft Surface Book 3 15 | |
| HP ProBook 455 G7-175W8EA | |
* ... Moindre est la valeur, meilleures sont les performances
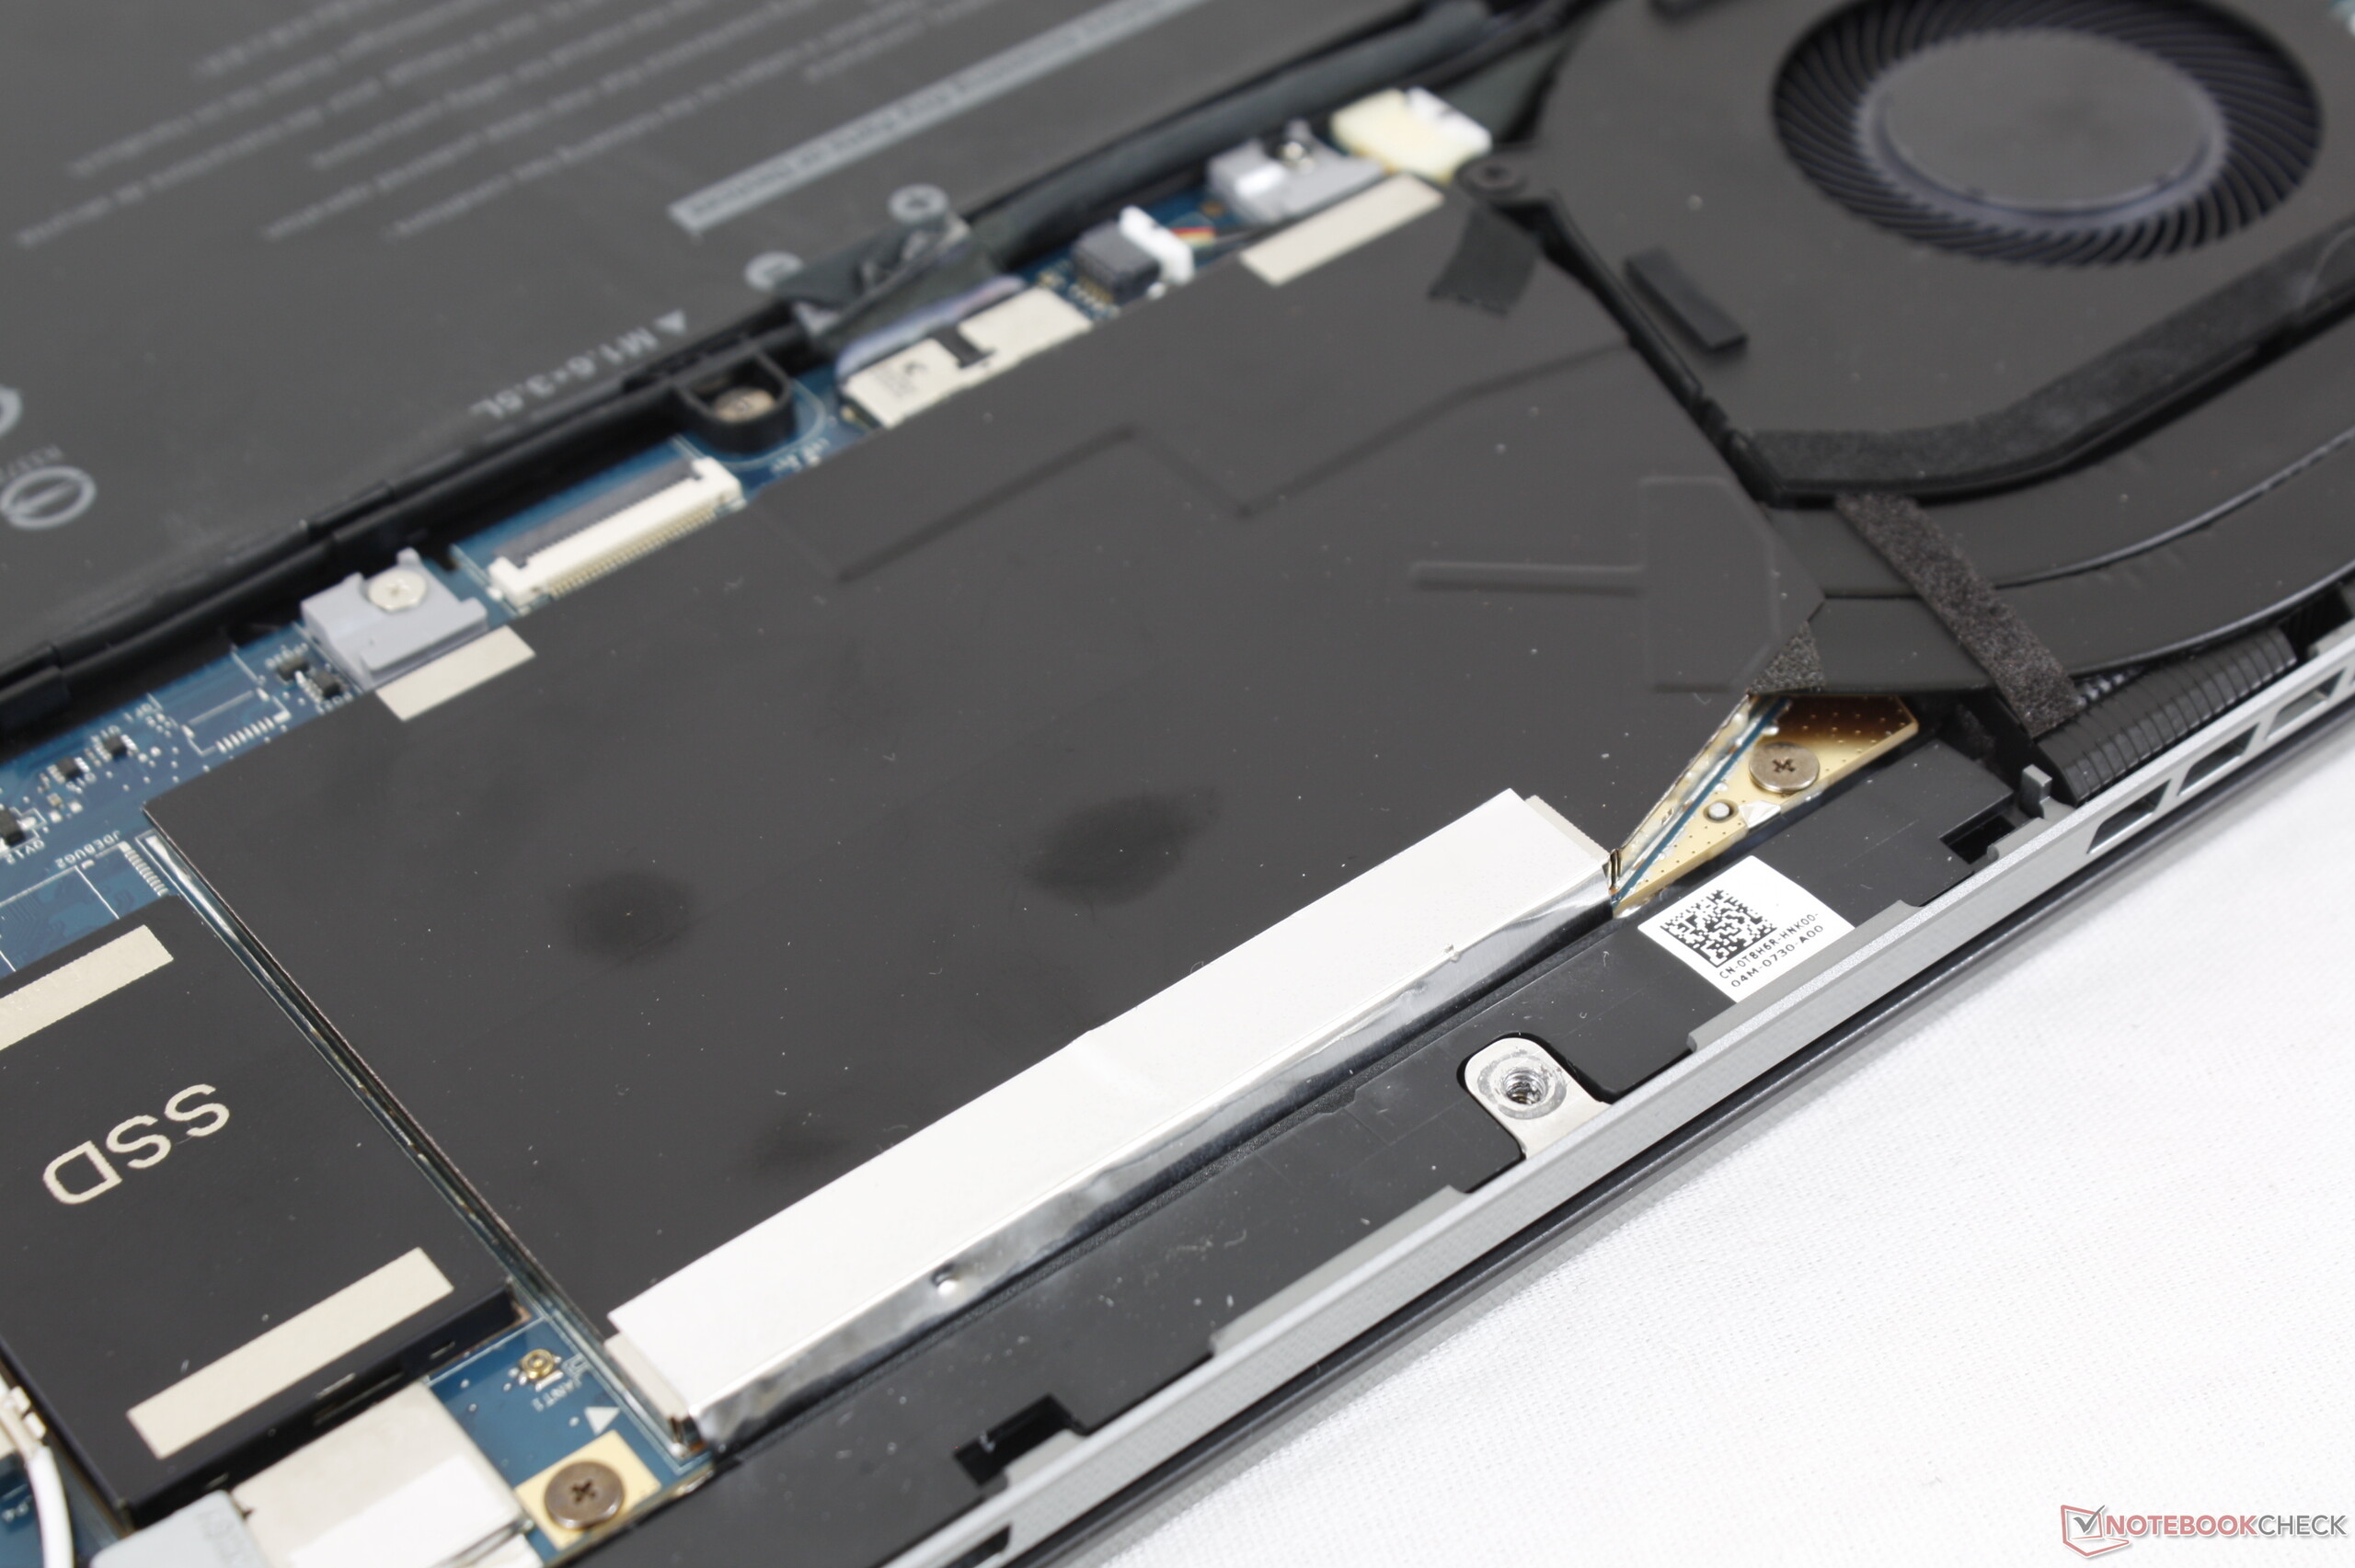
| Dell Latitude 9510 2-in-1 Toshiba KBG40ZNS512G NVMe | Lenovo ThinkPad T15 Gen1-20S7S02U00 Toshiba XG6 KXG6AZNV1T02 | Lenovo ThinkBook 15 Samsung SSD PM981 MZVLB512HAJQ | Dynabook Tecra X50-F Samsung SSD PM981 MZVLB512HAJQ | HP Envy x360 15-dr1679cl Intel Optane Memory H10 with Solid State Storage 32GB + 512GB HBRPEKNX0202A(L/H) | Dell Latitude 5591 Toshiba XG5 KXG50ZNV512G | |
|---|---|---|---|---|---|---|
| AS SSD | 88% | 105% | 49% | -5% | -11% | |
| Seq Read (MB/s) | 1427 | 2372 66% | 2564 80% | 1461 2% | 931 -35% | 2573 80% |
| Seq Write (MB/s) | 741 | 2230 201% | 2268 206% | 1039 40% | 331.5 -55% | 426.5 -42% |
| 4K Read (MB/s) | 48.7 | 50.2 3% | 57 17% | 45.98 -6% | 72.8 49% | 21.95 -55% |
| 4K Write (MB/s) | 108.2 | 139.8 29% | 141.4 31% | 125.5 16% | 119 10% | 97.2 -10% |
| 4K-64 Read (MB/s) | 1023 | 1430 40% | 1175 15% | 560 -45% | 389.7 -62% | 719 -30% |
| 4K-64 Write (MB/s) | 315.3 | 1368 334% | 1665 428% | 1162 269% | 573 82% | 430.3 36% |
| Access Time Read * (ms) | 0.058 | 0.059 -2% | 0.032 45% | 0.045 22% | 0.07 -21% | 0.122 -110% |
| Access Time Write * (ms) | 0.523 | 0.03 94% | 0.025 95% | 0.032 94% | 0.138 74% | 0.065 88% |
| Score Read (Points) | 1215 | 1718 41% | 1488 22% | 752 -38% | 556 -54% | 998 -18% |
| Score Write (Points) | 498 | 1731 248% | 2033 308% | 1391 179% | 725 46% | 570 14% |
| Score Total (Points) | 2310 | 4325 87% | 4279 85% | 2521 9% | 1565 -32% | 1971 -15% |
| Copy ISO MB/s (MB/s) | 1090 | 1540 41% | 2118 94% | 593 -46% | 782 -28% | |
| Copy Program MB/s (MB/s) | 406.8 | 583 43% | 495.6 22% | 495.5 22% | 365.7 -10% | |
| Copy Game MB/s (MB/s) | 1008 | 1046 4% | 1174 16% | 566 -44% | 457.9 -55% | |
| CrystalDiskMark 5.2 / 6 | 36% | 43% | 1% | 18% | ||
| Write 4K (MB/s) | 114.1 | 159.1 39% | 176.3 55% | 100.1 -12% | 125.6 10% | |
| Read 4K (MB/s) | 50.6 | 55.6 10% | 48.98 -3% | 42.4 -16% | 145.8 188% | |
| Write Seq (MB/s) | 1368 | 1435 5% | 1789 31% | 509 -63% | ||
| Read Seq (MB/s) | 1696 | 1435 -15% | 1671 -1% | 1536 -9% | ||
| Write 4K Q32T1 (MB/s) | 282.8 | 512 81% | 433.5 53% | 245.9 -13% | 362.4 28% | |
| Read 4K Q32T1 (MB/s) | 354.8 | 541 52% | 526 48% | 230.3 -35% | 307.3 -13% | |
| Write Seq Q32T1 (MB/s) | 1418 | 2682 89% | 2983 110% | 1910 35% | 1320 -7% | |
| Read Seq Q32T1 (MB/s) | 2359 | 2902 23% | 3555 51% | 3454 46% | 2489 6% | |
| Write 4K Q8T8 (MB/s) | 1688 | |||||
| Read 4K Q8T8 (MB/s) | 1036 | |||||
| Moyenne finale (programmes/paramètres) | 62% /
69% | 74% /
82% | 25% /
32% | 7% /
3% | -11% /
-11% |
* ... Moindre est la valeur, meilleures sont les performances

Disk Throttling: DiskSpd Read Loop, Queue Depth 8
| 3DMark 06 Standard Score | 12453 points | |
| 3DMark 11 Performance | 2187 points | |
| 3DMark Cloud Gate Standard Score | 10960 points | |
| 3DMark Fire Strike Score | 1130 points | |
| 3DMark Time Spy Score | 488 points | |
Aide | ||
| Bas | Moyen | Élevé | Ultra | |
|---|---|---|---|---|
| The Witcher 3 (2015) | 19.9 | 12.1 | ||
| Dota 2 Reborn (2015) | 71.7 | 44.1 | 19 | 17 |
| X-Plane 11.11 (2018) | 12.9 | 13.1 | 11.7 |
| Dell Latitude 9510 2-in-1 UHD Graphics 620, i7-10810U, Toshiba KBG40ZNS512G NVMe | Lenovo ThinkPad T15 Gen1-20S7S02U00 GeForce MX330, i7-10510U, Toshiba XG6 KXG6AZNV1T02 | Lenovo ThinkBook 15 UHD Graphics 620, i5-10210U, Samsung SSD PM981 MZVLB512HAJQ | Dynabook Tecra X50-F UHD Graphics 620, i7-8665U, Samsung SSD PM981 MZVLB512HAJQ | HP Envy x360 15-dr1679cl UHD Graphics 620, i7-10510U, Intel Optane Memory H10 with Solid State Storage 32GB + 512GB HBRPEKNX0202A(L/H) | Dell Latitude 5591 GeForce MX130, i7-8850H, Toshiba XG5 KXG50ZNV512G | |
|---|---|---|---|---|---|---|
| Noise | -4% | -2% | -7% | -8% | -16% | |
| arrêt / environnement * (dB) | 27.2 | 29.4 -8% | 29.2 -7% | 30.2 -11% | 28 -3% | 29 -7% |
| Idle Minimum * (dB) | 27.2 | 29.4 -8% | 29.2 -7% | 30.2 -11% | 28 -3% | 29 -7% |
| Idle Average * (dB) | 27.2 | 29.4 -8% | 29.2 -7% | 30.2 -11% | 30.2 -11% | 29 -7% |
| Idle Maximum * (dB) | 27.2 | 29.4 -8% | 29.9 -10% | 30.2 -11% | 31.5 -16% | 30.3 -11% |
| Load Average * (dB) | 33.4 | 34.2 -2% | 30.6 8% | 33.4 -0% | 35.7 -7% | 46.5 -39% |
| Load Maximum * (dB) | 39.5 | 34.2 13% | 33.8 14% | 39 1% | 43.1 -9% | 48.6 -23% |
| Witcher 3 ultra * (dB) | 34.2 |
* ... Moindre est la valeur, meilleures sont les performances
Degré de la nuisance sonore
| Au repos |
| 27.2 / 27.2 / 27.2 dB(A) |
| Fortement sollicité |
| 33.4 / 39.5 dB(A) |
 | ||
30 dB silencieux 40 dB(A) audible 50 dB(A) bruyant |
||
min: | ||
(±) La température maximale du côté supérieur est de 42.8 °C / 109 F, par rapport à la moyenne de 34.3 °C / 94 F, allant de 21.2 à 62.5 °C pour la classe Office.
(±) Le fond chauffe jusqu'à un maximum de 41.8 °C / 107 F, contre une moyenne de 36.8 °C / 98 F
(+) En utilisation inactive, la température moyenne du côté supérieur est de 27.2 °C / 81 F, par rapport à la moyenne du dispositif de 29.5 °C / 85 F.
(+) Les repose-poignets et le pavé tactile sont plus froids que la température de la peau avec un maximum de 30.6 °C / 87.1 F et sont donc froids au toucher.
(-) La température moyenne de la zone de l'appui-paume de dispositifs similaires était de 27.6 °C / 81.7 F (-3 °C / #-5.4 F).
Dell Latitude 9510 2-in-1 analyse audio
(±) | le niveau sonore du haut-parleur est moyen mais bon (77.9# dB)
Basses 100 - 315 Hz
(+) | bonne basse - seulement 3% loin de la médiane
(±) | la linéarité des basses est moyenne (9.6% delta à la fréquence précédente)
Médiums 400 - 2000 Hz
(+) | médiane équilibrée - seulement 3.5% de la médiane
(±) | la linéarité des médiums est moyenne (7.1% delta à la fréquence précédente)
Aiguës 2 - 16 kHz
(+) | des sommets équilibrés - à seulement 4.9% de la médiane
(±) | la linéarité des aigus est moyenne (12.2% delta à la fréquence précédente)
Globalement 100 - 16 000 Hz
(+) | le son global est linéaire (10% différence à la médiane)
Par rapport à la même classe
» 1% de tous les appareils testés de cette catégorie étaient meilleurs, 1% similaires, 98% pires
» Le meilleur avait un delta de 7%, la moyenne était de 21%, le pire était de 53%.
Par rapport à tous les appareils testés
» 4% de tous les appareils testés étaient meilleurs, 1% similaires, 94% pires
» Le meilleur avait un delta de 4%, la moyenne était de 23%, le pire était de 134%.
Apple MacBook 12 (Early 2016) 1.1 GHz analyse audio
(+) | les haut-parleurs peuvent jouer relativement fort (83.6# dB)
Basses 100 - 315 Hz
(±) | basse réduite - en moyenne 11.3% inférieure à la médiane
(±) | la linéarité des basses est moyenne (14.2% delta à la fréquence précédente)
Médiums 400 - 2000 Hz
(+) | médiane équilibrée - seulement 2.4% de la médiane
(+) | les médiums sont linéaires (5.5% delta à la fréquence précédente)
Aiguës 2 - 16 kHz
(+) | des sommets équilibrés - à seulement 2% de la médiane
(+) | les aigus sont linéaires (4.5% delta à la fréquence précédente)
Globalement 100 - 16 000 Hz
(+) | le son global est linéaire (10.2% différence à la médiane)
Par rapport à la même classe
» 7% de tous les appareils testés de cette catégorie étaient meilleurs, 2% similaires, 90% pires
» Le meilleur avait un delta de 5%, la moyenne était de 18%, le pire était de 53%.
Par rapport à tous les appareils testés
» 5% de tous les appareils testés étaient meilleurs, 1% similaires, 94% pires
» Le meilleur avait un delta de 4%, la moyenne était de 23%, le pire était de 134%.
| Éteint/en veille | |
| Au repos | |
| Fortement sollicité |
|
Légende:
min: | |
| Dell Latitude 9510 2-in-1 i7-10810U, UHD Graphics 620, Toshiba KBG40ZNS512G NVMe, IPS, 1920x1080, 15" | Lenovo ThinkPad T15 Gen1-20S7S02U00 i7-10510U, GeForce MX330, Toshiba XG6 KXG6AZNV1T02, IPS LED, 3840x2160, 15.6" | Lenovo ThinkBook 15 i5-10210U, UHD Graphics 620, Samsung SSD PM981 MZVLB512HAJQ, IPS, 1920x1080, 15.6" | Dynabook Tecra X50-F i7-8665U, UHD Graphics 620, Samsung SSD PM981 MZVLB512HAJQ, IPS, 1920x1080, 15.6" | HP Envy x360 15-dr1679cl i7-10510U, UHD Graphics 620, Intel Optane Memory H10 with Solid State Storage 32GB + 512GB HBRPEKNX0202A(L/H), IPS, 1920x1080, 15.6" | Dell Latitude 5591 i7-8850H, GeForce MX130, Toshiba XG5 KXG50ZNV512G, IPS, 1920x1080, 15.6" | |
|---|---|---|---|---|---|---|
| Power Consumption | -105% | -24% | -21% | -32% | -69% | |
| Idle Minimum * (Watt) | 2.1 | 4.3 -105% | 3.5 -67% | 3.9 -86% | 4.3 -105% | 4.4 -110% |
| Idle Average * (Watt) | 4.6 | 13.8 -200% | 7.1 -54% | 7 -52% | 7.2 -57% | 8.4 -83% |
| Idle Maximum * (Watt) | 5.3 | 16.2 -206% | 7.8 -47% | 7.3 -38% | 7.5 -42% | 10.2 -92% |
| Load Average * (Watt) | 45.8 | 66 -44% | 38.9 15% | 32.7 29% | 40.4 12% | 71 -55% |
| Load Maximum * (Watt) | 96.3 | 67.4 30% | 65.4 32% | 57.8 40% | 65.7 32% | 100.1 -4% |
| Witcher 3 ultra * (Watt) | 53 |
* ... Moindre est la valeur, meilleures sont les performances
| Dell Latitude 9510 2-in-1 i7-10810U, UHD Graphics 620, 88 Wh | Lenovo ThinkPad T15 Gen1-20S7S02U00 i7-10510U, GeForce MX330, 57 Wh | Lenovo ThinkBook 15 i5-10210U, UHD Graphics 620, 45 Wh | Dynabook Tecra X50-F i7-8665U, UHD Graphics 620, 48 Wh | HP Envy x360 15-dr1679cl i7-10510U, UHD Graphics 620, 55.67 Wh | Dell Latitude 5591 i7-8850H, GeForce MX130, 92 Wh | |
|---|---|---|---|---|---|---|
| Autonomie de la batterie | -66% | -65% | -74% | -50% | -52% | |
| Reader / Idle (h) | 59 | 17.9 -70% | 5.8 -90% | 25.4 -57% | 22.4 -62% | |
| WiFi v1.3 (h) | 18.7 | 7.1 -62% | 6.8 -64% | 4.6 -75% | 9.2 -51% | 12.5 -33% |
| Load (h) | 4 | 1.2 -70% | 1.5 -62% | 1.7 -57% | 2.3 -43% | 1.5 -62% |
Points positifs
Points négatifs
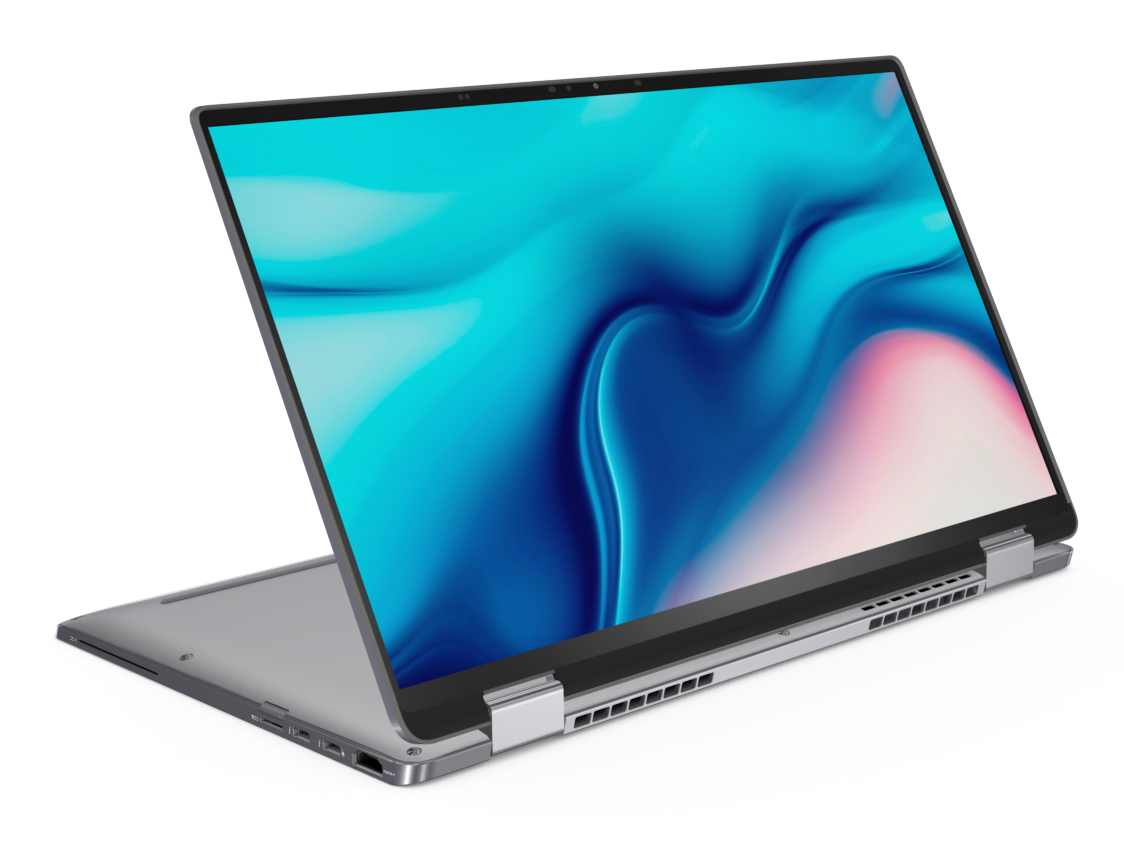
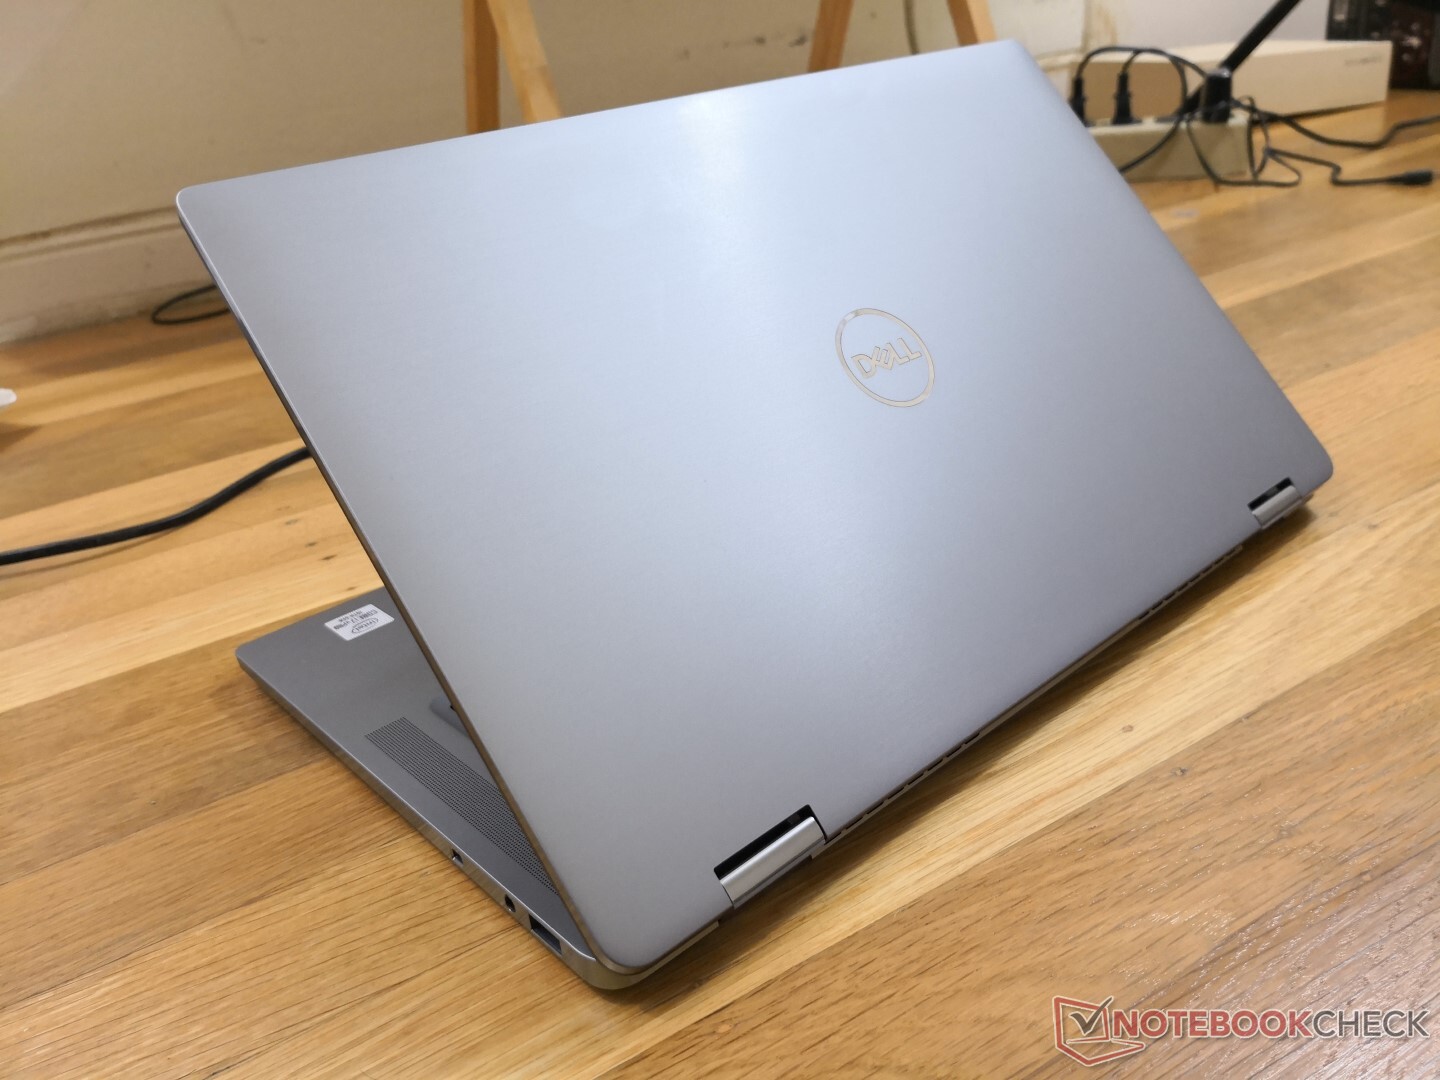
Les caractéristiques les plus intéressantes du Latitude 9510 2-en-1 sont son autonomie impressionnante, sa 5G intégrée, son châssis en métal et sa prise en main aisée, surtout pour un convertible de 15 pouces. Cela conviendra parfaitement aux nomades qui voudraient quelque chose de plus grand que les ultrabooks classiques de 13 ou 14 pouces comme le HP EliteBook x360 1040 ou le Lenovo X1 Carbon, sans trop sacrifier la portabilité et le poids. L'appareil reste plus lourd et plus grand que les appareils précités, mais il est vraiment plus compact que n'importe quel autre convertible de 15,6 pouces, s'avérant une proposition intermédiaire intéressante.
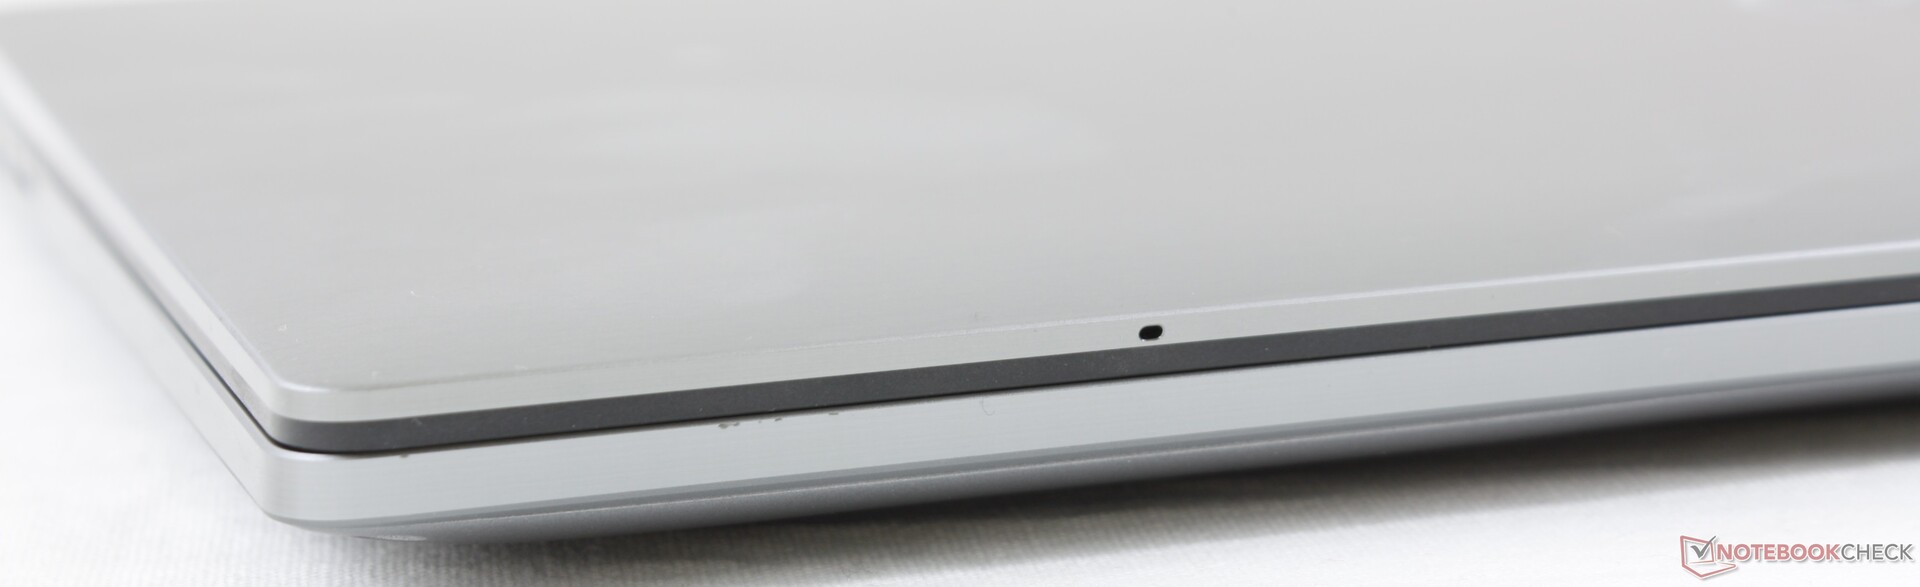
Aussi complet qu'il puisse être, certaines fonctionnalités manquent. L'absence de cache de webcam pour un convertible est étranche, surtout pour une série qui se concentre sur la sécurité. Et un écran à 1000 cd/m² aurait aidé l'appareil à avoir la lisibilité en extérieurs d'un HP EliteBook x360.
Ceux qui voudraient solliciter longtemps la machine devraient regarder ailleurs. Les performances du CPU chutent fortement au bout de quelques minutes seulement de grosses sollicitations, et l'absence de version Ryzen ou avec GPU dédié est vite notable. Le système reste en conséquence très silencieux et autonomie, mais les performances moyennes du processeur en sont le prix.
Polyvalent pour presque tous les usages de bureautique et nomades... tant que les sollicitations restent mesurées. La taille peu commune de 15 pouces fonctionne bien pour un convertible, à la fois plus grand qu'un 14 pouces, mais néanmoins plus compact et plus nomade que les alternatives classiques de 15,6 pouces.
L’intégralité de cette critique est disponible en anglais en suivant ce lien.
Dell Latitude 9510 2-in-1
- 07/20/2020 v7 (old)
Allen Ngo
Price comparison
