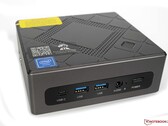
Intel Core i7-10810U
L'Intel Core i7-10810U est un SoC hexa-core économe en énergie pour ordinateurs portables basé sur la génération Comet Lake (CML-U) et apparu en mars 2020. Par rapport aux processeurs Whiskey Lake similaires (par exemple, le Core i5-8665U), la seule différence est la prise en charge de vitesses de mémoire plus élevées (DDR4-2666 contre 2400) et deux cœurs supplémentaires dans le modèle supérieur. Les cœurs du processeur sont cadencés entre 1,1 et 4,9 GHz. Grâce à HyperThreading, 12 threads peuvent être utilisés. Vous trouverez ici de plus amples informations sur Comet Lake, ainsi que tous les modèles et articles qui lui sont consacrés.
Le processeur prend en charge les fonctions de gestion professionnelle vPro (à la différence du i7-10710U).
Grâce aux deux cœurs supplémentaires et aux fréquences d'horloge élevées, les performances du processeur du i7-10710U sont très bonnes pour sa catégorie. Il devrait surpasser les meilleurs processeurs Whiskey Lake et Ice Lake si les paramètres de refroidissement et de TDP ne sont pas limités.
La carte graphique intégrée est cependant toujours la même que dans les générations précédentes. Elle devrait s'appeler Intel HD Graphics 620 et tourner entre 300 et 1150 MHz sur le i7. En outre, le SoC intègre un de- et encodeur VP9 et H.265 et un contrôleur de mémoire intégré à double canal DDR4-2666 / LPDDR4x 2933 / LPDDR3-2133.
La puce est toujours produite dans le processus 14nm++ comme Whiskey Lake. Le TDP (PL1) est spécifié à 15 watts mais peut varier de 12,5 à 25 watts chez le constructeur (cTDP up/down) ce qui entraîne des performances différentes (notamment les durées de Turbo). Pour fournir toutes les performances, Intel propose un pic de puissance court de 90 W (PL4) pour le i7 et donc 8 W de plus que les CPU quadri-cœurs CML-U et un énorme 19 W de plus que Whiskey Lake. Par conséquent, certains ordinateurs portables minces équipés de CPU CML-U de 15 W n'offriront pas le i7, car ils ne peuvent pas fournir suffisamment de puissance et de refroidissement pour tirer pleinement parti des 6 cœurs.
Gamme Intel Comet Lake Nom de code Comet Lake-U Gamme: Comet Lake Comet Lake-U Fréquence 1100 - 4900 MHz Cache de Niveau 1 (L1) 256 KB Cache de Niveau 2 (L2) 1 MB Cache de Niveau 3 (L3) 12 MB Nombres de cœurs/threads simultanés supportés 6 / 12 Consommation énergétique maximale (TDP) 15 Watt(s) Lithographie (procédé de fabrication) 14 nm Température maximale 100 °C Socket BGA1528 Fonctionnalités LPDDR3-2133/DDR4-2666/LPDDR4-2933 RAM, PCIe 3, 4 GT/s bus, vPro, MMX, SSE, SSE2, SSE3, SSSE3, SSE4.1, SSE4.2, AVX, AVX2, BMI2, ABM, FMA, ADX, VMX, SMX, SMEP, SMAP, MPX, EIST, TM1, TM2, HT, Turbo, SST, AES-NI, RDRAND, RDSEED, SGX Carte graphique Intel UHD Graphics 620 (300 - 1150 MHz)64 Bit Prend en charge les instructions 64 Bit Architecture x86 Date de présentation 05/13/2020 Lien redirigeant vers une page externe du produit ark.intel.com
Benchmarks Performance Rating - CB R15 + R20 + 7-Zip + X265 + Blender + 3DM11 CPU
30.3 pt (42%)
...
Intel Core i7-1065G7
Intel Core i5-1230U
Intel Core i5-1038NG7
...
max:
AMD Ryzen Threadripper PRO 7995WX
Cinebench R23 - Cinebench R23 Multi Core
min: 3867 moyenne: 4311 médian: 4310.5 (4%) maximum: 4754 Points
CPU TDP 15 W TDP 17 W 81% 100%
...
Intel Core i5-1035G4
Intel Core i5-1035G1
Intel Core i5-1230U
...
max:
AMD Ryzen Threadripper PRO 7995WX
Cinebench R23 - Cinebench R23 Single Core
min: 1082 moyenne: 1119 médian: 1118.5 (48%) maximum: 1155 Points
CPU TDP 15 W TDP 17 W 94% 100%
...
Intel Core i7-1065G7
...
Apple M3 Pro 12-Core
max:
Intel Core i9-14900K
Cinebench R20 - Cinebench R20 CPU (Single Core)
min: 396 moyenne: 425.2 médian: 424 (47%) maximum: 447 Points
CPU TDP ? TDP 15 W TDP 17 W 100% 97% 99%
...
Intel Core i5-1035G7
Intel Core i5-1035G1
Intel Core i5-1038NG7
...
max:
Intel Core i9-14900K
Cinebench R20 - Cinebench R20 CPU (Multi Core)
min: 1498 moyenne: 1778 médian: 1713 (4%) maximum: 2344 Points
CPU TDP ? TDP 15 W TDP 17 W 100% 81% 98%
...
Intel Core i7-7700HQ
Intel Core i5-1230U
Intel Core i5-1038NG7
...
max:
AMD Ryzen Threadripper PRO 7995WX
Cinebench R15 - Cinebench R15 CPU Multi 64 Bit
min: 623 moyenne: 799 médian: 754 (5%) maximum: 1064 Points
CPU TDP ? TDP 15 W TDP 17 W 100% 69% 86%
...
Intel Core i5-9400H
Intel Core i3-1215U
...
max:
AMD Ryzen Threadripper PRO 7995WX
0 55 110 165 220 275 330 385 440 495 550 605 660 715 770 825 880 935 990 1045 Tooltip Minipc Union NiPoGi CK10 - 10810U: Ø612 (604.67-652.86)
HP EliteBook x360 1030 G7: Ø722 (716.88-732.69)
HP EliteBook x360 1040 G7, i7-10810U: Ø765 (755.03-775.16)
Dell Latitude 9510 2-in-1: Ø562 (455.14-1064.2)
Cinebench R15 - Cinebench R15 CPU Single 64 Bit
min: 161 moyenne: 175.6 médian: 182 (55%) maximum: 183 Points
CPU TDP ? TDP 15 W TDP 17 W 96% 93% 100%
...
Intel Core i7-1065G7
Intel Core i5-1230U
...
max:
Intel Core i9-14900K
Cinebench R11.5 - Cinebench R11.5 CPU Multi 64 Bit
7 Points (9%)
...
...
max:
AMD Ryzen Threadripper PRO 7995WX
Cinebench R11.5 - Cinebench R11.5 CPU Single 64 Bit
2 Points (49%)
...
Intel Core i5-1035G7
Intel Core i5-1035G1
...
max:
Intel Core i9-14900K
Cinebench R10 - Cinebench R10 Rend. Single (32bit)
min: 6656 moyenne: 6927 médian: 6926.5 (42%) maximum: 7197 points
CPU TDP ? TDP 15 W 100% 92%
...
Intel Core i5-1038NG7
Intel Core i5-1035G4
Intel Core i5-1035G1
Intel Core i7-9750H
...
max:
Cinebench R10 - Cinebench R10 Rend. Multi (32bit)
min: 18912 moyenne: 19287 médian: 19286.5 (14%) maximum: 19661 points
CPU TDP ? TDP 15 W 100% 96%
...
Intel Core i5-8265U
Intel Core i3-1215U
Intel Core i5-1035G7
...
max:
Cinebench R10 - Cinebench R10 Rend. Multi (64bit)
23491 Points (16%)
...
...
max:
Intel Core i9-14900K
Cinebench R10 - Cinebench R10 Rend. Single (64bit)
8591 Points (46%)
...
Intel Core i5-1035G7
Intel Core i7-9750H
Intel Core i5-1035G1
...
max:
Intel Core i9-14900K
wPrime 2.10 - wPrime 2.0 1024m *
min: 205.3 moyenne: 236.3 médian: 236.3 (3%) maximum: 267.369 s
CPU TDP ? TDP 15 W 101% 100%
...
Intel Core i5-1245U
...
VIA C3-M C3-M-1200
wPrime 2.10 - wPrime 2.0 32m *
min: 4.856 moyenne: 5.9 médian: 5.9 (1%) maximum: 6.952 s
CPU TDP ? TDP 15 W 100% 100%
...
Intel Core i7-1265U
Intel Xeon E-2176M
Intel Core i5-1245U
...
min: 4747 moyenne: 4837 médian: 4837 (8%) maximum: 4927 points
CPU TDP ? TDP 15 W 100% 96%
...
Intel Core i7-1065G7
Intel Core i5-1230U
...
max:
AMD Ryzen Threadripper PRO 7995WX
7-Zip 18.03 - 7-Zip 18.03 Multli Thread 4 runs
min: 16072 moyenne: 21290 médian: 21925 (13%) maximum: 25244 MIPS
CPU TDP ? TDP 15 W TDP 17 W 81% 80% 100%
...
Intel Core i5-8260U
Intel Core i5-1038NG7
Intel Core i7-7700HQ
Intel Core i5-1230U
...
max:
AMD Ryzen Threadripper PRO 7995WX
7-Zip 18.03 - 7-Zip 18.03 Single Thread 4 runs
min: 4398 moyenne: 4561 médian: 4498 (54%) maximum: 4794 MIPS
CPU TDP ? TDP 15 W TDP 17 W 98% 100% 97%
...
Intel Core i5-1240U
...
max:
X264 HD Benchmark 4.0 - x264 Pass 2
min: 39.15 moyenne: 39.4 médian: 39.4 (14%) maximum: 39.7 fps
CPU TDP ? TDP 15 W 100% 99%
...
Intel Core i5-1035G7
...
max:
AMD Ryzen Threadripper PRO 7995WX
X264 HD Benchmark 4.0 - x264 Pass 1
min: 141.6 moyenne: 147.7 médian: 147.7 (34%) maximum: 153.7 fps
CPU TDP ? TDP 15 W 100% 92%
...
Intel Core i5-1230U
...
max:
HWBOT x265 Benchmark v2.2 - HWBOT x265 4k Preset
min: 3.81 moyenne: 5.3 médian: 5.2 (9%) maximum: 6.45 fps
CPU TDP ? TDP 15 W TDP 17 W 77% 81% 100%
...
Intel Core i5-1035G7
Intel Core i3-1215U
Intel Core i5-1230U
Intel Core i5-1038NG7
...
max:
AMD Ryzen Threadripper PRO 7995WX
0 1 2 3 4 5 6 7 8 9 10 11 12 13 14 15 16 Tooltip Dell Latitude 9510 2-in-1: Ø4.03 (0.65-7.35)
HP EliteBook 830 G7: Ø5.48 (0.8-9.95)
Minipc Union NiPoGi CK10 - 10810U: Ø5.82 (0.68-11.6)
HP EliteBook x360 1030 G7: Ø6.35 (1-12)
HP EliteBook x360 1040 G7, i7-10810U: Ø7.32 (0.98-16.2)
TrueCrypt - TrueCrypt Serpent
min: 0.566 moyenne: 0.6 médian: 0.6 (18%) maximum: 0.64 GB/s
CPU TDP ? TDP 15 W 100% 88%
...
Intel Xeon E-2176M
Intel Core i7-9750H
...
max:
AMD Ryzen Threadripper PRO 7995WX
TrueCrypt - TrueCrypt Twofish
min: 0.956 moyenne: 1 médian: 1 (17%) maximum: 1 GB/s
CPU TDP ? TDP 15 W 96% 100%
...
Intel Xeon E-2176M
...
max:
Intel Core i9-14900K
TrueCrypt - TrueCrypt AES
min: 5.5 moyenne: 5.7 médian: 5.7 (15%) maximum: 5.9 GB/s
CPU TDP ? TDP 15 W 93% 100%
...
...
max:
AMD Ryzen Threadripper PRO 7995WX
Blender - Blender 3.3 Classroom CPU *
1346 Seconds (17%)
...
Intel Core i3-1215U
Intel Core i5-8260U
Intel Core i5-1230U
Intel Core i5-8265U
...
Blender - Blender 2.79 BMW27 CPU *
min: 571 moyenne: 689 médian: 694 (5%) maximum: 875 Seconds
CPU TDP ? TDP 15 W TDP 17 W 100% 100% 101%
...
Intel Core i7-7700HQ
Intel Core i3-1215U
Intel Core i5-8260U
Intel Core i5-1230U
...
R Benchmark 2.5 - R Benchmark 2.5 *
min: 0.651 moyenne: 0.7 médian: 0.7 (15%) maximum: 0.717 sec
CPU TDP ? TDP 15 W TDP 17 W 100% 100% 101%
...
Intel Core i5-1038NG7
Intel Core i7-1065G7
...
3DMark 06 - CPU - 3DMark 06 - CPU
min: 6496 moyenne: 6843 médian: 6842.5 (15%) maximum: 7189 Points
CPU TDP ? TDP 15 W 90% 100%
...
Intel Core i5-1230U
...
max:
AMD Ryzen Threadripper PRO 7995WX
Super Pi mod 1.5 XS 1M - Super Pi mod 1.5 XS 1M *
min: 7.795 moyenne: 8 médian: 8 (2%) maximum: 8.155 s
CPU TDP ? TDP 15 W 100% 100%
...
Intel Core i7-1265U
...
VIA C3-M C3-M-1200
Super Pi mod 1.5 XS 2M - Super Pi mod 1.5 XS 2M *
min: 16.9 moyenne: 17.5 médian: 17.5 (1%) maximum: 18.167 s
CPU TDP ? TDP 15 W 100% 100%
...
Intel Core i7-1265U
...
Super Pi Mod 1.5 XS 32M - Super Pi mod 1.5 XS 32M *
min: 476.3 moyenne: 511 médian: 510.9 (2%) maximum: 545.435 s
CPU TDP ? TDP 15 W 100% 100%
...
...
VIA C3-M C3-M-1200
3DMark Vantage - 3DM Vant. Perf. CPU no Physx
25128 Points (23%)
...
Intel Core i5-1035G7
Intel Core i7-7700HQ
Intel Core i5-1035G4
Intel Core i7-1065G7
...
max:
3DMark 11 - 3DM11 Performance Physics
min: 6537 moyenne: 8591 médian: 8534 (23%) maximum: 10599 Points
CPU TDP ? TDP 15 W TDP 17 W 98% 71% 100%
...
Intel Core i7-1065G7
Intel Core i7-7700HQ
...
max:
3DMark - 3DMark Ice Storm Physics
43938 Points (36%)
...
Intel Xeon E-2176M
...
max:
Intel Core i5-14600K
3DMark - 3DMark Ice Storm Extreme Physics
44043 Points (36%)
...
Intel Xeon E-2176M
Intel Core i7-7700HQ
...
max:
Intel Core i5-14600K
3DMark - 3DMark Ice Storm Unlimited Physics
51608 Points (43%)
...
Intel Core i7-7700HQ
Intel Core i5-1035G4
Intel Core i5-1035G1
...
max:
Intel Core i5-14600K
3DMark - 3DMark Cloud Gate Physics
min: 6231 moyenne: 7704 médian: 7279 (18%) maximum: 10034 Points
CPU TDP ? TDP 15 W TDP 17 W 100% 76% 95%
...
Intel Core i5-1230U
Intel Core i3-1215U
Intel Xeon E-2176M
...
max:
Intel Core i9-14900K
3DMark - 3DMark Fire Strike Standard Physics
min: 9003 moyenne: 10590 médian: 10730 (19%) maximum: 11864 Points
CPU TDP ? TDP 15 W TDP 17 W 90% 76% 100%
...
Intel Core i5-8260U
Intel Core i7-7700HQ
...
max:
Intel Core i9-14900K
3DMark - 3DMark Time Spy CPU
min: 2331 moyenne: 3331 médian: 3587 (15%) maximum: 4127 Points
CPU TDP ? TDP 15 W TDP 17 W 79% 66% 100%
...
AMD Ryzen Embedded V1605B
Intel Core i5-8260U
Intel Core i5-1035G1
Intel Core i7-1065G7
Intel Core i5-1038NG7
...
max:
Intel Core i9-14900K
Geekbench 6.2 - Geekbench 6.2 Single-Core
1563 points (48%)
AMD Ryzen 5 5560U
AMD Ryzen 7 7735H
...
Apple M3 Pro 12-Core
max:
Intel Core i9-14900K
Geekbench 6.2 - Geekbench 6.2 Multi-Core
4090 points (16%)
AMD Ryzen 5 5560U
...
Apple M3 Max 16-Core
max:
AMD Ryzen Threadripper PRO 7995WX
Geekbench 5.5 - Geekbench 5.1 - 5.4 64 Bit Single-Core
min: 1219 moyenne: 1240 médian: 1226 (52%) maximum: 1274 points
CPU TDP ? TDP 15 W TDP 17 W 100% 97% 98%
...
Intel Core i5-1035G1
Intel Core i5-1038NG7
Intel Core i7-1065G7
...
Geekbench 5.5 - Geekbench 5.1 - 5.4 64 Bit Multi-Core
min: 3351 moyenne: 4350 médian: 3934 (7%) maximum: 5553 points
CPU TDP ? TDP 15 W TDP 17 W 74% 71% 100%
...
Intel Core i7-1065G7
Intel Core i7-1068G7
Intel Core i5-1038NG7
...
Apple M3 Max 16-Core
max:
AMD Ryzen Threadripper PRO 7995WX
Geekbench 5.0 - Geekbench 5.0 64 Bit Single-Core
min: 1220 moyenne: 1229 médian: 1233 (5%) maximum: 1235 points
CPU TDP ? TDP 15 W TDP 17 W 100% 99% 100%
...
Intel Core i5-1035G4
Intel Core i7-1065G7
...
max:
Intel Core i9-14900K
Geekbench 5.0 - Geekbench 5.0 64 Bit Multi-Core
min: 3924 moyenne: 4908 médian: 5168 (16%) maximum: 5631 points
CPU TDP ? TDP 15 W TDP 17 W 92% 70% 100%
...
Intel Core i7-1065G7
...
max:
Geekbench 4.4 - Geekbench 4.1 - 4.4 64 Bit Single-Core
min: 4762 moyenne: 5082 médian: 5203 (53%) maximum: 5281 points
CPU TDP ? TDP 15 W TDP 17 W 100% 90% 99%
...
Intel Core i5-1034G1
Intel Core i5-1035G1
Intel Core i7-9750H
...
max:
Intel Core i9-14900K
Geekbench 4.4 - Geekbench 4.1 - 4.4 64 Bit Multi-Core
min: 19324 moyenne: 21447 médian: 22485 (25%) maximum: 22533 points
CPU TDP ? TDP 15 W TDP 17 W 100% 86% 100%
...
Intel Xeon E-2176M
Intel Core i7-9750H
...
max:
Intel Core i9-14900K
Mozilla Kraken 1.1 - Kraken 1.1 Total Score *
min: 853 moyenne: 901 médian: 914 (1%) maximum: 968 ms
CPU TDP ? TDP 15 W TDP 17 W 100% 100% 100%
...
Intel Core i7-1065G7
Intel Core i5-1035G4
Intel Core i5-1035G1
...
max:
WebXPRT 4 - WebXPRT 4 Score
161.3 Points (48%)
...
Intel Core i5-8265U
Apple M1
...
max:
Intel Core i9-14900K
WebXPRT 3 - WebXPRT 3 Score
min: 202 moyenne: 205.2 médian: 206 (43%) maximum: 207 Points
CPU TDP ? TDP 15 W TDP 17 W 100% 99% 98%
...
Intel Core i7-1065G7
...
CrossMark - CrossMark Overall
1018 Points (39%)
...
Intel Core i5-8265U
Intel Core i7-1065G7
...
max:
Intel Core i9-14900K
Power Consumption - Prime95 Power Consumption - external Monitor *
min: 29.1 moyenne: 46.9 médian: 46.9 (8%) maximum: 64.7 Watt
CPU TDP ? TDP 15 W 100% 107%
...
Intel Core i5-1240U
...
max:
0 5 10 15 20 25 30 35 40 Tooltip Minipc Union NiPoGi CK10 - 10810U: Ø29.1 (25.3-42.4)
Power Consumption - Cinebench R15 Multi Power Consumption - external Monitor *
min: 32.6 moyenne: 53.9 médian: 53.9 (10%) maximum: 75.1 Watt
CPU TDP ? TDP 15 W 100% 109%
...
AMD Ryzen 7 7735H
...
max:
Intel Core i9-14900K
0 5 10 15 20 25 30 35 40 45 50 Tooltip Minipc Union NiPoGi CK10 - 10810U: Ø32.6 (23.3-53.5)
Power Consumption - Idle Power Consumption - external Monitor *
5.5 Watt (4%)
...
Apple M3 Max 16-Core
Intel Core i5-1230U
Apple M3 Pro 12-Core
Intel Core i5-8260U
...
max:
0 1 2 3 4 5 6 Tooltip Minipc Union NiPoGi CK10 - 10810U: Ø5.49 (5.09-6.37)
Power Consumption - Cinebench R15 Multi Power Efficiency - external Monitor
14.2 Points per Watt (11%)
...
Intel Atom x7-Z8750
Intel Core i5-8260U
Intel Core i7-9750H
...
- Amplitude des valeurs obtenues dans le benchmark avec cette carte graphique
- Valeur moyenne obtenue dans le benchmark avec cette carte graphique
* Plus les chiffres sont petits, plus les performances sont élevées
v1.26
log 06. 17:29:38
#0 no ids found in url (should be separated by "_") +0s ... 0s
#1 not redirecting to Ajax server +0s ... 0s
#2 did not recreate cache, as it is less than 5 days old! Created at Sat, 02 Dec 2023 15:30:08 +0100 +0.001s ... 0.001s
#3 no comparison url found in template nbc.compare_page_2 needed +0.008s ... 0.009s
#4 no comparison url found in template nbc.compare_page_2 needed +0s ... 0.009s
#5 no comparison url found in template nbc.compare_page_2 needed +0s ... 0.01s
#6 no comparison url found in template nbc.compare_page_2 needed +0s ... 0.01s
#7 no comparison url found in template nbc.compare_page_2 needed +0s ... 0.01s
#8 no comparison url found in template nbc.compare_page_2 needed +0s ... 0.01s
#9 no comparison url found in template nbc.compare_page_2 needed +0s ... 0.011s
#10 no comparison url found in template nbc.compare_page_2 needed +0s ... 0.011s
#11 composed specs +0s ... 0.011s
#12 did output specs +0s ... 0.011s
#13 getting avg benchmarks for device 11935 +0.015s ... 0.026s
#14 got single benchmarks 11935 +0.018s ... 0.044s
#15 got avg benchmarks for devices +0s ... 0.044s
#16 min, max, avg, median took s +0.9s ... 0.944s
#17 no comparison url found in template nbc.compare_page_2 needed +0s ... 0.944s
#18 return log +0s ... 0.944s
Critiques du Intel Core i7-10810U processeur