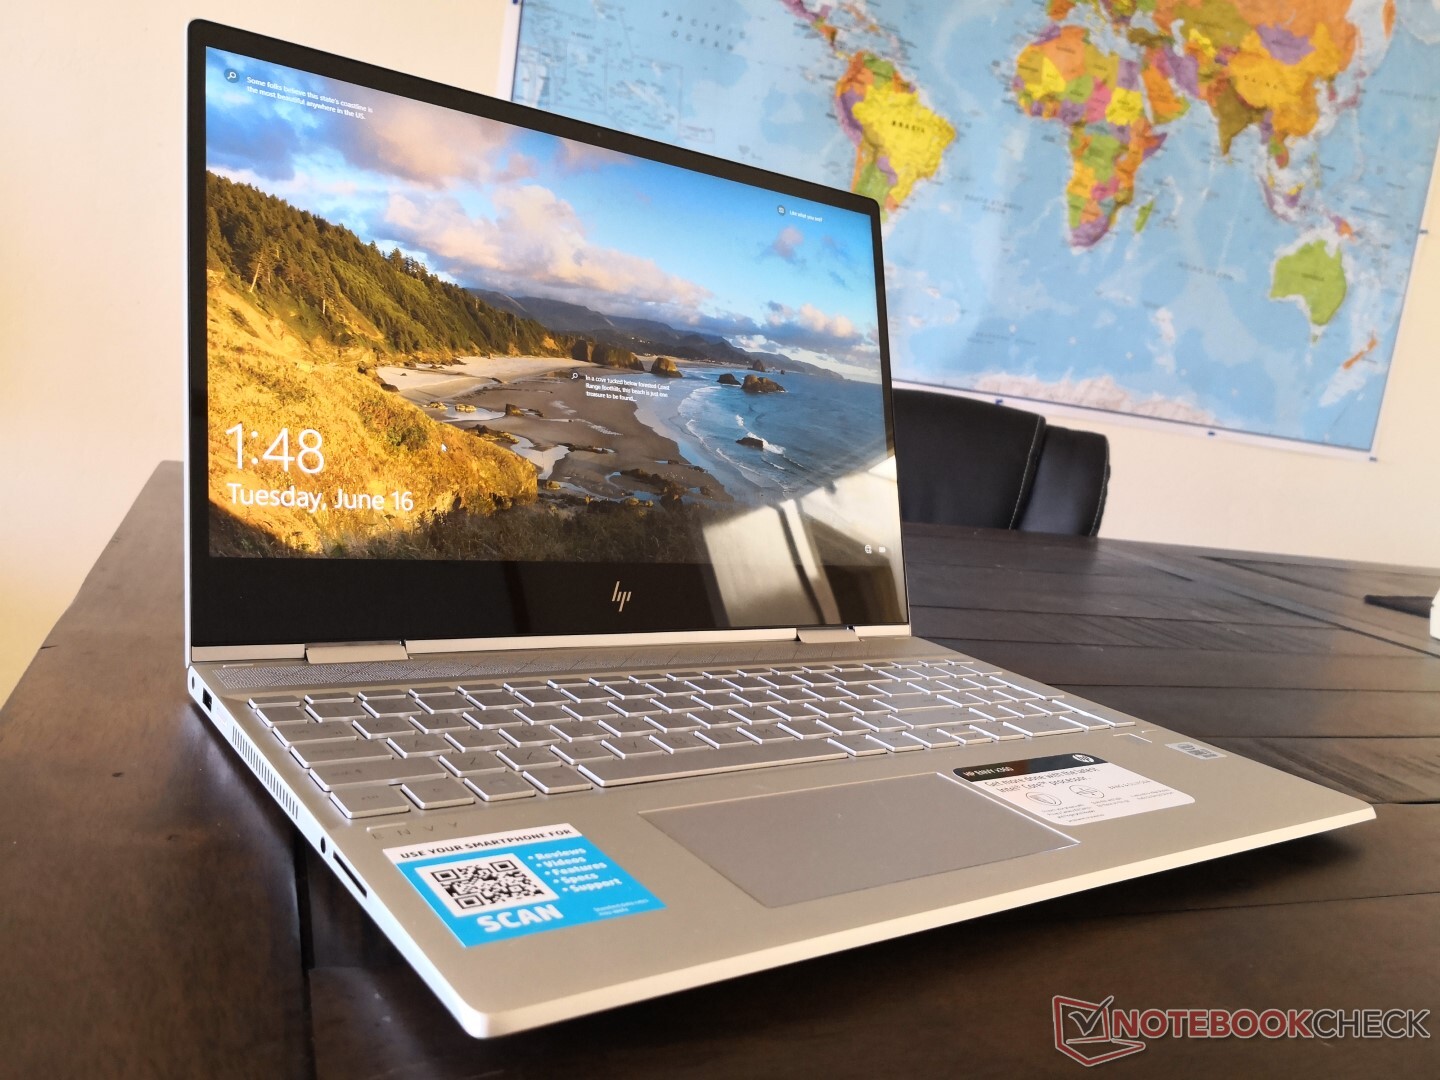
Test du HP Envy x360 15 2020 (i7-10510U, UHD 620, FHD) : un convertible un peu trop familier
Note | Date | Modèle | Poids | Épaisseur | Taille | Résolution | Prix |
|---|---|---|---|---|---|---|---|
| 80.4 % v7 (old) | 07/20 | HP Envy x360 15-dr1679cl i7-10510U, UHD Graphics 620 | 2.1 kg | 17.2 mm | 15.60" | 1920x1080 | |
| 84.8 % v7 (old) | 01/20 | Lenovo Yoga C740-15IML i7-10510U, UHD Graphics 620 | 1.9 kg | 17.25 mm | 15.60" | 1920x1080 | |
| 81.2 % v6 (old) | 06/18 | Dell Inspiron 15 5579-9672 i5-8250U, UHD Graphics 620 | 2.1 kg | 20.2 mm | 15.60" | 1920x1080 | |
| 86.5 % v7 (old) | 04/20 | Asus ZenBook Flip 15 UX563FD-A1027T i7-10510U, GeForce GTX 1050 Max-Q | 1.9 kg | 19.9 mm | 15.60" | 3840x2160 | |
| 86.8 % v7 (old) | 07/20 | Dell XPS 15 9500 Core i5 i5-10300H, UHD Graphics 630 | 1.8 kg | 18 mm | 15.60" | 1920x1200 |


| SD Card Reader | |
| average JPG Copy Test (av. of 3 runs) | |
| Dell XPS 15 9500 Core i5 (Toshiba Exceria Pro SDXC 64 GB UHS-II) | |
| HP Envy x360 15-dr1679cl (Toshiba Exceria Pro SDXC 64 GB UHS-II) | |
| HP Envy x360 15-bq102ng (Toshiba Exceria Pro SDXC 64 GB UHS-II) | |
| Dell Inspiron 15 5579-9672 (Toshiba Exceria Pro SDXC 64 GB UHS-II) | |
| maximum AS SSD Seq Read Test (1GB) | |
| Dell XPS 15 9500 Core i5 (Toshiba Exceria Pro SDXC 64 GB UHS-II) | |
| HP Envy x360 15-dr1679cl (Toshiba Exceria Pro SDXC 64 GB UHS-II) | |
| HP Envy x360 15-bq102ng (Toshiba Exceria Pro SDXC 64 GB UHS-II) | |
| Dell Inspiron 15 5579-9672 (Toshiba Exceria Pro SDXC 64 GB UHS-II) | |

")
")
| |||||||||||||||||||||||||
Homogénéité de la luminosité: 92 %
Valeur mesurée au centre, sur batterie: 261.2 cd/m²
Contraste: 687:1 (Valeurs des noirs: 0.38 cd/m²)
ΔE ColorChecker Calman: 5.4 | ∀{0.5-29.43 Ø4.73}
calibrated: 3.81
ΔE Greyscale Calman: 4.1 | ∀{0.09-98 Ø4.97}
58.7% sRGB (Argyll 1.6.3 3D)
37.4% AdobeRGB 1998 (Argyll 1.6.3 3D)
40.58% AdobeRGB 1998 (Argyll 3D)
58.8% sRGB (Argyll 3D)
39.28% Display P3 (Argyll 3D)
Gamma: 2.53
CCT: 6611 K
| HP Envy x360 15-dr1679cl AU Optronics B156HW02, IPS, 15.6", 1920x1080 | Lenovo Yoga C740-15IML B156HAN02.5, IPS LED, 15.6", 1920x1080 | Dell Inspiron 15 5579-9672 AUO, B156HW01, IPS, 15.6", 1920x1080 | Asus ZenBook Flip 15 UX563FD-A1027T BOE HF NE156QUM-N64, IPS, 15.6", 3840x2160 | Dell XPS 15 9500 Core i5 Sharp LQ156N1, IPS, 15.6", 1920x1200 | HP Envy x360 15-bq102ng Chi Mei CM15E9, IPS, 15.6", 1920x1080 | |
|---|---|---|---|---|---|---|
| Display | -1% | -6% | 67% | 91% | 5% | |
| Display P3 Coverage (%) | 39.28 | 39.04 -1% | 37 -6% | 66.2 69% | 81.5 107% | 41.36 5% |
| sRGB Coverage (%) | 58.8 | 57.9 -2% | 55.6 -5% | 97.2 65% | 100 70% | 62.2 6% |
| AdobeRGB 1998 Coverage (%) | 40.58 | 40.33 -1% | 38.23 -6% | 68.3 68% | 79.6 96% | 42.74 5% |
| Response Times | -33% | -14% | -50% | -14% | -6% | |
| Response Time Grey 50% / Grey 80% * (ms) | 39.6 ? | 50.8 ? -28% | 41 ? -4% | 60 ? -52% | 42 ? -6% | 40 ? -1% |
| Response Time Black / White * (ms) | 23.6 ? | 32.4 ? -37% | 29 ? -23% | 35 ? -48% | 28.8 ? -22% | 26 ? -10% |
| PWM Frequency (Hz) | 25000 ? | |||||
| Screen | -1% | 16% | 48% | 58% | 32% | |
| Brightness middle (cd/m²) | 261.2 | 286 9% | 251 -4% | 351 34% | 592 127% | 221 -15% |
| Brightness (cd/m²) | 248 | 268 8% | 240 -3% | 335 35% | 565 128% | 207 -17% |
| Brightness Distribution (%) | 92 | 83 -10% | 84 -9% | 87 -5% | 85 -8% | 87 -5% |
| Black Level * (cd/m²) | 0.38 | 0.2 47% | 0.2 47% | 0.31 18% | 0.46 -21% | 0.15 61% |
| Contrast (:1) | 687 | 1430 108% | 1255 83% | 1132 65% | 1287 87% | 1473 114% |
| Colorchecker dE 2000 * | 5.4 | 7.3 -35% | 5.25 3% | 1.74 68% | 3.19 41% | 4.35 19% |
| Colorchecker dE 2000 max. * | 16.31 | 21.7 -33% | 10.04 38% | 2.76 83% | 5.45 67% | 8.98 45% |
| Colorchecker dE 2000 calibrated * | 3.81 | 5.1 -34% | 2.03 47% | |||
| Greyscale dE 2000 * | 4.1 | 7 -71% | 3.28 20% | 2.22 46% | 3.9 5% | 3.09 25% |
| Gamma | 2.53 87% | 2.35 94% | 2.15 102% | 2.35 94% | 2.25 98% | 2.23 99% |
| CCT | 6611 98% | 5847 111% | 6502 100% | 6667 97% | 6522 100% | 6068 107% |
| Color Space (Percent of AdobeRGB 1998) (%) | 37.4 | 36.9 -1% | 35 -6% | 62 66% | 71.6 91% | 56 50% |
| Color Space (Percent of sRGB) (%) | 58.7 | 57.5 -2% | 55 -6% | 97 65% | 100 70% | 86 47% |
| Moyenne finale (programmes/paramètres) | -12% /
-5% | -1% /
8% | 22% /
38% | 45% /
55% | 10% /
22% |
* ... Moindre est la valeur, meilleures sont les performances
Temps de réponse de l'écran
| ↔ Temps de réponse noir à blanc | ||
|---|---|---|
| 23.6 ms ... hausse ↗ et chute ↘ combinées | ↗ 12 ms hausse | 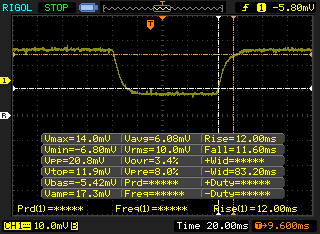 |
| ↘ 11.6 ms chute | ||
| L'écran montre de bons temps de réponse, mais insuffisant pour du jeu compétitif. En comparaison, tous les appareils testés affichent entre 0.1 (minimum) et 240 (maximum) ms. » 54 % des appareils testés affichent de meilleures performances. Cela signifie que les latences relevées sont moins bonnes que la moyenne (19.9 ms) de tous les appareils testés. | ||
| ↔ Temps de réponse gris 50% à gris 80% | ||
| 39.6 ms ... hausse ↗ et chute ↘ combinées | ↗ 19.6 ms hausse | 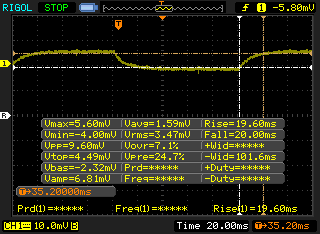 |
| ↘ 20 ms chute | ||
| L'écran souffre de latences très élevées, à éviter pour le jeu. En comparaison, tous les appareils testés affichent entre 0.165 (minimum) et 636 (maximum) ms. » 60 % des appareils testés affichent de meilleures performances. Cela signifie que les latences relevées sont moins bonnes que la moyenne (31.1 ms) de tous les appareils testés. | ||
Scintillement / MLI (Modulation de largeur d'impulsion)
| Scintillement / MLI (Modulation de largeur d'impulsion) non décelé | 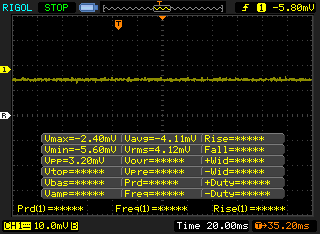 | ||
En comparaison, 52 % des appareils testés n'emploient pas MDI pour assombrir leur écran. Nous avons relevé une moyenne à 7798 (minimum : 5 - maximum : 343500) Hz dans le cas où une MDI était active. | |||
Cinebench R20: CPU (Multi Core) | CPU (Single Core)
Blender: v2.79 BMW27 CPU
7-Zip 18.03: 7z b 4 -mmt1 | 7z b 4
Geekbench 5.5: Single-Core | Multi-Core
HWBOT x265 Benchmark v2.2: 4k Preset
LibreOffice : 20 Documents To PDF
R Benchmark 2.5: Overall mean
| Cinebench R20 / CPU (Multi Core) | |
| MSI Prestige 15 A10SC | |
| Asus ZenBook 15 UX534FT-DB77 | |
| Lenovo Ideapad C340-15IWL-81N5004QGE | |
| Schenker VIA 15 | |
| Microsoft Surface Book 3 15 | |
| Dell Inspiron 15 5000 5585 | |
| HP Envy x360 15-dr1679cl | |
| Moyenne Intel Core i7-10510U (1015 - 1897, n=38) | |
| Acer Aspire 5 A515-54G | |
| Cinebench R20 / CPU (Single Core) | |
| MSI Prestige 15 A10SC | |
| Microsoft Surface Book 3 15 | |
| Asus ZenBook 15 UX534FT-DB77 | |
| Moyenne Intel Core i7-10510U (362 - 497, n=37) | |
| HP Envy x360 15-dr1679cl | |
| Acer Aspire 5 A515-54G | |
| Lenovo Ideapad C340-15IWL-81N5004QGE | |
| Dell Inspiron 15 5000 5585 | |
| Schenker VIA 15 | |
| Blender / v2.79 BMW27 CPU | |
| Microsoft Surface Book 3 15 | |
| Acer Aspire 5 A515-54G | |
| Moyenne Intel Core i7-10510U (628 - 1051, n=31) | |
| HP Envy x360 15-dr1679cl | |
| Schenker VIA 15 | |
| 7-Zip 18.03 / 7z b 4 -mmt1 | |
| HP Envy x360 15-dr1679cl | |
| Moyenne Intel Core i7-10510U (3747 - 4981, n=31) | |
| Microsoft Surface Book 3 15 | |
| Acer Aspire 5 A515-54G | |
| Schenker VIA 15 | |
| 7-Zip 18.03 / 7z b 4 | |
| HP Envy x360 15-dr1679cl | |
| Microsoft Surface Book 3 15 | |
| Moyenne Intel Core i7-10510U (12196 - 21298, n=31) | |
| Acer Aspire 5 A515-54G | |
| Schenker VIA 15 | |
| Geekbench 5.5 / Single-Core | |
| Microsoft Surface Book 3 15 | |
| Moyenne Intel Core i7-10510U (977 - 1287, n=31) | |
| HP Envy x360 15-dr1679cl | |
| Acer Aspire 5 A515-54G | |
| Schenker VIA 15 | |
| Geekbench 5.5 / Multi-Core | |
| Microsoft Surface Book 3 15 | |
| Acer Aspire 5 A515-54G | |
| Moyenne Intel Core i7-10510U (2474 - 4484, n=31) | |
| HP Envy x360 15-dr1679cl | |
| Schenker VIA 15 | |
| HWBOT x265 Benchmark v2.2 / 4k Preset | |
| HP Envy x360 15-dr1679cl | |
| Moyenne Intel Core i7-10510U (3.41 - 6.04, n=31) | |
| Microsoft Surface Book 3 15 | |
| Acer Aspire 5 A515-54G | |
| Schenker VIA 15 | |
| LibreOffice / 20 Documents To PDF | |
| Microsoft Surface Book 3 15 | |
| Acer Aspire 5 A515-54G | |
| HP Envy x360 15-dr1679cl | |
| Moyenne Intel Core i7-10510U (50.7 - 77.8, n=27) | |
| R Benchmark 2.5 / Overall mean | |
| Schenker VIA 15 | |
| Acer Aspire 5 A515-54G | |
| HP Envy x360 15-dr1679cl | |
| Microsoft Surface Book 3 15 | |
| Moyenne Intel Core i7-10510U (0.637 - 0.81, n=28) | |
* ... Moindre est la valeur, meilleures sont les performances
| PCMark 8 Home Score Accelerated v2 | 3458 points | |
| PCMark 8 Work Score Accelerated v2 | 5273 points | |
| PCMark 10 Score | 4356 points | |
Aide | ||
| DPC Latencies / LatencyMon - interrupt to process latency (max), Web, Youtube, Prime95 | |
| HP Envy x360 15-dr1679cl | |
| HP 470 G7 8VU24EA | |
| Dell XPS 15 9500 Core i5 | |
| Huawei MateBook 13 2020 i5 | |
* ... Moindre est la valeur, meilleures sont les performances
| HP Envy x360 15-dr1679cl Intel Optane Memory H10 with Solid State Storage 32GB + 512GB HBRPEKNX0202A(L/H) | Lenovo Yoga C740-15IML Samsung SSD PM981 MZVLB512HAJQ | Dell Inspiron 15 5579-9672 SK hynix SC311 SATA | Dell XPS 15 9500 Core i5 Toshiba KBG40ZNS256G NVMe | HP Envy x360 15-bq102ng Samsung PM961 MZVLW256HEHP | |
|---|---|---|---|---|---|
| AS SSD | 128% | -43% | 2% | 47% | |
| Seq Read (MB/s) | 931 | 2732 193% | 497.5 -47% | 1423 53% | 2465 165% |
| Seq Write (MB/s) | 331.5 | 1477 346% | 356.2 7% | 766 131% | 1318 298% |
| 4K Read (MB/s) | 72.8 | 57.7 -21% | 23.71 -67% | 42.21 -42% | 42.97 -41% |
| 4K Write (MB/s) | 119 | 136.3 15% | 47.64 -60% | 74.8 -37% | 81.9 -31% |
| 4K-64 Read (MB/s) | 389.7 | 1021 162% | 309.7 -21% | 973 150% | 1025 163% |
| 4K-64 Write (MB/s) | 573 | 1651 188% | 247 -57% | 218.8 -62% | 338.6 -41% |
| Access Time Read * (ms) | 0.07 | 0.062 11% | 0.142 -103% | 0.125 -79% | 0.077 -10% |
| Access Time Write * (ms) | 0.138 | 0.028 80% | 0.075 46% | 0.552 -300% | 0.046 67% |
| Score Read (Points) | 556 | 1352 143% | 383 -31% | 1157 108% | 1314 136% |
| Score Write (Points) | 725 | 1935 167% | 330 -54% | 370 -49% | 552 -24% |
| Score Total (Points) | 1565 | 3929 151% | 910 -42% | 2094 34% | 2488 59% |
| Copy ISO MB/s (MB/s) | 593 | 1972 233% | 301.3 -49% | 1151 94% | 700 18% |
| Copy Program MB/s (MB/s) | 495.5 | 642 30% | 166.4 -66% | 499.4 1% | 167.2 -66% |
| Copy Game MB/s (MB/s) | 566 | 1090 93% | 231.6 -59% | 733 30% | 370.4 -35% |
| CrystalDiskMark 5.2 / 6 | 71% | -56% | 3% | 10% | |
| Write 4K (MB/s) | 125.6 | 142.3 13% | 48.25 -62% | 93.3 -26% | 116 -8% |
| Read 4K (MB/s) | 145.8 | 47.56 -67% | 23.77 -84% | 45.9 -69% | 42.73 -71% |
| Write Seq (MB/s) | 509 | 2185 329% | 444.9 -13% | 1211 138% | 1222 140% |
| Read Seq (MB/s) | 1536 | 2235 46% | 497.5 -68% | 1633 6% | 1608 5% |
| Write 4K Q32T1 (MB/s) | 362.4 | 515 42% | 223.5 -38% | 273.1 -25% | 280.1 -23% |
| Read 4K Q32T1 (MB/s) | 307.3 | 413.4 35% | 171.8 -44% | 356 16% | 333.6 9% |
| Write Seq Q32T1 (MB/s) | 1320 | 2981 126% | 511 -61% | 1198 -9% | 1291 -2% |
| Read Seq Q32T1 (MB/s) | 2489 | 3565 43% | 553 -78% | 2269 -9% | 3183 28% |
| Write 4K Q8T8 (MB/s) | 310.2 | ||||
| Read 4K Q8T8 (MB/s) | 349.5 | ||||
| Moyenne finale (programmes/paramètres) | 100% /
107% | -50% /
-48% | 3% /
2% | 29% /
33% |
* ... Moindre est la valeur, meilleures sont les performances

Disk Throttling: DiskSpd Read Loop, Queue Depth 8
| 3DMark 11 Performance | 2052 points | |
| 3DMark Cloud Gate Standard Score | 8532 points | |
| 3DMark Fire Strike Score | 1074 points | |
| 3DMark Time Spy Score | 447 points | |
Aide | ||
| Bas | Moyen | Élevé | Ultra | |
|---|---|---|---|---|
| The Witcher 3 (2015) | 18.9 | 12.4 | 6.5 | |
| Dota 2 Reborn (2015) | 71.9 | 41.8 | 18.8 | 16.7 |
| X-Plane 11.11 (2018) | 22.6 | 15.2 | 13.6 |
| HP Envy x360 15-dr1679cl UHD Graphics 620, i7-10510U, Intel Optane Memory H10 with Solid State Storage 32GB + 512GB HBRPEKNX0202A(L/H) | Lenovo Yoga C740-15IML UHD Graphics 620, i7-10510U, Samsung SSD PM981 MZVLB512HAJQ | Dell Inspiron 15 5579-9672 UHD Graphics 620, i5-8250U, SK hynix SC311 SATA | Asus ZenBook Flip 15 UX563FD-A1027T GeForce GTX 1050 Max-Q, i7-10510U, Samsung SSD PM981 MZVLB1T0HALR | Dell XPS 15 9500 Core i5 UHD Graphics 630, i5-10300H, Toshiba KBG40ZNS256G NVMe | HP Envy x360 15-bq102ng Vega 8, R5 2500U, Samsung PM961 MZVLW256HEHP | |
|---|---|---|---|---|---|---|
| Noise | 5% | 4% | 1% | 7% | -2% | |
| arrêt / environnement * (dB) | 28 | 29.3 -5% | 30.4 -9% | 30.3 -8% | 28 -0% | 30.13 -8% |
| Idle Minimum * (dB) | 28 | 29.3 -5% | 30.4 -9% | 30.3 -8% | 28 -0% | 30.13 -8% |
| Idle Average * (dB) | 30.2 | 29.3 3% | 30.4 -1% | 30.3 -0% | 28 7% | 30.13 -0% |
| Idle Maximum * (dB) | 31.5 | 29.6 6% | 31.2 1% | 30.3 4% | 28 11% | 30.13 4% |
| Load Average * (dB) | 35.7 | 32.4 9% | 31.5 12% | 33.7 6% | 28 22% | 38.8 -9% |
| Load Maximum * (dB) | 43.1 | 33.3 23% | 31.5 27% | 38.9 10% | 41.9 3% | 38.8 10% |
| Witcher 3 ultra * (dB) | 37.4 |
* ... Moindre est la valeur, meilleures sont les performances
Degré de la nuisance sonore
| Au repos |
| 28 / 30.2 / 31.5 dB(A) |
| Fortement sollicité |
| 35.7 / 43.1 dB(A) |
 | ||
30 dB silencieux 40 dB(A) audible 50 dB(A) bruyant |
||
min: | ||
(-) La température maximale du côté supérieur est de 47 °C / 117 F, par rapport à la moyenne de 35.4 °C / 96 F, allant de 19.6 à 60 °C pour la classe Convertible.
(±) Le fond chauffe jusqu'à un maximum de 44 °C / 111 F, contre une moyenne de 36.9 °C / 98 F
(+) En utilisation inactive, la température moyenne du côté supérieur est de 30.8 °C / 87 F, par rapport à la moyenne du dispositif de 30.3 °C / 87 F.
(+) Les repose-poignets et le pavé tactile atteignent la température maximale de la peau (35.2 °C / 95.4 F) et ne sont donc pas chauds.
(-) La température moyenne de la zone de l'appui-paume de dispositifs similaires était de 28 °C / 82.4 F (-7.2 °C / #-13 F).
| Éteint/en veille | |
| Au repos | |
| Fortement sollicité |
|
Légende:
min: | |
| HP Envy x360 15-dr1679cl i7-10510U, UHD Graphics 620, Intel Optane Memory H10 with Solid State Storage 32GB + 512GB HBRPEKNX0202A(L/H), IPS, 1920x1080, 15.6" | Lenovo Yoga C740-15IML i7-10510U, UHD Graphics 620, Samsung SSD PM981 MZVLB512HAJQ, IPS LED, 1920x1080, 15.6" | Dell Inspiron 15 5579-9672 i5-8250U, UHD Graphics 620, SK hynix SC311 SATA, IPS, 1920x1080, 15.6" | Asus ZenBook Flip 15 UX563FD-A1027T i7-10510U, GeForce GTX 1050 Max-Q, Samsung SSD PM981 MZVLB1T0HALR, IPS, 3840x2160, 15.6" | Dell XPS 15 9500 Core i5 i5-10300H, UHD Graphics 630, Toshiba KBG40ZNS256G NVMe, IPS, 1920x1200, 15.6" | HP Envy x360 15-bq102ng R5 2500U, Vega 8, Samsung PM961 MZVLW256HEHP, IPS, 1920x1080, 15.6" | |
|---|---|---|---|---|---|---|
| Power Consumption | 0% | 13% | -43% | -5% | -1% | |
| Idle Minimum * (Watt) | 4.3 | 2.97 31% | 3.9 9% | 2.3 47% | 2.9 33% | 4.8 -12% |
| Idle Average * (Watt) | 7.2 | 7.2 -0% | 6.6 8% | 10.3 -43% | 7.6 -6% | 7 3% |
| Idle Maximum * (Watt) | 7.5 | 9.9 -32% | 9.3 -24% | 11 -47% | 8 -7% | 9.5 -27% |
| Load Average * (Watt) | 40.4 | 40.8 -1% | 30.2 25% | 77 -91% | 41.7 -3% | 40.8 -1% |
| Load Maximum * (Watt) | 65.7 | 64.7 2% | 33.2 49% | 118 -80% | 94.8 -44% | 44.3 33% |
| Witcher 3 ultra * (Watt) | 68 |
* ... Moindre est la valeur, meilleures sont les performances
| HP Envy x360 15-dr1679cl i7-10510U, UHD Graphics 620, 55.67 Wh | Lenovo Yoga C740-15IML i7-10510U, UHD Graphics 620, 60.3 Wh | Dell Inspiron 15 5579-9672 i5-8250U, UHD Graphics 620, 42 Wh | Asus ZenBook Flip 15 UX563FD-A1027T i7-10510U, GeForce GTX 1050 Max-Q, 71 Wh | Dell XPS 15 9500 Core i5 i5-10300H, UHD Graphics 630, 56 Wh | HP Envy x360 15-bq102ng R5 2500U, Vega 8, 55.8 Wh | |
|---|---|---|---|---|---|---|
| Autonomie de la batterie | 0% | -33% | -4% | -8% | -23% | |
| Reader / Idle (h) | 25.4 | 11.2 -56% | 19.5 -23% | 26.4 4% | ||
| WiFi v1.3 (h) | 9.2 | 10.4 13% | 7.3 -21% | 9.4 2% | 9.3 1% | 7.1 -23% |
| Load (h) | 2.3 | 2 -13% | 1.8 -22% | 2.5 9% | 1.6 -30% |
Points positifs
Points négatifs
La série Envy x360 15 stagne depuis quelques années. Malgré des changements au châssis et aux processeurs, la plupart de ces évolutions sont avant tout esthétiques, et avec des changements de performances minimales. Il faudra prendre la version avec GeForce MX330 si l'on veut tirer le meilleur du système, les versions de base Core i7 avec graphismes intégrés n'étant en rien meilleur que les anciennes versions avec Core i7-8565U ou Ryzen.
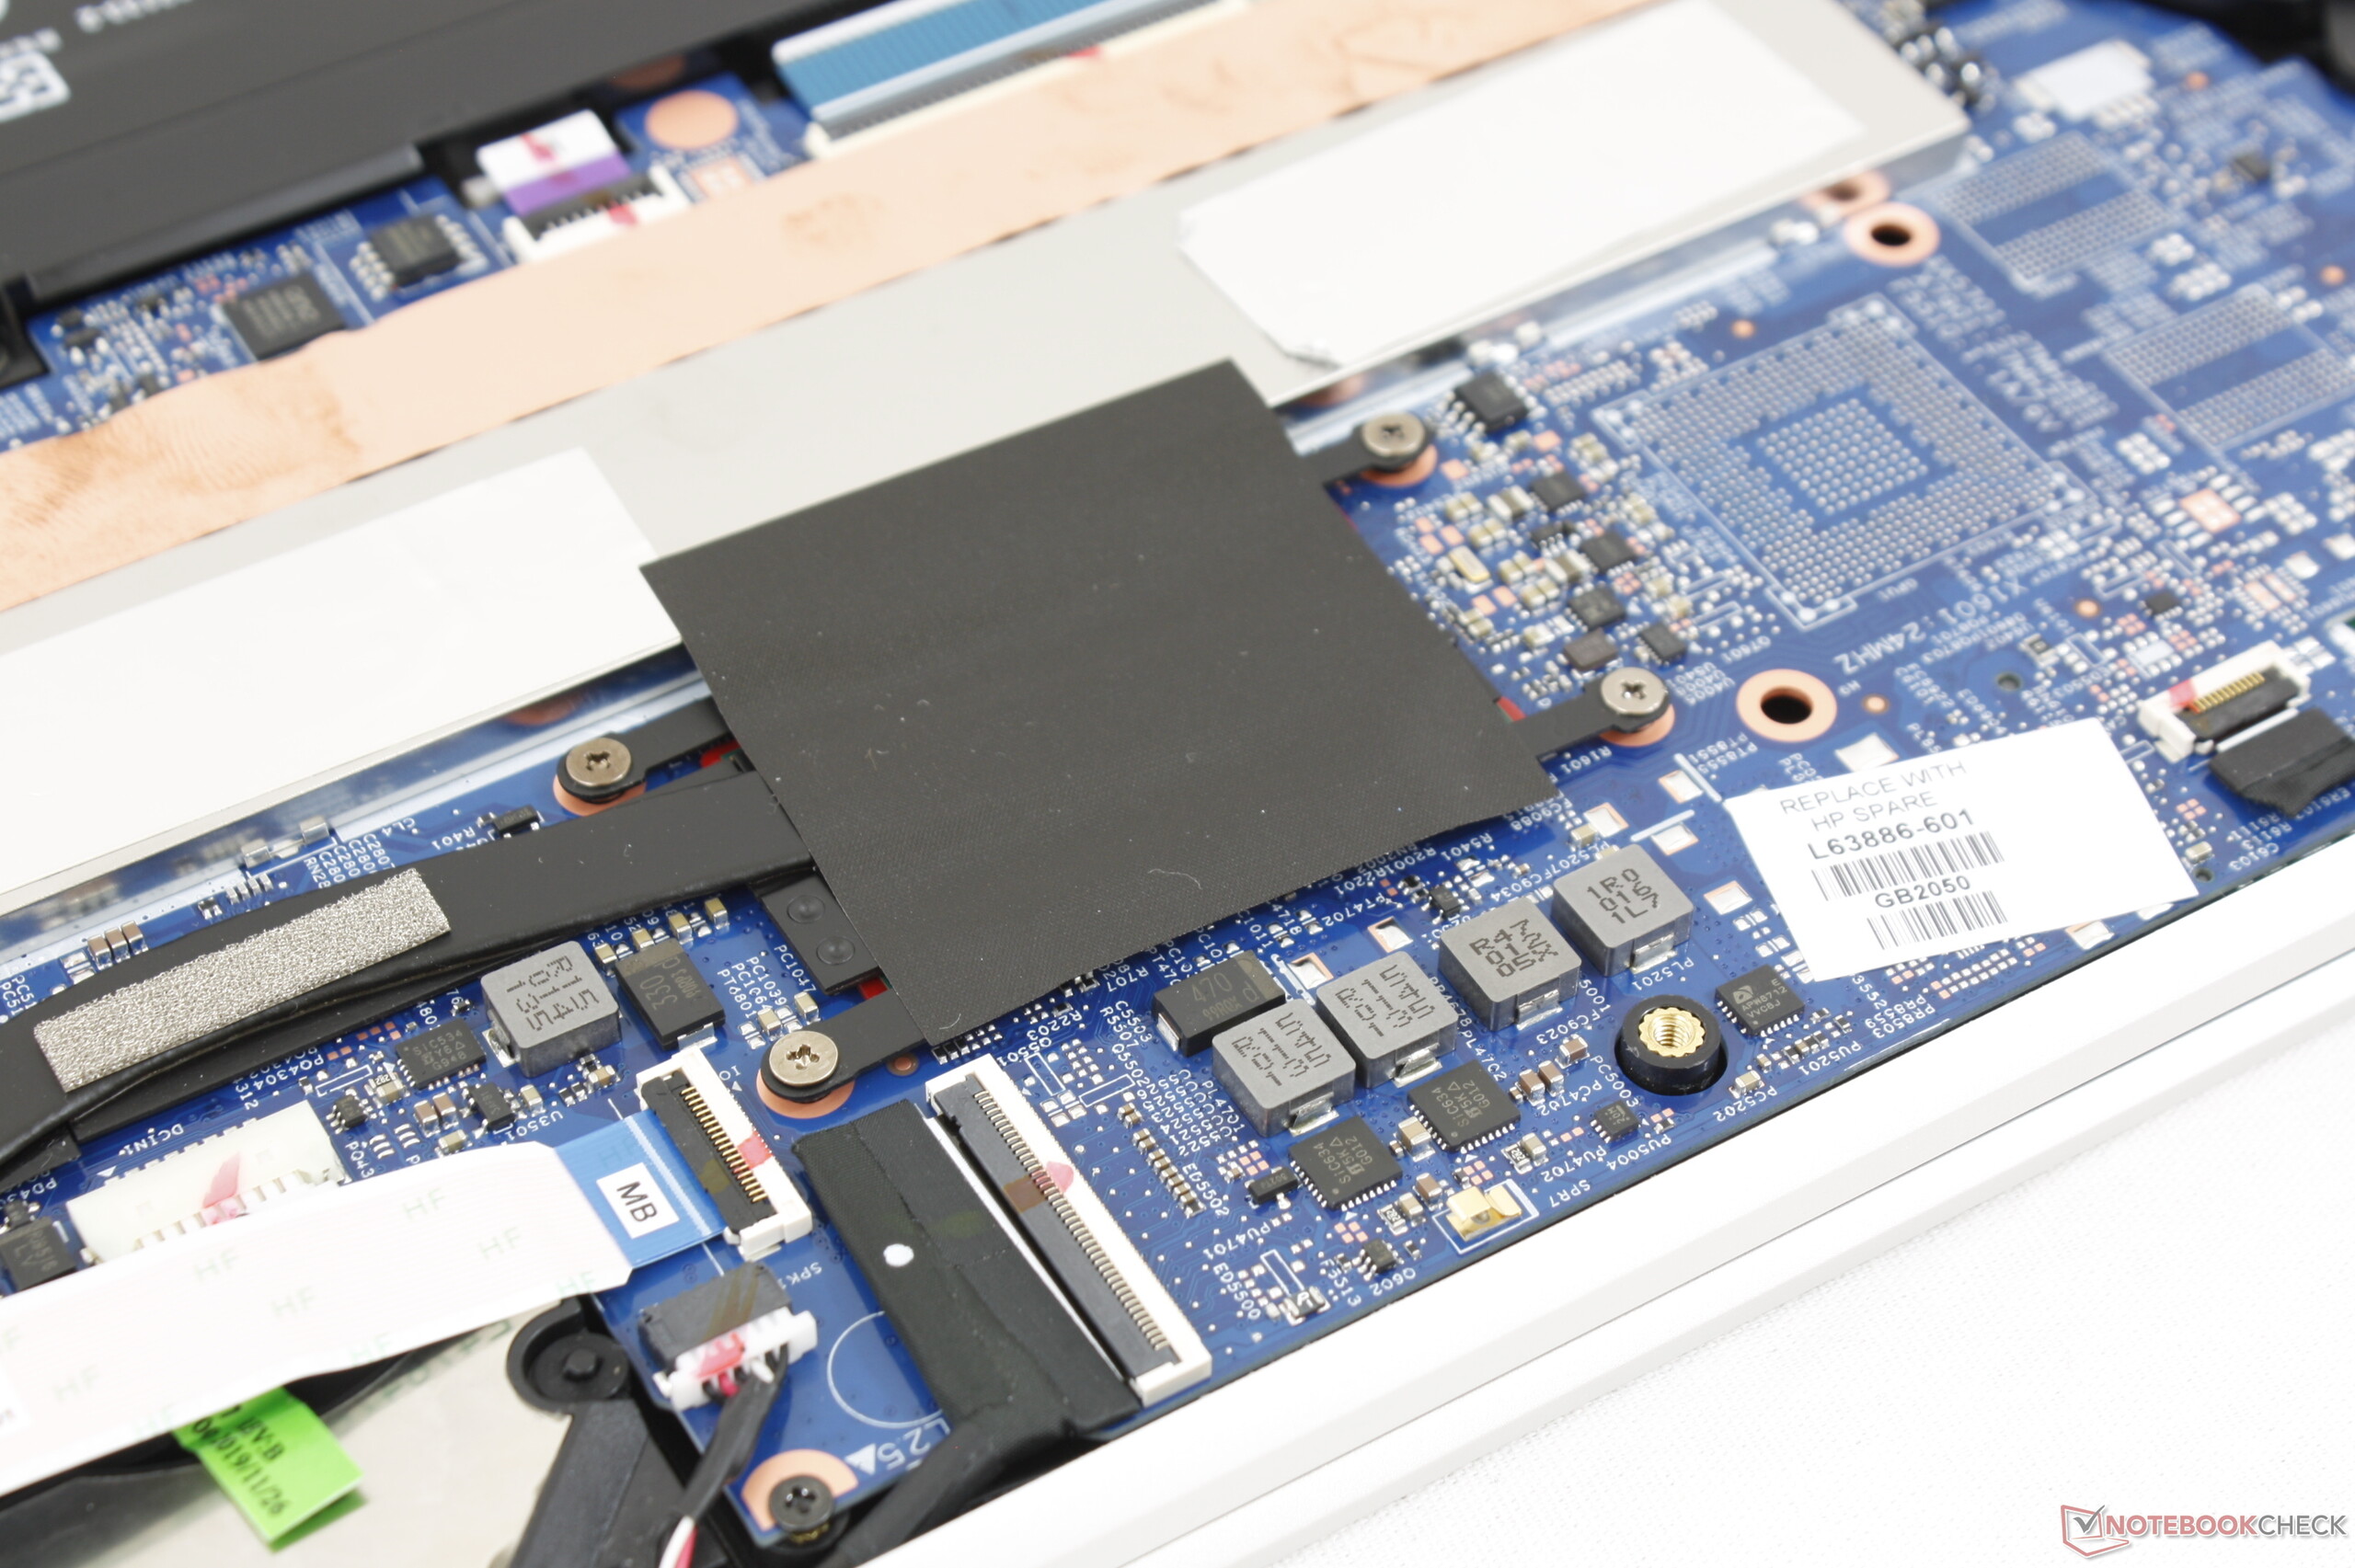
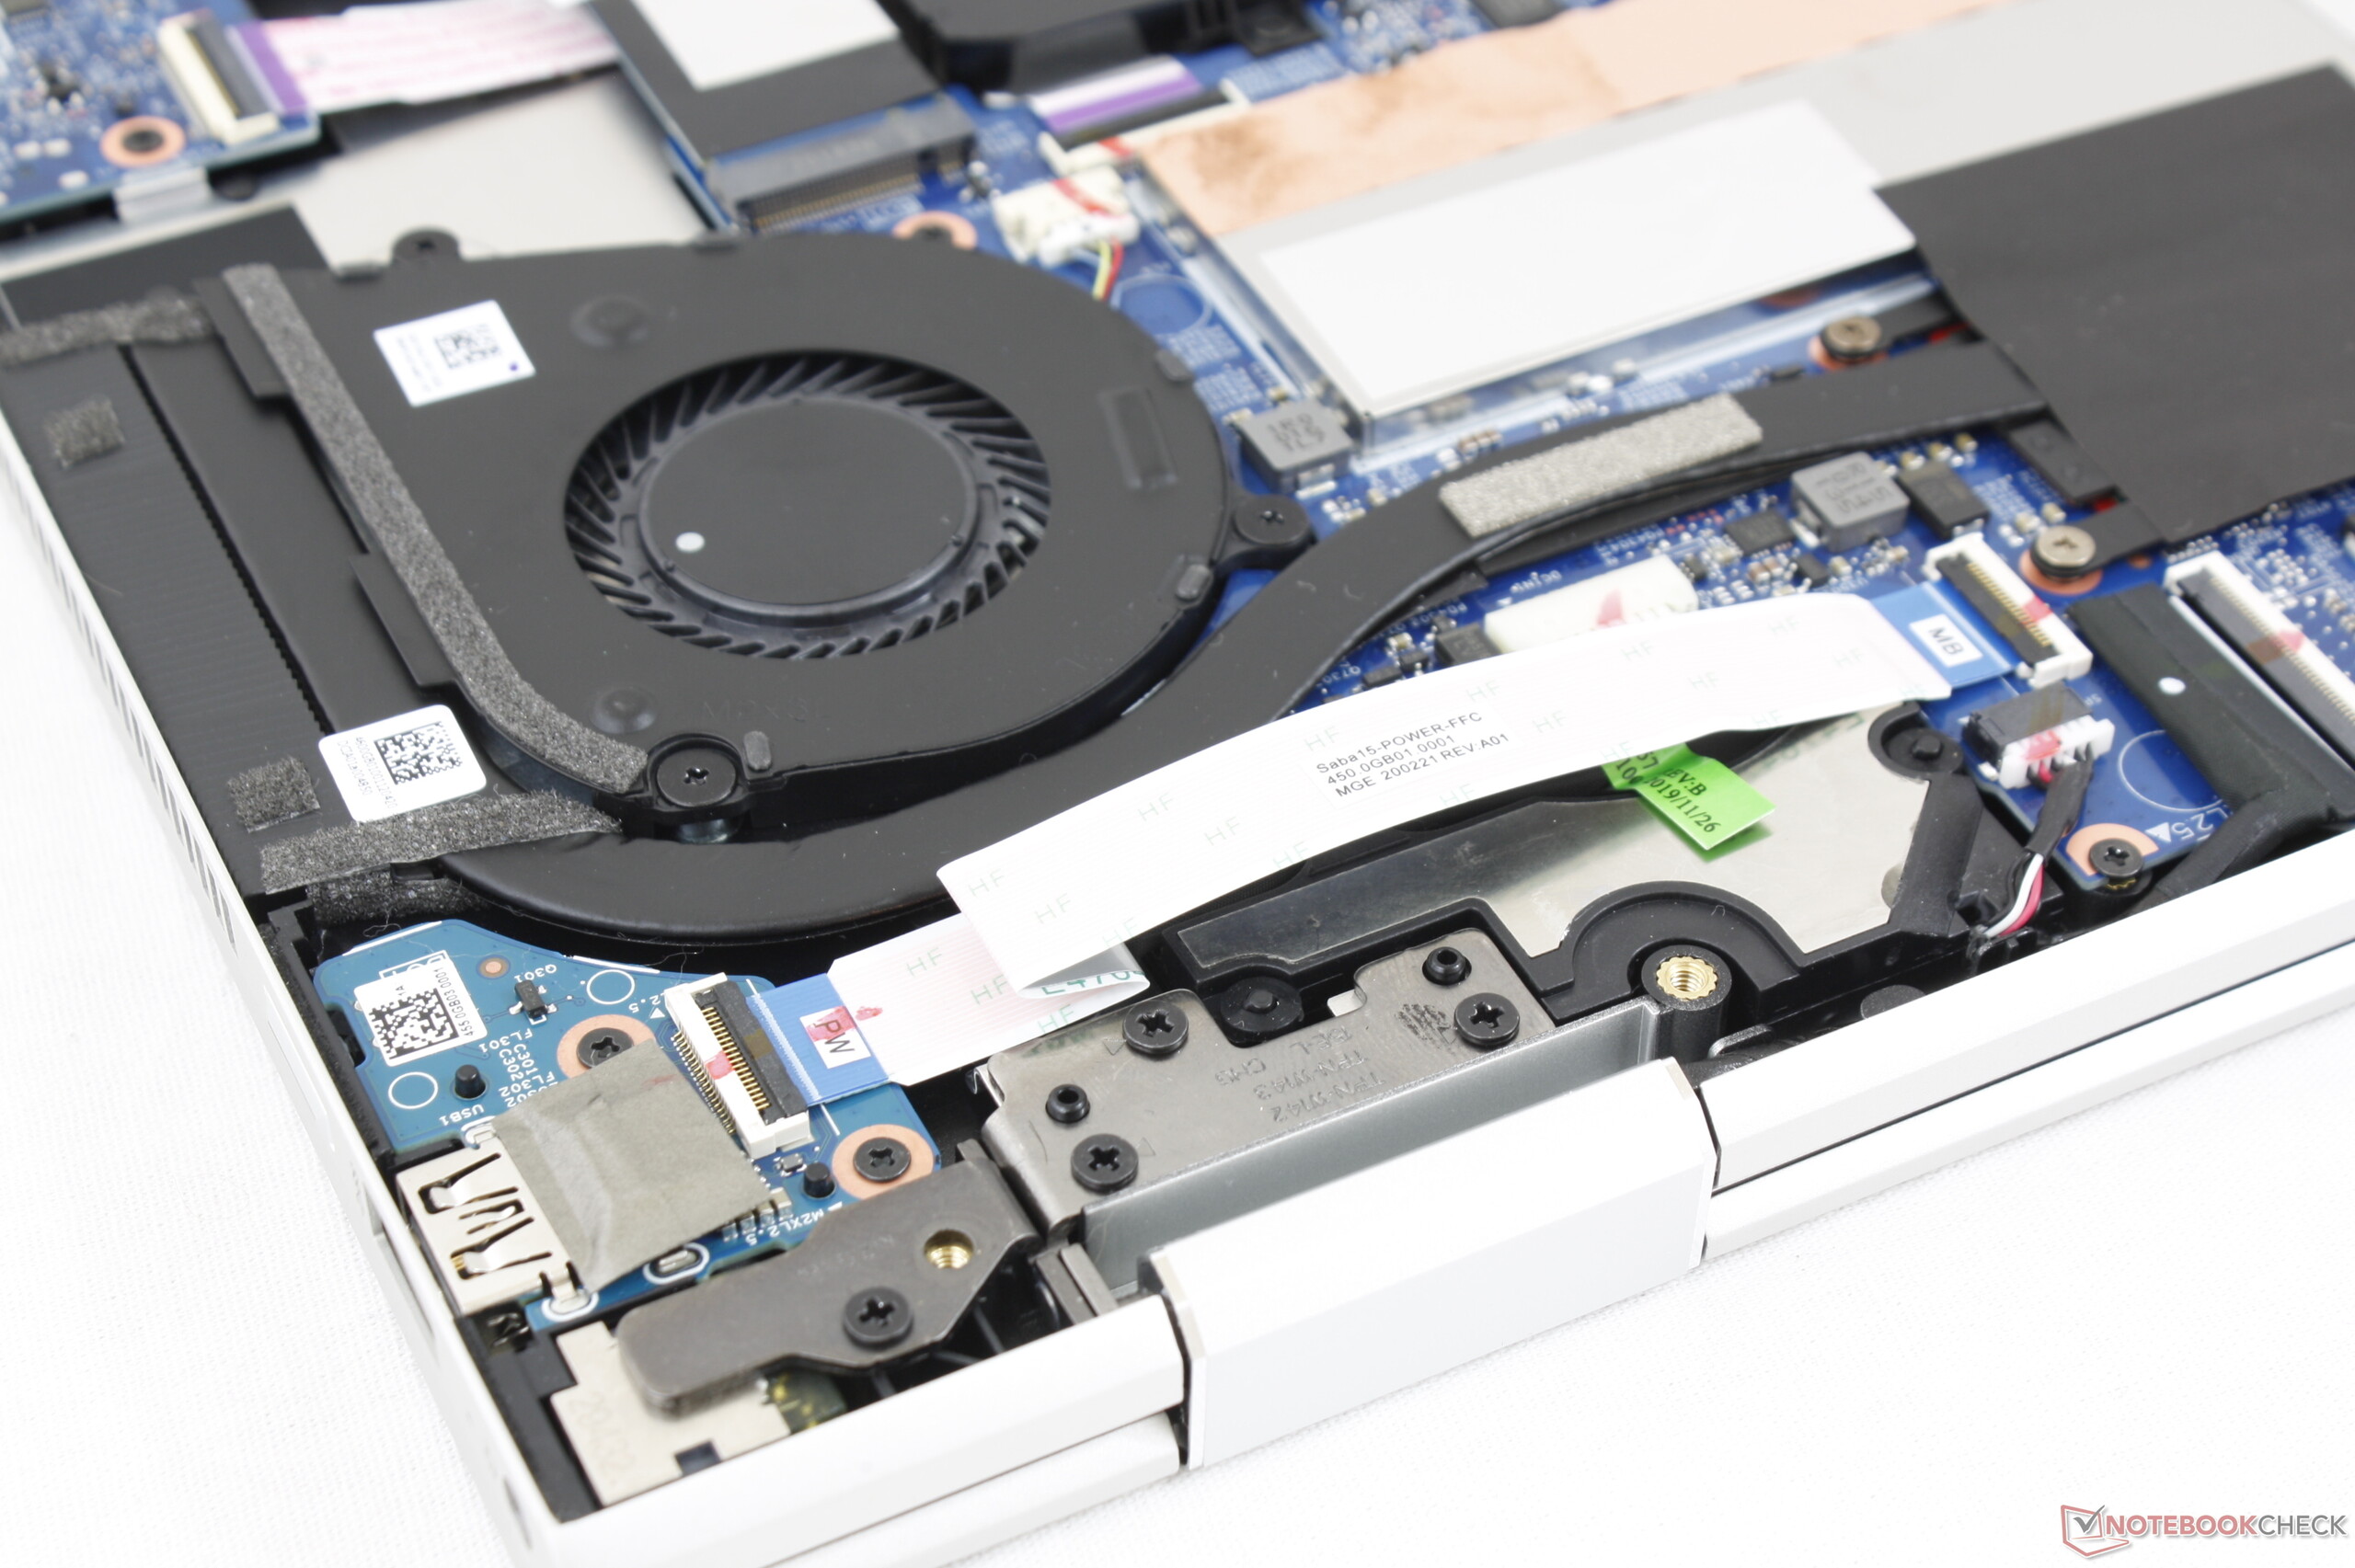
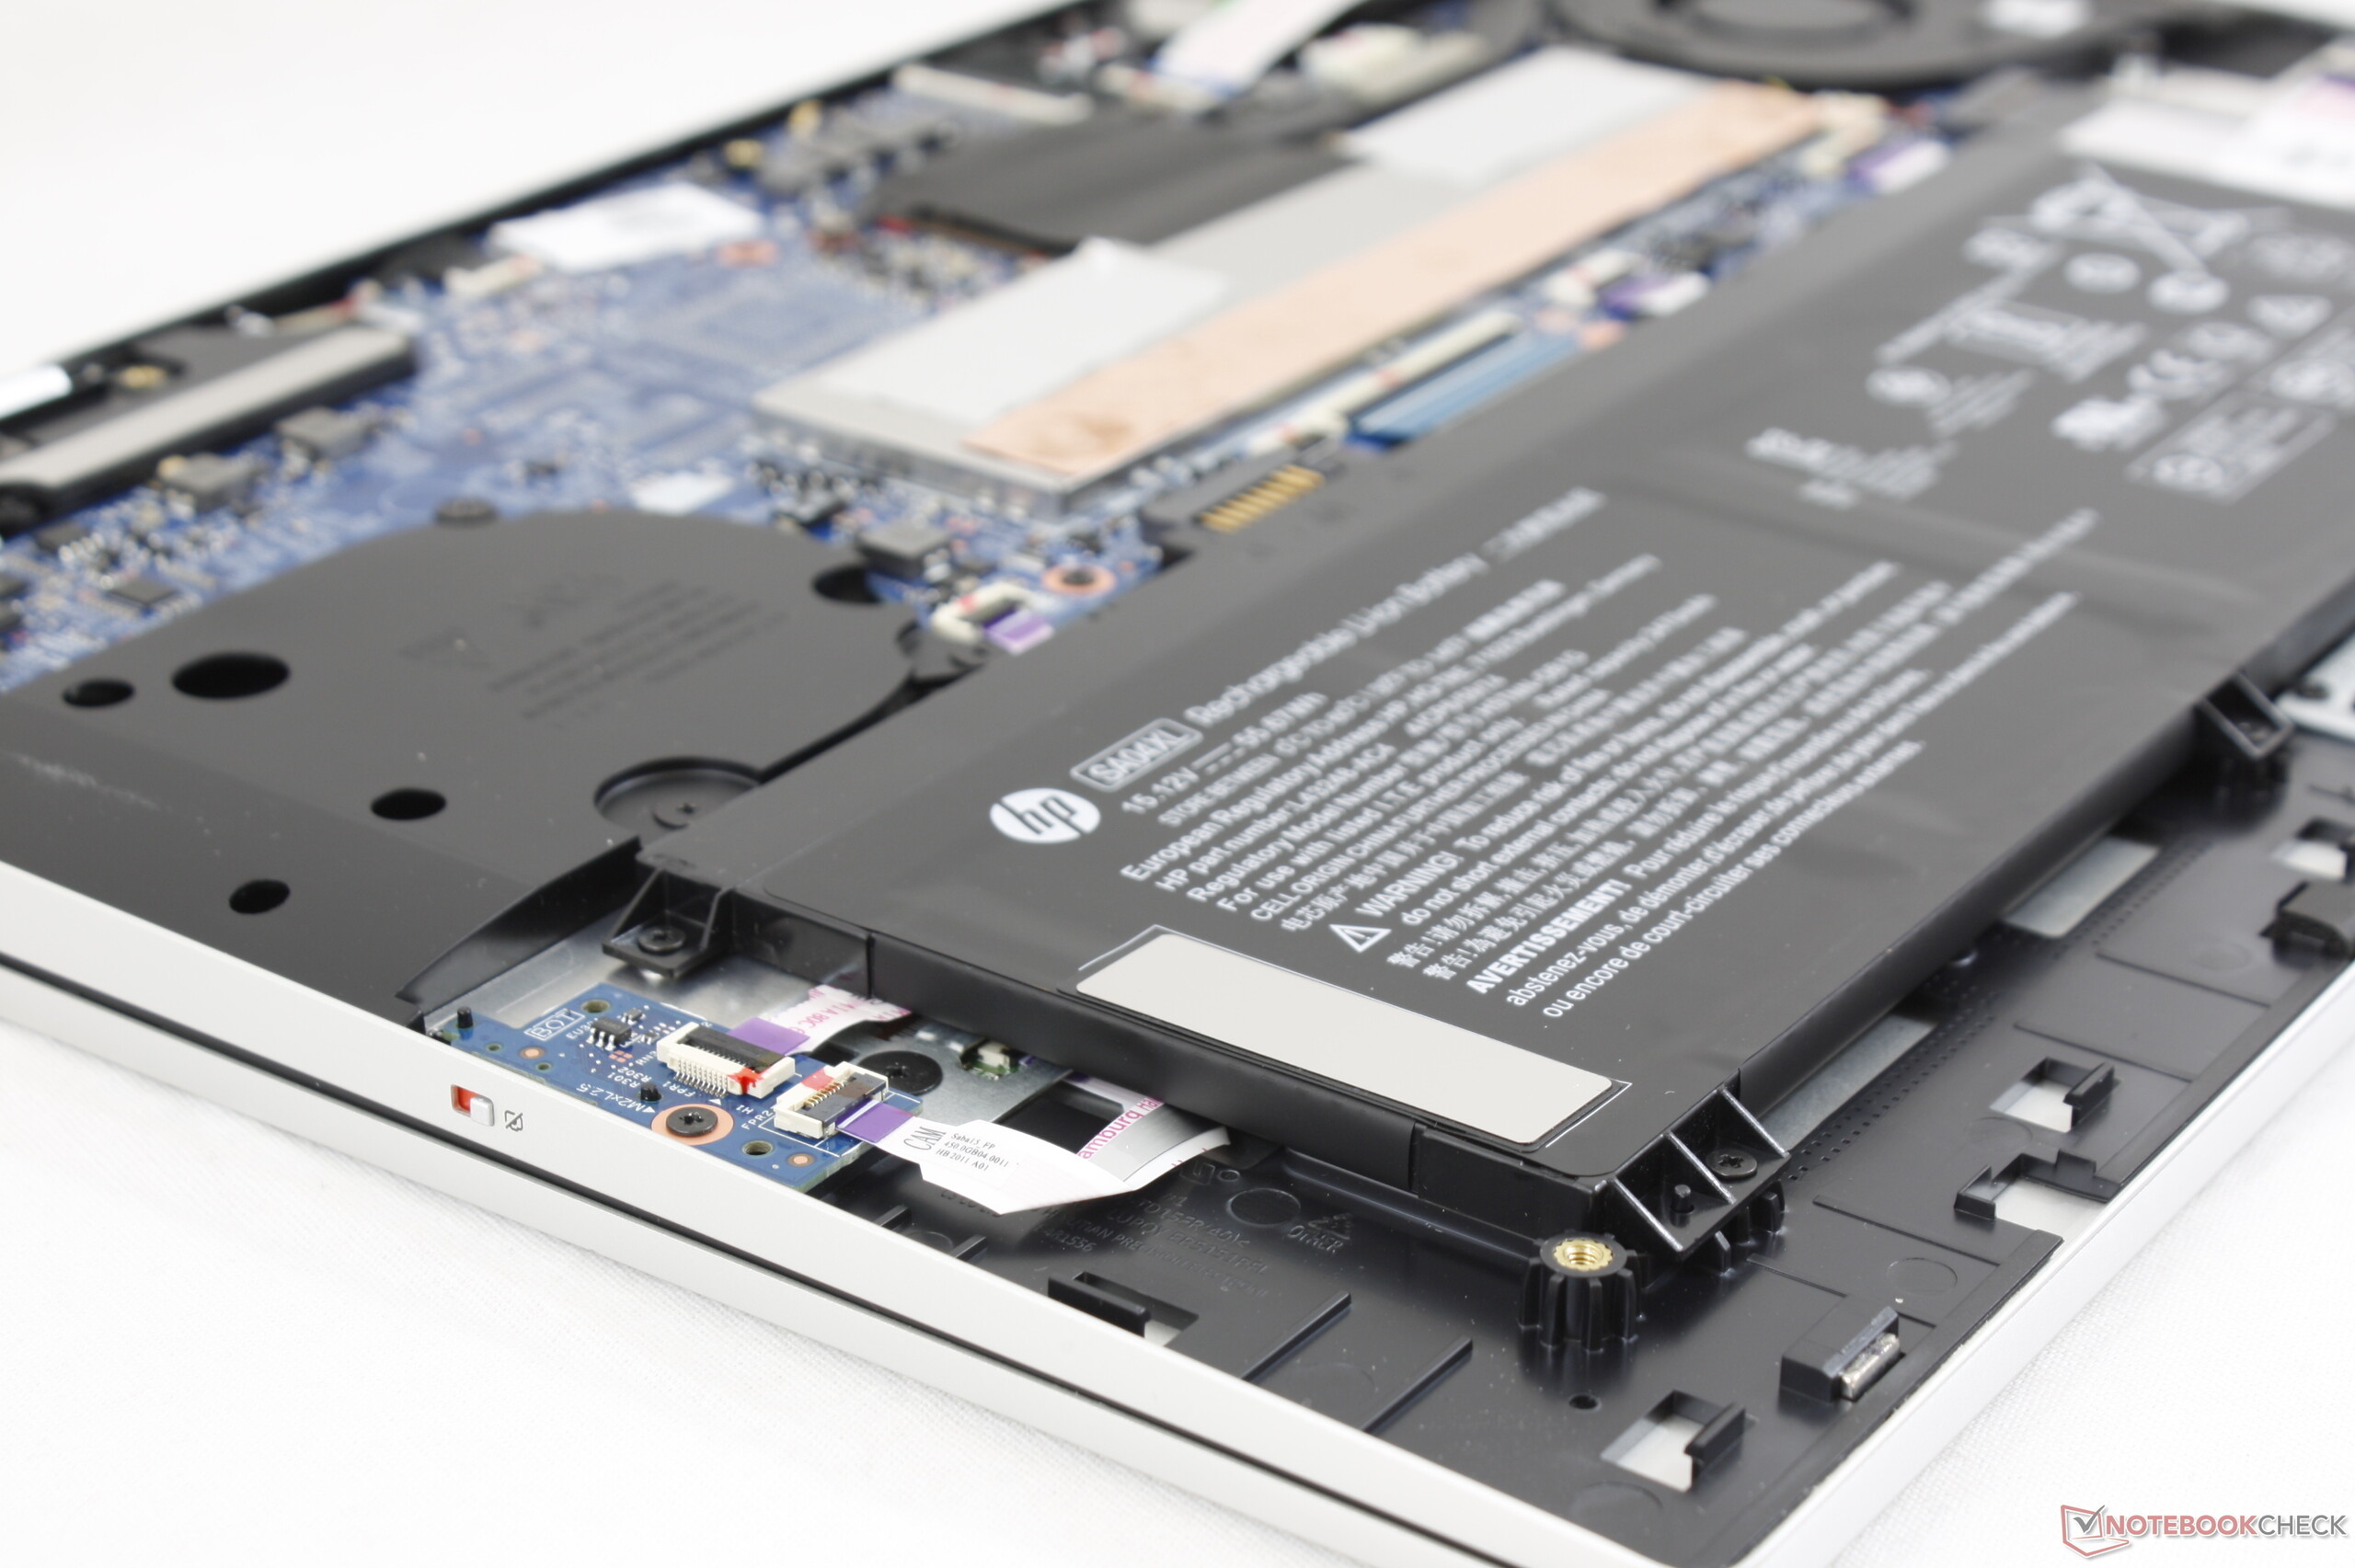
De plus, de nombreux problèmes de l'Envy x360 15 de 2018 sont toujours présents, HP ne les ayant toujours pas corrigés. La maintenance difficile est toujours un gros défaut, le changement de RAM ou de stockage étant frustrant. Il n'y a toujours pas de raccourci pour ouvrir le HP Command Center, ce qui est étrange, les performances du système étant très liées à cet utilitaire - il est possible de posséder l'appareil sans même savoir l'existence de ce logiciel...
A propos du HP Command Center, les performances du processeur sont moyennes en mode "Performances", et inférieures à la moyenne en mode "Recommandé". Les performances CPU sont tout juste au niveau attendu comparé aux autres portables, quand le profil d'alimentation et les ventilateurs sont au plus élevés.
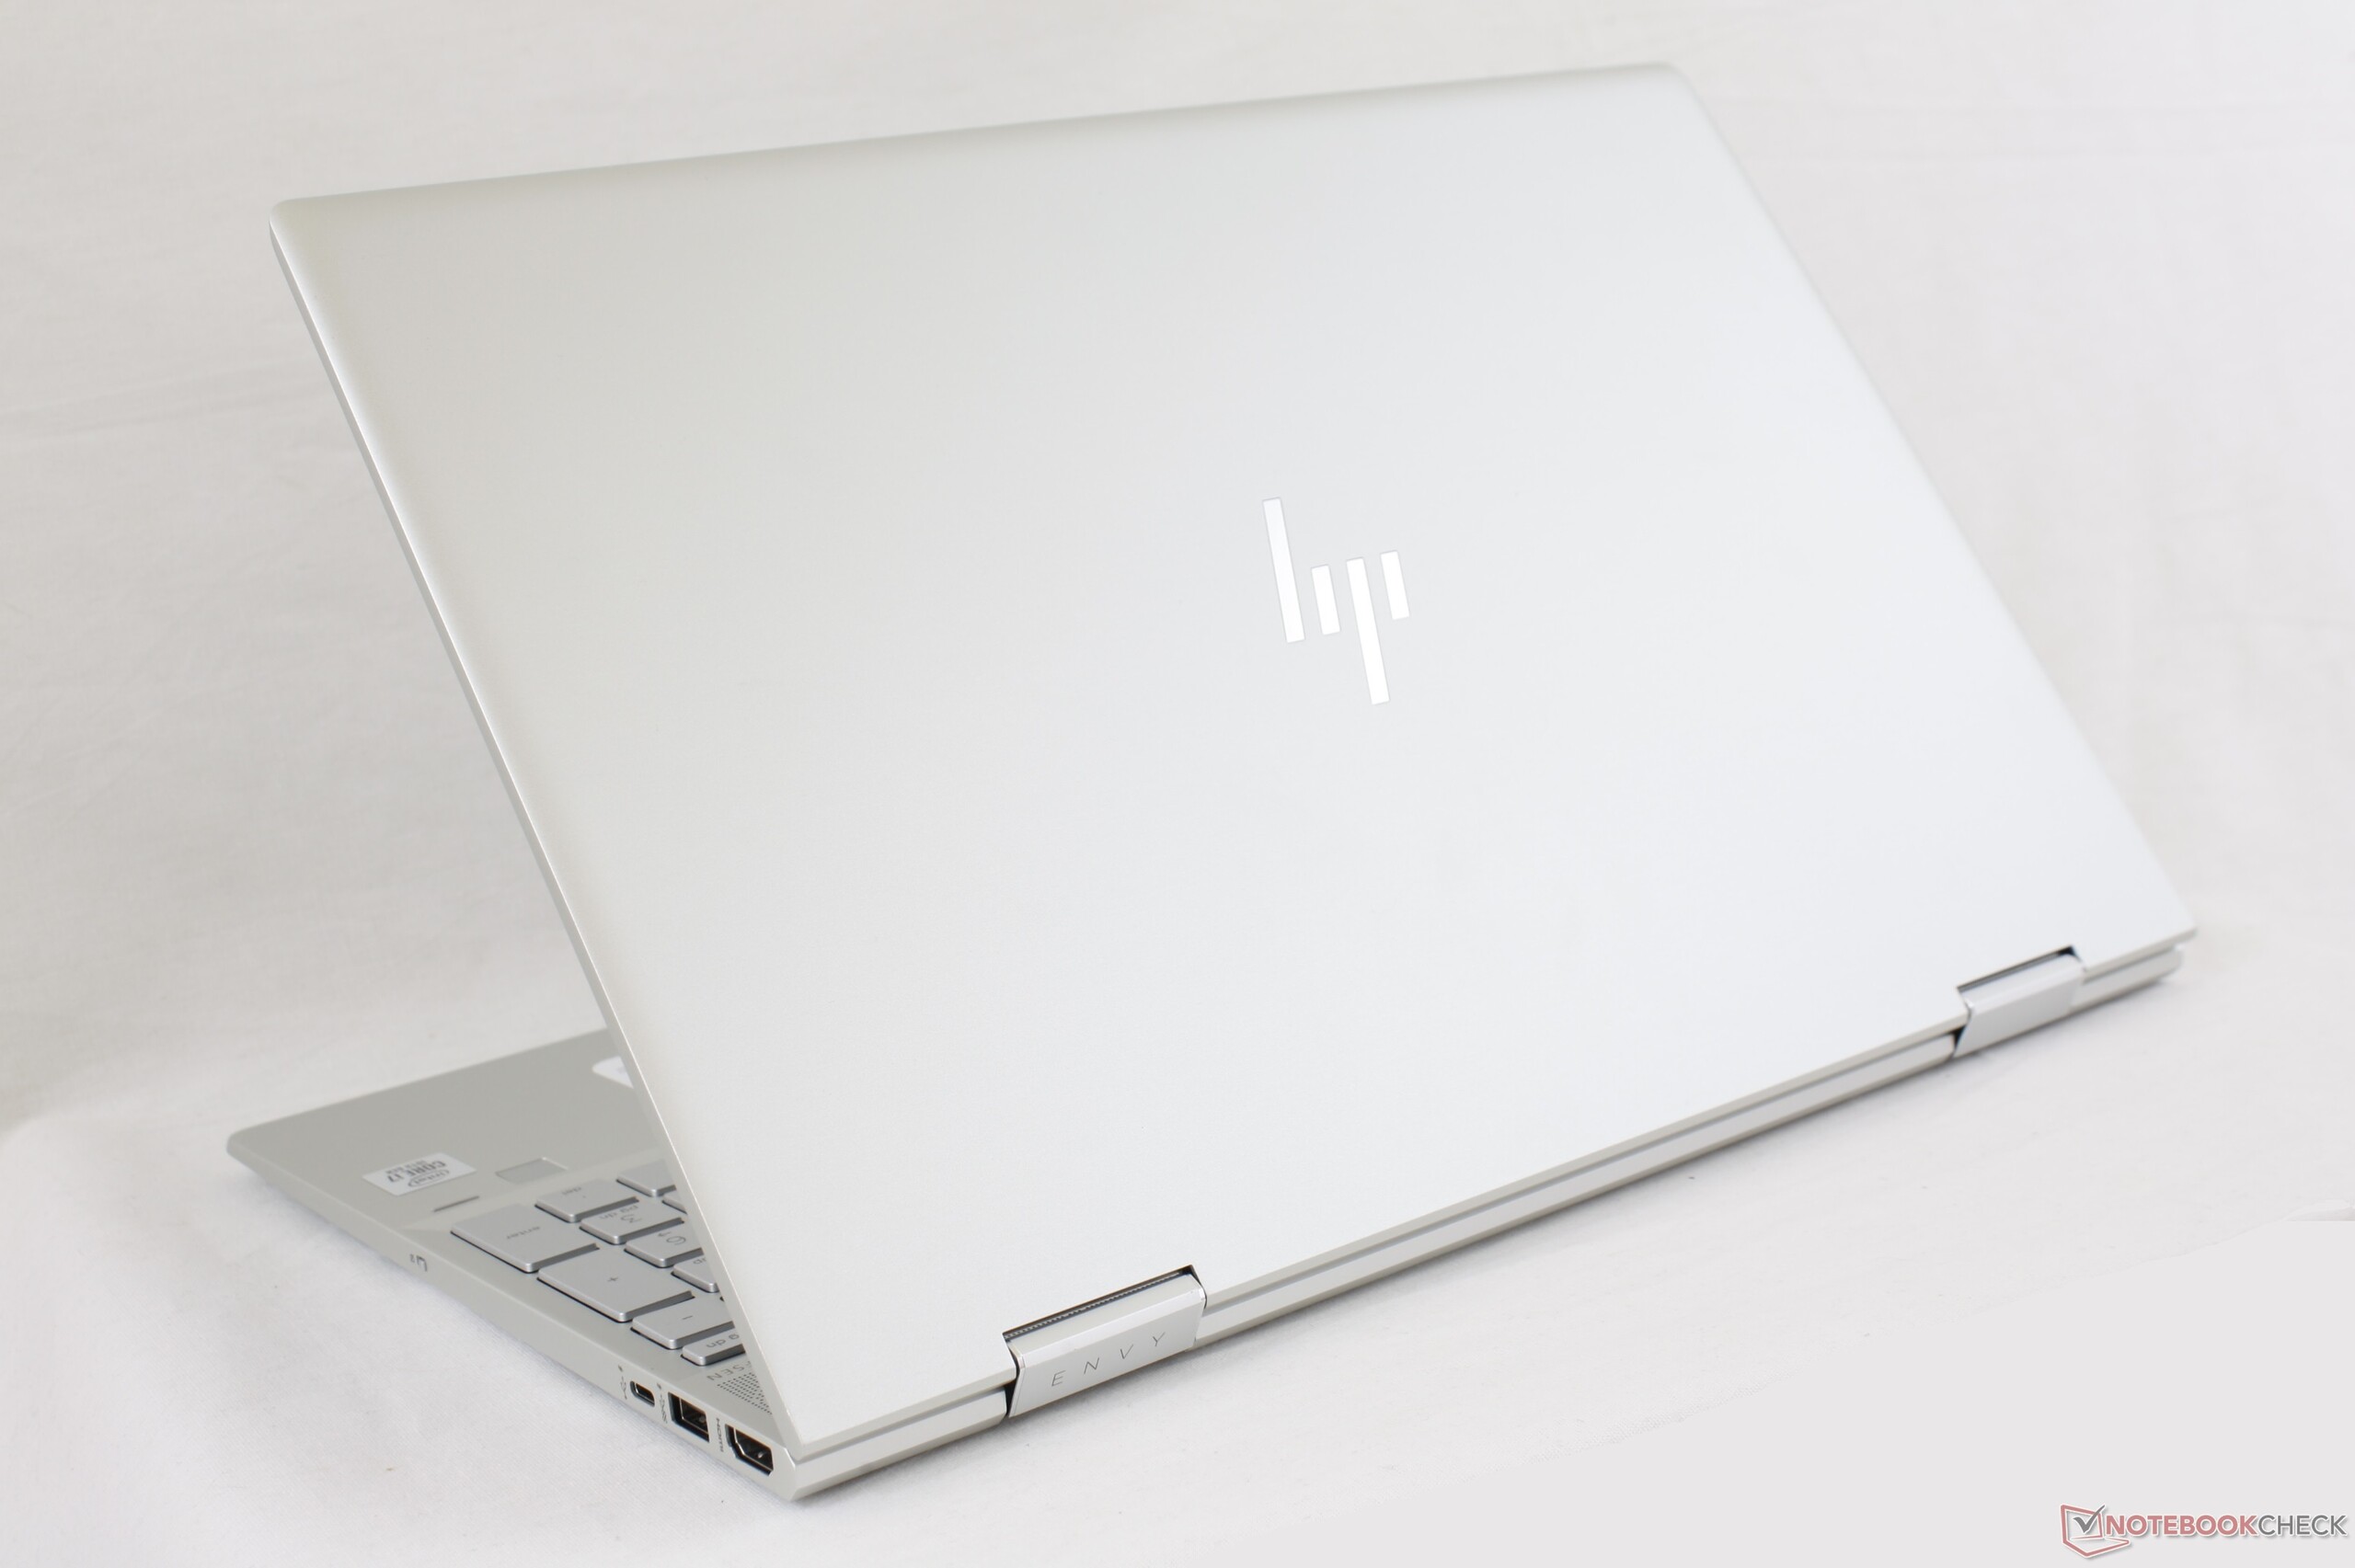
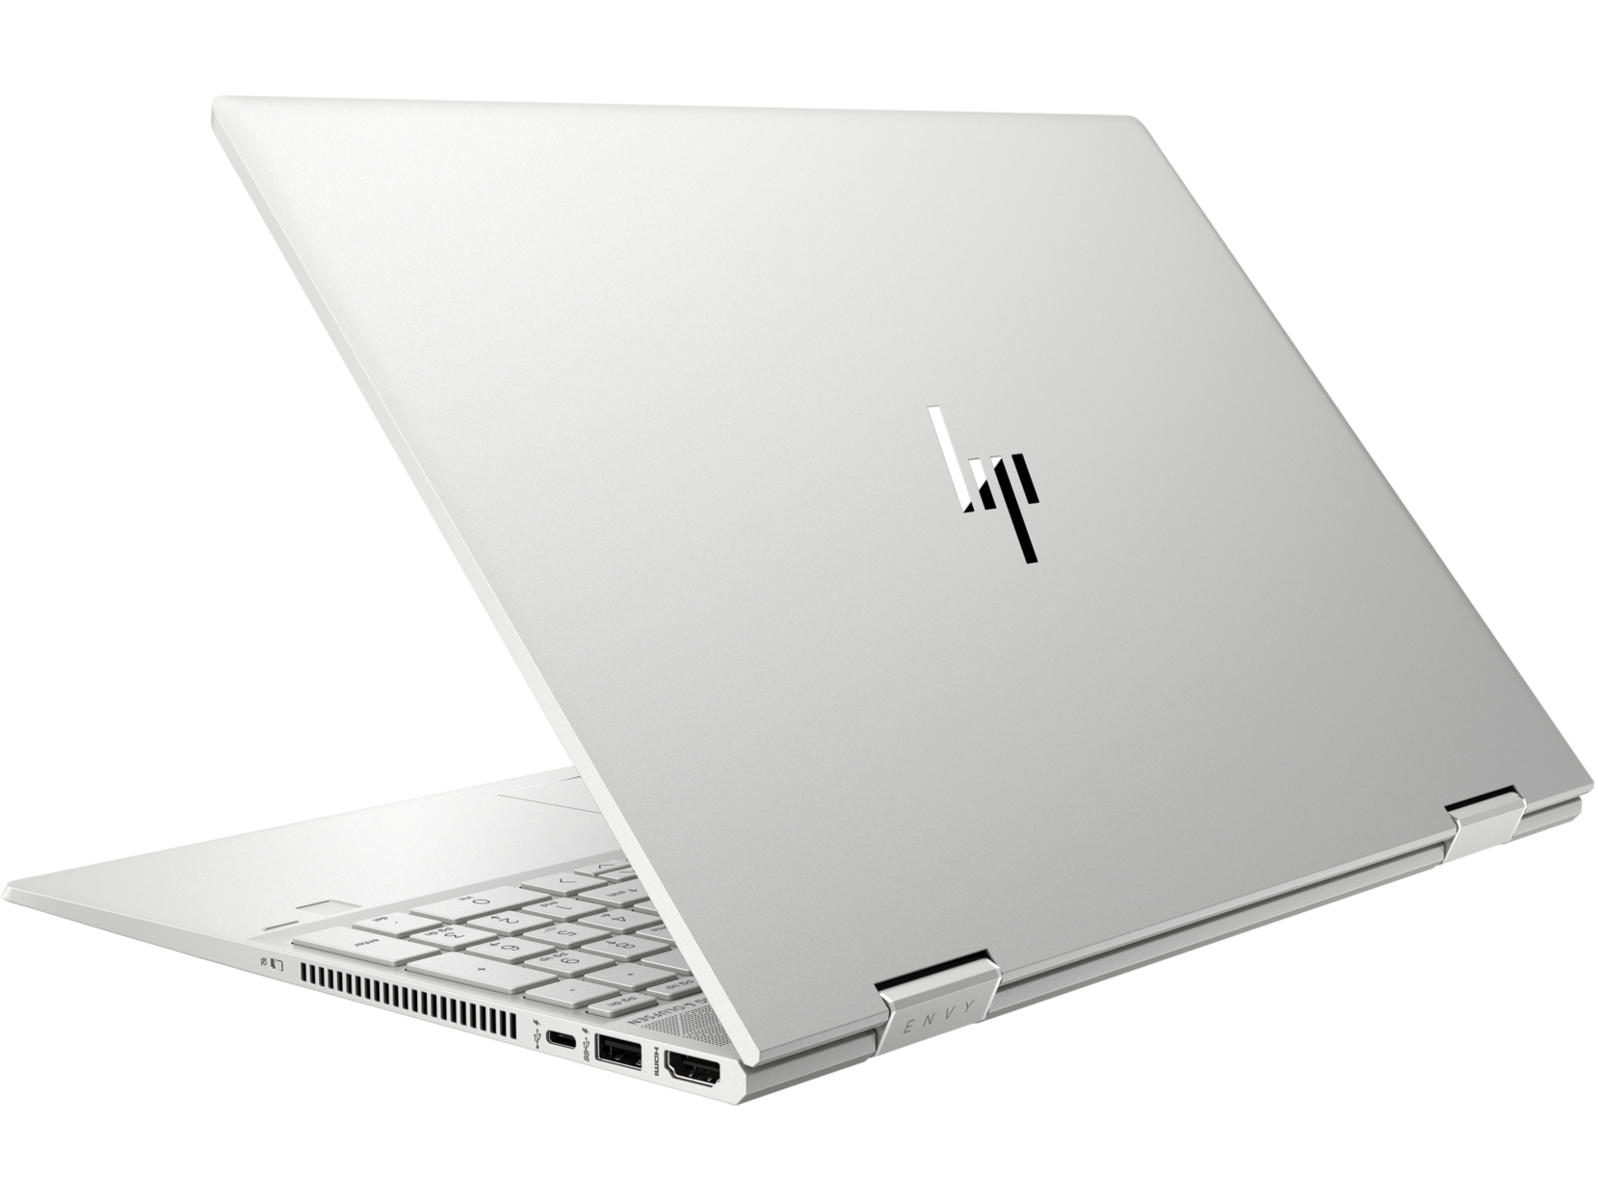
Le convertible HP se démarque cependant toujours par sa qualité de construction et sa rigidité. Il n'est pas spécialement léger, mais cela lui donne une allure plus résistante que les équivalents Lenovo, Acer ou Asus.
Le prix du convertible est faible, pour attirer les utilisateurs qui ne voudraient qu'un PC poratble robuste pour la maison, pour les mails ou la vidéo. Ses versions GeForce MX330 ou AMOLED ne sont pas très séduisantes, et il est possible de choisir un ancien Envy x360 15 au lieu de cette version 2020 sans manquer grand chose.
L’intégralité de cette critique est disponible en anglais en suivant ce lien.
HP Envy x360 15-dr1679cl
- 06/18/2020 v7 (old)
Allen Ngo
Price comparison
