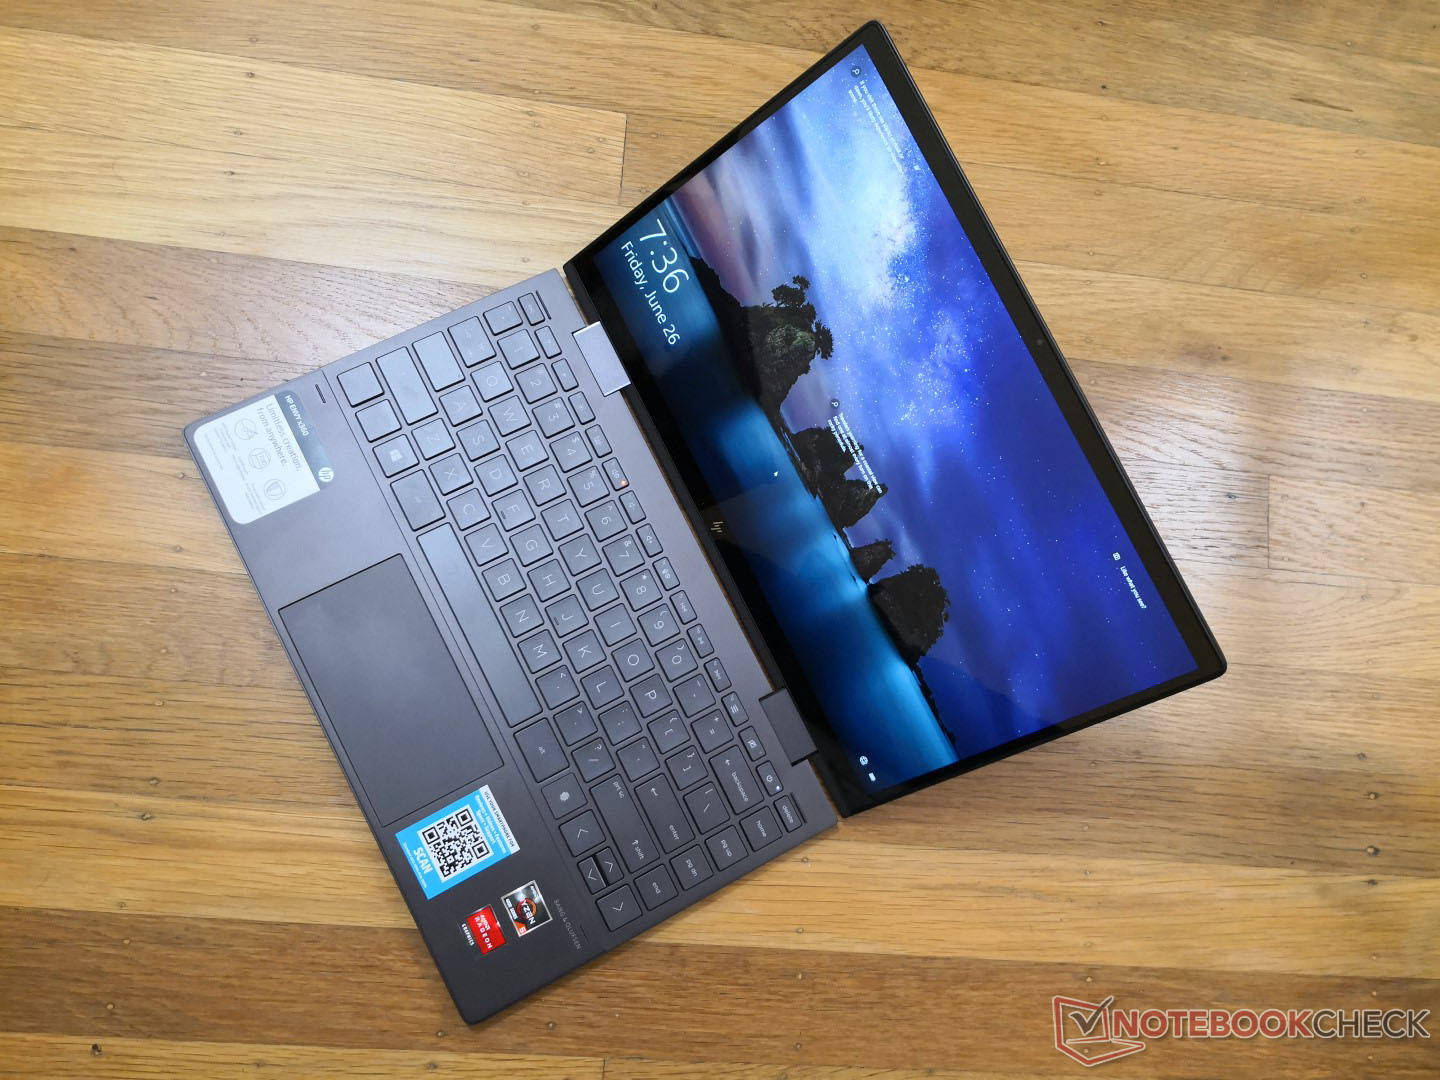
Test du HP Envy x360 13 2020 (Ryzen 5 4500U, RX Vega 6, FHD) : le convertible Ryzen 5 fait mieux que le Core i7
Note | Date | Modèle | Poids | Épaisseur | Taille | Résolution | Prix |
|---|---|---|---|---|---|---|---|
| 85.5 % v7 (old) | 08/20 | HP Envy x360 13-ay0010nr R5 4500U, Vega 6 | 1.3 kg | 16.4 mm | 13.30" | 1920x1080 | |
| 86.3 % v7 (old) | 10/19 | Dell XPS 13 7390 2-in-1 Core i7 i7-1065G7, Iris Plus Graphics G7 (Ice Lake 64 EU) | 1.3 kg | 13 mm | 13.40" | 1920x1200 | |
| 88.4 % v7 (old) | 01/20 | HP Spectre x360 13-aw0013dx i7-1065G7, Iris Plus Graphics G7 (Ice Lake 64 EU) | 1.2 kg | 16.9 mm | 13.30" | 1920x1080 | |
| 86.6 % v6 (old) | 05/19 | Asus ZenBook S13 UX392FN i7-8565U, GeForce MX150 | 1.1 kg | 12.9 mm | 13.90" | 1920x1080 | |
| 92.1 % v7 (old) | 07/20 | Apple MacBook Pro 13 2020 2GHz i5 10th-Gen i5-1038NG7, Iris Plus Graphics G7 (Ice Lake 64 EU) | 1.4 kg | 15.6 mm | 13.30" | 2560x1600 |
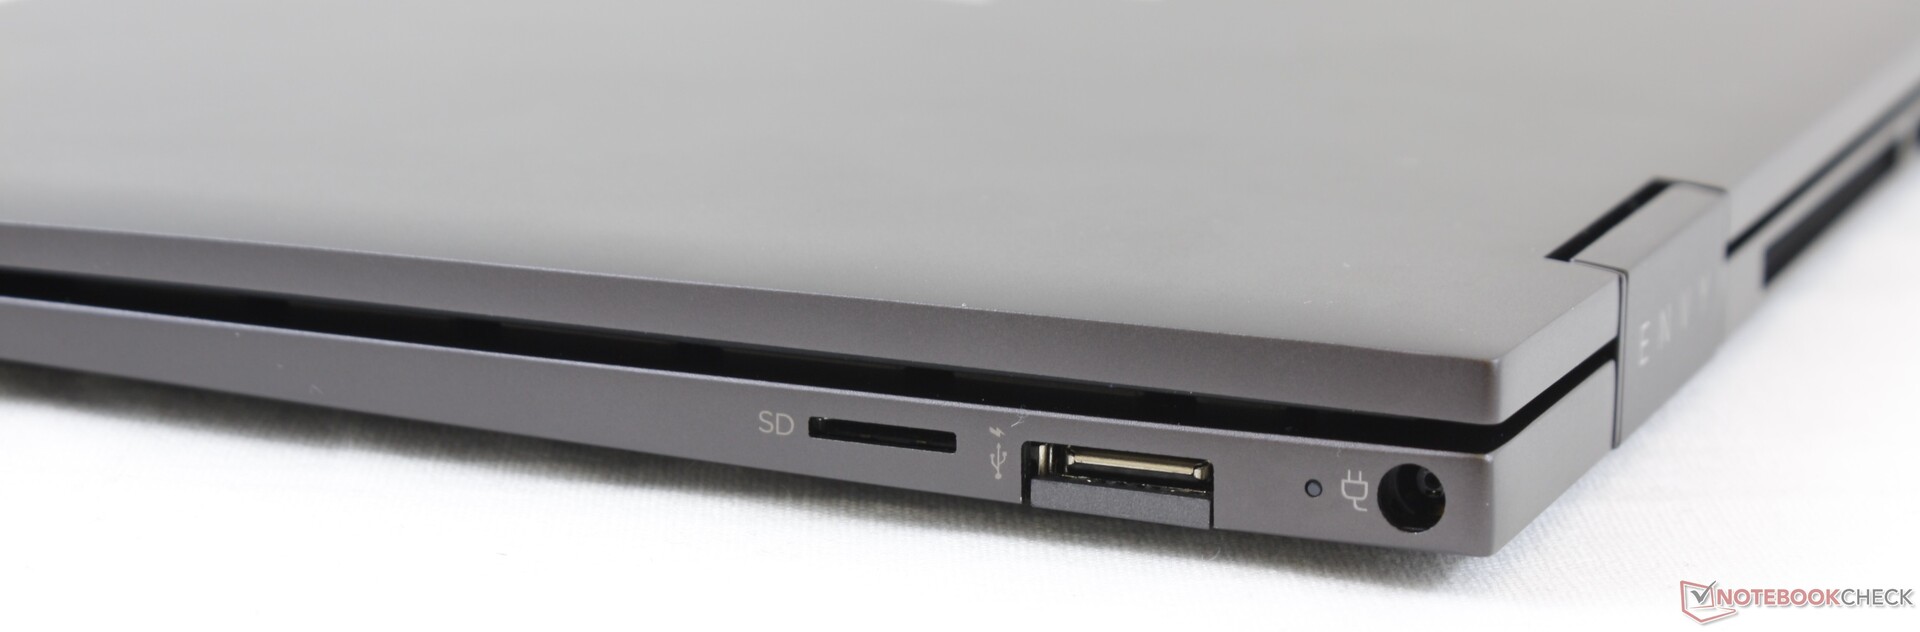
| SD Card Reader | |
| average JPG Copy Test (av. of 3 runs) | |
| HP Spectre x360 13-aw0013dx (Toshiba Exceria Pro M501 microSDXC 64GB) | |
| Dell XPS 13 7390 2-in-1 Core i7 (Toshiba Exceria Pro M501 64 GB UHS-II) | |
| HP Envy x360 13-ay0010nr (Toshiba Exceria Pro M501 64 GB UHS-II) | |
| HP Envy x360 13-ar0601ng (Toshiba Exceria Pro M501 microSDXC 64GB) | |
| Asus ZenBook S13 UX392FN (Toshiba Exceria Pro M501 64 GB UHS-II) | |
| maximum AS SSD Seq Read Test (1GB) | |
| Dell XPS 13 7390 2-in-1 Core i7 (Toshiba Exceria Pro M501 64 GB UHS-II) | |
| HP Spectre x360 13-aw0013dx (Toshiba Exceria Pro M501 microSDXC 64GB) | |
| HP Envy x360 13-ar0601ng (Toshiba Exceria Pro M501 microSDXC 64GB) | |
| HP Envy x360 13-ay0010nr (Toshiba Exceria Pro M501 64 GB UHS-II) | |
| Asus ZenBook S13 UX392FN (Toshiba Exceria Pro M501 64 GB UHS-II) | |


| |||||||||||||||||||||||||
Homogénéité de la luminosité: 93 %
Valeur mesurée au centre, sur batterie: 452.6 cd/m²
Contraste: 1561:1 (Valeurs des noirs: 0.29 cd/m²)
ΔE ColorChecker Calman: 2.67 | ∀{0.5-29.43 Ø4.71}
calibrated: 1.36
ΔE Greyscale Calman: 2.1 | ∀{0.09-98 Ø4.96}
97.6% sRGB (Argyll 1.6.3 3D)
62.2% AdobeRGB 1998 (Argyll 1.6.3 3D)
67.8% AdobeRGB 1998 (Argyll 3D)
97.4% sRGB (Argyll 3D)
65.9% Display P3 (Argyll 3D)
Gamma: 2.01
CCT: 6505 K
| HP Envy x360 13-ay0010nr IPS, 13.3", 1920x1080 | HP Envy x360 13-ar0601ng InfoVision, M133NVF3 R2, IPS, 120 Hz, 13.3", 1920x1080 | Dell XPS 13 7390 2-in-1 Core i7 Sharp LQ134N1, IPS, 13.4", 1920x1200 | HP Spectre x360 13-aw0013dx AU Optronics AUO5E2D, IPS, 13.3", 1920x1080 | Asus ZenBook S13 UX392FN Tianma XM, IPS, 13.9", 1920x1080 | Apple MacBook Pro 13 2020 2GHz i5 10th-Gen APPA03D, IPS, 13.3", 2560x1600 | |
|---|---|---|---|---|---|---|
| Display | -6% | 4% | 4% | 1% | 27% | |
| Display P3 Coverage (%) | 65.9 | 63 -4% | 69.9 6% | 69.6 6% | 67.5 2% | 98.8 50% |
| sRGB Coverage (%) | 97.4 | 90.8 -7% | 99.2 2% | 98.9 2% | 95.8 -2% | 99.9 3% |
| AdobeRGB 1998 Coverage (%) | 67.8 | 63.8 -6% | 71.5 5% | 71.5 5% | 69 2% | 86.4 27% |
| Response Times | 29% | 5% | -21% | 12% | 2% | |
| Response Time Grey 50% / Grey 80% * (ms) | 47.6 ? | 35 ? 26% | 47.6 ? -0% | 60.8 ? -28% | 47.2 ? 1% | 46 ? 3% |
| Response Time Black / White * (ms) | 32.4 ? | 22 ? 32% | 29.2 ? 10% | 36.8 ? -14% | 24.8 ? 23% | 32.4 ? -0% |
| PWM Frequency (Hz) | 25000 ? | 4065 ? | 2500 ? | 113600 ? | ||
| Screen | -22% | 0% | -36% | -2% | 12% | |
| Brightness middle (cd/m²) | 452.6 | 633 40% | 549.8 21% | 447.4 -1% | 466 3% | 512 13% |
| Brightness (cd/m²) | 438 | 675 54% | 520 19% | 420 -4% | 462 5% | 491 12% |
| Brightness Distribution (%) | 93 | 75 -19% | 86 -8% | 85 -9% | 90 -3% | 91 -2% |
| Black Level * (cd/m²) | 0.29 | 0.55 -90% | 0.39 -34% | 0.31 -7% | 0.33 -14% | 0.32 -10% |
| Contrast (:1) | 1561 | 1151 -26% | 1410 -10% | 1443 -8% | 1412 -10% | 1600 2% |
| Colorchecker dE 2000 * | 2.67 | 3.12 -17% | 2.12 21% | 4.23 -58% | 1.93 28% | 1.7 36% |
| Colorchecker dE 2000 max. * | 4.11 | 6.37 -55% | 3.66 11% | 9.34 -127% | 4.26 -4% | 3.4 17% |
| Colorchecker dE 2000 calibrated * | 1.36 | 1.83 -35% | 1.37 -1% | 1.32 3% | 1.99 -46% | 1 26% |
| Greyscale dE 2000 * | 2.1 | 3.89 -85% | 2.6 -24% | 6.1 -190% | 1.7 19% | 1.9 10% |
| Gamma | 2.01 109% | 2.39 92% | 2.3 96% | 2.11 104% | 2.15 102% | 2.19 100% |
| CCT | 6505 100% | 6476 100% | 6884 94% | 6136 106% | 6382 102% | 6817 95% |
| Color Space (Percent of AdobeRGB 1998) (%) | 62.2 | 59 -5% | 65.4 5% | 64.8 4% | 62.2 0% | 77.4 24% |
| Color Space (Percent of sRGB) (%) | 97.6 | 91 -7% | 99.7 2% | 98.9 1% | 95.7 -2% | 99.9 2% |
| Moyenne finale (programmes/paramètres) | 0% /
-13% | 3% /
2% | -18% /
-27% | 4% /
0% | 14% /
13% |
* ... Moindre est la valeur, meilleures sont les performances
Temps de réponse de l'écran
| ↔ Temps de réponse noir à blanc | ||
|---|---|---|
| 32.4 ms ... hausse ↗ et chute ↘ combinées | ↗ 16.4 ms hausse | 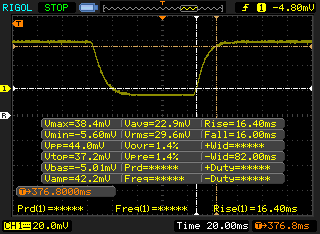 |
| ↘ 16 ms chute | ||
| L'écran souffre de latences très élevées, à éviter pour le jeu. En comparaison, tous les appareils testés affichent entre 0.1 (minimum) et 240 (maximum) ms. » 88 % des appareils testés affichent de meilleures performances. Cela signifie que les latences relevées sont moins bonnes que la moyenne (19.8 ms) de tous les appareils testés. | ||
| ↔ Temps de réponse gris 50% à gris 80% | ||
| 47.6 ms ... hausse ↗ et chute ↘ combinées | ↗ 24.8 ms hausse | 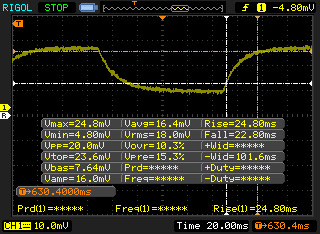 |
| ↘ 22.8 ms chute | ||
| L'écran souffre de latences très élevées, à éviter pour le jeu. En comparaison, tous les appareils testés affichent entre 0.165 (minimum) et 636 (maximum) ms. » 82 % des appareils testés affichent de meilleures performances. Cela signifie que les latences relevées sont moins bonnes que la moyenne (31 ms) de tous les appareils testés. | ||
Scintillement / MLI (Modulation de largeur d'impulsion)
| Scintillement / MLI (Modulation de largeur d'impulsion) décelé | 25000 Hz | ≤ 45 Niveau de luminosité | 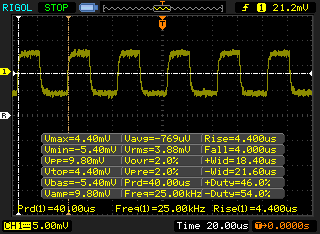 |
Le rétroéclairage de l'écran scintille à la fréquence de 25000 Hz (certainement du fait de l'utilisation d'une MDI - Modulation de largeur d'impulsion) à un niveau de luminosité inférieur ou égal à 45 % . Aucun scintillement ne devrait être perceptible au-dessus de cette valeur. La fréquence de rafraîchissement de 25000 Hz est élevée, la grande majorité des utilisateurs ne devrait pas percevoir de scintillements et être sujette à une fatigue oculaire accrue. En comparaison, 52 % des appareils testés n'emploient pas MDI pour assombrir leur écran. Nous avons relevé une moyenne à 7754 (minimum : 5 - maximum : 343500) Hz dans le cas où une MDI était active. | |||
Cinebench R15: CPU Multi 64Bit | CPU Single 64Bit
Blender: v2.79 BMW27 CPU
7-Zip 18.03: 7z b 4 -mmt1 | 7z b 4
Geekbench 5.5: Single-Core | Multi-Core
HWBOT x265 Benchmark v2.2: 4k Preset
LibreOffice : 20 Documents To PDF
R Benchmark 2.5: Overall mean
| Geekbench 5.5 / Single-Core | |
| Dell XPS 13 9300 i5 FHD | |
| Lenovo ThinkPad X1 Carbon 2020-20UAS04T00 | |
| Moyenne AMD Ryzen 5 4500U (1082 - 1220, n=10) | |
| Acer Swift 3 SF314-42-R4XJ | |
| HP Envy x360 13-ay0010nr | |
| Acer Swift 3 SF314-42-R27B | |
| Huawei MateBook 13 2020 AMD | |
| Geekbench 5.5 / Multi-Core | |
| Acer Swift 3 SF314-42-R4XJ | |
| Moyenne AMD Ryzen 5 4500U (4352 - 6234, n=10) | |
| HP Envy x360 13-ay0010nr | |
| Dell XPS 13 9300 i5 FHD | |
| Lenovo ThinkPad X1 Carbon 2020-20UAS04T00 | |
| Acer Swift 3 SF314-42-R27B | |
| Huawei MateBook 13 2020 AMD | |
| HWBOT x265 Benchmark v2.2 / 4k Preset | |
| Acer Swift 3 SF314-42-R4XJ | |
| Moyenne AMD Ryzen 5 4500U (5.86 - 7.33, n=10) | |
| HP Envy x360 13-ay0010nr | |
| Dell XPS 13 7390 Core i7-10710U | |
| Lenovo ThinkPad X1 Carbon 2020-20UAS04T00 | |
| Acer Swift 3 SF314-42-R27B | |
| Dell XPS 13 9300 i5 FHD | |
| Dell Latitude 13 3390 | |
| Huawei MateBook 13 2020 AMD | |
| LibreOffice / 20 Documents To PDF | |
| Huawei MateBook 13 2020 AMD | |
| Moyenne AMD Ryzen 5 4500U (58.2 - 78, n=11) | |
| Acer Swift 3 SF314-42-R27B | |
| HP Envy x360 13-ay0010nr | |
| Acer Swift 3 SF314-42-R4XJ | |
| Lenovo ThinkPad X1 Carbon 2020-20UAS04T00 | |
| R Benchmark 2.5 / Overall mean | |
| Huawei MateBook 13 2020 AMD | |
| Dell XPS 13 9300 i5 FHD | |
| Acer Swift 3 SF314-42-R27B | |
| Lenovo ThinkPad X1 Carbon 2020-20UAS04T00 | |
| Moyenne AMD Ryzen 5 4500U (0.614 - 0.654, n=10) | |
| Acer Swift 3 SF314-42-R4XJ | |
| HP Envy x360 13-ay0010nr | |
Cinebench R15: CPU Multi 64Bit | CPU Single 64Bit
Blender: v2.79 BMW27 CPU
7-Zip 18.03: 7z b 4 -mmt1 | 7z b 4
Geekbench 5.5: Single-Core | Multi-Core
HWBOT x265 Benchmark v2.2: 4k Preset
LibreOffice : 20 Documents To PDF
R Benchmark 2.5: Overall mean
* ... Moindre est la valeur, meilleures sont les performances
| PCMark 8 Home Score Accelerated v2 | 4127 points | |
| PCMark 8 Work Score Accelerated v2 | 5249 points | |
| PCMark 10 Score | 4884 points | |
Aide | ||
| DPC Latencies / LatencyMon - interrupt to process latency (max), Web, Youtube, Prime95 | |
| Dell XPS 15 9500 Core i7 4K UHD | |
| Razer Blade Stealth Core i7 GTX 1650 Ti Max-Q 4K | |
| HP Envy x360 13-ay0010nr | |
| Asus VivoBook 17 S712FA-DS76 | |
* ... Moindre est la valeur, meilleures sont les performances
| HP Envy x360 13-ay0010nr Toshiba KBG30ZMV256G | HP Envy x360 13-ar0601ng SK Hynix BC501 HFM512GDJTNG | Dell XPS 13 7390 2-in-1 Core i7 Toshiba BG4 KBG40ZPZ512G | HP Spectre x360 13-aw0013dx Intel Optane Memory H10 with Solid State Storage 32GB + 512GB HBRPEKNX0202A(L/H) | Asus ZenBook S13 UX392FN WDC PC SN520 SDAPNUW-512G | |
|---|---|---|---|---|---|
| AS SSD | 21% | 37% | 18% | 86% | |
| Seq Read (MB/s) | 1135 | 1412 24% | 1801 59% | 1039 -8% | 1224 8% |
| Seq Write (MB/s) | 628 | 540 -14% | 1125 79% | 310.1 -51% | 907 44% |
| 4K Read (MB/s) | 42.49 | 32.24 -24% | 39.7 -7% | 76 79% | 41.46 -2% |
| 4K Write (MB/s) | 96.9 | 74.7 -23% | 67 -31% | 118 22% | 126.2 30% |
| 4K-64 Read (MB/s) | 614 | 567 -8% | 1253 104% | 371.8 -39% | 1021 66% |
| 4K-64 Write (MB/s) | 256.4 | 700 173% | 209 -18% | 469.5 83% | 1251 388% |
| Access Time Read * (ms) | 0.162 | 0.049 70% | 0.069 57% | 0.067 59% | 0.053 67% |
| Access Time Write * (ms) | 0.592 | 0.048 92% | 0.625 -6% | 0.138 77% | 0.027 95% |
| Score Read (Points) | 770 | 741 -4% | 1472 91% | 552 -28% | 1185 54% |
| Score Write (Points) | 416 | 829 99% | 388 -7% | 618 49% | 1468 253% |
| Score Total (Points) | 1567 | 1913 22% | 2583 65% | 1448 -8% | 3250 107% |
| Copy ISO MB/s (MB/s) | 843 | 521 -38% | 1293 53% | 764 -9% | 1404 67% |
| Copy Program MB/s (MB/s) | 367.9 | 253.1 -31% | 560 52% | 465.8 27% | 402.4 9% |
| Copy Game MB/s (MB/s) | 727 | 392.9 -46% | 927 28% | 764 5% | 902 24% |
| CrystalDiskMark 5.2 / 6 | -1% | 46% | 44% | 53% | |
| Write 4K (MB/s) | 94.8 | 88.3 -7% | 106.7 13% | 112.6 19% | 149.2 57% |
| Read 4K (MB/s) | 45.5 | 34.84 -23% | 49.94 10% | 131 188% | 47.18 4% |
| Write Seq (MB/s) | 732 | 740 1% | 1223 67% | 458.9 -37% | 750 2% |
| Read Seq (MB/s) | 959 | 985 3% | 1801 88% | 1355 41% | 1137 19% |
| Write 4K Q32T1 (MB/s) | 224.6 | 313.7 40% | 325.3 45% | 341.3 52% | 749 233% |
| Read 4K Q32T1 (MB/s) | 365.2 | 243.1 -33% | 551 51% | 320.6 -12% | 478.7 31% |
| Write Seq Q32T1 (MB/s) | 864 | 846 -2% | 1224 42% | 1219 41% | 1453 68% |
| Read Seq Q32T1 (MB/s) | 1580 | 1783 13% | 2350 49% | 2462 56% | 1713 8% |
| Write 4K Q8T8 (MB/s) | 305.7 | ||||
| Read 4K Q8T8 (MB/s) | 698 | ||||
| Moyenne finale (programmes/paramètres) | 10% /
13% | 42% /
40% | 31% /
28% | 70% /
74% |
* ... Moindre est la valeur, meilleures sont les performances

Disk Throttling: DiskSpd Read Loop, Queue Depth 8
| 3DMark 11 Performance | 4563 points | |
| 3DMark Cloud Gate Standard Score | 15183 points | |
| 3DMark Fire Strike Score | 2589 points | |
| 3DMark Time Spy Score | 929 points | |
Aide | ||
| Bas | Moyen | Élevé | Ultra | |
|---|---|---|---|---|
| The Witcher 3 (2015) | 56.4 | 16.6 | 10.6 | |
| Dota 2 Reborn (2015) | 95.1 | 75.6 | 46.3 | 43.3 |
| X-Plane 11.11 (2018) | 39.1 | 30.1 | 26.8 |
| HP Envy x360 13-ay0010nr Vega 6, R5 4500U, Toshiba KBG30ZMV256G | HP Envy x360 13-ar0601ng Vega 10, R7 3700U, SK Hynix BC501 HFM512GDJTNG | Dell XPS 13 7390 2-in-1 Core i7 Iris Plus Graphics G7 (Ice Lake 64 EU), i7-1065G7, Toshiba BG4 KBG40ZPZ512G | HP Spectre x360 13-aw0013dx Iris Plus Graphics G7 (Ice Lake 64 EU), i7-1065G7, Intel Optane Memory H10 with Solid State Storage 32GB + 512GB HBRPEKNX0202A(L/H) | Asus ZenBook S13 UX392FN GeForce MX150, i7-8565U, WDC PC SN520 SDAPNUW-512G | |
|---|---|---|---|---|---|
| Noise | -8% | 4% | 7% | 1% | |
| arrêt / environnement * (dB) | 28 | 30.5 -9% | 28.1 -0% | 28.5 -2% | 28.1 -0% |
| Idle Minimum * (dB) | 28 | 32.2 -15% | 28.1 -0% | 28.5 -2% | 28.1 -0% |
| Idle Average * (dB) | 28 | 32.2 -15% | 28.1 -0% | 28.5 -2% | 28.1 -0% |
| Idle Maximum * (dB) | 28.5 | 32.2 -13% | 28.1 1% | 28.5 -0% | 29 -2% |
| Load Average * (dB) | 41.1 | 40.8 1% | 31.7 23% | 28.5 31% | 41.1 -0% |
| Load Maximum * (dB) | 43.5 | 41.9 4% | 43.4 -0% | 35.3 19% | 41.1 6% |
| Witcher 3 ultra * (dB) | 43.4 | 35.3 | 41.1 |
* ... Moindre est la valeur, meilleures sont les performances
Degré de la nuisance sonore
| Au repos |
| 28 / 28 / 28.5 dB(A) |
| Fortement sollicité |
| 41.1 / 43.5 dB(A) |
 | ||
30 dB silencieux 40 dB(A) audible 50 dB(A) bruyant |
||
min: | ||
(±) La température maximale du côté supérieur est de 44.8 °C / 113 F, par rapport à la moyenne de 35.4 °C / 96 F, allant de 19.6 à 60 °C pour la classe Convertible.
(±) Le fond chauffe jusqu'à un maximum de 43.8 °C / 111 F, contre une moyenne de 36.9 °C / 98 F
(+) En utilisation inactive, la température moyenne du côté supérieur est de 25.9 °C / 79 F, par rapport à la moyenne du dispositif de 30.3 °C / 87 F.
(±) En jouant à The Witcher 3, la température moyenne du côté supérieur est de 33.4 °C / 92 F, alors que la moyenne de l'appareil est de 30.3 °C / 87 F.
(+) Les repose-poignets et le pavé tactile sont plus froids que la température de la peau avec un maximum de 30.2 °C / 86.4 F et sont donc froids au toucher.
(-) La température moyenne de la zone de l'appui-paume de dispositifs similaires était de 28 °C / 82.4 F (-2.2 °C / #-4 F).
| Éteint/en veille | |
| Au repos | |
| Fortement sollicité |
|
Légende:
min: | |
| HP Envy x360 13-ay0010nr R5 4500U, Vega 6, Toshiba KBG30ZMV256G, IPS, 1920x1080, 13.3" | HP Envy x360 13-ar0601ng R7 3700U, Vega 10, SK Hynix BC501 HFM512GDJTNG, IPS, 120 Hz, 1920x1080, 13.3" | Dell XPS 13 7390 2-in-1 Core i7 i7-1065G7, Iris Plus Graphics G7 (Ice Lake 64 EU), Toshiba BG4 KBG40ZPZ512G, IPS, 1920x1200, 13.4" | HP Spectre x360 13-aw0013dx i7-1065G7, Iris Plus Graphics G7 (Ice Lake 64 EU), Intel Optane Memory H10 with Solid State Storage 32GB + 512GB HBRPEKNX0202A(L/H), IPS, 1920x1080, 13.3" | Asus ZenBook S13 UX392FN i7-8565U, GeForce MX150, WDC PC SN520 SDAPNUW-512G, IPS, 1920x1080, 13.9" | Apple MacBook Pro 13 2020 2GHz i5 10th-Gen i5-1038NG7, Iris Plus Graphics G7 (Ice Lake 64 EU), Apple SSD SM0512F, IPS, 2560x1600, 13.3" | |
|---|---|---|---|---|---|---|
| Power Consumption | 1% | 5% | -4% | -23% | -34% | |
| Idle Minimum * (Watt) | 3.9 | 3.2 18% | 2.6 33% | 3.9 -0% | 3.4 13% | 3.8 3% |
| Idle Average * (Watt) | 5.8 | 2.8 52% | 5.3 9% | 6.3 -9% | 6.3 -9% | 8.6 -48% |
| Idle Maximum * (Watt) | 6 | 12.4 -107% | 7 -17% | 6.8 -13% | 10.4 -73% | 10.3 -72% |
| Load Average * (Watt) | 41.5 | 24.2 42% | 43.1 -4% | 32.6 21% | 51 -23% | 52.1 -26% |
| Load Maximum * (Watt) | 50.4 | 50 1% | 49 3% | 59 -17% | 62.7 -24% | 65.2 -29% |
| Witcher 3 ultra * (Watt) | 43.1 | 25.6 | 39 | 48.2 |
* ... Moindre est la valeur, meilleures sont les performances
| HP Envy x360 13-ay0010nr R5 4500U, Vega 6, 51 Wh | HP Envy x360 13-ar0601ng R7 3700U, Vega 10, 53 Wh | Dell XPS 13 7390 2-in-1 Core i7 i7-1065G7, Iris Plus Graphics G7 (Ice Lake 64 EU), 51 Wh | HP Spectre x360 13-aw0013dx i7-1065G7, Iris Plus Graphics G7 (Ice Lake 64 EU), 60 Wh | Asus ZenBook S13 UX392FN i7-8565U, GeForce MX150, 50 Wh | Apple MacBook Pro 13 2020 2GHz i5 10th-Gen i5-1038NG7, Iris Plus Graphics G7 (Ice Lake 64 EU), 58 Wh | |
|---|---|---|---|---|---|---|
| Autonomie de la batterie | -30% | -24% | 14% | -17% | 3% | |
| Reader / Idle (h) | 31.9 | 10.5 -67% | 37.1 16% | 28.5 -11% | ||
| WiFi v1.3 (h) | 11.8 | 7.3 -38% | 9 -24% | 9.9 -16% | 8.4 -29% | 12.1 3% |
| Load (h) | 1.9 | 2.2 16% | 2.7 42% | 1.7 -11% |
Points positifs
Points négatifs
L'Envy x360 13 2020 AMD a meilleure allure et s'avère plus performant que ce que son prix laisse entendre. C'est en gros une version moins chère du Spectre x360 13 2019 qui ne sacrifie ni la qualité du châssis ni les performances pour atteindre un prix moins élevé. Ceux qui visaient à acheter un Envy x360 plus ancien ou un convertible Spectre devraient regarder ce modèle 2020 plus puissant, moins cher et plus fin.
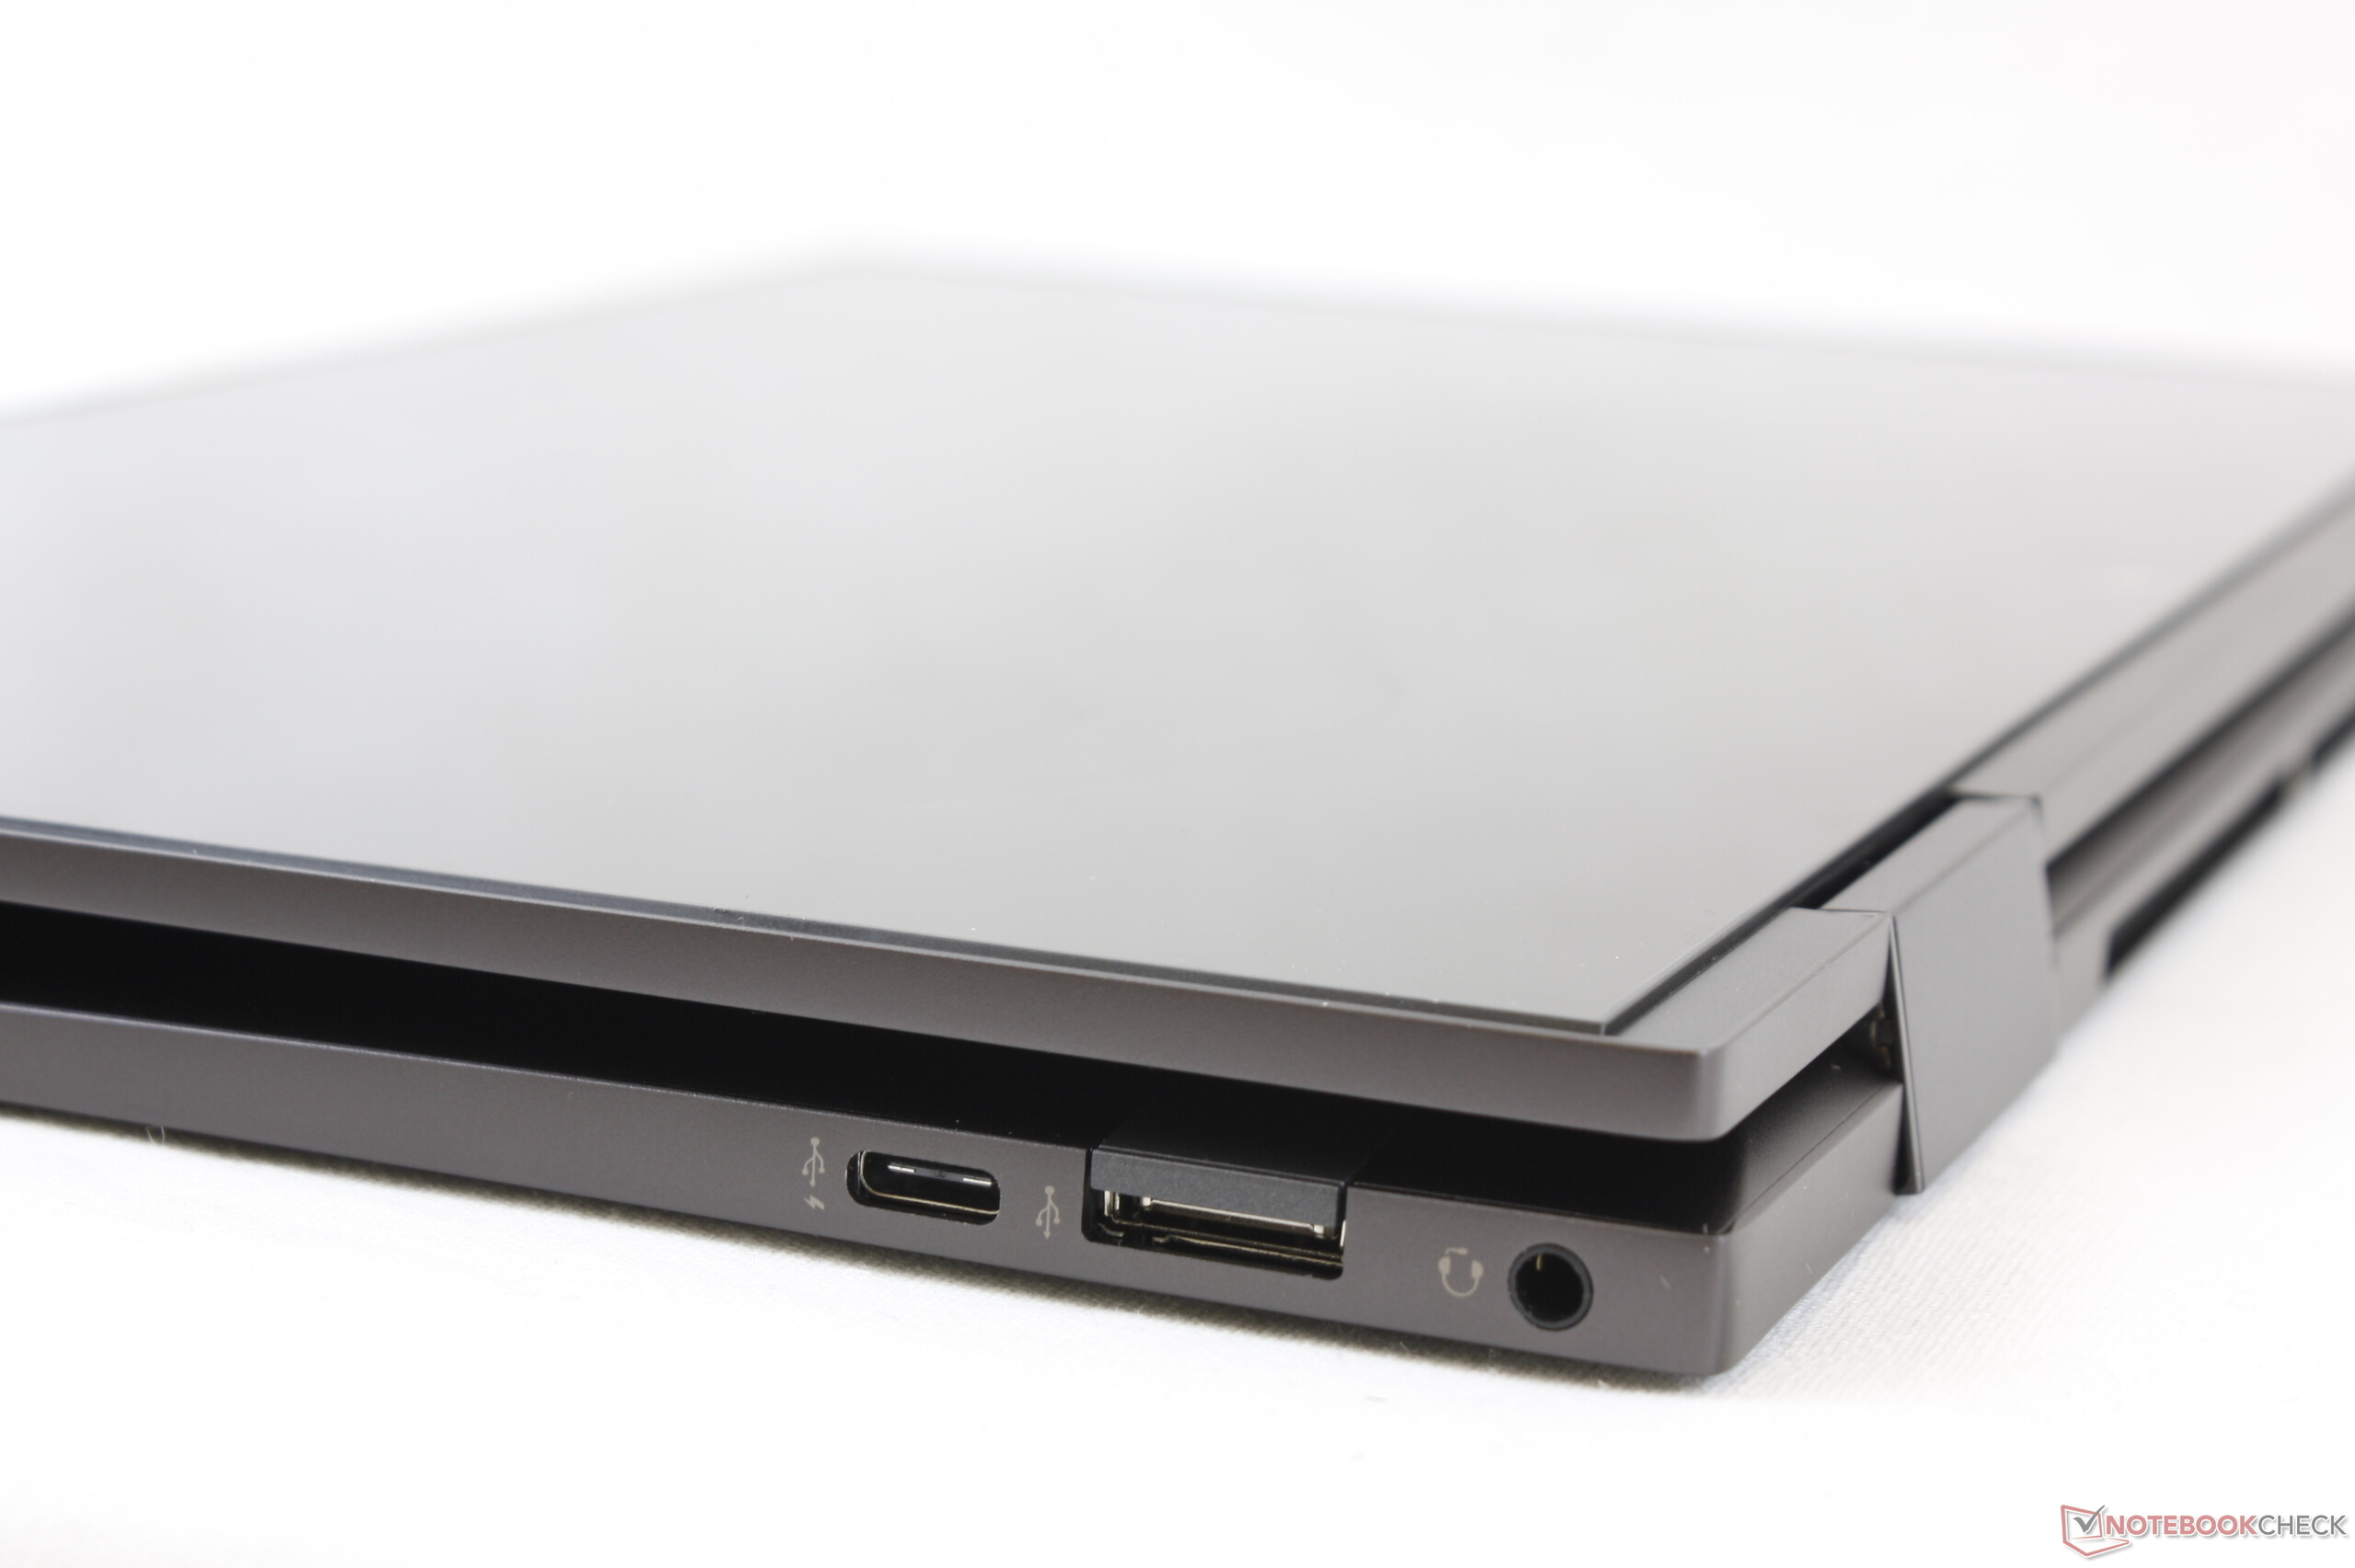
Certaines limitations matérielles empêchent l'Envy x360 13 d'être l'ultime convertible de 13,3 pouces du moment. Il n'y a ni Thunderbolt 3, ni HDMI, et la RAM n'est pas amovible, si bien que HP peut imposer un surcoût pour les versions 16 Go DDR4. Il faudra également s'habituer à l'emplacement bizarre du lecteur d'empreintes, et nous pensons que les charnières pourraient être plus fermes. Des alternatives comme le Lenovo Yoga C940 intègrent des rangements pour stylet, qui s'avèrent utiles en mode tablette.
Nous avions considéré le Yoga C940 de 14 pouces comme étant le convertible grand public à battre, quand nous l'avons testé l'an dernier, mais cet appareil se vendait pour presque 1 500 $. Pour moins de 1 000 $, on ne trouvera pour l'instant pas de convertible de 13,3 pouces avec un tel équilibre entre performances, poids, qualité de construction et prix meilleur que le HP Envy x360 13 2020.
C'est impressionnant de voir ce qu'un passage à un processeur AMD permet au regard du prix et du rapport performances / prix. L'Envy x360 13 2020 revu est notablement plus compact que le modèle que l'an dernier, tout en étant bien plus performant.
L’intégralité de cette critique est disponible en anglais en suivant ce lien.
HP Envy x360 13-ay0010nr
- 06/30/2020 v7 (old)
Allen Ngo
Price comparison
