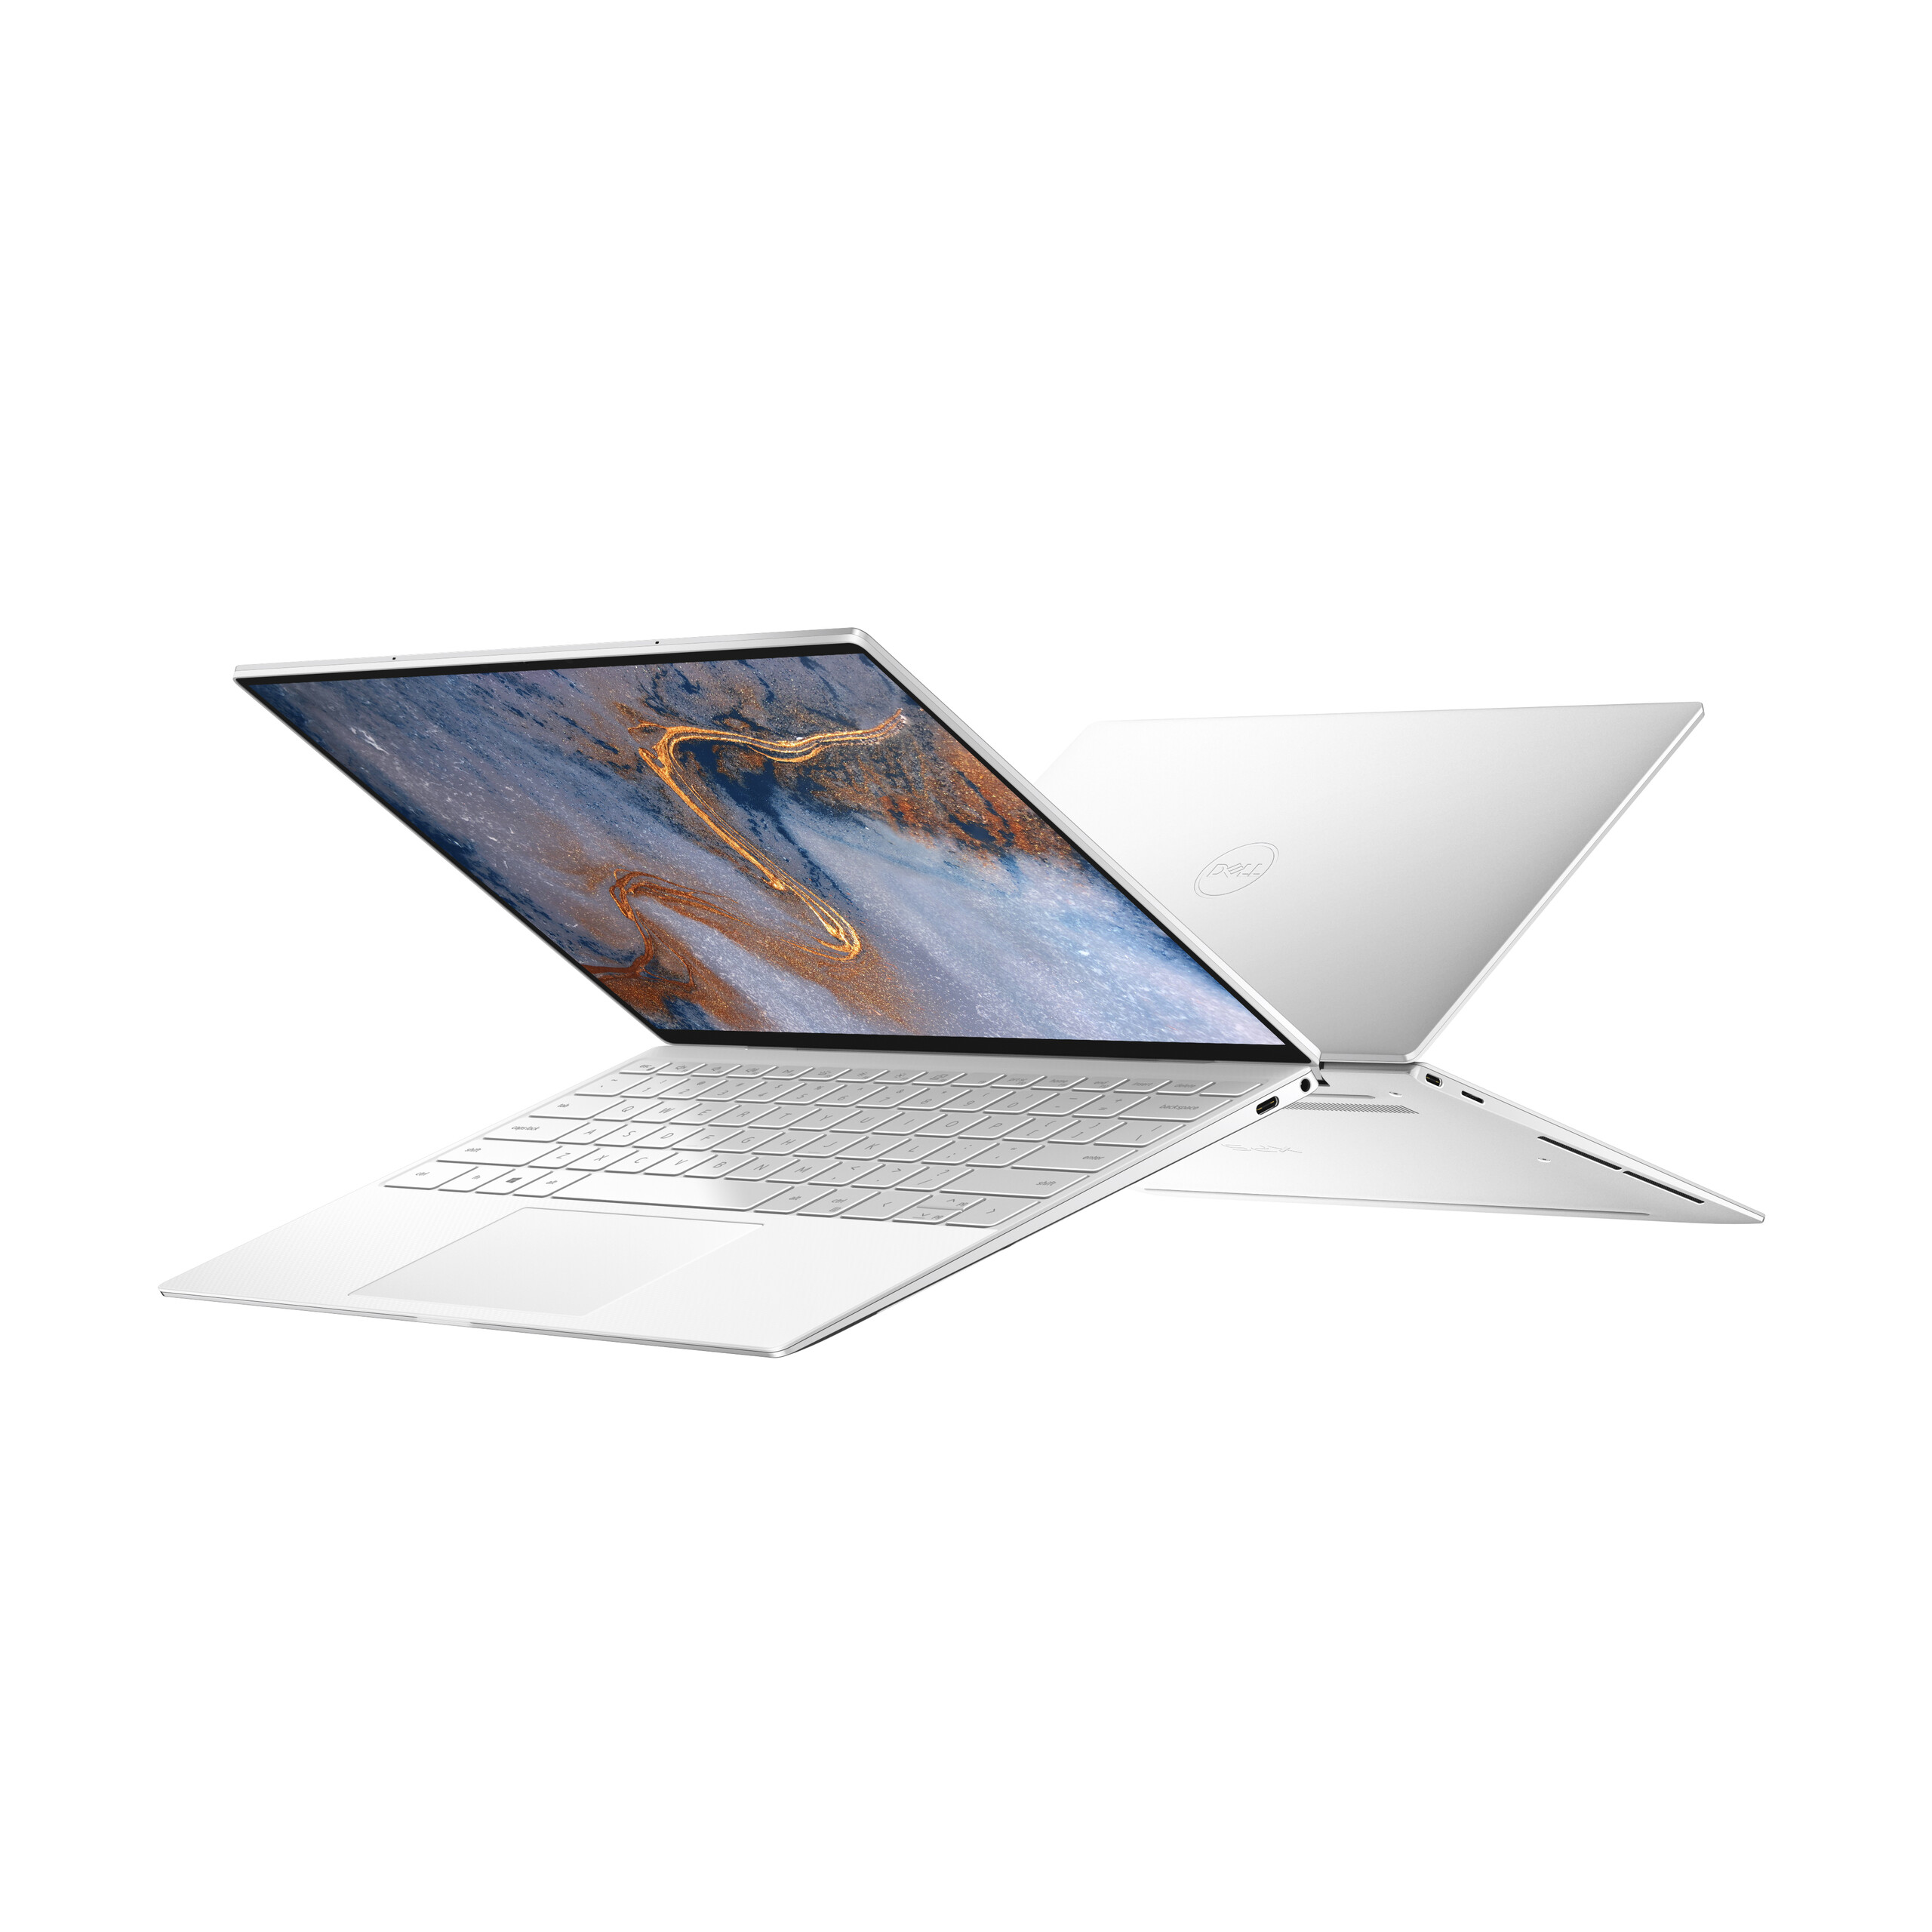
Test du Dell XPS 13 9300 (i7-1065G7, FHD, 16:10) : le nouveau châssis plus intéressant que le nouveau processeur
Note | Date | Modèle | Poids | Épaisseur | Taille | Résolution | Prix |
|---|---|---|---|---|---|---|---|
| 88.9 % v7 (old) | 04/20 | Dell XPS 13 9300 Core i7-1065G7 i7-1065G7, Iris Plus Graphics G7 (Ice Lake 64 EU) | 1.2 kg | 14.8 mm | 13.40" | 1920x1200 | |
| 85.9 % v7 (old) | 11/19 | Dell XPS 13 7390 Core i7-10710U i7-10710U, UHD Graphics 620 | 1.2 kg | 11.6 mm | 13.30" | 3840x2160 | |
| 86.3 % v7 (old) | 10/19 | Dell XPS 13 7390 2-in-1 Core i7 i7-1065G7, Iris Plus Graphics G7 (Ice Lake 64 EU) | 1.3 kg | 13 mm | 13.40" | 1920x1200 | |
| 86.6 % v6 (old) | 05/19 | Asus ZenBook S13 UX392FN i7-8565U, GeForce MX150 | 1.1 kg | 12.9 mm | 13.90" | 1920x1080 | |
| 84 % v7 (old) | 03/20 | Microsoft Surface Laptop 3 13 Core i5-1035G7 i5-1035G7, Iris Plus Graphics G7 (Ice Lake 64 EU) | 1.3 kg | 14.5 mm | 13.50" | 2256x1504 |
| SD Card Reader | |
| average JPG Copy Test (av. of 3 runs) | |
| Dell XPS 13 7390 Core i7-10710U (Toshiba Exceria Pro M501 64 GB UHS-II) | |
| Dell XPS 13 9300 Core i7-1065G7 (Toshiba Exceria Pro M501 64 GB UHS-II) | |
| Dell XPS 13 7390 2-in-1 Core i7 (Toshiba Exceria Pro M501 64 GB UHS-II) | |
| Asus ZenBook S13 UX392FN (Toshiba Exceria Pro M501 64 GB UHS-II) | |
| maximum AS SSD Seq Read Test (1GB) | |
| Dell XPS 13 7390 Core i7-10710U (Toshiba Exceria Pro M501 64 GB UHS-II) | |
| Dell XPS 13 7390 2-in-1 Core i7 (Toshiba Exceria Pro M501 64 GB UHS-II) | |
| Dell XPS 13 9300 Core i7-1065G7 (Toshiba Exceria Pro M501 64 GB UHS-II) | |
| Asus ZenBook S13 UX392FN (Toshiba Exceria Pro M501 64 GB UHS-II) | |

| |||||||||||||||||||||||||
Homogénéité de la luminosité: 96 %
Valeur mesurée au centre, sur batterie: 607.6 cd/m²
Contraste: 1519:1 (Valeurs des noirs: 0.4 cd/m²)
ΔE ColorChecker Calman: 3.23 | ∀{0.5-29.43 Ø4.73}
calibrated: 1.01
ΔE Greyscale Calman: 5.5 | ∀{0.09-98 Ø4.97}
97.5% sRGB (Argyll 1.6.3 3D)
63% AdobeRGB 1998 (Argyll 1.6.3 3D)
68.5% AdobeRGB 1998 (Argyll 3D)
97.3% sRGB (Argyll 3D)
66.3% Display P3 (Argyll 3D)
Gamma: 2.12
CCT: 6413 K
| Dell XPS 13 9300 Core i7-1065G7 Sharp LQ134N1, IPS, 13.4", 1920x1200 | Dell XPS 13 7390 Core i7-10710U AU Optronics B133ZAN, Dell P/N: 90NTH, IPS, 13.3", 3840x2160 | Dell XPS 13 7390 2-in-1 Core i7 Sharp LQ134N1, IPS, 13.4", 1920x1200 | Huawei Matebook X Pro i5 Tianma XM, IPS, 13.9", 3000x2000 | Asus ZenBook S13 UX392FN Tianma XM, IPS, 13.9", 1920x1080 | Microsoft Surface Laptop 3 13 Core i5-1035G7 Sharp LQ135P1JX51, IPS, 13.5", 2256x1504 | |
|---|---|---|---|---|---|---|
| Display | -5% | 4% | -1% | 0% | -0% | |
| Display P3 Coverage (%) | 66.3 | 63.4 -4% | 69.9 5% | 65.9 -1% | 67.5 2% | 65.7 -1% |
| sRGB Coverage (%) | 97.3 | 93.7 -4% | 99.2 2% | 95.2 -2% | 95.8 -2% | 98.6 1% |
| AdobeRGB 1998 Coverage (%) | 68.5 | 64.3 -6% | 71.5 4% | 67.6 -1% | 69 1% | 67.8 -1% |
| Response Times | -2% | 9% | 21% | 16% | -22% | |
| Response Time Grey 50% / Grey 80% * (ms) | 50 ? | 51.6 ? -3% | 47.6 ? 5% | 40.4 ? 19% | 47.2 ? 6% | 59.2 ? -18% |
| Response Time Black / White * (ms) | 33.2 ? | 33.6 ? -1% | 29.2 ? 12% | 25.6 ? 23% | 24.8 ? 25% | 41.6 ? -25% |
| PWM Frequency (Hz) | 2500 ? | 2500 ? | 21740 ? | |||
| Screen | -30% | 7% | -8% | 2% | 13% | |
| Brightness middle (cd/m²) | 607.6 | 408.2 -33% | 549.8 -10% | 442.7 -27% | 466 -23% | 403.4 -34% |
| Brightness (cd/m²) | 595 | 399 -33% | 520 -13% | 428 -28% | 462 -22% | 397 -33% |
| Brightness Distribution (%) | 96 | 89 -7% | 86 -10% | 84 -12% | 90 -6% | 89 -7% |
| Black Level * (cd/m²) | 0.4 | 0.39 2% | 0.39 2% | 0.31 23% | 0.33 17% | 0.34 15% |
| Contrast (:1) | 1519 | 1047 -31% | 1410 -7% | 1428 -6% | 1412 -7% | 1186 -22% |
| Colorchecker dE 2000 * | 3.23 | 4.6 -42% | 2.12 34% | 2.24 31% | 1.93 40% | 0.94 71% |
| Colorchecker dE 2000 max. * | 8.67 | 11.84 -37% | 3.66 58% | 7.19 17% | 4.26 51% | 2.92 66% |
| Colorchecker dE 2000 calibrated * | 1.01 | 2.03 -101% | 1.37 -36% | 1.11 -10% | 1.99 -97% | 0.99 2% |
| Greyscale dE 2000 * | 5.5 | 7.5 -36% | 2.6 53% | 9.7 -76% | 1.7 69% | 0.9 84% |
| Gamma | 2.12 104% | 2.12 104% | 2.3 96% | 1.42 155% | 2.15 102% | 2.13 103% |
| CCT | 6413 101% | 7966 82% | 6884 94% | 6227 104% | 6382 102% | 6620 98% |
| Color Space (Percent of AdobeRGB 1998) (%) | 63 | 59.5 -6% | 65.4 4% | 61.6 -2% | 62.2 -1% | 62.3 -1% |
| Color Space (Percent of sRGB) (%) | 97.5 | 93.5 -4% | 99.7 2% | 95 -3% | 95.7 -2% | 98.7 1% |
| Moyenne finale (programmes/paramètres) | -12% /
-22% | 7% /
7% | 4% /
-3% | 6% /
3% | -3% /
6% |
* ... Moindre est la valeur, meilleures sont les performances
Temps de réponse de l'écran
| ↔ Temps de réponse noir à blanc | ||
|---|---|---|
| 33.2 ms ... hausse ↗ et chute ↘ combinées | ↗ 16 ms hausse | 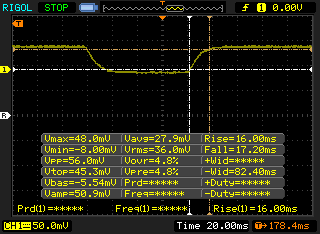 |
| ↘ 17.2 ms chute | ||
| L'écran souffre de latences très élevées, à éviter pour le jeu. En comparaison, tous les appareils testés affichent entre 0.1 (minimum) et 240 (maximum) ms. » 90 % des appareils testés affichent de meilleures performances. Cela signifie que les latences relevées sont moins bonnes que la moyenne (19.9 ms) de tous les appareils testés. | ||
| ↔ Temps de réponse gris 50% à gris 80% | ||
| 50 ms ... hausse ↗ et chute ↘ combinées | ↗ 22 ms hausse | 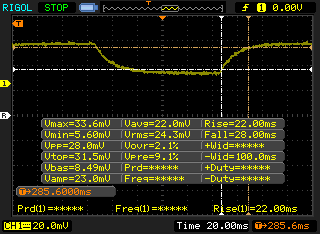 |
| ↘ 28 ms chute | ||
| L'écran souffre de latences très élevées, à éviter pour le jeu. En comparaison, tous les appareils testés affichent entre 0.165 (minimum) et 636 (maximum) ms. » 86 % des appareils testés affichent de meilleures performances. Cela signifie que les latences relevées sont moins bonnes que la moyenne (31.1 ms) de tous les appareils testés. | ||
Scintillement / MLI (Modulation de largeur d'impulsion)
| Scintillement / MLI (Modulation de largeur d'impulsion) décelé | 2500 Hz | ≤ 25 Niveau de luminosité | 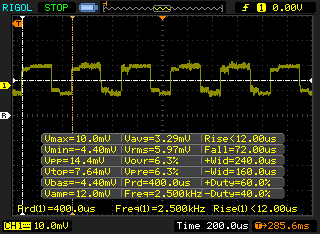 |
Le rétroéclairage de l'écran scintille à la fréquence de 2500 Hz (certainement du fait de l'utilisation d'une MDI - Modulation de largeur d'impulsion) à un niveau de luminosité inférieur ou égal à 25 % . Aucun scintillement ne devrait être perceptible au-dessus de cette valeur. La fréquence de rafraîchissement de 2500 Hz est élevée, la grande majorité des utilisateurs ne devrait pas percevoir de scintillements et être sujette à une fatigue oculaire accrue. En comparaison, 52 % des appareils testés n'emploient pas MDI pour assombrir leur écran. Nous avons relevé une moyenne à 7798 (minimum : 5 - maximum : 343500) Hz dans le cas où une MDI était active. | |||
| wPrime 2.10 - 1024m | |
| Dell XPS 13 7390 2-in-1 Core i3 | |
| Microsoft Surface Pro 7 Core i5-1035G4 | |
| Moyenne Intel Core i7-1065G7 (233 - 354, n=3) | |
| Dell XPS 13 7390 Core i7-10710U | |
* ... Moindre est la valeur, meilleures sont les performances
| PCMark 8 Home Score Accelerated v2 | 3825 points | |
| PCMark 8 Work Score Accelerated v2 | 5039 points | |
| PCMark 10 Score | 4154 points | |
Aide | ||
| Dell XPS 13 9300 Core i7-1065G7 Intel SSDPEMKF512G8 NVMe SSD | Dell XPS 13 7390 Core i7-10710U SK Hynix PC601 NVMe 512 GB | Dell XPS 13 7390 2-in-1 Core i7 Toshiba BG4 KBG40ZPZ512G | Microsoft Surface Laptop 3 13 Core i5-1035G7 SK hynix BC501 HFM256GDGTNG | Asus ZenBook S13 UX392FN WDC PC SN520 SDAPNUW-512G | |
|---|---|---|---|---|---|
| AS SSD | 30% | -20% | -23% | 39% | |
| Seq Read (MB/s) | 1956 | 1804 -8% | 1801 -8% | 1387 -29% | 1224 -37% |
| Seq Write (MB/s) | 1227 | 1000 -19% | 1125 -8% | 504 -59% | 907 -26% |
| 4K Read (MB/s) | 63 | 45.1 -28% | 39.7 -37% | 42.35 -33% | 41.46 -34% |
| 4K Write (MB/s) | 156.6 | 115 -27% | 67 -57% | 120 -23% | 126.2 -19% |
| 4K-64 Read (MB/s) | 475.6 | 893 88% | 1253 163% | 497.4 5% | 1021 115% |
| 4K-64 Write (MB/s) | 539 | 732 36% | 209 -61% | 354.9 -34% | 1251 132% |
| Access Time Read * (ms) | 0.042 | 0.044 -5% | 0.069 -64% | 0.055 -31% | 0.053 -26% |
| Access Time Write * (ms) | 0.105 | 0.095 10% | 0.625 -495% | 0.093 11% | 0.027 74% |
| Score Read (Points) | 734 | 1119 52% | 1472 101% | 678 -8% | 1185 61% |
| Score Write (Points) | 818 | 947 16% | 388 -53% | 525 -36% | 1468 79% |
| Score Total (Points) | 1915 | 2608 36% | 2583 35% | 1520 -21% | 3250 70% |
| Copy ISO MB/s (MB/s) | 1022 | 1515 48% | 1293 27% | 764 -25% | 1404 37% |
| Copy Program MB/s (MB/s) | 302.8 | 535 77% | 560 85% | 256.1 -15% | 402.4 33% |
| Copy Game MB/s (MB/s) | 491.4 | 1211 146% | 927 89% | 368.4 -25% | 902 84% |
| CrystalDiskMark 5.2 / 6 | 12% | -13% | -35% | -9% | |
| Write 4K (MB/s) | 186.8 | 134 -28% | 106.7 -43% | 112.3 -40% | 149.2 -20% |
| Read 4K (MB/s) | 71.4 | 42.91 -40% | 49.94 -30% | 42.13 -41% | 47.18 -34% |
| Write Seq (MB/s) | 1203 | 1841 53% | 1223 2% | 630 -48% | 750 -38% |
| Read Seq (MB/s) | 2600 | 1707 -34% | 1801 -31% | 1023 -61% | 1137 -56% |
| Write 4K Q32T1 (MB/s) | 514 | 394.7 -23% | 325.3 -37% | 336.6 -35% | 749 46% |
| Read 4K Q32T1 (MB/s) | 570 | 398.5 -30% | 551 -3% | 399.6 -30% | 478.7 -16% |
| Write Seq Q32T1 (MB/s) | 786 | 2250 186% | 1224 56% | 821 4% | 1453 85% |
| Read Seq Q32T1 (MB/s) | 2947 | 3265 11% | 2350 -20% | 2030 -31% | 1713 -42% |
| Moyenne finale (programmes/paramètres) | 21% /
24% | -17% /
-18% | -29% /
-28% | 15% /
21% |
* ... Moindre est la valeur, meilleures sont les performances

| 3DMark 11 Performance | 4866 points | |
| 3DMark Ice Storm Standard Score | 67829 points | |
| 3DMark Cloud Gate Standard Score | 14272 points | |
| 3DMark Fire Strike Score | 2753 points | |
| 3DMark Time Spy Score | 937 points | |
Aide | ||
| Shadow of the Tomb Raider - 1280x720 Lowest Preset | |
| Desktop PC | |
| MSI Modern 15 A10RB | |
| Dell Inspiron 15 5000 5585 | |
| Dell XPS 13 9300 Core i7-1065G7 | |
| Moyenne Intel Iris Plus Graphics G7 (Ice Lake 64 EU) (15.6 - 33, n=13) | |
| Dell XPS 13 7390 Core i7-10710U | |
| The Witcher 3 | |
| 1024x768 Low Graphics & Postprocessing | |
| Huawei MateBook 13 i7 | |
| MSI Modern 15 A10RB | |
| Dell Inspiron 15 5000 5585 | |
| Dell XPS 13 9300 Core i7-1065G7 | |
| Moyenne Intel Iris Plus Graphics G7 (Ice Lake 64 EU) (28.2 - 58, n=20) | |
| Dell XPS 13 7390 Core i7-10710U | |
| HP Pavilion x360 15-dq0065cl | |
| 1366x768 Medium Graphics & Postprocessing | |
| MSI Modern 15 A10RB | |
| Huawei MateBook 13 i7 | |
| Dell XPS 13 9300 Core i7-1065G7 | |
| Moyenne Intel Iris Plus Graphics G7 (Ice Lake 64 EU) (20.8 - 36.8, n=18) | |
| HP Pavilion x360 15-dq0065cl | |
| 1920x1080 High Graphics & Postprocessing (Nvidia HairWorks Off) | |
| HP Pavilion Gaming 15t-cx0000 | |
| MSI Modern 15 A10RB | |
| Huawei MateBook 13 i7 | |
| Dell Inspiron 15 5000 5585 | |
| Dell XPS 13 9300 Core i7-1065G7 | |
| Moyenne Intel Iris Plus Graphics G7 (Ice Lake 64 EU) (10.9 - 20.1, n=18) | |
| Bas | Moyen | Élevé | Ultra | |
|---|---|---|---|---|
| BioShock Infinite (2013) | 104.2 | 66.8 | 56.7 | 21.1 |
| The Witcher 3 (2015) | 50.7 | 33.5 | 18.4 | 9.1 |
| Rocket League (2017) | 85.5 | 53.6 | 38.3 | |
| Shadow of the Tomb Raider (2018) | 28 |
| Dell XPS 13 9300 Core i7-1065G7 Iris Plus Graphics G7 (Ice Lake 64 EU), i7-1065G7, Intel SSDPEMKF512G8 NVMe SSD | Dell XPS 13 7390 Core i7-10710U UHD Graphics 620, i7-10710U, SK Hynix PC601 NVMe 512 GB | Dell XPS 13 7390 2-in-1 Core i7 Iris Plus Graphics G7 (Ice Lake 64 EU), i7-1065G7, Toshiba BG4 KBG40ZPZ512G | Huawei Matebook X Pro i5 GeForce MX150, i5-8250U, Samsung PM961 MZVLW256HEHP | Microsoft Surface Laptop 3 13 Core i5-1035G7 Iris Plus Graphics G7 (Ice Lake 64 EU), i5-1035G7, SK hynix BC501 HFM256GDGTNG | Dell XPS 13 9300 i5 FHD UHD Graphics G1 (Ice Lake 32 EU), i5-1035G1, Toshiba XG6 KXG60ZNV512G | |
|---|---|---|---|---|---|---|
| Noise | -3% | -2% | -5% | 0% | 2% | |
| arrêt / environnement * (dB) | 28.3 | 28 1% | 28.1 1% | 27.9 1% | 28.5 -1% | 29.3 -4% |
| Idle Minimum * (dB) | 28.3 | 28 1% | 28.1 1% | 27.9 1% | 28.5 -1% | 29.3 -4% |
| Idle Average * (dB) | 28.3 | 28 1% | 28.1 1% | 27.9 1% | 28.5 -1% | 29.3 -4% |
| Idle Maximum * (dB) | 28.3 | 28 1% | 28.1 1% | 27.9 1% | 28.5 -1% | 29.3 -4% |
| Load Average * (dB) | 32.5 | 33.7 -4% | 31.7 2% | 36.2 -11% | 28.5 12% | 30 8% |
| Witcher 3 ultra * (dB) | 39.3 | 43.4 -10% | 45 -15% | 40.4 -3% | ||
| Load Maximum * (dB) | 39.3 | 46.5 -18% | 43.4 -10% | 45.2 -15% | 40.4 -3% | 32.4 18% |
* ... Moindre est la valeur, meilleures sont les performances
Degré de la nuisance sonore
| Au repos |
| 28.3 / 28.3 / 28.3 dB(A) |
| Fortement sollicité |
| 32.5 / 39.3 dB(A) |
 | ||
30 dB silencieux 40 dB(A) audible 50 dB(A) bruyant |
||
min: | ||
(-) La température maximale du côté supérieur est de 46.6 °C / 116 F, par rapport à la moyenne de 35.9 °C / 97 F, allant de 21.4 à 59 °C pour la classe Subnotebook.
(±) Le fond chauffe jusqu'à un maximum de 44.8 °C / 113 F, contre une moyenne de 39.2 °C / 103 F
(+) En utilisation inactive, la température moyenne du côté supérieur est de 27.4 °C / 81 F, par rapport à la moyenne du dispositif de 30.8 °C / 87 F.
(±) En jouant à The Witcher 3, la température moyenne du côté supérieur est de 33.9 °C / 93 F, alors que la moyenne de l'appareil est de 30.8 °C / 87 F.
(+) Les repose-poignets et le pavé tactile sont plus froids que la température de la peau avec un maximum de 29.8 °C / 85.6 F et sont donc froids au toucher.
(±) La température moyenne de la zone de l'appui-paume de dispositifs similaires était de 28.2 °C / 82.8 F (-1.6 °C / #-2.8 F).
| Éteint/en veille | |
| Au repos | |
| Fortement sollicité |
|
Légende:
min: | |
| Dell XPS 13 9300 Core i7-1065G7 i7-1065G7, Iris Plus Graphics G7 (Ice Lake 64 EU), Intel SSDPEMKF512G8 NVMe SSD, IPS, 1920x1200, 13.4" | Dell XPS 13 7390 Core i7-10710U i7-10710U, UHD Graphics 620, SK Hynix PC601 NVMe 512 GB, IPS, 3840x2160, 13.3" | Dell XPS 13 7390 2-in-1 Core i7 i7-1065G7, Iris Plus Graphics G7 (Ice Lake 64 EU), Toshiba BG4 KBG40ZPZ512G, IPS, 1920x1200, 13.4" | Huawei Matebook X Pro i5 i5-8250U, GeForce MX150, Samsung PM961 MZVLW256HEHP, IPS, 3000x2000, 13.9" | Asus ZenBook S13 UX392FN i7-8565U, GeForce MX150, WDC PC SN520 SDAPNUW-512G, IPS, 1920x1080, 13.9" | Microsoft Surface Laptop 3 13 Core i5-1035G7 i5-1035G7, Iris Plus Graphics G7 (Ice Lake 64 EU), SK hynix BC501 HFM256GDGTNG, IPS, 2256x1504, 13.5" | Dell XPS 13 9300 i5 FHD i5-1035G1, UHD Graphics G1 (Ice Lake 32 EU), Toshiba XG6 KXG60ZNV512G, IPS, 1920x1200, 13.4" | |
|---|---|---|---|---|---|---|---|
| Power Consumption | -16% | 4% | -27% | -17% | -14% | -3% | |
| Idle Minimum * (Watt) | 4.2 | 4.7 -12% | 2.6 38% | 3.5 17% | 3.4 19% | 4.4 -5% | 3.4 19% |
| Idle Average * (Watt) | 6.9 | 8.3 -20% | 5.3 23% | 8.9 -29% | 6.3 9% | 7.5 -9% | 6 13% |
| Idle Maximum * (Watt) | 7.5 | 9 -20% | 7 7% | 12.3 -64% | 10.4 -39% | 7.8 -4% | 10.2 -36% |
| Load Average * (Watt) | 33.3 | 42 -26% | 43.1 -29% | 54.2 -63% | 51 -53% | 41.9 -26% | 36.6 -10% |
| Witcher 3 ultra * (Watt) | 37.1 | 43.1 -16% | 42.4 -14% | 39 -5% | 40.8 -10% | ||
| Load Maximum * (Watt) | 48.4 | 49 -1% | 49 -1% | 52.1 -8% | 62.7 -30% | 63.9 -32% | 49.3 -2% |
* ... Moindre est la valeur, meilleures sont les performances
| Dell XPS 13 9300 Core i7-1065G7 i7-1065G7, Iris Plus Graphics G7 (Ice Lake 64 EU), 52 Wh | Dell XPS 13 7390 Core i7-10710U i7-10710U, UHD Graphics 620, 52 Wh | Dell XPS 13 7390 2-in-1 Core i7 i7-1065G7, Iris Plus Graphics G7 (Ice Lake 64 EU), 51 Wh | Huawei Matebook X Pro i5 i5-8250U, GeForce MX150, 57.4 Wh | Asus ZenBook S13 UX392FN i7-8565U, GeForce MX150, 50 Wh | Microsoft Surface Laptop 3 13 Core i5-1035G7 i5-1035G7, Iris Plus Graphics G7 (Ice Lake 64 EU), 45 Wh | Dell XPS 13 9300 i5 FHD i5-1035G1, UHD Graphics G1 (Ice Lake 32 EU), 52 Wh | |
|---|---|---|---|---|---|---|---|
| Autonomie de la batterie | -34% | -29% | -27% | -34% | -35% | -8% | |
| WiFi v1.3 (h) | 12.7 | 8.4 -34% | 9 -29% | 9.3 -27% | 8.4 -34% | 8.3 -35% | 11.7 -8% |
| Reader / Idle (h) | 20.7 | 28.5 | 34.4 | ||||
| Load (h) | 2.2 | 1.7 | 1.9 | 3.4 |
Points positifs
Points négatifs
Passer d’une version Core i5-1035G1 à une version Core i7-1065G7 permettra des gains de performances du processeur d’environ 23 %, et des graphismes d’environ 70 % pour un coût énergétique négligeable. Ainsi la meilleure raison de choisir la version Core i7 plutôt que la version Core i5 sera le gain graphique, pour un peu d’édition photo ou du jeu occasionnel tels Rocket League ou LoL. Ceux qui font essentiellement du traitement de texte, du web ou du streaming vidéo, seront bien servis par la configuration Core i5. Et l’on peu même considérer un ancien Core i5-8265U ou Core i7-8565U, le Core i5-1035G1 se comportant très proche de cette ancienne génération de processeurs.
Les performances du processeur commencent à montrer leur limite avec des sollicitations extrêmes sur de longues périodes. Mais cela ne gênera certainement pas l’audience-cible des utilisateurs d’ultraportables, ceux recherchant des performances se tournant vers des PC portables plus puissants comme le XPS 15 ou l’Asus ZenBook Pro.
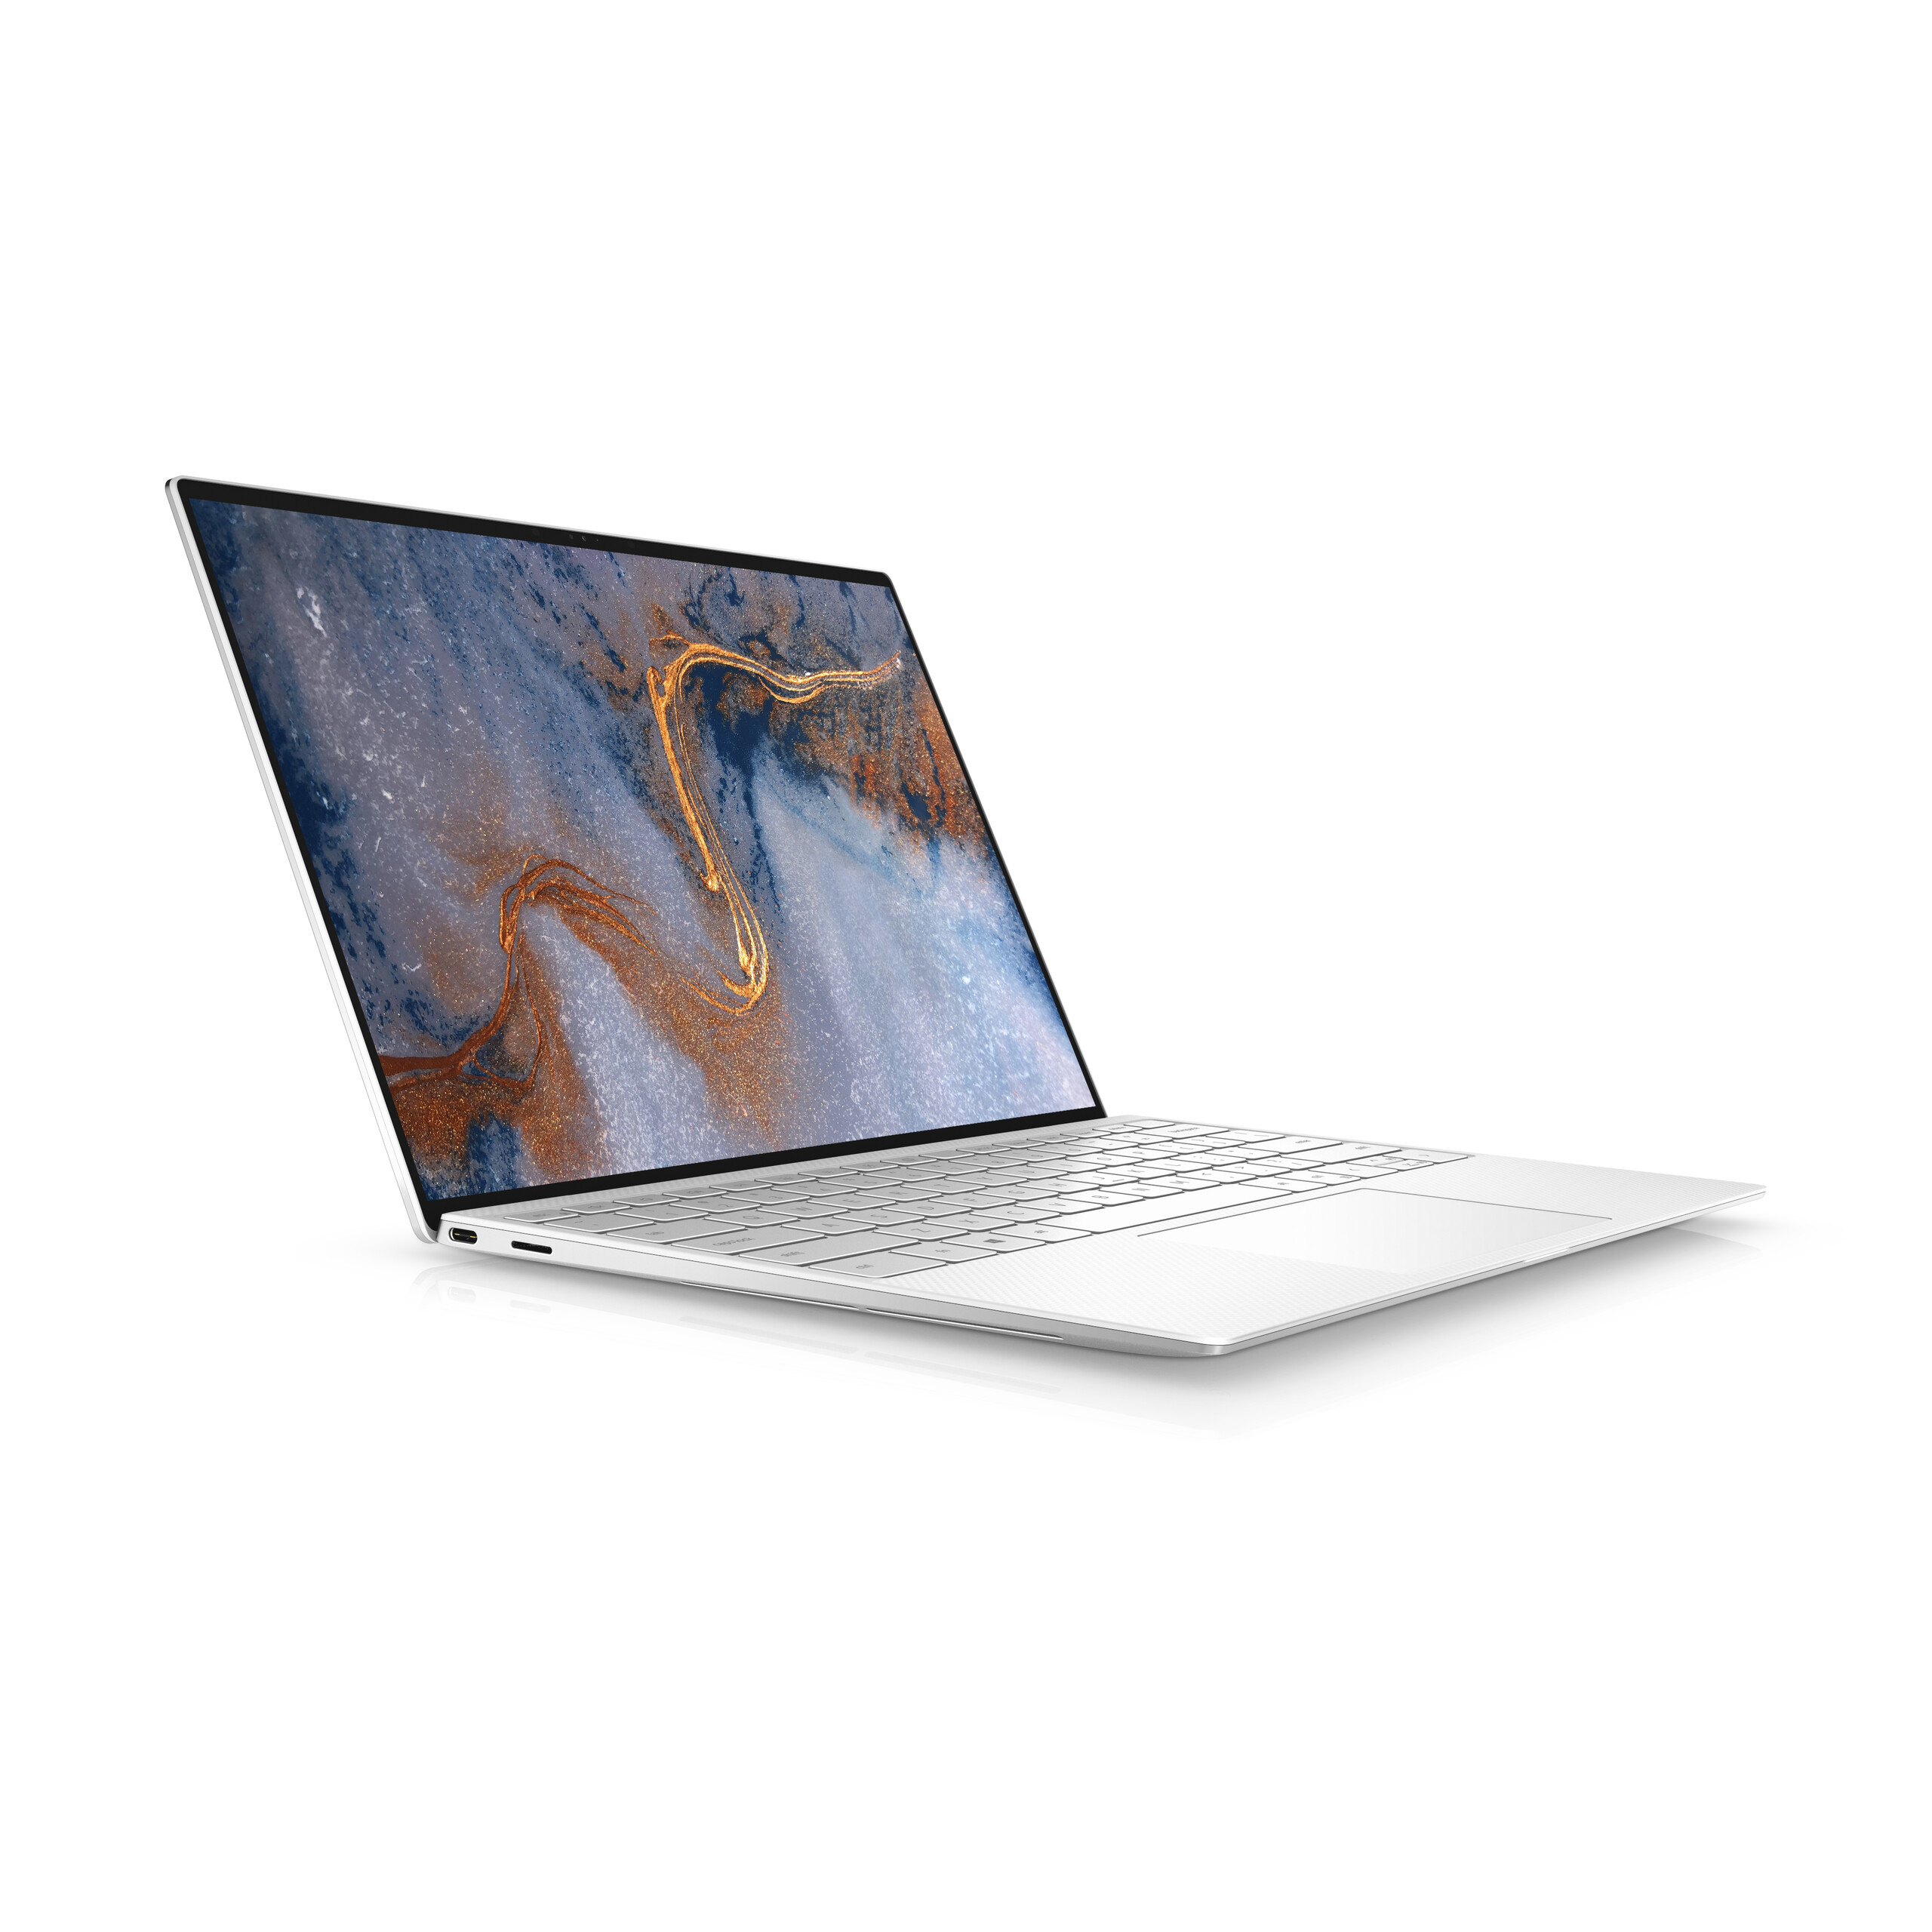
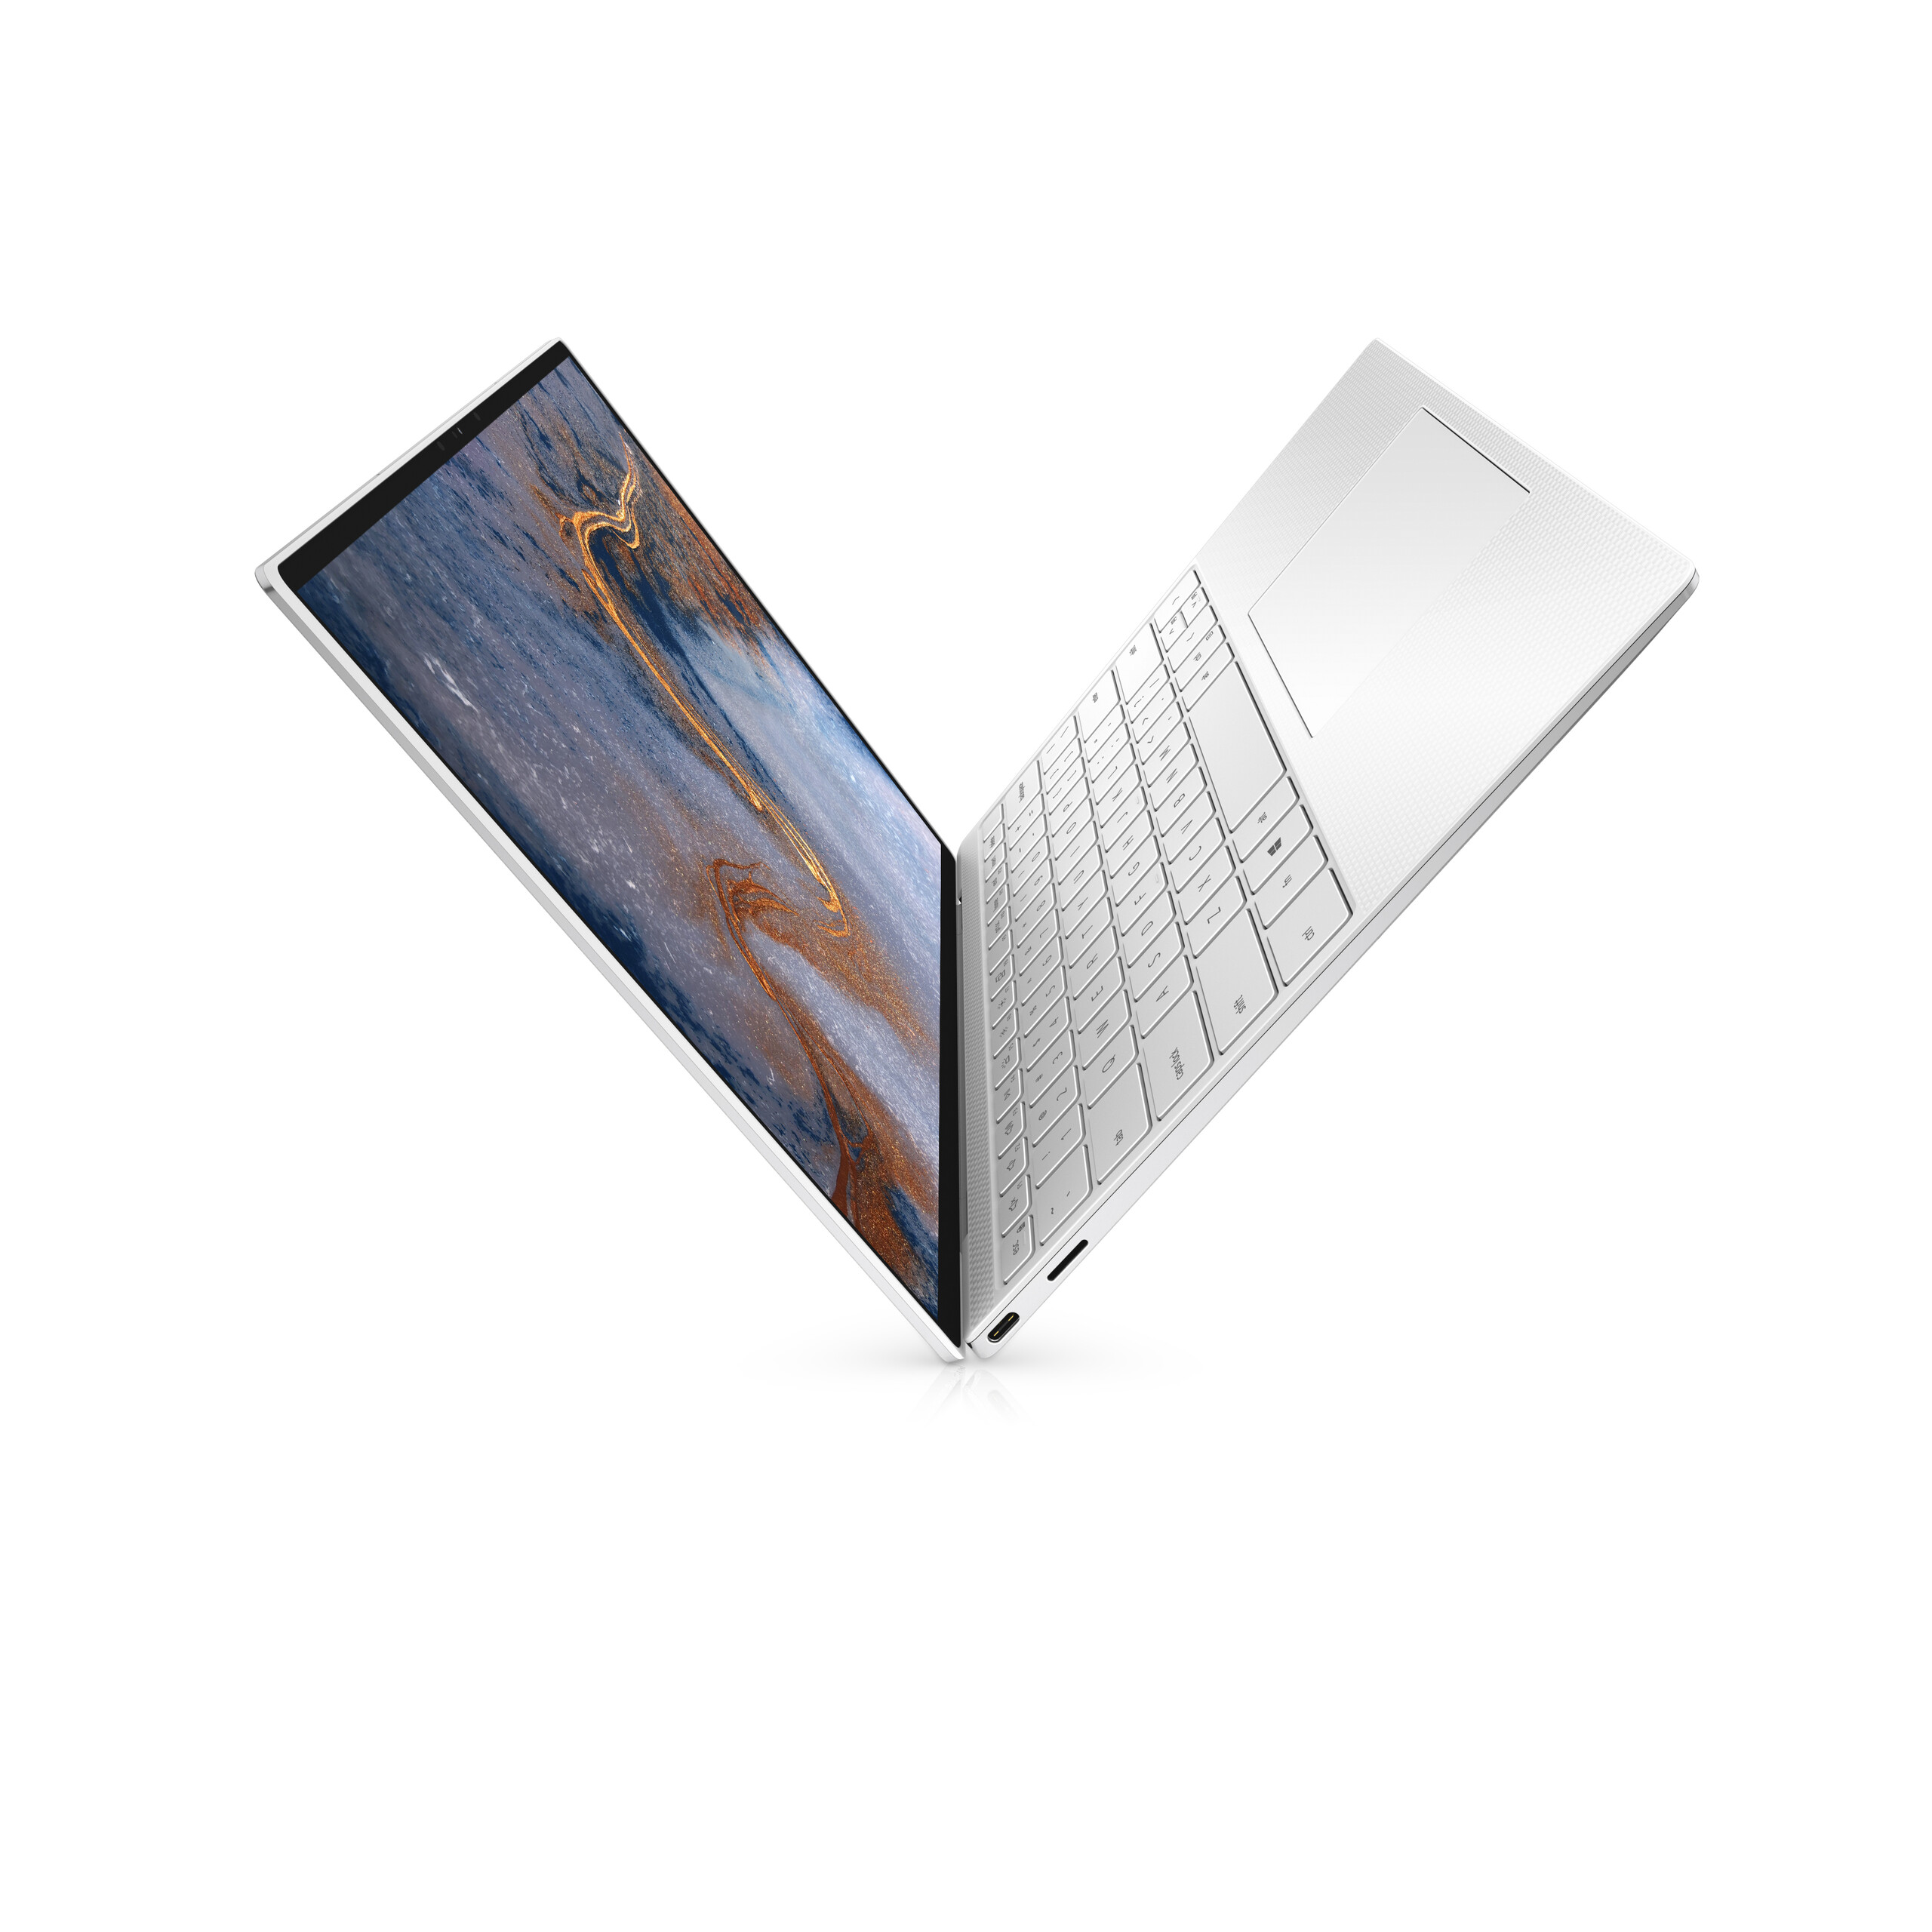
L’élément le plus marquant du XPS 13 9300 est son écran 16:10 plus grand que l’ancien format 16:9, qui aura plus d’influence sur l’utilisateur que des variations mineures de performances. C’est probablement l’un des choix les plus malins de Dell pour attirer toujours plus d’utilisateurs de MacBook Air ou de MacBook Pro 13, qui sont habitués à ces écrans 16:10 depuis des années. Nous trouvons que ce rapport est un bon compromis entre les portables 16:9 traditionnels et les portables de travail 3:2 comme le Huawei MateBook X Pro ou la série Microsoft Surface.
Le XPS 13 devient chaque année une alternative plus pertinente au MacBook. Sa dernière mouture propose un écran 16:10 et un clickpad plus grands, sans sacrifier aucune des fonctionnalités du modèle de l’an dernier.
L’intégralité de cette critique est disponible en anglais en suivant ce lien.
Dell XPS 13 9300 Core i7-1065G7
- 03/25/2020 v7 (old)
Allen Ngo
Price comparison
