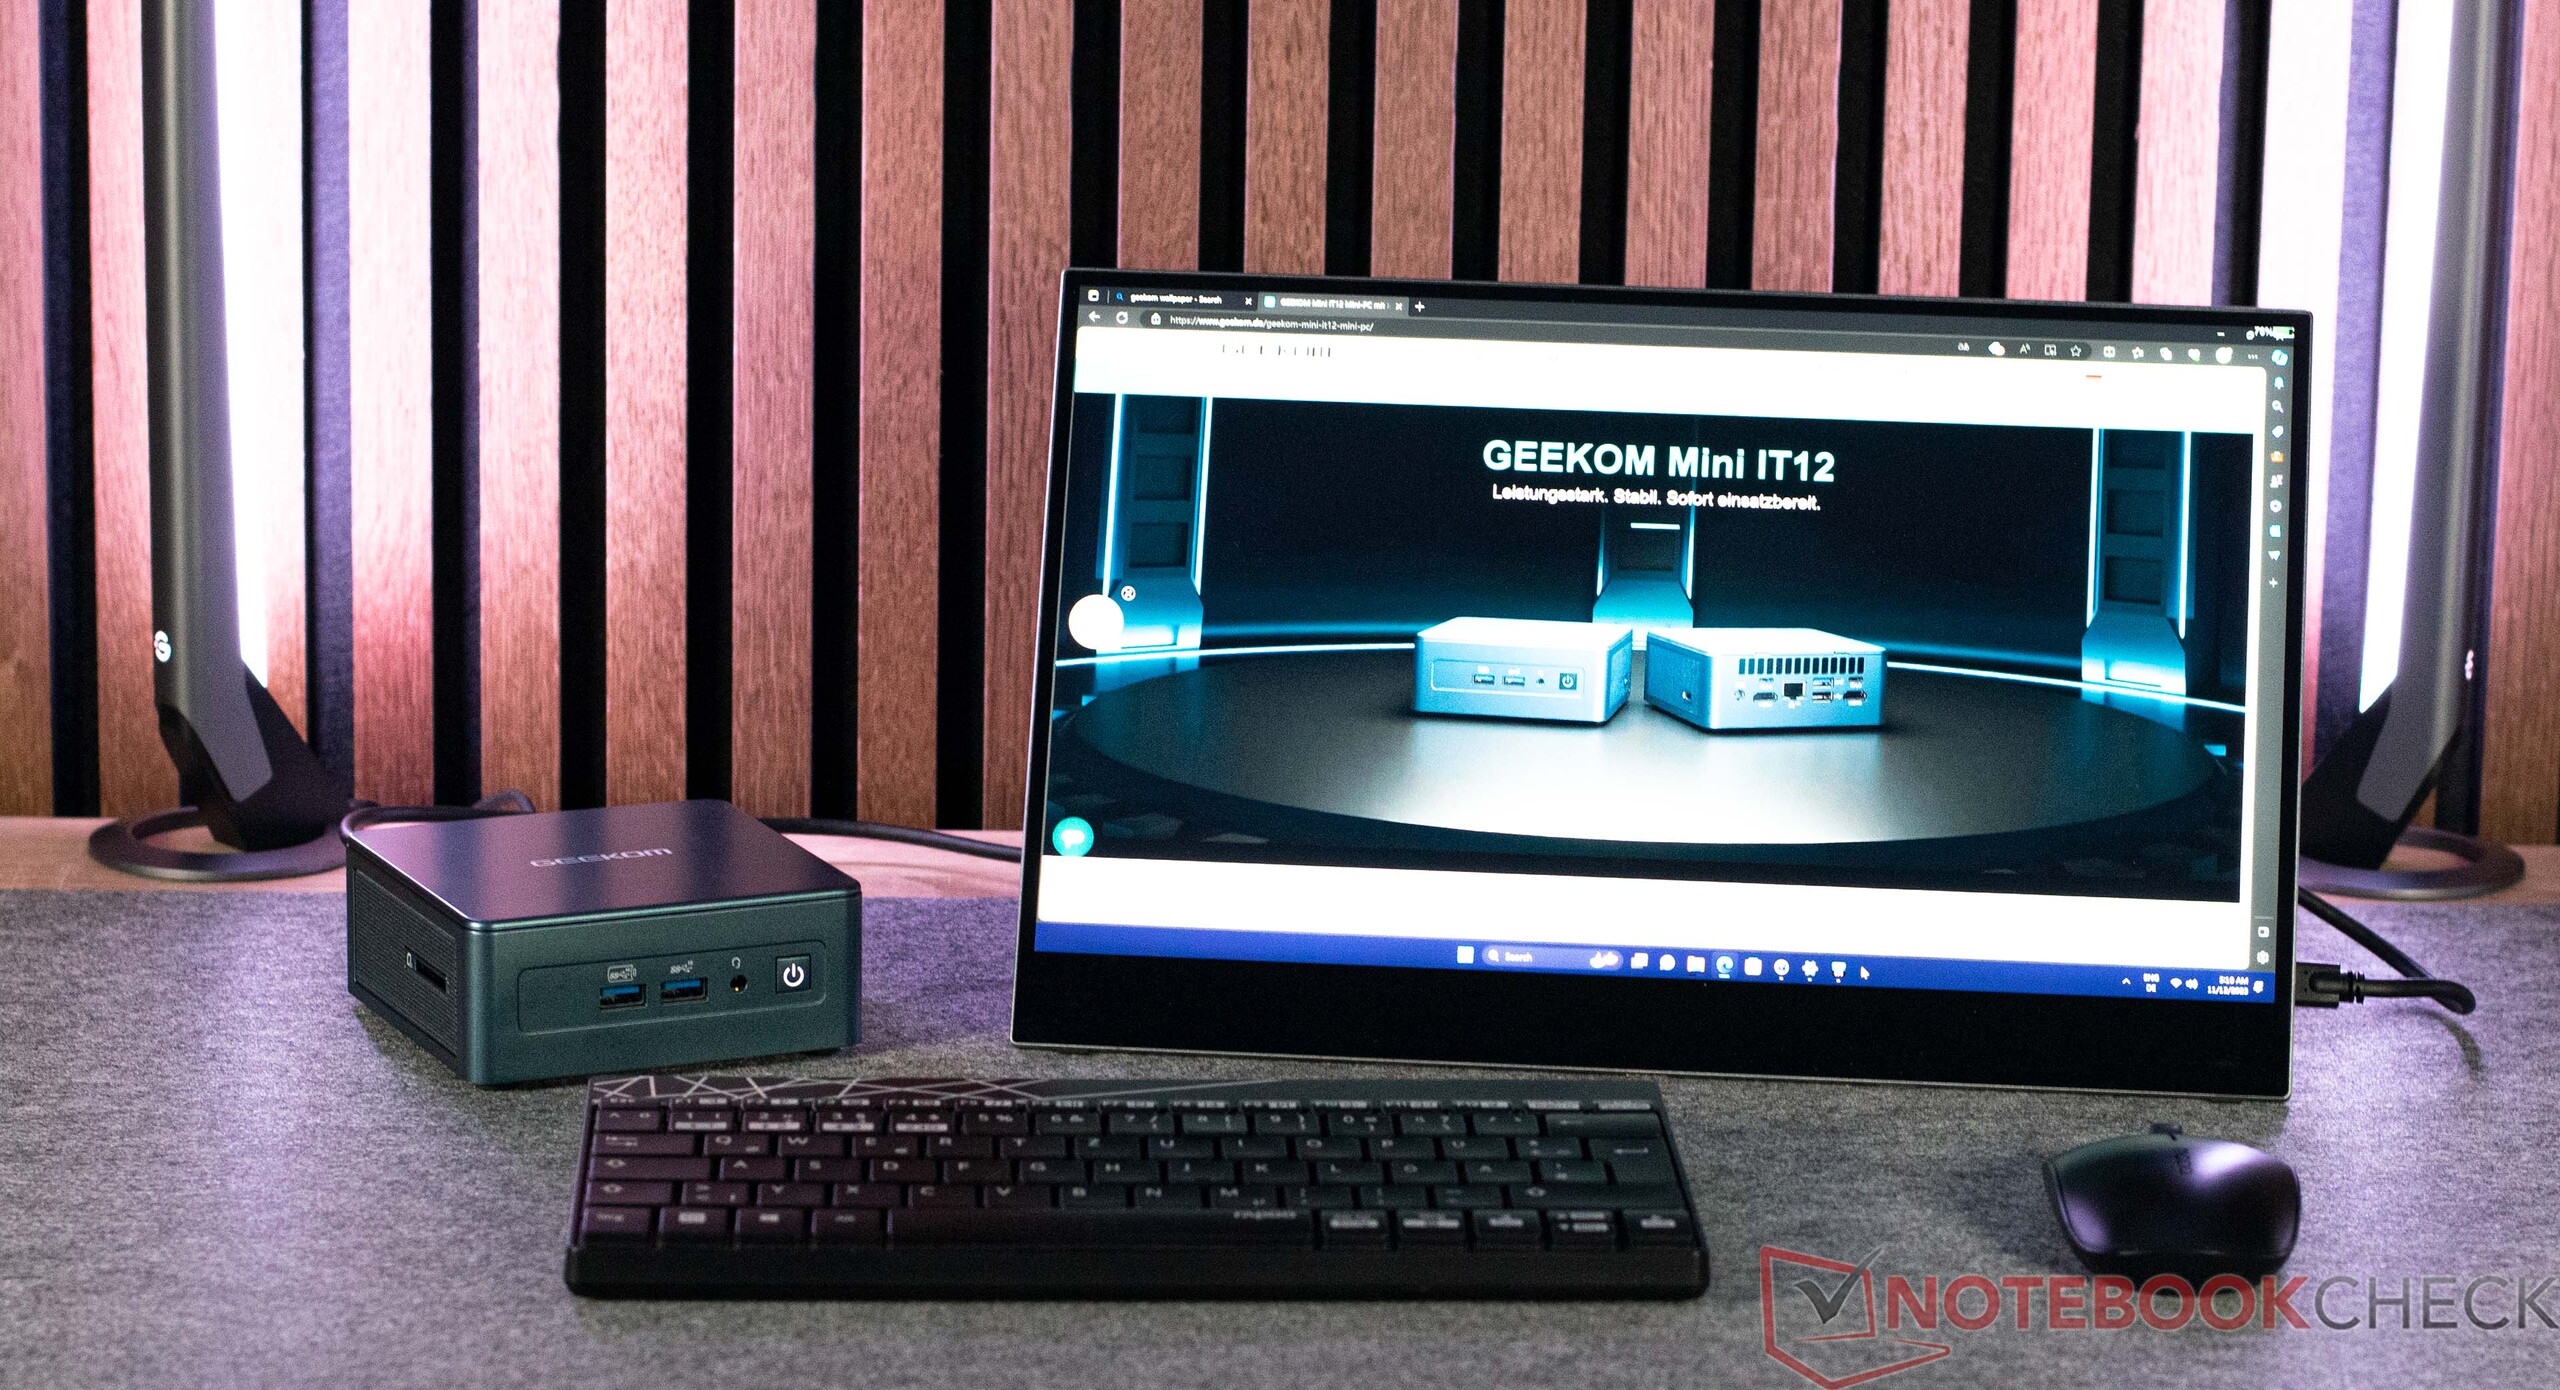
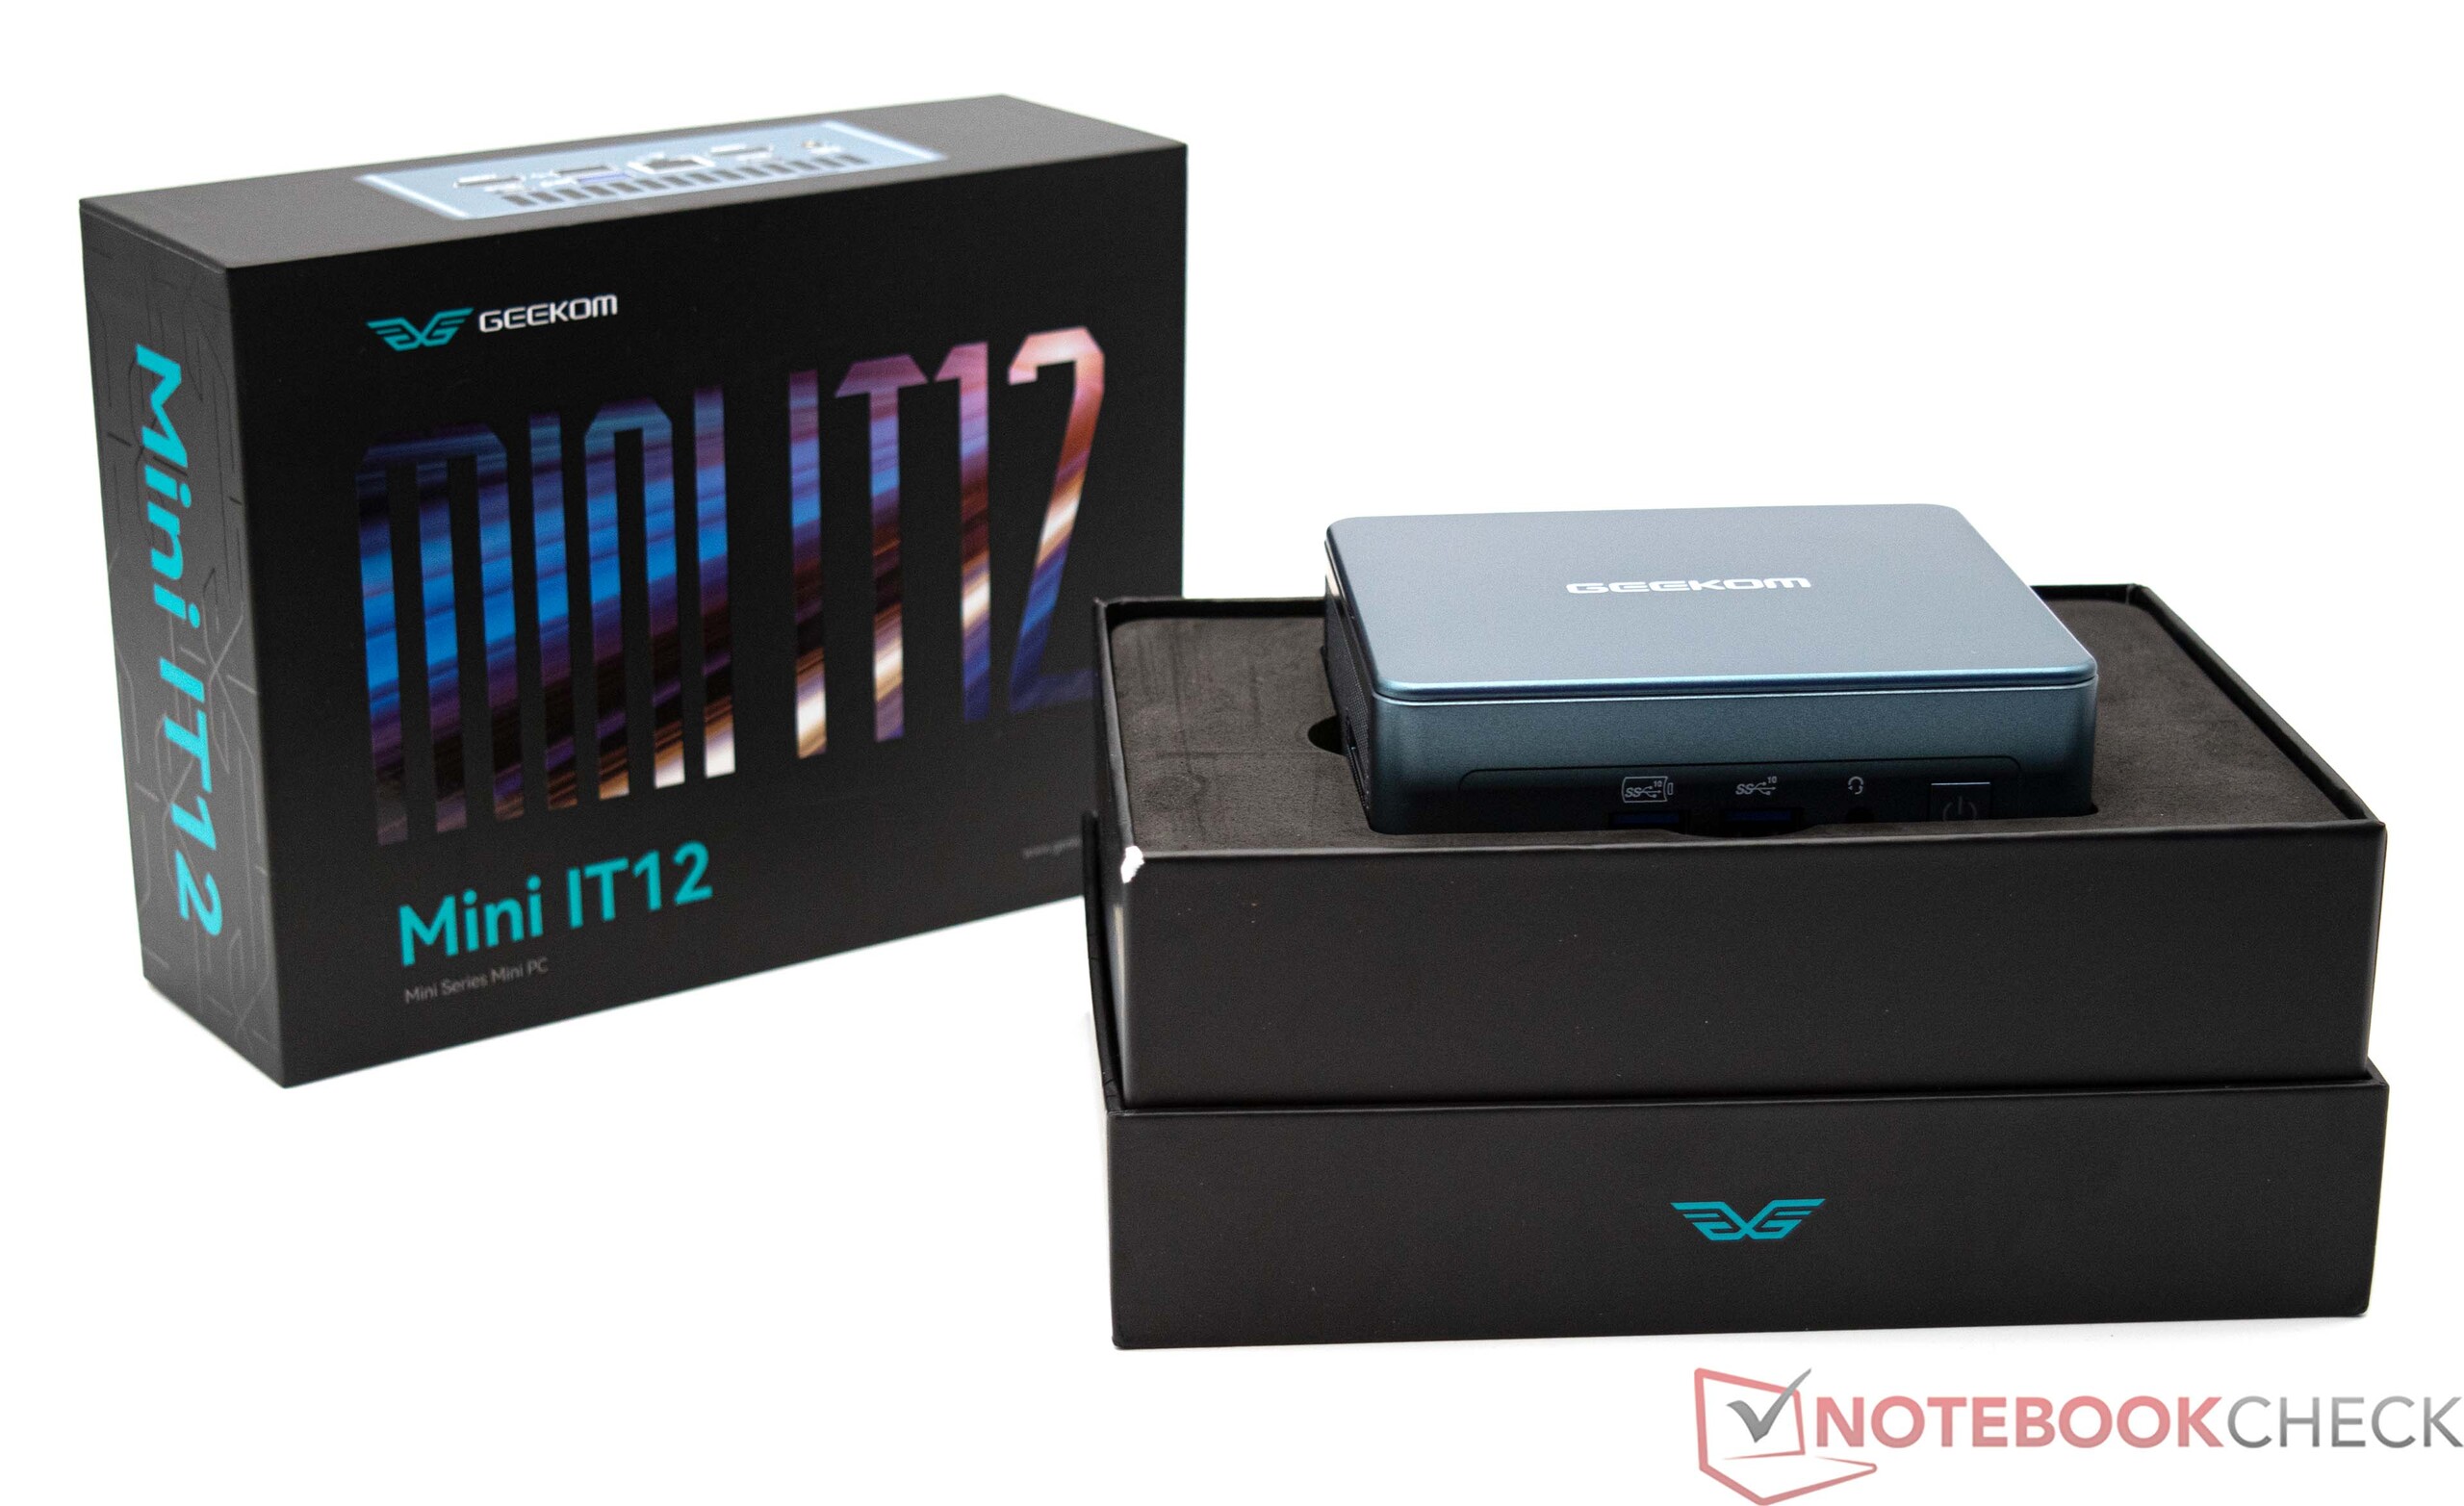
Test du Geekom Mini IT12 Intel Core i5-12450H : Mini PC avec de bonnes performances et 2 USB 4

Le Geekom Mini IT12 est un mini PC compact et puissant, doté d'un processeur Intel Core i5-12450H Intel Core i5-12450Hde 16 Go de RAM et d'un disque dur de 512 Go dans notre configuration de test. Avec un prix de 449 dollars, Geekom se positionne de manière compétitive sur le marché des appareils équipés de manière similaire. Notamment, le Geekom Mini IT12 dispose d'une connectivité légèrement supérieure, ce qui pourrait influencer les décisions d'achat.
Destiné à la série Intel NUC, désormais proposée par Asus, le Geekom Mini IT12 est confronté à la concurrence de Minisforum et NiPoGi, qui présentent tous deux des produits comparables. Dans l'aperçu suivant, nous avons compilé une liste de dispositifs de comparaison pour cet examen.
Comparaison avec les concurrents potentiels
Note | Date | Modèle | Poids | Épaisseur | Prix |
|---|---|---|---|---|---|
| 79.5 % v7 (old) | 11/23 | Geekom Mini IT12 i5-12450H, UHD Graphics 64EUs | 572 g | 45.6 mm | |
| 82.3 % v7 (old) | 05/23 | Geekom Mini IT12 i7-1260P, Iris Xe G7 96EUs | 572 g | 45.6 mm | |
| 80.8 % v7 (old) | 04/23 | Intel NUC 13 Pro Kit NUC13ANK i7-1360P, Iris Xe G7 96EUs | 538 g | 37 mm | |
| 79.5 % v7 (old) | 02/23 | Minisforum Mars Series MC560 R5 5600U, Vega 7 | 562 g | 66 mm | |
| 78.9 % v7 (old) | 11/22 | Intel NUC 12 Pro Kit NUC12WSKi7 i7-1260P, Iris Xe G7 96EUs | 511 g | 37 mm | |
| 78 % v7 (old) | 10/23 | Minisforum Venus Series UN1245 i5-12450H, UHD Graphics 64EUs | 545 g | 54.3 mm | |
| 77.2 % v7 (old) | 10/23 | NiPoGi CK10 i5-12450H, UHD Graphics 64EUs | 481 g | 50 mm |
Geekom Mini IT12 i5-12450H en détail
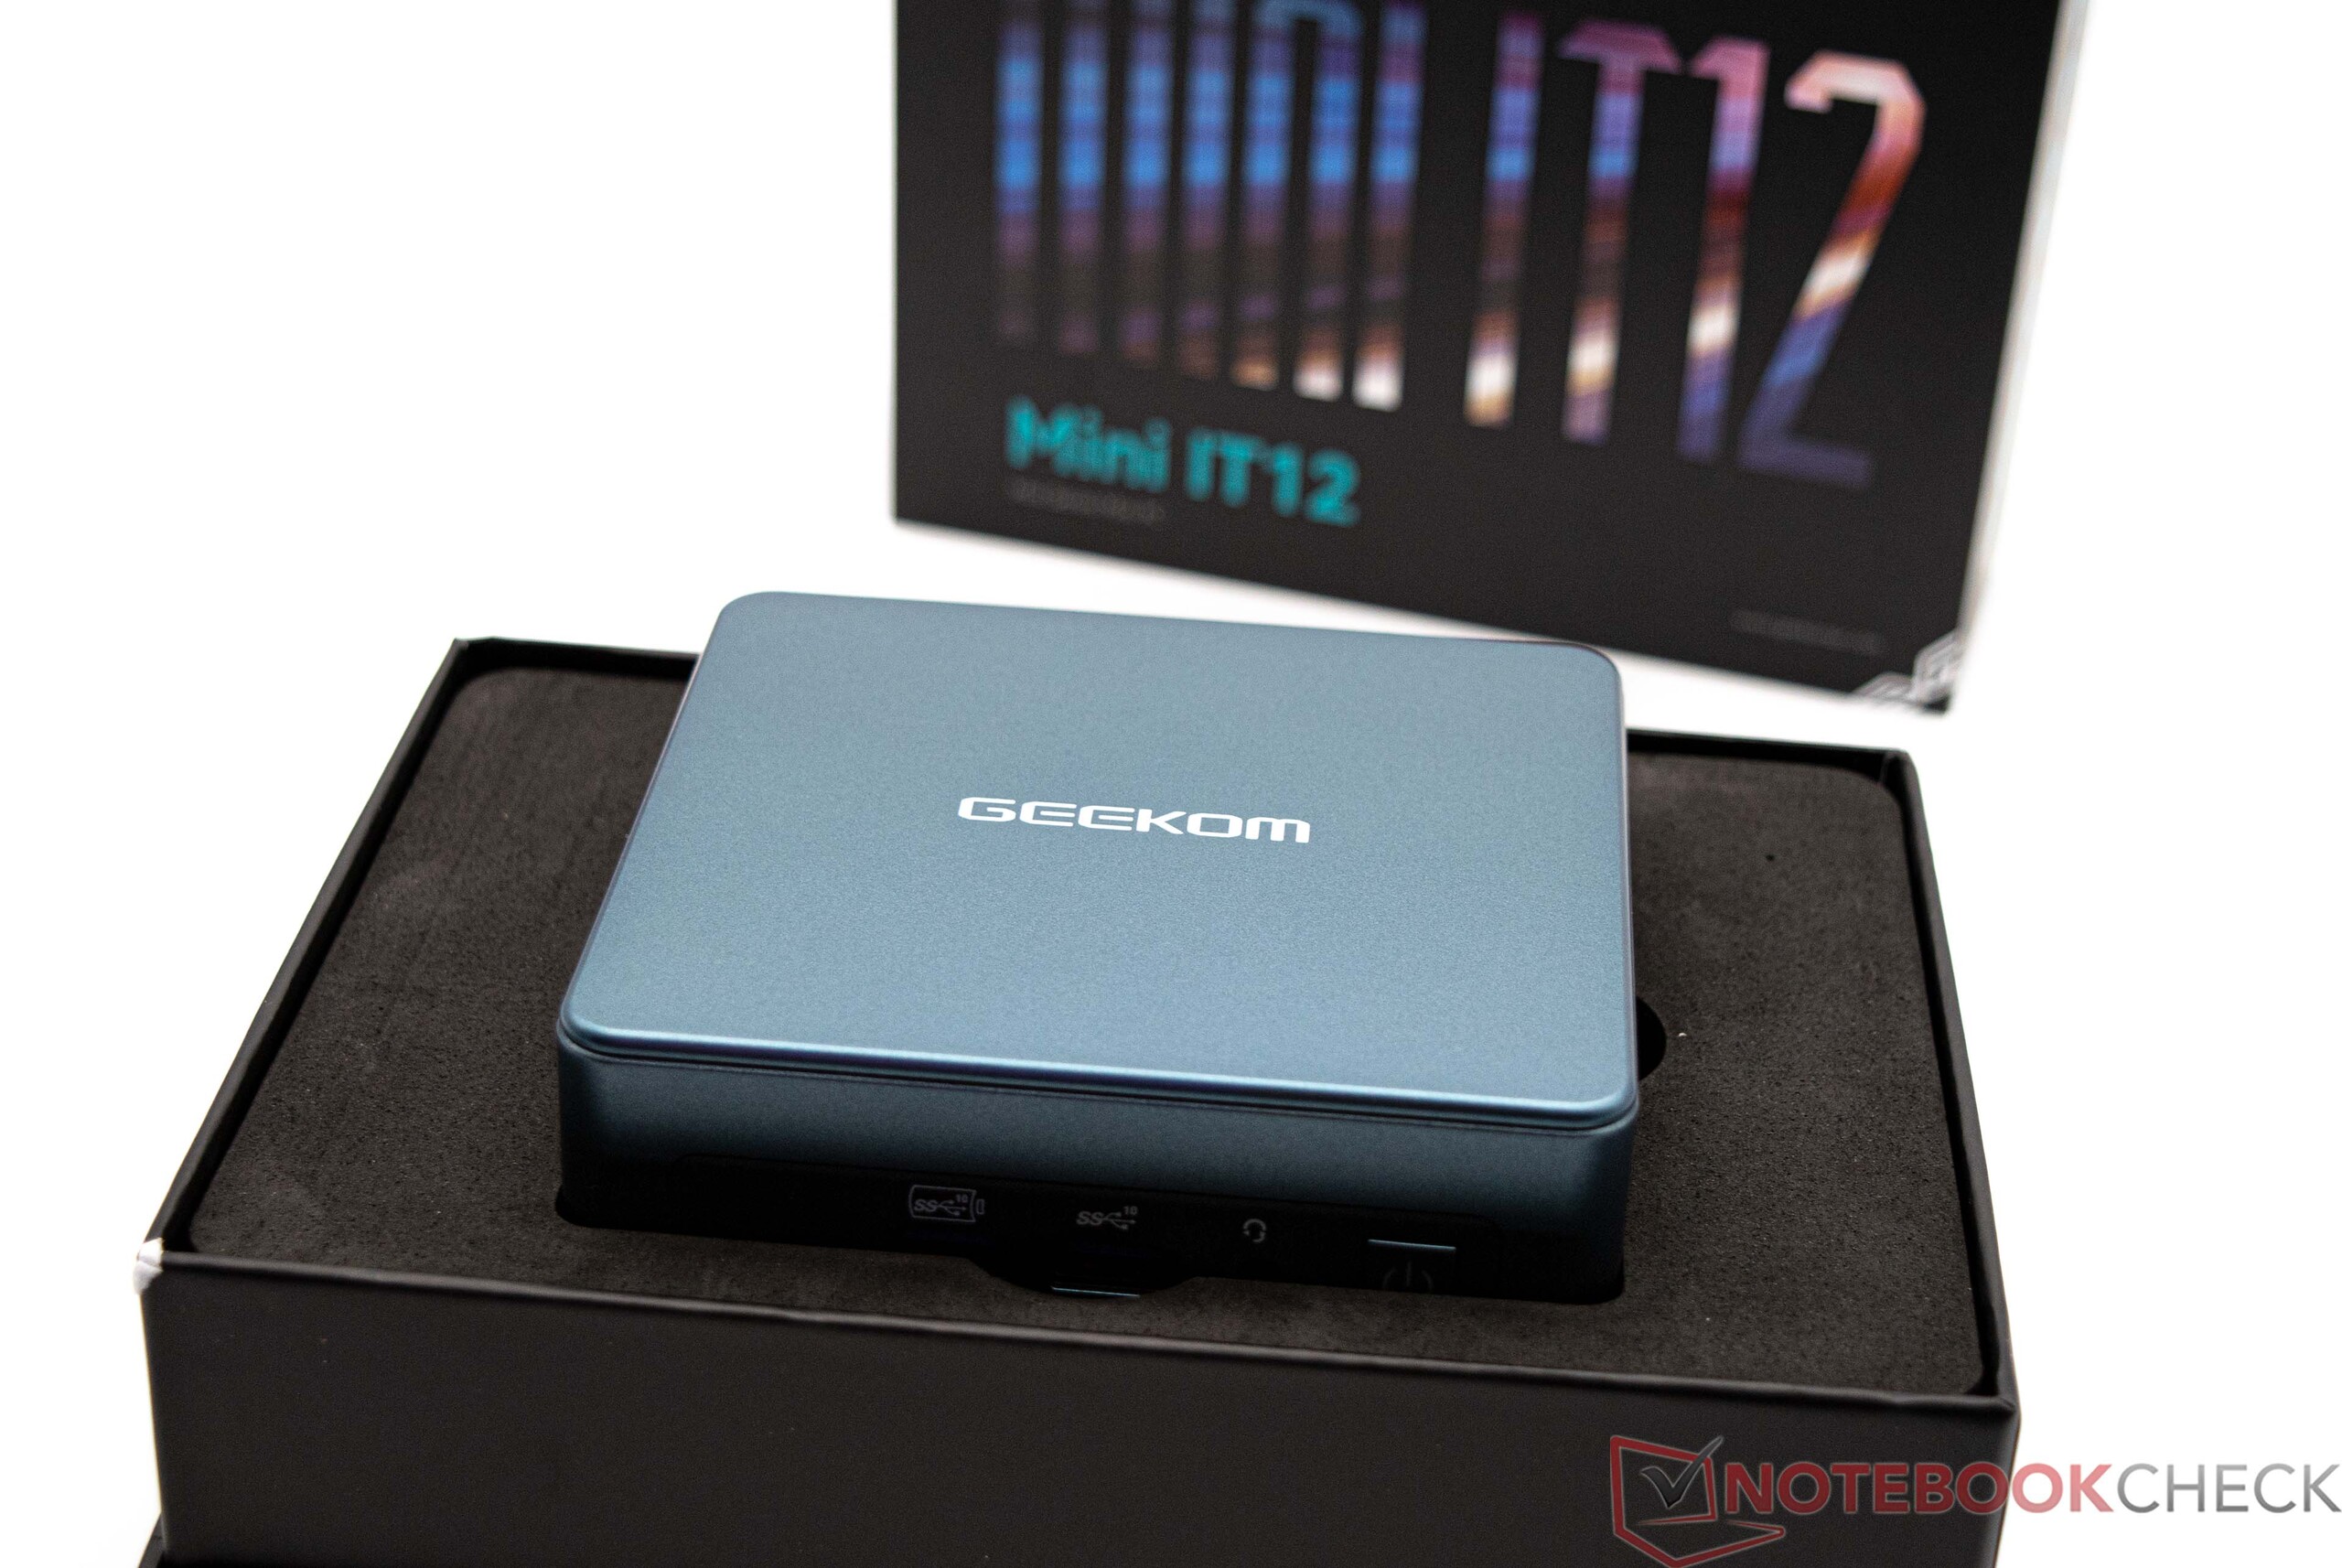
Boîtier - extérieur familier de type NUC d'Intel
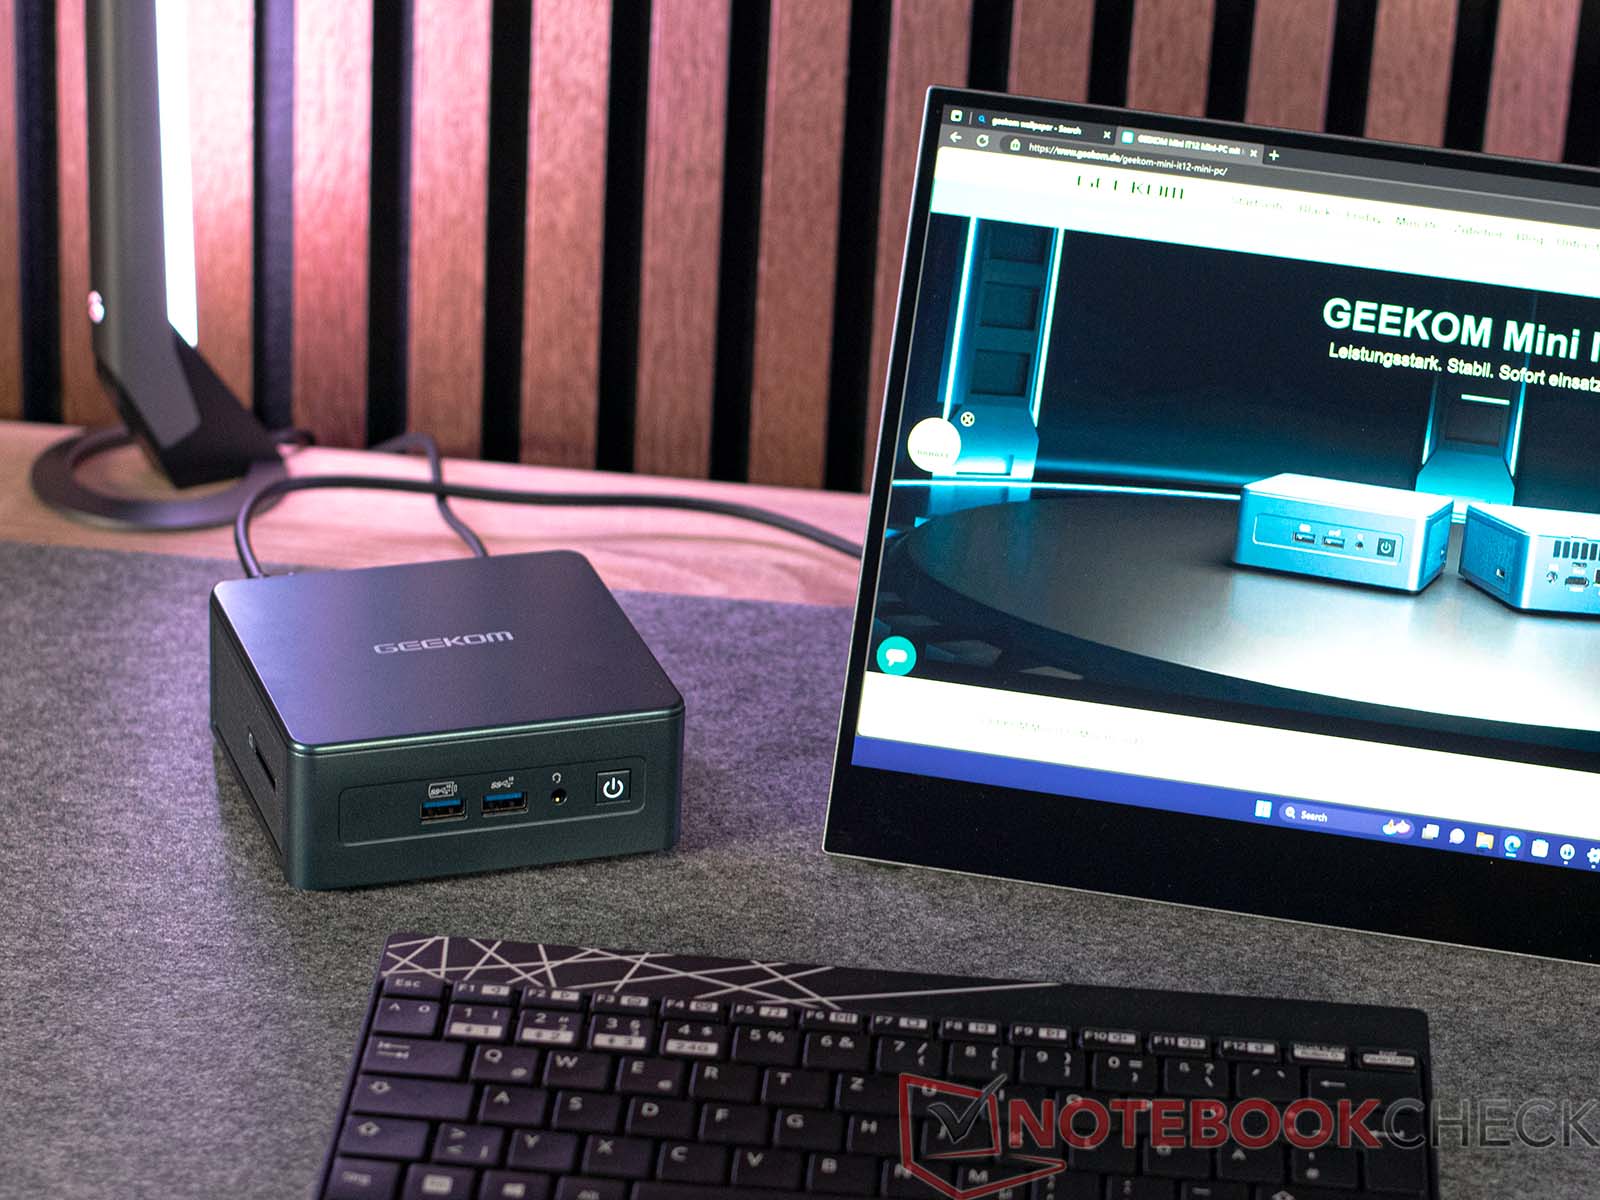
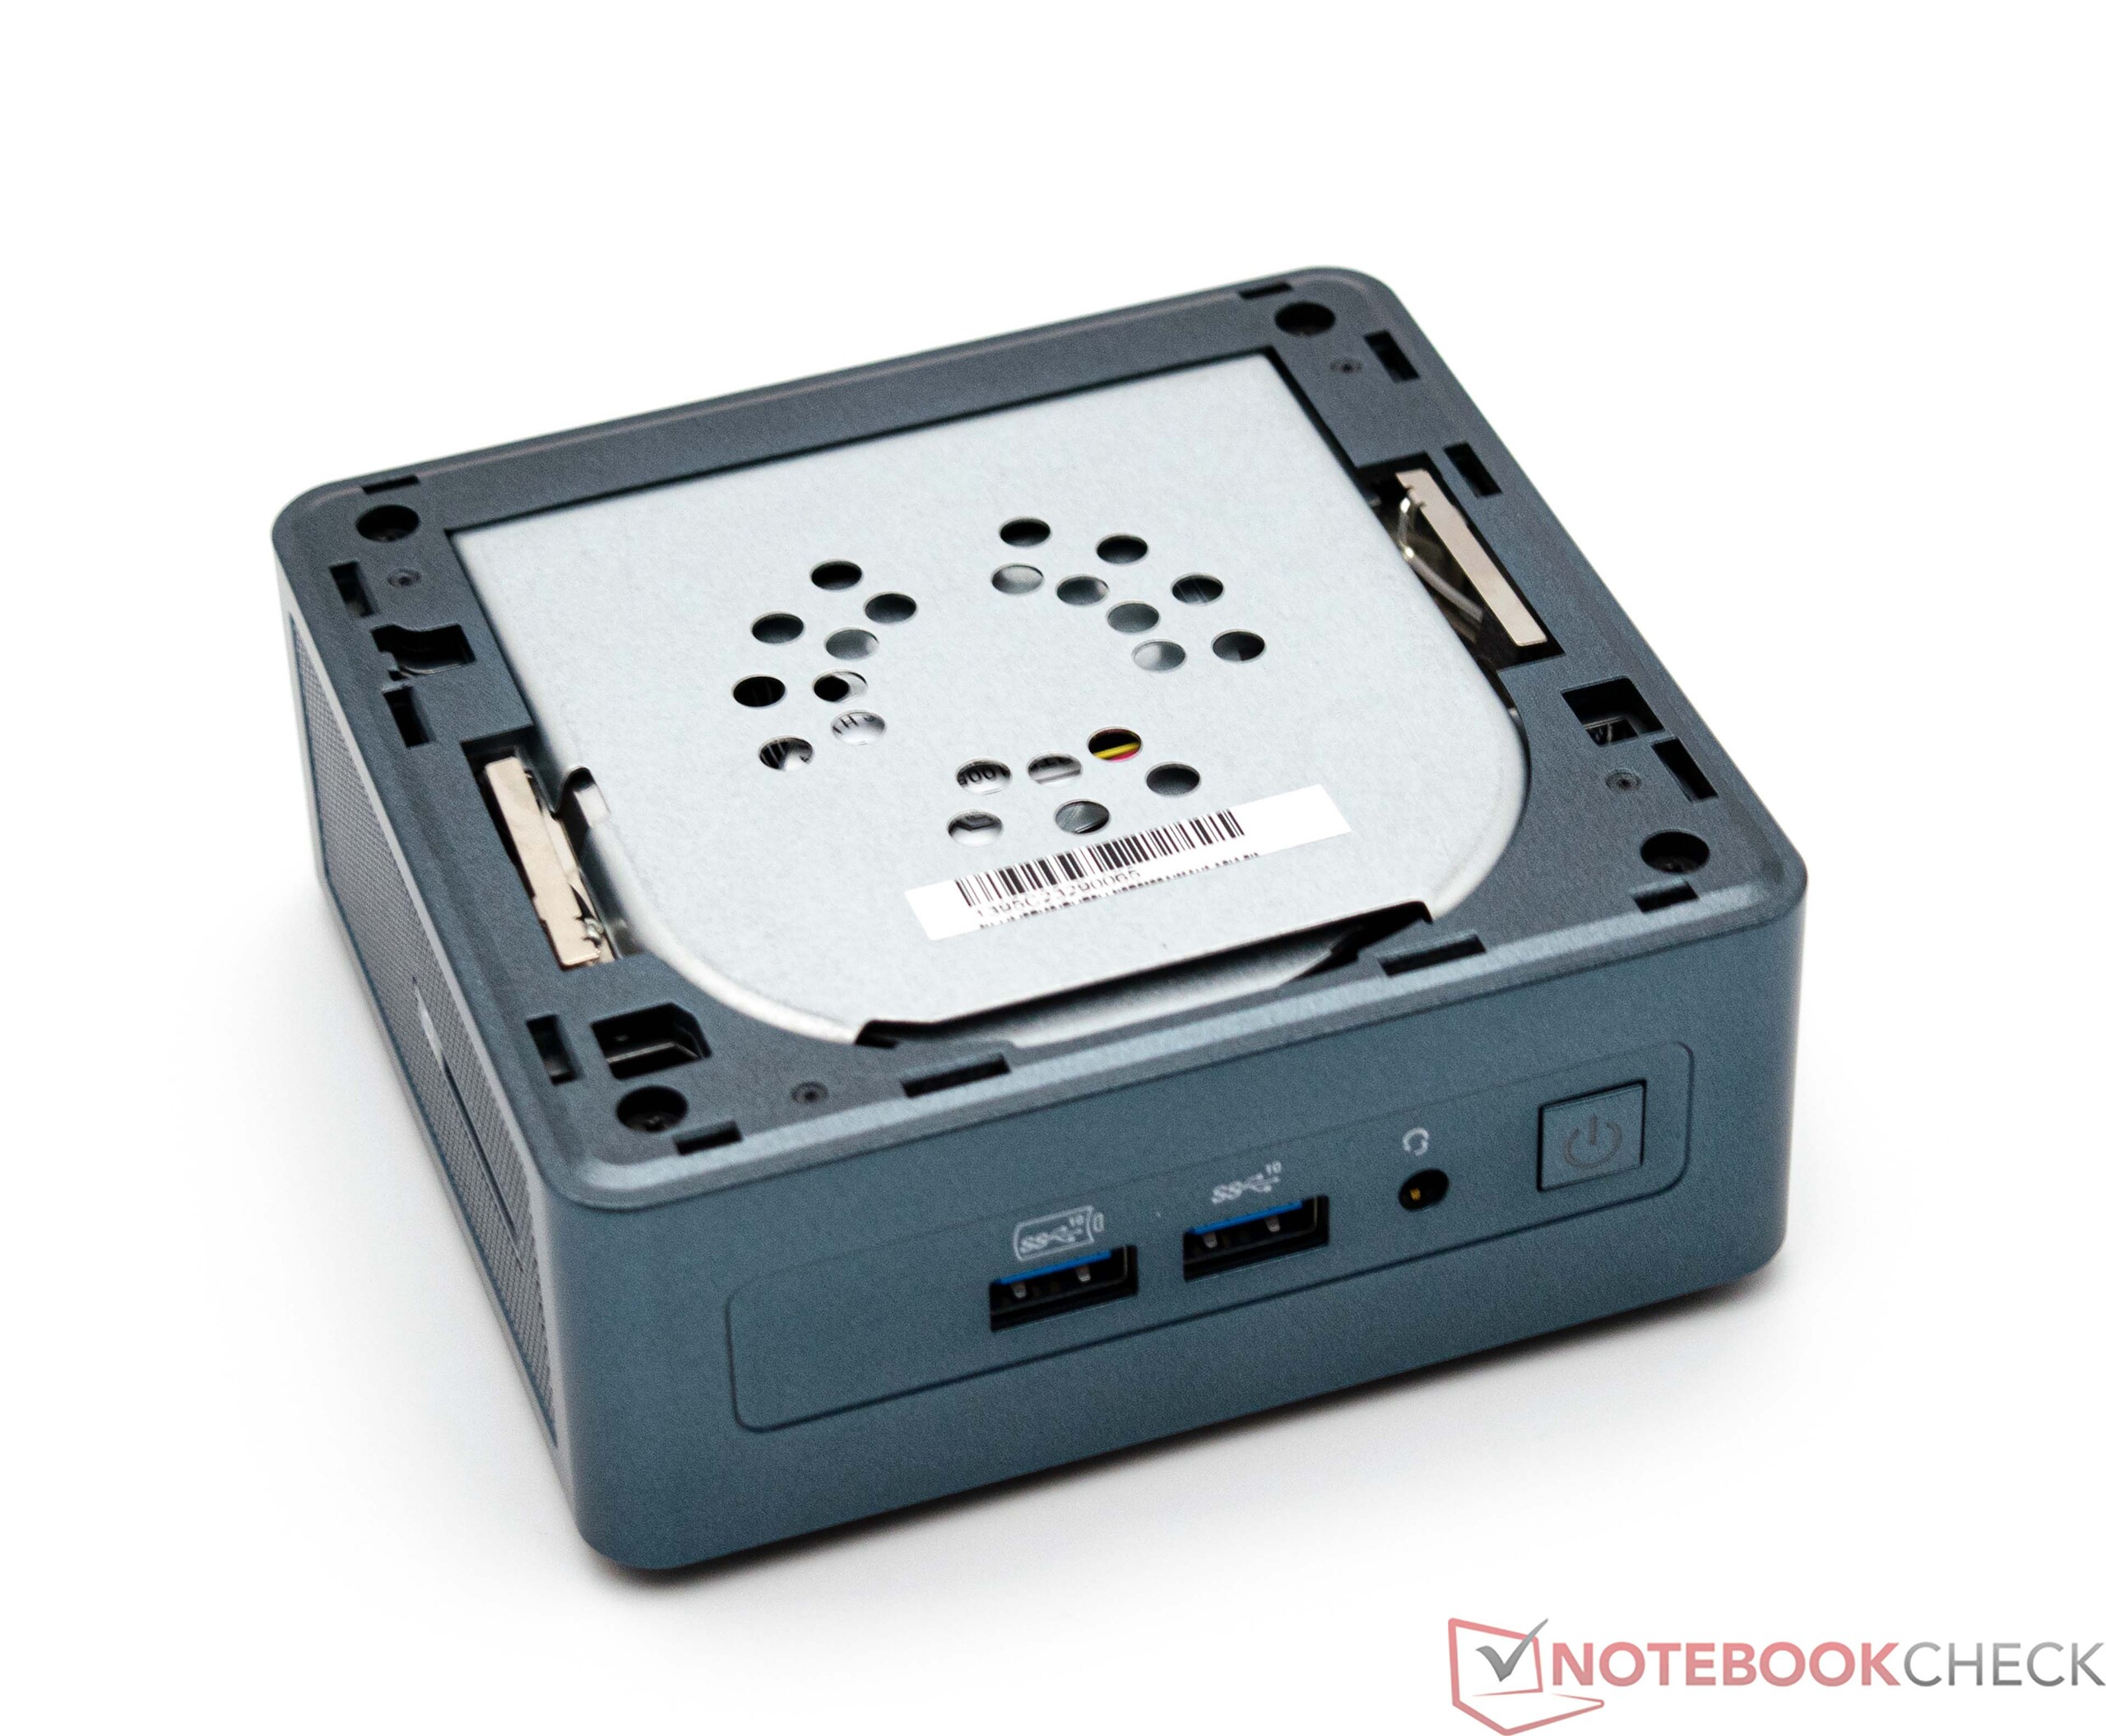
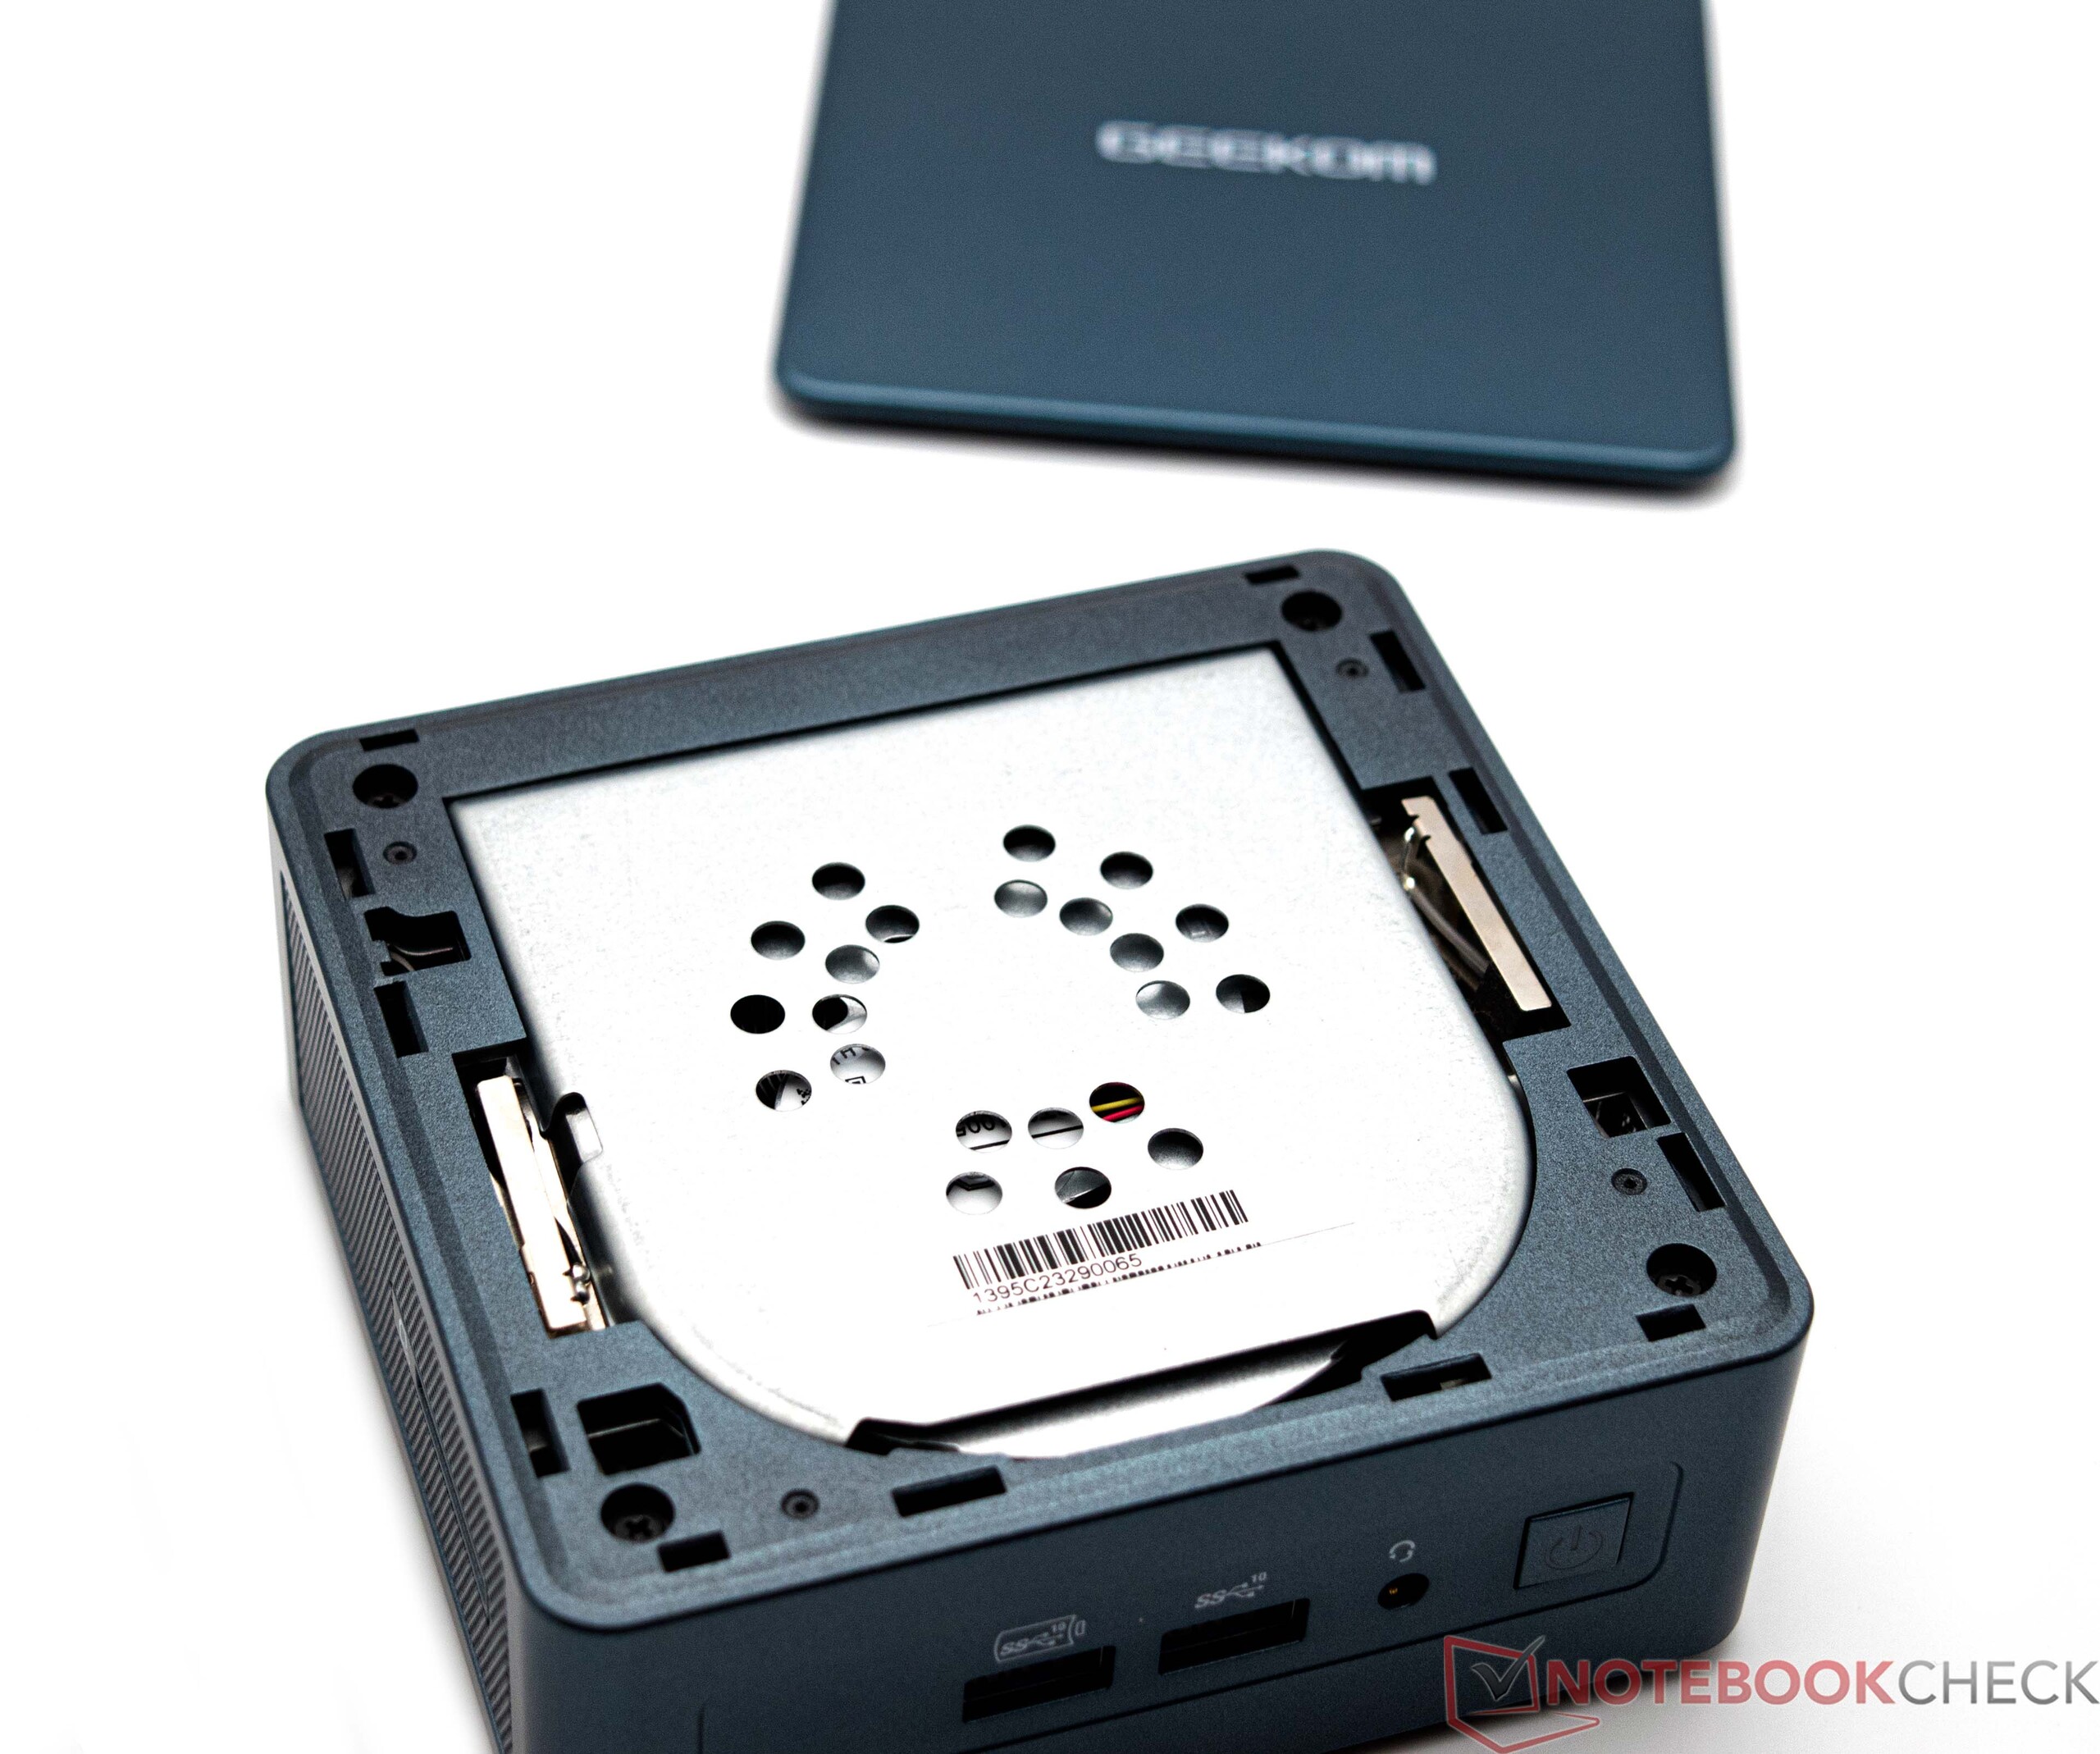
Le Geekom Mini IT12 ressemble beaucoup aux NUC d'Intel, en optant pour un design plus haut qui permet l'installation d'un support de données de 2,5 pouces. Contrairement aux précédentes variantes "petites" et "grandes" d'Intel, le Mini IT12 mesure 4,6 × 4,4 pouces, ce qui minimise l'espace sur le bureau. Le boîtier de couleur turquoise présente un aspect de haute qualité sans la vulnérabilité des surfaces en laque de piano sensibles aux rayures. Alors que Geekom maintient l'utilisation du plastique pour ses matériaux, ce qui est standard par rapport aux concurrents choisis, certains fabricants ont adopté des boîtiers entièrement en aluminium pour une sensation plus premium. Notamment, comme beaucoup d'autres mini PC, le Geekom Mini IT12 inclut un support VESA pour une fixation pratique à un moniteur.
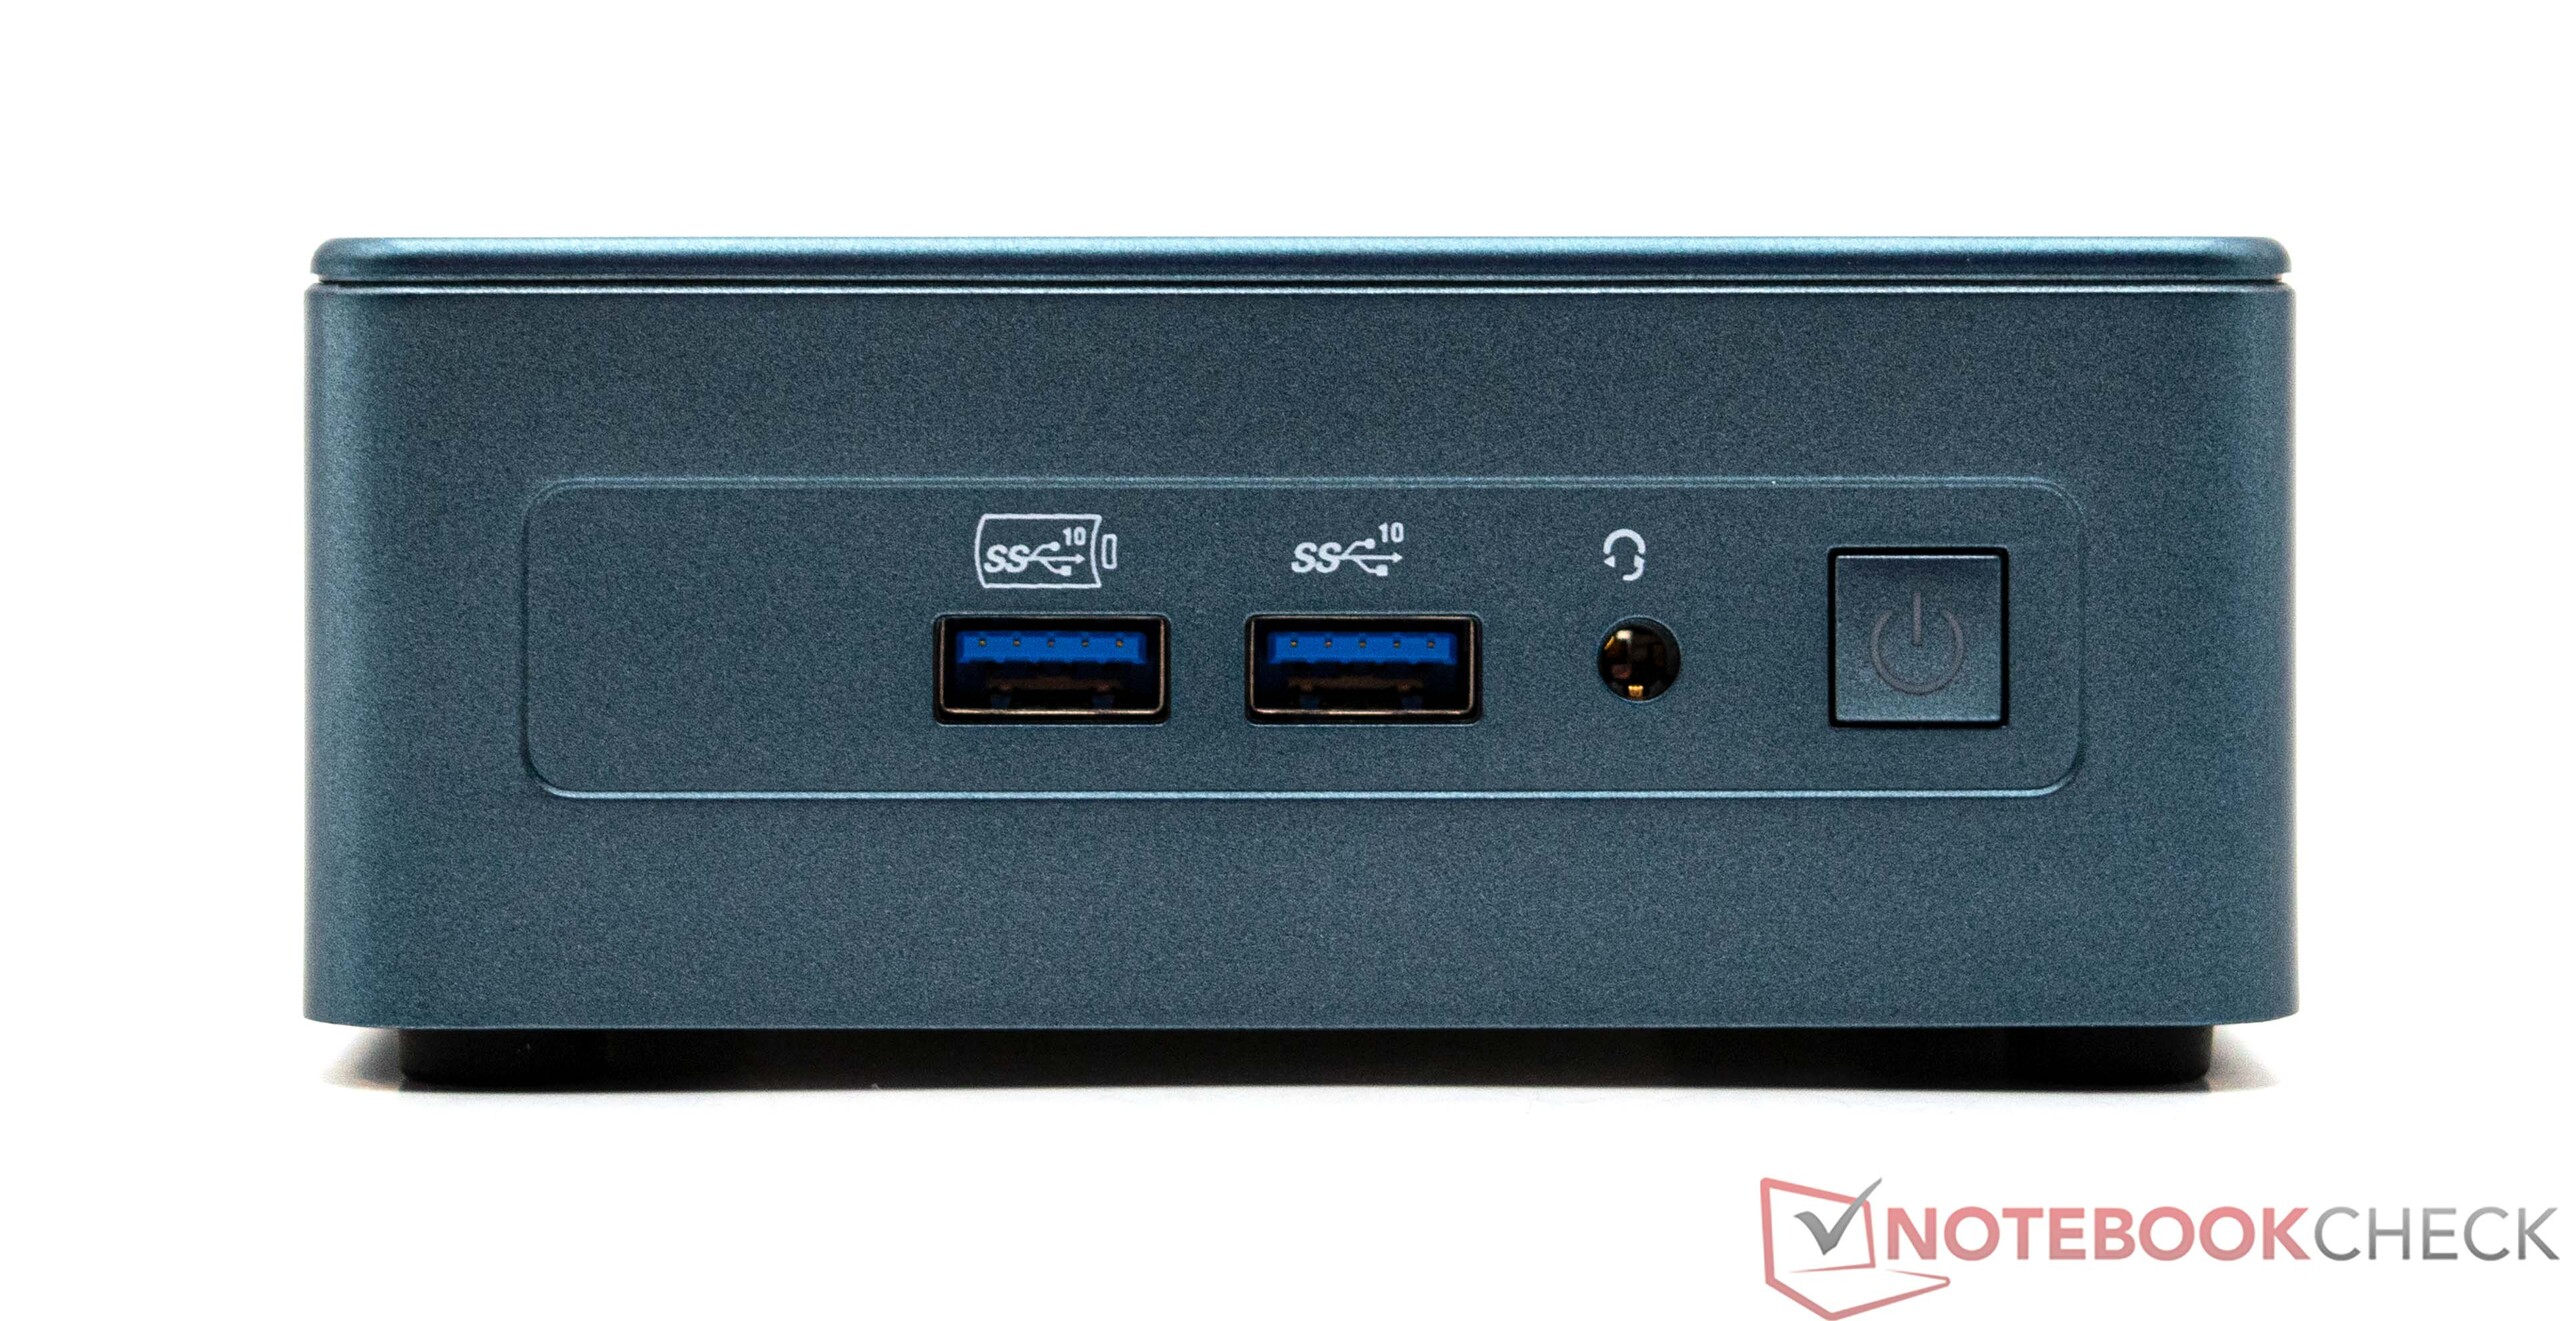
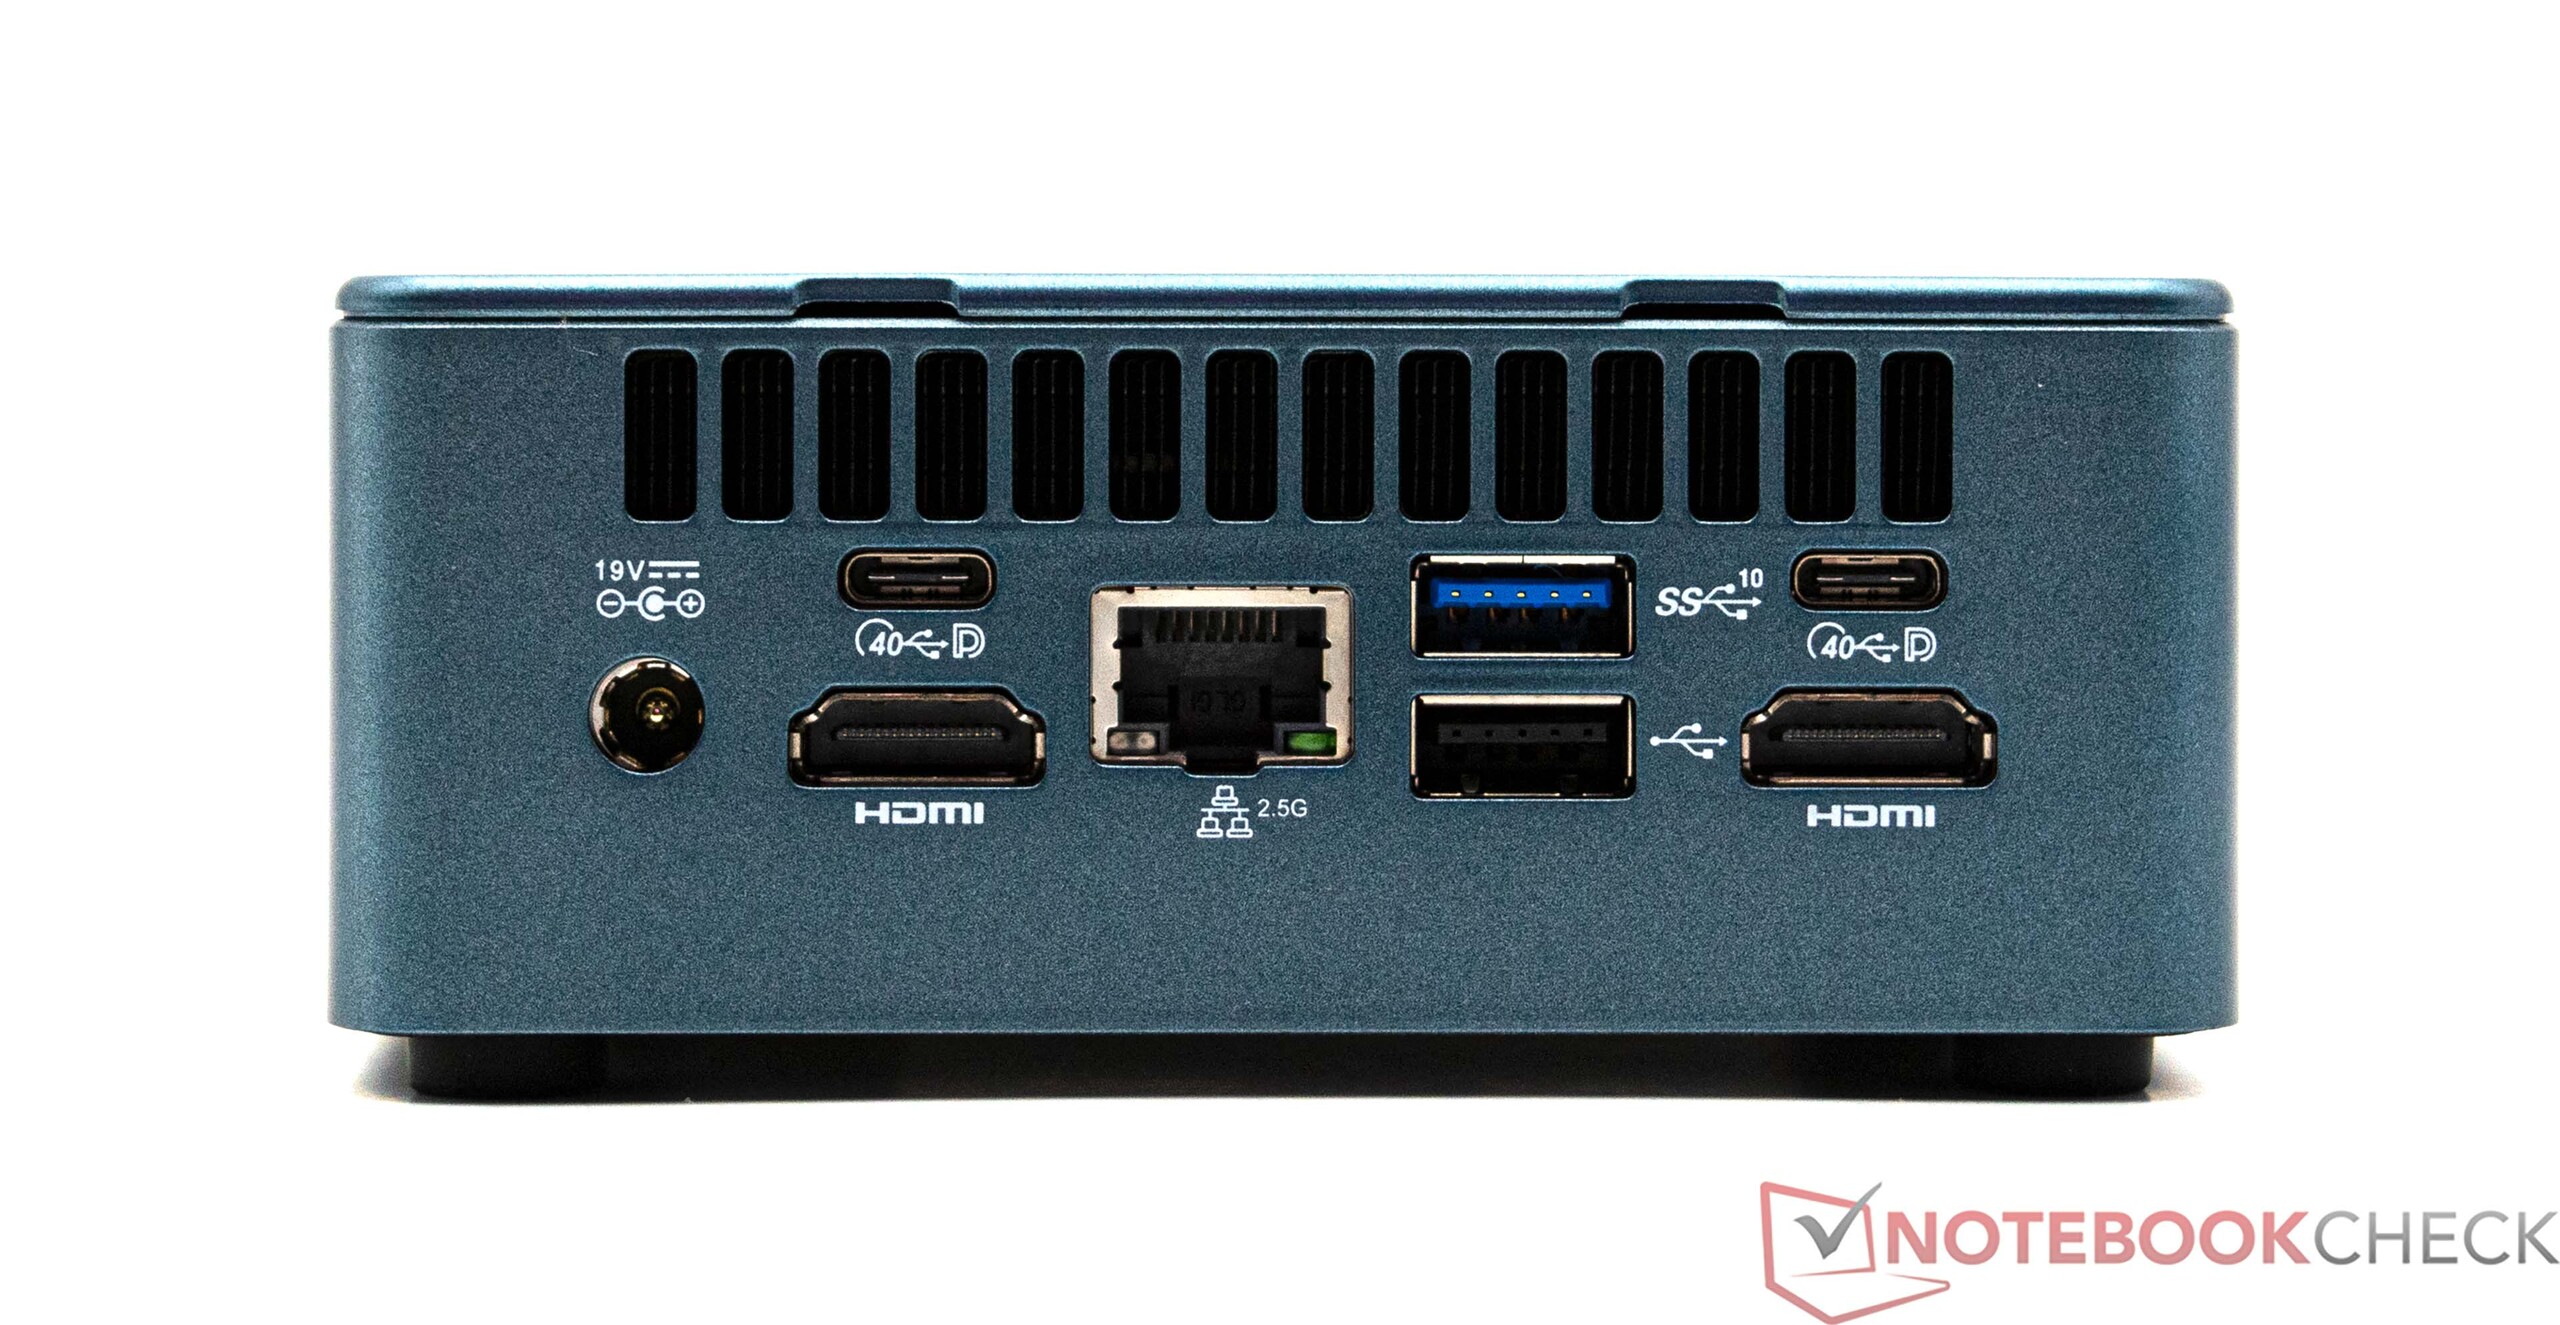
Connectivité
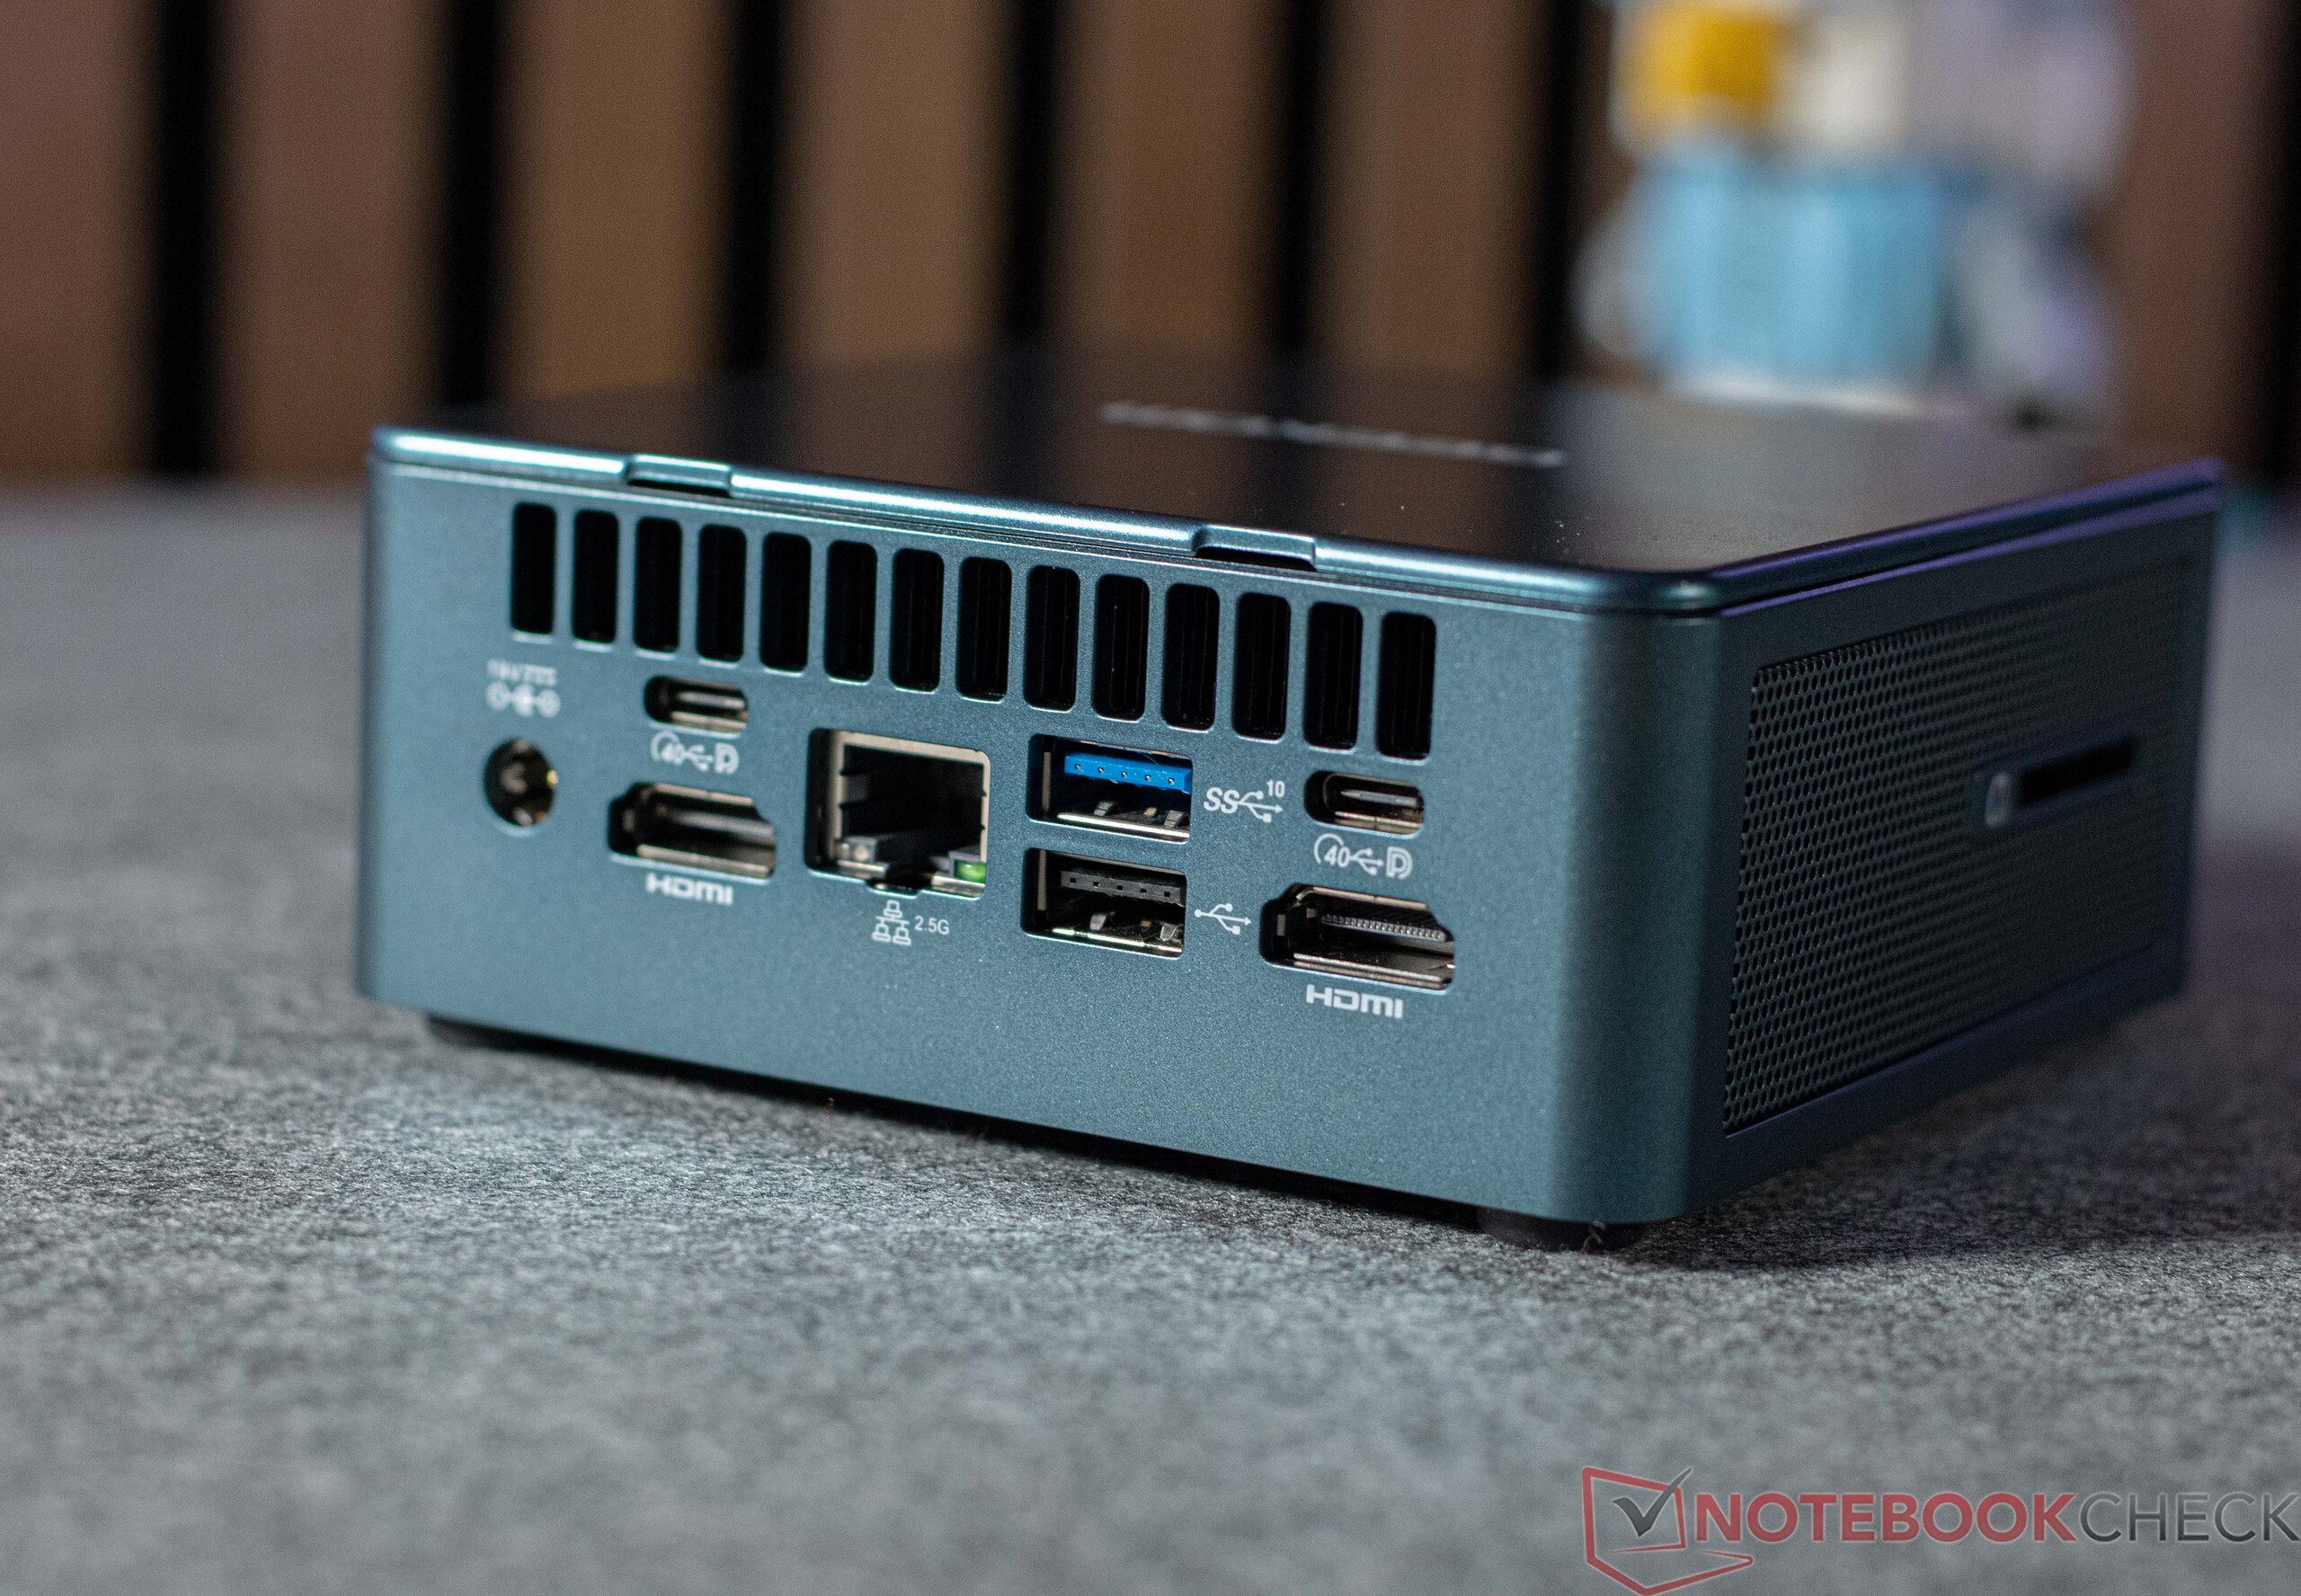
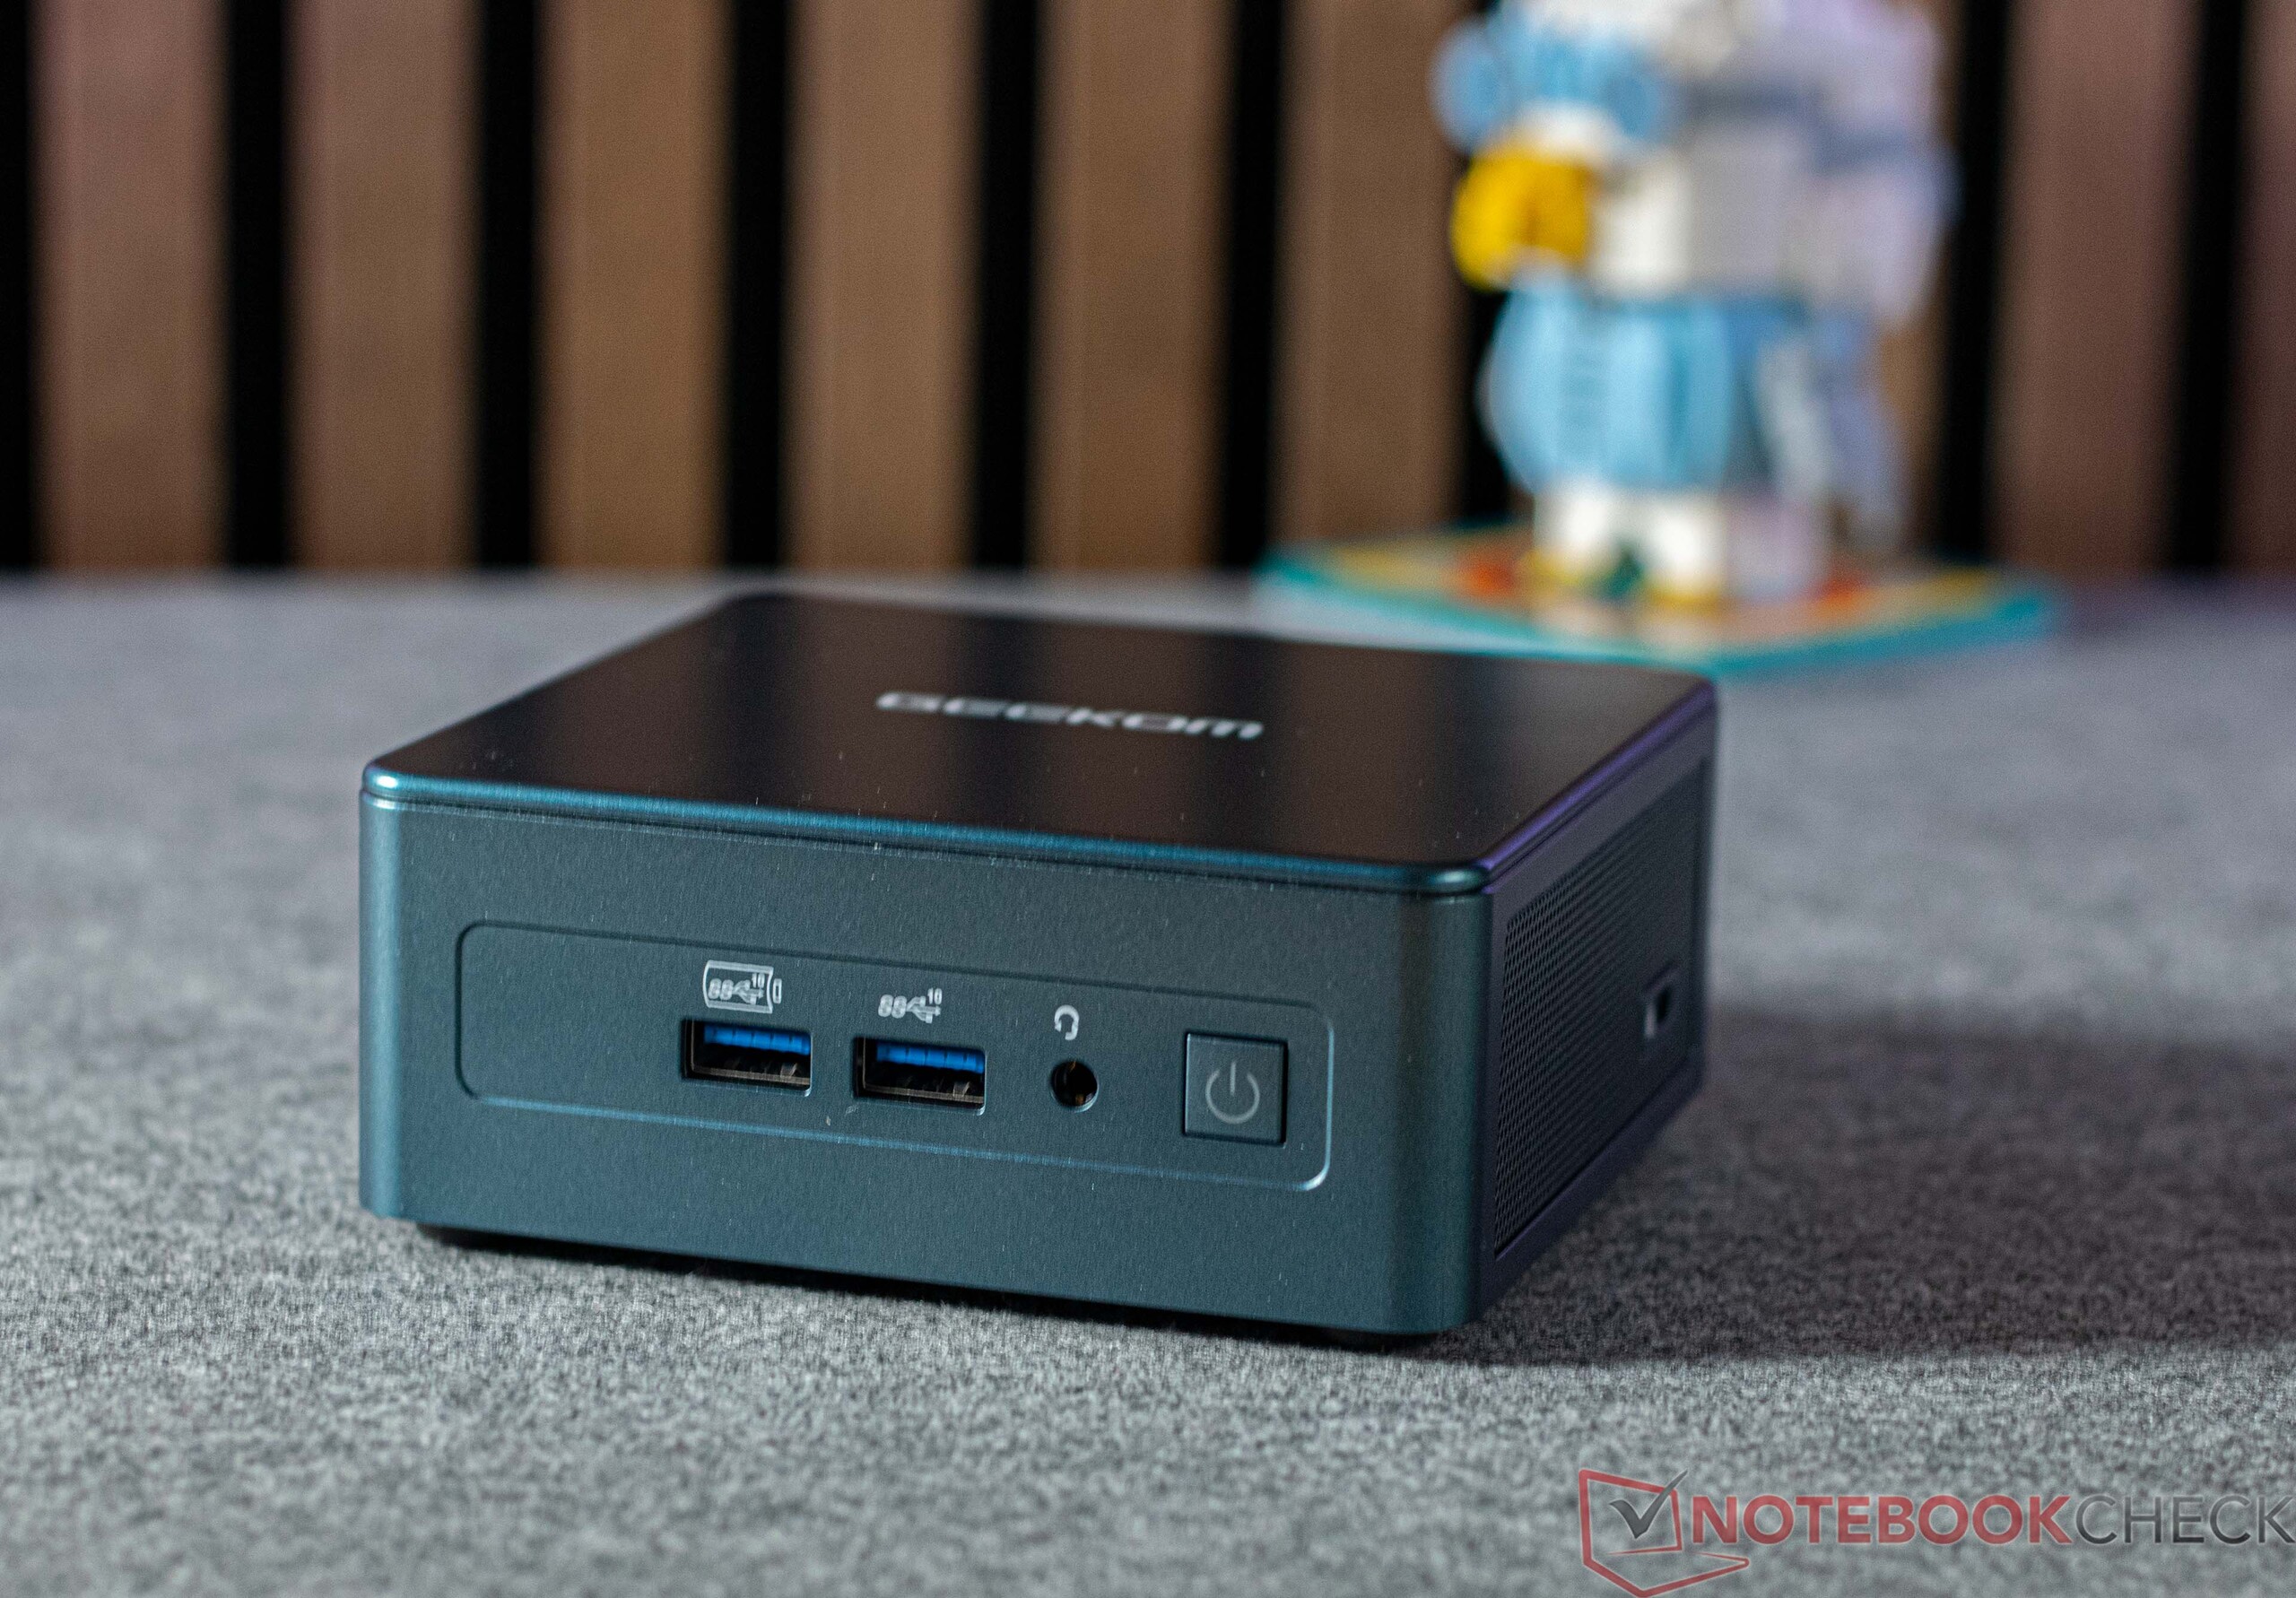
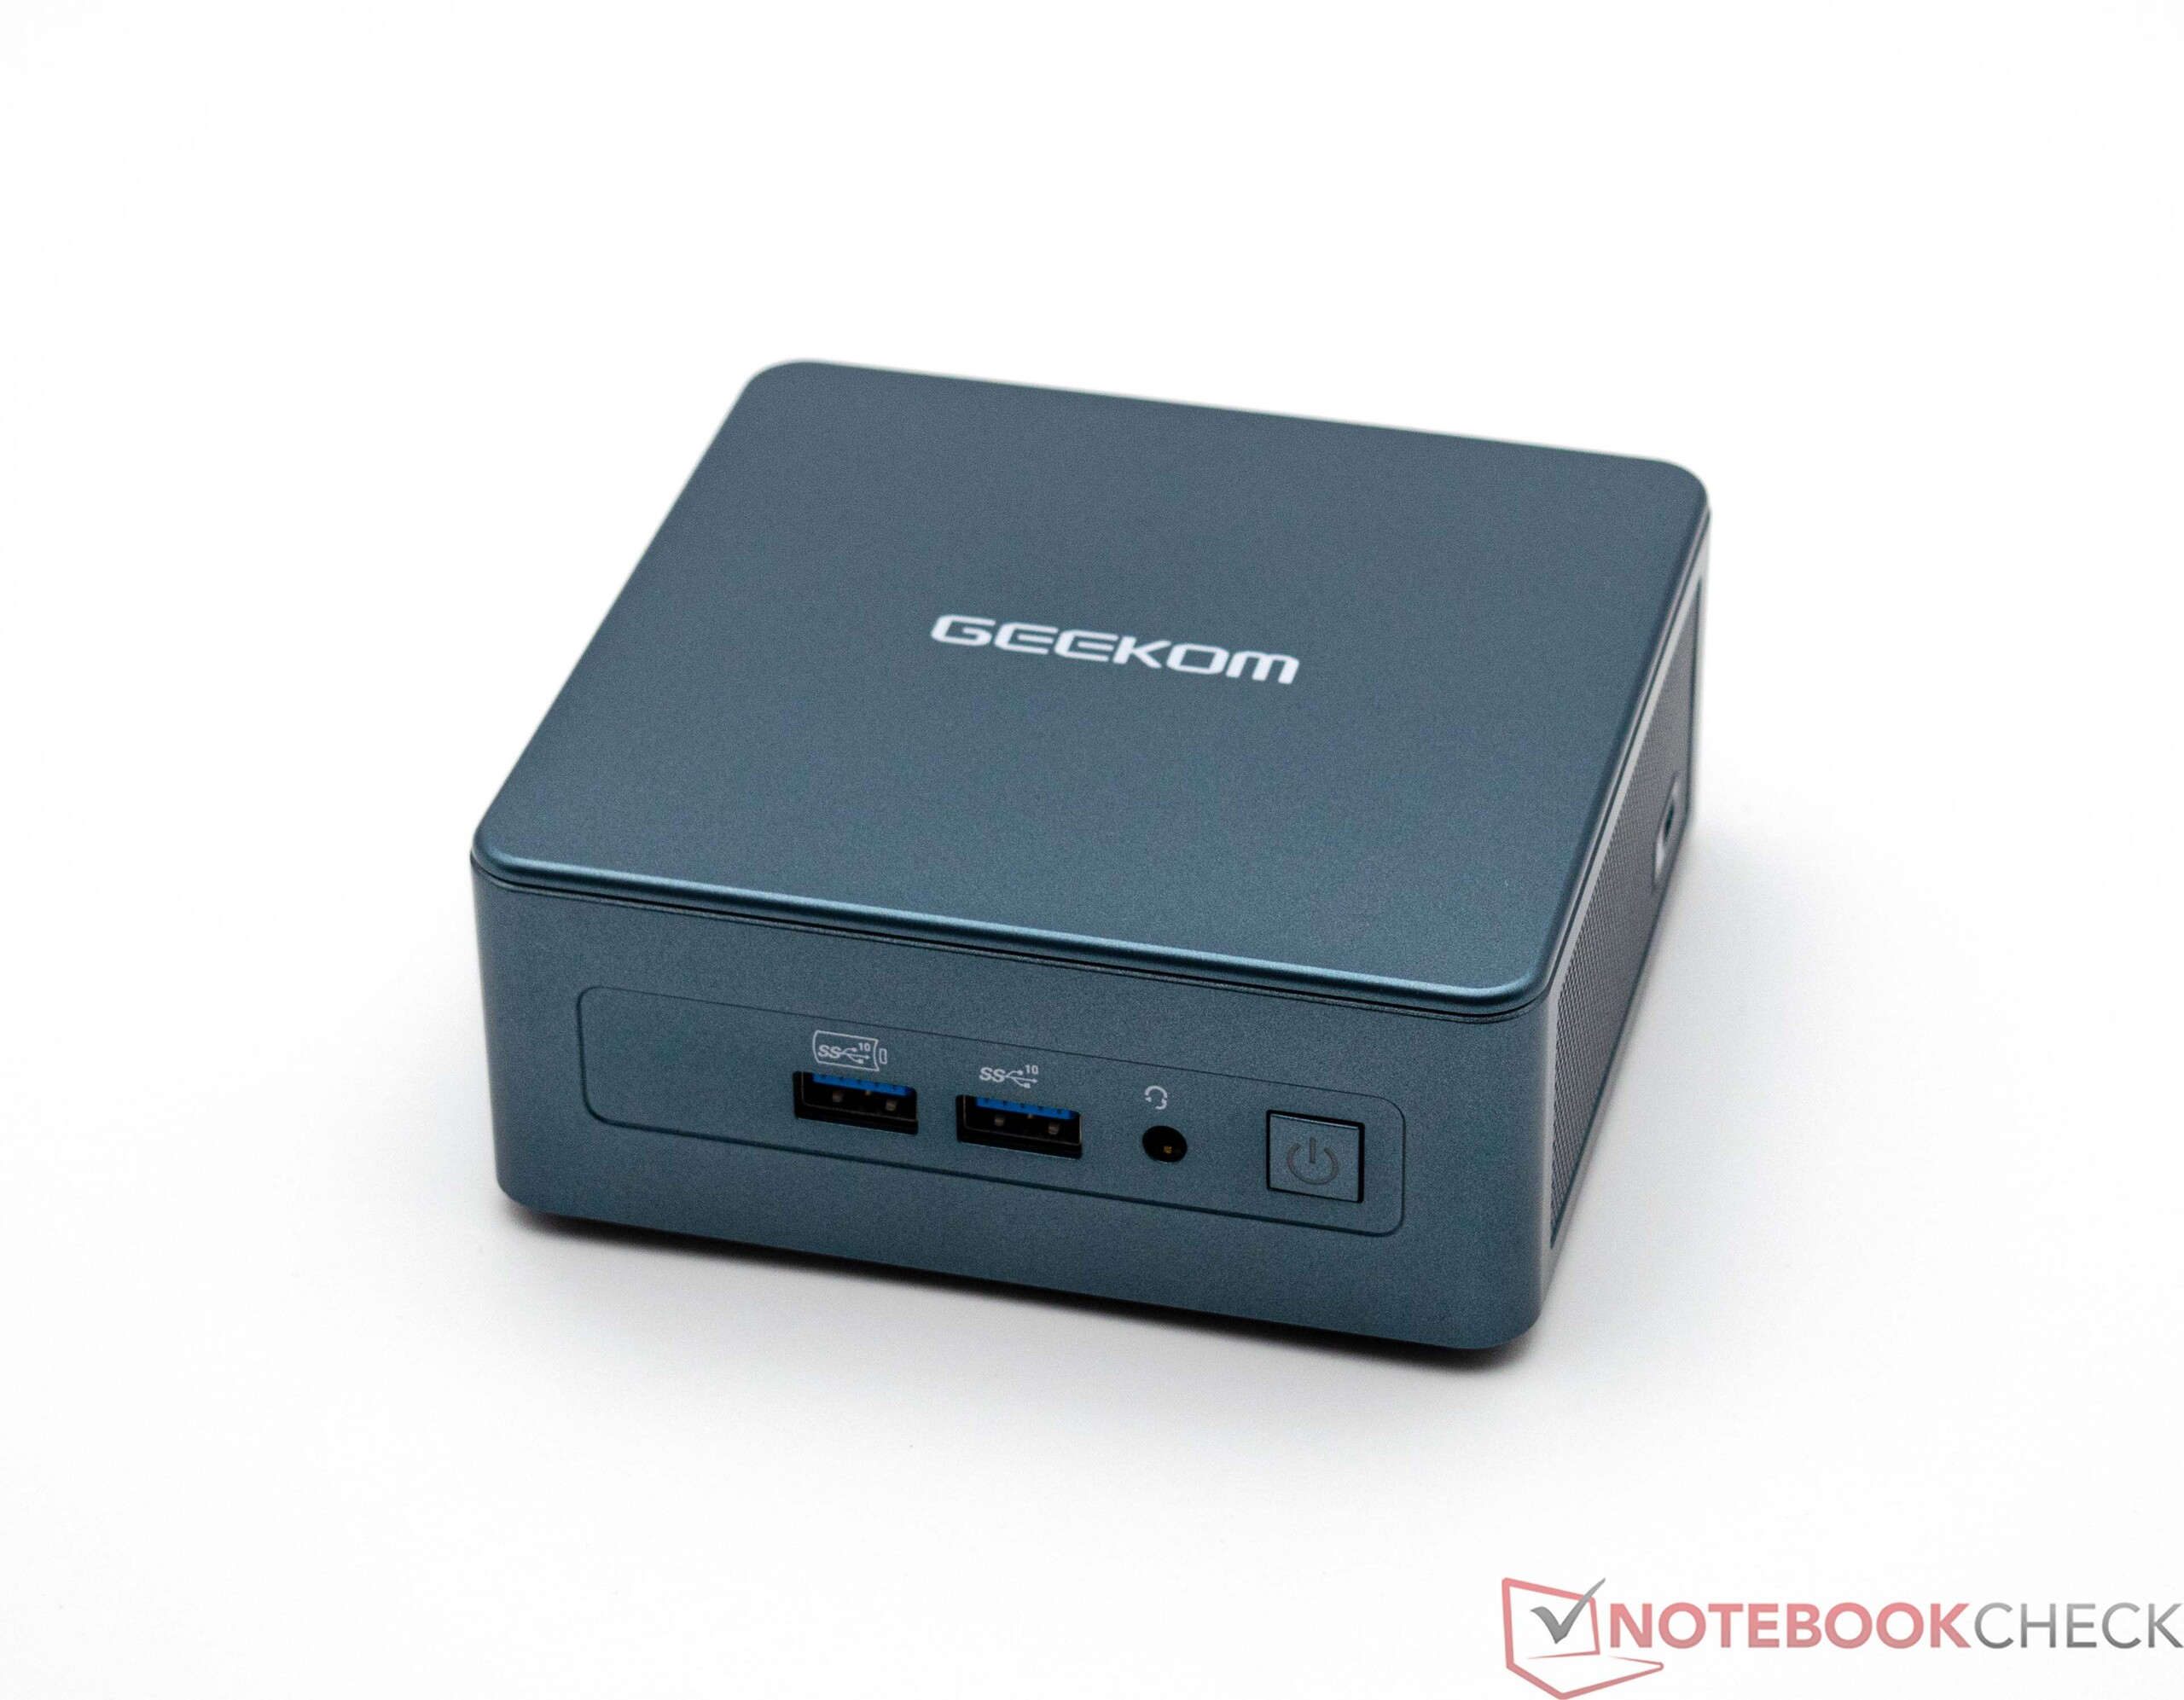
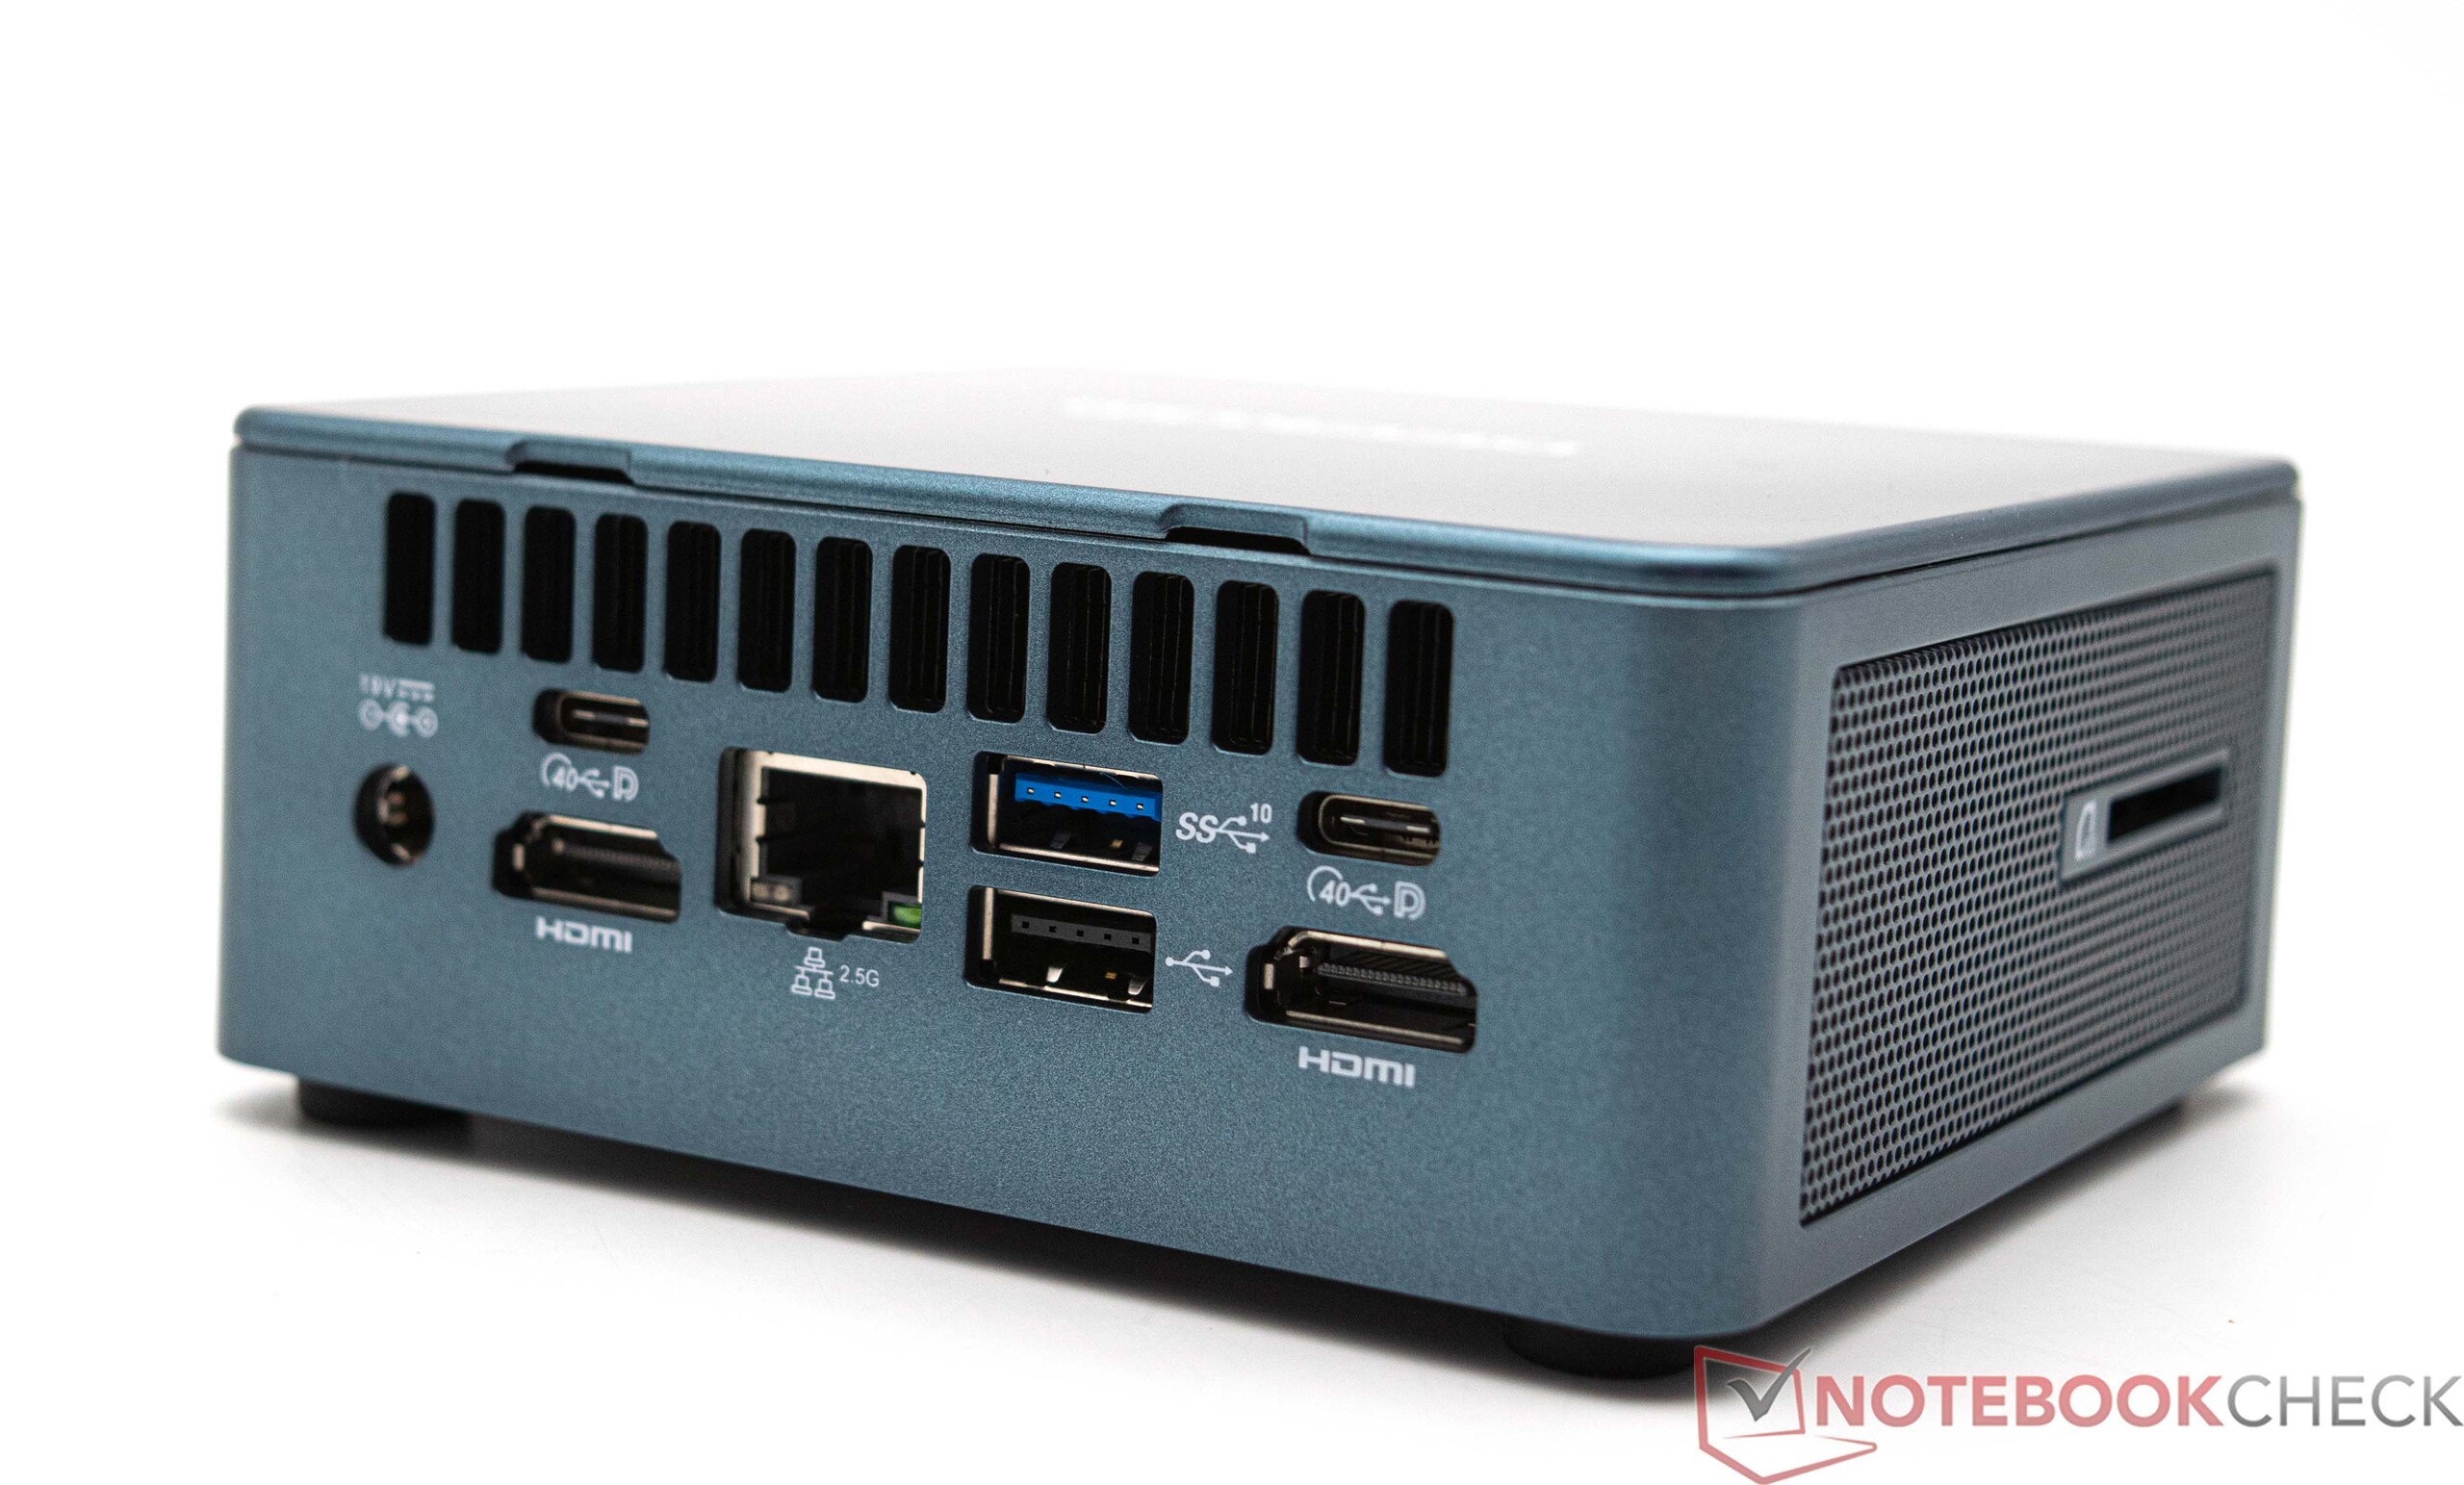
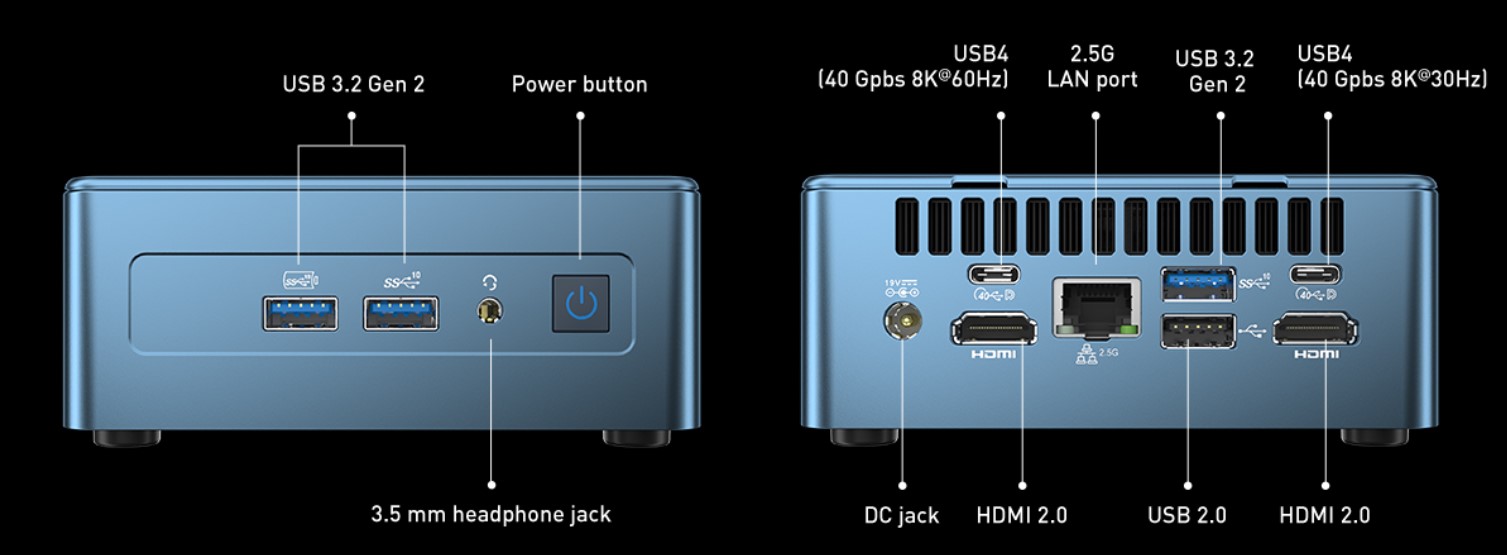
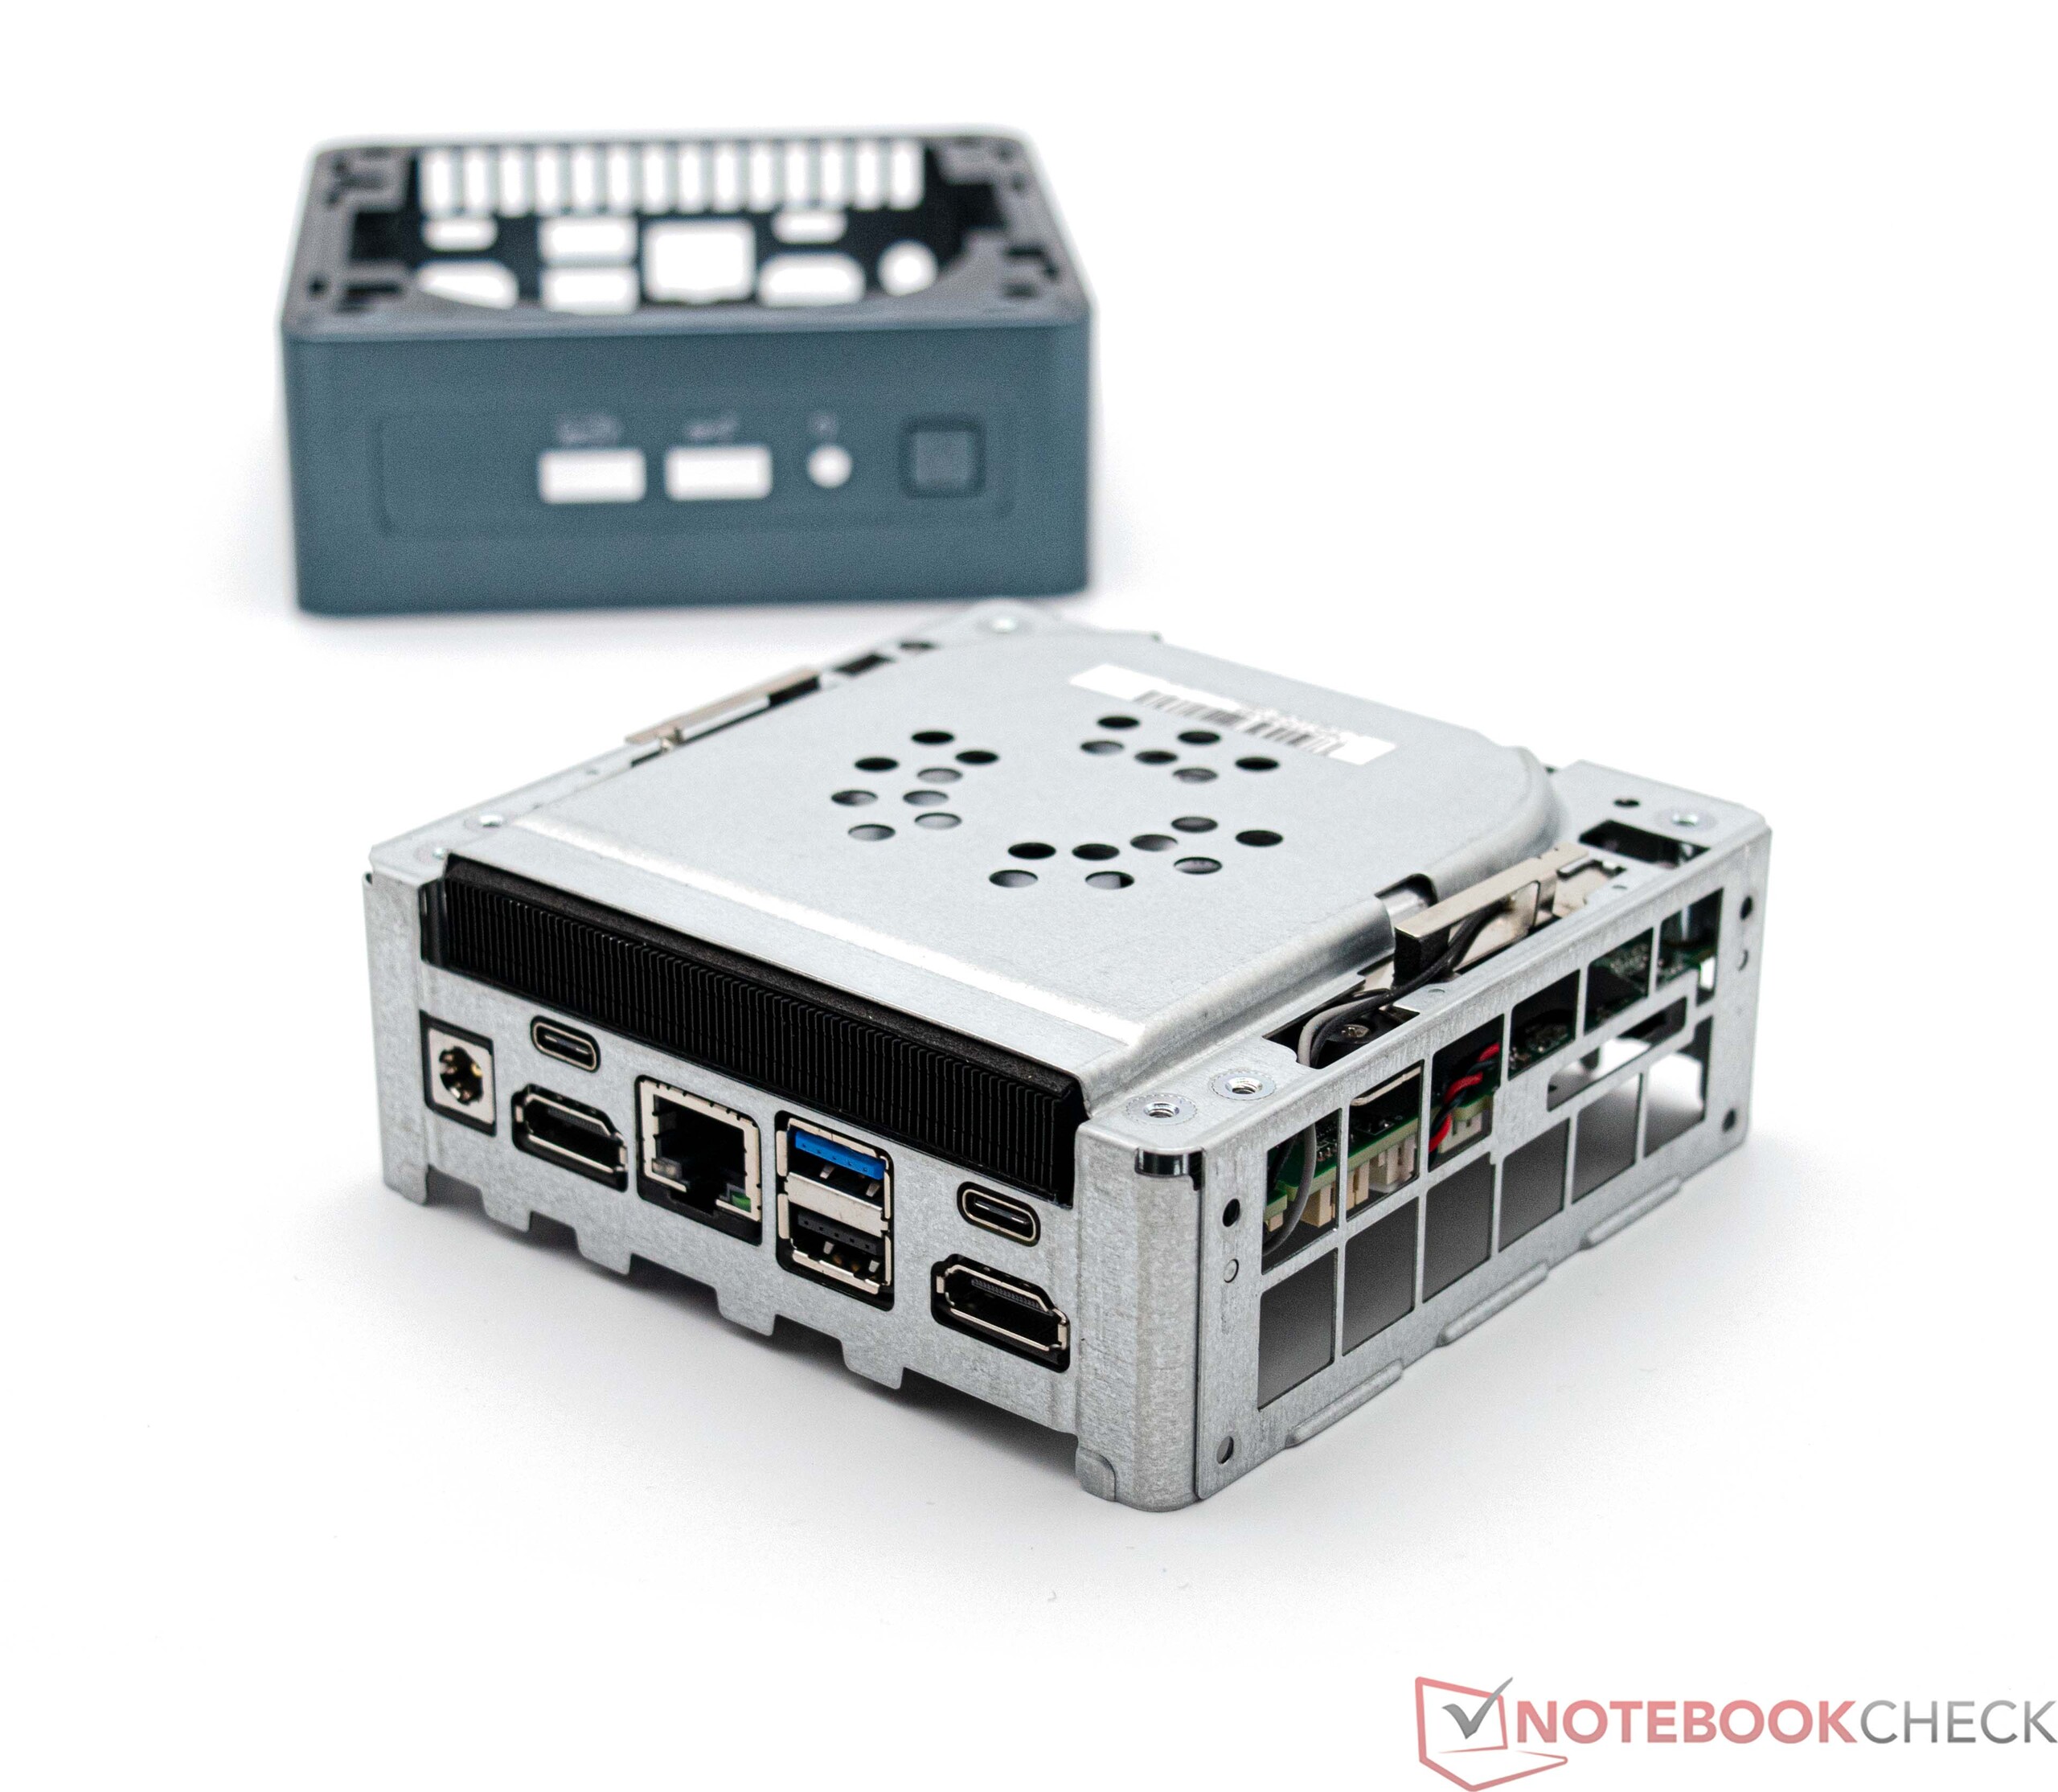
Il offre une multitude d'options de connectivité pour les appareils externes. Il permet notamment d'utiliser jusqu'à quatre écrans simultanément, une caractéristique peu courante dans de nombreux mini-PC. La répartition des quatre ports USB de type A, situés à l'avant et à l'arrière, offre un accès pratique. De plus, l'inclusion de deux ports USB 4 à l'arrière permet de connecter des cartes graphiques dédiées, élargissant ainsi les possibilités d'application du Mini IT12. La présence de l'USB 4 ouvre la voie à la compatibilité avec divers accessoires de fabricants tiers.
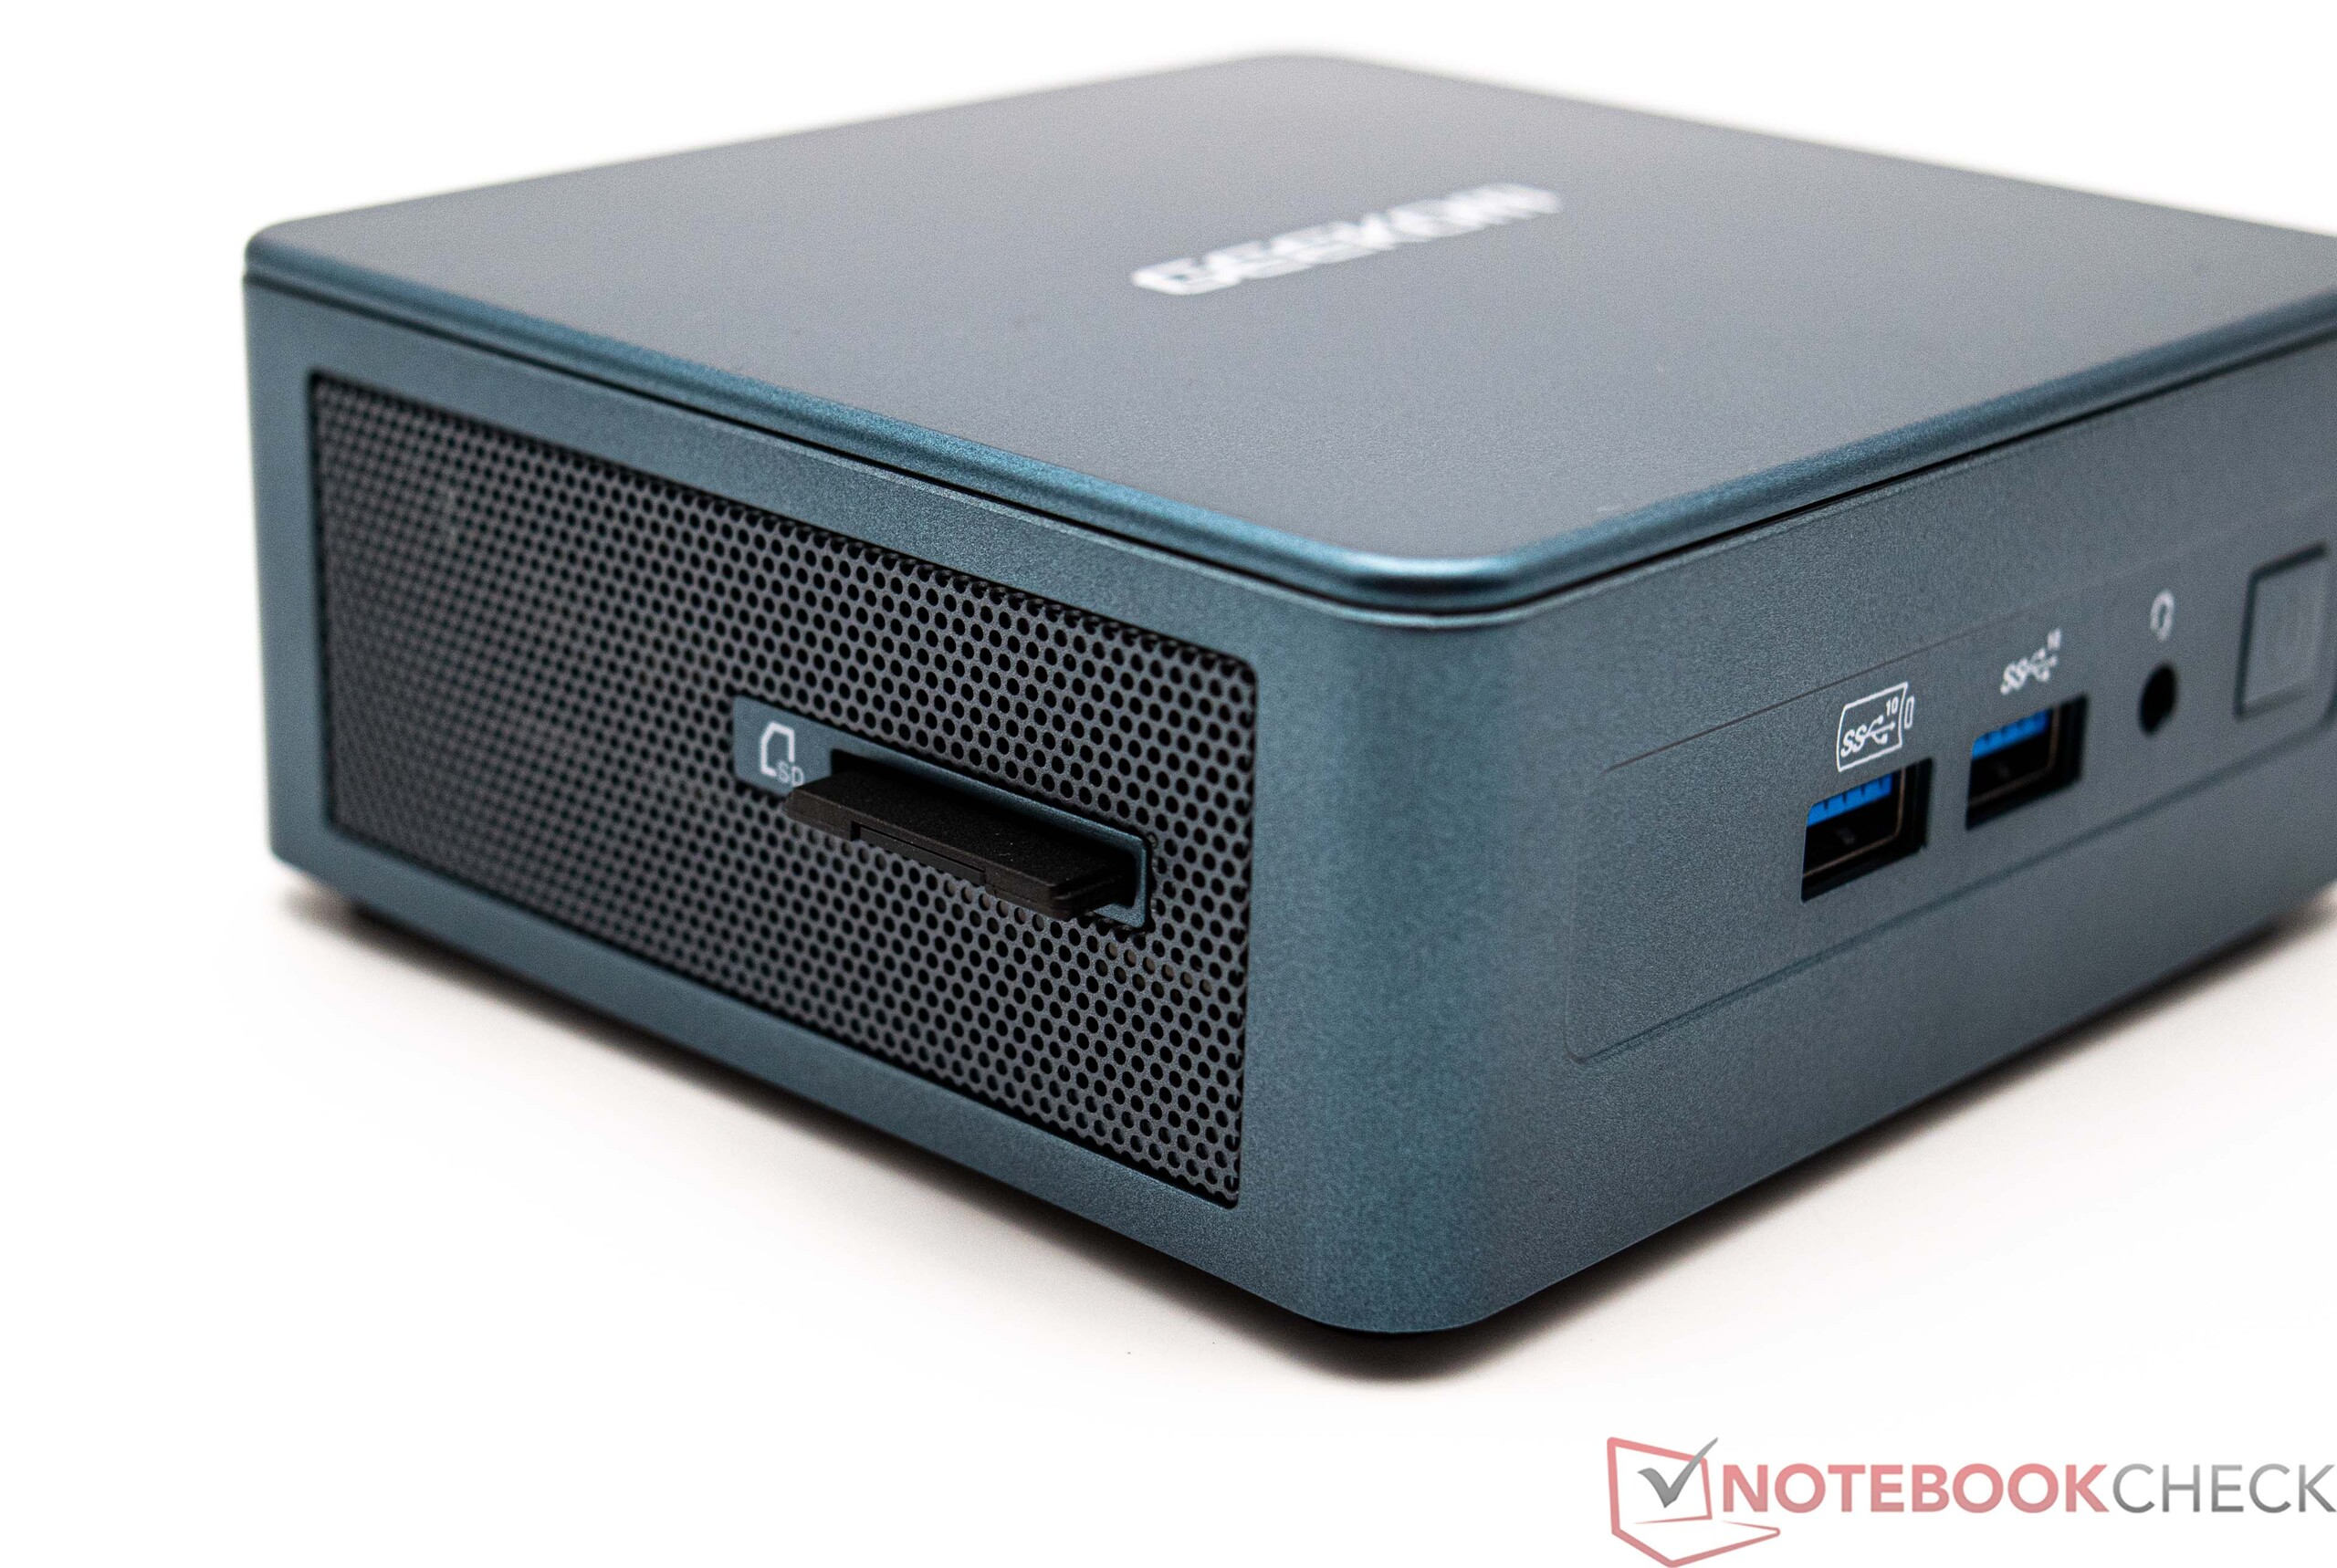
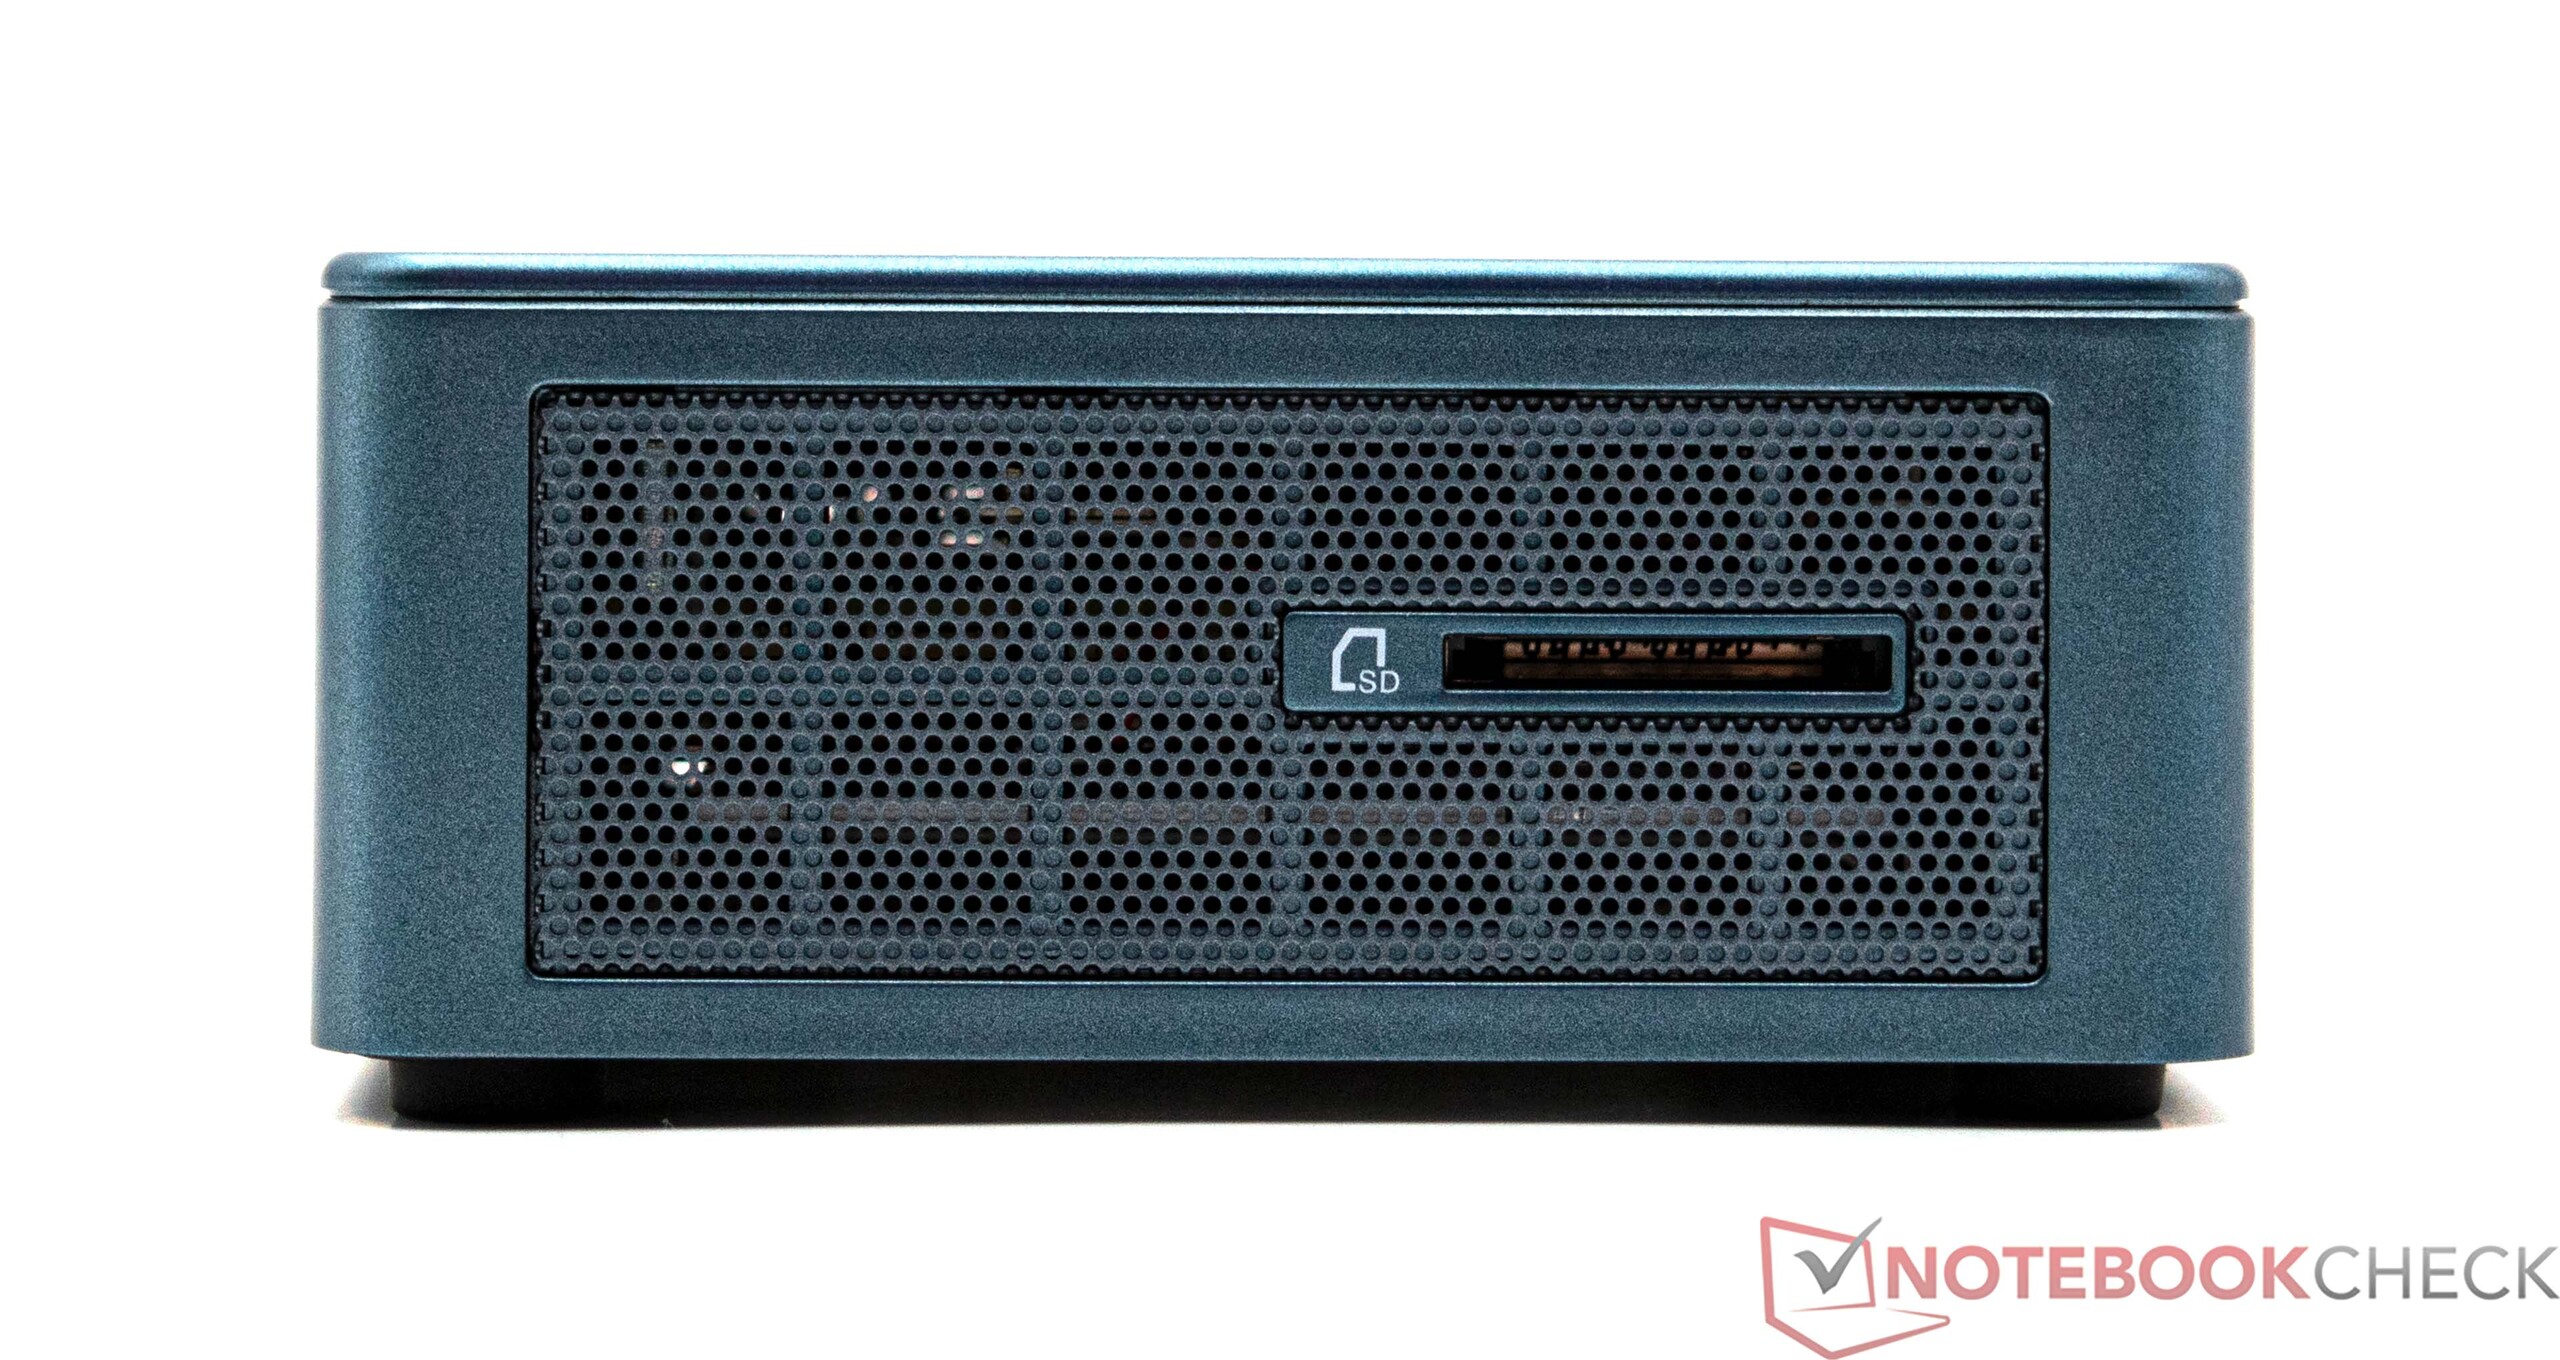
Lecteur de carte SD
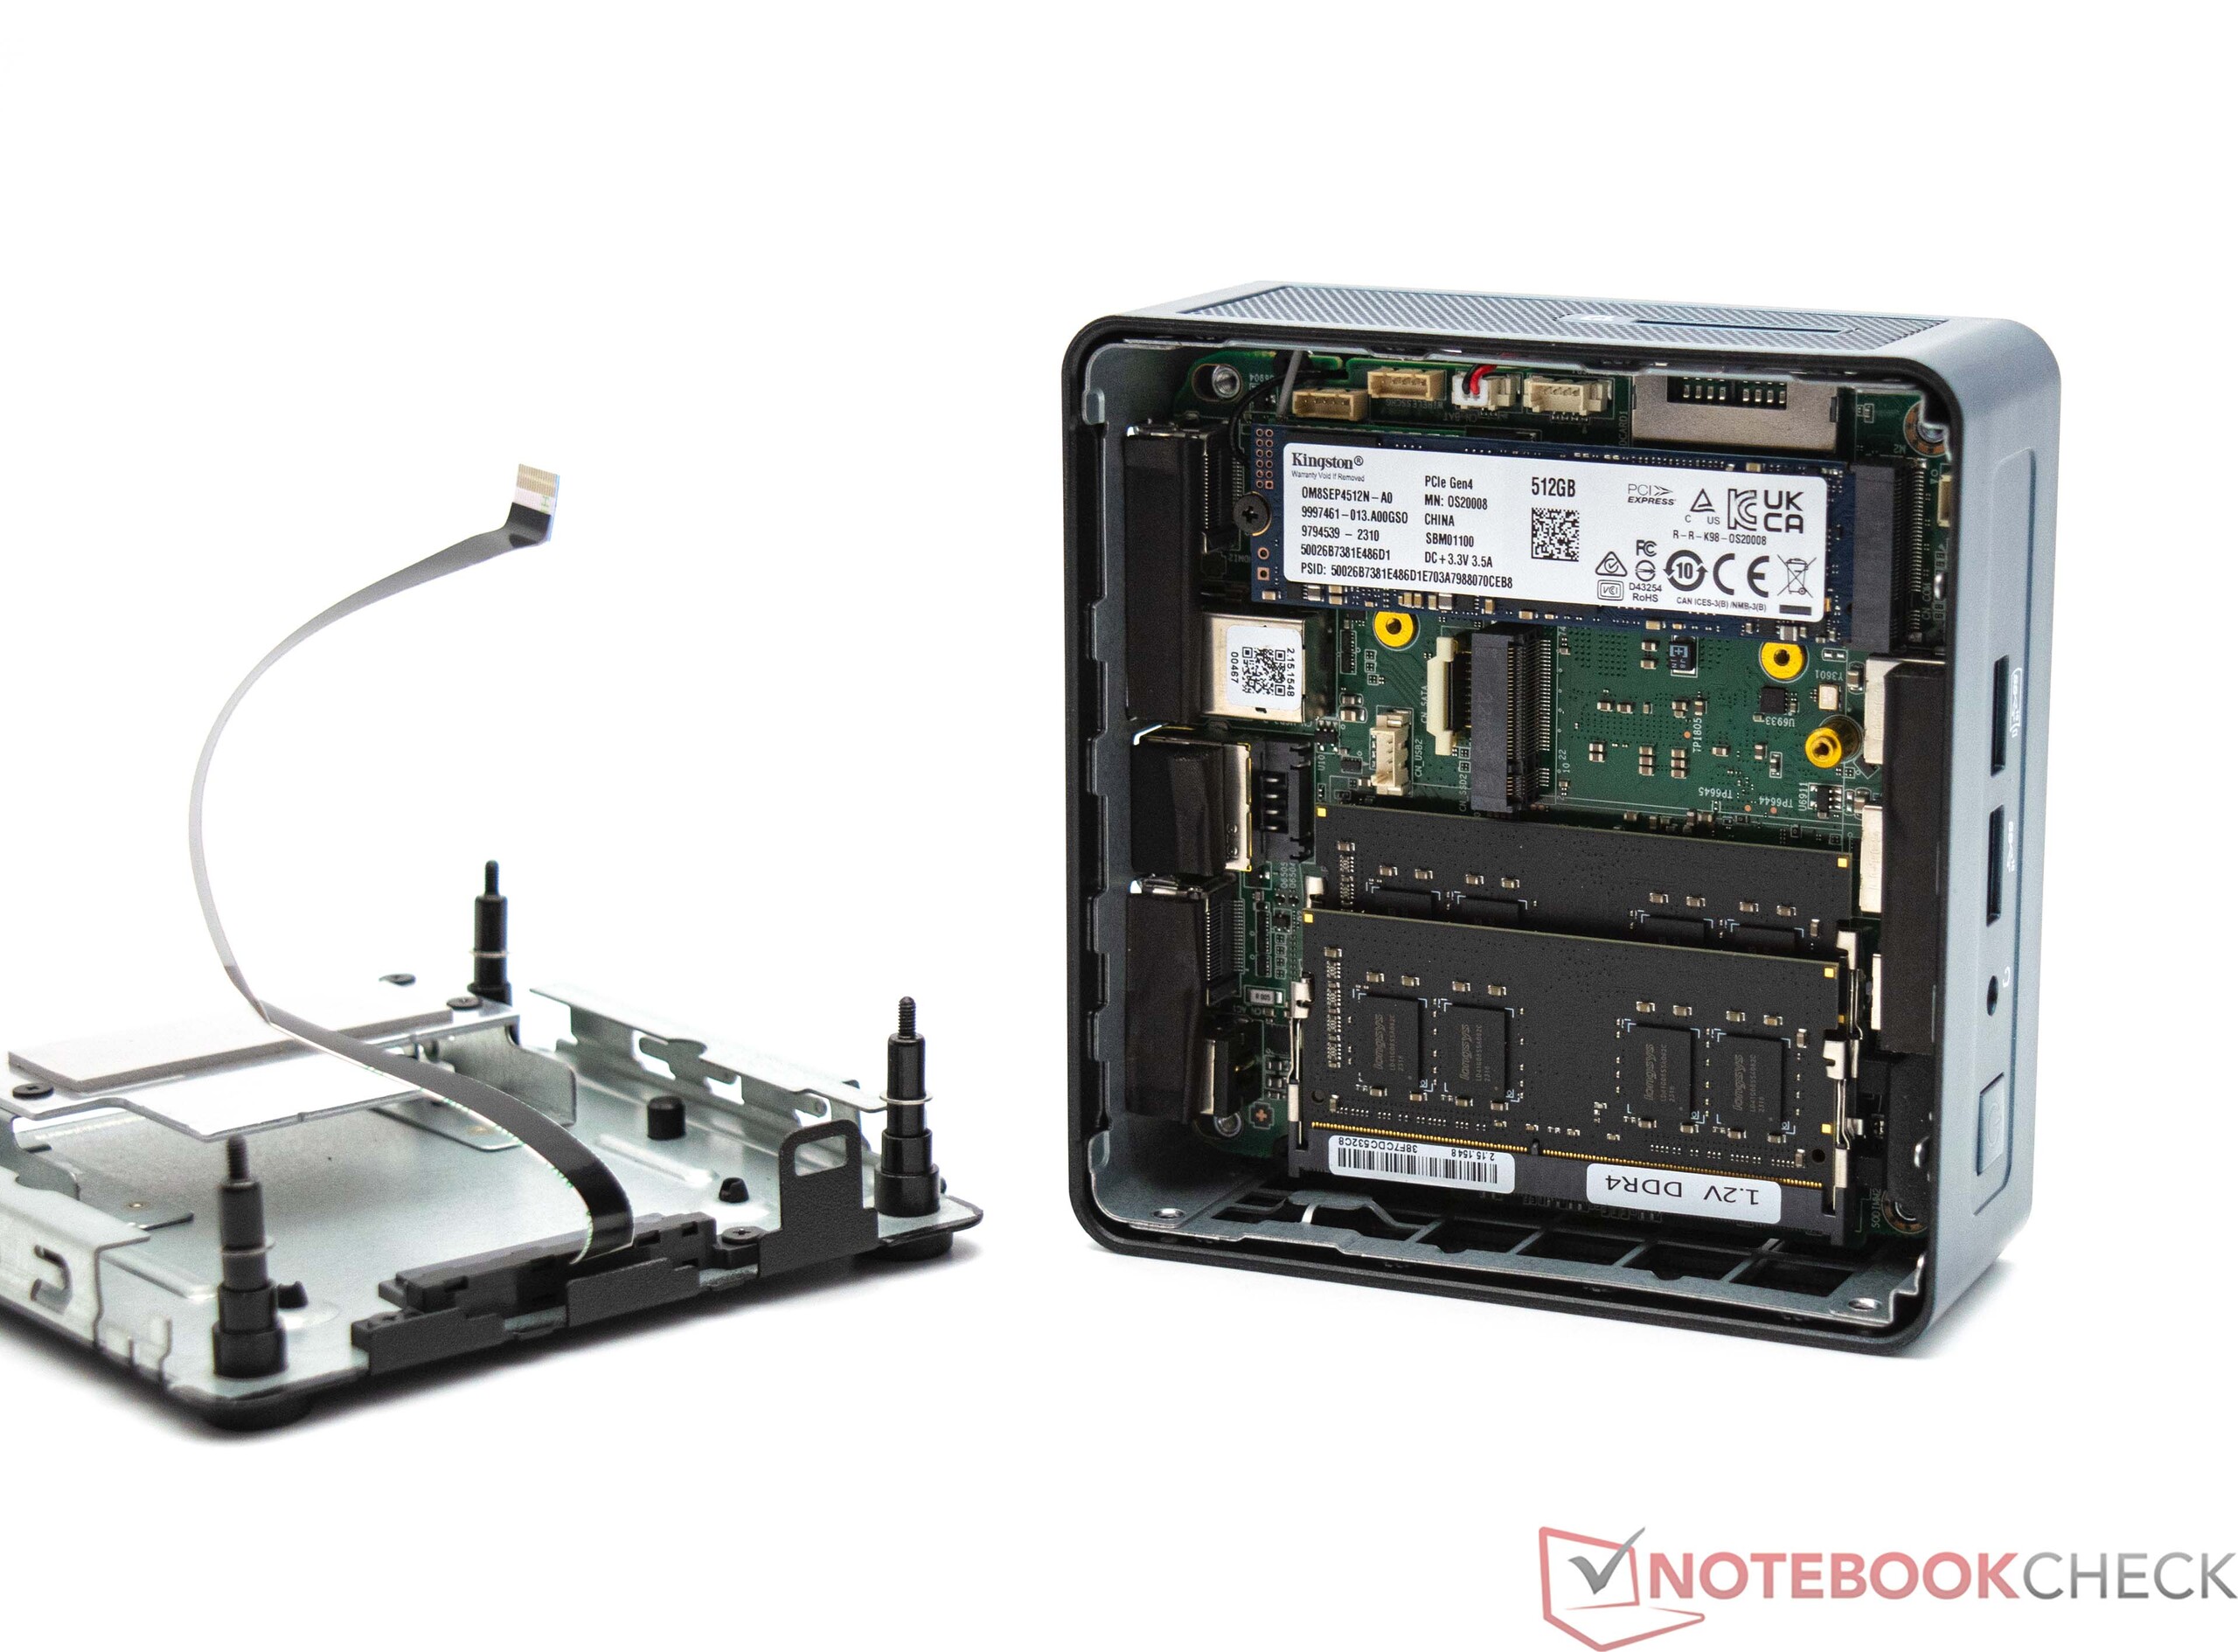
Le Geekom Mini IT12 est équipé d'un lecteur de carte SD capable d'offrir des performances impressionnantes. Associé à notre carte mémoire de référence (Angelbird SD Card AV PRO UHS-II 128GB V60), les taux de transfert dépassent largement les 100 MB/s. Il convient de noter qu'une carte mémoire prenant en charge la norme UHS-II est nécessaire pour exploiter pleinement ces performances.
| SD Card Reader | |
| average JPG Copy Test (av. of 3 runs) | |
| Intel Beast Canyon NUC (AV Pro SD microSD 128 GB V60) | |
| Intel Dragon Canyon NUC | |
| Geekom Mini IT12 (AV Pro SD microSD 128 GB V60) | |
| Geekom Mini IT12 (AV Pro SD microSD 128 GB V60) | |
| Moyenne de la classe Mini PC (17.3 - 214, n=21, 2 dernières années) | |
| Zotac ZBOX Magnus EN173070C (AV Pro SD microSD 128 GB V60) | |
| Geekom MiniAir 11 Special Edition (AV Pro SD microSD 128 GB V60) | |
| maximum AS SSD Seq Read Test (1GB) | |
| Intel Beast Canyon NUC (AV Pro SD microSD 128 GB V60) | |
| Intel Dragon Canyon NUC | |
| Geekom Mini IT12 (AV Pro SD microSD 128 GB V60) | |
| Geekom Mini IT12 (AV Pro SD microSD 128 GB V60) | |
| Moyenne de la classe Mini PC (17.9 - 250, n=21, 2 dernières années) | |
| Zotac ZBOX Magnus EN173070C (AV Pro SD microSD 128 GB V60) | |
| Geekom MiniAir 11 Special Edition (AV Pro SD microSD 128 GB V60) | |
Communication
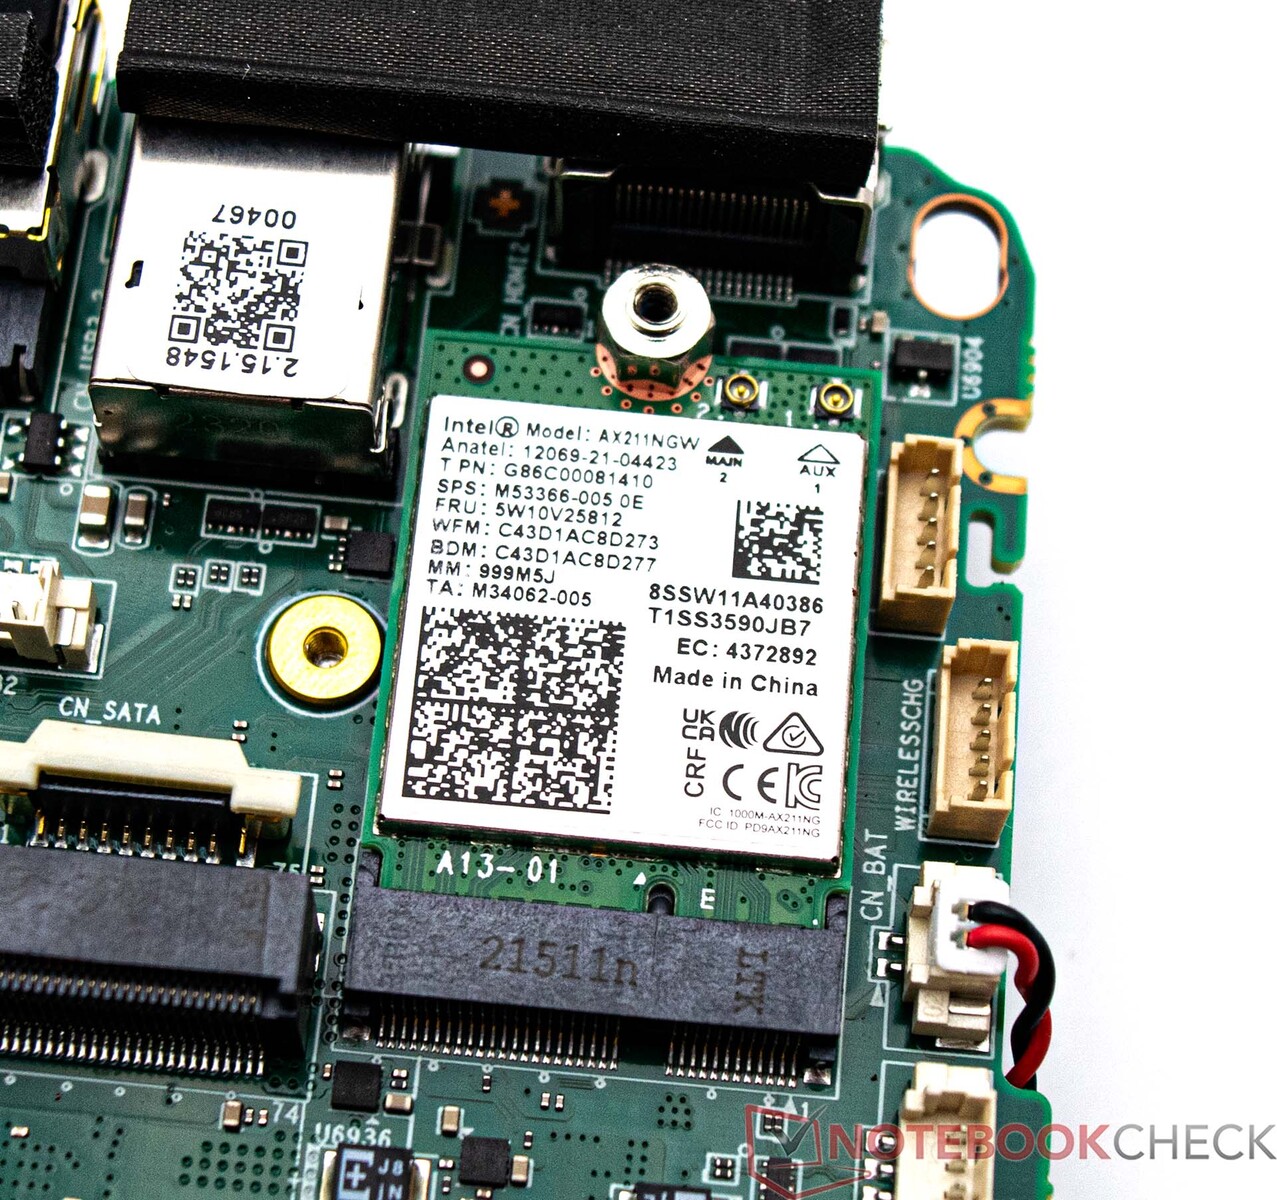
Geekom a intégré un module Wi-Fi moderne 6E-AX211 d'Intel dans le Mini IT12. Les résultats des tests indiquent que les performances ne répondent pas aux normes attendues. Dans les bandes de 5 GHz et de 6 GHz, les taux de transmission et de réception de données mesurés sont inférieurs à ceux obtenus par les concurrents avec le même module WLAN. Il est important de noter que nos tests ont utilisé le routeur Asus ROG Rapture GT-AXE11000.
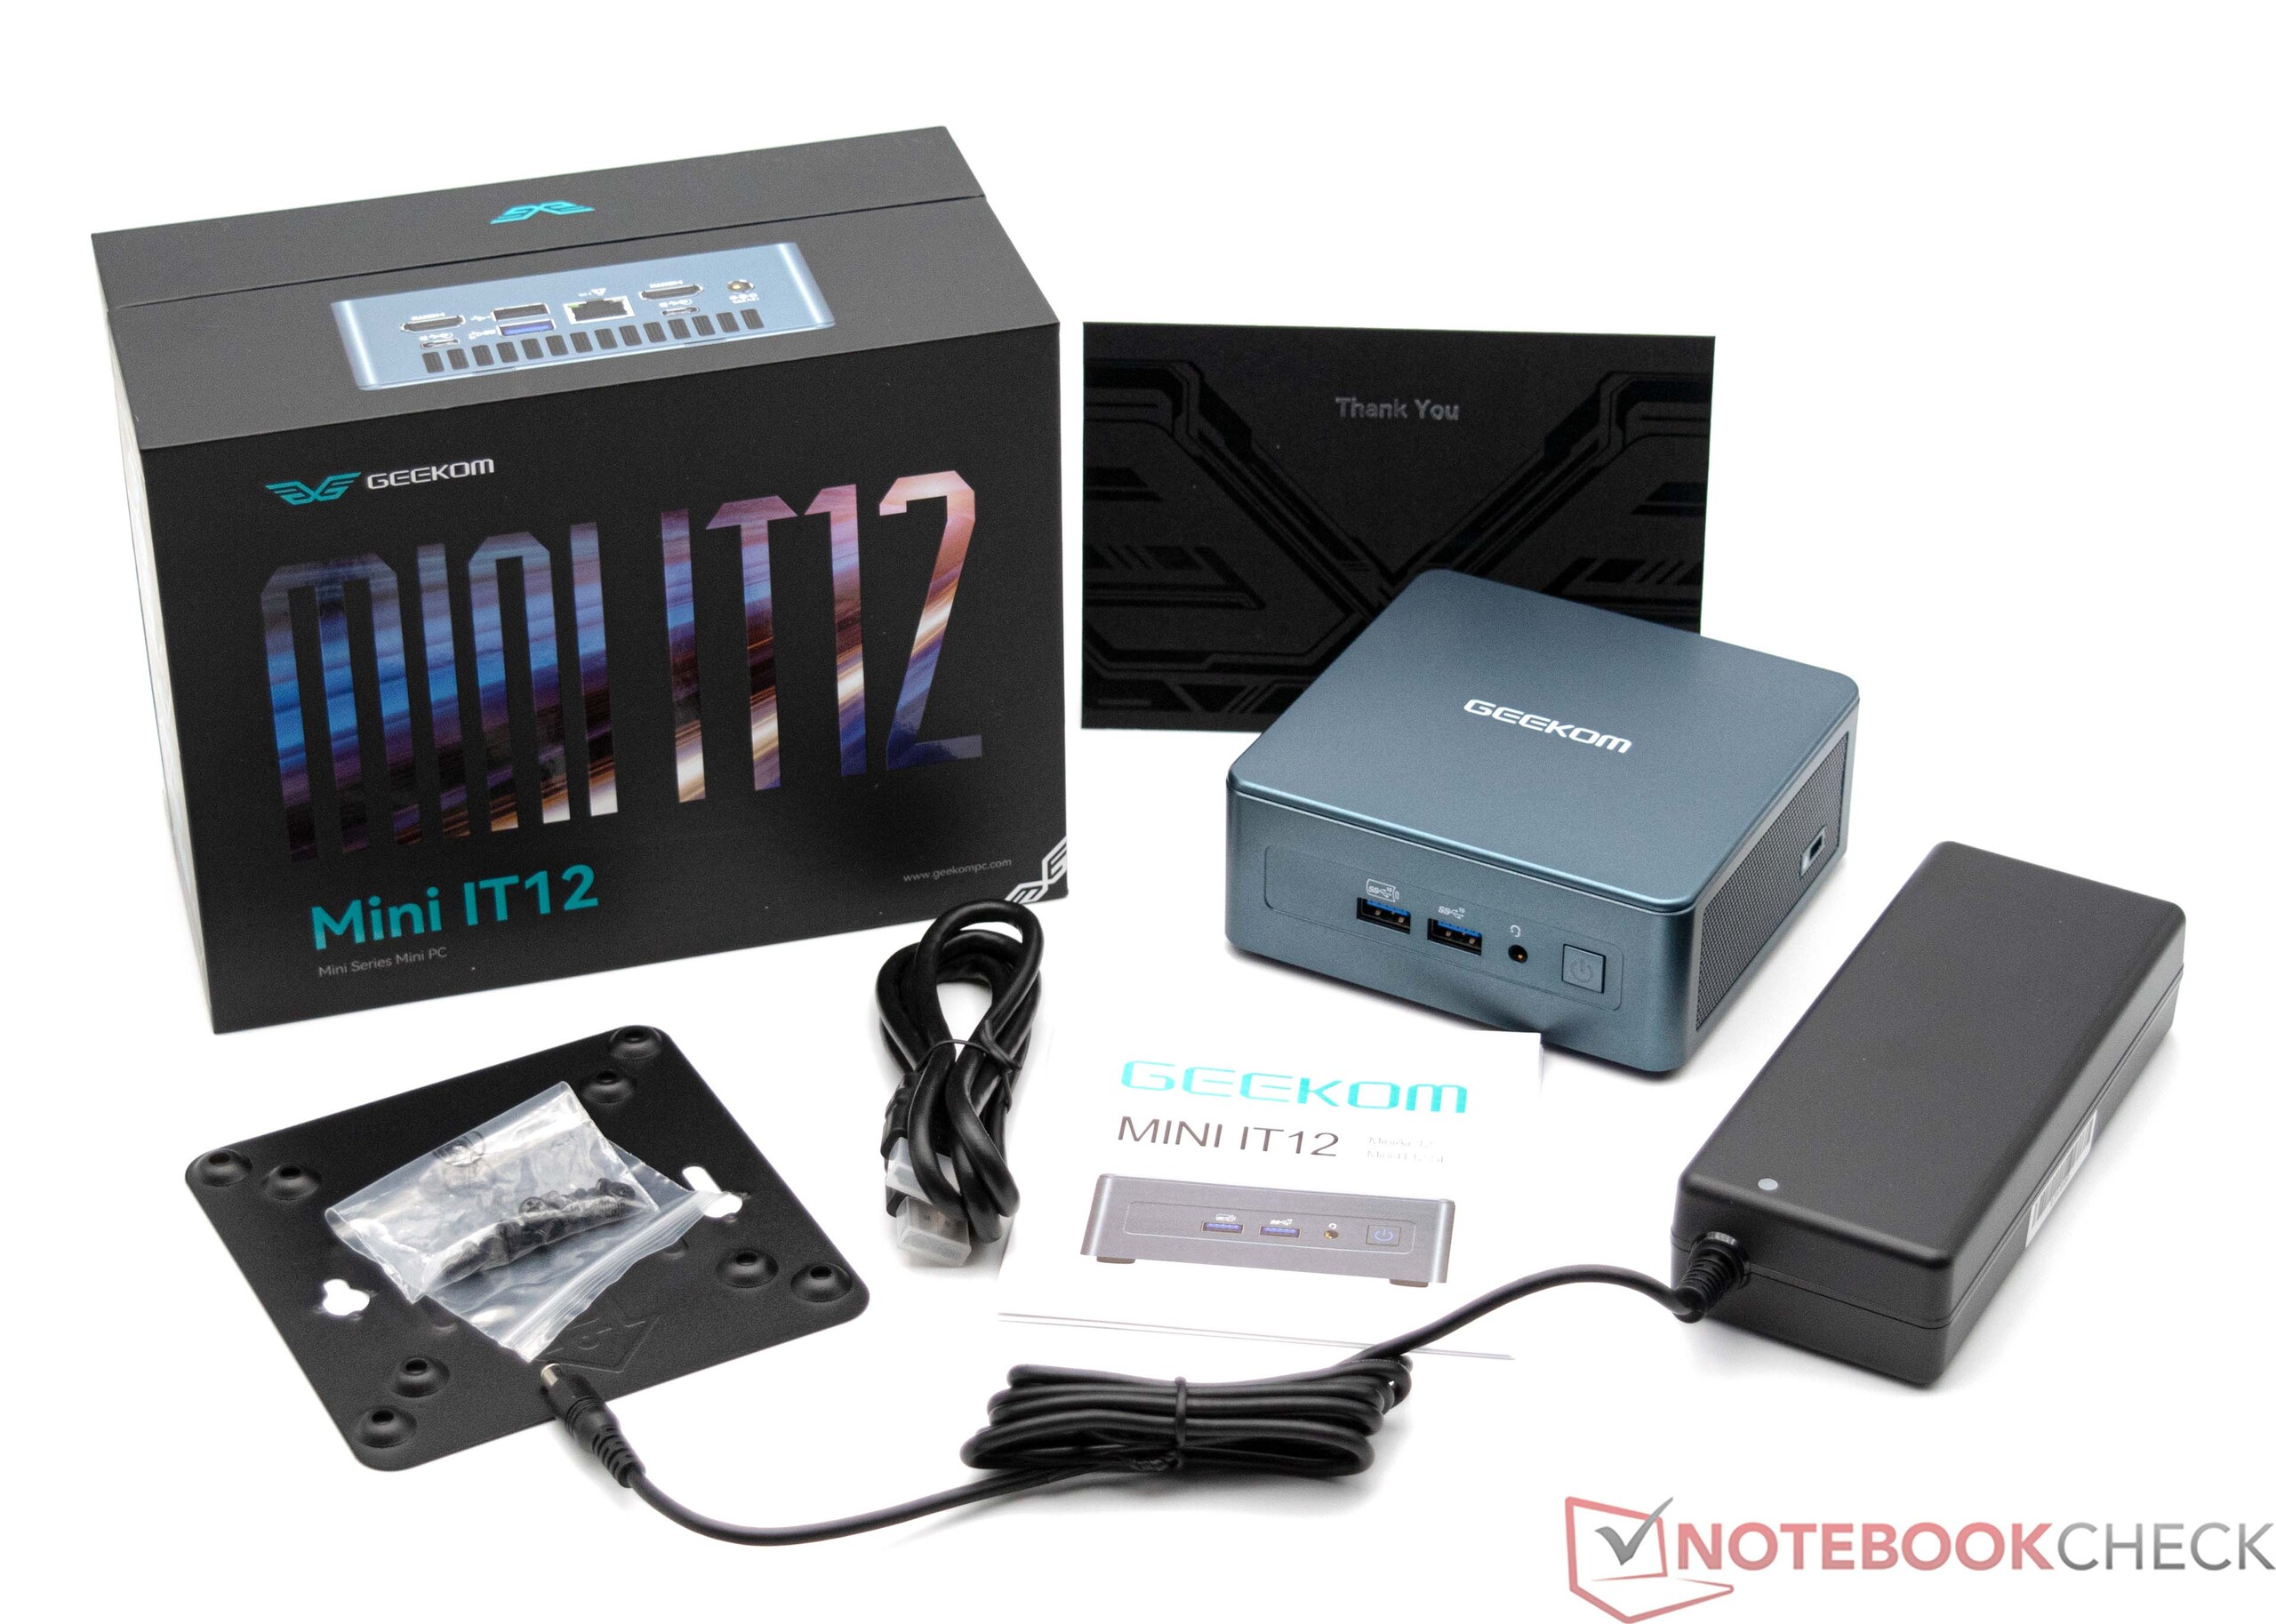
Accessoires
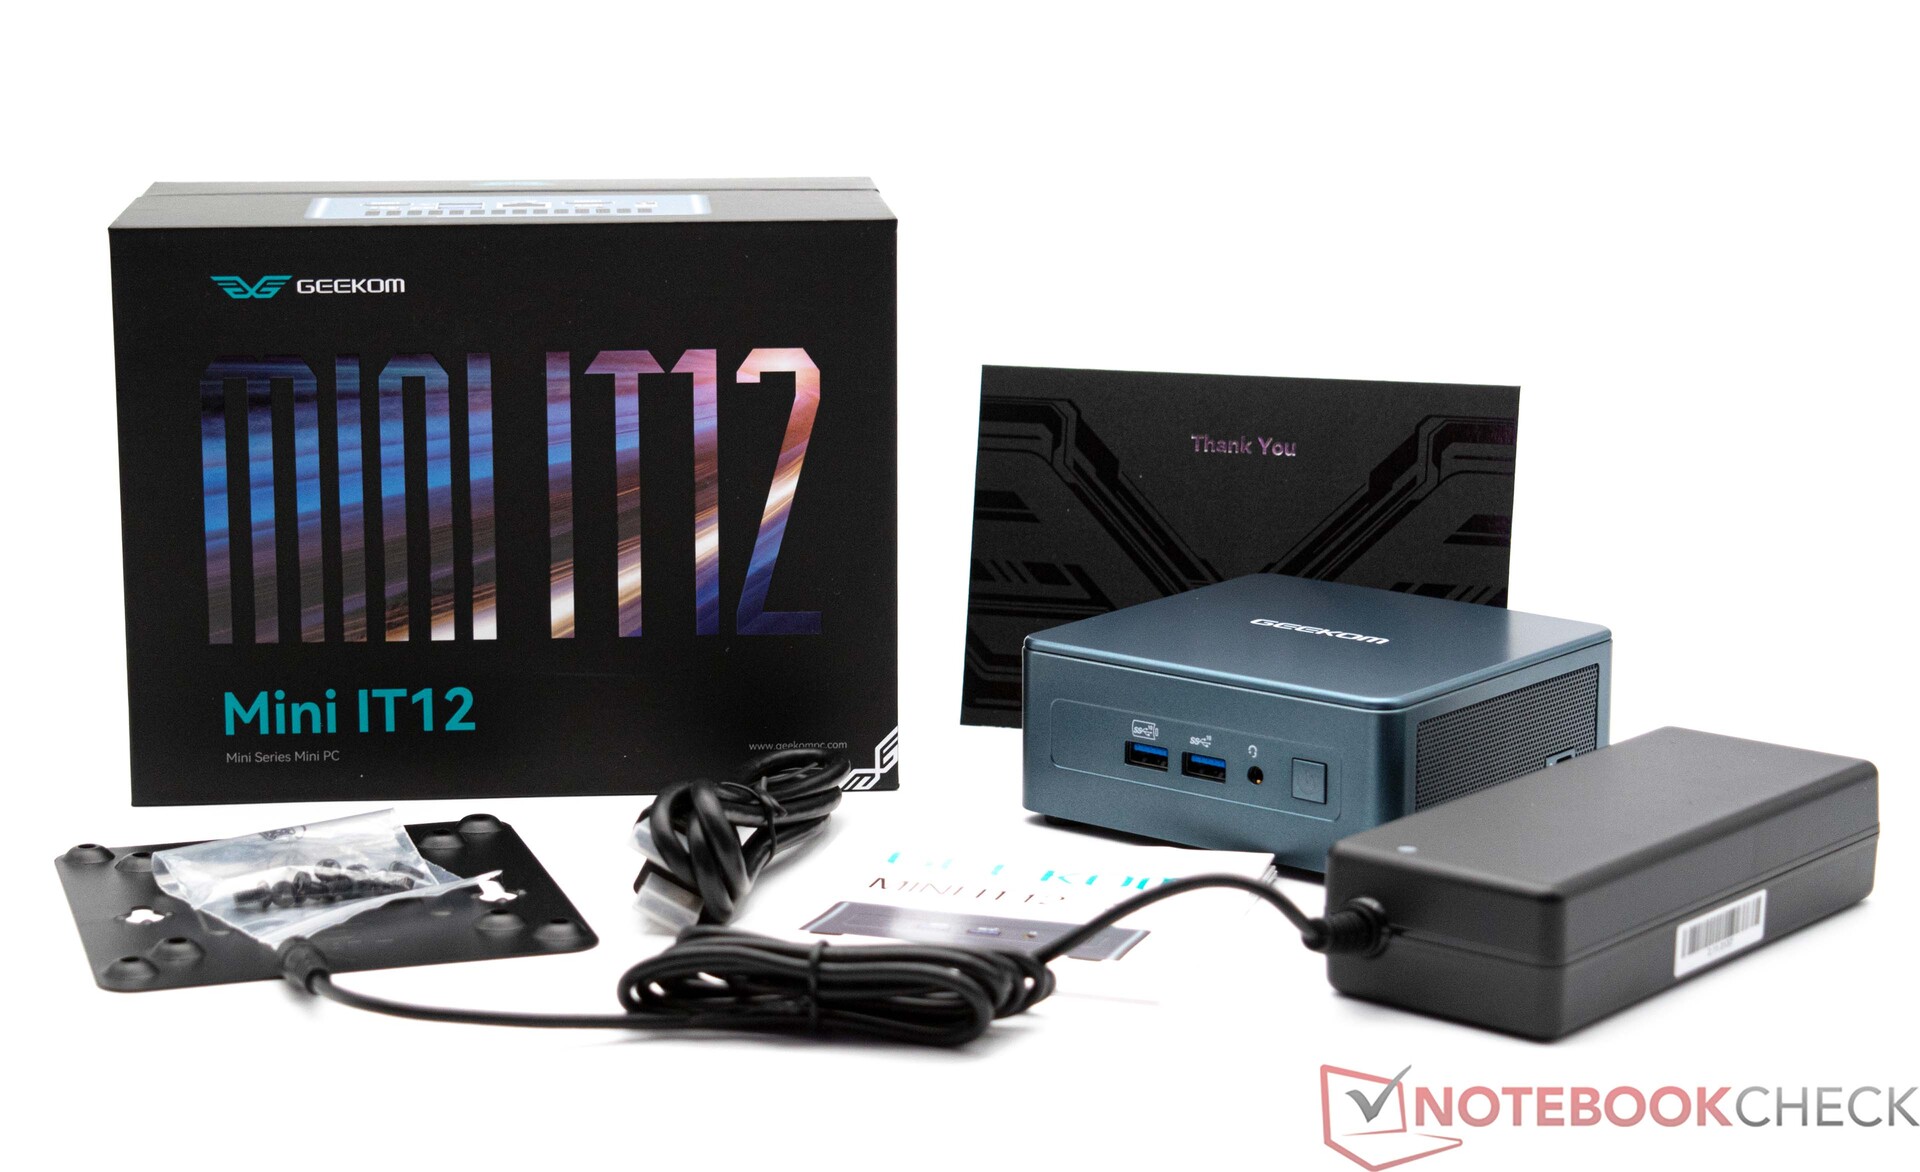
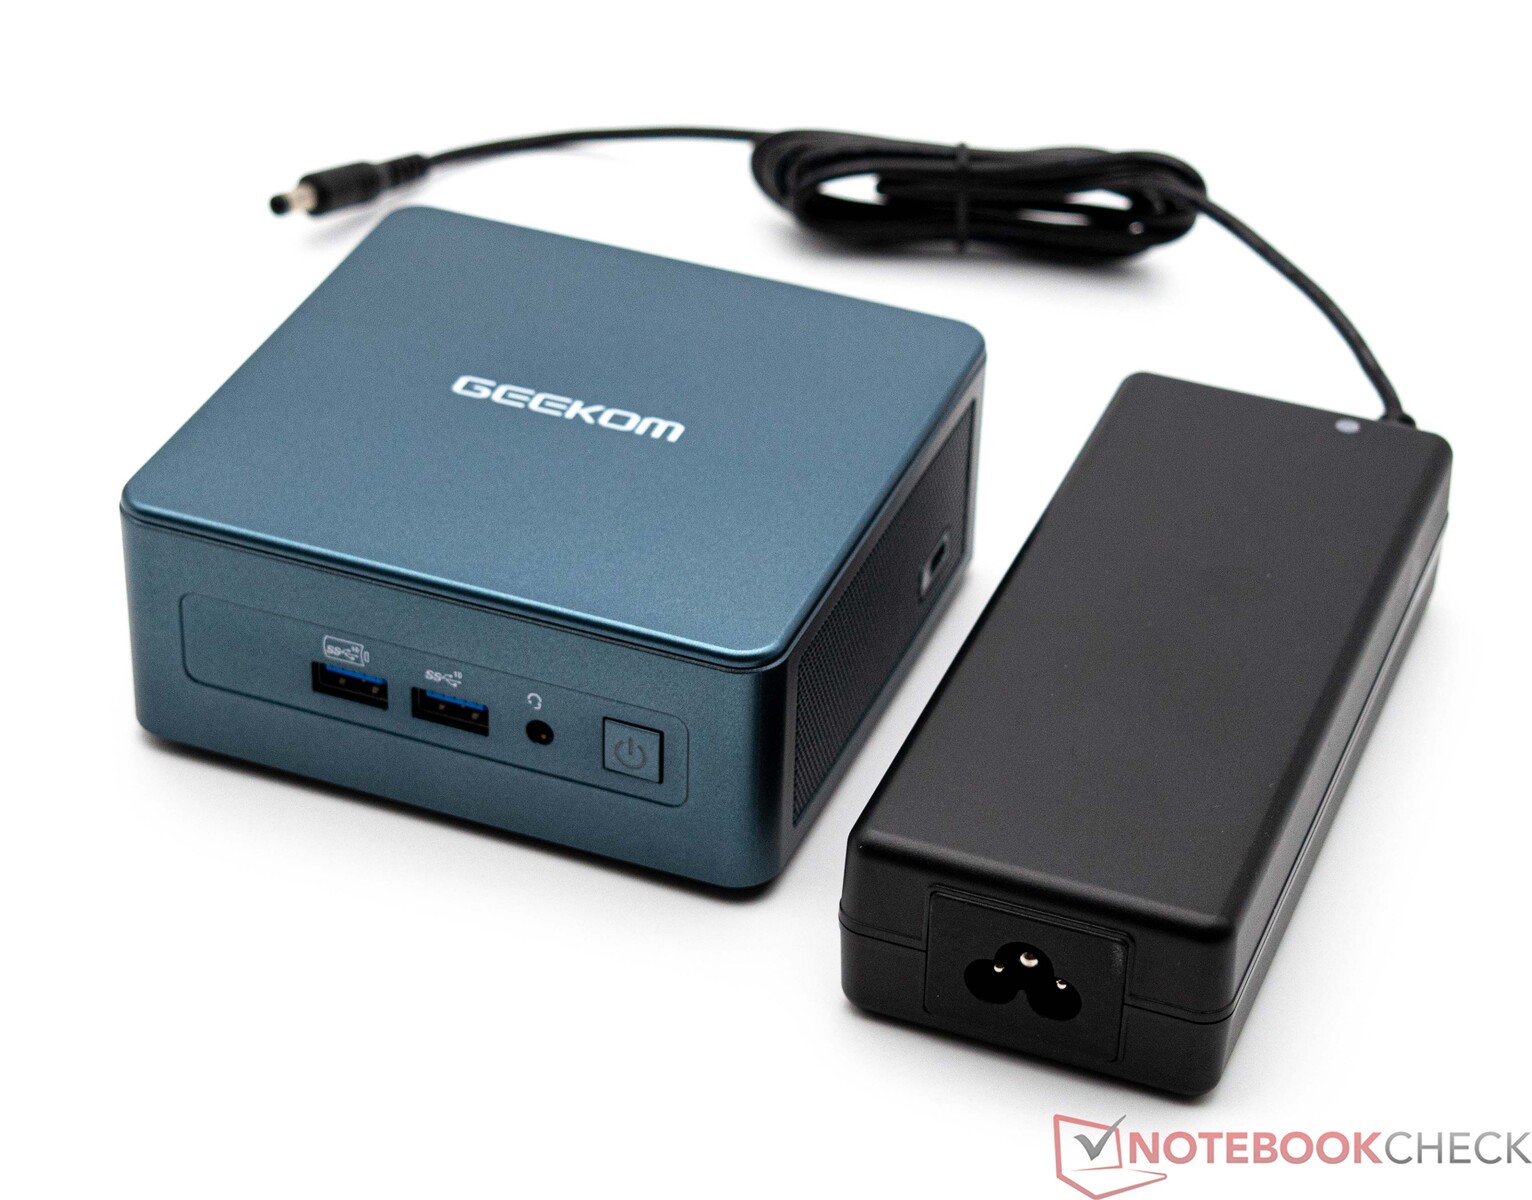
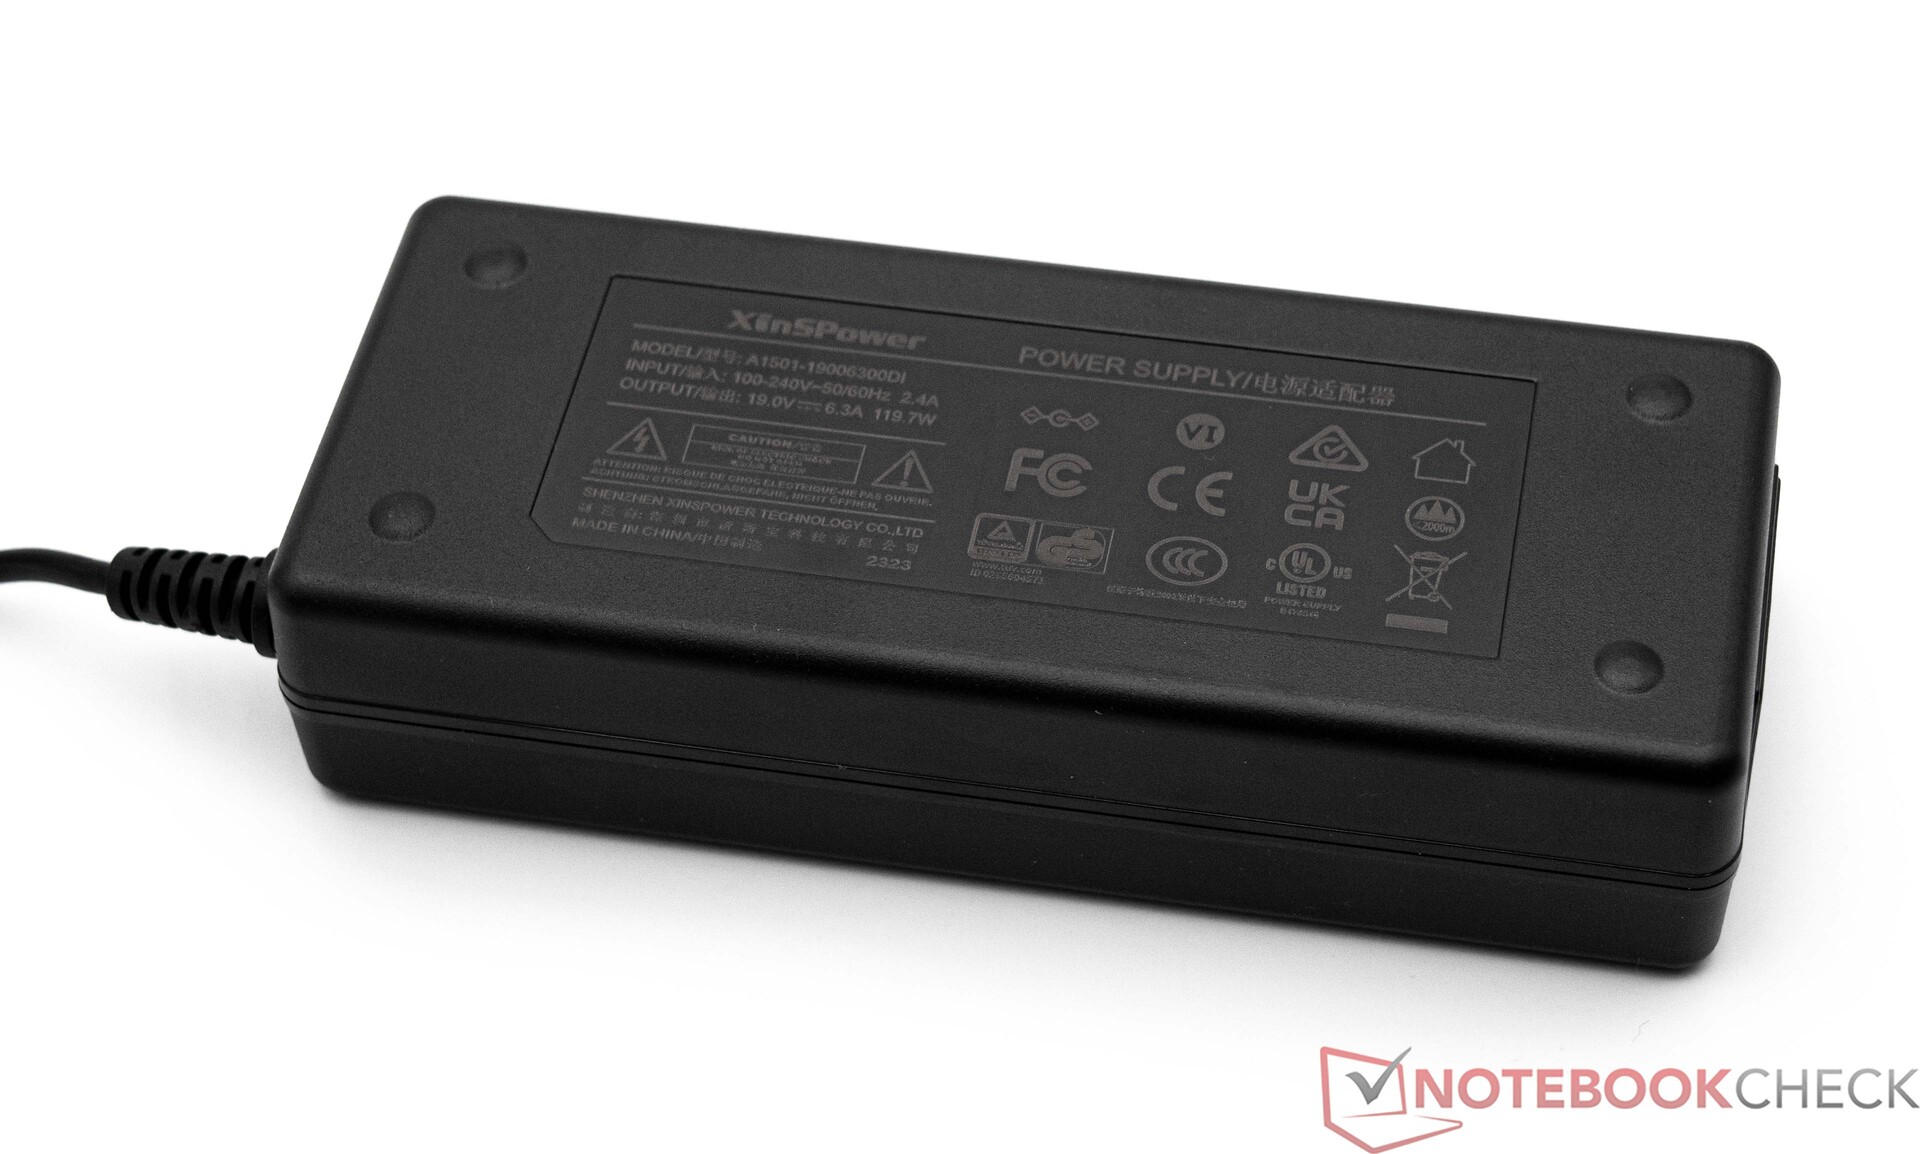
Outre l'appareil, l'emballage comprend un bloc d'alimentation de 90 watts, une plaque de montage VESA pour fixer l'appareil à un moniteur, un câble HDMI, un guide de démarrage rapide et une carte de remerciement.
Maintenance
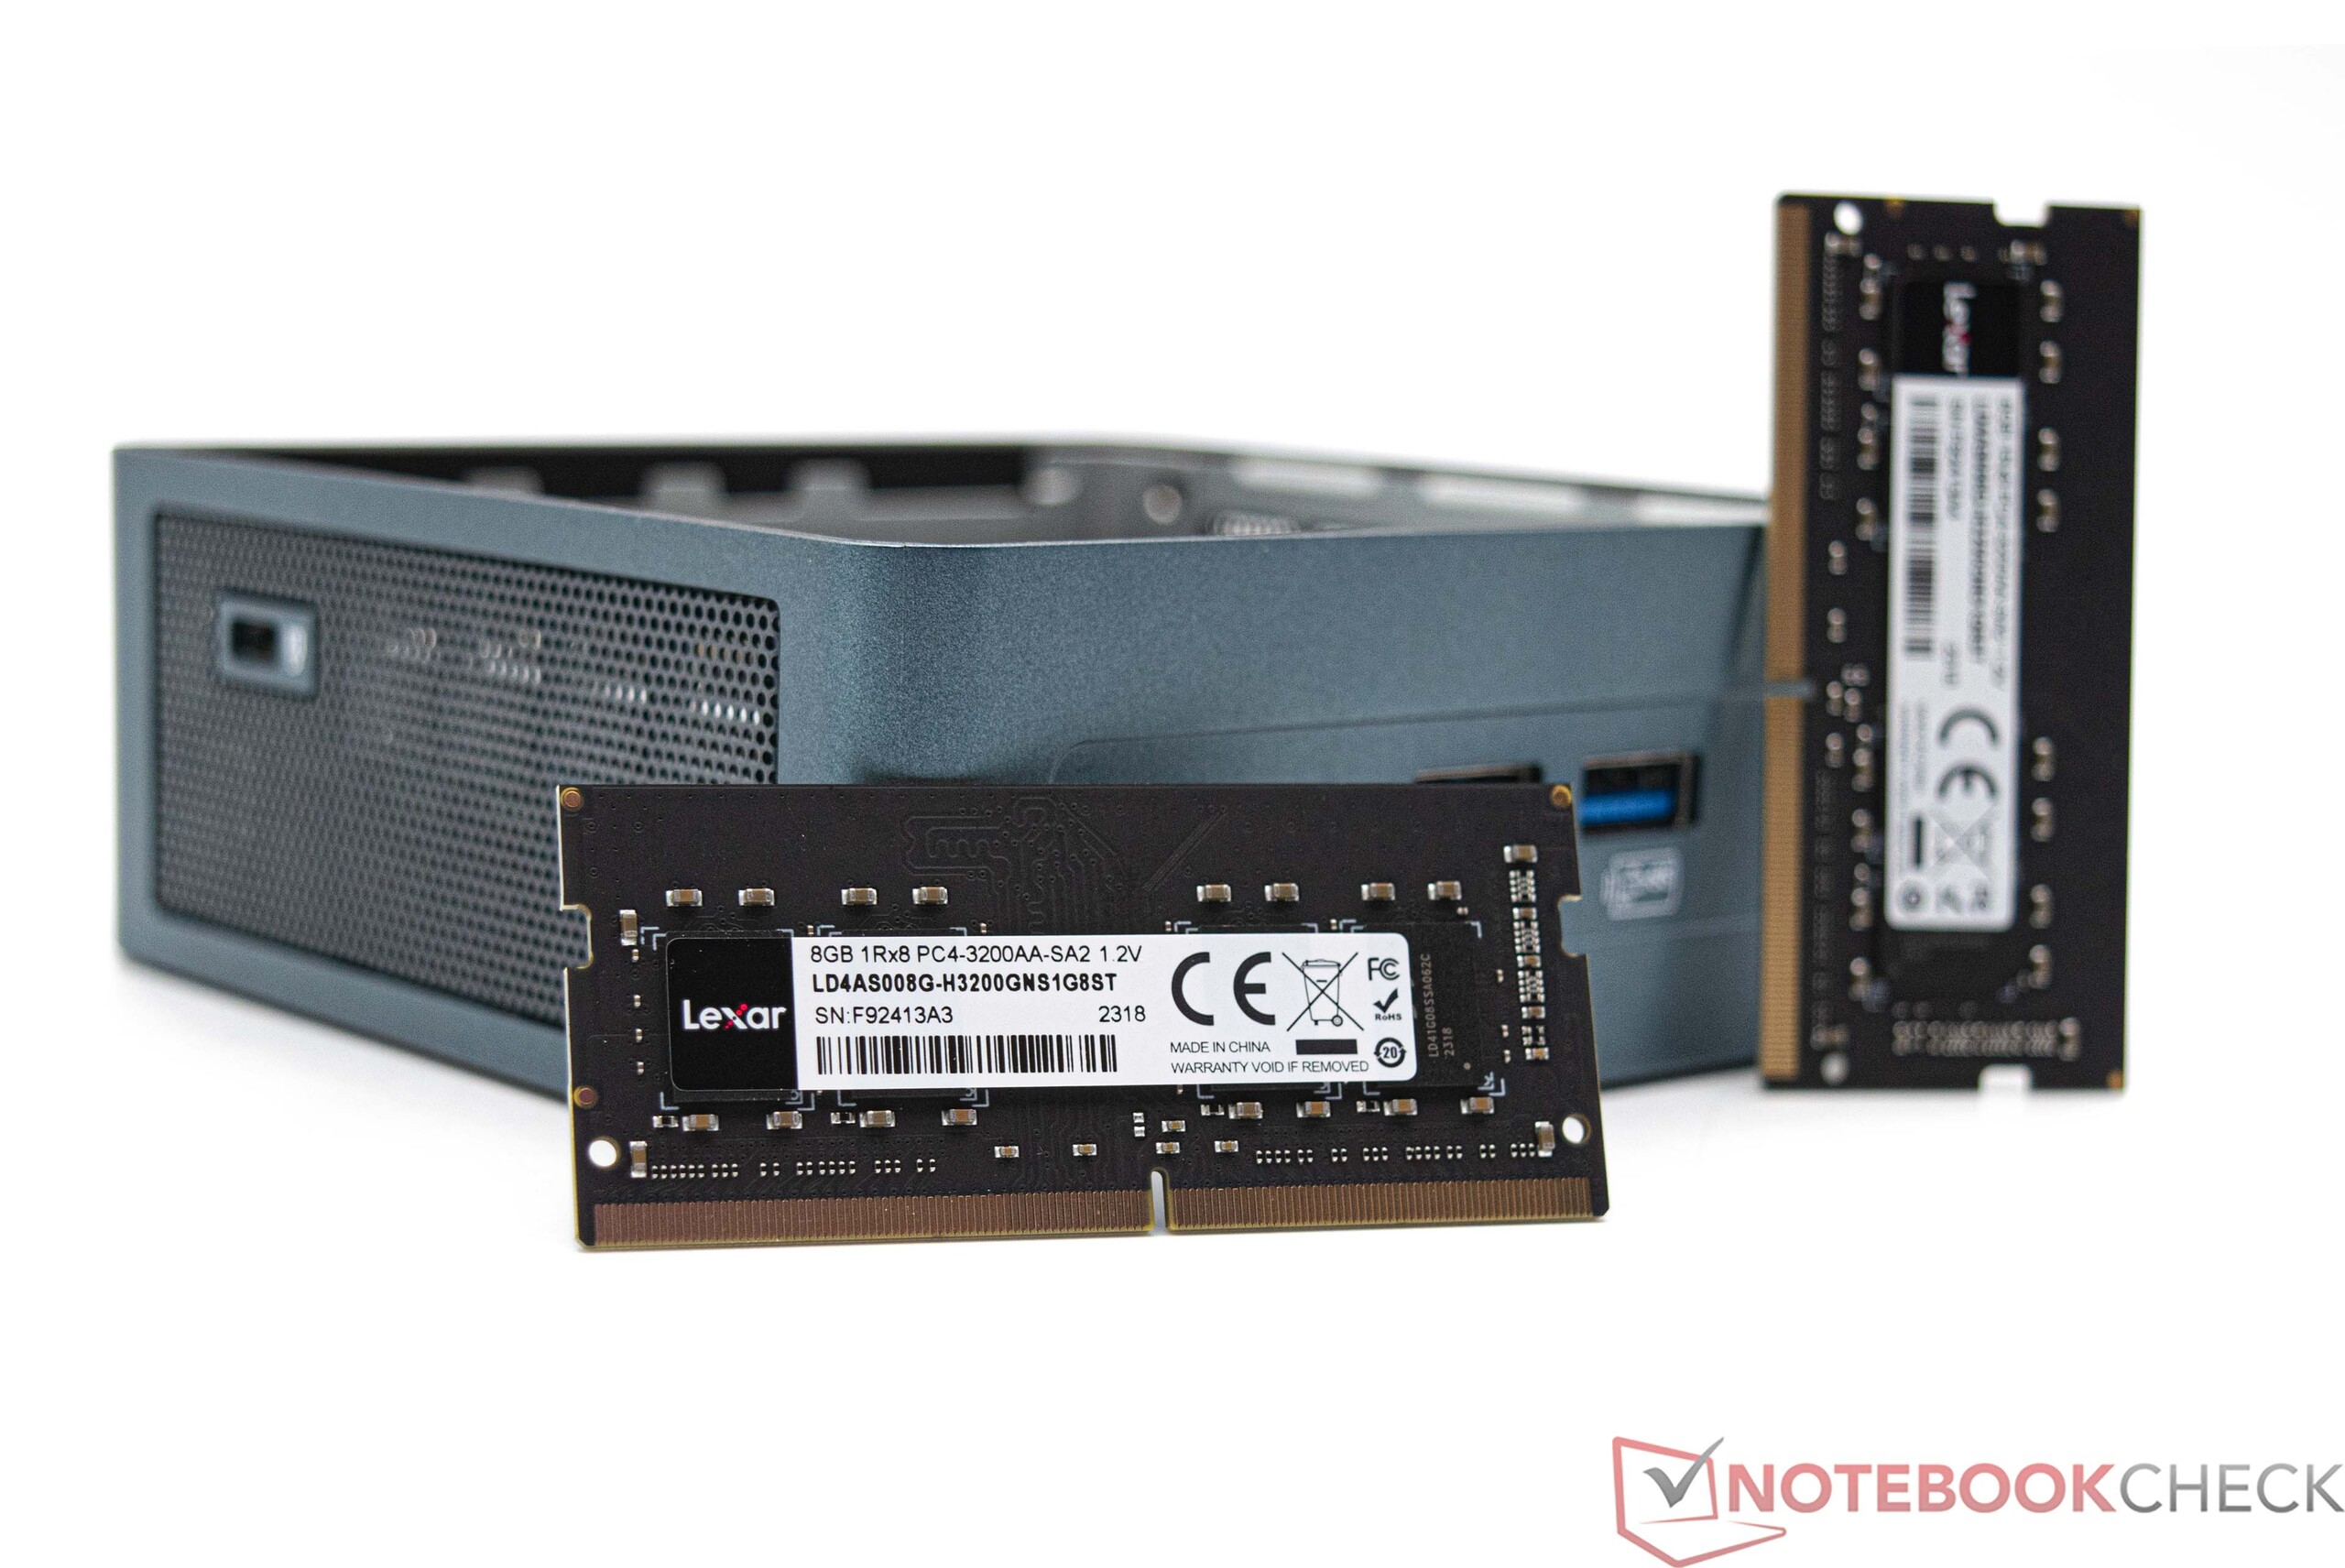
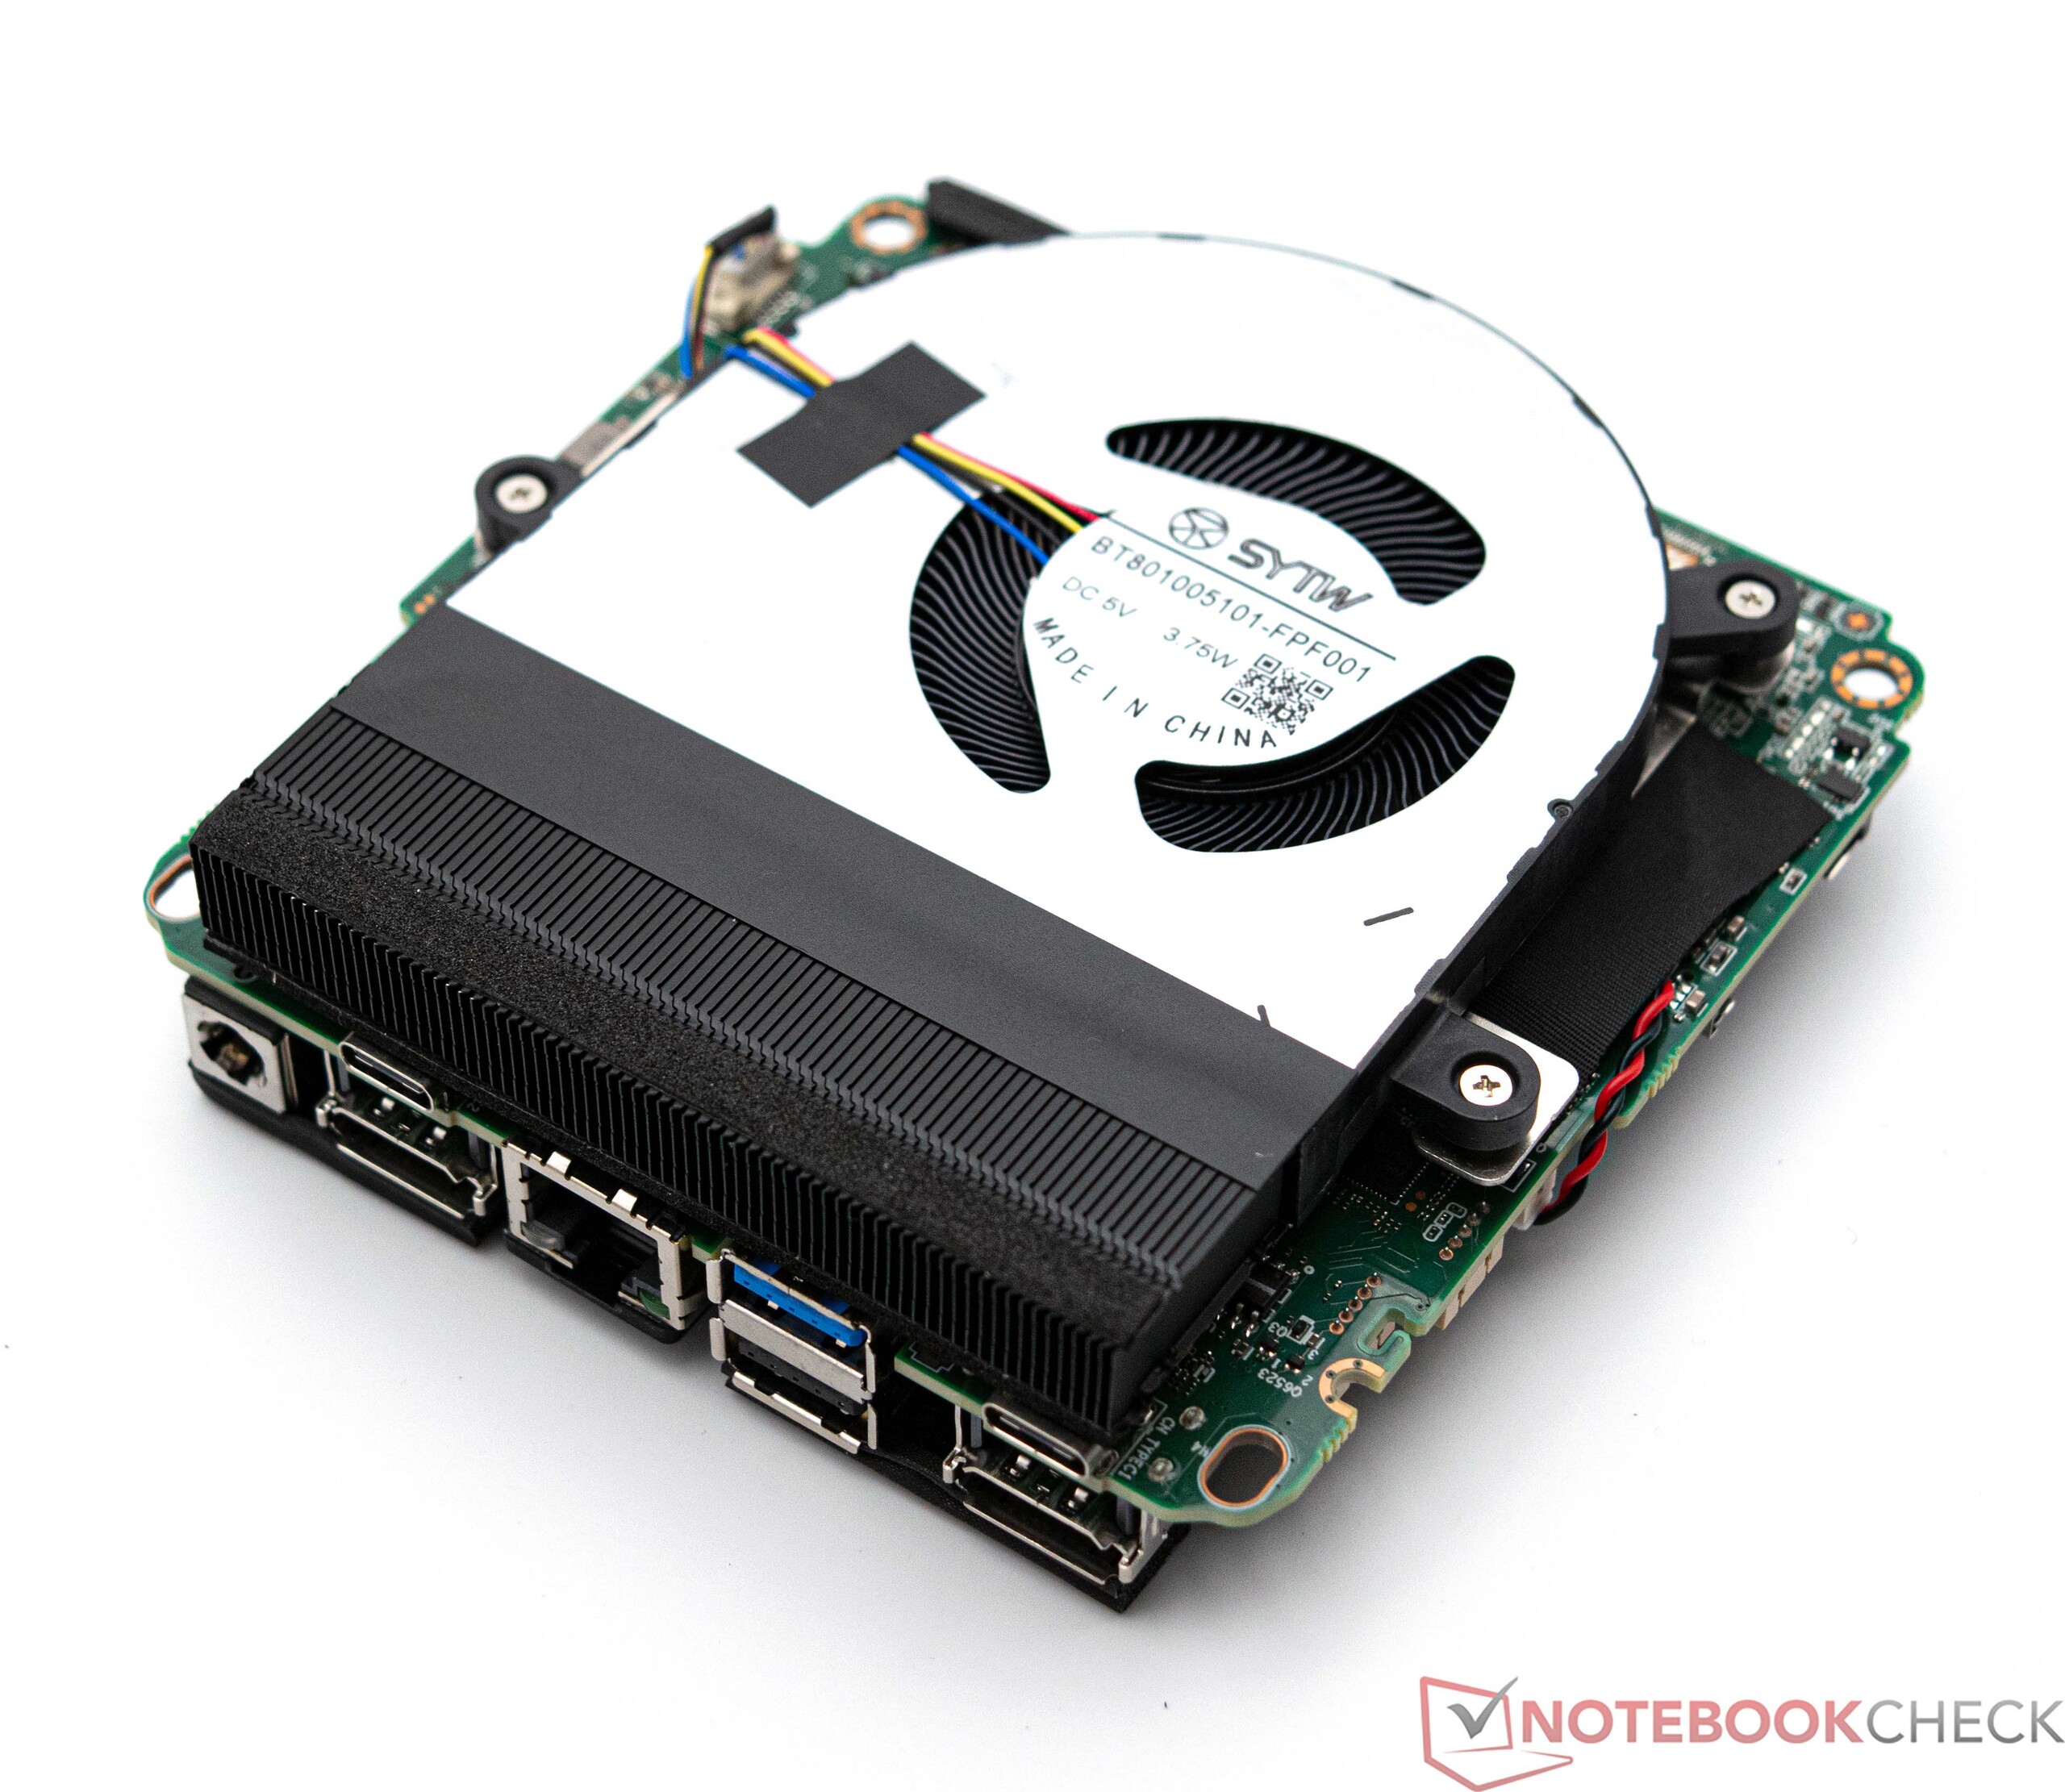
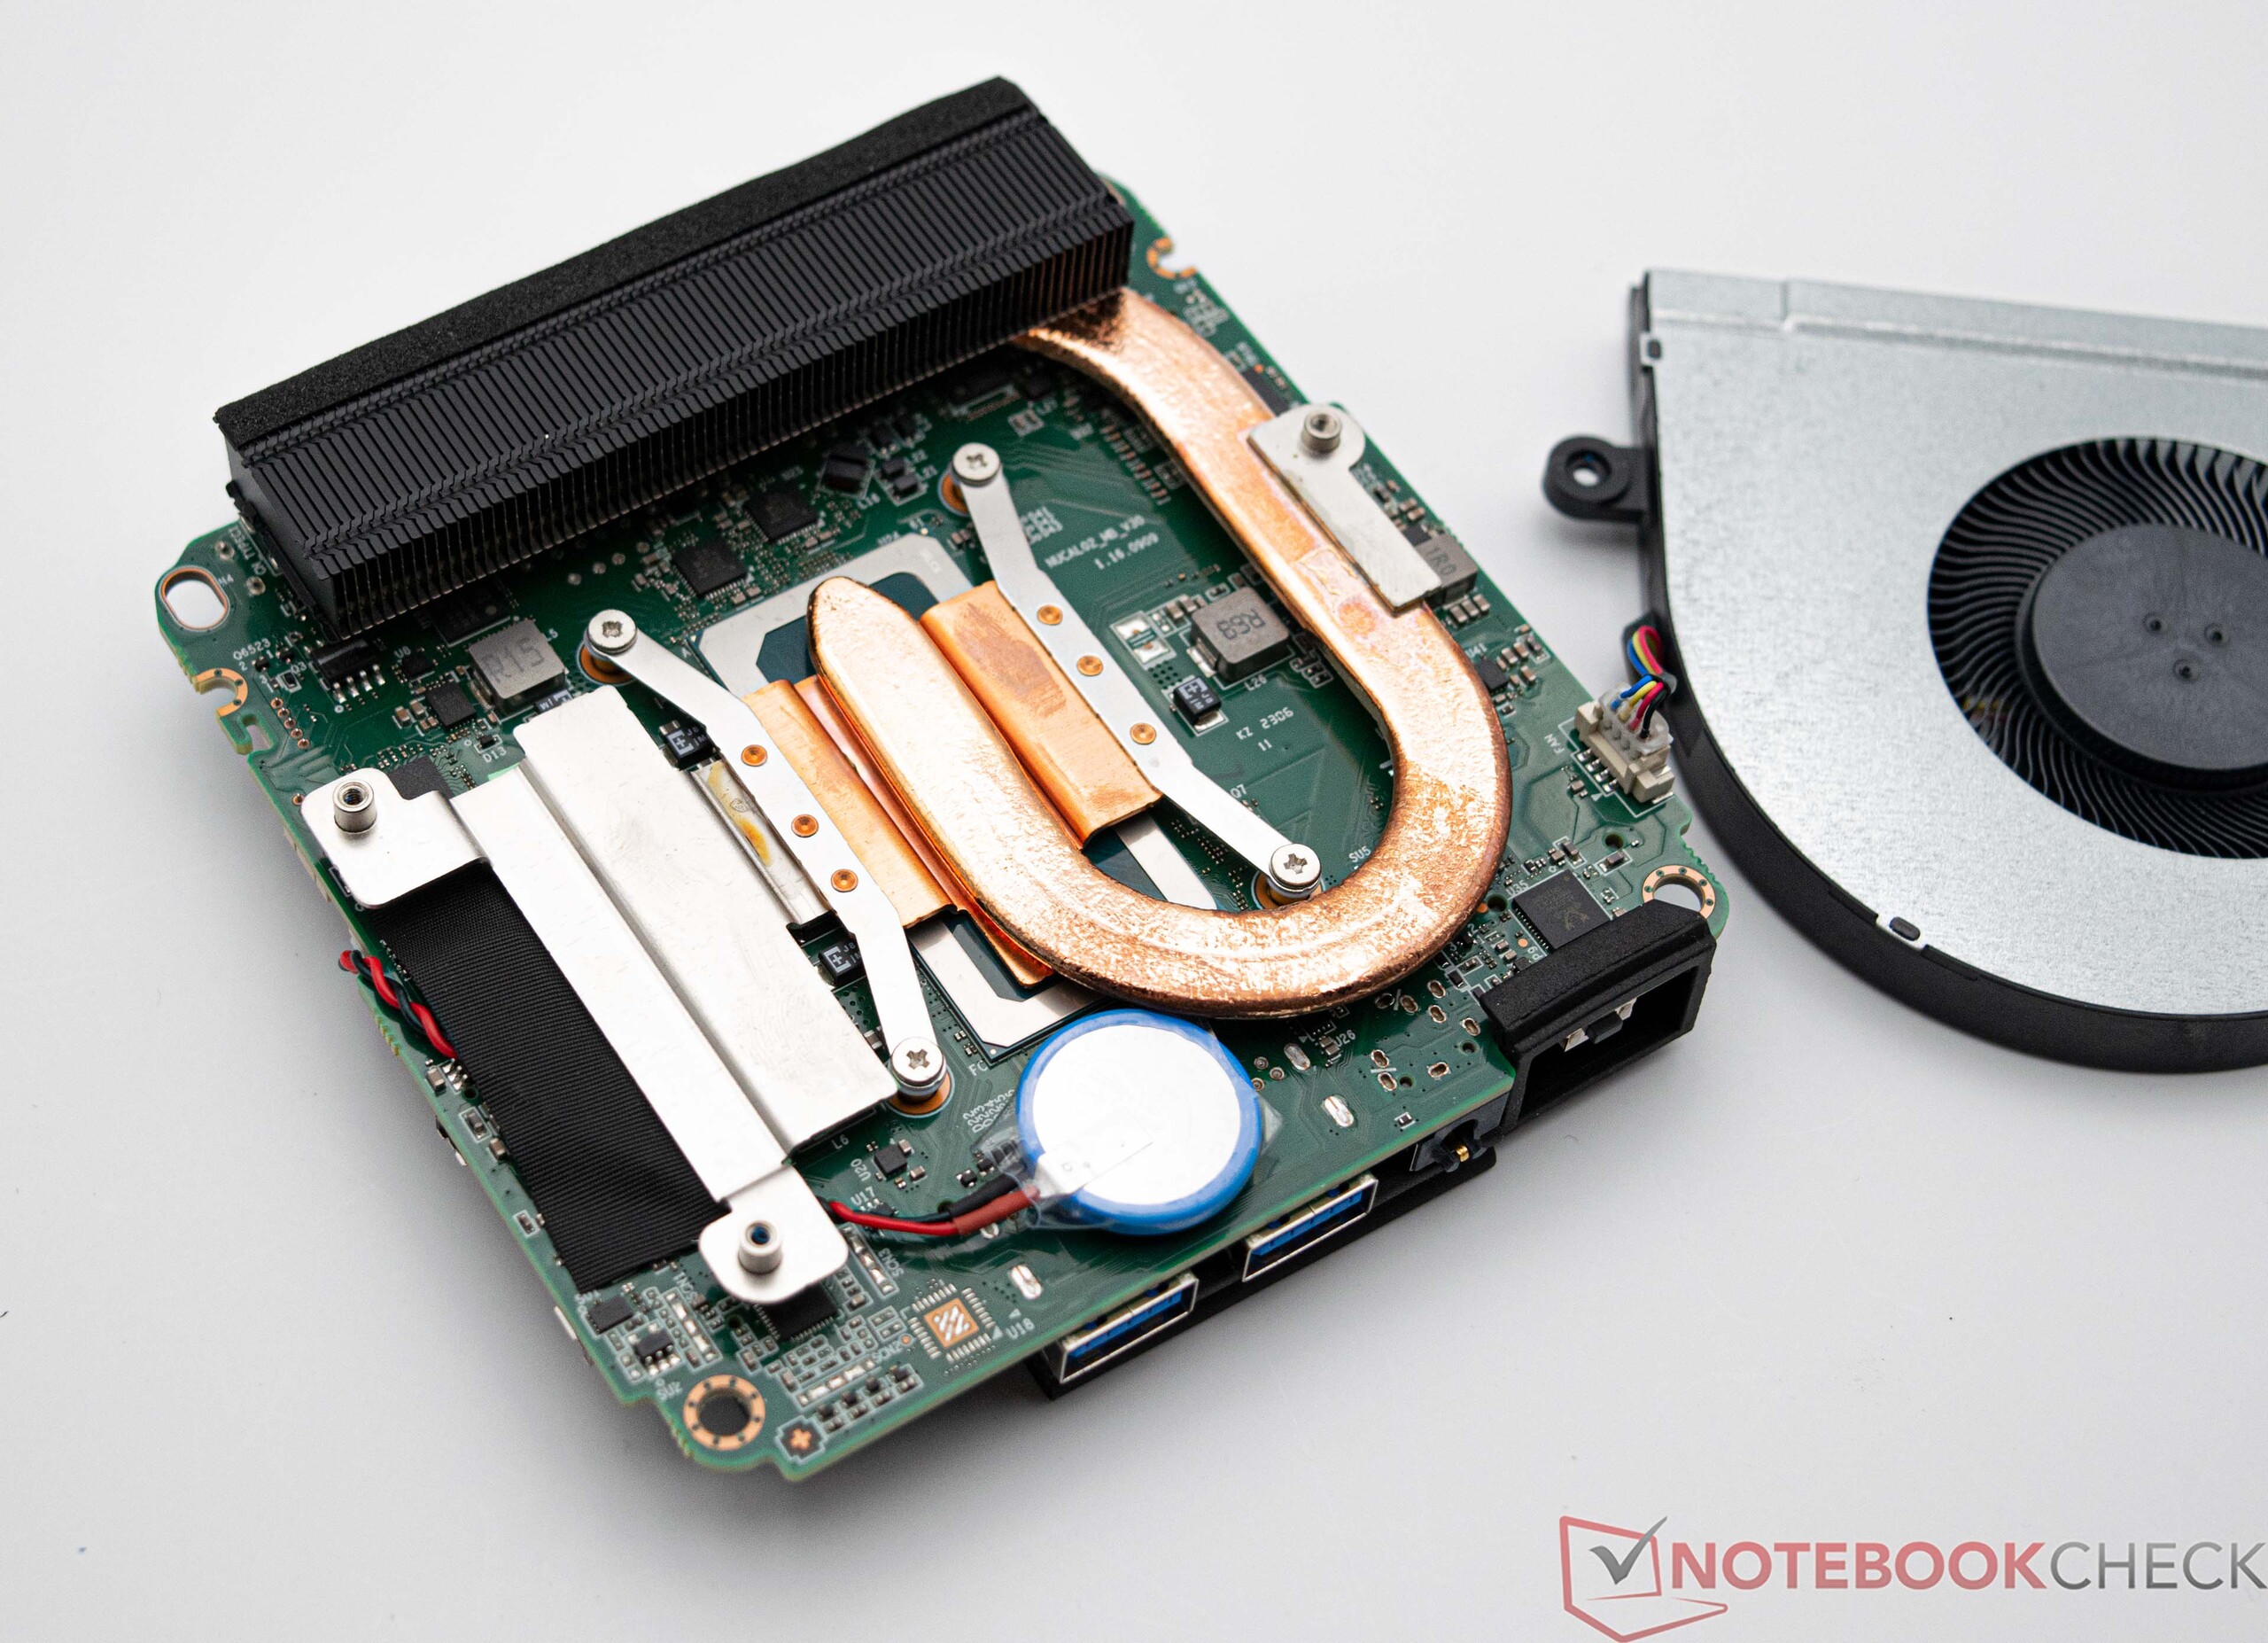
Si vous souhaitez accéder aux composants internes de l'appareil, vous devez d'abord retirer la plaque de base. Cette opération est simple : les vis qui maintiennent le couvercle sur le boîtier se trouvent sous les quatre pieds en caoutchouc. Une fois le couvercle retiré, vous pouvez facilement accéder aux composants installés tels que la RAM, le SSD ou le module WLAN. Le Geekom Mini IT12 dispose également d'un emplacement M.2 supplémentaire pour l'installation d'un périphérique de stockage de masse supplémentaire. En outre, il dispose d'un espace pour accueillir un périphérique de stockage de masse de 2,5 pouces. L'appareil peut être démonté si nécessaire, ce qui permet de nettoyer le ventilateur ou d'appliquer une nouvelle pâte thermique.
Performance - Alder Lake-H avec cœurs P et E
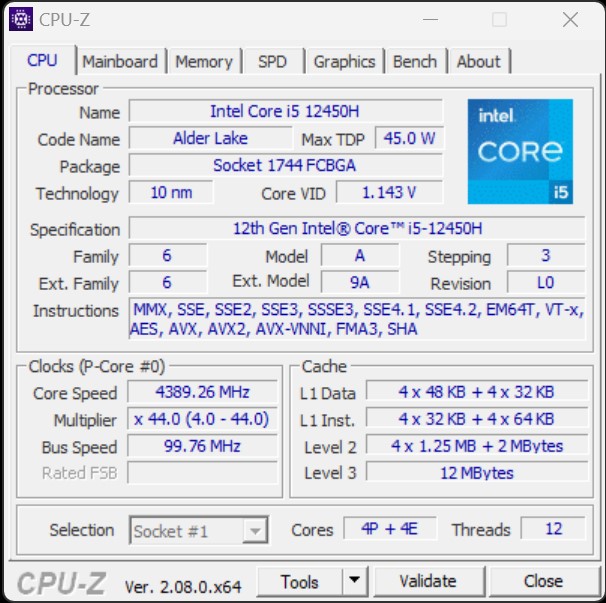
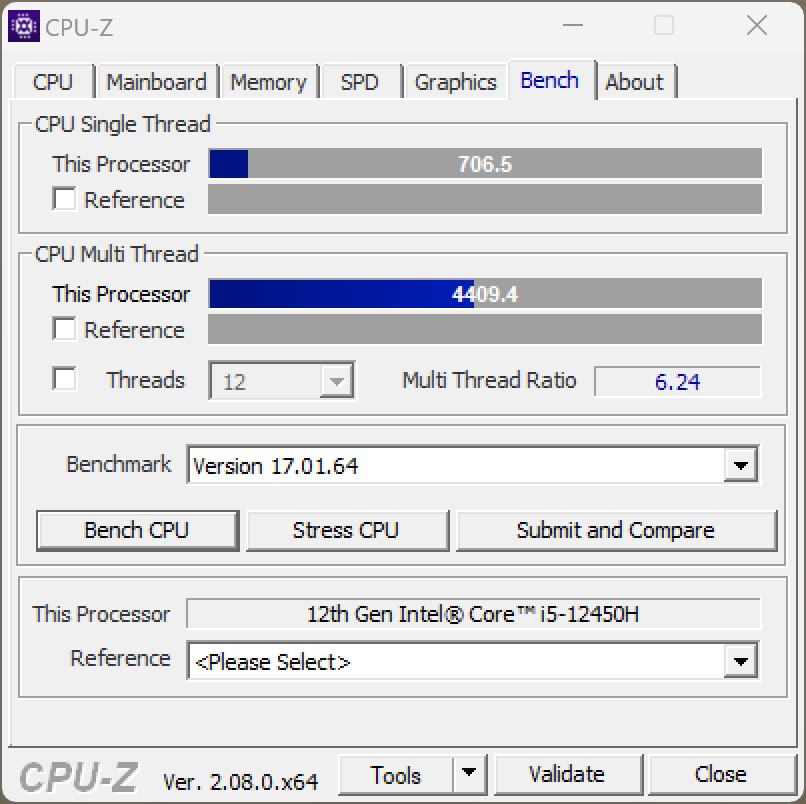
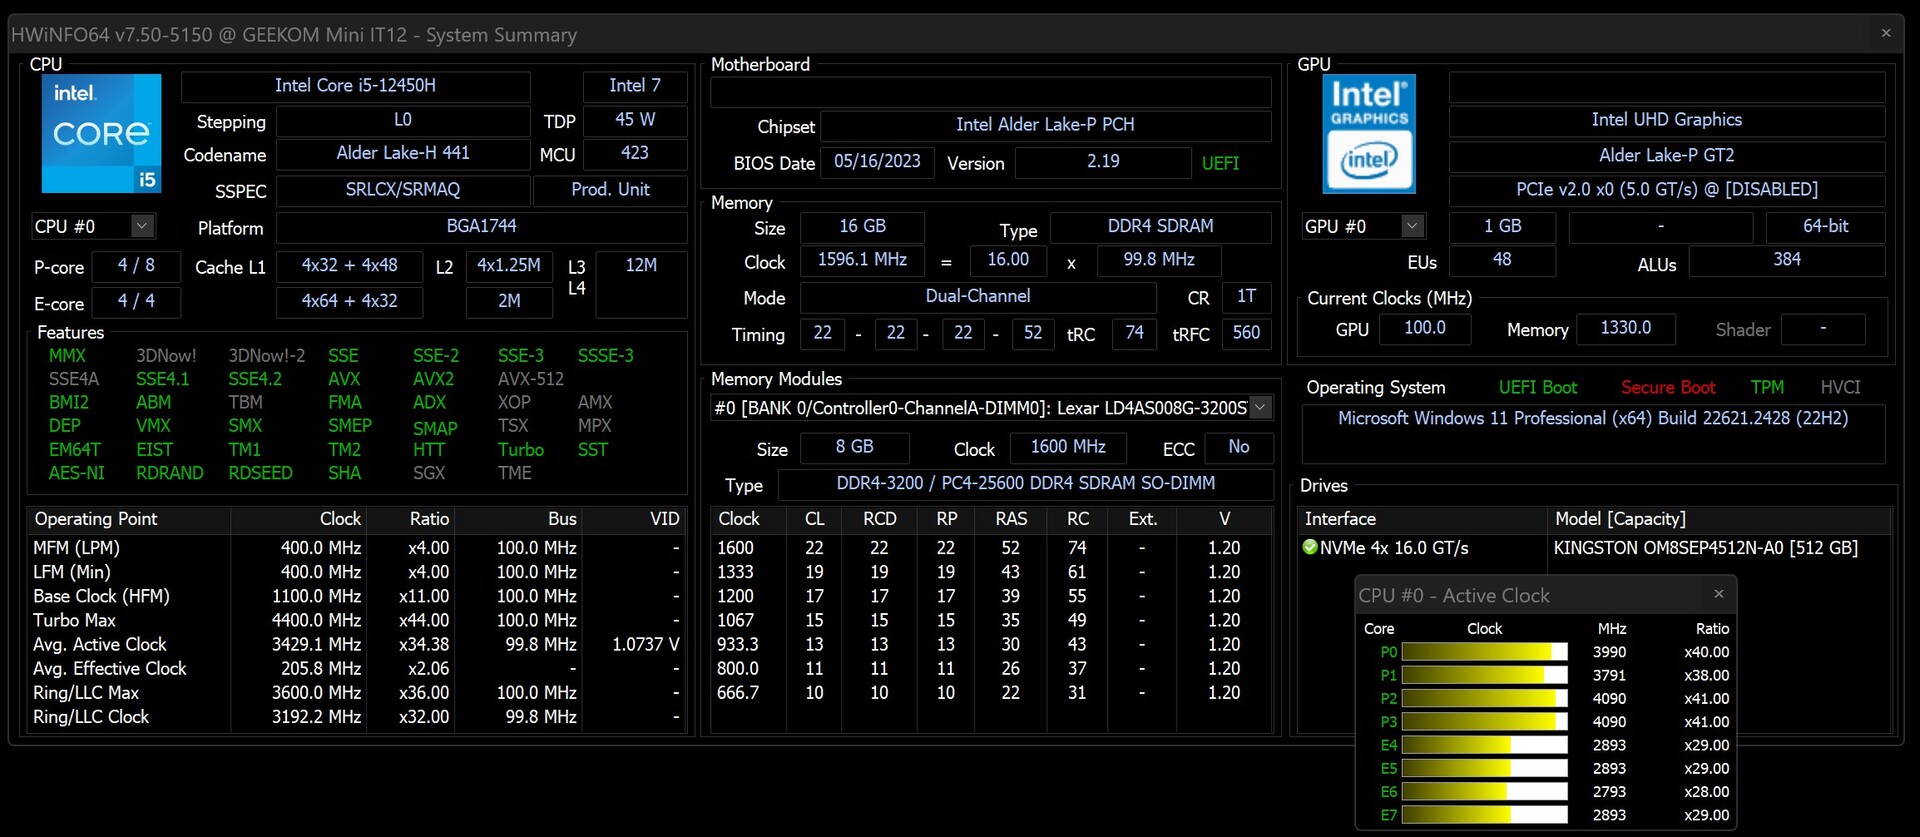
Même s'il ne s'agit pas d'une des versions les plus récentes, le Geekom Mini IT12 offre un SoC fiable avec l'Intel Core i5-12450H. Ce processeur, qui dispose de 8 cœurs et de 12 threads, devrait permettre de faire face aux charges de travail les plus exigeantes avec facilité. Il convient de mentionner que le Geekom Mini IT12 est également disponible avec un processeur Intel Core i7-12650H.
Conditions d'essai
Nous avons effectué tous les tests de performance en utilisant le profil d'alimentation équilibré. Nous n'avons pas modifié les performances du SoC et l'avons maintenu dans l'état par défaut conformément aux paramètres du BIOS.
Processeur
Geekom a équipé le Mini IT12 d'un processeur Intel Core i5-12450H intel Core i5-12450H. Ce processeur Alder Lake série H est également utilisé dans le Minisforum Venus Series UN1245 et le NiPoGi CK10. En comparaison directe, le Geekom est plus performant dans l'ensemble, perdant de peu le duel interne avec le Geekom Mini IT12 basé sur l'Intel Core i7-1260P. Notre échantillon de test a été surpassé par les deux NUC concurrents d'Intel.
Pour d'autres comparaisons et benchmarks, veuillez vous référer à notre tableau de comparaison des CPU.
| Performance rating - Percent | |
| Intel NUC 13 Pro Kit NUC13ANK | |
| Intel NUC 12 Pro Kit NUC12WSKi7 | |
| Geekom Mini IT12 | |
| Geekom Mini IT12 | |
| Minisforum Venus Series UN1245 | |
| NiPoGi CK10 | |
| Minisforum Mars Series MC560 | |
| Blender - v2.79 BMW27 CPU | |
| Minisforum Mars Series MC560 | |
| NiPoGi CK10 | |
| Geekom Mini IT12 | |
| Minisforum Venus Series UN1245 | |
| Intel NUC 12 Pro Kit NUC12WSKi7 | |
| Geekom Mini IT12 | |
| Intel NUC 13 Pro Kit NUC13ANK | |
| WinRAR - Result | |
| Intel NUC 12 Pro Kit NUC12WSKi7 | |
| Minisforum Mars Series MC560 | |
| Geekom Mini IT12 | |
| Minisforum Venus Series UN1245 | |
| Geekom Mini IT12 | |
| Intel NUC 13 Pro Kit NUC13ANK | |
| NiPoGi CK10 | |
| 3DMark 11 - 1280x720 Performance Physics | |
| Intel NUC 12 Pro Kit NUC12WSKi7 | |
| Intel NUC 13 Pro Kit NUC13ANK | |
| Geekom Mini IT12 | |
| Minisforum Venus Series UN1245 | |
| NiPoGi CK10 | |
| Minisforum Mars Series MC560 | |
| Geekom Mini IT12 | |
| HWBOT x265 Benchmark v2.2 - 4k Preset | |
| Intel NUC 13 Pro Kit NUC13ANK | |
| Intel NUC 12 Pro Kit NUC12WSKi7 | |
| Minisforum Venus Series UN1245 | |
| Geekom Mini IT12 | |
| Minisforum Mars Series MC560 | |
| Geekom Mini IT12 | |
| NiPoGi CK10 | |
| R Benchmark 2.5 - Overall mean | |
| Minisforum Mars Series MC560 | |
| NiPoGi CK10 | |
| Minisforum Venus Series UN1245 | |
| Geekom Mini IT12 | |
| Intel NUC 12 Pro Kit NUC12WSKi7 | |
| Geekom Mini IT12 | |
| Intel NUC 13 Pro Kit NUC13ANK | |
| LibreOffice - 20 Documents To PDF | |
| Minisforum Mars Series MC560 | |
| Geekom Mini IT12 | |
| Geekom Mini IT12 | |
| Minisforum Venus Series UN1245 | |
| Intel NUC 12 Pro Kit NUC12WSKi7 | |
| Intel NUC 13 Pro Kit NUC13ANK | |
| NiPoGi CK10 | |
| WebXPRT 3 - Overall | |
| Intel NUC 13 Pro Kit NUC13ANK | |
| Geekom Mini IT12 | |
| Intel NUC 12 Pro Kit NUC12WSKi7 | |
| Minisforum Venus Series UN1245 | |
| Geekom Mini IT12 | |
| NiPoGi CK10 | |
| Minisforum Mars Series MC560 | |
| Mozilla Kraken 1.1 - Total | |
| Minisforum Mars Series MC560 | |
| Minisforum Venus Series UN1245 | |
| NiPoGi CK10 | |
| Geekom Mini IT12 | |
| Geekom Mini IT12 | |
| Intel NUC 12 Pro Kit NUC12WSKi7 | |
| Intel NUC 13 Pro Kit NUC13ANK | |
* ... Moindre est la valeur, meilleures sont les performances
AIDA64: FP32 Ray-Trace | FPU Julia | CPU SHA3 | CPU Queen | FPU SinJulia | FPU Mandel | CPU AES | CPU ZLib | FP64 Ray-Trace | CPU PhotoWorxx
| Performance rating | |
| Moyenne de la classe Mini PC | |
| Intel NUC 13 Pro Kit NUC13ANK | |
| Intel NUC 12 Pro Kit NUC12WSKi7 | |
| Minisforum Mars Series MC560 | |
| Minisforum Venus Series UN1245 | |
| Geekom Mini IT12 | |
| Geekom Mini IT12 | |
| NiPoGi CK10 | |
| AIDA64 / FP32 Ray-Trace | |
| Moyenne de la classe Mini PC (974 - 82725, n=97, 2 dernières années) | |
| Intel NUC 13 Pro Kit NUC13ANK | |
| Intel NUC 12 Pro Kit NUC12WSKi7 | |
| Minisforum Mars Series MC560 | |
| Minisforum Venus Series UN1245 | |
| Geekom Mini IT12 | |
| Geekom Mini IT12 | |
| NiPoGi CK10 | |
| AIDA64 / FPU Julia | |
| Moyenne de la classe Mini PC (6115 - 363782, n=97, 2 dernières années) | |
| Minisforum Mars Series MC560 | |
| Intel NUC 13 Pro Kit NUC13ANK | |
| Intel NUC 12 Pro Kit NUC12WSKi7 | |
| Minisforum Venus Series UN1245 | |
| Geekom Mini IT12 | |
| Geekom Mini IT12 | |
| NiPoGi CK10 | |
| AIDA64 / FPU SinJulia | |
| Moyenne de la classe Mini PC (1116 - 31931, n=97, 2 dernières années) | |
| Minisforum Mars Series MC560 | |
| Intel NUC 13 Pro Kit NUC13ANK | |
| Intel NUC 12 Pro Kit NUC12WSKi7 | |
| Minisforum Venus Series UN1245 | |
| Geekom Mini IT12 | |
| Geekom Mini IT12 | |
| NiPoGi CK10 | |
| AIDA64 / FPU Mandel | |
| Moyenne de la classe Mini PC (3322 - 192994, n=97, 2 dernières années) | |
| Minisforum Mars Series MC560 | |
| Intel NUC 13 Pro Kit NUC13ANK | |
| Intel NUC 12 Pro Kit NUC12WSKi7 | |
| Minisforum Venus Series UN1245 | |
| Geekom Mini IT12 | |
| Geekom Mini IT12 | |
| NiPoGi CK10 | |
| AIDA64 / FP64 Ray-Trace | |
| Moyenne de la classe Mini PC (537 - 43587, n=97, 2 dernières années) | |
| Intel NUC 13 Pro Kit NUC13ANK | |
| Intel NUC 12 Pro Kit NUC12WSKi7 | |
| Minisforum Mars Series MC560 | |
| Minisforum Venus Series UN1245 | |
| Geekom Mini IT12 | |
| Geekom Mini IT12 | |
| NiPoGi CK10 | |
| AIDA64 / CPU PhotoWorxx | |
| Moyenne de la classe Mini PC (8069 - 96843, n=97, 2 dernières années) | |
| Intel NUC 13 Pro Kit NUC13ANK | |
| Minisforum Venus Series UN1245 | |
| Intel NUC 12 Pro Kit NUC12WSKi7 | |
| Geekom Mini IT12 | |
| NiPoGi CK10 | |
| Geekom Mini IT12 | |
| Minisforum Mars Series MC560 | |
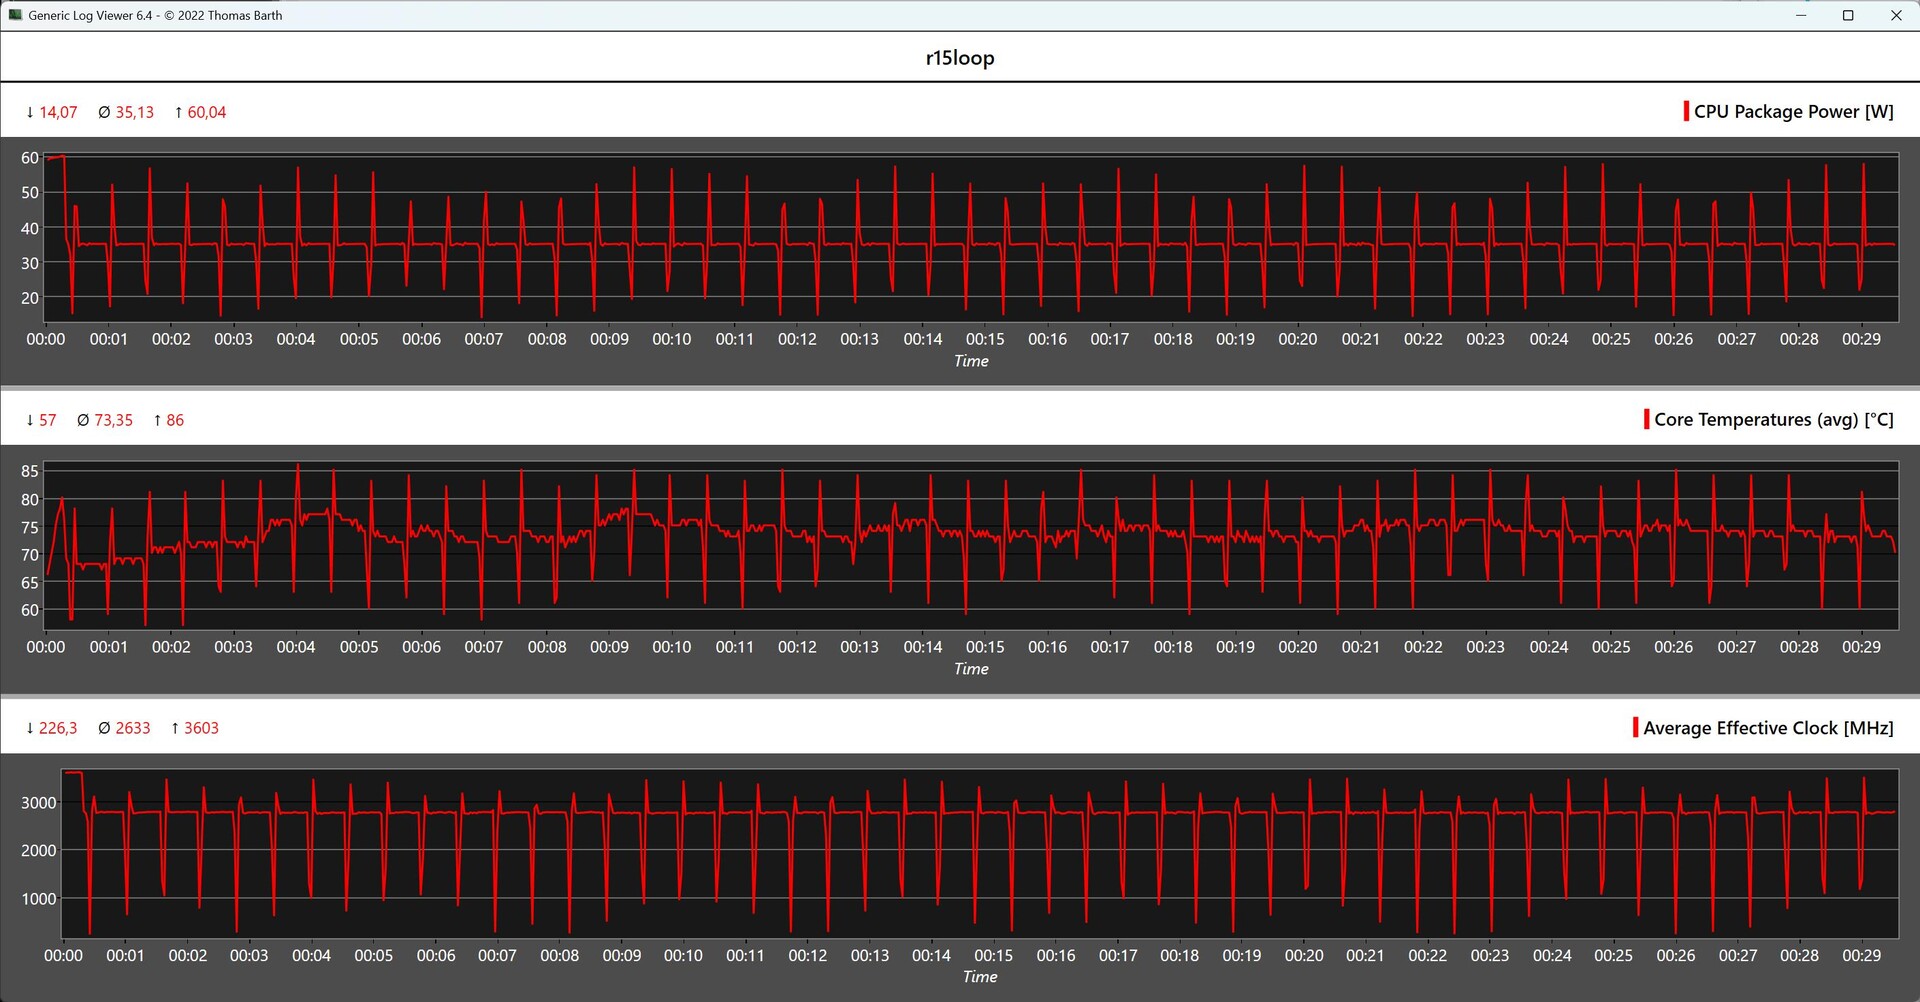
Geekom Mini IT12 vs. Cinebench-R15 Multi Loop
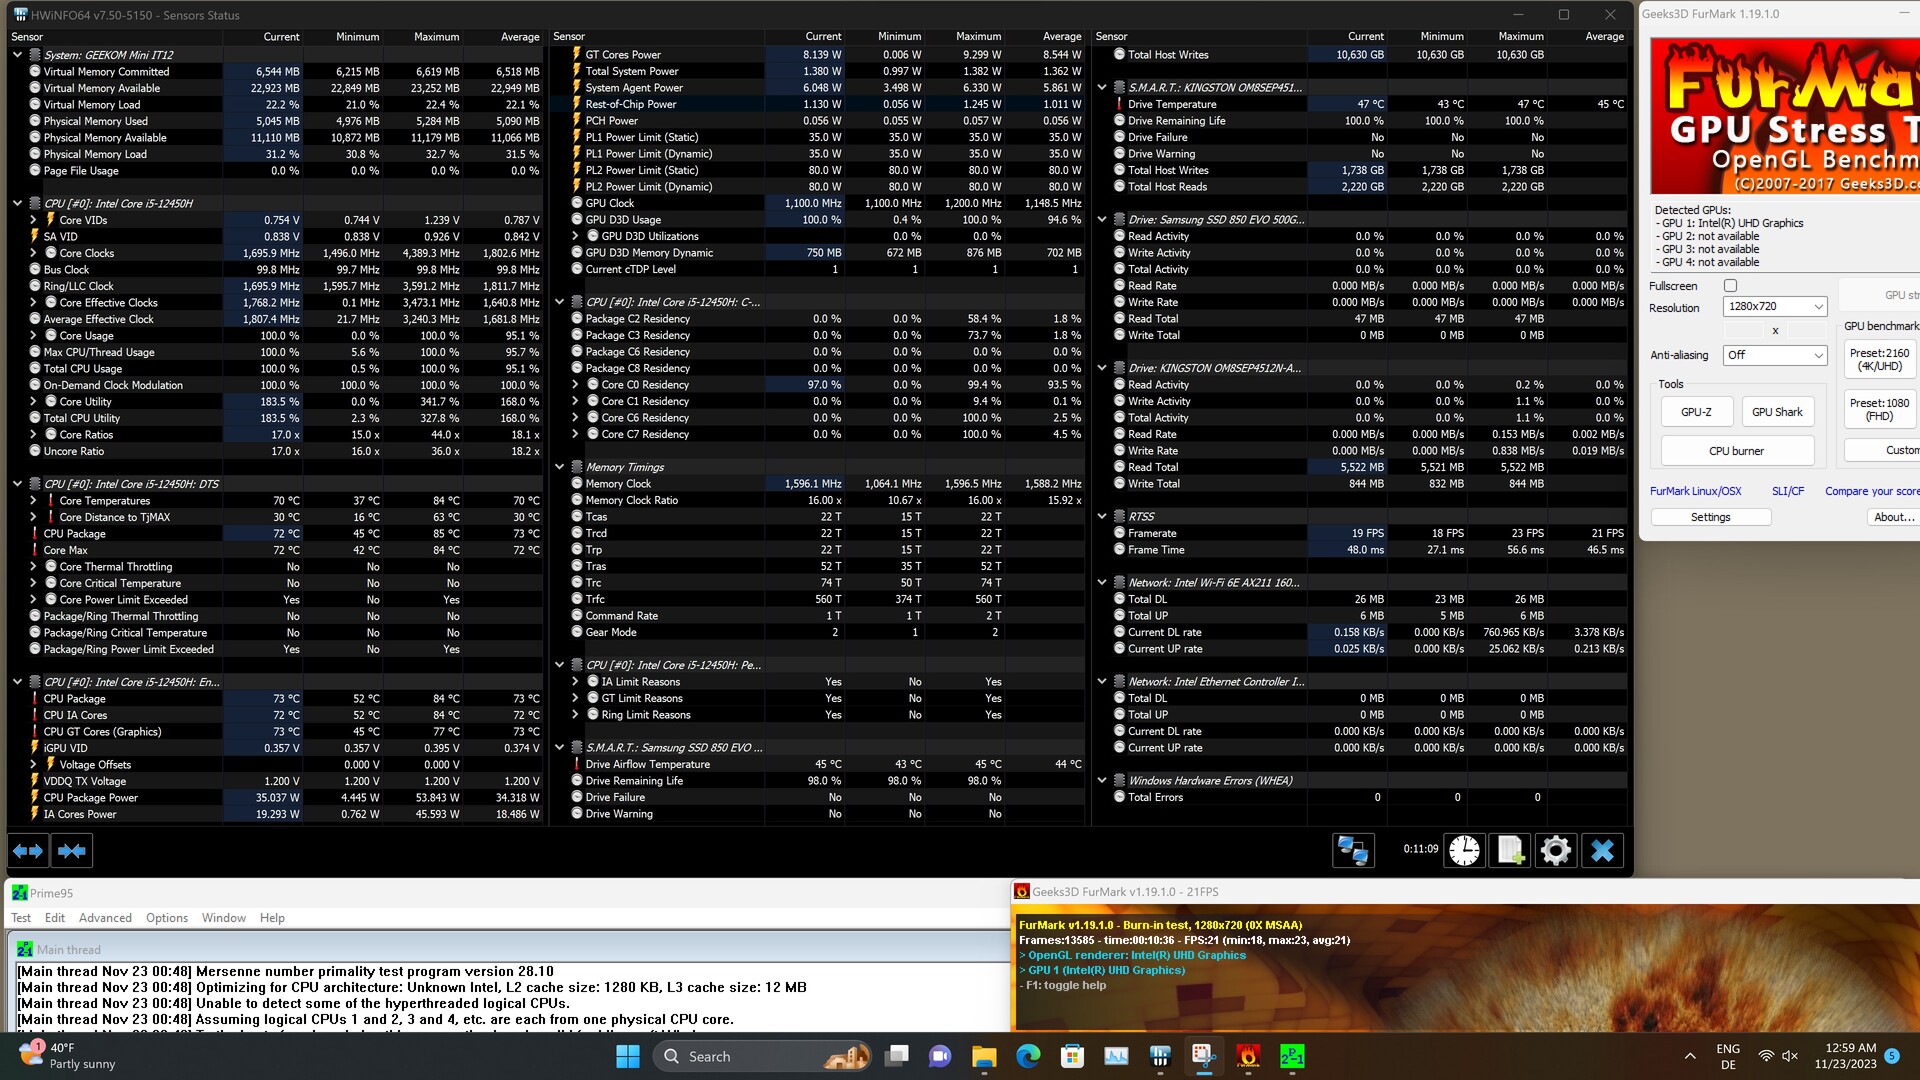
Nous avons étudié les performances du système de refroidissement intégré en conjonction avec l'objectif de puissance du processeur Intel Core i5-12450H à l'aide de Cinebench R15 Multi Loop. Les résultats suggèrent que les performances maximales du processeur ne sont disponibles qu'au début. Après la deuxième exécution, les performances diminuent considérablement, mais se stabilisent pour le reste du test. Notre gadget de test obtient la sixième place dans ce benchmark, avec un score moyen de 1 211 points.
Performance du système
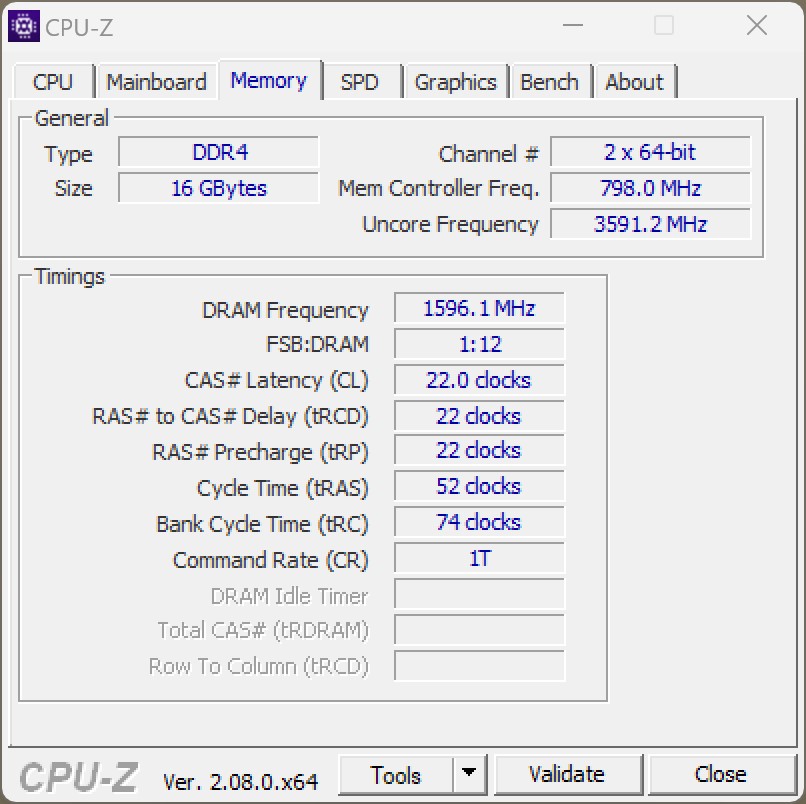
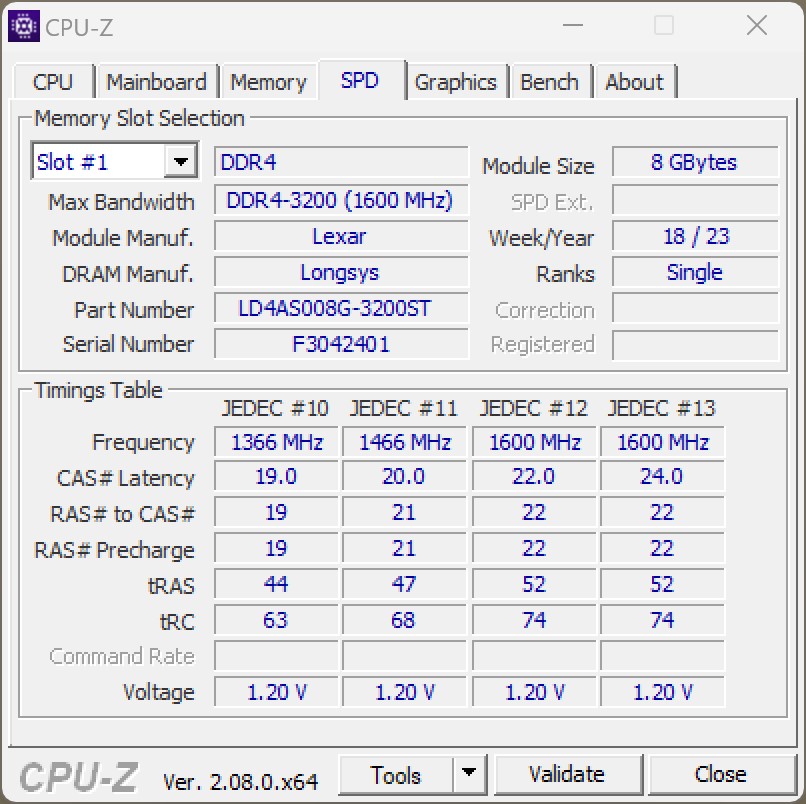
Les tests de performance du système dépeignent une image similaire à celle des tests de performance du processeur précédents. Une fois de plus, la Geekom Mini IT12 surpasse ses deux concurrentes, Minisforum Venus Series UN1245 et NiPoGi CK10. Lors des tests de mémoire vive, tous les appareils affichent des performances similaires, car aucun des fabricants ne s'est aventuré à installer une mémoire vive DDR5 plus rapide. Il convient de noter que le Intel Core i5-12450H prend en charge la RAM DDR5 avec des vitesses allant jusqu'à 5 200 MT/s.
| AIDA64 / Memory Copy | |
| Moyenne de la classe Mini PC (15933 - 163031, n=97, 2 dernières années) | |
| Intel NUC 13 Pro Kit NUC13ANK | |
| Geekom Mini IT12 | |
| Intel NUC 12 Pro Kit NUC12WSKi7 | |
| Geekom Mini IT12 | |
| NiPoGi CK10 | |
| Minisforum Venus Series UN1245 | |
| Minisforum Mars Series MC560 | |
| AIDA64 / Memory Read | |
| Moyenne de la classe Mini PC (14143 - 123769, n=97, 2 dernières années) | |
| Geekom Mini IT12 | |
| Geekom Mini IT12 | |
| NiPoGi CK10 | |
| Minisforum Venus Series UN1245 | |
| Intel NUC 12 Pro Kit NUC12WSKi7 | |
| Intel NUC 13 Pro Kit NUC13ANK | |
| Minisforum Mars Series MC560 | |
| AIDA64 / Memory Write | |
| Moyenne de la classe Mini PC (10630 - 216693, n=97, 2 dernières années) | |
| Geekom Mini IT12 | |
| NiPoGi CK10 | |
| Geekom Mini IT12 | |
| Minisforum Venus Series UN1245 | |
| Intel NUC 12 Pro Kit NUC12WSKi7 | |
| Intel NUC 13 Pro Kit NUC13ANK | |
| Minisforum Mars Series MC560 | |
| AIDA64 / Memory Latency | |
| Moyenne de la classe Mini PC (88.1 - 170, n=98, 2 dernières années) | |
| Minisforum Mars Series MC560 | |
| Intel NUC 13 Pro Kit NUC13ANK | |
| Intel NUC 12 Pro Kit NUC12WSKi7 | |
| Geekom Mini IT12 | |
| Minisforum Venus Series UN1245 | |
| NiPoGi CK10 | |
| Geekom Mini IT12 | |
* ... Moindre est la valeur, meilleures sont les performances
Latence DPC
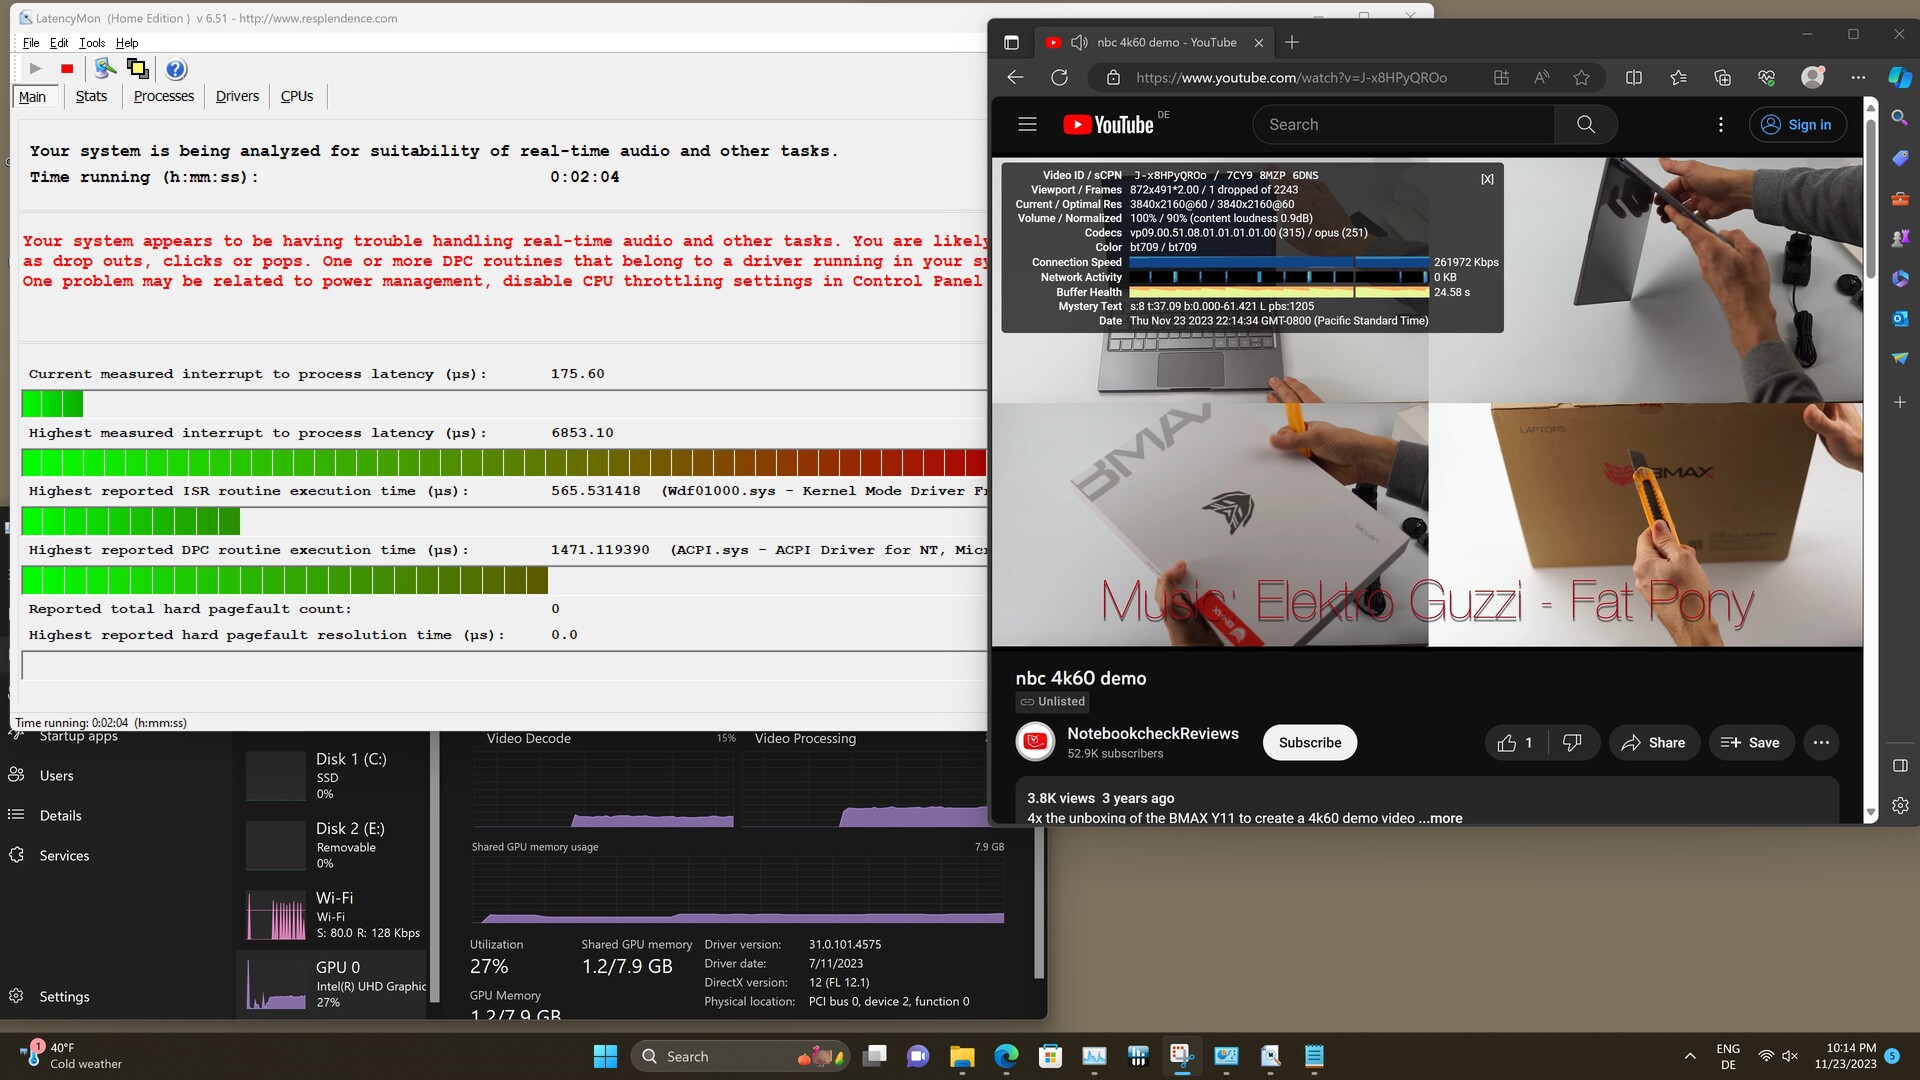
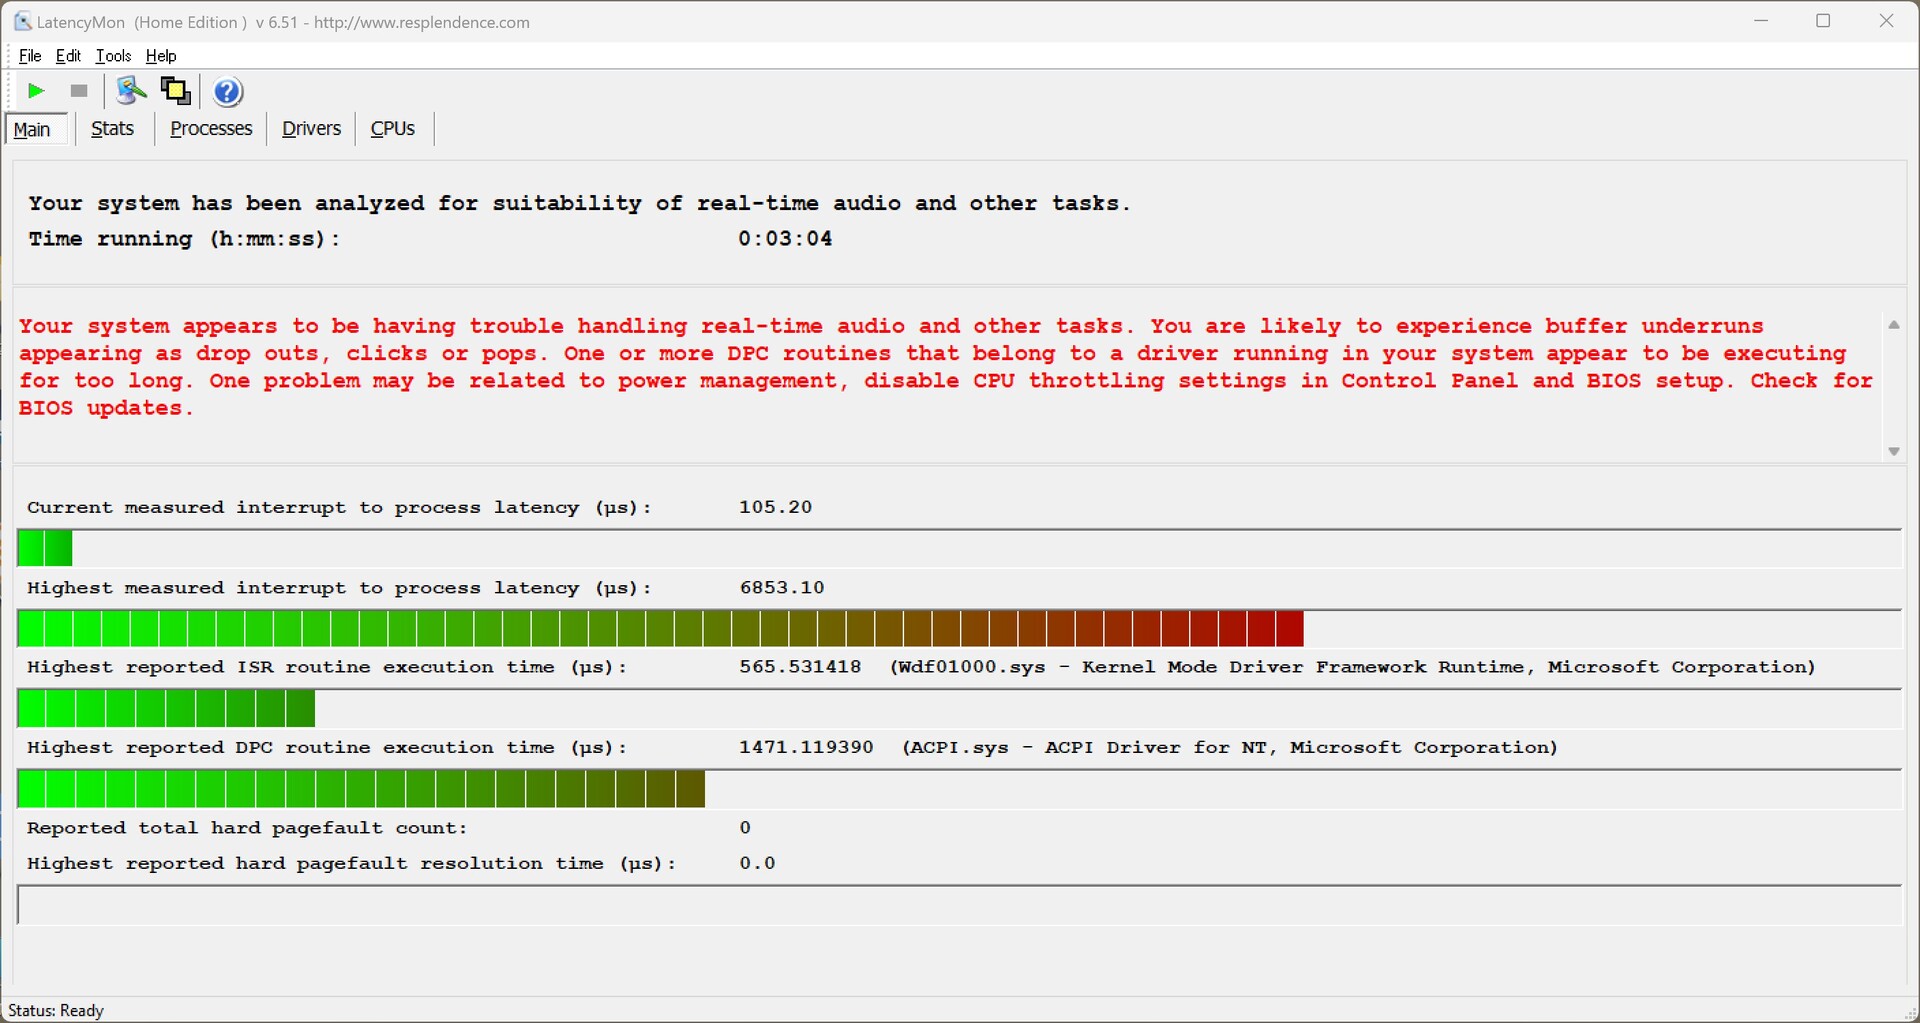
Le Geekom Mini IT12, basé sur le processeur Intel Core i5-12450Hn'est pas très performant en termes de latences DPC. LatencyMon montre des latences très élevées même en ouvrant plusieurs onglets dans le navigateur Edge. Heureusement, il n'y a pas de dégradation notable lors de la lecture de la vidéo de test 4K. Avec un faible nombre d'images perdues, la Geekom Mini IT12 peut toujours être utilisée comme client de streaming dans le salon, par exemple.
| DPC Latencies / LatencyMon - interrupt to process latency (max), Web, Youtube, Prime95 | |
| Geekom Mini IT12 | |
| Minisforum Mars Series MC560 | |
| Intel NUC 13 Pro Kit NUC13ANK | |
| Geekom Mini IT12 | |
| NiPoGi CK10 | |
| Intel NUC 12 Pro Kit NUC12WSKi7 | |
| Minisforum Venus Series UN1245 | |
* ... Moindre est la valeur, meilleures sont les performances
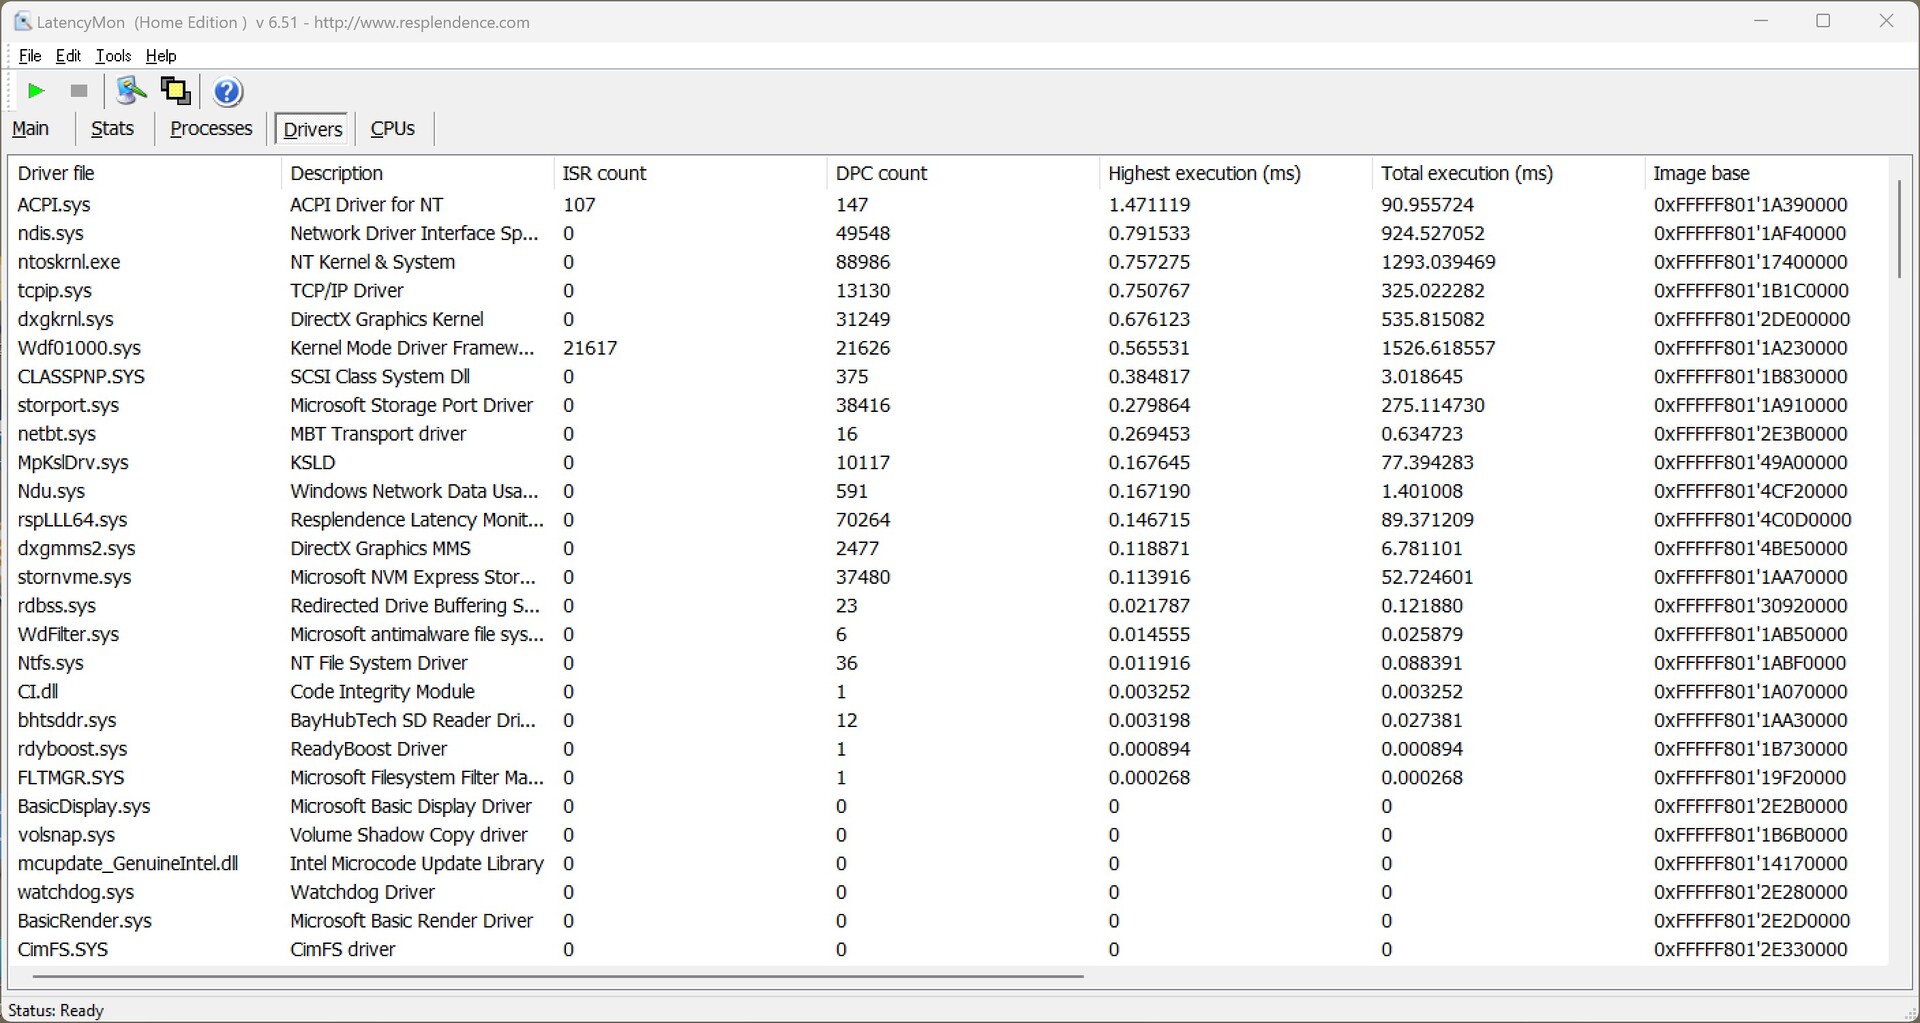
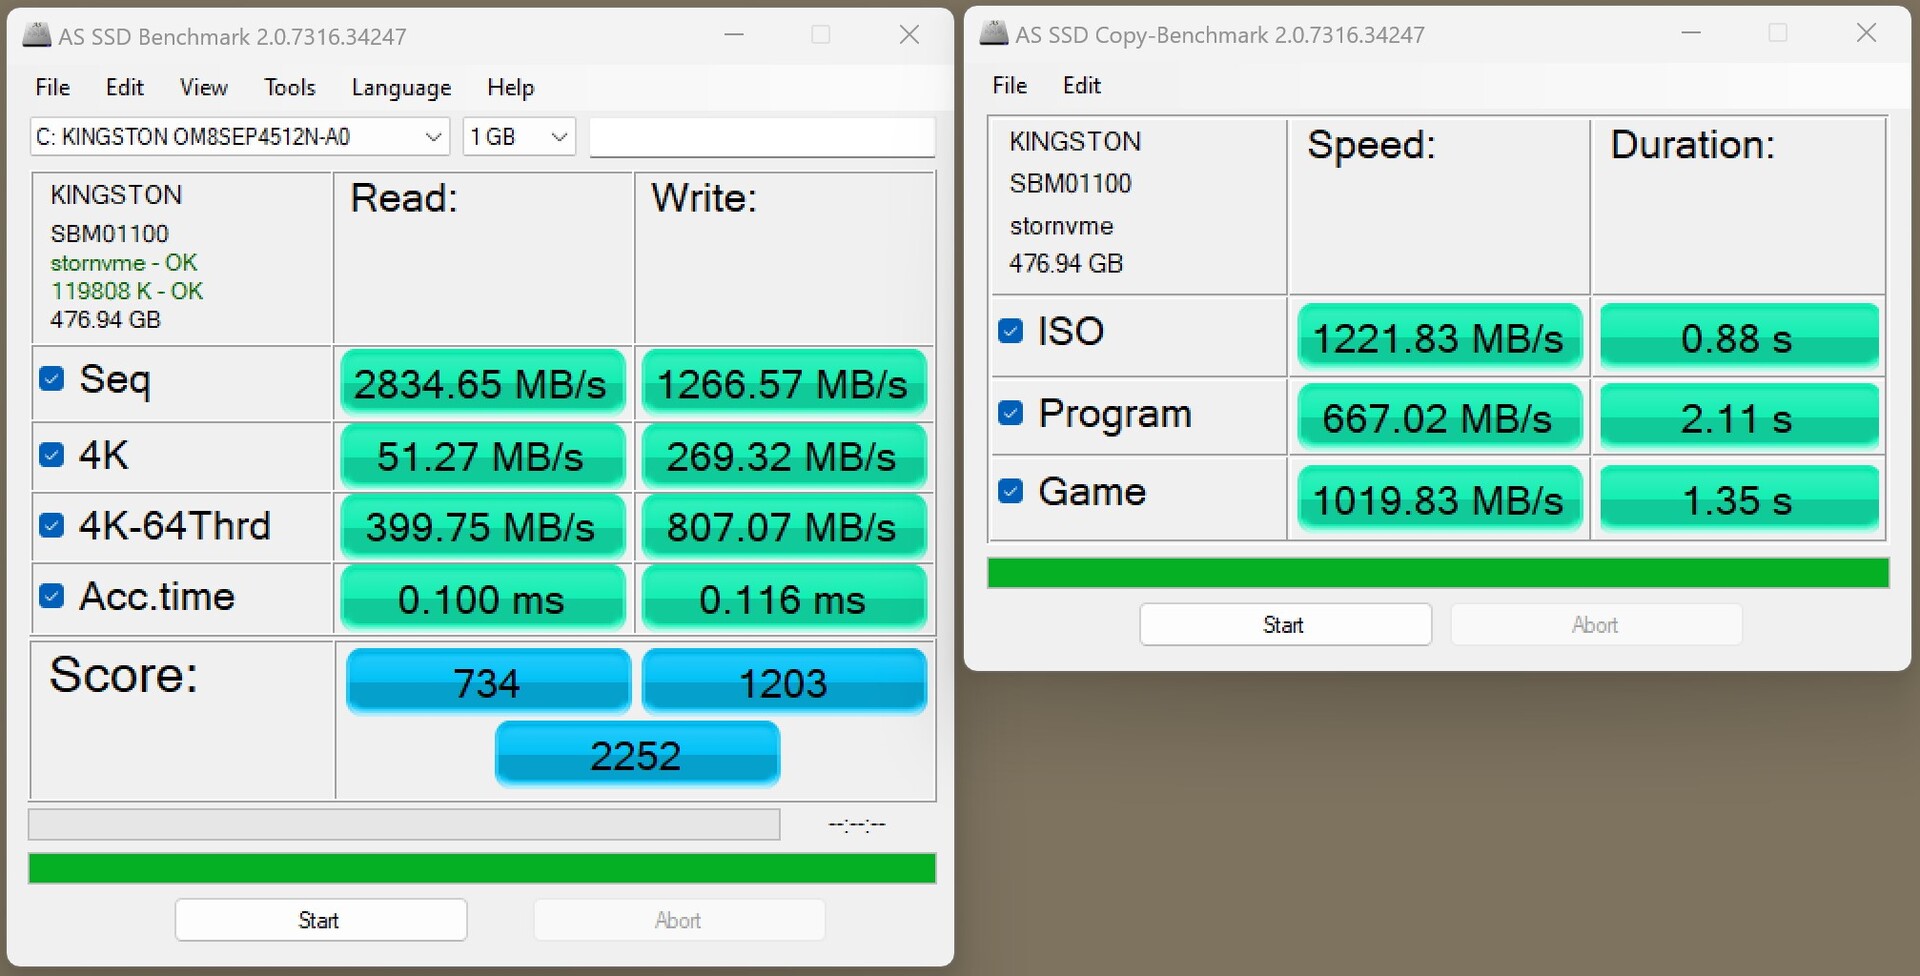
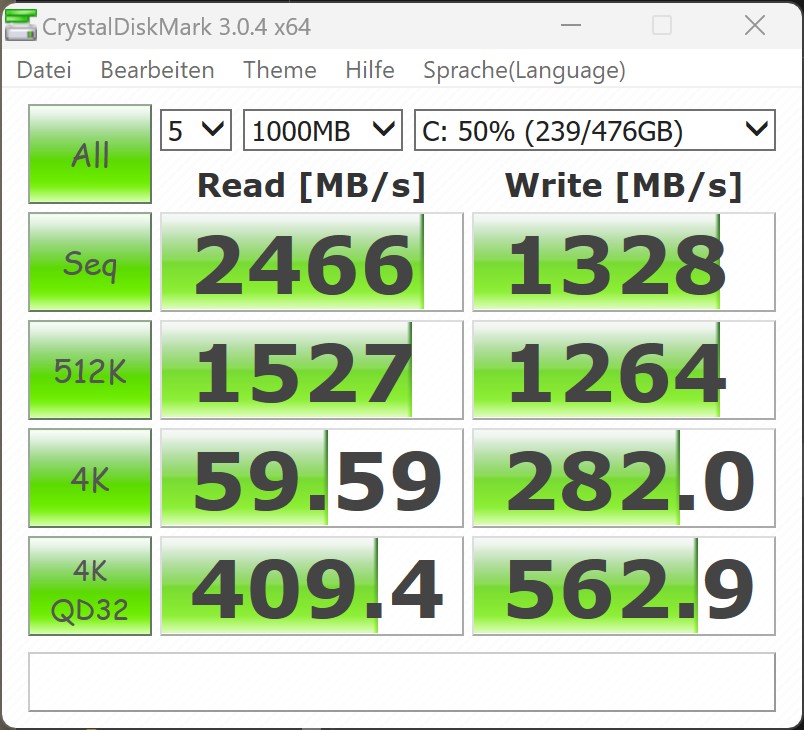
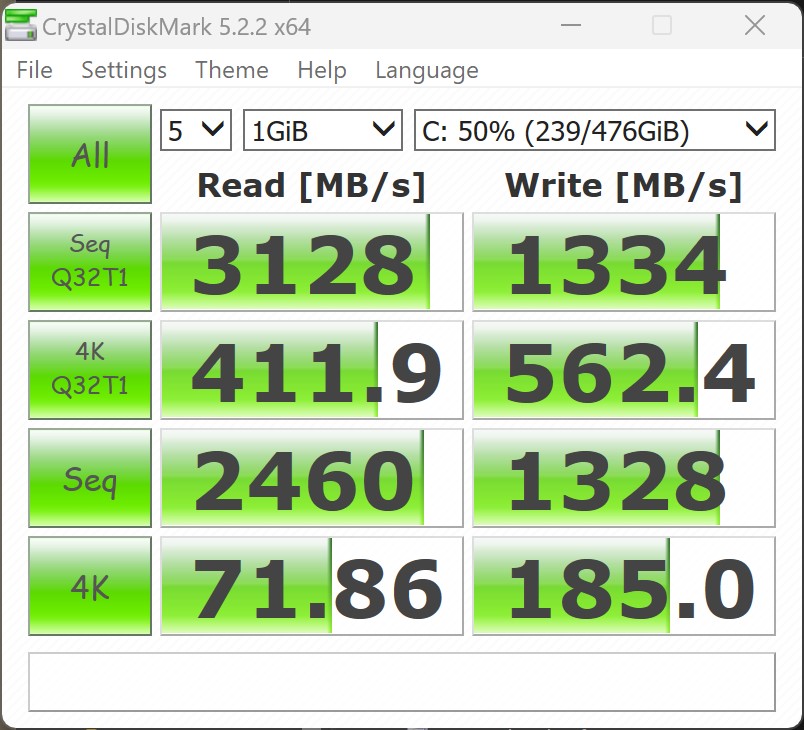
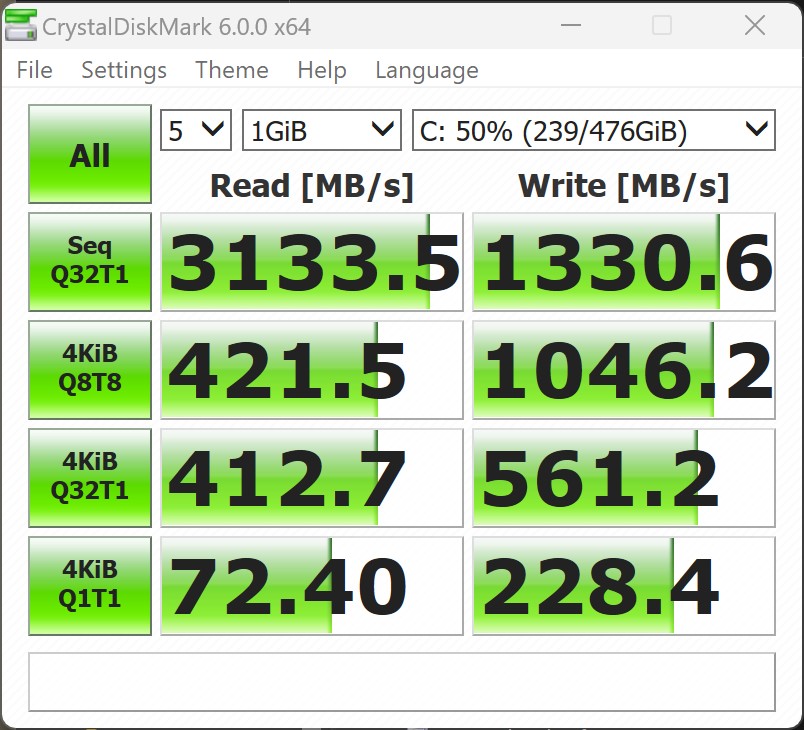
Dispositifs de stockage
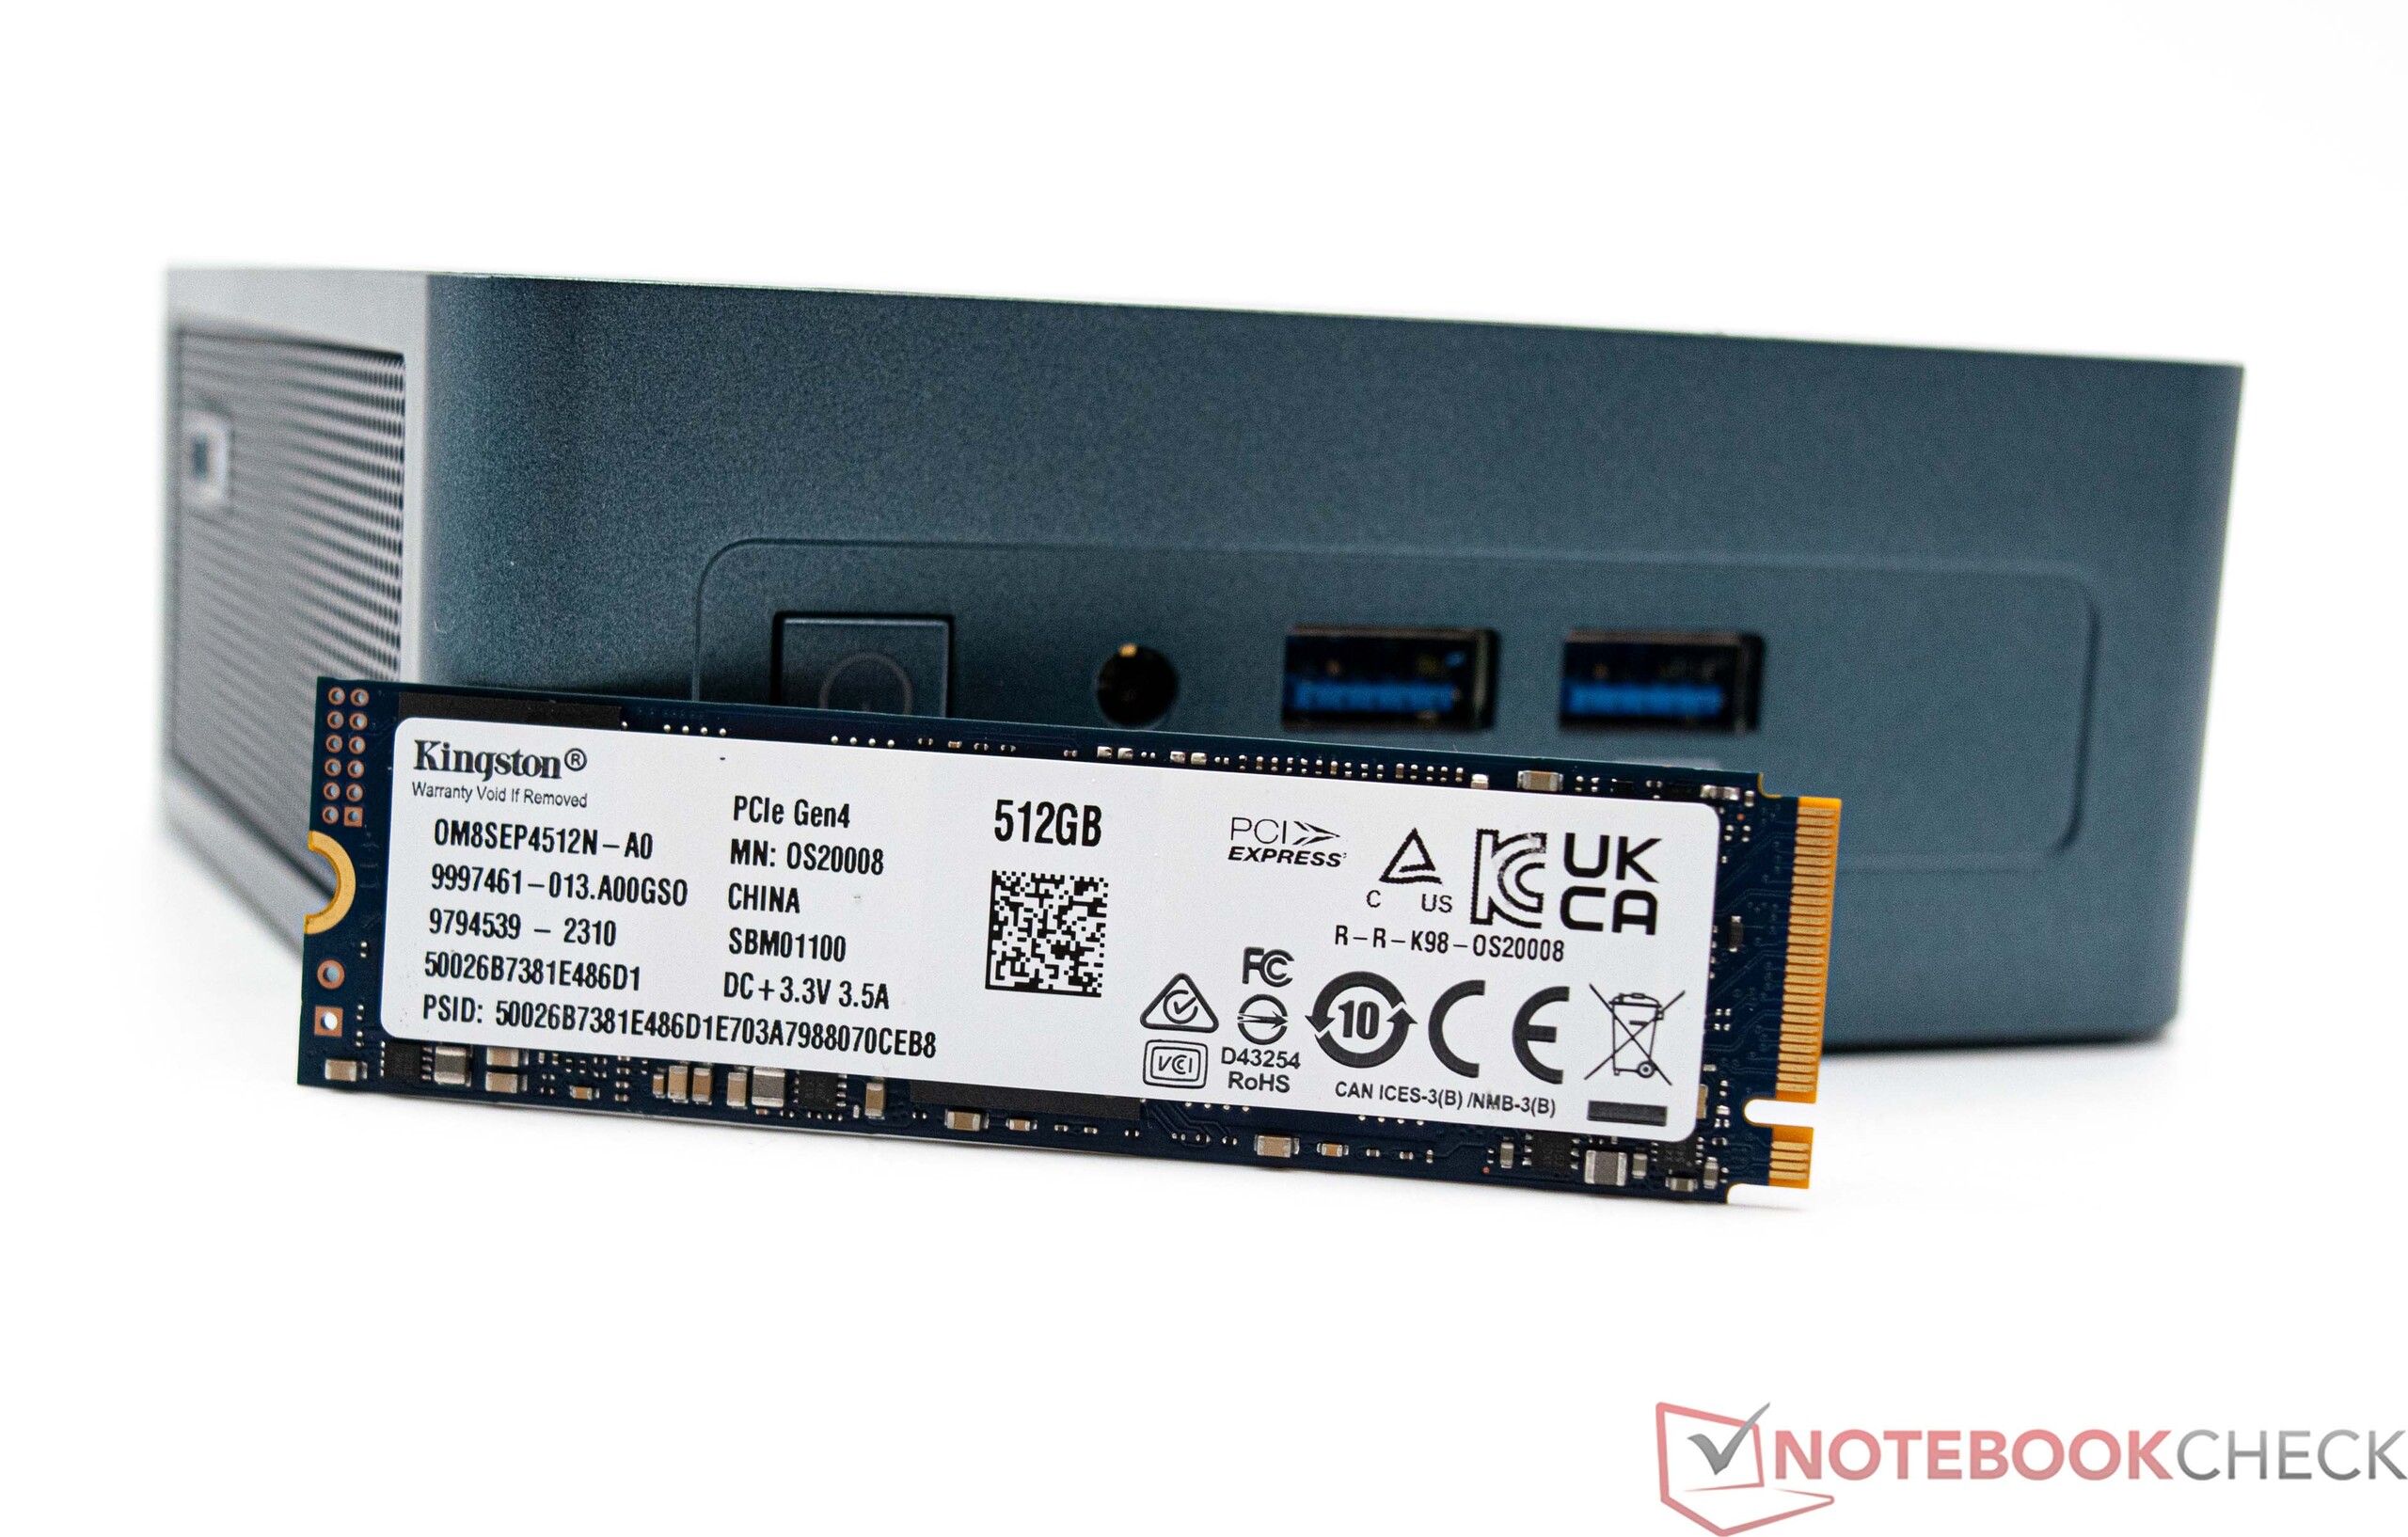
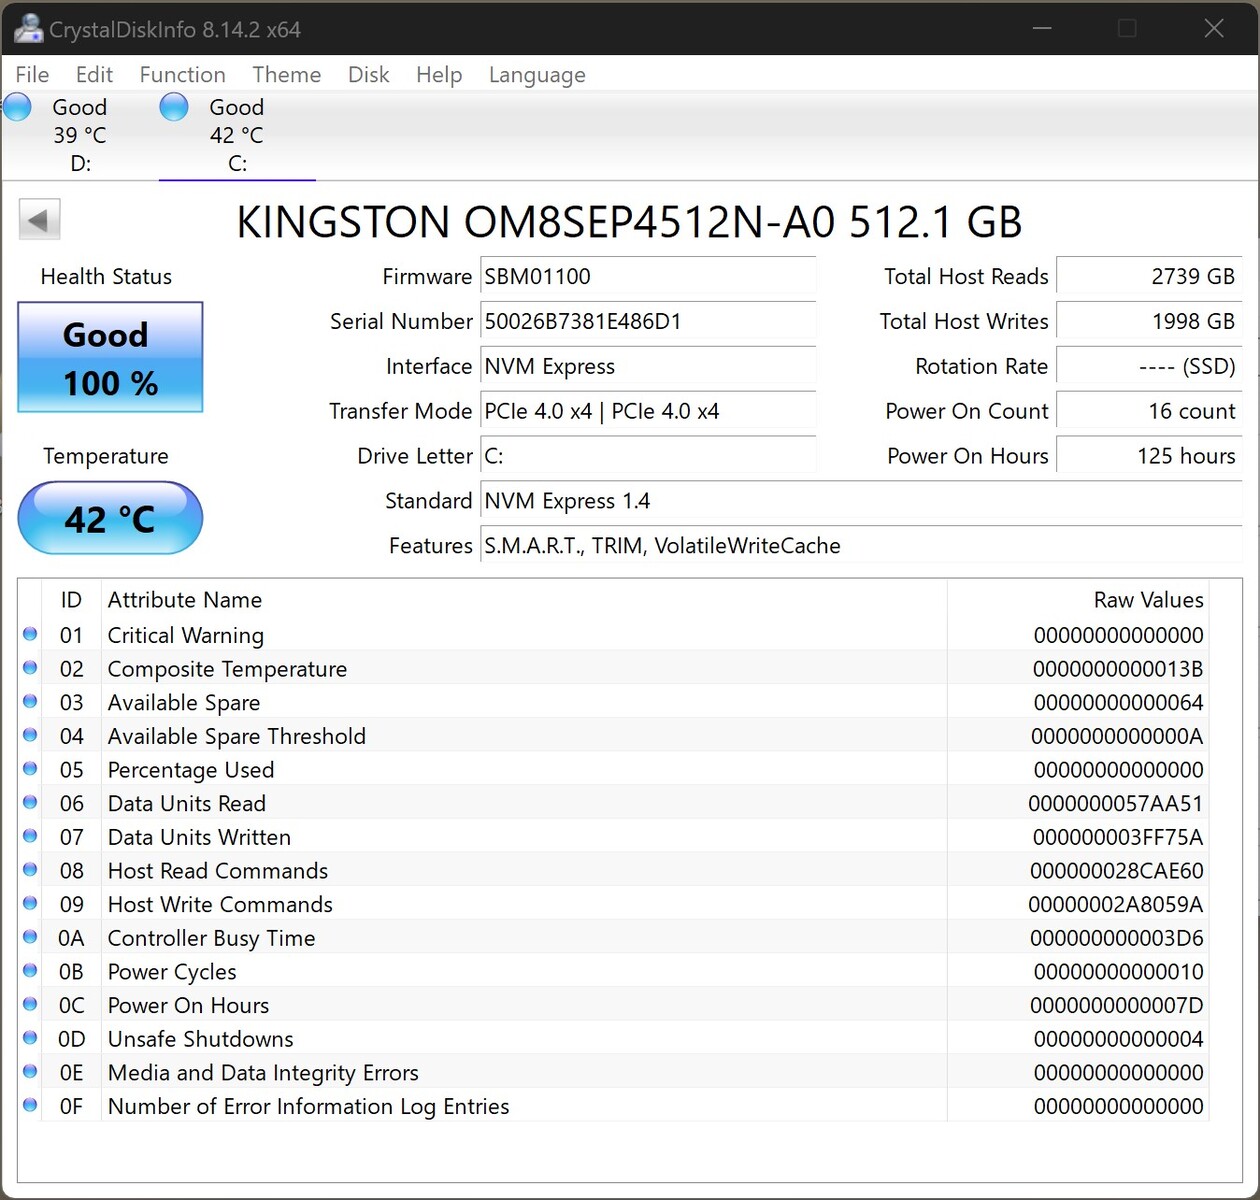
Geekom a équipé le Mini IT12 d'un SSD NVMe de 512 Go bien connu de Kingston, un modèle que nous avons déjà vu à l'œuvre dans d'autres systèmes. Ce SSD utilise l'interface NVMe, est équipé de mémoire QLC et est connecté à PCIe 4.0x4. Cependant, lors du test, le SSD est en retrait par rapport à ses concurrents, car certains d'entre eux sont équipés de SSD nettement plus rapides. Néanmoins, dans une utilisation quotidienne, il ne devrait pas y avoir de réduction notable des performances. Les taux d'écriture et de lecture sont suffisamment rapides, et l'installation des programmes de test s'est faite rapidement. Grâce au refroidissement passif via la plaque de base, le SSD supporte bien la charge continue, et nous n'avons pas remarqué de baisse de performance sous charge. Le Geekom Mini IT12 peut accueillir jusqu'à trois périphériques de stockage de masse, y compris un autre SSD au format M.2-2242 et un périphérique de stockage de masse de 2,5 pouces, en observant une hauteur maximale de 7 millimètres.
Pour d'autres comparaisons et benchmarks, veuillez vous référer à notre tableau comparatif.

* ... Moindre est la valeur, meilleures sont les performances
Dauerleistung Lesen: DiskSpd Read Loop, Queue Depth 8
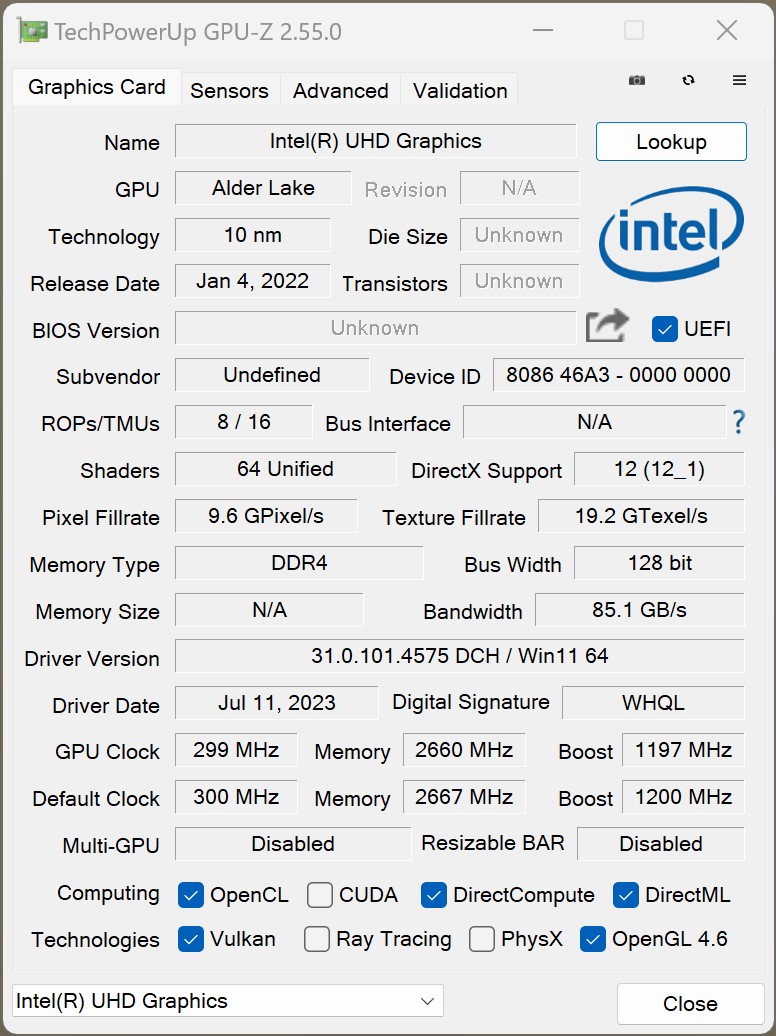
Carte graphique
Le Geekom Mini IT12 est doté d'un iGPU de base avec 64 UE et un processeur Intel UHD Graphics. L'unité graphique intégrée de notre échantillon de test est plus performante que l'unité graphique intégrée d'Intel Minisforum Venus Series UN1245 et le NiPoGi CK10. Cependant, il y a une différence significative entre ce modèle et le Geekom Mini IT12 avec Intel Core i7-1260P, car Intel inclut un iGPU avec 96 EUs dans les CPUs un peu plus rapides. Considérez La Radeon 680M d'AMD ou Radeon 780M d'AMD pour des performances nettement supérieures.
Vous trouverez d'autres comparaisons et benchmarks dans notre tableau de comparaison des GPU.
| Affinity Photo 2 - Combined (Single / Multi GPU) | |
| Intel NUC 13 Pro Kit NUC13ANK | |
| Geekom Mini IT12 | |
| Minisforum Venus Series UN1245 | |
| Geekom Mini IT12 | |
| NiPoGi CK10 | |
| Moyenne AMD Radeon 780M (1072 - 1889, n=21) | |
| Minisforum Mars Series MC560 | |
| Moyenne AMD Radeon 680M (555 - 2339, n=12) | |
| 3DMark 05 Standard | 37574 points | |
| 3DMark 06 Standard Score | 23680 points | |
| 3DMark Vantage P Result | 15554 points | |
| 3DMark 11 Performance | 4450 points | |
| 3DMark Ice Storm Standard Score | 111432 points | |
| 3DMark Cloud Gate Standard Score | 18265 points | |
| 3DMark Fire Strike Score | 2879 points | |
| 3DMark Fire Strike Extreme Score | 1348 points | |
| 3DMark Time Spy Score | 982 points | |
Aide | ||
Performances de jeu - iGPU
Les performances 3D médiocres de la carte Intel UHD Graphics ne rend pas les jeux 3D compliqués sur le Geekom Mini IT12 amusants. L'intérêt principal de ce petit PC n'est pas le jeu. Il y a des restrictions à jouer à des jeux occasionnels pour passer le temps. Si les performances de jeu sont une priorité, le Minisforum UM790 Pro avec AMD Radeon 780M ou le Geekom AS 6 avec AMD Ryzen 9 6900HX et une AMD Radeon 680M peuvent être de meilleurs choix. En outre, pour ceux qui recherchent un petit PC avec une carte graphique dédiée, le Minisforum HX77G et Minisforum NUCXi7 méritent d'être pris en considération.
| The Witcher 3 | |
| 1024x768 Low Graphics & Postprocessing | |
| Moyenne AMD Radeon 780M (74 - 163.3, n=49) | |
| Moyenne AMD Radeon 680M (67.4 - 150, n=31) | |
| Intel NUC 13 Pro Kit NUC13ANK | |
| Intel NUC 12 Pro Kit NUC12WSKi7 | |
| Geekom Mini IT12 | |
| Minisforum Mars Series MC560 | |
| Minisforum Venus Series UN1245 | |
| Geekom Mini IT12 | |
| NiPoGi CK10 | |
| 1920x1080 High Graphics & Postprocessing (Nvidia HairWorks Off) | |
| Moyenne AMD Radeon 780M (21.3 - 52.2, n=57) | |
| Moyenne AMD Radeon 680M (22.3 - 48, n=33) | |
| Intel NUC 13 Pro Kit NUC13ANK | |
| Geekom Mini IT12 | |
| Minisforum Mars Series MC560 | |
| Minisforum Venus Series UN1245 | |
| Geekom Mini IT12 | |
| NiPoGi CK10 | |
| Intel NUC 12 Pro Kit NUC12WSKi7 | |
| Bas | Moyen | Élevé | Ultra | |
|---|---|---|---|---|
| GTA V (2015) | 108.9 | 90.1 | 14.4 | 6.18 |
| The Witcher 3 (2015) | 60.8 | 37.5 | 20 | 10.2 |
| Dota 2 Reborn (2015) | 115.2 | 84.1 | 44.4 | 41 |
| X-Plane 11.11 (2018) | 36.8 | 24.4 | 21.9 | |
| Far Cry 5 (2018) | 36 | 17 | 16 | 15 |
| Strange Brigade (2018) | 63.4 | 25.1 | 19.9 | 16.8 |
| Shadow of the Tomb Raider (2018) | 34.2 | 15.3 | 14.1 | |
| Far Cry New Dawn (2019) | 35 | 17 | 16 | 15 |
| Metro Exodus (2019) | 27.5 | 12.9 | 9.61 | 7.86 |
| Borderlands 3 (2019) | 32.2 | 14.2 | 8.51 | 6.17 |
| F1 2021 (2021) | 69.2 | 31.1 | 24.8 | 16.1 |
| F1 22 (2022) | 27.3 | 24.5 | 17.5 | 13.5 |
| F1 23 (2023) | 24.6 | 22.1 | 15.2 |
performances 3D via eGPU-Dock avec Nvidia GeForce RTX 3060 Ti
La Geekom Mini IT12 disposant de deux ports USB 4, nous comparons ses performances à celles de la Razer Core X et d'une carte graphique Nvidia Nvidia GeForce RTX 3060 Ti. Avec ce combo, les performances 3D peuvent être considérablement améliorées. En raison de la contrainte de bande passante (PCIe x4 3.0), les performances de la carte graphique dédiée ne sont pas équivalentes à celles d'une machine de bureau traditionnelle. Lors du test, nous avons constaté que les performances étaient comparables à celles d'autres mini-PC évalués avec les mêmes accessoires. Pour l'essentiel, ce combo fonctionne à merveille. Avec cet accessoire, de nombreux jeux peuvent être joués en douceur, avec des taux de rafraîchissement acceptables et un maximum de détails.
| Performance rating - Percent | |
| Intel NUC 13 Pro Kit NUC13ANK (Nvidia GeForce RTX 3060 Ti FE TB3) | |
| Geekom Mini IT12 (Nvidia GeForce RTX 3060 Ti FE TB3) | |
| Geekbench Mini IT12 (Nvidia GeForce RTX 3060 Ti FE) | |
| Morefine M600 (Nvidia GeForce RTX 3060 Ti FE TB3) | |
| Minisforum Venus Series UM690 (Nvidia GeForce RTX 3060 Ti FE TB3) | |
| Minisforum Venus Series UM790 Pro (Nvidia GeForce RTX 3060 Ti FE TB3) | |
| Ace Magician AM08Pro (Nvidia GeForce RTX 3060 Ti FE TB3) | |
| 3DMark 11 - 1280x720 Performance GPU | |
| Geekbench Mini IT12 (Nvidia GeForce RTX 3060 Ti FE) | |
| Intel NUC 13 Pro Kit NUC13ANK (Nvidia GeForce RTX 3060 Ti FE TB3) | |
| Geekom Mini IT12 (Nvidia GeForce RTX 3060 Ti FE TB3) | |
| Minisforum Venus Series UM790 Pro (Nvidia GeForce RTX 3060 Ti FE TB3) | |
| Morefine M600 (Nvidia GeForce RTX 3060 Ti FE TB3) | |
| Ace Magician AM08Pro (Nvidia GeForce RTX 3060 Ti FE TB3) | |
| Minisforum Venus Series UM690 (Nvidia GeForce RTX 3060 Ti FE TB3) | |
| 3DMark | |
| 2560x1440 Time Spy Graphics | |
| Geekbench Mini IT12 (Nvidia GeForce RTX 3060 Ti FE) | |
| Intel NUC 13 Pro Kit NUC13ANK (Nvidia GeForce RTX 3060 Ti FE TB3) | |
| Geekom Mini IT12 (Nvidia GeForce RTX 3060 Ti FE TB3) | |
| Morefine M600 (Nvidia GeForce RTX 3060 Ti FE TB3) | |
| Minisforum Venus Series UM790 Pro (Nvidia GeForce RTX 3060 Ti FE TB3) | |
| Ace Magician AM08Pro (Nvidia GeForce RTX 3060 Ti FE TB3) | |
| Minisforum Venus Series UM690 (Nvidia GeForce RTX 3060 Ti FE TB3) | |
| 1920x1080 Fire Strike Graphics | |
| Intel NUC 13 Pro Kit NUC13ANK (Nvidia GeForce RTX 3060 Ti FE TB3) | |
| Geekbench Mini IT12 (Nvidia GeForce RTX 3060 Ti FE) | |
| Geekom Mini IT12 (Nvidia GeForce RTX 3060 Ti FE TB3) | |
| Morefine M600 (Nvidia GeForce RTX 3060 Ti FE TB3) | |
| Ace Magician AM08Pro (Nvidia GeForce RTX 3060 Ti FE TB3) | |
| Minisforum Venus Series UM790 Pro (Nvidia GeForce RTX 3060 Ti FE TB3) | |
| Minisforum Venus Series UM690 (Nvidia GeForce RTX 3060 Ti FE TB3) | |
| 3840x2160 Fire Strike Ultra Graphics | |
| Geekbench Mini IT12 (Nvidia GeForce RTX 3060 Ti FE) | |
| Geekom Mini IT12 (Nvidia GeForce RTX 3060 Ti FE TB3) | |
| Morefine M600 (Nvidia GeForce RTX 3060 Ti FE TB3) | |
| Intel NUC 13 Pro Kit NUC13ANK (Nvidia GeForce RTX 3060 Ti FE TB3) | |
| Minisforum Venus Series UM790 Pro (Nvidia GeForce RTX 3060 Ti FE TB3) | |
| Ace Magician AM08Pro (Nvidia GeForce RTX 3060 Ti FE TB3) | |
| Minisforum Venus Series UM690 (Nvidia GeForce RTX 3060 Ti FE TB3) | |
| Unigine Superposition | |
| 1280x720 720p Low | |
| Minisforum Venus Series UM790 Pro (Nvidia GeForce RTX 3060 Ti FE TB3) | |
| Intel NUC 13 Pro Kit NUC13ANK (Nvidia GeForce RTX 3060 Ti FE TB3) | |
| Geekom Mini IT12 (Nvidia GeForce RTX 3060 Ti FE TB3) | |
| Minisforum Venus Series UM690 (Nvidia GeForce RTX 3060 Ti FE TB3) | |
| Ace Magician AM08Pro (Nvidia GeForce RTX 3060 Ti FE TB3) | |
| Morefine M600 (Nvidia GeForce RTX 3060 Ti FE TB3) | |
| Geekbench Mini IT12 (Nvidia GeForce RTX 3060 Ti FE) | |
| 1920x1080 1080p High | |
| Intel NUC 13 Pro Kit NUC13ANK (Nvidia GeForce RTX 3060 Ti FE TB3) | |
| Geekbench Mini IT12 (Nvidia GeForce RTX 3060 Ti FE) | |
| Geekom Mini IT12 (Nvidia GeForce RTX 3060 Ti FE TB3) | |
| Morefine M600 (Nvidia GeForce RTX 3060 Ti FE TB3) | |
| Minisforum Venus Series UM690 (Nvidia GeForce RTX 3060 Ti FE TB3) | |
| Ace Magician AM08Pro (Nvidia GeForce RTX 3060 Ti FE TB3) | |
| Minisforum Venus Series UM790 Pro (Nvidia GeForce RTX 3060 Ti FE TB3) | |
| 1920x1080 1080p Extreme | |
| Geekom Mini IT12 (Nvidia GeForce RTX 3060 Ti FE TB3) | |
| Intel NUC 13 Pro Kit NUC13ANK (Nvidia GeForce RTX 3060 Ti FE TB3) | |
| Geekbench Mini IT12 (Nvidia GeForce RTX 3060 Ti FE) | |
| Morefine M600 (Nvidia GeForce RTX 3060 Ti FE TB3) | |
| Minisforum Venus Series UM690 (Nvidia GeForce RTX 3060 Ti FE TB3) | |
| Ace Magician AM08Pro (Nvidia GeForce RTX 3060 Ti FE TB3) | |
| Minisforum Venus Series UM790 Pro (Nvidia GeForce RTX 3060 Ti FE TB3) | |
| 3840x2160 4k Optimized | |
| Geekom Mini IT12 (Nvidia GeForce RTX 3060 Ti FE TB3) | |
| Intel NUC 13 Pro Kit NUC13ANK (Nvidia GeForce RTX 3060 Ti FE TB3) | |
| Geekbench Mini IT12 (Nvidia GeForce RTX 3060 Ti FE) | |
| Morefine M600 (Nvidia GeForce RTX 3060 Ti FE TB3) | |
| Minisforum Venus Series UM690 (Nvidia GeForce RTX 3060 Ti FE TB3) | |
| Ace Magician AM08Pro (Nvidia GeForce RTX 3060 Ti FE TB3) | |
| Minisforum Venus Series UM790 Pro (Nvidia GeForce RTX 3060 Ti FE TB3) | |
| 7680x4320 8k Optimized | |
| Geekom Mini IT12 (Nvidia GeForce RTX 3060 Ti FE TB3) | |
| Morefine M600 (Nvidia GeForce RTX 3060 Ti FE TB3) | |
| Geekbench Mini IT12 (Nvidia GeForce RTX 3060 Ti FE) | |
| Intel NUC 13 Pro Kit NUC13ANK (Nvidia GeForce RTX 3060 Ti FE TB3) | |
| Minisforum Venus Series UM690 (Nvidia GeForce RTX 3060 Ti FE TB3) | |
| Ace Magician AM08Pro (Nvidia GeForce RTX 3060 Ti FE TB3) | |
| Minisforum Venus Series UM790 Pro (Nvidia GeForce RTX 3060 Ti FE TB3) | |
| Unigine Valley 1.0 | |
| 1920x1080 Extreme HD DirectX AA:x8 | |
| Intel NUC 13 Pro Kit NUC13ANK (Nvidia GeForce RTX 3060 Ti FE TB3) | |
| Geekom Mini IT12 (Nvidia GeForce RTX 3060 Ti FE TB3) | |
| Geekbench Mini IT12 (Nvidia GeForce RTX 3060 Ti FE) | |
| Minisforum Venus Series UM690 (Nvidia GeForce RTX 3060 Ti FE TB3) | |
| Minisforum Venus Series UM790 Pro (Nvidia GeForce RTX 3060 Ti FE TB3) | |
| Morefine M600 (Nvidia GeForce RTX 3060 Ti FE TB3) | |
| Ace Magician AM08Pro (Nvidia GeForce RTX 3060 Ti FE TB3) | |
| 1920x1080 Extreme HD Preset OpenGL AA:x8 | |
| Geekbench Mini IT12 (Nvidia GeForce RTX 3060 Ti FE) | |
| Intel NUC 13 Pro Kit NUC13ANK (Nvidia GeForce RTX 3060 Ti FE TB3) | |
| Geekom Mini IT12 (Nvidia GeForce RTX 3060 Ti FE TB3) | |
| Minisforum Venus Series UM690 (Nvidia GeForce RTX 3060 Ti FE TB3) | |
| Morefine M600 (Nvidia GeForce RTX 3060 Ti FE TB3) | |
| Ace Magician AM08Pro (Nvidia GeForce RTX 3060 Ti FE TB3) | |
| Minisforum Venus Series UM790 Pro (Nvidia GeForce RTX 3060 Ti FE TB3) | |
| Unigine Heaven 4.0 | |
| Extreme Preset OpenGL | |
| Intel NUC 13 Pro Kit NUC13ANK (Nvidia GeForce RTX 3060 Ti FE TB3) | |
| Geekom Mini IT12 (Nvidia GeForce RTX 3060 Ti FE TB3) | |
| Geekbench Mini IT12 (Nvidia GeForce RTX 3060 Ti FE) | |
| Minisforum Venus Series UM690 (Nvidia GeForce RTX 3060 Ti FE TB3) | |
| Morefine M600 (Nvidia GeForce RTX 3060 Ti FE TB3) | |
| Ace Magician AM08Pro (Nvidia GeForce RTX 3060 Ti FE TB3) | |
| Minisforum Venus Series UM790 Pro (Nvidia GeForce RTX 3060 Ti FE TB3) | |
| Extreme Preset DX11 | |
| Intel NUC 13 Pro Kit NUC13ANK (Nvidia GeForce RTX 3060 Ti FE TB3) | |
| Geekom Mini IT12 (Nvidia GeForce RTX 3060 Ti FE TB3) | |
| Geekbench Mini IT12 (Nvidia GeForce RTX 3060 Ti FE) | |
| Minisforum Venus Series UM690 (Nvidia GeForce RTX 3060 Ti FE TB3) | |
| Morefine M600 (Nvidia GeForce RTX 3060 Ti FE TB3) | |
| Ace Magician AM08Pro (Nvidia GeForce RTX 3060 Ti FE TB3) | |
| Minisforum Venus Series UM790 Pro (Nvidia GeForce RTX 3060 Ti FE TB3) | |
| ComputeMark v2.1 | |
| 1024x600 Normal, Score | |
| Geekom Mini IT12 (Nvidia GeForce RTX 3060 Ti FE TB3) | |
| Morefine M600 (Nvidia GeForce RTX 3060 Ti FE TB3) | |
| Minisforum Venus Series UM790 Pro (Nvidia GeForce RTX 3060 Ti FE TB3) | |
| Intel NUC 13 Pro Kit NUC13ANK (Nvidia GeForce RTX 3060 Ti FE TB3) | |
| Minisforum Venus Series UM690 (Nvidia GeForce RTX 3060 Ti FE TB3) | |
| Geekbench Mini IT12 (Nvidia GeForce RTX 3060 Ti FE) | |
| Ace Magician AM08Pro (Nvidia GeForce RTX 3060 Ti FE TB3) | |
| 1024x600 Normal, Fluid 3DTex | |
| Morefine M600 (Nvidia GeForce RTX 3060 Ti FE TB3) | |
| Intel NUC 13 Pro Kit NUC13ANK (Nvidia GeForce RTX 3060 Ti FE TB3) | |
| Geekom Mini IT12 (Nvidia GeForce RTX 3060 Ti FE TB3) | |
| Geekbench Mini IT12 (Nvidia GeForce RTX 3060 Ti FE) | |
| Minisforum Venus Series UM790 Pro (Nvidia GeForce RTX 3060 Ti FE TB3) | |
| Minisforum Venus Series UM690 (Nvidia GeForce RTX 3060 Ti FE TB3) | |
| Ace Magician AM08Pro (Nvidia GeForce RTX 3060 Ti FE TB3) | |
| 1024x600 Normal, Fluid 2DTexArr | |
| Morefine M600 (Nvidia GeForce RTX 3060 Ti FE TB3) | |
| Geekom Mini IT12 (Nvidia GeForce RTX 3060 Ti FE TB3) | |
| Minisforum Venus Series UM690 (Nvidia GeForce RTX 3060 Ti FE TB3) | |
| Intel NUC 13 Pro Kit NUC13ANK (Nvidia GeForce RTX 3060 Ti FE TB3) | |
| Minisforum Venus Series UM790 Pro (Nvidia GeForce RTX 3060 Ti FE TB3) | |
| Geekbench Mini IT12 (Nvidia GeForce RTX 3060 Ti FE) | |
| Ace Magician AM08Pro (Nvidia GeForce RTX 3060 Ti FE TB3) | |
| 1024x600 Normal, Mandel Vector | |
| Geekom Mini IT12 (Nvidia GeForce RTX 3060 Ti FE TB3) | |
| Minisforum Venus Series UM790 Pro (Nvidia GeForce RTX 3060 Ti FE TB3) | |
| Intel NUC 13 Pro Kit NUC13ANK (Nvidia GeForce RTX 3060 Ti FE TB3) | |
| Morefine M600 (Nvidia GeForce RTX 3060 Ti FE TB3) | |
| Minisforum Venus Series UM690 (Nvidia GeForce RTX 3060 Ti FE TB3) | |
| Geekbench Mini IT12 (Nvidia GeForce RTX 3060 Ti FE) | |
| Ace Magician AM08Pro (Nvidia GeForce RTX 3060 Ti FE TB3) | |
| 1024x600 Normal, Mandel Scalar | |
| Geekom Mini IT12 (Nvidia GeForce RTX 3060 Ti FE TB3) | |
| Morefine M600 (Nvidia GeForce RTX 3060 Ti FE TB3) | |
| Minisforum Venus Series UM790 Pro (Nvidia GeForce RTX 3060 Ti FE TB3) | |
| Intel NUC 13 Pro Kit NUC13ANK (Nvidia GeForce RTX 3060 Ti FE TB3) | |
| Minisforum Venus Series UM690 (Nvidia GeForce RTX 3060 Ti FE TB3) | |
| Geekbench Mini IT12 (Nvidia GeForce RTX 3060 Ti FE) | |
| Ace Magician AM08Pro (Nvidia GeForce RTX 3060 Ti FE TB3) | |
| 1024x600 Normal, QJuliaRayTrace | |
| Geekom Mini IT12 (Nvidia GeForce RTX 3060 Ti FE TB3) | |
| Intel NUC 13 Pro Kit NUC13ANK (Nvidia GeForce RTX 3060 Ti FE TB3) | |
| Minisforum Venus Series UM790 Pro (Nvidia GeForce RTX 3060 Ti FE TB3) | |
| Morefine M600 (Nvidia GeForce RTX 3060 Ti FE TB3) | |
| Minisforum Venus Series UM690 (Nvidia GeForce RTX 3060 Ti FE TB3) | |
| Geekbench Mini IT12 (Nvidia GeForce RTX 3060 Ti FE) | |
| Ace Magician AM08Pro (Nvidia GeForce RTX 3060 Ti FE TB3) | |
| Performance rating - Percent | |
| Intel NUC 13 Pro Kit NUC13ANK (Nvidia GeForce RTX 3060 Ti FE TB3) | |
| Geekom Mini IT12 (Nvidia GeForce RTX 3060 Ti FE TB3) | |
| Geekom AS 6 (Nvidia GeForce RTX 3060 Ti FE TB3) | |
| Minisforum Venus Series UM790 Pro (Nvidia GeForce RTX 3060 Ti FE TB3) | |
| Ace Magician AM08Pro (Nvidia GeForce RTX 3060 Ti FE TB3) | |
| Geekbench Mini IT12 (Nvidia GeForce RTX 3060 Ti FE) | |
| GTA V - 1920x1080 Highest AA:4xMSAA + FX AF:16x | |
| Intel NUC 13 Pro Kit NUC13ANK (Nvidia GeForce RTX 3060 Ti FE TB3) | |
| Geekom Mini IT12 (Nvidia GeForce RTX 3060 Ti FE TB3) | |
| Geekom AS 6 (Nvidia GeForce RTX 3060 Ti FE TB3) | |
| Ace Magician AM08Pro (Nvidia GeForce RTX 3060 Ti FE TB3) | |
| Geekbench Mini IT12 (Nvidia GeForce RTX 3060 Ti FE) | |
| Minisforum Venus Series UM790 Pro (Nvidia GeForce RTX 3060 Ti FE TB3) | |
| The Witcher 3 - 1920x1080 Ultra Graphics & Postprocessing (HBAO+) | |
| Intel NUC 13 Pro Kit NUC13ANK (Nvidia GeForce RTX 3060 Ti FE TB3) | |
| Geekom Mini IT12 (Nvidia GeForce RTX 3060 Ti FE TB3) | |
| Geekbench Mini IT12 (Nvidia GeForce RTX 3060 Ti FE) | |
| Geekom AS 6 (Nvidia GeForce RTX 3060 Ti FE TB3) | |
| Minisforum Venus Series UM790 Pro (Nvidia GeForce RTX 3060 Ti FE TB3) | |
| Ace Magician AM08Pro (Nvidia GeForce RTX 3060 Ti FE TB3) | |
| Dota 2 Reborn - 1920x1080 ultra (3/3) best looking | |
| Minisforum Venus Series UM790 Pro (Nvidia GeForce RTX 3060 Ti FE TB3) | |
| Intel NUC 13 Pro Kit NUC13ANK (Nvidia GeForce RTX 3060 Ti FE TB3) | |
| Geekom Mini IT12 (Nvidia GeForce RTX 3060 Ti FE TB3) | |
| Geekom AS 6 (Nvidia GeForce RTX 3060 Ti FE TB3) | |
| Geekbench Mini IT12 (Nvidia GeForce RTX 3060 Ti FE) | |
| Ace Magician AM08Pro (Nvidia GeForce RTX 3060 Ti FE TB3) | |
| Final Fantasy XV Benchmark - 1920x1080 High Quality | |
| Geekom AS 6 (Nvidia GeForce RTX 3060 Ti FE TB3) | |
| Intel NUC 13 Pro Kit NUC13ANK (Nvidia GeForce RTX 3060 Ti FE TB3) | |
| Geekom Mini IT12 (Nvidia GeForce RTX 3060 Ti FE TB3) | |
| Minisforum Venus Series UM790 Pro (Nvidia GeForce RTX 3060 Ti FE TB3) | |
| Ace Magician AM08Pro (Nvidia GeForce RTX 3060 Ti FE TB3) | |
| Geekbench Mini IT12 (Nvidia GeForce RTX 3060 Ti FE) | |
| Strange Brigade - 1920x1080 ultra AA:ultra AF:16 | |
| Geekom AS 6 (Nvidia GeForce RTX 3060 Ti FE TB3) | |
| Intel NUC 13 Pro Kit NUC13ANK (Nvidia GeForce RTX 3060 Ti FE TB3) | |
| Geekom Mini IT12 (Nvidia GeForce RTX 3060 Ti FE TB3) | |
| Minisforum Venus Series UM790 Pro (Nvidia GeForce RTX 3060 Ti FE TB3) | |
| Ace Magician AM08Pro (Nvidia GeForce RTX 3060 Ti FE TB3) | |
| Geekbench Mini IT12 (Nvidia GeForce RTX 3060 Ti FE) | |
| Far Cry 5 - 1920x1080 Ultra Preset AA:T | |
| Intel NUC 13 Pro Kit NUC13ANK (Nvidia GeForce RTX 3060 Ti FE TB3) | |
| Minisforum Venus Series UM790 Pro (Nvidia GeForce RTX 3060 Ti FE TB3) | |
| Geekom Mini IT12 (Nvidia GeForce RTX 3060 Ti FE TB3) | |
| Ace Magician AM08Pro (Nvidia GeForce RTX 3060 Ti FE TB3) | |
| Geekom AS 6 (Nvidia GeForce RTX 3060 Ti FE TB3) | |
| Geekbench Mini IT12 (Nvidia GeForce RTX 3060 Ti FE) | |
| Far Cry New Dawn - 1920x1080 Ultra Preset | |
| Geekbench Mini IT12 (Nvidia GeForce RTX 3060 Ti FE) | |
| Intel NUC 13 Pro Kit NUC13ANK (Nvidia GeForce RTX 3060 Ti FE TB3) | |
| Minisforum Venus Series UM790 Pro (Nvidia GeForce RTX 3060 Ti FE TB3) | |
| Geekom Mini IT12 (Nvidia GeForce RTX 3060 Ti FE TB3) | |
| Ace Magician AM08Pro (Nvidia GeForce RTX 3060 Ti FE TB3) | |
| Geekom AS 6 (Nvidia GeForce RTX 3060 Ti FE TB3) | |
| Borderlands 3 - 1920x1080 Badass Overall Quality (DX11) | |
| Geekom Mini IT12 (Nvidia GeForce RTX 3060 Ti FE TB3) | |
| Intel NUC 13 Pro Kit NUC13ANK (Nvidia GeForce RTX 3060 Ti FE TB3) | |
| Geekom AS 6 (Nvidia GeForce RTX 3060 Ti FE TB3) | |
| Minisforum Venus Series UM790 Pro (Nvidia GeForce RTX 3060 Ti FE TB3) | |
| Ace Magician AM08Pro (Nvidia GeForce RTX 3060 Ti FE TB3) | |
| Geekbench Mini IT12 (Nvidia GeForce RTX 3060 Ti FE) | |
| F1 22 - 1920x1080 Ultra High Preset AA:T AF:16x | |
| Geekom AS 6 (Nvidia GeForce RTX 3060 Ti FE TB3) | |
| Intel NUC 13 Pro Kit NUC13ANK (Nvidia GeForce RTX 3060 Ti FE TB3) | |
| Geekbench Mini IT12 (Nvidia GeForce RTX 3060 Ti FE) | |
| Geekom Mini IT12 (Nvidia GeForce RTX 3060 Ti FE TB3) | |
| Minisforum Venus Series UM790 Pro (Nvidia GeForce RTX 3060 Ti FE TB3) | |
| Ace Magician AM08Pro (Nvidia GeForce RTX 3060 Ti FE TB3) | |
| Tiny Tina's Wonderlands - 1920x1080 Badass Preset (DX12) | |
| Geekom AS 6 (Nvidia GeForce RTX 3060 Ti FE TB3) | |
| Geekom Mini IT12 (Nvidia GeForce RTX 3060 Ti FE TB3) | |
| Intel NUC 13 Pro Kit NUC13ANK (Nvidia GeForce RTX 3060 Ti FE TB3) | |
| Minisforum Venus Series UM790 Pro (Nvidia GeForce RTX 3060 Ti FE TB3) | |
| Ace Magician AM08Pro (Nvidia GeForce RTX 3060 Ti FE TB3) | |
| Geekbench Mini IT12 (Nvidia GeForce RTX 3060 Ti FE) | |
| Shadow of the Tomb Raider - 1920x1080 Highest Preset AA:T | |
| Geekom AS 6 (Nvidia GeForce RTX 3060 Ti FE TB3) | |
| Geekom Mini IT12 (Nvidia GeForce RTX 3060 Ti FE TB3) | |
| Geekbench Mini IT12 (Nvidia GeForce RTX 3060 Ti FE) | |
| Intel NUC 13 Pro Kit NUC13ANK (Nvidia GeForce RTX 3060 Ti FE TB3) | |
| Minisforum Venus Series UM790 Pro (Nvidia GeForce RTX 3060 Ti FE TB3) | |
| Ace Magician AM08Pro (Nvidia GeForce RTX 3060 Ti FE TB3) | |
| Metro Exodus - 1920x1080 Ultra Quality AF:16x | |
| Intel NUC 13 Pro Kit NUC13ANK (Nvidia GeForce RTX 3060 Ti FE TB3) | |
| Geekom Mini IT12 (Nvidia GeForce RTX 3060 Ti FE TB3) | |
| Geekom AS 6 (Nvidia GeForce RTX 3060 Ti FE TB3) | |
| Minisforum Venus Series UM790 Pro (Nvidia GeForce RTX 3060 Ti FE TB3) | |
| Ace Magician AM08Pro (Nvidia GeForce RTX 3060 Ti FE TB3) | |
| Geekbench Mini IT12 (Nvidia GeForce RTX 3060 Ti FE) | |
| God of War - 1920x1080 Ultra Preset | |
| Geekom Mini IT12 (Nvidia GeForce RTX 3060 Ti FE TB3) | |
| Geekom AS 6 (Nvidia GeForce RTX 3060 Ti FE TB3) | |
| Intel NUC 13 Pro Kit NUC13ANK (Nvidia GeForce RTX 3060 Ti FE TB3) | |
| Minisforum Venus Series UM790 Pro (Nvidia GeForce RTX 3060 Ti FE TB3) | |
| Geekbench Mini IT12 (Nvidia GeForce RTX 3060 Ti FE) | |
| Ace Magician AM08Pro (Nvidia GeForce RTX 3060 Ti FE TB3) | |
| Bas | Moyen | Élevé | Ultra | QHD | 4K | |
|---|---|---|---|---|---|---|
| GTA V (2015) | 175 | 169.3 | 152.3 | 91.6 | 86.9 | 102.8 |
| The Witcher 3 (2015) | 286 | 212 | 153.9 | 73.5 | 63.6 | 72.9 |
| Dota 2 Reborn (2015) | 155.9 | 138.1 | 127.2 | 120.9 | 102.6 | |
| Final Fantasy XV Benchmark (2018) | 144.7 | 87.9 | 64.1 | 43.5 | 23.7 | |
| Far Cry 5 (2018) | 127 | 89 | 84 | 80 | 50 | 24 |
| Strange Brigade (2018) | 176.3 | 121.6 | 112.2 | 107.6 | 74.1 | 32.8 |
| Shadow of the Tomb Raider (2018) | 145.3 | 102.6 | 100.1 | 92.8 | 76.1 | 50.1 |
| Far Cry New Dawn (2019) | 130 | 115 | 110 | 100 | 94 | 60 |
| Metro Exodus (2019) | 111.3 | 53.6 | 49.2 | 40.3 | 31.5 | 19.9 |
| Borderlands 3 (2019) | 121.8 | 82.5 | 65.6 | 55.9 | 38.8 | 21.5 |
| F1 2020 (2020) | 194.1 | 115.2 | 119.8 | 101.7 | 90.7 | 60 |
| F1 2021 (2021) | 138.2 | 107.2 | 69.4 | 52.5 | 48.7 | 41.3 |
| Far Cry 6 (2021) | 67.7 | 53.3 | 45.5 | 40.2 | 32.8 | |
| God of War (2022) | 108.1 | 97.6 | 81.6 | 60.2 | 53.6 | 39.9 |
| GRID Legends (2022) | 81 | 64.4 | 55.5 | 50.7 | 39 | 23.6 |
| Tiny Tina's Wonderlands (2022) | 103.7 | 84.3 | 64.2 | 55.2 | 39.2 | 21.8 |
| F1 22 (2022) | 60.2 | 55 | 42.6 | 27.9 | 26.1 | 19.7 |
| F1 23 (2023) | 66.8 | 65.4 | 54.1 | 33.5 | 31.2 | 17.7 |
| Intel UHD Graphics 64EUs (Alder Lake 12th Gen) i5-12450H | i5-12450H | Intel Arc A770 R9 7950X | NVIDIA GeForce RTX 2060 Super (Desktop) R9 7950X | NVIDIA GeForce RTX 2070 Super (Desktop) R9 7950X | NVIDIA GeForce RTX 3060 Ti R9 7950X | NVIDIA GeForce RTX 4060 R9 7950X | NVIDIA GeForce RTX 4060 Ti 16G R9 7950X | NVIDIA GeForce RTX 4070 R9 7950X | NVIDIA GeForce RTX 4070 Ti R9 7950X | AMD Radeon RX 7600 R9 7950X | AMD Radeon RX 7700 XT R9 7950X | AMD Radeon RX 7800 XT R9 7950X | AMD Radeon RX 7900 GRE R9 7950X | AMD Radeon RX 6600 R9 7950X | AMD Radeon RX 6650 XT R9 7950X | AMD Radeon RX 6700 XT R9 7950X | AMD Radeon RX 6750 XT R9 7950X | Moyenne de la classe Mini PC | |
|---|---|---|---|---|---|---|---|---|---|---|---|---|---|---|---|---|---|---|---|
| SPECviewperf 12 | 1223% | 581% | 1056% | 1178% | 1354% | 1401% | 1888% | 2558% | 3571% | 2212% | 2928% | 3380% | 3586% | 2436% | 2953% | 3231% | 2707% | 1630% | |
| 1900x1060 3ds Max (3dsmax-05) (fps) | 29.8 | 147 393% | 179 501% | 220 638% | 247 729% | 297 897% | 251 742% | 290 873% | 382 1182% | 436 1363% | 279 836% | 373 1152% | 427 1333% | 444 1390% | 258 766% | 310 940% | 363 1118% | 377 1165% | 149.4 ? 401% |
| 1900x1060 Catia (catia-04) (fps) | 22.9 | 115 402% | 174 660% | 84.5 269% | 114 398% | 114 398% | 113 393% | 128 459% | 161 603% | 192 738% | 273 1092% | 351 1433% | 386 1586% | 448 1856% | 256 1018% | 314 1271% | 339 1380% | 360 1472% | 142.7 ? 523% |
| 1900x1060 Creo (creo-01) (fps) | 17.7 | 59.7 237% | 45.3 156% | 58.8 232% | 65.7 271% | 65.2 268% | 60.6 242% | 73.4 315% | 89.1 403% | 99.4 462% | 115 550% | 123 595% | 148 736% | 155 776% | 133 651% | 142 702% | 152 759% | 154 770% | 66.4 ? 275% |
| 1900x1060 Energy (energy-01) (fps) | 0.24 | 13.4 5483% | 2.44 917% | 11.6 4733% | 12.4 5067% | 14.4 5900% | 15.9 6525% | 22.6 9317% | 31.7 13108% | 48 19900% | 25.5 10525% | 33.4 13817% | 38.4 15900% | 40.3 16692% | 31.3 12942% | 37.6 15567% | 40.6 16817% | 30.1 12442% | 22.2 ? 9150% |
| 1900x1060 Maya (maya-04) (fps) | 22.8 | 203 790% | 183 703% | 200 777% | 225 887% | 251 1001% | 233 922% | 257 1027% | 284 1146% | 287 1159% | 236 935% | 283 1141% | 304 1233% | 323 1317% | 218 856% | 246 979% | 268 1075% | 277 1115% | 128.8 ? 465% |
| 1900x1060 Medical (medical-01) (fps) | 5.07 | 73.5 1350% | 46.7 821% | 49.5 876% | 55.9 1003% | 65.6 1194% | 82.4 1525% | 110 2070% | 132 2504% | 157 2997% | 128 2425% | 177 3391% | 200 3845% | 226 4358% | 102 1912% | 137 2602% | 150 2859% | 144 2740% | 79.8 ? 1474% |
| 1900x1060 Showcase (showcase-01) (fps) | 13.2 | 149 1029% | 119 802% | 121 817% | 135 923% | 150 1036% | 109 726% | 132 900% | 190 1339% | 244 1748% | 127 862% | 179 1256% | 235 1680% | 222 1582% | 125 847% | 151 1044% | 176 1233% | 186 1309% | 85.5 ? 548% |
| 1900x1060 Solidworks (sw-03) (fps) | 38.9 | 78.3 101% | 73.4 89% | 79.7 105% | 95.1 144% | 93.5 140% | 91.2 134% | 95.1 144% | 109 180% | 118 203% | 221 468% | 288 640% | 322 728% | 319 720% | 232 496% | 242 522% | 275 607% | 290 646% | 118.4 ? 204% |
| SPECviewperf 13 | 968% | 900% | 836% | 972% | 1081% | 1120% | 1395% | 1784% | 2251% | 2347% | 3236% | 3803% | 4102% | 1434% | 1814% | 2240% | 2534% | 1260% | |
| 3ds Max (3dsmax-06) (fps) | 29.6 | 147 397% | 179 505% | 218 636% | 247 734% | 297 903% | 252 751% | 289 876% | 381 1187% | 433 1363% | 280 846% | 371 1153% | 434 1366% | 439 1383% | 258 772% | 310 947% | 360 1116% | 379 1180% | 145.4 ? 391% |
| Catia (catia-05) (fps) | 32.7 | 163 398% | 260 695% | 119 264% | 163 398% | 167 411% | 163 398% | 189 478% | 241 637% | 290 787% | 410 1154% | 529 1518% | 588 1698% | 661 1921% | 387 1083% | 482 1374% | 528 1515% | 565 1628% | 195.5 ? 498% |
| Creo (creo-02) (fps) | 26.5 | 230 768% | 90 240% | 203 666% | 240 806% | 243 817% | 230 768% | 301 1036% | 375 1315% | 455 1617% | 294 1009% | 387 1360% | 442 1568% | 470 1674% | 279 953% | 317 1096% | 353 1232% | 389 1368% | 161.8 ? 511% |
| Energy (energy-02) (fps) | 0.94 | 25.8 2645% | 22.5 2294% | 21.9 2230% | 23.8 2432% | 26.1 2677% | 34.6 3581% | 45.3 4719% | 54.2 5666% | 72.8 7645% | 82.9 8719% | 115 12134% | 139 14687% | 150 15857% | 44 4581% | 59.8 6262% | 74.3 7804% | 80.6 8474% | 40.2 ? 4177% |
| Maya (maya-05) (fps) | 32.2 | 355 1002% | 319 891% | 291 804% | 344 968% | 372 1055% | 343 965% | 403 1152% | 510 1484% | 591 1735% | 333 934% | 487 1412% | 548 1602% | 580 1701% | 348 981% | 403 1152% | 462 1335% | 482 1397% | 204 ? 534% |
| Medical (medical-02) (fps) | 4.49 | 65.3 1354% | 80.8 1700% | 54.2 1107% | 63.7 1319% | 74.3 1555% | 76.5 1604% | 85.1 1795% | 112 2394% | 132 2840% | 226 4933% | 300 6582% | 332 7294% | 372 8185% | 88.8 1878% | 105 2239% | 148 3196% | 202 4399% | 152.5 ? 3296% |
| Showcase (showcase-02) (fps) | 13.1 | 150 1045% | 119 808% | 122 831% | 135 931% | 150 1045% | 108 724% | 133 915% | 191 1358% | 244 1763% | 127 869% | 179 1266% | 234 1686% | 221 1587% | 125 854% | 151 1053% | 176 1244% | 186 1320% | 80.9 ? 518% |
| Solidworks (sw-04) (fps) | 47.2 | 109 131% | 77.5 64% | 119 152% | 136 188% | 135 186% | 127 169% | 135 186% | 157 233% | 168 256% | 195 313% | 265 461% | 294 523% | 287 508% | 220 366% | 231 389% | 272 476% | 286 506% | 121.4 ? 157% |
| SPECviewperf 2020 | 1005% | 1724% | 1419% | 1368% | 1914% | 1896% | 2460% | 3213% | 4074% | 3597% | 5203% | 6877% | 7116% | 1932% | 2647% | 3171% | 3596% | 2093% | |
| 3840x2160 Medical (medical-03) (fps) | 0.78 | 9.9 1169% | 22.3 2759% | 10.3 1221% | 12 1438% | 11.9 1426% | 13.7 1656% | 16.5 2015% | 22.2 2746% | 26.9 3349% | 36.1 4528% | 56.2 7105% | 63.7 8067% | 76.1 9656% | 20.9 2579% | 27.3 3400% | 30.1 3759% | 39.9 5015% | 24.2 ? 3003% |
| 3840x2160 Maya (maya-06) (fps) | 15.3 | 148 867% | 195 1175% | 162 959% | 185 1109% | 235 1436% | 196 1181% | 237 1449% | 305 1893% | 372 2331% | 178 1063% | 261 1606% | 346 2161% | 161 952% | 192 1155% | 258 1586% | 279 1724% | 150.1 ? 881% | |
| 3840x2160 Energy (energy-03) (fps) | 0.52 | 13.4 2477% | 25 4708% | 22.9 4304% | 17.8 3323% | 31.2 5900% | 33.2 6285% | 44.9 8535% | 57.6 10977% | 75.7 14458% | 67 12785% | 95 18169% | 111 21246% | 133 25477% | 29.5 5573% | 44.2 8400% | 52.2 9938% | 56.3 10727% | 36.2 ? 6862% |
| 3840x2160 Creo (creo-03) (fps) | 9.17 | 59 543% | 52.9 477% | 77.2 742% | 85.8 836% | 91.2 895% | 85.9 837% | 95.9 946% | 112 1121% | 121 1220% | 106 1056% | 130 1318% | 151 1547% | 159 1634% | 93.4 919% | 105 1045% | 123 1241% | 130 1318% | 52 ? 467% |
| 3840x2160 CATIA (catia-06) (fps) | 5.24 | 31.2 495% | 38.9 642% | 30.5 482% | 36.7 600% | 40.5 673% | 34 549% | 38.5 635% | 51.6 885% | 61.2 1068% | 68 1198% | 88.8 1595% | 101 1827% | 107 1942% | 60.8 1060% | 70.1 1238% | 77.2 1373% | 83.8 1499% | 36.7 ? 600% |
| 3840x2160 3ds Max (3dsmax-07) (fps) | 6.95 | 40.1 477% | 47.4 582% | 63.1 808% | 69.7 903% | 87 1152% | 67.4 870% | 88.8 1178% | 122 1655% | 147 2015% | 72.9 949% | 106 1425% | 125 1699% | 134 1828% | 42.4 510% | 51.5 641% | 85.4 1129% | 96.8 1293% | 58.9 ? 747% |
| Moyenne finale (programmes/paramètres) | 1065% /
1071% | 1068% /
1009% | 1104% /
1075% | 1173% /
1155% | 1450% /
1408% | 1472% /
1434% | 1914% /
1865% | 2518% /
2455% | 3299% /
3228% | 2719% /
2639% | 3789% /
3660% | 4687% /
4374% | 4935% /
4737% | 1934% /
1934% | 2471% /
2455% | 2881% /
2854% | 2946% /
2887% | 1661% /
1622% |
Émissions - Efficace avec un contrôle discutable du ventilateur
Bruit du système
Notre échantillon de Geekom Mini IT12 n'est pas très performant en ce qui concerne les mesures de volume. Même au ralenti, nous avons enregistré 36,5 dB(A), ce qui est nettement plus bruyant que les autres. De plus, le bruit du ventilateur est aigu, ce qui augmente encore la perception subjective du niveau sonore. En charge moyenne, le niveau de pression sonore n'augmente que très peu, atteignant un pic de 47,5 dB(A). Dans le BIOS, l'utilisateur peut choisir entre les profils Silent, Auto et Performance, mais cela modifie également les limites de puissance du processeur. L'absence d'une option permettant de définir les limites de puissance séparément de la vitesse du ventilateur est déconcertante. Il est recommandé à Geekom de se pencher sur ce problème afin de réduire de manière significative le niveau de bruit. Le Geekom Mini IT12 Geekom Mini IT12 avec l'Intel Core i7-1260P s'est amélioré sur ce point.
Degré de la nuisance sonore
| Au repos |
| 36.5 / 36.5 / 36.5 dB(A) |
| Fortement sollicité |
| 36.6 / 47.5 dB(A) |
 | ||
30 dB silencieux 40 dB(A) audible 50 dB(A) bruyant |
||
min: | ||
| Geekom Mini IT12 i5-12450H, UHD Graphics 64EUs | Geekom Mini IT12 i7-1260P, Iris Xe G7 96EUs | Intel NUC 13 Pro Kit NUC13ANK i7-1360P, Iris Xe G7 96EUs | Minisforum Mars Series MC560 R5 5600U, Vega 7 | Intel NUC 12 Pro Kit NUC12WSKi7 i7-1260P, Iris Xe G7 96EUs | Minisforum Venus Series UN1245 i5-12450H, UHD Graphics 64EUs | NiPoGi CK10 i5-12450H, UHD Graphics 64EUs | |
|---|---|---|---|---|---|---|---|
| Noise | 13% | 5% | 12% | 1% | 6% | 11% | |
| arrêt / environnement * (dB) | 24.8 | 29.8 -20% | 29.8 -20% | 30.2 -22% | 30.4 -23% | 25.2 -2% | 25 -1% |
| Idle Minimum * (dB) | 36.5 | 29.9 18% | 30.2 17% | 30.4 17% | 33.1 9% | 32 12% | 30.6 16% |
| Idle Average * (dB) | 36.5 | 30.1 18% | 31.1 15% | 30.4 17% | 33.1 9% | 32.1 12% | 31.1 15% |
| Idle Maximum * (dB) | 36.5 | 30.2 17% | 31.9 13% | 30.4 17% | 33.1 9% | 32.2 12% | 31.7 13% |
| Load Average * (dB) | 36.6 | 32.1 12% | 40 -9% | 31.8 13% | 38.1 -4% | 39.8 -9% | 32.9 10% |
| Witcher 3 ultra * (dB) | 36.6 | 36.2 1% | |||||
| Load Maximum * (dB) | 47.5 | 32.5 32% | 40.5 15% | 33.4 30% | 43.6 8% | 43.3 9% | 36.1 24% |
* ... Moindre est la valeur, meilleures sont les performances
Température
Le boîtier de la Geekom Mini IT12 ne se réchauffe que légèrement au repos, les zones les plus chaudes devenant perceptibles sous charge. La température maximale pendant le test de stress est de 106,52 °F, ce qui est inoffensif. L'Intel Core i5-12450H consomme 35 watts en charge continue, une valeur maintenue tout au long du test de stress. Bien que le SoC atteigne brièvement 53 watts au début, entraînant une température maximale de 185 °F, il semble que le fabricant ait fixé une limite, car la température du CPU se stabilise à 163,4 °F, en dessous de la limite de puissance maximale de 80 watts dans n'importe quel benchmark.
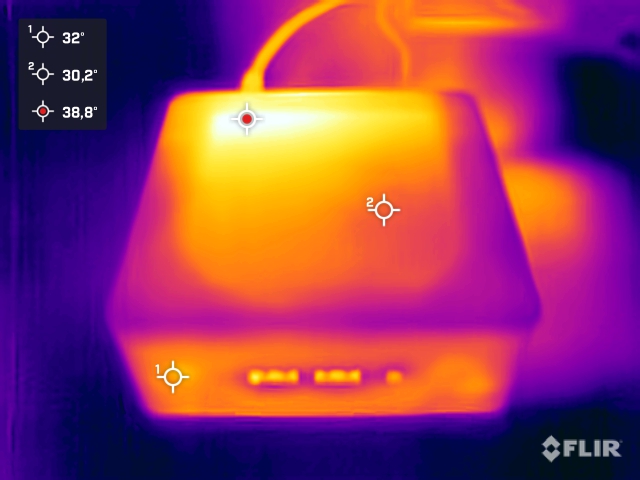
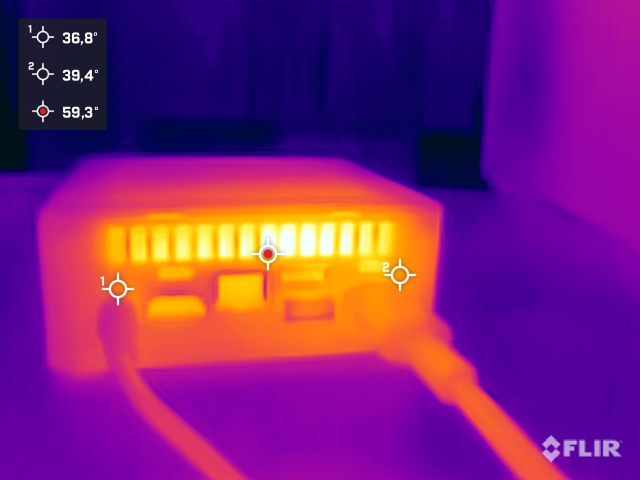
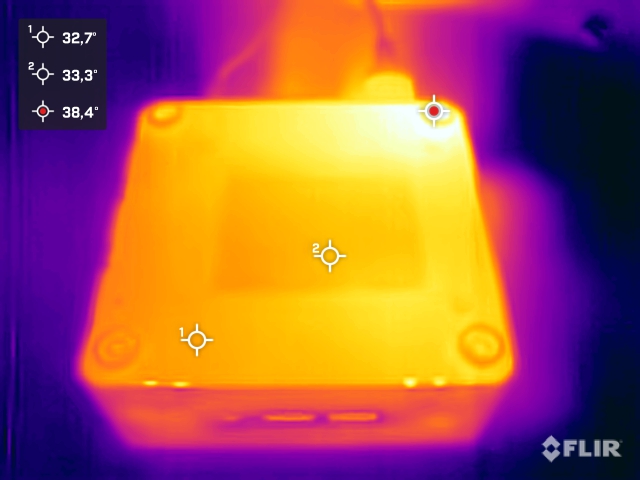
(±) La température maximale du côté supérieur est de 41.4 °C / 107 F, par rapport à la moyenne de 35.4 °C / 96 F, allant de 20.6 à 69.5 °C pour la classe Mini PC.
(+) Le fond chauffe jusqu'à un maximum de 39.1 °C / 102 F, contre une moyenne de 36.1 °C / 97 F
(+) En utilisation inactive, la température moyenne du côté supérieur est de 27.5 °C / 82 F, par rapport à la moyenne du dispositif de 32.1 °C / 90 F.
Consommation électrique
Geekom a intentionnellement limité la puissance du processeur avec certaines contraintes, ce qui permet au Mini IT12 d'être très économe en énergie à la fois en mode veille et en charge. La consommation d'énergie en mode veille varie de 5,5 à 11,3 watts. Bien que l'alimentation de 90 watts doive brièvement fournir un peu moins de 87 watts, cela ne pose pas de problème. En moyenne, le Geekom Mini IT12 consomme un peu plus de 40 watts, ce qui lui confère une excellente efficacité énergétique par rapport à ses concurrents.
| Éteint/en veille | |
| Au repos | |
| Fortement sollicité |
|
Légende:
min: | |
| Geekom Mini IT12 i5-12450H, UHD Graphics 64EUs | Geekom Mini IT12 i7-1260P, Iris Xe G7 96EUs | Intel NUC 13 Pro Kit NUC13ANK i7-1360P, Iris Xe G7 96EUs | Minisforum Mars Series MC560 R5 5600U, Vega 7 | Intel NUC 12 Pro Kit NUC12WSKi7 i7-1260P, Iris Xe G7 96EUs | Minisforum Venus Series UN1245 i5-12450H, UHD Graphics 64EUs | NiPoGi CK10 i5-12450H, UHD Graphics 64EUs | Moyenne Intel UHD Graphics 64EUs (Alder Lake 12th Gen) | Moyenne de la classe Mini PC | |
|---|---|---|---|---|---|---|---|---|---|
| Power Consumption | 4% | -7% | 18% | -48% | -9% | -22% | -21% | -36% | |
| Idle Minimum * (Watt) | 5.5 | 5 9% | 5.1 7% | 6.2 -13% | 12.1 -120% | 8.2 -49% | 9.1 -65% | 8.78 ? -60% | 8.63 ? -57% |
| Idle Average * (Watt) | 8.5 | 7 18% | 5.8 32% | 6.3 26% | 12.2 -44% | 8.6 -1% | 11.3 -33% | 10.4 ? -22% | 10.8 ? -27% |
| Idle Maximum * (Watt) | 11.3 | 10.7 5% | 10.2 10% | 7.5 34% | 12.3 -9% | 9.6 15% | 13.7 -21% | 14.7 ? -30% | 13.5 ? -19% |
| Load Average * (Watt) | 42.3 | 50.3 -19% | 68.1 -61% | 41.3 2% | 64 -51% | 52.1 -23% | 49.5 -17% | 49 ? -16% | 63.6 ? -50% |
| Load Maximum * (Watt) | 86.5 | 82 5% | 108.3 -25% | 49 43% | 98.8 -14% | 73.6 15% | 62.3 28% | 67.6 ? 22% | 110.9 ? -28% |
* ... Moindre est la valeur, meilleures sont les performances
Energieaufnahme mit externem Monitor
Points positifs
Points négatifs
Verdict - PC de bureau économique avec de bonnes fonctionnalités

Le Geekom Mini IT12 s'avère être un mini PC fiable adapté à un usage domestique. Doté d'un processeur Intel Core i5-12450H, il gère la plupart des tâches quotidiennes en toute transparence. Ses nombreuses options de connectivité le rendent polyvalent pour diverses applications, et il s'adapte sans problème aux cartes graphiques externes. En comparaison avec la variante Intel Core i7-1260P du même modèle, l'appareil testé n'est pas à la hauteur. Alors que, sur le papier, le Minisforum Venus Series UN1245 et NiPoGi CK10 n'arrivent pas à la cheville du Geekom Mini IT12, les différences de performances dans le monde réel sont minimes et souvent imperceptibles. Geekom gagne un avantage significatif en matière de connectivité, avec un port USB 4 moderne, une caractéristique qui fait défaut à ses concurrents.
Le Geekom Mini IT12 est un outil de travail compact avec une large applicabilité, améliorée par son excellente connectivité, supportant même les cartes graphiques externes.
Geekom maintient sa qualité constante en matière de fabrication et de design. Cependant, un nouveau look pourrait ajouter de la distinction à leurs appareils. La critique notable de notre unité de test est le bruit audible du ventilateur, un problème qui n'était pas présent dans notre test du Mini IT12 avec Intel Core i7-1260P. Il reste à voir si le fabricant réglera ce problème par une mise à jour du BIOS. Si le bruit du ventilateur vous préoccupe, optez pour le modèle Intel Core i7-1260P, s'il est disponible. Toute amélioration apportée par le fabricant sera dûment reflétée dans nos prochains tests.
Prix et disponibilité
Le Geekom Mini IT12 peut être acheté directement auprès de l'entreprise https://www.geekompc.com/le Geekom Mini IT12 est également disponible sur Amazon. Pour les utilisateurs à la recherche de plus de puissance, il est également possible d'acheter le Mini IT12 avec Intel Core i7-12650H dans la boutique Geekom.
Geekom Mini IT12
- 11/27/2023 v7 (old)
Sebastian Bade
Transparency
La sélection des appareils à examiner est effectuée par notre équipe éditoriale. L'échantillon d'essai a été remis gratuitement à l'auteur par le fabricant à des fins d'évaluation. Cet examen n'a pas été influencé par des tiers et le fabricant n'a pas reçu de copie de cet examen avant sa publication. Il n'y avait aucune obligation de publier cet article. En tant que média indépendant, Notebookcheck n'est pas soumis à l'autorité des fabricants, des détaillants ou des éditeurs.
Voici comment Notebookcheck teste
Chaque année, Notebookcheck examine de manière indépendante des centaines d'ordinateurs portables et de smartphones en utilisant des procédures standardisées afin de garantir que tous les résultats sont comparables. Nous avons continuellement développé nos méthodes de test depuis environ 20 ans et avons établi des normes industrielles dans le processus. Dans nos laboratoires de test, des équipements de mesure de haute qualité sont utilisés par des techniciens et des rédacteurs expérimentés. Ces tests impliquent un processus de validation en plusieurs étapes. Notre système d'évaluation complexe repose sur des centaines de mesures et de points de référence bien fondés, ce qui garantit l'objectivité.
