Test du MSI Summit E14 Flip Evo A12M : alternative légitime à HP, Dell ou Lenovo
A ne pas confondre avec le Summit E14 clamshellle Summit E14 Flip est la version convertible avec des charnières à 360 degrés et un design de châssis globalement différent. Ce modèle a fait ses débuts en mars aux côtés du Summit E13 Flip de 13 pouces, plus petit et rafraîchi.
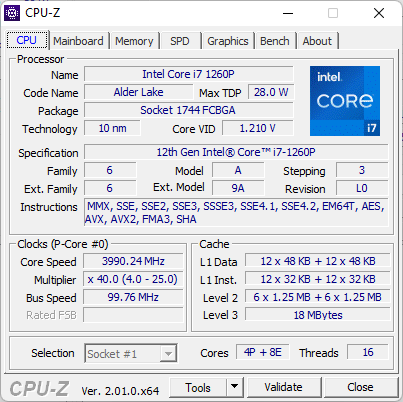
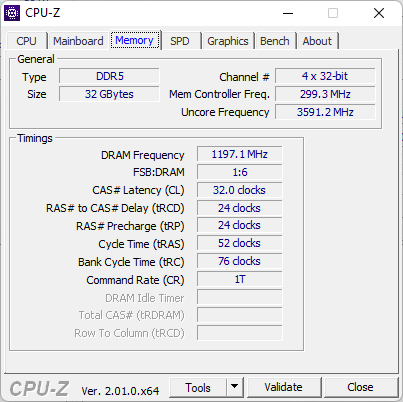
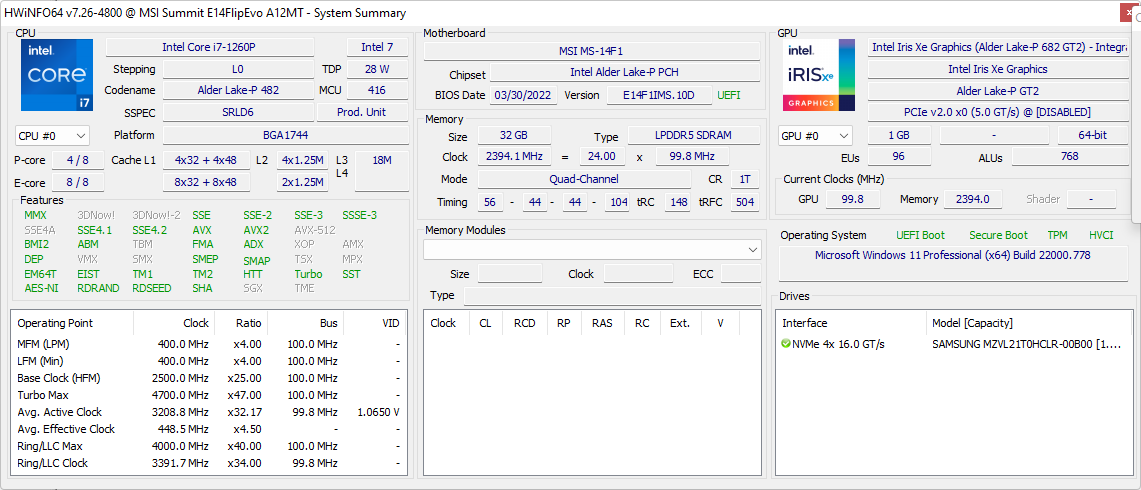
Notre unité d'examen est configurée avec le processeur Intel Alder Lake-P Core i7-1260P, 32 Go de RAM LPDDR5, un écran tactile IPS QHD+ 16:10 et un SSD NVMe de 1 To pour un prix de détail d'environ 1600 à 1700 $ US. D'autres unités de stock avec des options discrètes GeForce MX sont prévues dans un avenir proche.
Le Summit E14 Flip est en concurrence avec d'autres ordinateurs convertibles haut de gamme destinés à la consommation ou aux entreprises, comme leLenovo Yoga 9i 14,Dell Latitude 9420 2-en-1,LG Gram 14T90Pou Asus ExpertBook B7 Flip.
Plus de commentaires sur MSI :
Comparaison avec les concurrents potentiels
Note | Date | Modèle | Poids | Épaisseur | Taille | Résolution | Prix |
|---|---|---|---|---|---|---|---|
| 86.1 % v7 (old) | 07/22 | MSI Summit E14 Flip Evo A12MT i7-1260P, Iris Xe G7 96EUs | 1.6 kg | 17.9 mm | 14.00" | 2880x1800 | |
| 82.3 % v7 (old) | 07/21 | MSI Summit E14 A11SCS i7-1185G7, GeForce GTX 1650 Ti Max-Q | 1.3 kg | 16 mm | 14.00" | 3840x2160 | |
| 84.1 % v7 (old) | 07/22 | Asus VivoBook S 14X S5402Z i7-12700H, Iris Xe G7 96EUs | 1.6 kg | 17.9 mm | 14.50" | 2880x1800 | |
| 87.5 % v7 (old) | 05/22 | LG Gram 14T90P i5-1135G7, Iris Xe G7 80EUs | 1.2 kg | 17 mm | 14.00" | 1900x1200 | |
| 87.6 % v7 (old) | 06/22 | Lenovo Yoga Slim 7i Pro 14IAP G7 i5-1240P, Iris Xe G7 80EUs | 1.3 kg | 14.6 mm | 14.00" | 2880x1800 | |
| 89 % v7 (old) | 07/21 | Dell Latitude 9420 2-in-1 i7-1185G7, Iris Xe G7 96EUs | 1.5 kg | 13.94 mm | 14.00" | 2560x1600 |
Affaire - Plus difficile qu'avant
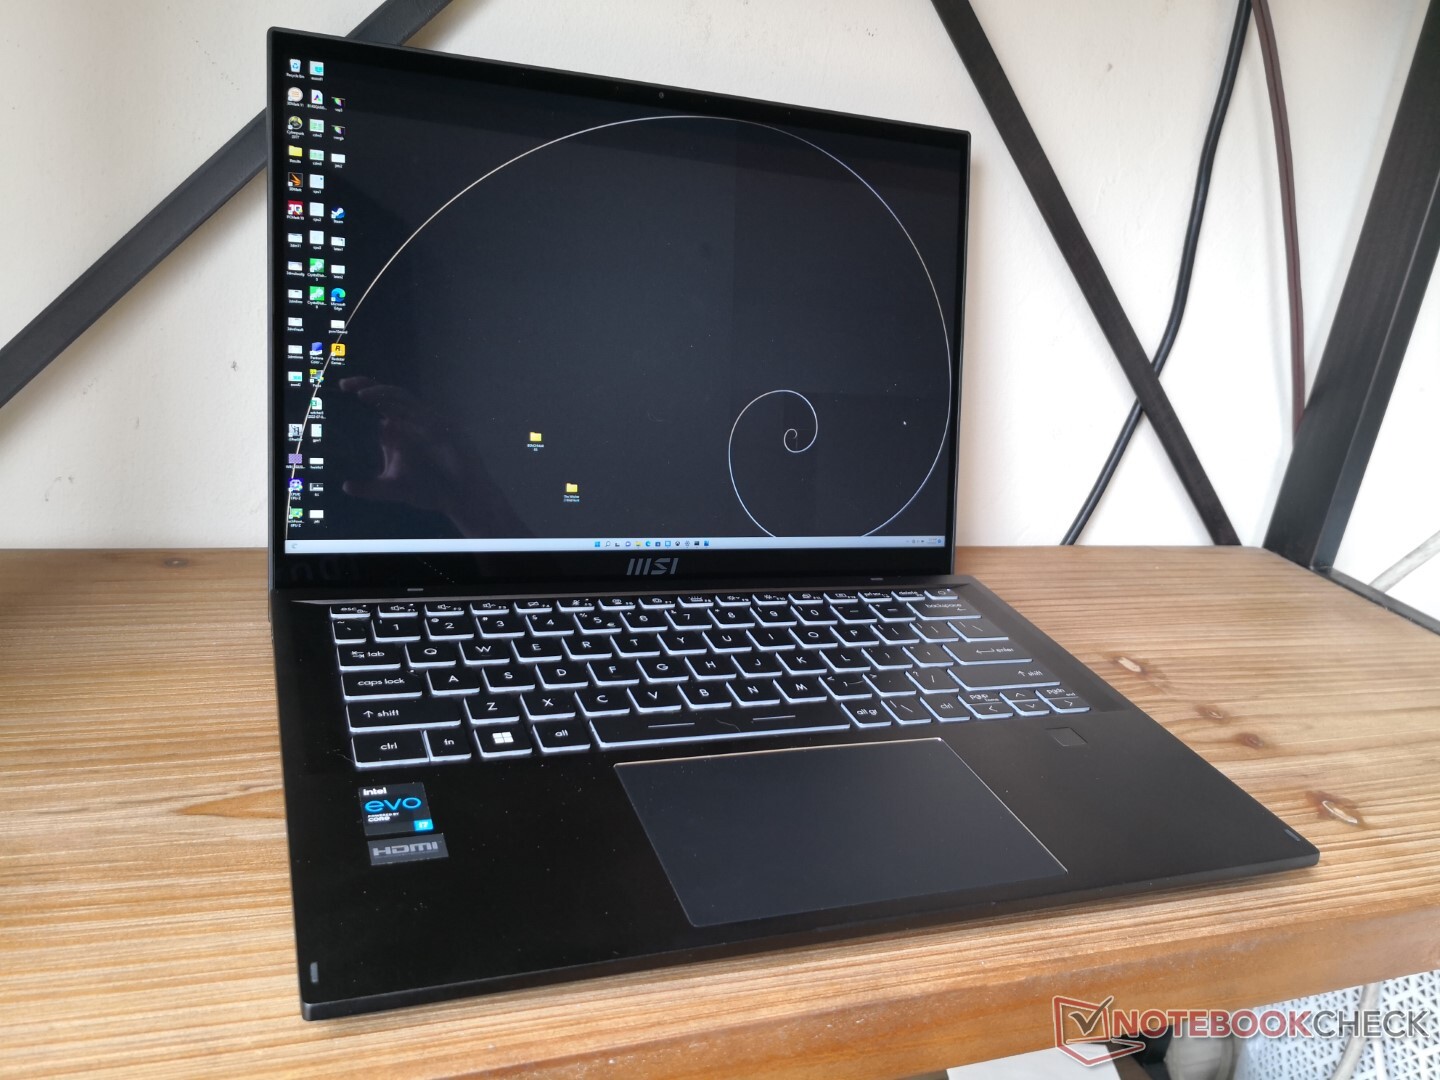
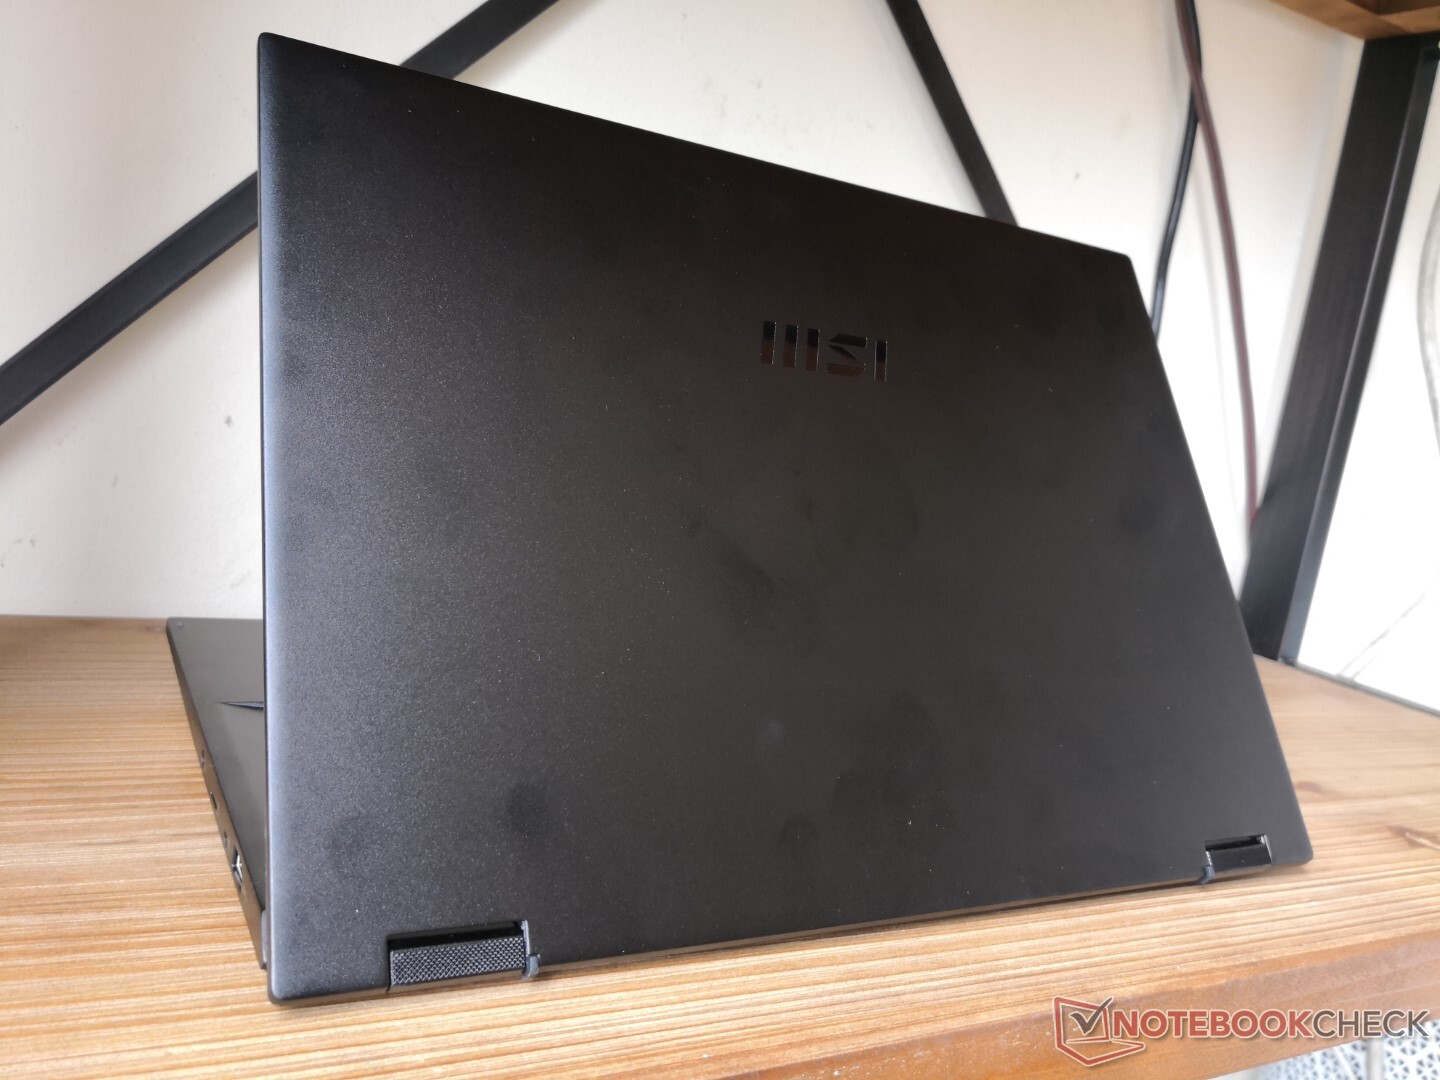
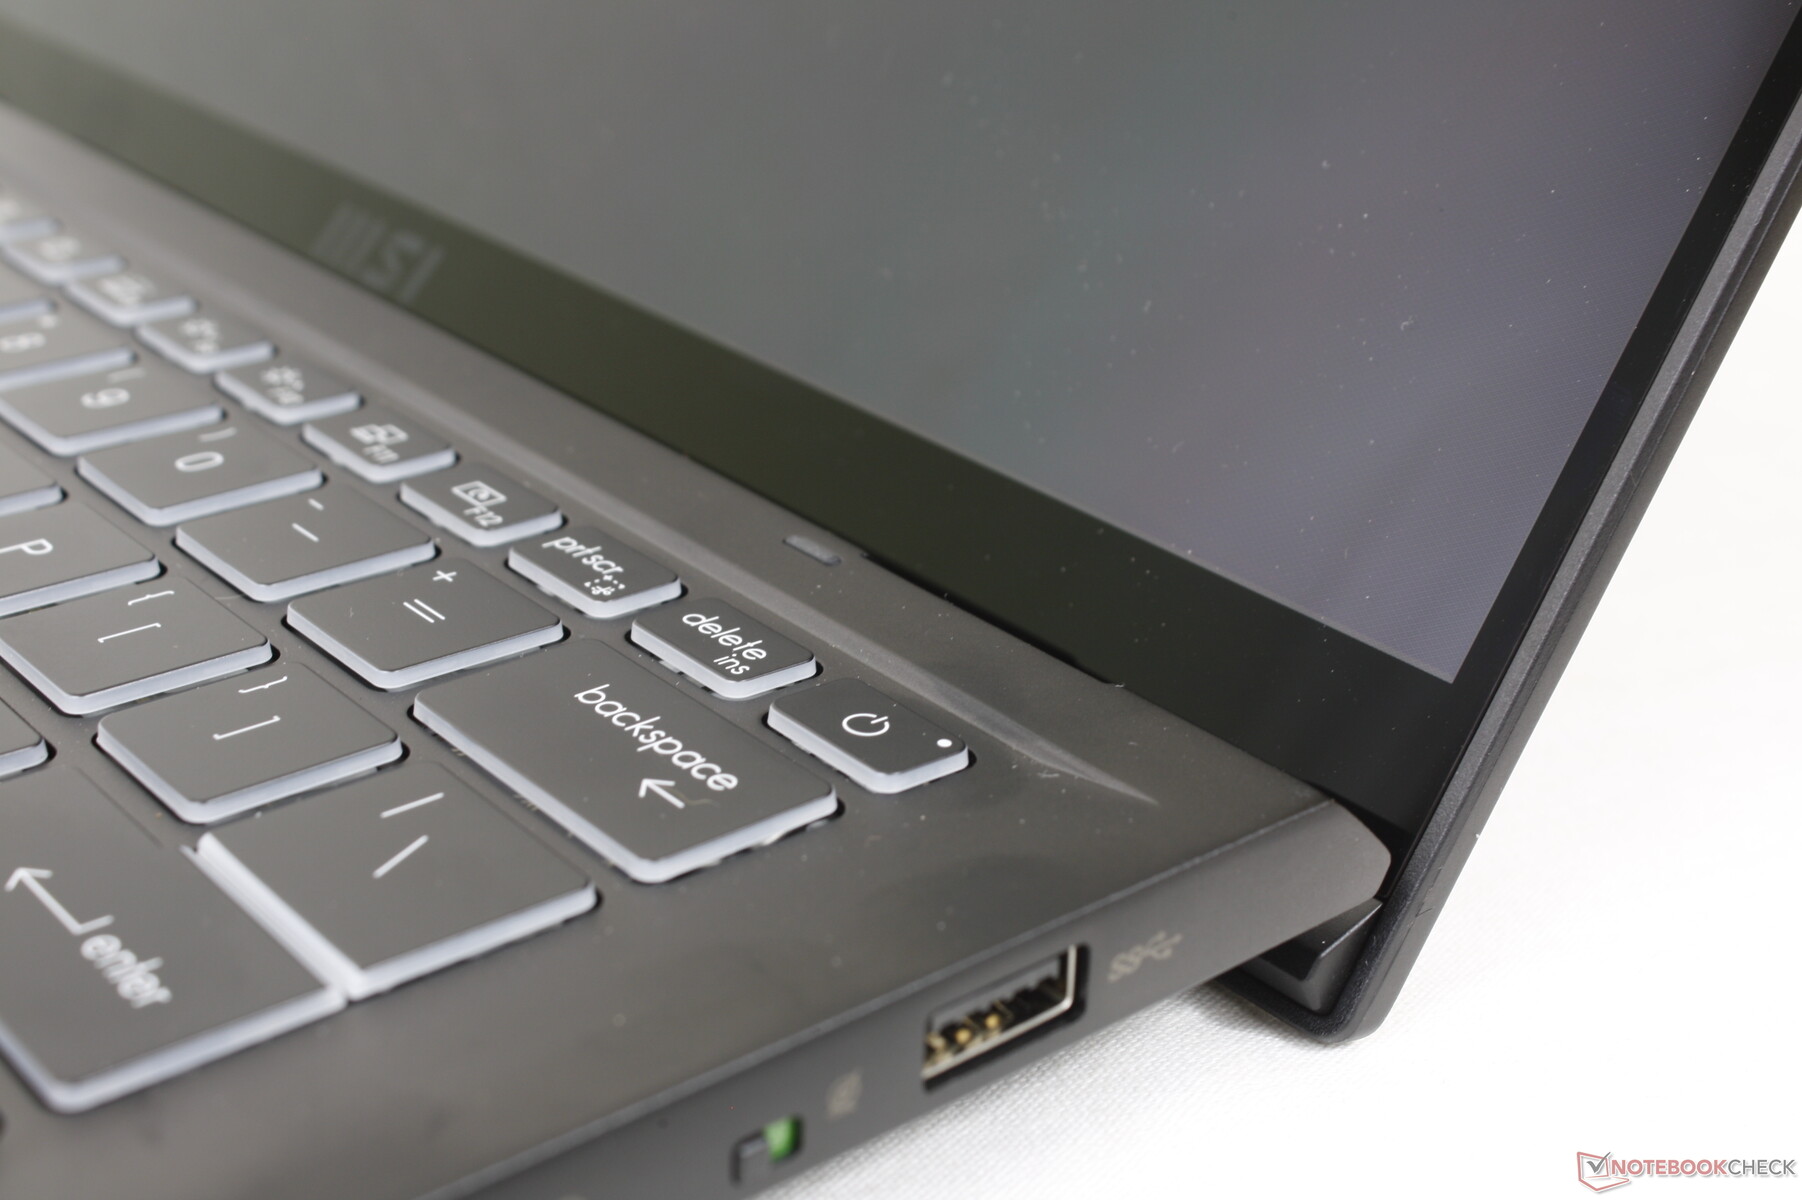
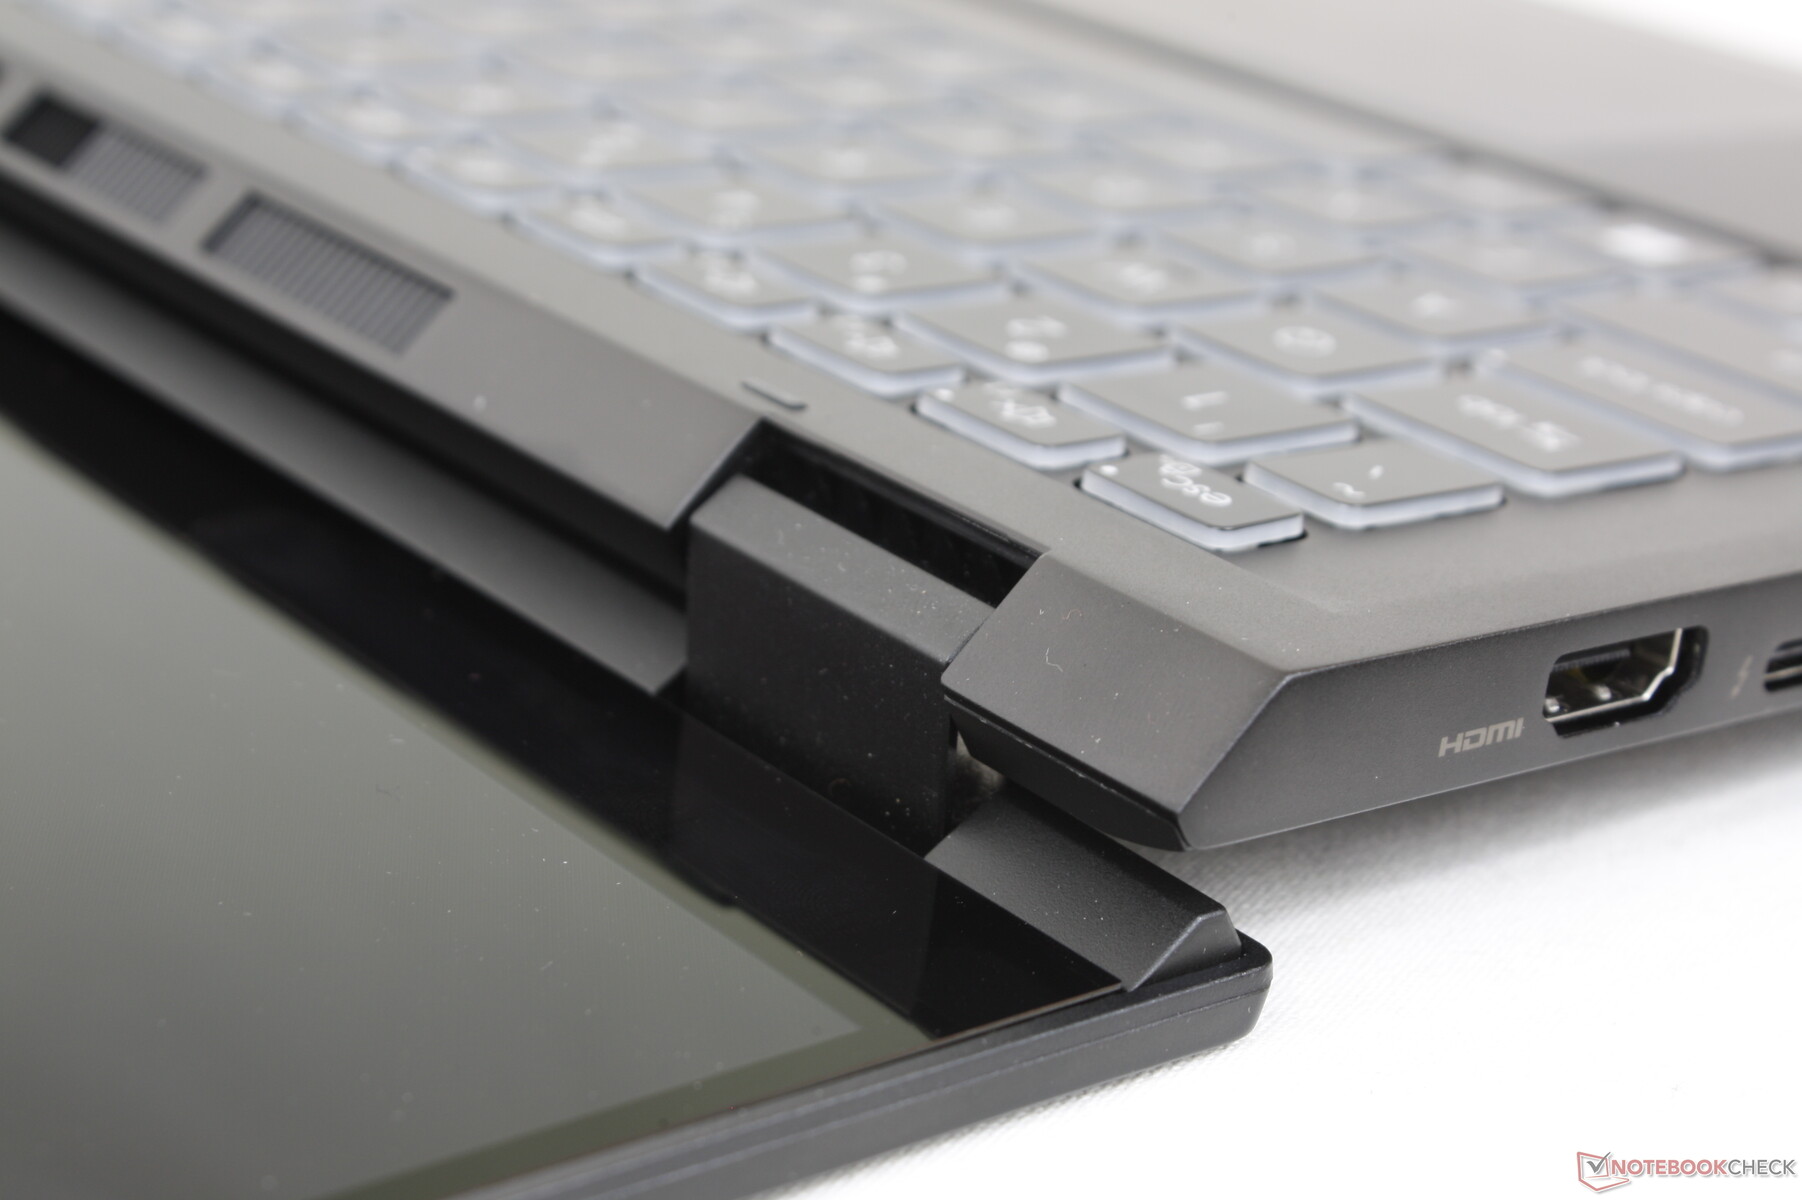
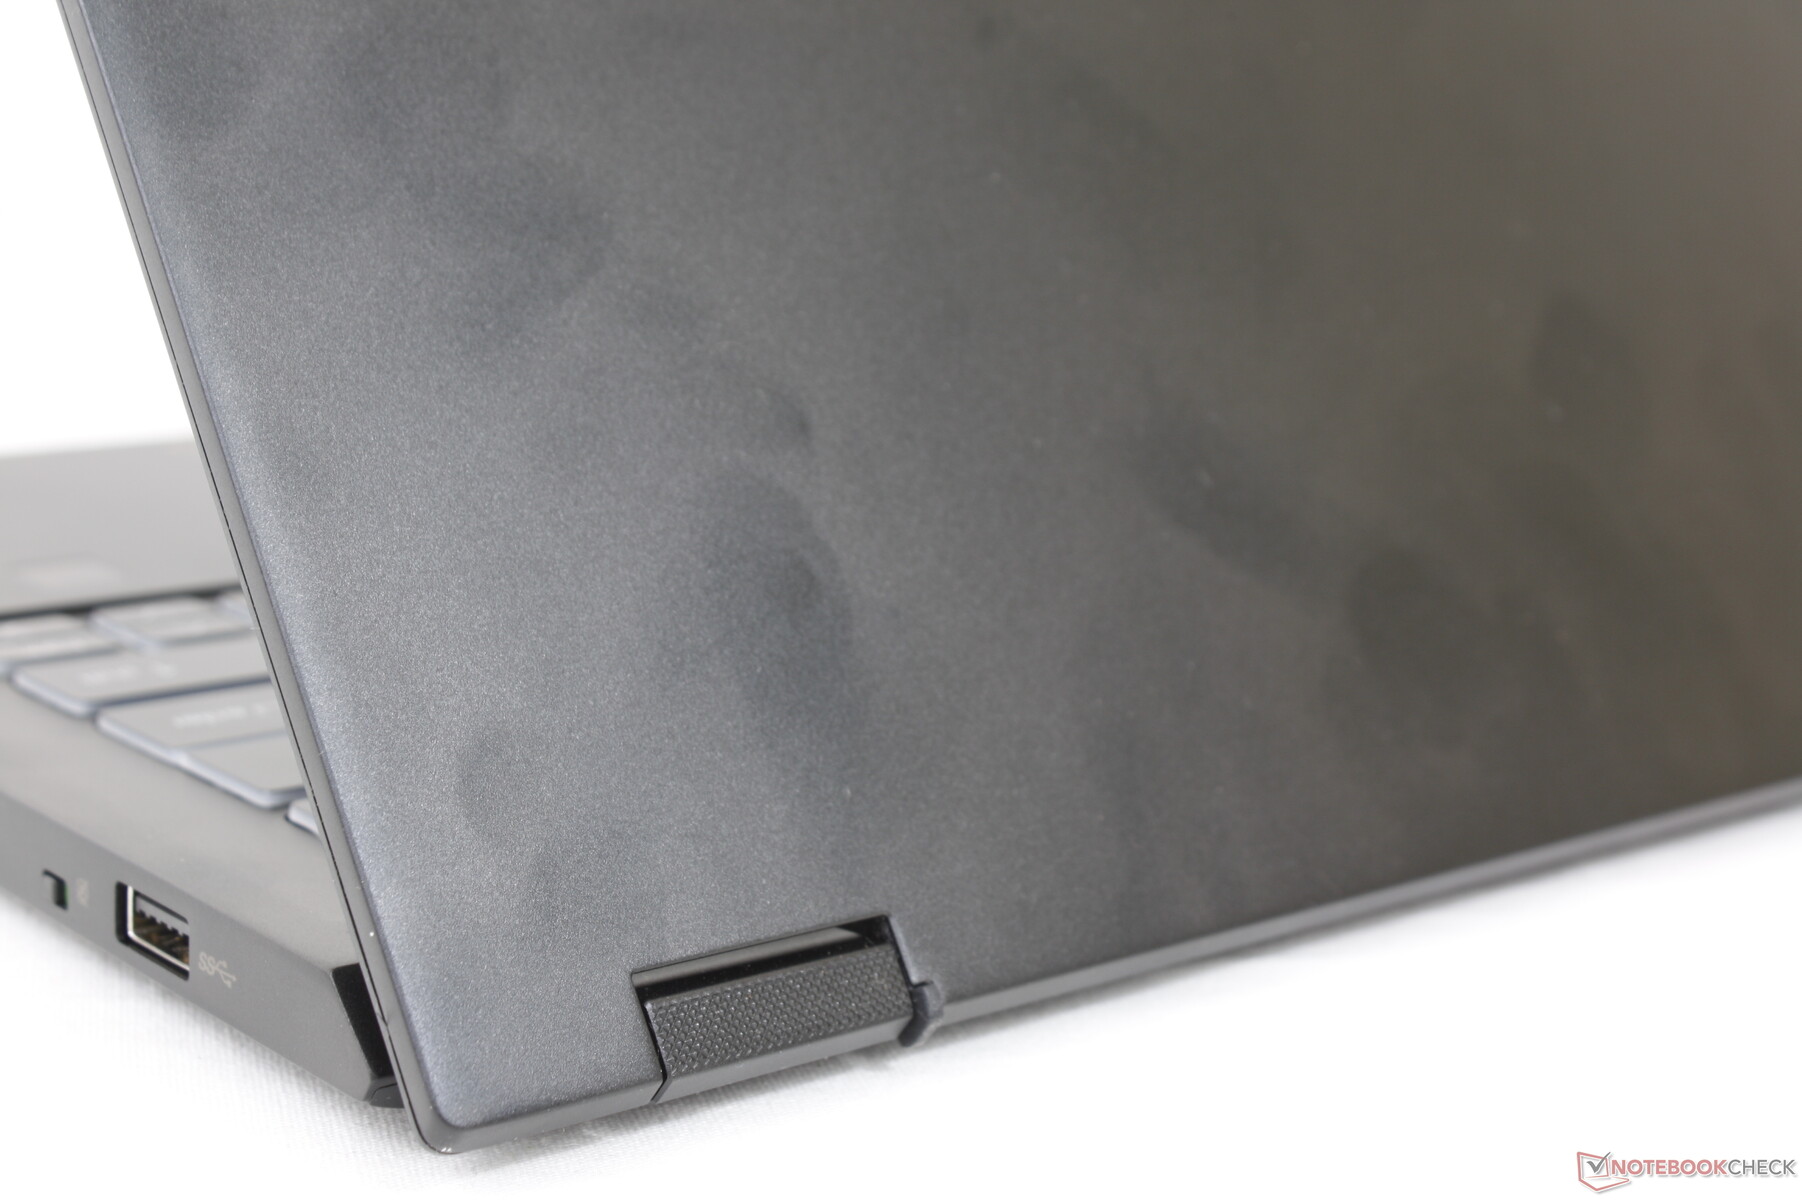
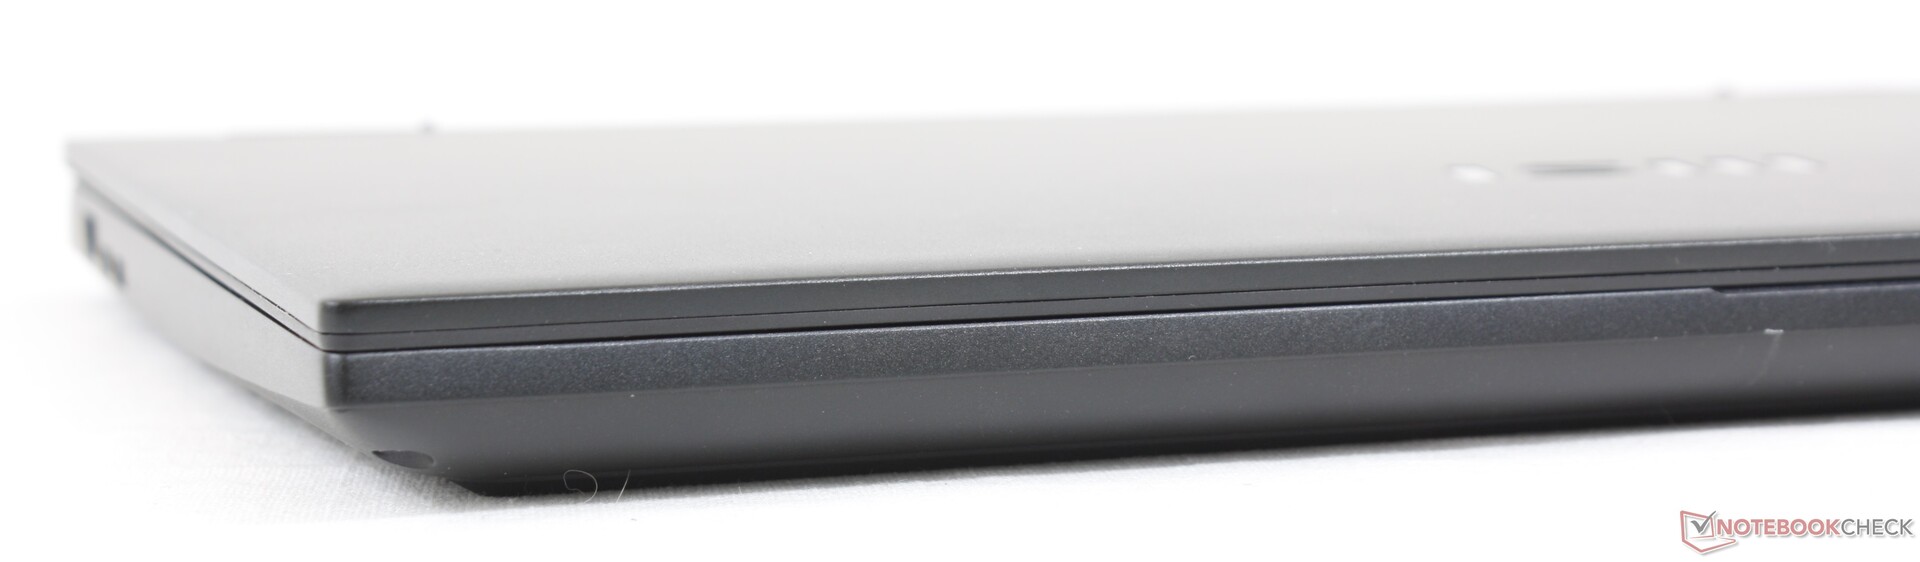
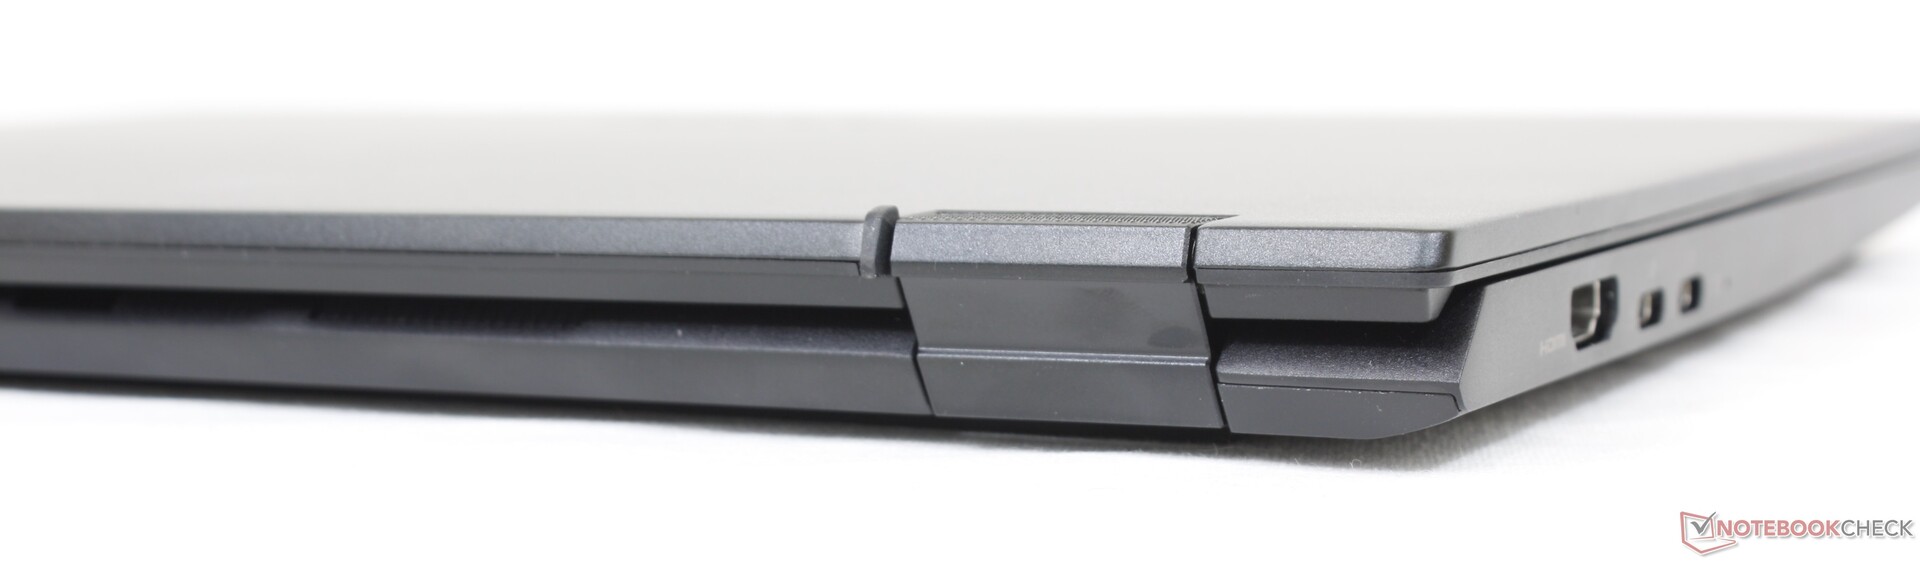
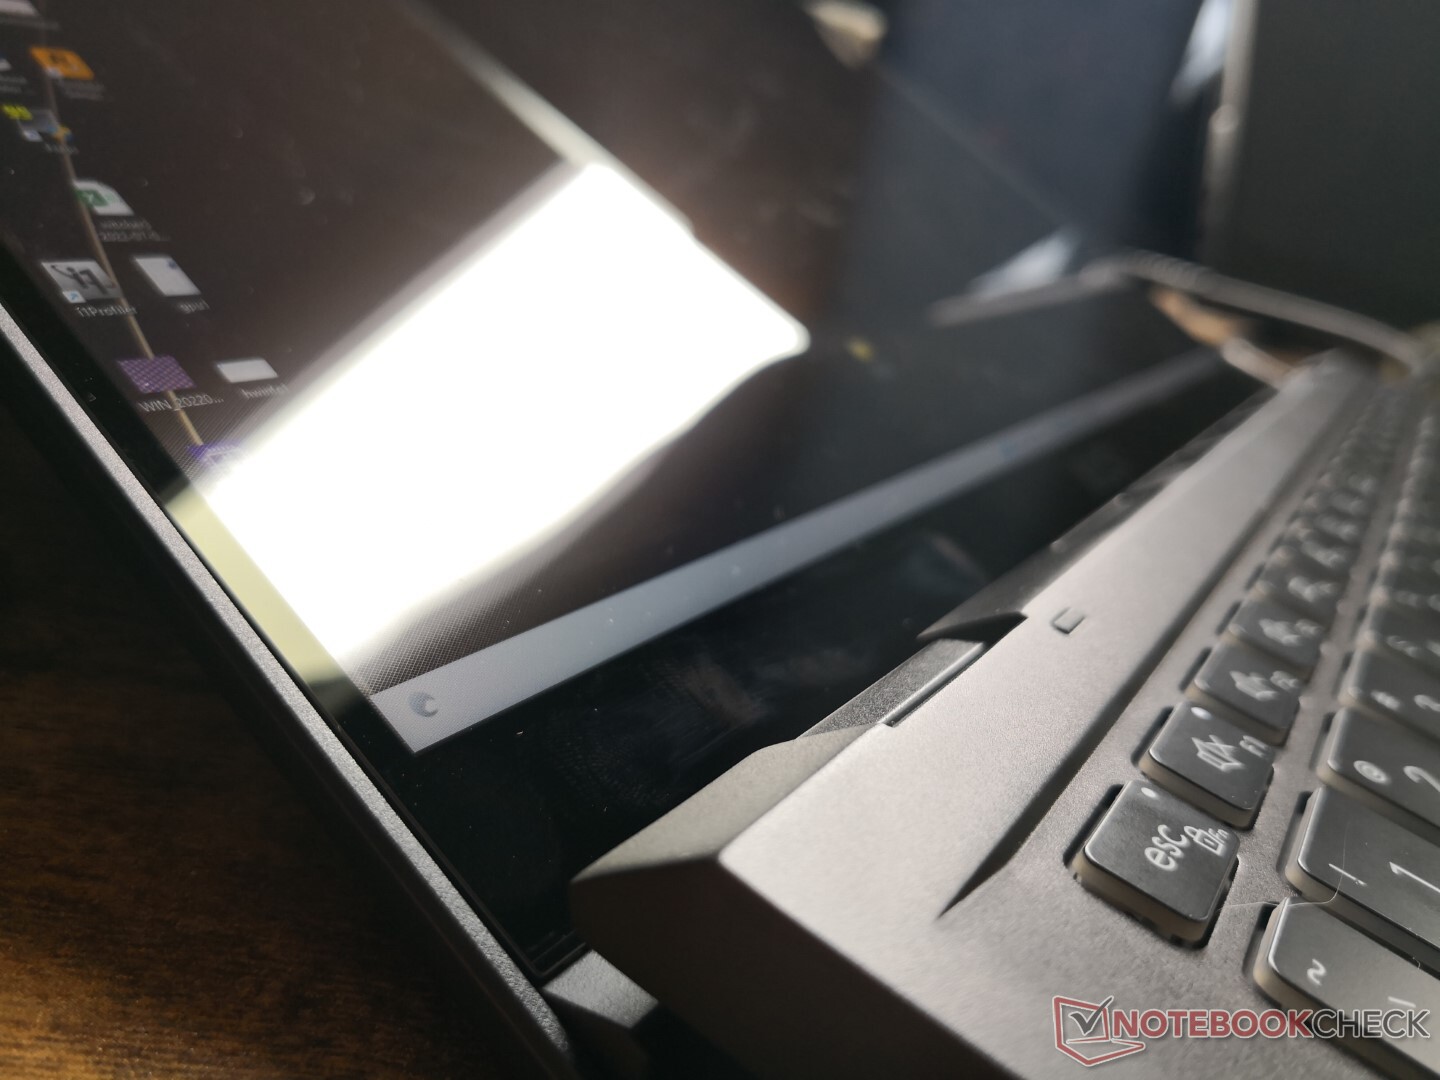
Bien que le Summit E14 Flip convertible puisse ressembler au Summit E14 clamshell à première vue en raison de leur revêtement noir mat, ils sont en fait très différents à l'intérieur comme à l'extérieur. Le logo doré et les garnitures autour du pavé tactile ont disparu pour un look plus subtil. Le verre bord à bord est désormais standard pour renforcer la rigidité du couvercle et permettre l'utilisation de l'écran tactile ou du stylet. Les charnières, qui sont limitées à 180 degrés sur le modèle à clapet, ont été entièrement redessinées pour être plus grandes et plus solides pour le nouveau facteur de forme à 360 degrés. Nous pensons cependant que les charnières pourraient être plus rigides à certains angles, en particulier autour de la plage de 150 à 180 degrés pour une meilleure sensation de longévité
Le modèle conserve la certification MIL-STD-810G qu'il partage avec le clamshell original. La base est rigide et résistante aux torsions et aux dépressions pour être au même niveau que beaucoup d'autres convertibles pour prosommateurs comme le Asus Zenbook Flip, XPS 13 2-in-1, ou Lenovo Yoga 9i 14. Il s'agit d'une amélioration majeure par rapport aux ordinateurs portables MSI Modern moins chers, que nous avons toujours trouvés plus fragiles par rapport à la concurrence.
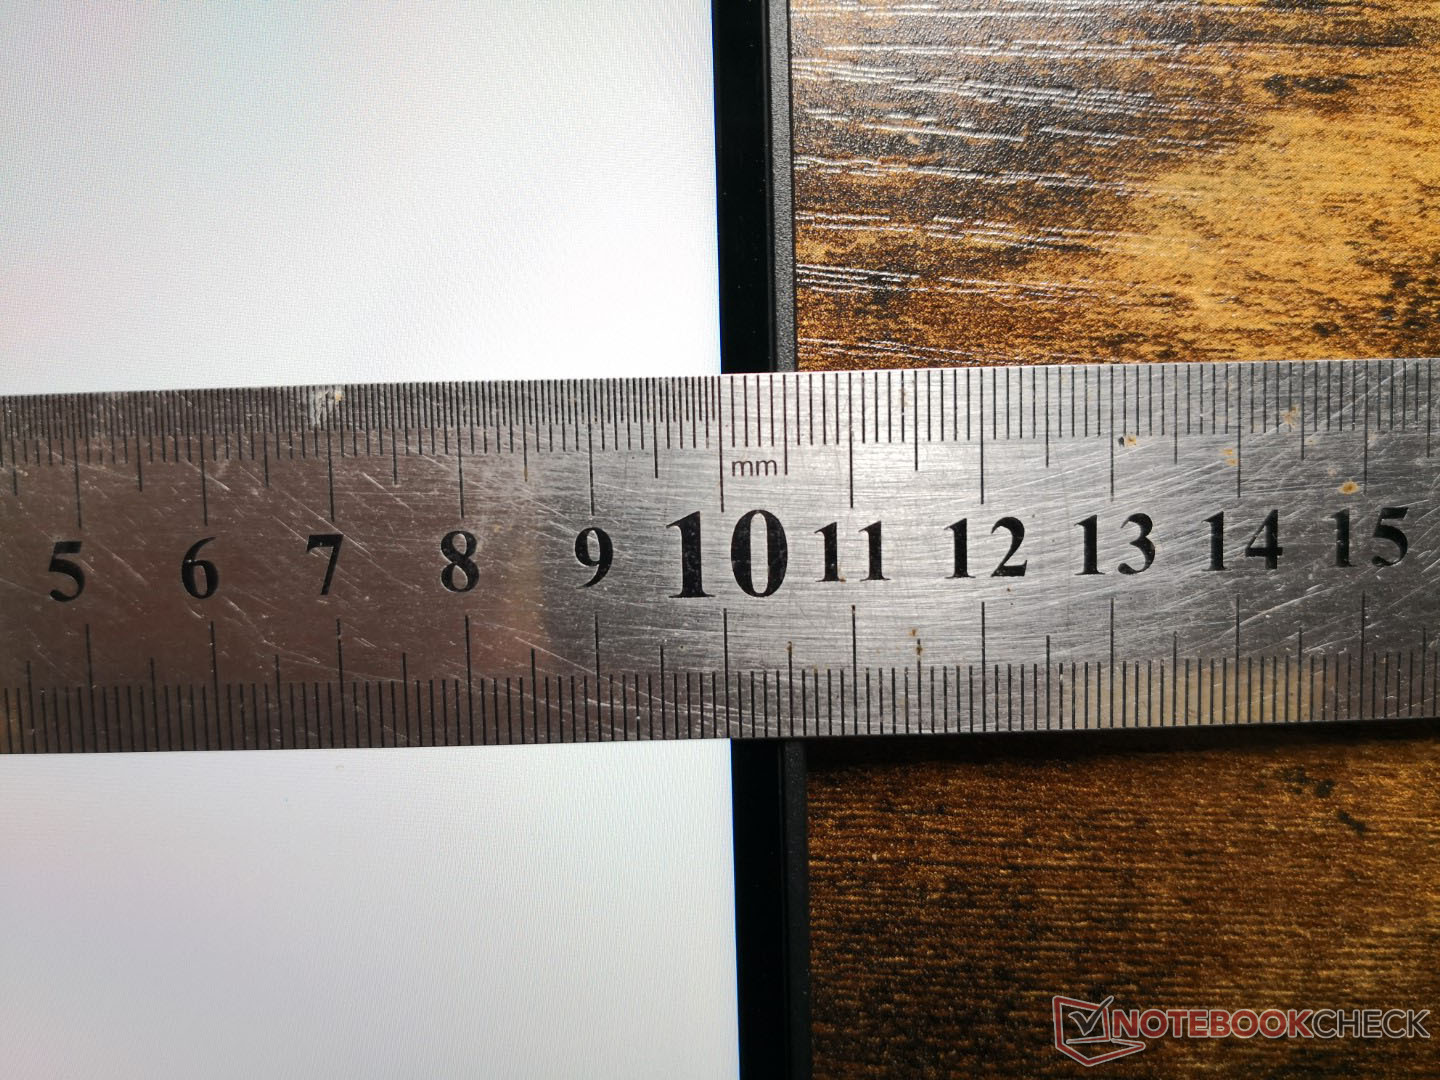
En termes de taille et de poids, le modèle MSI est à la fois plus grand et plus lourd que de nombreux autres convertibles de 14 pouces. Le sitelG Gram 14T90P et Latitude 9420 2-en-1, par exemple, sont chacun plus léger, plus petit et même plus fin que notre Summit E14 Flip. Le Lenovo Yoga 9i 14 convertible est légèrement plus grand en termes d'encombrement, mais il est toujours plus fin et plus léger d'environ 3 mm et 200 grammes, respectivement.
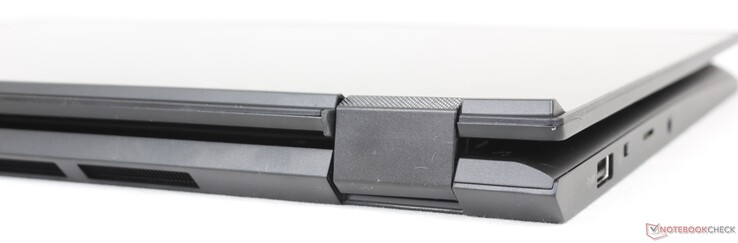
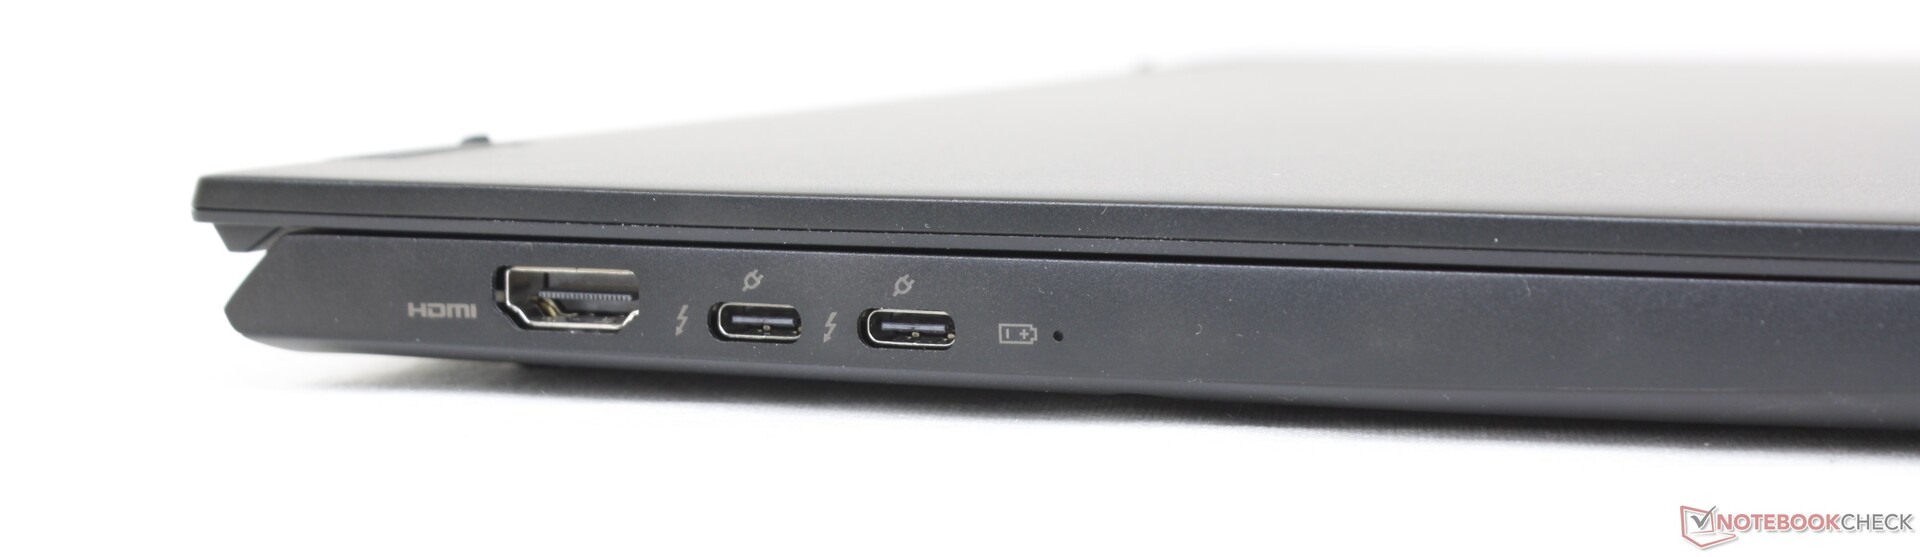
Connectivité - Support Thunderbolt 4
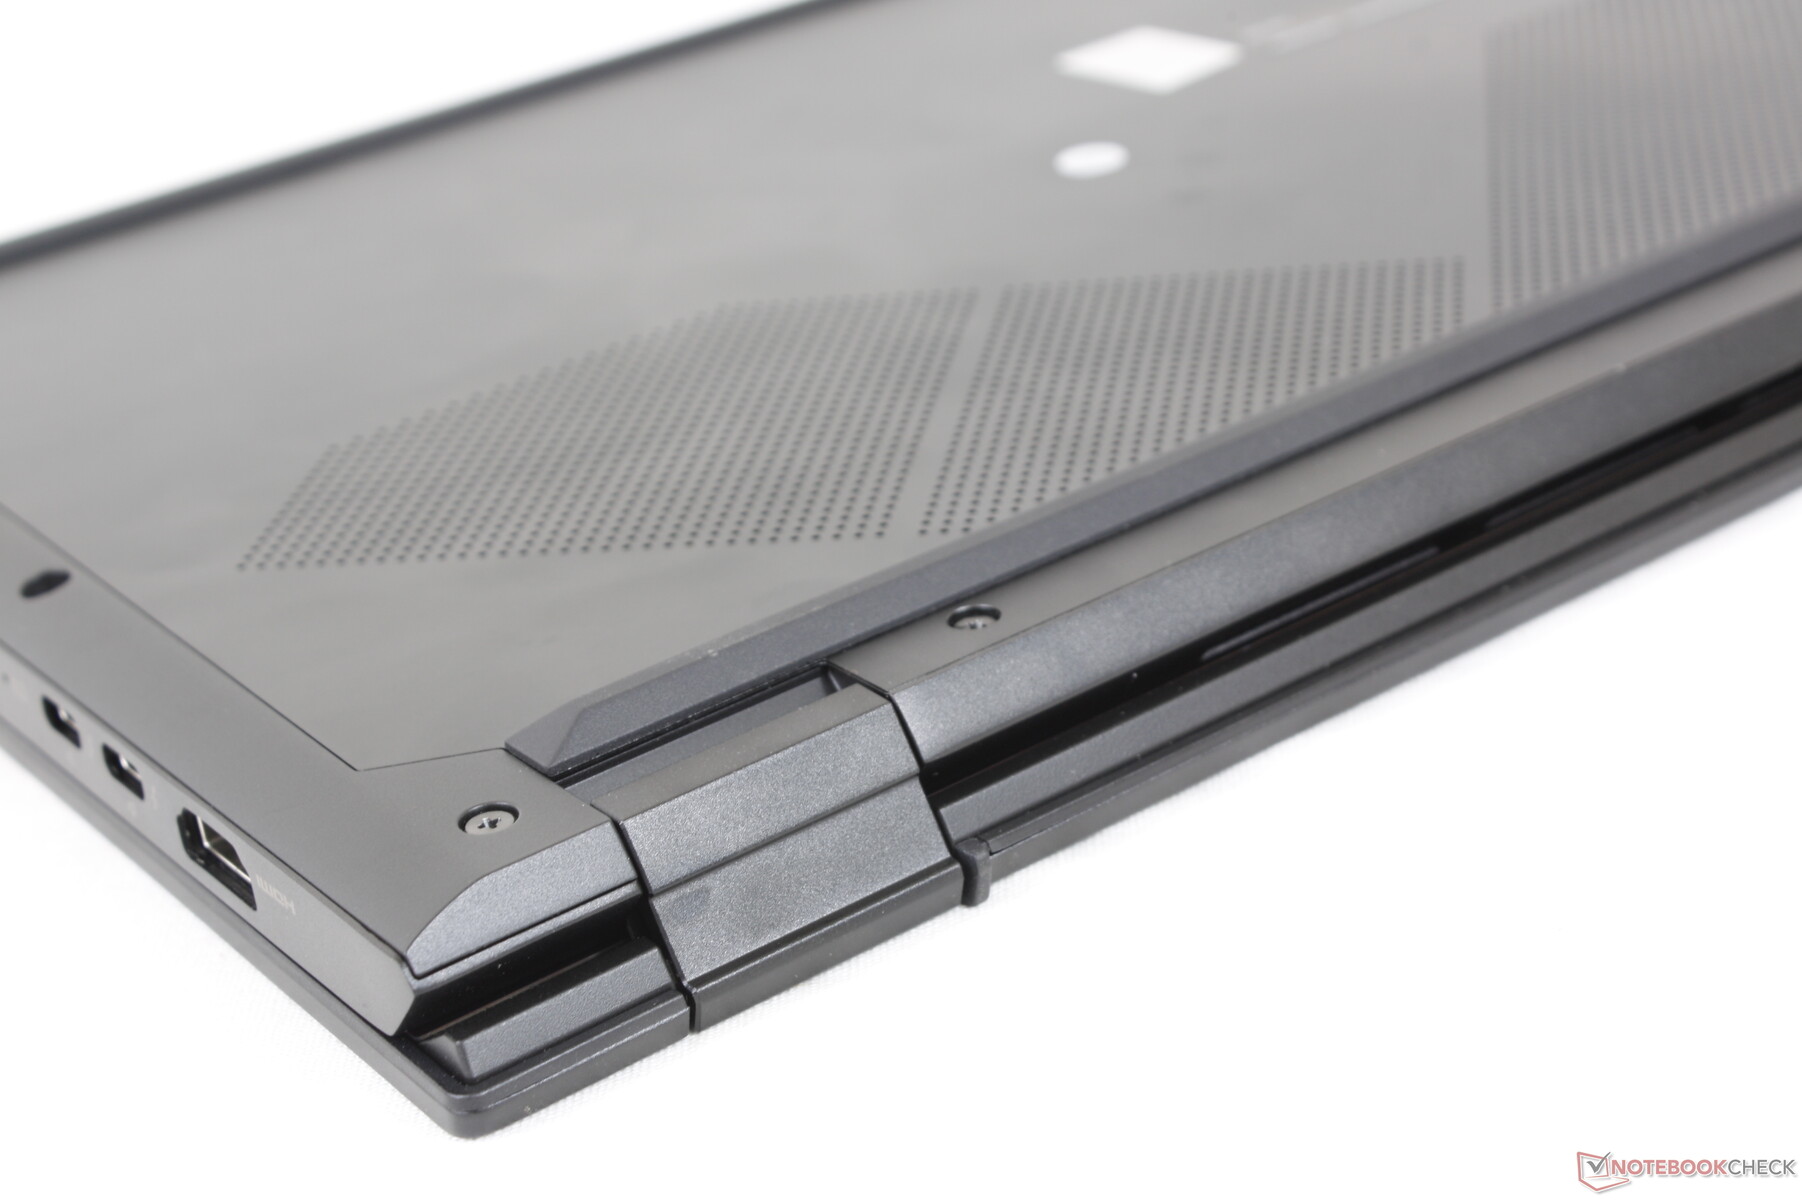
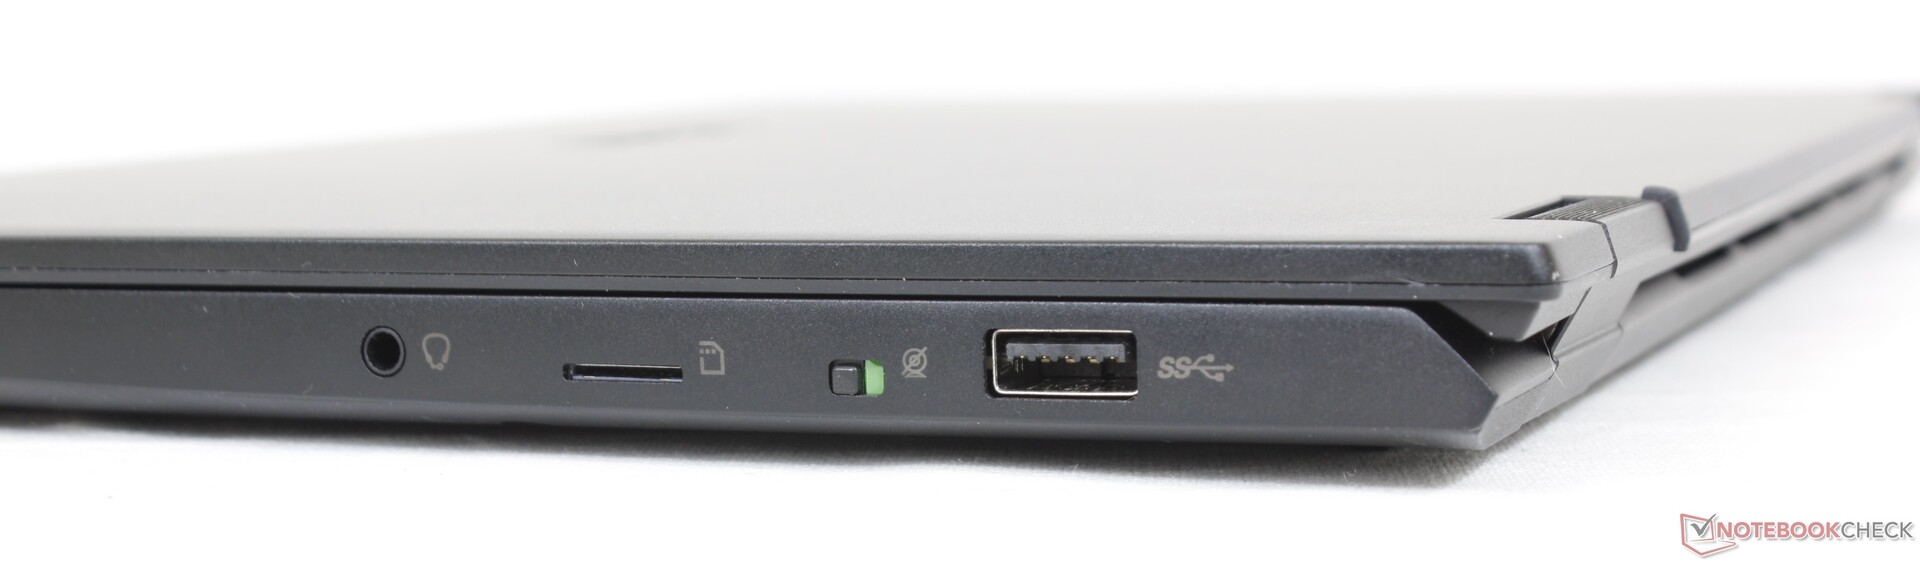
Ce modèle convertible comprend tous les ports de la version originale à clapet, plus une interface HDMI de taille normale et un commutateur de webcam. Il aurait été intéressant de voir un verrou Kensington, cependant, puisque la série Summit est plus orientée vers les professionnels. Le positionnement des ports aurait pu être amélioré sur le bord gauche, où les trois ports sont un peu trop serrés les uns contre les autres.
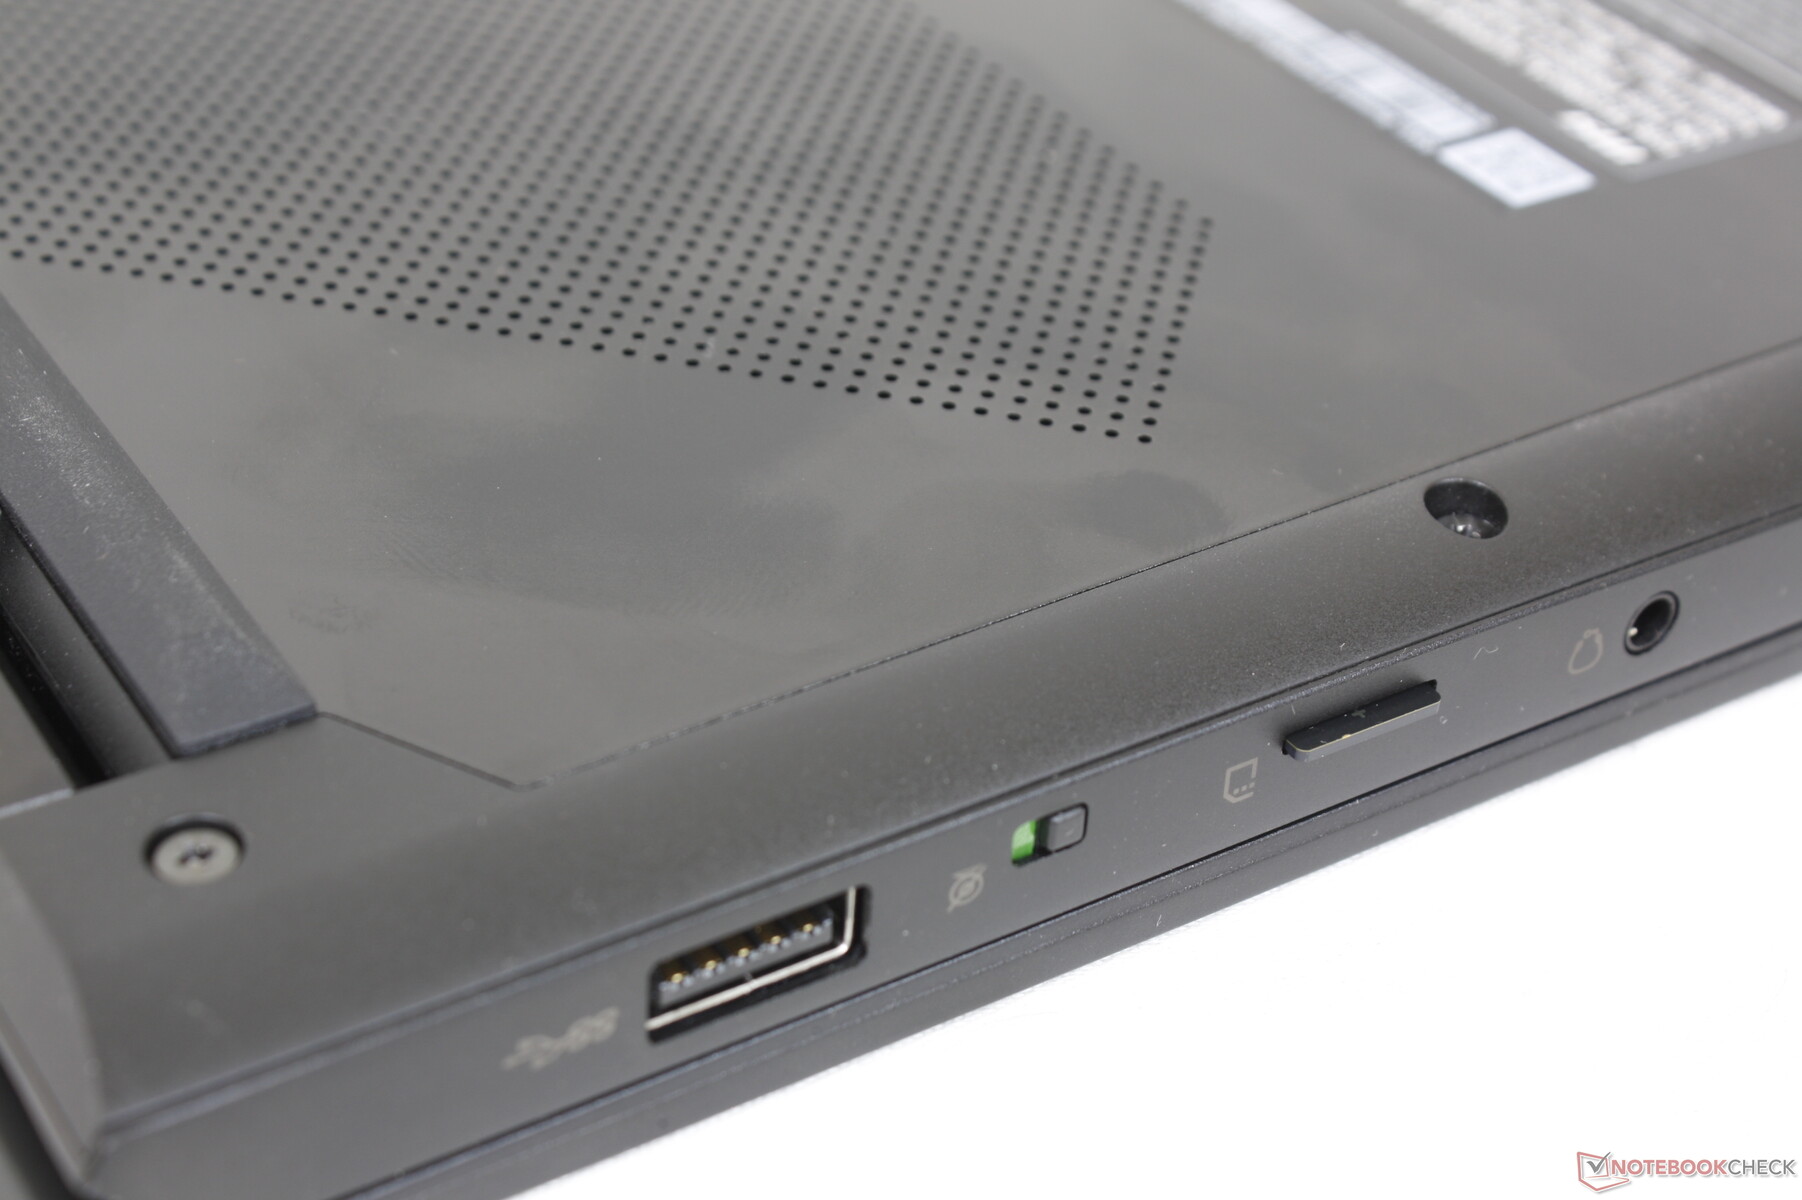
Lecteur de carte SD
Malheureusement, le lecteur MicroSD intégré à ressort est plus lent que celui du Summit E14 à clapet. Le transfert de 1 Go d'images depuis notre carte de test UHS-II sur le bureau supérieur prend environ 21 secondes, contre seulement 6 à 7 secondes sur le Summit E14.
| SD Card Reader | |
| average JPG Copy Test (av. of 3 runs) | |
| MSI Summit E14 A11SCS (AV Pro V60) | |
| Dell Latitude 9420 2-in-1 (AV PRO microSD 128 GB V60) | |
| LG Gram 14T90P (AV Pro V60) | |
| MSI Summit E14 Flip Evo A12MT (AV Pro V60) | |
| maximum AS SSD Seq Read Test (1GB) | |
| MSI Summit E14 A11SCS (AV Pro V60) | |
| Dell Latitude 9420 2-in-1 (AV PRO microSD 128 GB V60) | |
| LG Gram 14T90P (AV Pro V60) | |
| MSI Summit E14 Flip Evo A12MT (AV Pro V60) | |
Communication
Un Intel AX1675s est fourni en standard pour la connectivité Wi-Fi 6E et Bluetooth 5.2. Nous n'avons rencontré aucun problème lorsque nous l'avons couplé à notre réseau 6 GHz.
| Networking | |
| iperf3 transmit AX12 | |
| MSI Summit E14 A11SCS | |
| Dell Latitude 9420 2-in-1 | |
| iperf3 receive AX12 | |
| MSI Summit E14 A11SCS | |
| Dell Latitude 9420 2-in-1 | |
| iperf3 receive AXE11000 6GHz | |
| Asus VivoBook S 14X S5402Z | |
| MSI Summit E14 Flip Evo A12MT | |
| iperf3 transmit AXE11000 6GHz | |
| MSI Summit E14 Flip Evo A12MT | |
| Asus VivoBook S 14X S5402Z | |
Webcam
La webcam est de 2 MP, contrairement à la plupart des autres ordinateurs portables où les capteurs de 1 MP sont encore courants. Windows Hello est pris en charge.
Pour la confidentialité, le modèle s'appuie sur un interrupteur électronique pour désactiver la webcam au lieu d'un obturateur physique.


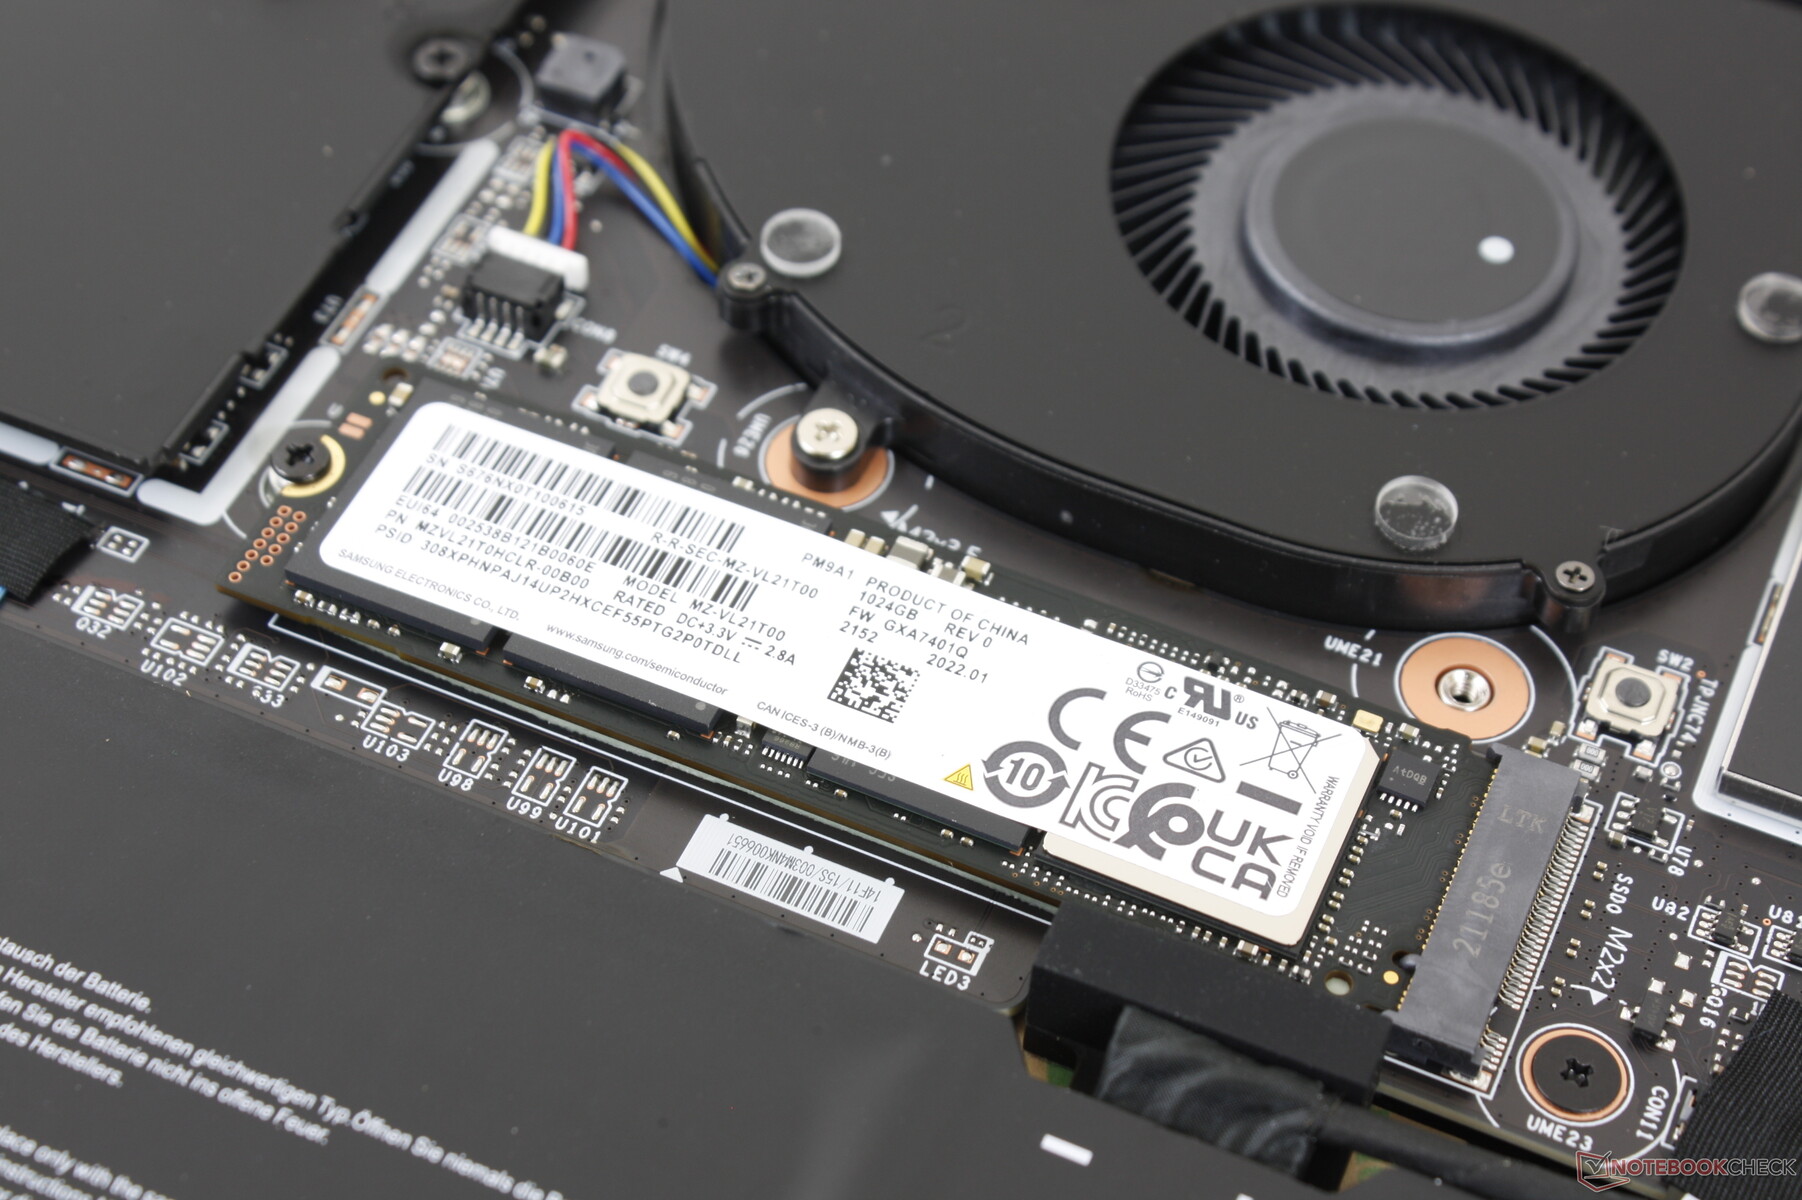
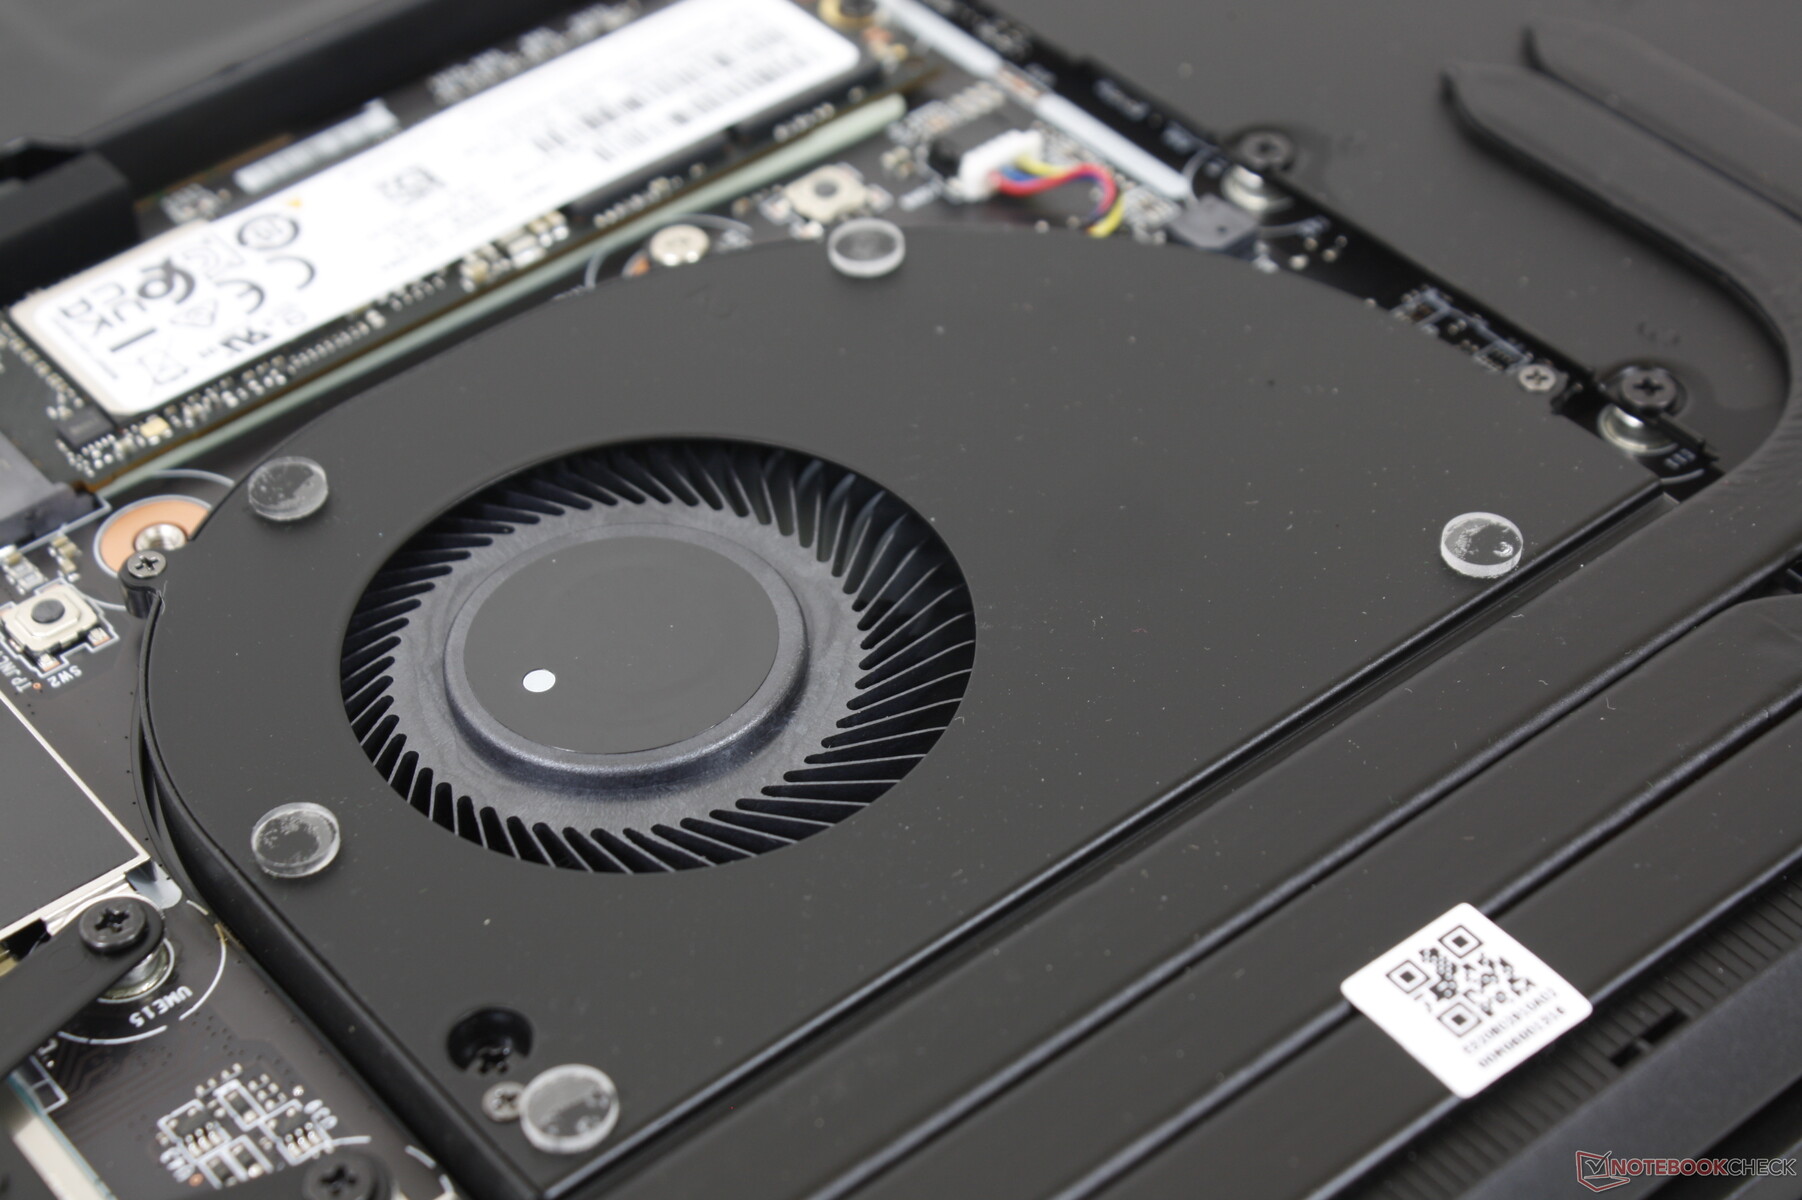
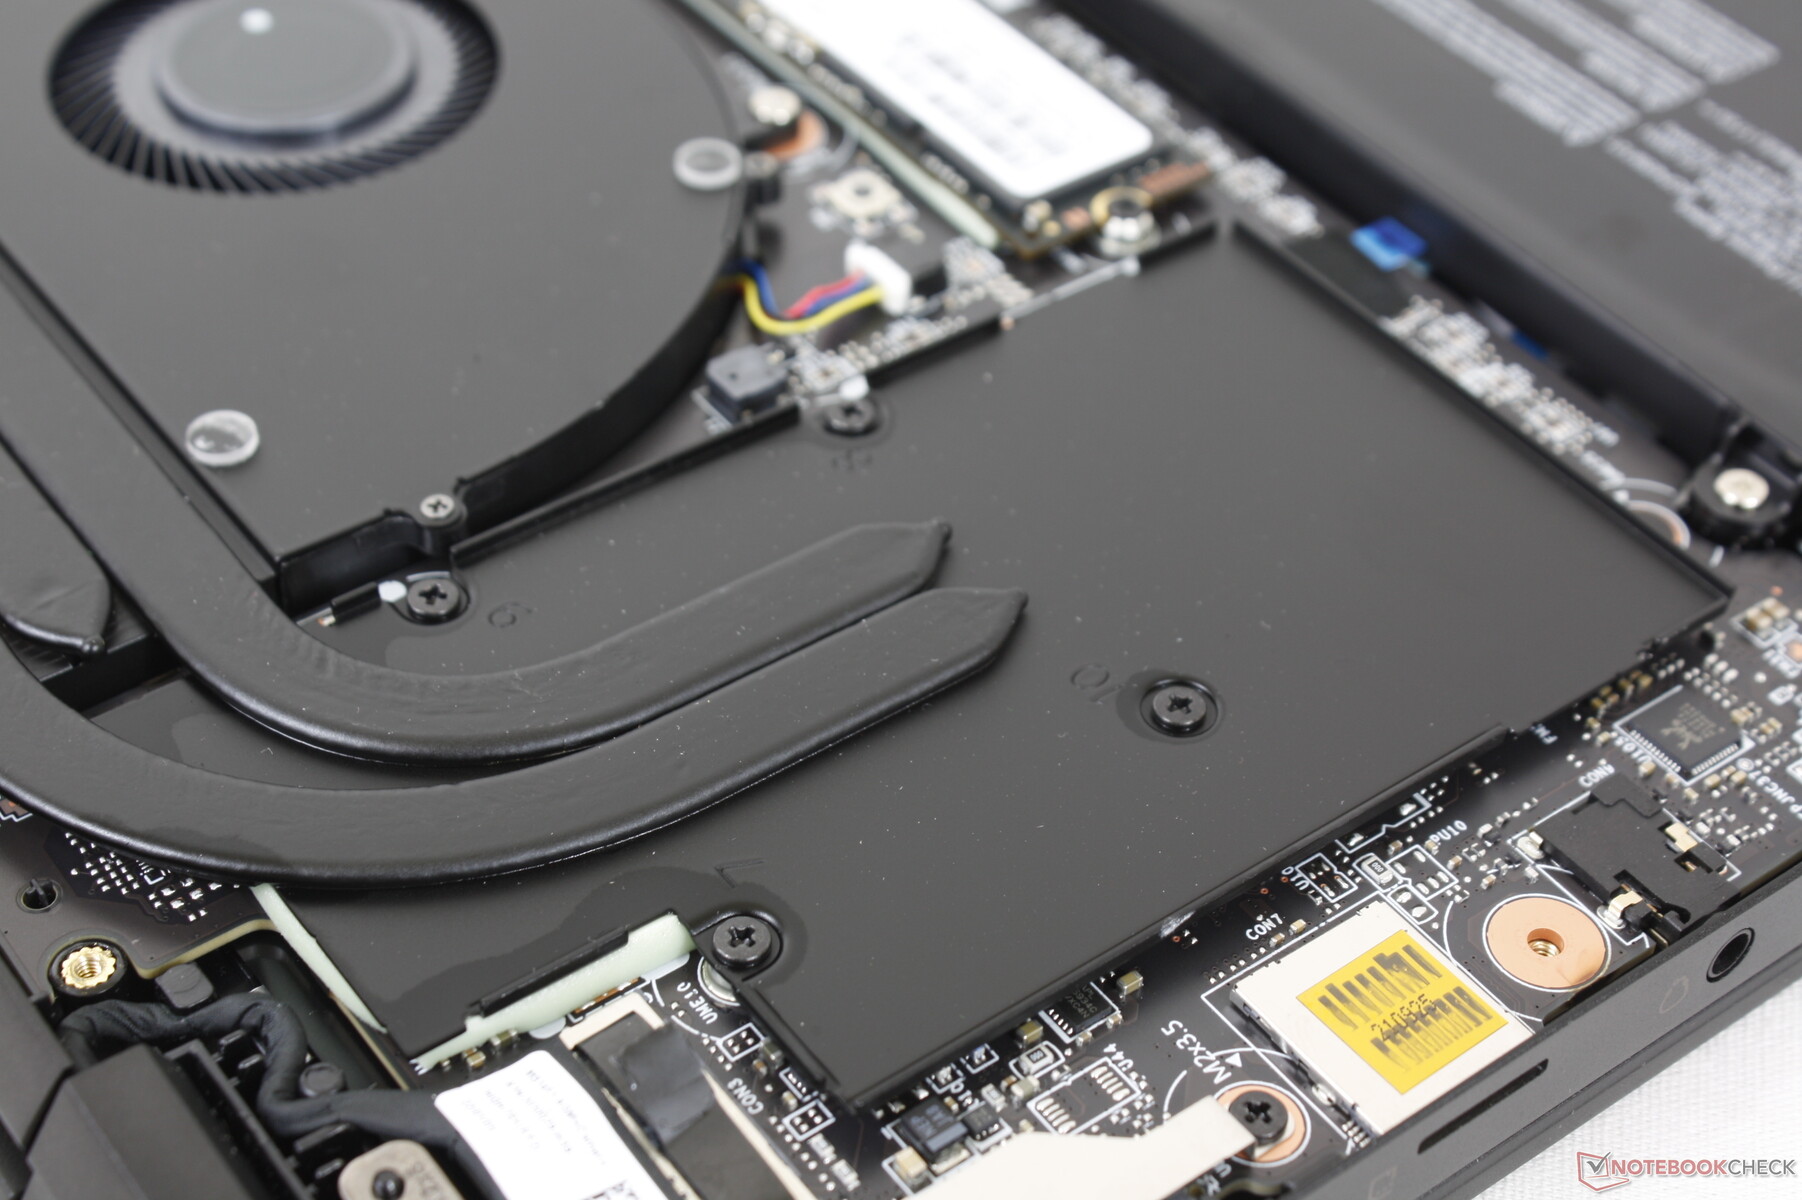
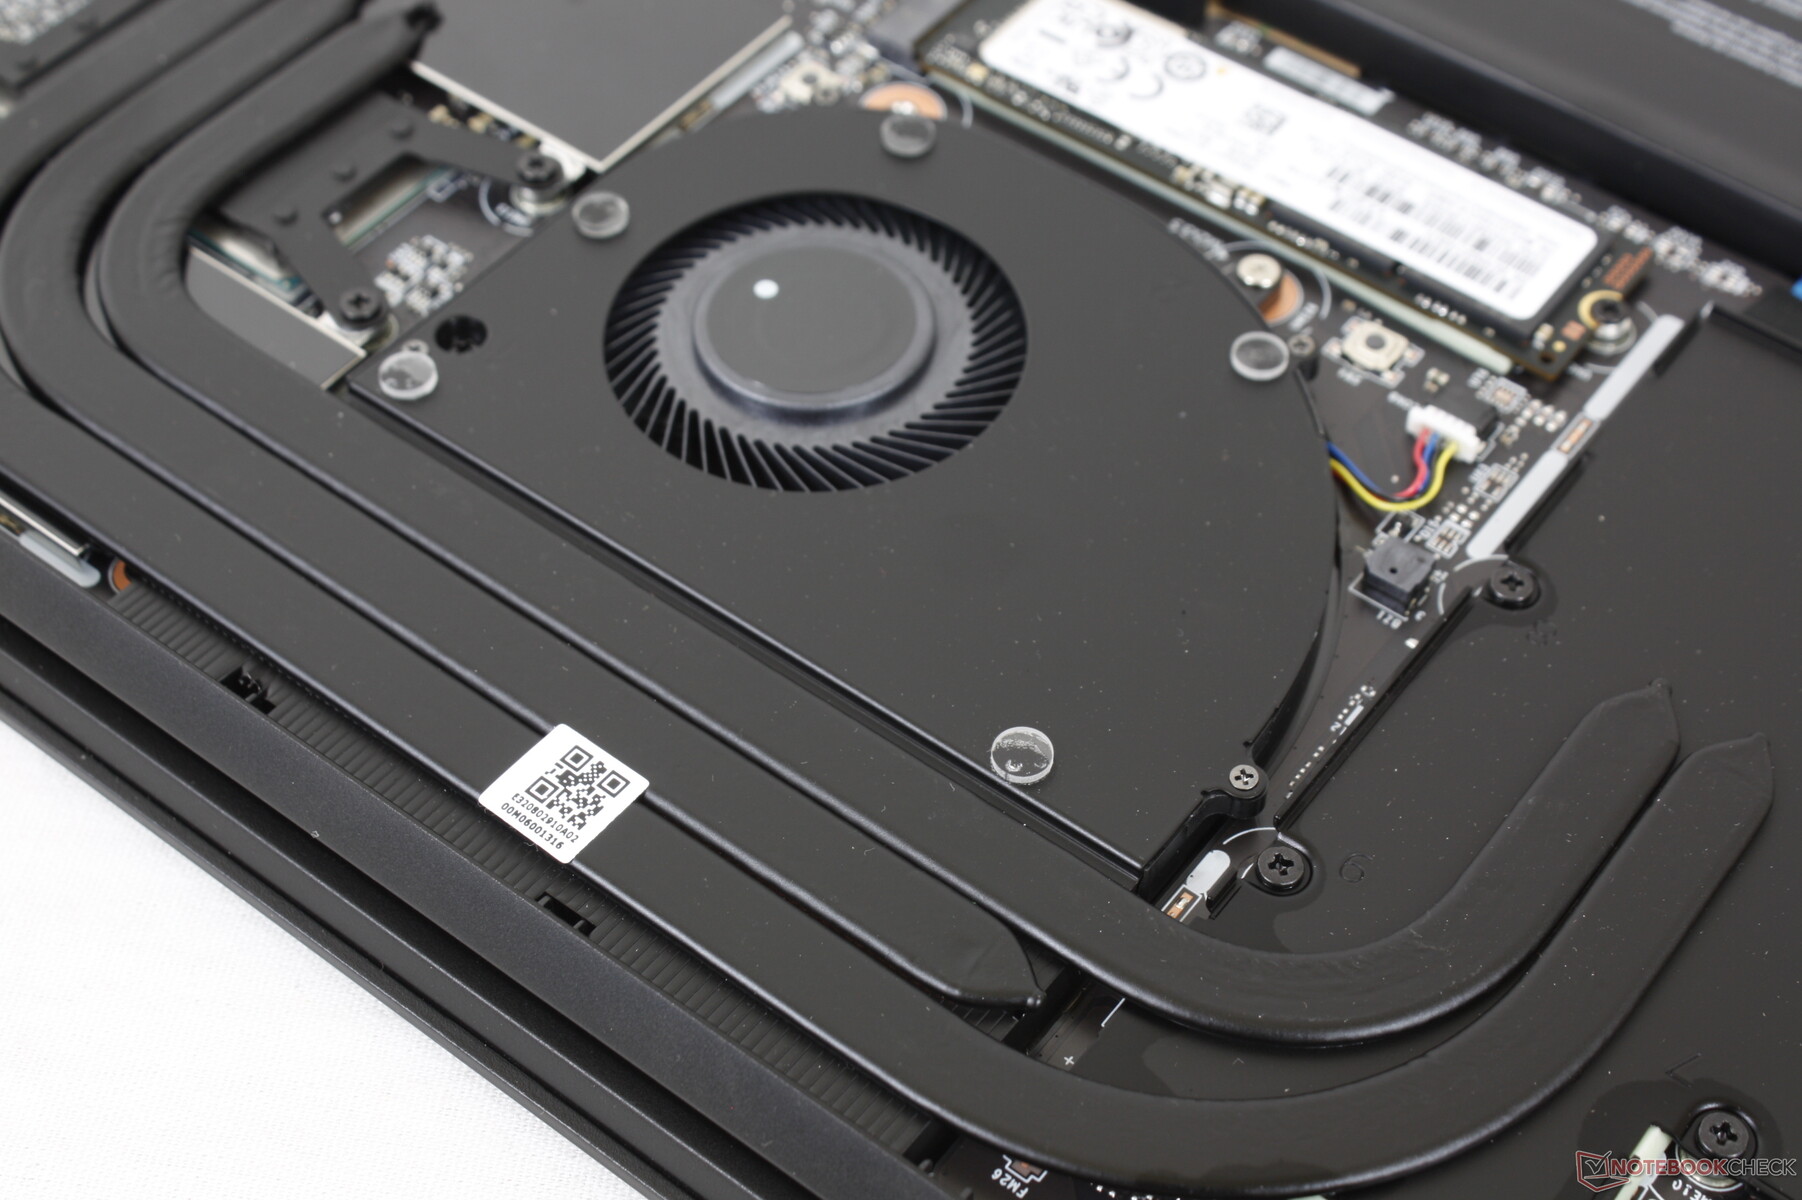
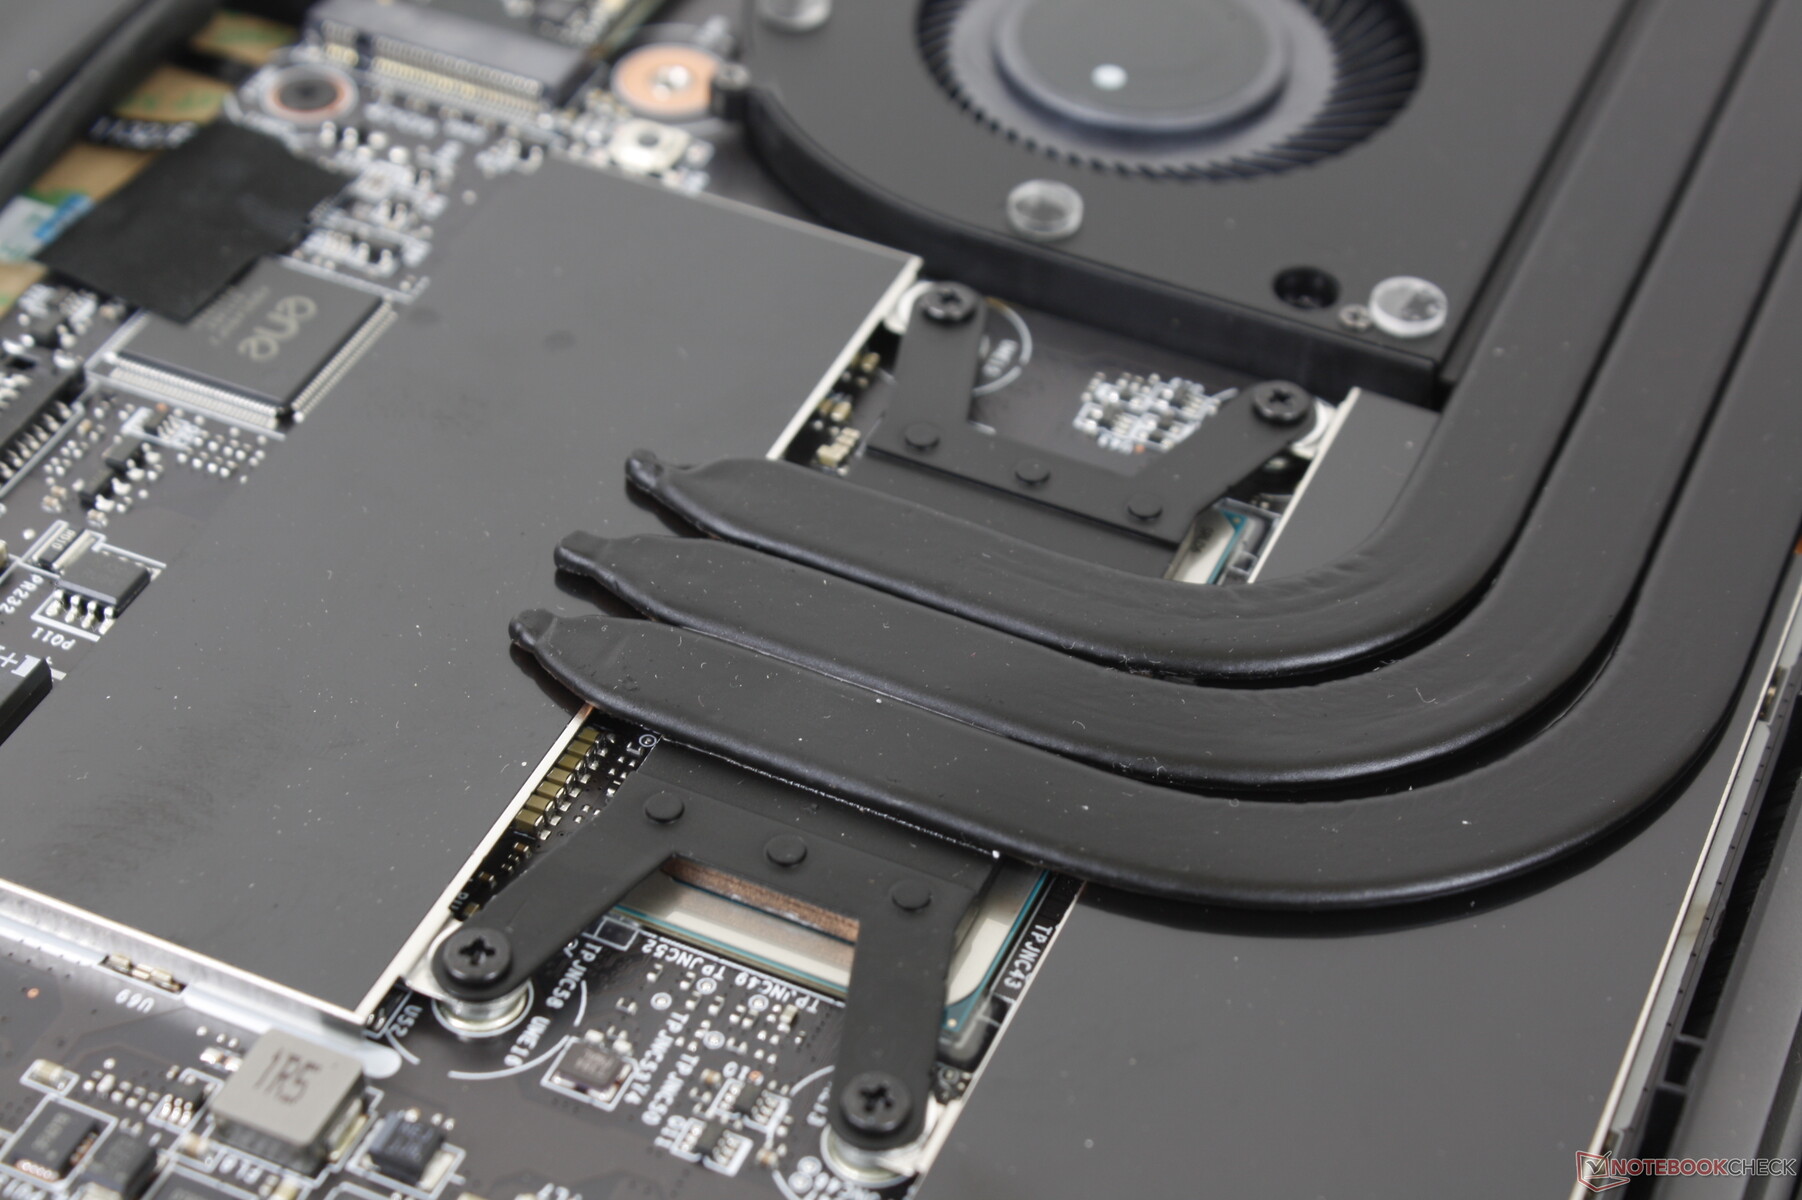
Maintenance
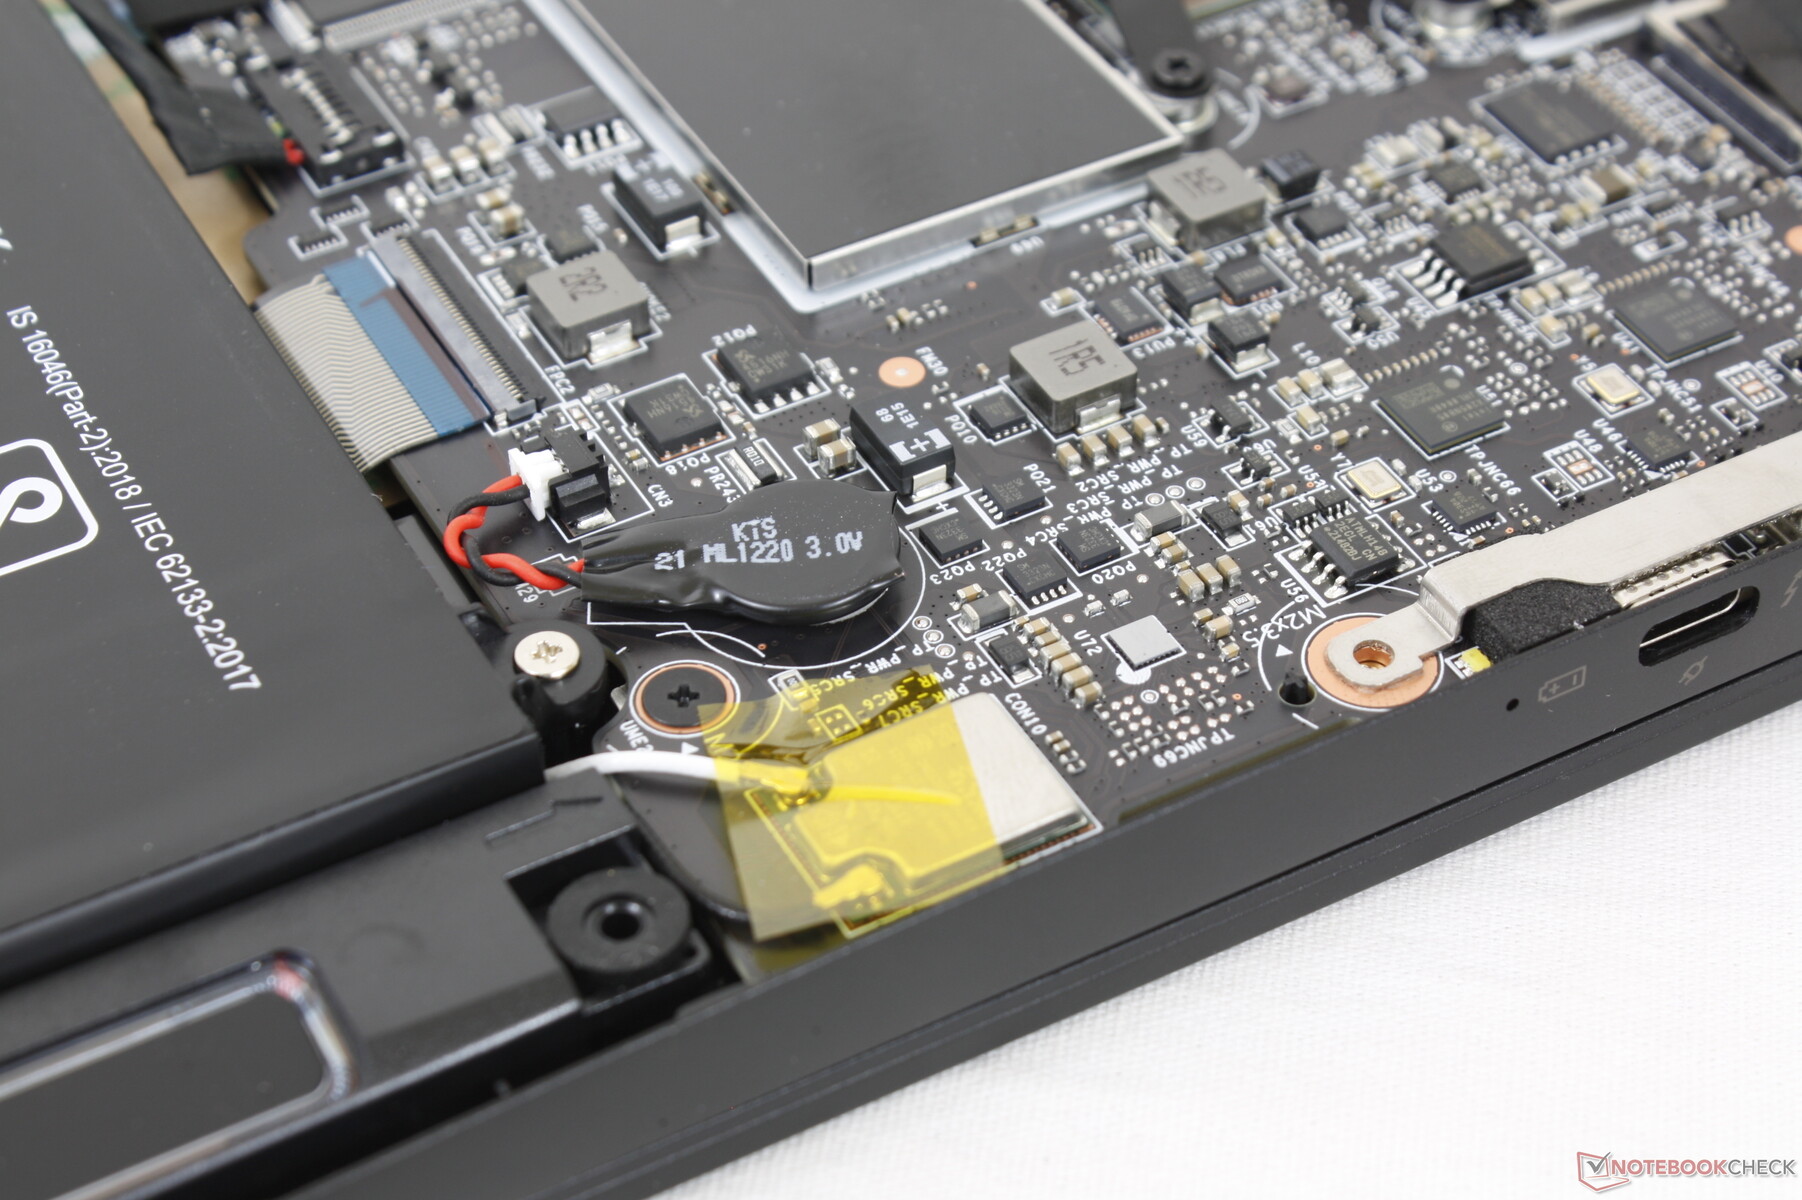
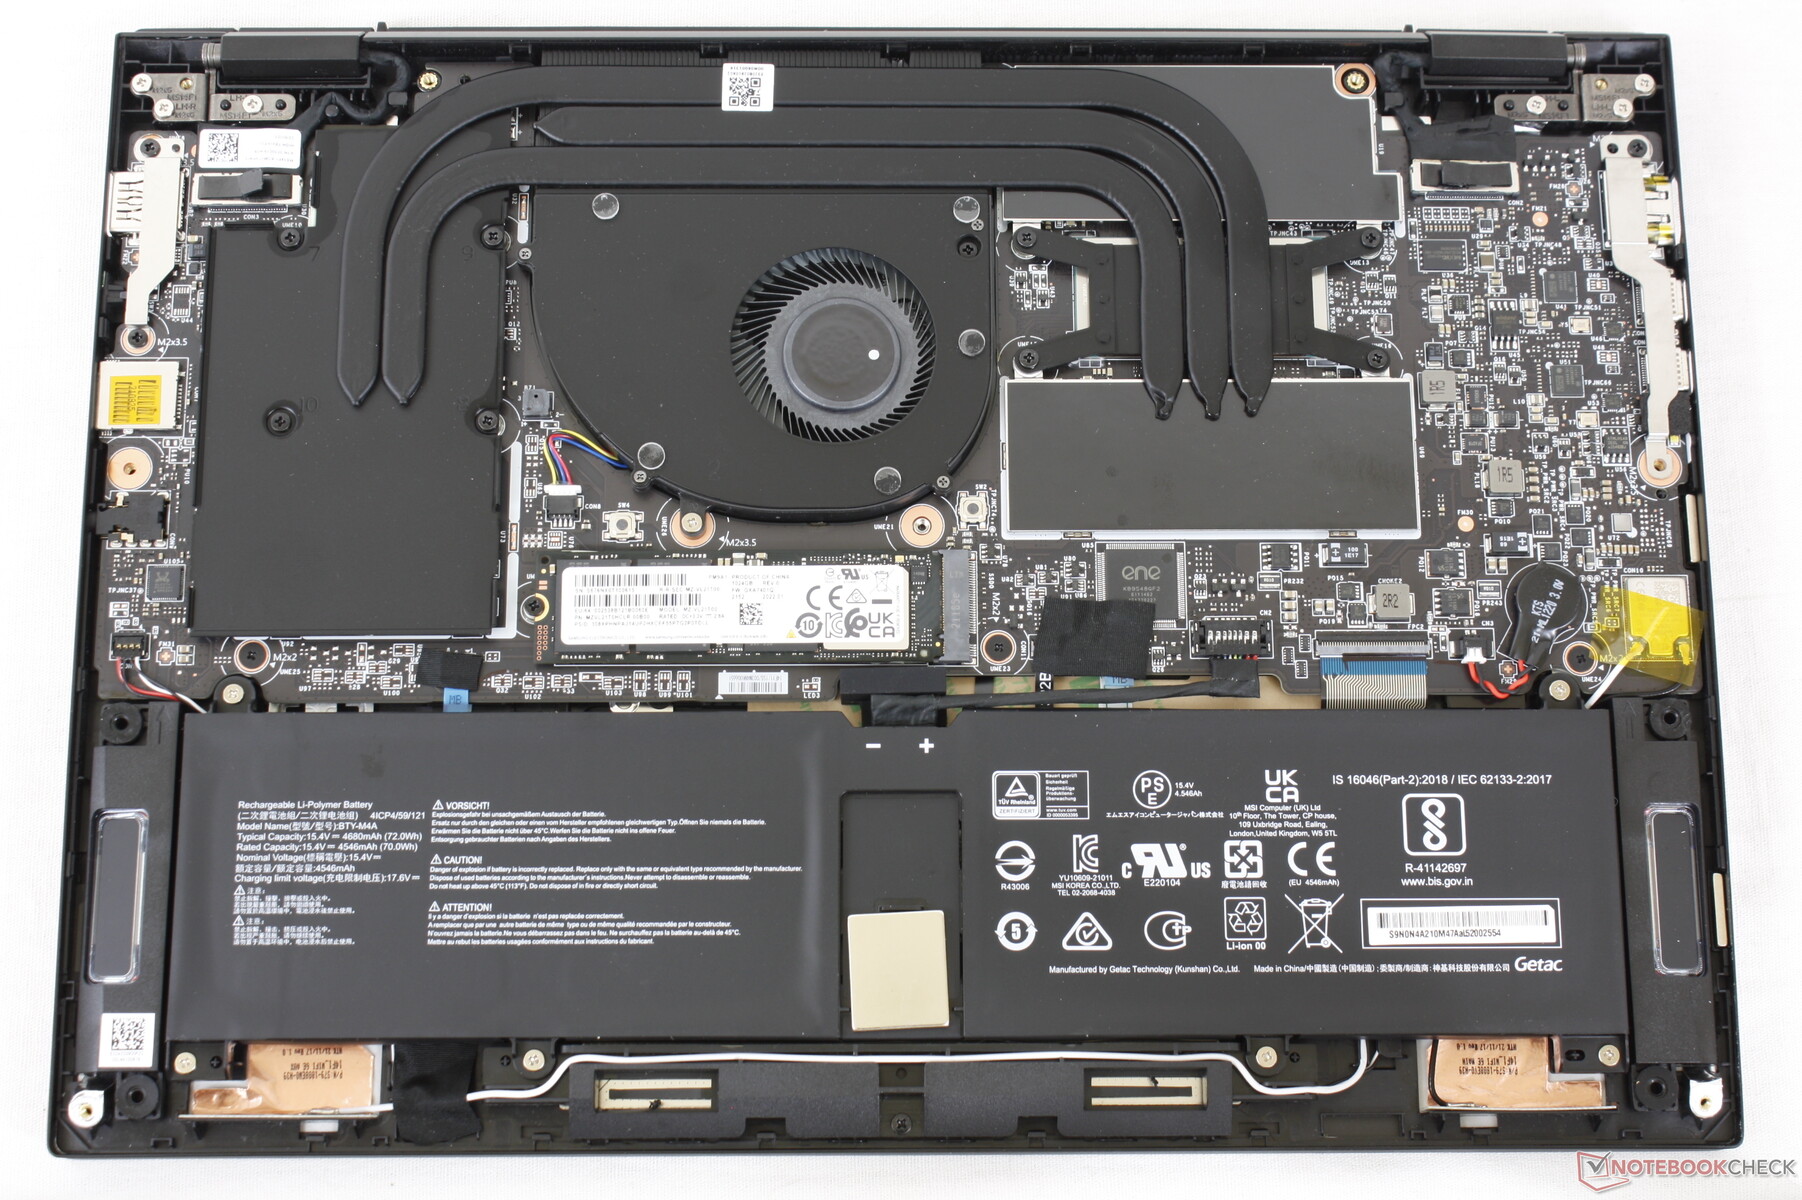
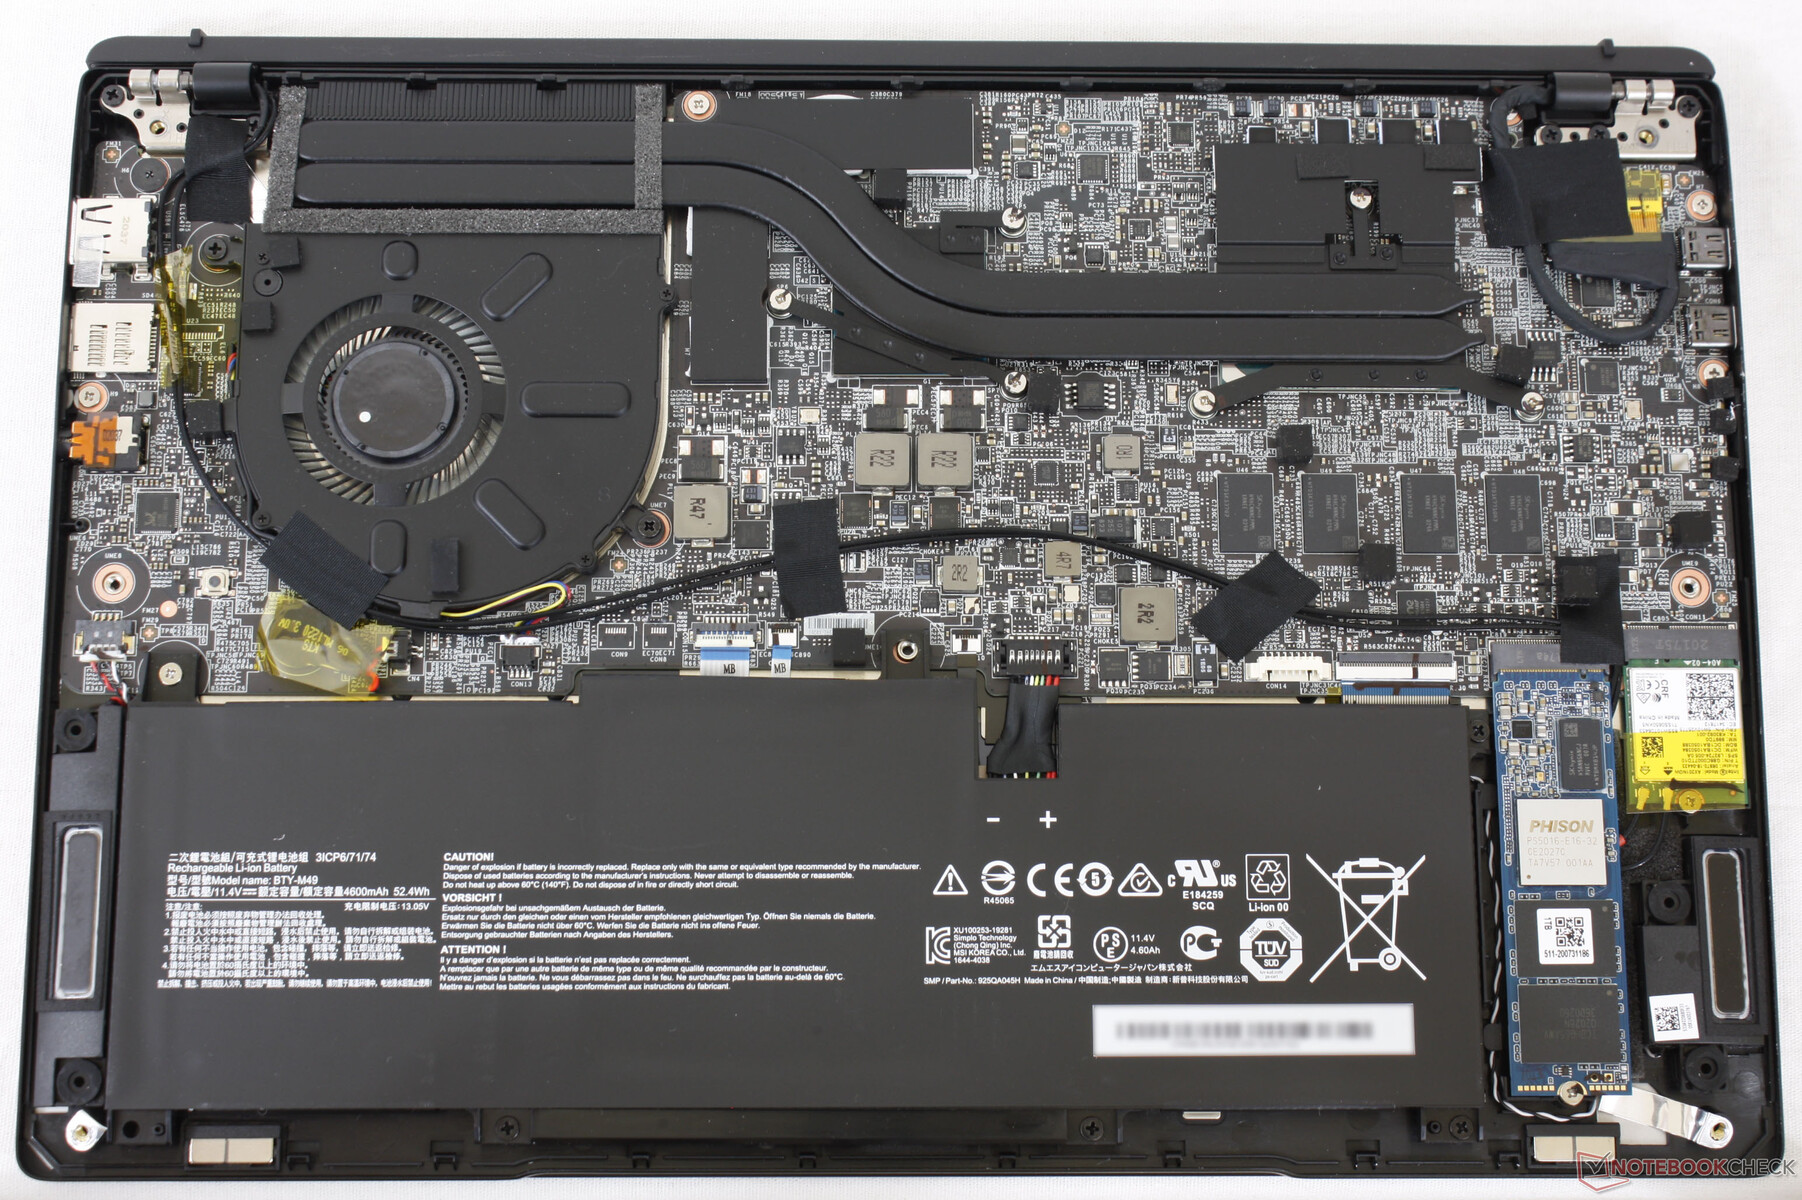
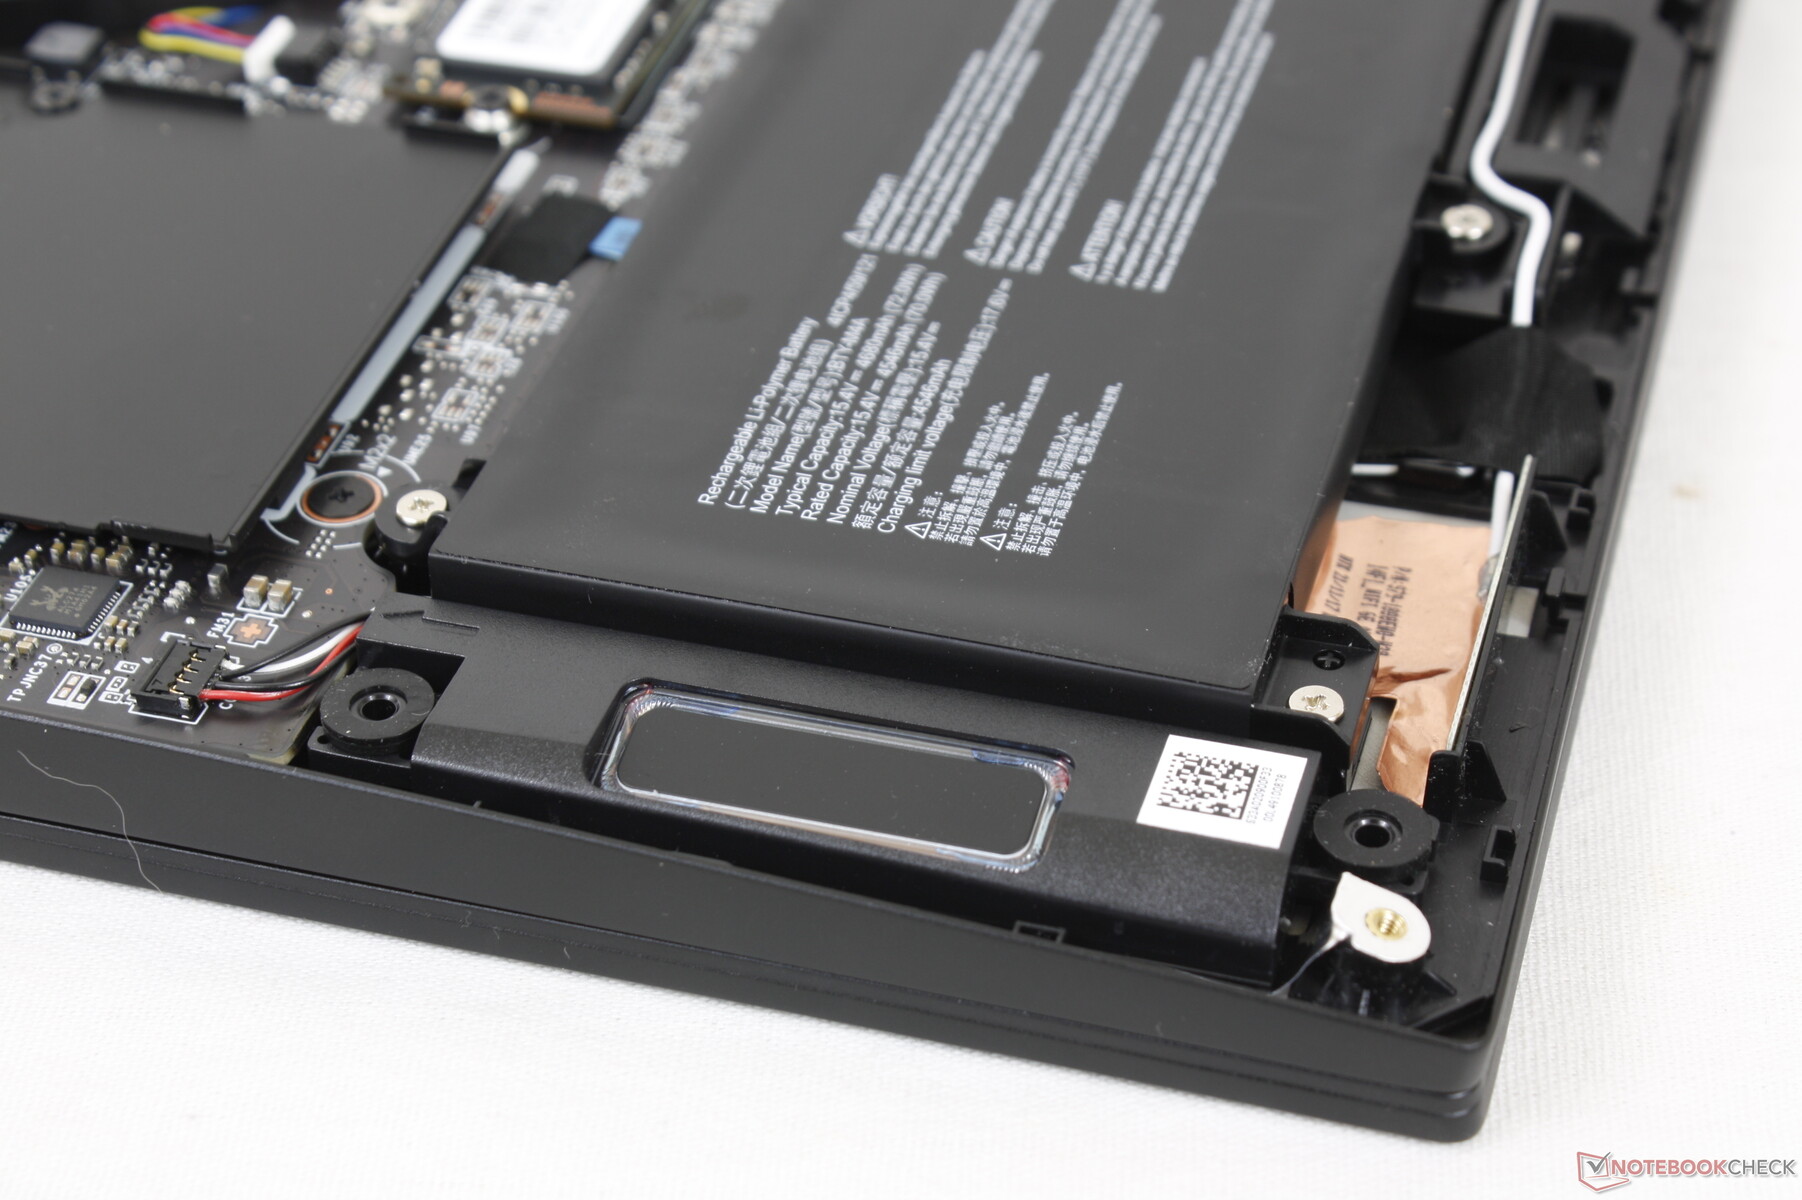
Le panneau inférieur est fixé par seulement 9 vis Philips pour un retrait facile. Cependant, gardez à l'esprit que vous devez briser un autocollant de scellement d'usine afin d'accéder à l'une des vis. Il n'y a pas beaucoup de possibilités de mise à niveau car il n'y a qu'un seul emplacement de stockage et les modules RAM et WLAN sont soudés sur la carte.
La disposition et le design de la carte mère sont complètement différents de ceux du Summit E14, comme le montrent les images comparatives ci-dessous.
Accessoires et garantie
La boîte de détail comprend le stylet actif de MSI, qui se vend actuellement plus de 100 dollars américains. La garantie standard limitée d'un an du fabricant s'applique.
Périphériques d'entrée - Pas de changements majeurs au sommet
Clavier
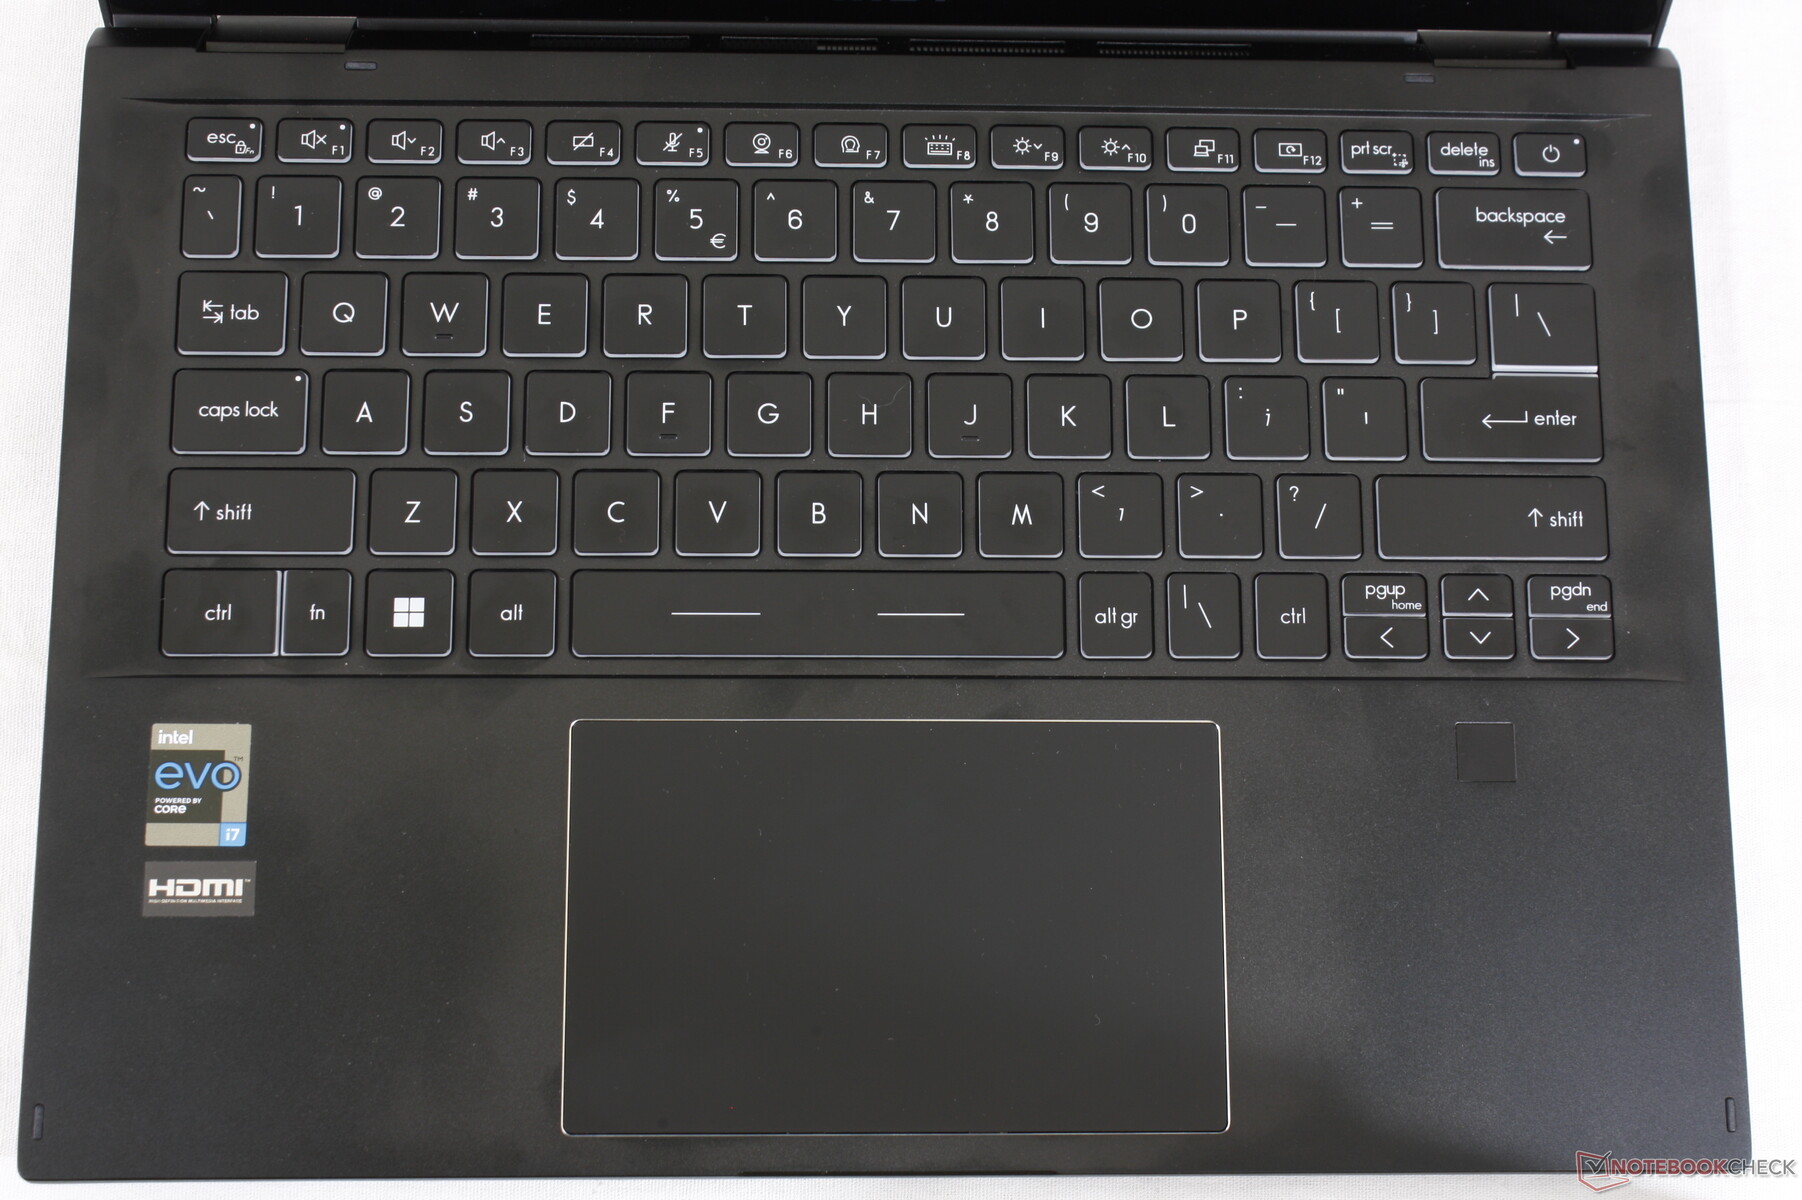
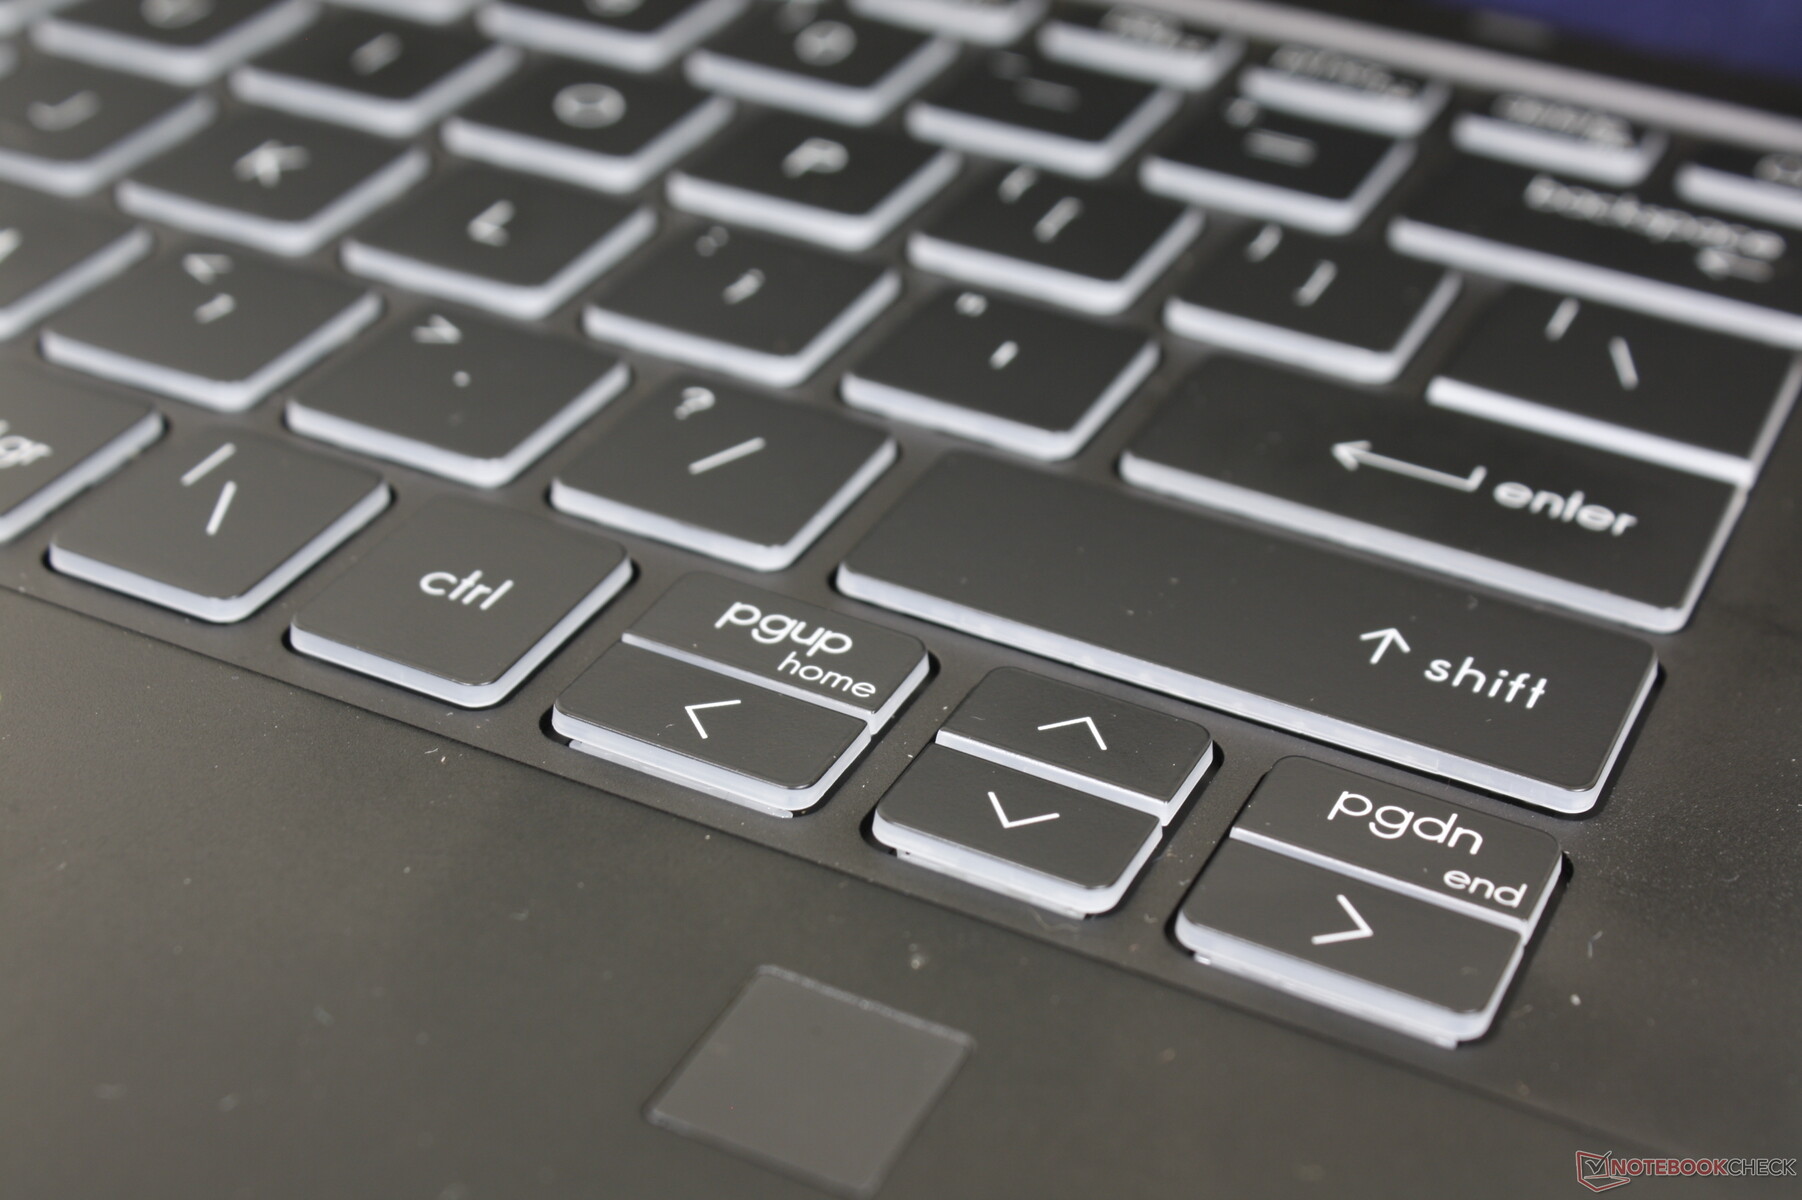
La disposition du clavier diffère de celle du Summit E14 à clapet. La colonne de droite des touches Del, Insert, PgDn et PgUp, par exemple, a disparu au profit d'un clavier plus court. L'expérience de frappe reste satisfaisante avec un bruit de touches plus fort que la moyenne et un retour légèrement plus doux que les touches d'un HP Spectre x360 14.
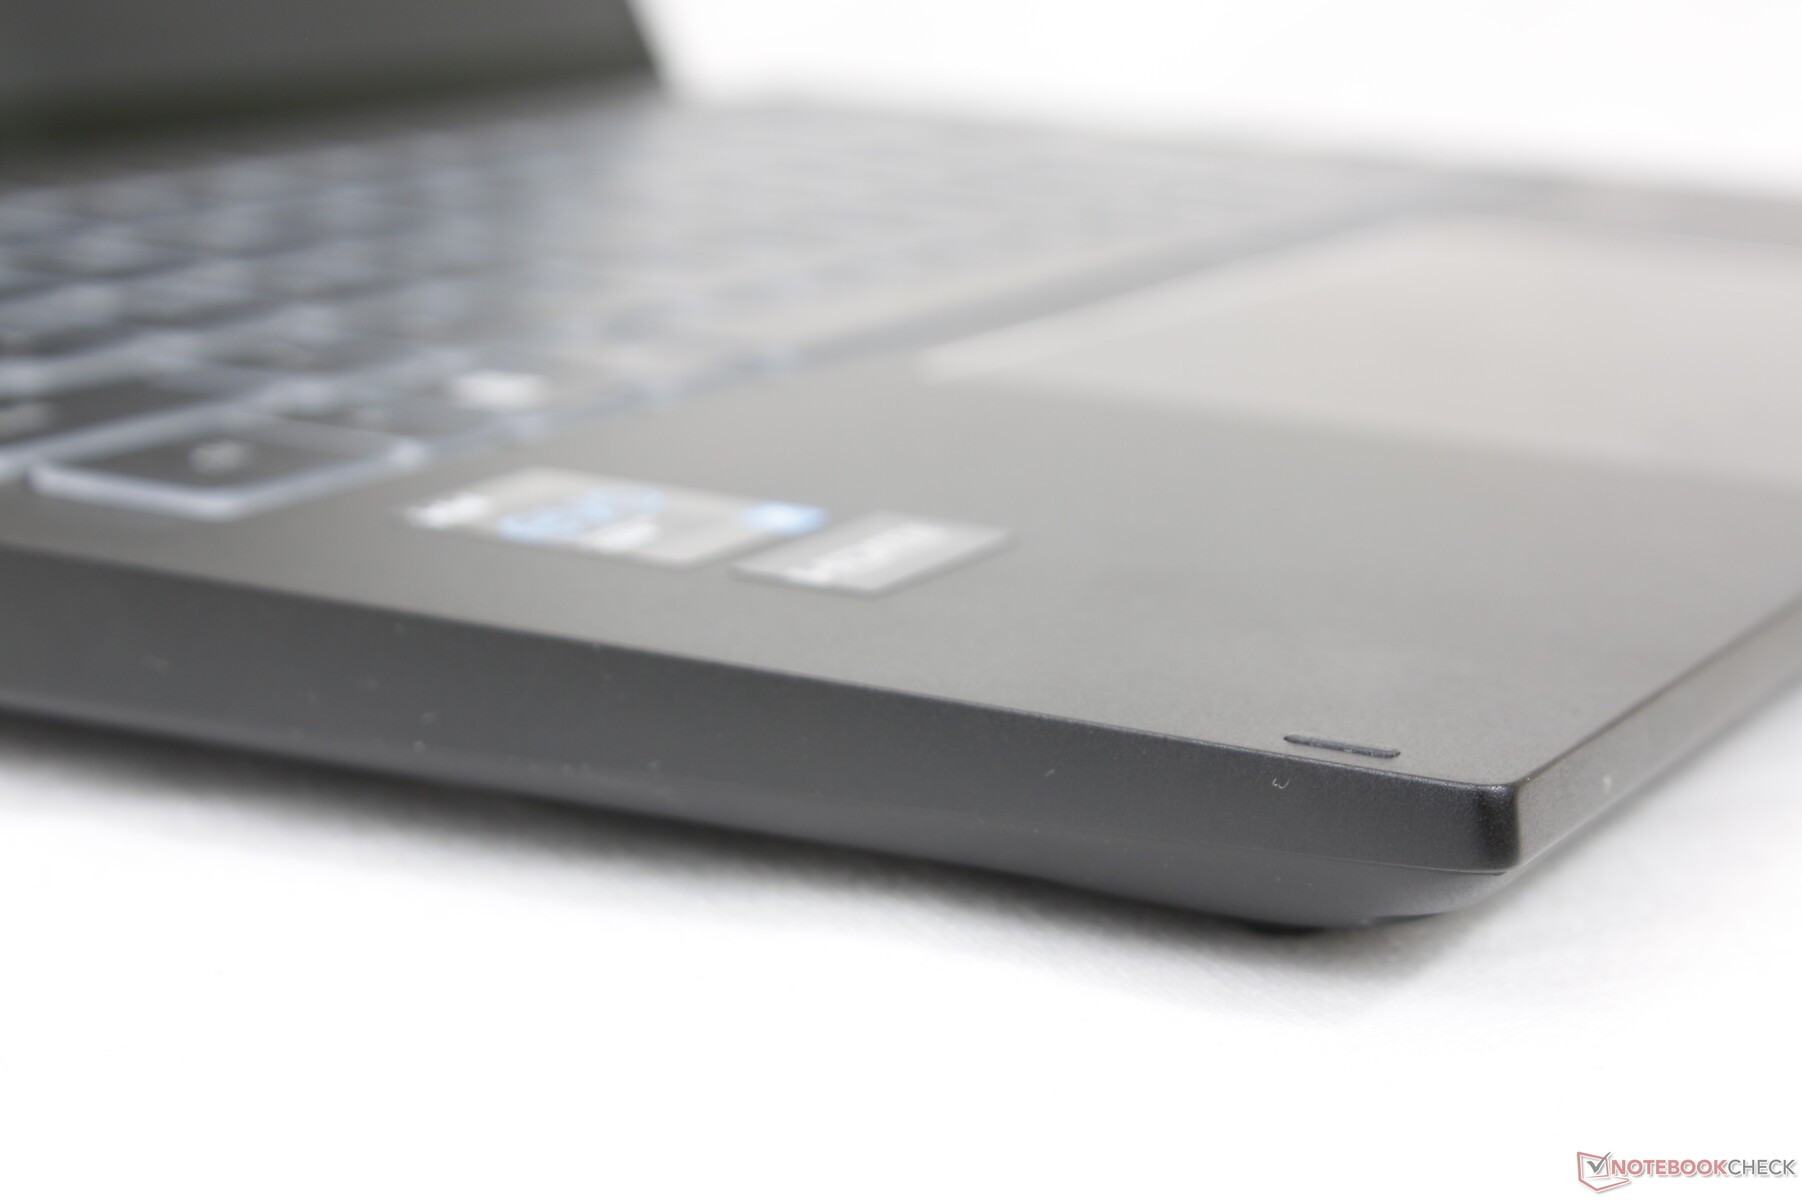
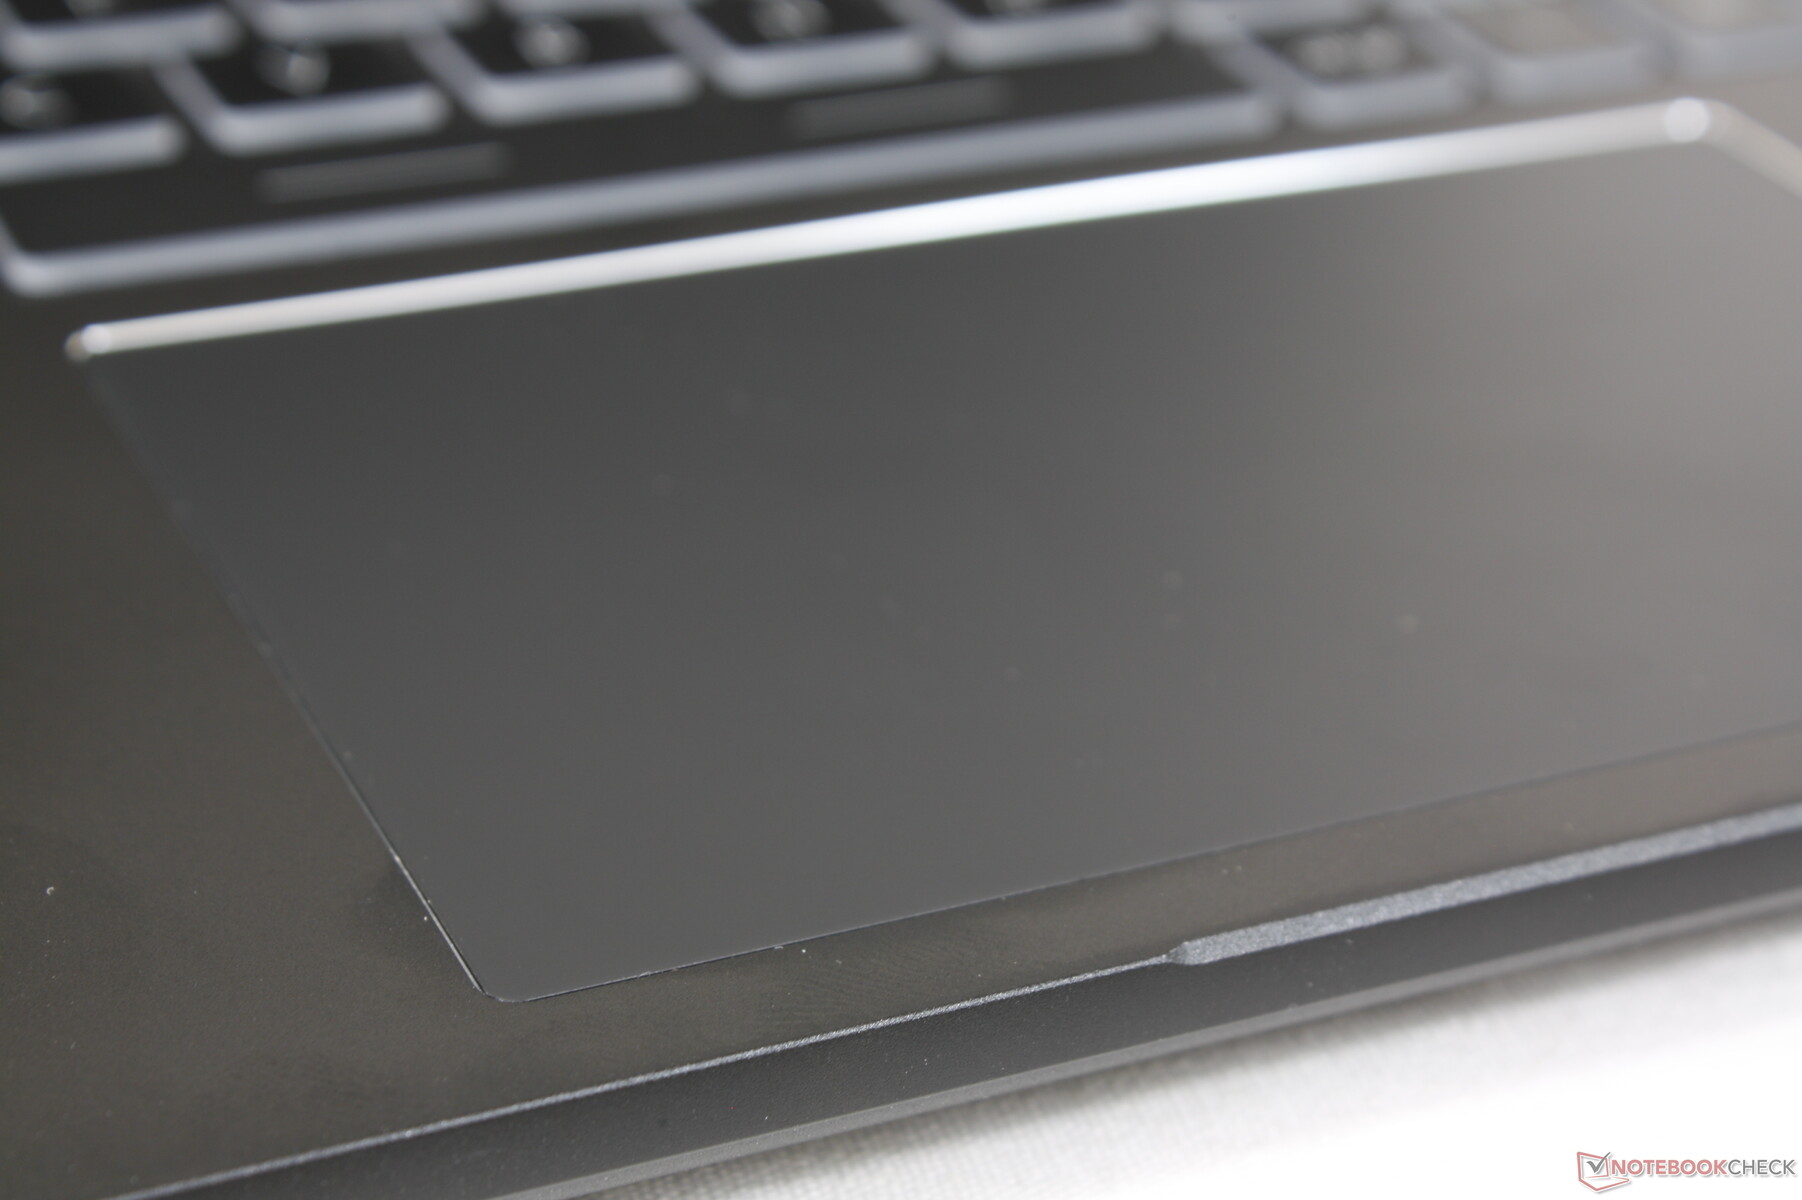
Pavé tactile
MSI a augmenté la taille du pavé tactile de 10,5 x 6,5 cm sur le Summit E14 à 12 x 7,5 cm sur la version convertible pour des entrées multi-touch plus confortables. Ses propriétés de glissement sont extrêmement douces, même lorsqu'il se déplace à faible vitesse, ce qui peut rendre les clics plus fins du curseur quelque peu difficiles. En revanche, le retour d'information des clics sur le pavé tactile est adéquat et il est facile d'effectuer des pressions successives rapides sans fatiguer le doigt
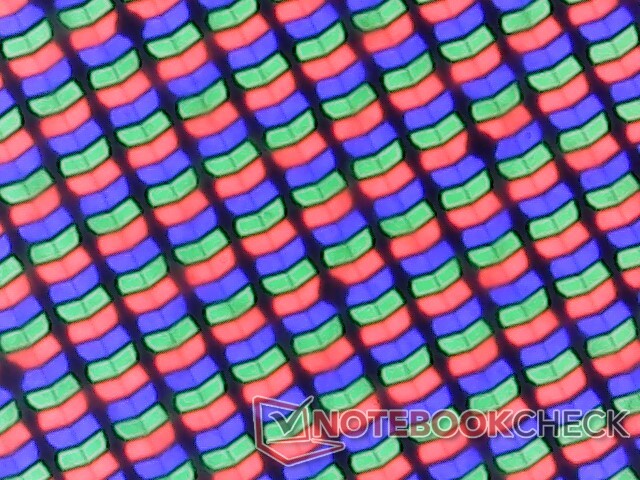
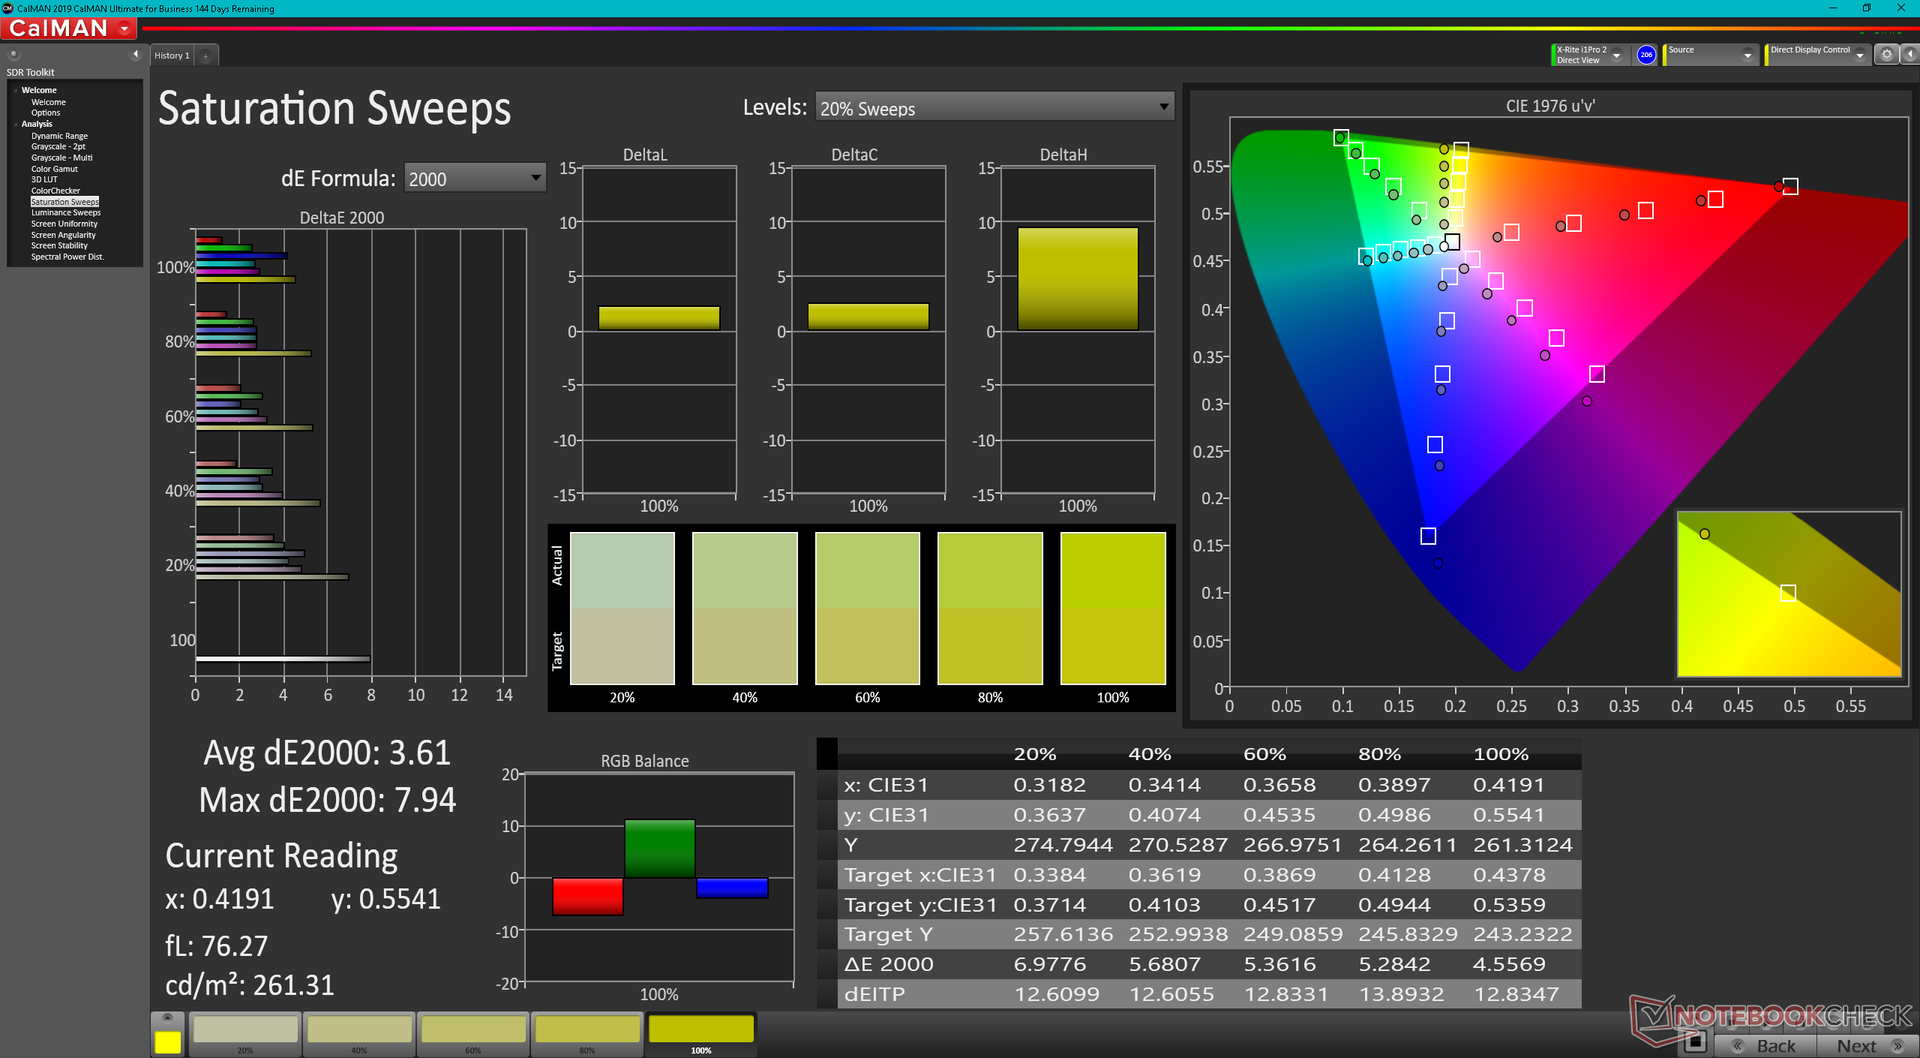
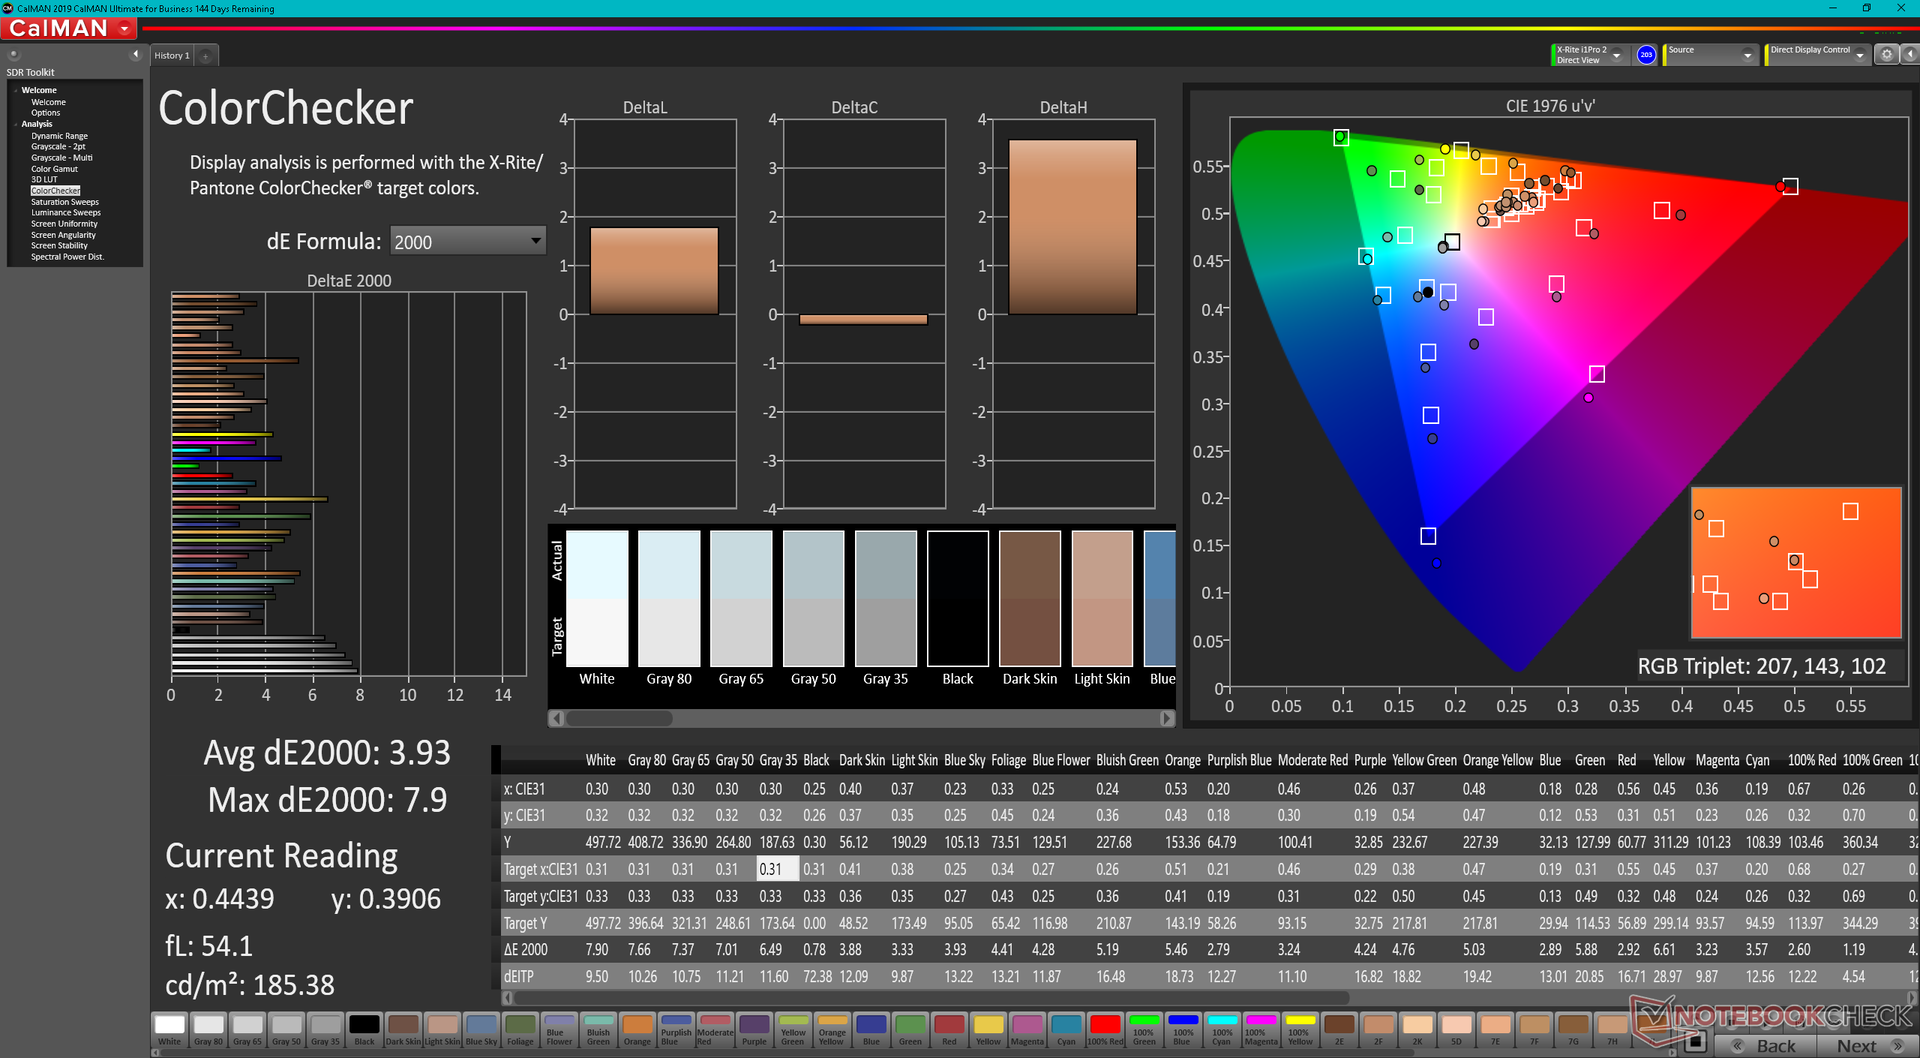
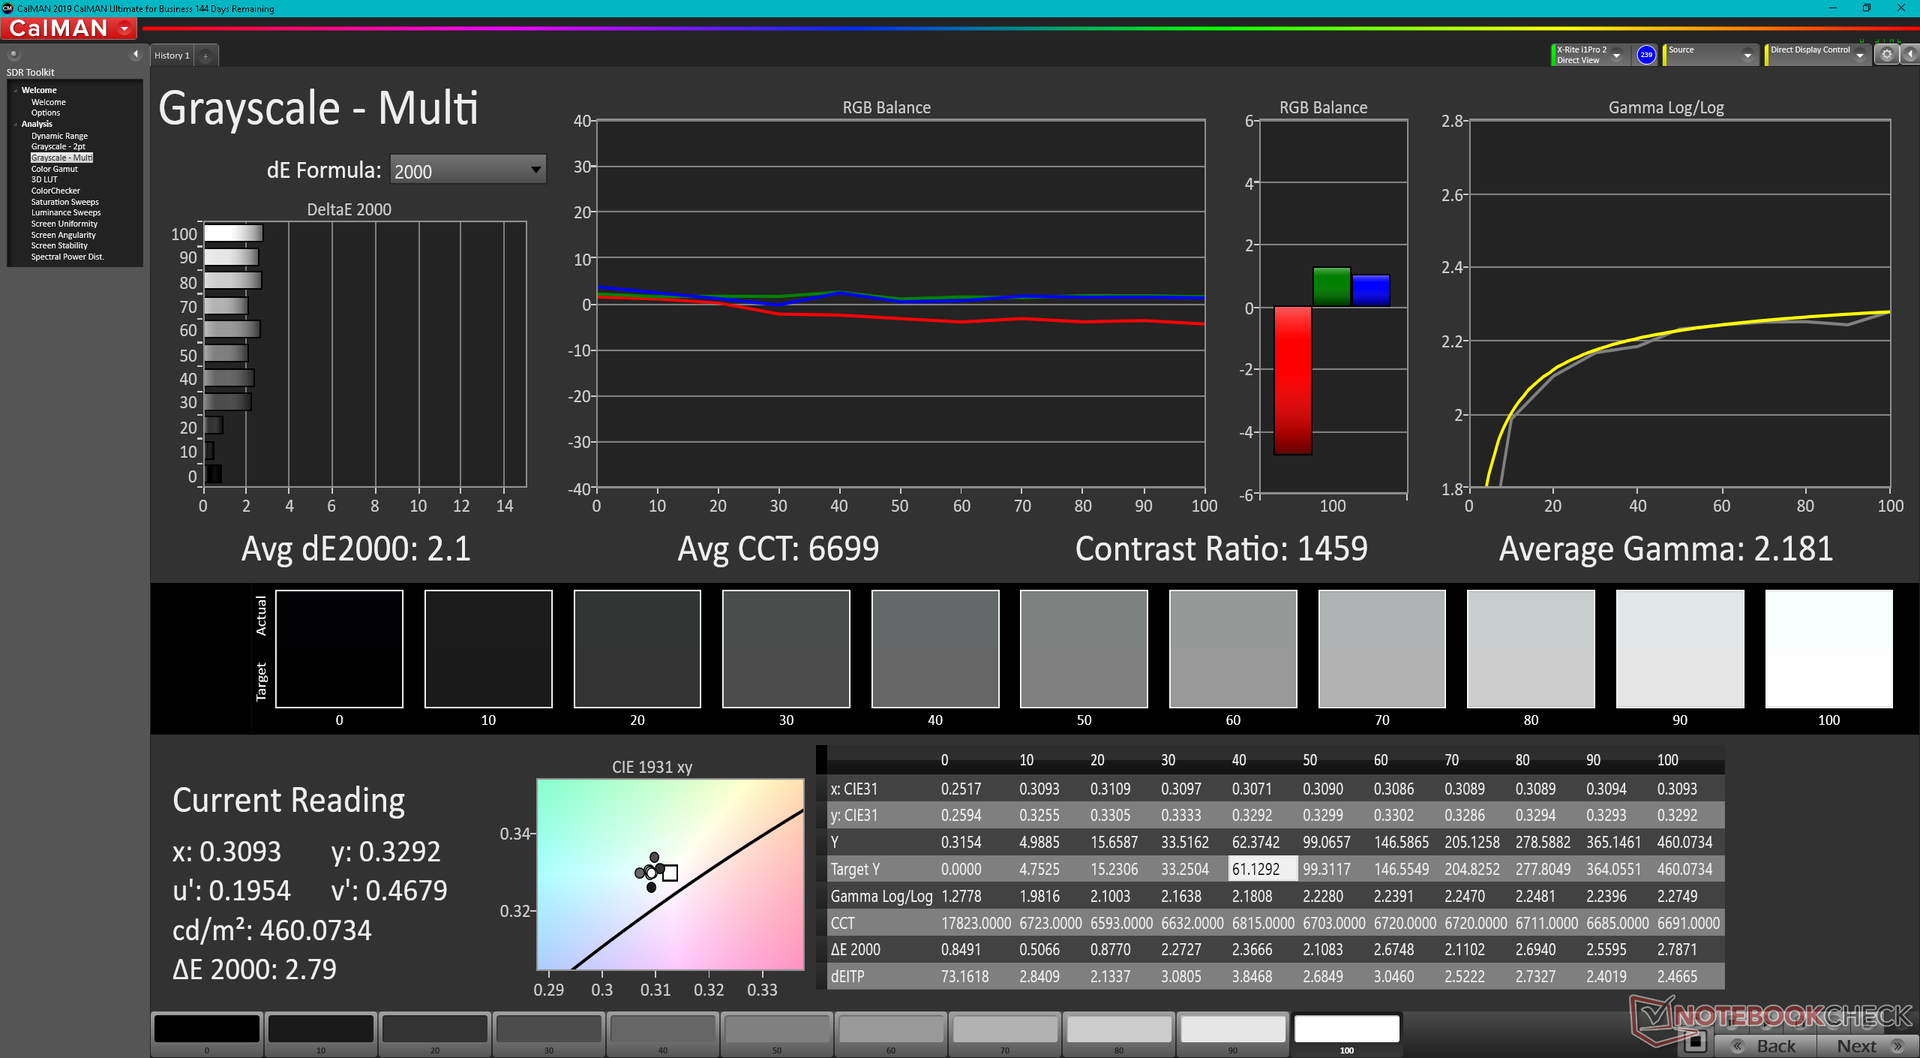
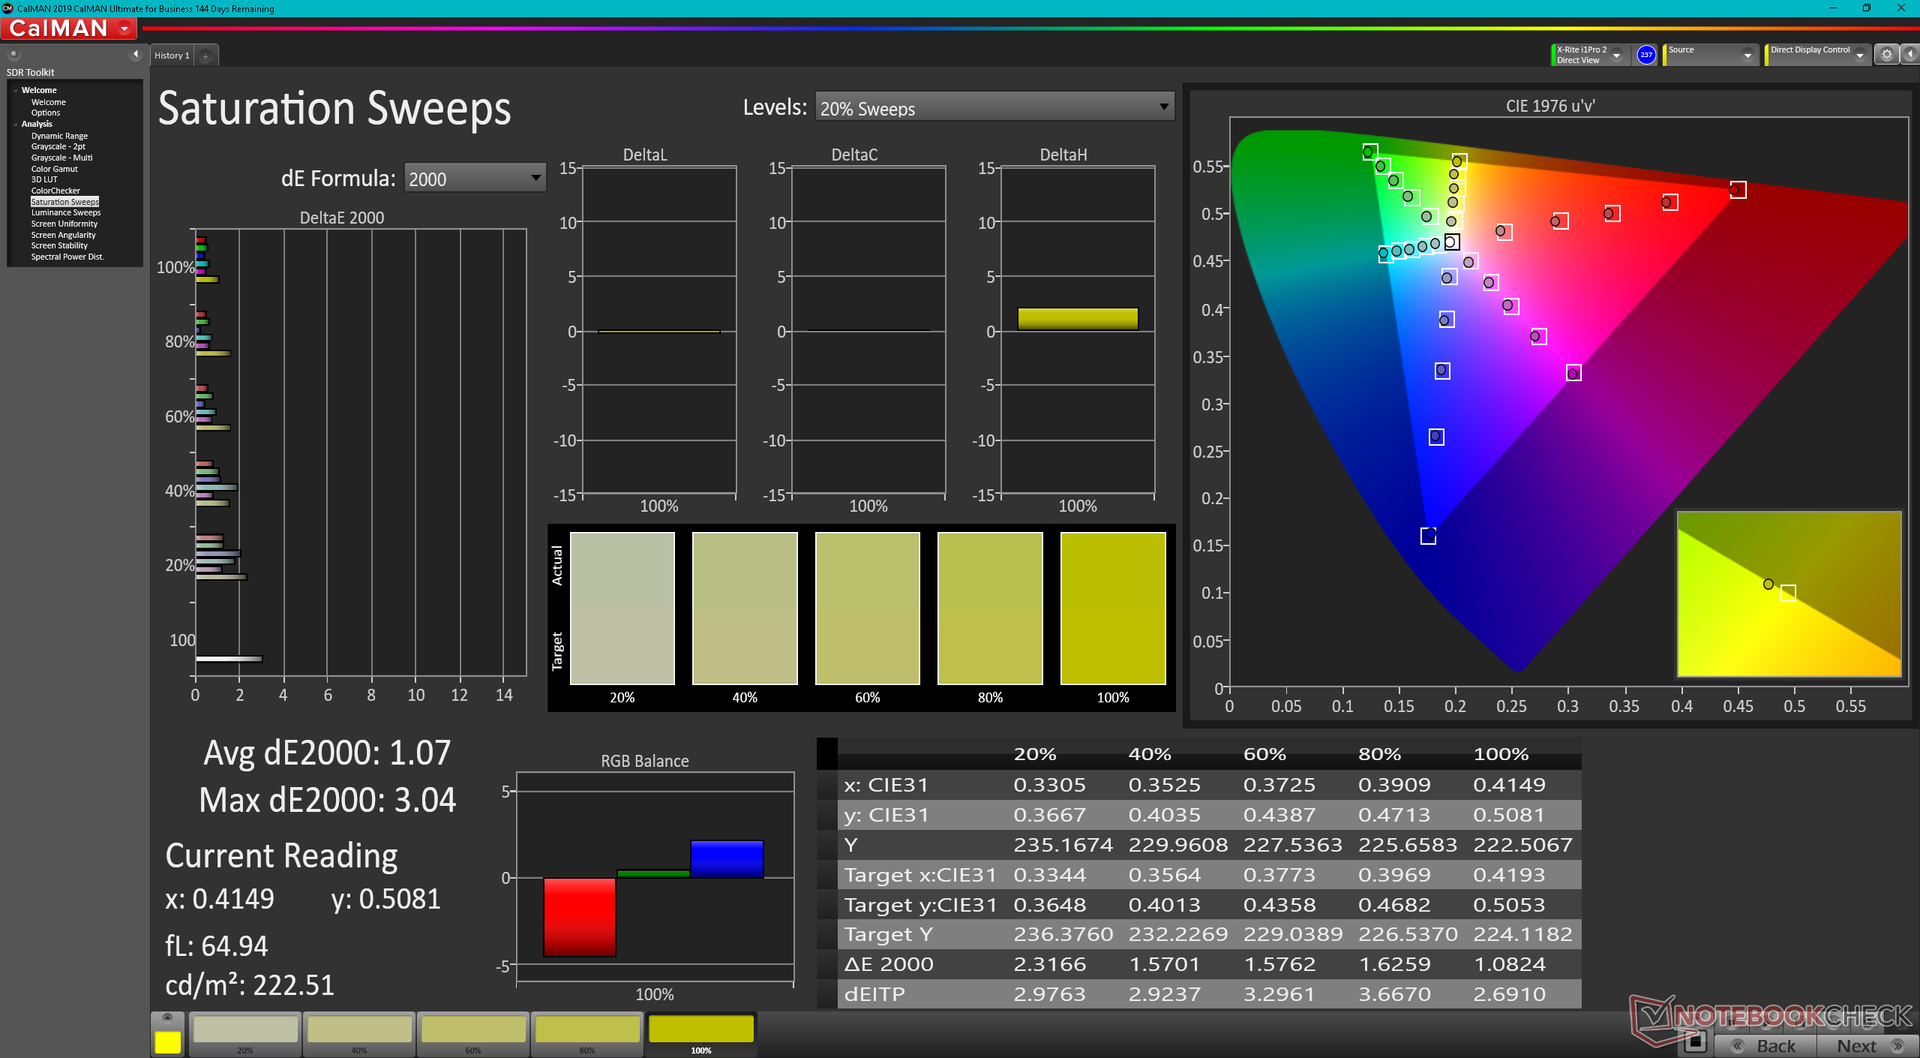
Écran - Des couleurs superbes, mais bloqué à 60 Hz
Le modèle offre la même résolution native que sur l'...Lenovo Yoga Slim 7i Pro mais avec des couleurs plus larges pour prendre en charge la norme DCI-P3. Les temps de réponse noir-blanc et gris-gris, bien qu'ils ne soient pas aussi rapides que ceux de l'OLED, sont tout de même plus rapides que sur le LG Gram 14T90P ou le Latitude 9420 2-en-1 pour une réduction notable des images fantômes. L'écran fonctionne très bien pour les jeux et les tâches de bureau grâce à ses couleurs profondes, son rétroéclairage brillant de 500 nits et ses temps de réponse raisonnables
La principale limite de l'écran est sa fréquence de rafraîchissement native de 60 Hz, car d'autres ordinateurs portables commencent à offrir des fréquences de rafraîchissement de 90 Hz ou plus. Des alternatives comme le Lenovo IdeaPad Slim 7i Pro ou Asus VivoBook S 14X peuvent offrir des expériences d'interface utilisateur nettement plus fluides grâce à leurs taux de rafraîchissement plus élevés. Les entrées au stylet, en particulier, auraient bénéficié d'un taux de rafraîchissement de l'écran plus élevé que les 60 Hz habituels.
| |||||||||||||||||||||||||
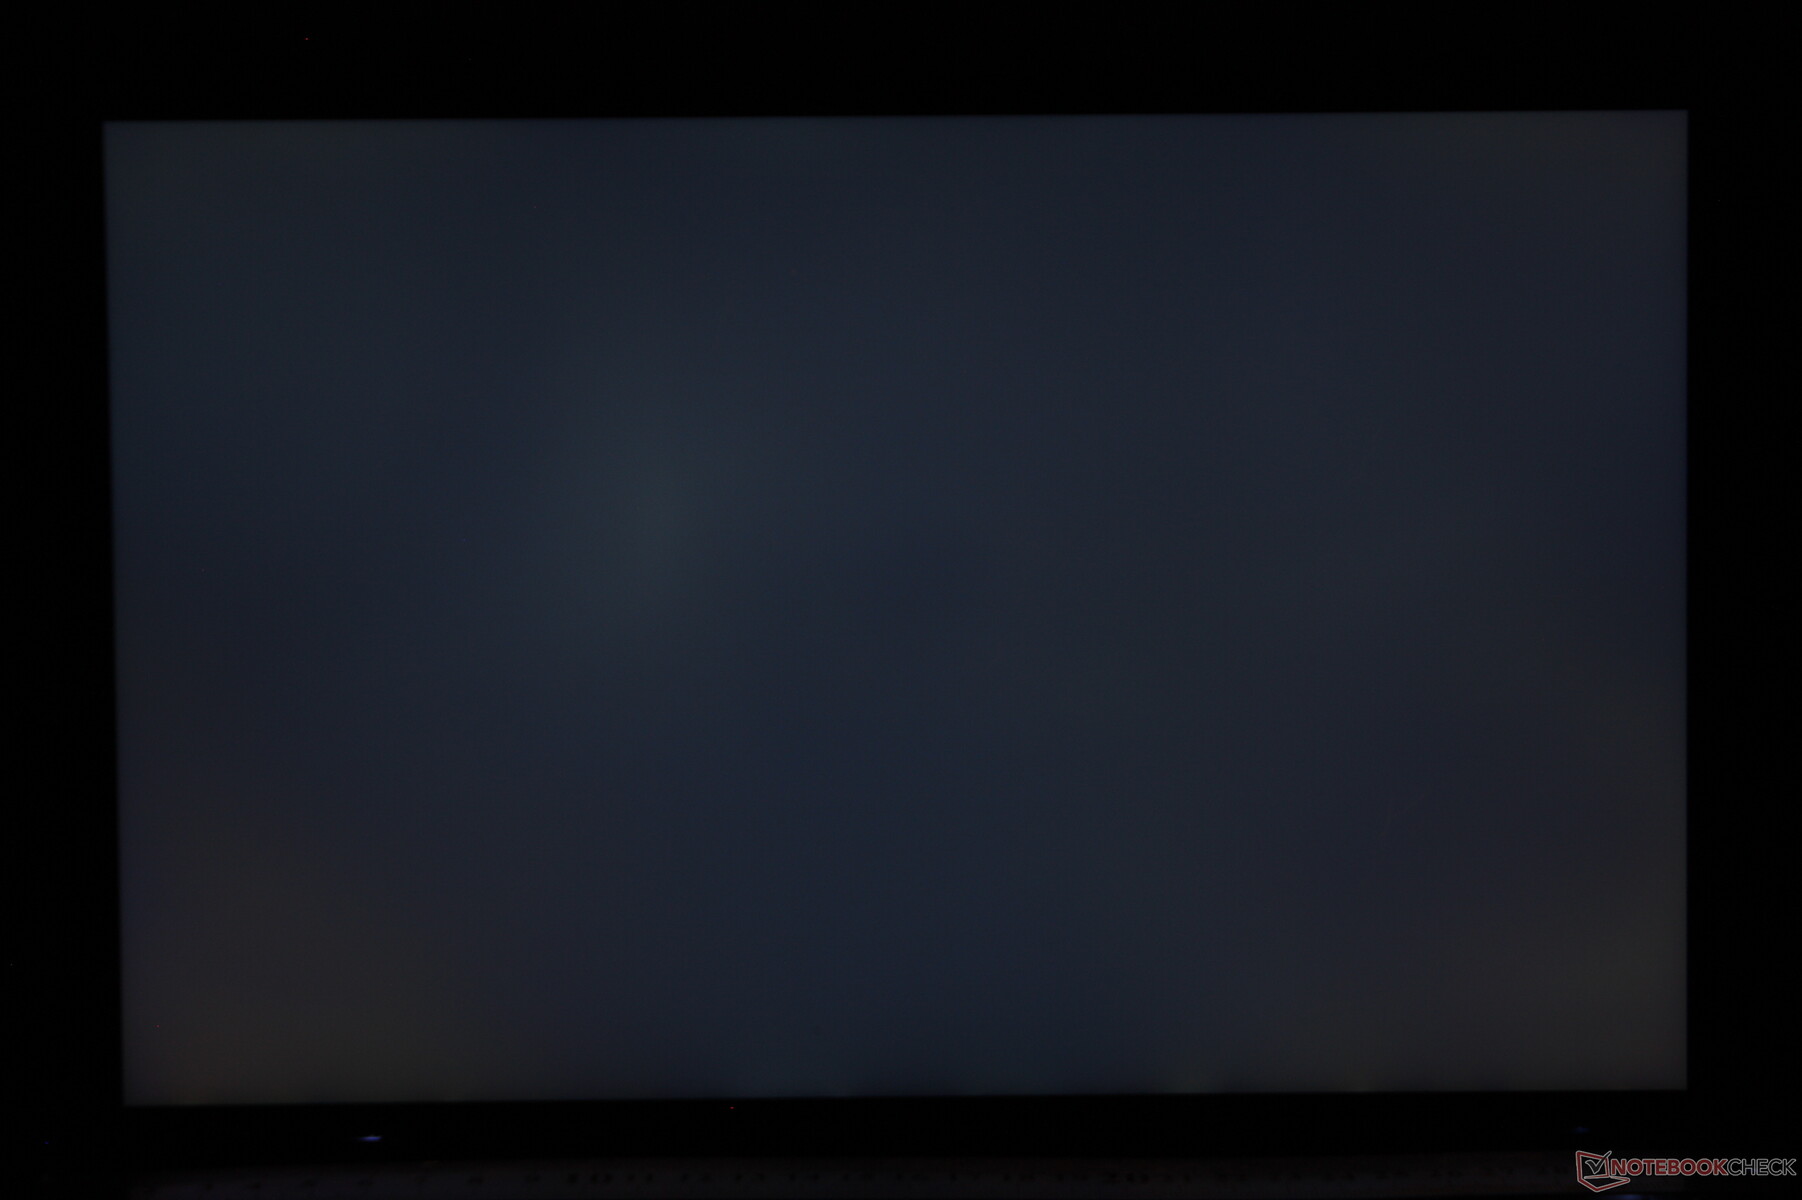
Homogénéité de la luminosité: 87 %
Valeur mesurée au centre, sur batterie: 496.7 cd/m²
Contraste: 1656:1 (Valeurs des noirs: 0.3 cd/m²)
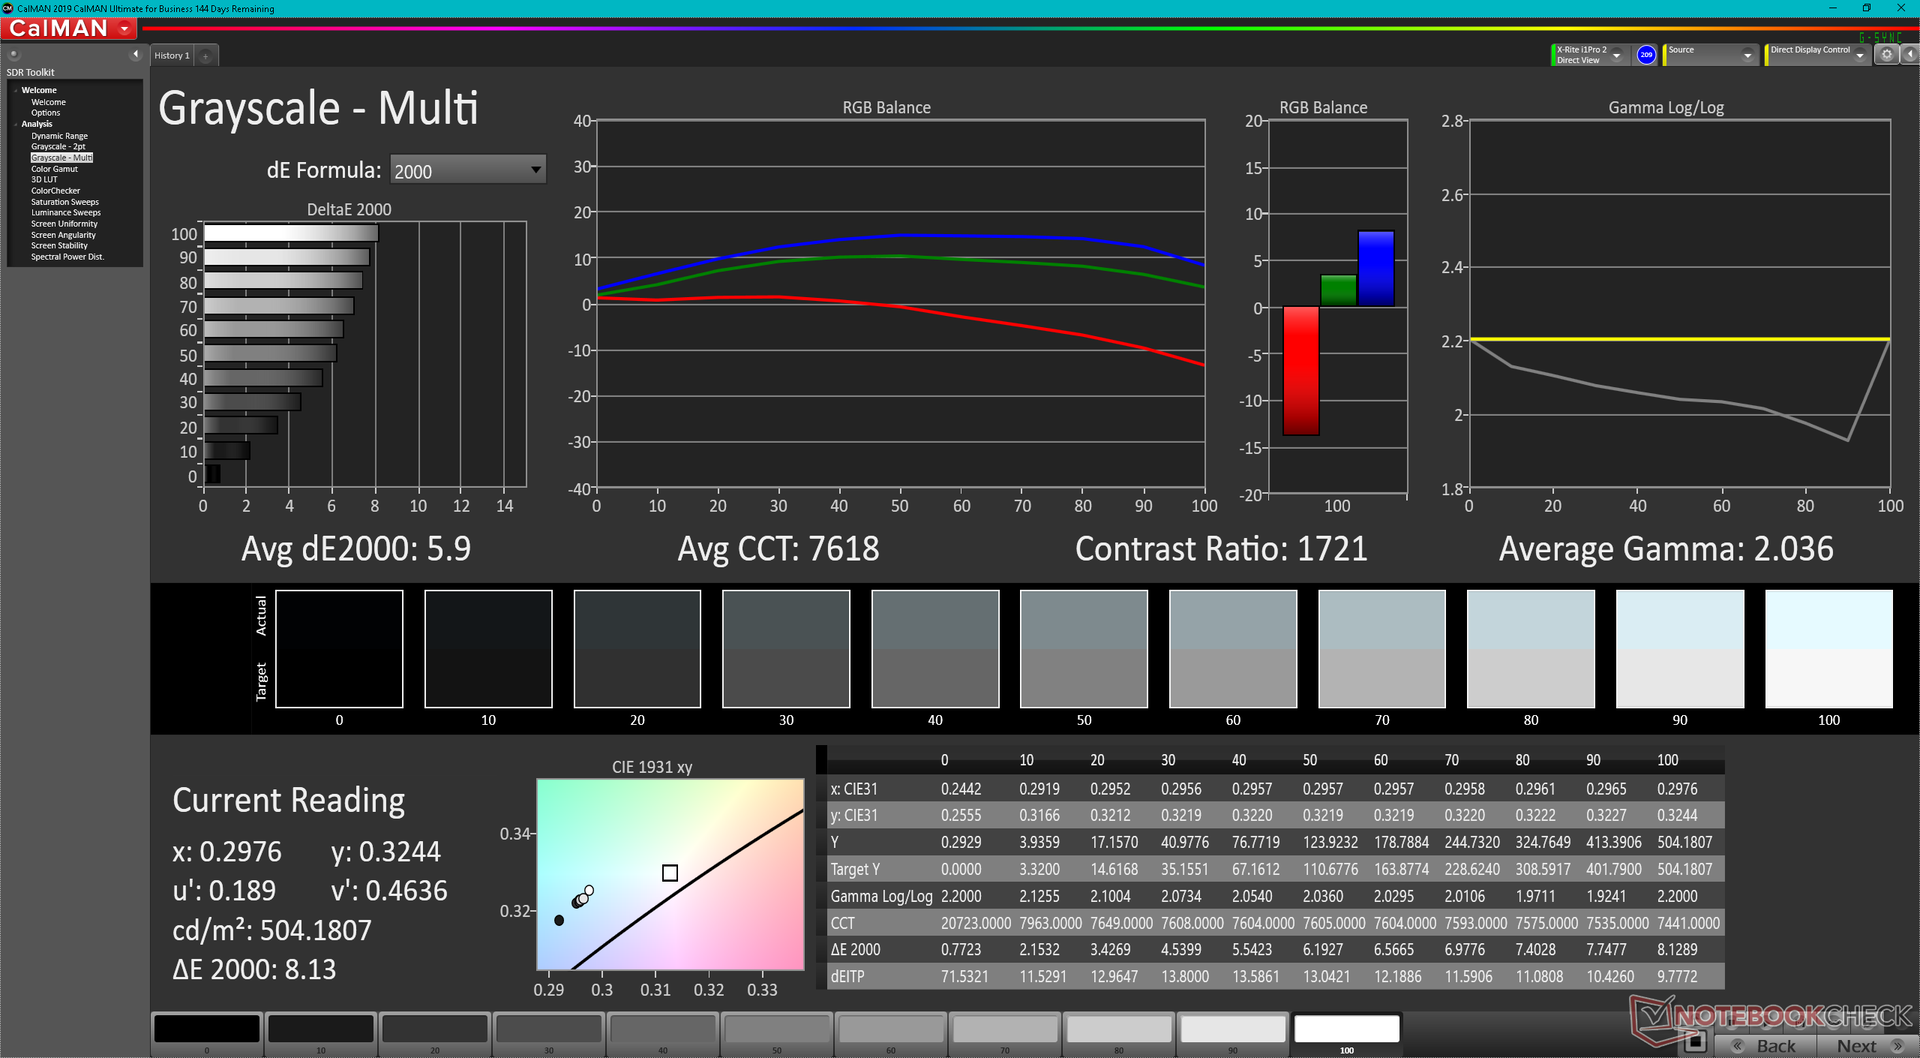
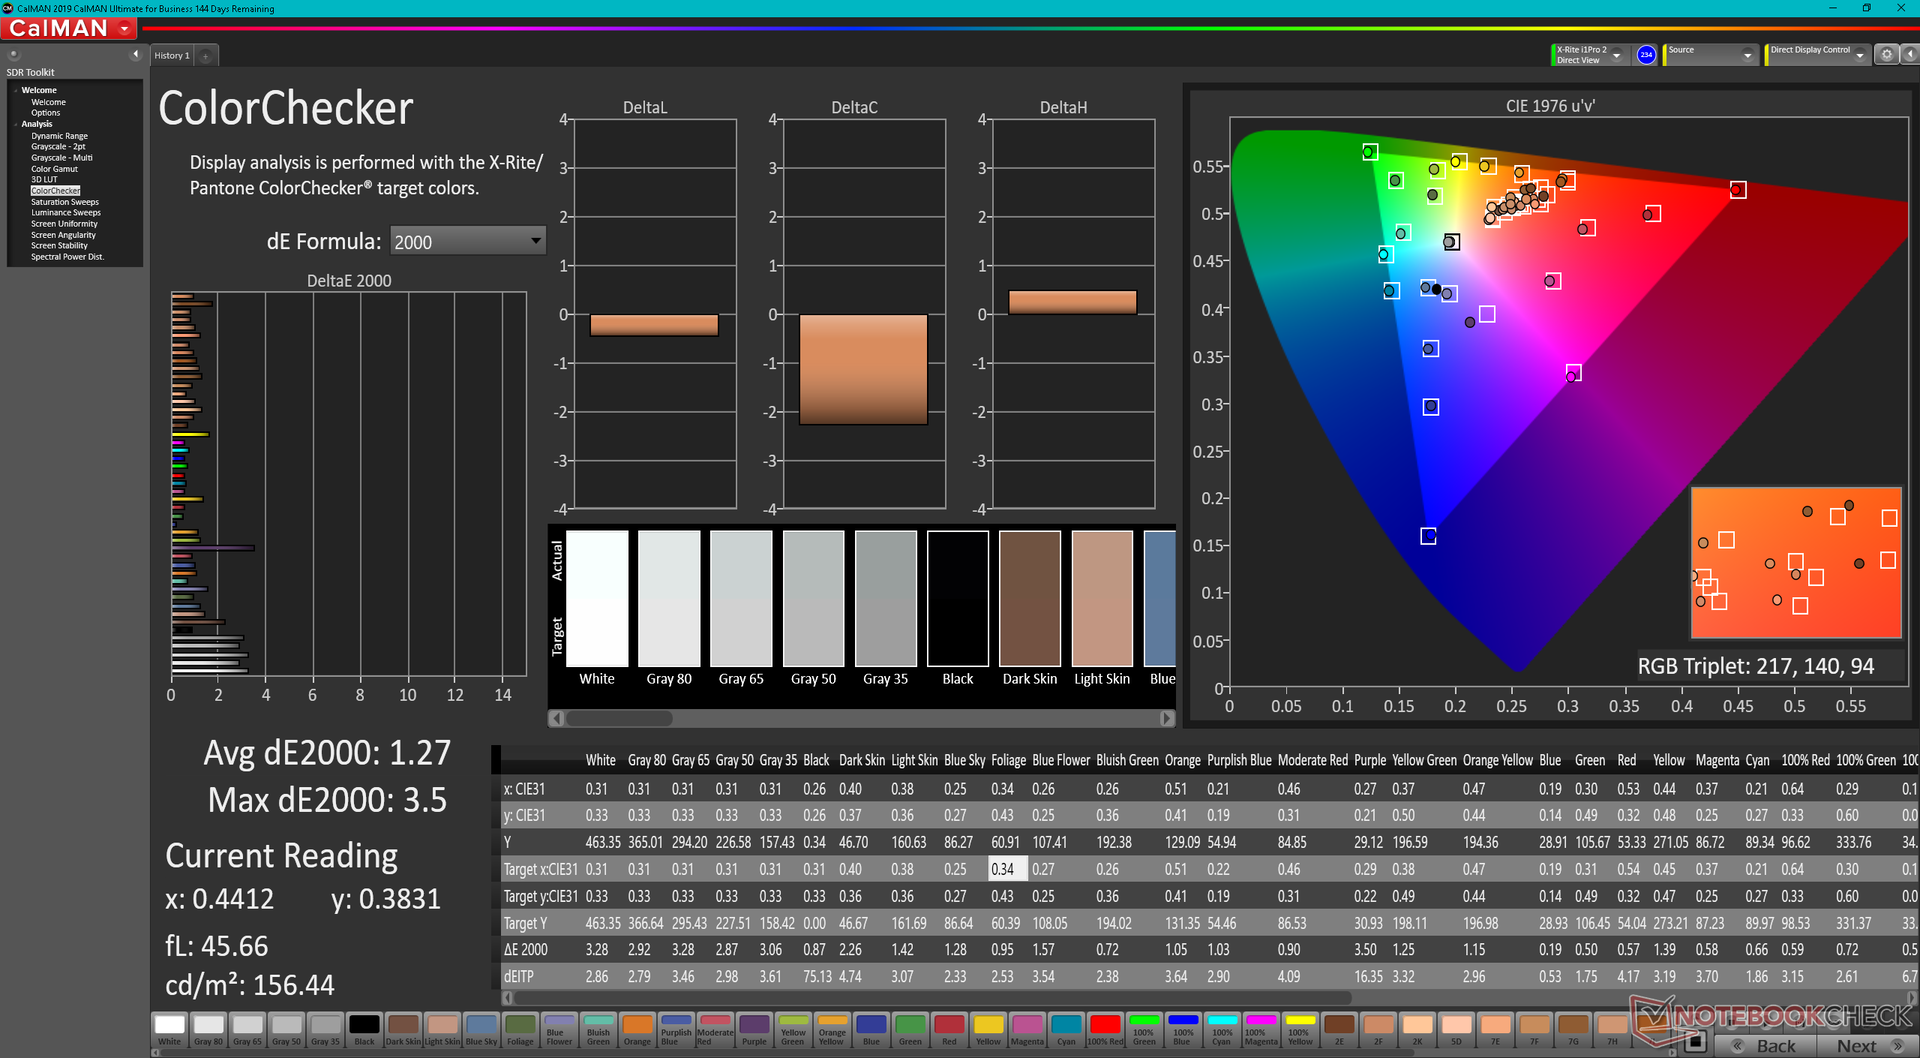
ΔE ColorChecker Calman: 3.93 | ∀{0.5-29.43 Ø4.71}
calibrated: 1.27
ΔE Greyscale Calman: 5.9 | ∀{0.09-98 Ø4.96}
85.9% AdobeRGB 1998 (Argyll 3D)
99.9% sRGB (Argyll 3D)
97.8% Display P3 (Argyll 3D)
Gamma: 2.04
CCT: 7618 K
| MSI Summit E14 Flip Evo A12MT AU Optronics B140QAN04.R, IPS, 2880x1800, 14" | MSI Summit E14 A11SCS AU Optronics AUO123B, IPS, 3840x2160, 14" | Asus VivoBook S 14X S5402Z Samsung ATNA45AF01-0, OLED, 2880x1800, 14.5" | LG Gram 14T90P LG Philips LP140WU1-SPA1, IPS, 1900x1200, 14" | Lenovo Yoga Slim 7i Pro 14IAP G7 LEN140WQ+, IPS, 2880x1800, 14" | Dell Latitude 9420 2-in-1 AU Optronics B140QAN, IPS, 2560x1600, 14" | |
|---|---|---|---|---|---|---|
| Display | 2% | 4% | 1% | -10% | -8% | |
| Display P3 Coverage (%) | 97.8 | 87.5 -11% | 99.9 2% | 98.8 1% | 77.7 -21% | 80.7 -17% |
| sRGB Coverage (%) | 99.9 | 100 0% | 100 0% | 100 0% | 100 0% | 100 0% |
| AdobeRGB 1998 Coverage (%) | 85.9 | 99.4 16% | 95.5 11% | 78.4 -9% | 79.7 -7% | |
| Response Times | -154% | 95% | -128% | -61% | -167% | |
| Response Time Grey 50% / Grey 80% * (ms) | 16.9 ? | 52 ? -208% | 0.73 ? 96% | 44 ? -160% | 35.2 ? -108% | 54 ? -220% |
| Response Time Black / White * (ms) | 15.4 ? | 30.8 ? -100% | 1 ? 94% | 30 ? -95% | 17.6 ? -14% | 32.8 ? -113% |
| PWM Frequency (Hz) | 240.4 ? | |||||
| Screen | -29% | 18% | 1% | 7% | -0% | |
| Brightness middle (cd/m²) | 496.7 | 593.3 19% | 373 -25% | 305.5 -38% | 469 -6% | 483.6 -3% |
| Brightness (cd/m²) | 468 | 571 22% | 375 -20% | 289 -38% | 445 -5% | 465 -1% |
| Brightness Distribution (%) | 87 | 87 0% | 99 14% | 87 0% | 90 3% | 92 6% |
| Black Level * (cd/m²) | 0.3 | 0.53 -77% | 0.27 10% | 0.32 -7% | ||
| Contrast (:1) | 1656 | 1119 -32% | 1131 -32% | 1511 -9% | ||
| Colorchecker dE 2000 * | 3.93 | 4.42 -12% | 2.26 42% | 3.31 16% | 3.5 11% | 3.69 6% |
| Colorchecker dE 2000 max. * | 7.9 | 7.16 9% | 6.22 21% | 6.12 23% | 5.3 33% | 5.97 24% |
| Colorchecker dE 2000 calibrated * | 1.27 | 4.3 -239% | 1.7 -34% | 2.05 -61% | ||
| Greyscale dE 2000 * | 5.9 | 3.2 46% | 1.4 76% | 1.9 68% | 3.3 44% | 3.5 41% |
| Gamma | 2.04 108% | 2.04 108% | 2.22 99% | 2.04 108% | 1.97 112% | 2.04 108% |
| CCT | 7618 85% | 6737 96% | 6417 101% | 6706 97% | 6512 100% | 6158 106% |
| Moyenne finale (programmes/paramètres) | -60% /
-41% | 39% /
28% | -42% /
-20% | -21% /
-9% | -58% /
-26% |
* ... Moindre est la valeur, meilleures sont les performances
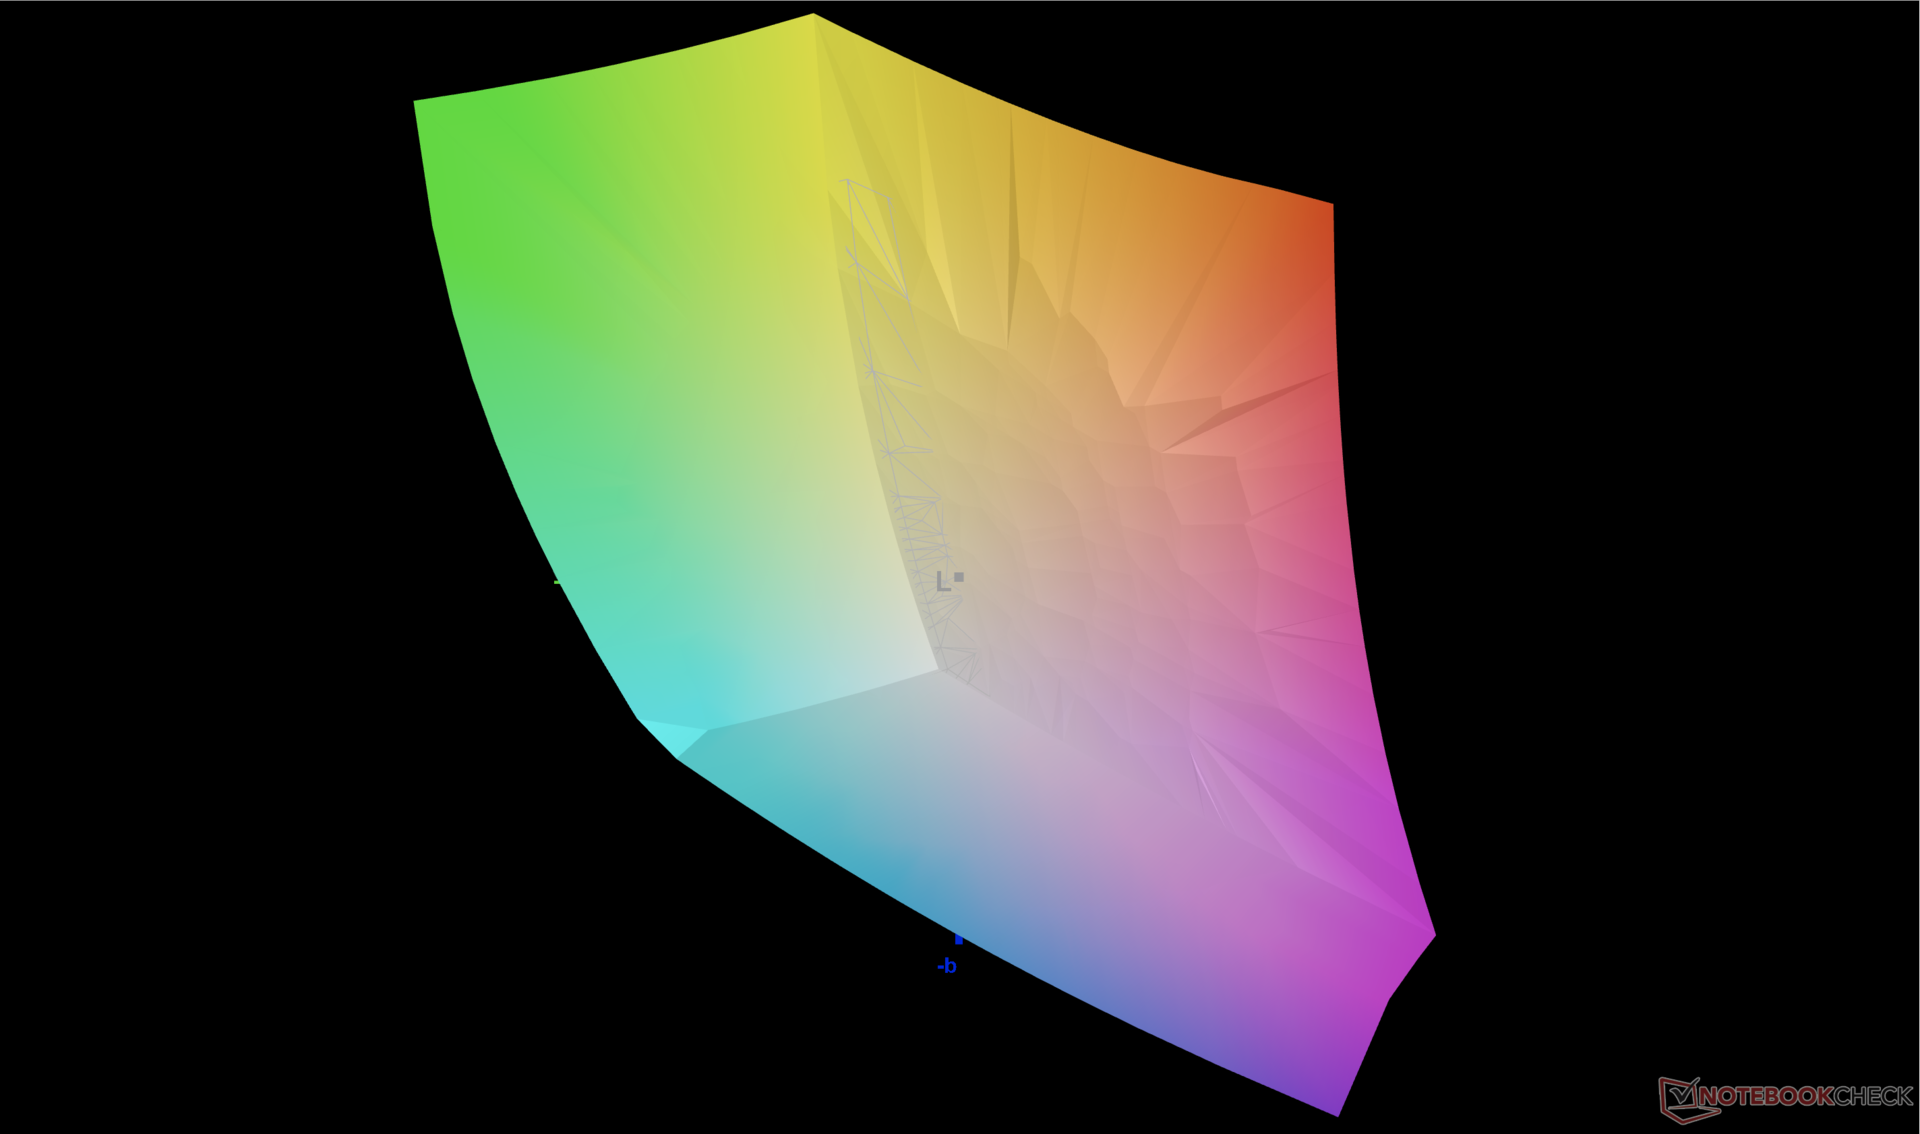
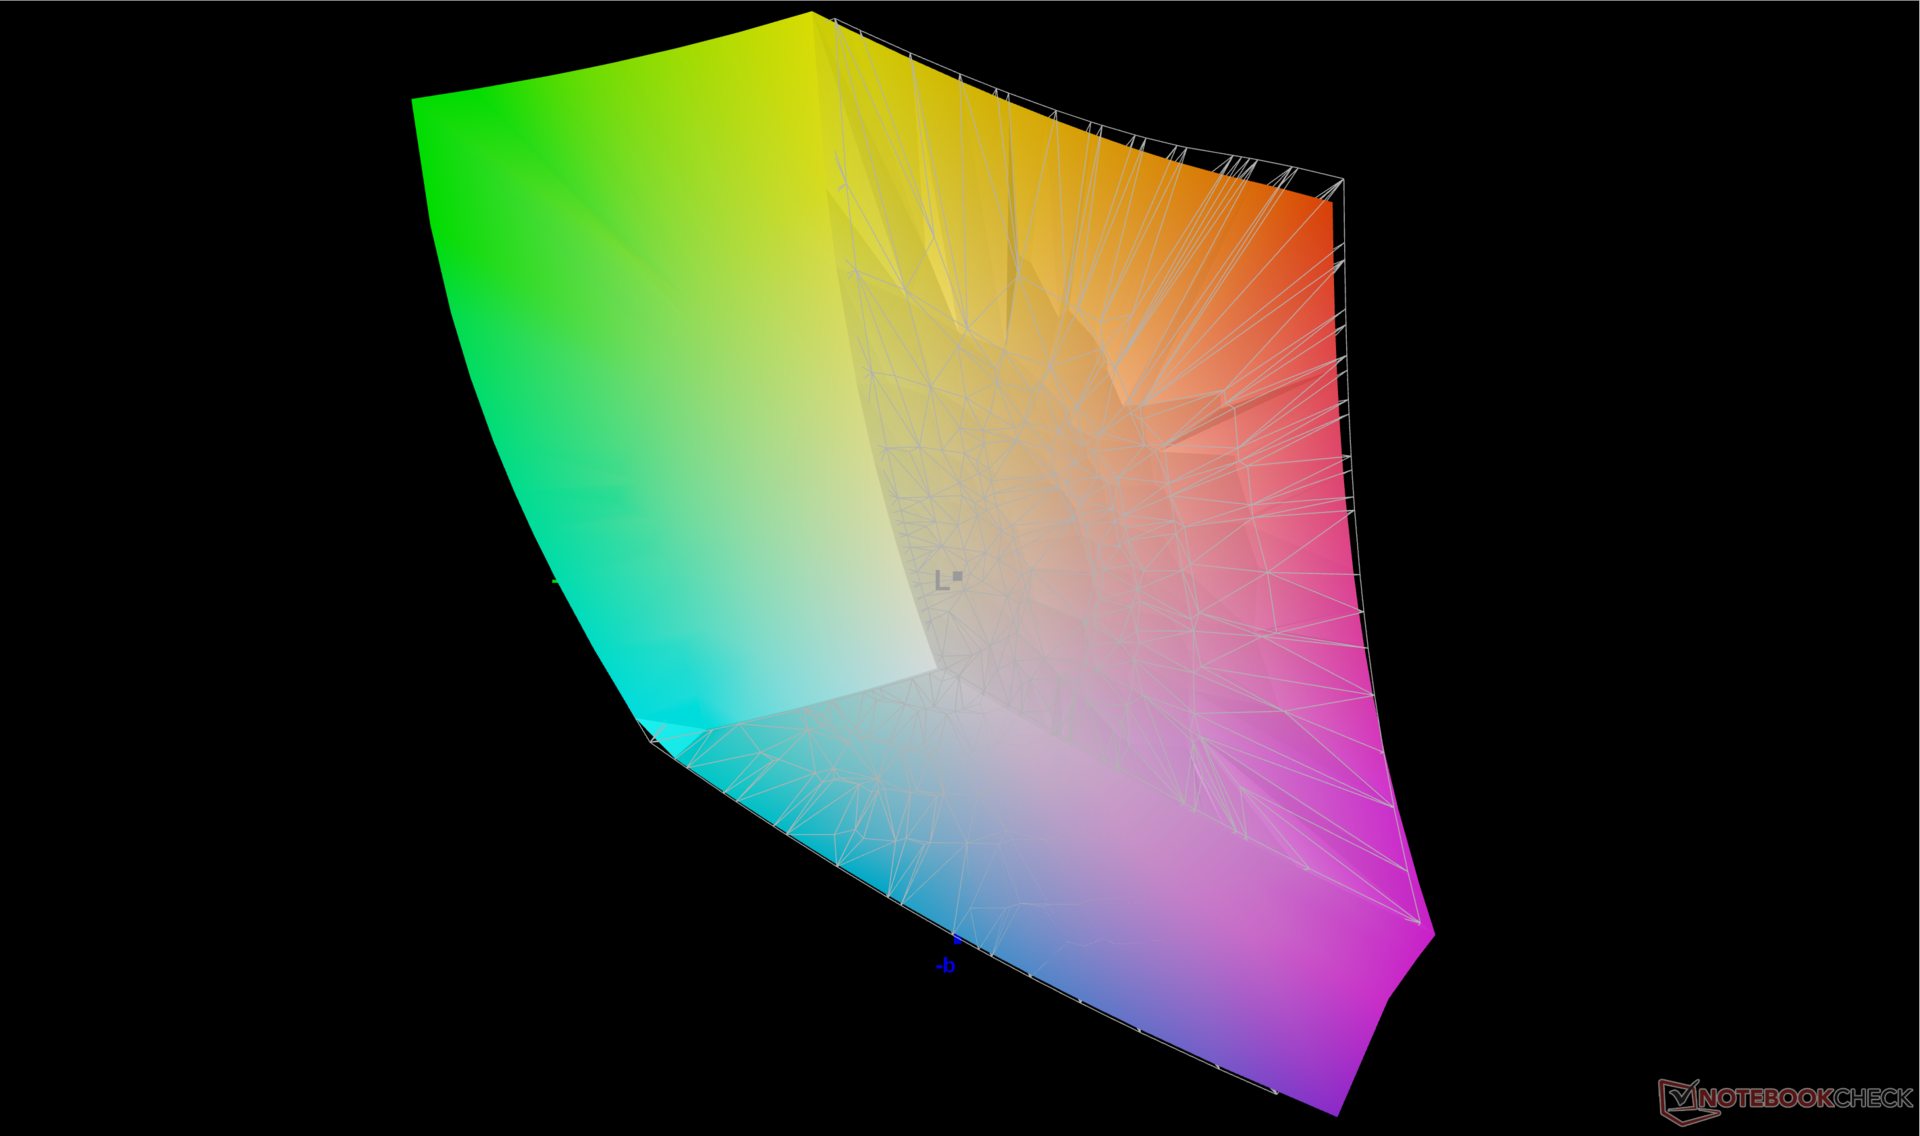
L'écran de notre Summit n'est pas calibré en usine, contrairement à de nombreux modèles MSI Creator, malgré le fait que la dalle offre une couverture DCI-P3 complète. Ainsi, les valeurs DeltaE moyennes des niveaux de gris et des couleurs sont médiocres à 5,9 et 3,93, respectivement, par rapport à la norme P3. La température des couleurs, en particulier, est plus froide que nous le souhaiterions, à 7618. Les utilisateurs devront calibrer leurs écrans pour mieux exploiter sa gamme de couleurs.
Temps de réponse de l'écran
| ↔ Temps de réponse noir à blanc | ||
|---|---|---|
| 15.4 ms ... hausse ↗ et chute ↘ combinées | ↗ 7.3 ms hausse | 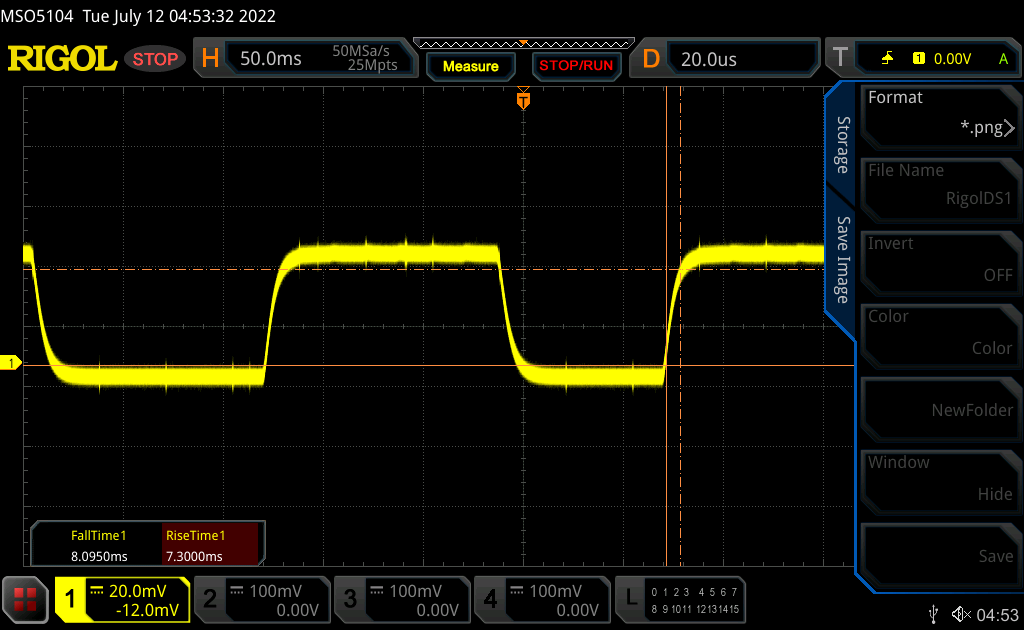 |
| ↘ 8.1 ms chute | ||
| L'écran montre de bons temps de réponse, mais insuffisant pour du jeu compétitif. En comparaison, tous les appareils testés affichent entre 0.1 (minimum) et 240 (maximum) ms. » 37 % des appareils testés affichent de meilleures performances. Cela signifie que les latences relevées sont meilleures que la moyenne (19.8 ms) de tous les appareils testés. | ||
| ↔ Temps de réponse gris 50% à gris 80% | ||
| 16.9 ms ... hausse ↗ et chute ↘ combinées | ↗ 7.3 ms hausse | 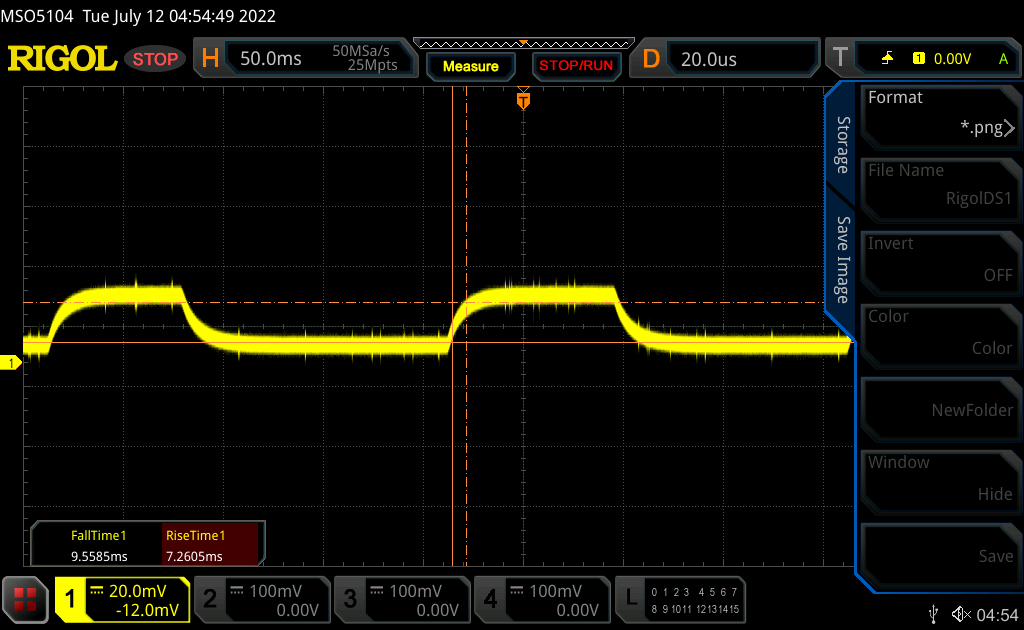 |
| ↘ 9.6 ms chute | ||
| L'écran montre de bons temps de réponse, mais insuffisant pour du jeu compétitif. En comparaison, tous les appareils testés affichent entre 0.165 (minimum) et 636 (maximum) ms. » 31 % des appareils testés affichent de meilleures performances. Cela signifie que les latences relevées sont meilleures que la moyenne (31 ms) de tous les appareils testés. | ||
Scintillement / MLI (Modulation de largeur d'impulsion)
| Scintillement / MLI (Modulation de largeur d'impulsion) non décelé | 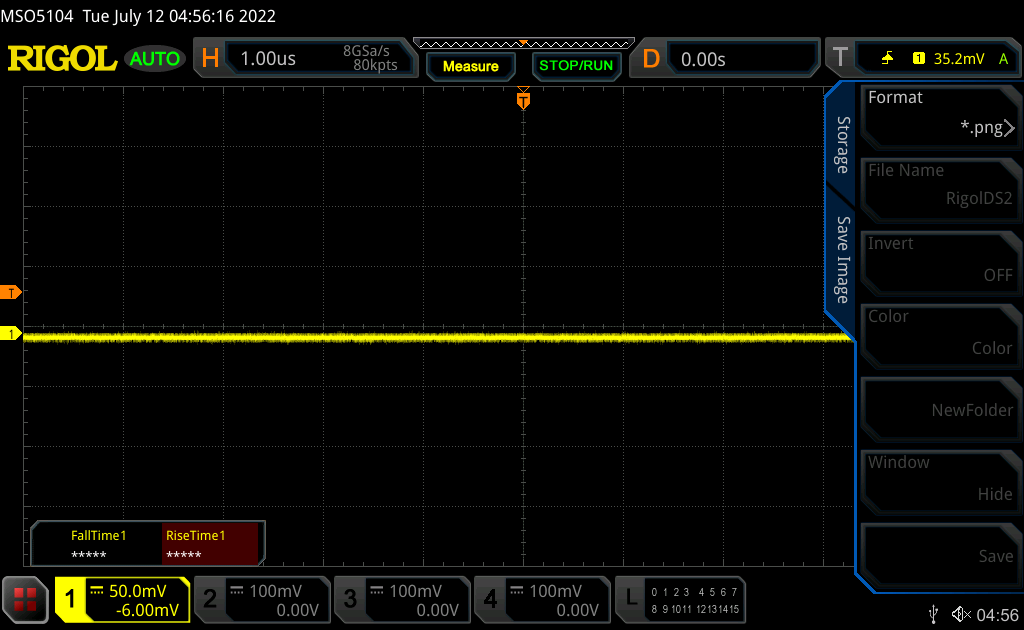 | ||
En comparaison, 52 % des appareils testés n'emploient pas MDI pour assombrir leur écran. Nous avons relevé une moyenne à 7754 (minimum : 5 - maximum : 343500) Hz dans le cas où une MDI était active. | |||
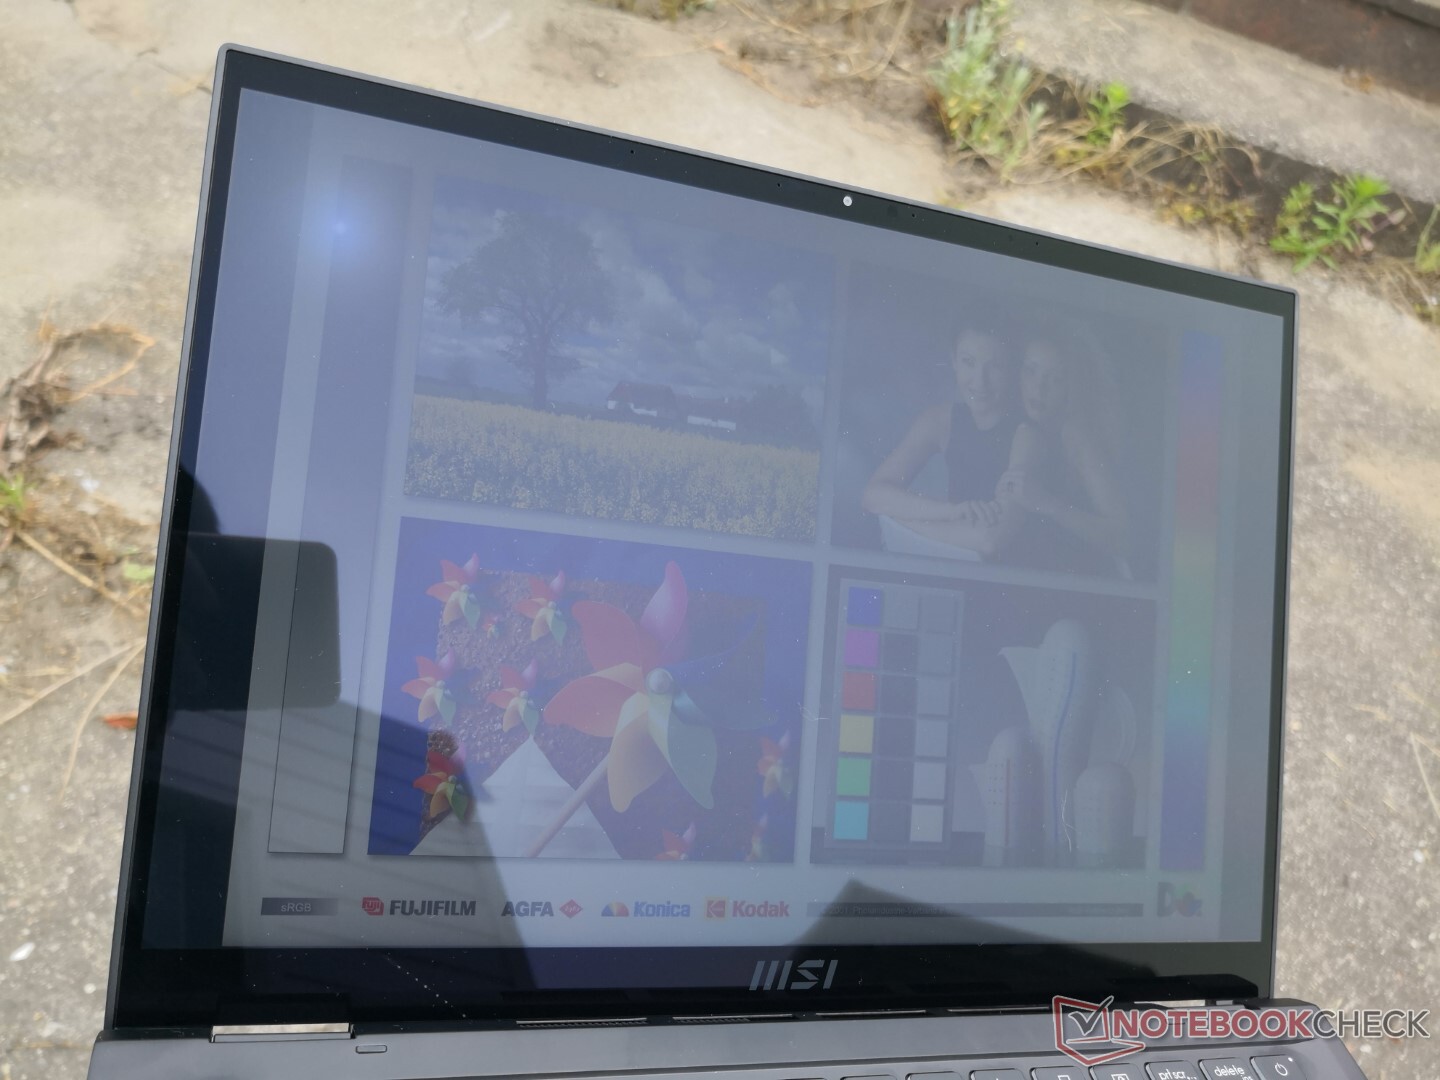
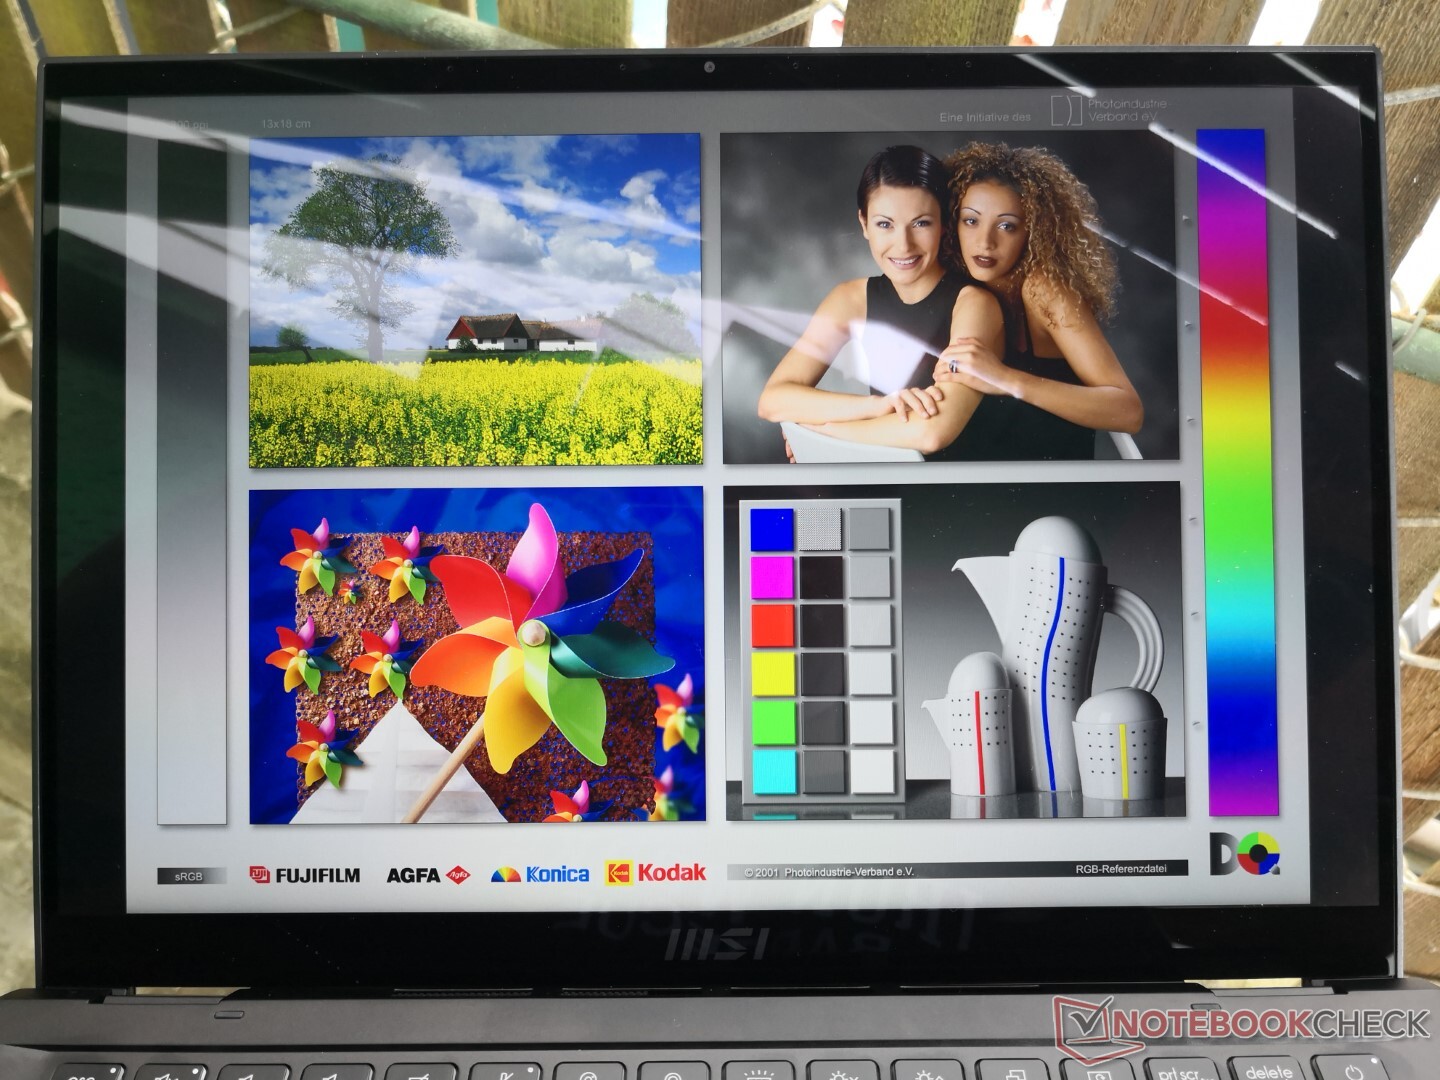
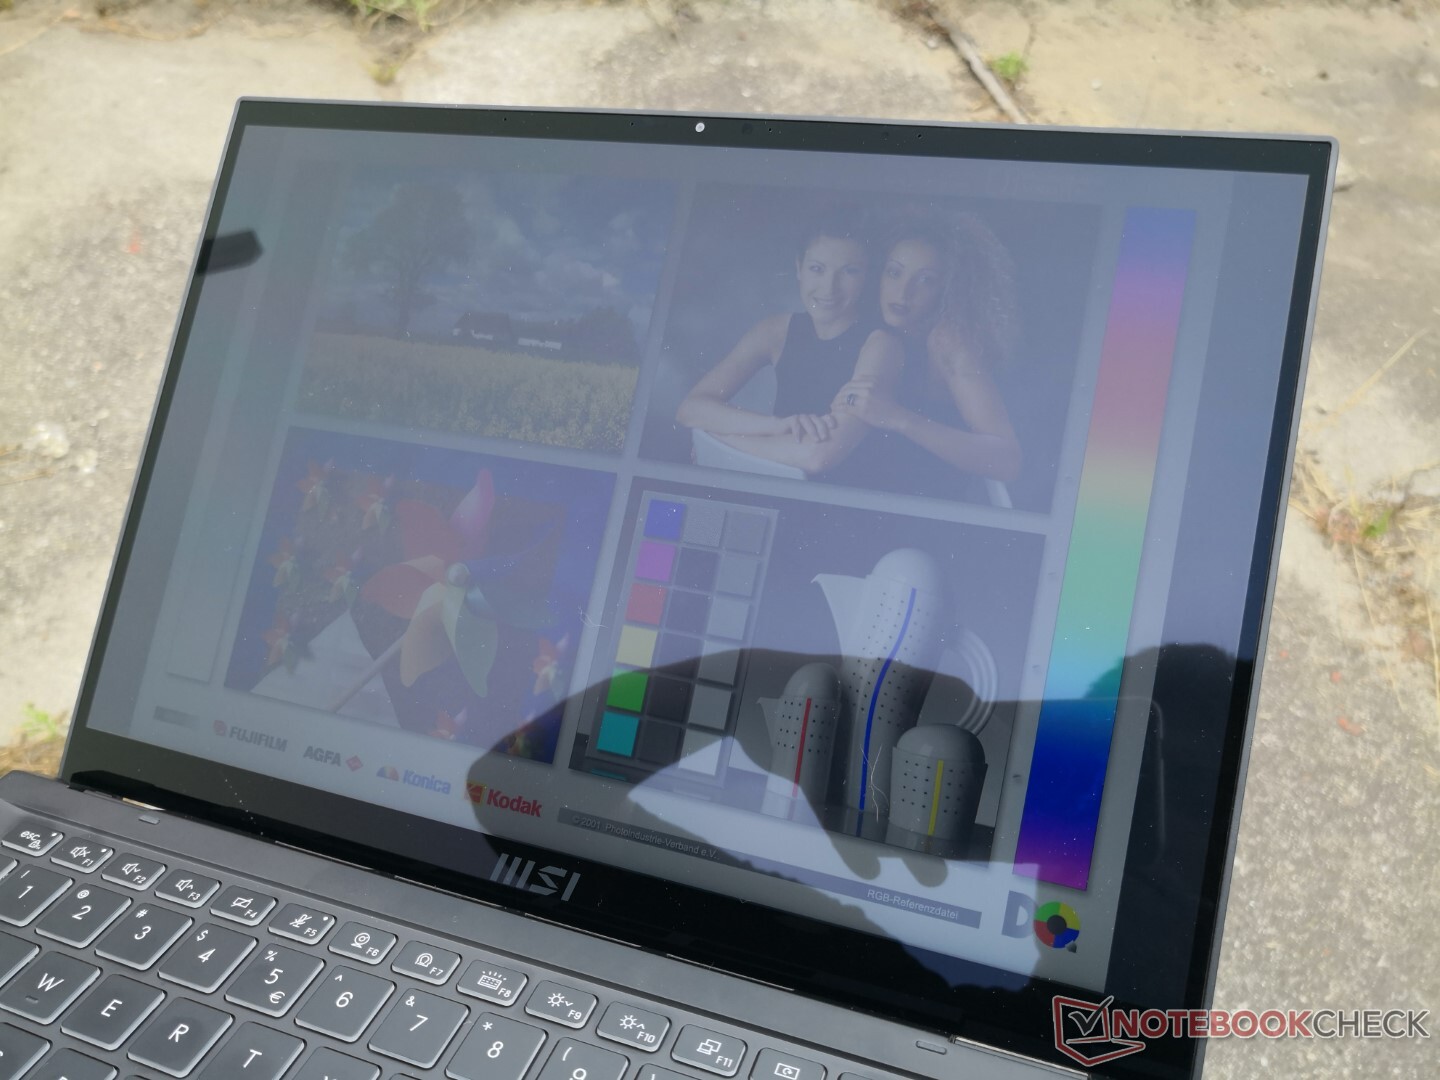
Les reflets sont inévitables sur l'écran brillant, mais le rétroéclairage de 500 nits, plus lumineux que la moyenne, permet de les réduire à des niveaux plus tolérables. Il est toujours recommandé d'éviter de travailler sous la lumière directe du soleil.
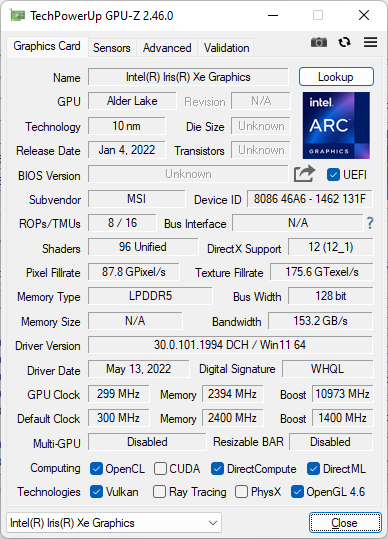
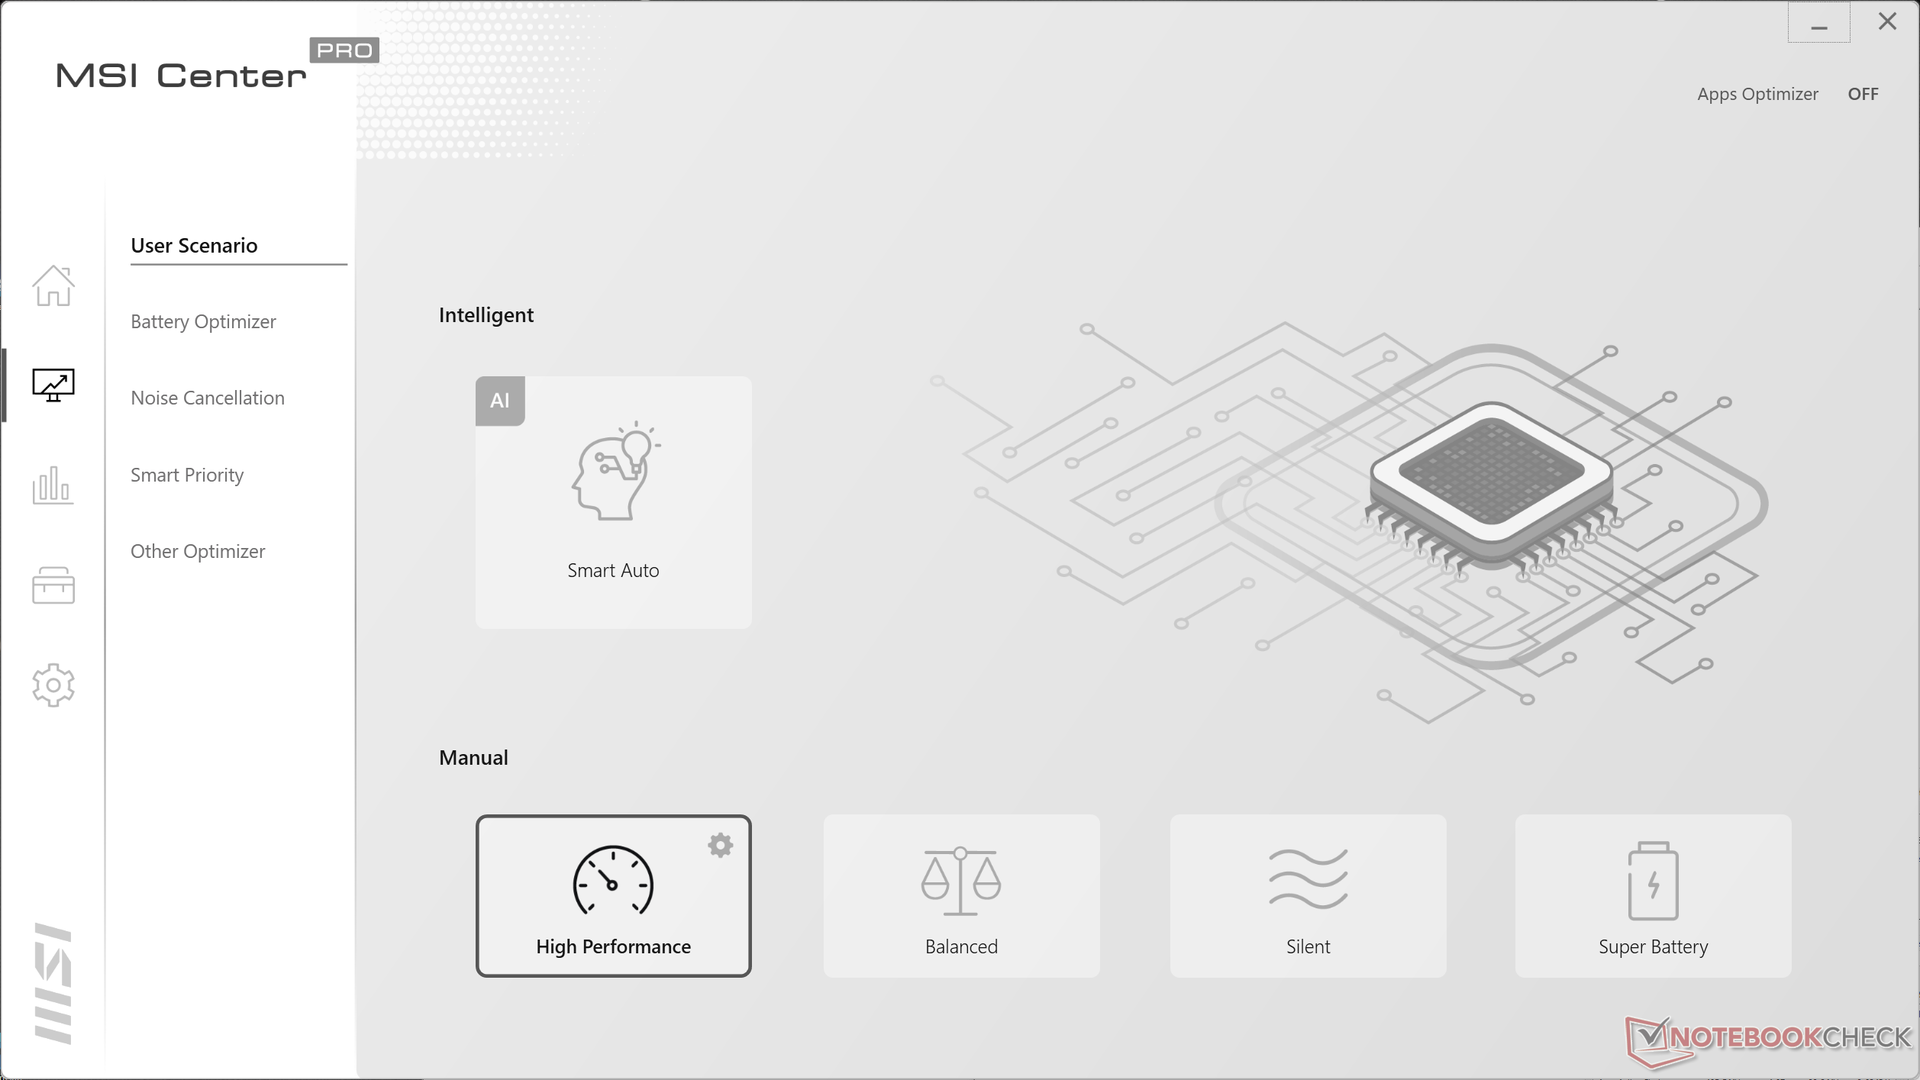
Performances - La série Intel Core-P impressionne
Conditions d'essai
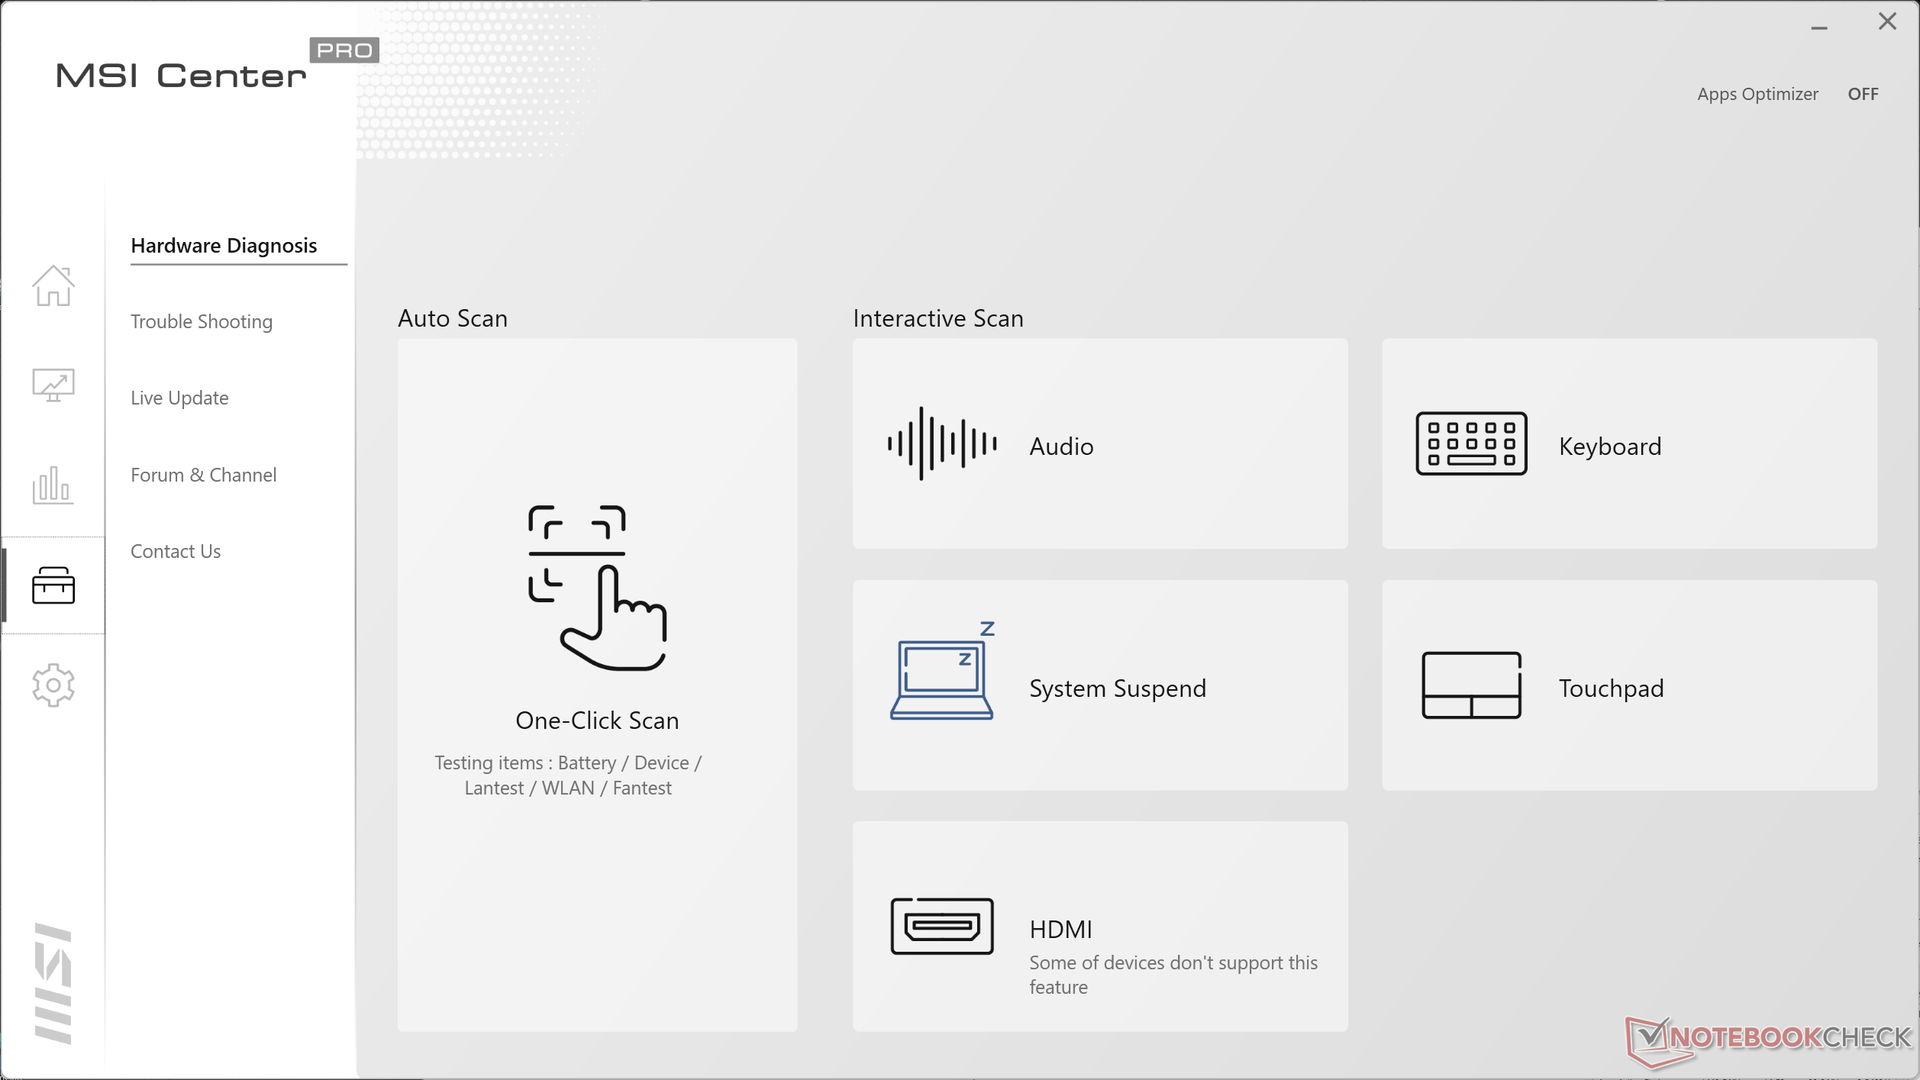
Nous avons réglé notre appareil en mode hautes performances via le logiciel préinstallé MSI Center avant d'effectuer les tests de performances ci-dessous. Il est recommandé aux propriétaires de se familiariser avec ce logiciel, car il s'agit essentiellement du centre de commande permettant de régler la plupart des paramètres du système, des mises à jour et des profils de performance.
Processeur
Les performances du CPU sont excellentes, avec des résultats supérieurs de 5 à 10 % à ceux de l'ordinateur portable moyen de notre base de données équipé du même Core i7-1260P CPU. Notre appareil parvient même à surpasser systématiquement le Core i7-1270P que l'on trouve sur leLenovo ThinkPad X1 Yoga G7 dans les charges de travail monofilaires et multifilaires. Les utilisateurs qui passent de la dernière génération de Core i7-1165G7 de dernière génération, peuvent s'attendre à une augmentation significative allant jusqu'à 80 % dans les applications multifilières.
Le concurrent Ryzen 7 6800U est capable de surpasser notre Core i7-1260P de 15 à 20 % dans les charges de travail multithreads, alors que c'est l'inverse dans les charges de travail monothreads.
Cinebench R15 Multi Loop
Cinebench R23: Multi Core | Single Core
Cinebench R15: CPU Multi 64Bit | CPU Single 64Bit
Blender: v2.79 BMW27 CPU
7-Zip 18.03: 7z b 4 | 7z b 4 -mmt1
Geekbench 5.5: Multi-Core | Single-Core
HWBOT x265 Benchmark v2.2: 4k Preset
LibreOffice : 20 Documents To PDF
R Benchmark 2.5: Overall mean
Cinebench R23: Multi Core | Single Core
Cinebench R15: CPU Multi 64Bit | CPU Single 64Bit
Blender: v2.79 BMW27 CPU
7-Zip 18.03: 7z b 4 | 7z b 4 -mmt1
Geekbench 5.5: Multi-Core | Single-Core
HWBOT x265 Benchmark v2.2: 4k Preset
LibreOffice : 20 Documents To PDF
R Benchmark 2.5: Overall mean
* ... Moindre est la valeur, meilleures sont les performances
AIDA64: FP32 Ray-Trace | FPU Julia | CPU SHA3 | CPU Queen | FPU SinJulia | FPU Mandel | CPU AES | CPU ZLib | FP64 Ray-Trace | CPU PhotoWorxx
| Performance rating | |
| Asus VivoBook S 14X S5402Z | |
| Lenovo Yoga Slim 7i Pro 14IAP G7 | |
| Dell Latitude 9420 2-in-1 | |
| Moyenne Intel Core i7-1260P | |
| MSI Summit E14 A11SCS | |
| LG Gram 14T90P | |
| MSI Summit E14 Flip Evo A12MT | |
| AIDA64 / FP32 Ray-Trace | |
| Dell Latitude 9420 2-in-1 | |
| MSI Summit E14 A11SCS | |
| LG Gram 14T90P | |
| Asus VivoBook S 14X S5402Z | |
| Moyenne Intel Core i7-1260P (2176 - 10898, n=26) | |
| Lenovo Yoga Slim 7i Pro 14IAP G7 | |
| MSI Summit E14 Flip Evo A12MT | |
| AIDA64 / FPU Julia | |
| Asus VivoBook S 14X S5402Z | |
| Moyenne Intel Core i7-1260P (11015 - 56906, n=26) | |
| Dell Latitude 9420 2-in-1 | |
| MSI Summit E14 A11SCS | |
| Lenovo Yoga Slim 7i Pro 14IAP G7 | |
| LG Gram 14T90P | |
| MSI Summit E14 Flip Evo A12MT | |
| AIDA64 / CPU SHA3 | |
| Asus VivoBook S 14X S5402Z | |
| Lenovo Yoga Slim 7i Pro 14IAP G7 | |
| Dell Latitude 9420 2-in-1 | |
| MSI Summit E14 A11SCS | |
| LG Gram 14T90P | |
| Moyenne Intel Core i7-1260P (669 - 2709, n=26) | |
| MSI Summit E14 Flip Evo A12MT | |
| AIDA64 / CPU Queen | |
| Asus VivoBook S 14X S5402Z | |
| MSI Summit E14 Flip Evo A12MT | |
| Lenovo Yoga Slim 7i Pro 14IAP G7 | |
| Moyenne Intel Core i7-1260P (42571 - 82493, n=26) | |
| Dell Latitude 9420 2-in-1 | |
| MSI Summit E14 A11SCS | |
| LG Gram 14T90P | |
| AIDA64 / FPU SinJulia | |
| Asus VivoBook S 14X S5402Z | |
| Lenovo Yoga Slim 7i Pro 14IAP G7 | |
| MSI Summit E14 Flip Evo A12MT | |
| Moyenne Intel Core i7-1260P (2901 - 6975, n=26) | |
| Dell Latitude 9420 2-in-1 | |
| MSI Summit E14 A11SCS | |
| LG Gram 14T90P | |
| AIDA64 / FPU Mandel | |
| Asus VivoBook S 14X S5402Z | |
| MSI Summit E14 A11SCS | |
| Dell Latitude 9420 2-in-1 | |
| LG Gram 14T90P | |
| Moyenne Intel Core i7-1260P (5950 - 26376, n=26) | |
| Lenovo Yoga Slim 7i Pro 14IAP G7 | |
| MSI Summit E14 Flip Evo A12MT | |
| AIDA64 / CPU AES | |
| Dell Latitude 9420 2-in-1 | |
| LG Gram 14T90P | |
| Asus VivoBook S 14X S5402Z | |
| Moyenne Intel Core i7-1260P (16041 - 92356, n=26) | |
| Lenovo Yoga Slim 7i Pro 14IAP G7 | |
| MSI Summit E14 A11SCS | |
| MSI Summit E14 Flip Evo A12MT | |
| AIDA64 / CPU ZLib | |
| Asus VivoBook S 14X S5402Z | |
| Lenovo Yoga Slim 7i Pro 14IAP G7 | |
| MSI Summit E14 Flip Evo A12MT | |
| Moyenne Intel Core i7-1260P (259 - 771, n=26) | |
| Dell Latitude 9420 2-in-1 | |
| MSI Summit E14 A11SCS | |
| LG Gram 14T90P | |
| AIDA64 / FP64 Ray-Trace | |
| Asus VivoBook S 14X S5402Z | |
| Dell Latitude 9420 2-in-1 | |
| MSI Summit E14 A11SCS | |
| LG Gram 14T90P | |
| Moyenne Intel Core i7-1260P (1237 - 5858, n=26) | |
| Lenovo Yoga Slim 7i Pro 14IAP G7 | |
| MSI Summit E14 Flip Evo A12MT | |
| AIDA64 / CPU PhotoWorxx | |
| MSI Summit E14 A11SCS | |
| Dell Latitude 9420 2-in-1 | |
| LG Gram 14T90P | |
| MSI Summit E14 Flip Evo A12MT | |
| Lenovo Yoga Slim 7i Pro 14IAP G7 | |
| Moyenne Intel Core i7-1260P (13261 - 43652, n=26) | |
| Asus VivoBook S 14X S5402Z | |
Performance du système
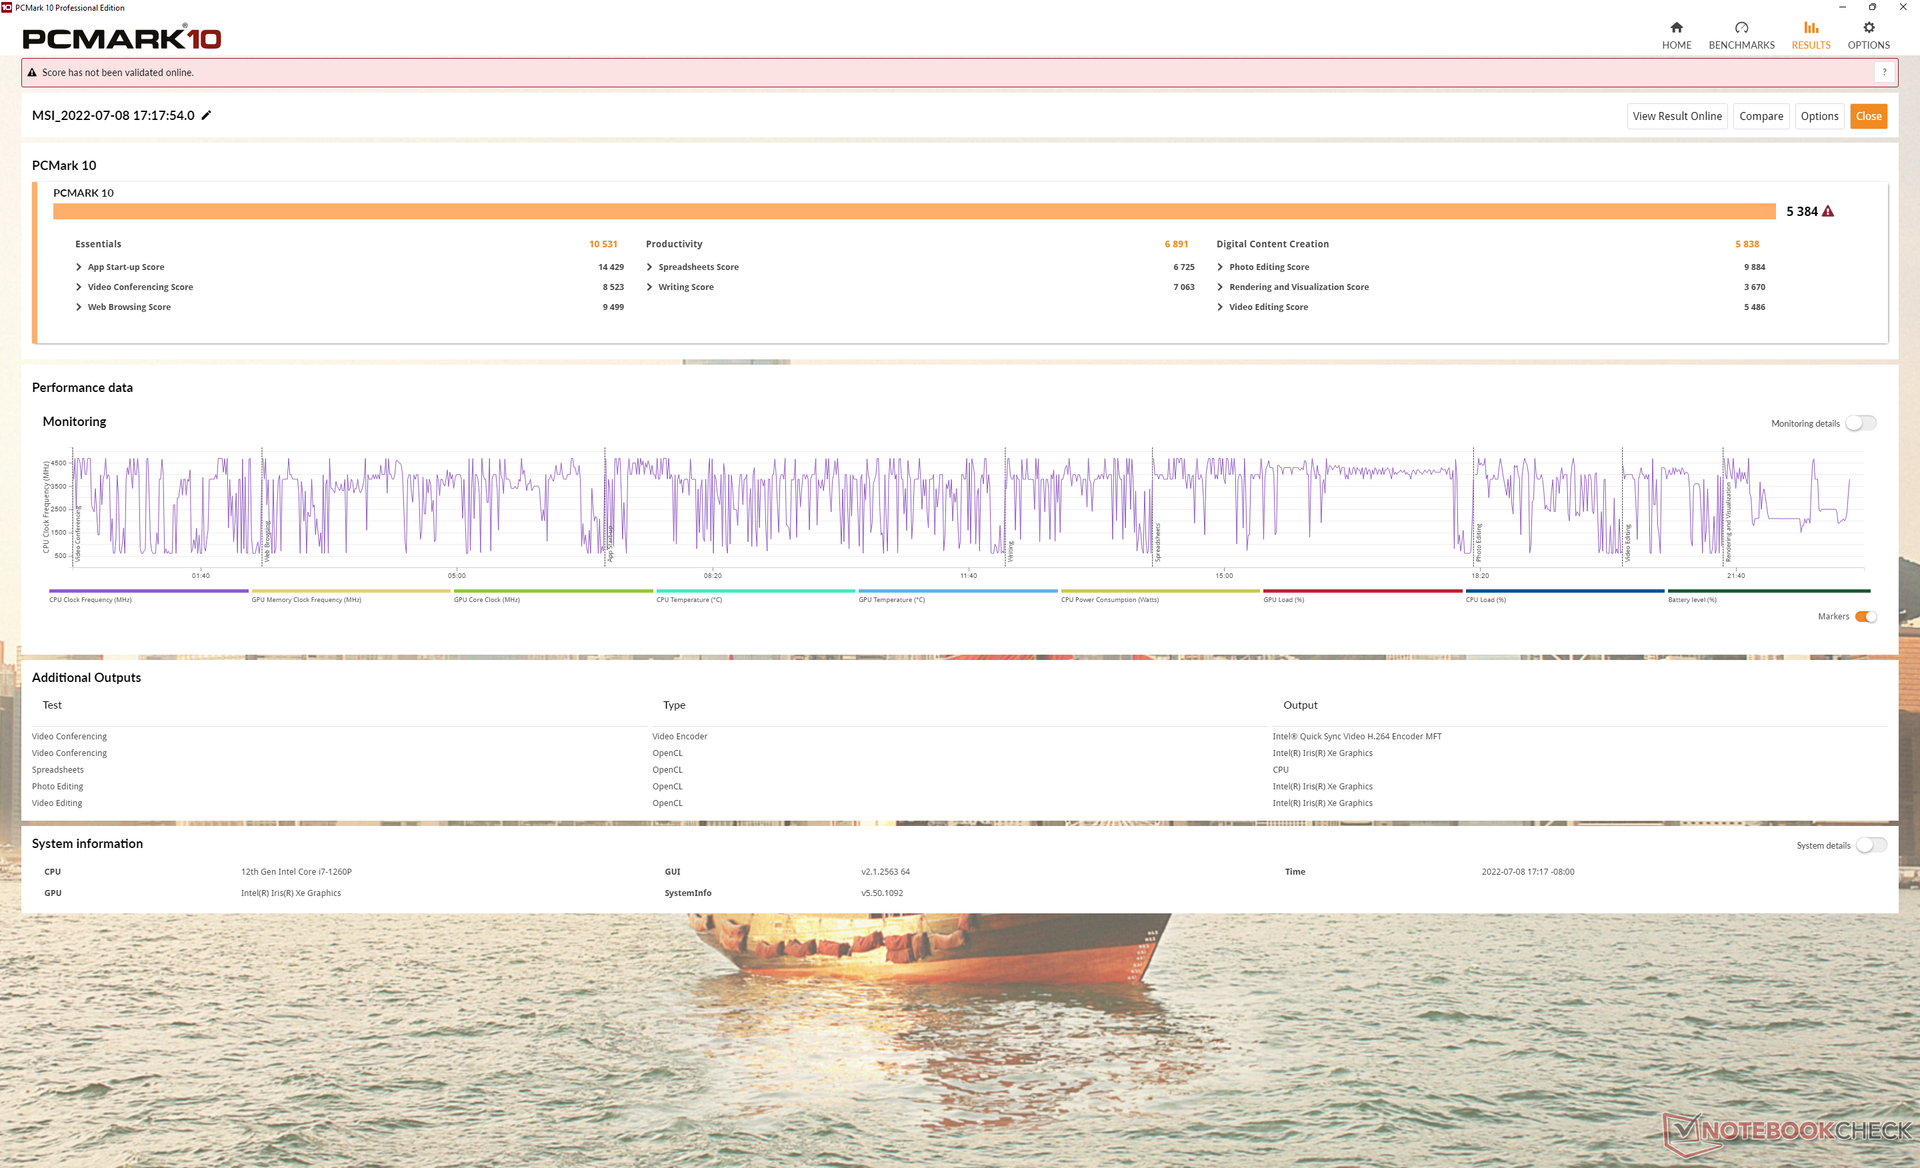
Les scores PCMark 10 sont comparables à ceux d'autres ordinateurs portables équipés du même processeur Core i7-1260P. En attendant, les scores CrossMark sont systématiquement plus élevés que ceux de nombreuses autres alternatives de 14 pouces, y compris même ceux de l'Asus VivoBook S 14 pouces équipé d'un processeur Core H-series Asus VivoBook S 14.
CrossMark: Overall | Productivity | Creativity | Responsiveness
| PCMark 10 / Score | |
| Asus VivoBook S 14X S5402Z | |
| Moyenne Intel Core i7-1260P, Intel Iris Xe Graphics G7 96EUs (4796 - 6068, n=17) | |
| MSI Summit E14 Flip Evo A12MT | |
| MSI Summit E14 A11SCS | |
| Dell Latitude 9420 2-in-1 | |
| Lenovo Yoga Slim 7i Pro 14IAP G7 | |
| LG Gram 14T90P | |
| PCMark 10 / Essentials | |
| Asus VivoBook S 14X S5402Z | |
| MSI Summit E14 Flip Evo A12MT | |
| Dell Latitude 9420 2-in-1 | |
| Moyenne Intel Core i7-1260P, Intel Iris Xe Graphics G7 96EUs (9260 - 11251, n=17) | |
| Lenovo Yoga Slim 7i Pro 14IAP G7 | |
| LG Gram 14T90P | |
| MSI Summit E14 A11SCS | |
| PCMark 10 / Productivity | |
| MSI Summit E14 A11SCS | |
| Asus VivoBook S 14X S5402Z | |
| Moyenne Intel Core i7-1260P, Intel Iris Xe Graphics G7 96EUs (6167 - 8629, n=17) | |
| Dell Latitude 9420 2-in-1 | |
| MSI Summit E14 Flip Evo A12MT | |
| LG Gram 14T90P | |
| Lenovo Yoga Slim 7i Pro 14IAP G7 | |
| PCMark 10 / Digital Content Creation | |
| Asus VivoBook S 14X S5402Z | |
| Moyenne Intel Core i7-1260P, Intel Iris Xe Graphics G7 96EUs (5231 - 6908, n=17) | |
| Lenovo Yoga Slim 7i Pro 14IAP G7 | |
| MSI Summit E14 Flip Evo A12MT | |
| MSI Summit E14 A11SCS | |
| Dell Latitude 9420 2-in-1 | |
| LG Gram 14T90P | |
| CrossMark / Overall | |
| MSI Summit E14 Flip Evo A12MT | |
| Moyenne Intel Core i7-1260P, Intel Iris Xe Graphics G7 96EUs (1484 - 1811, n=16) | |
| Lenovo Yoga Slim 7i Pro 14IAP G7 | |
| Asus VivoBook S 14X S5402Z | |
| LG Gram 14T90P | |
| CrossMark / Productivity | |
| MSI Summit E14 Flip Evo A12MT | |
| Moyenne Intel Core i7-1260P, Intel Iris Xe Graphics G7 96EUs (1486 - 1755, n=16) | |
| Asus VivoBook S 14X S5402Z | |
| Lenovo Yoga Slim 7i Pro 14IAP G7 | |
| LG Gram 14T90P | |
| CrossMark / Creativity | |
| MSI Summit E14 Flip Evo A12MT | |
| Moyenne Intel Core i7-1260P, Intel Iris Xe Graphics G7 96EUs (1451 - 1872, n=16) | |
| Lenovo Yoga Slim 7i Pro 14IAP G7 | |
| Asus VivoBook S 14X S5402Z | |
| LG Gram 14T90P | |
| CrossMark / Responsiveness | |
| MSI Summit E14 Flip Evo A12MT | |
| Moyenne Intel Core i7-1260P, Intel Iris Xe Graphics G7 96EUs (1253 - 1807, n=16) | |
| Asus VivoBook S 14X S5402Z | |
| Lenovo Yoga Slim 7i Pro 14IAP G7 | |
| LG Gram 14T90P | |
| PCMark 10 Score | 5384 points | |
Aide | ||
| AIDA64 / Memory Copy | |
| MSI Summit E14 Flip Evo A12MT | |
| Dell Latitude 9420 2-in-1 | |
| LG Gram 14T90P | |
| MSI Summit E14 A11SCS | |
| Lenovo Yoga Slim 7i Pro 14IAP G7 | |
| Moyenne Intel Core i7-1260P (25125 - 71544, n=25) | |
| Asus VivoBook S 14X S5402Z | |
| AIDA64 / Memory Read | |
| MSI Summit E14 Flip Evo A12MT | |
| Dell Latitude 9420 2-in-1 | |
| Lenovo Yoga Slim 7i Pro 14IAP G7 | |
| LG Gram 14T90P | |
| MSI Summit E14 A11SCS | |
| Moyenne Intel Core i7-1260P (24983 - 72065, n=25) | |
| Asus VivoBook S 14X S5402Z | |
| AIDA64 / Memory Write | |
| LG Gram 14T90P | |
| Dell Latitude 9420 2-in-1 | |
| MSI Summit E14 A11SCS | |
| MSI Summit E14 Flip Evo A12MT | |
| Lenovo Yoga Slim 7i Pro 14IAP G7 | |
| Moyenne Intel Core i7-1260P (23512 - 66799, n=25) | |
| Asus VivoBook S 14X S5402Z | |
| AIDA64 / Memory Latency | |
| MSI Summit E14 A11SCS | |
| Dell Latitude 9420 2-in-1 | |
| LG Gram 14T90P | |
| Moyenne Intel Core i7-1260P (77.9 - 118.4, n=21) | |
| Asus VivoBook S 14X S5402Z | |
| MSI Summit E14 Flip Evo A12MT | |
* ... Moindre est la valeur, meilleures sont les performances
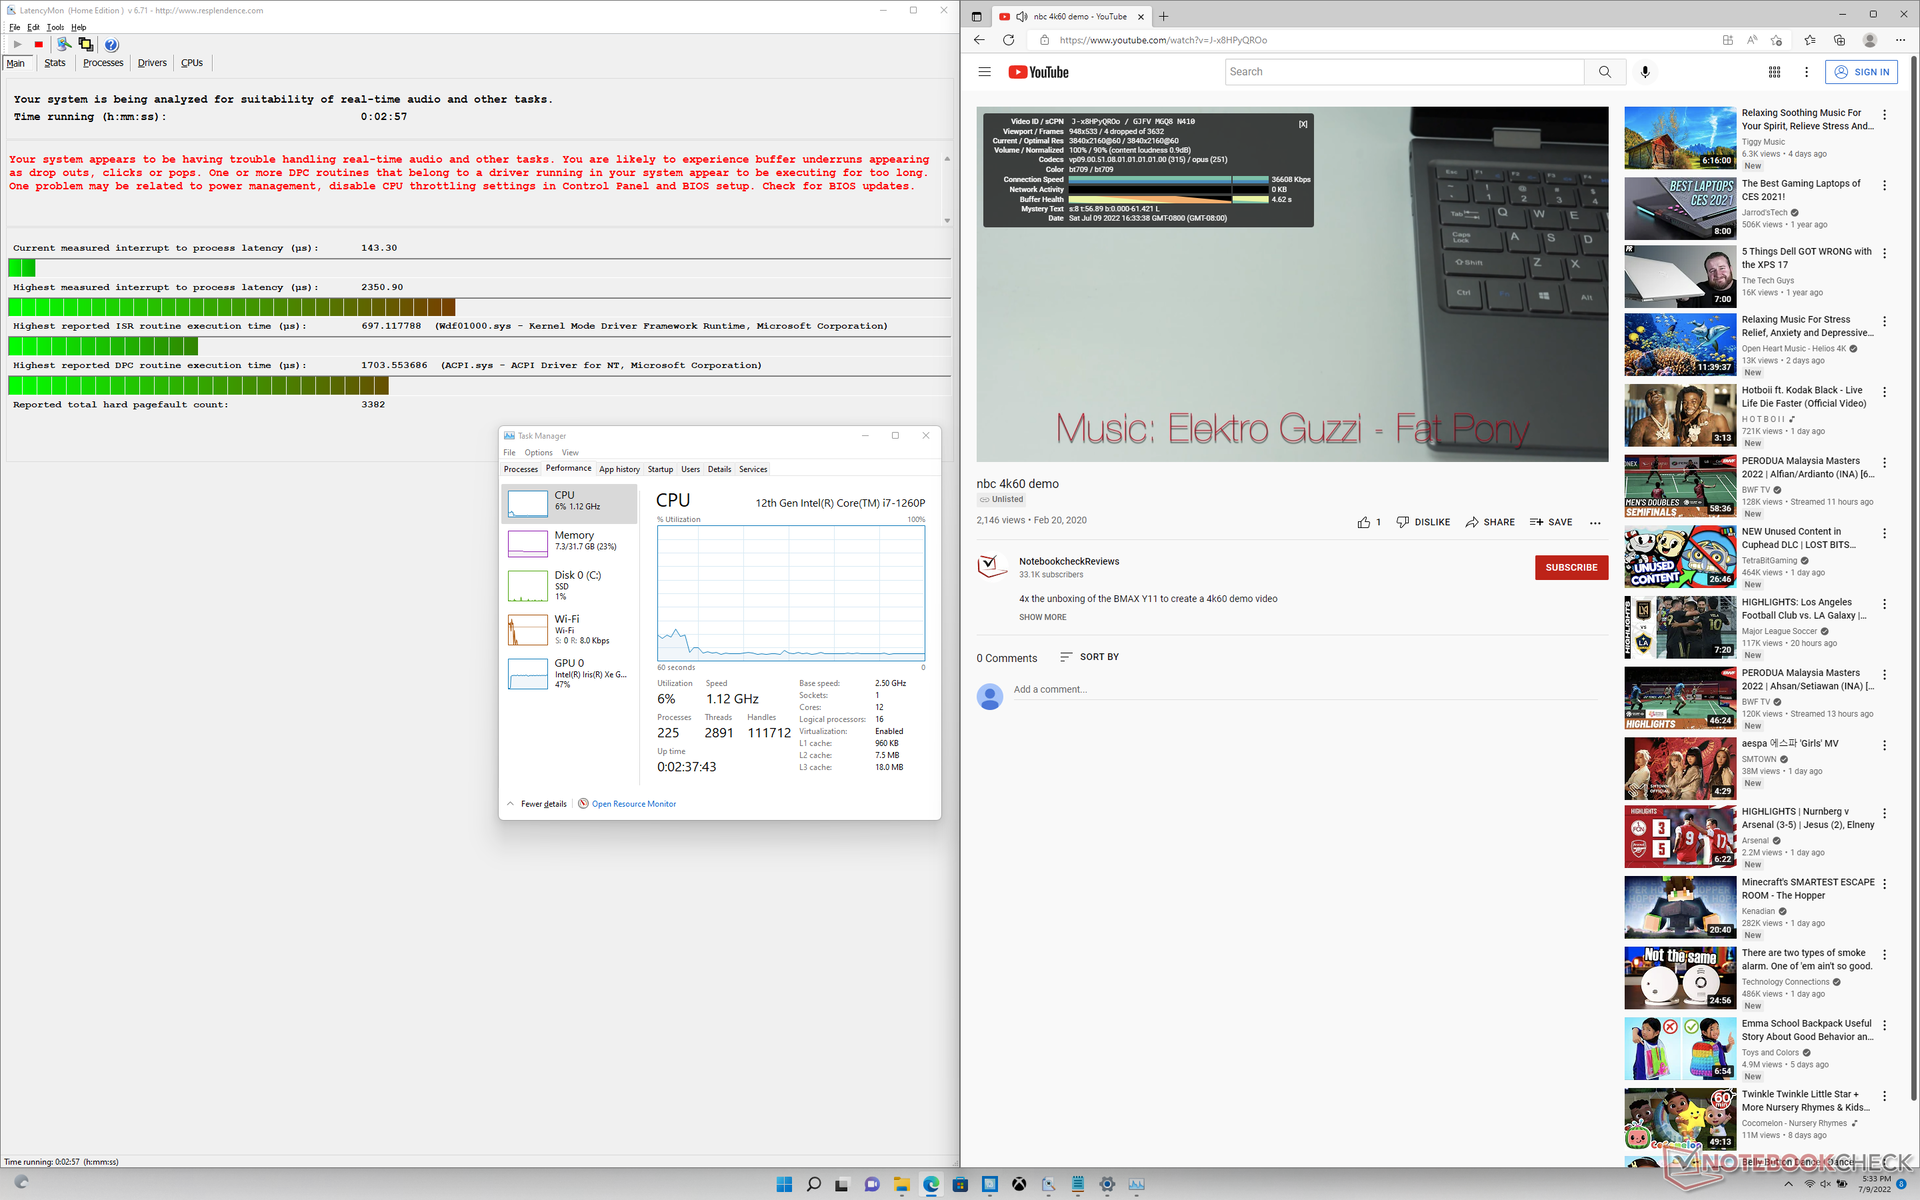
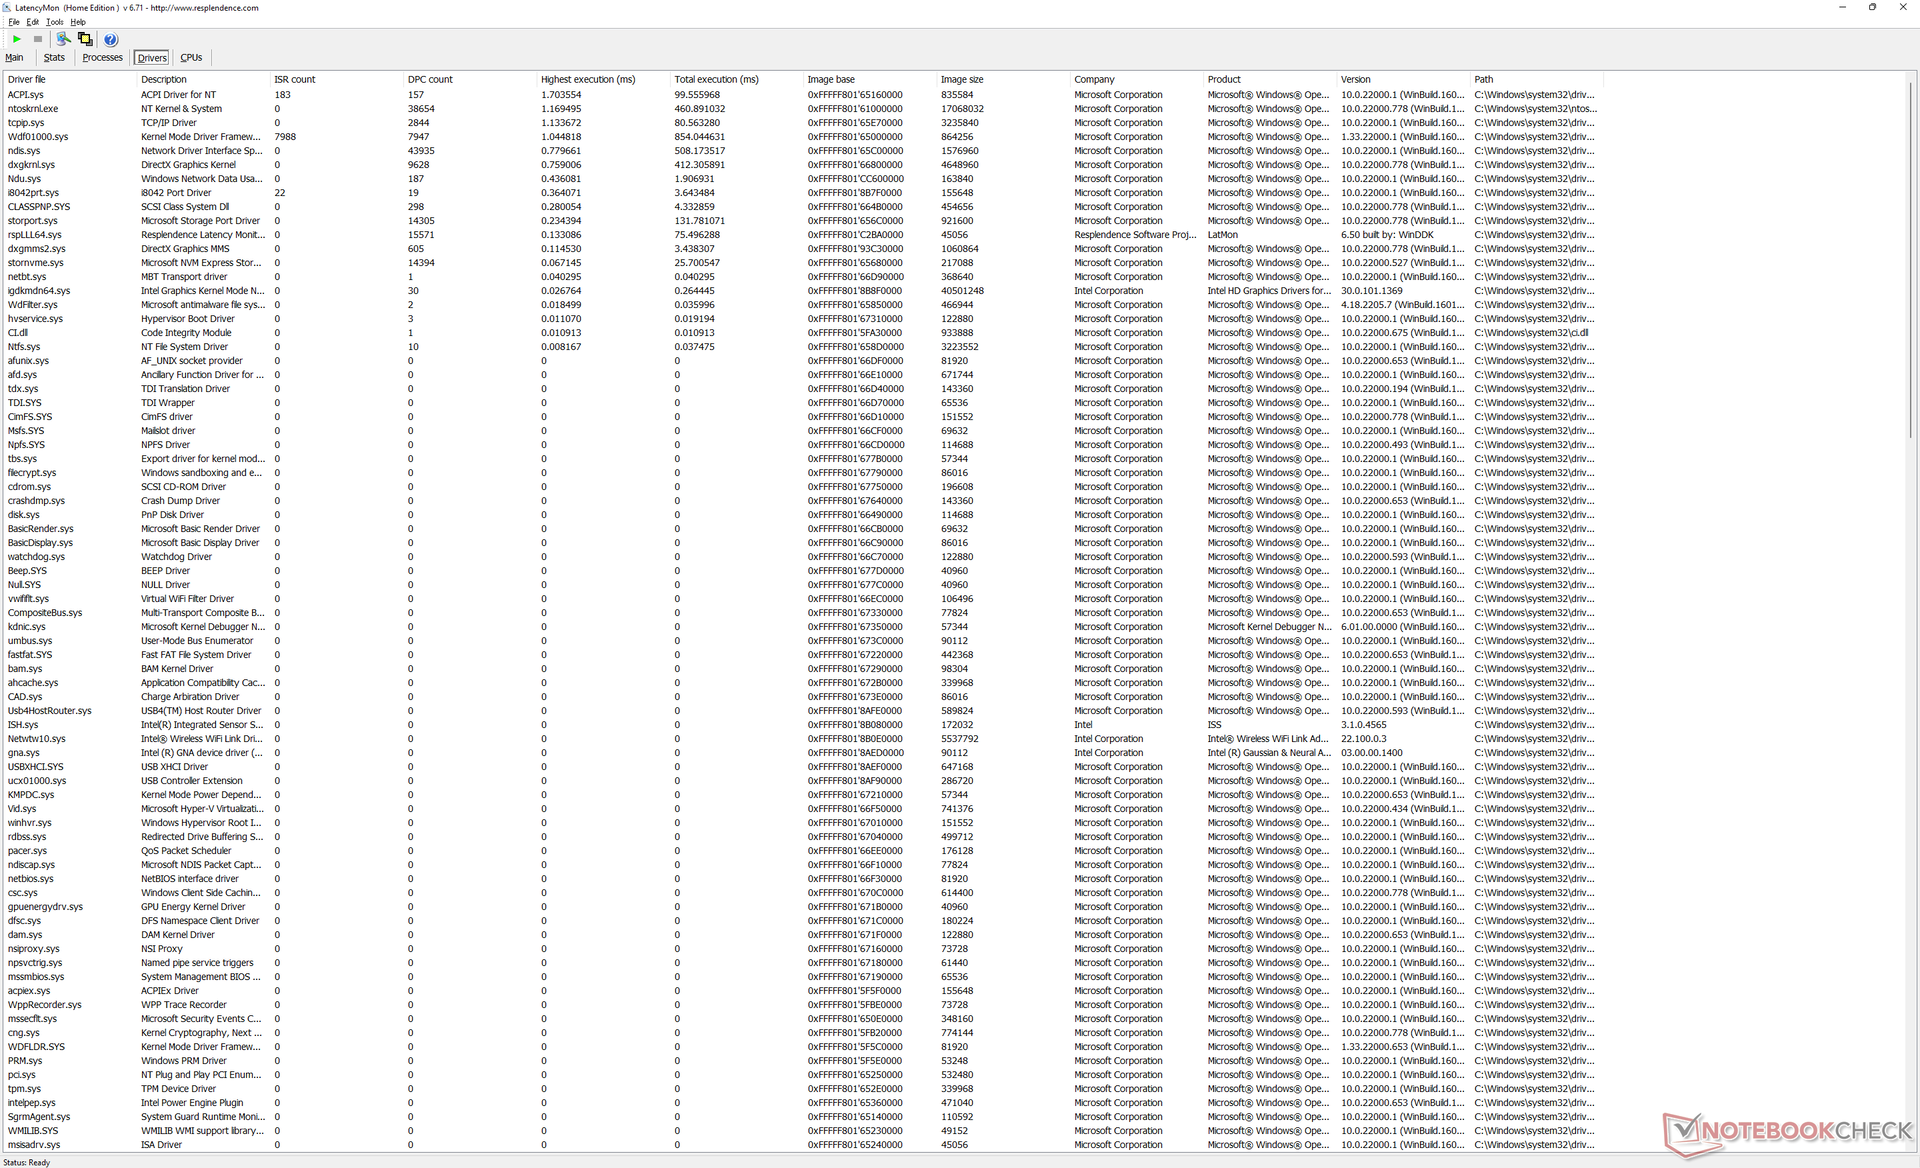
Latence DPC
LatencyMon révèle des problèmes de CPD lors de l'ouverture de plusieurs onglets de navigateur de notre page d'accueil. la lecture de vidéos 4K à 60 FPS n'est pas non plus parfaite avec 4 images perdues pendant notre test vidéo d'une minute.
| DPC Latencies / LatencyMon - interrupt to process latency (max), Web, Youtube, Prime95 | |
| MSI Summit E14 Flip Evo A12MT | |
| Asus VivoBook S 14X S5402Z | |
| LG Gram 14T90P | |
| MSI Summit E14 A11SCS | |
| Lenovo Yoga Slim 7i Pro 14IAP G7 | |
| Dell Latitude 9420 2-in-1 | |
* ... Moindre est la valeur, meilleures sont les performances
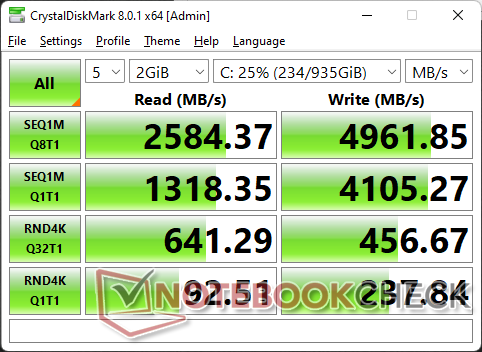
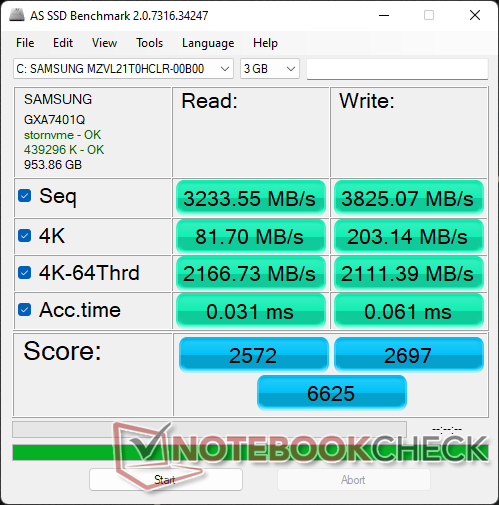
Périphériques de stockage - Étranglement des performances de PCIe4 x4
Notre unité de test est équipée d'un disque dur de 1 ToSamsung PM9A1 PCIe4 x4 NVMe SSD pour des taux de lecture et d'écriture séquentiels allant jusqu'à 7000 Mo/s et 5200 Mo/s, respectivement. Malheureusement, il ne faut pas s'attendre à des taux de transfert proches de ces valeurs dans la plupart des scénarios du monde réel en raison de l'absence de refroidissement du SSD dans le Summit E14 Flip. En faisant tourner DiskSpd en boucle, les taux de transfert s'effondrent presque instantanément à seulement 1700 Mo/s, ce qui est déjà plus lent que la plupart des SSD NVMe PCIe3. En exécutant ce même test sur leLenovo Yoga Slim 7i Pro équipé d'un SSD Samsung PM9A1 similaire, les performances sont également limitées, mais les taux de transfert moyens sont toujours plus rapides que sur le MSI.

| Drive Performance rating - Percent | |
| MSI Summit E14 Flip Evo A12MT | |
| MSI Summit E14 A11SCS | |
| Lenovo Yoga Slim 7i Pro 14IAP G7 | |
| LG Gram 14T90P | |
| Asus VivoBook S 14X S5402Z | |
| Dell Latitude 9420 2-in-1 | |
* ... Moindre est la valeur, meilleures sont les performances
Disk Throttling: DiskSpd Read Loop, Queue Depth 8
Performances du GPU - L'Iris Xe est encore très bon
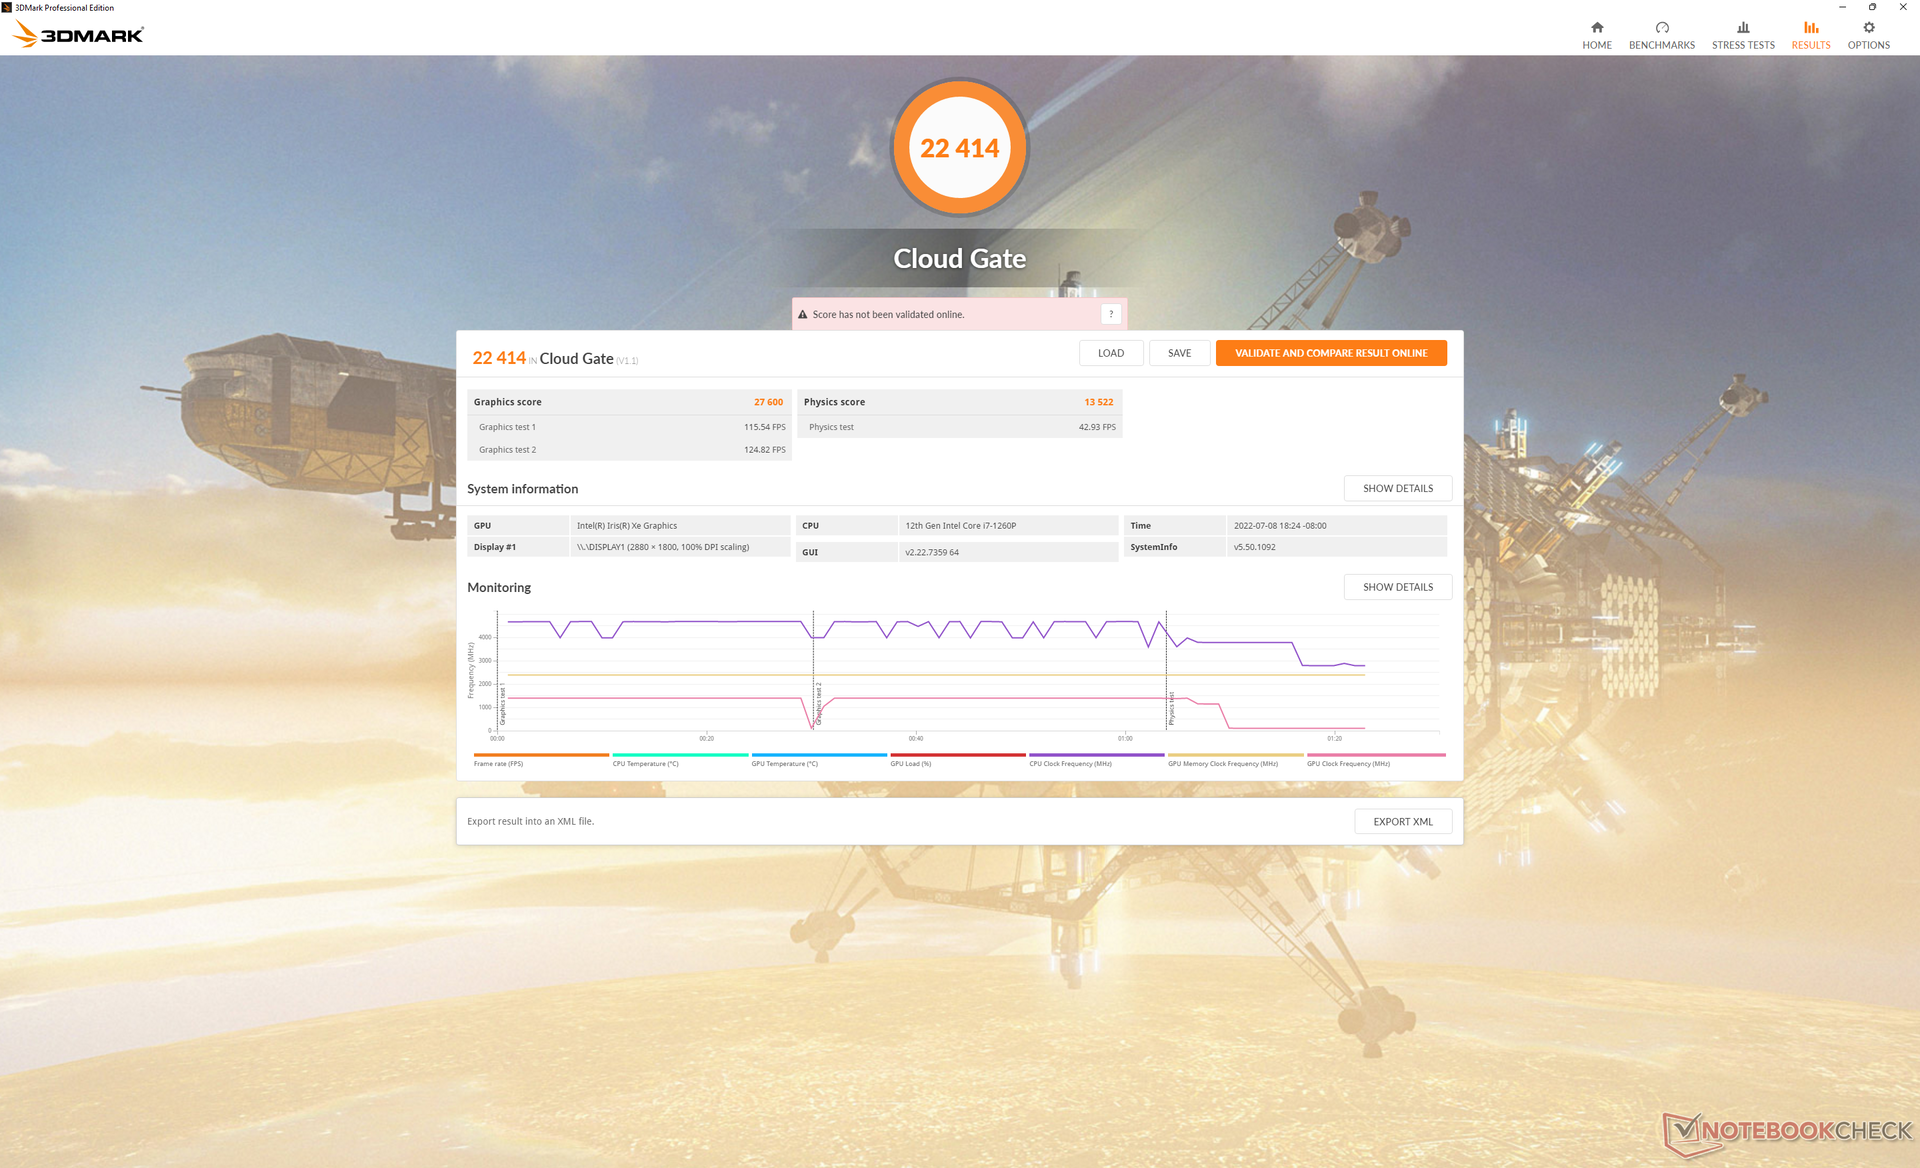
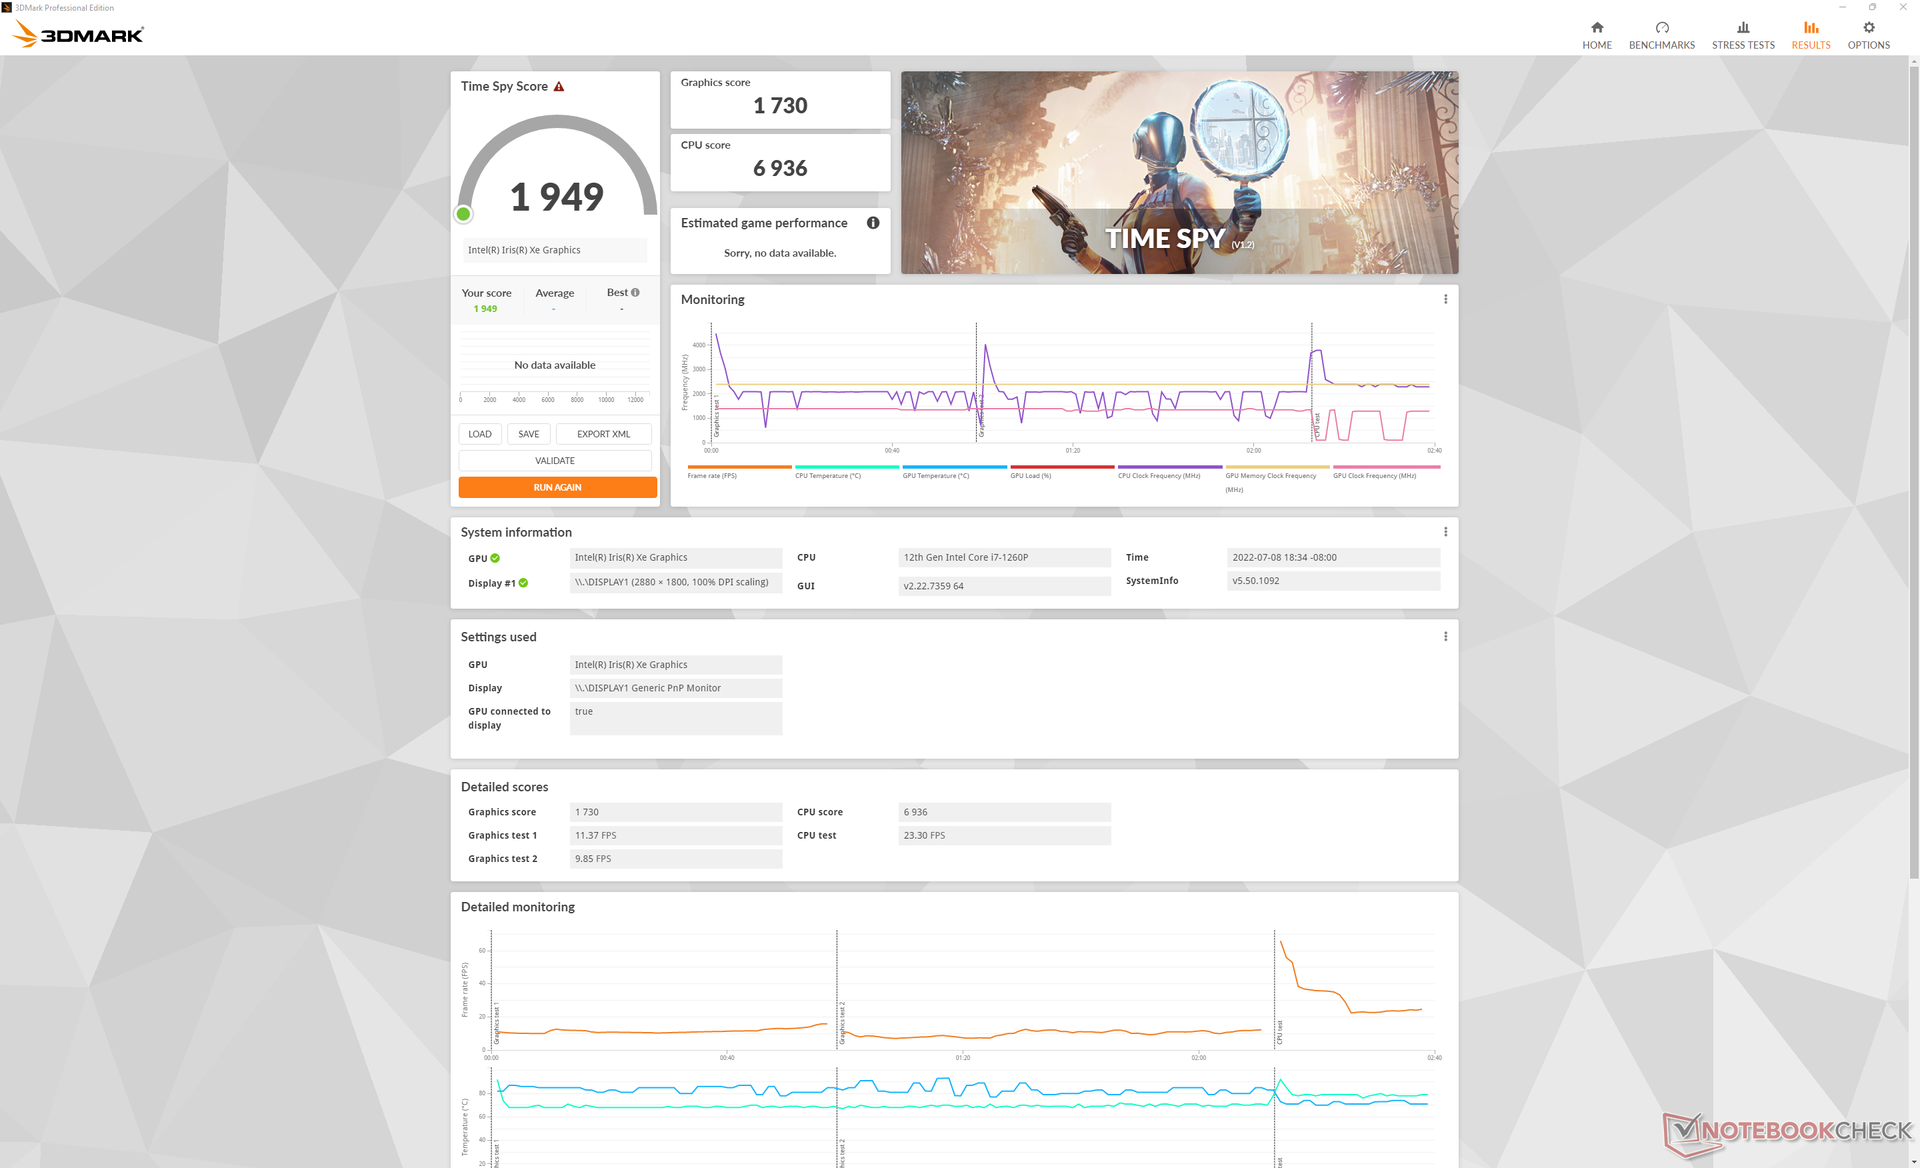
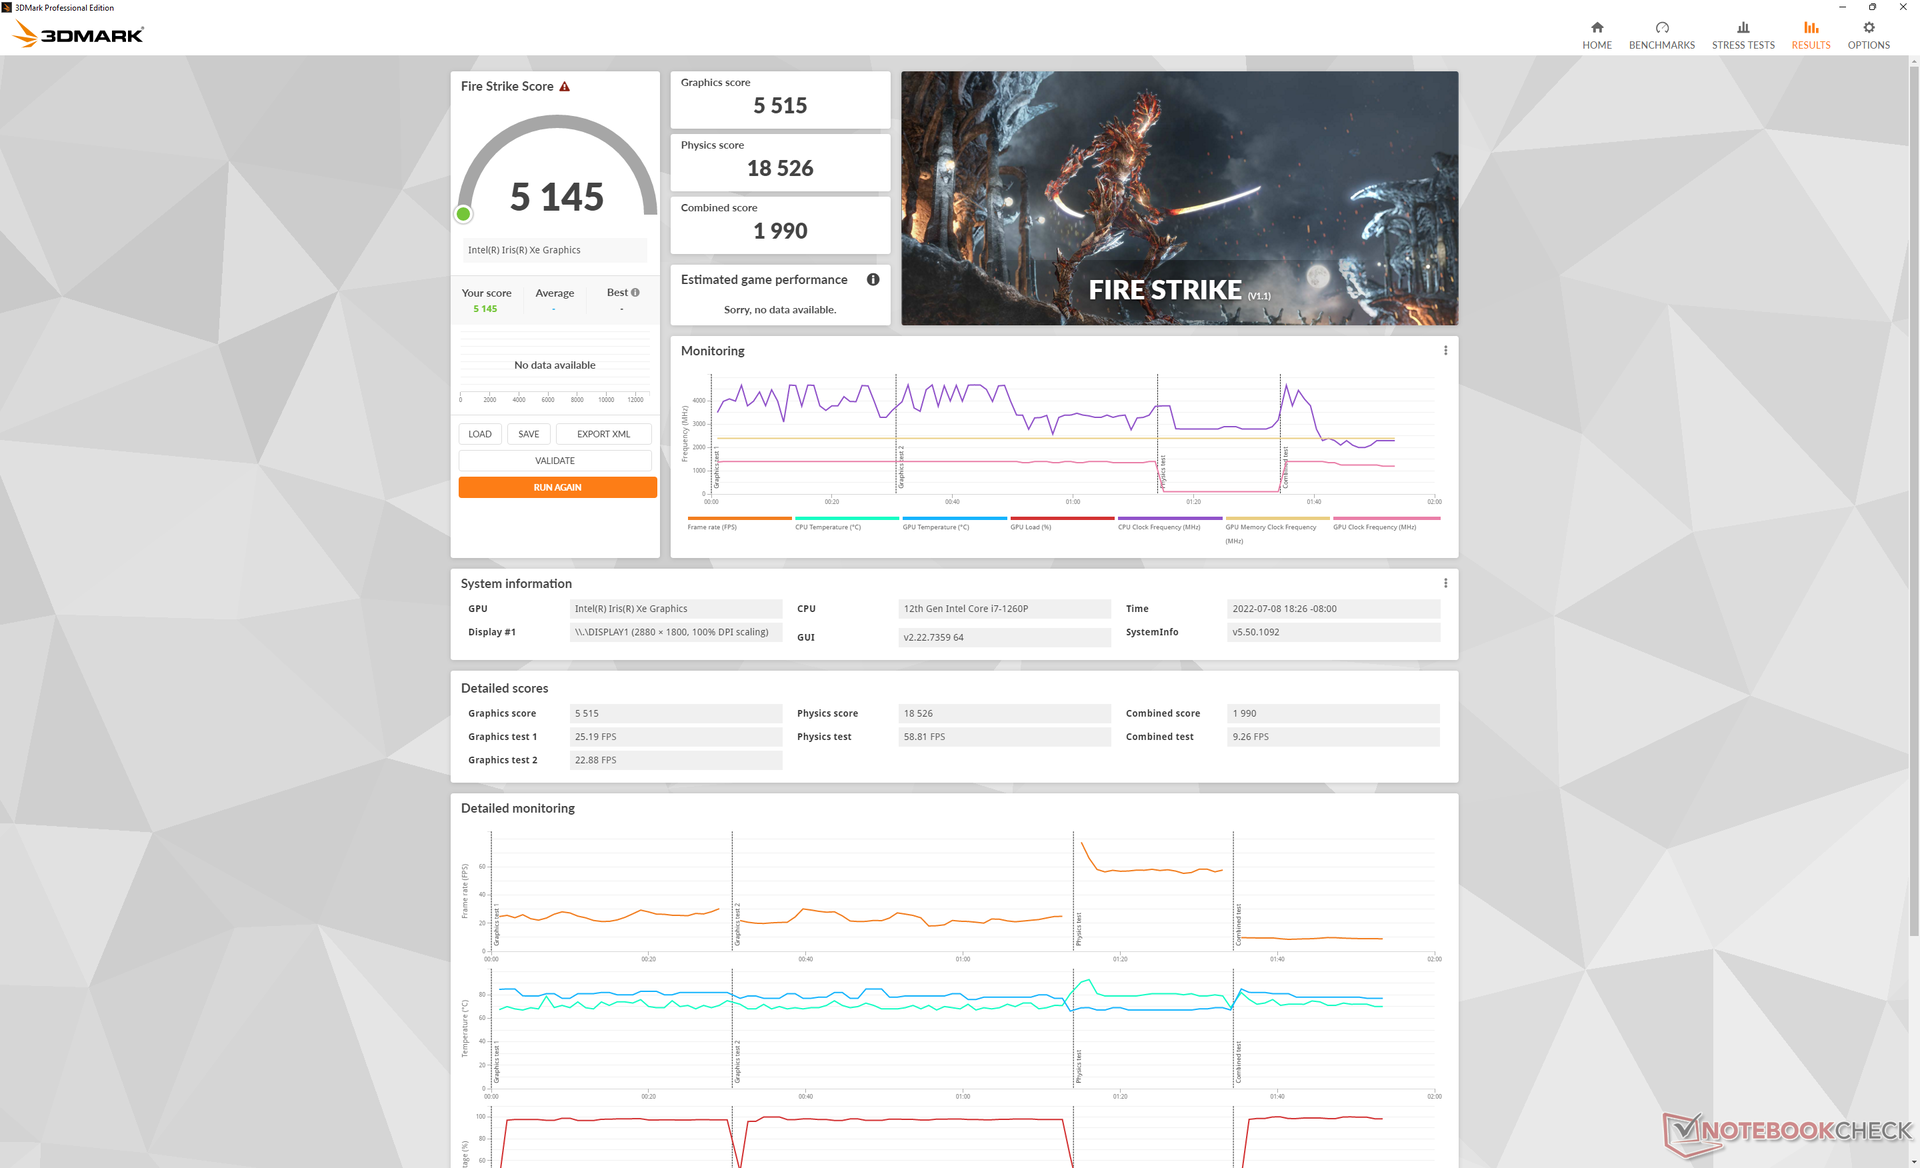
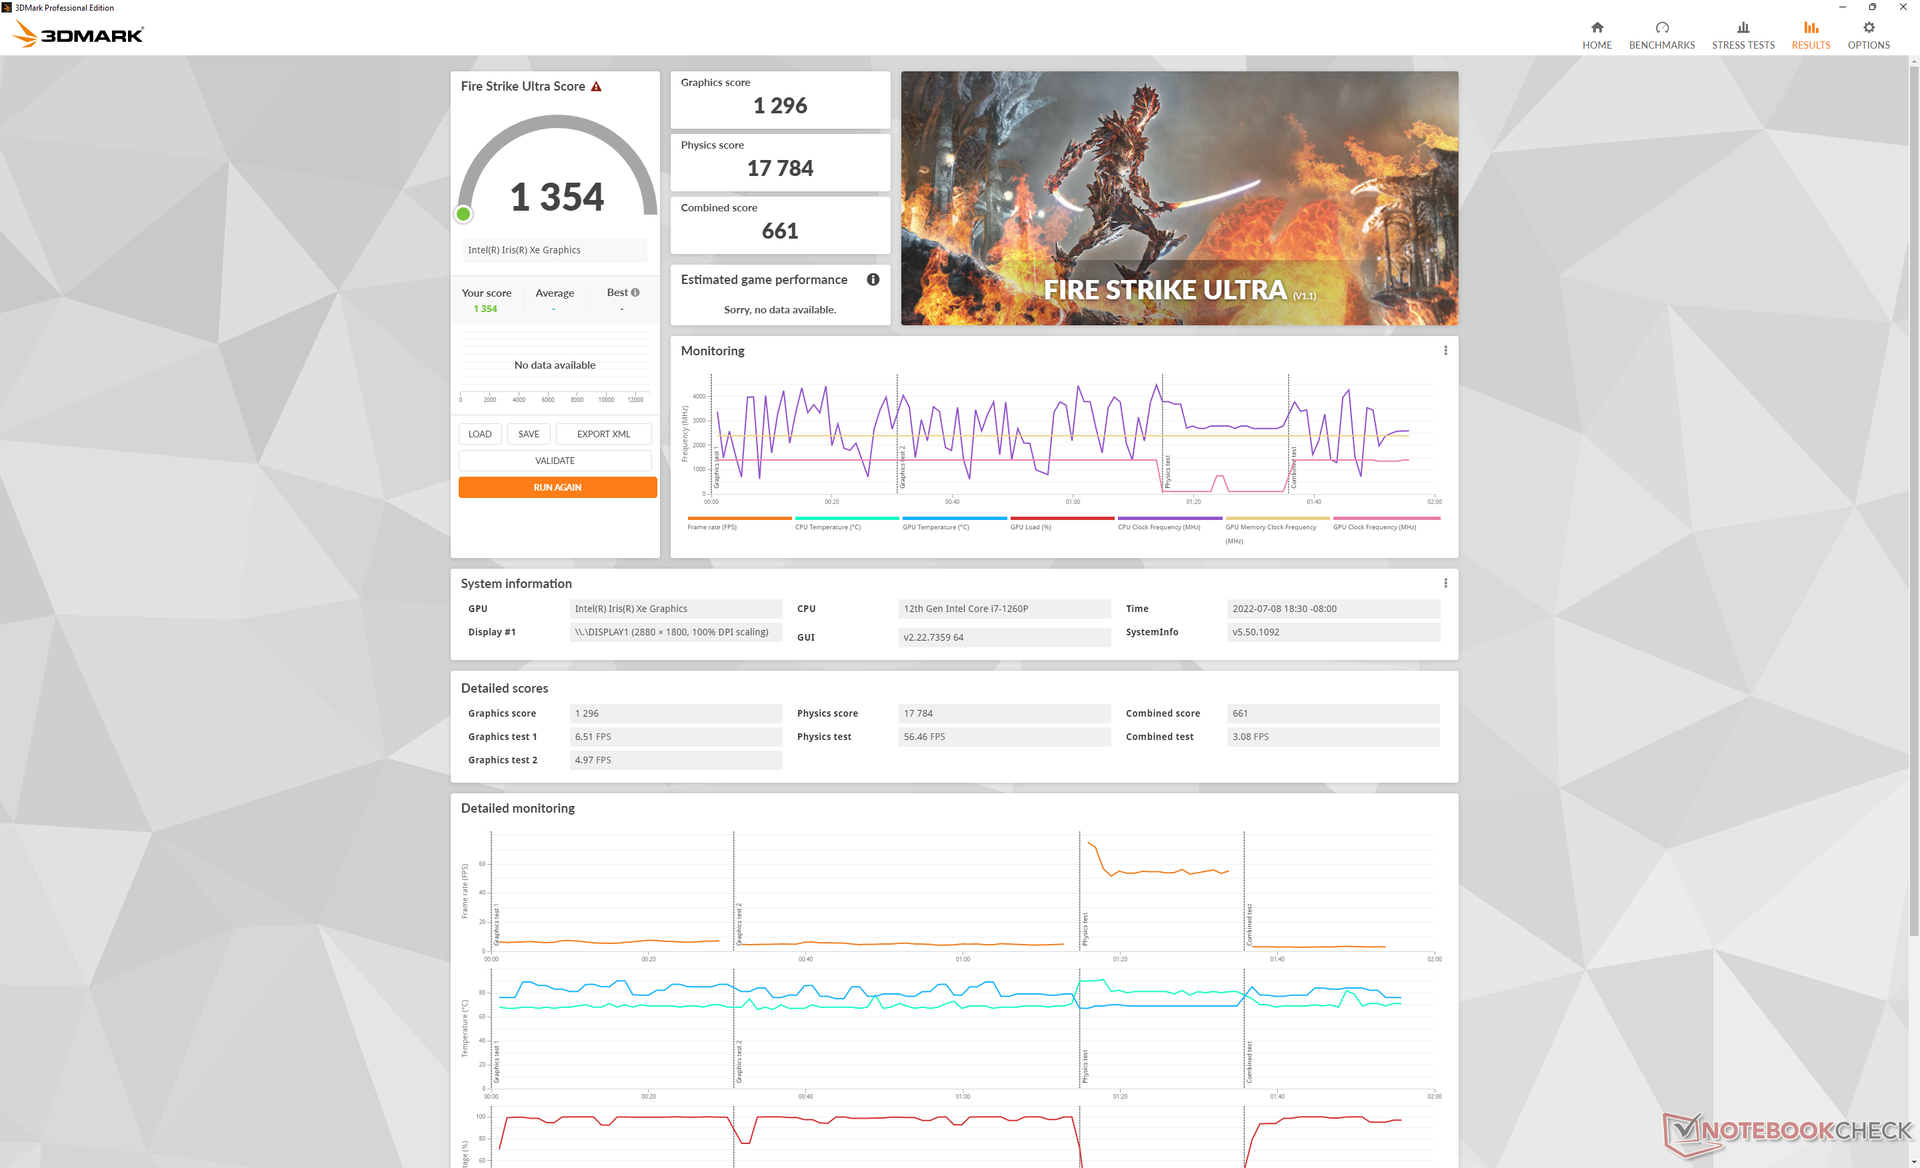
Les performances graphiques sont de 15 à 20 % plus rapides que celles de la plupart des ordinateurs Iris Xe 96 EU dans notre base de données pour être l'un des convertibles de 14 pouces les plus rapides avec des graphiques intégrés. Ce léger gain peut être attribué en partie à la RAM LPDDR5, alors que la plupart des autres Ultrabooks utilisent encore la DDR4 ou la LPDDR4. Le siteAMD Radeon 680M est toujours plus rapide dans la plupart des cas, mais cette option n'est pas disponible sur la série Summit. Le système est néanmoins assez rapide pour jouer à des jeux exigeants en basse résolution 720p ou 900p ou à des jeux moins exigeants comme DOTA 2 en 1080p.
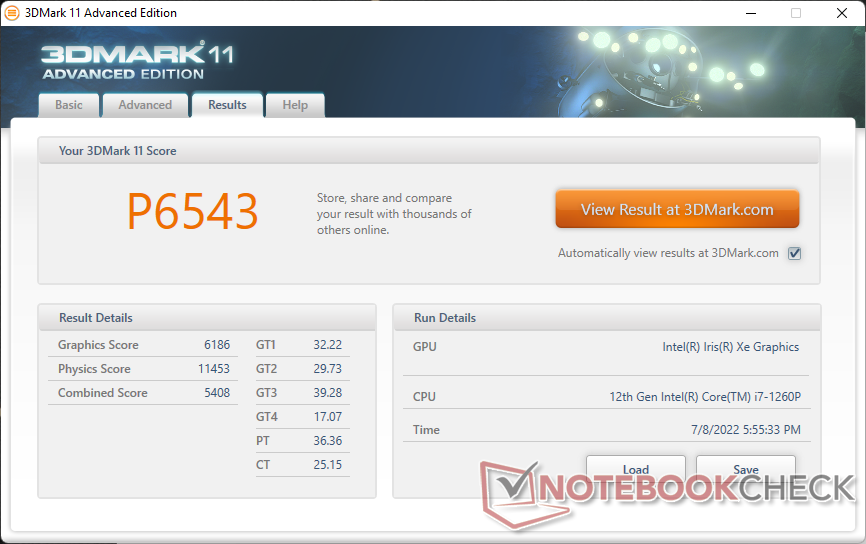
| 3DMark 11 Performance | 6543 points | |
| 3DMark Cloud Gate Standard Score | 22414 points | |
| 3DMark Fire Strike Score | 5145 points | |
| 3DMark Time Spy Score | 1949 points | |
Aide | ||
Witcher 3 FPS Chart
| Bas | Moyen | Élevé | Ultra | |
|---|---|---|---|---|
| GTA V (2015) | 121.6 | 101.4 | 20.5 | 9.75 |
| The Witcher 3 (2015) | 96.9 | 62.9 | 34.7 | 15.8 |
| Dota 2 Reborn (2015) | 122.1 | 93.5 | 66.2 | 59.8 |
| Final Fantasy XV Benchmark (2018) | 44.4 | 24.8 | 24.8 | |
| X-Plane 11.11 (2018) | 47.8 | 34.9 | 32.1 | |
| Strange Brigade (2018) | 95.2 | 44.5 | 35.8 | 29 |
| Cyberpunk 2077 1.6 (2022) | 22.6 | 19.1 | 14.5 | 11.6 |
Émissions
Bruit du système - silencieux dans la plupart des scénarios bas-moyens
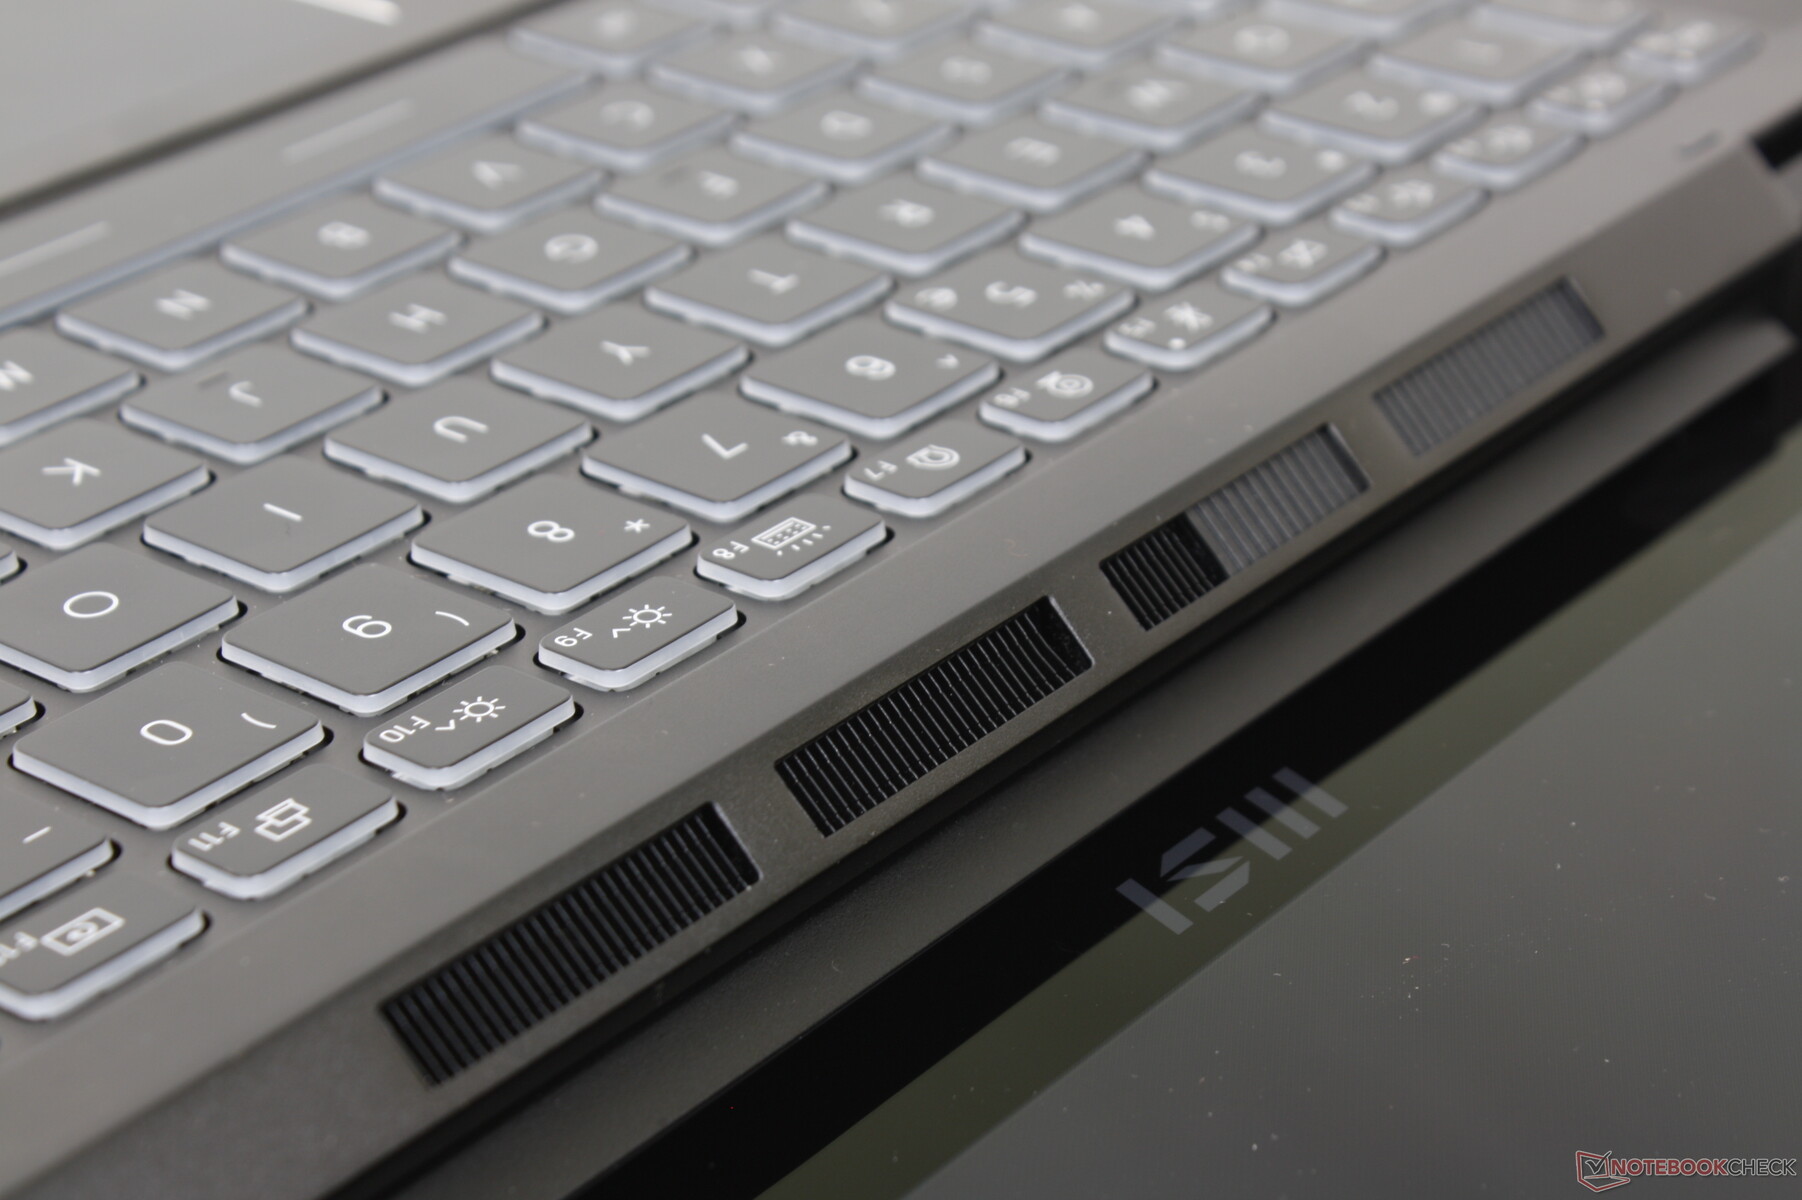
Le châssis a été construit pour supporter des options Core-H et GeForce MX discrètes plus exigeantes. Ainsi, il n'est pas surprenant que notre configuration unique de CPU Core-P soit relativement silencieuse. Lors de l'exécution de la première scène de benchmark de 3DMark 06 en mode Balanced, par exemple, le bruit du ventilateur était à peine audible à 24 dB(A) contre un fond silencieux de 23,3 dB(A). Les utilisateurs peuvent s'attendre à ce que le bruit du ventilateur reste inférieur à 24,7 dB(A) dans des scénarios de navigation typiques.
En cas de fonctionnement Witcher 3 pour représenter des charges élevées, le bruit du ventilateur se situe généralement entre 35 et 43 dB(A). L'activation du mode Cooler Boost (c'est-à-dire le mode ventilateur maximal) induirait un bruit de ventilateur de près de 56 dB(A), soit plus fort que celui de la plupart des ordinateurs portables. Heureusement, un tel mode n'est pas nécessaire dans la plupart des cas pour notre configuration particulière.
Degré de la nuisance sonore
| Au repos |
| 23.3 / 23.3 / 23.3 dB(A) |
| Fortement sollicité |
| 24 / 55.8 dB(A) |
 | ||
30 dB silencieux 40 dB(A) audible 50 dB(A) bruyant |
||
min: | ||
| MSI Summit E14 Flip Evo A12MT Iris Xe G7 96EUs, i7-1260P, Samsung PM9A1 MZVL21T0HCLR | MSI Summit E14 A11SCS GeForce GTX 1650 Ti Max-Q, i7-1185G7, Phison 1TB SM2801T24GKBB4S-E162 | Asus VivoBook S 14X S5402Z Iris Xe G7 96EUs, i7-12700H, Micron 2450 512GB MTFDKBA512TFK | LG Gram 14T90P Iris Xe G7 80EUs, i5-1135G7, Samsung SSD PM981a MZVLB512HBJQ | Lenovo Yoga Slim 7i Pro 14IAP G7 Iris Xe G7 80EUs, i5-1240P, Samsung PM9A1 MZVL2512HCJQ | Dell Latitude 9420 2-in-1 Iris Xe G7 96EUs, i7-1185G7, WDC PC SN530 SDBPNPZ-512G | |
|---|---|---|---|---|---|---|
| Noise | -21% | -20% | -2% | -8% | -5% | |
| arrêt / environnement * (dB) | 23.3 | 23.9 -3% | 22.7 3% | 25.4 -9% | 23.7 -2% | 25.4 -9% |
| Idle Minimum * (dB) | 23.3 | 24.2 -4% | 23.2 -0% | 25.5 -9% | 23.7 -2% | 25.4 -9% |
| Idle Average * (dB) | 23.3 | 24.2 -4% | 23.2 -0% | 25.5 -9% | 25.1 -8% | 25.4 -9% |
| Idle Maximum * (dB) | 23.3 | 24.2 -4% | 27.2 -17% | 25.5 -9% | 25.1 -8% | 25.4 -9% |
| Load Average * (dB) | 24 | 50.2 -109% | 43.2 -80% | 28.3 -18% | 38.4 -60% | 25.4 -6% |
| Witcher 3 ultra * (dB) | 35.6 | 47 -32% | 52.8 -48% | 35 2% | 38.4 -8% | 41.3 -16% |
| Load Maximum * (dB) | 55.8 | 51.7 7% | 52.8 5% | 35 37% | 39.4 29% | 41.3 26% |
* ... Moindre est la valeur, meilleures sont les performances
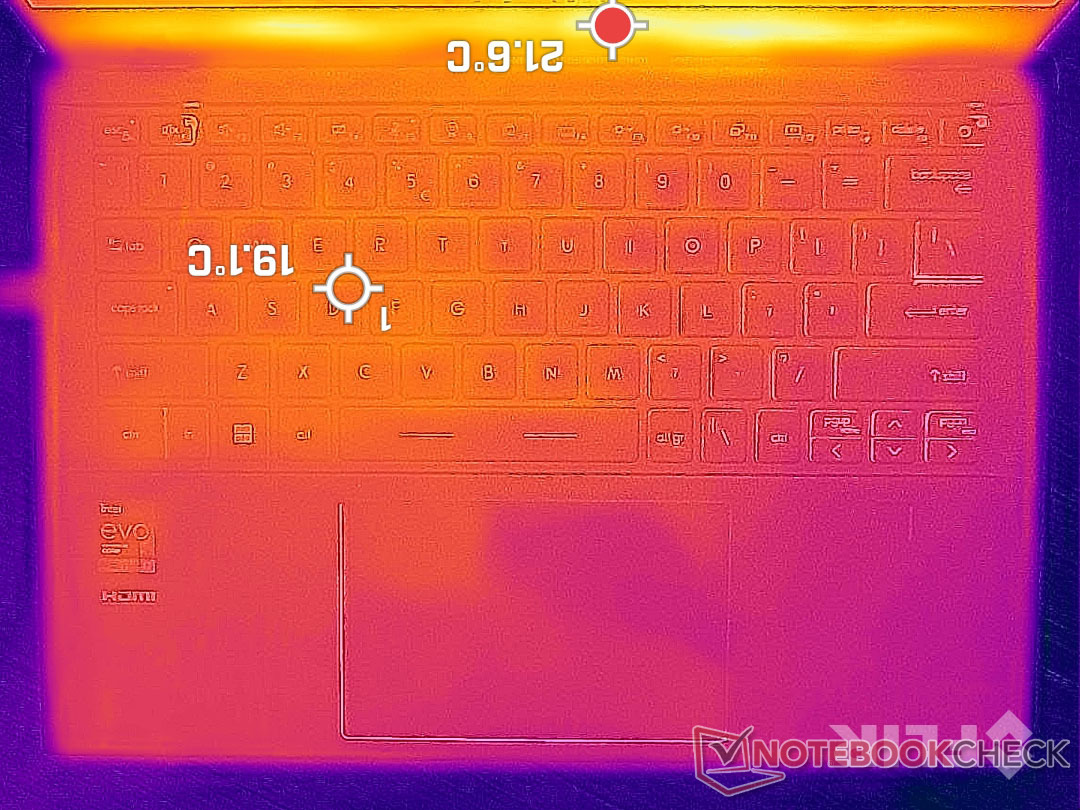
Température
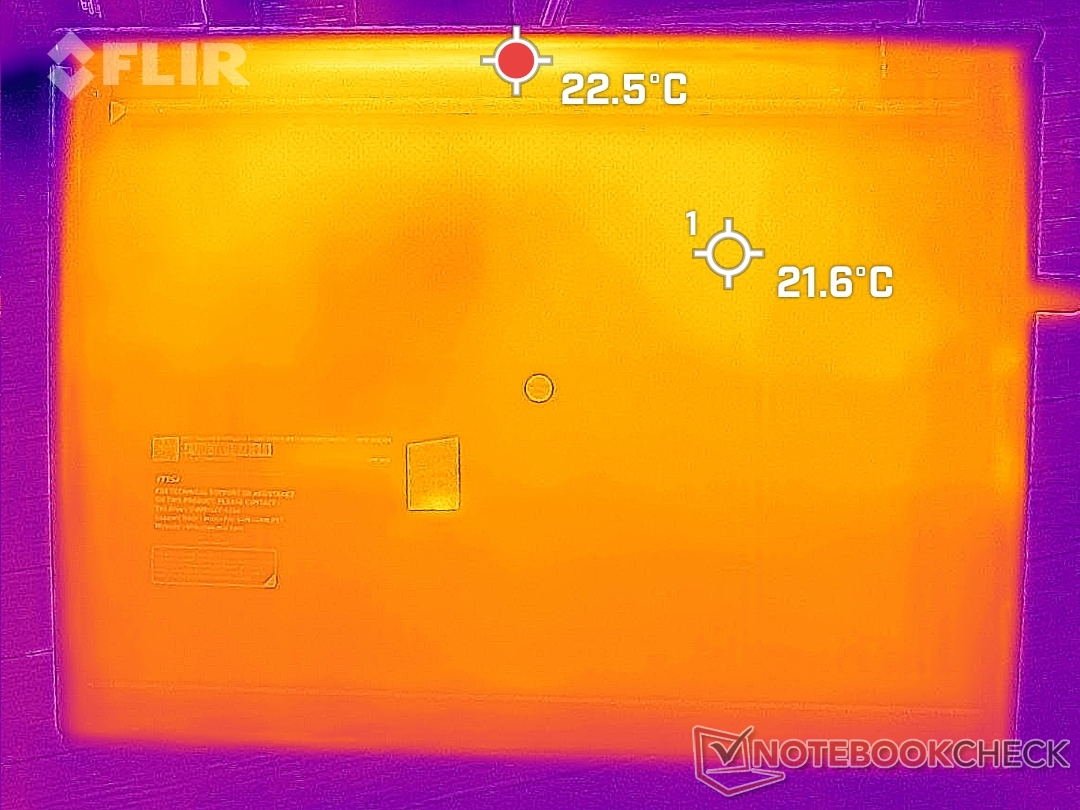
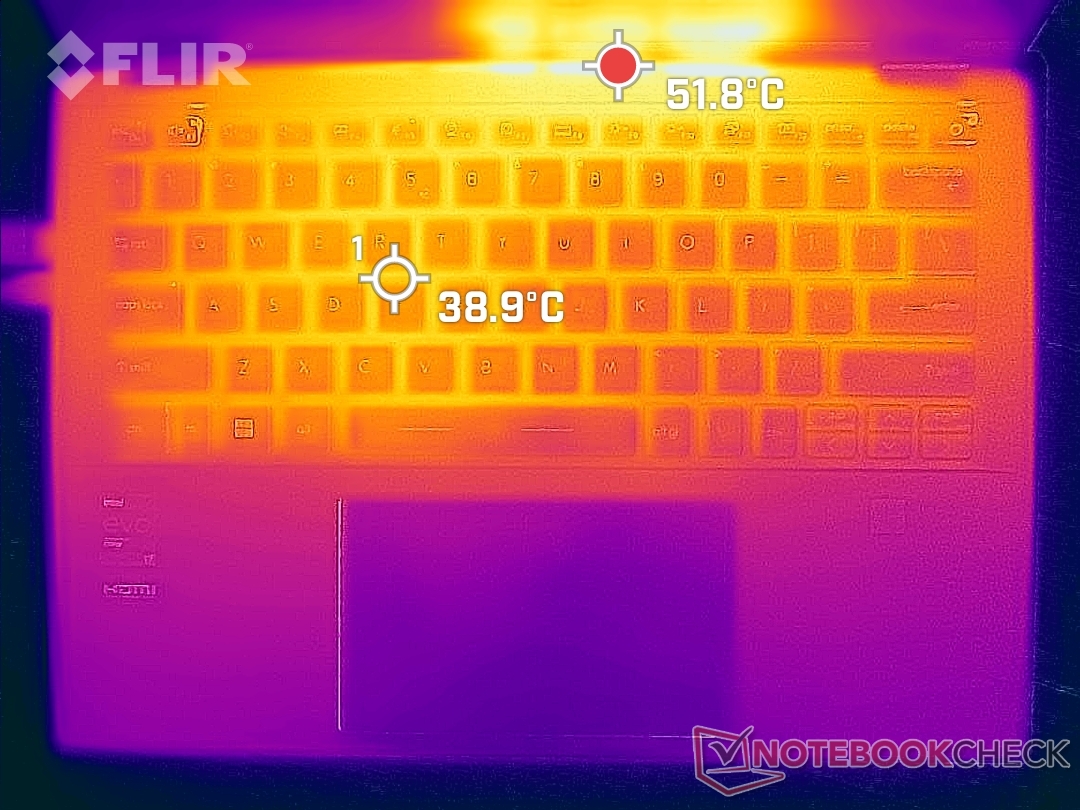
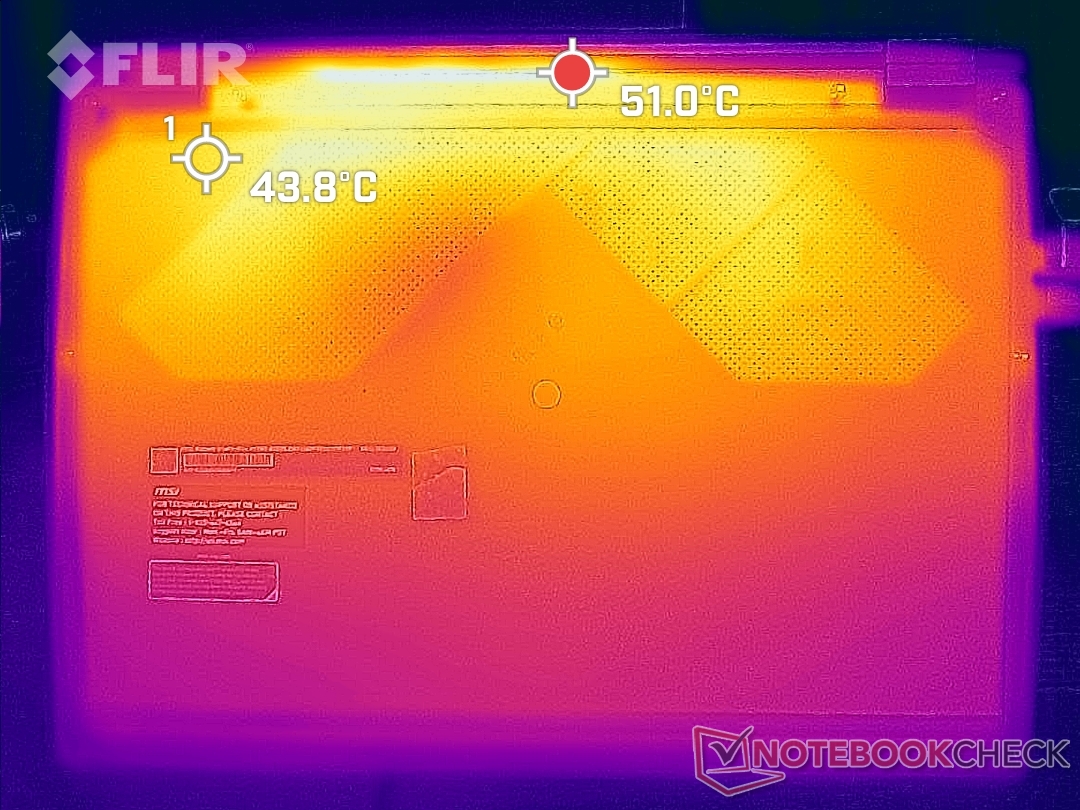
Les températures de surface lors de la marche au ralenti ou de la navigation sur Internet restent confortables et parfois même fraîches au toucher, car la majeure partie du châssis est en métal. Cependant, lors de l'exécution de charges plus exigeantes comme des jeux, les points chauds sur le dessus et le dessous peuvent devenir aussi chauds que 52 C près des grilles de ventilation. Les repose-paumes deviennent également plus chauds à 27 C pour être perceptibles sur les paumes. Des résultats similaires peuvent être observés sur le revêtement métallique.Dell Latitude 9420 2-en-1et donc les températures de surface très chaudes du MSI ne sont pas rares.
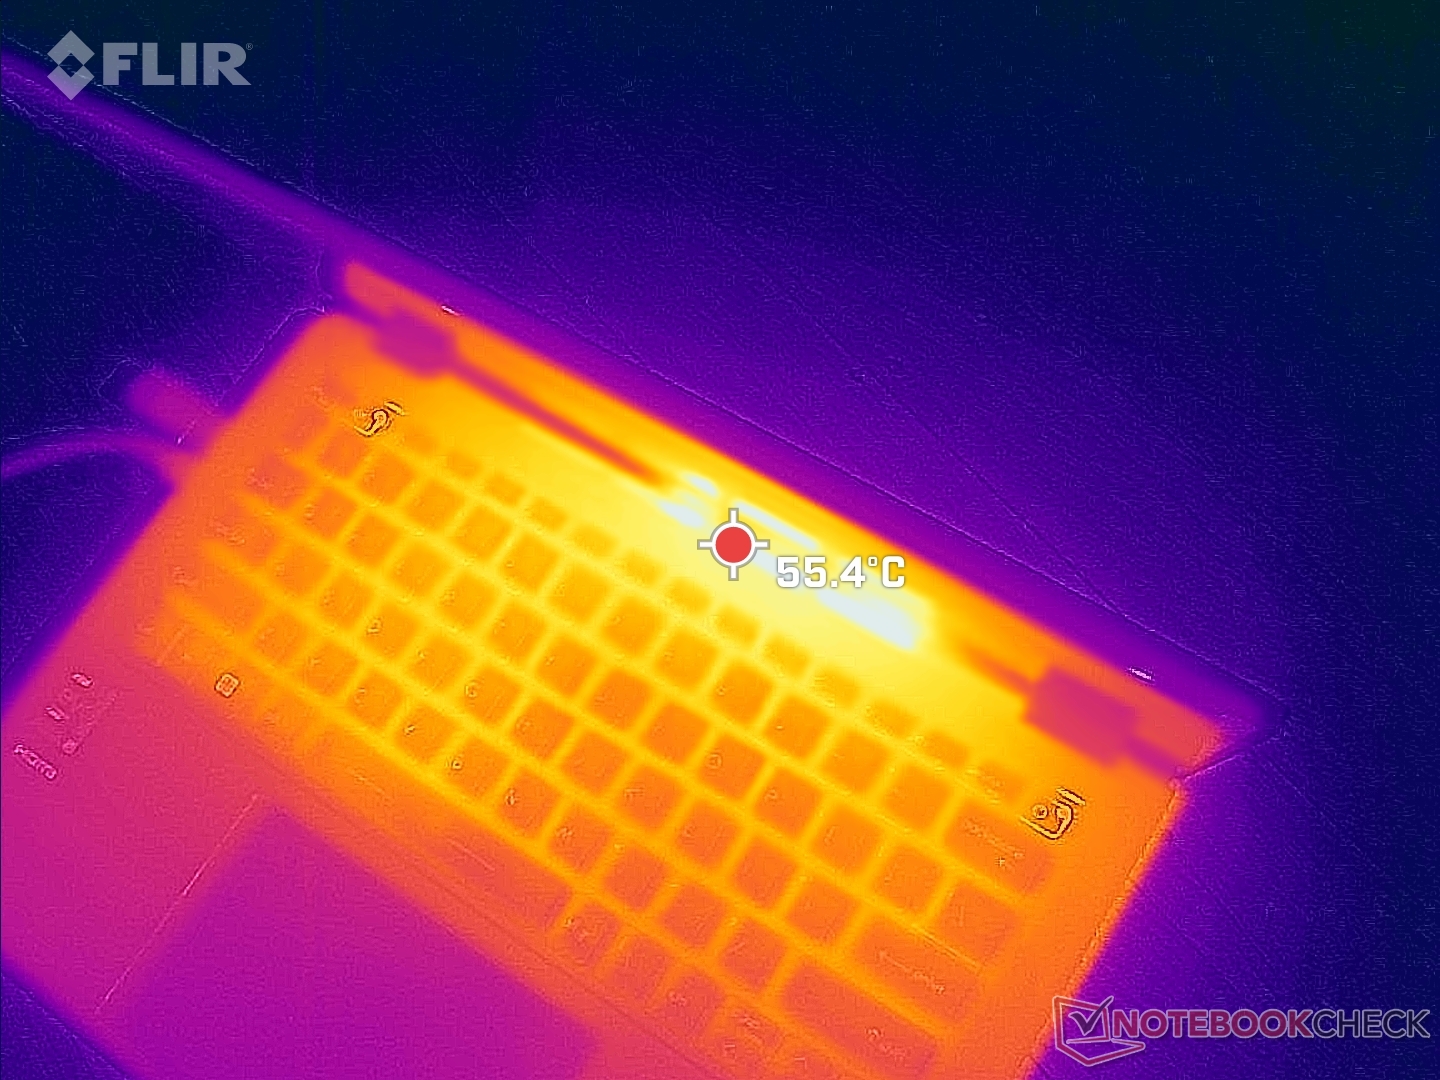
(±) La température maximale du côté supérieur est de 44.2 °C / 112 F, par rapport à la moyenne de 35.4 °C / 96 F, allant de 19.6 à 60 °C pour la classe Convertible.
(-) Le fond chauffe jusqu'à un maximum de 45.8 °C / 114 F, contre une moyenne de 36.9 °C / 98 F
(+) En utilisation inactive, la température moyenne du côté supérieur est de 19.2 °C / 67 F, par rapport à la moyenne du dispositif de 30.3 °C / 87 F.
(+) Les repose-poignets et le pavé tactile sont plus froids que la température de la peau avec un maximum de 27.2 °C / 81 F et sont donc froids au toucher.
(±) La température moyenne de la zone de l'appui-paume de dispositifs similaires était de 28 °C / 82.4 F (+0.8 °C / #1.4 F).
| MSI Summit E14 Flip Evo A12MT Intel Core i7-1260P, Intel Iris Xe Graphics G7 96EUs | MSI Summit E14 A11SCS Intel Core i7-1185G7, NVIDIA GeForce GTX 1650 Ti Max-Q | Asus VivoBook S 14X S5402Z Intel Core i7-12700H, Intel Iris Xe Graphics G7 96EUs | LG Gram 14T90P Intel Core i5-1135G7, Intel Iris Xe Graphics G7 80EUs | Lenovo Yoga Slim 7i Pro 14IAP G7 Intel Core i5-1240P, Intel Iris Xe Graphics G7 80EUs | Dell Latitude 9420 2-in-1 Intel Core i7-1185G7, Intel Iris Xe Graphics G7 96EUs | |
|---|---|---|---|---|---|---|
| Heat | -43% | -17% | -4% | -20% | -21% | |
| Maximum Upper Side * (°C) | 44.2 | 49.4 -12% | 37.2 16% | 41.6 6% | 42.3 4% | 43.4 2% |
| Maximum Bottom * (°C) | 45.8 | 60.6 -32% | 39.2 14% | 46.2 -1% | 52.8 -15% | 48 -5% |
| Idle Upper Side * (°C) | 19.6 | 30.6 -56% | 30.4 -55% | 22.6 -15% | 27.1 -38% | 29.8 -52% |
| Idle Bottom * (°C) | 22 | 37.4 -70% | 31.6 -44% | 23.2 -5% | 29.1 -32% | 28 -27% |
* ... Moindre est la valeur, meilleures sont les performances
Test de stress - Températures élevées du cœur
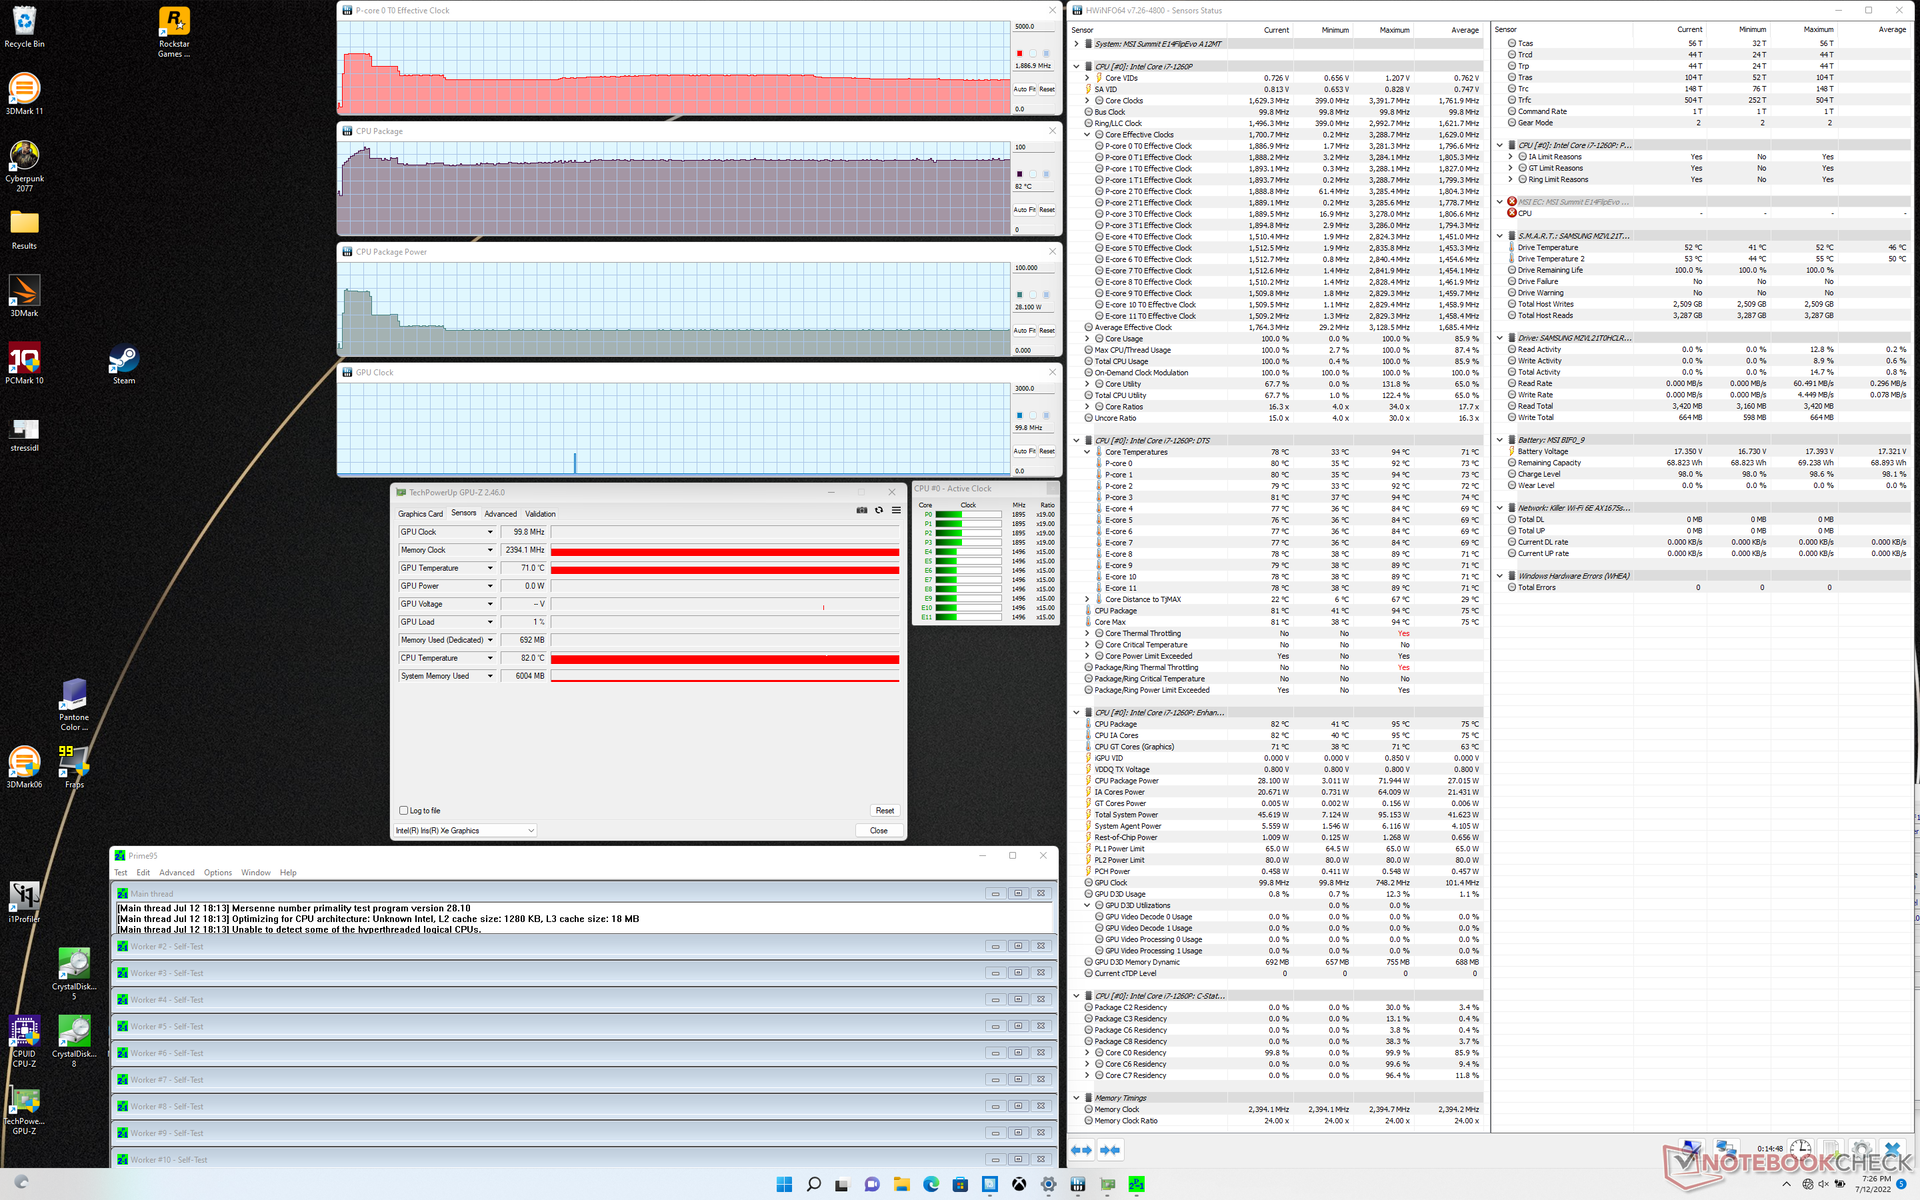
Lors de l'exécution de Prime95, les fréquences d'horloge du CPU ont augmenté jusqu'à 3,3 GHz pendant moins d'une minute avant d'atteindre une température de 95 C. Ensuite, les fréquences d'horloge ont chuté à 2,6 GHz avant de finalement chuter et se stabiliser à 1,9 GHz et à une température de 82 C. La consommation d'énergie du CPU a atteint 72 W au début du test avant de se stabiliser à 28 W. L'exécution de ce même test sur le Yoga 9 14 avec le même processeur, on obtient des fréquences d'horloge stables similaires de 2,0 GHz et une consommation d'énergie du processeur de 28 W, mais la température centrale est plus basse à 66 C.
L'exécution de Witcher 3 la température moyenne du cœur serait de 85°C, ce qui est élevé pour un convertible de 14 pouces. L'exécution de ce même test sur leDell Latitude 9420 2-en-1 ou sur le Lenovo susmentionné, par exemple, la température du cœur serait de 73 °C et 65 °C, respectivement. L'activation du mode Cooler Boost permettrait de réduire les températures à 70 °C si les températures élevées sont un problème.
Le fonctionnement sur batterie ne limite pas les performances. Un test 3DMark 11 sur batterie donne des résultats similaires à ceux obtenus sur secteur.
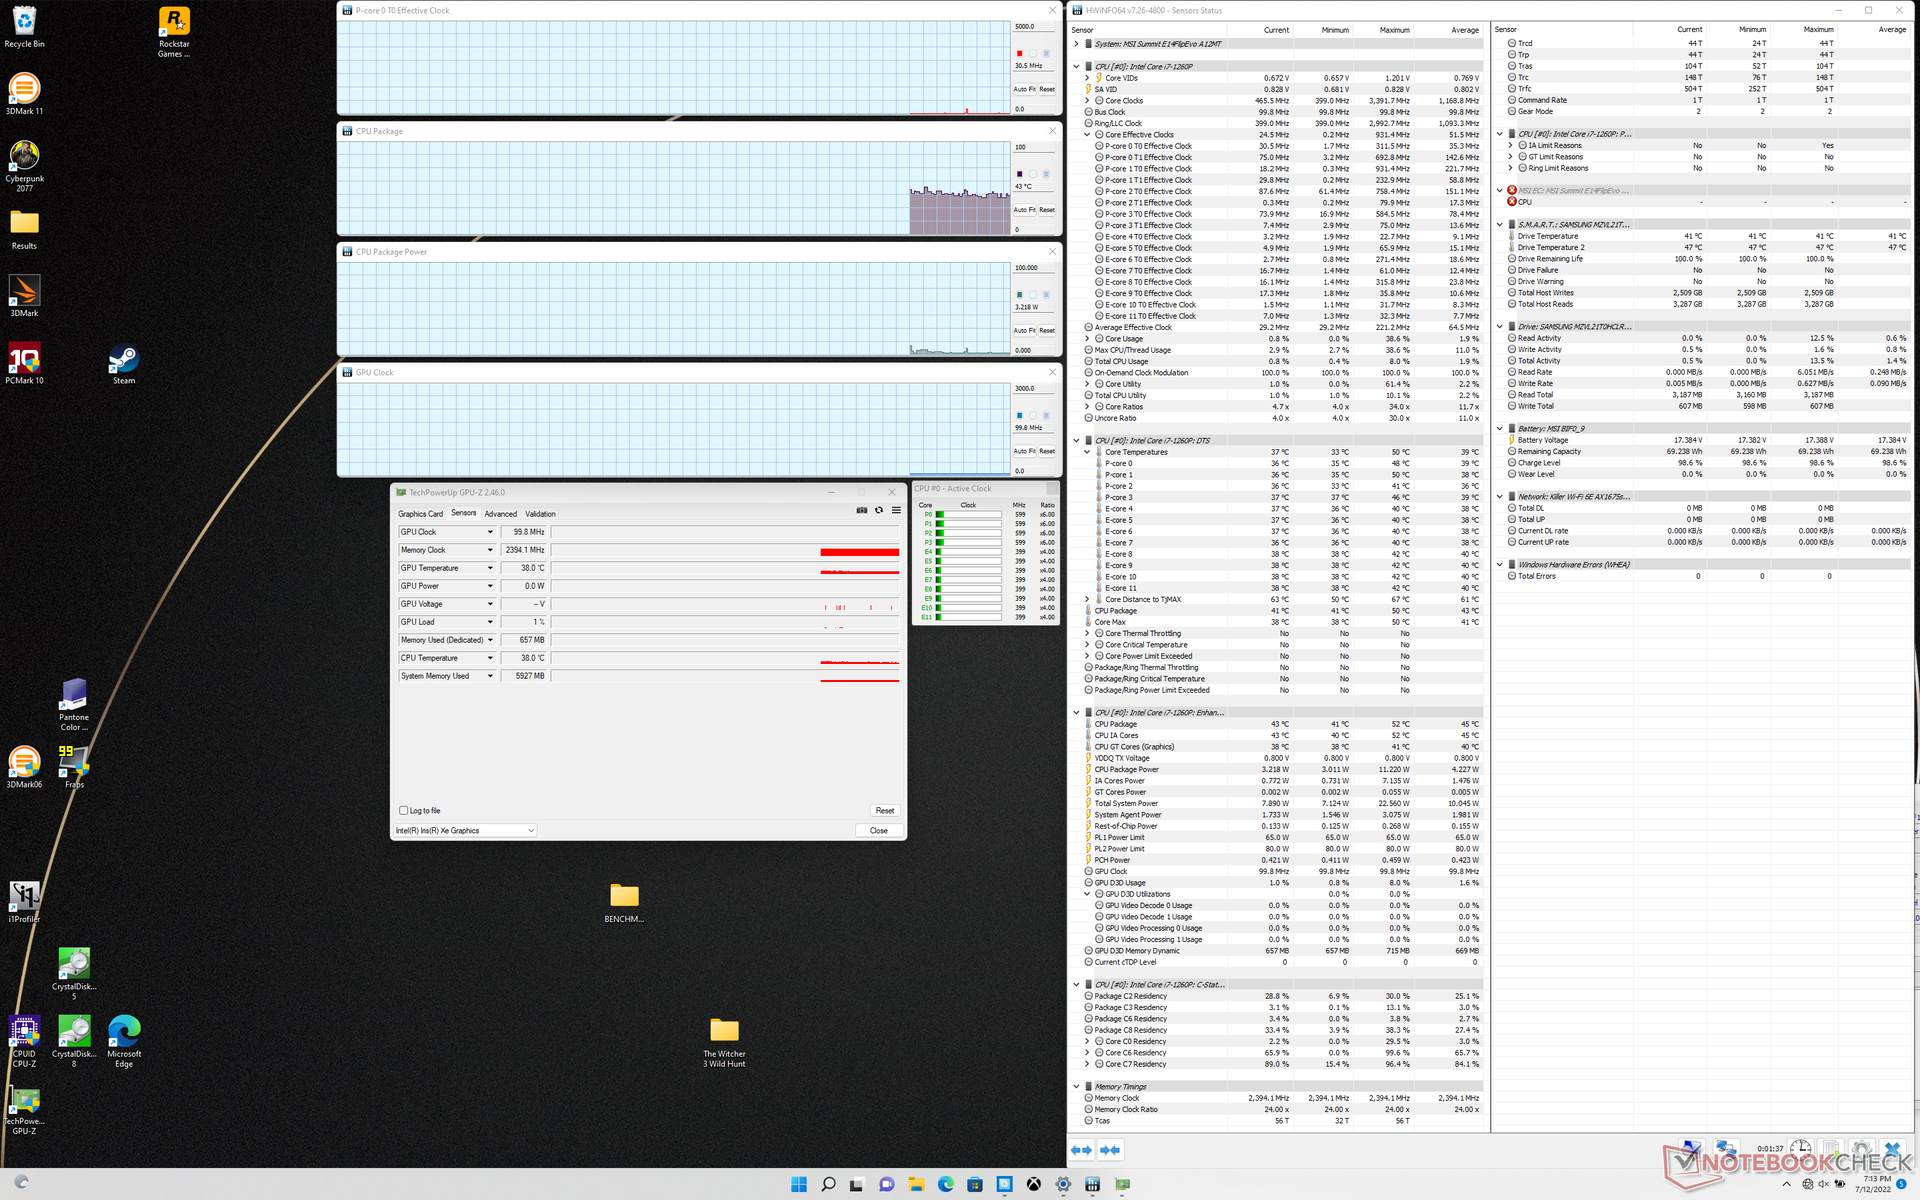
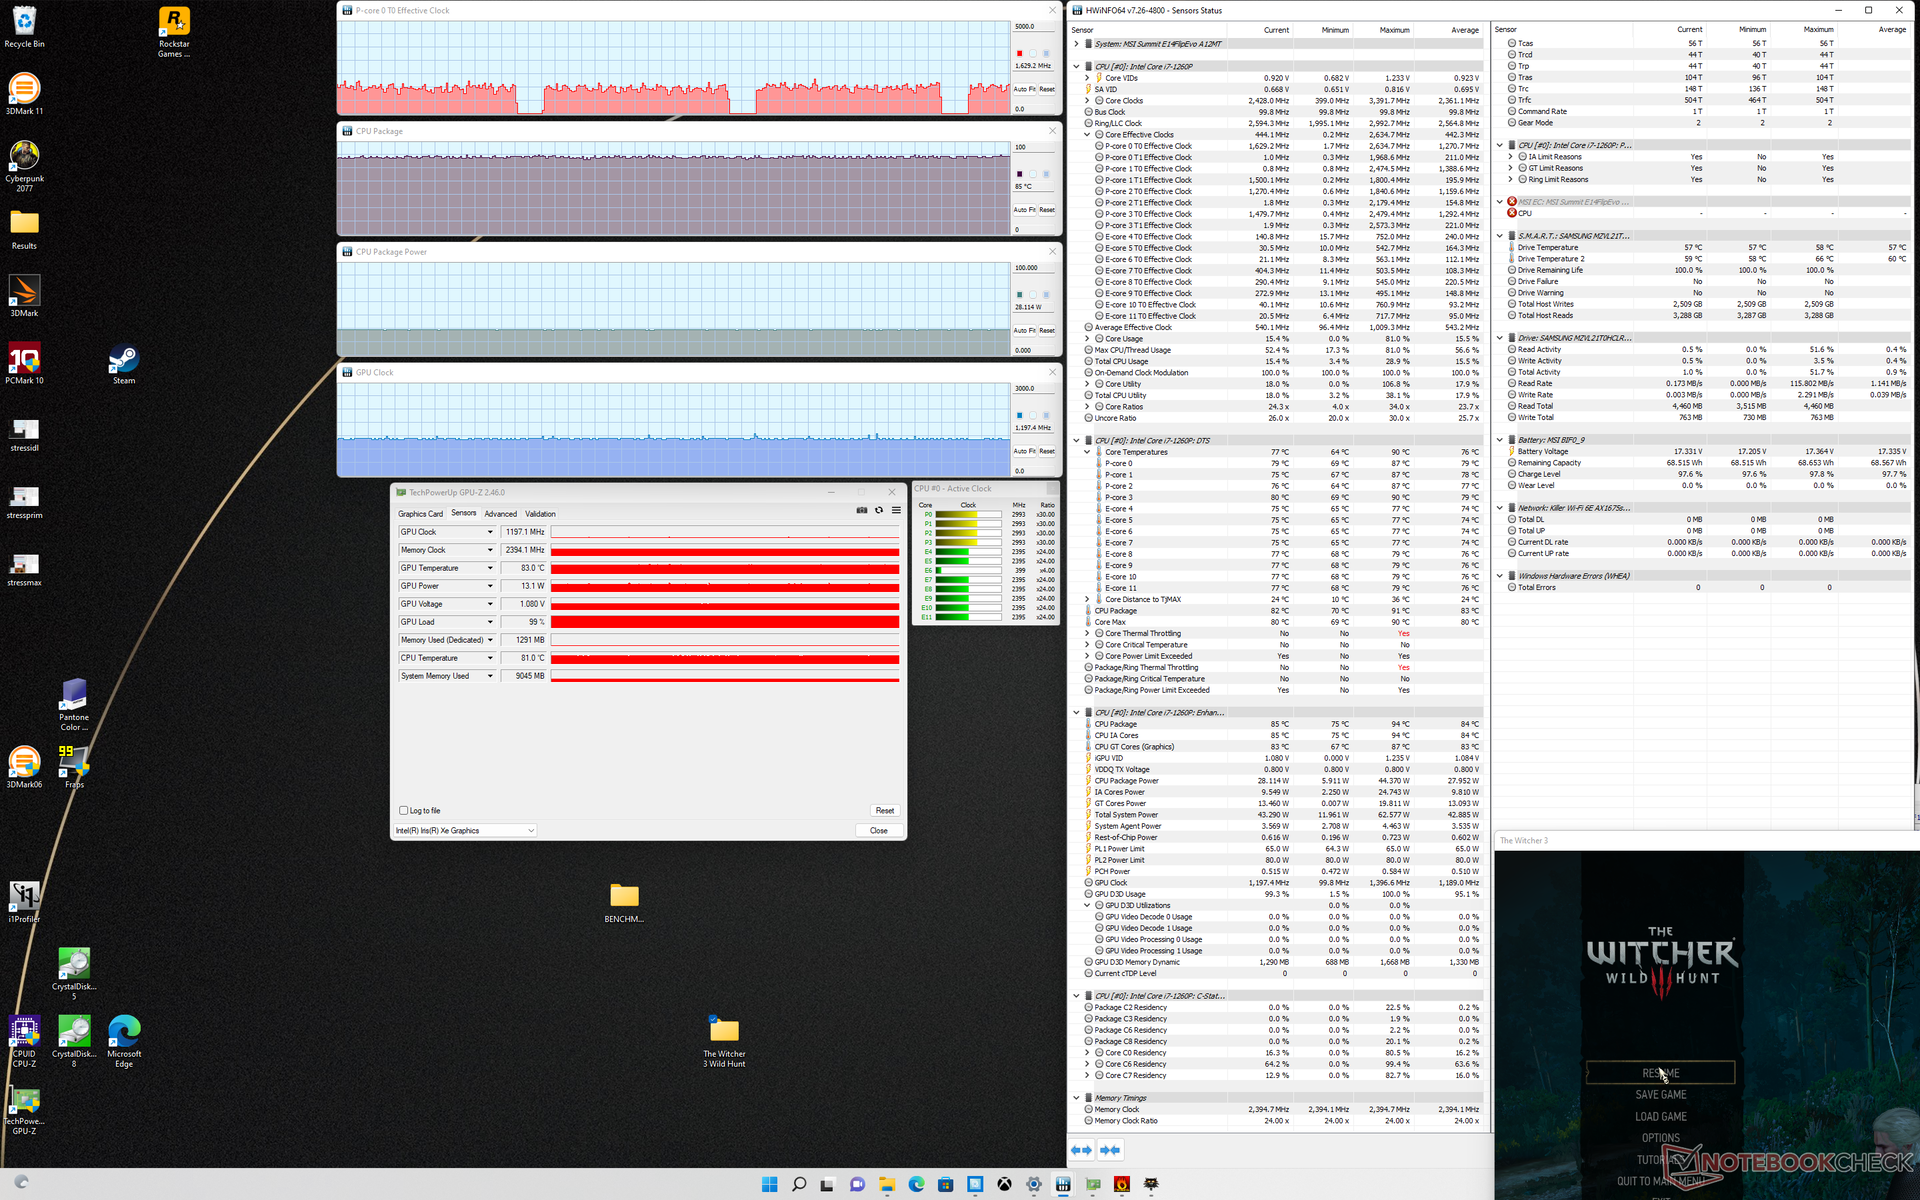
| Horloge du CPU (GHz) | Horloge GPU (MHz) | Température moyenne du CPU (°C) | |
| Système au repos | -- | -- | 43 |
| Prime95 Stress | 1.9 - 2.0 | -- | 82 |
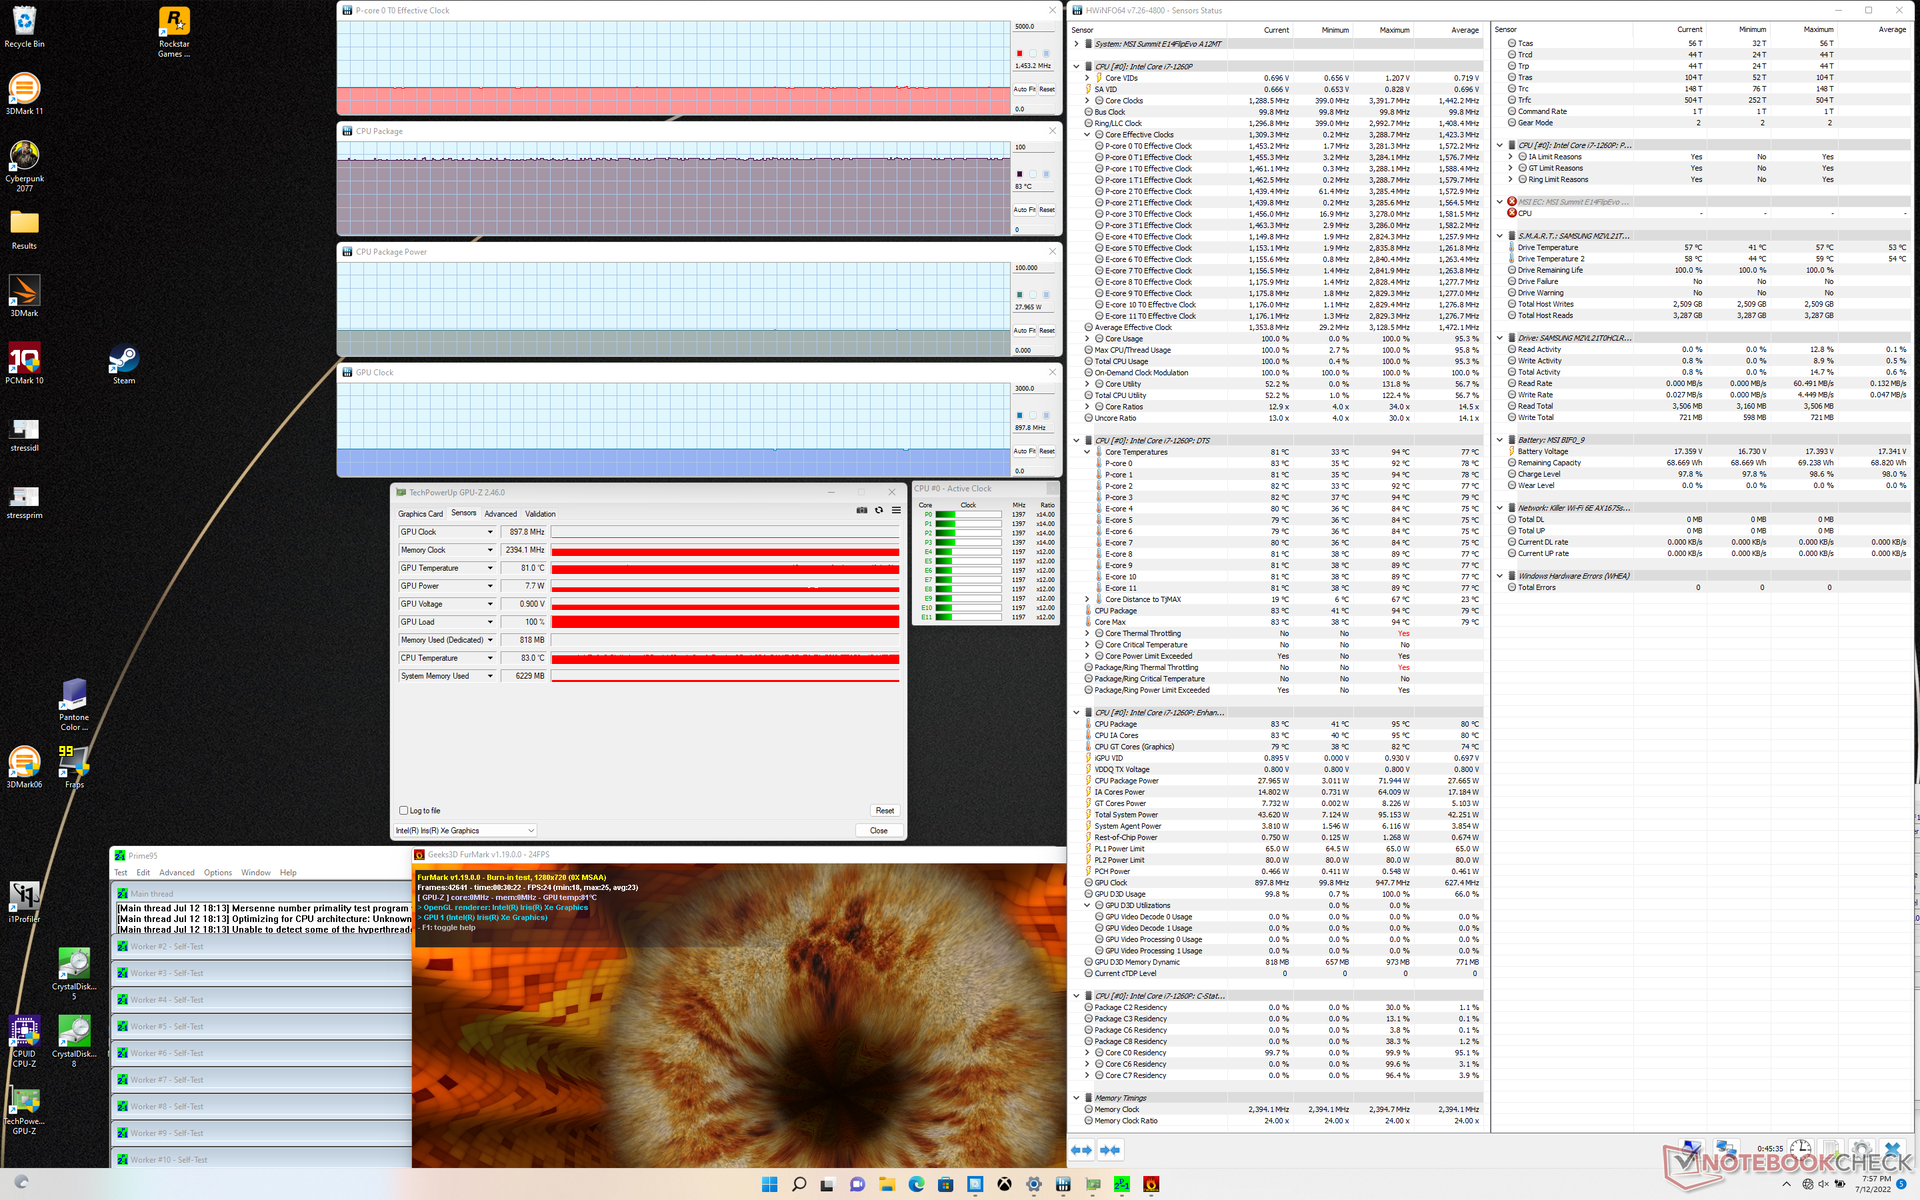
| Prime95 + FurMark Stress | 1.5 | 898 | 83 |
| Witcher 3 Stress | ~1.6 | 1197 | 85 |
Haut-parleurs
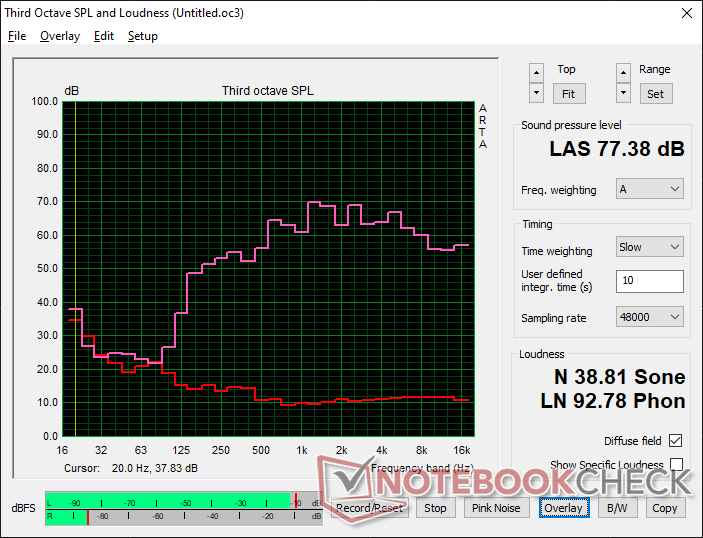
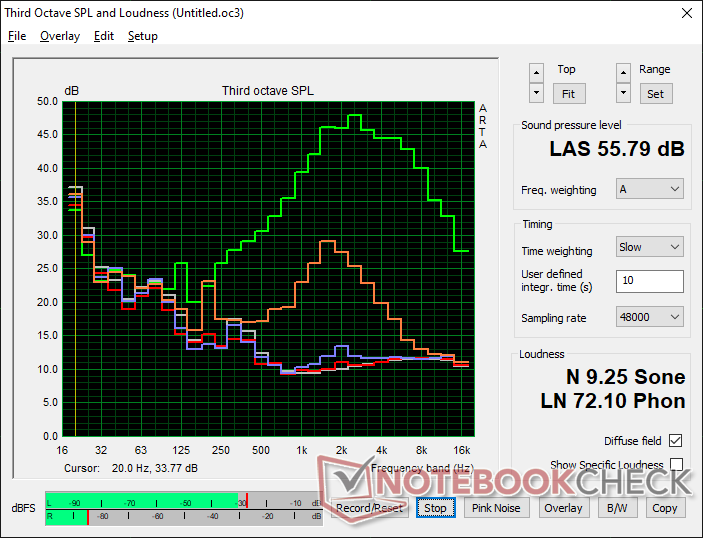
MSI Summit E14 Flip Evo A12MT analyse audio
(±) | le niveau sonore du haut-parleur est moyen mais bon (77.4# dB)
Basses 100 - 315 Hz
(±) | basse réduite - en moyenne 14.7% inférieure à la médiane
(±) | la linéarité des basses est moyenne (11.4% delta à la fréquence précédente)
Médiums 400 - 2000 Hz
(±) | médiane supérieure - en moyenne 5.2% supérieure à la médiane
(±) | la linéarité des médiums est moyenne (8.7% delta à la fréquence précédente)
Aiguës 2 - 16 kHz
(+) | des sommets équilibrés - à seulement 4.3% de la médiane
(±) | la linéarité des aigus est moyenne (7.7% delta à la fréquence précédente)
Globalement 100 - 16 000 Hz
(±) | la linéarité du son global est moyenne (17% de différence avec la médiane)
Par rapport à la même classe
» 32% de tous les appareils testés de cette catégorie étaient meilleurs, 8% similaires, 61% pires
» Le meilleur avait un delta de 6%, la moyenne était de 20%, le pire était de 57%.
Par rapport à tous les appareils testés
» 31% de tous les appareils testés étaient meilleurs, 8% similaires, 61% pires
» Le meilleur avait un delta de 4%, la moyenne était de 23%, le pire était de 134%.
Apple MacBook Pro 16 2021 M1 Pro analyse audio
(+) | les haut-parleurs peuvent jouer relativement fort (84.7# dB)
Basses 100 - 315 Hz
(+) | bonne basse - seulement 3.8% loin de la médiane
(+) | les basses sont linéaires (5.2% delta à la fréquence précédente)
Médiums 400 - 2000 Hz
(+) | médiane équilibrée - seulement 1.3% de la médiane
(+) | les médiums sont linéaires (2.1% delta à la fréquence précédente)
Aiguës 2 - 16 kHz
(+) | des sommets équilibrés - à seulement 1.9% de la médiane
(+) | les aigus sont linéaires (2.7% delta à la fréquence précédente)
Globalement 100 - 16 000 Hz
(+) | le son global est linéaire (4.6% différence à la médiane)
Par rapport à la même classe
» 0% de tous les appareils testés de cette catégorie étaient meilleurs, 0% similaires, 100% pires
» Le meilleur avait un delta de 5%, la moyenne était de 17%, le pire était de 45%.
Par rapport à tous les appareils testés
» 0% de tous les appareils testés étaient meilleurs, 0% similaires, 100% pires
» Le meilleur avait un delta de 4%, la moyenne était de 23%, le pire était de 134%.
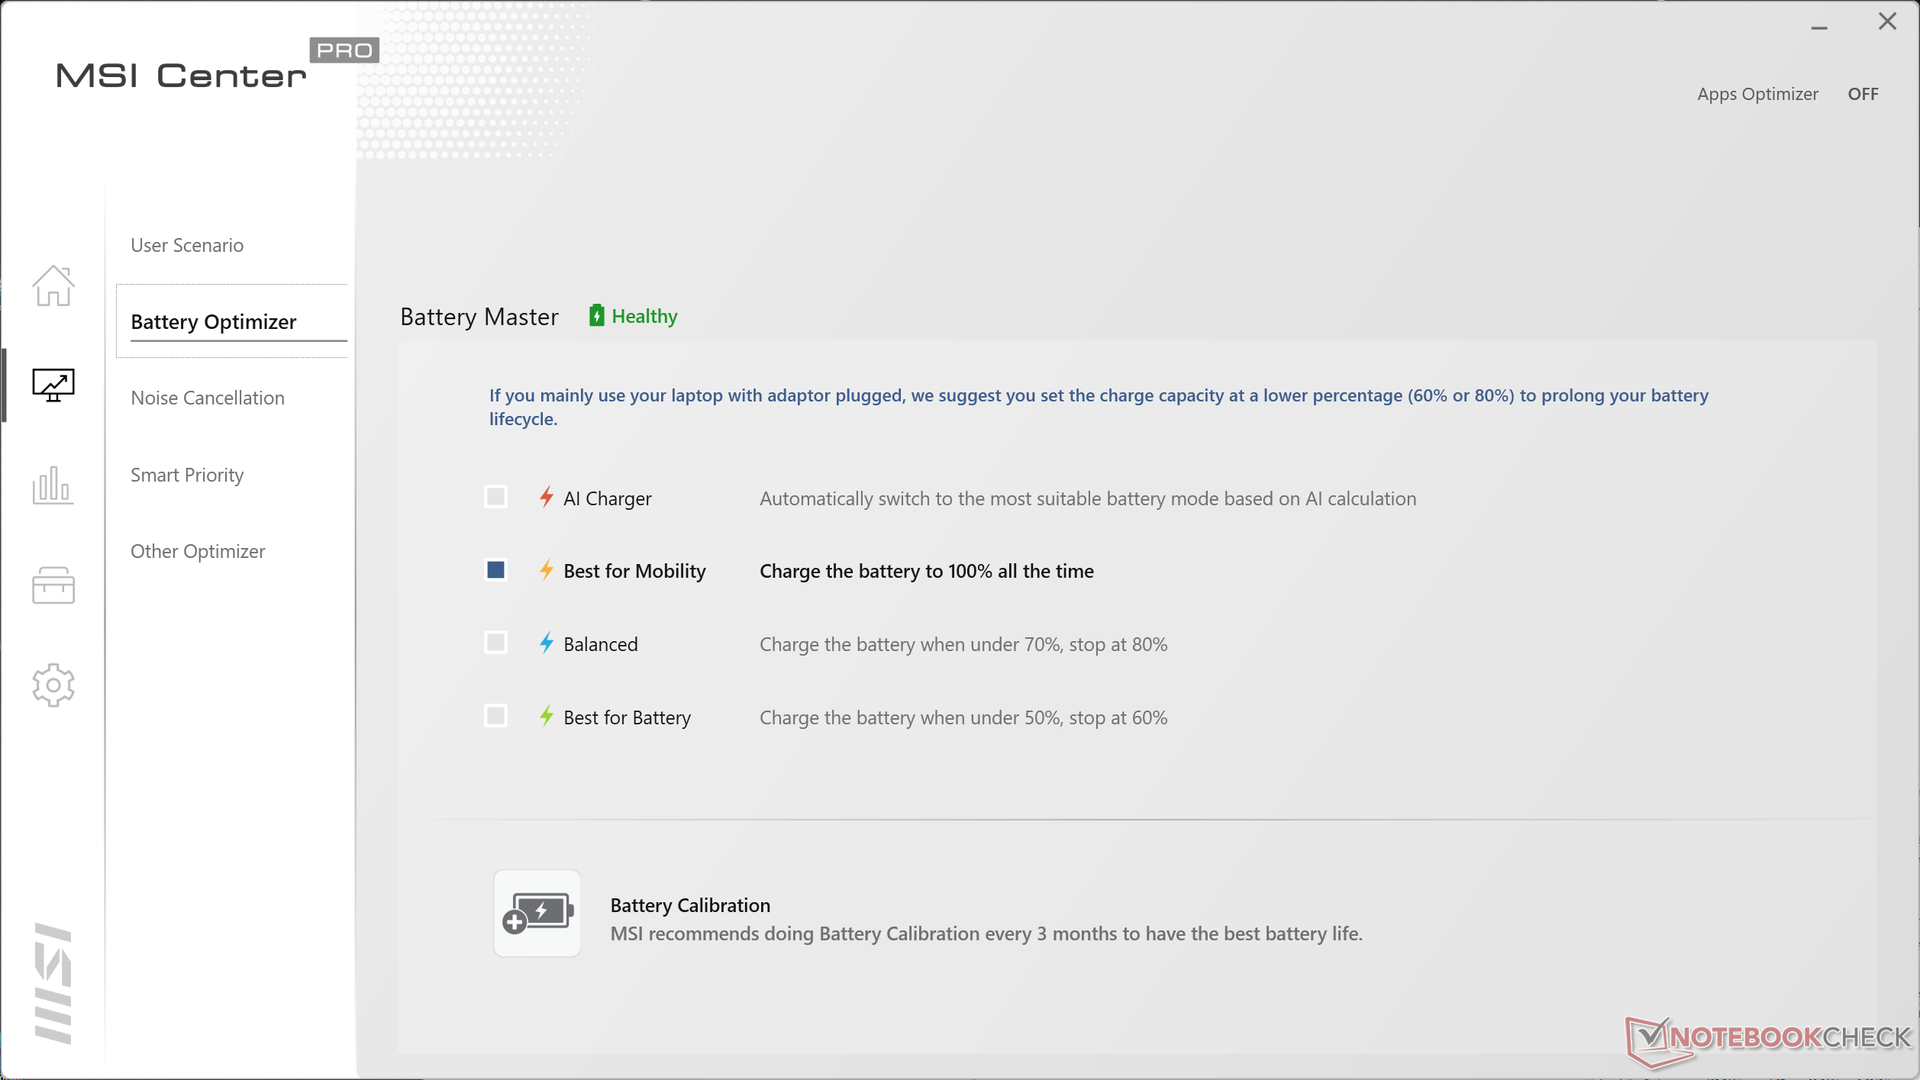
Gestion de l'énergie
Consommation d'énergie - Le Core-P est très exigeant
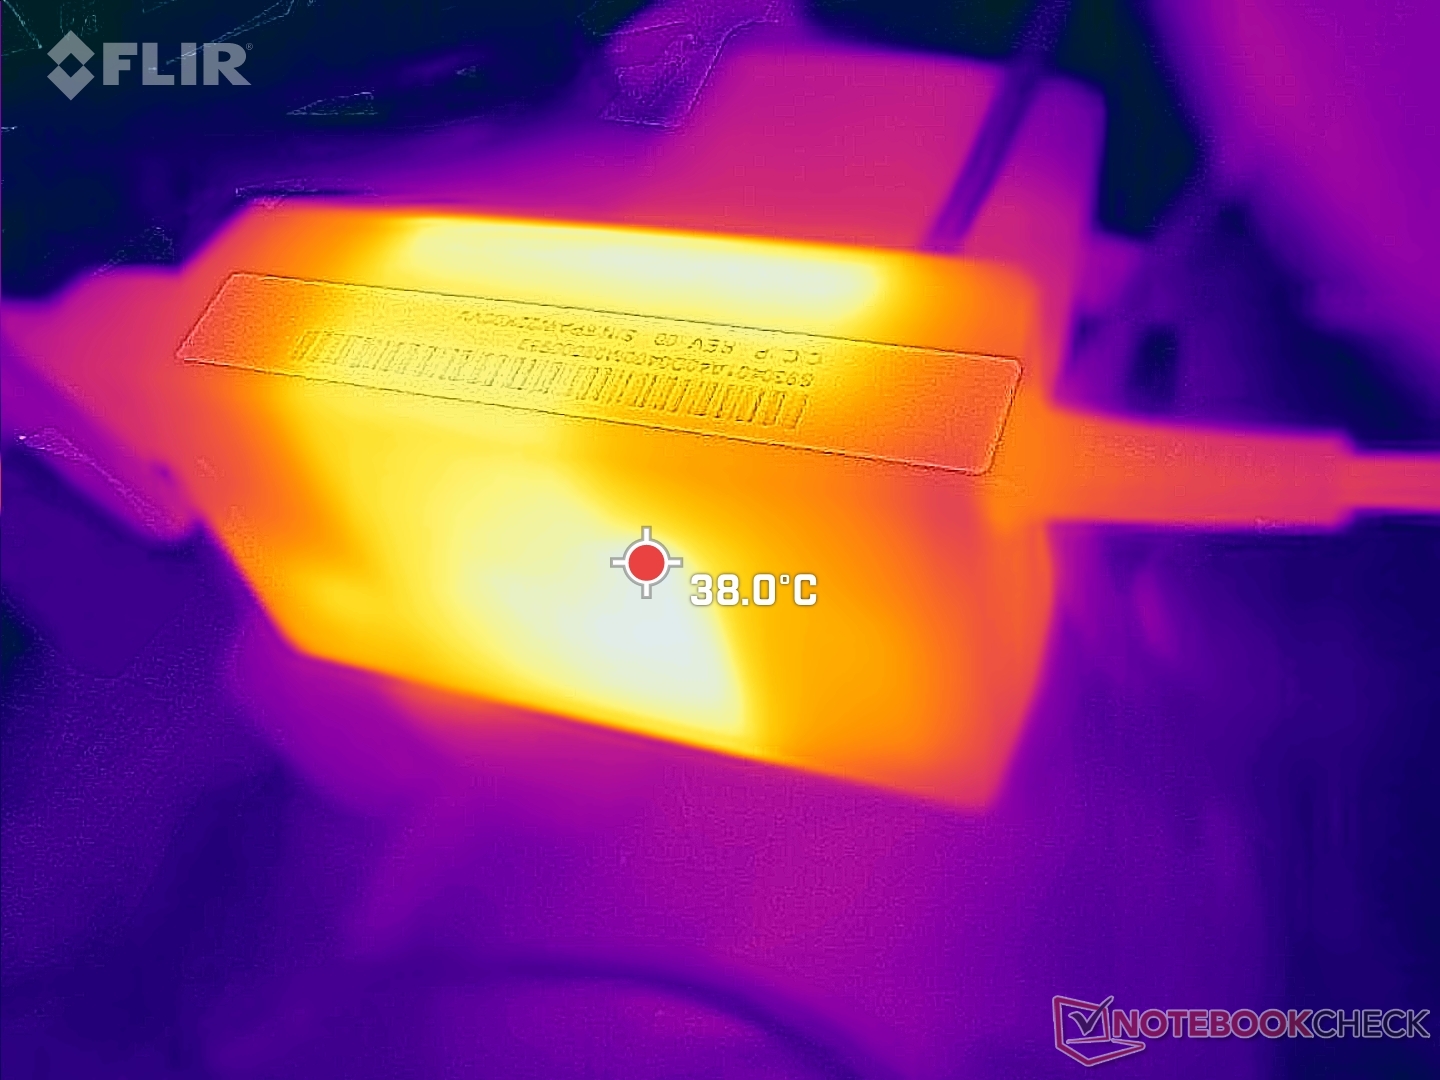
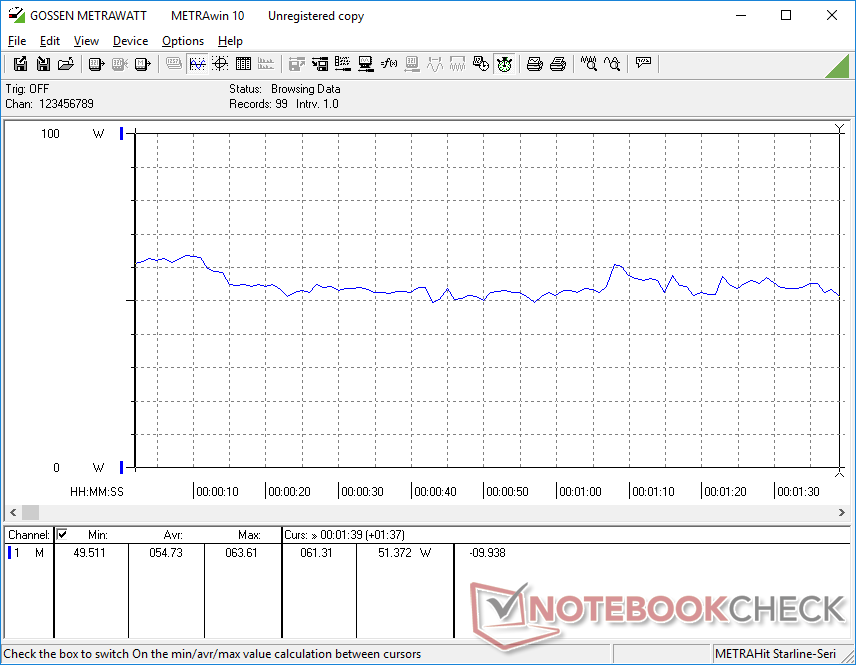
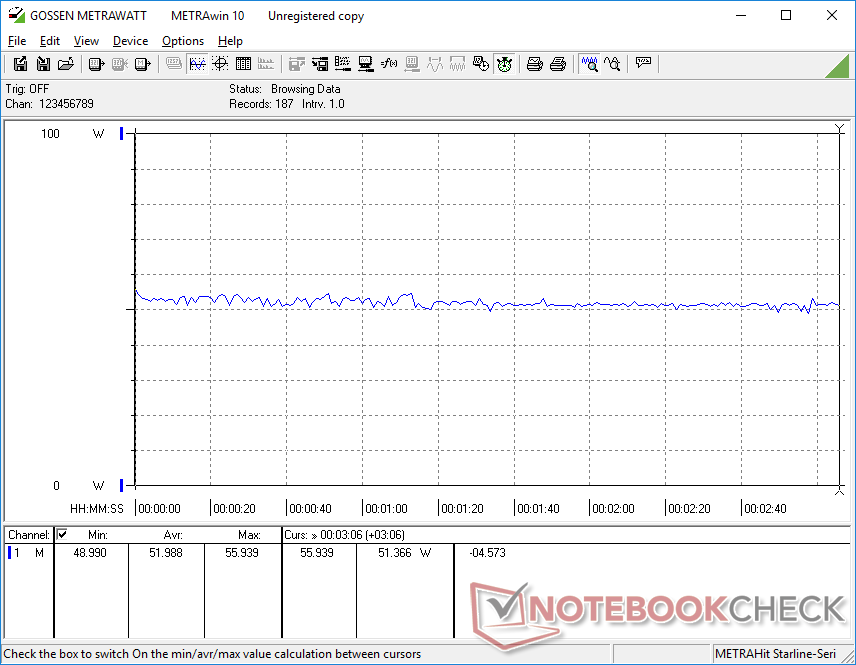
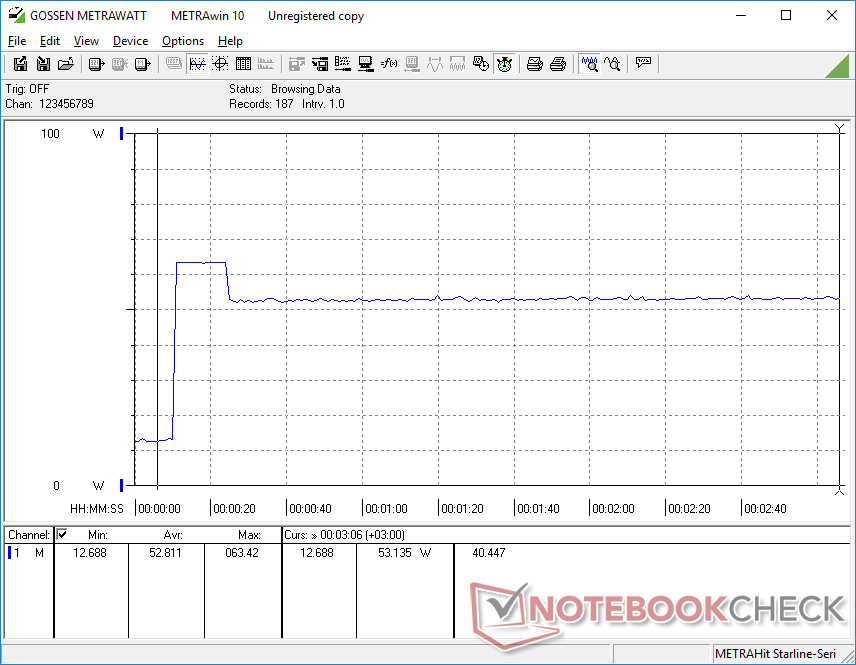
La consommation d'énergie est plus élevée que celle des systèmes équipés de processeurs Intel Core U-series de 11e génération, comme le LG Gram 14T90P ou le Dell Latitude 9420 2-en-1. L'exécution de Witcher 3 ou Prime95 sur notre MSI, par exemple, consommerait 37 % et 47 % d'énergie en plus, respectivement, par rapport au Dell susmentionné. En d'autres termes, les gains en termes de CPU et de GPU mentionnés ci-dessus par rapport aux CPU Intel de la génération précédente se font au prix d'une demande d'énergie sensiblement plus élevée.
Nous avons pu enregistrer une consommation maximale de 63,4 W sur le petit adaptateur secteur de 65 W (~8,8 x 4,9 x 3 cm). La consommation totale tend à se stabiliser à 53 W lorsque le CPU est pleinement sollicité, ce qui laisse une marge de 12 W seulement.

| Éteint/en veille | |
| Au repos | |
| Fortement sollicité |
|
Légende:
min: | |
| MSI Summit E14 Flip Evo A12MT i7-1260P, Iris Xe G7 96EUs, Samsung PM9A1 MZVL21T0HCLR, IPS, 2880x1800, 14" | MSI Summit E14 A11SCS i7-1185G7, GeForce GTX 1650 Ti Max-Q, Phison 1TB SM2801T24GKBB4S-E162, IPS, 3840x2160, 14" | Asus VivoBook S 14X S5402Z i7-12700H, Iris Xe G7 96EUs, Micron 2450 512GB MTFDKBA512TFK, OLED, 2880x1800, 14.5" | LG Gram 14T90P i5-1135G7, Iris Xe G7 80EUs, Samsung SSD PM981a MZVLB512HBJQ, IPS, 1900x1200, 14" | Lenovo Yoga Slim 7i Pro 14IAP G7 i5-1240P, Iris Xe G7 80EUs, Samsung PM9A1 MZVL2512HCJQ, IPS, 2880x1800, 14" | Dell Latitude 9420 2-in-1 i7-1185G7, Iris Xe G7 96EUs, WDC PC SN530 SDBPNPZ-512G, IPS, 2560x1600, 14" | |
|---|---|---|---|---|---|---|
| Power Consumption | -64% | -5% | 31% | 9% | 11% | |
| Idle Minimum * (Watt) | 5.4 | 9.9 -83% | 5.1 6% | 2.8 48% | 5.6 -4% | 4.6 15% |
| Idle Average * (Watt) | 9.5 | 17.4 -83% | 7.7 19% | 5.5 42% | 9.3 2% | 7.8 18% |
| Idle Maximum * (Watt) | 12.4 | 22.5 -81% | 11 11% | 6.4 48% | 9.6 23% | 8.2 34% |
| Load Average * (Watt) | 54.7 | 85.6 -56% | 73.9 -35% | 45.4 17% | 49 10% | 47.9 12% |
| Witcher 3 ultra * (Watt) | 52 | 70.9 -36% | 42.7 18% | 34 35% | 38.2 27% | 38.8 25% |
| Load Maximum * (Watt) | 63.4 | 91.1 -44% | 93 -47% | 65.9 -4% | 65.2 -3% | 87.1 -37% |
* ... Moindre est la valeur, meilleures sont les performances
Power Consumption Witcher 3 / Stresstest
Power Consumption external Monitor
Autonomie de la batterie
La capacité de la batterie est similaire à celle des ordinateurs concurrents Asus VivoBook S 14X ou LG Gram 14T90P avec 70 Wh. Les utilisateurs peuvent s'attendre à un peu plus de 8 heures d'utilisation du réseau WLAN dans le monde réel avant de devoir le recharger.
Le chargement d'un ordinateur vide à sa pleine capacité avec l'adaptateur inclus prend un peu moins de 90 minutes, ce qui est comparable à la plupart des Ultrabooks. Des adaptateurs secteur USB-C tiers peuvent également être utilisés pour recharger le système.
| MSI Summit E14 Flip Evo A12MT i7-1260P, Iris Xe G7 96EUs, 72 Wh | MSI Summit E14 A11SCS i7-1185G7, GeForce GTX 1650 Ti Max-Q, 52 Wh | Asus VivoBook S 14X S5402Z i7-12700H, Iris Xe G7 96EUs, 70 Wh | LG Gram 14T90P i5-1135G7, Iris Xe G7 80EUs, 72 Wh | Lenovo Yoga Slim 7i Pro 14IAP G7 i5-1240P, Iris Xe G7 80EUs, 61 Wh | Dell Latitude 9420 2-in-1 i7-1185G7, Iris Xe G7 96EUs, 60 Wh | |
|---|---|---|---|---|---|---|
| Autonomie de la batterie | -54% | -27% | 35% | -21% | 33% | |
| Reader / Idle (h) | 22.1 | 6.6 -70% | 13.1 -41% | 28.7 30% | ||
| WiFi v1.3 (h) | 8.2 | 4.5 -45% | 7.1 -13% | 12.1 48% | 8.6 5% | 11.7 43% |
| Load (h) | 1.9 | 1 -47% | 2.3 21% | 1 -47% | 2.4 26% | |
| H.264 (h) | 10.7 |
Points positifs
Points négatifs
Verdict - Le meilleur sommet MSI à ce jour
Au lieu de prendre le 13 pouces Summit E13 Flip et de l'agrandir simplement pour le transformer en 14 pouces, le Summit E14 Flip est la refonte complète du châssis que nous attendions. Il perd certaines des finitions dorées de son petit frère, mais les gains en termes de rigidité et de qualité de construction en valent la peine, notamment d'un point de vue professionnel où la fiabilité est prioritaire. Il ne semble pas aussi solide que le HP Spectre mais il s'en rapproche.
Le Summit E14 Flip est destiné aux prosumers et aux étudiants qui souhaitent bénéficier de la polyvalence d'un ordinateur portable convertible sans avoir à sacrifier les performances.
Les performances sont excellentes et il n'y a pas d'étranglement majeur du CPU ou du GPU, contrairement à ce qui se passe sur certains ordinateurs HP EliteBook Dragonfly contrairement à certains modèles EliteBook Dragonfly. Pendant ce temps, l'écran est à la hauteur des écrans des autres subnotebooks de Dell, HP, ou Asus sur la plupart des fronts. Nous espérons voir à l'avenir des options OLED ou 90+ Hz qui semblent être la tendance actuelle.
L'absence d'options WAN signifie que certains utilisateurs auront toujours une raison d'opter pour des modèles des familles Lenovo ThinkPad, Dell Latitude ou HP Spectre. En outre, si les performances sont excellentes et le châssis est solide, ils entraînent respectivement des températures très élevées et un design plus grand. Choisir le Summit E14 Flip signifie sacrifier un peu de portabilité pour ce processeur rapide.
Prix et disponibilité
Amazon a plusieurs configurations en stock, allant du Core i5-1240P pour 1300 USD au Core i7-1260P pour 1700 USD.
MSI Summit E14 Flip Evo A12MT
- 07/15/2022 v7 (old)
Allen Ngo
Price comparison

