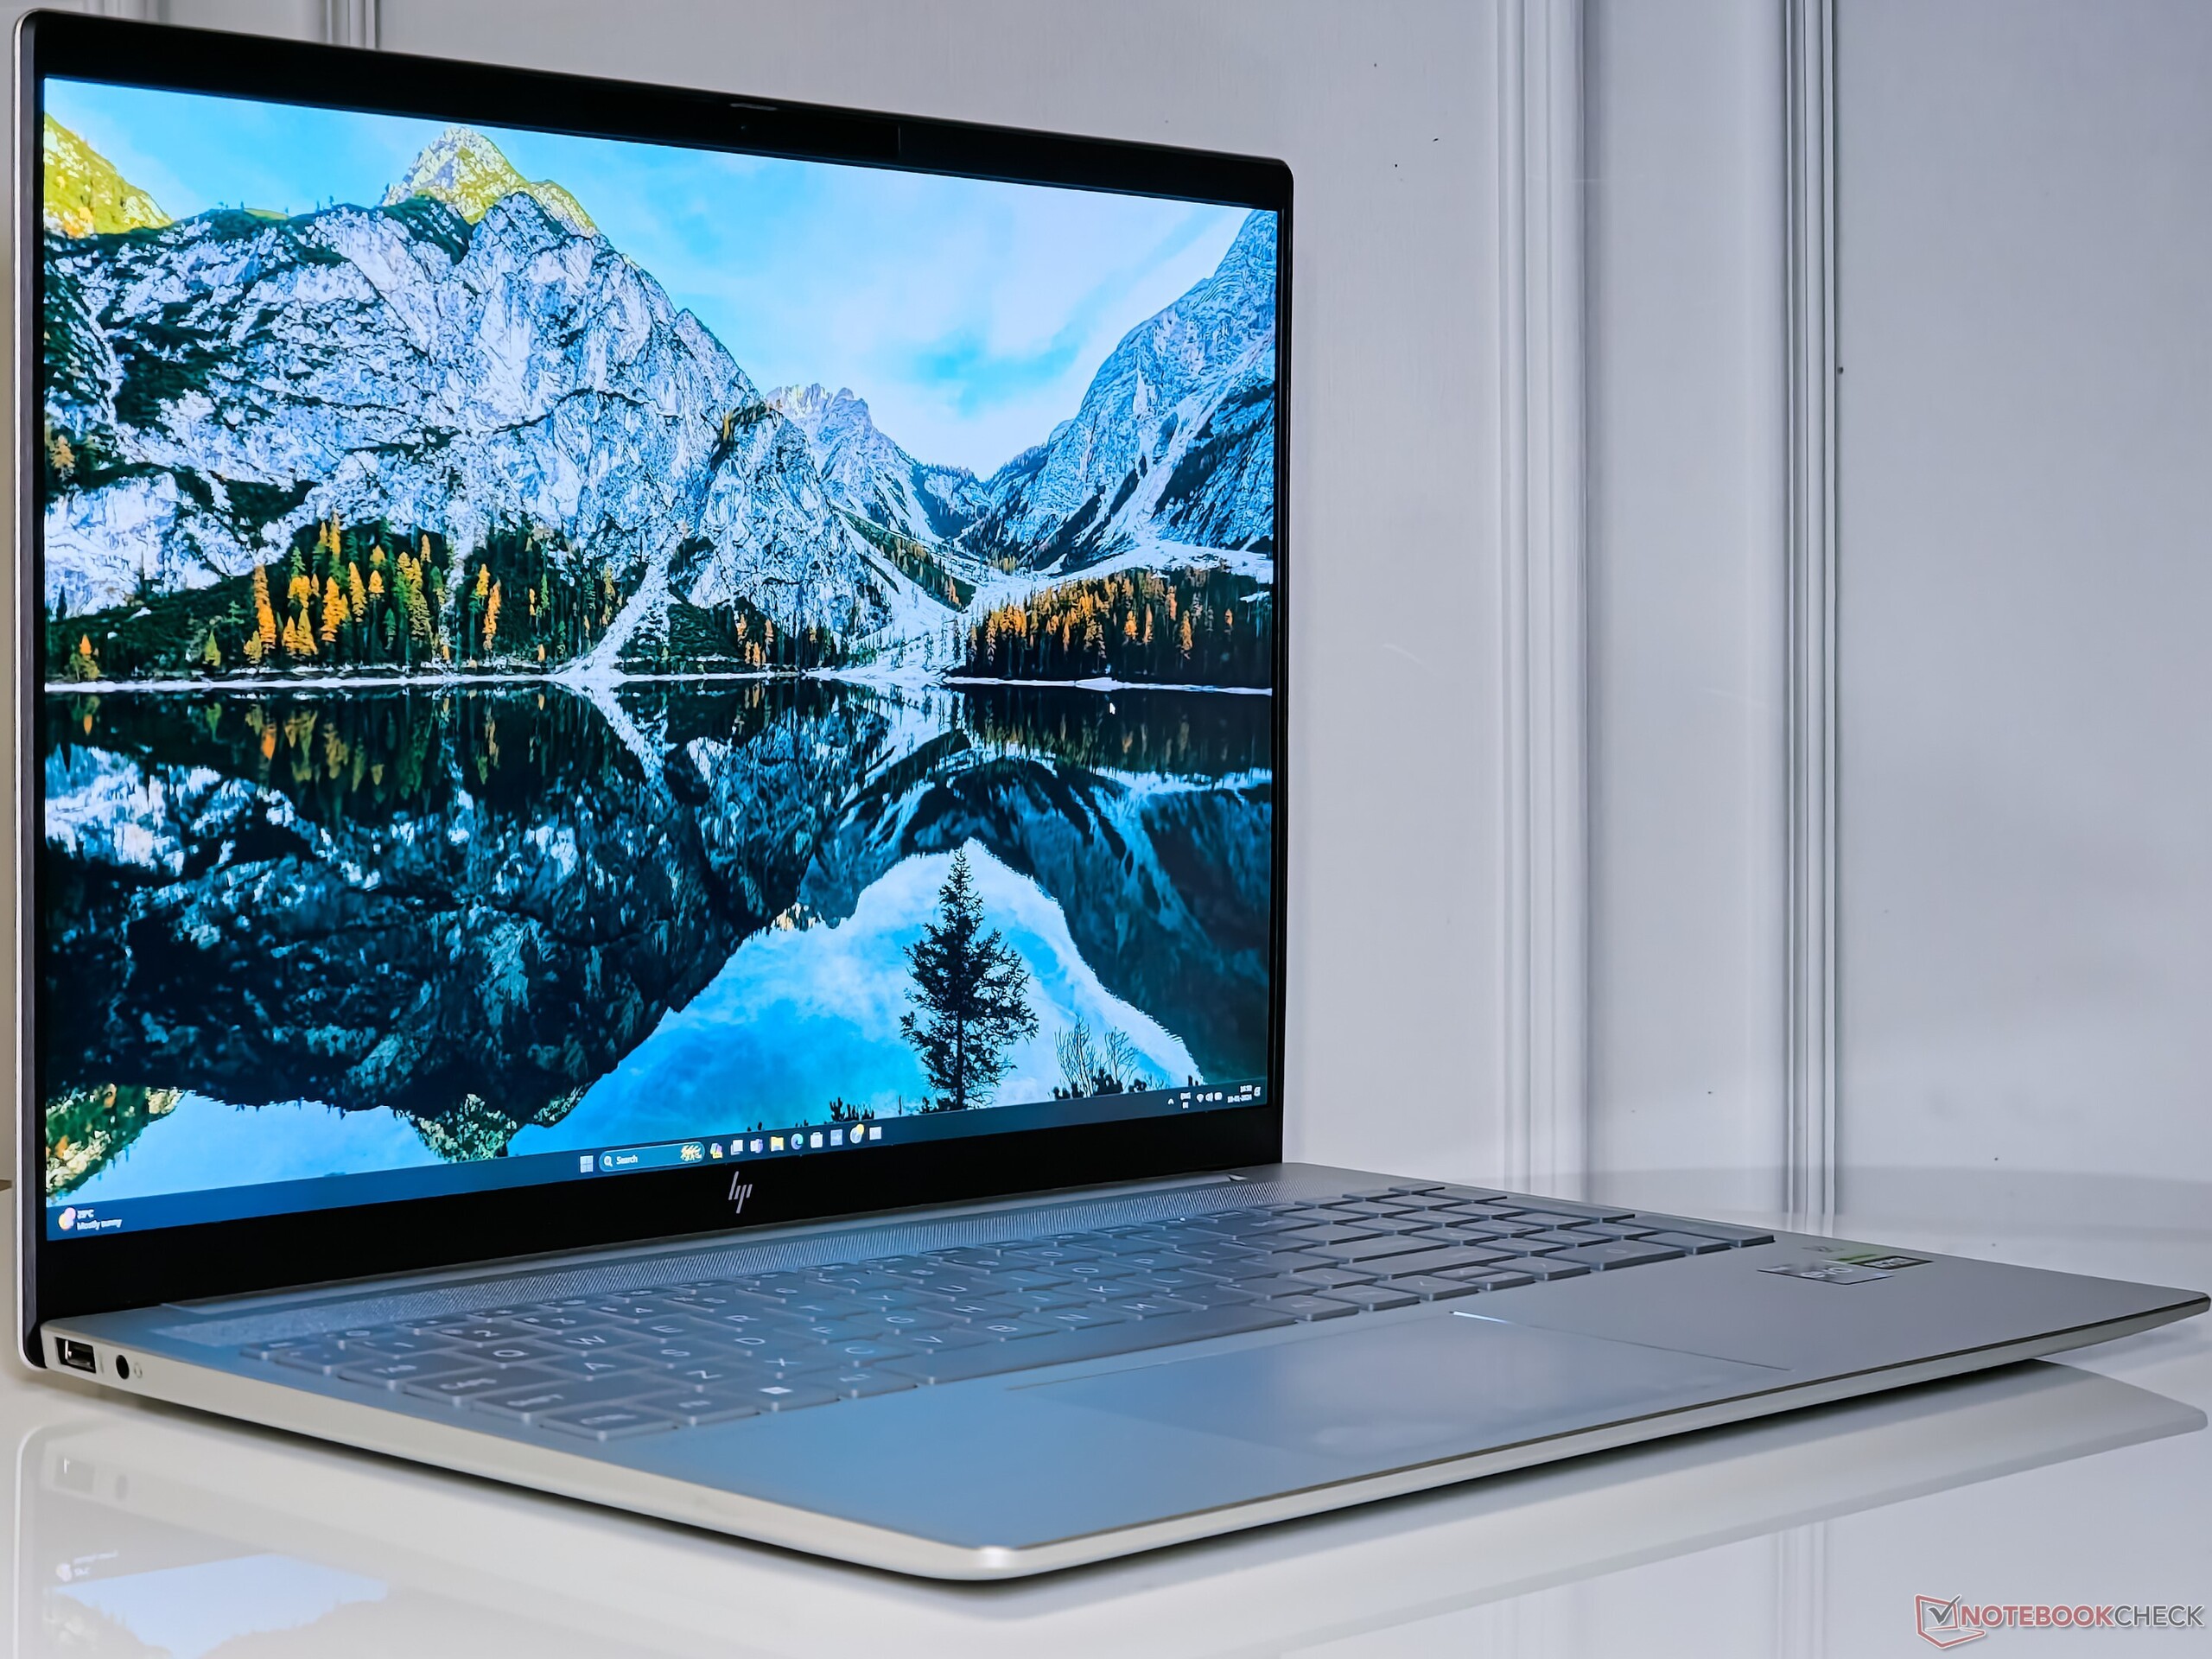
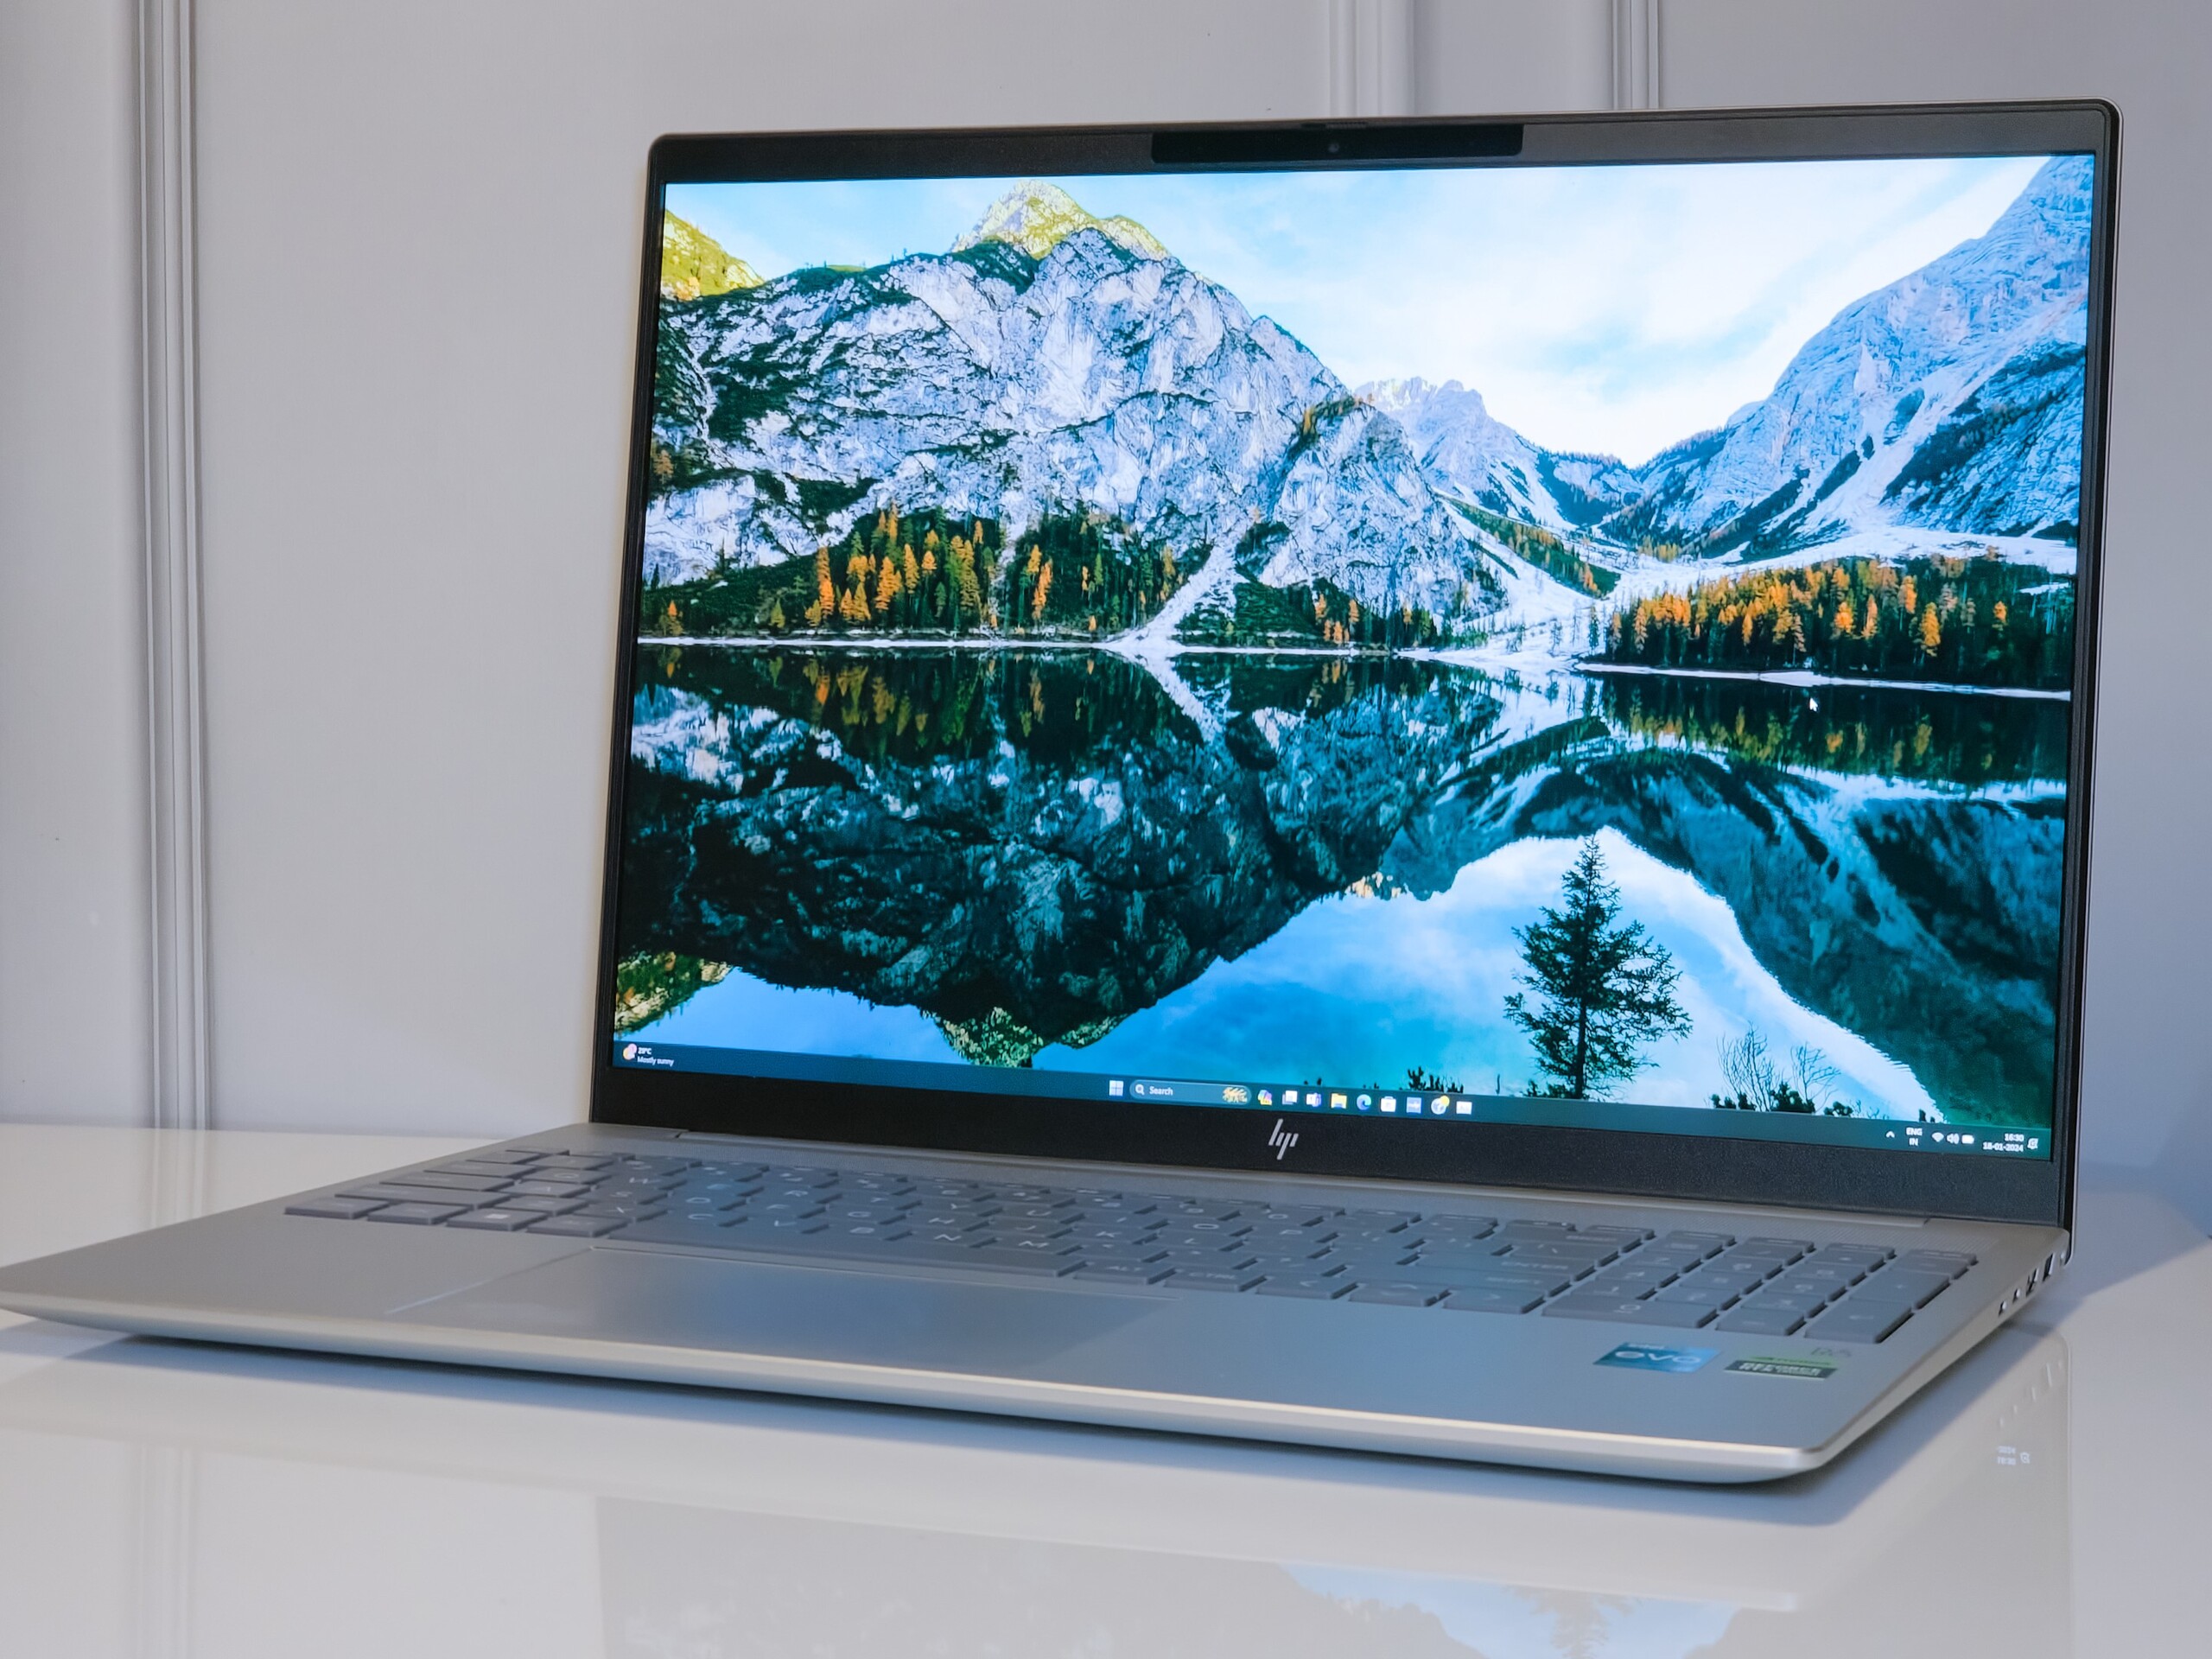
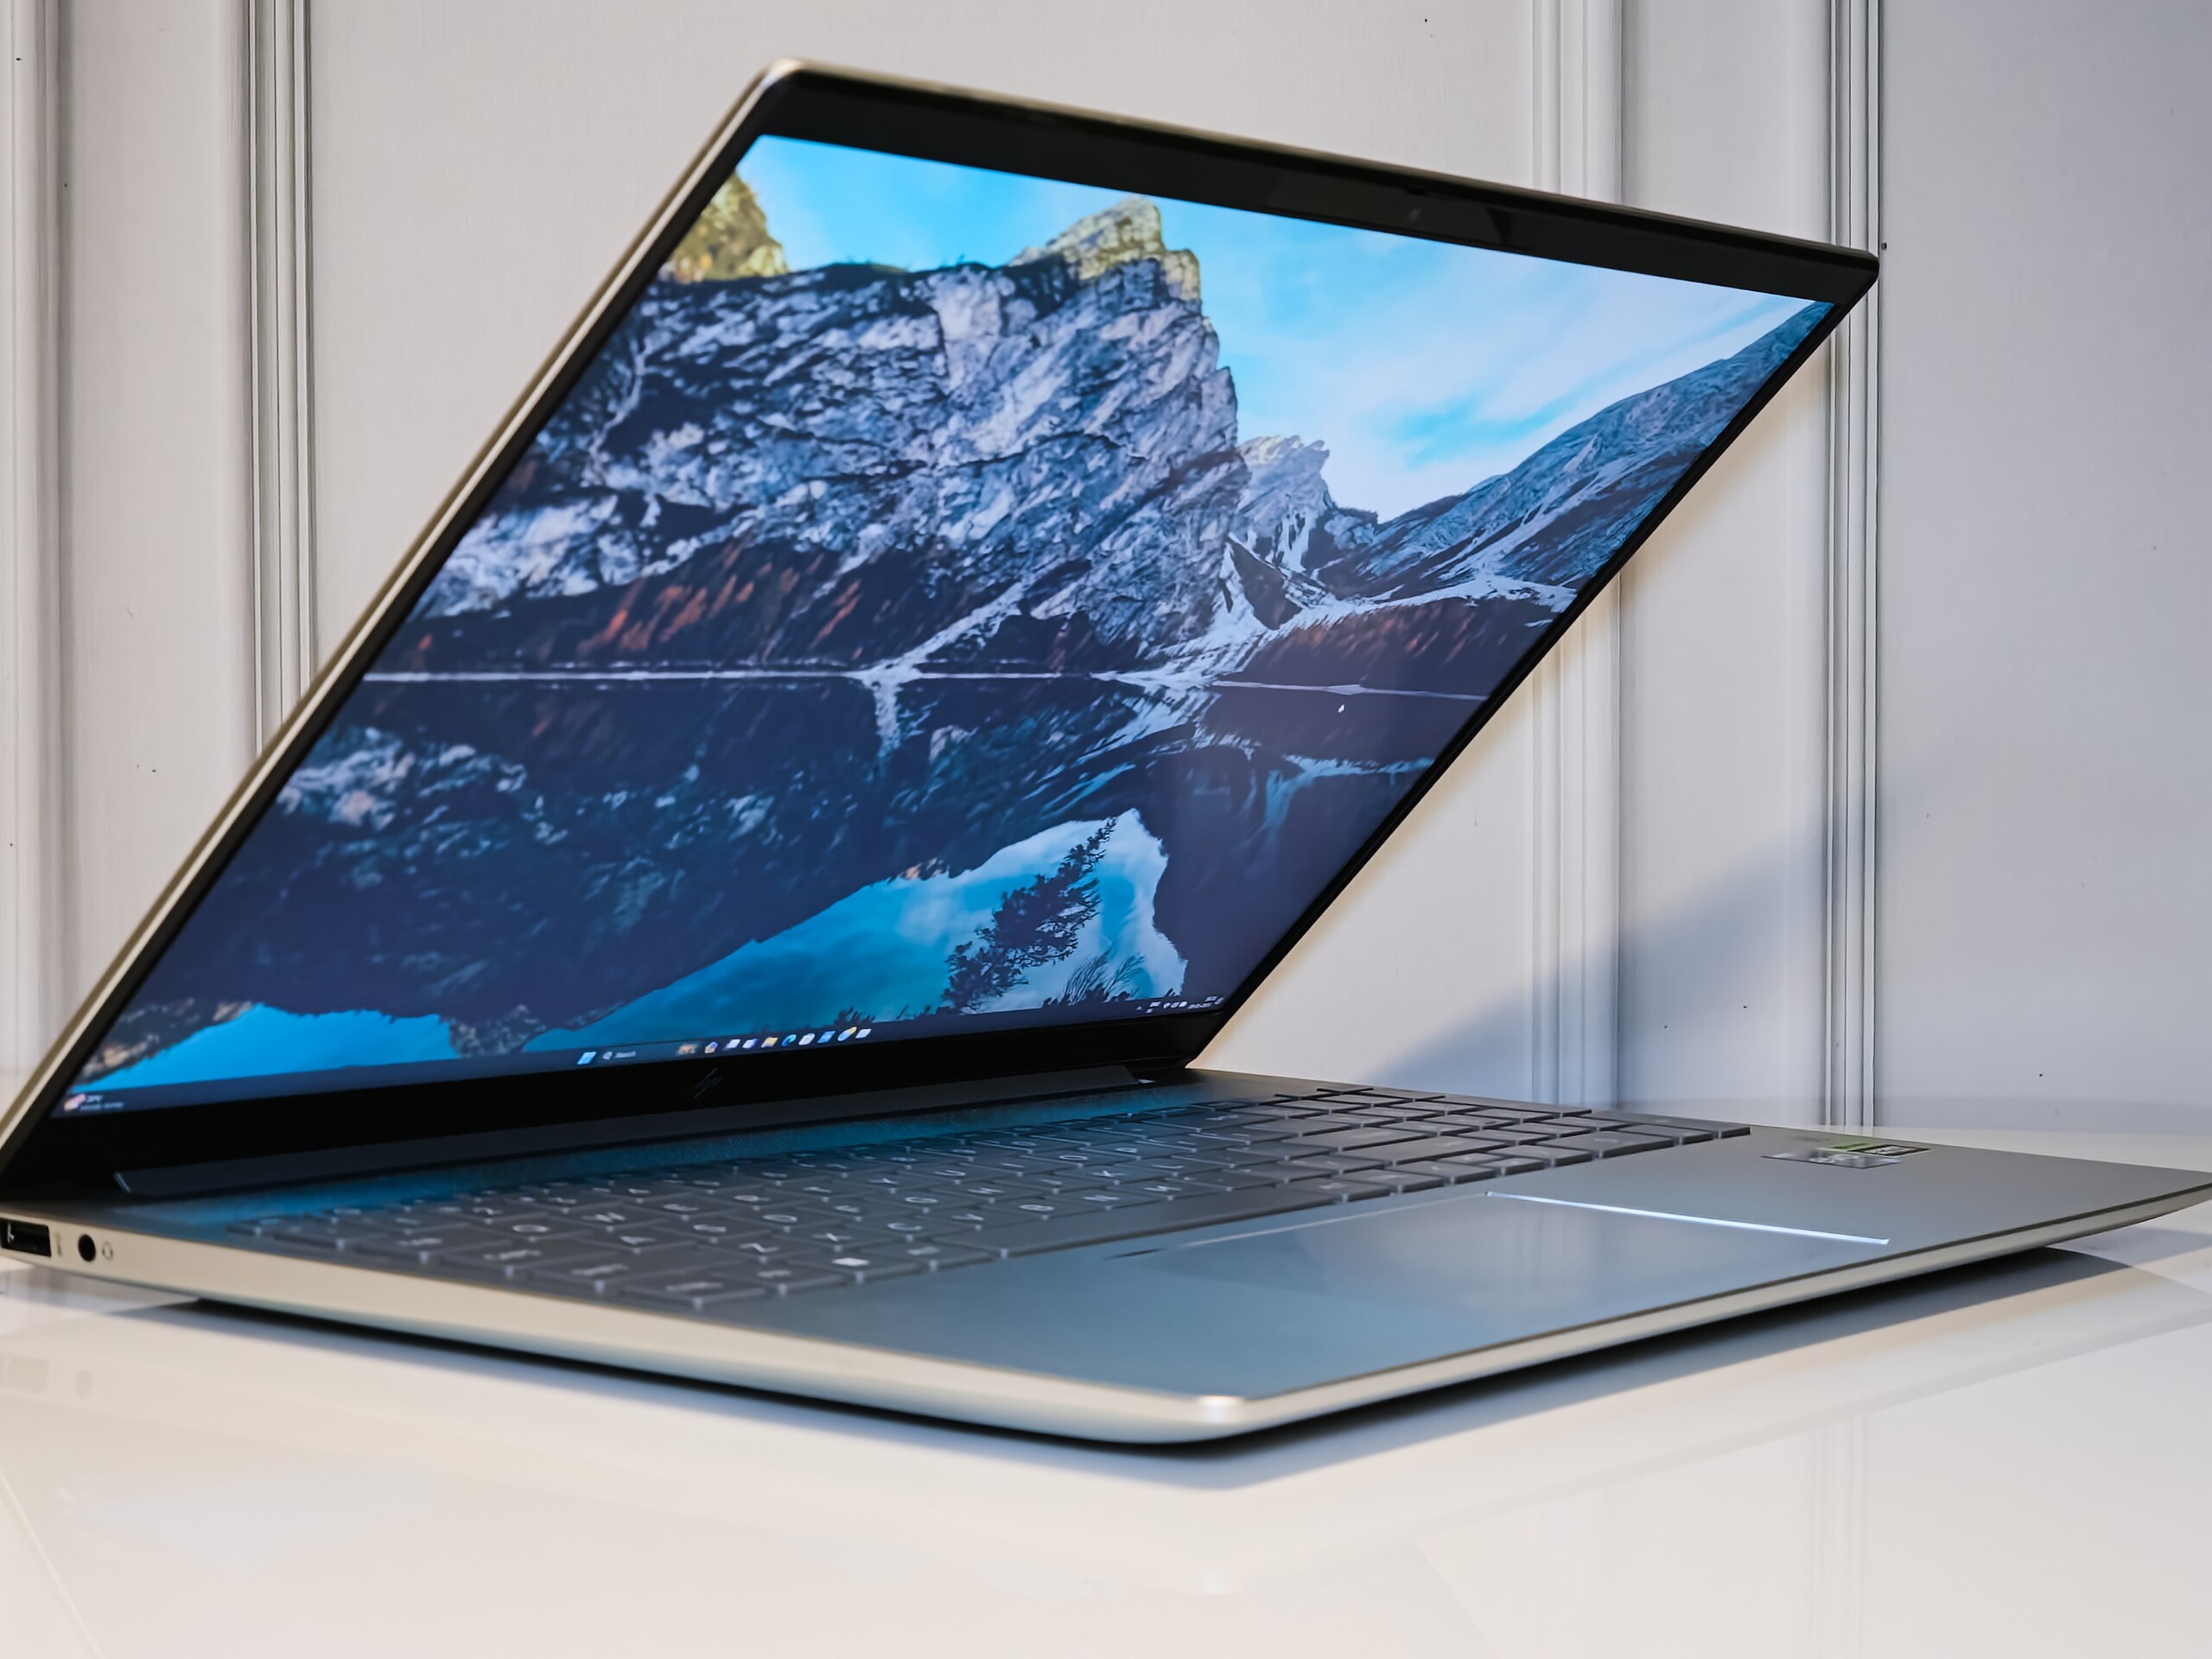
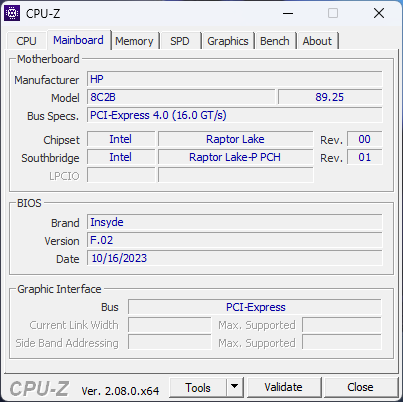
Test du HP Pavilion Plus 16 : multimédia haut de gamme qui aurait bénéficié d'une RTX 4050
 en revue")
HP a récemment introduit deux nouveaux modèles Pavilion Plus comme alternative plus abordable à la série Envy. Nous avons déjà examiné le Pavilion Plus 14 dans les deux versions suivantes Intel Raptor Lake et AMD Zen 4 d'AMD. Aujourd'hui, nous jetons un coup d'œil à la version plus grande Pavilion Plus 16.
Le Pavilion Plus 16 renonce à la dalle OLED "IMAX Enhanced" du Pavilion Plus 14 et propose à la place un processeur de série H et une carte graphique Nvidia en option.
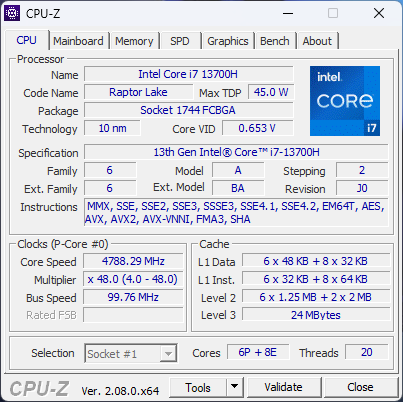
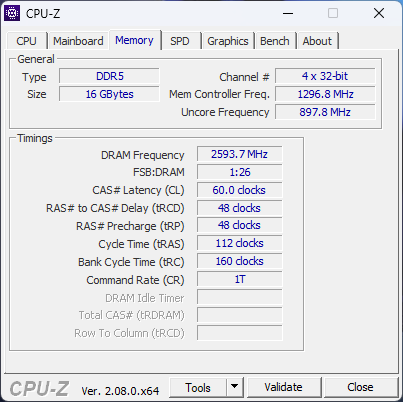
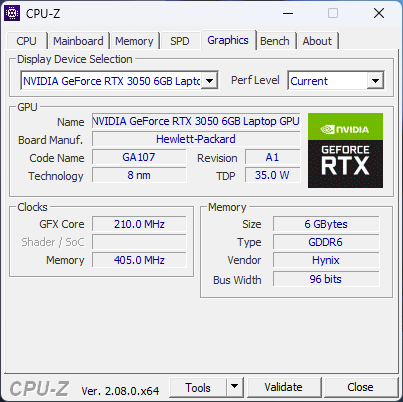
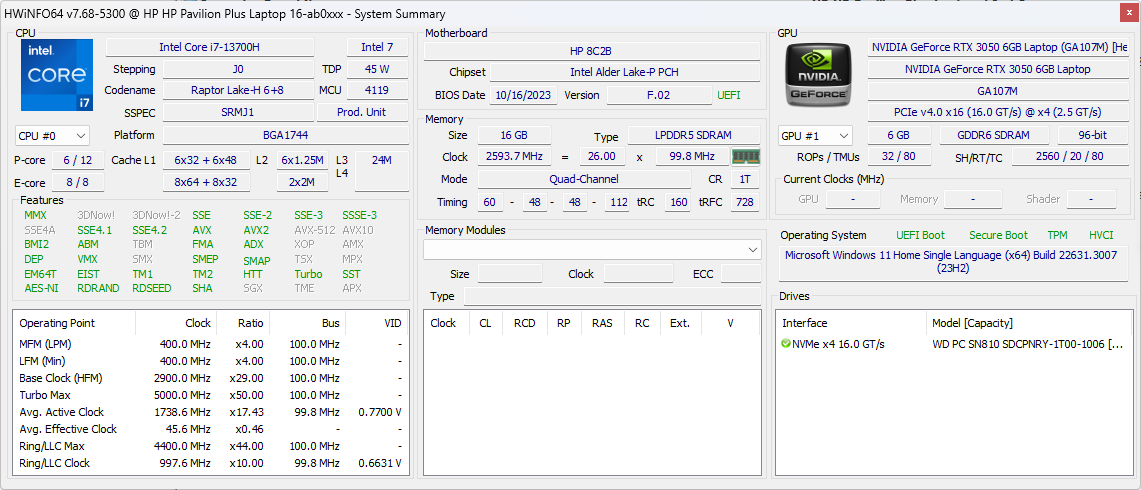
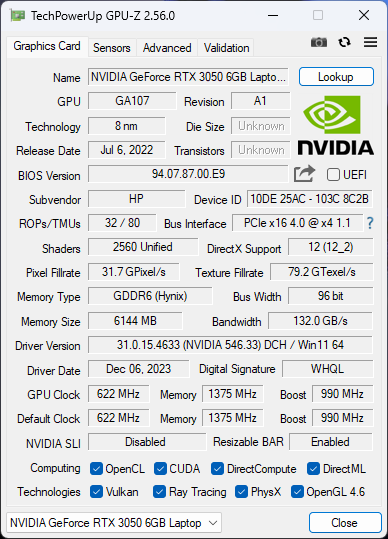
Notre Pavilion Plus 16 est équipé d'un processeur Intel Core i7-13700H avec 16 Go de RAM, 1 TB SSD, et un écran IPS de 16 pouces 2560 x 1600 120 Hz. Le Pavilion Plus 16 fait partie de la poignée d'ordinateurs portables dotés de la technologie Nvidia RTX Nvidia GeForce RTX 3050 6 Go GPU pour ordinateur portable. Cette configuration vous coûtera 1 24 999 ₹ (1 350 $ US) sur la boutique officielle de HP en Inde.
Comparaison avec les concurrents potentiels
Note | Date | Modèle | Poids | Épaisseur | Taille | Résolution | Prix |
|---|---|---|---|---|---|---|---|
| 88.7 % v7 (old) | 02/24 | HP Pavilion Plus 16-ab0456tx i7-13700H, GeForce RTX 3050 6GB Laptop GPU | 1.9 kg | 19.9 mm | 16.00" | 2560x1600 | |
| 88.2 % v7 (old) | 01/24 | Schenker Vision 14 M23 RTX 3050 i7-13700H, GeForce RTX 3050 6GB Laptop GPU | 1.3 kg | 16.6 mm | 14.00" | 2880x1800 | |
| 87.1 % v7 (old) | 08/23 | Dell Inspiron 16 Plus 7630 i7-13700H, GeForce RTX 4060 Laptop GPU | 2.2 kg | 19.95 mm | 16.00" | 2560x1600 | |
| 85.6 % v7 (old) | 08/23 | Asus VivoBook 14X K3405 i5-13500H, GeForce RTX 3050 4GB Laptop GPU | 1.4 kg | 18.9 mm | 14.00" | 2880x1800 | |
| 89.2 % v7 (old) | 04/23 | Lenovo Slim Pro 7 14ARP8 R7 7735HS, GeForce RTX 3050 6GB Laptop GPU | 1.6 kg | 15.6 mm | 14.50" | 2560x1600 | |
| 87.6 % v7 (old) | 11/23 | Asus VivoBook Pro 16 K6602VU i9-13900H, GeForce RTX 4050 Laptop GPU | 1.9 kg | 19 mm | 16.00" | 3200x2000 | |
| 89.4 % v7 (old) | 04/23 | Samsung Galaxy Book3 Ultra 16 i7-13700H, GeForce RTX 4050 Laptop GPU | 1.8 kg | 16.5 mm | 16.00" | 2880x1800 |
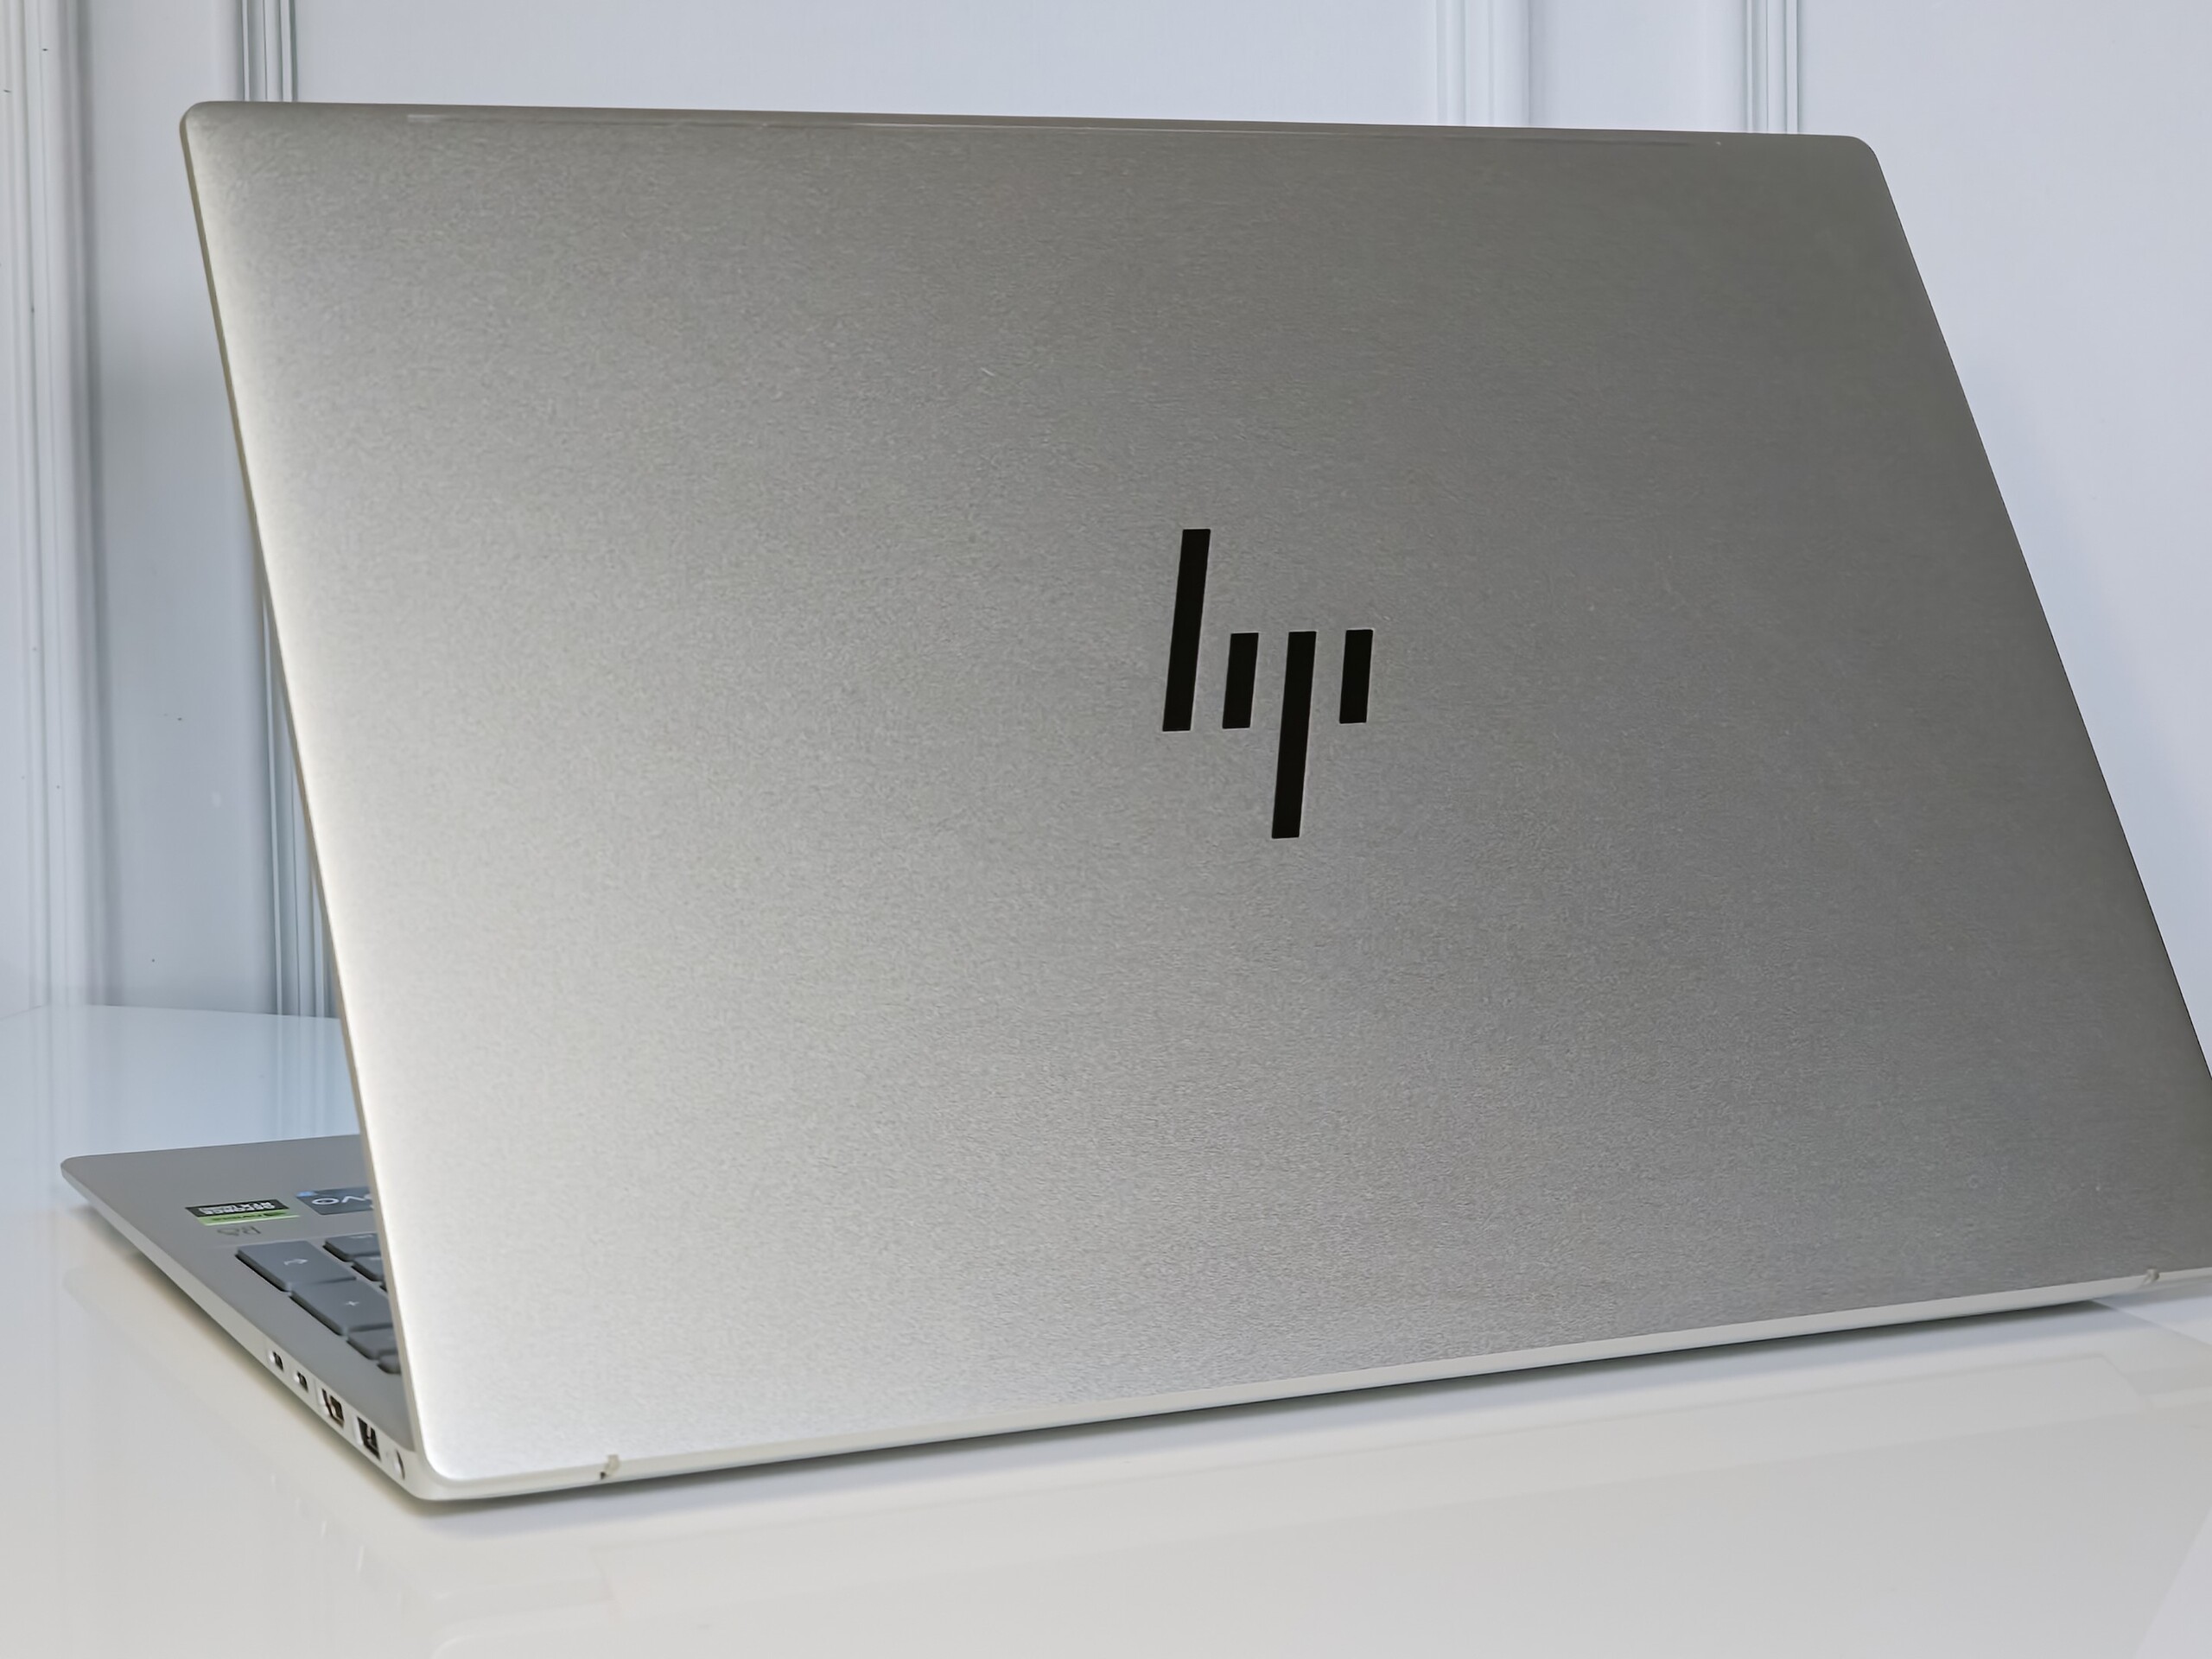
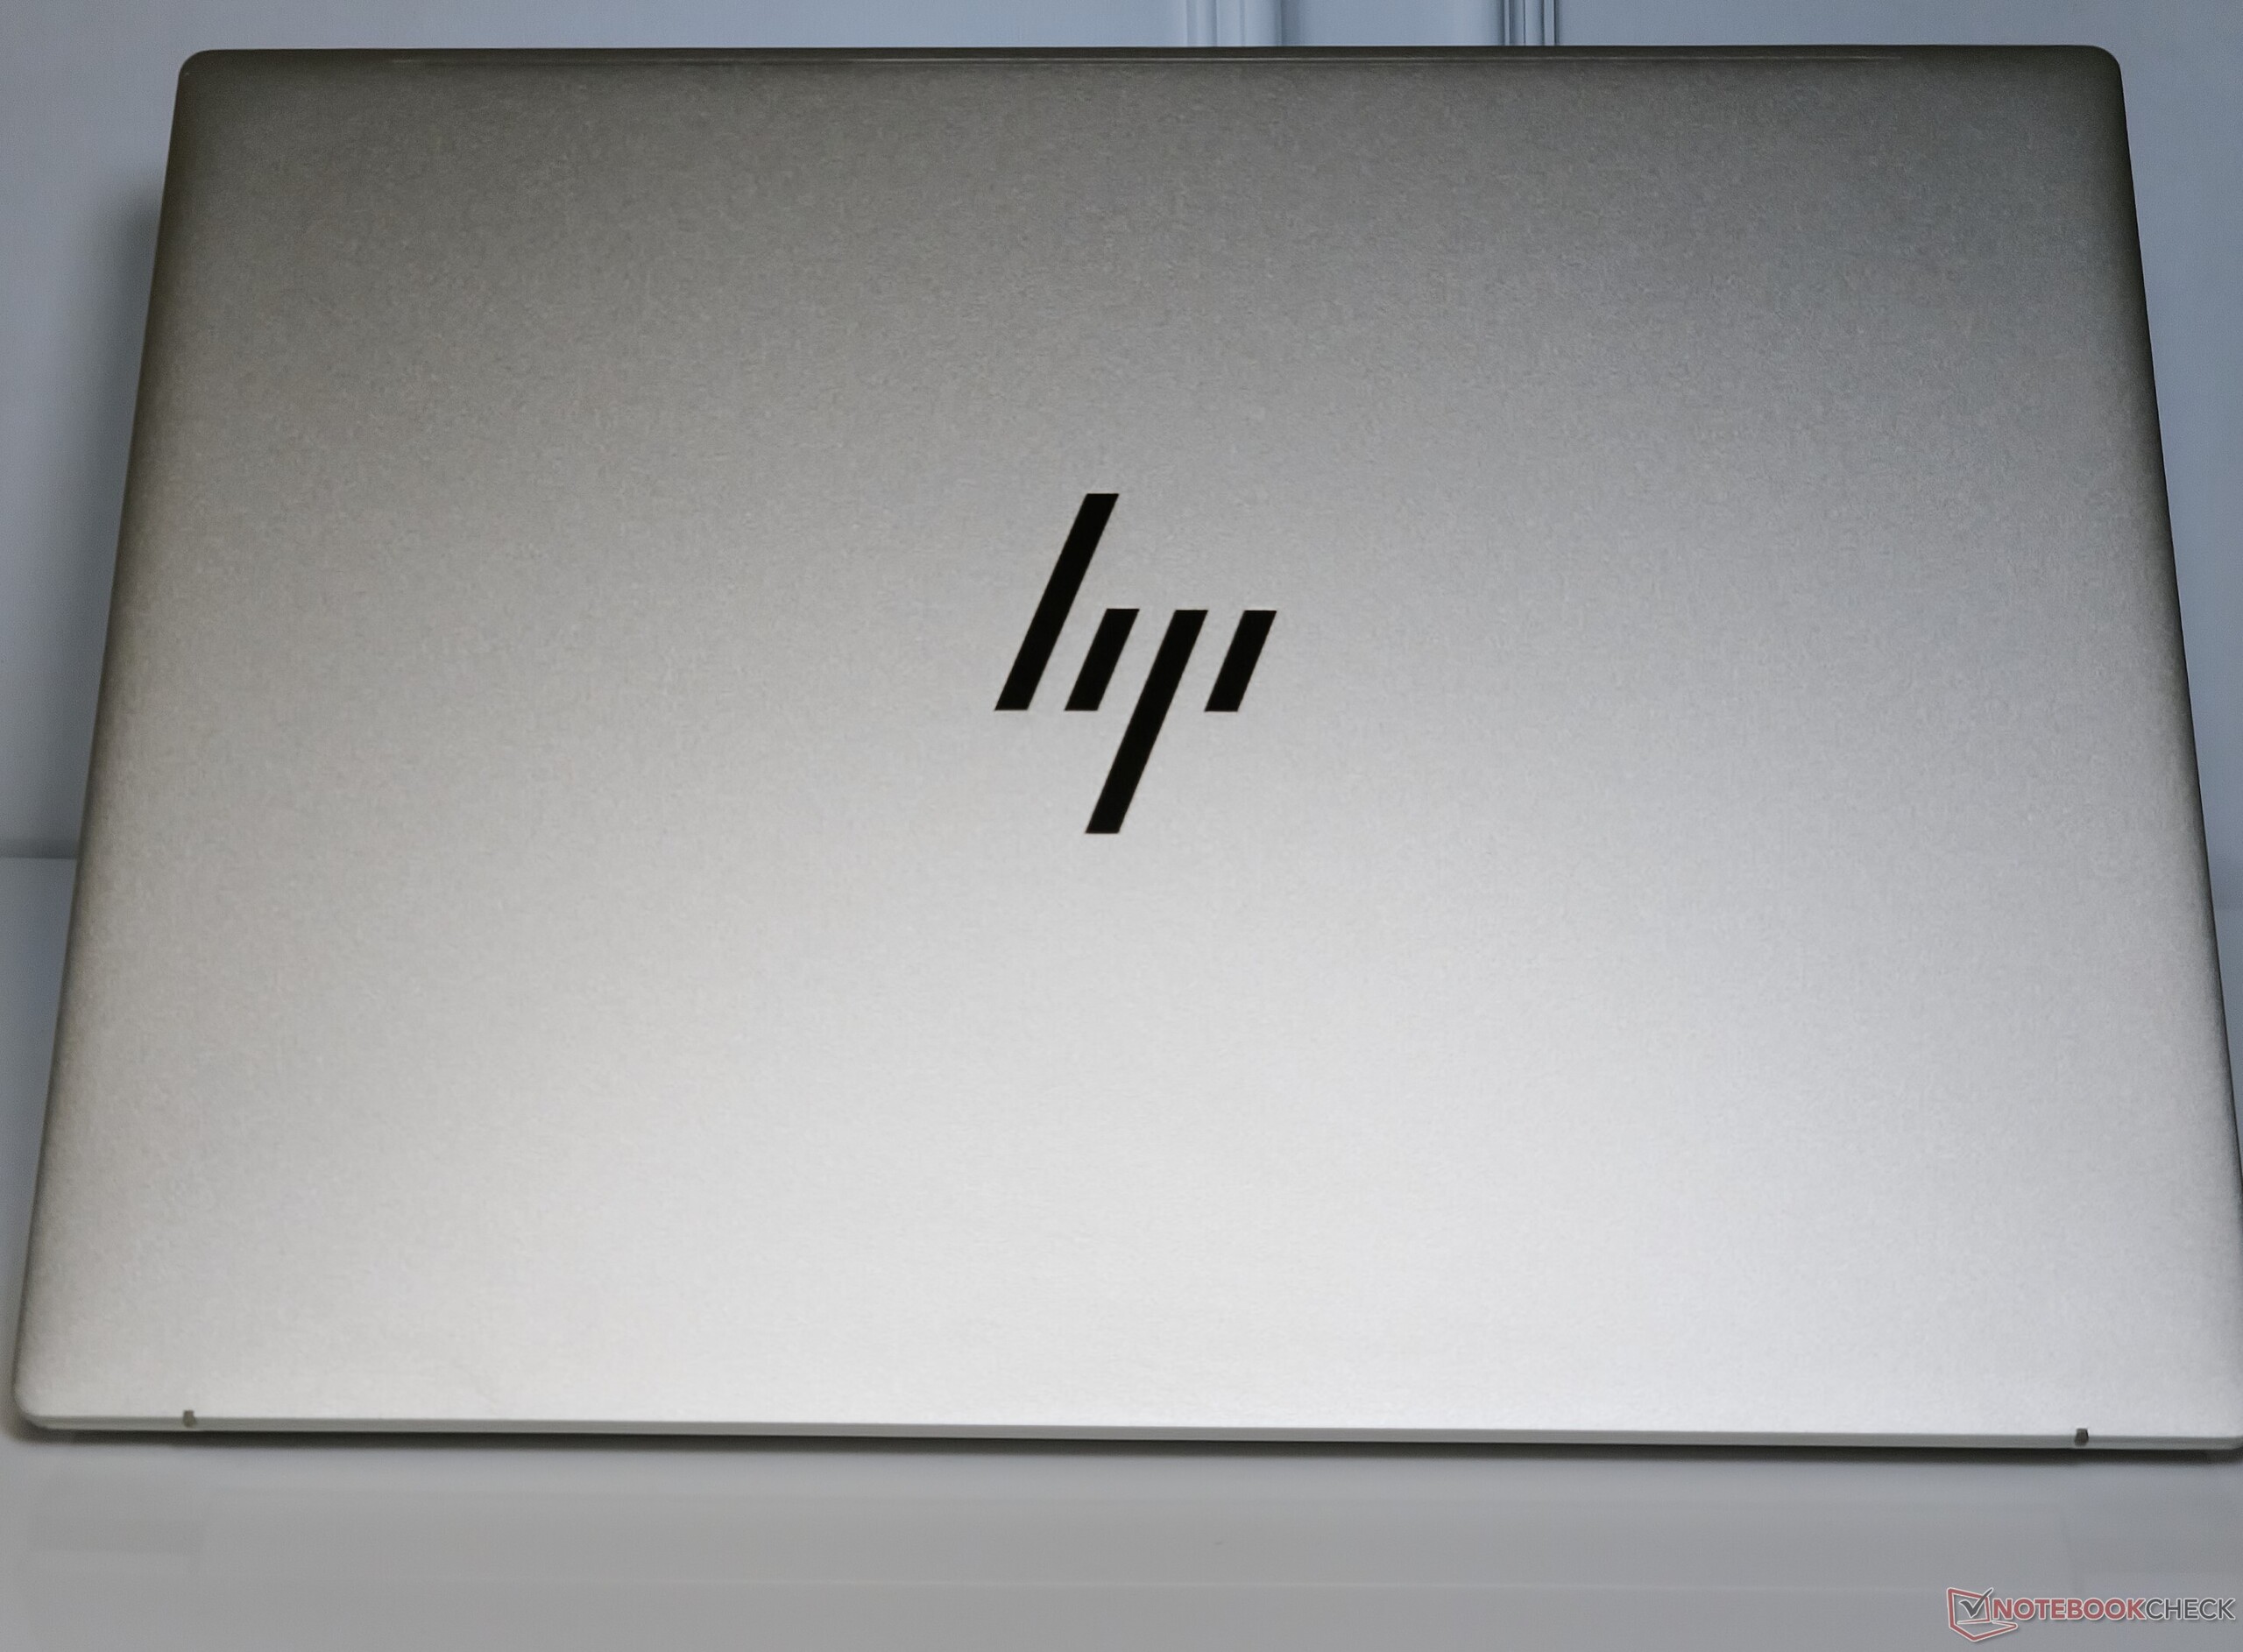
Châssis : Construction robuste entièrement métallique
Comme le Pavilion Plus 14, le Pavilion Plus 16 arbore une construction métallique Natural Silver pour les couvercles A, C et D, tandis que le couvercle est en aluminium.
La qualité générale de la construction laisse peu de place à la plainte. Nous n'avons pas remarqué de flexion particulière au niveau du couvercle ou du clavier.
HP annonce un ratio écran/corps de 89,74%, mais la valeur mesurée est de 83%. Avec un poids de 1,9 kg, l'ordinateur portable est similaire aux autres ordinateurs portables multimédias de 16 pouces en vogue.
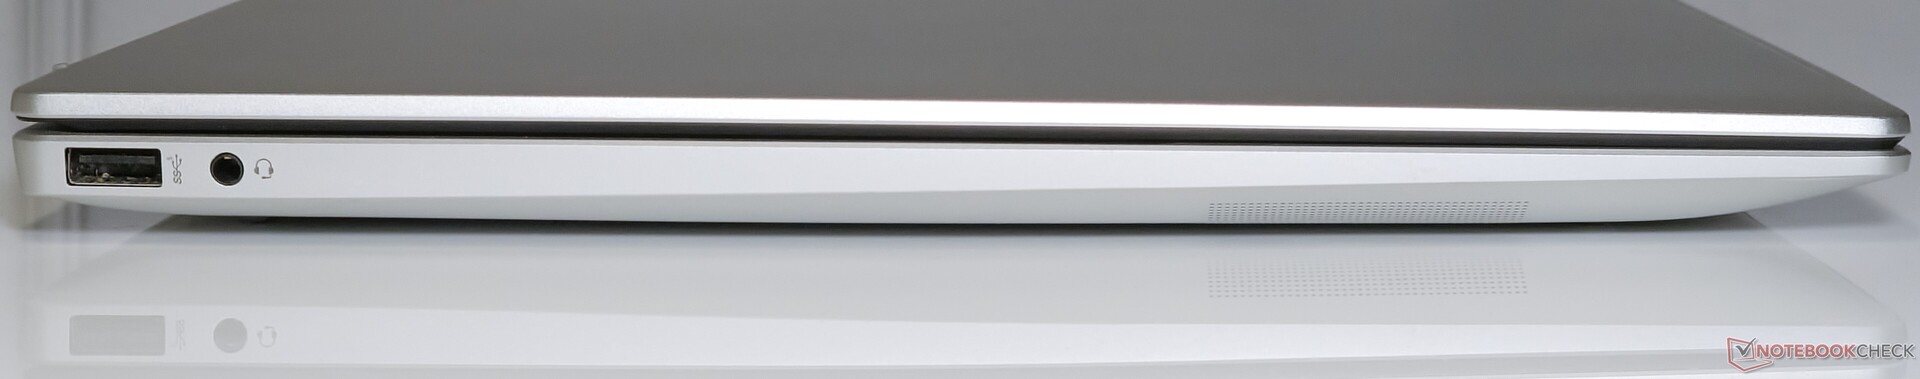
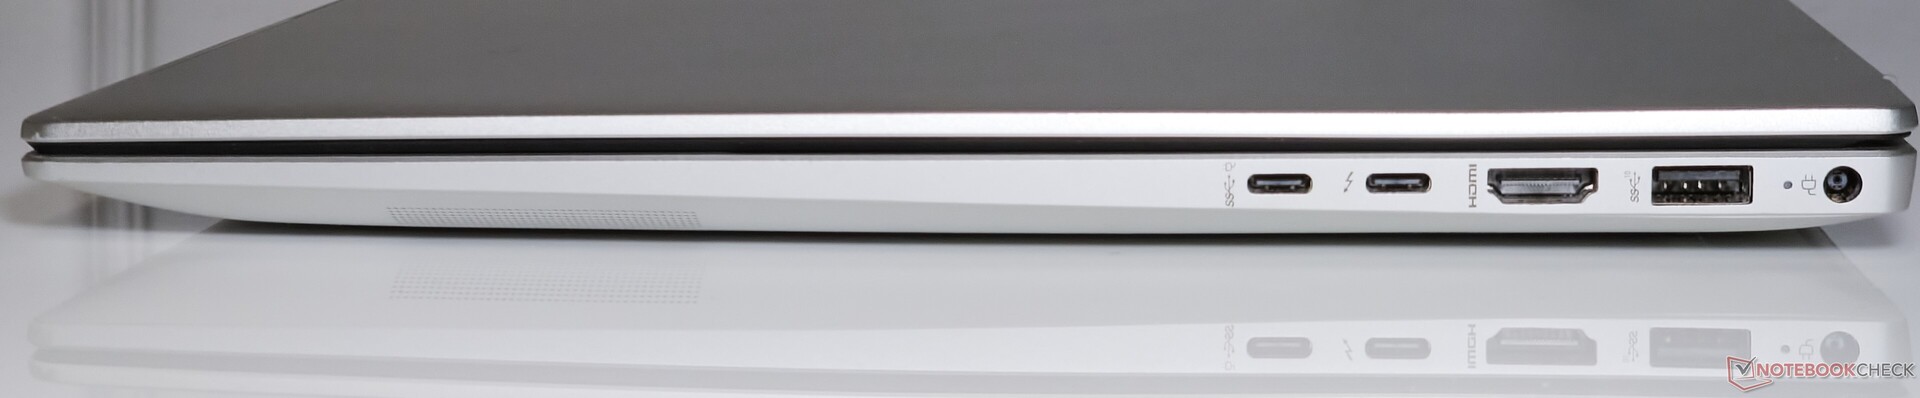
Connectivité : Débit constant du réseau local sans fil
Le Pavilion Plus 16 offre une sélection de ports décente qui comprend des ports USB Type-A et USB Type-C, y compris Thunderbolt 4.
L'emplacement des ports est correct et n'entrave pas la connectivité des périphériques adjacents, mais l'un des ports Type-C aurait pu se trouver sur le côté gauche pour une répartition plus homogène.
Communication
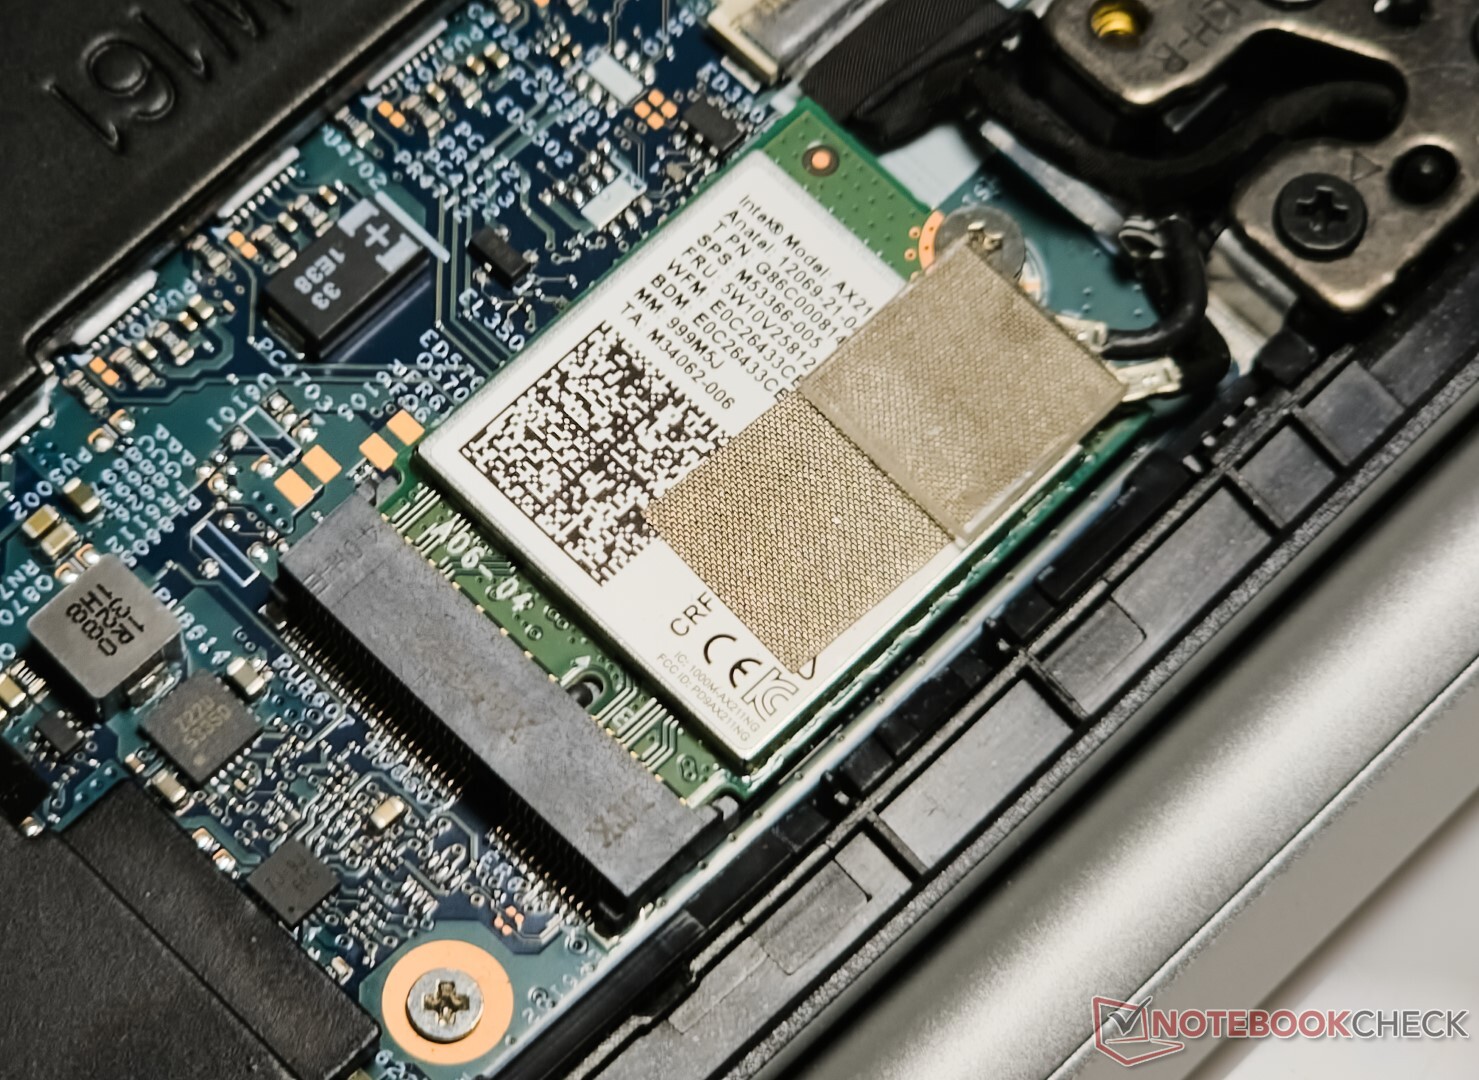
Les performances iPerf3 du Pavilion Plus 16 dans la bande 5 GHz sont un peu plus lentes que celles observées avec le Asus VivoBook Pro 16 équipé de la même carte WLAN Intel Wi-Fi 6E AX211.
Le Pavilion compense ce manque par rapport au VivoBook Pro 16 dans les performances de réception à 6 GHz, mais pas de beaucoup.
les performances iPerf3 dans les bandes 5 GHz et 6 GHz sont assez cohérentes sans aucun problème, contrairement à ce que nous avons vu avec le Lenovo Slim Pro 7 équipé d'une puce MediaTek Wi-Fi 6E MT7922.
| Networking / iperf3 transmit AXE11000 | |
| Asus VivoBook 14X K3405 | |
| HP Pavilion Plus 16-ab0456tx | |
| Asus VivoBook Pro 16 K6602VU | |
| Samsung Galaxy Book3 Ultra 16 | |
| Moyenne de la classe Multimedia (606 - 1978, n=61, 2 dernières années) | |
| Lenovo Slim Pro 7 14ARP8 | |
| Dell Inspiron 16 Plus 7630 | |
| Moyenne Intel Wi-Fi 6E AX211 (64 - 1921, n=276) | |
| Networking / iperf3 receive AXE11000 | |
| Asus VivoBook 14X K3405 | |
| Asus VivoBook Pro 16 K6602VU | |
| HP Pavilion Plus 16-ab0456tx | |
| Samsung Galaxy Book3 Ultra 16 | |
| Lenovo Slim Pro 7 14ARP8 | |
| Moyenne Intel Wi-Fi 6E AX211 (582 - 1890, n=276) | |
| Moyenne de la classe Multimedia (682 - 1818, n=61, 2 dernières années) | |
| Dell Inspiron 16 Plus 7630 | |
| Networking / iperf3 transmit AXE11000 6GHz | |
| HP Pavilion Plus 16-ab0456tx | |
| Dell Inspiron 16 Plus 7630 | |
| Moyenne de la classe Multimedia (869 - 2373, n=25, 2 dernières années) | |
| Asus VivoBook 14X K3405 | |
| Asus VivoBook Pro 16 K6602VU | |
| Moyenne Intel Wi-Fi 6E AX211 (385 - 1851, n=226) | |
| Networking / iperf3 receive AXE11000 6GHz | |
| HP Pavilion Plus 16-ab0456tx | |
| Moyenne de la classe Multimedia (1212 - 2361, n=25, 2 dernières années) | |
| Asus VivoBook Pro 16 K6602VU | |
| Asus VivoBook 14X K3405 | |
| Moyenne Intel Wi-Fi 6E AX211 (700 - 1857, n=226) | |
| Dell Inspiron 16 Plus 7630 | |
Webcam
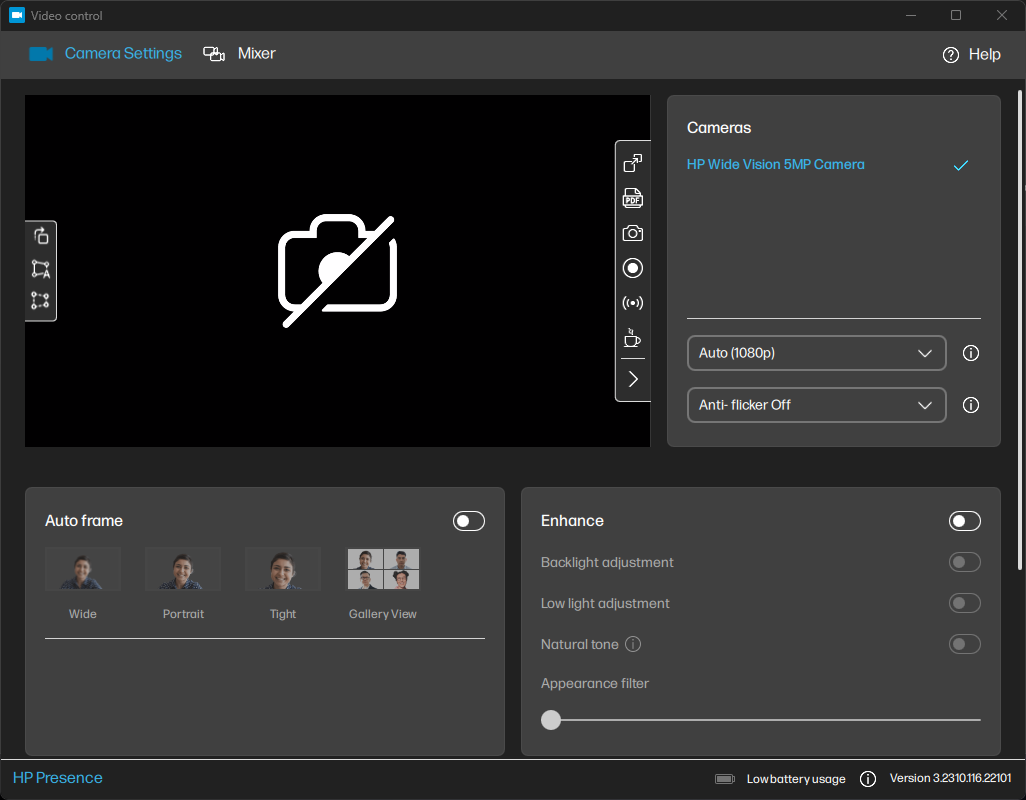
La webcam de 5 mégapixels produit des images correctes qui conviennent parfaitement à la vidéoconférence. Les détails sont assez bien préservés pour une webcam d'ordinateur portable, mais la caméra peut avoir des difficultés en cas de faible luminosité.
HP fournit quelques utilitaires astucieux tels que HP Enhanced Lighting qui éclaircit l'écran autour du sujet et une application Video Control qui offre des options supplémentaires de cadrage et d'ajustement de l'image.


Sécurité
HP fournit une caméra IR compatible avec Windows Hello pour le Pavilion Plus 16, ainsi qu'un obturateur de confidentialité pour la webcam. La caméra infrarouge a fonctionné assez rapidement pendant notre utilisation de l'appareil.
De plus, un module TPM 2.0 est présent pour répondre aux exigences de sécurité de Windows 11.
Accessoires et garantie
Il n'y a pas d'autres accessoires dans la boîte à part l'adaptateur d'alimentation de 135 W et les documents habituels.
HP offre une garantie d'un an pour le Pavilion Plus 16 en Inde. Les acheteurs peuvent prolonger cette garantie jusqu'à trois ans en achetant les HP Care Packs éligibles sur le site https://www.hp.com/in-en/shop/carepackfinder.
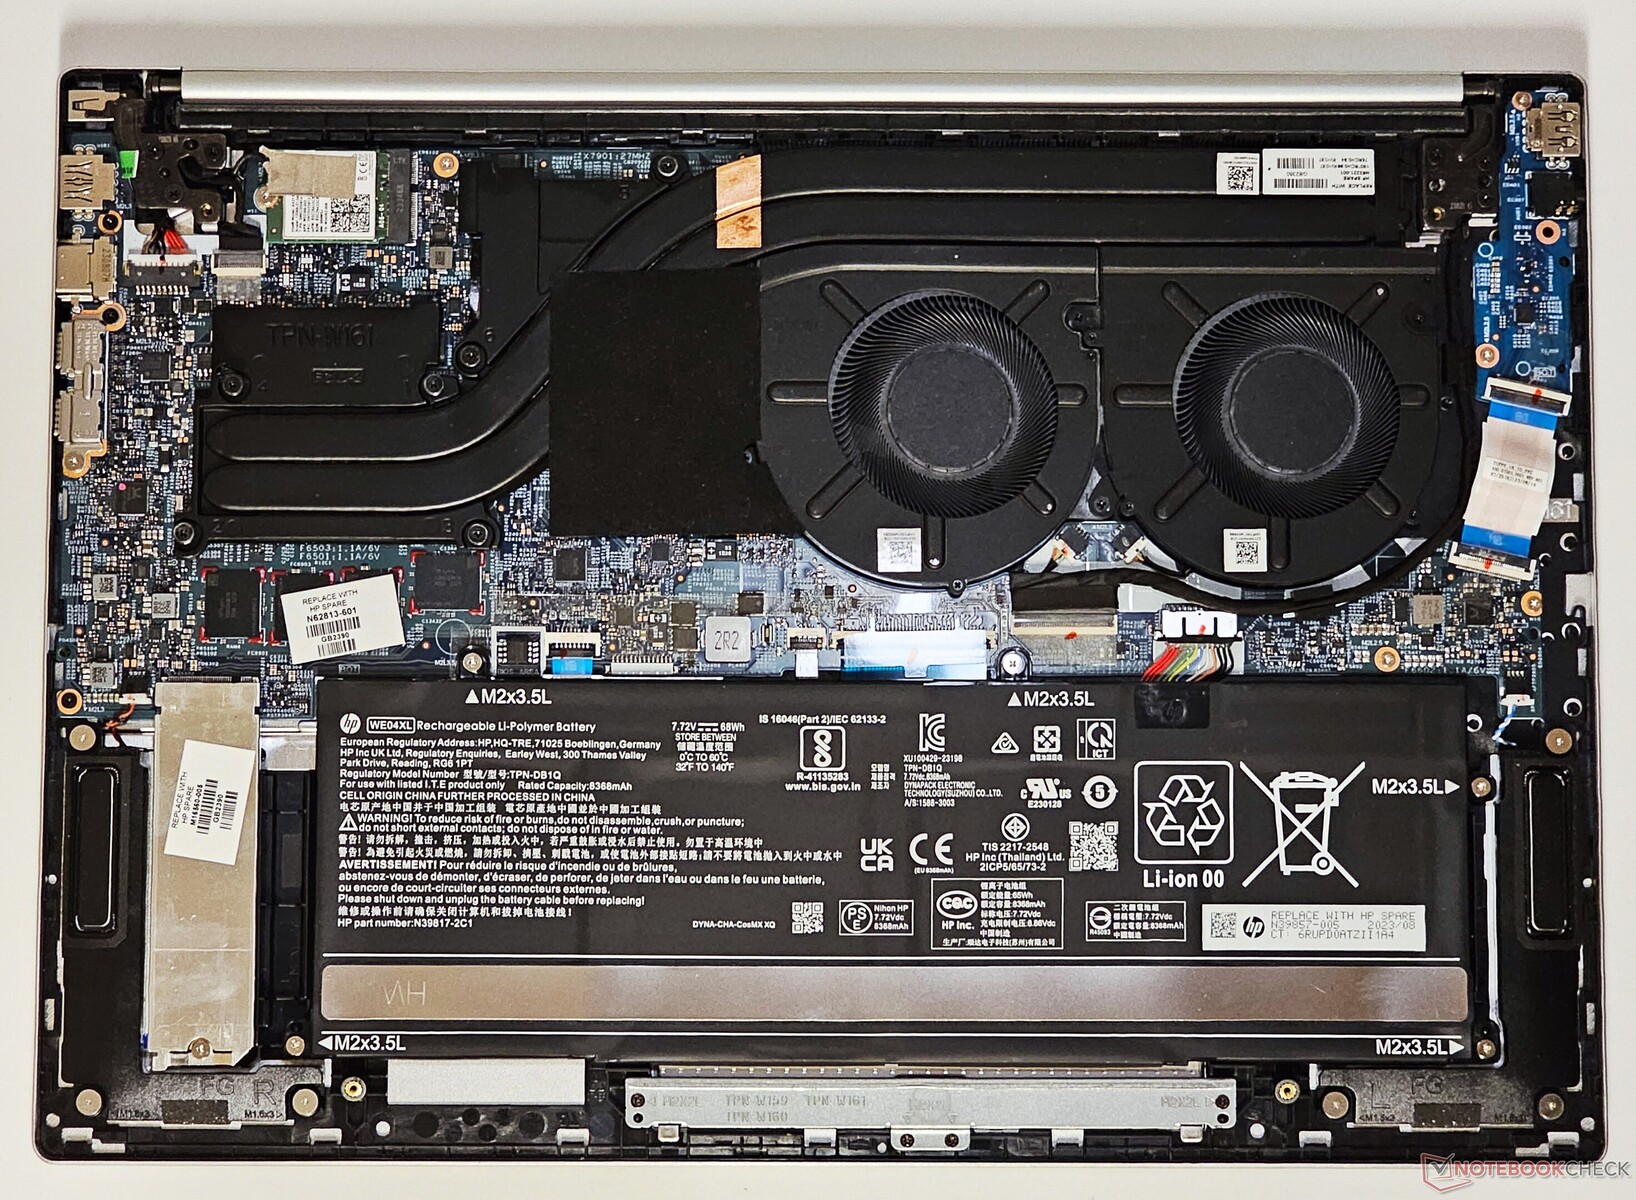
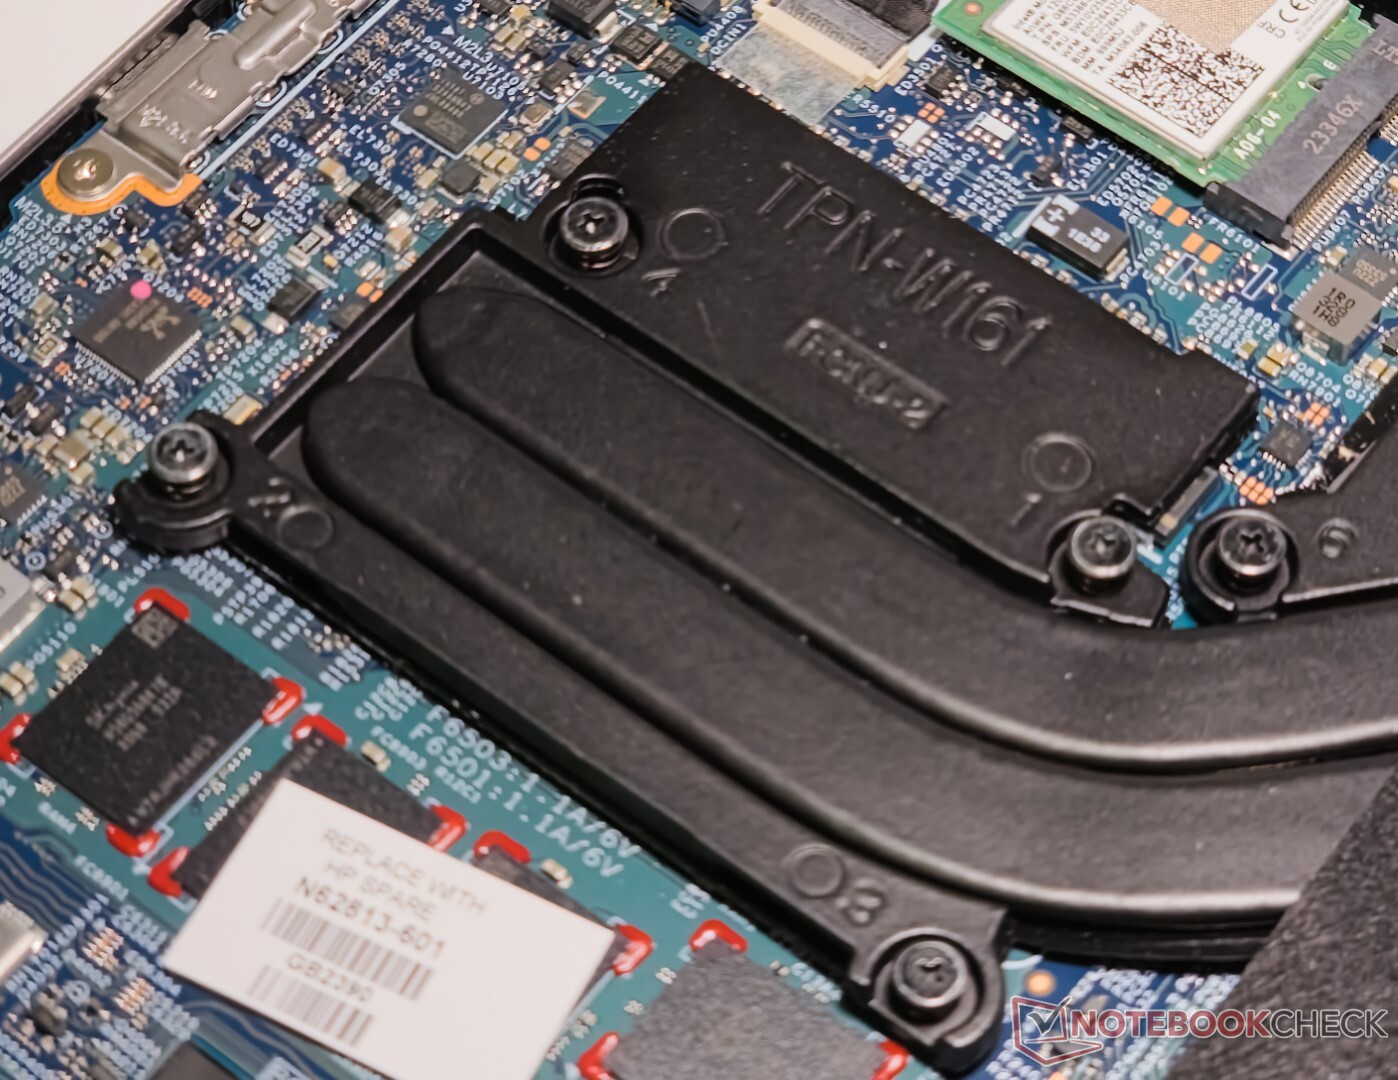
Maintenance
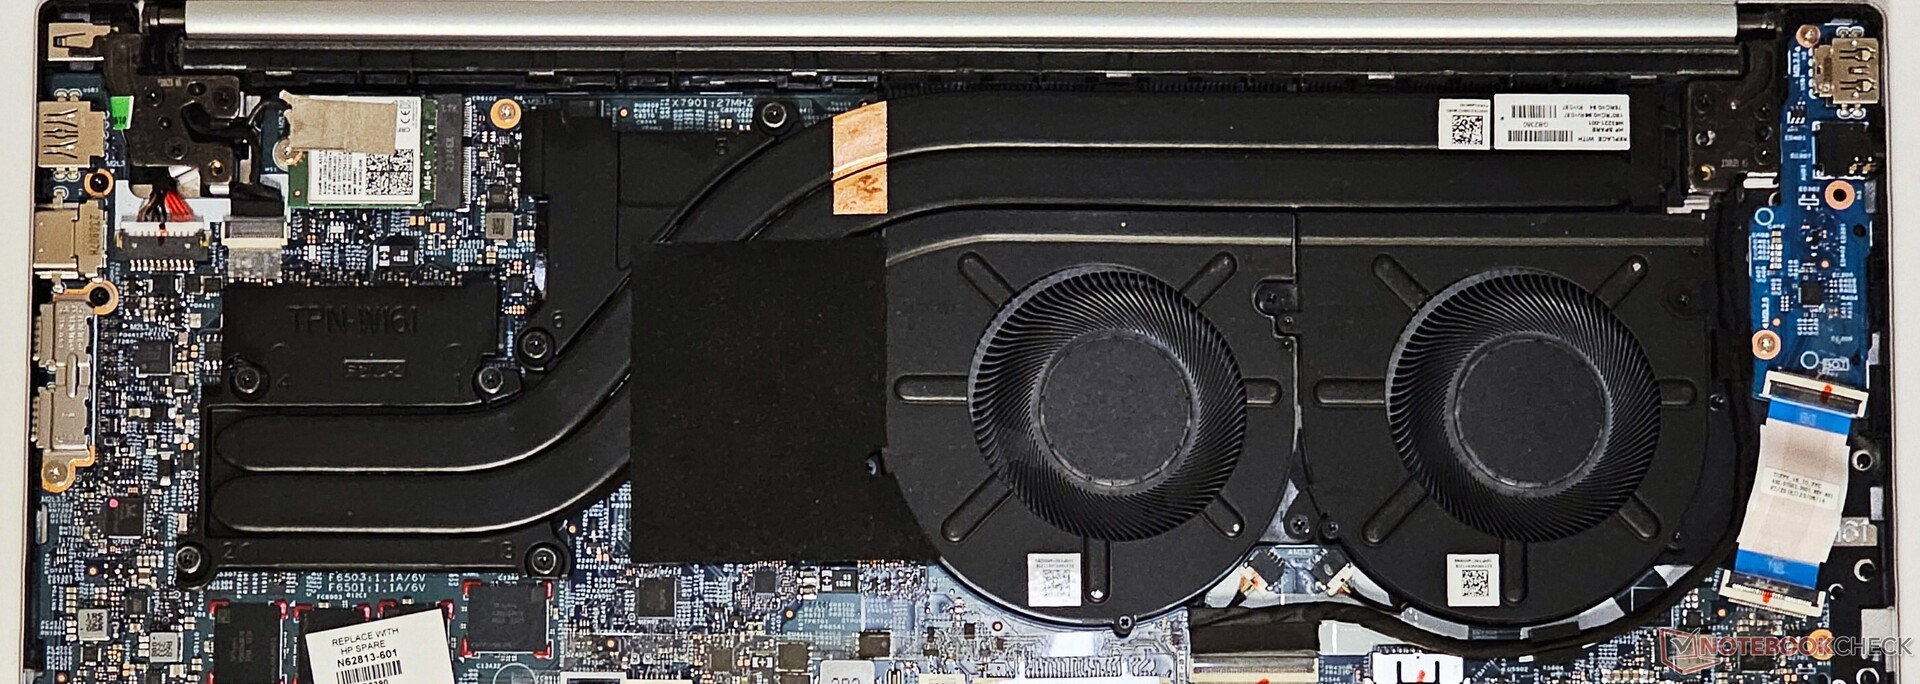
Le panneau inférieur peut être ouvert après avoir retiré les quatre vis PH0. La mémoire est soudée, mais la carte WLAN, le SSD NVMe et la batterie peuvent être remplacés si nécessaire.
Périphériques d'entrée : Pavé numérique de taille normale avec une tactilité décente
Clavier
Le clavier du Pavilion Plus 16 offre une expérience de frappe décente. Les touches grises offrent un bon contraste avec la couleur argentée du châssis. Le pavé numérique est spacieux et s'avère pratique pour calculer des nombres dans Excel. Il n'y a cependant pas d'indicateur de verrouillage numérique.
Le bouton d'alimentation est situé juste à côté de la touche Suppr, ce qui peut dérouter les utilisateurs novices. Les touches fléchées du haut et du bas sont également à l'étroit. Un rétroéclairage blanc à trois niveaux permet une meilleure lisibilité en cas de faible luminosité.
Pavé tactile
Le pavé tactile de 12,5 cm x 8 cm est spacieux et offre une expérience de glissement fluide avec un bon retour d'information. Cependant, la course n'est pas aussi profonde.
L'ensemble du pavé tactile fait office de bouton gauche de la souris. Les clics vers le milieu et la base du pavé tactile sont plus réactifs que ceux du haut.
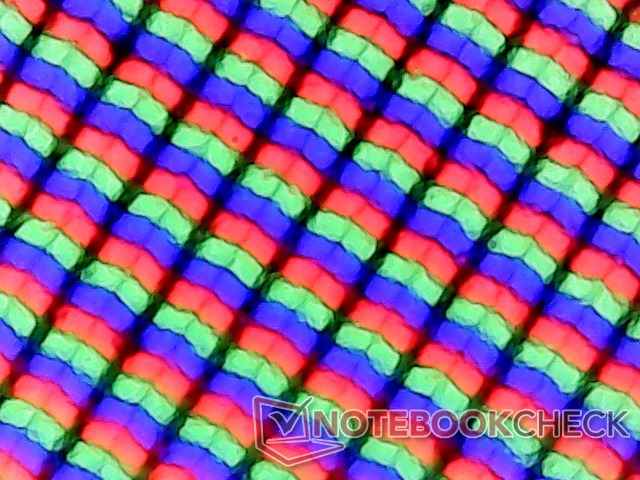
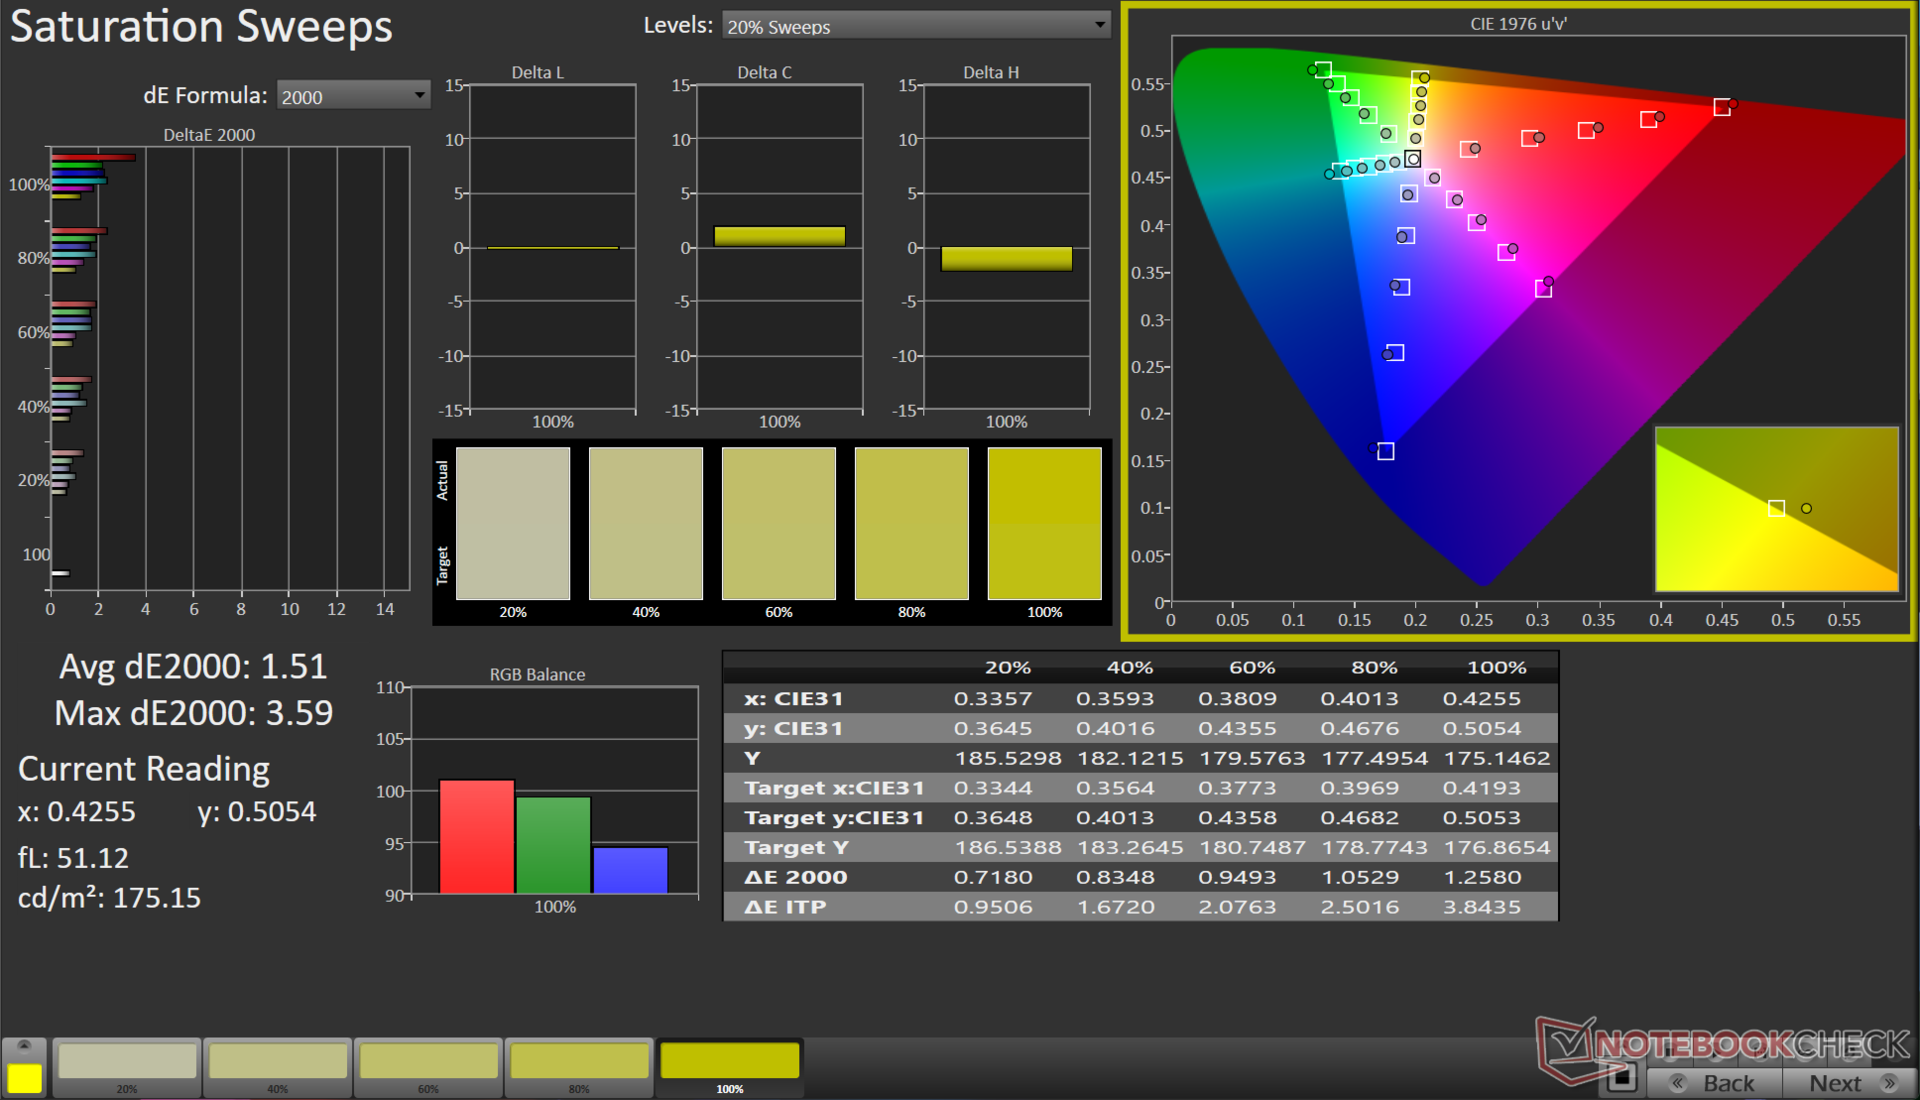
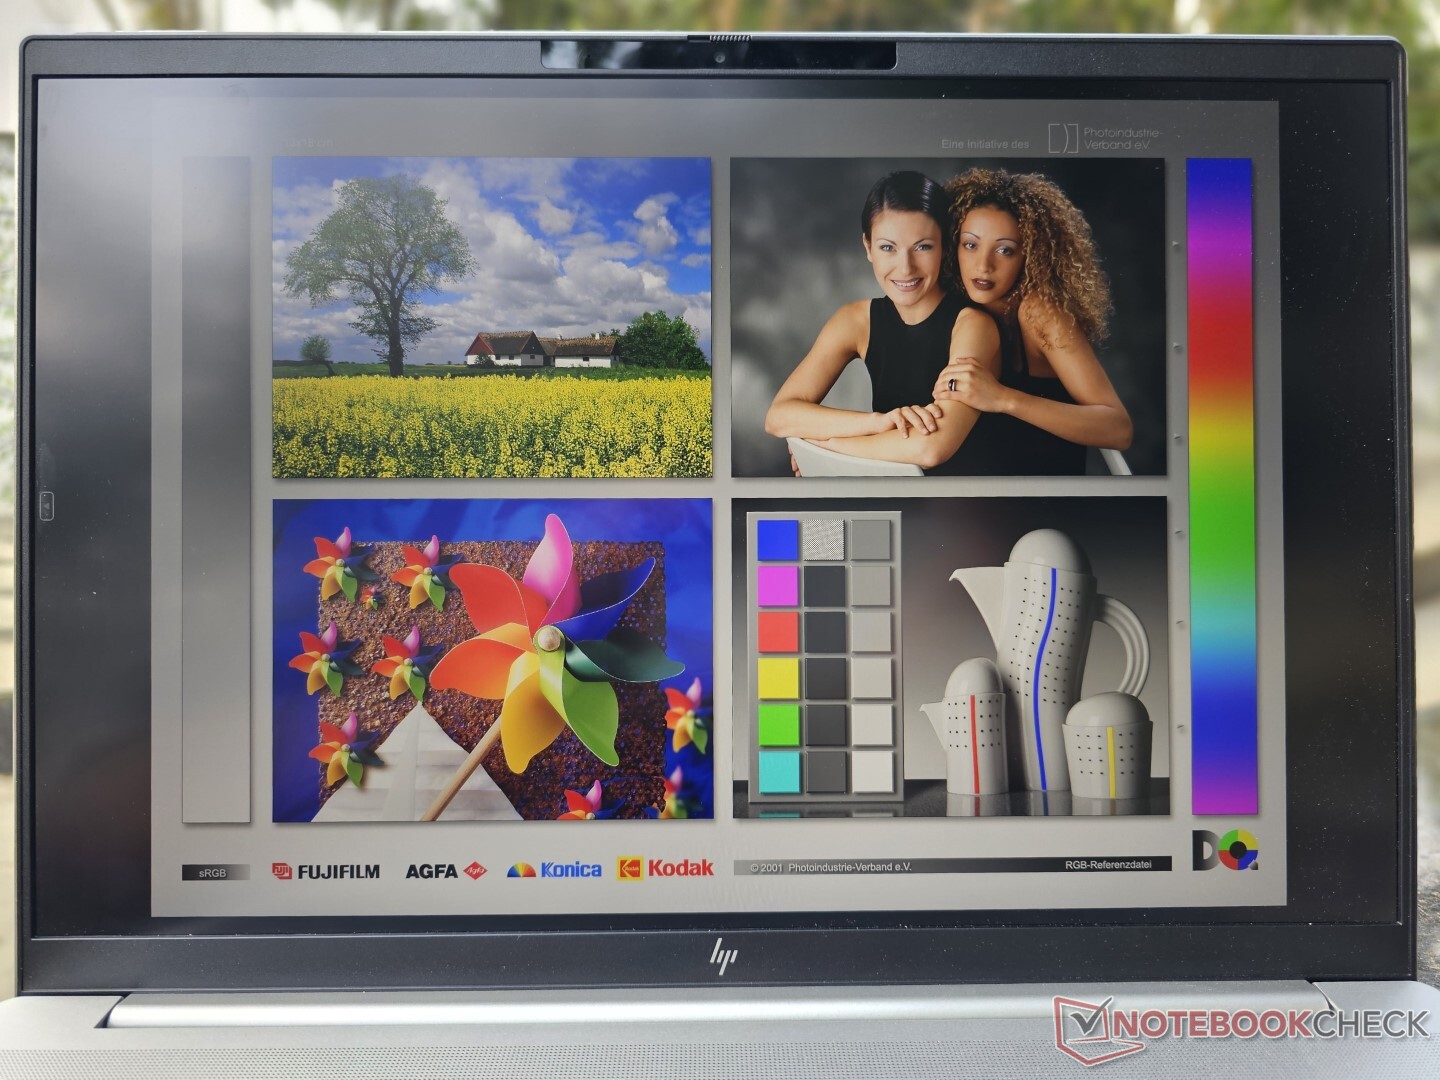
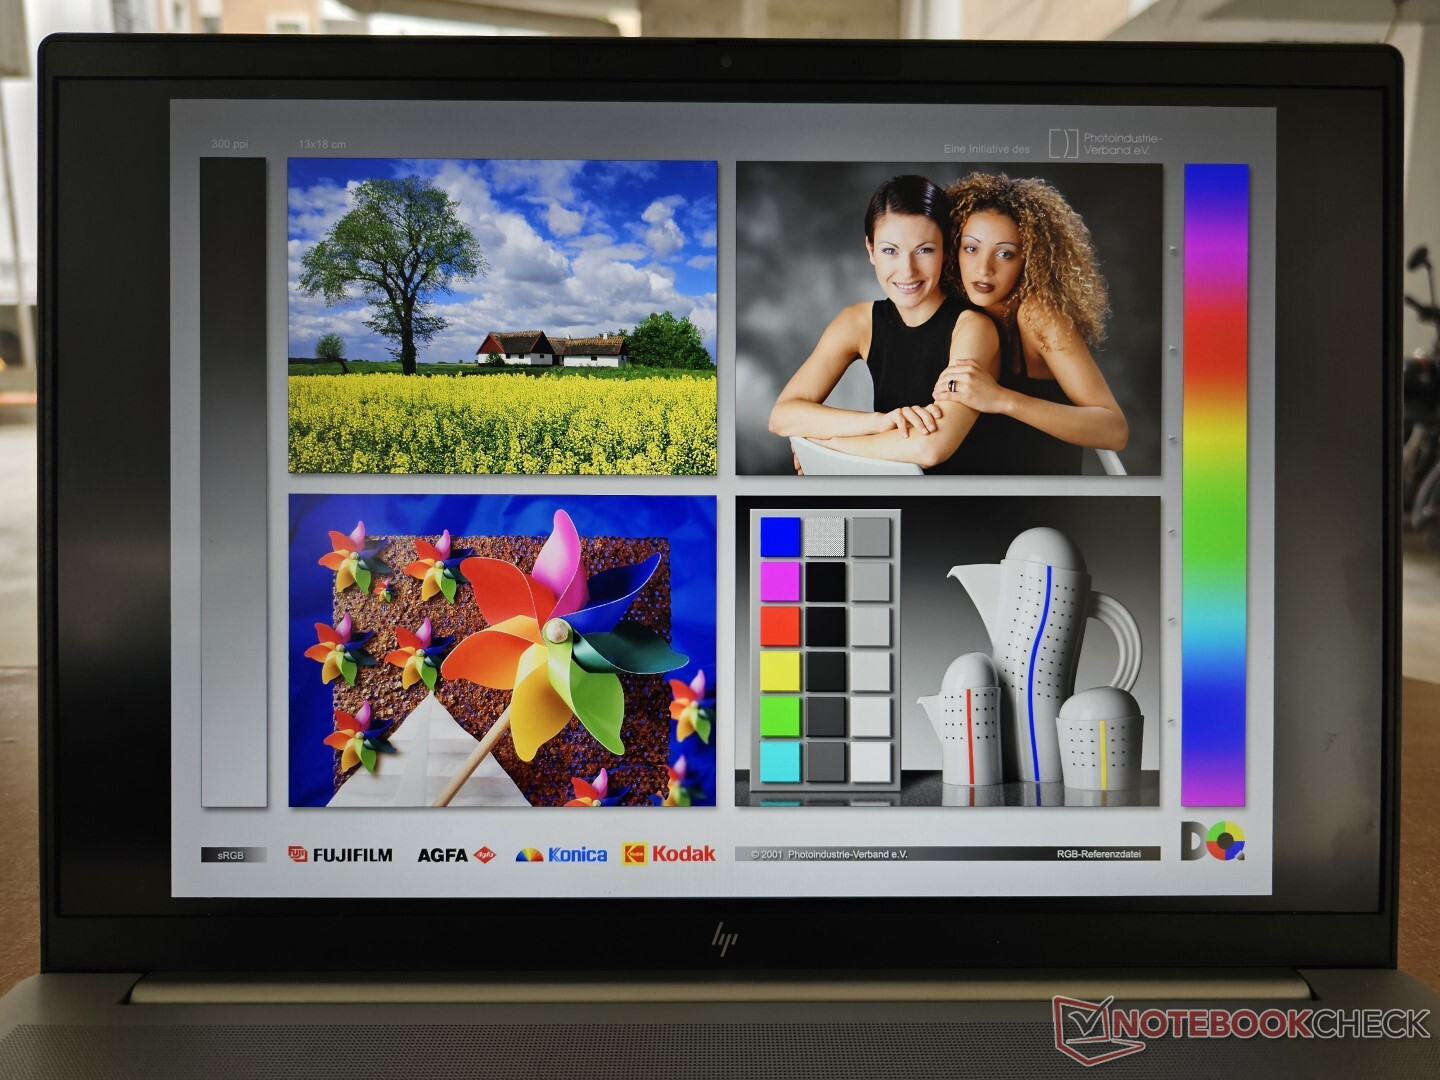
Affichage : panneau WQXGA 120 Hz avec un profil de couleur décent et sans PWM
Le Pavilion Plus 16 est équipé d'un écran IPS 16 pouces 16:10 2560 x 1600 WQXGA avec un taux de rafraîchissement de 120 Hz et une luminosité nominale de 400 nits.
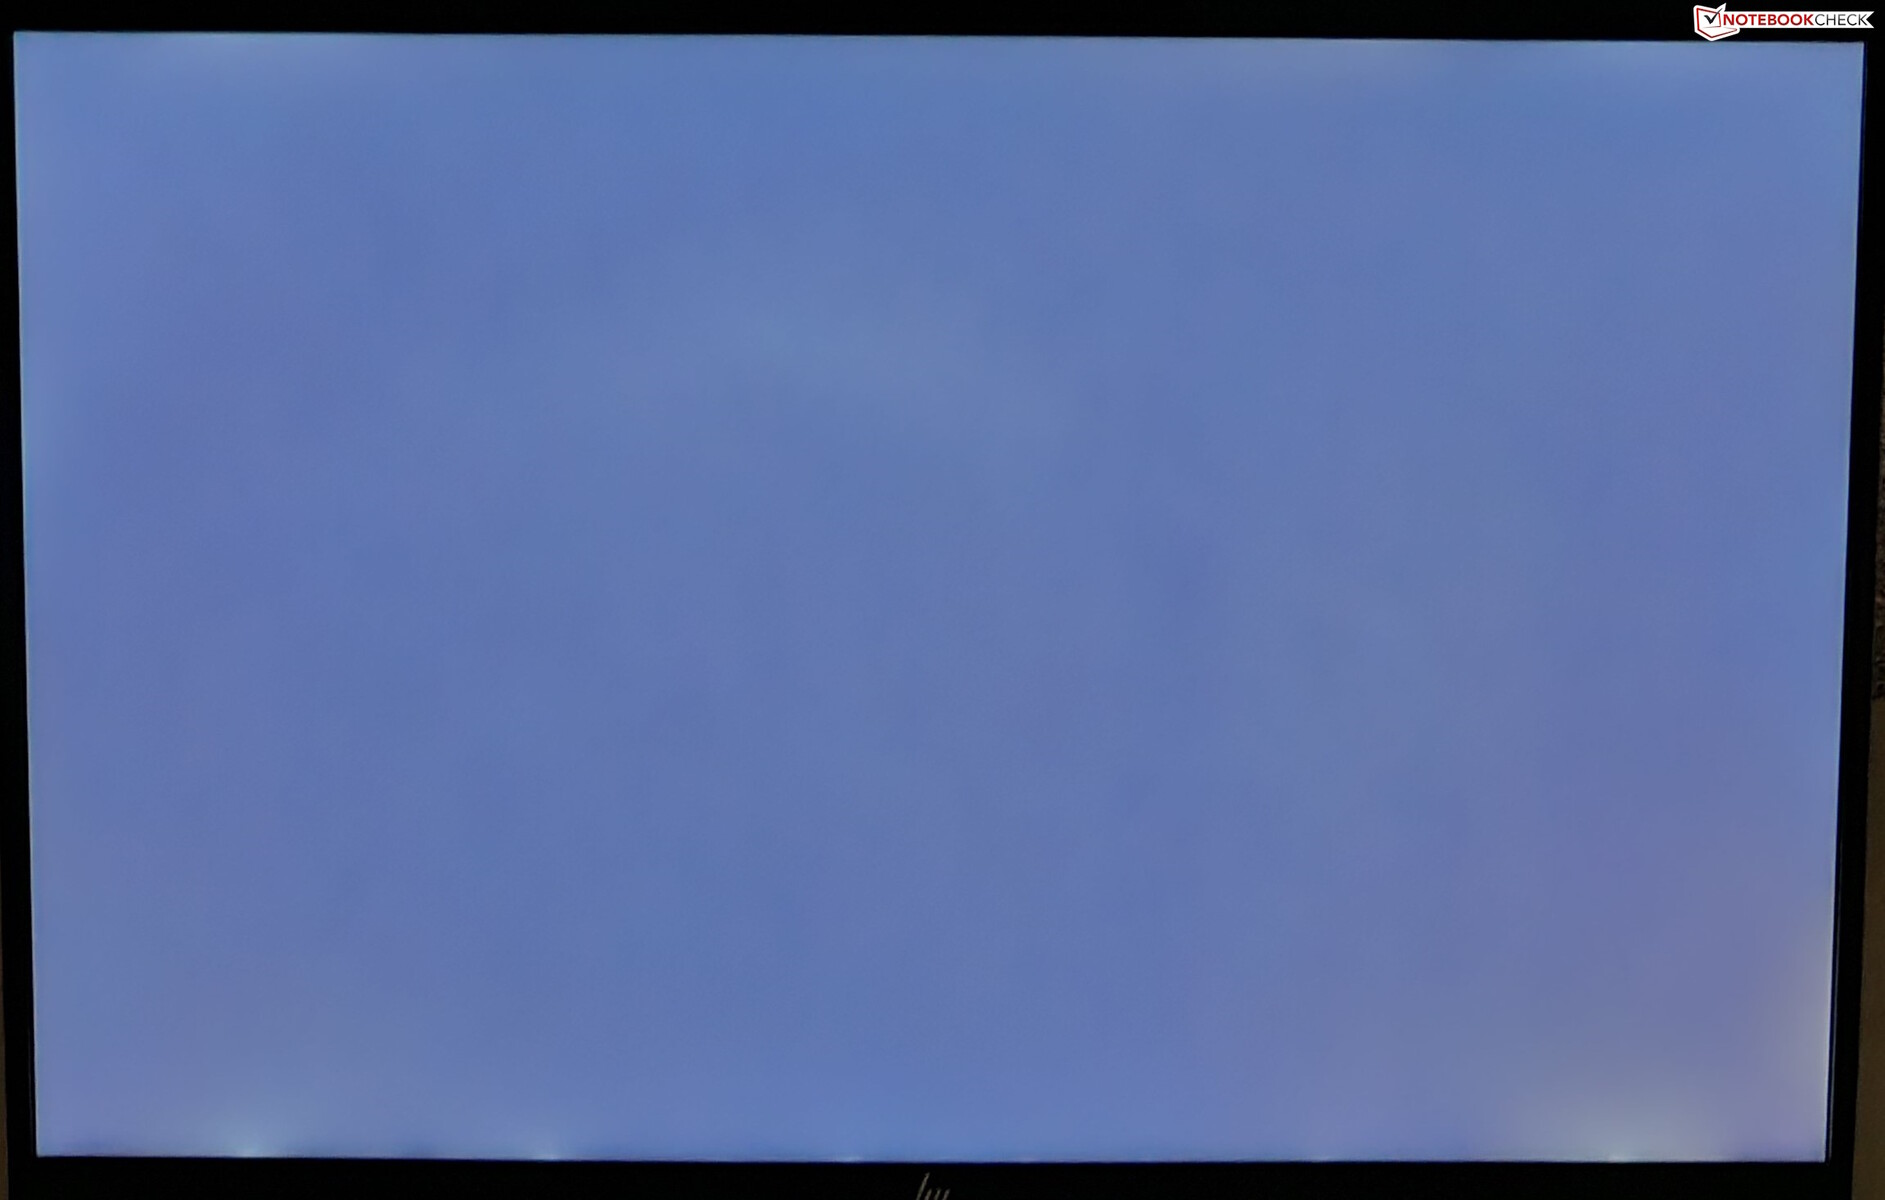
Nous avons mesuré une luminosité maximale de 415 nits avec une moyenne de 394 nits et une bonne répartition de 90%. Comme il s'agit d'une dalle IPS, l'écran n'est pas à l'abri d'une perte de rétroéclairage, que l'on peut remarquer dans les coins inférieurs en cas d'exposition prolongée.
D'un point de vue subjectif, le Pavilion Plus 16 offre une bonne expérience visuelle qui devrait convenir à la fois au travail et au divertissement.
| |||||||||||||||||||||||||
Homogénéité de la luminosité: 90 %
Valeur mesurée au centre, sur batterie: 401 cd/m²
Contraste: 1185:1 (Valeurs des noirs: 0.34 cd/m²)
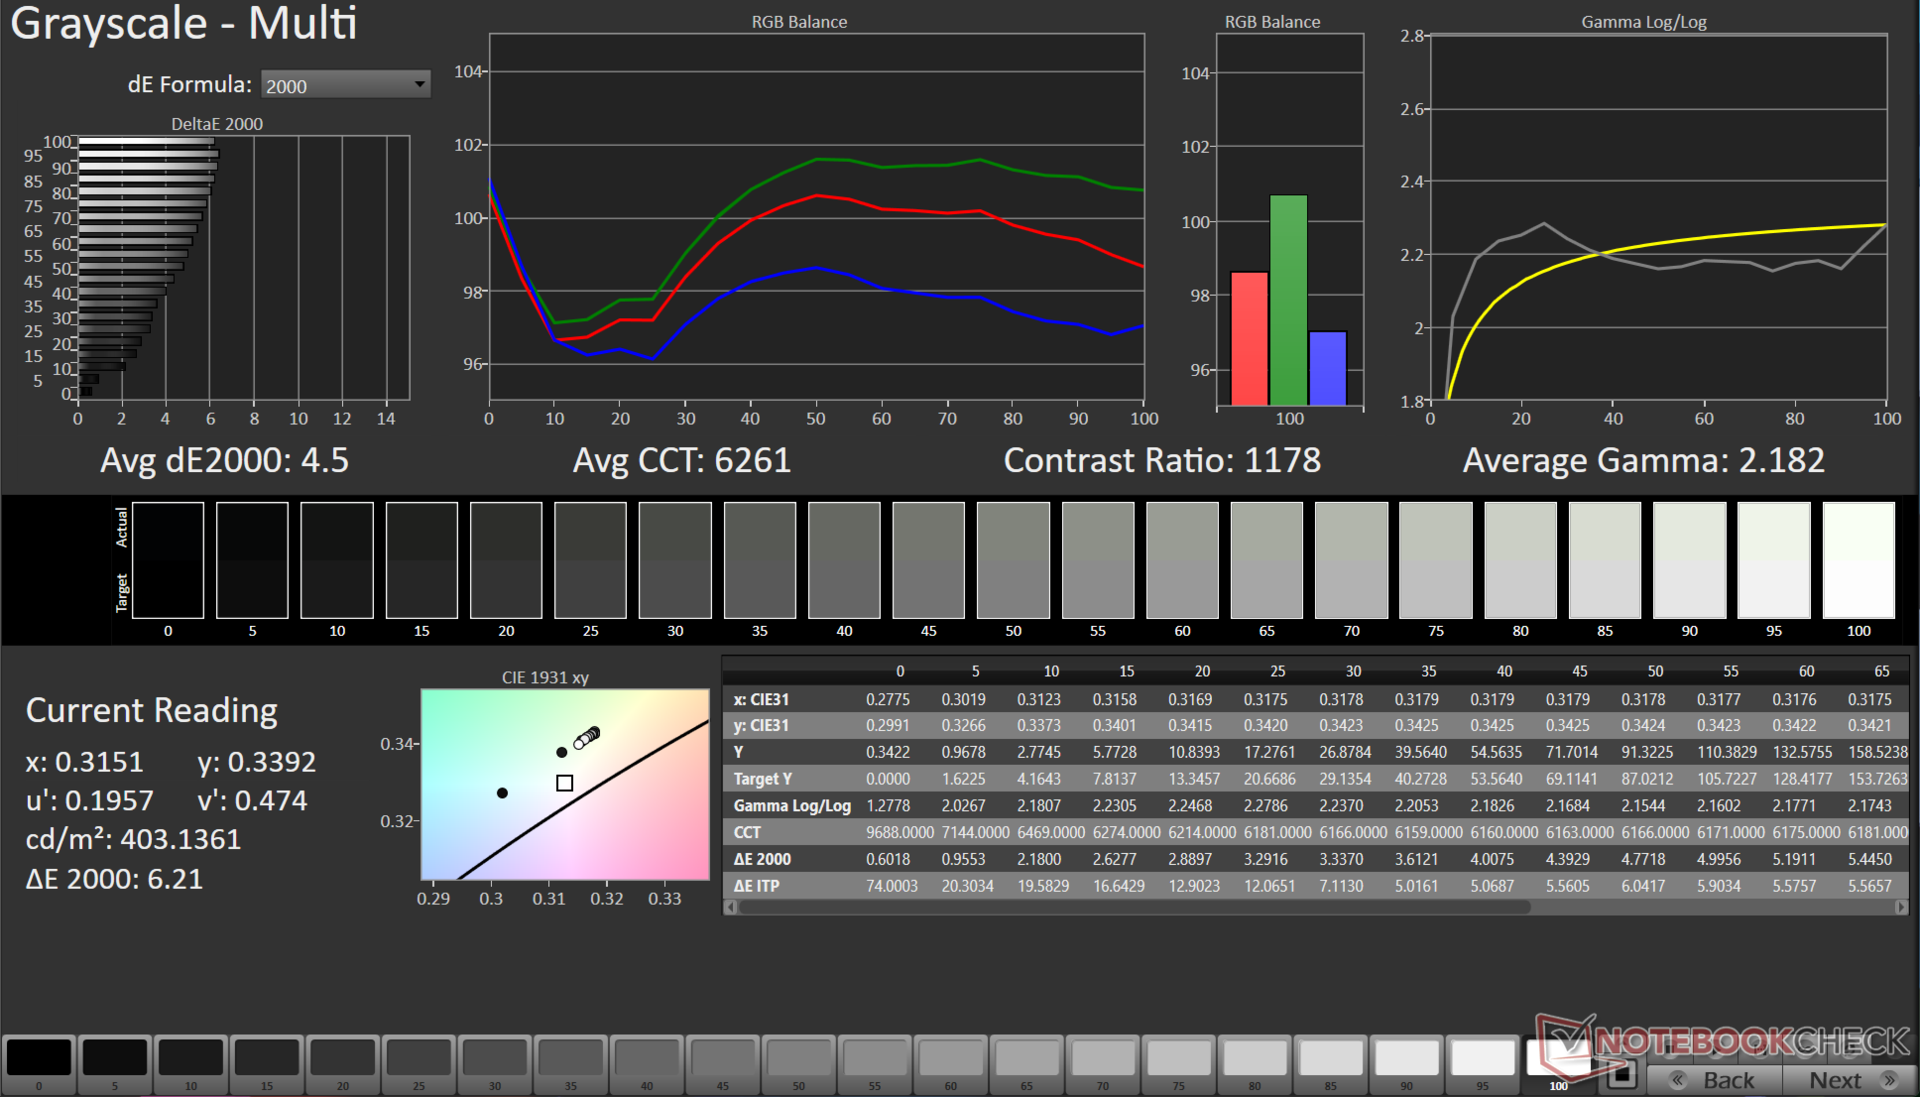
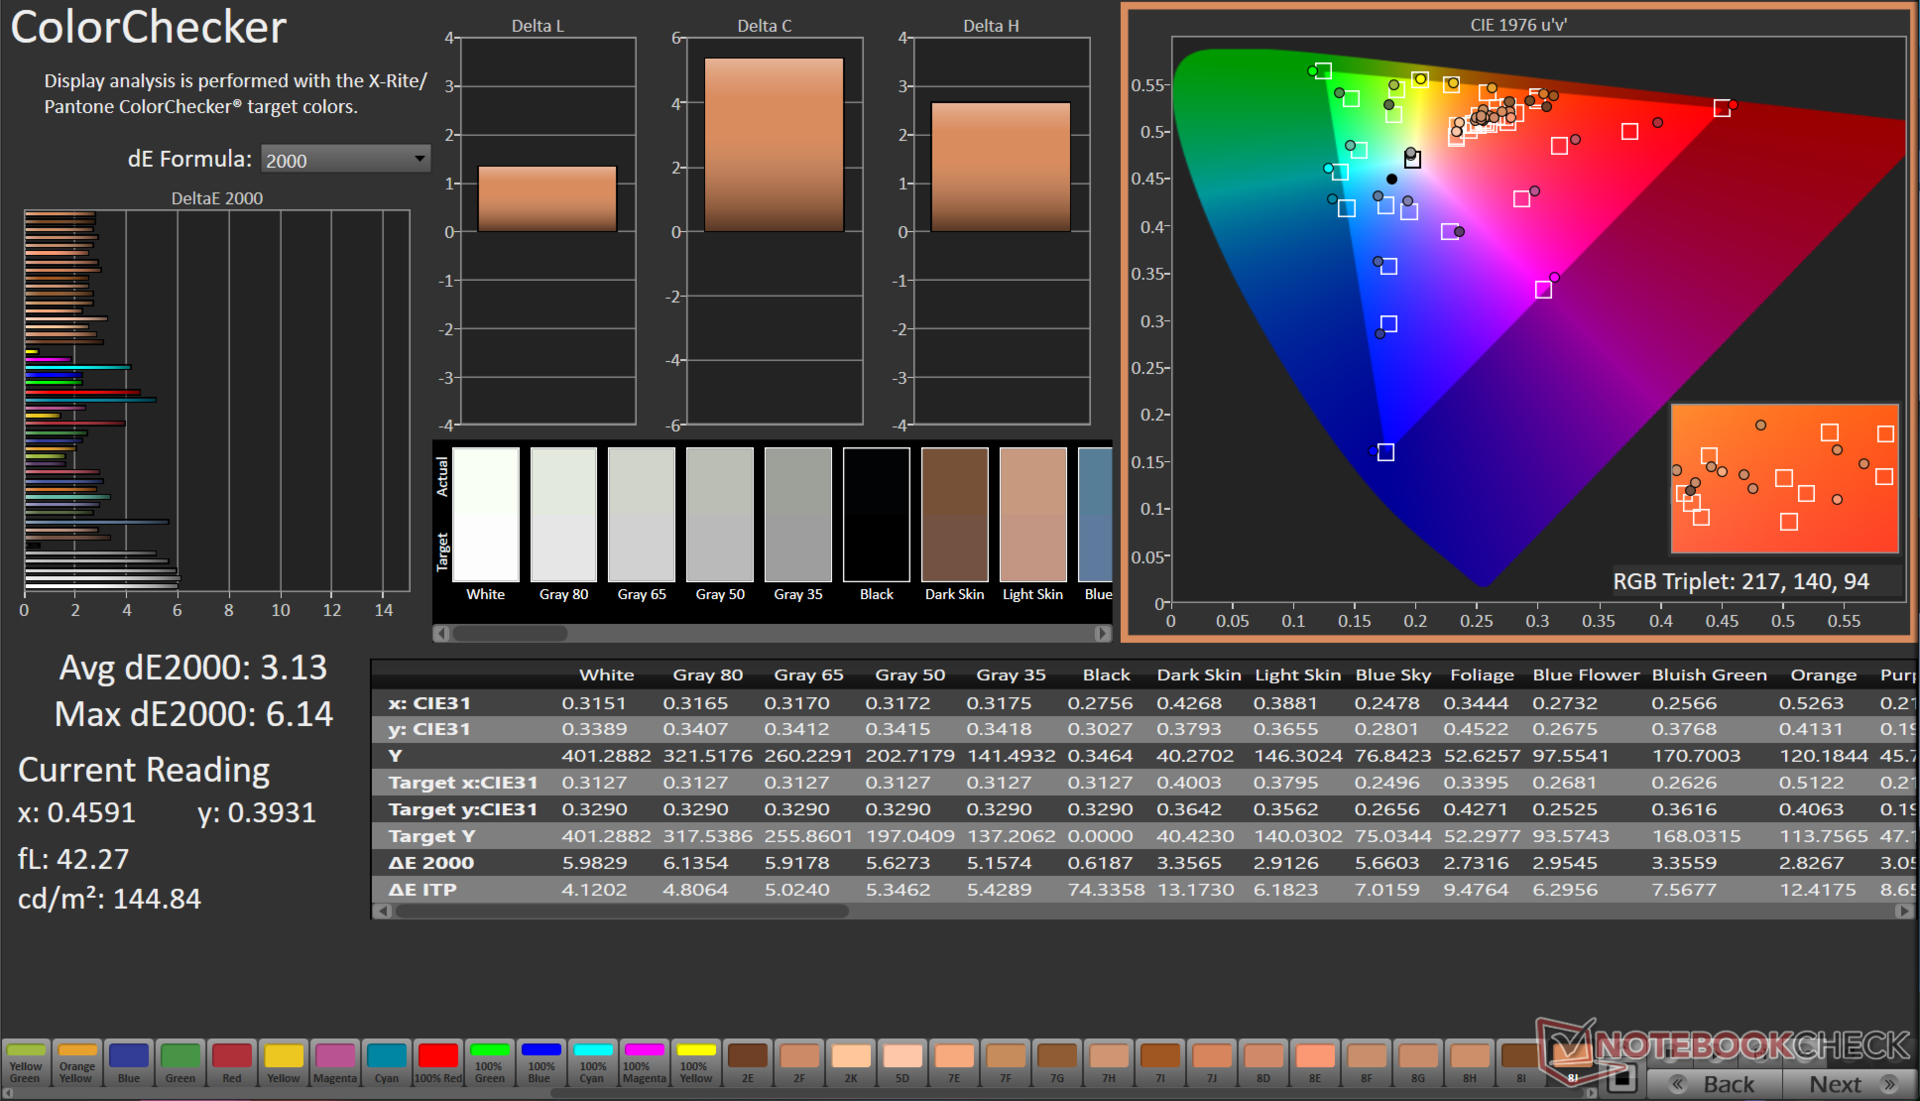
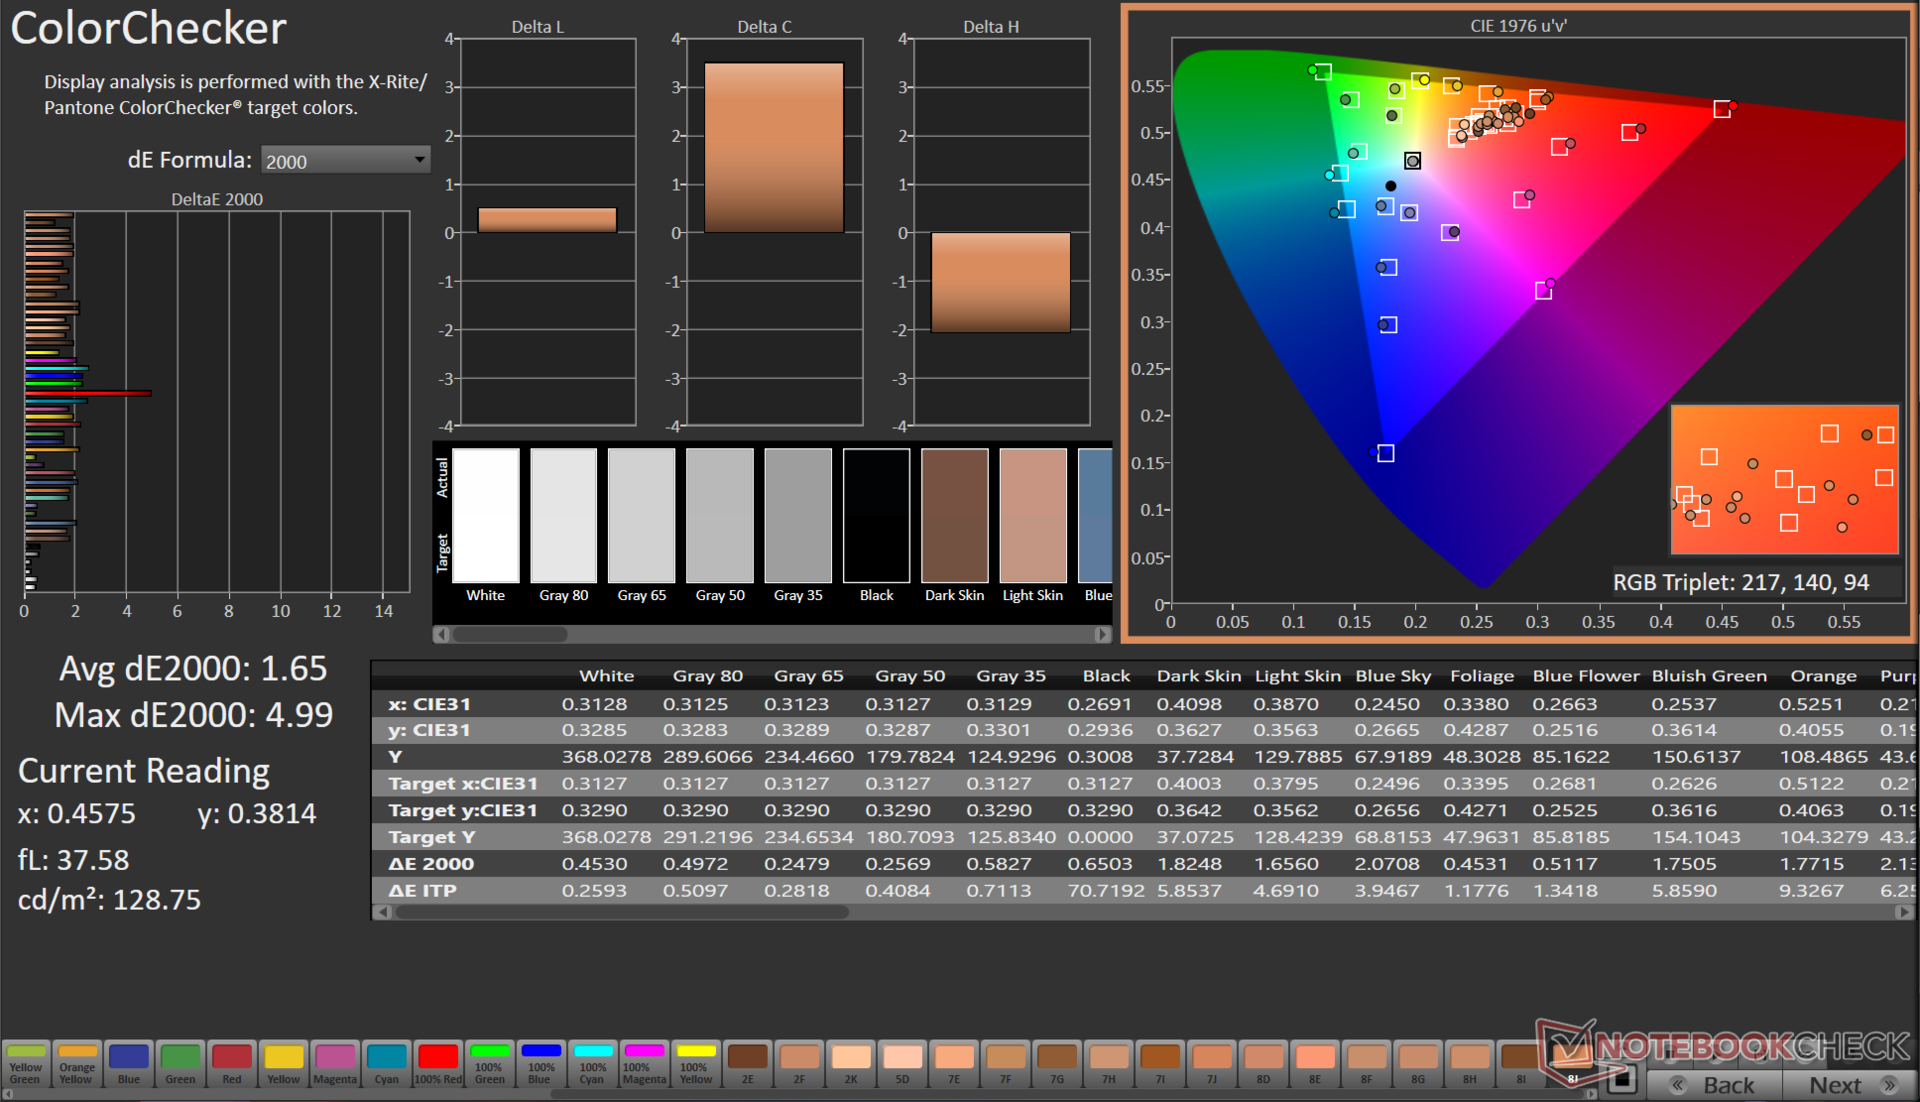
ΔE ColorChecker Calman: 3.13 | ∀{0.5-29.43 Ø4.73}
calibrated: 1.65
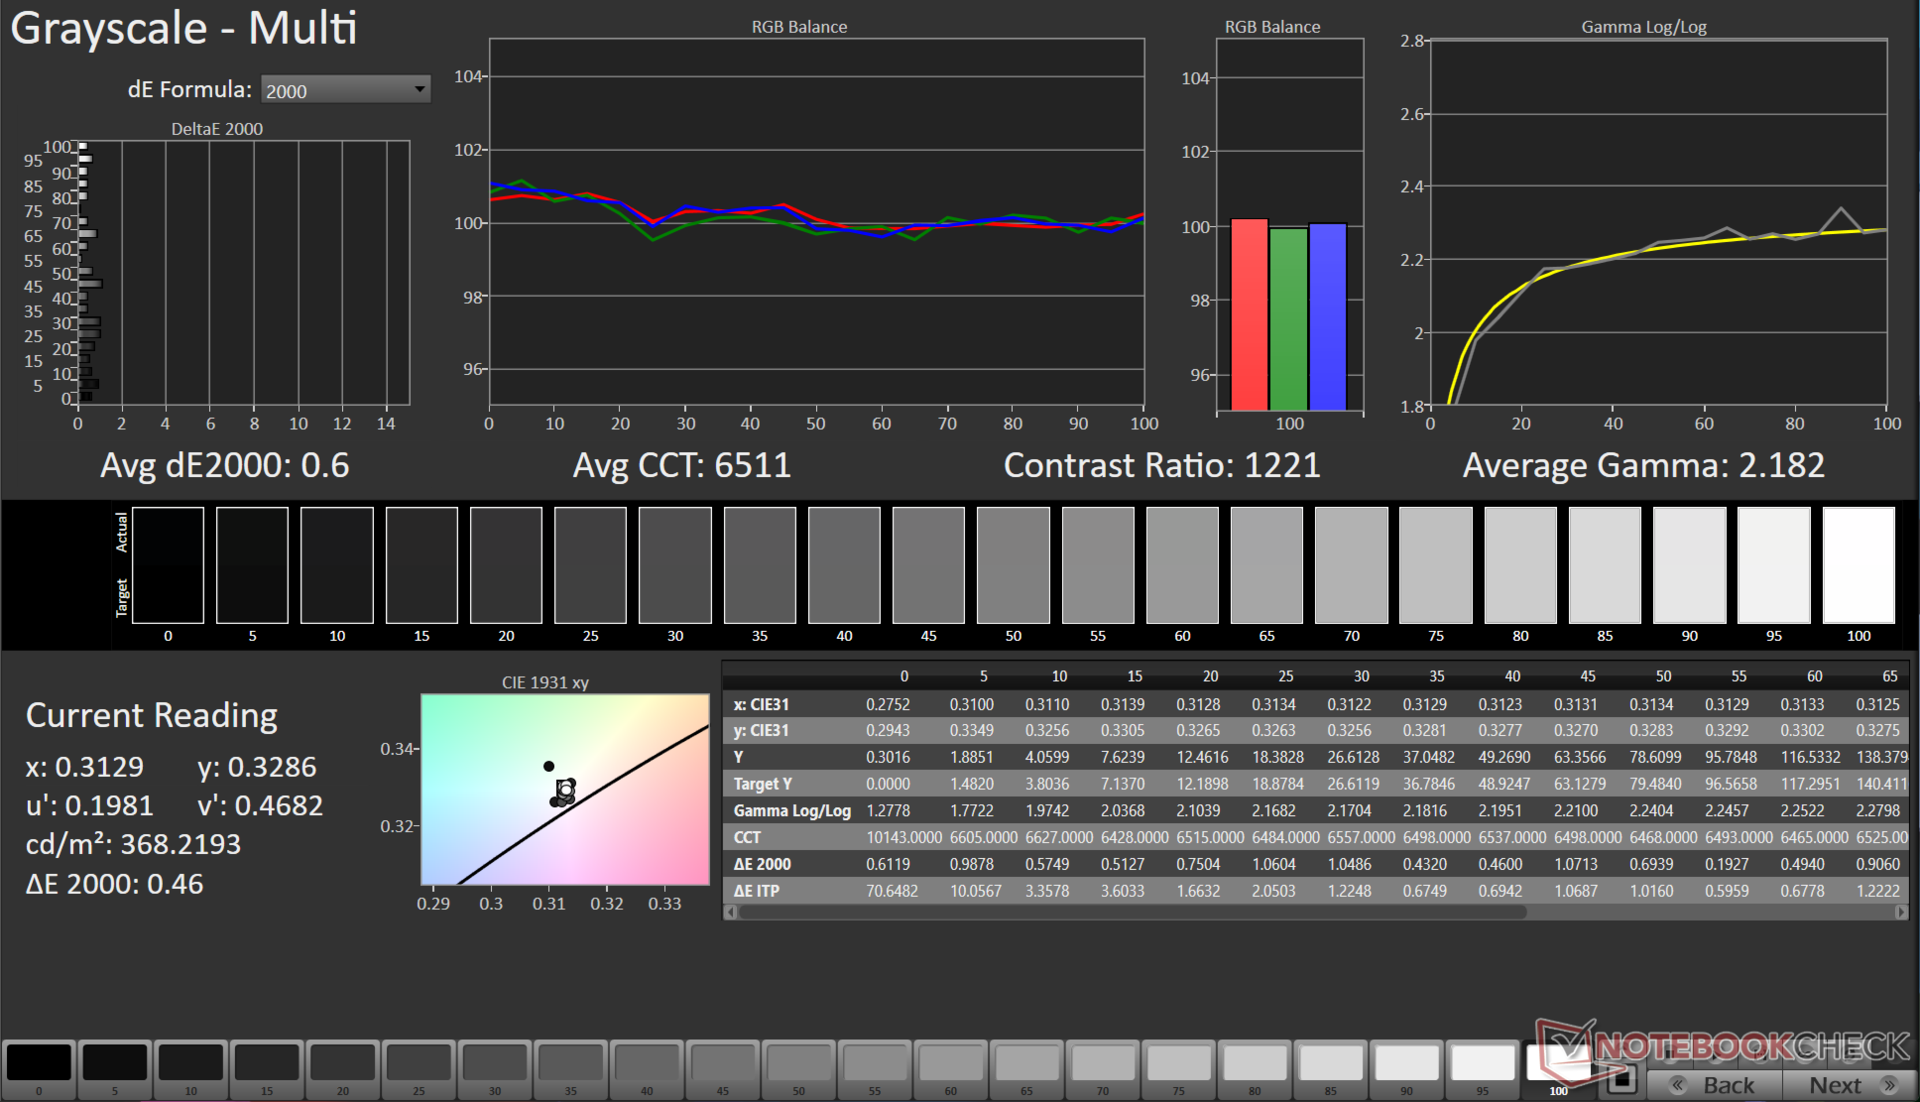
ΔE Greyscale Calman: 4.5 | ∀{0.09-98 Ø4.97}
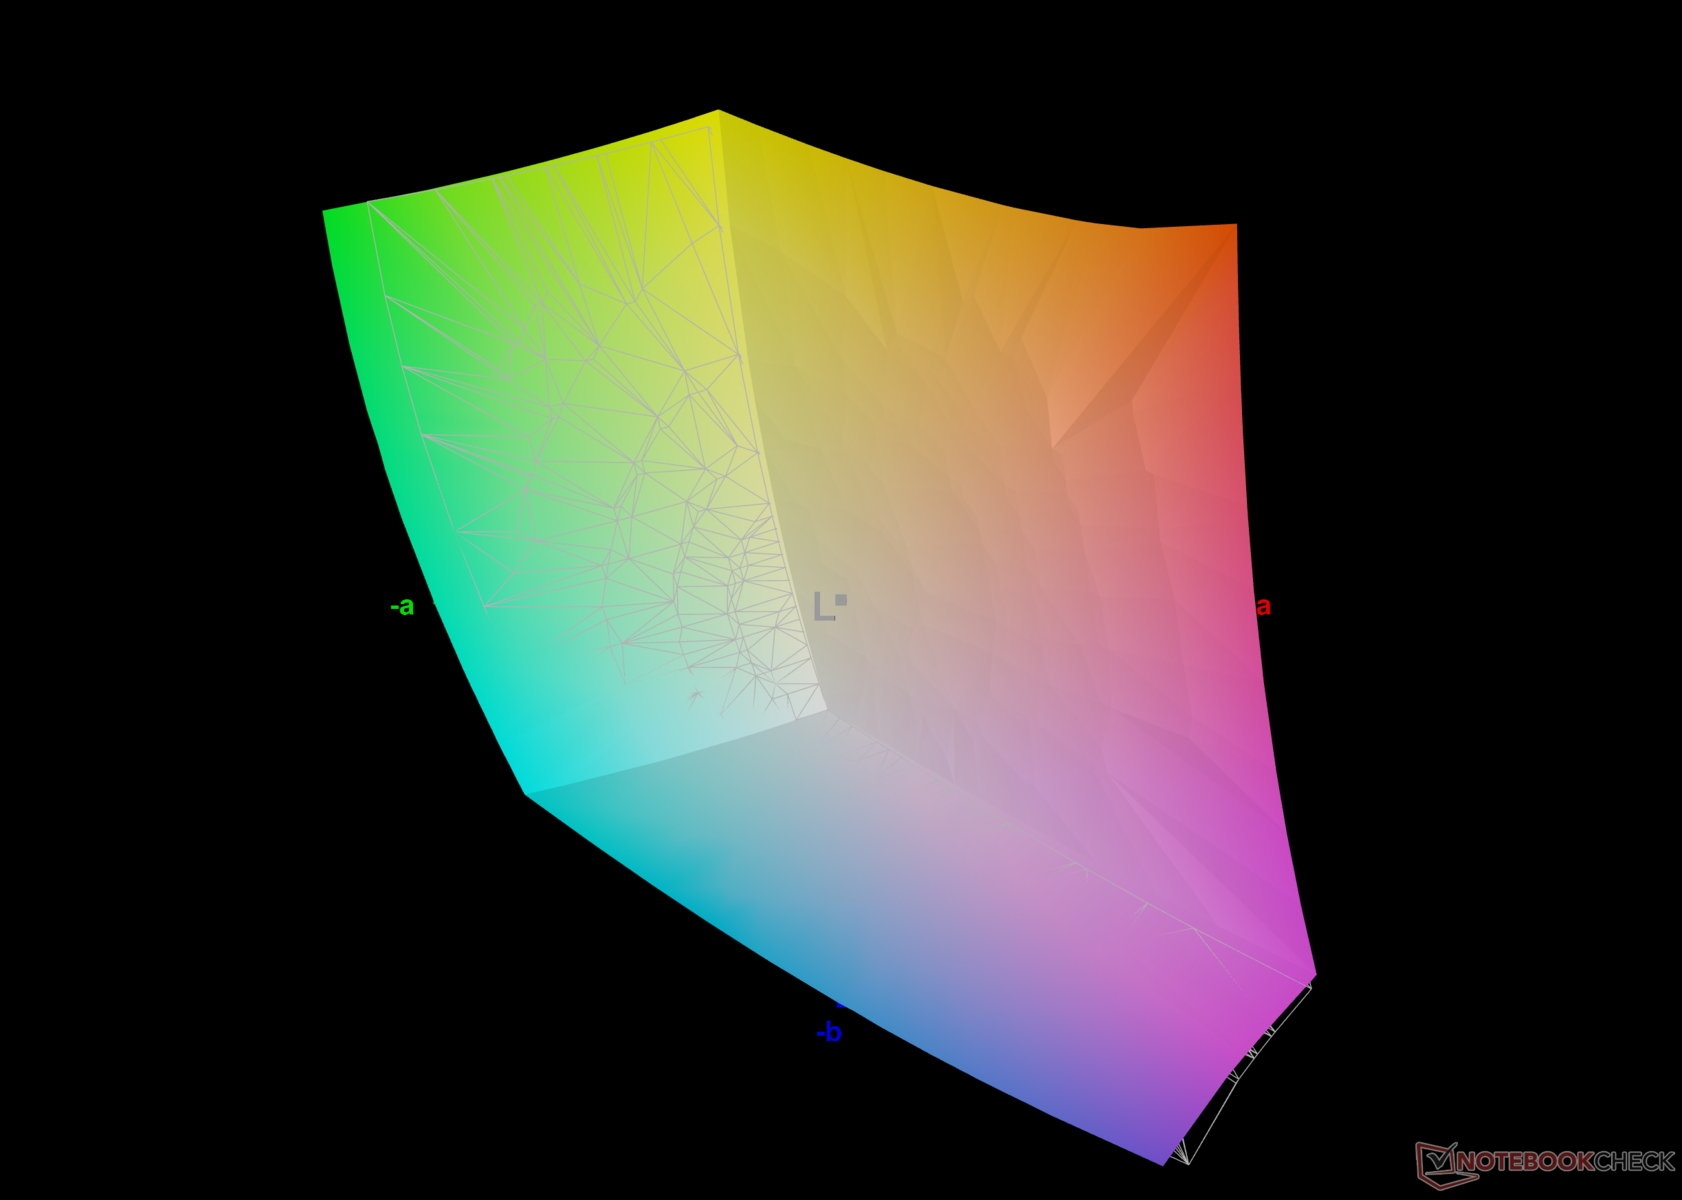
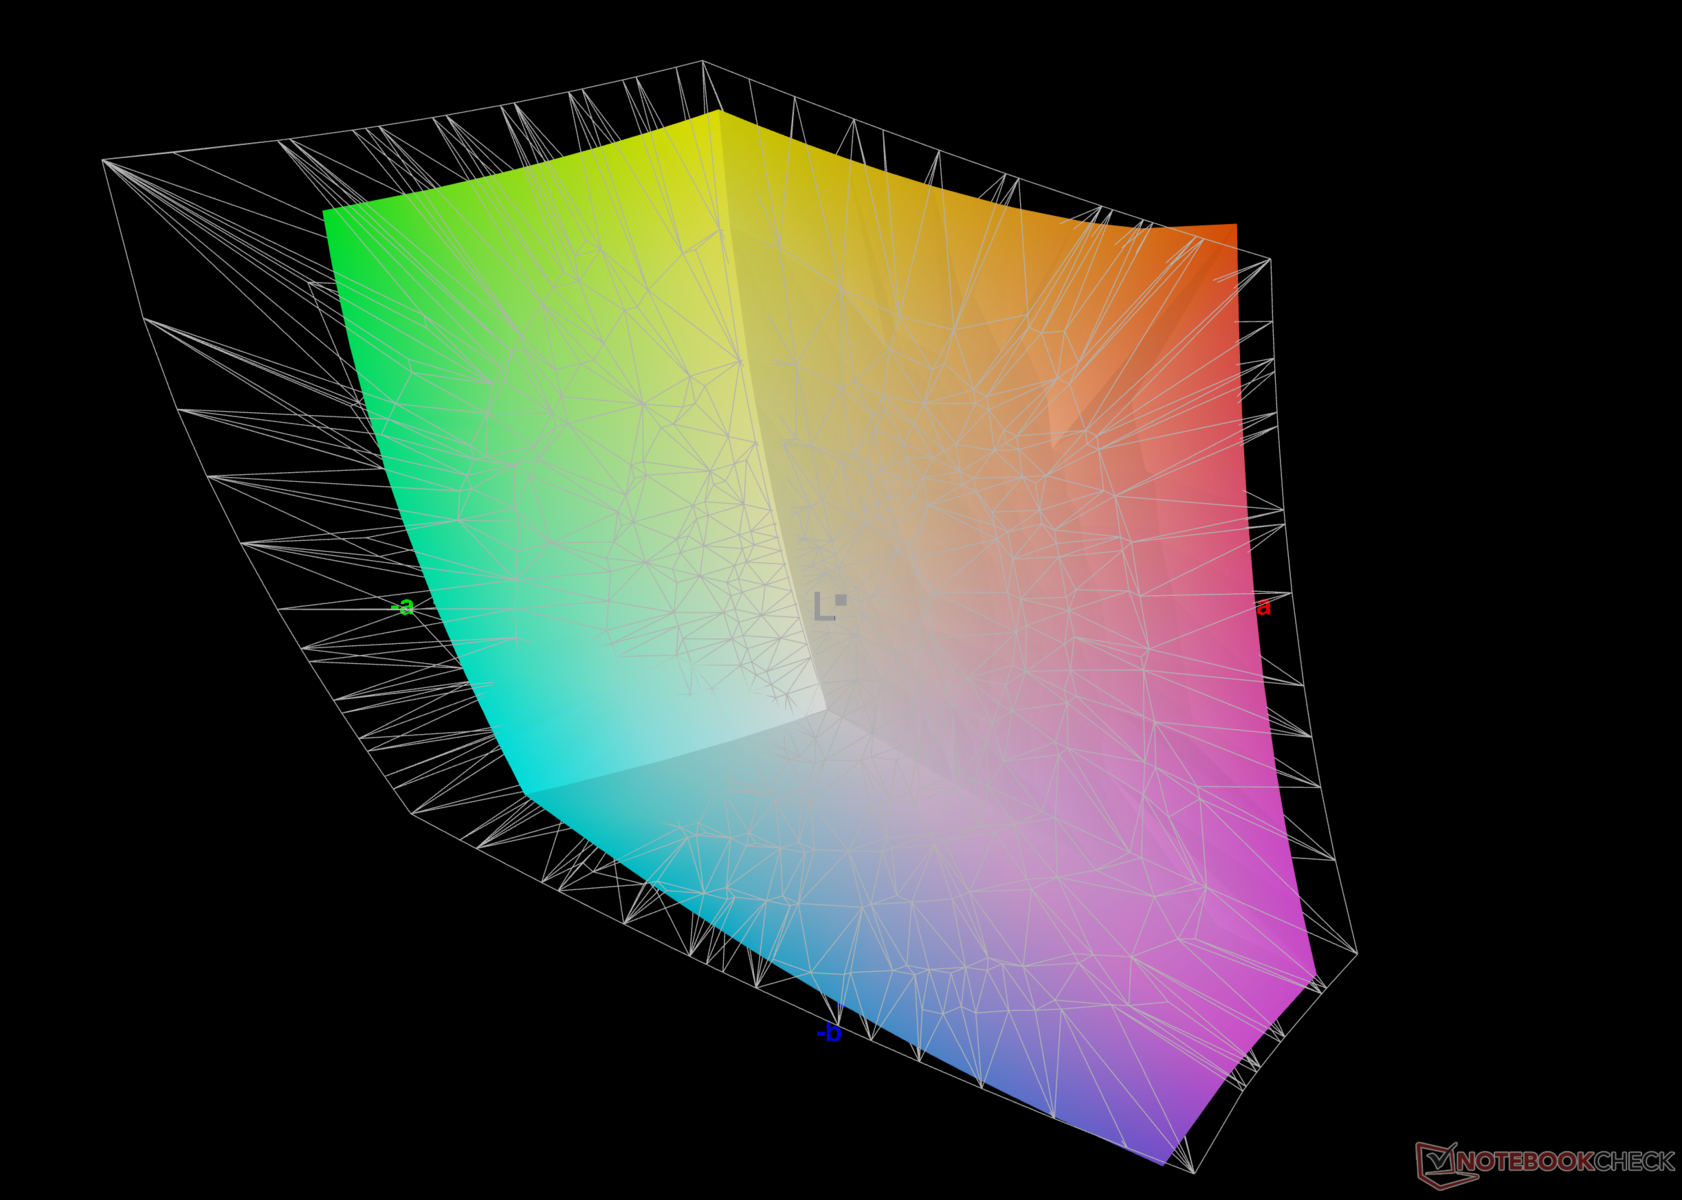
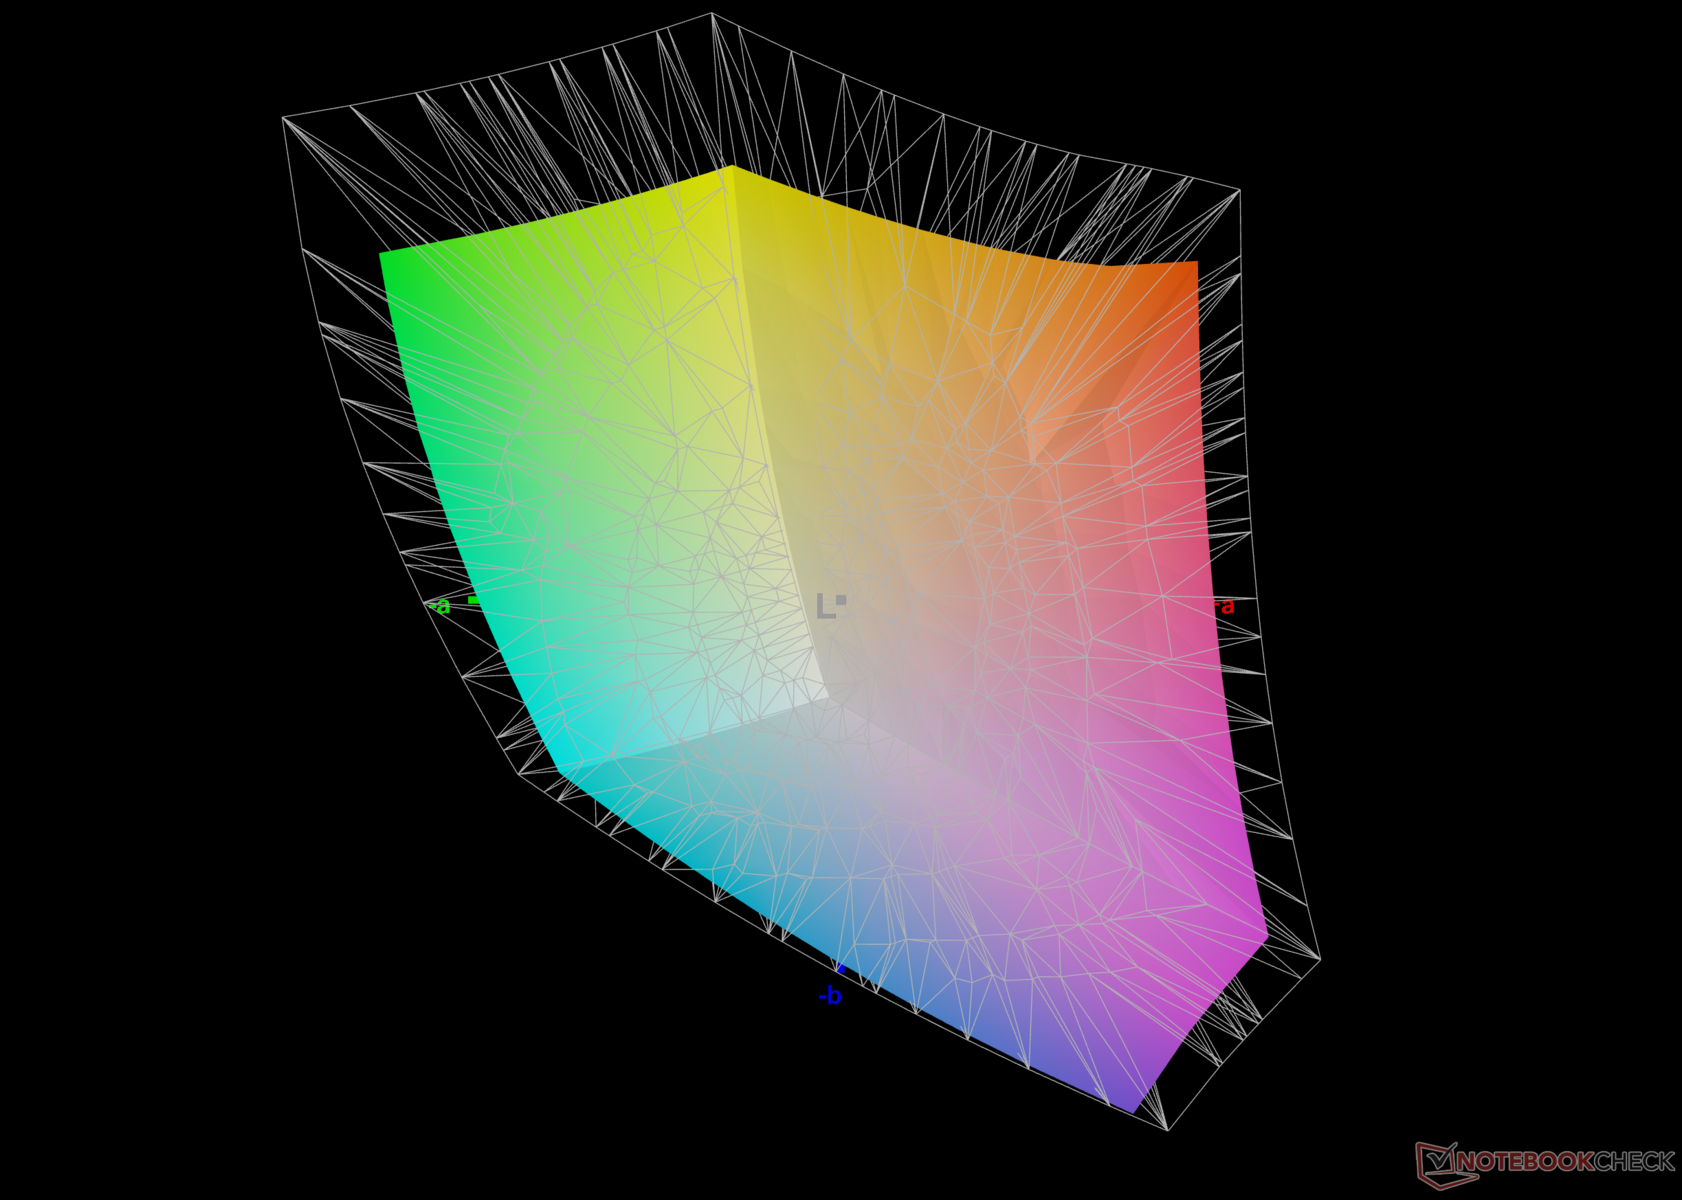
76.5% AdobeRGB 1998 (Argyll 3D)
99% sRGB (Argyll 3D)
74.6% Display P3 (Argyll 3D)
Gamma: 2.18
CCT: 6261 K
| HP Pavilion Plus 16-ab0456tx AU Optronics AUOFDA4, IPS, 2560x1600, 16" | Schenker Vision 14 2023 CSOT T3 MNE007ZA1-3, IPS, 2880x1800, 14" | Dell Inspiron 16 Plus 7630 LG Philips 160WQ2, IPS, 2560x1600, 16" | Asus VivoBook 14X K3405 Samsung ATNA40YK07-1, , 2880x1800, 14" | Lenovo Slim Pro 7 14ARP8 LEN89C1, IPS, 2560x1600, 14.5" | Asus VivoBook Pro 16 K6602VU Samsung ATNA60BX01-1, OLED, 3200x2000, 16" | Samsung Galaxy Book3 Ultra 16 Samsung ATNA60CL03-0, AMOLED, 2880x1800, 16" | |
|---|---|---|---|---|---|---|---|
| Display | 0% | -3% | 20% | -2% | 20% | 20% | |
| Display P3 Coverage (%) | 74.6 | 74.7 0% | 70.1 -6% | 99.9 34% | 72.9 -2% | 98.7 32% | 99.9 34% |
| sRGB Coverage (%) | 99 | 99.6 1% | 99.6 1% | 100 1% | 98.2 -1% | 99.7 1% | 100 1% |
| AdobeRGB 1998 Coverage (%) | 76.5 | 75.8 -1% | 72.3 -5% | 96.5 26% | 74.6 -2% | 96.5 26% | 96.3 26% |
| Response Times | -193% | -274% | -14% | -220% | -3% | 93% | |
| Response Time Grey 50% / Grey 80% * (ms) | 9.06 ? | 32.2 ? -255% | 35 ? -286% | 1.15 ? 87% | 31.8 ? -251% | 0.68 ? 92% | 0.49 ? 95% |
| Response Time Black / White * (ms) | 6.7 ? | 15.4 ? -130% | 24.2 ? -261% | 14.4 ? -115% | 19.3 ? -188% | 13.2 ? -97% | 0.65 ? 90% |
| PWM Frequency (Hz) | 90.02 ? | 240 ? | 240 ? | ||||
| Screen | 21% | 1% | 5% | 3% | -10% | 135% | |
| Brightness middle (cd/m²) | 403 | 402 0% | 299.4 -26% | 369 -8% | 344.7 -14% | 353 -12% | 400 -1% |
| Brightness (cd/m²) | 394 | 371 -6% | 290 -26% | 364 -8% | 334 -15% | 354 -10% | 399 1% |
| Brightness Distribution (%) | 90 | 86 -4% | 92 2% | 85 -6% | 92 2% | 98 9% | 93 3% |
| Black Level * (cd/m²) | 0.34 | 0.27 21% | 0.21 38% | 0.31 9% | 0.03 91% | ||
| Contrast (:1) | 1185 | 1489 26% | 1426 20% | 1112 -6% | 13333 1025% | ||
| Colorchecker dE 2000 * | 3.13 | 1.8 42% | 4.25 -36% | 2.85 9% | 3.01 4% | 4.23 -35% | 2.3 27% |
| Colorchecker dE 2000 max. * | 6.14 | 3.6 41% | 6.71 -9% | 4.22 31% | 6.3 -3% | 7.13 -16% | 4.15 32% |
| Colorchecker dE 2000 calibrated * | 1.65 | 1.5 9% | 0.52 68% | 2.18 -32% | 0.83 50% | 2.42 -47% | 1.66 -1% |
| Greyscale dE 2000 * | 4.5 | 1.8 60% | 5.5 -22% | 2.2 51% | 4.6 -2% | 2.5 44% | 2.7 40% |
| Gamma | 2.18 101% | 2.27 97% | 2.35 94% | 2.15 102% | 2.28 96% | 2.4 92% | 2.266 97% |
| CCT | 6261 104% | 6695 97% | 6368 102% | 6518 100% | 6420 101% | 6642 98% | 7047 92% |
| Moyenne finale (programmes/paramètres) | -57% /
-14% | -92% /
-39% | 4% /
6% | -73% /
-30% | 2% /
-1% | 83% /
105% |
* ... Moindre est la valeur, meilleures sont les performances
L'écran couvre 99% de l'espace colorimétrique sRGB tout en offrant une reproduction décente des couleurs Adobe RGB et Display P3. L'écran Pavilion Plus 16 convient donc à la consommation multimédia générale et aux flux de travail d'édition de base, en particulier pour le contenu web.
En utilisant le spectrophotomètre X-Rite i1Basic Pro 3 et le logiciel Calman Ultimate de Portrait Displays, nous avons pu améliorer les valeurs moyennes des niveaux de gris et du ColorChecker Delta E 2000 de 4,5 à 0,6 et de 3,13 à 1,65, respectivement.
Notre fichier calibré peut être téléchargé à partir du lien ci-dessus.
Temps de réponse de l'écran
| ↔ Temps de réponse noir à blanc | ||
|---|---|---|
| 6.7 ms ... hausse ↗ et chute ↘ combinées | ↗ 3.6 ms hausse | 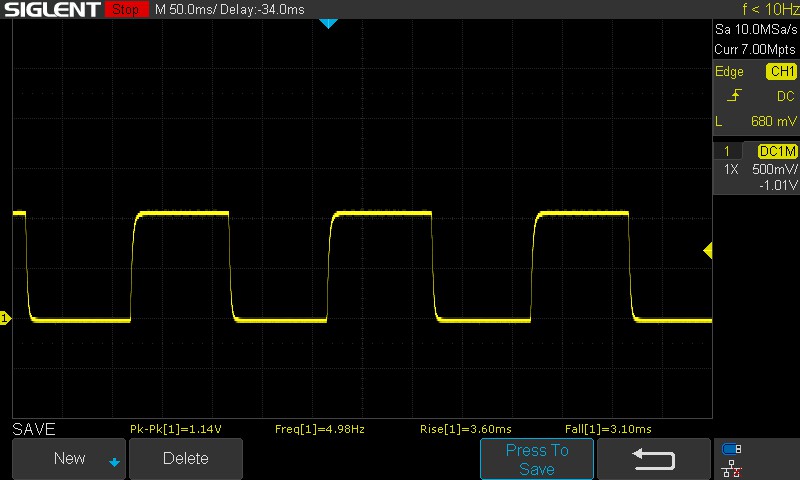 |
| ↘ 3.1 ms chute | ||
| L'écran montre de très faibles temps de réponse, parfait pour le jeu. En comparaison, tous les appareils testés affichent entre 0.1 (minimum) et 240 (maximum) ms. » 21 % des appareils testés affichent de meilleures performances. Cela signifie que les latences relevées sont meilleures que la moyenne (19.9 ms) de tous les appareils testés. | ||
| ↔ Temps de réponse gris 50% à gris 80% | ||
| 9.06 ms ... hausse ↗ et chute ↘ combinées | ↗ 4.27 ms hausse | 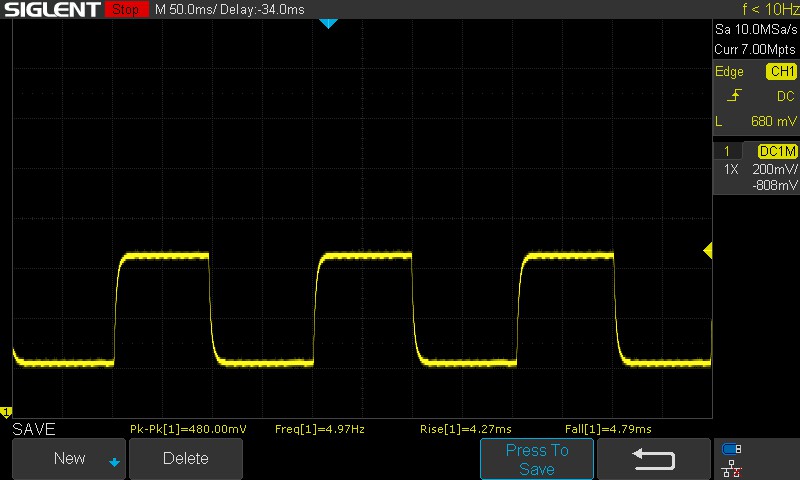 |
| ↘ 4.79 ms chute | ||
| L'écran montre de faibles temps de réponse, un bon écran pour jouer. En comparaison, tous les appareils testés affichent entre 0.165 (minimum) et 636 (maximum) ms. » 22 % des appareils testés affichent de meilleures performances. Cela signifie que les latences relevées sont meilleures que la moyenne (31.1 ms) de tous les appareils testés. | ||
Scintillement / MLI (Modulation de largeur d'impulsion)
| Scintillement / MLI (Modulation de largeur d'impulsion) non décelé | ≤ 100 Niveau de luminosité | 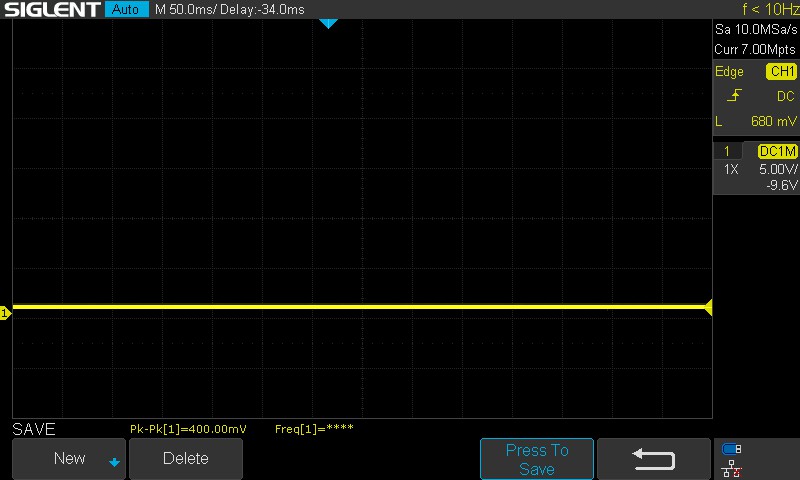 | |
En comparaison, 52 % des appareils testés n'emploient pas MDI pour assombrir leur écran. Nous avons relevé une moyenne à 7810 (minimum : 5 - maximum : 343500) Hz dans le cas où une MDI était active. | |||
Les temps de réponse sont corrects étant donné que le Pavilion Plus 16 n'est pas destiné aux joueurs. Nous n'avons observé aucun PWM à tous les niveaux de luminosité testés, ce qui est une bonne chose.
Pour plus d'informations, consultez notre article "Why PWM is such a headache". Notre tableau de classement PWM PWM Ranking - Notebooks, Smartphones, and Tablets with PWM fournit une vue d'ensemble des PWM mesurés sur les appareils examinés.
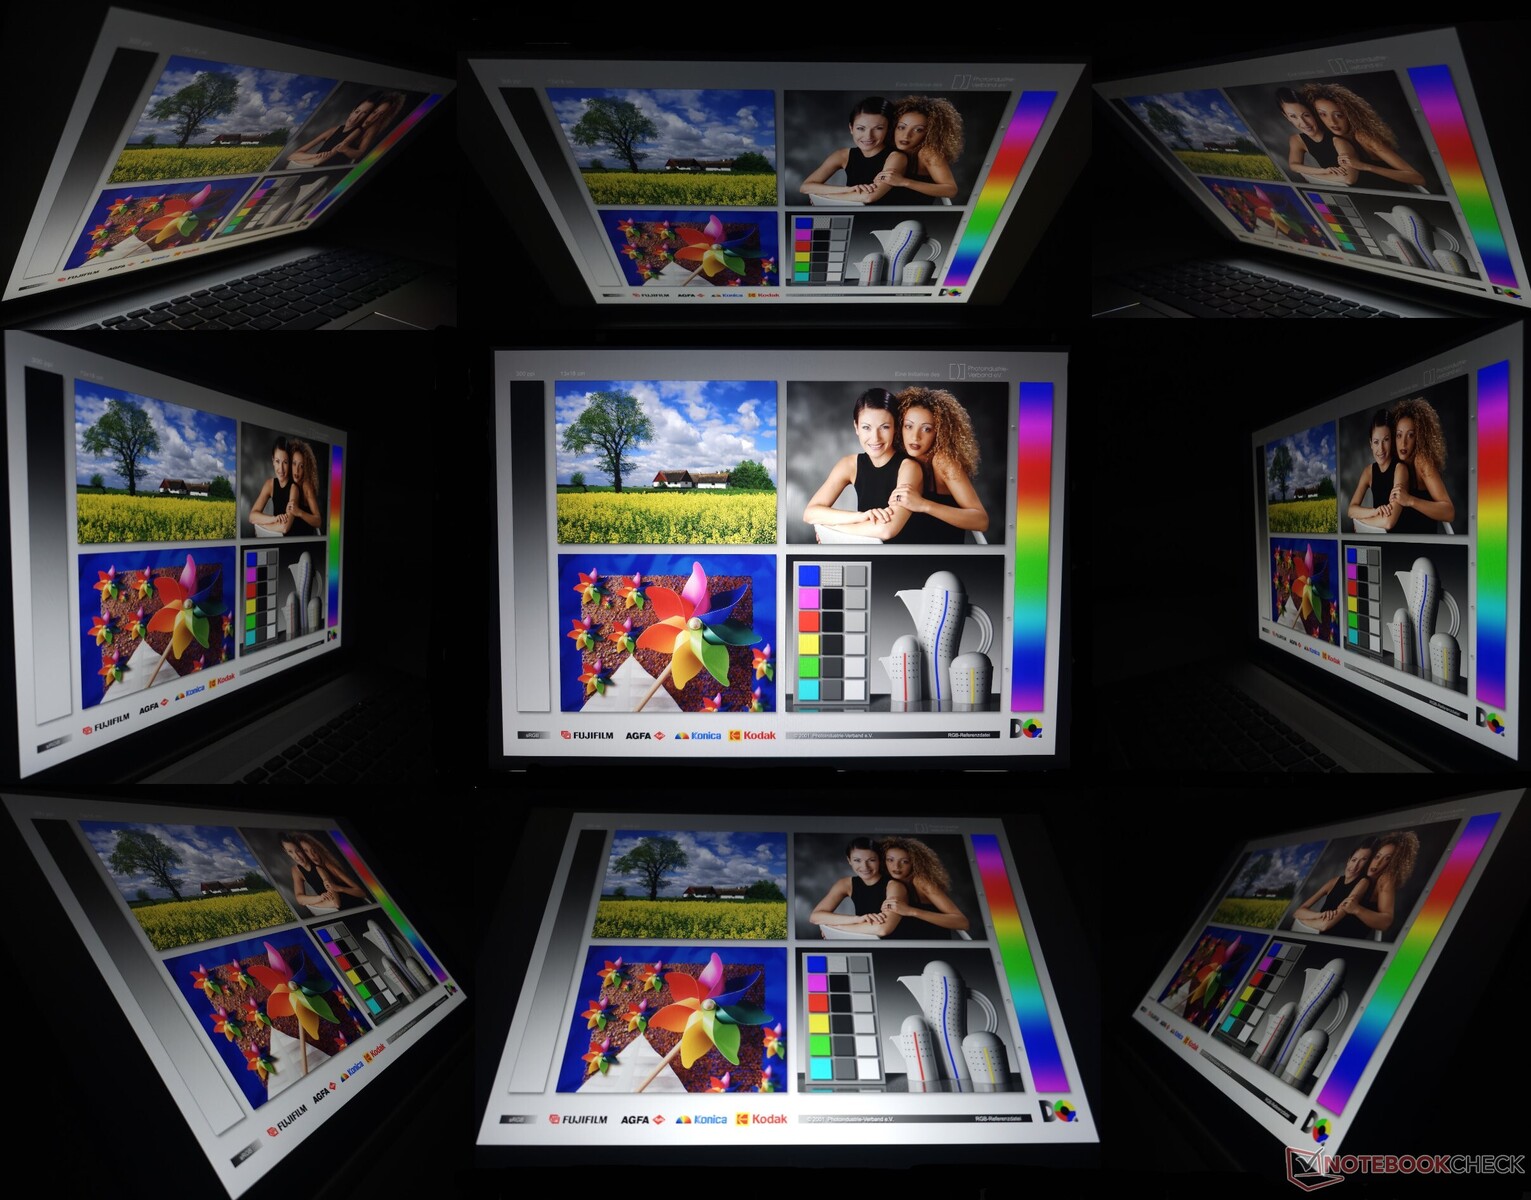
En extérieur, l'affichage est généralement satisfaisant à la luminosité maximale, tant qu'il n'y a pas de lumière directe du soleil sur l'écran. Les angles de vision sont stables, mais nous avons observé une perte de luminosité et de couleurs aux extrêmes.
Performances : Core i7-13700H limité par un faible PL2
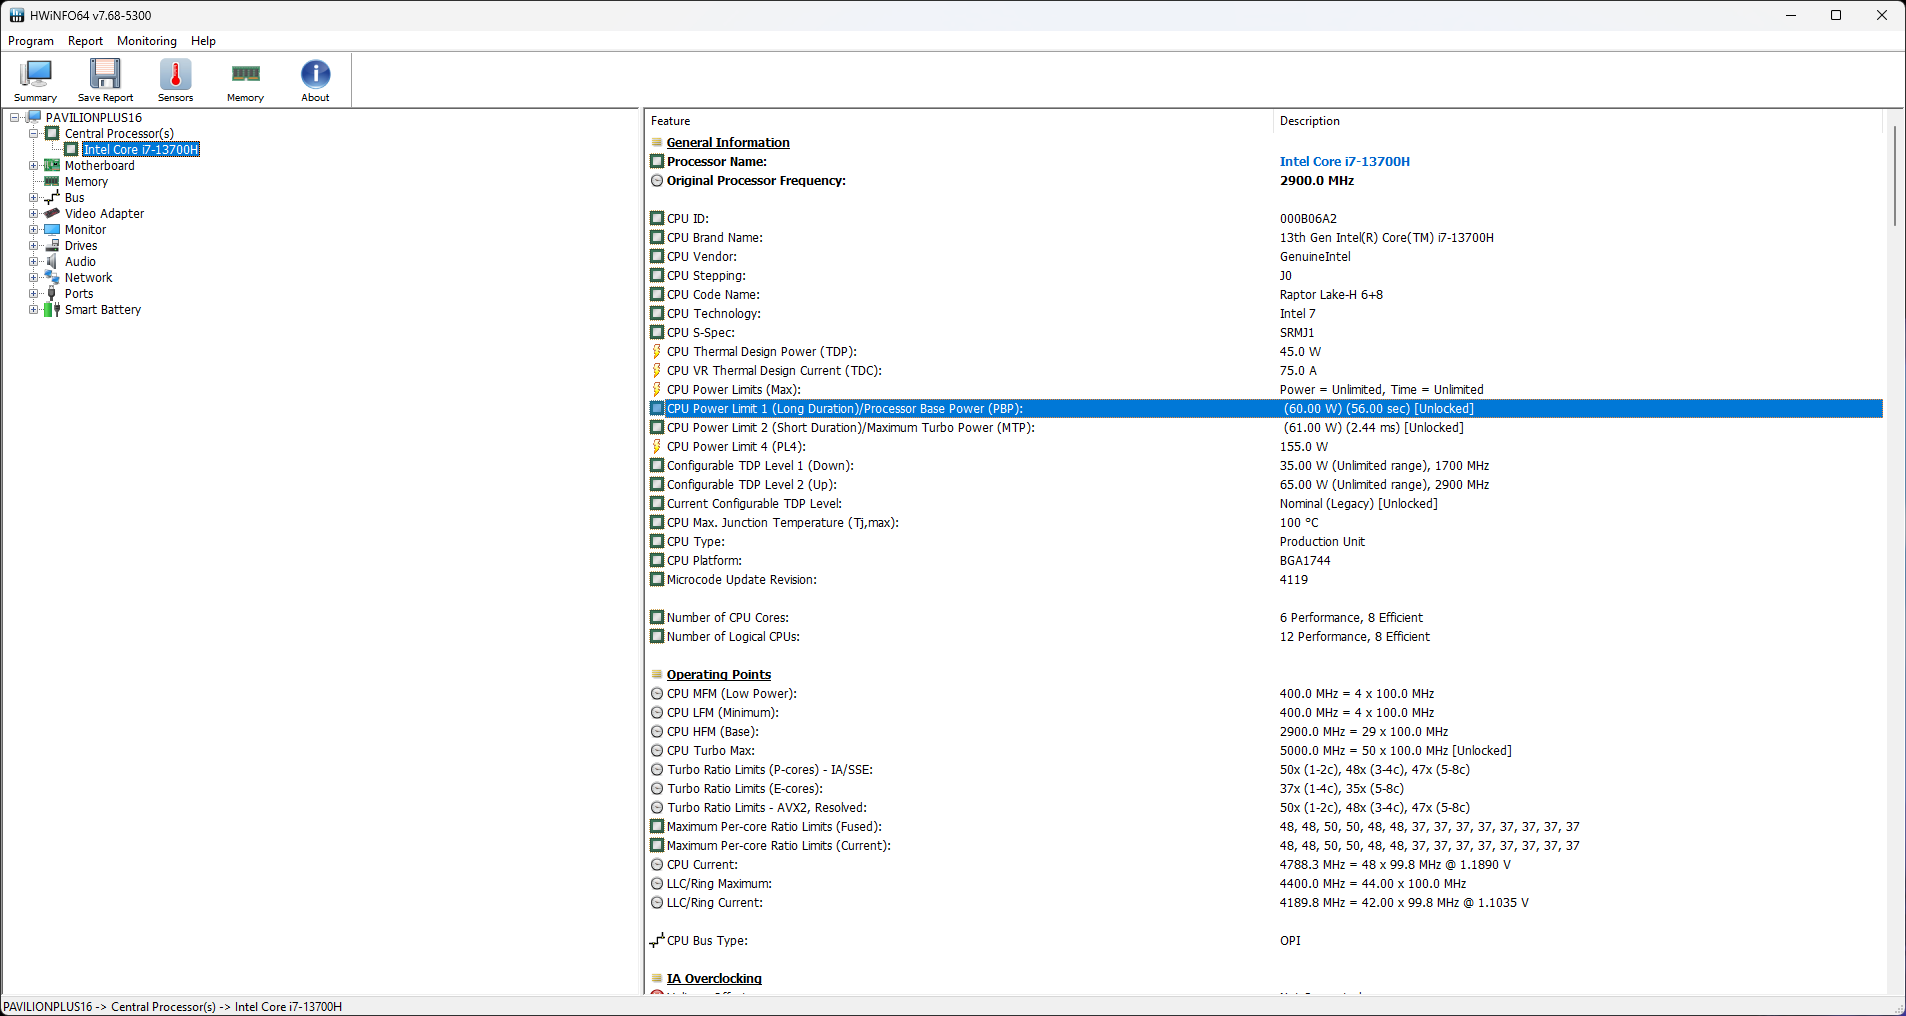
Selon la région, HP propose le modèle Pavilion Plus 16 pouces Core i5-13500H et Core i7-13700H avec des cartes graphiques RTX 3050 de 6 Go en option.
Conditions d'essai
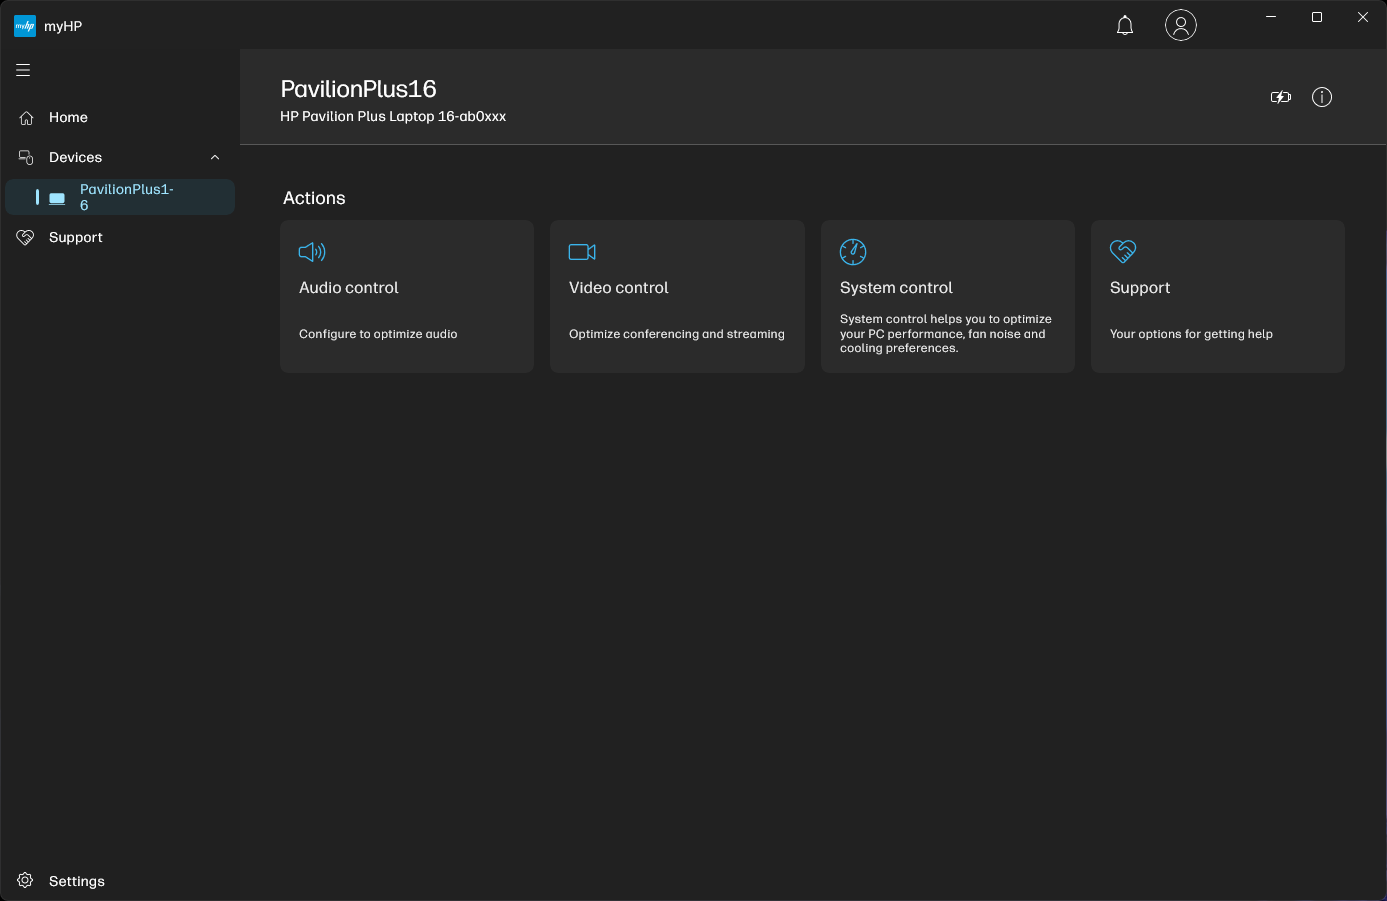
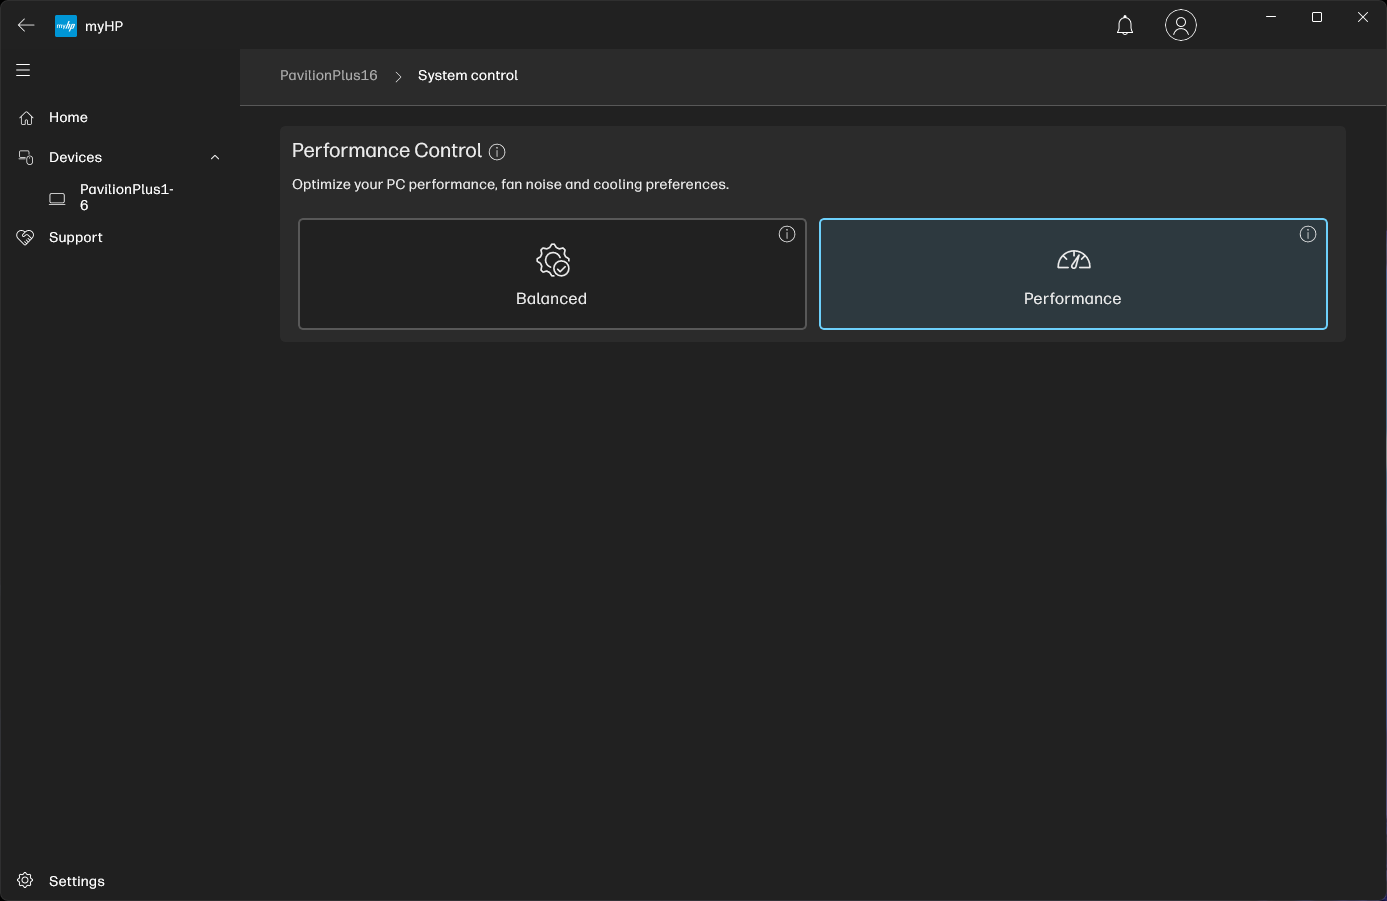
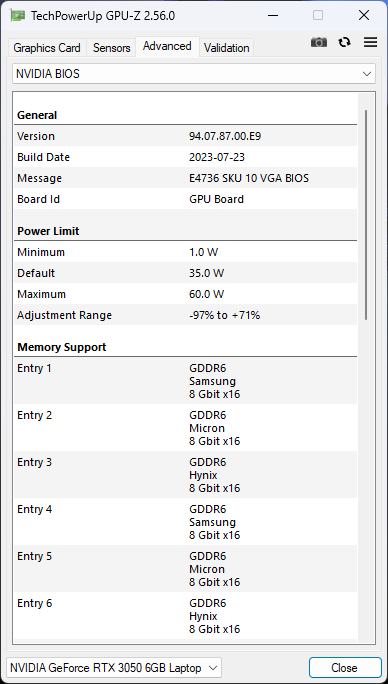
L'application myHP permet aux utilisateurs de choisir entre deux modes de fonctionnement : Équilibré et Performance. Le mode équilibré utilise un PL1 de 50 W, qui passe à 60 W en mode Performance. Le PL2 dans ces deux modes est plafonné à 61 W.
Le GPU RTX 3050 6 Go fonctionne en mode MSHybrid / Optimus par défaut, sans possibilité de commutation MUX.
Nous avons utilisé le mode Performance pour tous les benchmarks. Le PL1/PL2 tombe à 35 W / 35 W sur batterie.
Processeur
Le Core i7-13700H du Pavilion Plus 16 est handicapé par une faible valeur PL2. Cela devient particulièrement évident dans les benchmarks multicœurs, où il est nettement moins performant que les modèles suivants Dell Inspiron 16 Plus 7630 qui dispose d'un Core i7-13700H de 89 W PL2.
Ceci étant dit, le refroidissement du Pavilion Plus 16 semble être très efficace pour assurer des performances soutenues lors de notre test en boucle multi-cœur Cinebench R15.
Le Pavilion Plus 16 est en tête de la plupart des classements de CPU à cœur unique, mais le Plus 16 est en tête de la plupart des classements de CPU à cœur unique Schenker Vision 14 M23 le talonne dans ces tests.
Cinebench R15 Multi Loop
Cinebench R23: Multi Core | Single Core
Cinebench R20: CPU (Multi Core) | CPU (Single Core)
Cinebench R15: CPU Multi 64Bit | CPU Single 64Bit
Blender: v2.79 BMW27 CPU
7-Zip 18.03: 7z b 4 | 7z b 4 -mmt1
Geekbench 6.6: Multi-Core | Single-Core
Geekbench 5.5: Multi-Core | Single-Core
HWBOT x265 Benchmark v2.2: 4k Preset
LibreOffice : 20 Documents To PDF
R Benchmark 2.5: Overall mean
| CPU Performance rating | |
| Moyenne de la classe Multimedia | |
| Dell Inspiron 16 Plus 7630 | |
| Moyenne Intel Core i7-13700H | |
| HP Pavilion Plus 16-ab0456tx | |
| Asus VivoBook Pro 16 K6602VU | |
| Samsung Galaxy Book3 Ultra 16 -2! | |
| Schenker Vision 14 M23 RTX 3050 | |
| Asus VivoBook 14X K3405 -2! | |
| Lenovo Slim Pro 7 14ARP8 -2! | |
| Cinebench R23 / Multi Core | |
| Moyenne de la classe Multimedia (4861 - 33362, n=81, 2 dernières années) | |
| Dell Inspiron 16 Plus 7630 | |
| Samsung Galaxy Book3 Ultra 16 | |
| Moyenne Intel Core i7-13700H (5890 - 20034, n=29) | |
| Asus VivoBook Pro 16 K6602VU | |
| Asus VivoBook 14X K3405 | |
| Schenker Vision 14 M23 RTX 3050 | |
| Lenovo Slim Pro 7 14ARP8 | |
| HP Pavilion Plus 16-ab0456tx | |
| Cinebench R23 / Single Core | |
| Moyenne de la classe Multimedia (1128 - 2459, n=73, 2 dernières années) | |
| HP Pavilion Plus 16-ab0456tx | |
| Schenker Vision 14 M23 RTX 3050 | |
| Dell Inspiron 16 Plus 7630 | |
| Moyenne Intel Core i7-13700H (1323 - 1914, n=29) | |
| Asus VivoBook Pro 16 K6602VU | |
| Asus VivoBook 14X K3405 | |
| Samsung Galaxy Book3 Ultra 16 | |
| Lenovo Slim Pro 7 14ARP8 | |
| Cinebench R20 / CPU (Multi Core) | |
| Moyenne de la classe Multimedia (1887 - 12912, n=64, 2 dernières années) | |
| Dell Inspiron 16 Plus 7630 | |
| Samsung Galaxy Book3 Ultra 16 | |
| Moyenne Intel Core i7-13700H (2322 - 7674, n=29) | |
| HP Pavilion Plus 16-ab0456tx | |
| Asus VivoBook Pro 16 K6602VU | |
| Asus VivoBook 14X K3405 | |
| Schenker Vision 14 M23 RTX 3050 | |
| Lenovo Slim Pro 7 14ARP8 | |
| Cinebench R20 / CPU (Single Core) | |
| HP Pavilion Plus 16-ab0456tx | |
| Schenker Vision 14 M23 RTX 3050 | |
| Dell Inspiron 16 Plus 7630 | |
| Moyenne de la classe Multimedia (425 - 853, n=64, 2 dernières années) | |
| Moyenne Intel Core i7-13700H (508 - 741, n=29) | |
| Asus VivoBook Pro 16 K6602VU | |
| Asus VivoBook 14X K3405 | |
| Samsung Galaxy Book3 Ultra 16 | |
| Lenovo Slim Pro 7 14ARP8 | |
| Cinebench R15 / CPU Multi 64Bit | |
| Moyenne de la classe Multimedia (856 - 5224, n=68, 2 dernières années) | |
| Samsung Galaxy Book3 Ultra 16 | |
| Asus VivoBook Pro 16 K6602VU | |
| Dell Inspiron 16 Plus 7630 | |
| Moyenne Intel Core i7-13700H (905 - 2982, n=29) | |
| Asus VivoBook 14X K3405 | |
| HP Pavilion Plus 16-ab0456tx | |
| Lenovo Slim Pro 7 14ARP8 | |
| Schenker Vision 14 M23 RTX 3050 | |
| Cinebench R15 / CPU Single 64Bit | |
| Moyenne de la classe Multimedia (184.8 - 326, n=66, 2 dernières années) | |
| HP Pavilion Plus 16-ab0456tx | |
| Schenker Vision 14 M23 RTX 3050 | |
| Dell Inspiron 16 Plus 7630 | |
| Moyenne Intel Core i7-13700H (213 - 278, n=29) | |
| Asus VivoBook Pro 16 K6602VU | |
| Asus VivoBook 14X K3405 | |
| Samsung Galaxy Book3 Ultra 16 | |
| Lenovo Slim Pro 7 14ARP8 | |
| Blender / v2.79 BMW27 CPU | |
| Schenker Vision 14 M23 RTX 3050 | |
| Moyenne de la classe Multimedia (100 - 557, n=65, 2 dernières années) | |
| Lenovo Slim Pro 7 14ARP8 | |
| Asus VivoBook 14X K3405 | |
| Moyenne Intel Core i7-13700H (169 - 555, n=29) | |
| Samsung Galaxy Book3 Ultra 16 | |
| Dell Inspiron 16 Plus 7630 | |
| HP Pavilion Plus 16-ab0456tx | |
| Asus VivoBook Pro 16 K6602VU | |
| 7-Zip 18.03 / 7z b 4 | |
| Asus VivoBook Pro 16 K6602VU | |
| HP Pavilion Plus 16-ab0456tx | |
| Samsung Galaxy Book3 Ultra 16 | |
| Moyenne Intel Core i7-13700H (27322 - 76344, n=29) | |
| Dell Inspiron 16 Plus 7630 | |
| Moyenne de la classe Multimedia (29095 - 130368, n=62, 2 dernières années) | |
| Lenovo Slim Pro 7 14ARP8 | |
| Schenker Vision 14 M23 RTX 3050 | |
| Asus VivoBook 14X K3405 | |
| 7-Zip 18.03 / 7z b 4 -mmt1 | |
| Schenker Vision 14 M23 RTX 3050 | |
| HP Pavilion Plus 16-ab0456tx | |
| Moyenne de la classe Multimedia (3666 - 7545, n=63, 2 dernières années) | |
| Moyenne Intel Core i7-13700H (4825 - 6238, n=29) | |
| Asus VivoBook Pro 16 K6602VU | |
| Dell Inspiron 16 Plus 7630 | |
| Asus VivoBook 14X K3405 | |
| Samsung Galaxy Book3 Ultra 16 | |
| Lenovo Slim Pro 7 14ARP8 | |
| Geekbench 6.6 / Multi-Core | |
| Moyenne de la classe Multimedia (4983 - 29415, n=76, 2 dernières années) | |
| Dell Inspiron 16 Plus 7630 | |
| HP Pavilion Plus 16-ab0456tx | |
| Schenker Vision 14 M23 RTX 3050 | |
| Moyenne Intel Core i7-13700H (8415 - 13832, n=13) | |
| Asus VivoBook Pro 16 K6602VU | |
| Geekbench 6.6 / Single-Core | |
| Moyenne de la classe Multimedia (1534 - 4335, n=75, 2 dernières années) | |
| Schenker Vision 14 M23 RTX 3050 | |
| Dell Inspiron 16 Plus 7630 | |
| HP Pavilion Plus 16-ab0456tx | |
| Moyenne Intel Core i7-13700H (2316 - 2639, n=13) | |
| Asus VivoBook Pro 16 K6602VU | |
| Geekbench 5.5 / Multi-Core | |
| Moyenne de la classe Multimedia (4652 - 20422, n=62, 2 dernières années) | |
| Dell Inspiron 16 Plus 7630 | |
| Moyenne Intel Core i7-13700H (6165 - 14215, n=29) | |
| Samsung Galaxy Book3 Ultra 16 | |
| HP Pavilion Plus 16-ab0456tx | |
| Schenker Vision 14 M23 RTX 3050 | |
| Asus VivoBook Pro 16 K6602VU | |
| Asus VivoBook 14X K3405 | |
| Lenovo Slim Pro 7 14ARP8 | |
| Geekbench 5.5 / Single-Core | |
| Moyenne de la classe Multimedia (805 - 2974, n=62, 2 dernières années) | |
| Dell Inspiron 16 Plus 7630 | |
| Schenker Vision 14 M23 RTX 3050 | |
| HP Pavilion Plus 16-ab0456tx | |
| Moyenne Intel Core i7-13700H (1362 - 1919, n=29) | |
| Asus VivoBook Pro 16 K6602VU | |
| Samsung Galaxy Book3 Ultra 16 | |
| Asus VivoBook 14X K3405 | |
| Lenovo Slim Pro 7 14ARP8 | |
| HWBOT x265 Benchmark v2.2 / 4k Preset | |
| Moyenne de la classe Multimedia (5.26 - 36.1, n=63, 2 dernières années) | |
| Samsung Galaxy Book3 Ultra 16 | |
| Asus VivoBook Pro 16 K6602VU | |
| Moyenne Intel Core i7-13700H (6.72 - 21.2, n=29) | |
| HP Pavilion Plus 16-ab0456tx | |
| Lenovo Slim Pro 7 14ARP8 | |
| Dell Inspiron 16 Plus 7630 | |
| Asus VivoBook 14X K3405 | |
| Schenker Vision 14 M23 RTX 3050 | |
| LibreOffice / 20 Documents To PDF | |
| HP Pavilion Plus 16-ab0456tx | |
| Lenovo Slim Pro 7 14ARP8 | |
| Schenker Vision 14 M23 RTX 3050 | |
| Asus VivoBook Pro 16 K6602VU | |
| Moyenne de la classe Multimedia (23.9 - 146.7, n=64, 2 dernières années) | |
| Samsung Galaxy Book3 Ultra 16 | |
| Moyenne Intel Core i7-13700H (31.3 - 62.4, n=29) | |
| Asus VivoBook 14X K3405 | |
| Dell Inspiron 16 Plus 7630 | |
| R Benchmark 2.5 / Overall mean | |
| Lenovo Slim Pro 7 14ARP8 | |
| Asus VivoBook 14X K3405 | |
| Samsung Galaxy Book3 Ultra 16 | |
| Asus VivoBook Pro 16 K6602VU | |
| Moyenne Intel Core i7-13700H (0.4308 - 0.607, n=29) | |
| Moyenne de la classe Multimedia (0.3604 - 0.947, n=63, 2 dernières années) | |
| Schenker Vision 14 M23 RTX 3050 | |
| HP Pavilion Plus 16-ab0456tx | |
| Dell Inspiron 16 Plus 7630 | |
* ... Moindre est la valeur, meilleures sont les performances
AIDA64: FP32 Ray-Trace | FPU Julia | CPU SHA3 | CPU Queen | FPU SinJulia | FPU Mandel | CPU AES | CPU ZLib | FP64 Ray-Trace | CPU PhotoWorxx
| Performance rating | |
| Moyenne de la classe Multimedia | |
| Asus VivoBook Pro 16 K6602VU | |
| Lenovo Slim Pro 7 14ARP8 | |
| HP Pavilion Plus 16-ab0456tx | |
| Samsung Galaxy Book3 Ultra 16 | |
| Moyenne Intel Core i7-13700H | |
| Dell Inspiron 16 Plus 7630 | |
| Asus VivoBook 14X K3405 | |
| Schenker Vision 14 M23 RTX 3050 | |
| AIDA64 / FP32 Ray-Trace | |
| Moyenne de la classe Multimedia (2214 - 50388, n=60, 2 dernières années) | |
| Lenovo Slim Pro 7 14ARP8 | |
| HP Pavilion Plus 16-ab0456tx | |
| Samsung Galaxy Book3 Ultra 16 | |
| Moyenne Intel Core i7-13700H (4986 - 18908, n=29) | |
| Dell Inspiron 16 Plus 7630 | |
| Asus VivoBook Pro 16 K6602VU | |
| Asus VivoBook 14X K3405 | |
| Schenker Vision 14 M23 RTX 3050 | |
| AIDA64 / FPU Julia | |
| Lenovo Slim Pro 7 14ARP8 | |
| Moyenne de la classe Multimedia (12867 - 201874, n=61, 2 dernières années) | |
| HP Pavilion Plus 16-ab0456tx | |
| Asus VivoBook Pro 16 K6602VU | |
| Moyenne Intel Core i7-13700H (25360 - 92359, n=29) | |
| Samsung Galaxy Book3 Ultra 16 | |
| Dell Inspiron 16 Plus 7630 | |
| Asus VivoBook 14X K3405 | |
| Schenker Vision 14 M23 RTX 3050 | |
| AIDA64 / CPU SHA3 | |
| Moyenne de la classe Multimedia (653 - 8623, n=61, 2 dernières années) | |
| Asus VivoBook 14X K3405 | |
| HP Pavilion Plus 16-ab0456tx | |
| Asus VivoBook Pro 16 K6602VU | |
| Samsung Galaxy Book3 Ultra 16 | |
| Moyenne Intel Core i7-13700H (1339 - 4224, n=29) | |
| Lenovo Slim Pro 7 14ARP8 | |
| Dell Inspiron 16 Plus 7630 | |
| Schenker Vision 14 M23 RTX 3050 | |
| AIDA64 / CPU Queen | |
| Dell Inspiron 16 Plus 7630 | |
| Samsung Galaxy Book3 Ultra 16 | |
| HP Pavilion Plus 16-ab0456tx | |
| Moyenne Intel Core i7-13700H (59324 - 107159, n=29) | |
| Asus VivoBook Pro 16 K6602VU | |
| Lenovo Slim Pro 7 14ARP8 | |
| Schenker Vision 14 M23 RTX 3050 | |
| Asus VivoBook 14X K3405 | |
| Moyenne de la classe Multimedia (13483 - 181505, n=49, 2 dernières années) | |
| AIDA64 / FPU SinJulia | |
| Lenovo Slim Pro 7 14ARP8 | |
| HP Pavilion Plus 16-ab0456tx | |
| Moyenne de la classe Multimedia (1240 - 28794, n=61, 2 dernières années) | |
| Samsung Galaxy Book3 Ultra 16 | |
| Dell Inspiron 16 Plus 7630 | |
| Asus VivoBook Pro 16 K6602VU | |
| Moyenne Intel Core i7-13700H (4800 - 11050, n=29) | |
| Schenker Vision 14 M23 RTX 3050 | |
| Asus VivoBook 14X K3405 | |
| AIDA64 / FPU Mandel | |
| Lenovo Slim Pro 7 14ARP8 | |
| Moyenne de la classe Multimedia (6395 - 105740, n=60, 2 dernières années) | |
| HP Pavilion Plus 16-ab0456tx | |
| Samsung Galaxy Book3 Ultra 16 | |
| Moyenne Intel Core i7-13700H (12321 - 45118, n=29) | |
| Asus VivoBook Pro 16 K6602VU | |
| Dell Inspiron 16 Plus 7630 | |
| Asus VivoBook 14X K3405 | |
| Schenker Vision 14 M23 RTX 3050 | |
| AIDA64 / CPU AES | |
| Asus VivoBook Pro 16 K6602VU | |
| Asus VivoBook 14X K3405 | |
| Moyenne Intel Core i7-13700H (28769 - 151254, n=29) | |
| HP Pavilion Plus 16-ab0456tx | |
| Samsung Galaxy Book3 Ultra 16 | |
| Moyenne de la classe Multimedia (13243 - 126790, n=61, 2 dernières années) | |
| Dell Inspiron 16 Plus 7630 | |
| Schenker Vision 14 M23 RTX 3050 | |
| Lenovo Slim Pro 7 14ARP8 | |
| AIDA64 / CPU ZLib | |
| Samsung Galaxy Book3 Ultra 16 | |
| Moyenne de la classe Multimedia (167.2 - 2022, n=61, 2 dernières années) | |
| HP Pavilion Plus 16-ab0456tx | |
| Asus VivoBook Pro 16 K6602VU | |
| Moyenne Intel Core i7-13700H (389 - 1215, n=29) | |
| Asus VivoBook 14X K3405 | |
| Dell Inspiron 16 Plus 7630 | |
| Schenker Vision 14 M23 RTX 3050 | |
| Lenovo Slim Pro 7 14ARP8 | |
| AIDA64 / FP64 Ray-Trace | |
| Moyenne de la classe Multimedia (1014 - 26875, n=61, 2 dernières années) | |
| HP Pavilion Plus 16-ab0456tx | |
| Lenovo Slim Pro 7 14ARP8 | |
| Samsung Galaxy Book3 Ultra 16 | |
| Asus VivoBook Pro 16 K6602VU | |
| Moyenne Intel Core i7-13700H (2540 - 10135, n=29) | |
| Dell Inspiron 16 Plus 7630 | |
| Asus VivoBook 14X K3405 | |
| Schenker Vision 14 M23 RTX 3050 | |
| AIDA64 / CPU PhotoWorxx | |
| Moyenne de la classe Multimedia (12860 - 88154, n=61, 2 dernières années) | |
| Samsung Galaxy Book3 Ultra 16 | |
| Schenker Vision 14 M23 RTX 3050 | |
| HP Pavilion Plus 16-ab0456tx | |
| Moyenne Intel Core i7-13700H (12872 - 52727, n=29) | |
| Asus VivoBook Pro 16 K6602VU | |
| Dell Inspiron 16 Plus 7630 | |
| Lenovo Slim Pro 7 14ARP8 | |
| Asus VivoBook 14X K3405 | |
Consultez notre site dédié Intel Core i7-13700H pour plus de comparaisons de performances.
Performance du système
Le Pavilion Plus 16 parvient à dépasser le VivoBook Pro 16 avec un processeur Core i9-13900H et une RTX 4050 dans l'ensemble des tests CrossMark, mais perd 6% dans PCMark 10.
Sinon, le système est assez réactif pour les tâches quotidiennes de productivité et de navigation sur le web.
CrossMark: Overall | Productivity | Creativity | Responsiveness
AIDA64: Memory Copy | Memory Read | Memory Write | Memory Latency
WebXPRT 3: Overall
WebXPRT 4: Overall
Mozilla Kraken 1.1: Total
| PCMark 10 / Score | |
| Moyenne de la classe Multimedia (4325 - 10386, n=58, 2 dernières années) | |
| Dell Inspiron 16 Plus 7630 | |
| Asus VivoBook Pro 16 K6602VU | |
| Samsung Galaxy Book3 Ultra 16 | |
| Asus VivoBook 14X K3405 | |
| HP Pavilion Plus 16-ab0456tx | |
| Moyenne Intel Core i7-13700H, NVIDIA GeForce RTX 3050 6GB Laptop GPU (6290 - 6597, n=2) | |
| Lenovo Slim Pro 7 14ARP8 | |
| Schenker Vision 14 M23 RTX 3050 | |
| PCMark 10 / Essentials | |
| Dell Inspiron 16 Plus 7630 | |
| Samsung Galaxy Book3 Ultra 16 | |
| Moyenne de la classe Multimedia (8025 - 11664, n=57, 2 dernières années) | |
| Asus VivoBook Pro 16 K6602VU | |
| Asus VivoBook 14X K3405 | |
| HP Pavilion Plus 16-ab0456tx | |
| Moyenne Intel Core i7-13700H, NVIDIA GeForce RTX 3050 6GB Laptop GPU (9943 - 10112, n=2) | |
| Lenovo Slim Pro 7 14ARP8 | |
| Schenker Vision 14 M23 RTX 3050 | |
| PCMark 10 / Productivity | |
| Moyenne de la classe Multimedia (7323 - 18233, n=57, 2 dernières années) | |
| Dell Inspiron 16 Plus 7630 | |
| Asus VivoBook 14X K3405 | |
| Schenker Vision 14 M23 RTX 3050 | |
| Moyenne Intel Core i7-13700H, NVIDIA GeForce RTX 3050 6GB Laptop GPU (8803 - 8950, n=2) | |
| HP Pavilion Plus 16-ab0456tx | |
| Asus VivoBook Pro 16 K6602VU | |
| Samsung Galaxy Book3 Ultra 16 | |
| Lenovo Slim Pro 7 14ARP8 | |
| PCMark 10 / Digital Content Creation | |
| Dell Inspiron 16 Plus 7630 | |
| Asus VivoBook Pro 16 K6602VU | |
| Moyenne de la classe Multimedia (3651 - 16240, n=57, 2 dernières années) | |
| Samsung Galaxy Book3 Ultra 16 | |
| Lenovo Slim Pro 7 14ARP8 | |
| HP Pavilion Plus 16-ab0456tx | |
| Asus VivoBook 14X K3405 | |
| Moyenne Intel Core i7-13700H, NVIDIA GeForce RTX 3050 6GB Laptop GPU (7590 - 8752, n=2) | |
| Schenker Vision 14 M23 RTX 3050 | |
| CrossMark / Overall | |
| Moyenne de la classe Multimedia (866 - 2728, n=67, 2 dernières années) | |
| Dell Inspiron 16 Plus 7630 | |
| HP Pavilion Plus 16-ab0456tx | |
| Asus VivoBook Pro 16 K6602VU | |
| Asus VivoBook 14X K3405 | |
| Moyenne Intel Core i7-13700H, NVIDIA GeForce RTX 3050 6GB Laptop GPU (1504 - 1752, n=2) | |
| Samsung Galaxy Book3 Ultra 16 | |
| Schenker Vision 14 M23 RTX 3050 | |
| Lenovo Slim Pro 7 14ARP8 | |
| CrossMark / Productivity | |
| Dell Inspiron 16 Plus 7630 | |
| Moyenne de la classe Multimedia (931 - 2489, n=67, 2 dernières années) | |
| Asus VivoBook Pro 16 K6602VU | |
| HP Pavilion Plus 16-ab0456tx | |
| Asus VivoBook 14X K3405 | |
| Moyenne Intel Core i7-13700H, NVIDIA GeForce RTX 3050 6GB Laptop GPU (1417 - 1657, n=2) | |
| Samsung Galaxy Book3 Ultra 16 | |
| Schenker Vision 14 M23 RTX 3050 | |
| Lenovo Slim Pro 7 14ARP8 | |
| CrossMark / Creativity | |
| Moyenne de la classe Multimedia (907 - 3465, n=67, 2 dernières années) | |
| Dell Inspiron 16 Plus 7630 | |
| HP Pavilion Plus 16-ab0456tx | |
| Asus VivoBook Pro 16 K6602VU | |
| Moyenne Intel Core i7-13700H, NVIDIA GeForce RTX 3050 6GB Laptop GPU (1711 - 1970, n=2) | |
| Schenker Vision 14 M23 RTX 3050 | |
| Asus VivoBook 14X K3405 | |
| Samsung Galaxy Book3 Ultra 16 | |
| Lenovo Slim Pro 7 14ARP8 | |
| CrossMark / Responsiveness | |
| Dell Inspiron 16 Plus 7630 | |
| Asus VivoBook Pro 16 K6602VU | |
| Moyenne de la classe Multimedia (605 - 2024, n=67, 2 dernières années) | |
| Samsung Galaxy Book3 Ultra 16 | |
| Asus VivoBook 14X K3405 | |
| HP Pavilion Plus 16-ab0456tx | |
| Moyenne Intel Core i7-13700H, NVIDIA GeForce RTX 3050 6GB Laptop GPU (1220 - 1458, n=2) | |
| Schenker Vision 14 M23 RTX 3050 | |
| Lenovo Slim Pro 7 14ARP8 | |
| AIDA64 / Memory Copy | |
| Moyenne de la classe Multimedia (21158 - 132135, n=61, 2 dernières années) | |
| Samsung Galaxy Book3 Ultra 16 | |
| Schenker Vision 14 M23 RTX 3050 | |
| Moyenne Intel Core i7-13700H, NVIDIA GeForce RTX 3050 6GB Laptop GPU (64356 - 65837, n=2) | |
| HP Pavilion Plus 16-ab0456tx | |
| Dell Inspiron 16 Plus 7630 | |
| Asus VivoBook Pro 16 K6602VU | |
| Lenovo Slim Pro 7 14ARP8 | |
| Asus VivoBook 14X K3405 | |
| AIDA64 / Memory Read | |
| Moyenne de la classe Multimedia (19699 - 174586, n=61, 2 dernières années) | |
| Schenker Vision 14 M23 RTX 3050 | |
| Samsung Galaxy Book3 Ultra 16 | |
| Moyenne Intel Core i7-13700H, NVIDIA GeForce RTX 3050 6GB Laptop GPU (65825 - 70861, n=2) | |
| Dell Inspiron 16 Plus 7630 | |
| Asus VivoBook Pro 16 K6602VU | |
| HP Pavilion Plus 16-ab0456tx | |
| Lenovo Slim Pro 7 14ARP8 | |
| Asus VivoBook 14X K3405 | |
| AIDA64 / Memory Write | |
| Samsung Galaxy Book3 Ultra 16 | |
| Moyenne de la classe Multimedia (17733 - 134998, n=61, 2 dernières années) | |
| HP Pavilion Plus 16-ab0456tx | |
| Moyenne Intel Core i7-13700H, NVIDIA GeForce RTX 3050 6GB Laptop GPU (68174 - 76930, n=2) | |
| Schenker Vision 14 M23 RTX 3050 | |
| Asus VivoBook Pro 16 K6602VU | |
| Dell Inspiron 16 Plus 7630 | |
| Lenovo Slim Pro 7 14ARP8 | |
| Asus VivoBook 14X K3405 | |
| AIDA64 / Memory Latency | |
| Moyenne de la classe Multimedia (7 - 535, n=60, 2 dernières années) | |
| Lenovo Slim Pro 7 14ARP8 | |
| Samsung Galaxy Book3 Ultra 16 | |
| Dell Inspiron 16 Plus 7630 | |
| Asus VivoBook Pro 16 K6602VU | |
| HP Pavilion Plus 16-ab0456tx | |
| Asus VivoBook 14X K3405 | |
| Moyenne Intel Core i7-13700H, NVIDIA GeForce RTX 3050 6GB Laptop GPU (85.7 - 89.7, n=2) | |
| Schenker Vision 14 M23 RTX 3050 | |
| WebXPRT 3 / Overall | |
| Moyenne de la classe Multimedia (136.4 - 596, n=70, 2 dernières années) | |
| Dell Inspiron 16 Plus 7630 | |
| Schenker Vision 14 M23 RTX 3050 | |
| Moyenne Intel Core i7-13700H, NVIDIA GeForce RTX 3050 6GB Laptop GPU (286 - 300, n=2) | |
| HP Pavilion Plus 16-ab0456tx | |
| Asus VivoBook 14X K3405 | |
| Lenovo Slim Pro 7 14ARP8 | |
| Samsung Galaxy Book3 Ultra 16 | |
| WebXPRT 4 / Overall | |
| Schenker Vision 14 M23 RTX 3050 | |
| Moyenne Intel Core i7-13700H, NVIDIA GeForce RTX 3050 6GB Laptop GPU (273 - 325, n=2) | |
| Moyenne de la classe Multimedia (167.3 - 402, n=71, 2 dernières années) | |
| Dell Inspiron 16 Plus 7630 | |
| HP Pavilion Plus 16-ab0456tx | |
| Asus VivoBook 14X K3405 | |
| Asus VivoBook Pro 16 K6602VU | |
| Samsung Galaxy Book3 Ultra 16 | |
| Lenovo Slim Pro 7 14ARP8 | |
| Mozilla Kraken 1.1 / Total | |
| Lenovo Slim Pro 7 14ARP8 | |
| Samsung Galaxy Book3 Ultra 16 | |
| Asus VivoBook 14X K3405 | |
| Asus VivoBook Pro 16 K6602VU | |
| Dell Inspiron 16 Plus 7630 | |
| Schenker Vision 14 M23 RTX 3050 | |
| Moyenne Intel Core i7-13700H, NVIDIA GeForce RTX 3050 6GB Laptop GPU (490 - 496, n=2) | |
| HP Pavilion Plus 16-ab0456tx | |
| Moyenne de la classe Multimedia (228 - 835, n=74, 2 dernières années) | |
* ... Moindre est la valeur, meilleures sont les performances
| PCMark 8 Home Score Accelerated v2 | 5525 points | |
| PCMark 8 Work Score Accelerated v2 | 5653 points | |
| PCMark 10 Score | 6597 points | |
Aide | ||
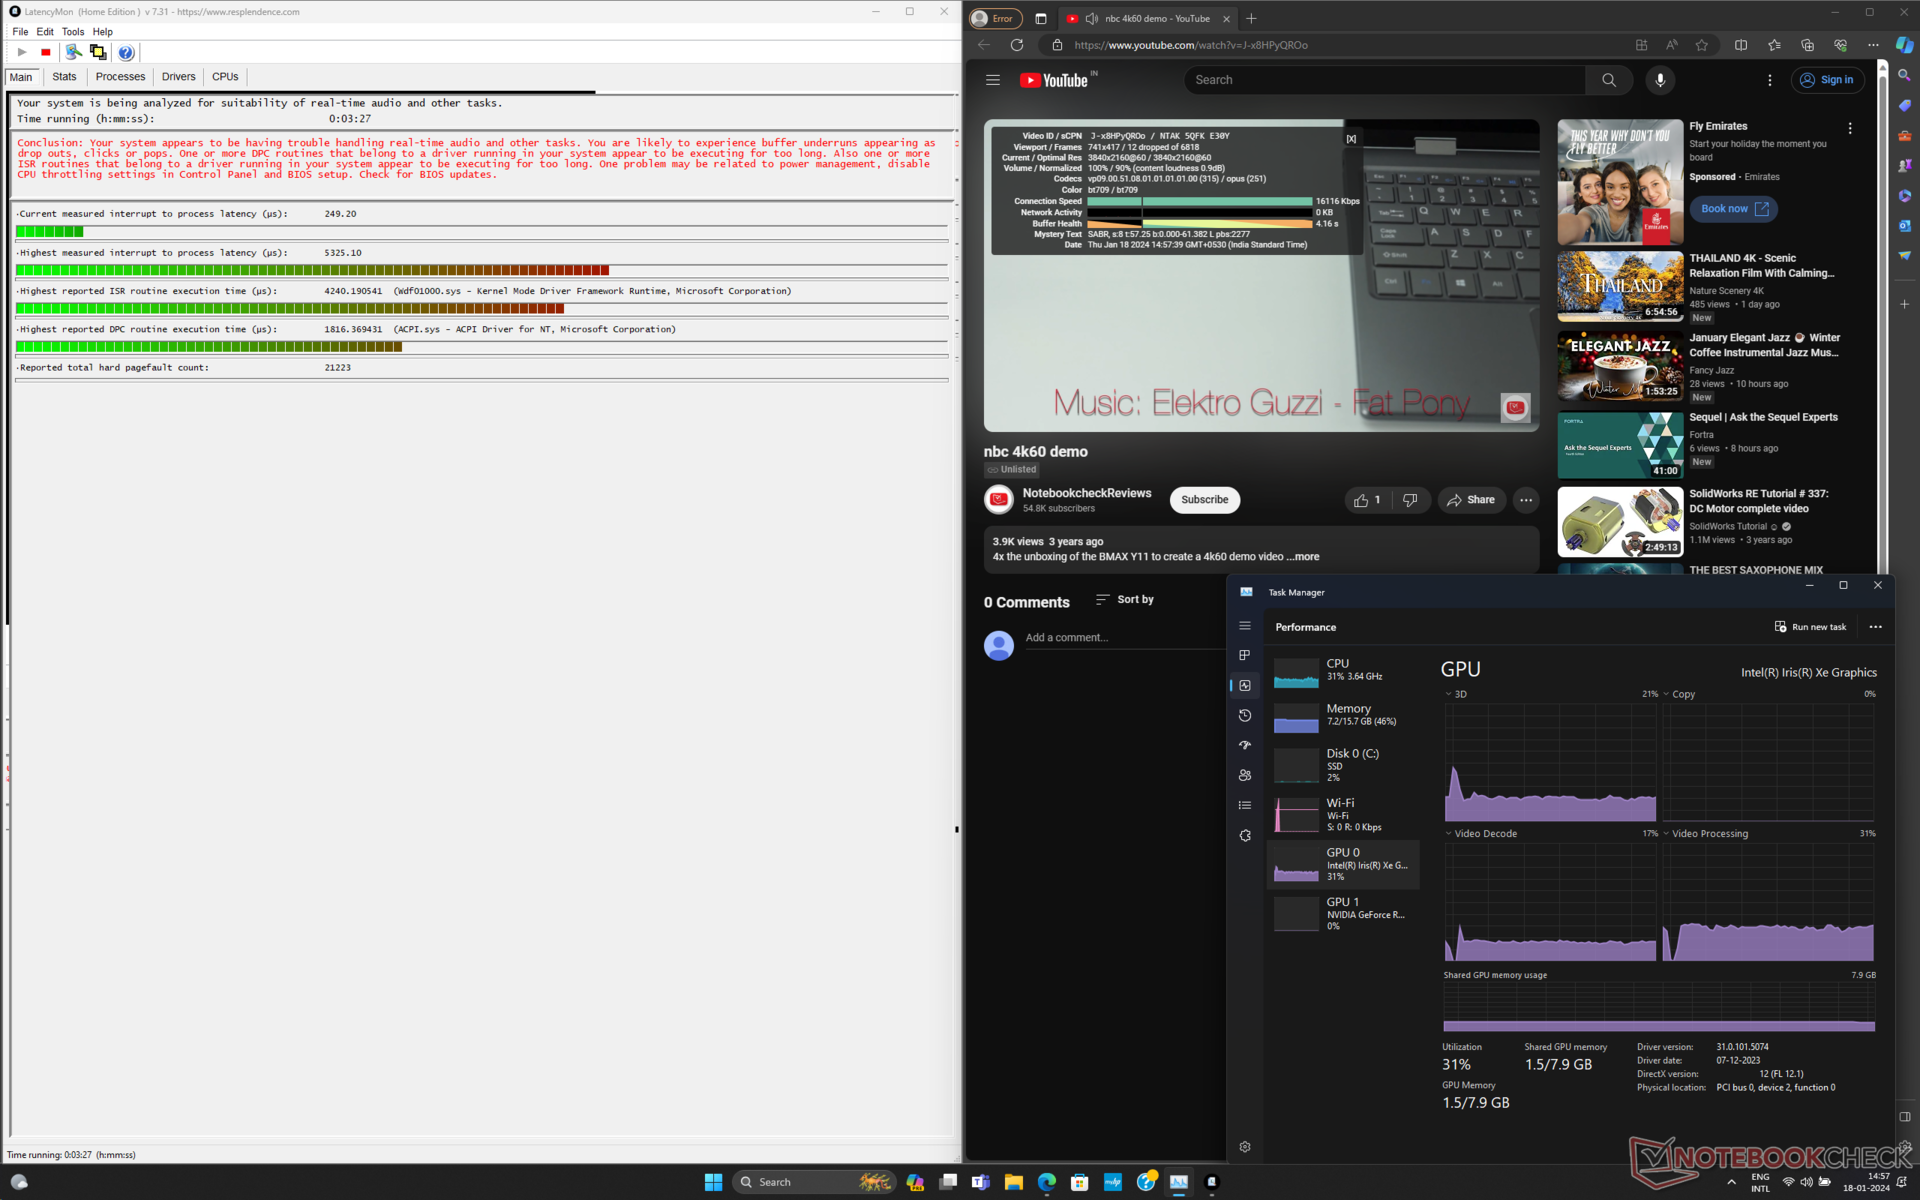
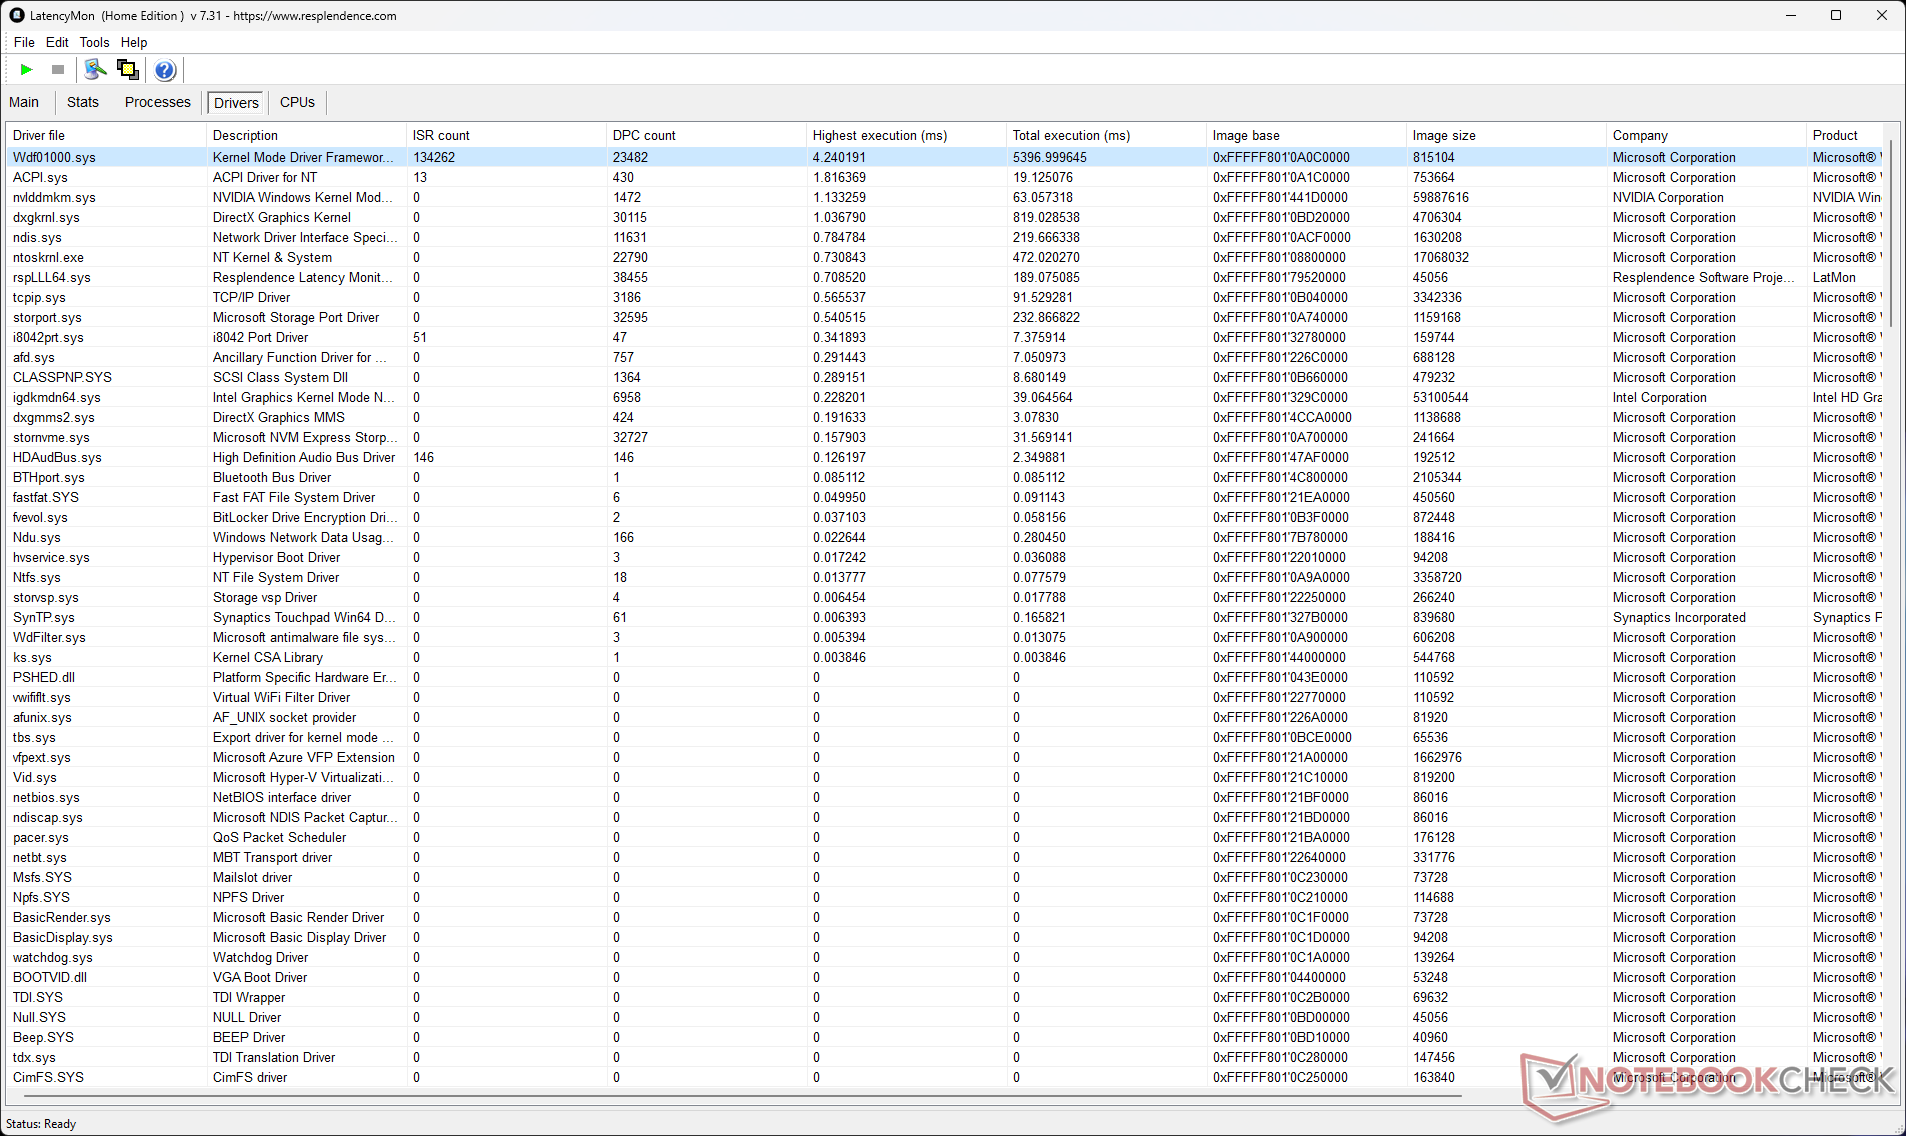
Latence DPC
La latence entre l'interruption et le traitement mesurée par le Pavilion Plus 16 (5325,1 μs) est plus élevée, ce qui peut être un problème pour les utilisateurs de flux de travail audio et vidéo en temps réel.
| DPC Latencies / LatencyMon - interrupt to process latency (max), Web, Youtube, Prime95 | |
| HP Pavilion Plus 16-ab0456tx | |
| Samsung Galaxy Book3 Ultra 16 | |
| Asus VivoBook Pro 16 K6602VU | |
| Schenker Vision 14 M23 RTX 3050 | |
| Lenovo Slim Pro 7 14ARP8 | |
| Asus VivoBook 14X K3405 | |
| Dell Inspiron 16 Plus 7630 | |
* ... Moindre est la valeur, meilleures sont les performances
Notre Classement de latence DPC propose d'autres comparaisons de latence entre les appareils examinés.
Dispositifs de stockage
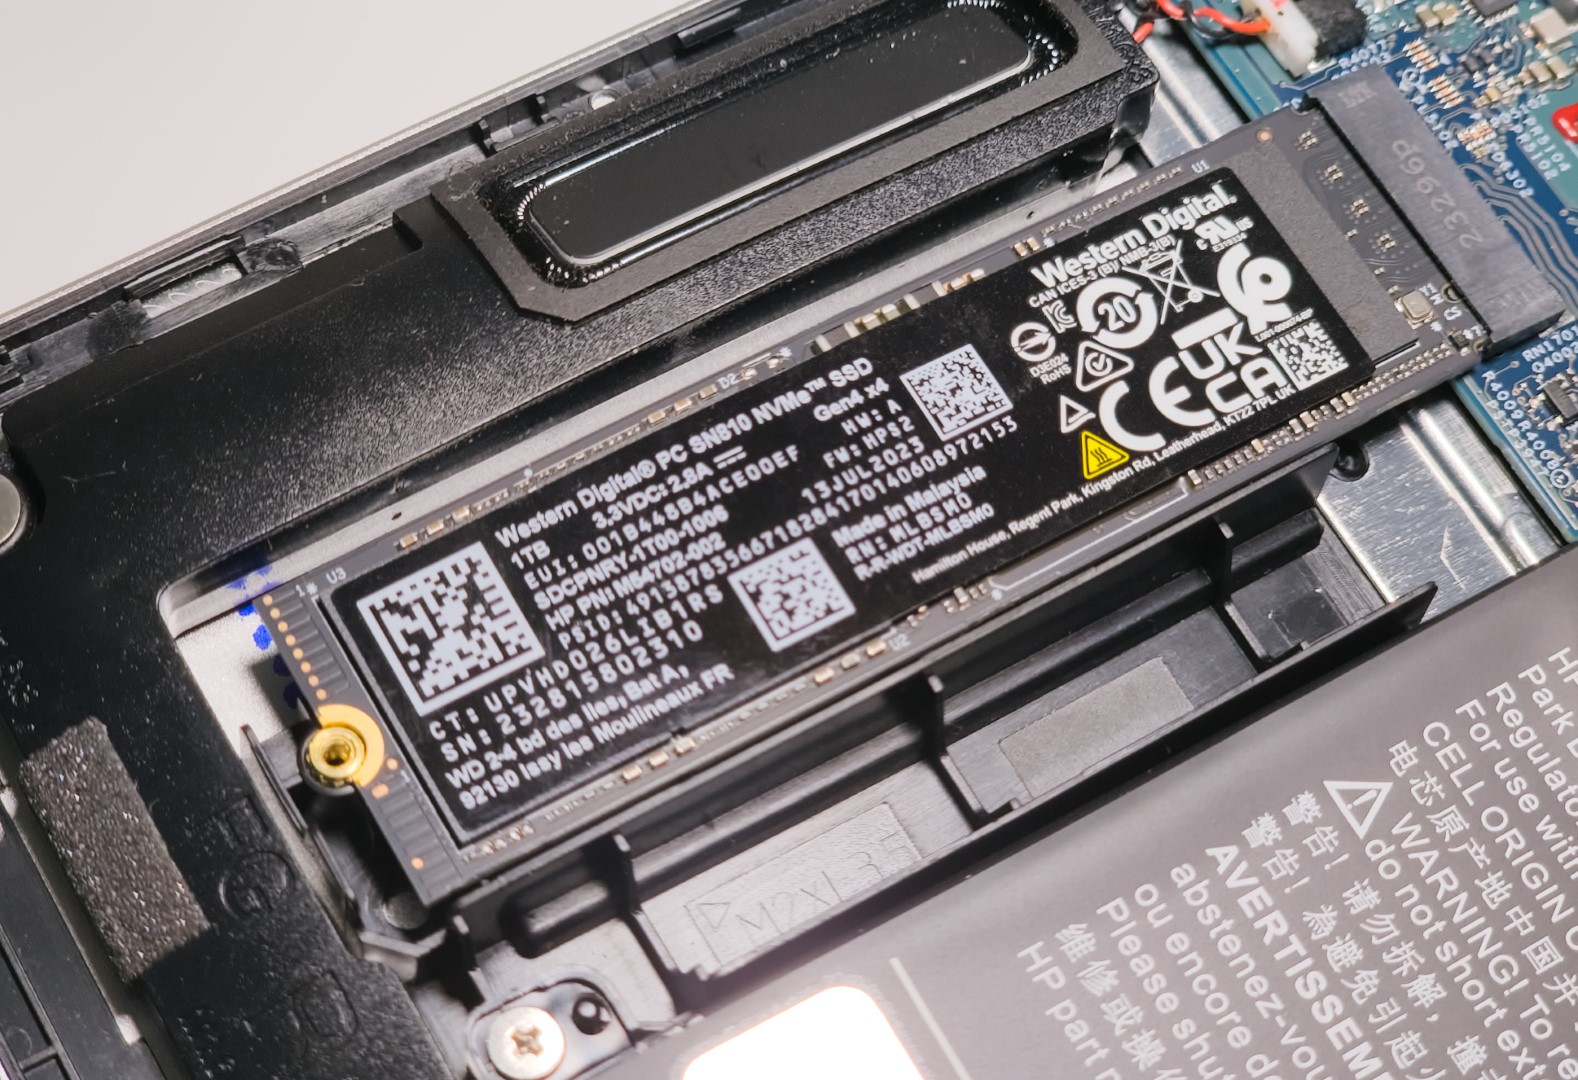
Un disque Western Digital PC SN810 1 TB NVMe est installé dans notre unité Pavilion Plus 16. Les performances cumulées du disque sont environ 10 % plus lentes que celles du Samsung 990 Pro dans le Schenker Vision 14 M23 et environ 16 % plus lentes que celles du Samsung PM9A1 dans le Schenker Vision 14 M23 et environ 16 % plus lentes que celles du Samsung PM9A1 dans le Schenker Vision 14 M23 Samsung Galaxy Book3 Ultra 16.
Les performances inférieures en lecture/écriture 4K contribuent principalement à ce déficit de performance.
Malheureusement, un seul SSD peut être installé dans le châssis. Il n'est pas non plus possible d'ajouter des disques durs de 2,5 pouces.

* ... Moindre est la valeur, meilleures sont les performances
Throttoir de disque : Boucle de lecture DiskSpd, profondeur de la file d'attente 8
Bien que HP fournisse une couverture thermique pour le SSD, elle n'est apparemment pas suffisante pour empêcher le disque de s'étrangler après la 25e boucle lors de notre test de lecture en boucle DiskSpd avec une profondeur de file d'attente de 8.
Vous trouverez d'autres comparaisons de stockage sur notre Page de comparaison des SSD.
Performance du GPU
Le Pavilion Plus 16 est le seul ordinateur portable que nous avons testé à être équipé du nouveau GPU RTX 3050 6 Go pour ordinateur portable, à l'exception du Lenovo Slim Pro 7 et du Schenker Vision 14 M23.
La RTX 3050 6 GB de l'ordinateur portable HP est évaluée à 60 W TGP alors que les Schenker et Lenovo ont des implémentations de 50 W et 63 W, respectivement.
En conséquence, le Slim 7 Pro a un léger avantage en termes de performances 3DMark cumulées sur le Pavilion Plus 16, tandis que le Vision 14 M23 est 5 % moins performant que le HP.
| 3DMark 11 Performance | 17282 points | |
| 3DMark Ice Storm Standard Score | 82182 points | |
| 3DMark Cloud Gate Standard Score | 43015 points | |
| 3DMark Fire Strike Score | 10890 points | |
| 3DMark Fire Strike Extreme Score | 5641 points | |
Aide | ||
| Blender / v3.3 Classroom OPTIX/RTX | |
| Asus VivoBook 14X K3405 | |
| Schenker Vision 14 M23 RTX 3050 | |
| Moyenne NVIDIA GeForce RTX 3050 4GB Laptop GPU (53 - 99, n=12) | |
| Lenovo Slim Pro 7 14ARP8 | |
| HP Pavilion Plus 16-ab0456tx | |
| Moyenne de la classe Multimedia (12 - 105, n=24, 2 dernières années) | |
| Samsung Galaxy Book3 Ultra 16 | |
| Asus VivoBook Pro 16 K6602VU | |
| Dell Inspiron 16 Plus 7630 | |
| Blender / v3.3 Classroom CUDA | |
| Asus VivoBook 14X K3405 | |
| Asus VivoBook 14X K3405 | |
| Moyenne NVIDIA GeForce RTX 3050 4GB Laptop GPU (97 - 152, n=13) | |
| Schenker Vision 14 M23 RTX 3050 | |
| Lenovo Slim Pro 7 14ARP8 | |
| HP Pavilion Plus 16-ab0456tx | |
| Samsung Galaxy Book3 Ultra 16 | |
| Moyenne de la classe Multimedia (20 - 186, n=24, 2 dernières années) | |
| Asus VivoBook Pro 16 K6602VU | |
| Dell Inspiron 16 Plus 7630 | |
| Blender / v3.3 Classroom CPU | |
| Moyenne NVIDIA GeForce RTX 3050 4GB Laptop GPU (388 - 937, n=11) | |
| Schenker Vision 14 M23 RTX 3050 | |
| Asus VivoBook 14X K3405 | |
| Lenovo Slim Pro 7 14ARP8 | |
| Dell Inspiron 16 Plus 7630 | |
| Moyenne de la classe Multimedia (134.5 - 1042, n=68, 2 dernières années) | |
| Samsung Galaxy Book3 Ultra 16 | |
| HP Pavilion Plus 16-ab0456tx | |
| Asus VivoBook Pro 16 K6602VU | |
* ... Moindre est la valeur, meilleures sont les performances
Performances des jeux
Nous constatons un avantage cumulatif d'environ 10 % dans les jeux en 1080p avec la RTX 3050 6 Go par rapport à la RTX 3050 4 GO en moyenne.
La RTX 3050 du Pavilion Plus 16 montre de bons gains en performances cumulées de jeu en 1080p par rapport au Slim Pro 7 et au Vision 14 M23, tout en restant 25% en dessous du GPU RTX 4050 65 W du VivoBook Pro 16.
Il est intéressant de noter que le Pavilion Plus 16 est également capable de devancer le Galaxy Book3 Ultra 16 avec une RTX 4050 dans le jeu global, mais c'est à cause des piètres performances de ce dernier dans Dota 2 Reborn et X-Plane 11.
La RTX 3050 6 GB peut jouer des titres plus anciens en 1080p Ultra, mais les jeux AAA modernes ont du mal avec des réglages supérieurs à 1080p.
Le tableau des FPS de Witcher 3
Nous n'avons observé aucun ralentissement perceptible lors d'un test de stress avec The Witcher 3 à 1080p Ultra, ce qui indique un refroidissement efficace.
| Bas | Moyen | Élevé | Ultra | QHD | |
|---|---|---|---|---|---|
| GTA V (2015) | 177.9 | 172 | 123.3 | 62.7 | 42.7 |
| The Witcher 3 (2015) | 244 | 159.1 | 91.4 | 50.1 | 37 |
| Dota 2 Reborn (2015) | 155.2 | 131 | 124.2 | 116.9 | |
| Final Fantasy XV Benchmark (2018) | 128.2 | 70.9 | 52 | 37.4 | |
| X-Plane 11.11 (2018) | 140.6 | 117 | 97.3 | ||
| Far Cry 5 (2018) | 89 | 82 | 76 | 52 | |
| Strange Brigade (2018) | 256 | 112.8 | 91.9 | 80.5 | 57.1 |
| F1 22 (2022) | 150.2 | 145.3 | 109.5 | 34 | 20.1 |
| F1 23 (2023) | 150.1 | 141.2 | 97.5 | 26 | 14.3 |
| Cyberpunk 2077 (2023) | 67.6 | 52.1 | 43.2 | 36.9 | 21.3 |
| Assassin's Creed Mirage (2023) | 70 | 63 | 55 | 41 | 31 |
| Avatar Frontiers of Pandora (2023) | 39.5 | 36.3 | 31.5 | 23.4 | 15.1 |
Consultez notre site dédié Nvidia GeForce RTX 3050 6 GB Laptop GPU pour plus d'informations.
Émissions : Bruit du ventilateur tolérable mais températures de surface élevées sous charge
Bruit du système
Nous avons mesuré un niveau de pression acoustique (SPL) de 42,1 dB(A) en mode Performance sous charge maximale. Il semble que HP ait fixé des limites pour le bruit du ventilateur afin qu'il reste inférieur à 35 dB(A) en mode équilibré et à 45 dB(A) en mode performance.
Degré de la nuisance sonore
| Au repos |
| 22.22 / 22.22 / 22.22 dB(A) |
| Fortement sollicité |
| 42.03 / 42.1 dB(A) |
 | ||
30 dB silencieux 40 dB(A) audible 50 dB(A) bruyant |
||
min: | ||
| Mode de performance | Au ralenti dB(A) | Charge moyenne dB(A) | Charge maximale dB(A) | Le Witcher 3 1080p Ultra dB(A) |
|---|---|---|---|---|
| Équilibré | 22.22 | 33.81 | 34.08 | 34.41 / 48 fps |
| Performance | 22.22 | 42.03 | 42.1 | 42.1 / 50 fps |
| HP Pavilion Plus 16-ab0456tx i7-13700H, GeForce RTX 3050 6GB Laptop GPU | Schenker Vision 14 M23 RTX 3050 i7-13700H, GeForce RTX 3050 6GB Laptop GPU | Dell Inspiron 16 Plus 7630 i7-13700H, GeForce RTX 4060 Laptop GPU | Asus VivoBook 14X K3405 i5-13500H, GeForce RTX 3050 4GB Laptop GPU | Lenovo Slim Pro 7 14ARP8 R7 7735HS, GeForce RTX 3050 6GB Laptop GPU | Asus VivoBook Pro 16 K6602VU i9-13900H, GeForce RTX 4050 Laptop GPU | Samsung Galaxy Book3 Ultra 16 i7-13700H, GeForce RTX 4050 Laptop GPU | |
|---|---|---|---|---|---|---|---|
| Noise | -10% | -7% | -10% | -4% | -14% | -9% | |
| arrêt / environnement * (dB) | 22.22 | 23.5 -6% | 23.2 -4% | 21.46 3% | 22.7 -2% | 20.96 6% | 25 -13% |
| Idle Minimum * (dB) | 22.22 | 23.5 -6% | 23.2 -4% | 22.08 1% | 22.8 -3% | 25.28 -14% | 26 -17% |
| Idle Average * (dB) | 22.22 | 23.5 -6% | 23.2 -4% | 22.08 1% | 22.8 -3% | 25.28 -14% | 27 -22% |
| Idle Maximum * (dB) | 22.22 | 26 -17% | 23.2 -4% | 22.08 1% | 22.8 -3% | 25.28 -14% | 28 -26% |
| Load Average * (dB) | 42.03 | 43.6 -4% | 35.1 16% | 52.98 -26% | 43.8 -4% | 51.88 -23% | 40 5% |
| Witcher 3 ultra * (dB) | 42.1 | 48.7 -16% | 52.5 -25% | 52.7 -25% | 43.8 -4% | 49 -16% | 39 7% |
| Load Maximum * (dB) | 42.1 | 49.1 -17% | 52.5 -25% | 52.67 -25% | 47.1 -12% | 51.8 -23% | 41 3% |
* ... Moindre est la valeur, meilleures sont les performances
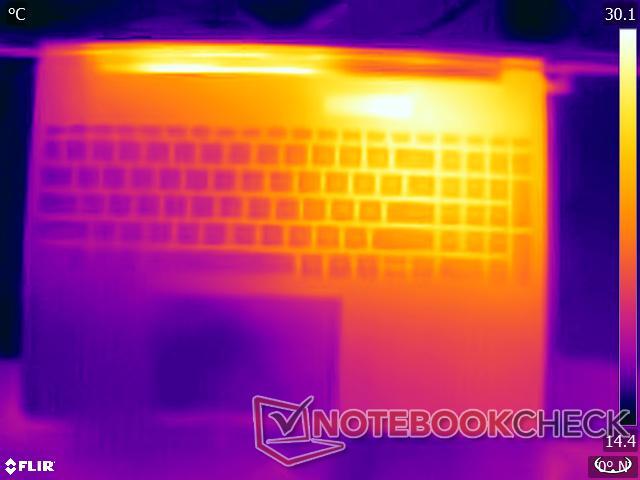
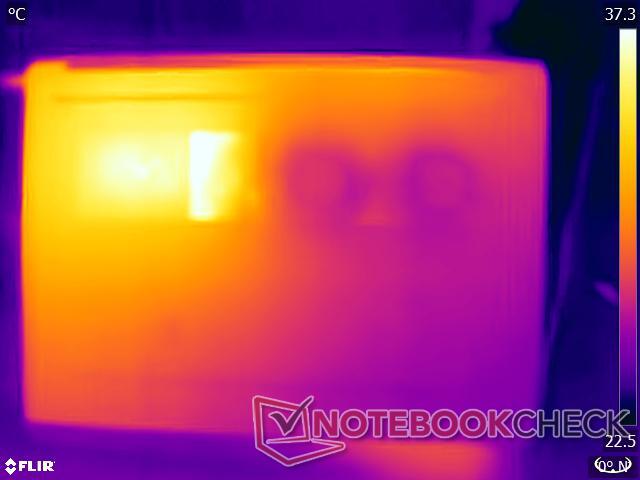
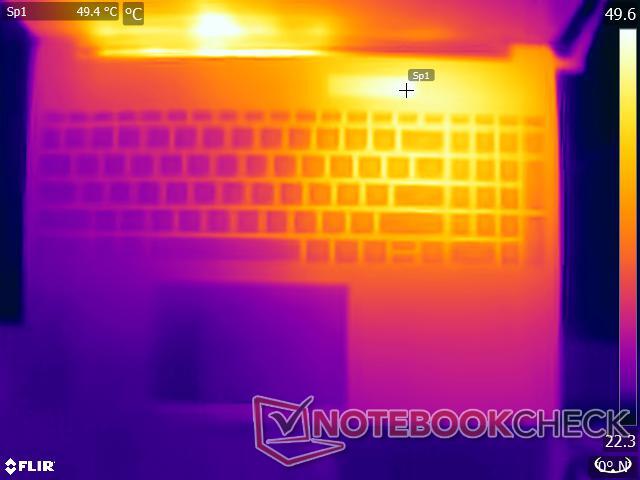
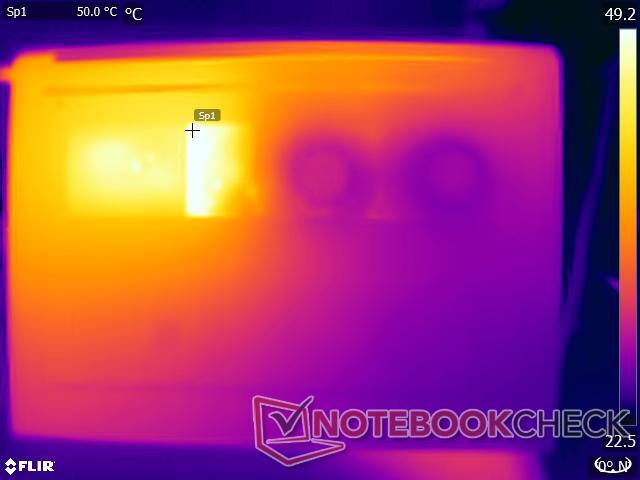
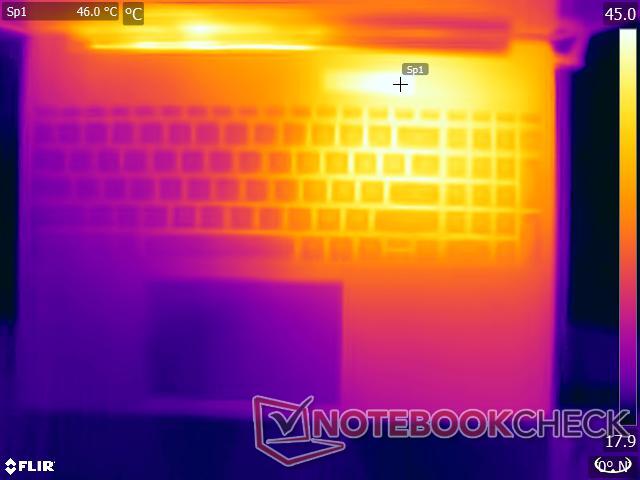
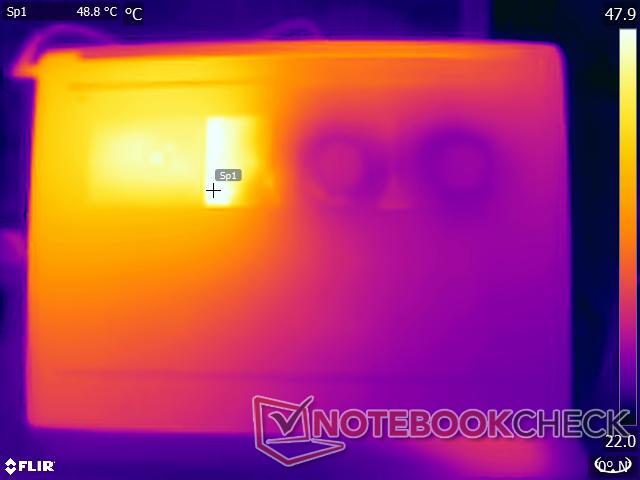
Température
Le Pavilion Plus 16 utilise un système à double ventilateur et à double caloduc pour refroidir le CPU et le GPU. Lors de nos tests de stress, cette configuration a été poussée dans ses derniers retranchements avec des températures de surface atteignant 49,6°C en haut et 45,8°C en bas.
Bien que l'appareil puisse être utilisé confortablement sur les genoux pour des tâches légères, il peut devenir inconfortable en cas de charge de travail élevée.
(-) La température maximale du côté supérieur est de 49.6 °C / 121 F, par rapport à la moyenne de 36.8 °C / 98 F, allant de 21 à 71 °C pour la classe Multimedia.
(-) Le fond chauffe jusqu'à un maximum de 45.8 °C / 114 F, contre une moyenne de 39.1 °C / 102 F
(±) En utilisation inactive, la température moyenne du côté supérieur est de 32.3 °C / 90 F, par rapport à la moyenne du dispositif de 31.3 °C / 88 F.
(-) En jouant à The Witcher 3, la température moyenne du côté supérieur est de 39.7 °C / 103 F, alors que la moyenne de l'appareil est de 31.3 °C / 88 F.
(+) Les repose-poignets et le pavé tactile atteignent la température maximale de la peau (35 °C / 95 F) et ne sont donc pas chauds.
(-) La température moyenne de la zone de l'appui-paume de dispositifs similaires était de 28.7 °C / 83.7 F (-6.3 °C / #-11.3 F).
| HP Pavilion Plus 16-ab0456tx Intel Core i7-13700H, NVIDIA GeForce RTX 3050 6GB Laptop GPU | Schenker Vision 14 M23 RTX 3050 Intel Core i7-13700H, NVIDIA GeForce RTX 3050 6GB Laptop GPU | Dell Inspiron 16 Plus 7630 Intel Core i7-13700H, NVIDIA GeForce RTX 4060 Laptop GPU | Asus VivoBook 14X K3405 Intel Core i5-13500H, NVIDIA GeForce RTX 3050 4GB Laptop GPU | Lenovo Slim Pro 7 14ARP8 AMD Ryzen 7 7735HS, NVIDIA GeForce RTX 3050 6GB Laptop GPU | Asus VivoBook Pro 16 K6602VU Intel Core i9-13900H, NVIDIA GeForce RTX 4050 Laptop GPU | Samsung Galaxy Book3 Ultra 16 Intel Core i7-13700H, NVIDIA GeForce RTX 4050 Laptop GPU | |
|---|---|---|---|---|---|---|---|
| Heat | 10% | 6% | -2% | 19% | -1% | 22% | |
| Maximum Upper Side * (°C) | 49.6 | 48.5 2% | 47.8 4% | 49.2 1% | 42.2 15% | 42.6 14% | 41 17% |
| Maximum Bottom * (°C) | 45.8 | 52.8 -15% | 42.2 8% | 54 -18% | 49 -7% | 48.4 -6% | 44 4% |
| Idle Upper Side * (°C) | 39.2 | 27.6 30% | 35.2 10% | 33.6 14% | 24.4 38% | 39.4 -1% | 23 41% |
| Idle Bottom * (°C) | 35.4 | 27 24% | 35 1% | 37.6 -6% | 25.2 29% | 39.8 -12% | 26 27% |
* ... Moindre est la valeur, meilleures sont les performances
Test de stress
Pendant un stress Prime95 in-place large FFTs, le Core i7-13700H du Pavilion Plus 16 tourne en moyenne à 2,2 GHz tout en consommant en moyenne 53 W d'énergie.
En ajoutant FurMark, le Core i7-13700H et la RTX 3050 se disputent l'énergie, ce qui se traduit par des hausses et des baisses d'horloge intermittentes pour le CPU et le GPU.
En moyenne, le Core i7-13700H ne peut atteindre que 1,96 GHz tandis que la RTX 3050 atteint 910 MHz tout en consommant respectivement 41 W et 39 W en moyenne.
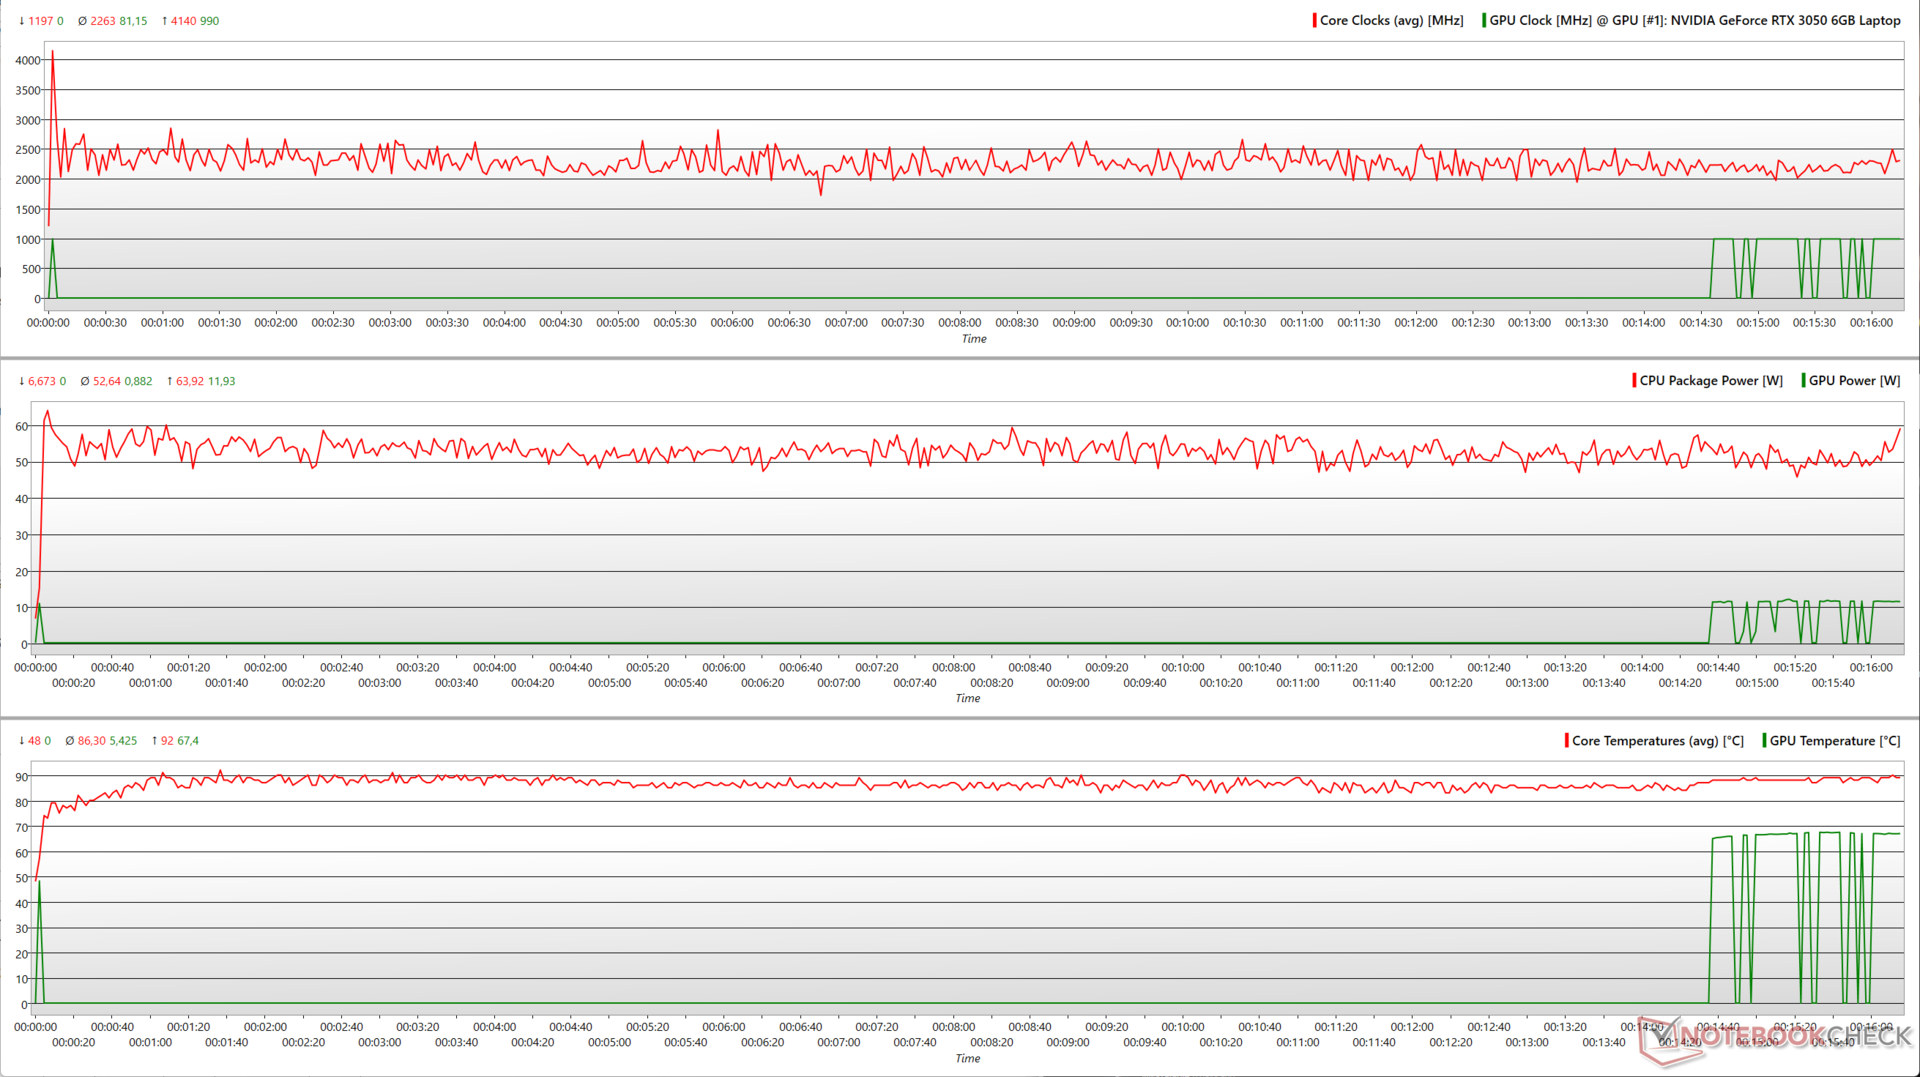
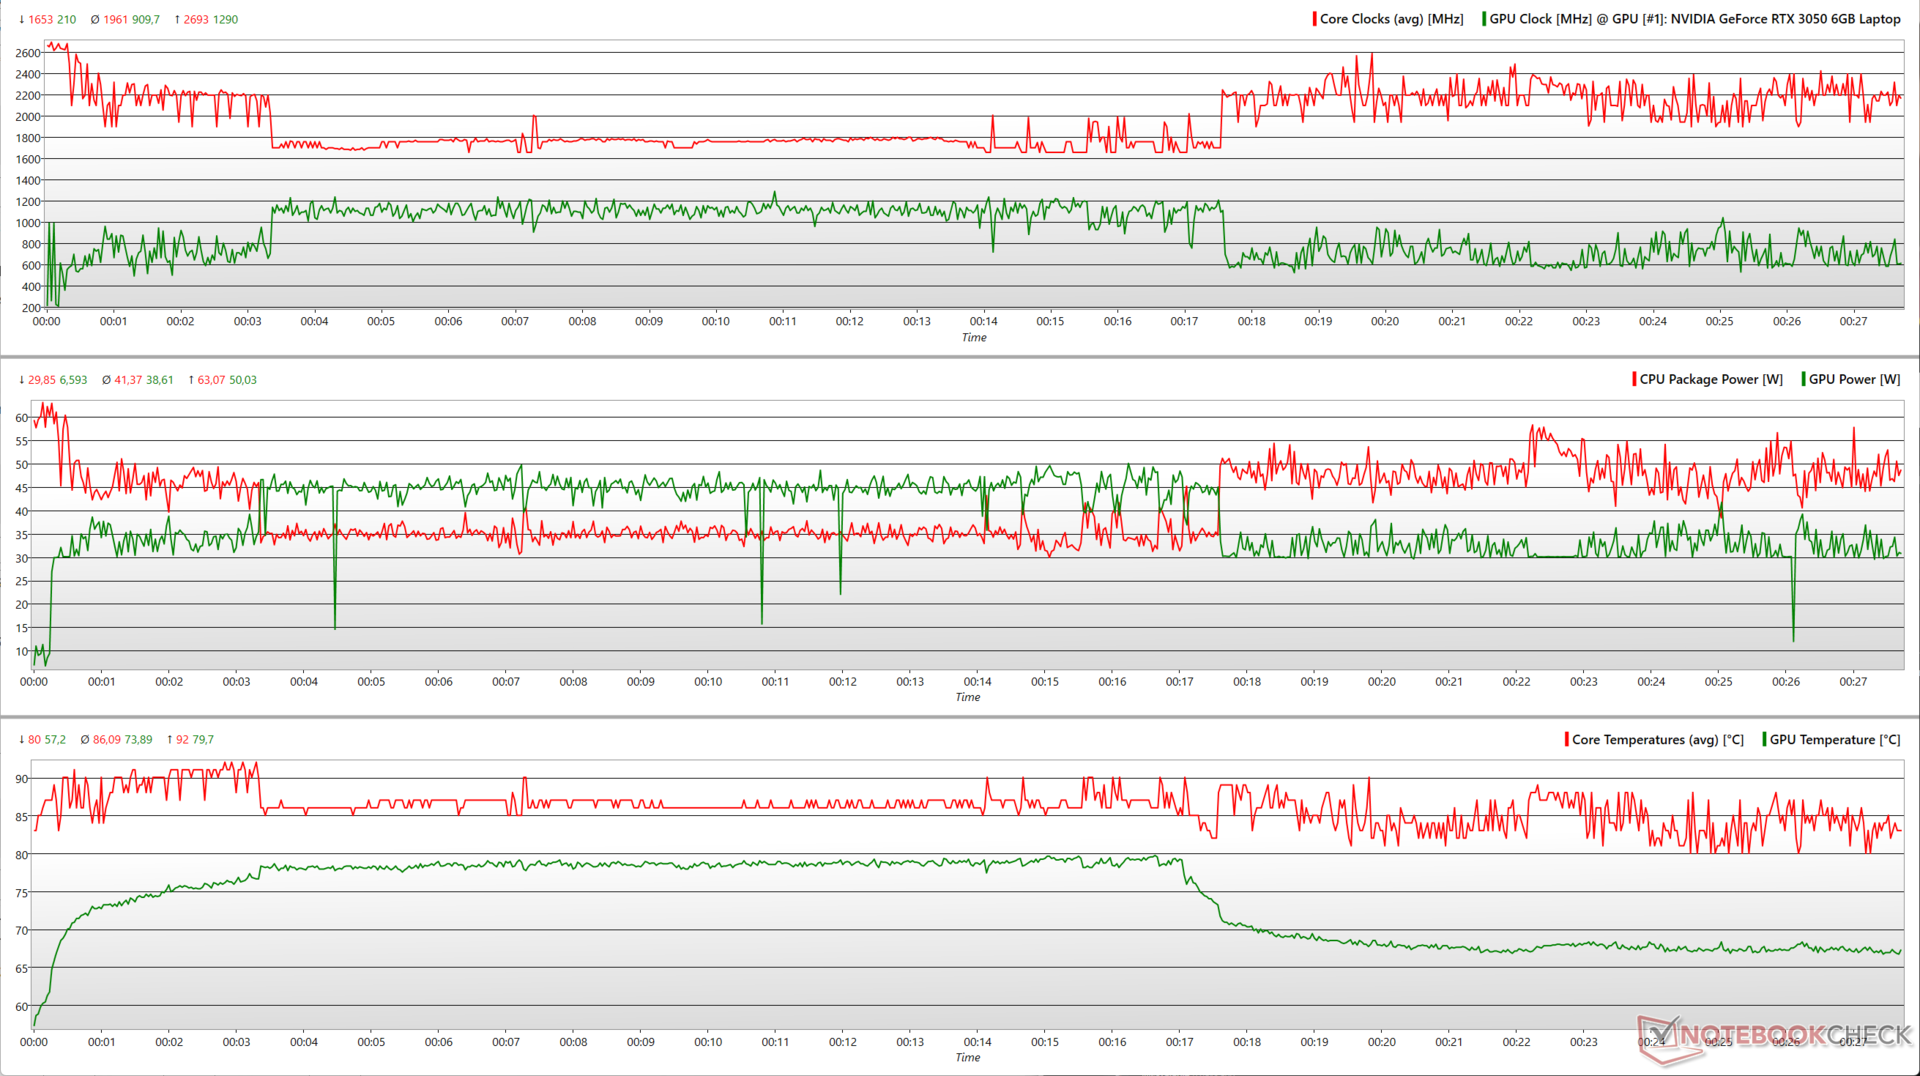
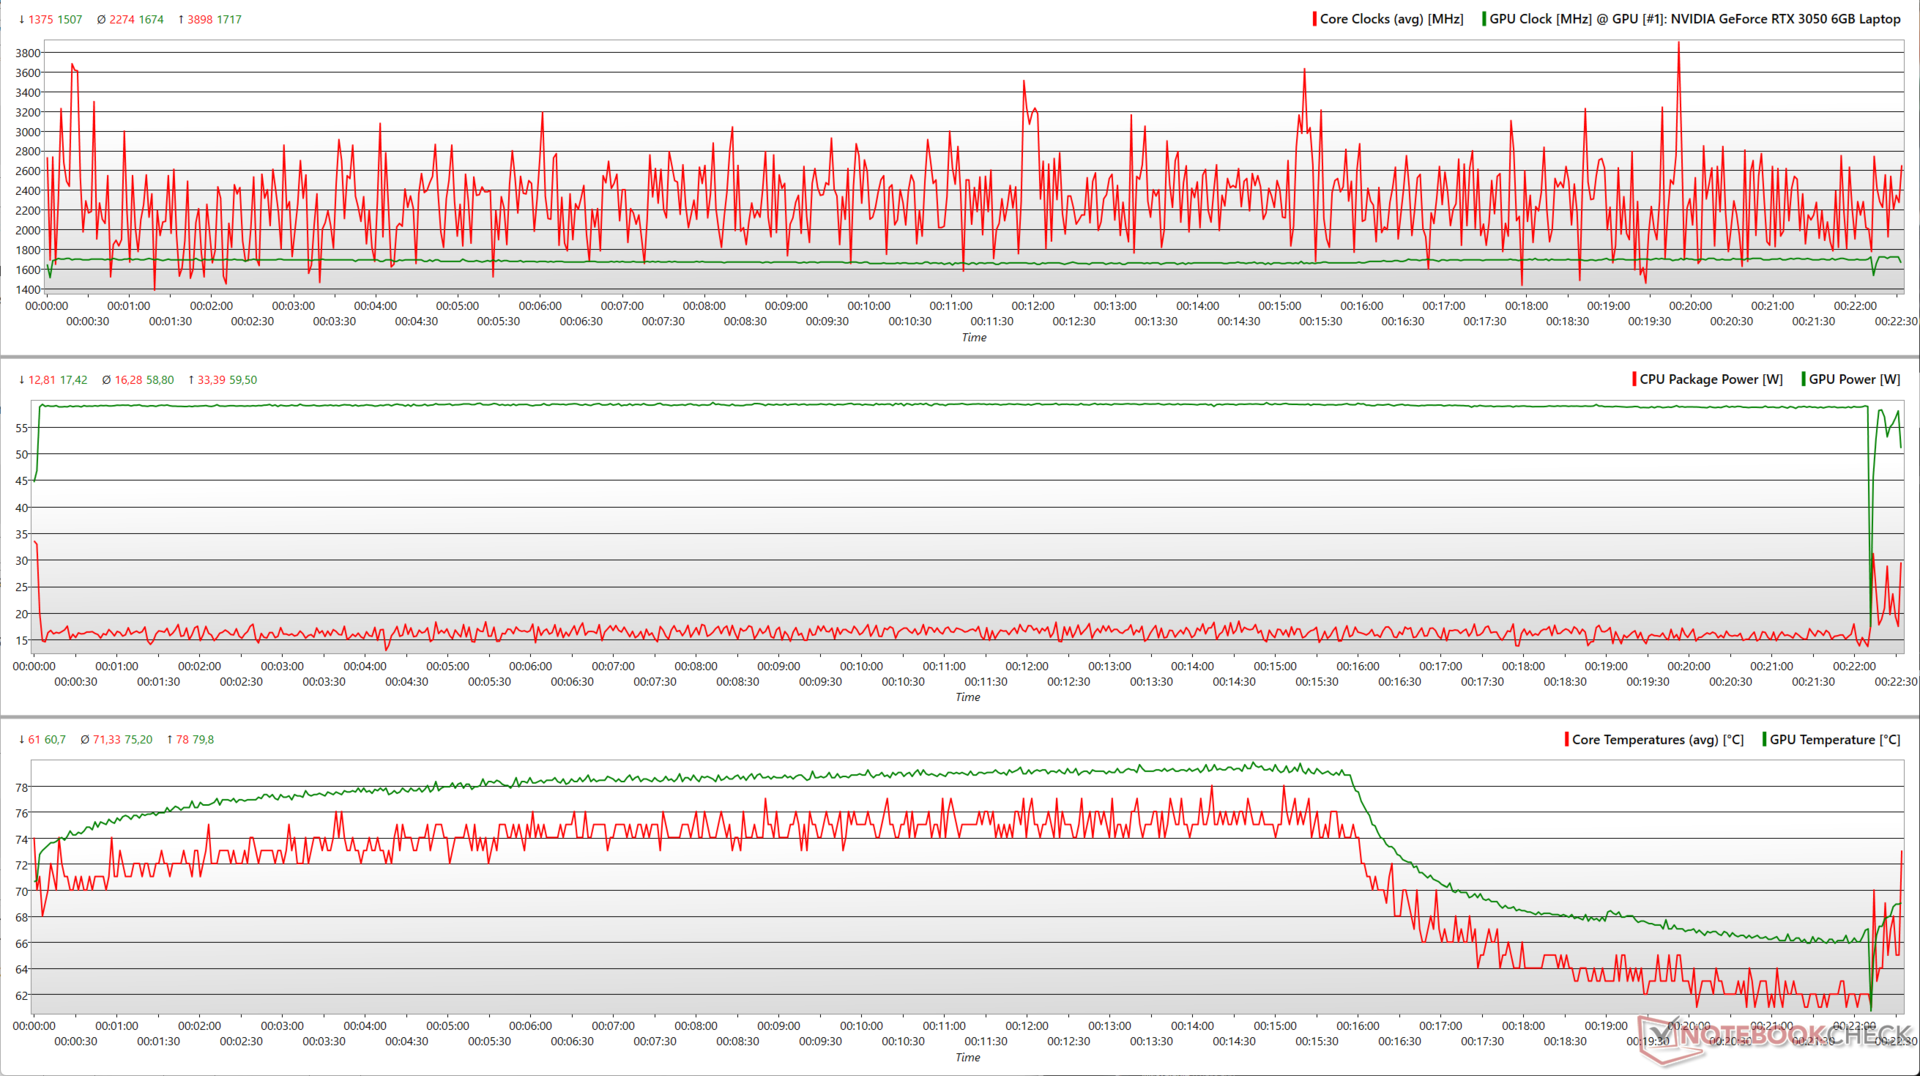
Les choses deviennent beaucoup plus prévisibles avec The Witcher 3 en 1080p Ultra. La RTX 3050 est maintenant capable d'utiliser son TGP maximum proche de 60 W de manière constante.
Il est intéressant de noter que les températures des cœurs commencent à baisser après un certain temps, même lorsque les horloges et la puissance du CPU/GPU restent relativement inchangées.
| Test de stress | Horloge du CPU (GHz) | Horloge du GPU (MHz) | Température moyenne du CPU (°C) | Température moyenne du GPU (°C) |
| Système au repos | 3.74 | - | 52 | 31.1 |
| Prime95 | 2.1 | - | 86 | 67.4 |
| Prime95 + FurMark | 1.93 | 735 | 86 | 73.5 |
| The Witcher 3 1080p Ultra | 2.2 | 1,717 | 71 | 74.2 |
Intervenants
Le Pavilion Plus 16 est équipé d'une paire de haut-parleurs stéréo d'une puissance raisonnable de 74,2 dB(A), ce qui devrait suffire dans la plupart des pièces de taille moyenne. Les basses sont perceptibles mais ne sont pas très proéminentes. En revanche, les médiums et les aigus sont relativement bien définis.
Néanmoins, les utilisateurs peuvent obtenir un meilleur son grâce à des haut-parleurs externes ou au Bluetooth 5.3.
HP Pavilion Plus 16-ab0456tx analyse audio
(±) | le niveau sonore du haut-parleur est moyen mais bon (74.2# dB)
Basses 100 - 315 Hz
(±) | basse réduite - en moyenne 14.7% inférieure à la médiane
(±) | la linéarité des basses est moyenne (7.8% delta à la fréquence précédente)
Médiums 400 - 2000 Hz
(+) | médiane équilibrée - seulement 3.4% de la médiane
(+) | les médiums sont linéaires (4.2% delta à la fréquence précédente)
Aiguës 2 - 16 kHz
(+) | des sommets équilibrés - à seulement 4.6% de la médiane
(+) | les aigus sont linéaires (4.8% delta à la fréquence précédente)
Globalement 100 - 16 000 Hz
(±) | la linéarité du son global est moyenne (16.7% de différence avec la médiane)
Par rapport à la même classe
» 44% de tous les appareils testés de cette catégorie étaient meilleurs, 8% similaires, 48% pires
» Le meilleur avait un delta de 5%, la moyenne était de 17%, le pire était de 45%.
Par rapport à tous les appareils testés
» 29% de tous les appareils testés étaient meilleurs, 7% similaires, 64% pires
» Le meilleur avait un delta de 4%, la moyenne était de 24%, le pire était de 134%.
Apple MacBook Pro 16 2021 M1 Pro analyse audio
(+) | les haut-parleurs peuvent jouer relativement fort (84.7# dB)
Basses 100 - 315 Hz
(+) | bonne basse - seulement 3.8% loin de la médiane
(+) | les basses sont linéaires (5.2% delta à la fréquence précédente)
Médiums 400 - 2000 Hz
(+) | médiane équilibrée - seulement 1.3% de la médiane
(+) | les médiums sont linéaires (2.1% delta à la fréquence précédente)
Aiguës 2 - 16 kHz
(+) | des sommets équilibrés - à seulement 1.9% de la médiane
(+) | les aigus sont linéaires (2.7% delta à la fréquence précédente)
Globalement 100 - 16 000 Hz
(+) | le son global est linéaire (4.6% différence à la médiane)
Par rapport à la même classe
» 0% de tous les appareils testés de cette catégorie étaient meilleurs, 0% similaires, 100% pires
» Le meilleur avait un delta de 5%, la moyenne était de 17%, le pire était de 45%.
Par rapport à tous les appareils testés
» 0% de tous les appareils testés étaient meilleurs, 0% similaires, 100% pires
» Le meilleur avait un delta de 4%, la moyenne était de 24%, le pire était de 134%.
Gestion de l'énergie : Consommation d'énergie économique et bonne durée de vie de la batterie
Consommation électrique
Le Pavilion Plus 16 consomme relativement moins d'énergie pour un matériel donné. Alors que le Schenker Vision 14 M23 et le Lenovo Slim Pro 7 sont plus économes en charge moyenne et The Witcher 3, le Pavilion Plus 16 est plus économique en charge maximale.
L'adaptateur de 135 W fourni est plus que suffisant pour alimenter l'ordinateur portable sous contrainte.
| Éteint/en veille | |
| Au repos | |
| Fortement sollicité |
|
Légende:
min: | |
| HP Pavilion Plus 16-ab0456tx i7-13700H, GeForce RTX 3050 6GB Laptop GPU, IPS, 2560x1600, 16" | Schenker Vision 14 M23 RTX 3050 i7-13700H, GeForce RTX 3050 6GB Laptop GPU, IPS, 2880x1800, 14" | Dell Inspiron 16 Plus 7630 i7-13700H, GeForce RTX 4060 Laptop GPU, IPS, 2560x1600, 16" | Asus VivoBook 14X K3405 i5-13500H, GeForce RTX 3050 4GB Laptop GPU, , 2880x1800, 14" | Lenovo Slim Pro 7 14ARP8 R7 7735HS, GeForce RTX 3050 6GB Laptop GPU, IPS, 2560x1600, 14.5" | Asus VivoBook Pro 16 K6602VU i9-13900H, GeForce RTX 4050 Laptop GPU, OLED, 3200x2000, 16" | Samsung Galaxy Book3 Ultra 16 i7-13700H, GeForce RTX 4050 Laptop GPU, AMOLED, 2880x1800, 16" | Moyenne NVIDIA GeForce RTX 3050 6GB Laptop GPU | Moyenne de la classe Multimedia | |
|---|---|---|---|---|---|---|---|---|---|
| Power Consumption | -2% | -100% | 6% | -30% | -141% | 20% | -8% | -13% | |
| Idle Minimum * (Watt) | 3.3 | 5.2 -58% | 15.6 -373% | 4.96 -50% | 7.6 -130% | 21.06 -538% | 3 9% | 4.55 ? -38% | 5.71 ? -73% |
| Idle Average * (Watt) | 7.3 | 7.8 -7% | 17.7 -142% | 7.54 -3% | 12.2 -67% | 24.27 -232% | 5 32% | 8.63 ? -18% | 10.1 ? -38% |
| Idle Maximum * (Watt) | 14.24 | 9 37% | 20.6 -45% | 9.31 35% | 12.8 10% | 25.12 -76% | 11 23% | 11.7 ? 18% | 12.4 ? 13% |
| Load Average * (Watt) | 91.7 | 78.6 14% | 87.4 5% | 83.4 9% | 76.5 17% | 52.4 43% | 72 21% | 86.6 ? 6% | 65 ? 29% |
| Witcher 3 ultra * (Watt) | 96.2 | 86.8 10% | 121.7 -27% | 73.3 24% | 89.5 7% | 110.2 -15% | 69.7 28% | ||
| Load Maximum * (Watt) | 115.8 | 121.2 -5% | 138 -19% | 91.74 21% | 135.7 -17% | 146 -26% | 108 7% | 127.6 ? -10% | 112.2 ? 3% |
* ... Moindre est la valeur, meilleures sont les performances
Power Consumption: The Witcher 3 / Stress test
Power Consumption: External monitor
Autonomie de la batterie
Les composants internes puissants mais peu puissants contribuent à une bonne autonomie de la batterie. Avec une luminosité de 150 nits, la batterie de 68 WHr du Pavilion Plus 16 permet de naviguer sur le web pendant près de 10,5 heures et de lire des vidéos en 1080p pendant 12 heures, ce qui est impressionnant.
| HP Pavilion Plus 16-ab0456tx i7-13700H, GeForce RTX 3050 6GB Laptop GPU, 68 Wh | Schenker Vision 14 M23 RTX 3050 i7-13700H, GeForce RTX 3050 6GB Laptop GPU, 99 Wh | Dell Inspiron 16 Plus 7630 i7-13700H, GeForce RTX 4060 Laptop GPU, 86 Wh | Asus VivoBook 14X K3405 i5-13500H, GeForce RTX 3050 4GB Laptop GPU, 63 Wh | Lenovo Slim Pro 7 14ARP8 R7 7735HS, GeForce RTX 3050 6GB Laptop GPU, 73 Wh | Asus VivoBook Pro 16 K6602VU i9-13900H, GeForce RTX 4050 Laptop GPU, 96 Wh | Samsung Galaxy Book3 Ultra 16 i7-13700H, GeForce RTX 4050 Laptop GPU, 76 Wh | Moyenne de la classe Multimedia | |
|---|---|---|---|---|---|---|---|---|
| Autonomie de la batterie | 16% | -10% | -18% | 1% | -11% | 2% | 26% | |
| H.264 (h) | 12 | 10.4 -13% | 9.8 -18% | 13.4 12% | 16.4 ? 37% | |||
| WiFi v1.3 (h) | 10.4 | 12.1 16% | 9.4 -10% | 8.1 -22% | 10.5 1% | 10.1 -3% | 9.6 -8% | 12 ? 15% |
| Reader / Idle (h) | 17.6 | 18.2 | 25.2 ? | |||||
| Load (h) | 1.4 | 1.1 | 1.8 | 1.675 ? | ||||
| Witcher 3 ultra (h) | 1.3 |
Points positifs
Points négatifs
Verdict : Un grand potentiel freiné par des compromis
Le HP Pavilion Plus 16 répond à la plupart des attentes que l'on peut avoir d'un ordinateur portable multimédia moderne pour le travail et le divertissement. Le Pavilion Plus 16 est doté d'une construction entièrement métallique qui dégage une sensation de qualité supérieure, sans flexions inutiles, et d'une sélection de ports qui couvre l'essentiel.
La dalle 2560 x 1600 120 Hz n'offre pas de HDR ni de couverture Adobe RGB et Display P3 comme sur le Plus 14 Pavilion Plus 14oLED 2,8K. Cependant, l'essentiel est assuré avec des temps de réponse corrects et l'absence de scintillement PWM.
Le HP Pavilion Plus 16 est un ordinateur portable multimédia et de productivité polyvalent, mais le prix demandé aurait pu idéalement contenir au moins une RTX 4050."
Les limites de performance deviennent évidentes lorsque vous commencez à comparer avec la concurrence. Le PL2 de 60 W s'avère particulièrement désavantageux pour le Pavilion Plus 16 en multi-core par rapport au Dell Inspiron 16 Plus 7630 et même au Samsung Galaxy Book3 Ultra 16qui sont équipés d'un Core i7-13700H plus puissant.
HP aurait pu facilement autoriser 80 W PL2 ou plus dans un profil d'alimentation supplémentaire pour maximiser le potentiel de la puce. Cependant, le sous-système de refroidissement semble déjà mis à rude épreuve avec la configuration actuelle sous charge.
La Nvidia GeForce RTX 3050 6 Go n'est pas à la hauteur de la génération Ada en termes de performances et d'efficacité énergétique. Bien que les jeux en 1080p bénéficient d'une amélioration notable par rapport à la RTX 3050 4 Go, les tests synthétiques ne montrent pas d'amélioration notable.
Au prix de 1350 dollars sur le site de HP, le Pavilion Plus 16 est 100 dollars plus cher que l'Inspiron 16 Plus 7630 qui offre une RTX 4060 de 60 W et un Core i7-13700H plus performant. Cela dit, le Pavilion Plus 16 est moins cher que l'Inspiron 16 Plus 7630 sur le marché indien.
L'Asus VivoBook Pro 16 Asus VivoBook Pro 16 avec un écran OLED 3.2K, un Core i9-13900H, et jusqu'à une RTX 4060 est une excellente alternative pour les créateurs en herbe, tant que le plastique et la prime supplémentaire de 300 $ ne vous retiennent pas.
Prix et disponibilité
Le HP Pavilion Plus 16-ab0456tx testé est disponible sur le site officiel HP India au prix de 1 24 999 ₹1. L'ordinateur portable peut également être configuré sur le site HP US pour 1 350 dollars.
Amazon India propose le Pavilion Plus 16 sans le dGPU RTX 3050 pour ₹1,25,900.
HP Pavilion Plus 16-ab0456tx
- 02/07/2024 v7 (old)
Vaidyanathan Subramaniam
Transparency
La sélection des appareils à examiner est effectuée par notre équipe éditoriale. L'échantillon de test a été prêté à l'auteur par le fabricant ou le détaillant pour les besoins de cet examen. Le prêteur n'a pas eu d'influence sur cette évaluation et le fabricant n'a pas reçu de copie de cette évaluation avant sa publication. Il n'y avait aucune obligation de publier cet article. En tant que média indépendant, Notebookcheck n'est pas soumis à l'autorité des fabricants, des détaillants ou des éditeurs.
Voici comment Notebookcheck teste
Chaque année, Notebookcheck examine de manière indépendante des centaines d'ordinateurs portables et de smartphones en utilisant des procédures standardisées afin de garantir que tous les résultats sont comparables. Nous avons continuellement développé nos méthodes de test depuis environ 20 ans et avons établi des normes industrielles dans le processus. Dans nos laboratoires de test, des équipements de mesure de haute qualité sont utilisés par des techniciens et des rédacteurs expérimentés. Ces tests impliquent un processus de validation en plusieurs étapes. Notre système d'évaluation complexe repose sur des centaines de mesures et de points de référence bien fondés, ce qui garantit l'objectivité.Price comparison

