Test du Dell Inspiron 16 Plus 7630 : la GeForce RTX 4060 60 W n'est pas si mauvaise

Le Dell Inspiron 16 Plus 7630 2023 succède au 2022 Inspiron 16 Plus 7620 de l'année dernière avec des éléments internes et externes mis à jour, même si le modèle 2022 était déjà une refonte complète du 2021 Inspiron 16 Plus 7610. Il est rare de voir une série subir trois refontes majeures trois années de suite, car les fabricants ne révisent généralement l'extérieur qu'une fois tous les deux ans. Comme d'autres ordinateurs portables multimédias de 2023, l'Inspiron 16 Plus 7630 intègre des processeurs Intel Raptor Lake-H de 13e génération et des GPU Nvidia Ada Lovelace.
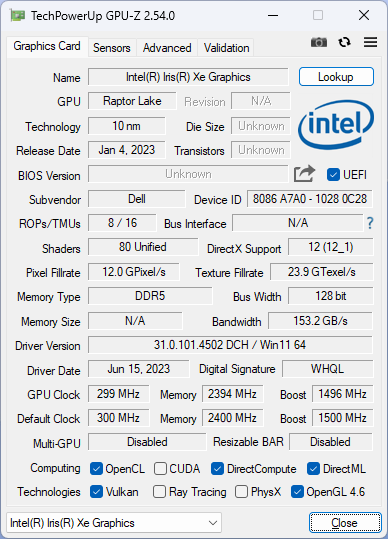
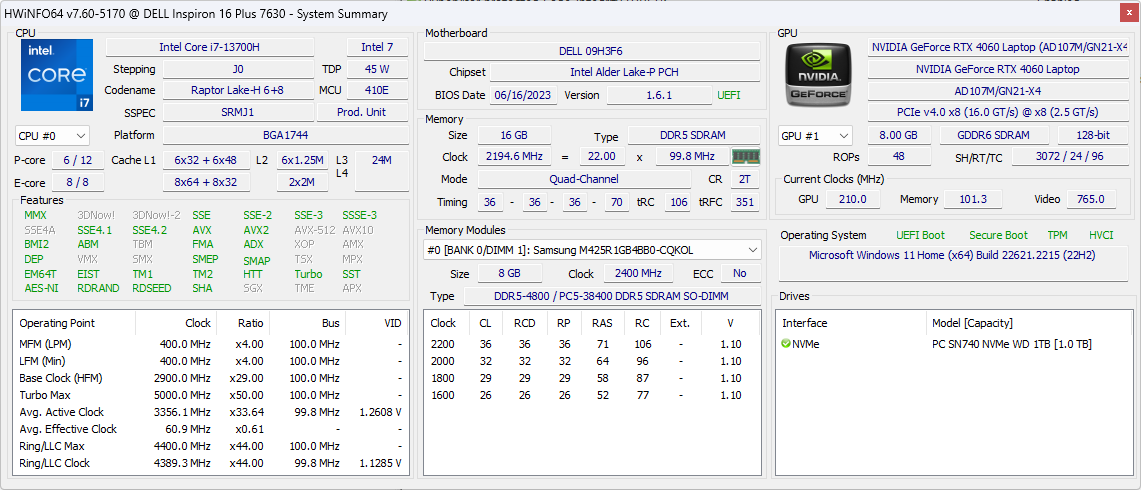
Notre unité d'évaluation est une configuration haut de gamme avec le CPU Core i7-13700H, le GPU GeForce RTX 4060 et l'écran IPS 2560 x 1600 120 Hz pour environ 1250 USD. Des modèles moins chers avec le Core i5-13500H, l'iris Xe intégré, la RTX 3050, la RTX 4050 ou l'écran 1200p 60 Hz sont en cours d'élaboration. Des variantes AMD avec les Ryzen 5 7640HS et Ryzen 7 7840HS sont également prévues sous le nom de modèle Inspiron 16 Plus 7635.
Parmi les alternatives à l'Inspiron 16 Plus 7630 figurent d'autres ordinateurs portables multimédias de 16 pouces comme le Lenovo Slim Pro 9i 16, Asus VivoBook Pro 16X, HP Envy 16, ou MSI Summit E16 Flip. L'Inspiron 16 Plus 7630 ne doit pas être confondu avec l'Inspiron 16 standard, plus lent, ou l'Inspiron 16 Plus 7630 2-en-1, dont les spécifications et les caractéristiques sont très différentes.
Plus d'avis sur Dell :
Comparaison avec les concurrents potentiels
Note | Date | Modèle | Poids | Épaisseur | Taille | Résolution | Prix |
|---|---|---|---|---|---|---|---|
| 87.1 % v7 (old) | 08/23 | Dell Inspiron 16 Plus 7630 i7-13700H, GeForce RTX 4060 Laptop GPU | 2.2 kg | 19.95 mm | 16.00" | 2560x1600 | |
| 87.4 % v7 (old) | 08/22 | Dell Inspiron 16 Plus 7620 i7-12700H, GeForce RTX 3050 Ti Laptop GPU | 2.1 kg | 18.99 mm | 16.00" | 3072x1920 | |
| 88 % v7 (old) | 08/23 | Lenovo Slim Pro 9i 16IRP8 i9-13905H, GeForce RTX 4050 Laptop GPU | 2.2 kg | 18.2 mm | 16.00" | 3200x2000 | |
| 86.2 % v7 (old) | 07/23 | Asus Vivobook Pro 16X K6604JV-MX016W i9-13980HX, GeForce RTX 4060 Laptop GPU | 2.1 kg | 22.8 mm | 16.00" | 3200x2000 | |
| 86.9 % v7 (old) | 09/22 | HP Envy 16 h0112nr i7-12700H, GeForce RTX 3060 Laptop GPU | 2.3 kg | 19.8 mm | 16.00" | 3840x2400 | |
| 84.2 % v7 (old) | 10/22 | MSI Summit E16 Flip A12UDT-031 i7-1280P, GeForce RTX 3050 Ti Laptop GPU | 1.9 kg | 16.85 mm | 16.00" | 2560x1600 |
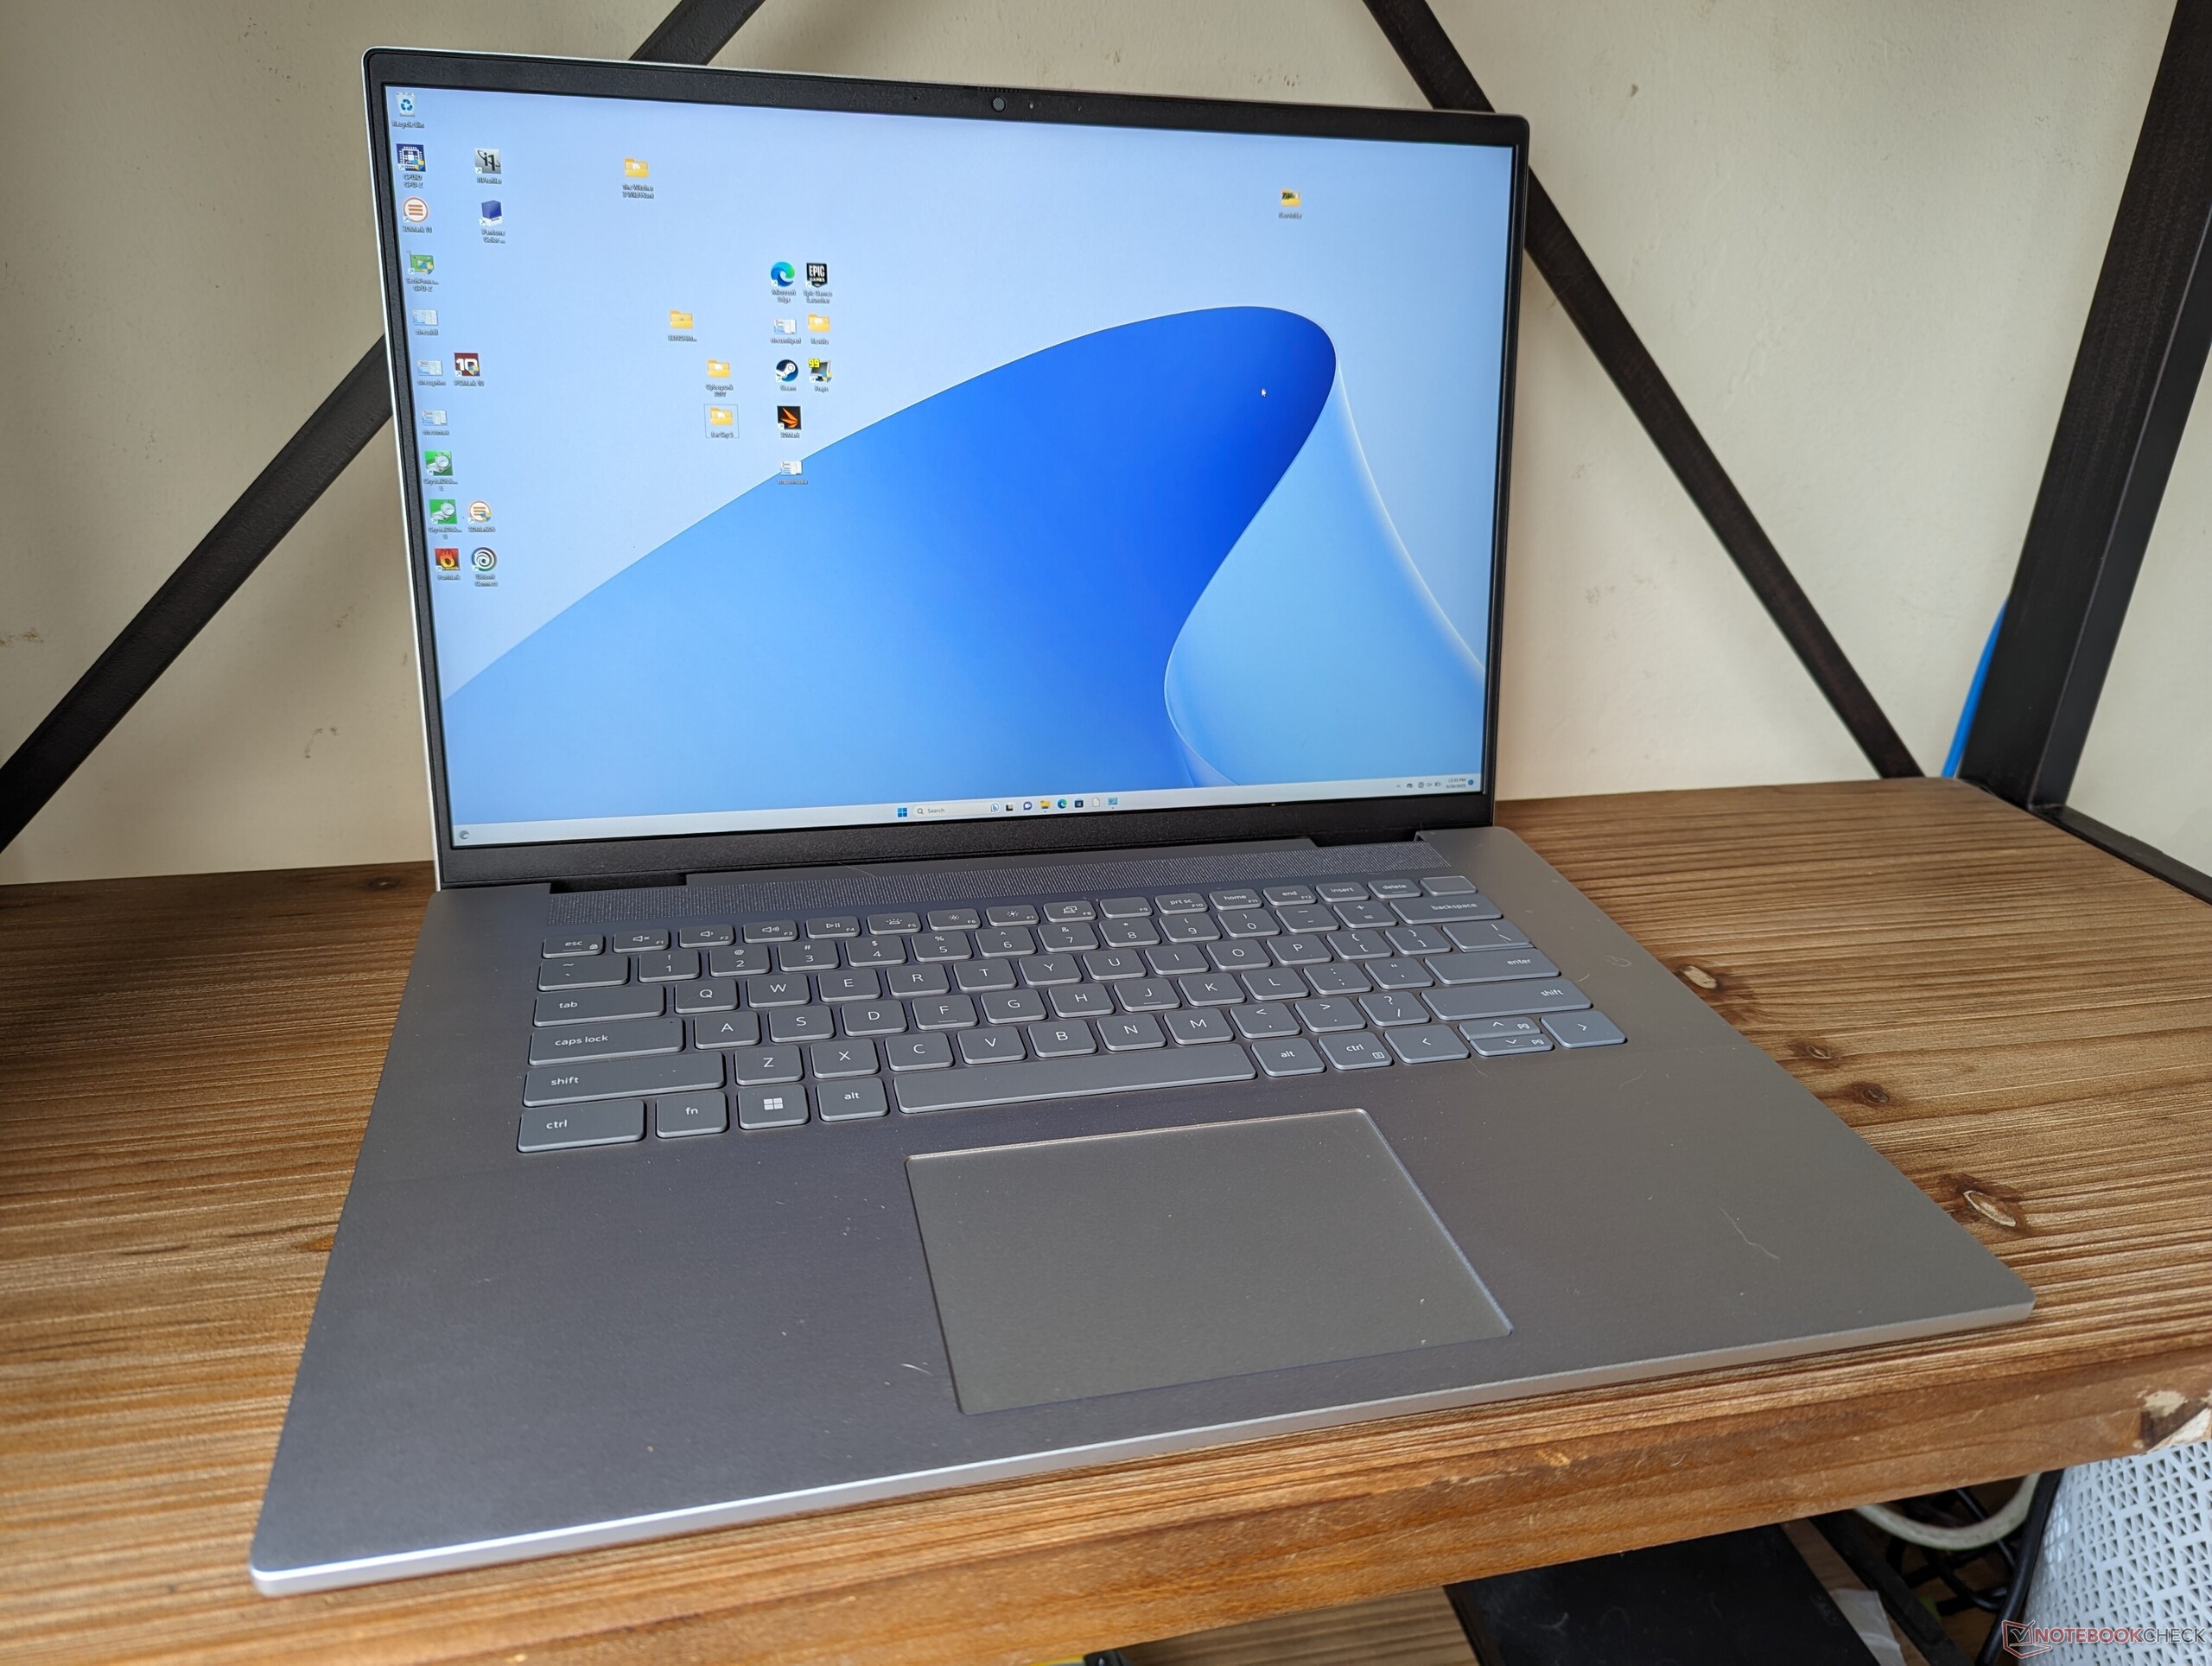
Cas - Garder les choses simples
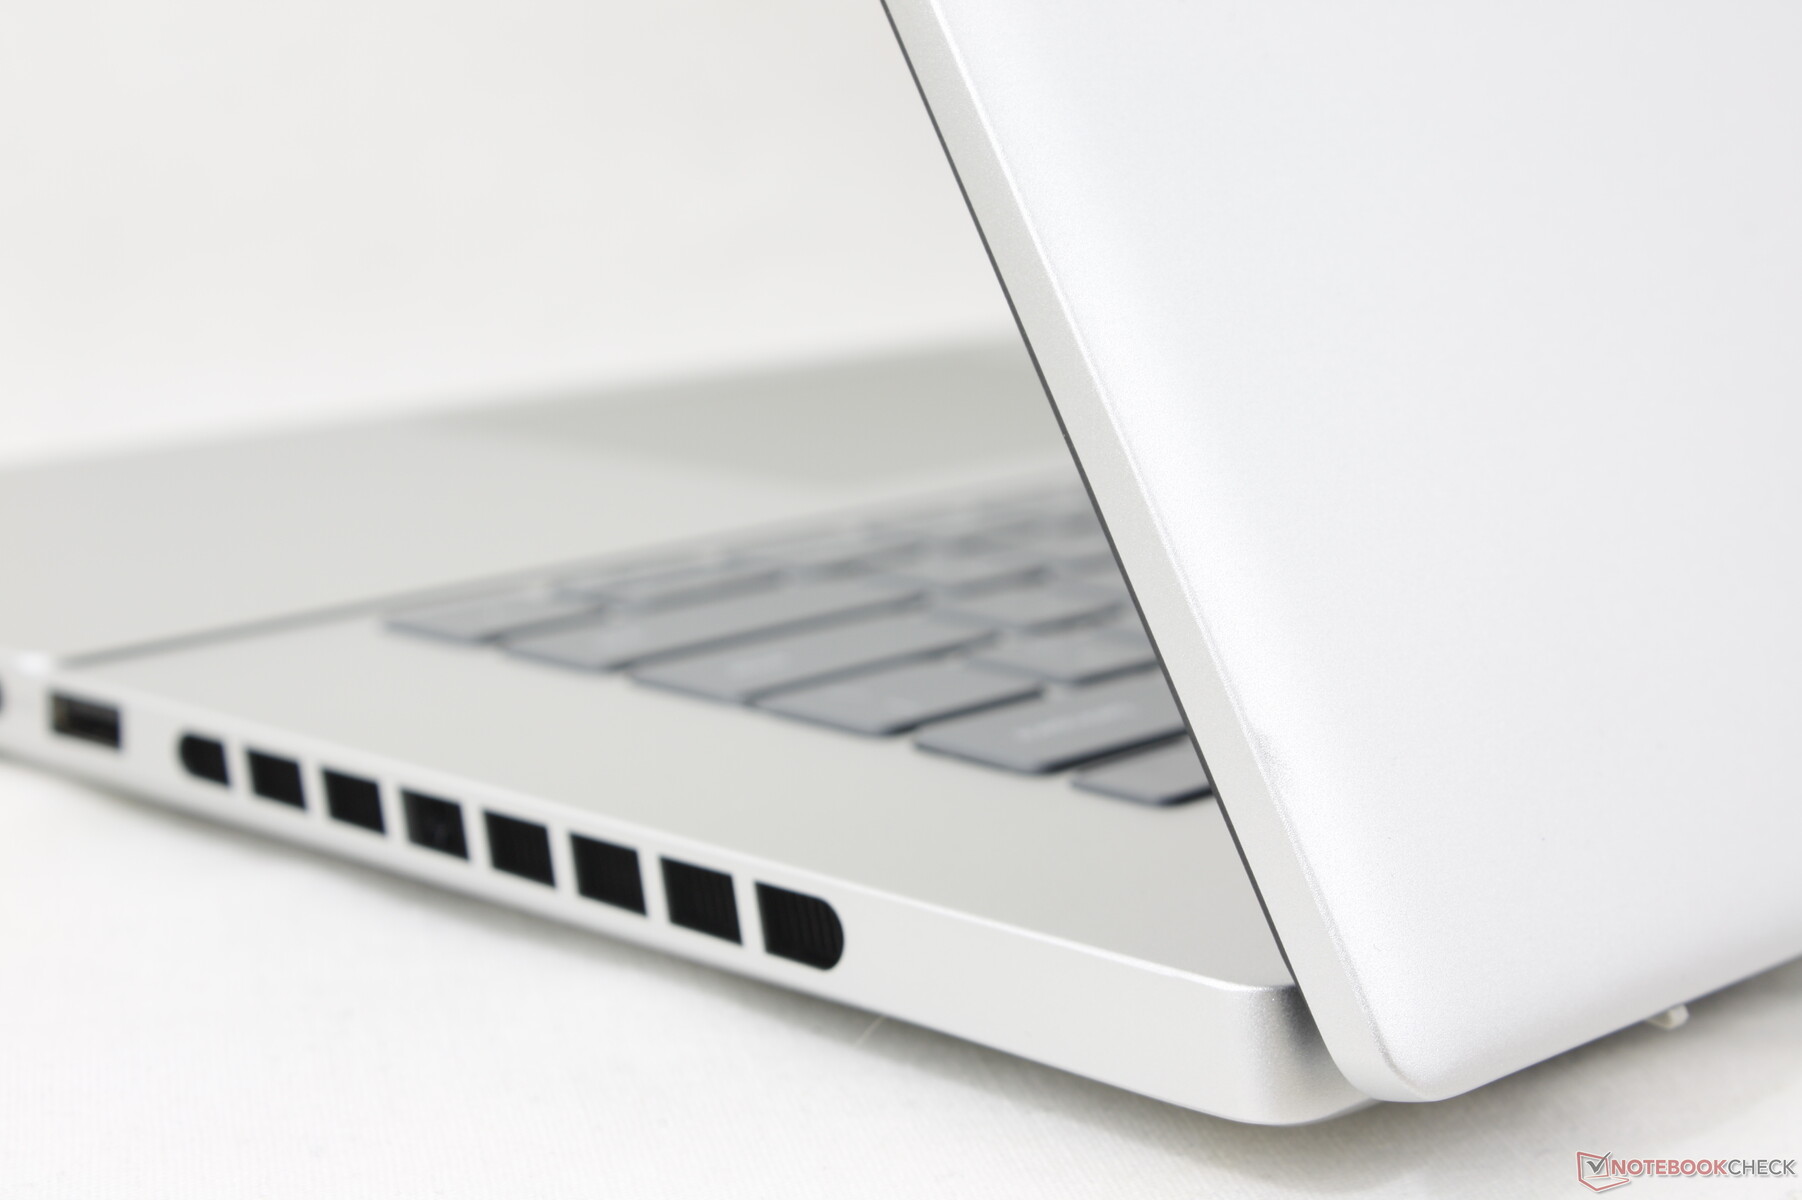
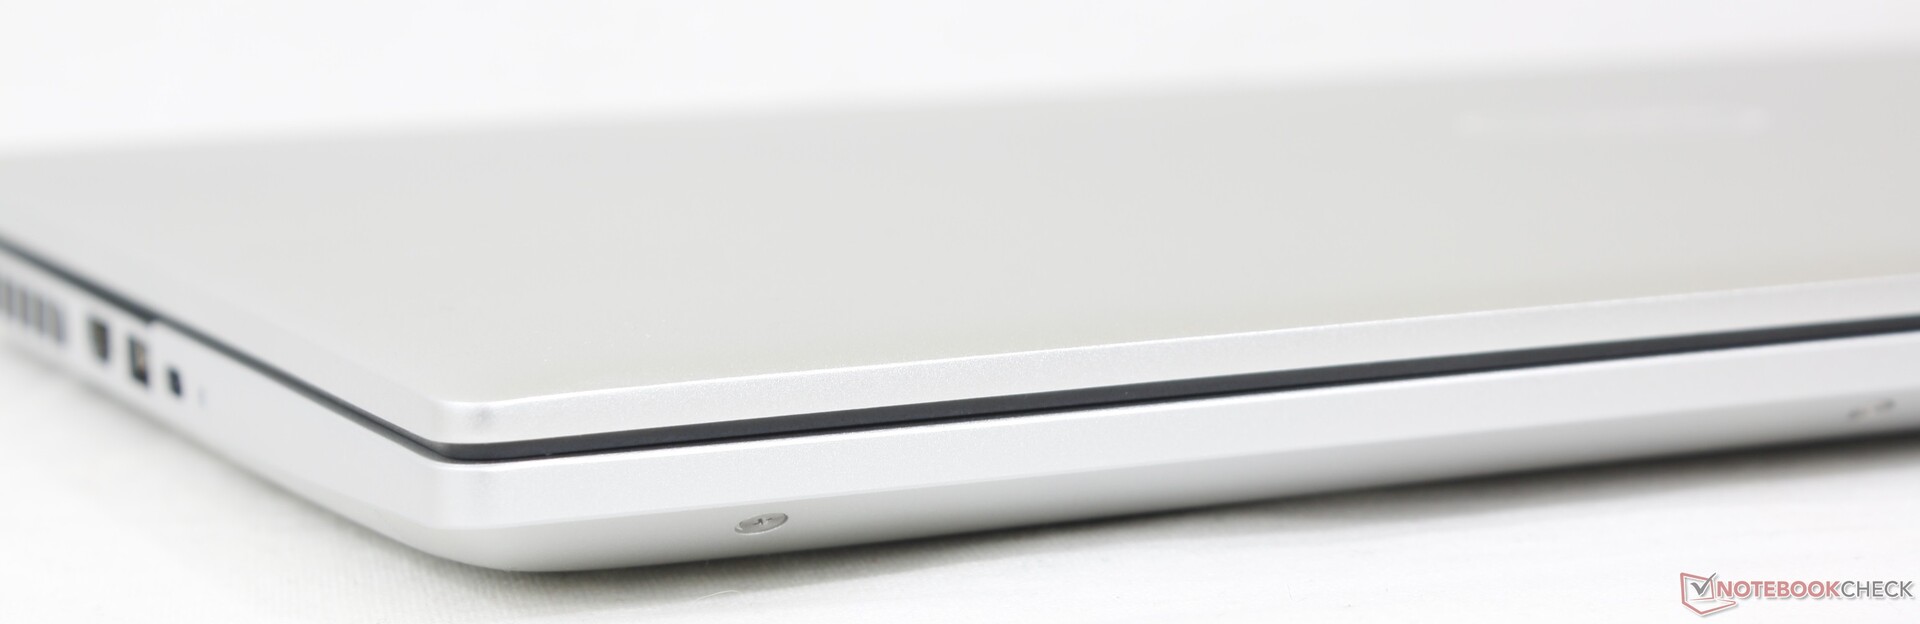
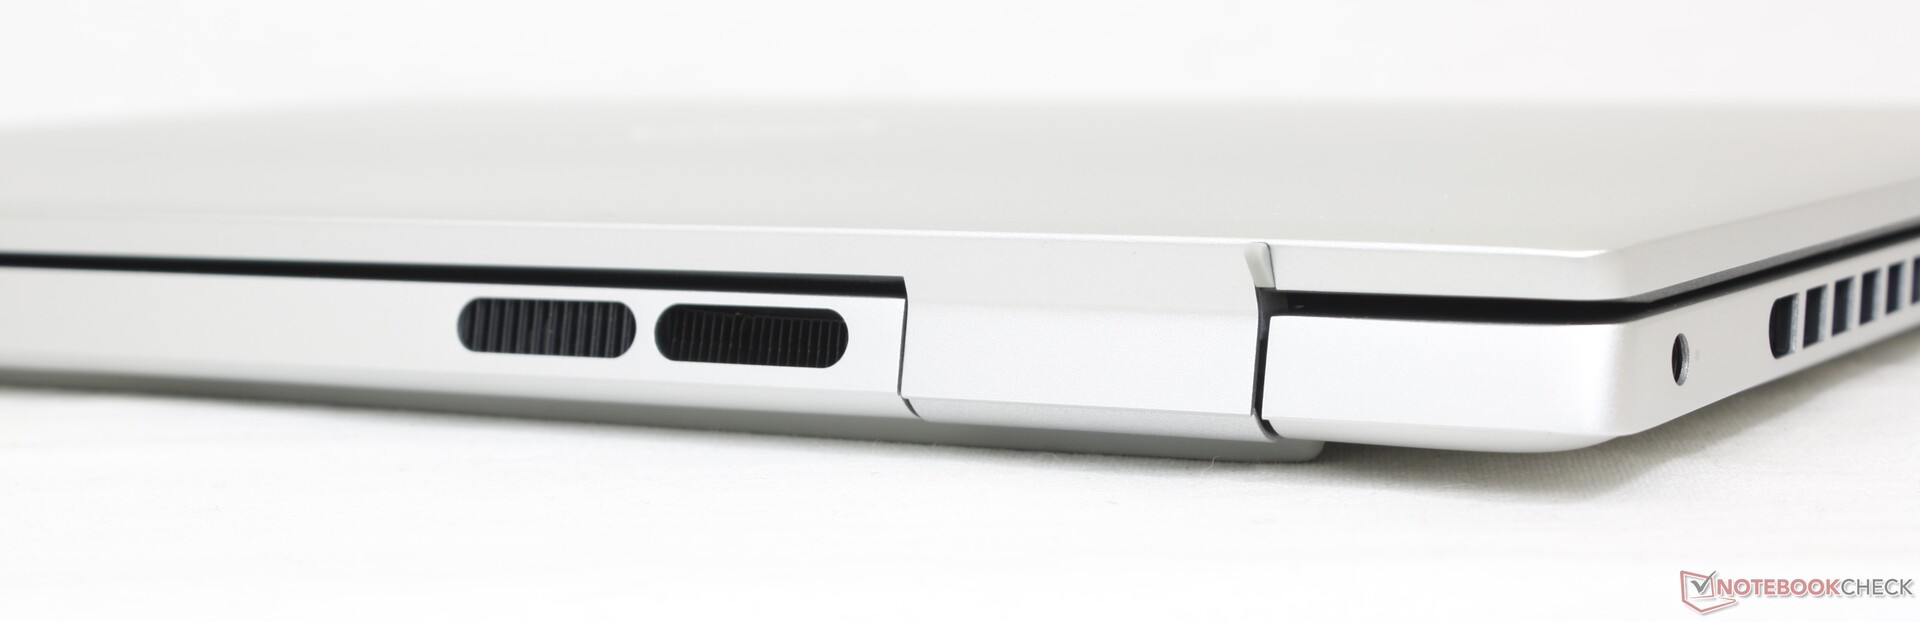
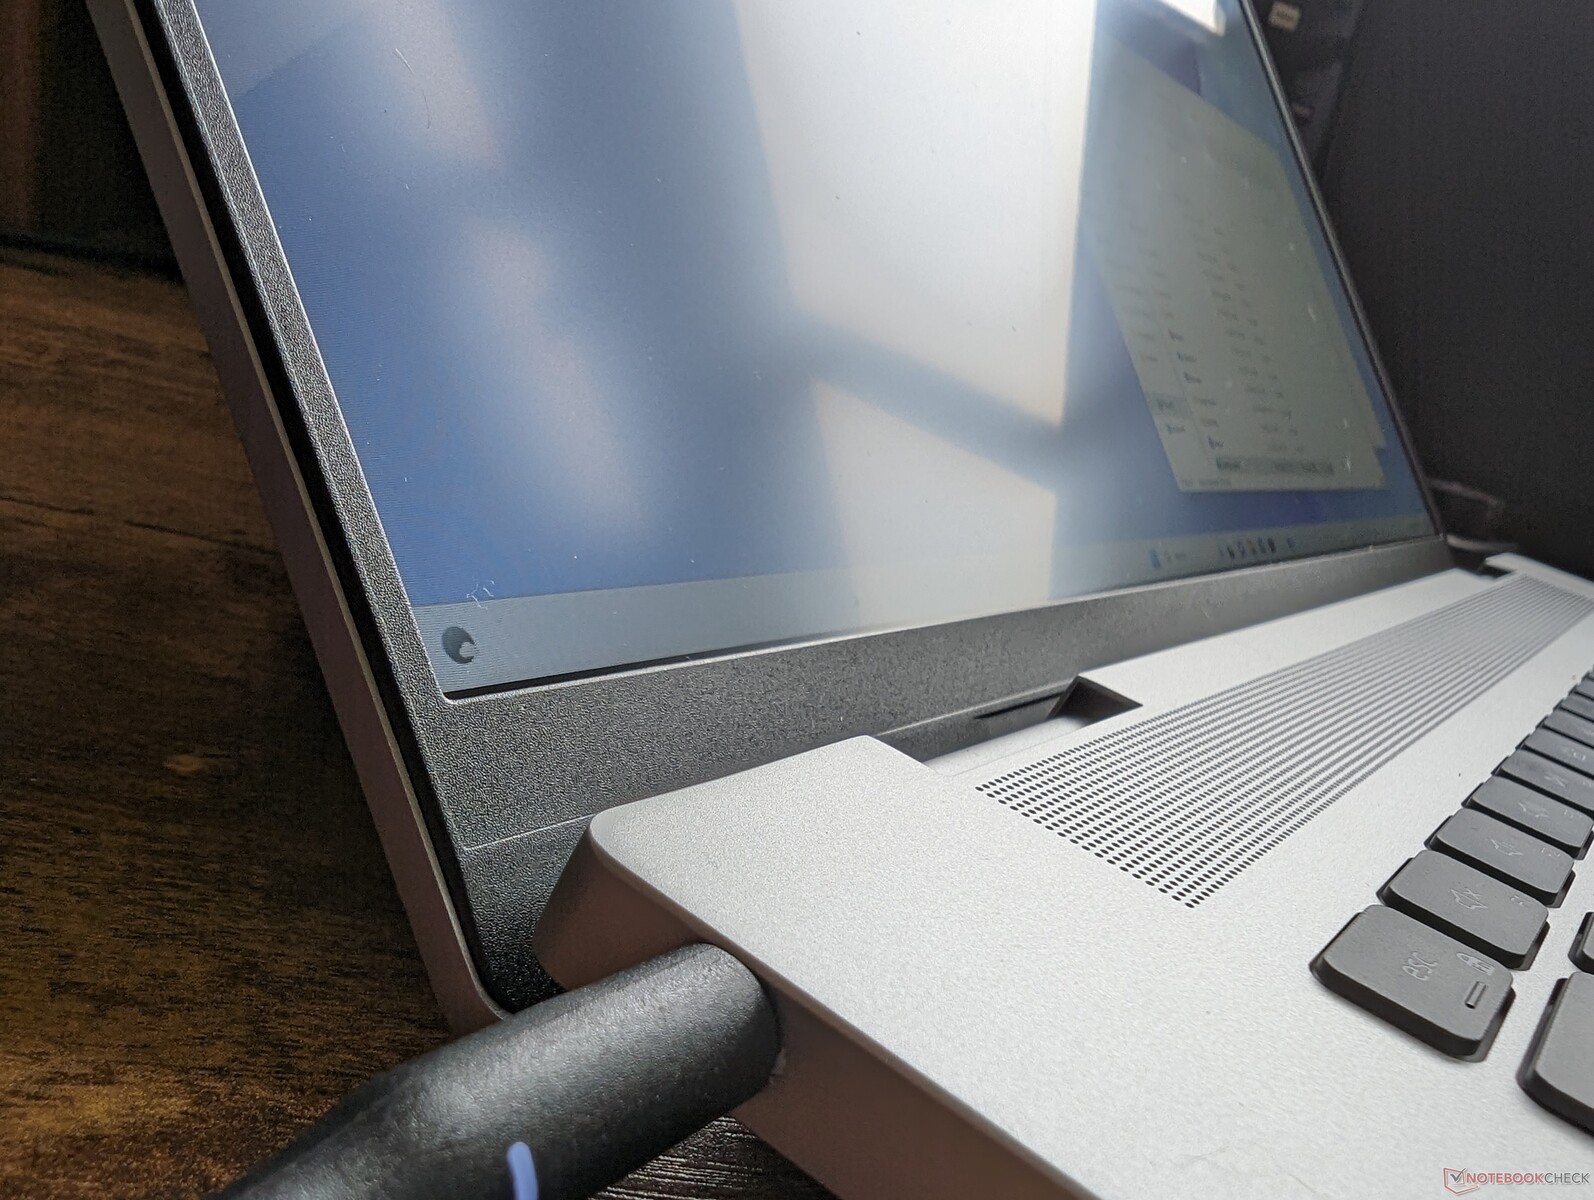
L'Inspiron 16 Plus 7630 présente trois changements extérieurs notables par rapport au modèle de l'année dernière. Tout d'abord, et c'est peut-être le plus important, les charnières ont été redessinées pour être plus épaisses et plus solides qu'auparavant. Deuxièmement, des grilles d'aération supplémentaires ont été ajoutées sur les bords pour faciliter le refroidissement. Enfin, les repose-poignets en Mylar et le pavé tactile ont été supprimés, comme sur l'Inspiron 16 Plus 7635 2-en-1. Les deux premiers éléments en particulier devraient augmenter la durée de vie du système, tandis que le dernier est probablement une mesure d'économie.
La rigidité du châssis est à peu près la même que celle de l'Inspiron 16 Plus 7620 puisque les matériaux utilisés sont les mêmes. La prise en main de l'appareil est similaire à celle de l'Inspiron 16 Plus 7620 Envy 16mais avec un couvercle un peu plus faible puisque le Dell n'a pas de renfort en verre Gorilla.
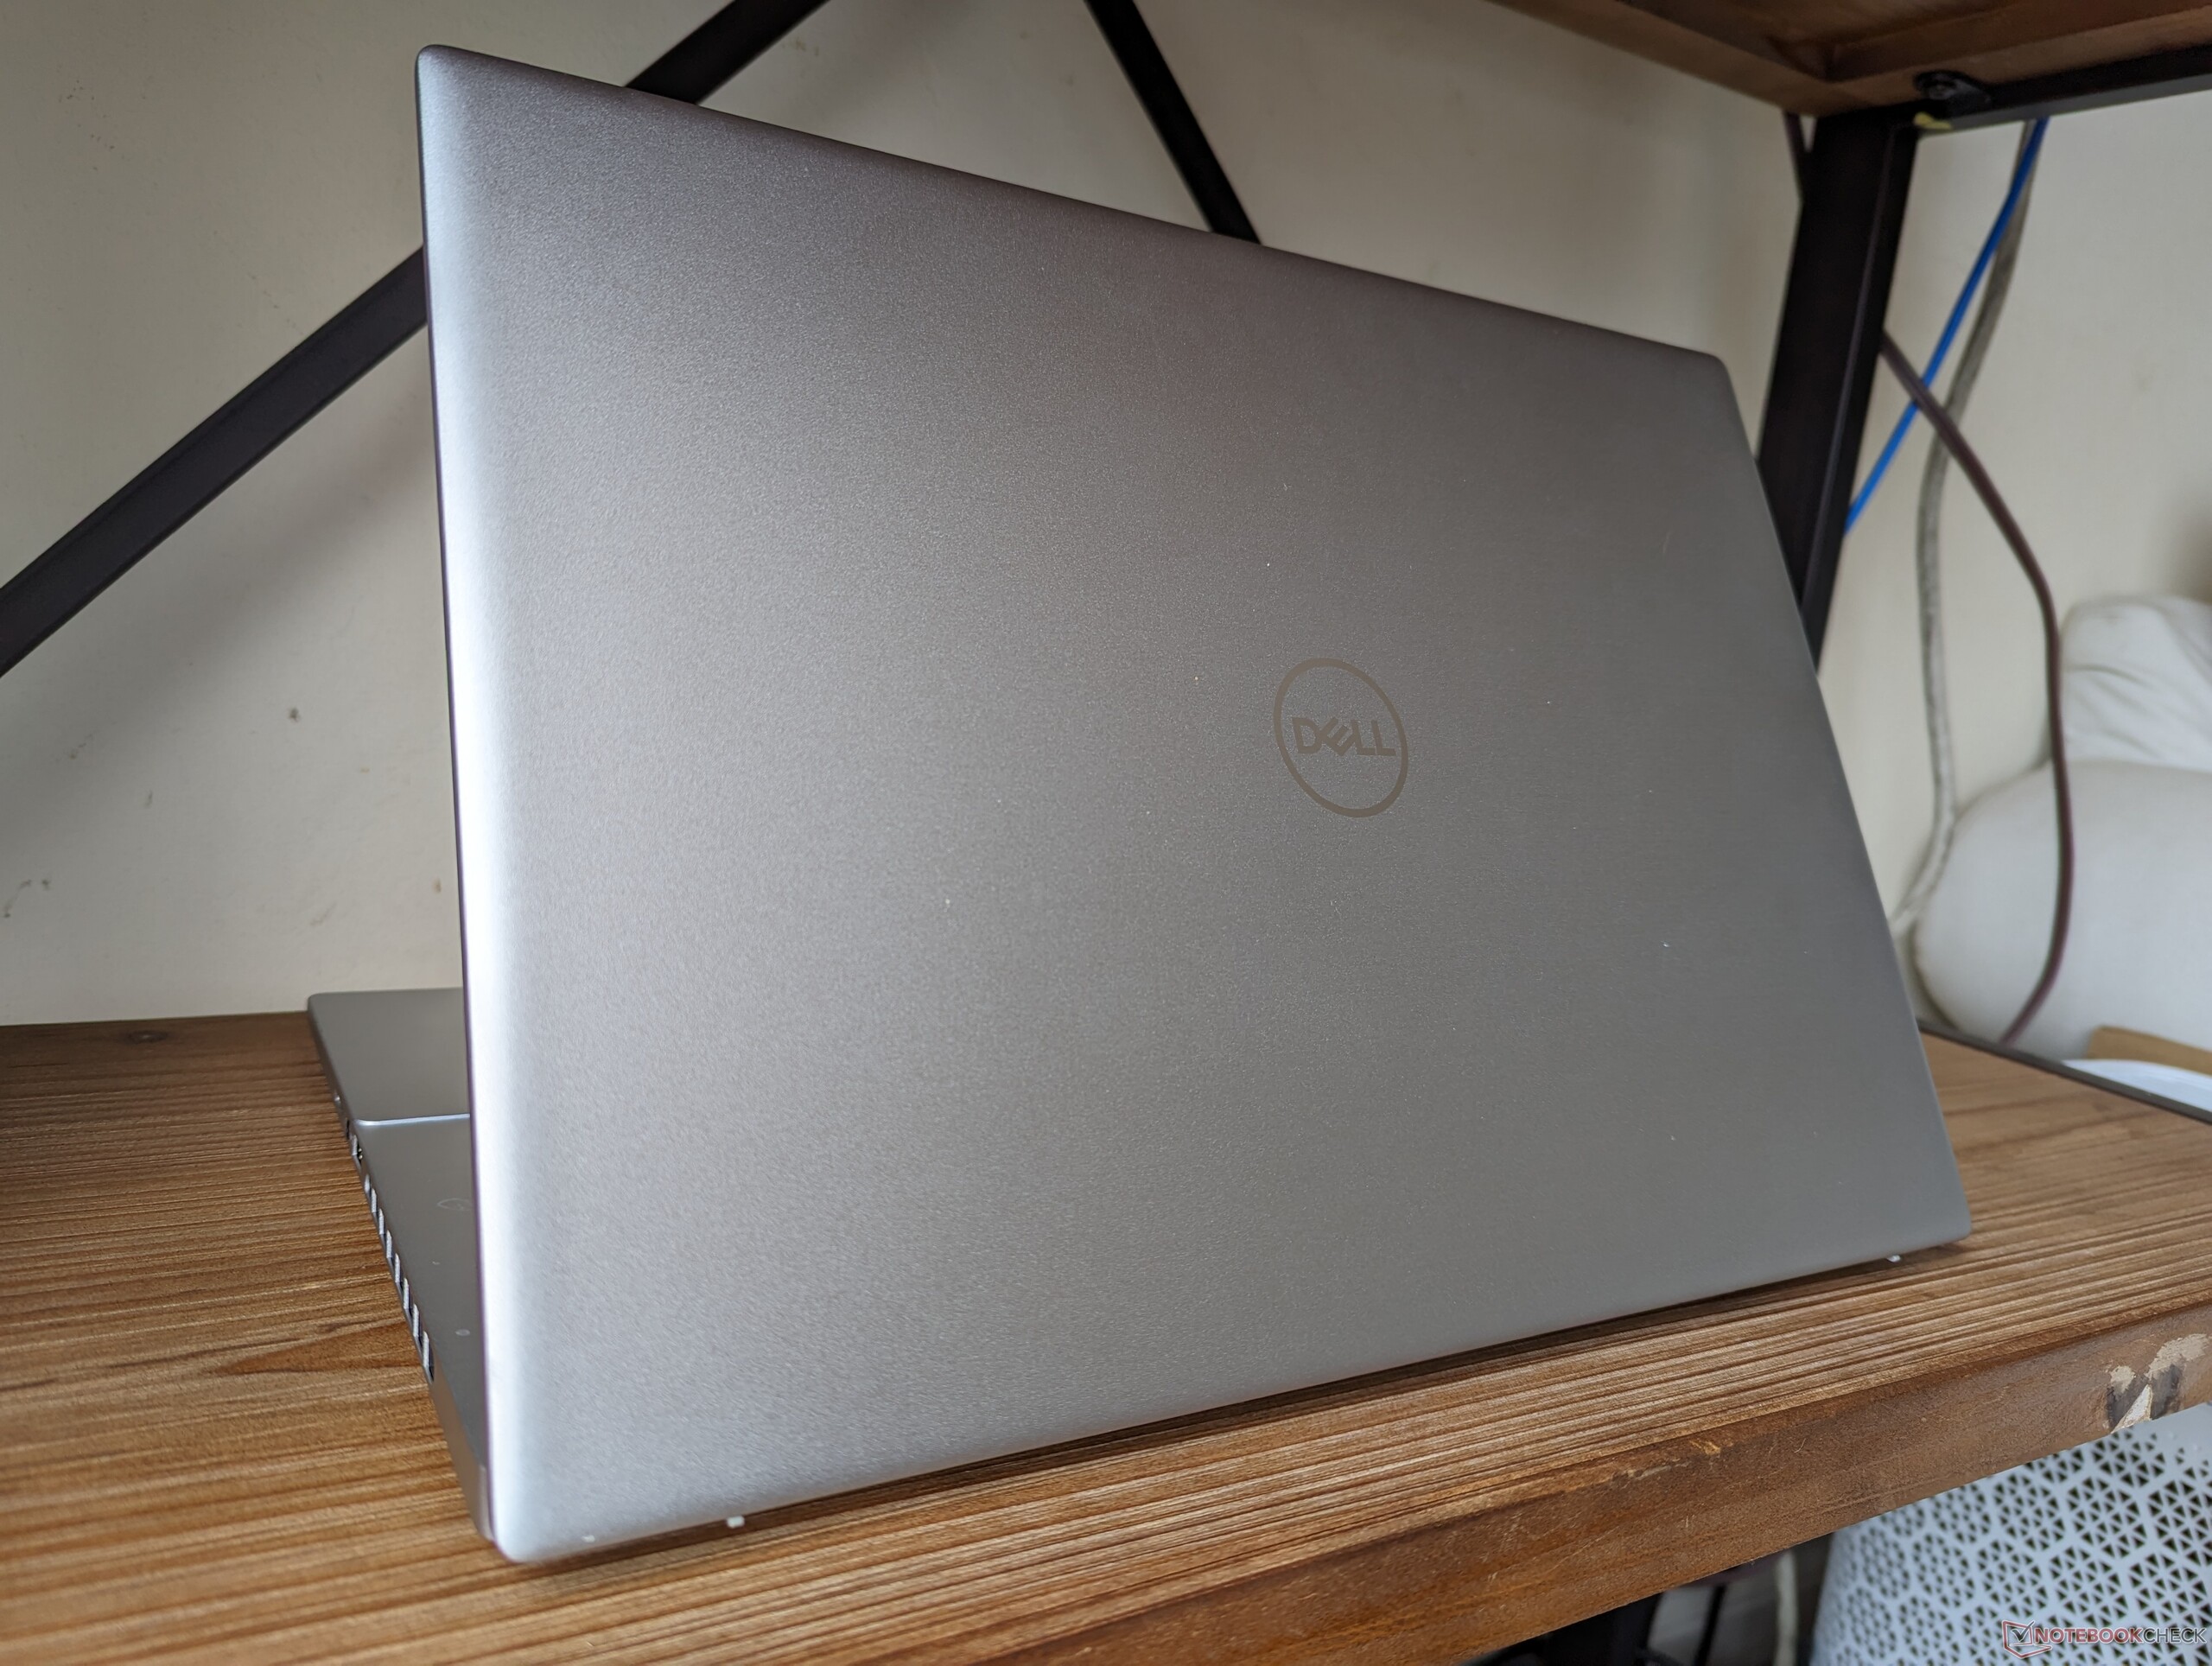
Les dimensions et le poids restent à peu près les mêmes que ceux du modèle de l'année dernière, si ce n'est qu'il est légèrement plus lourd d'environ 100 g. Bien qu'il ne soit pas vraiment léger, le modèle Dell reste comparable à d'autres modèles tels que le Slim Pro 9i 16 ou l'Envy 16 Envy 16 à cet égard.
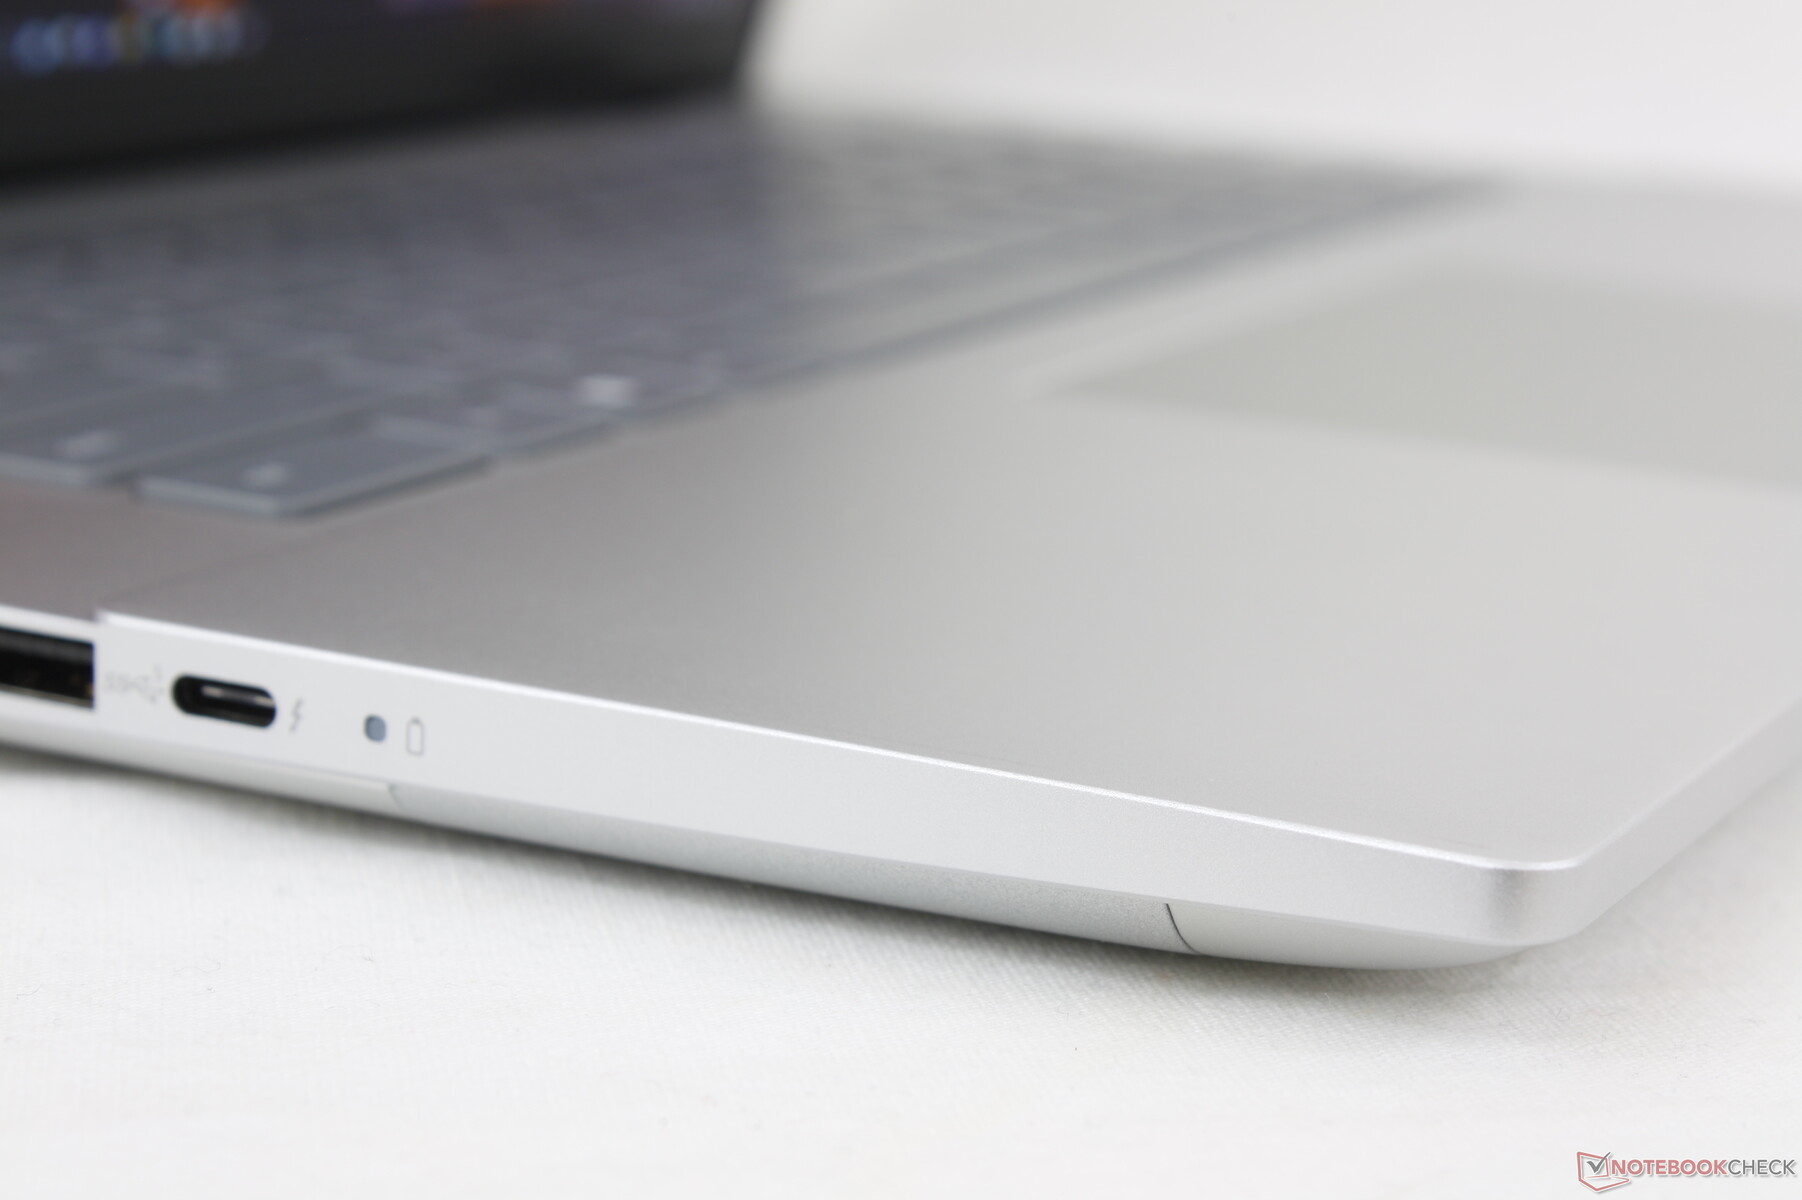
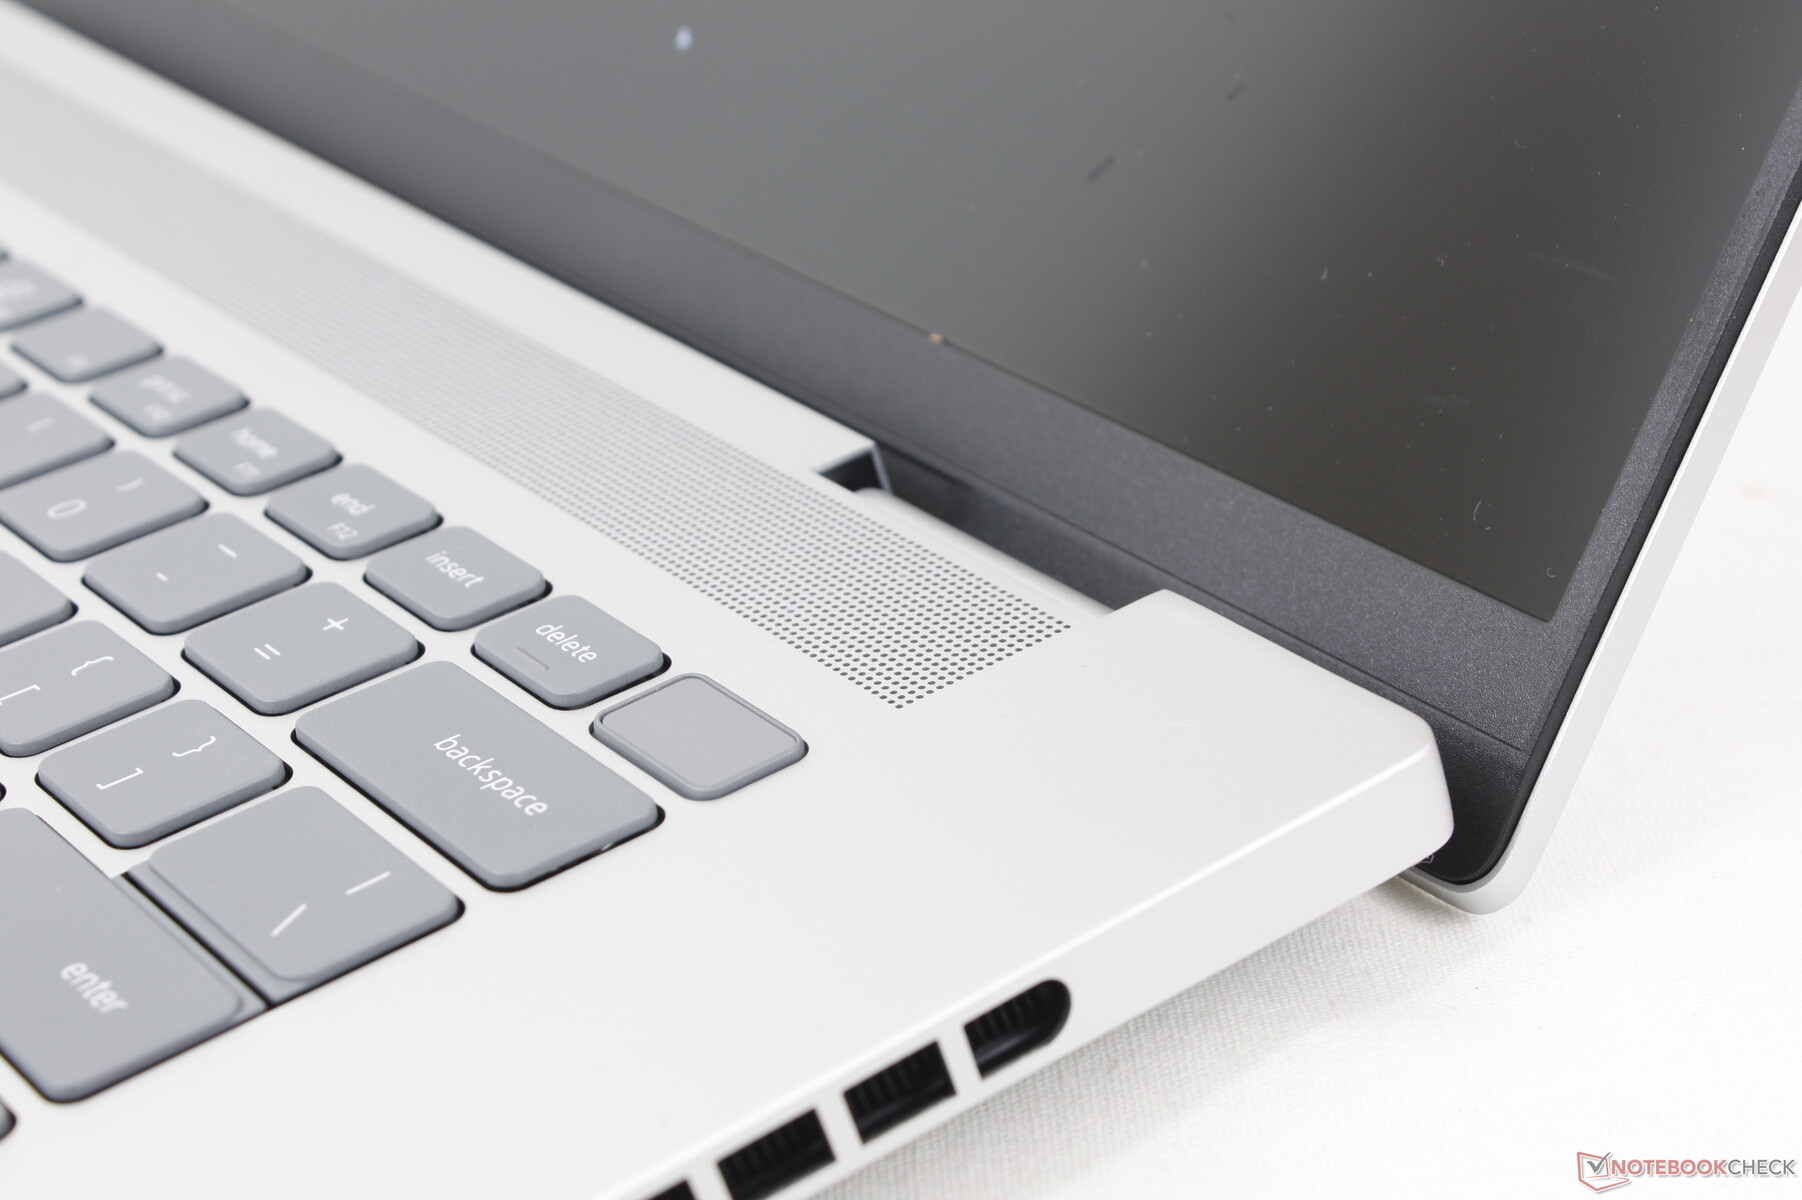
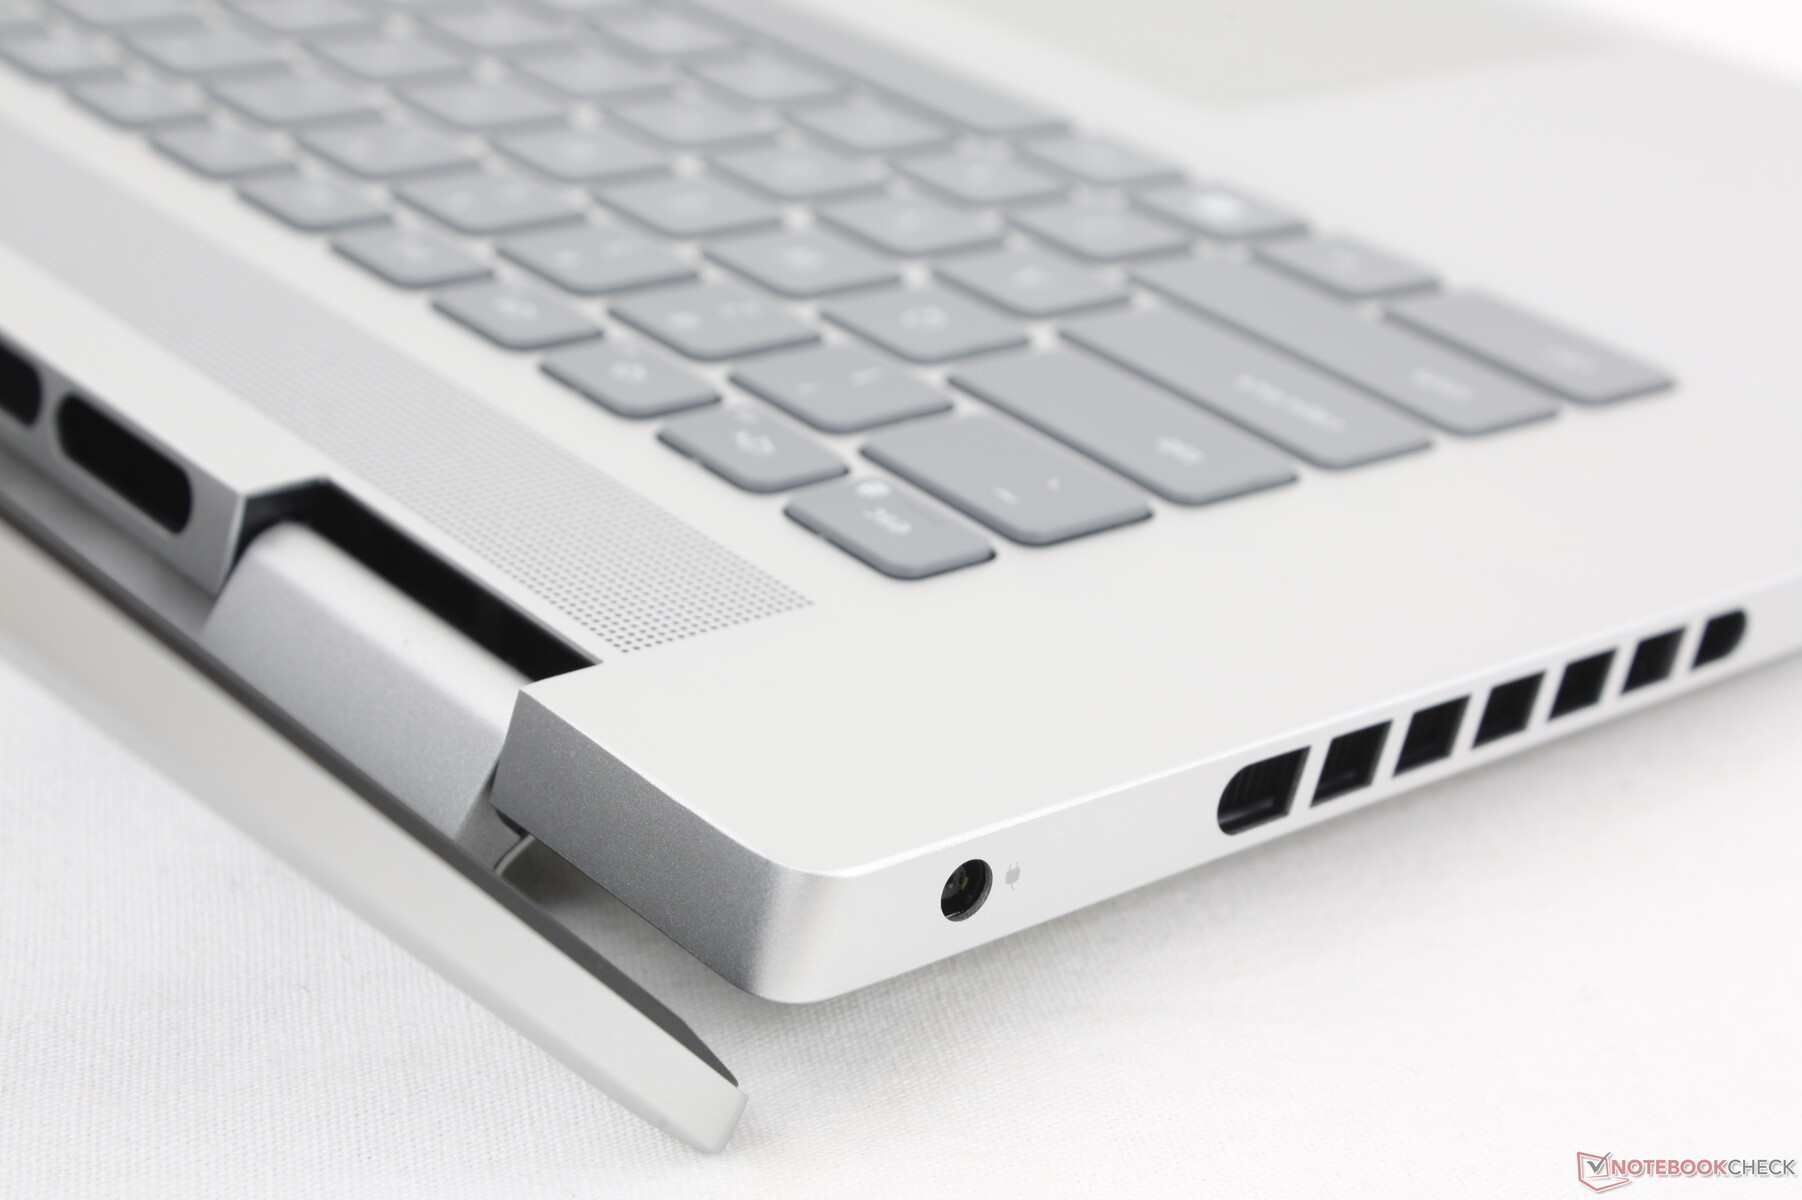
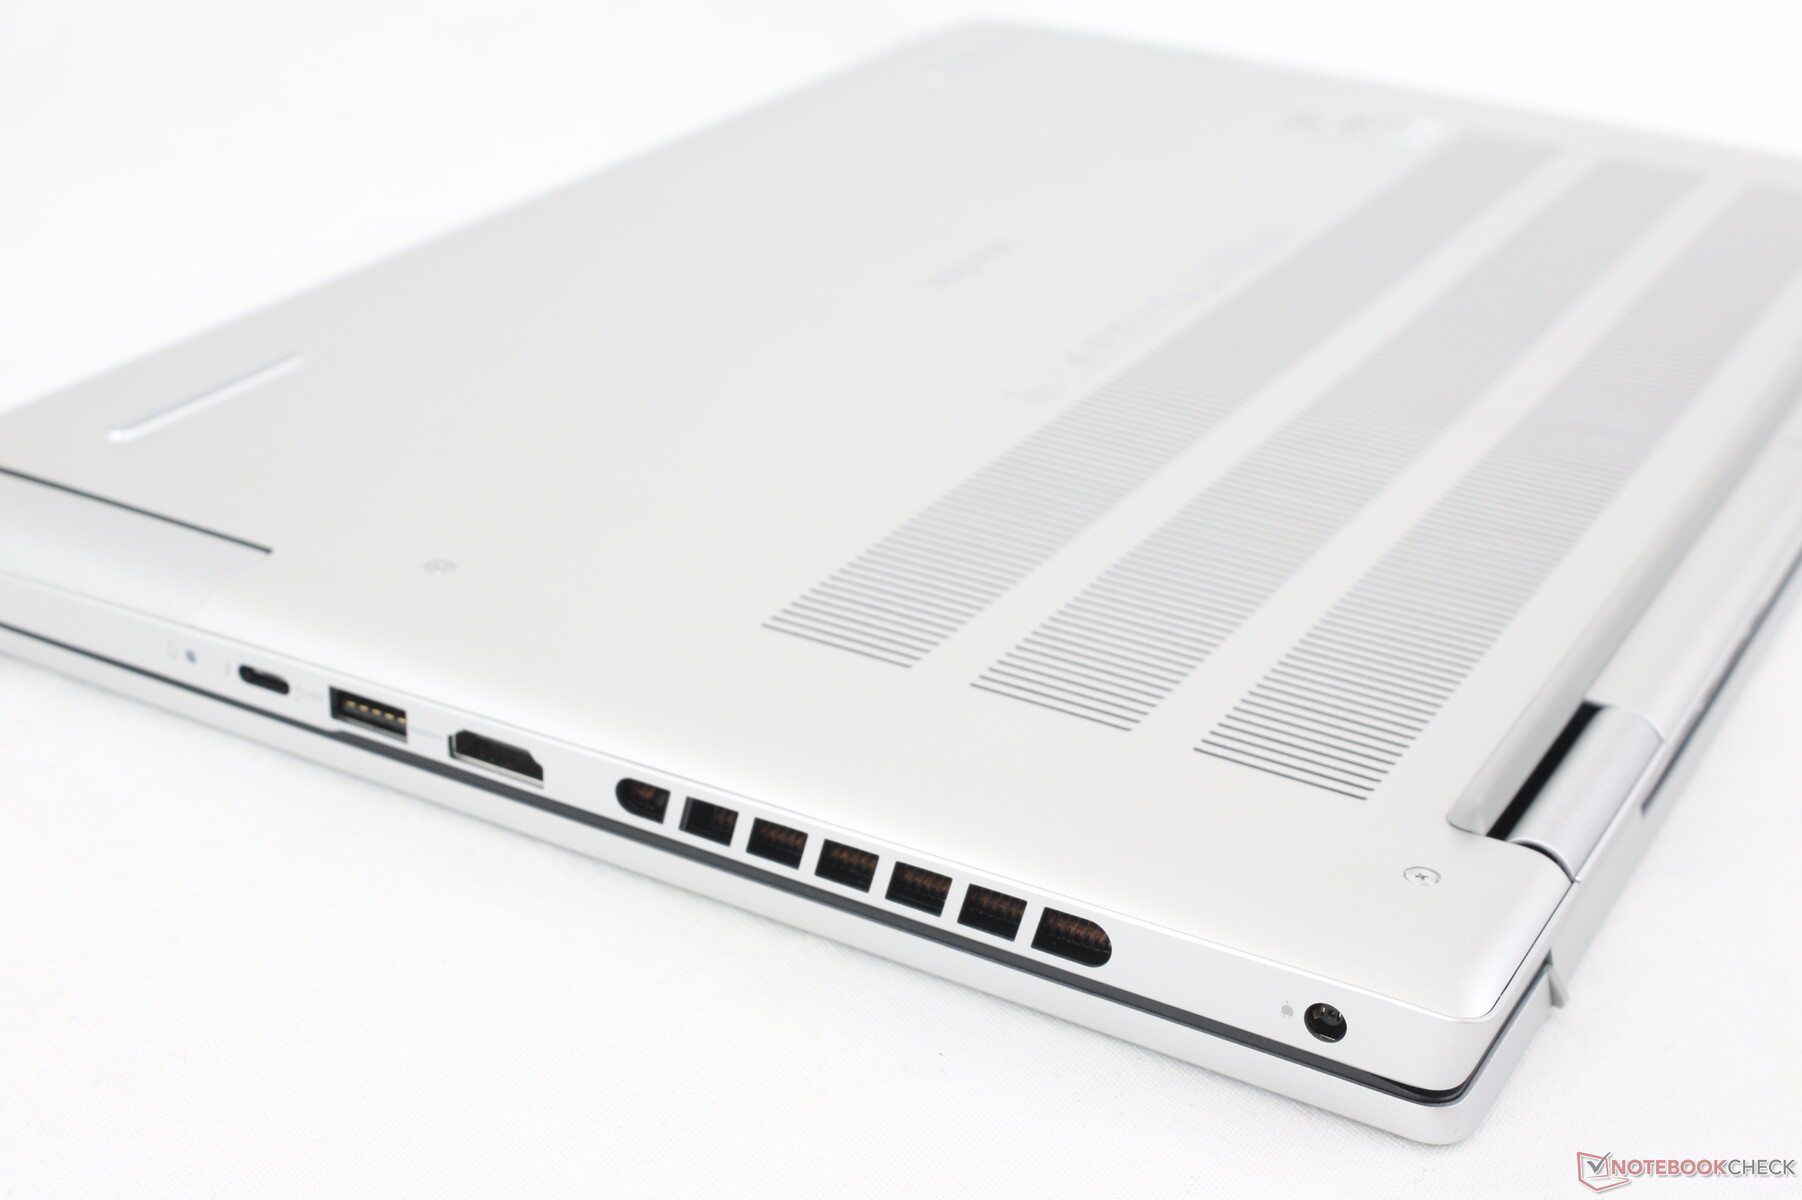
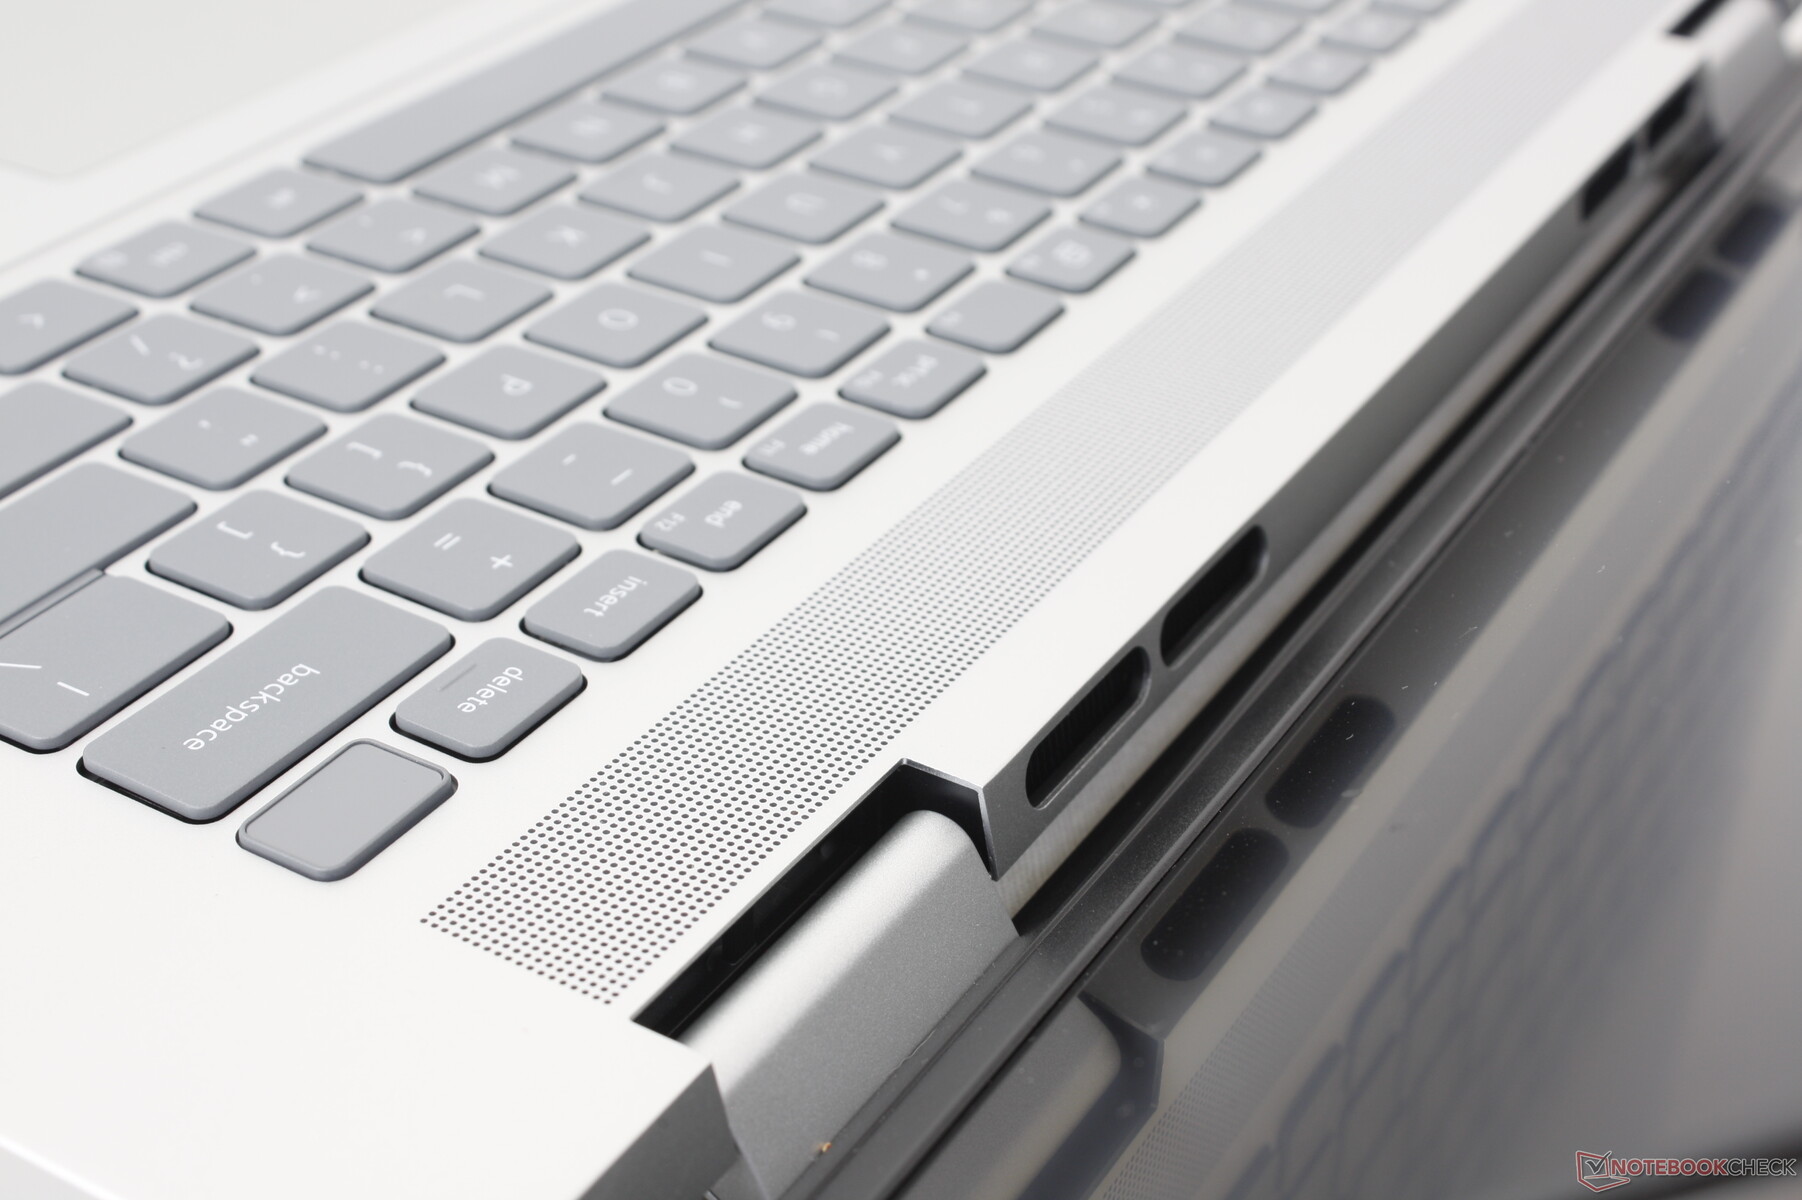
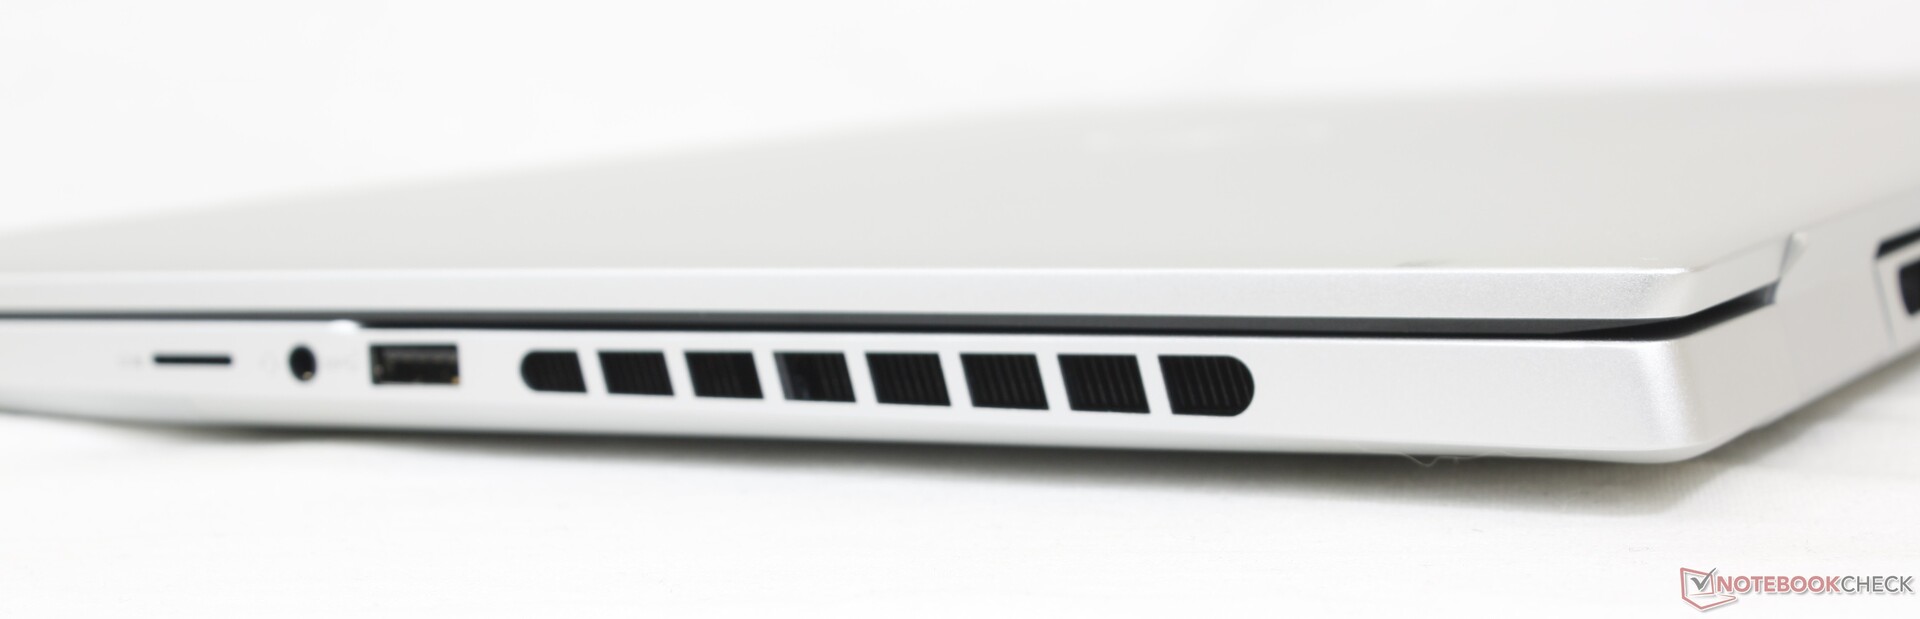
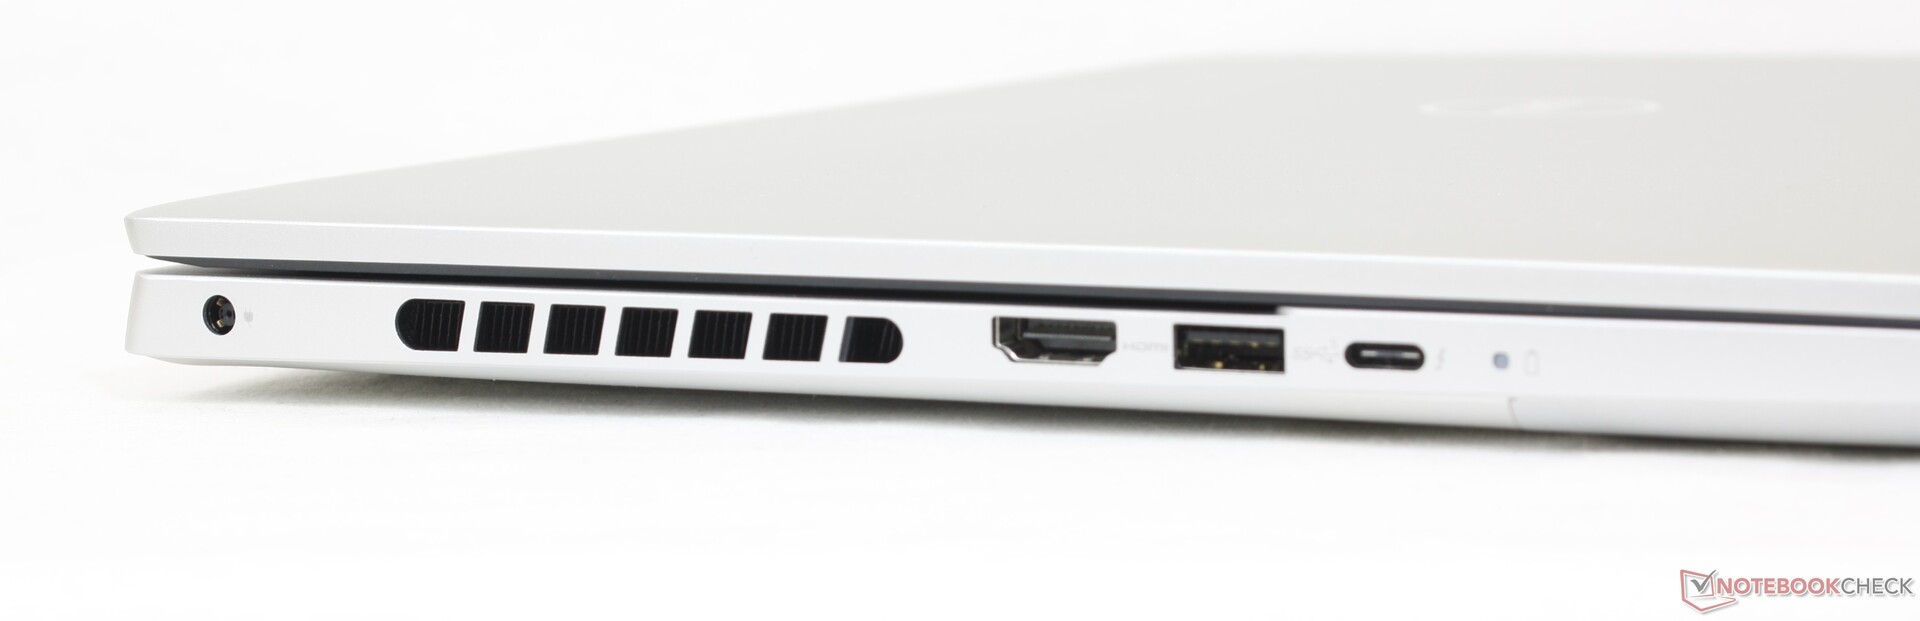
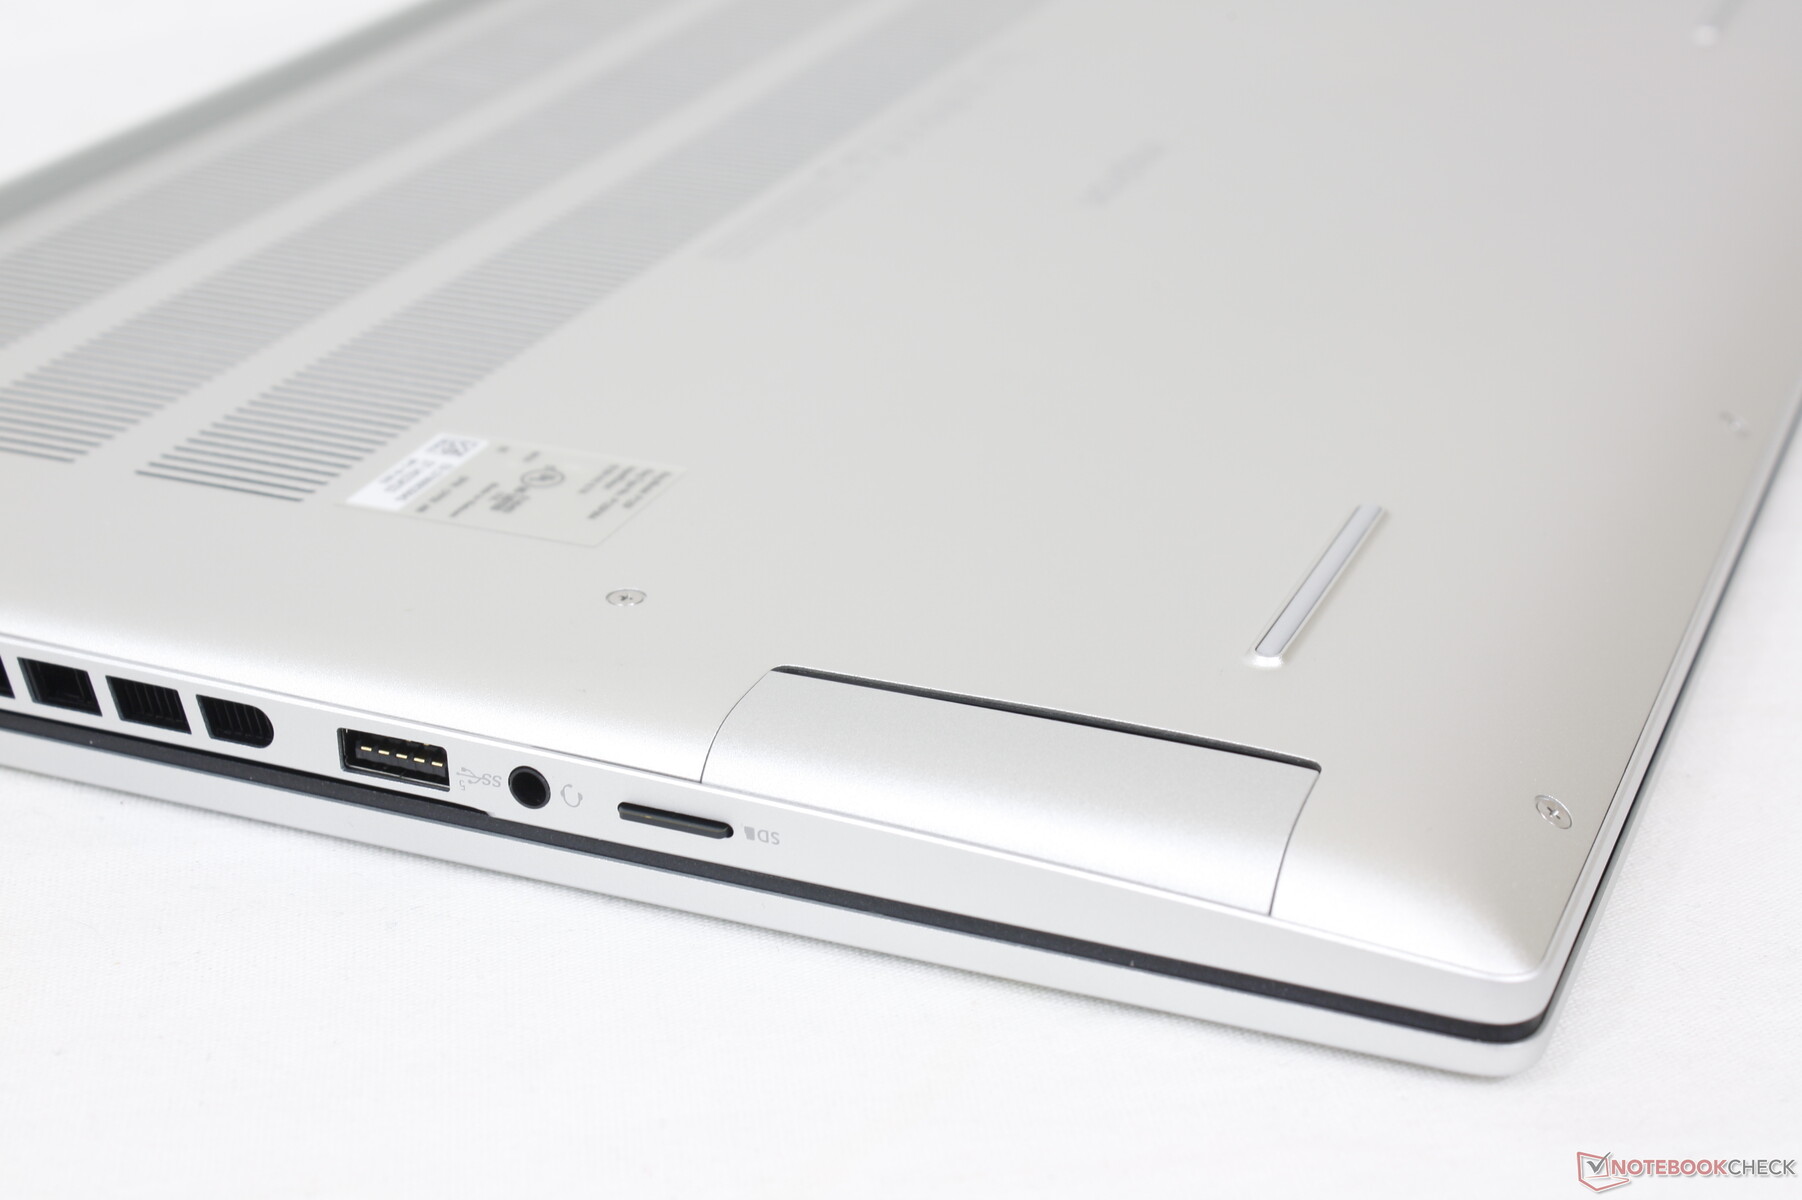
Connectivité - Plus d'USB-C
Le positionnement des ports et les options sont les mêmes que sur le modèle de l'année dernière, mais avec une baisse notable : le lecteur de carte SD de taille normale a été remplacé par un lecteur microSD plus petit sur toutes les configurations de la RTX 4060. Des alternatives comme l'Envy 16 ou le VivoBook Pro 16X intègrent plus de ports USB-C que notre Dell ou disposent de lecteurs de cartes SD de taille normale.
Nous aimerions également que les futurs modèles Inspiron abandonnent le port canon de l'adaptateur secteur propriétaire en faveur de la charge USB-C, comme sur les séries XPS 15 et XPS 17.
Lecteur de carte SD
Alors que la série XPS abrite certains des lecteurs de cartes SD les plus rapides de tous les ordinateurs portables, la série Inspiron comprend certains des plus lents. Transférer 1 Go de photos de notre carte de test UHS-II vers l'ordinateur de bureau prendrait plus de 50 secondes, contre seulement 5 à 6 secondes sur un XPS 15 ou XPS 17.
| SD Card Reader | |
| average JPG Copy Test (av. of 3 runs) | |
| MSI Summit E16 Flip A12UDT-031 (AV Pro SD microSD 128 GB V60) | |
| Asus Vivobook Pro 16X K6604JV-MX016W | |
| Lenovo Slim Pro 9i 16IRP8 (PNY EliteX-Pro60 V60 256 GB) | |
| HP Envy 16 h0112nr (AV Pro SD microSD 128 GB V60) | |
| Dell Inspiron 16 Plus 7620 (Toshiba Exceria Pro SDXC 64 GB UHS-II) | |
| Dell Inspiron 16 Plus 7630 (AV Pro SD microSD 128 GB V60) | |
| maximum AS SSD Seq Read Test (1GB) | |
| MSI Summit E16 Flip A12UDT-031 (AV Pro SD microSD 128 GB V60) | |
| Asus Vivobook Pro 16X K6604JV-MX016W | |
| Lenovo Slim Pro 9i 16IRP8 (PNY EliteX-Pro60 V60 256 GB) | |
| HP Envy 16 h0112nr (AV Pro SD microSD 128 GB V60) | |
| Dell Inspiron 16 Plus 7620 (Toshiba Exceria Pro SDXC 64 GB UHS-II) | |
| Dell Inspiron 16 Plus 7630 (AV Pro SD microSD 128 GB V60) | |
Communication
Un Intel AX211 est fourni en standard pour la connectivité Wi-Fi 6E et Bluetooth 5.3. Nous avons constaté des performances stables et fiables lorsque nous l'avons couplé à notre réseau de test Asus AXE11000 6GHz.
Un module MediaTek est inclus à la place s'il est configuré avec un CPU AMD.
Webcam
La webcam de 2 mégapixels est devenue la norme sur la plupart des ordinateurs portables multimédias. Les modèles plus chers de HP incluent des webcams de 5 MP ou même de 8 MP si la qualité de la webcam est une priorité.
Un curseur physique est inclus pour la confidentialité, mais l'infrarouge n'est pas pris en charge.


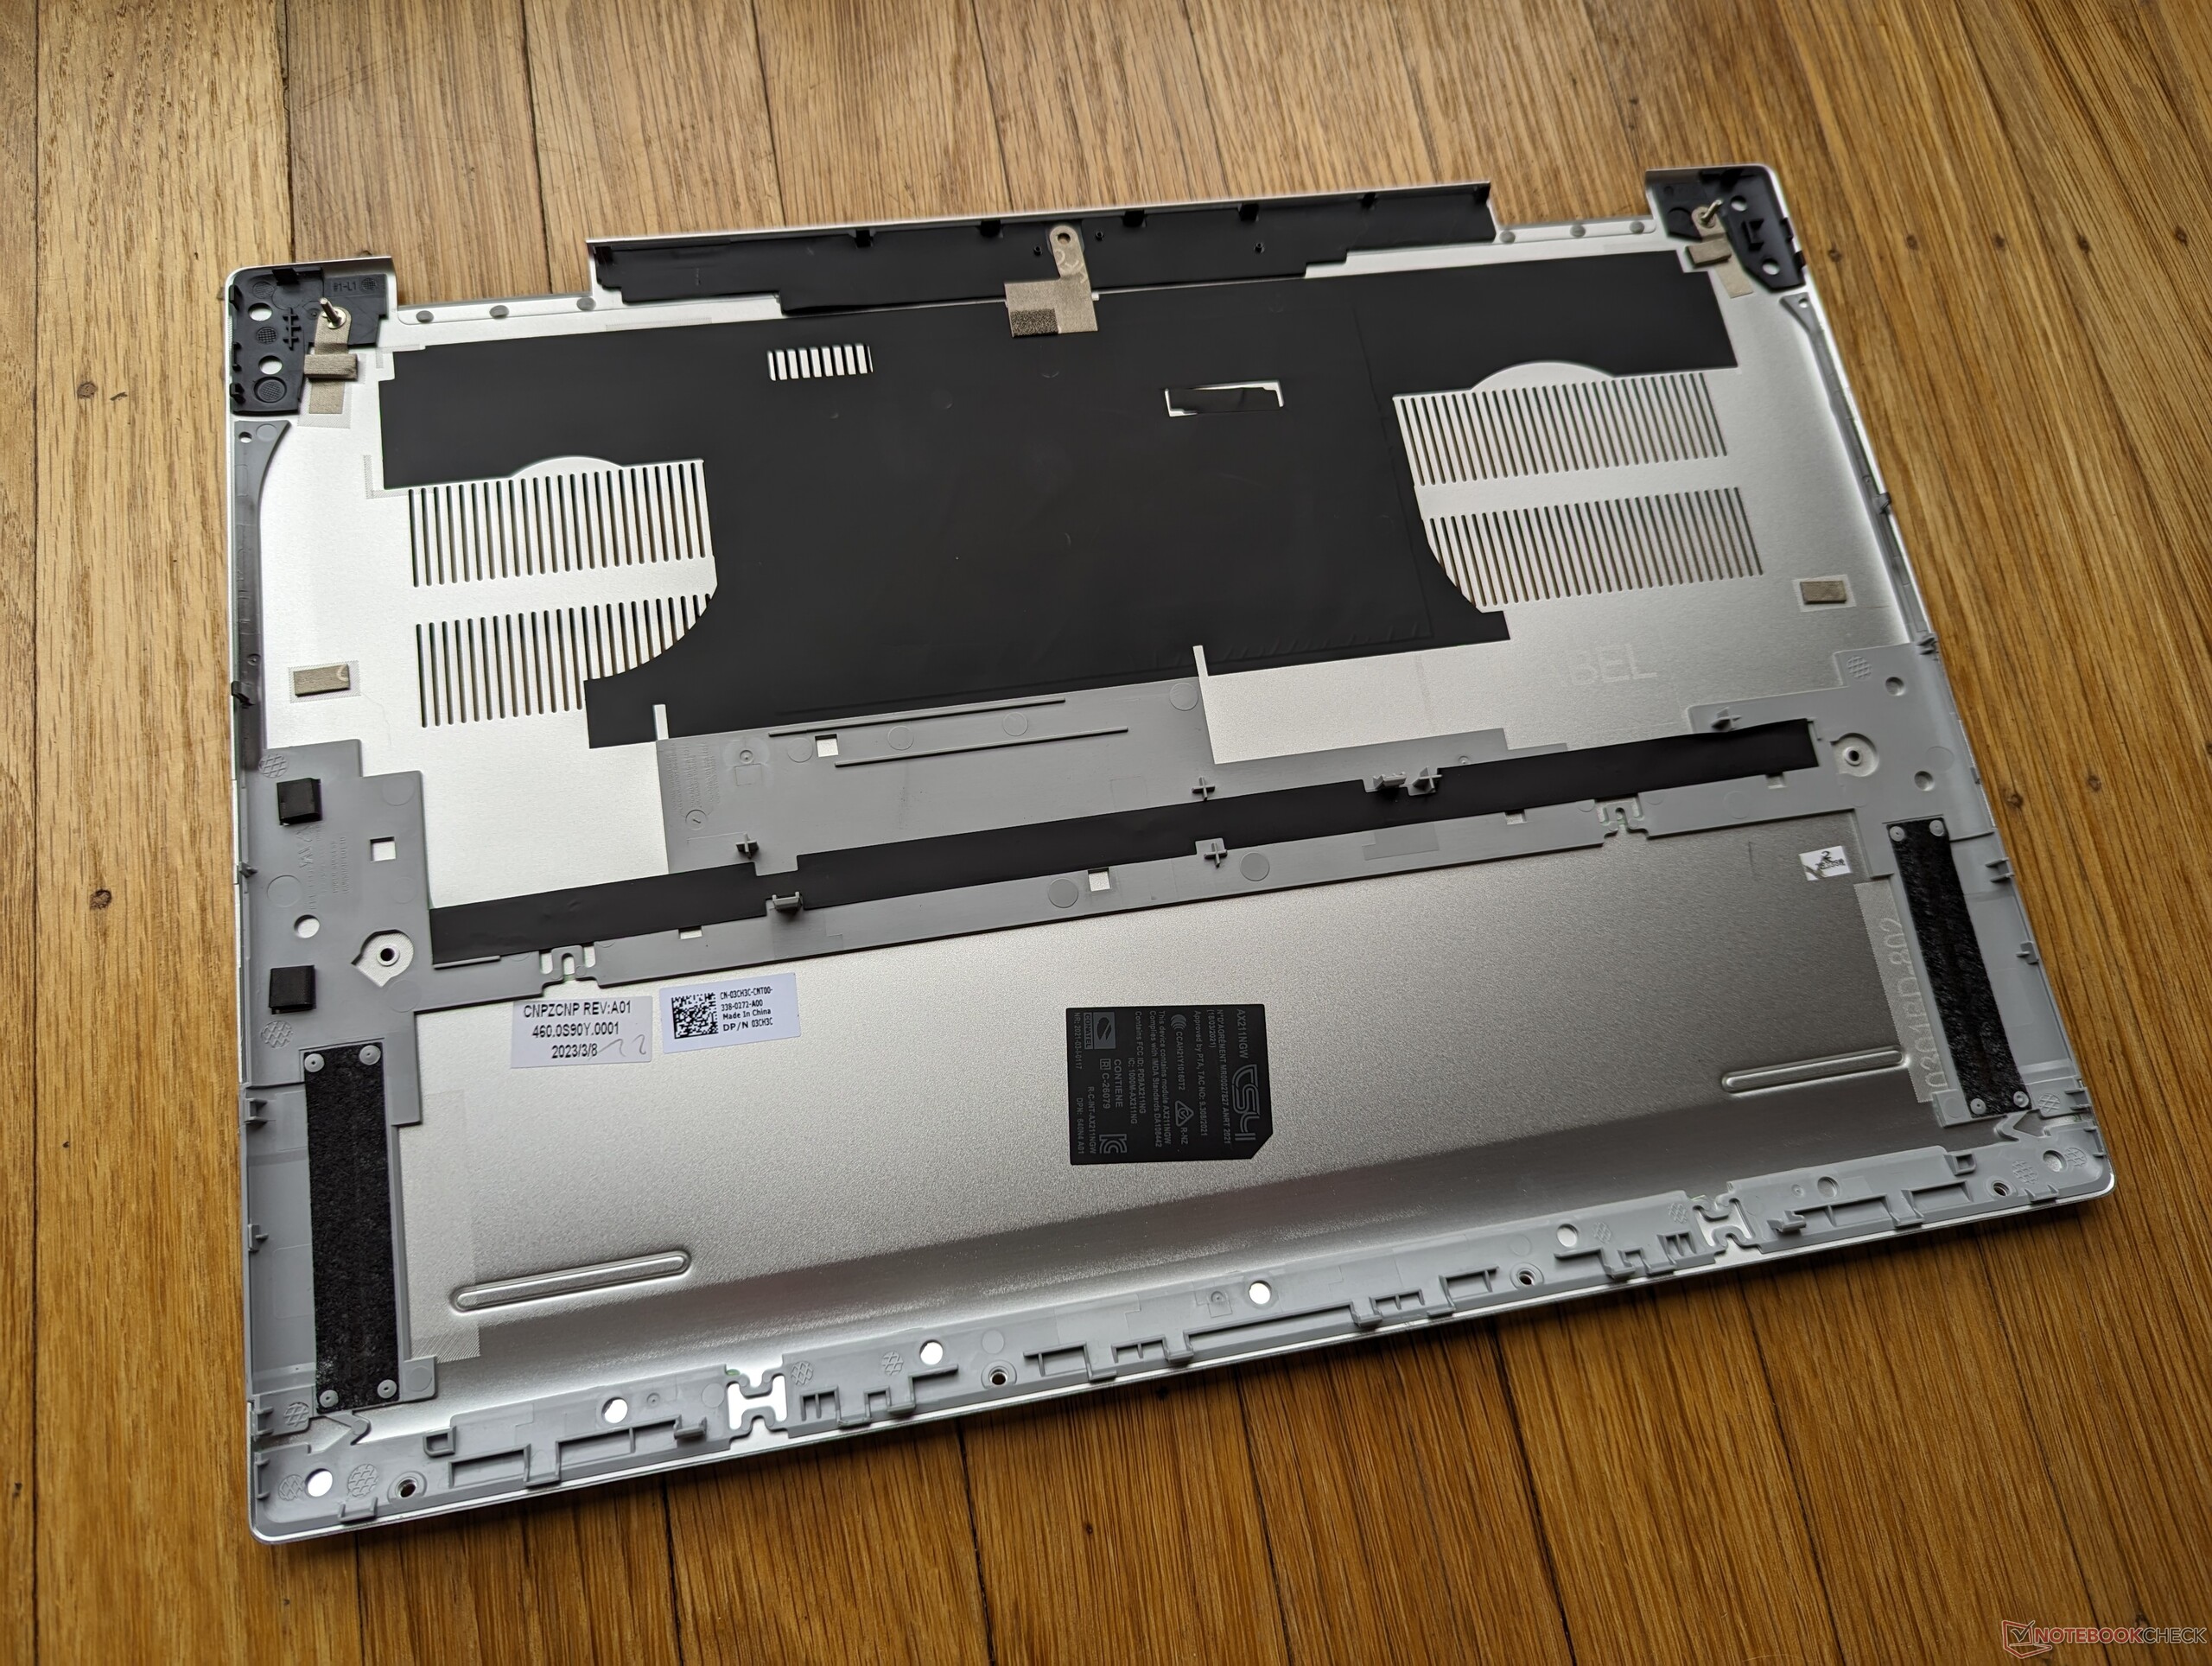
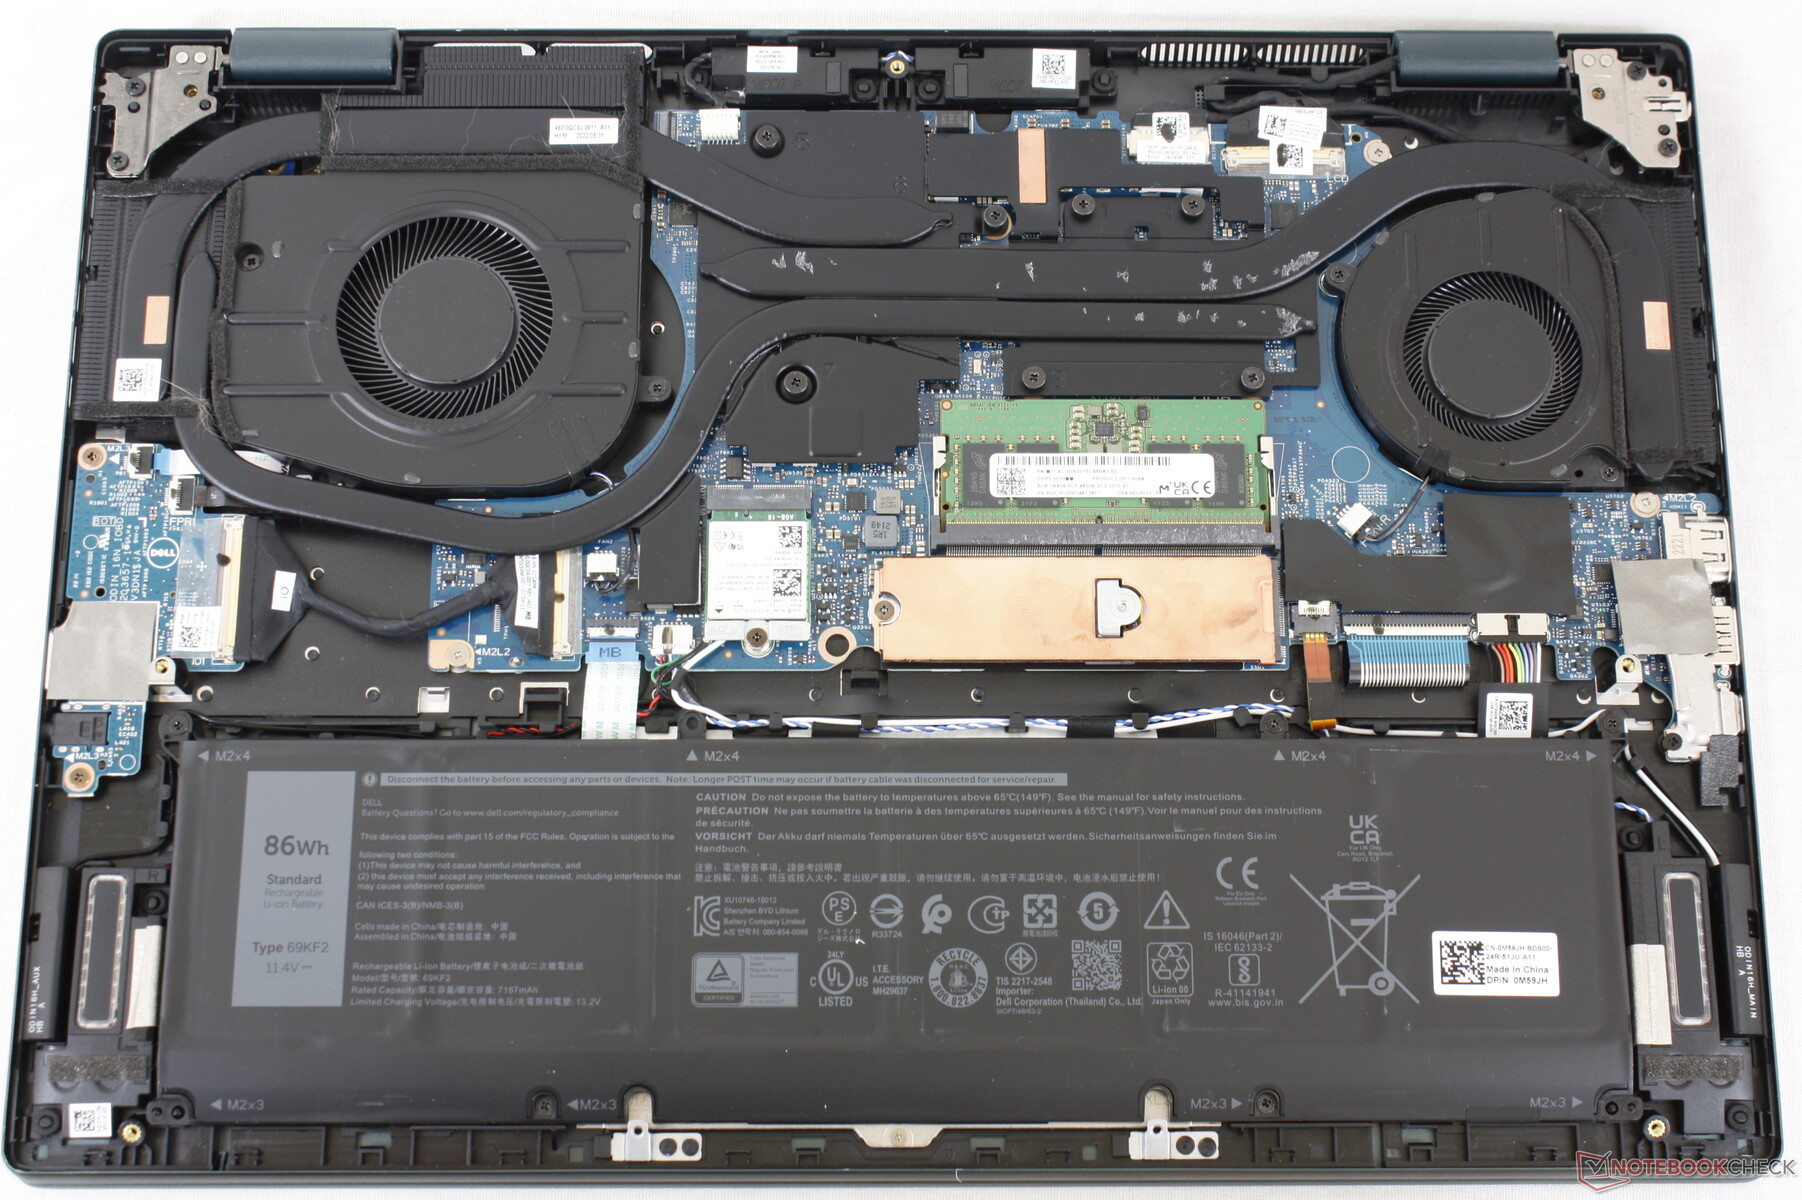
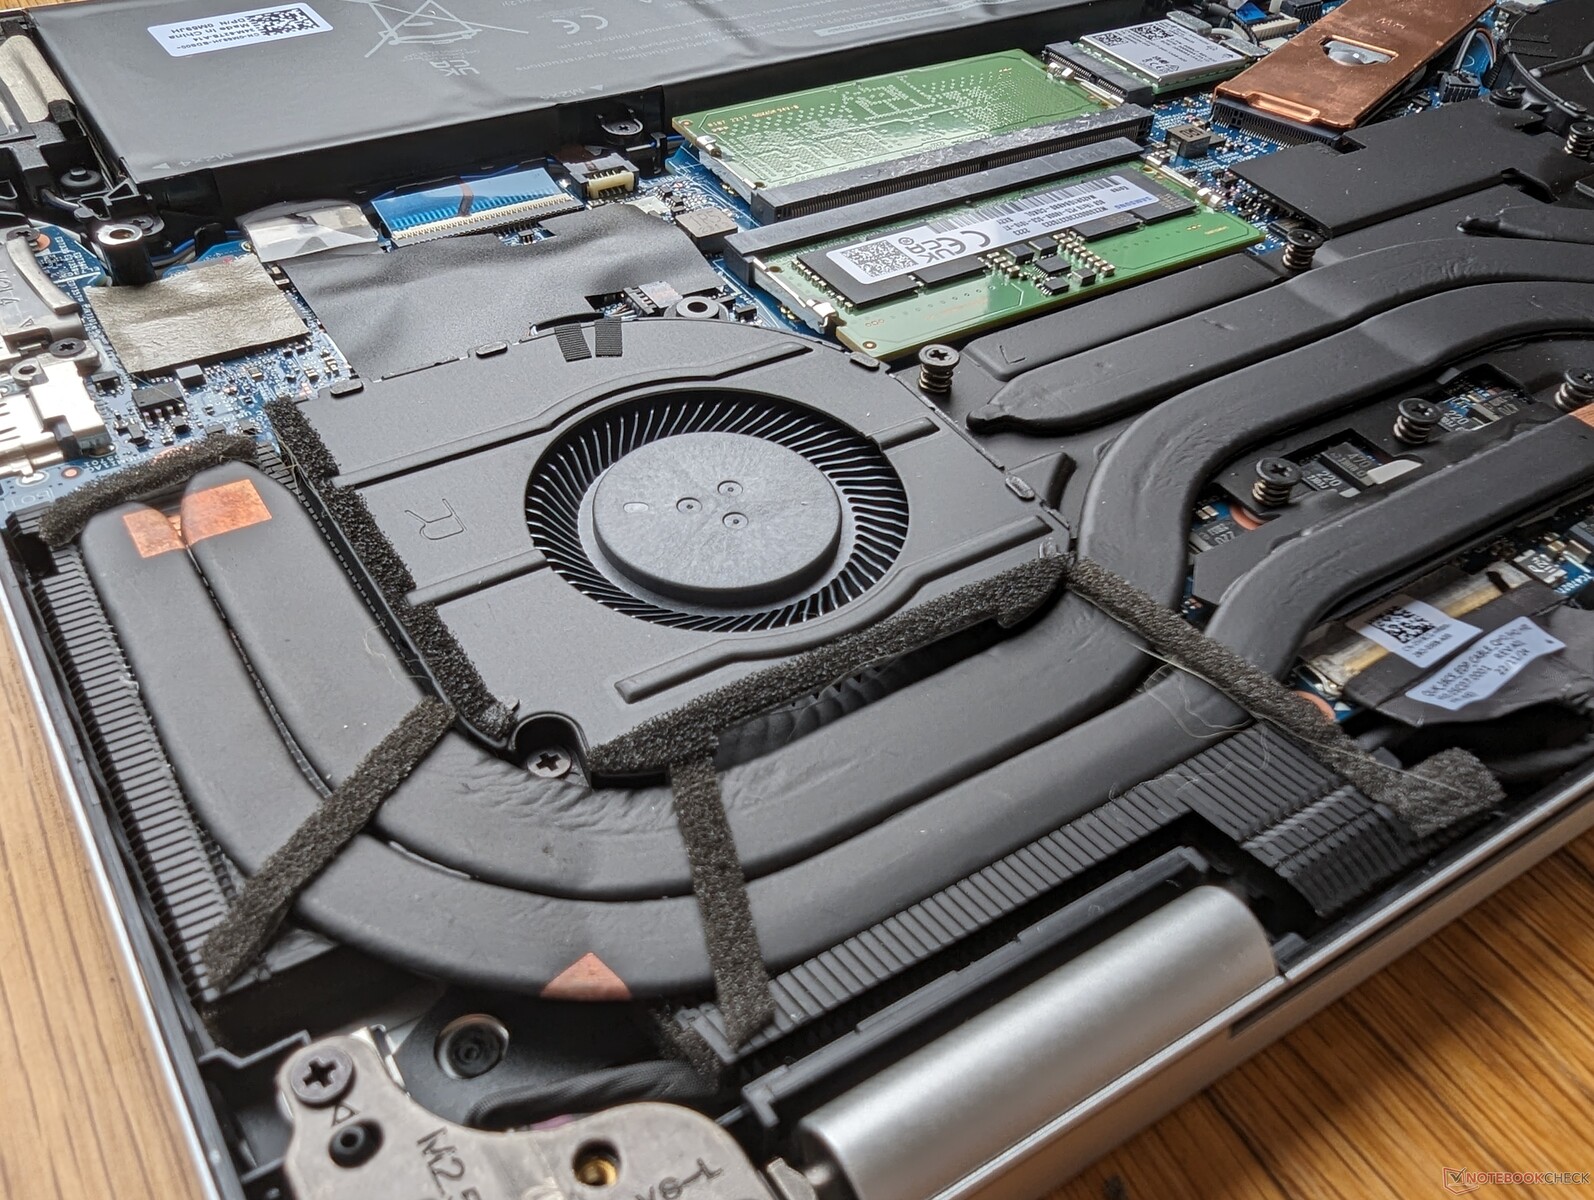
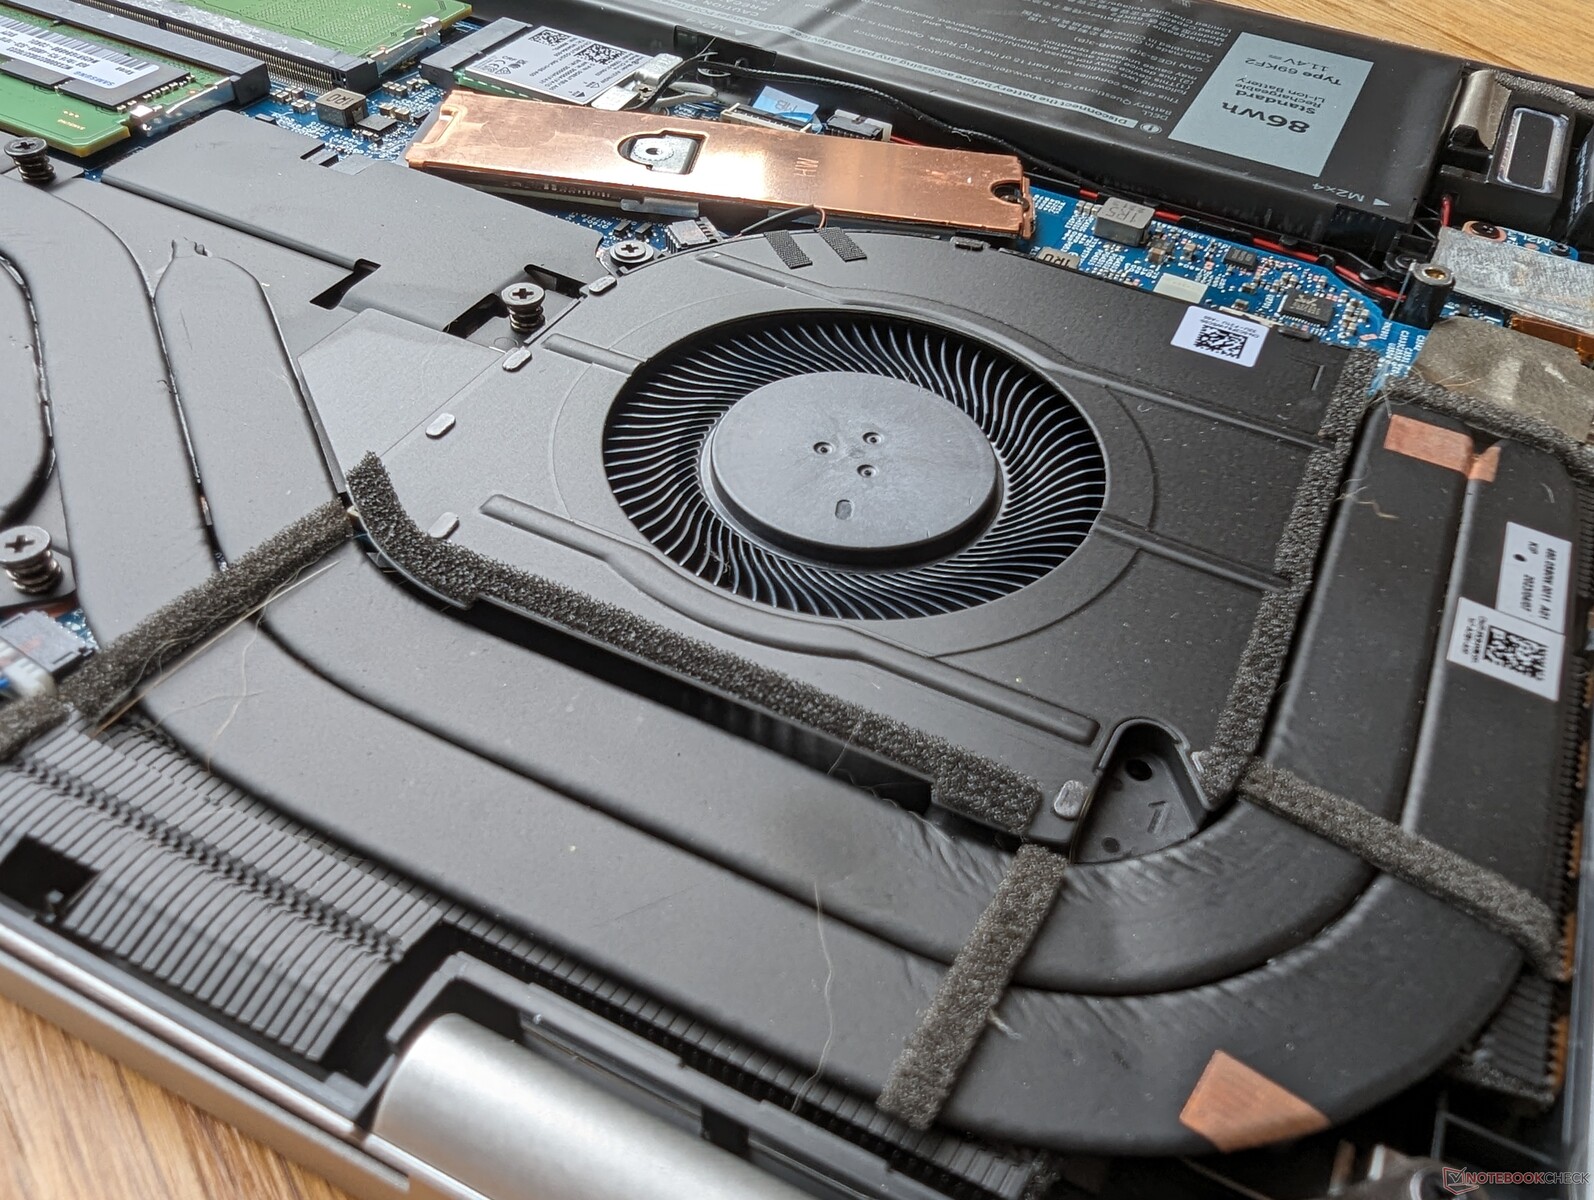
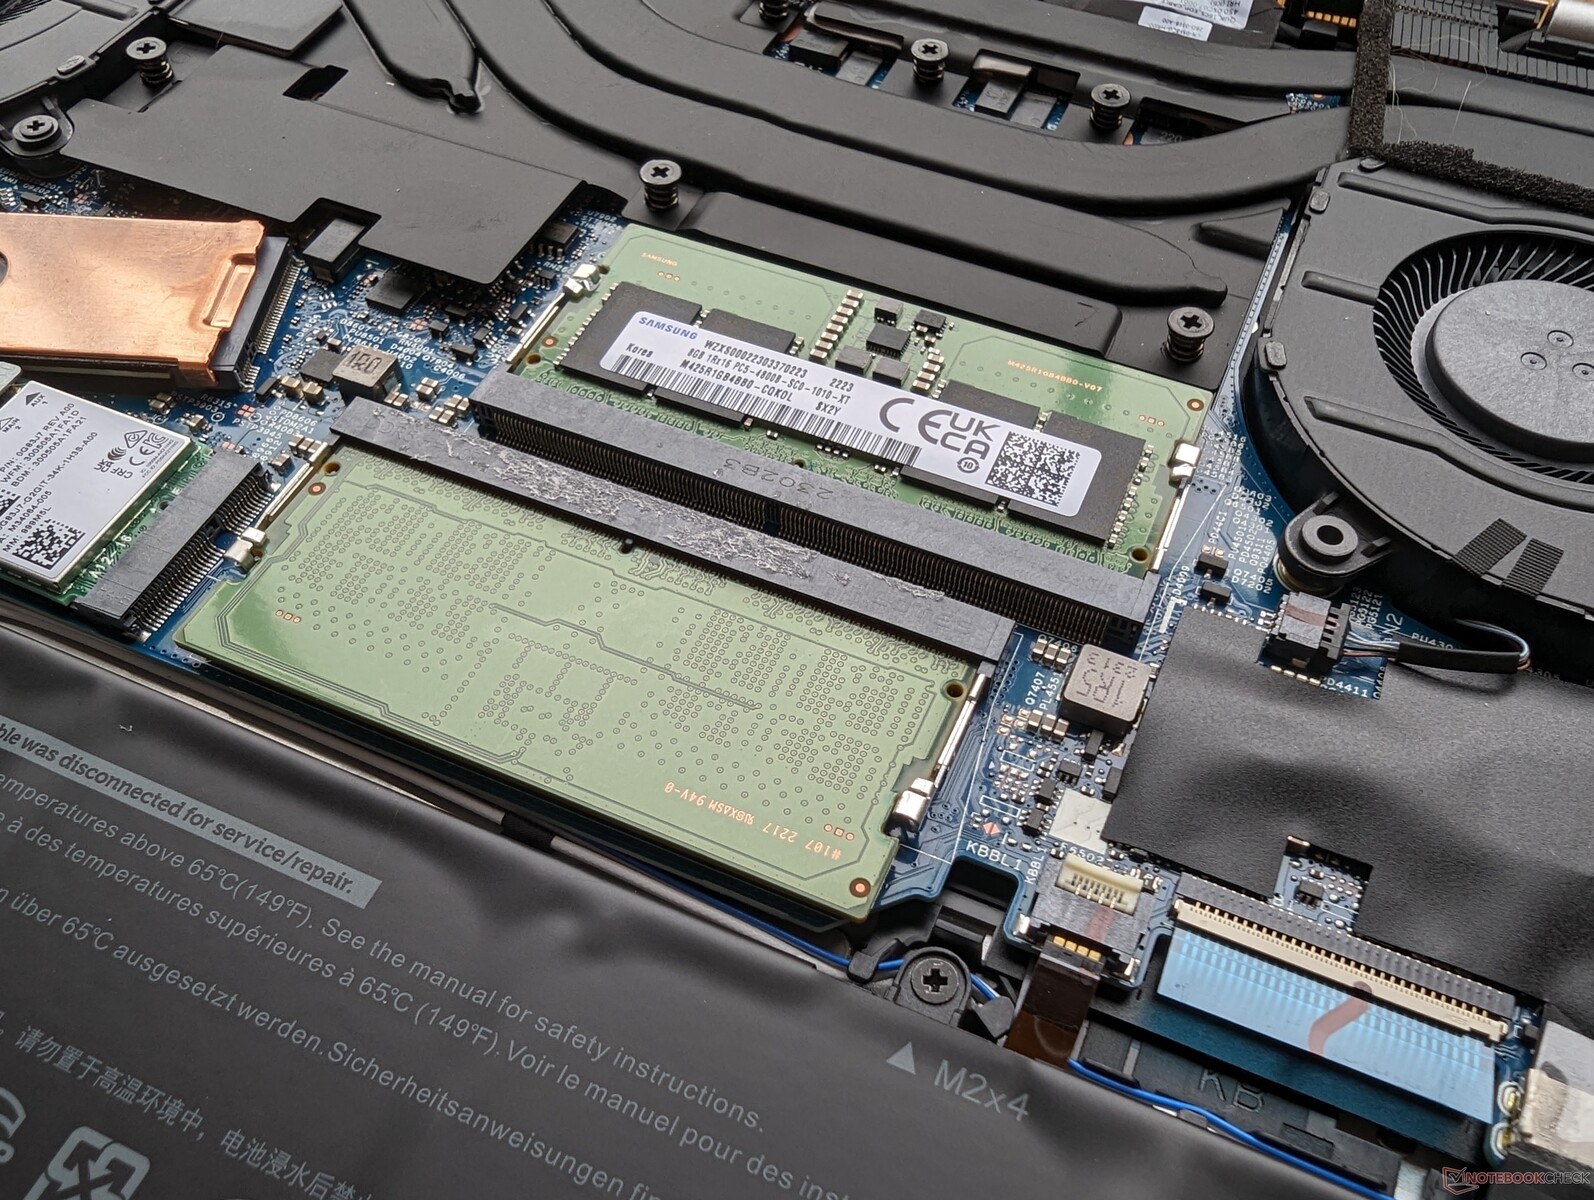
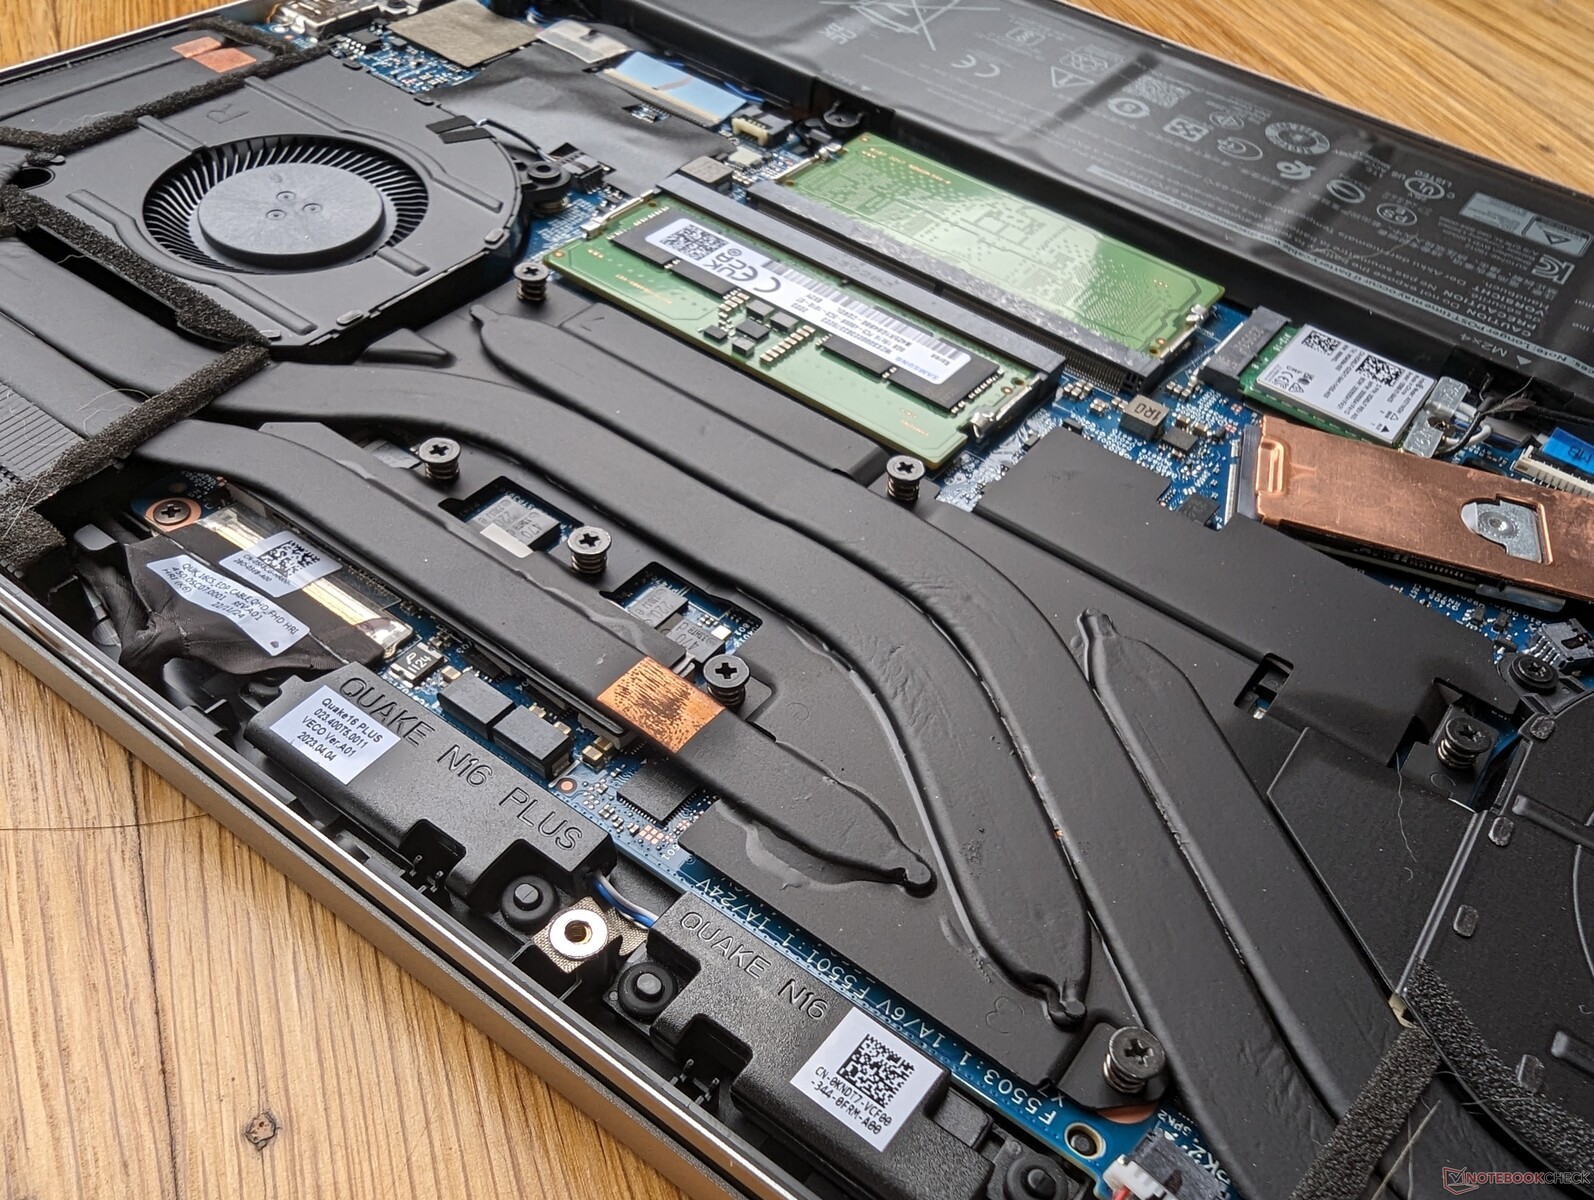
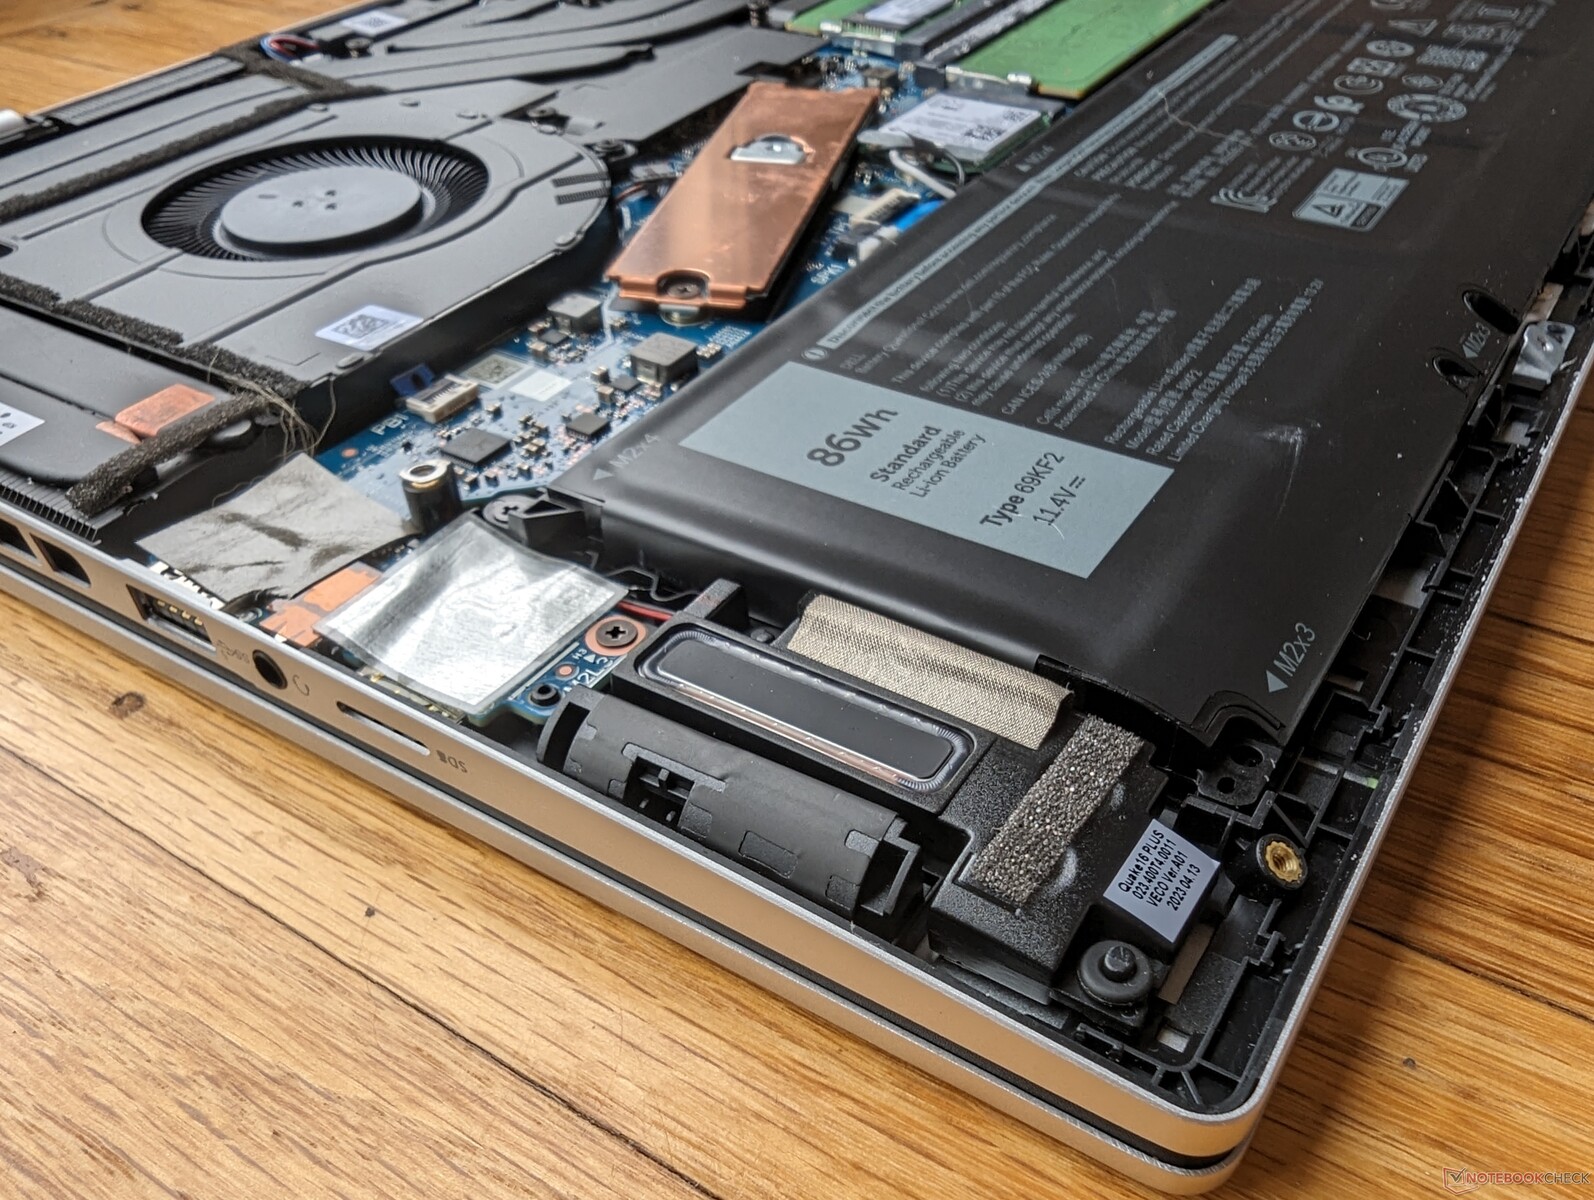
Maintenance
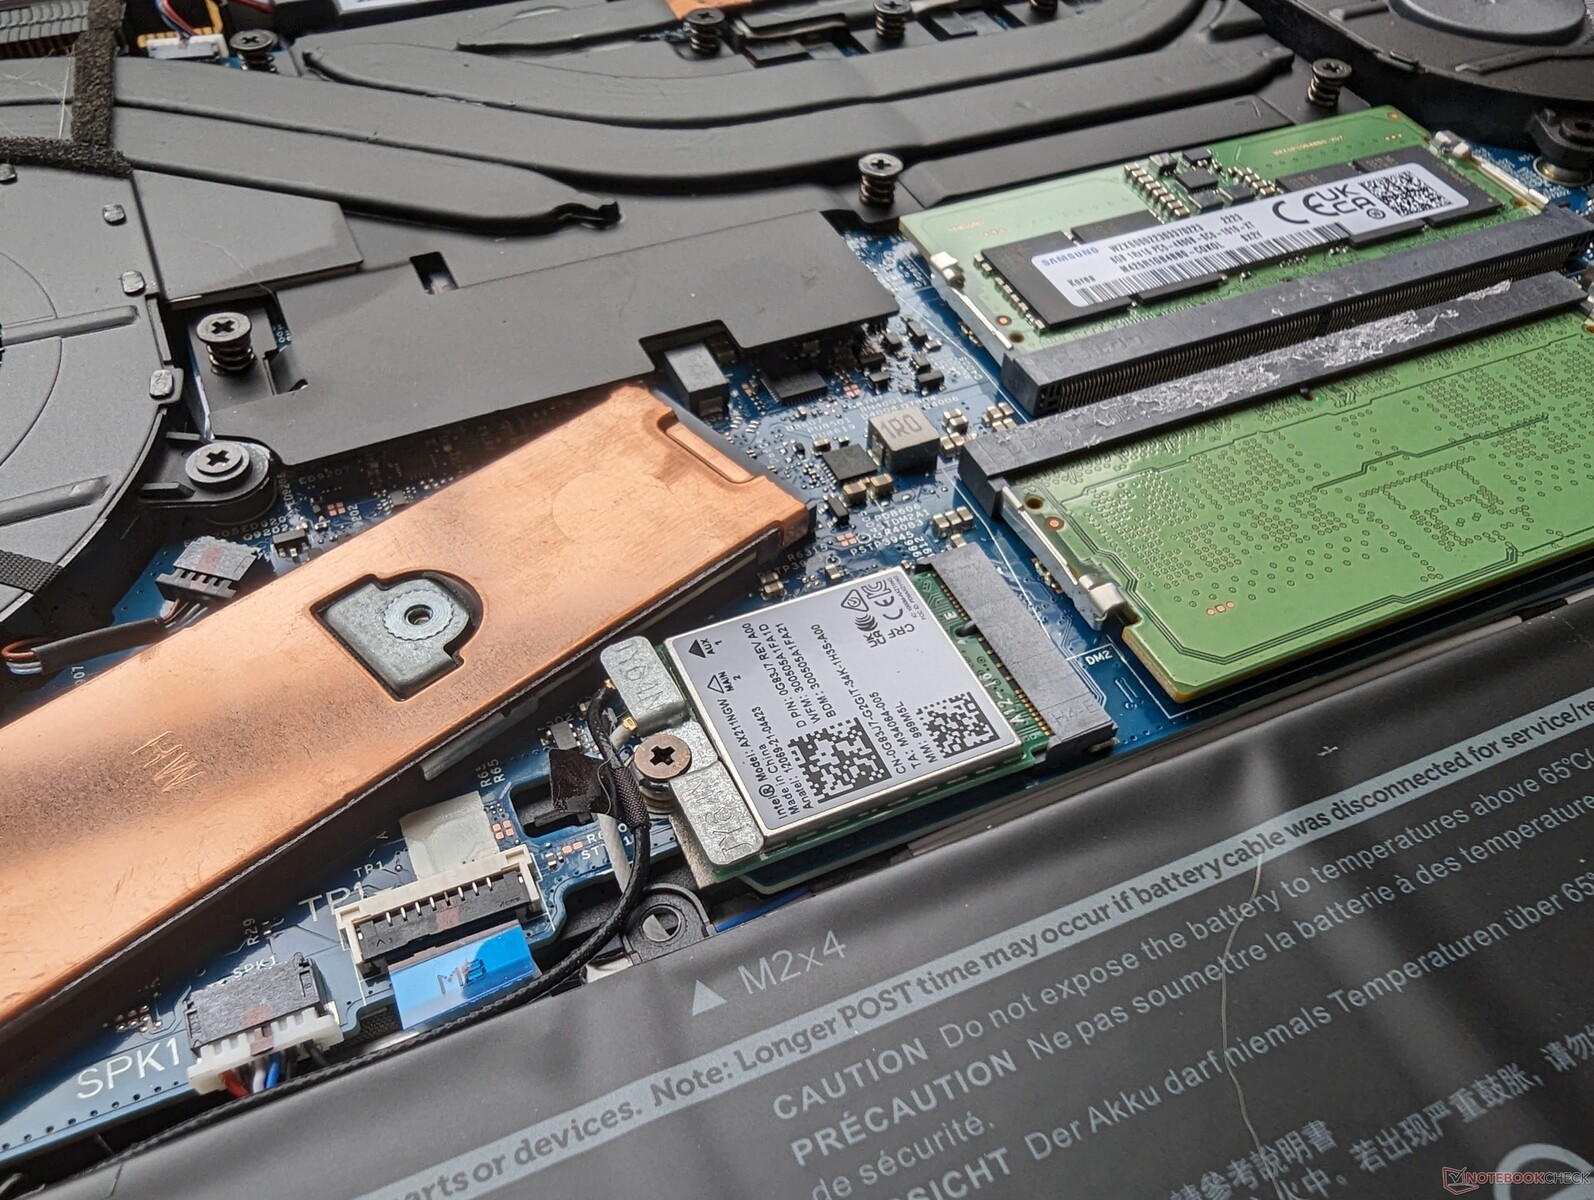
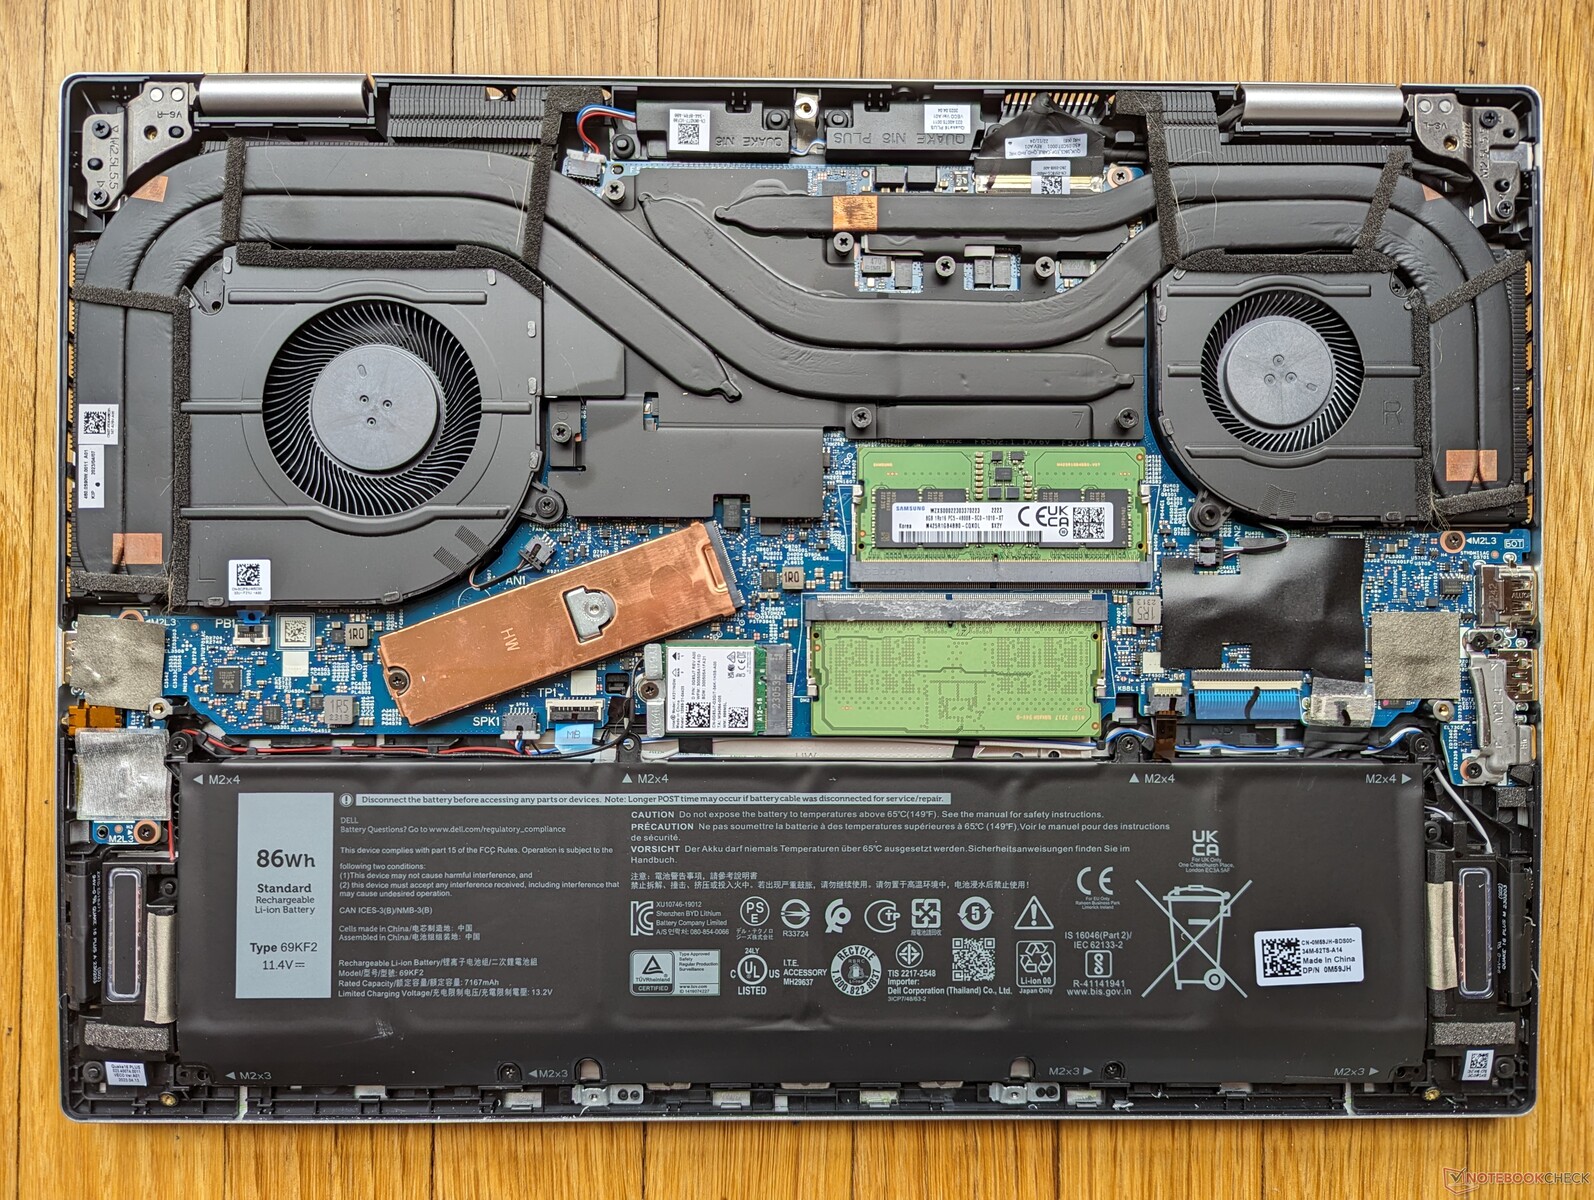
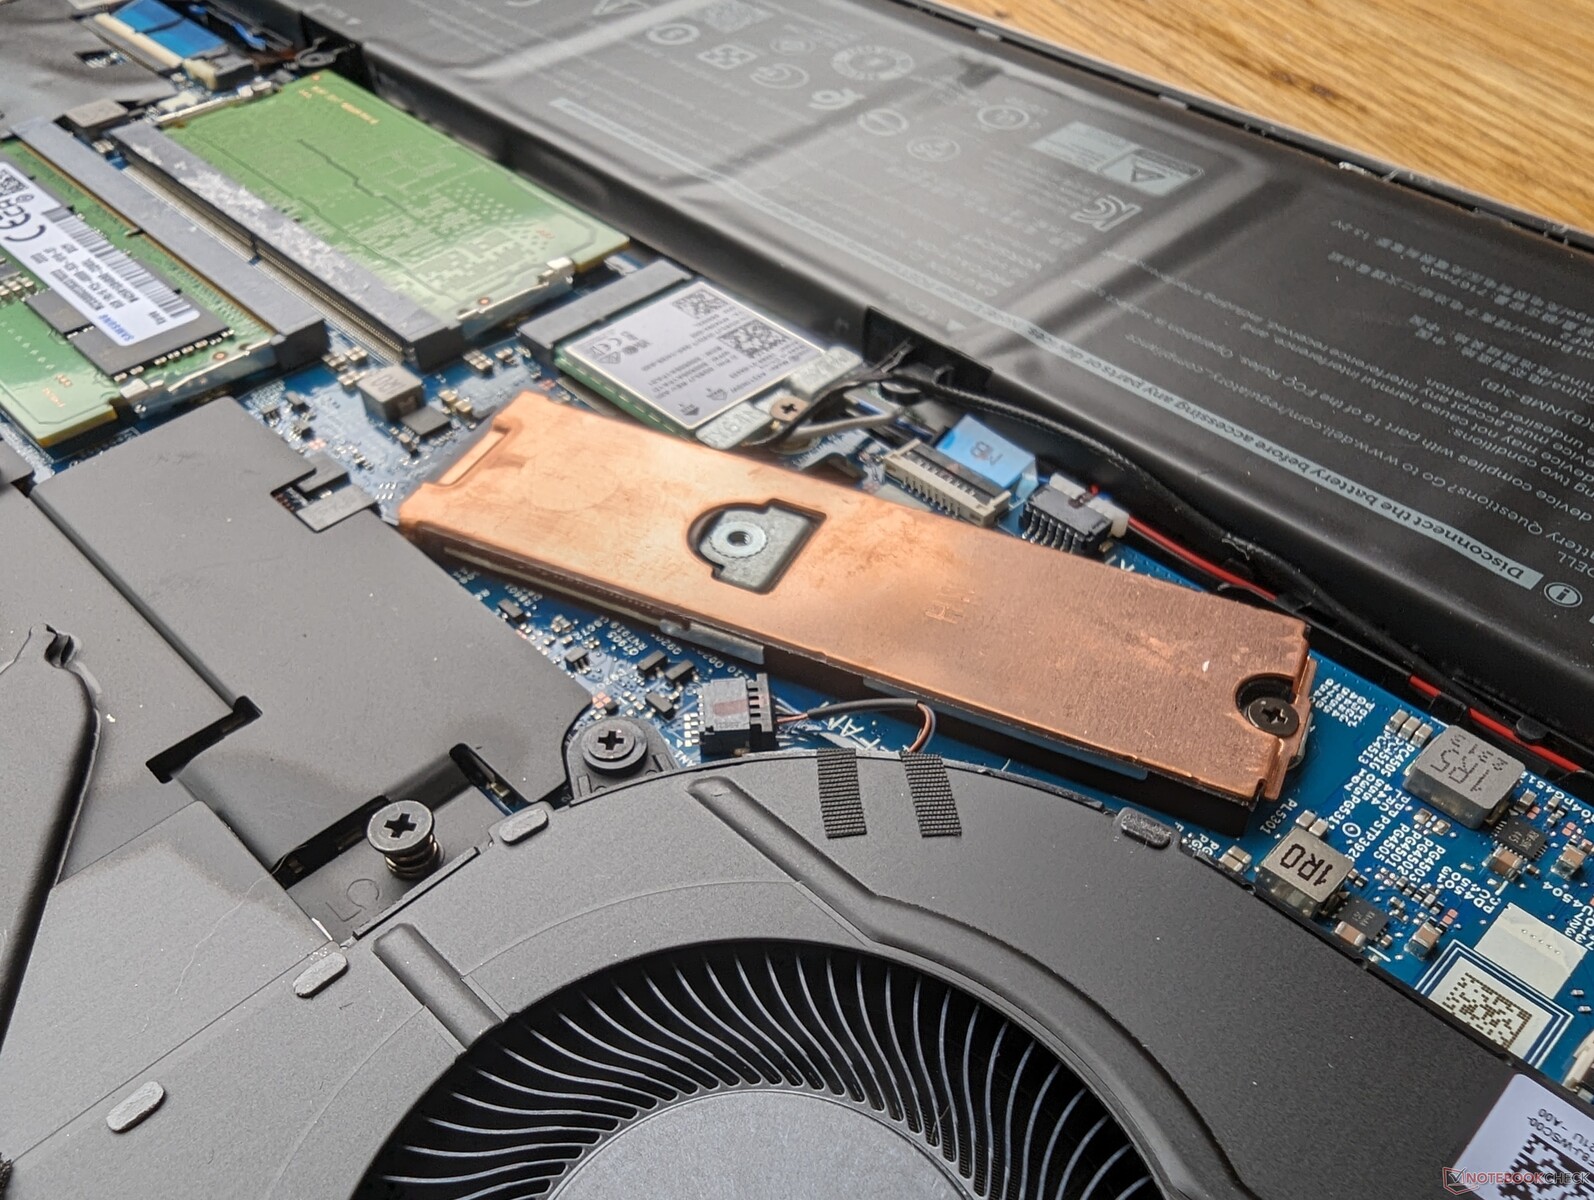
Le panneau inférieur ne nécessite qu'un tournevis Phillips et un bord tranchant pour un entretien relativement facile. Les propriétaires ont un accès direct au SSD, au WLAN et à deux emplacements SODIMM, alors que le modèle de l'année dernière était limité à un seul emplacement SODIMM, comme le montrent les photos comparatives ci-dessous. Les ventilateurs sont également plus grands cette fois-ci et les caloducs en cuivre plus épais pour améliorer le potentiel de refroidissement.
Notez que la version AMD de ce modèle utilise de la RAM LPDDR5 soudée, contrairement à l'approche 2x SODIMM entièrement extensible de notre version Intel.
Accessoires et garantie
La boîte ne contient pas d'autres éléments que l'adaptateur secteur et la documentation. La garantie limitée habituelle d'un an du fabricant s'applique si l'appareil est acheté aux États-Unis.
Périphériques d'entrée - Une sensation familière de l'Inspiron
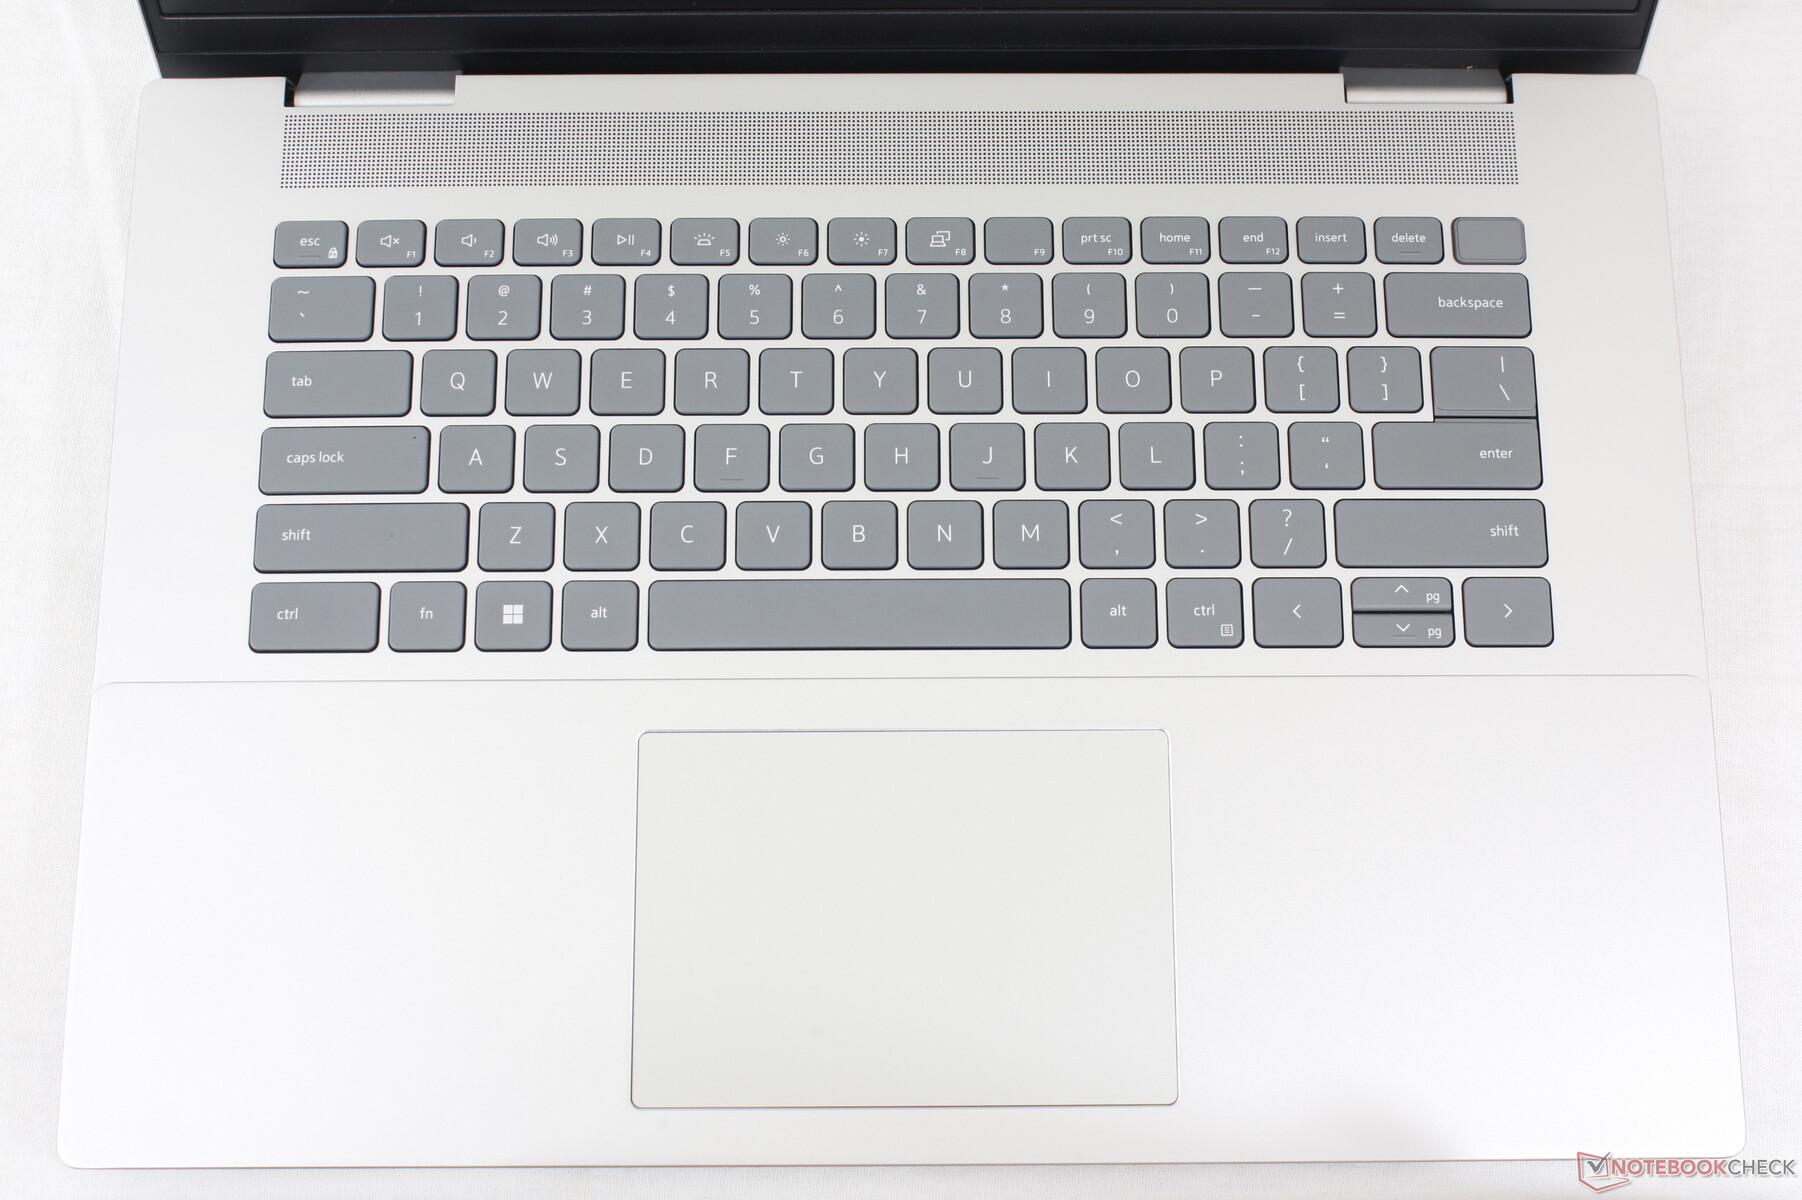
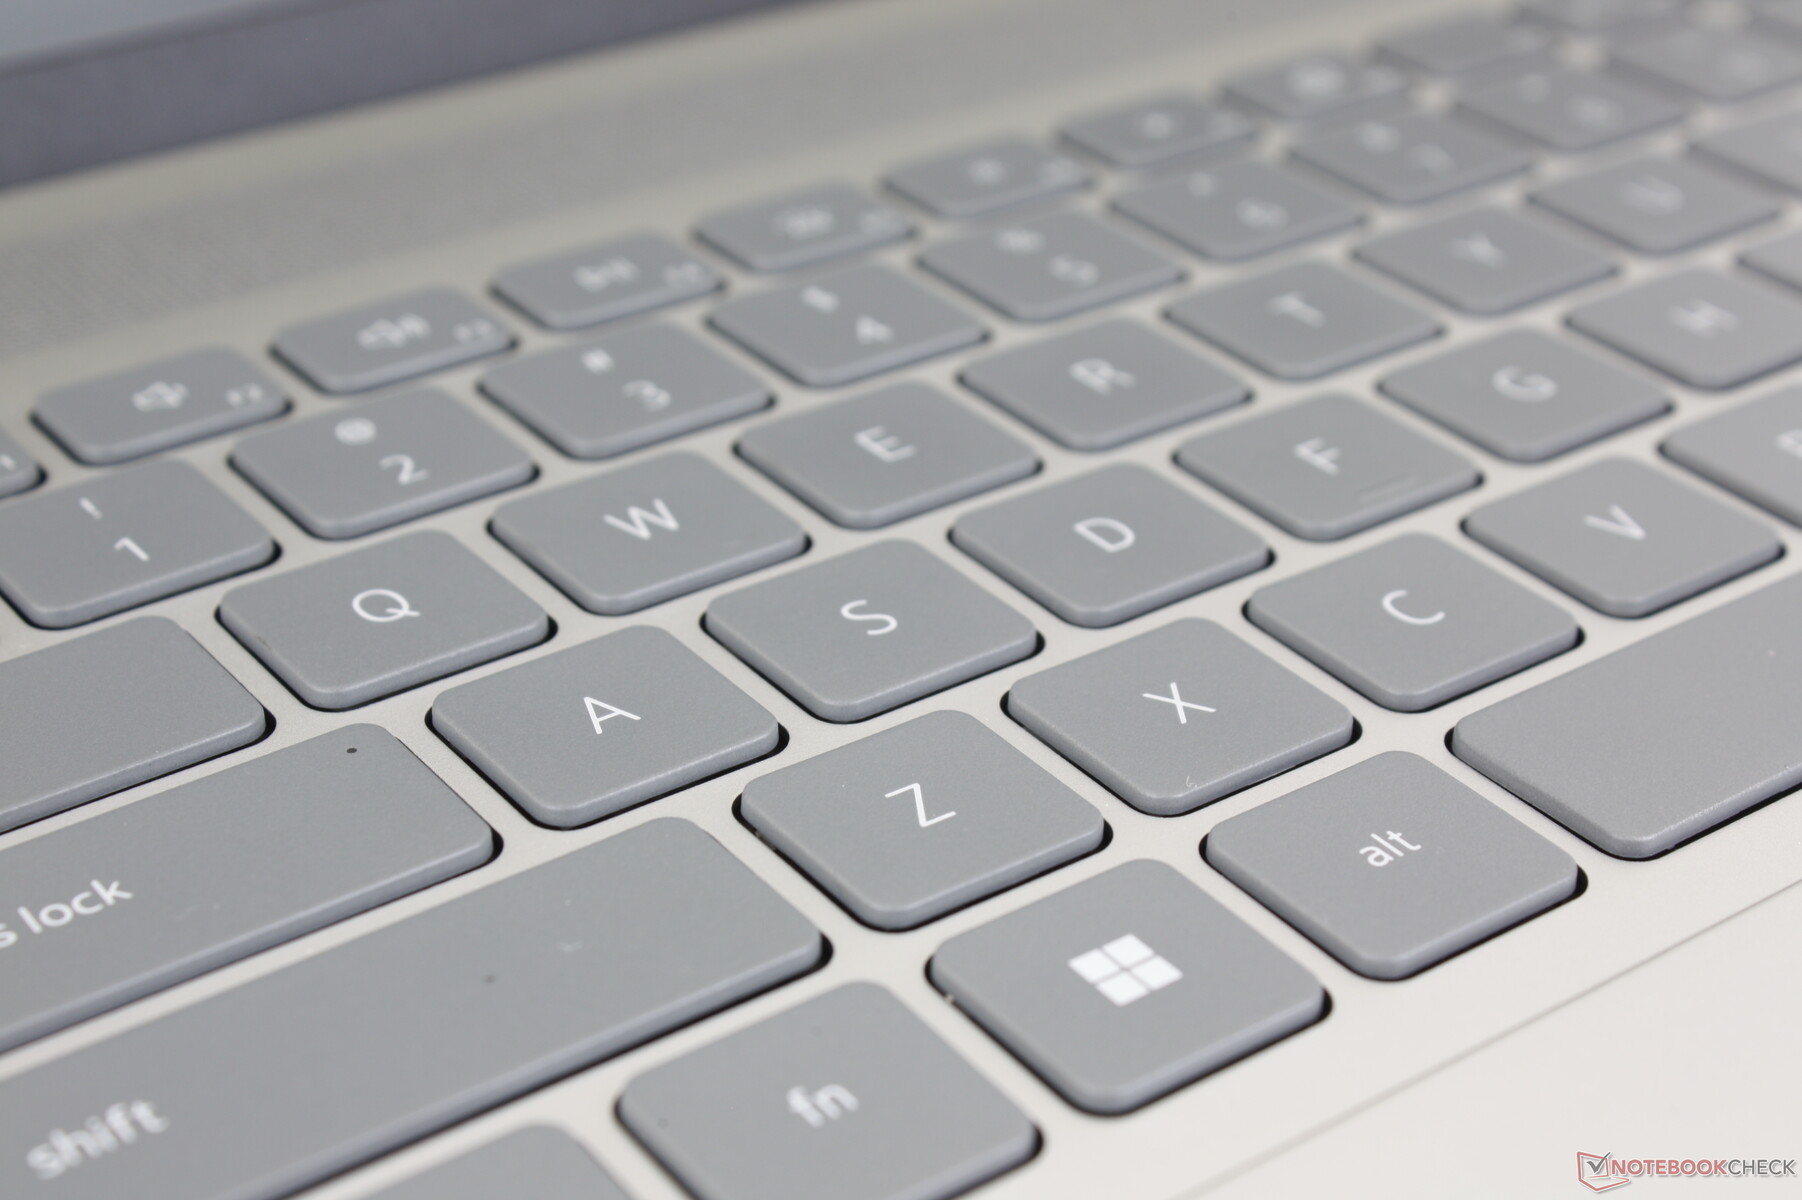
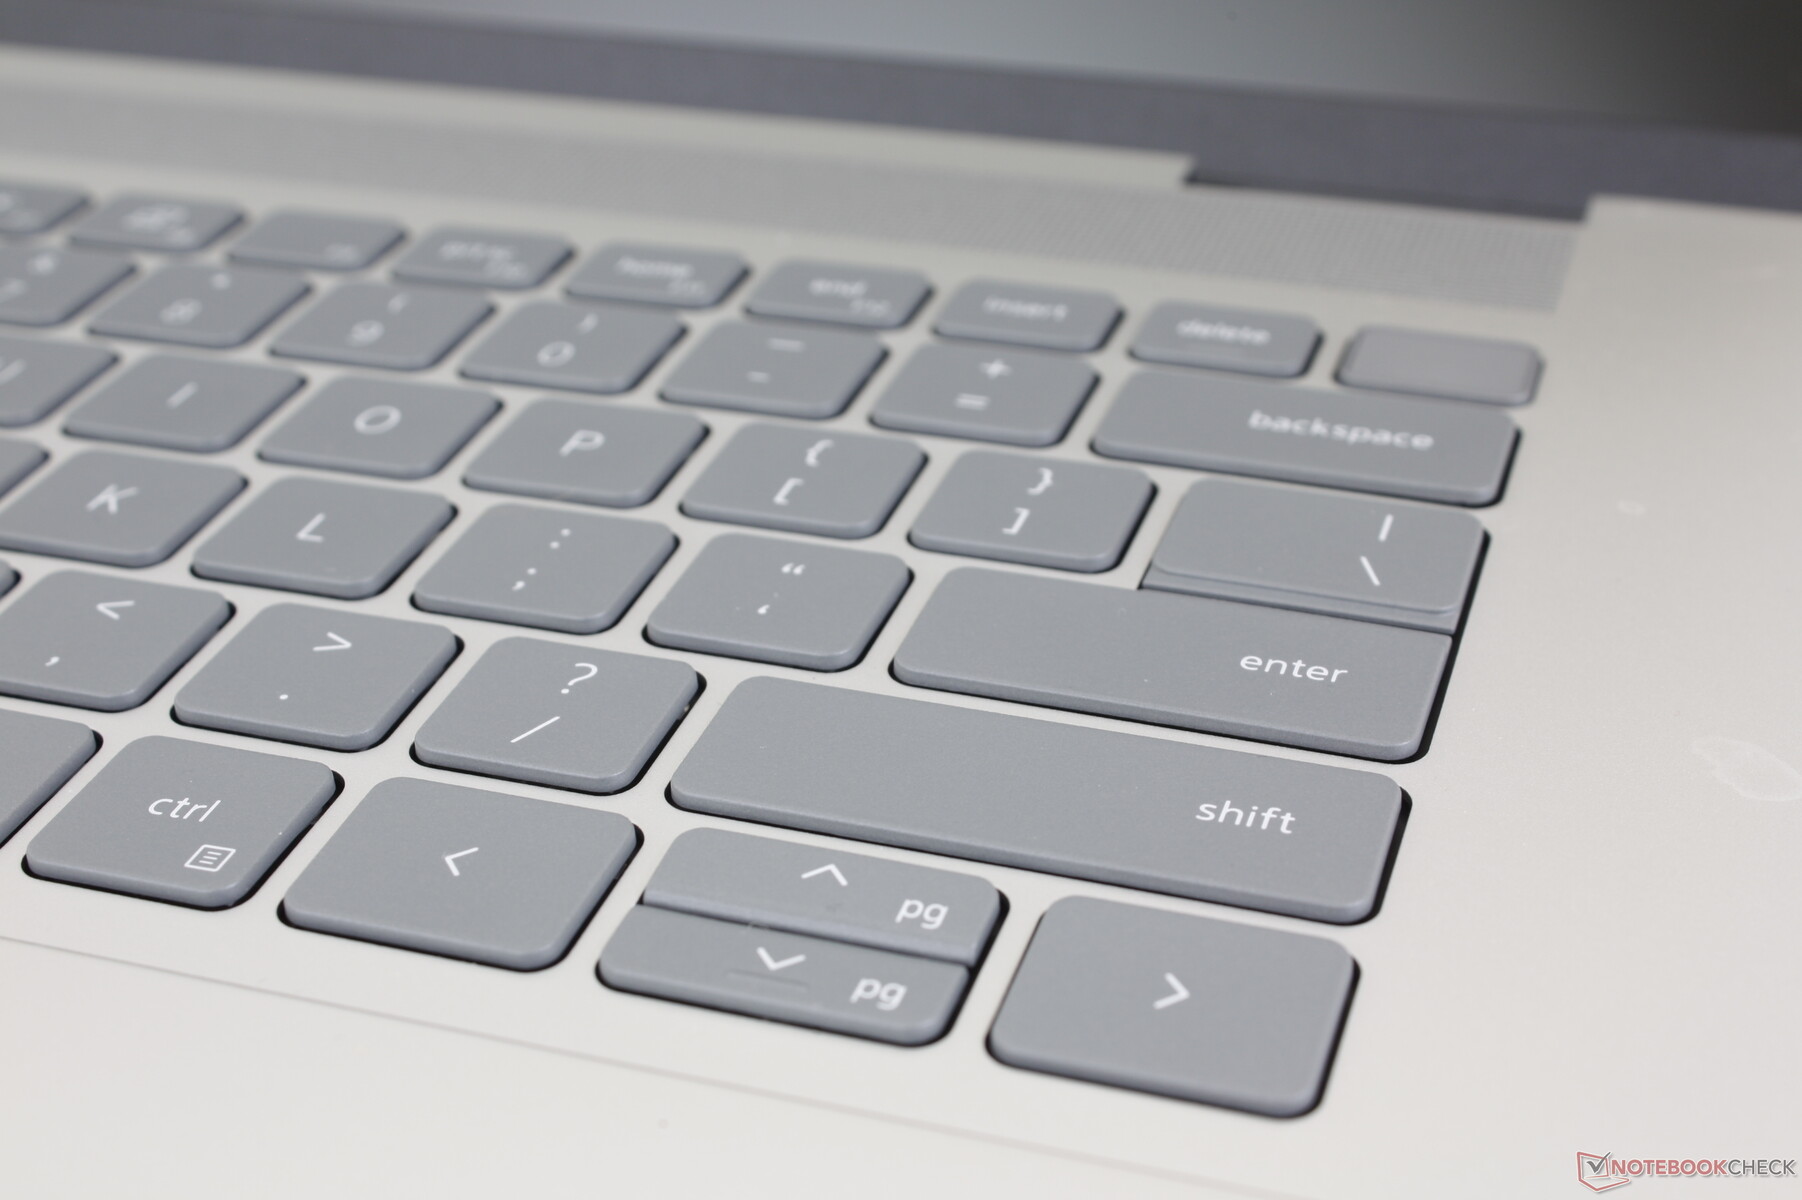
Clavier
L'expérience de frappe reste identique à celle de l Inspiron 16 Plus 7620 jusqu'à chaque touche de fonction et action secondaire. Ce n'est pas forcément une mauvaise chose car la cohérence entre les différents modèles Inspiron est appréciable. Cependant, d'autres ordinateurs portables multimédias comme le LG Gram 16 ou le HP Spectre x360 16 ont des touches nettement plus fermes et confortables.
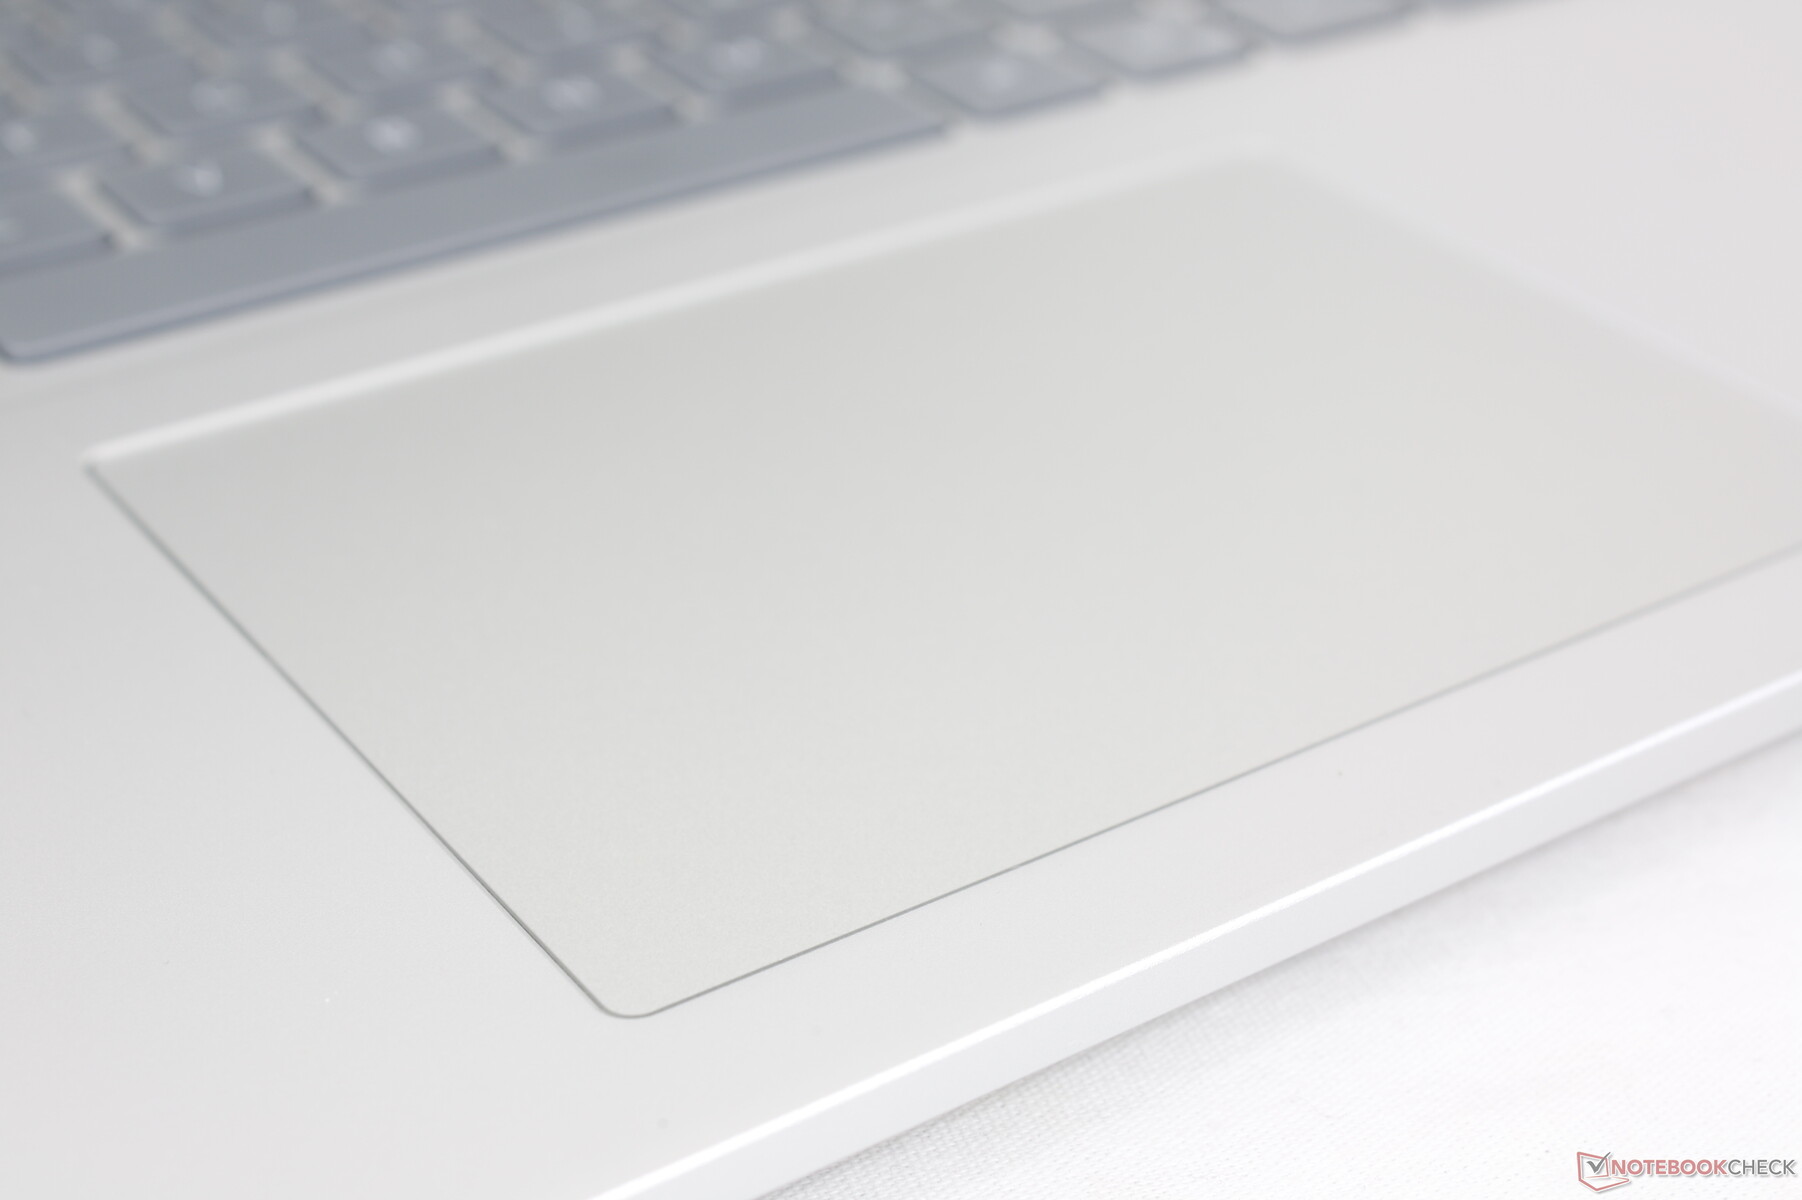
Pavé tactile
Le pavé tactile est de la même taille que celui du modèle de l'année dernière (11,5 x 8 cm). Le glissement est fluide, avec un peu d'adhérence à des vitesses plus lentes pour des saisies plus précises. Le retour d'information lorsque l'on appuie sur le pavé tactile est malheureusement un peu mou, malgré le clic sonore.
Affichage - Décent mais options limitées
Les options d'affichage ont changé par rapport à l'ancien Inspiron 16 Plus 7620. Le panneau 3K 3072 x 1920 a disparu au profit de ces deux nouveaux choix :
- 2560 x 1600 (2.5K), 120 Hz
- 1920 x 1200, 60 Hz
Les deux options sont IPS et non tactiles, et aucune ne prend en charge G-Sync. Nos mesures ci-dessous ne reflètent que l'option 1600p en gras.
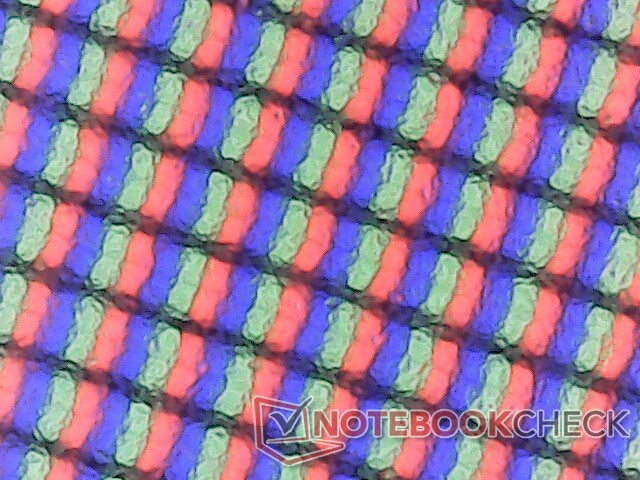
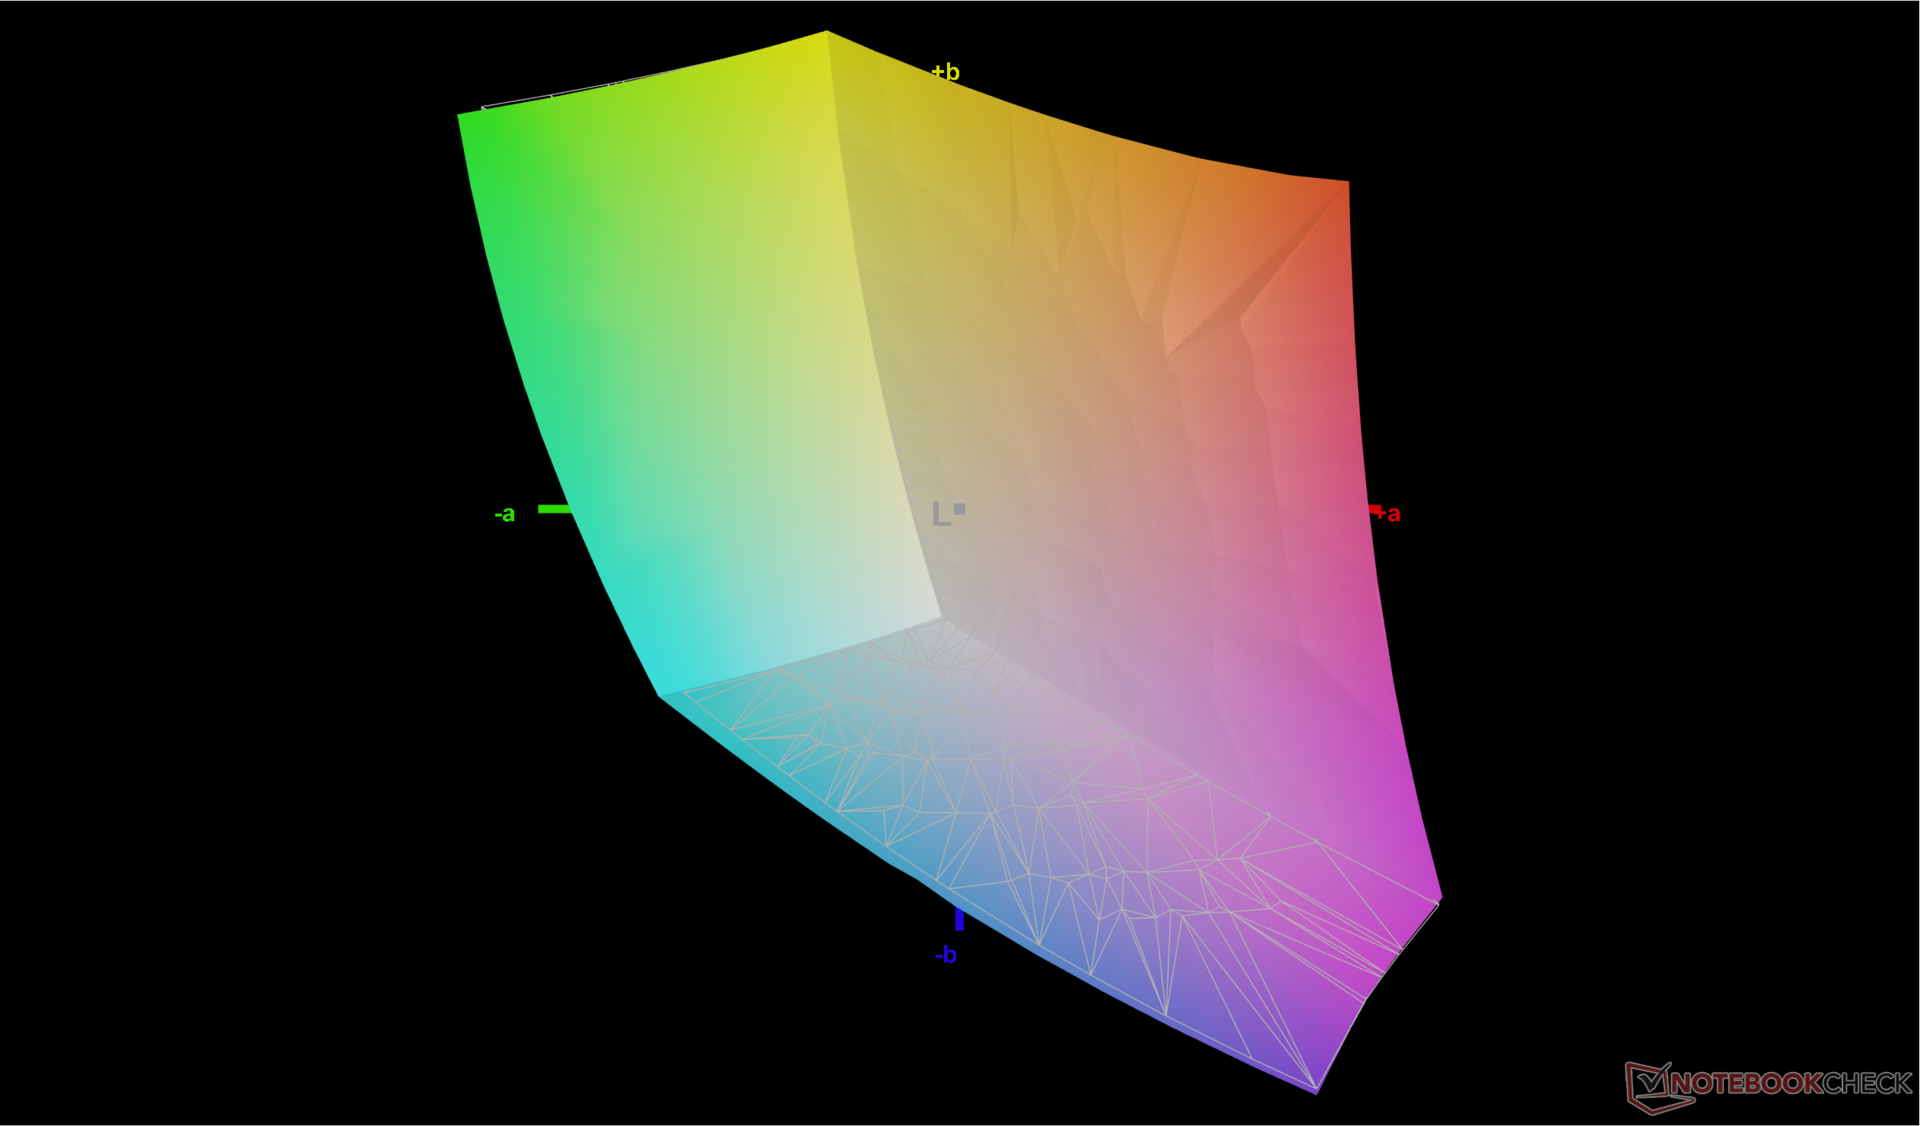
Par rapport à la dalle BOE 3K de l'année dernière, la nouvelle dalle LG Philips 2.5K présente un taux de rafraîchissement natif deux fois plus élevé, au prix d'une résolution native plus faible. La couverture sRGB complète, la luminosité de 300 nits, le rapport de contraste >1000:1 et les temps de réponse moyens sont par ailleurs assez similaires. Néanmoins, des modèles concurrents comme le Vivobook Pro 16X ou l'Envy 16 offrent des options de résolution plus élevées avec des couleurs encore plus profondes que les créateurs de contenu pourraient apprécier. Notre écran LG Philips est donc plus adapté à notre budget.
| |||||||||||||||||||||||||
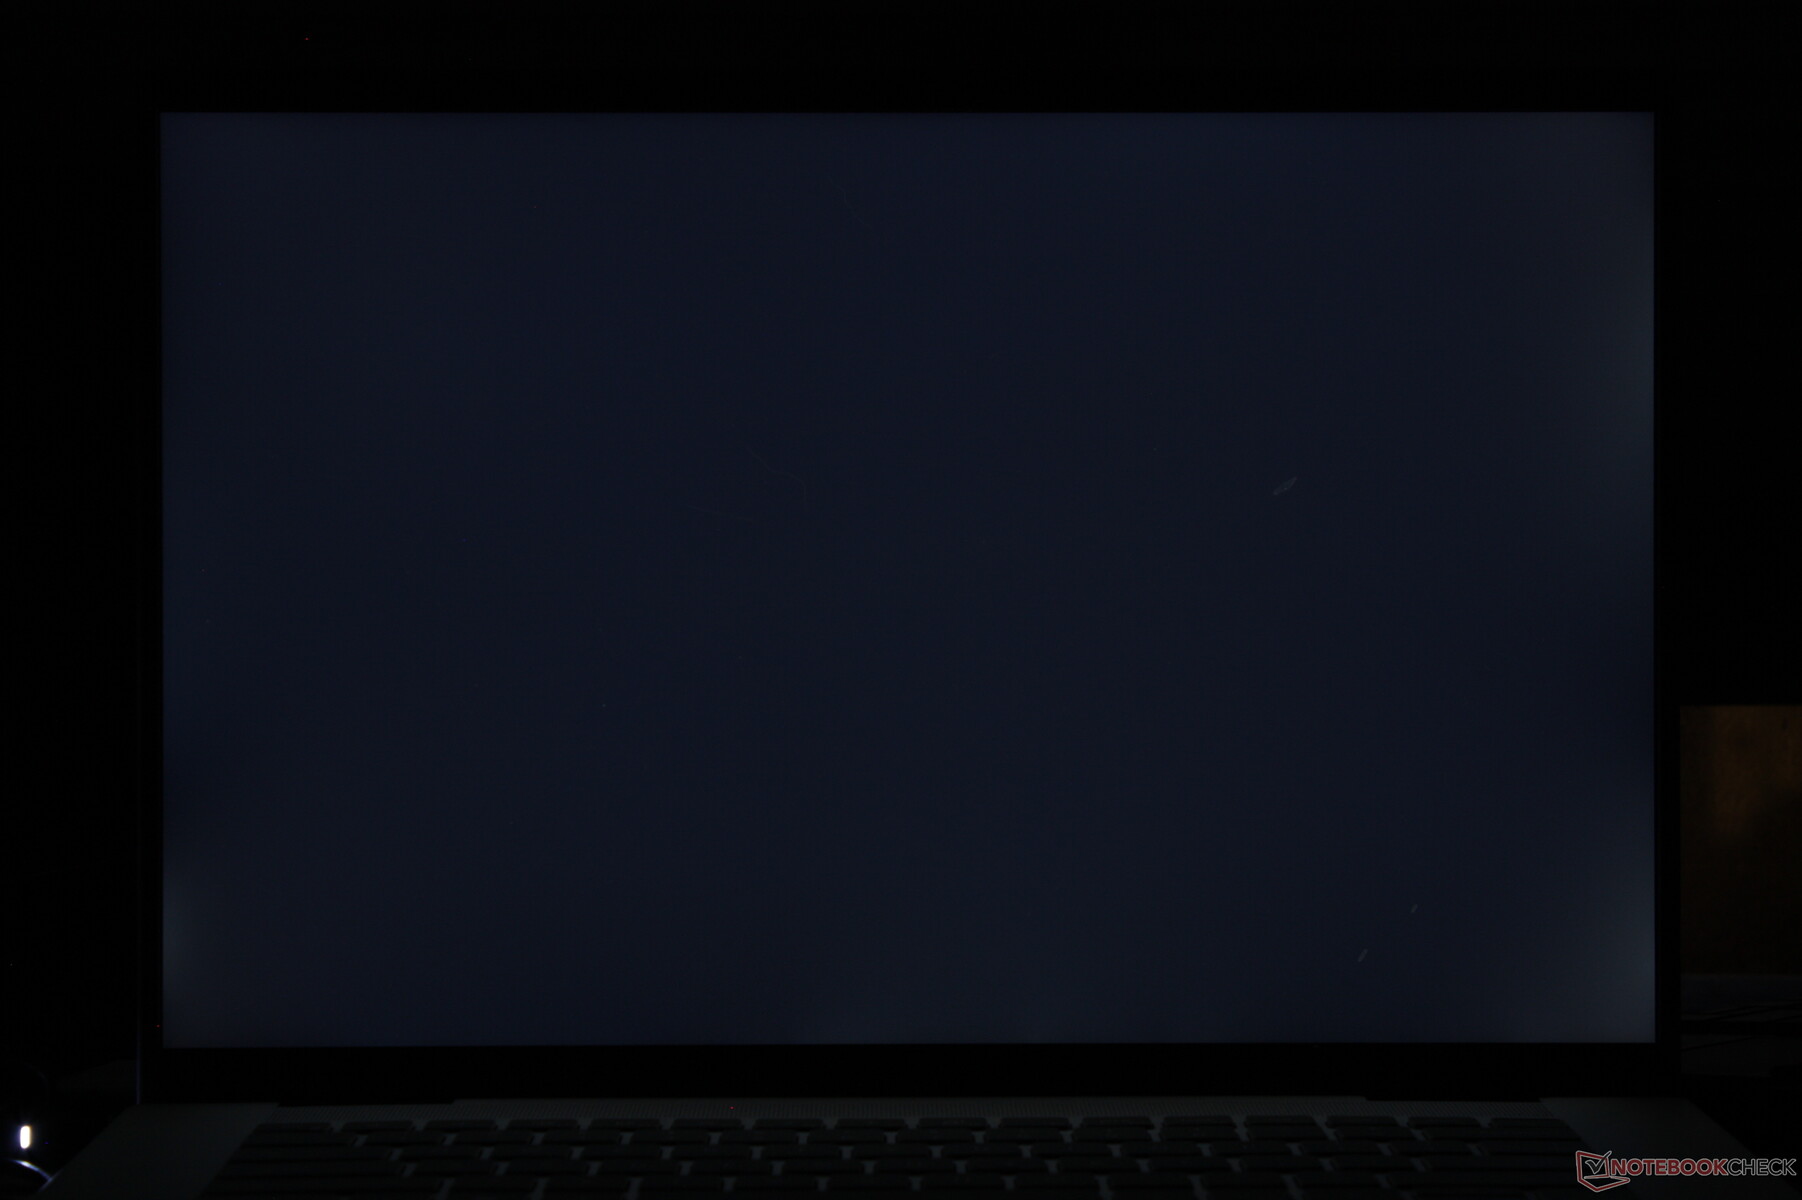
Homogénéité de la luminosité: 92 %
Valeur mesurée au centre, sur batterie: 299.4 cd/m²
Contraste: 1426:1 (Valeurs des noirs: 0.21 cd/m²)
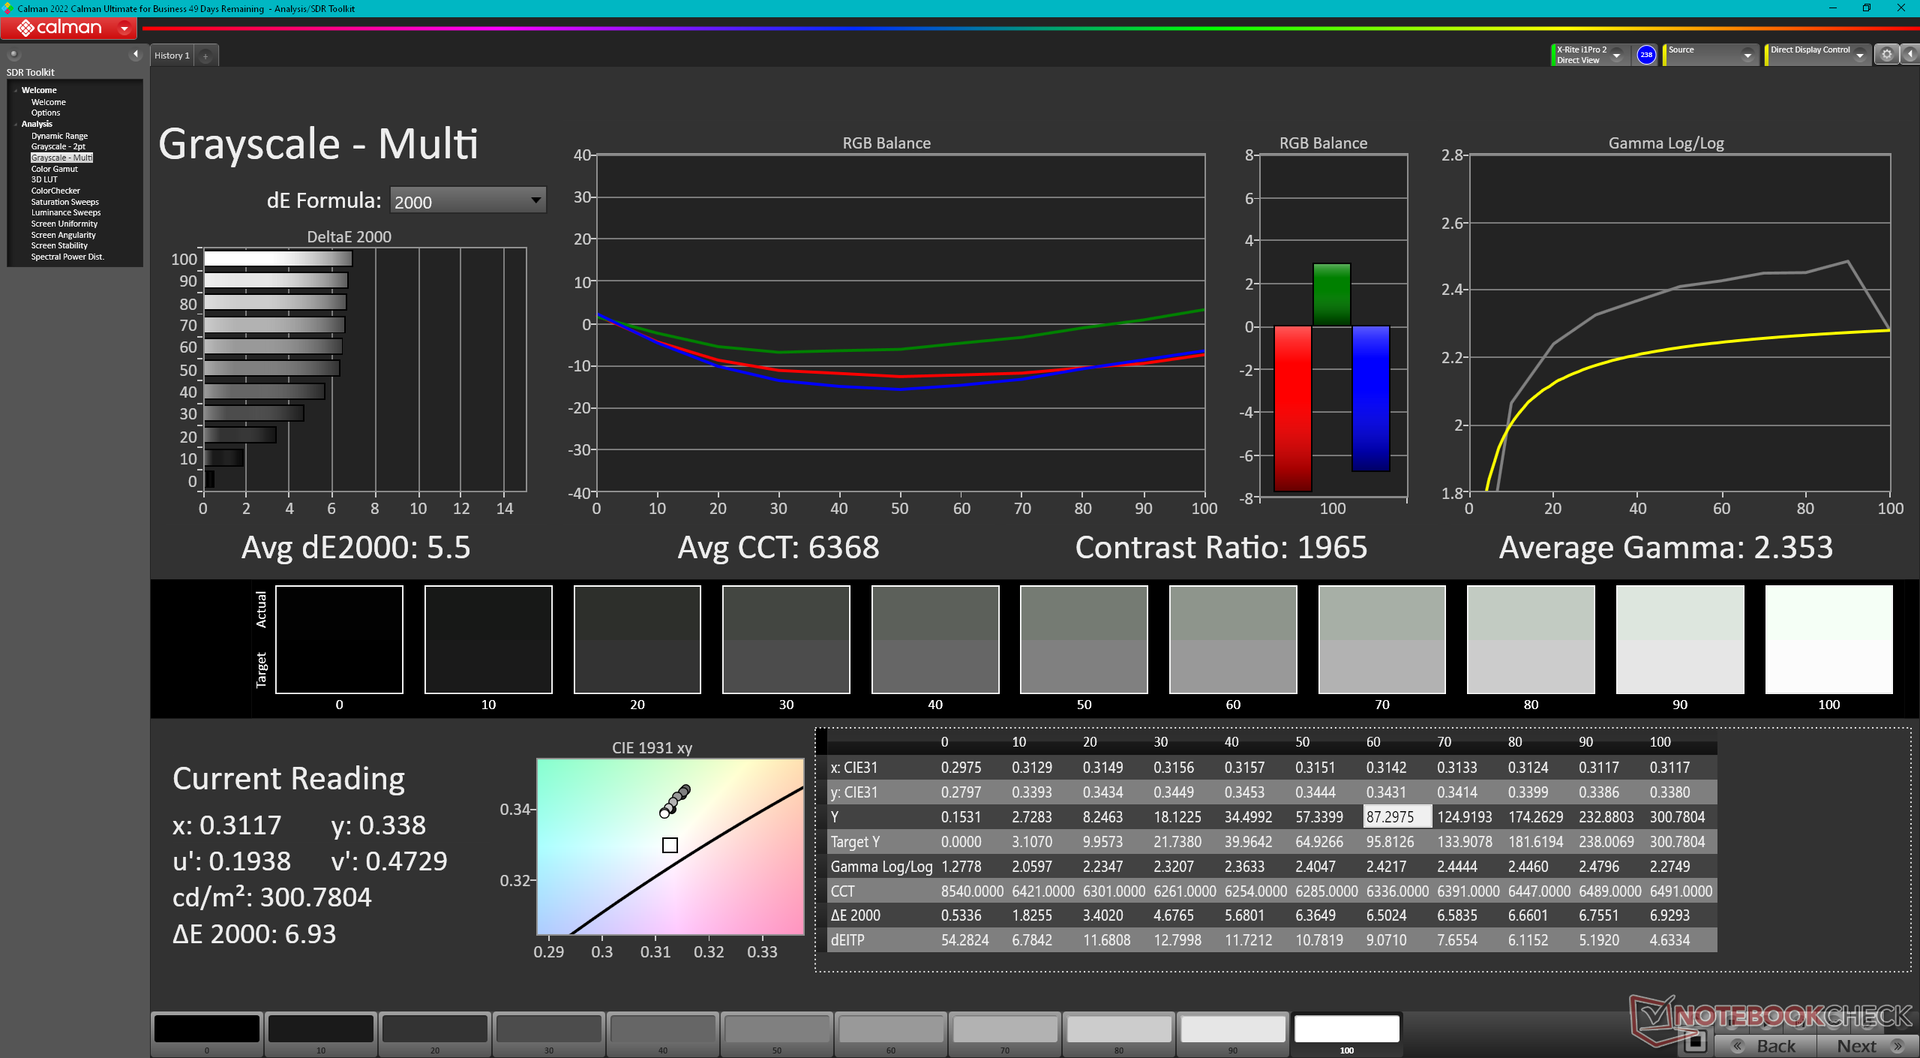
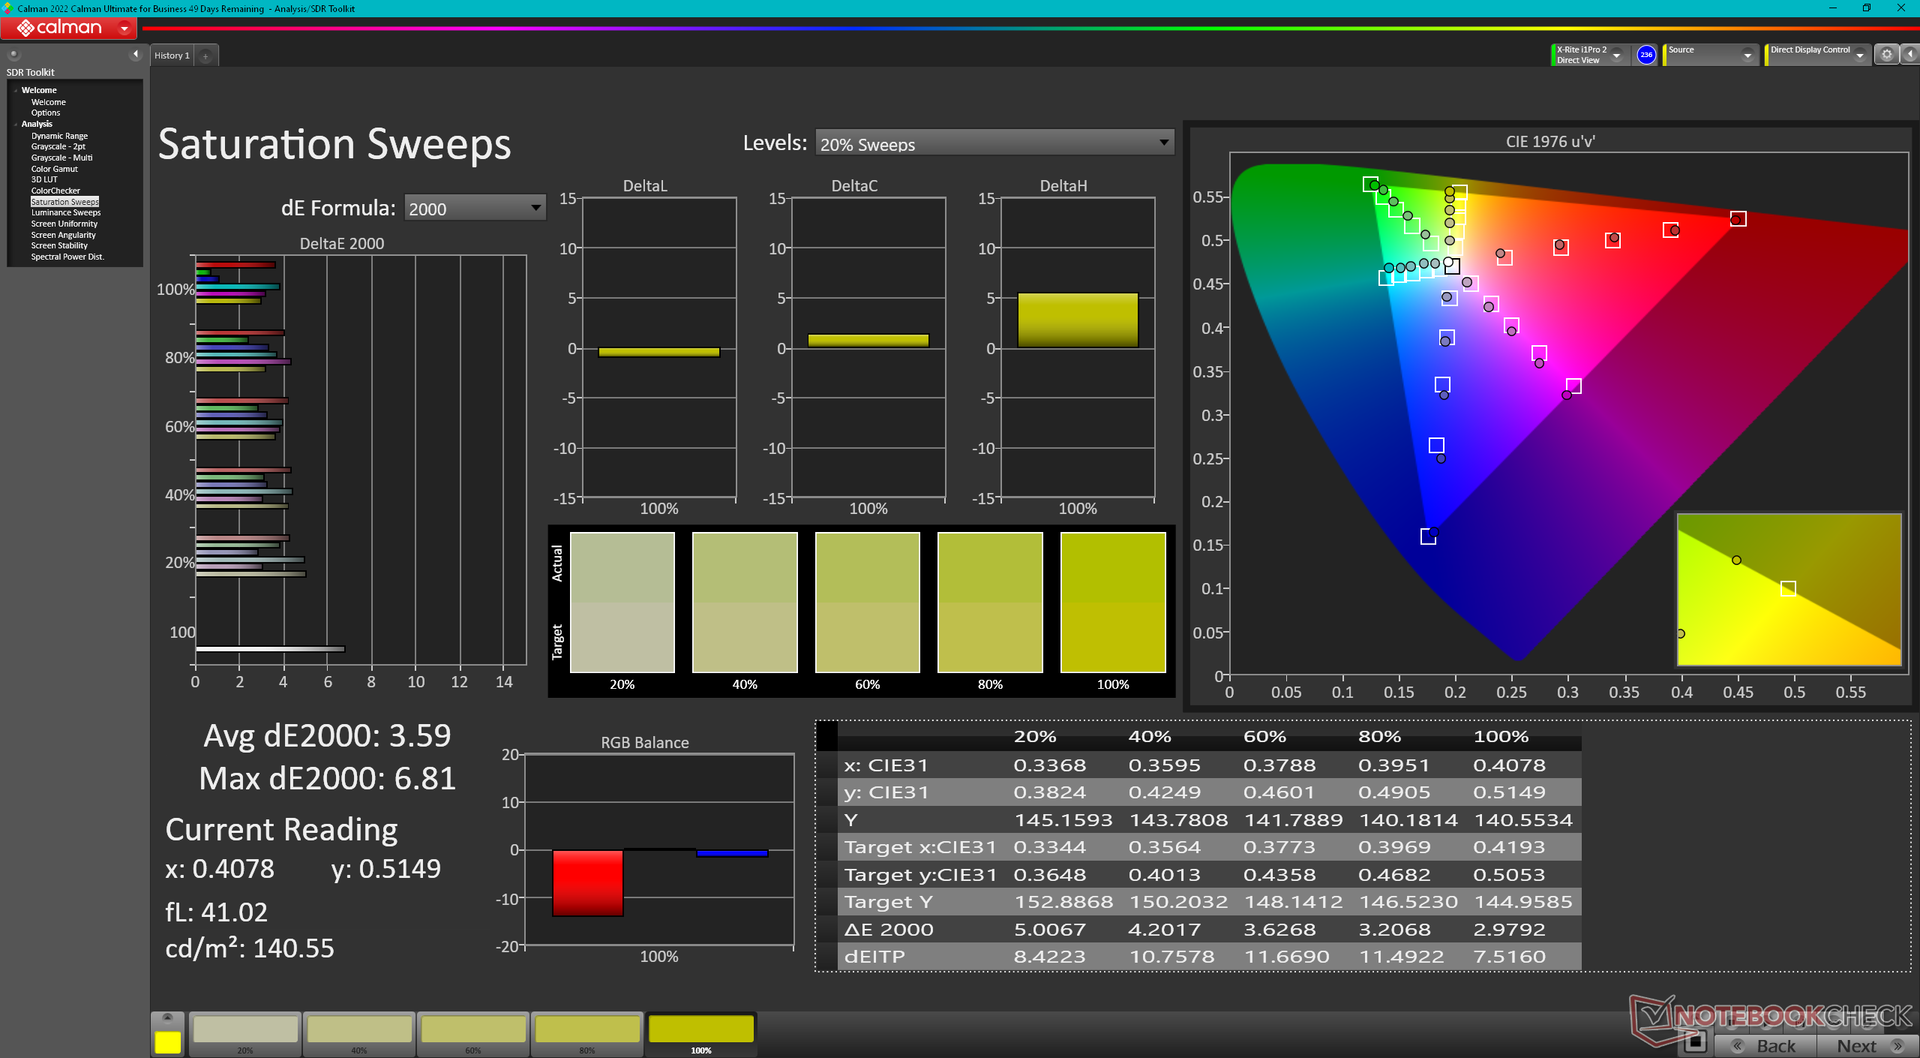
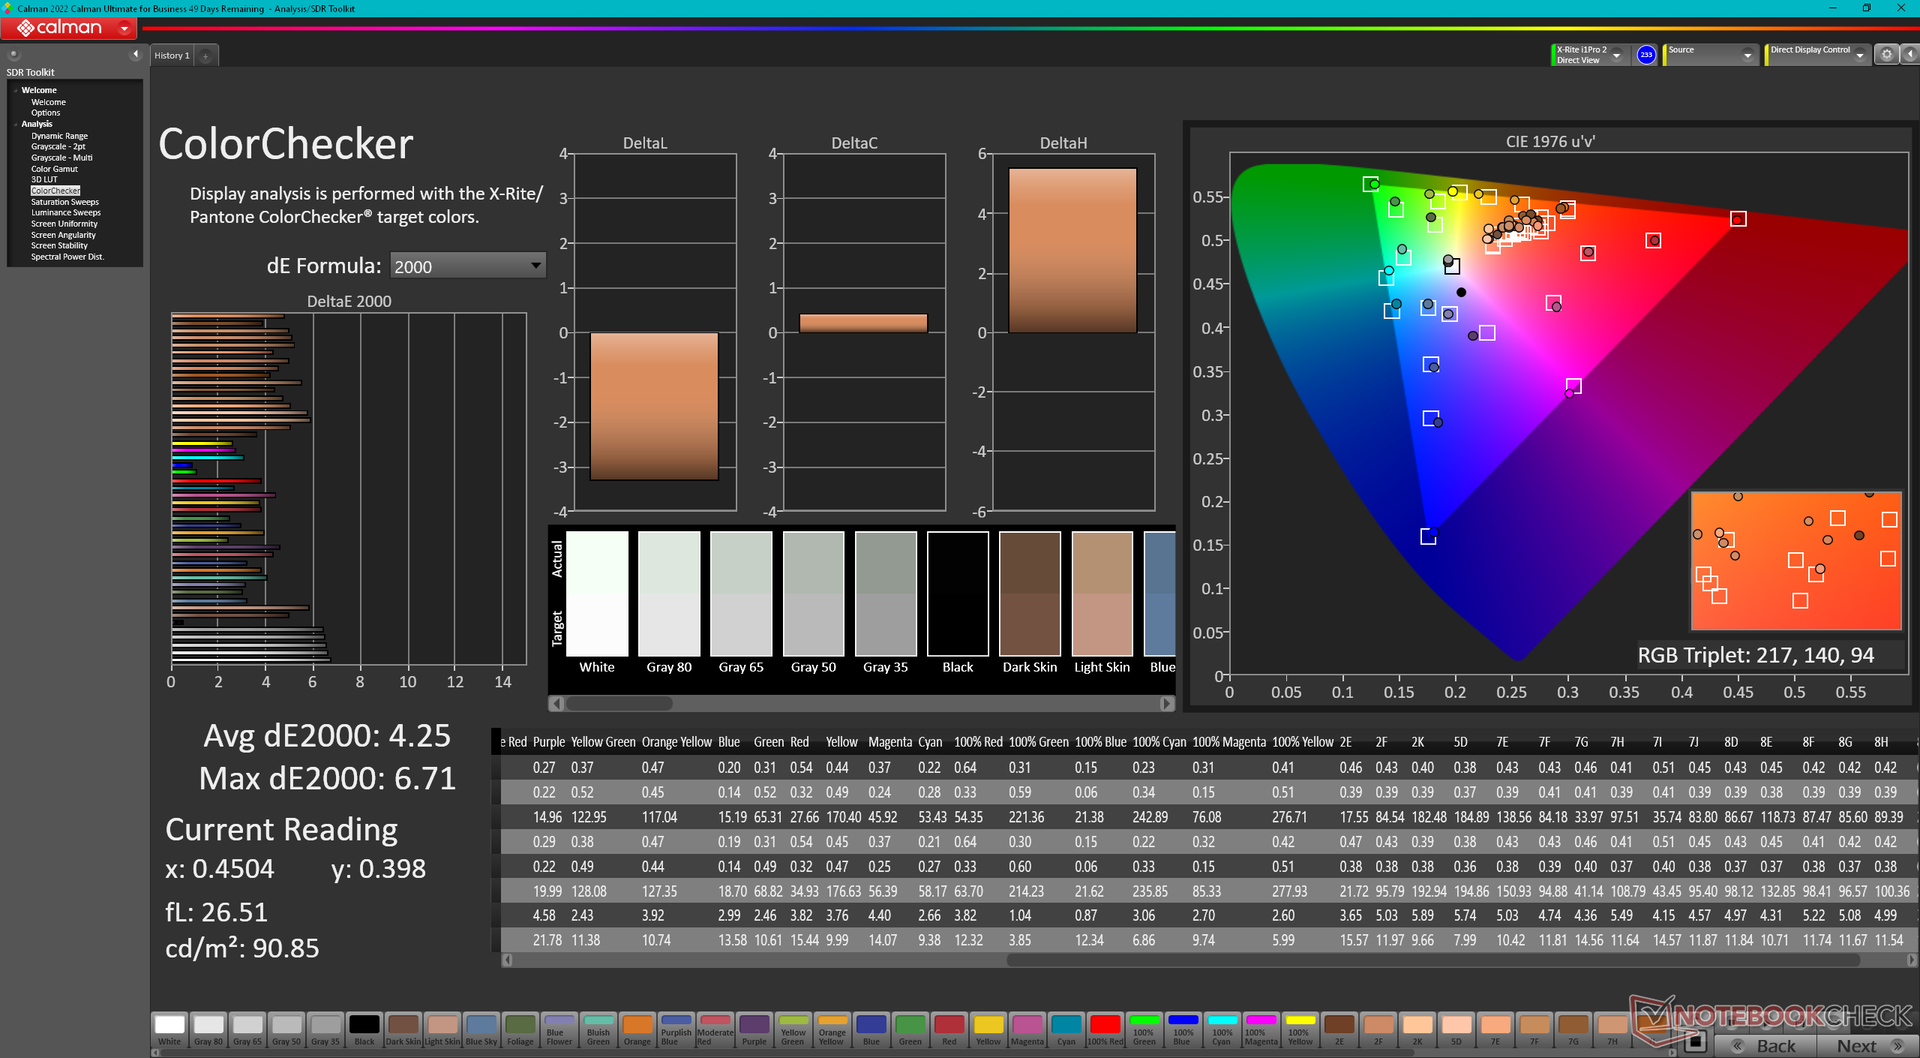
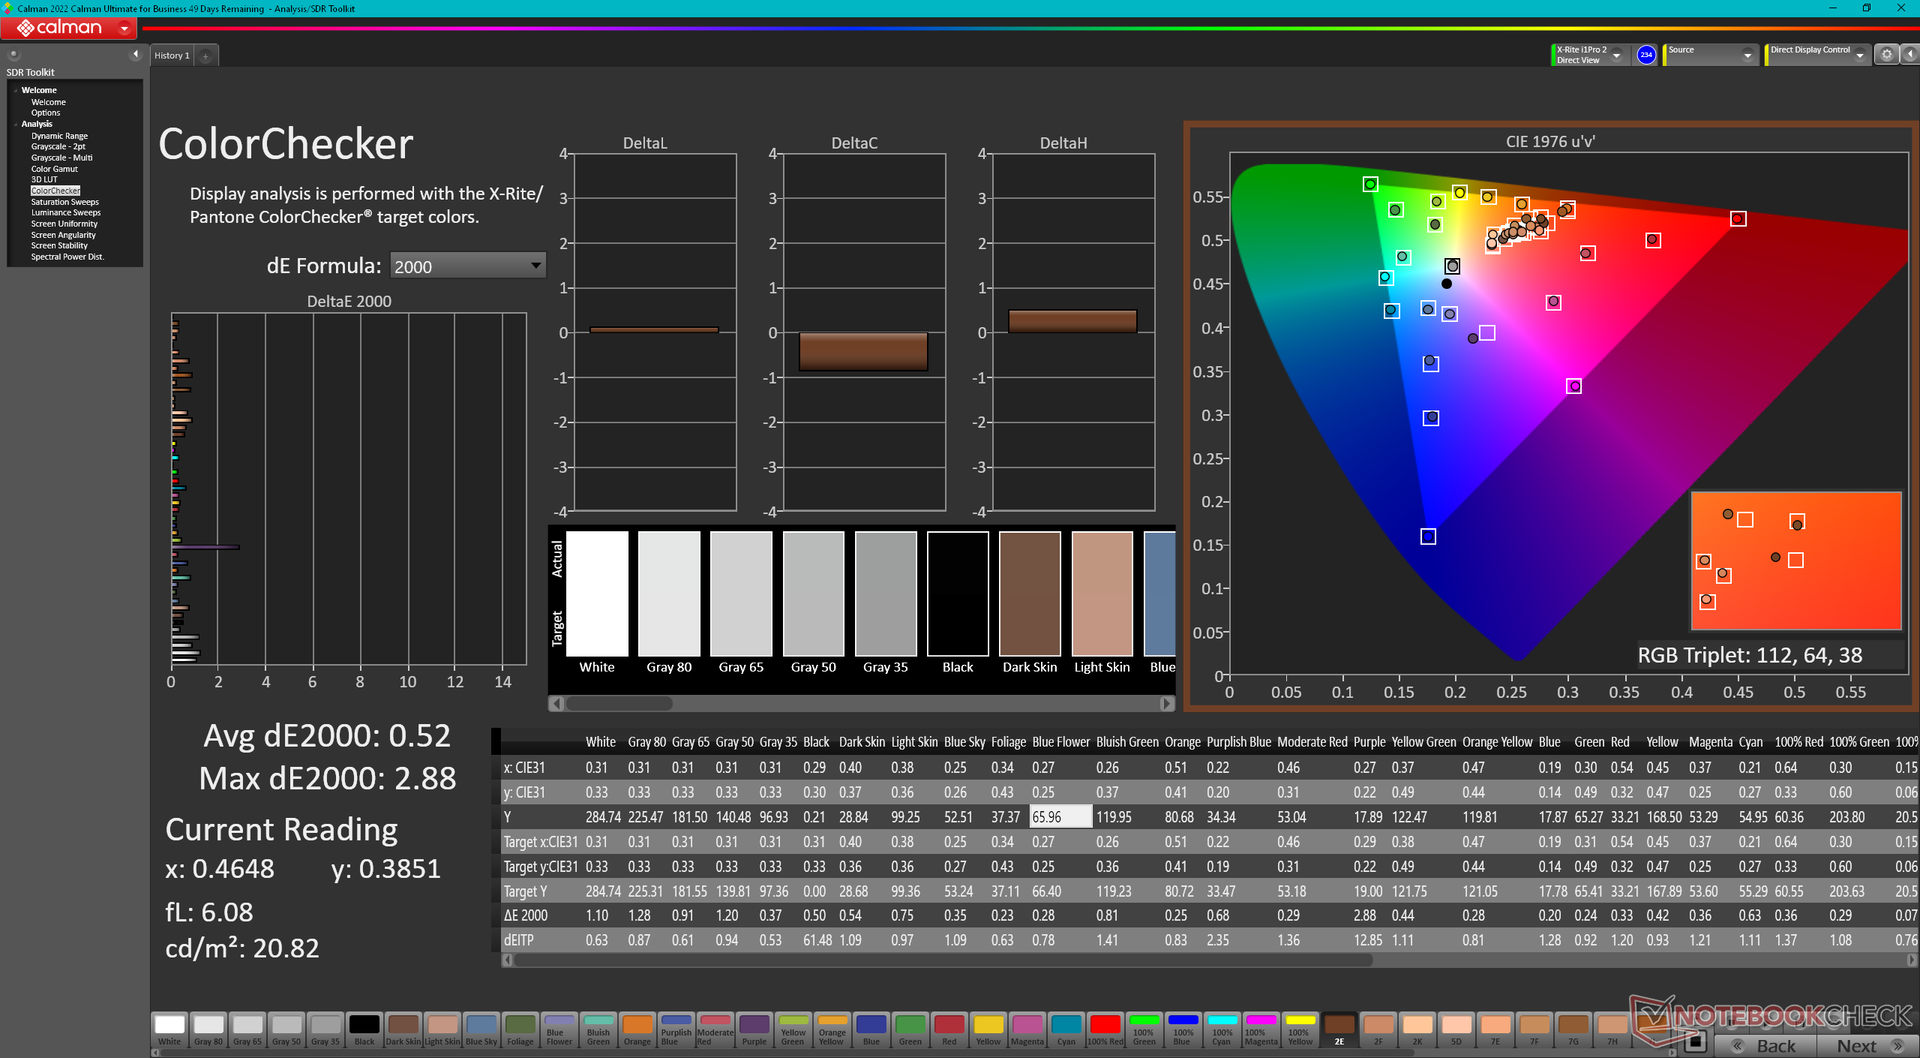
ΔE ColorChecker Calman: 4.25 | ∀{0.5-29.43 Ø4.73}
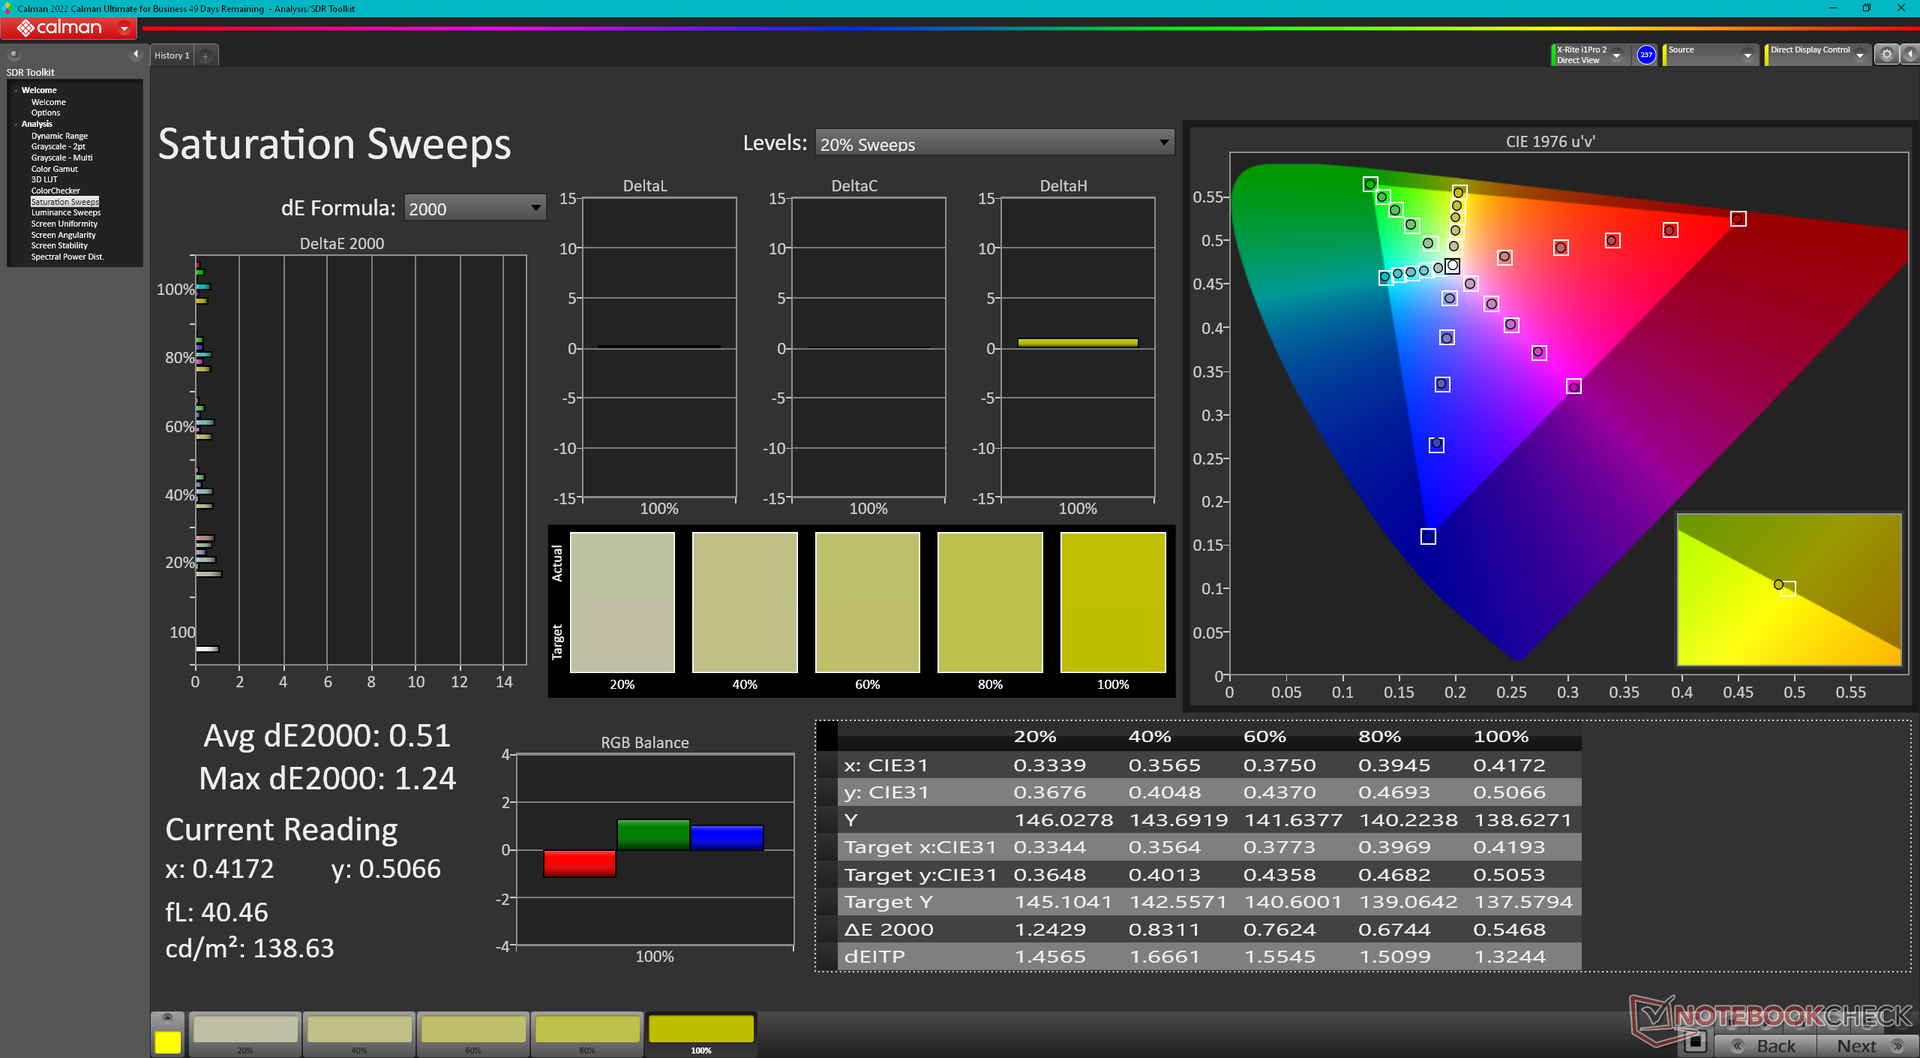
calibrated: 0.52
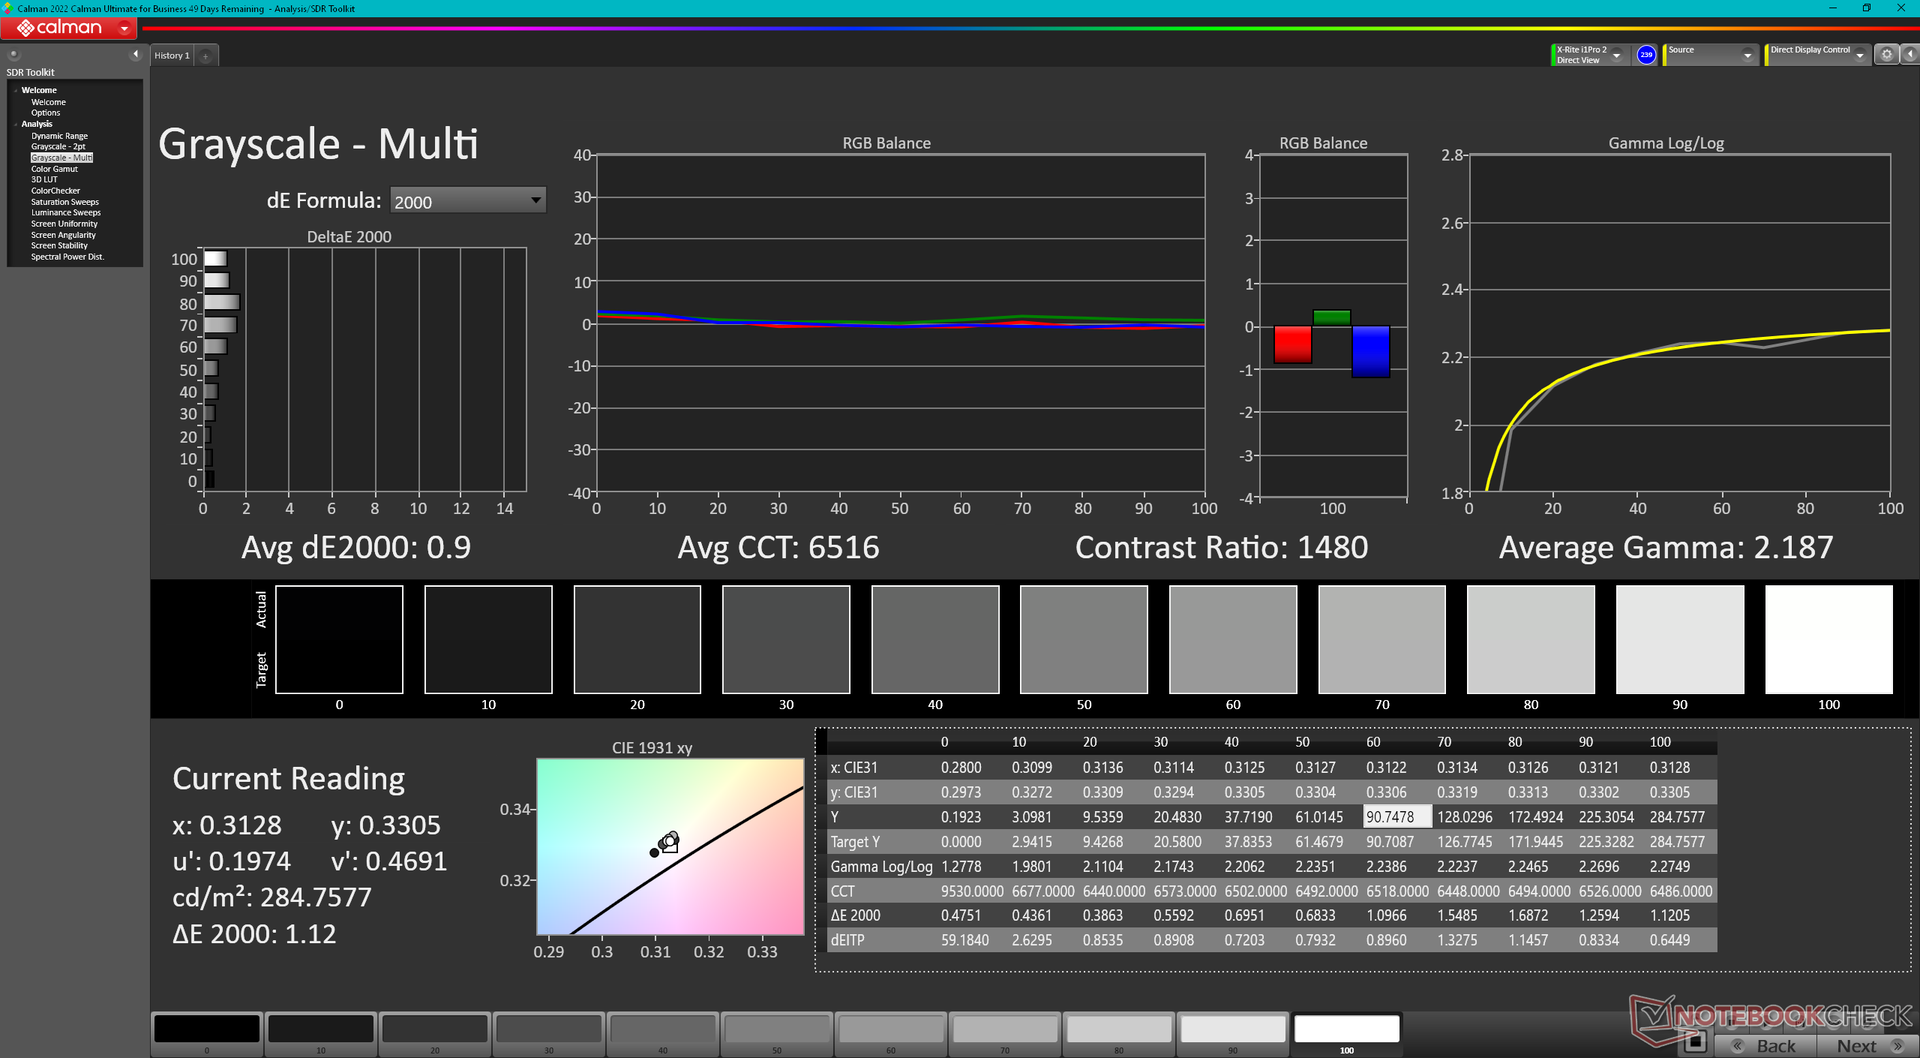
ΔE Greyscale Calman: 5.5 | ∀{0.09-98 Ø4.97}
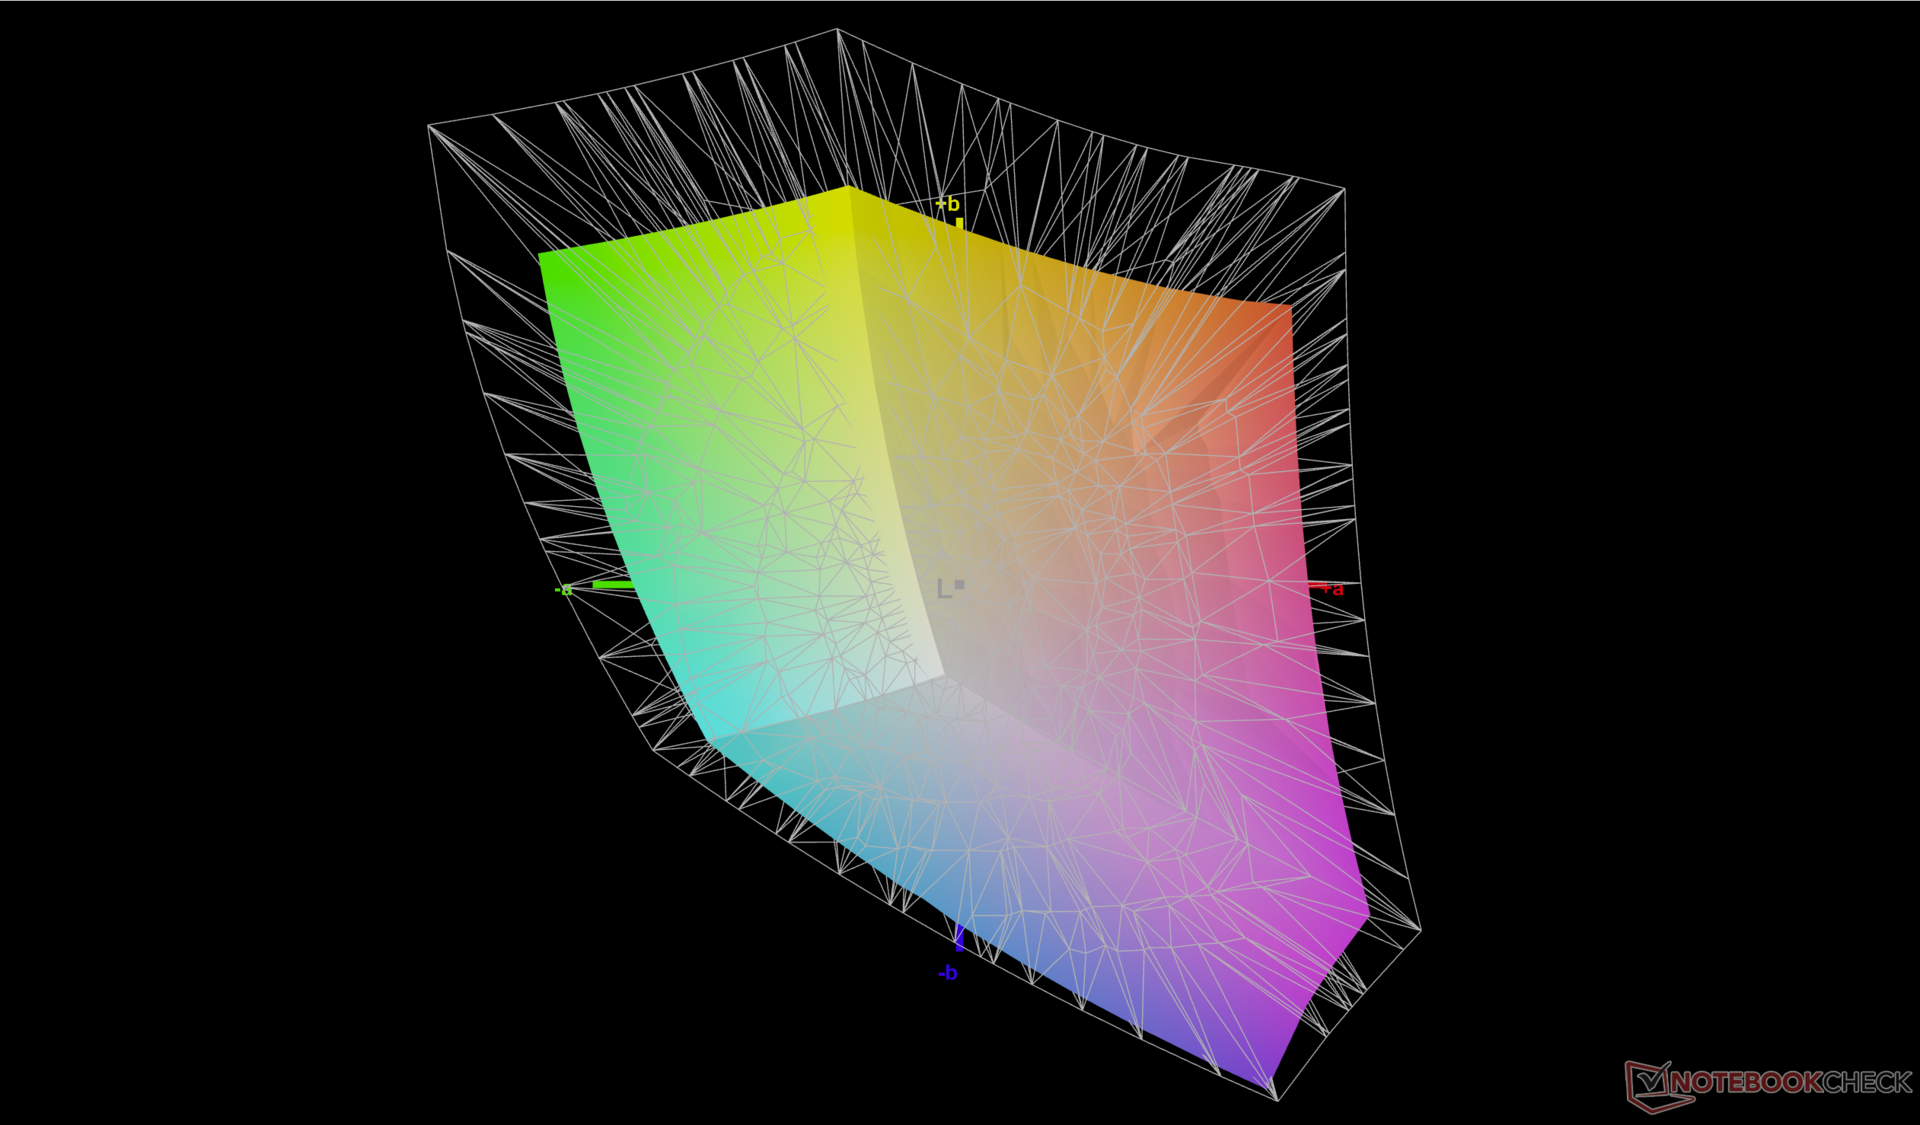
72.3% AdobeRGB 1998 (Argyll 3D)
99.6% sRGB (Argyll 3D)
70.1% Display P3 (Argyll 3D)
Gamma: 2.35
CCT: 6368 K
| Dell Inspiron 16 Plus 7630 LG Philips 160WQ2, IPS, 2560x1600, 16" | Dell Inspiron 16 Plus 7620 BOE NE16N41, IPS, 3072x1920, 16" | Lenovo Slim Pro 9i 16IRP8 LEN160-3.2K, Mini-LED, 3200x2000, 16" | Asus Vivobook Pro 16X K6604JV-MX016W Samsung SDC4178 ATNA60BX01-1, OLED, 3200x2000, 16" | HP Envy 16 h0112nr Samsung SDC4174, OLED, 3840x2400, 16" | MSI Summit E16 Flip A12UDT-031 AU Optronics B16QAN02.N, IPS, 2560x1600, 16" | |
|---|---|---|---|---|---|---|
| Display | 1% | 18% | 24% | 21% | 20% | |
| Display P3 Coverage (%) | 70.1 | 70.8 1% | 95.1 36% | 98.4 40% | 99.3 42% | 98.9 41% |
| sRGB Coverage (%) | 99.6 | 99.5 0% | 99.9 0% | 99.7 0% | 100 0% | 100 0% |
| AdobeRGB 1998 Coverage (%) | 72.3 | 73.2 1% | 84.6 17% | 95.8 33% | 88 22% | 86.5 20% |
| Response Times | -13% | 61% | 95% | 93% | 63% | |
| Response Time Grey 50% / Grey 80% * (ms) | 35 ? | 38 ? -9% | 14 ? 60% | 1.6 ? 95% | 2 ? 94% | 13 ? 63% |
| Response Time Black / White * (ms) | 24.2 ? | 28 ? -16% | 9.2 ? 62% | 1.4 ? 94% | 1.9 ? 92% | 9 ? 63% |
| PWM Frequency (Hz) | 5784 ? | 120 ? | 240.4 ? | |||
| Screen | 14% | -55% | 35% | 30% | -5% | |
| Brightness middle (cd/m²) | 299.4 | 288.9 -4% | 627.4 110% | 347 16% | 328.8 10% | 314 5% |
| Brightness (cd/m²) | 290 | 276 -5% | 618 113% | 346 19% | 332 14% | 294 1% |
| Brightness Distribution (%) | 92 | 92 0% | 95 3% | 97 5% | 97 5% | 89 -3% |
| Black Level * (cd/m²) | 0.21 | 0.26 -24% | 0.19 10% | 0.06 71% | 0.28 -33% | |
| Contrast (:1) | 1426 | 1111 -22% | 3302 132% | 5783 306% | 1121 -21% | |
| Colorchecker dE 2000 * | 4.25 | 1.88 56% | 5.84 -37% | 1.89 56% | 1.53 64% | 3.08 28% |
| Colorchecker dE 2000 max. * | 6.71 | 4.37 35% | 10.22 -52% | 3.26 51% | 6.04 10% | 5.49 18% |
| Colorchecker dE 2000 calibrated * | 0.52 | 0.42 19% | 4.45 -756% | 1.97 -279% | 0.88 -69% | |
| Greyscale dE 2000 * | 5.5 | 1.4 75% | 6.7 -22% | 1.55 72% | 1.3 76% | 3.99 27% |
| Gamma | 2.35 94% | 2.3 96% | 2.77 79% | 2.39 92% | 2.18 101% | 2.3 96% |
| CCT | 6368 102% | 6634 98% | 5795 112% | 6458 101% | 6362 102% | 6219 105% |
| Moyenne finale (programmes/paramètres) | 1% /
8% | 8% /
-23% | 51% /
41% | 48% /
39% | 26% /
10% |
* ... Moindre est la valeur, meilleures sont les performances
L'écran n'est pas pré-calibré avec des valeurs moyennes d'échelle de gris et de couleur deltaE de 5,5 et 4,25, respectivement. La température des couleurs est également plus chaude que d'habitude, à 6368. Un étalonnage correct à l'aide de notre colorimètre X-Rite permettrait de résoudre tous ces problèmes et d'obtenir un affichage nettement plus précis, comme le montrent nos résultats CalMAN ci-dessous. Notre profil ICM calibré peut être téléchargé gratuitement si vous ne disposez pas de vos propres outils de calibrage.
Temps de réponse de l'écran
| ↔ Temps de réponse noir à blanc | ||
|---|---|---|
| 24.2 ms ... hausse ↗ et chute ↘ combinées | ↗ 10.8 ms hausse | 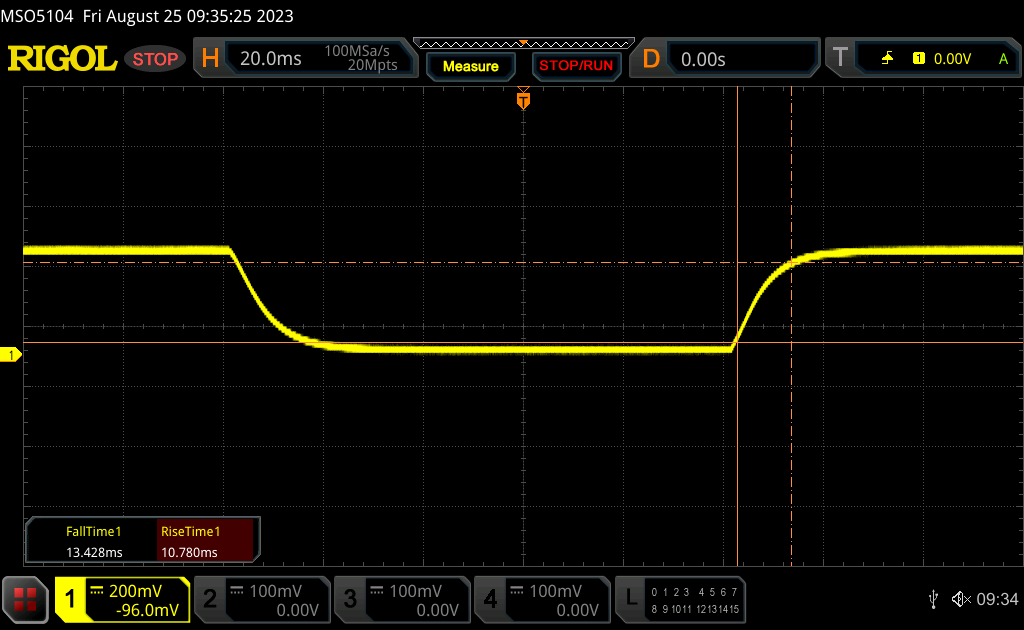 |
| ↘ 13.4 ms chute | ||
| L'écran montre de bons temps de réponse, mais insuffisant pour du jeu compétitif. En comparaison, tous les appareils testés affichent entre 0.1 (minimum) et 240 (maximum) ms. » 57 % des appareils testés affichent de meilleures performances. Cela signifie que les latences relevées sont moins bonnes que la moyenne (19.9 ms) de tous les appareils testés. | ||
| ↔ Temps de réponse gris 50% à gris 80% | ||
| 35 ms ... hausse ↗ et chute ↘ combinées | ↗ 15.7 ms hausse | 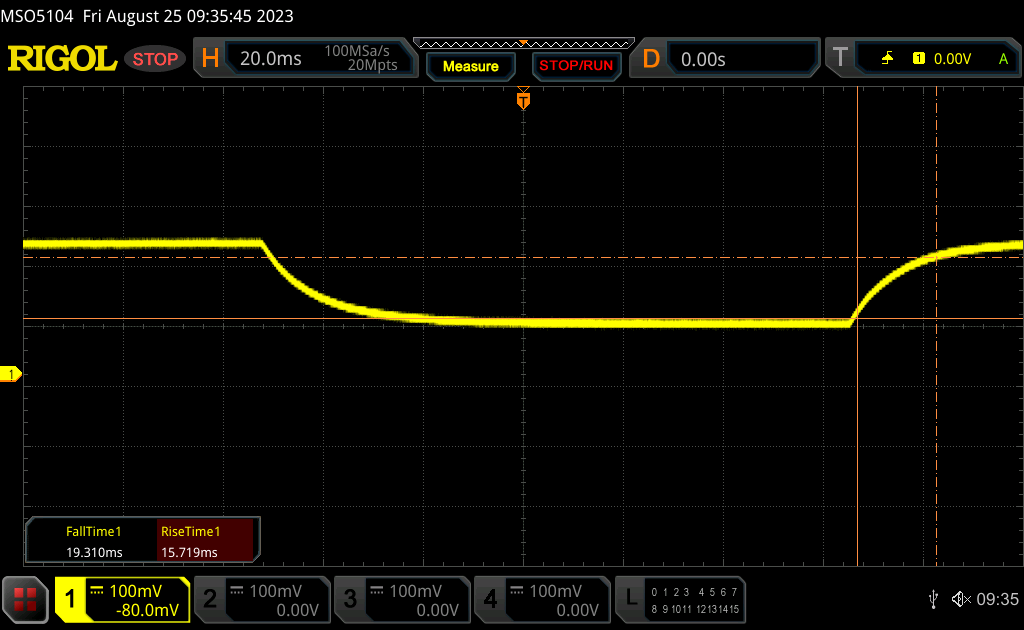 |
| ↘ 19.3 ms chute | ||
| L'écran souffre de latences très élevées, à éviter pour le jeu. En comparaison, tous les appareils testés affichent entre 0.165 (minimum) et 636 (maximum) ms. » 49 % des appareils testés affichent de meilleures performances. Cela signifie que les latences relevées sont moins bonnes que la moyenne (31.1 ms) de tous les appareils testés. | ||
Scintillement / MLI (Modulation de largeur d'impulsion)
| Scintillement / MLI (Modulation de largeur d'impulsion) non décelé | 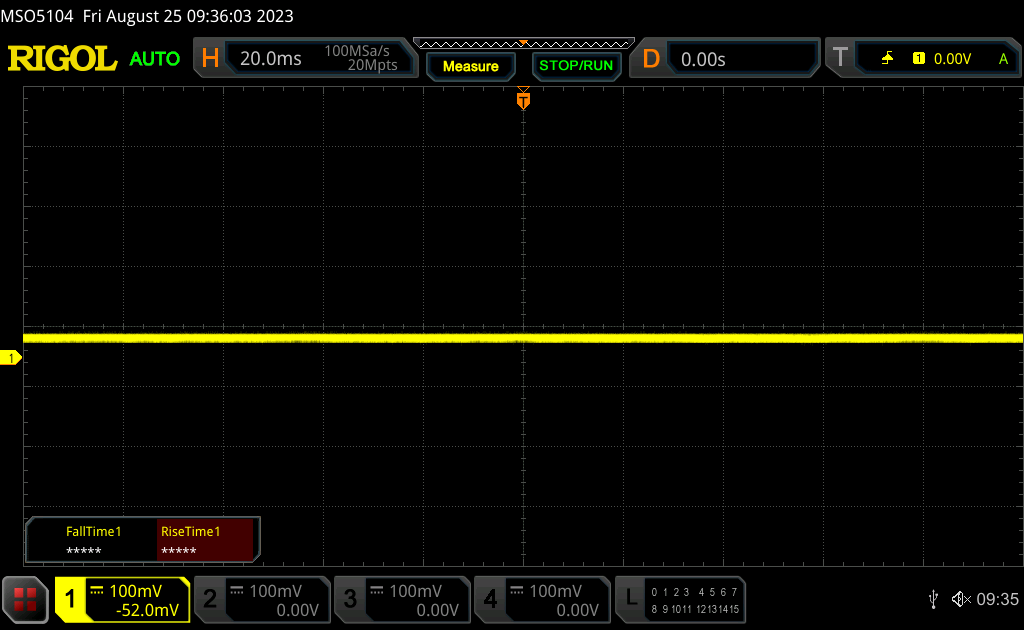 | ||
En comparaison, 52 % des appareils testés n'emploient pas MDI pour assombrir leur écran. Nous avons relevé une moyenne à 7798 (minimum : 5 - maximum : 343500) Hz dans le cas où une MDI était active. | |||
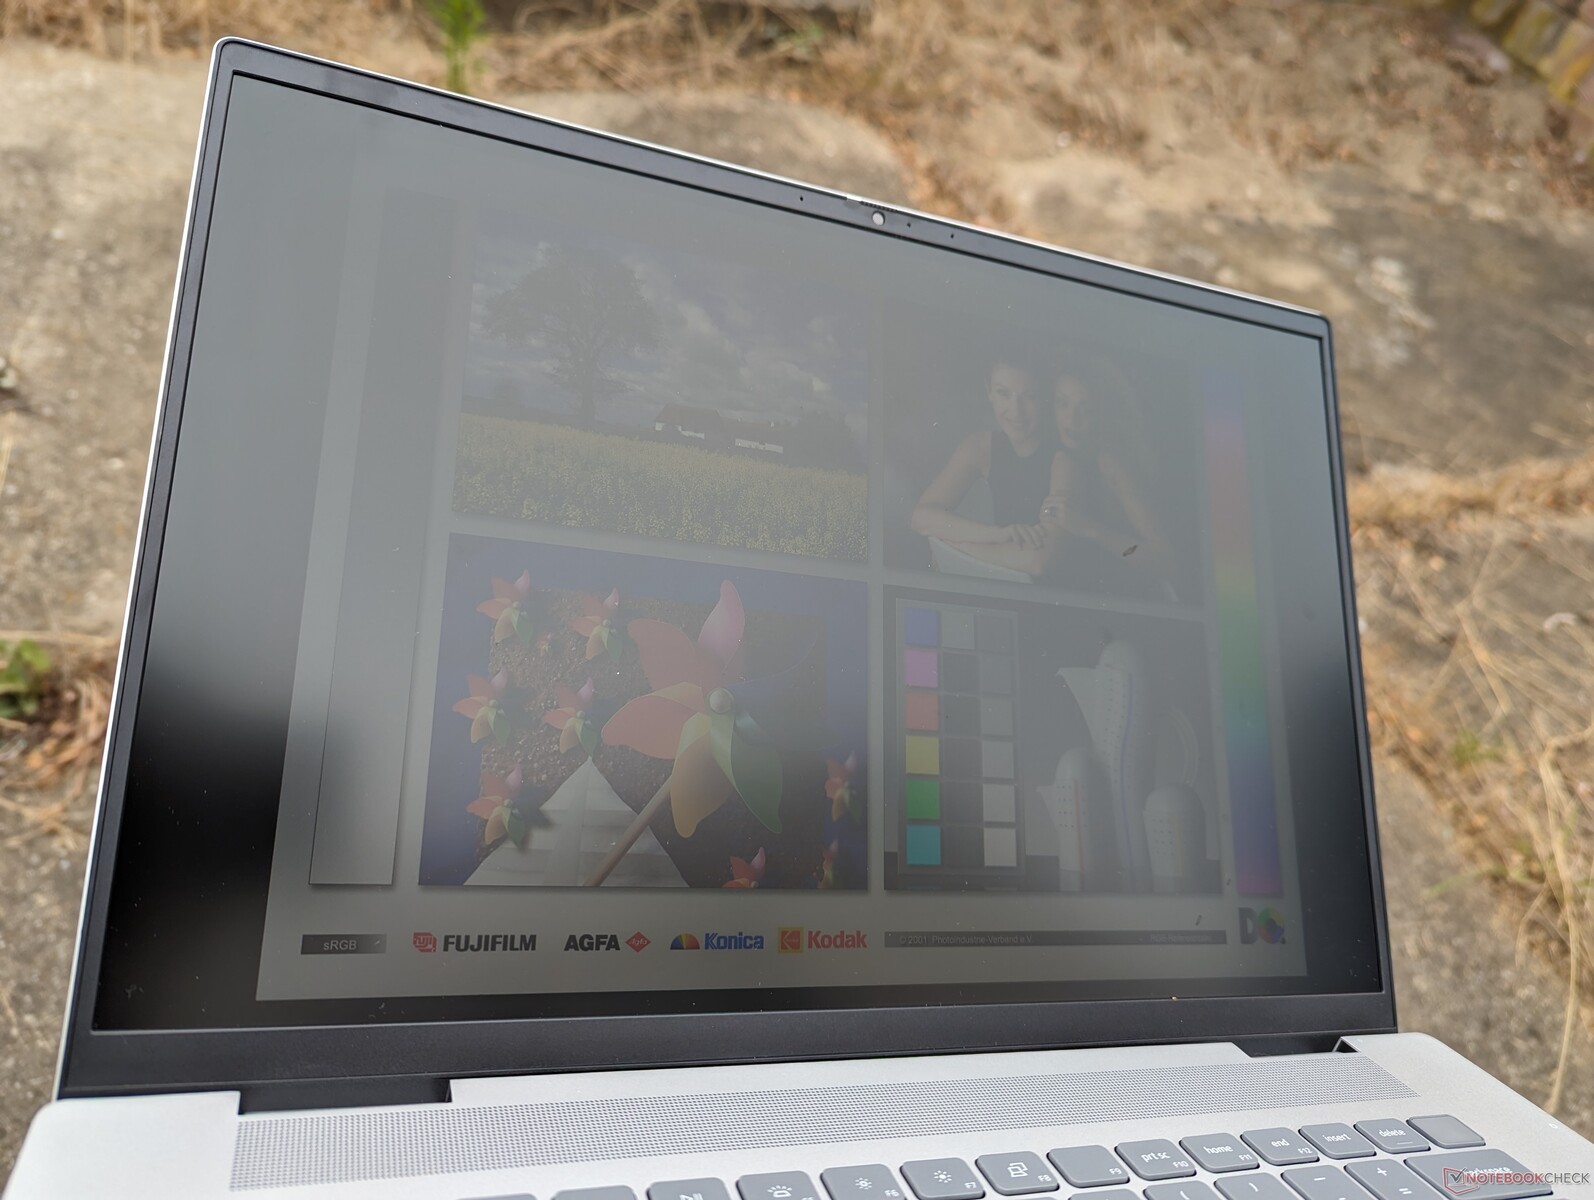
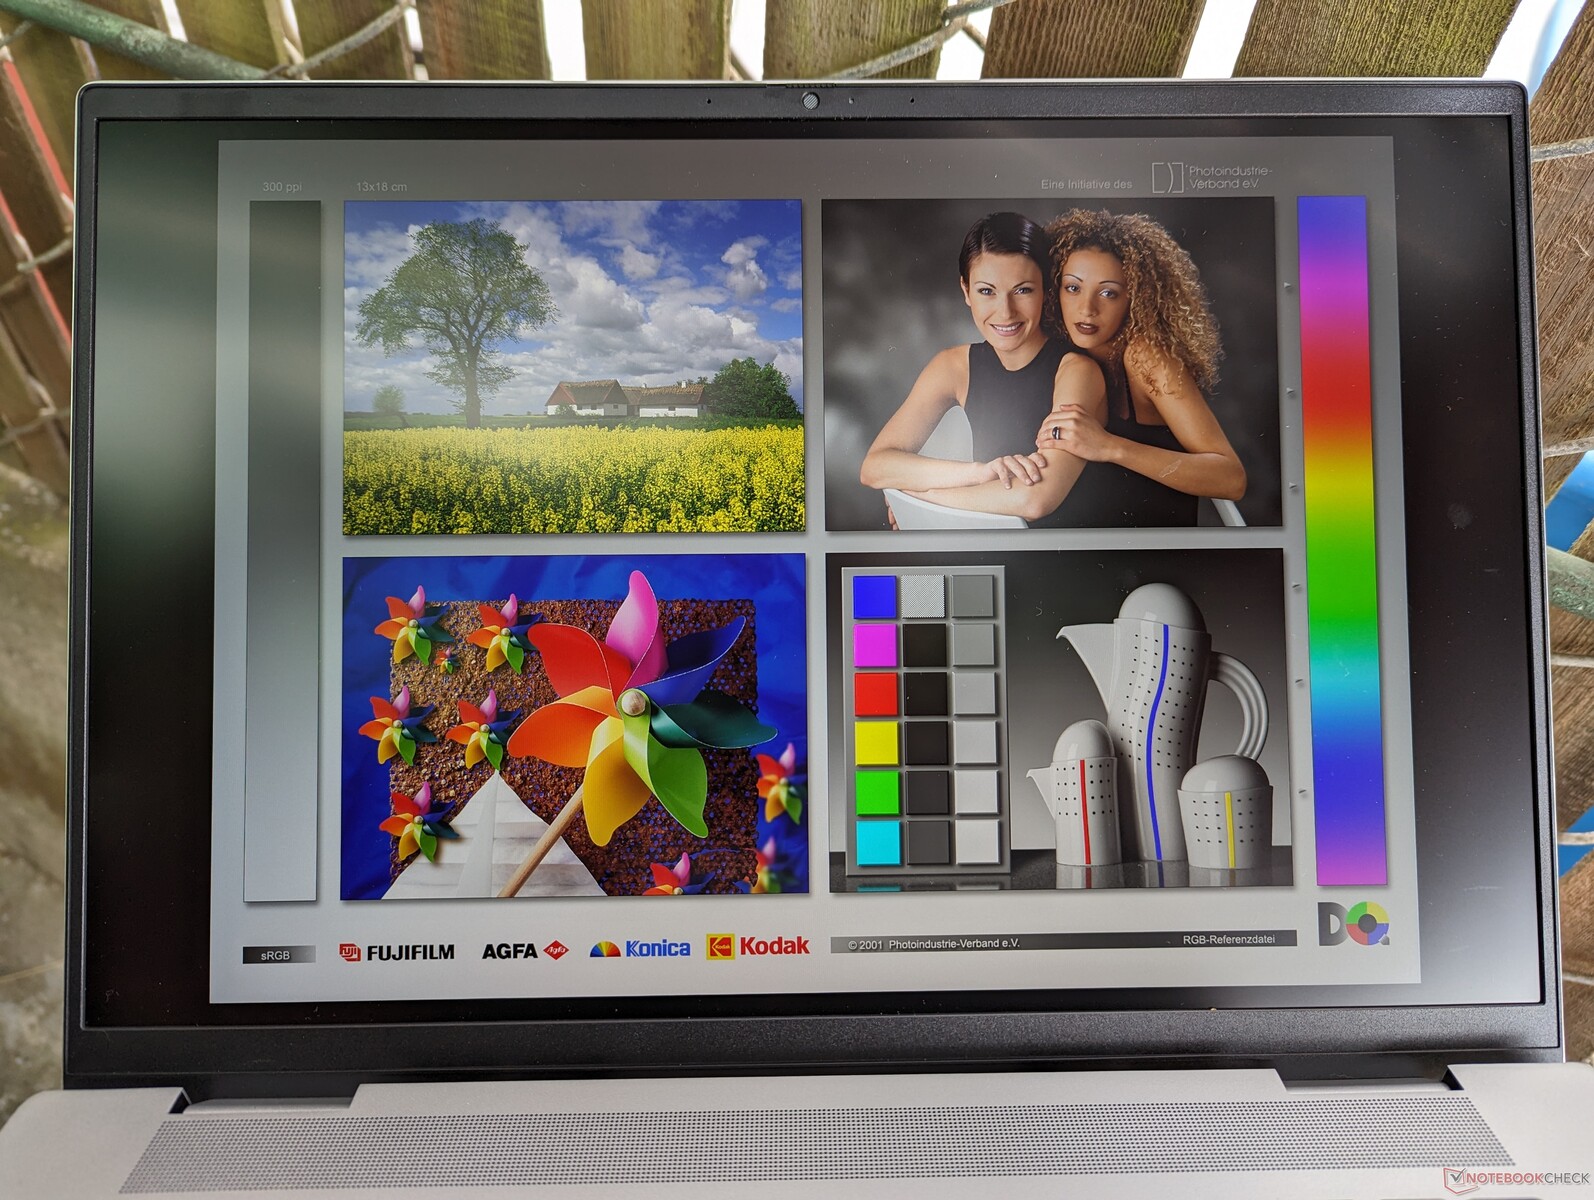
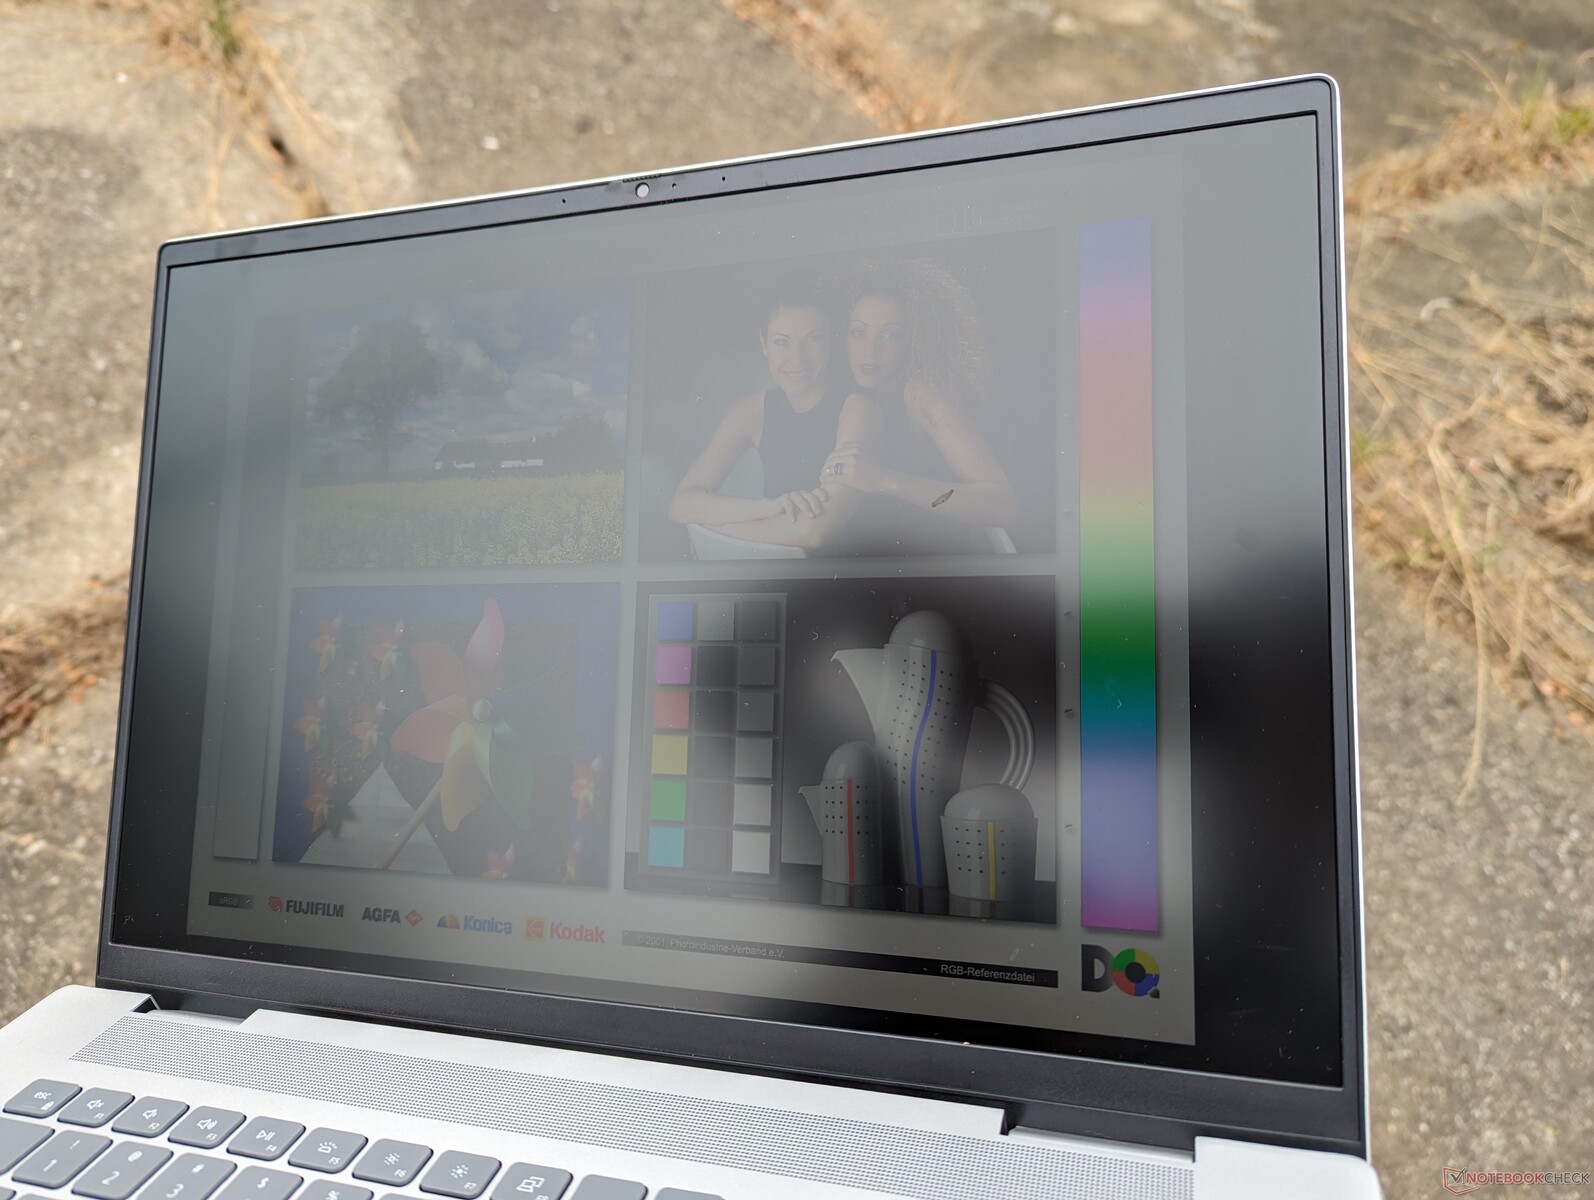
La visibilité en extérieur est comparable à celle du modèle de l'année dernière et n'est satisfaisante qu'à l'ombre pour minimiser les reflets. D'autres ordinateurs portables de 16 pouces avec mini-LED ou OLED comme le Yoga 9i 16 ou le Razer Blade 16 ont tendance à être plus lumineux pour une meilleure visibilité en extérieur, mais ils sont aussi beaucoup plus chers que notre Dell.
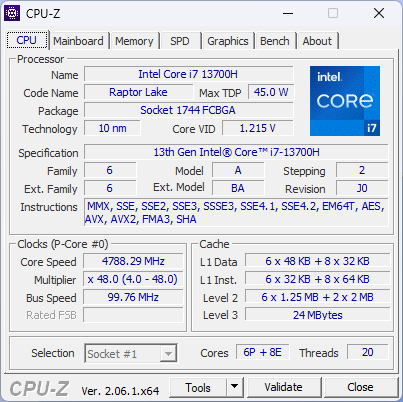
Performance - Intel 13th Gen Raptor Lake-H
Conditions d'essai
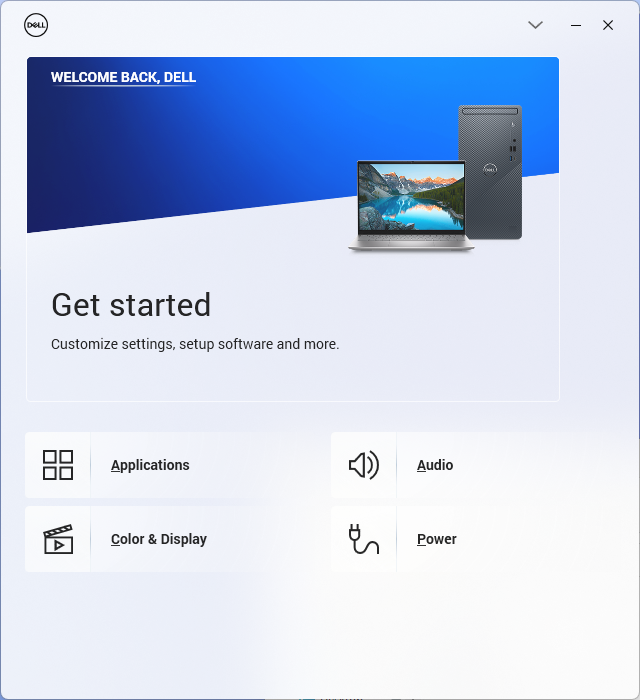
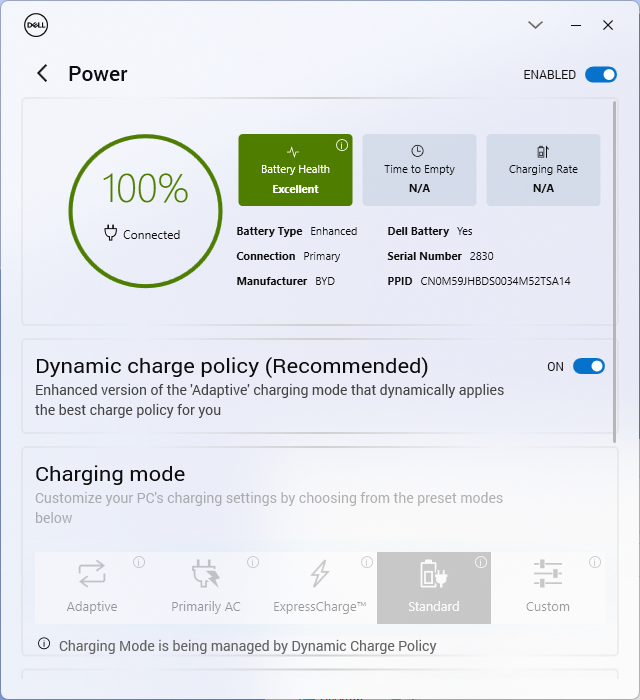
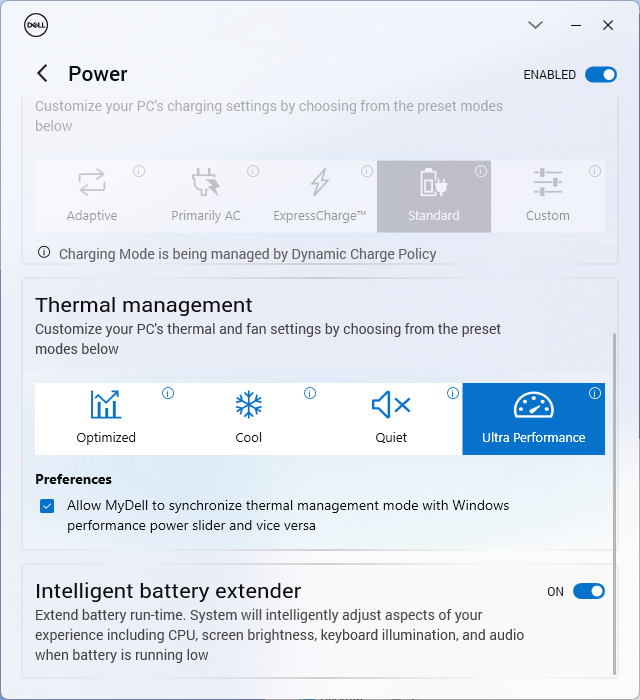
Nous avons réglé notre appareil en mode Performance via le logiciel MyDell préinstallé avant d'effectuer les tests de référence ci-dessous. Les profils d'alimentation MyDell peuvent être synchronisés avec les profils d'alimentation Windows afin de réduire la confusion et d'éviter les conflits de paramètres.
L'Inspiron ne prend pas en charge Advanced Optimus ou MUX, qui sont des fonctions courantes sur les modèles dédiés aux jeux de la série G de Dell ou de la série Alienware.
Processeur
Performances du processeur de notre Core i7-13700H de 13e génération Core i7-13700H n'est que de 10 % supérieure à celle du Core i7-12700H de 12e génération de l'Inspiron 16 Plus 7620 de l'année dernière. Cependant, une fois que les avantages respectifs du Turbo Boost diminuent, les différences de performances sont encore plus faibles, comme le montrent les résultats de la boucle CineBench R15 xT ci-dessous. En d'autres termes, l'Inspiron 16 Plus 7630 n'est que marginalement plus rapide que le modèle de l'année dernière, dans le meilleur des cas, en ce qui concerne les performances du processeur.
En rétrogradant vers le Core i5-13500H ne devrait avoir un impact sur les performances du processeur que d'environ 10 %, d'après notre expérience avec l'Asus VivoBook 14X Asus VivoBook 14X. En revanche, le processeur Ryzen 7 7840HS basée sur AMD devrait être au coude à coude avec notre Core i7-13700H.
Cinebench R15 Multi Loop
Cinebench R23: Multi Core | Single Core
Cinebench R20: CPU (Multi Core) | CPU (Single Core)
Cinebench R15: CPU Multi 64Bit | CPU Single 64Bit
Blender: v2.79 BMW27 CPU
7-Zip 18.03: 7z b 4 | 7z b 4 -mmt1
Geekbench 5.5: Multi-Core | Single-Core
HWBOT x265 Benchmark v2.2: 4k Preset
LibreOffice : 20 Documents To PDF
R Benchmark 2.5: Overall mean
* ... Moindre est la valeur, meilleures sont les performances
AIDA64: FP32 Ray-Trace | FPU Julia | CPU SHA3 | CPU Queen | FPU SinJulia | FPU Mandel | CPU AES | CPU ZLib | FP64 Ray-Trace | CPU PhotoWorxx
| Performance rating | |
| Asus Vivobook Pro 16X K6604JV-MX016W | |
| Lenovo Slim Pro 9i 16IRP8 | |
| Moyenne Intel Core i7-13700H | |
| Dell Inspiron 16 Plus 7630 | |
| MSI Summit E16 Flip A12UDT-031 | |
| HP Envy 16 h0112nr | |
| Dell Inspiron 16 Plus 7620 | |
| AIDA64 / FP32 Ray-Trace | |
| Asus Vivobook Pro 16X K6604JV-MX016W | |
| Lenovo Slim Pro 9i 16IRP8 | |
| Moyenne Intel Core i7-13700H (4986 - 18908, n=29) | |
| Dell Inspiron 16 Plus 7630 | |
| MSI Summit E16 Flip A12UDT-031 | |
| Dell Inspiron 16 Plus 7620 | |
| HP Envy 16 h0112nr | |
| AIDA64 / FPU Julia | |
| Asus Vivobook Pro 16X K6604JV-MX016W | |
| Lenovo Slim Pro 9i 16IRP8 | |
| Moyenne Intel Core i7-13700H (25360 - 92359, n=29) | |
| Dell Inspiron 16 Plus 7630 | |
| MSI Summit E16 Flip A12UDT-031 | |
| Dell Inspiron 16 Plus 7620 | |
| HP Envy 16 h0112nr | |
| AIDA64 / CPU SHA3 | |
| Asus Vivobook Pro 16X K6604JV-MX016W | |
| Lenovo Slim Pro 9i 16IRP8 | |
| Moyenne Intel Core i7-13700H (1339 - 4224, n=29) | |
| Dell Inspiron 16 Plus 7630 | |
| MSI Summit E16 Flip A12UDT-031 | |
| Dell Inspiron 16 Plus 7620 | |
| HP Envy 16 h0112nr | |
| AIDA64 / CPU Queen | |
| Asus Vivobook Pro 16X K6604JV-MX016W | |
| Lenovo Slim Pro 9i 16IRP8 | |
| Dell Inspiron 16 Plus 7630 | |
| HP Envy 16 h0112nr | |
| MSI Summit E16 Flip A12UDT-031 | |
| Moyenne Intel Core i7-13700H (59324 - 107159, n=29) | |
| Dell Inspiron 16 Plus 7620 | |
| AIDA64 / FPU SinJulia | |
| Asus Vivobook Pro 16X K6604JV-MX016W | |
| Lenovo Slim Pro 9i 16IRP8 | |
| Dell Inspiron 16 Plus 7630 | |
| Moyenne Intel Core i7-13700H (4800 - 11050, n=29) | |
| MSI Summit E16 Flip A12UDT-031 | |
| Dell Inspiron 16 Plus 7620 | |
| HP Envy 16 h0112nr | |
| AIDA64 / FPU Mandel | |
| Asus Vivobook Pro 16X K6604JV-MX016W | |
| Lenovo Slim Pro 9i 16IRP8 | |
| Moyenne Intel Core i7-13700H (12321 - 45118, n=29) | |
| Dell Inspiron 16 Plus 7630 | |
| MSI Summit E16 Flip A12UDT-031 | |
| Dell Inspiron 16 Plus 7620 | |
| HP Envy 16 h0112nr | |
| AIDA64 / CPU AES | |
| HP Envy 16 h0112nr | |
| Asus Vivobook Pro 16X K6604JV-MX016W | |
| Lenovo Slim Pro 9i 16IRP8 | |
| Moyenne Intel Core i7-13700H (28769 - 151254, n=29) | |
| Dell Inspiron 16 Plus 7620 | |
| MSI Summit E16 Flip A12UDT-031 | |
| Dell Inspiron 16 Plus 7630 | |
| AIDA64 / CPU ZLib | |
| Asus Vivobook Pro 16X K6604JV-MX016W | |
| Lenovo Slim Pro 9i 16IRP8 | |
| Dell Inspiron 16 Plus 7620 | |
| Moyenne Intel Core i7-13700H (389 - 1215, n=29) | |
| MSI Summit E16 Flip A12UDT-031 | |
| Dell Inspiron 16 Plus 7630 | |
| HP Envy 16 h0112nr | |
| AIDA64 / FP64 Ray-Trace | |
| Asus Vivobook Pro 16X K6604JV-MX016W | |
| Lenovo Slim Pro 9i 16IRP8 | |
| Moyenne Intel Core i7-13700H (2540 - 10135, n=29) | |
| Dell Inspiron 16 Plus 7630 | |
| MSI Summit E16 Flip A12UDT-031 | |
| Dell Inspiron 16 Plus 7620 | |
| HP Envy 16 h0112nr | |
| AIDA64 / CPU PhotoWorxx | |
| Lenovo Slim Pro 9i 16IRP8 | |
| Asus Vivobook Pro 16X K6604JV-MX016W | |
| MSI Summit E16 Flip A12UDT-031 | |
| Moyenne Intel Core i7-13700H (12872 - 52727, n=29) | |
| Dell Inspiron 16 Plus 7630 | |
| HP Envy 16 h0112nr | |
| Dell Inspiron 16 Plus 7620 | |
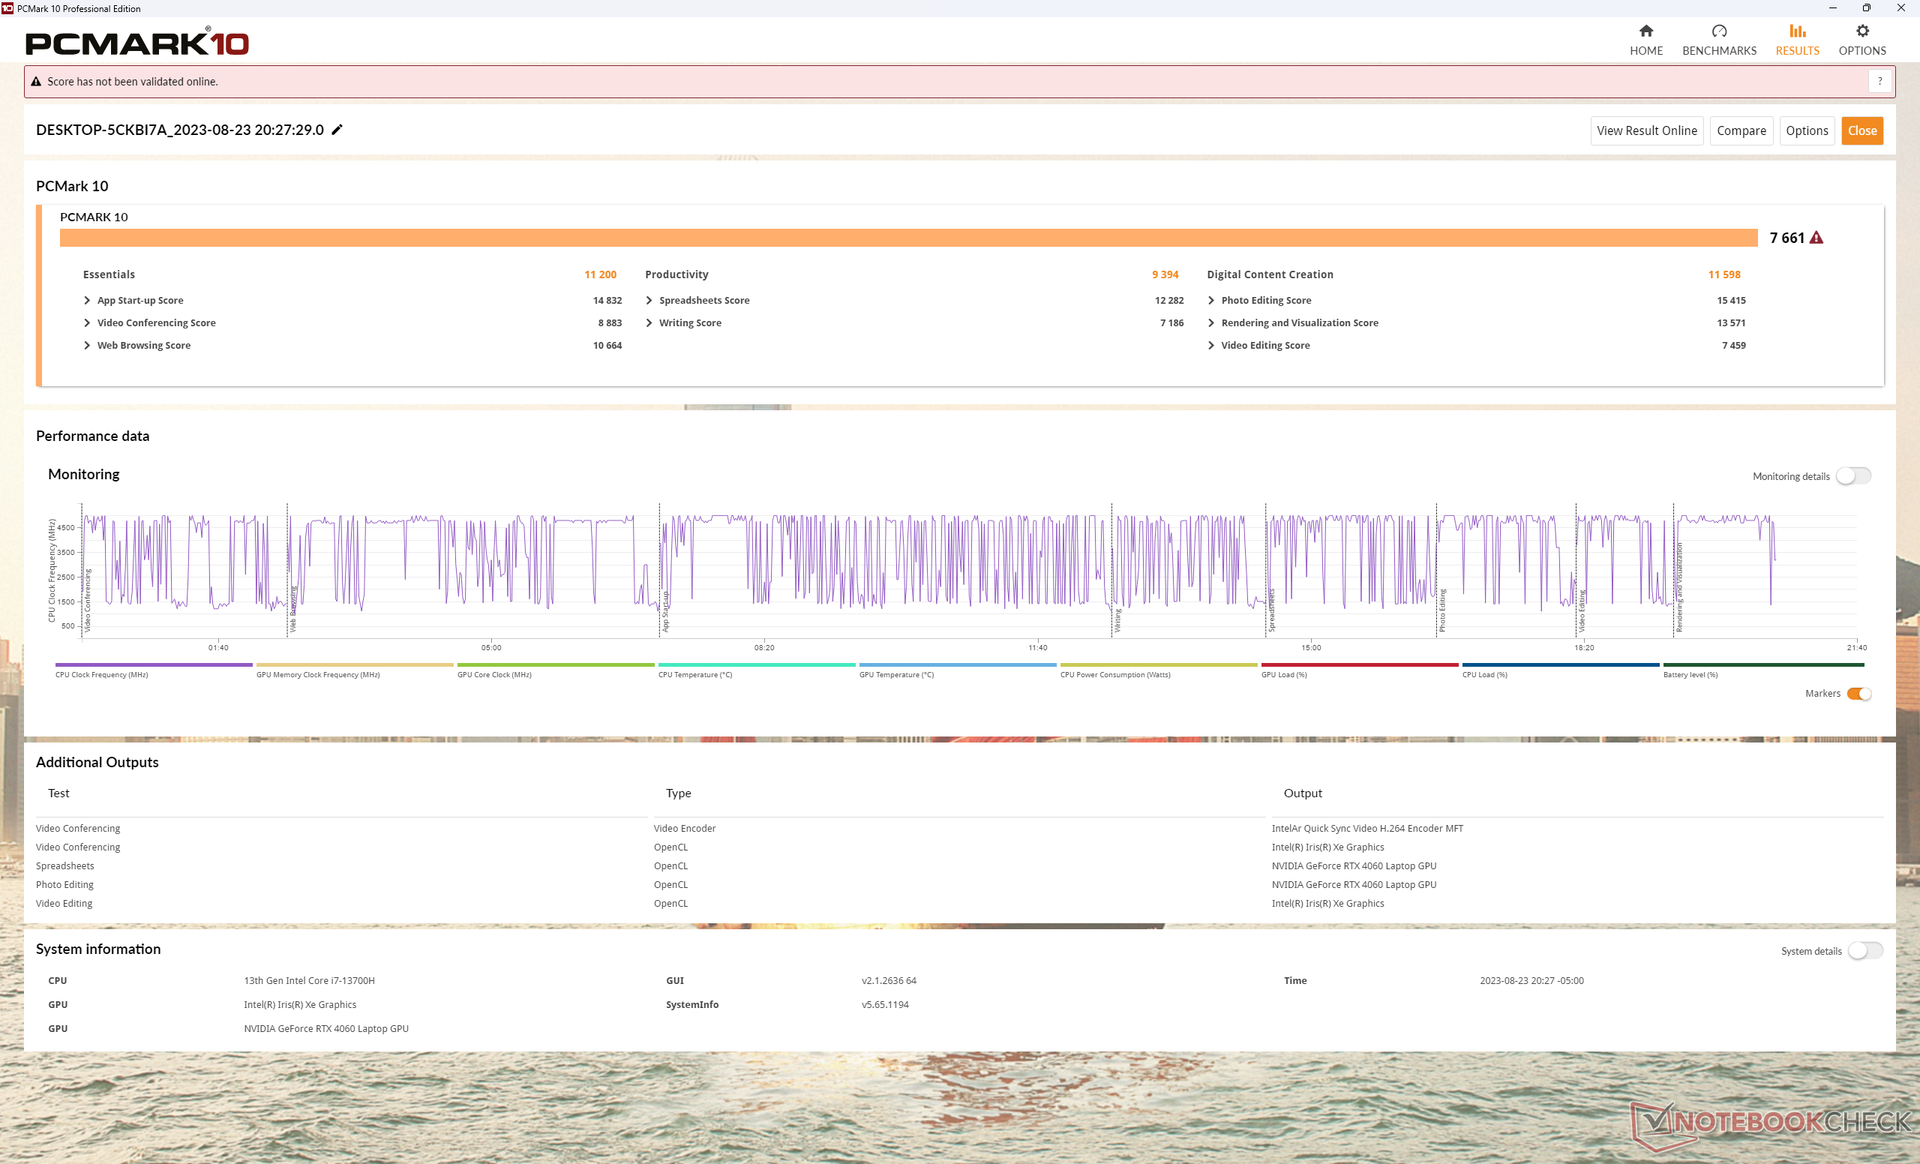
Performance du système
Les scores PCMark sont toujours plus élevés que ceux de l'Inspiron 16 Plus 7620 de l'année dernière, en particulier dans le sous-test de création de contenu numérique, où les performances du GPU sont les plus importantes.
Nous n'avons pas rencontré de problèmes de sortie de veille ou de BSOD, contrairement à l'Inspiron 16 Plus 7620 de l'année dernière Alienware m16 R1.
CrossMark: Overall | Productivity | Creativity | Responsiveness
| PCMark 10 / Score | |
| Lenovo Slim Pro 9i 16IRP8 | |
| Dell Inspiron 16 Plus 7630 | |
| HP Envy 16 h0112nr | |
| Moyenne Intel Core i7-13700H, NVIDIA GeForce RTX 4060 Laptop GPU (7157 - 7661, n=5) | |
| Asus Vivobook Pro 16X K6604JV-MX016W | |
| Dell Inspiron 16 Plus 7620 | |
| MSI Summit E16 Flip A12UDT-031 | |
| PCMark 10 / Essentials | |
| HP Envy 16 h0112nr | |
| Lenovo Slim Pro 9i 16IRP8 | |
| Dell Inspiron 16 Plus 7630 | |
| Moyenne Intel Core i7-13700H, NVIDIA GeForce RTX 4060 Laptop GPU (10179 - 11200, n=5) | |
| Asus Vivobook Pro 16X K6604JV-MX016W | |
| Dell Inspiron 16 Plus 7620 | |
| MSI Summit E16 Flip A12UDT-031 | |
| PCMark 10 / Productivity | |
| Lenovo Slim Pro 9i 16IRP8 | |
| Moyenne Intel Core i7-13700H, NVIDIA GeForce RTX 4060 Laptop GPU (8238 - 10249, n=5) | |
| Dell Inspiron 16 Plus 7630 | |
| HP Envy 16 h0112nr | |
| Dell Inspiron 16 Plus 7620 | |
| Asus Vivobook Pro 16X K6604JV-MX016W | |
| MSI Summit E16 Flip A12UDT-031 | |
| PCMark 10 / Digital Content Creation | |
| Dell Inspiron 16 Plus 7630 | |
| Lenovo Slim Pro 9i 16IRP8 | |
| Moyenne Intel Core i7-13700H, NVIDIA GeForce RTX 4060 Laptop GPU (10308 - 11862, n=5) | |
| HP Envy 16 h0112nr | |
| Dell Inspiron 16 Plus 7620 | |
| Asus Vivobook Pro 16X K6604JV-MX016W | |
| MSI Summit E16 Flip A12UDT-031 | |
| CrossMark / Overall | |
| Asus Vivobook Pro 16X K6604JV-MX016W | |
| Dell Inspiron 16 Plus 7630 | |
| HP Envy 16 h0112nr | |
| Lenovo Slim Pro 9i 16IRP8 | |
| Dell Inspiron 16 Plus 7620 | |
| Moyenne Intel Core i7-13700H, NVIDIA GeForce RTX 4060 Laptop GPU (1629 - 1849, n=5) | |
| MSI Summit E16 Flip A12UDT-031 | |
| CrossMark / Productivity | |
| Asus Vivobook Pro 16X K6604JV-MX016W | |
| Dell Inspiron 16 Plus 7630 | |
| HP Envy 16 h0112nr | |
| Dell Inspiron 16 Plus 7620 | |
| Lenovo Slim Pro 9i 16IRP8 | |
| Moyenne Intel Core i7-13700H, NVIDIA GeForce RTX 4060 Laptop GPU (1561 - 1743, n=5) | |
| MSI Summit E16 Flip A12UDT-031 | |
| CrossMark / Creativity | |
| Asus Vivobook Pro 16X K6604JV-MX016W | |
| Lenovo Slim Pro 9i 16IRP8 | |
| Dell Inspiron 16 Plus 7630 | |
| HP Envy 16 h0112nr | |
| Dell Inspiron 16 Plus 7620 | |
| Moyenne Intel Core i7-13700H, NVIDIA GeForce RTX 4060 Laptop GPU (1691 - 2064, n=5) | |
| MSI Summit E16 Flip A12UDT-031 | |
| CrossMark / Responsiveness | |
| Asus Vivobook Pro 16X K6604JV-MX016W | |
| HP Envy 16 h0112nr | |
| Dell Inspiron 16 Plus 7630 | |
| MSI Summit E16 Flip A12UDT-031 | |
| Dell Inspiron 16 Plus 7620 | |
| Moyenne Intel Core i7-13700H, NVIDIA GeForce RTX 4060 Laptop GPU (1381 - 1656, n=5) | |
| Lenovo Slim Pro 9i 16IRP8 | |
| PCMark 10 Score | 7661 points | |
Aide | ||
| AIDA64 / Memory Copy | |
| Lenovo Slim Pro 9i 16IRP8 | |
| Asus Vivobook Pro 16X K6604JV-MX016W | |
| MSI Summit E16 Flip A12UDT-031 | |
| Moyenne Intel Core i7-13700H (24334 - 78081, n=29) | |
| Dell Inspiron 16 Plus 7630 | |
| HP Envy 16 h0112nr | |
| Dell Inspiron 16 Plus 7620 | |
| AIDA64 / Memory Read | |
| Asus Vivobook Pro 16X K6604JV-MX016W | |
| Lenovo Slim Pro 9i 16IRP8 | |
| Dell Inspiron 16 Plus 7630 | |
| HP Envy 16 h0112nr | |
| MSI Summit E16 Flip A12UDT-031 | |
| Moyenne Intel Core i7-13700H (23681 - 79656, n=29) | |
| Dell Inspiron 16 Plus 7620 | |
| AIDA64 / Memory Write | |
| Lenovo Slim Pro 9i 16IRP8 | |
| Asus Vivobook Pro 16X K6604JV-MX016W | |
| Moyenne Intel Core i7-13700H (22986 - 99898, n=29) | |
| Dell Inspiron 16 Plus 7630 | |
| HP Envy 16 h0112nr | |
| MSI Summit E16 Flip A12UDT-031 | |
| Dell Inspiron 16 Plus 7620 | |
| AIDA64 / Memory Latency | |
| MSI Summit E16 Flip A12UDT-031 | |
| Lenovo Slim Pro 9i 16IRP8 | |
| Dell Inspiron 16 Plus 7620 | |
| Moyenne Intel Core i7-13700H (82.4 - 136.8, n=29) | |
| Dell Inspiron 16 Plus 7630 | |
| HP Envy 16 h0112nr | |
| Asus Vivobook Pro 16X K6604JV-MX016W | |
* ... Moindre est la valeur, meilleures sont les performances
Latence DPC
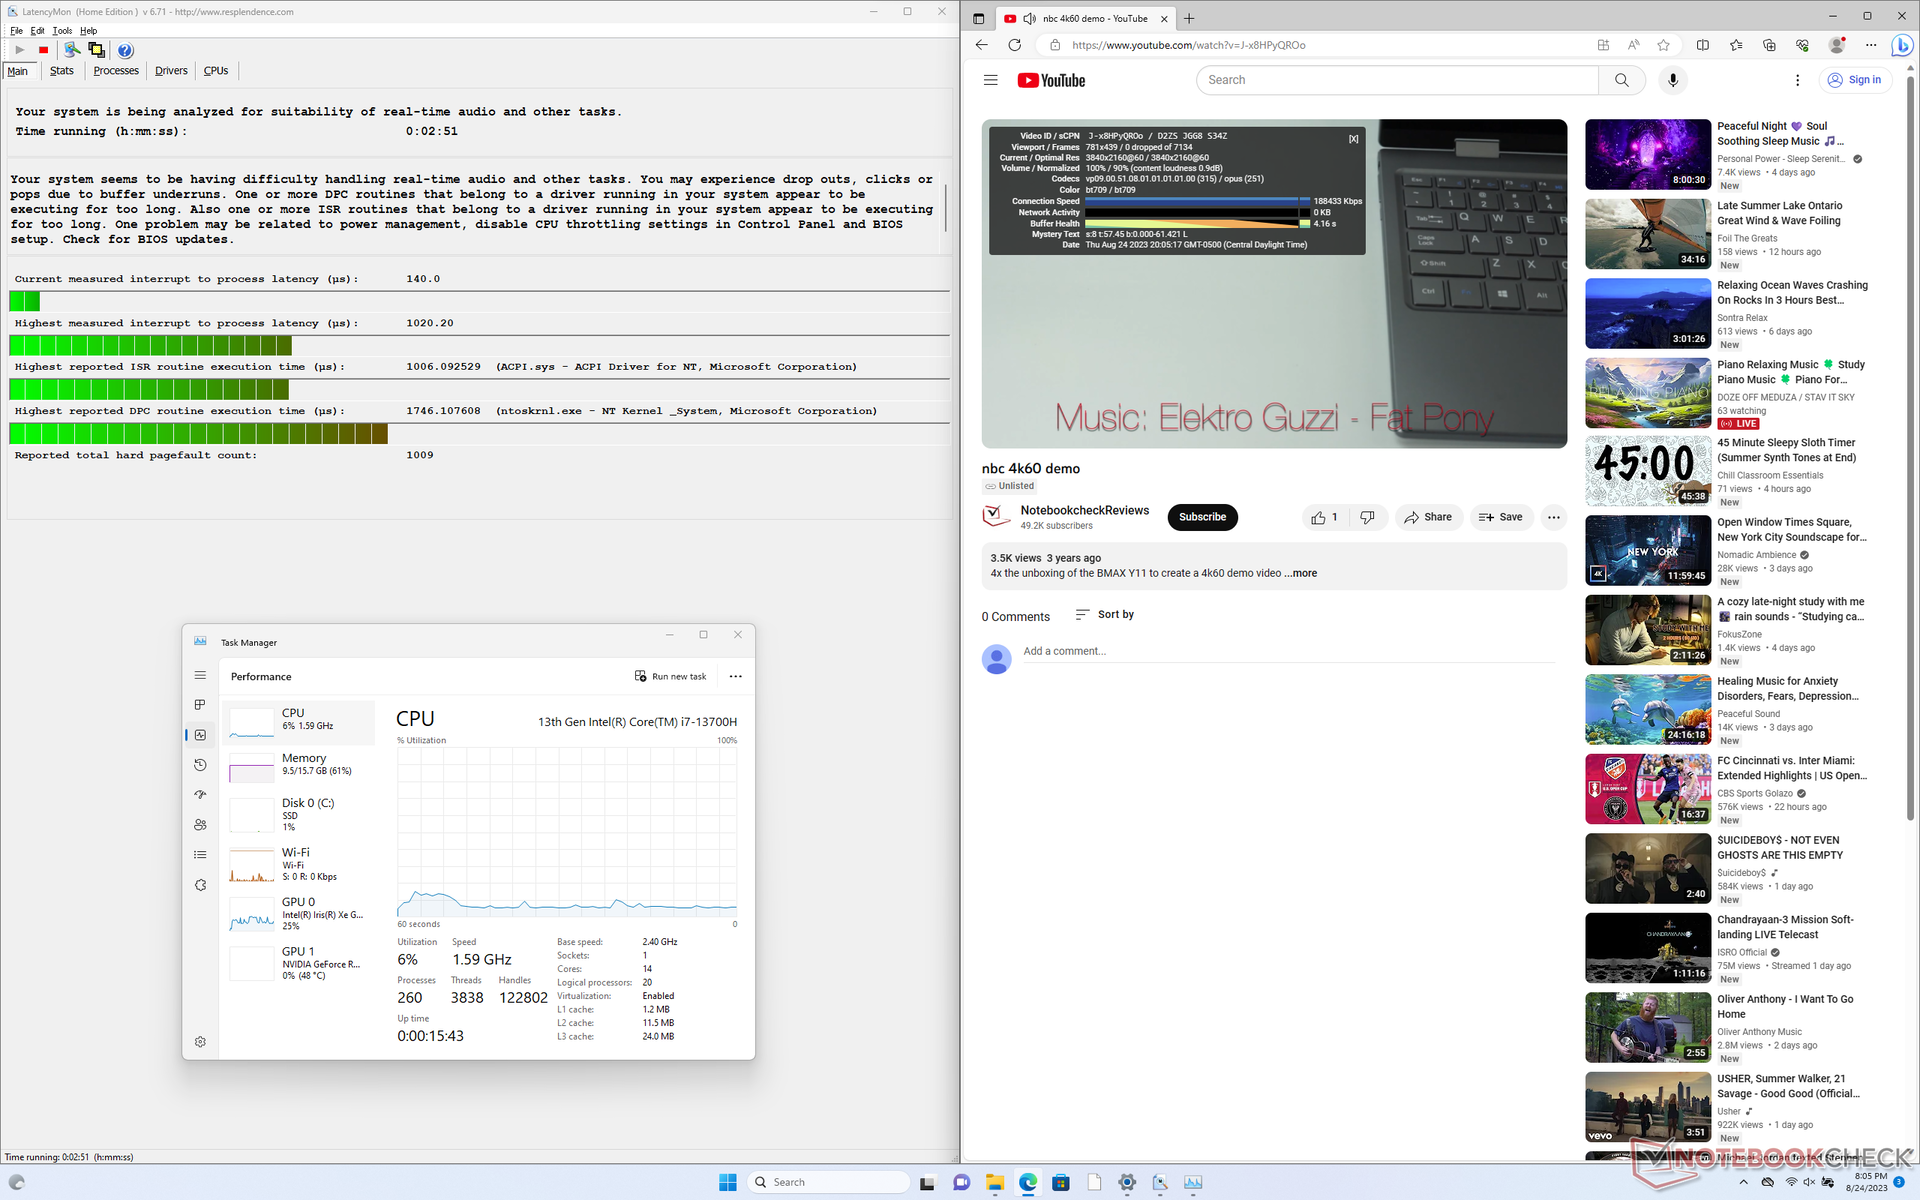
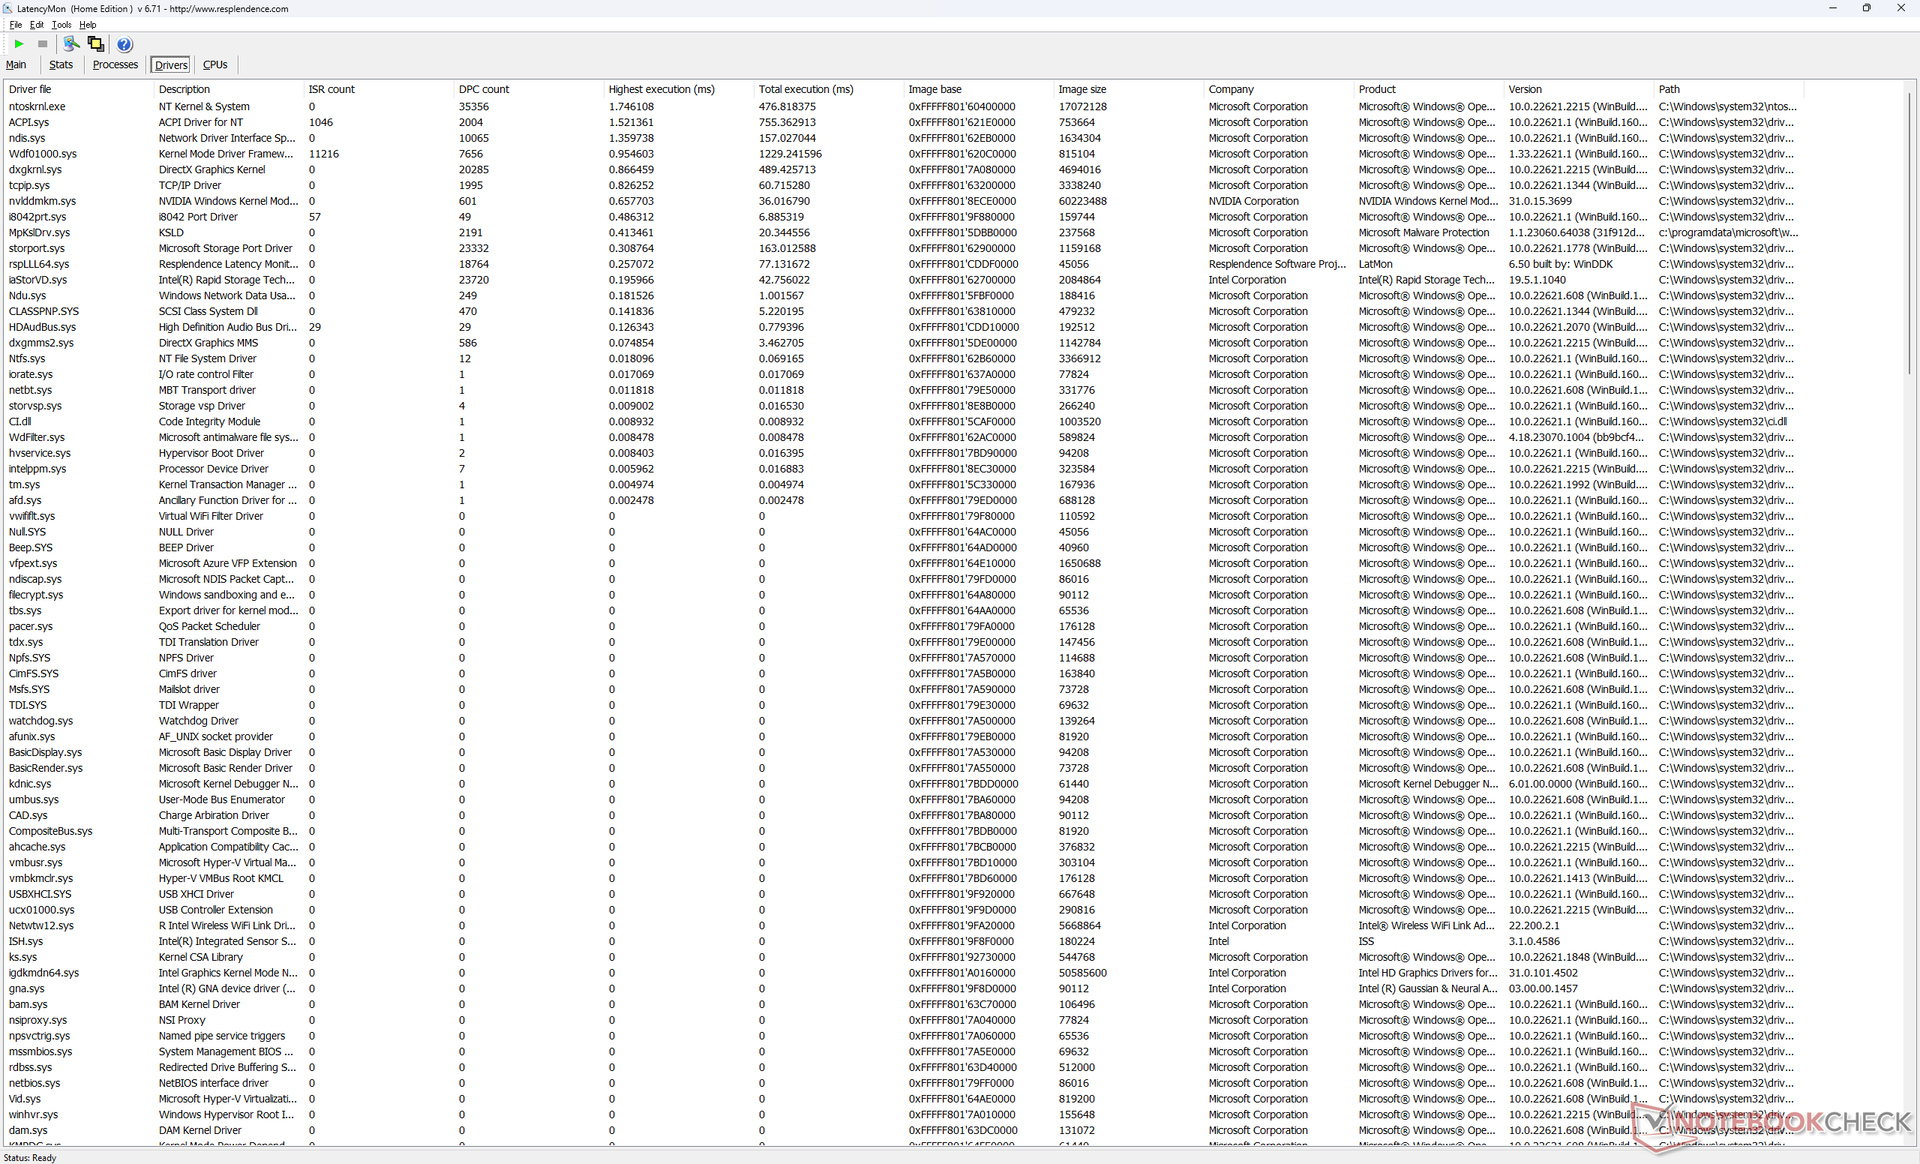
LatencyMon ne montre que des problèmes mineurs de DPC lors de l'ouverture de plusieurs onglets de notre page d'accueil. la lecture vidéo 4K à 60 FPS est parfaite, sans aucune perte d'images, contrairement à l'Alienware m16 R1 récent où les sauts d'images étaient persistants.
| DPC Latencies / LatencyMon - interrupt to process latency (max), Web, Youtube, Prime95 | |
| Asus Vivobook Pro 16X K6604JV-MX016W | |
| Lenovo Slim Pro 9i 16IRP8 | |
| Dell Inspiron 16 Plus 7630 | |
| Dell Inspiron 16 Plus 7620 | |
| MSI Summit E16 Flip A12UDT-031 | |
| HP Envy 16 h0112nr | |
* ... Moindre est la valeur, meilleures sont les performances
Périphériques de stockage - Prise en charge d'un seul SSD
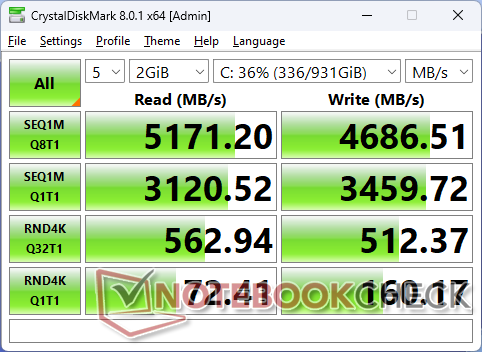
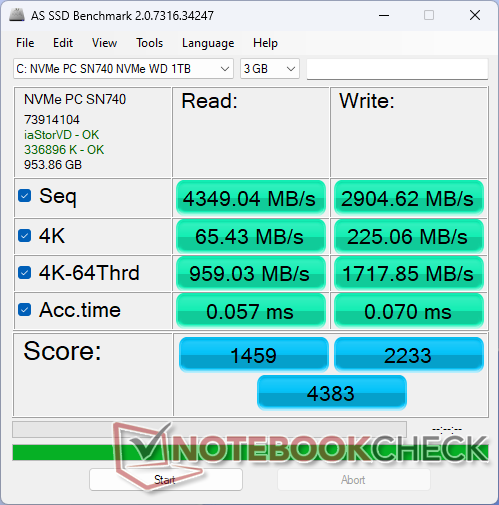
Notre appareil est équipé d'un disque dur de milieu de gamme Western Digital SN740 PCIe4 x4 NVMe SSD de milieu de gamme offrant des taux de transfert allant jusqu'à 5200 Mo/s. Ce maximum n'est viable que pendant environ une minute, cependant, avant qu'il ne finisse par s'étrangler à 2400 Mo/s, comme le montrent les résultats de notre test en boucle DiskSpd ci-dessous. Cette limitation n'est pas un problème pour les performances de jeu et la grande majorité des scénarios d'utilisation.
Le modèle ne prend en charge qu'un seul disque SSD interne, alors que d'autres ordinateurs portables de 16 pouces comme le Envy 16 peuvent prendre en charge jusqu'à deux disques.

| Drive Performance rating - Percent | |
| MSI Summit E16 Flip A12UDT-031 | |
| Lenovo Slim Pro 9i 16IRP8 | |
| HP Envy 16 h0112nr | |
| Dell Inspiron 16 Plus 7630 | |
| Asus Vivobook Pro 16X K6604JV-MX016W | |
| Dell Inspiron 16 Plus 7620 | |
* ... Moindre est la valeur, meilleures sont les performances
Disk Throttling: DiskSpd Read Loop, Queue Depth 8
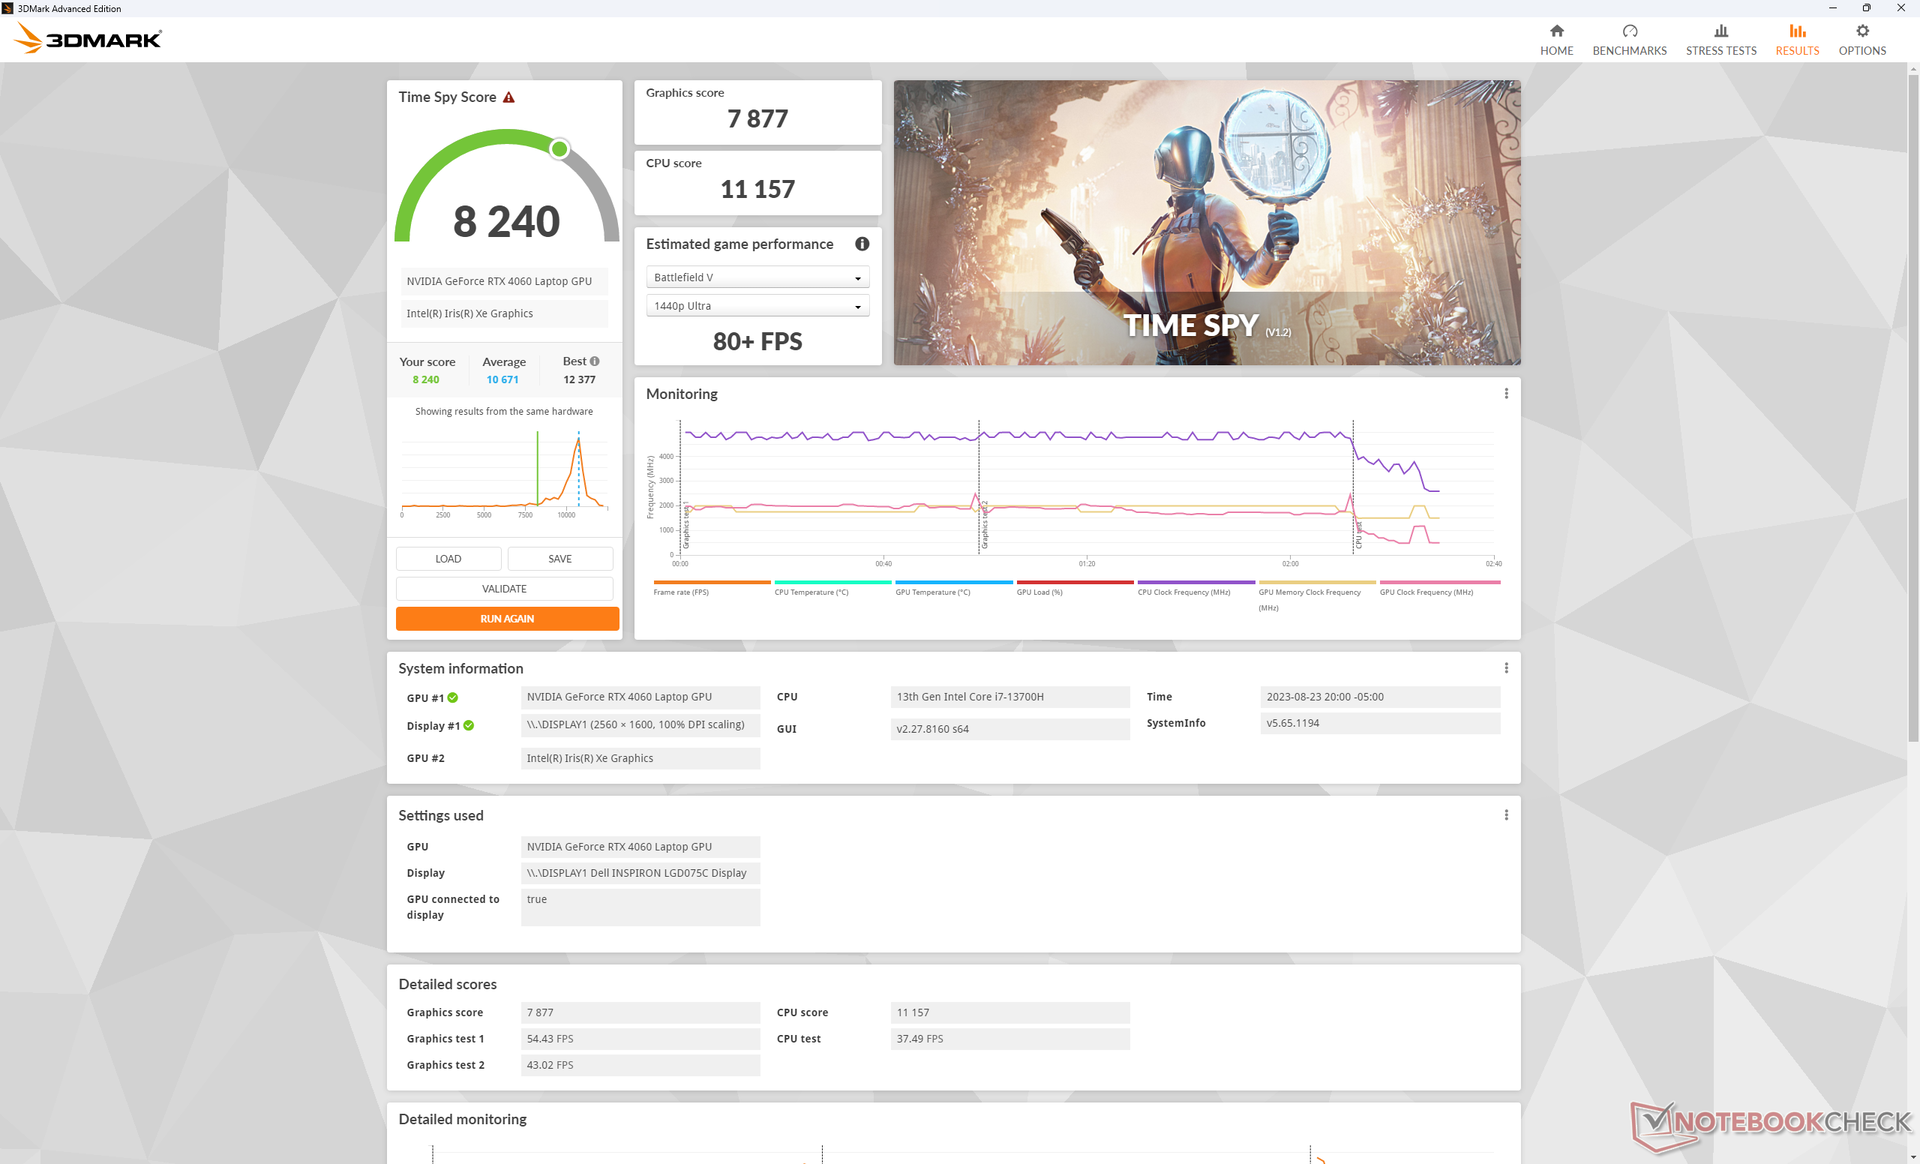
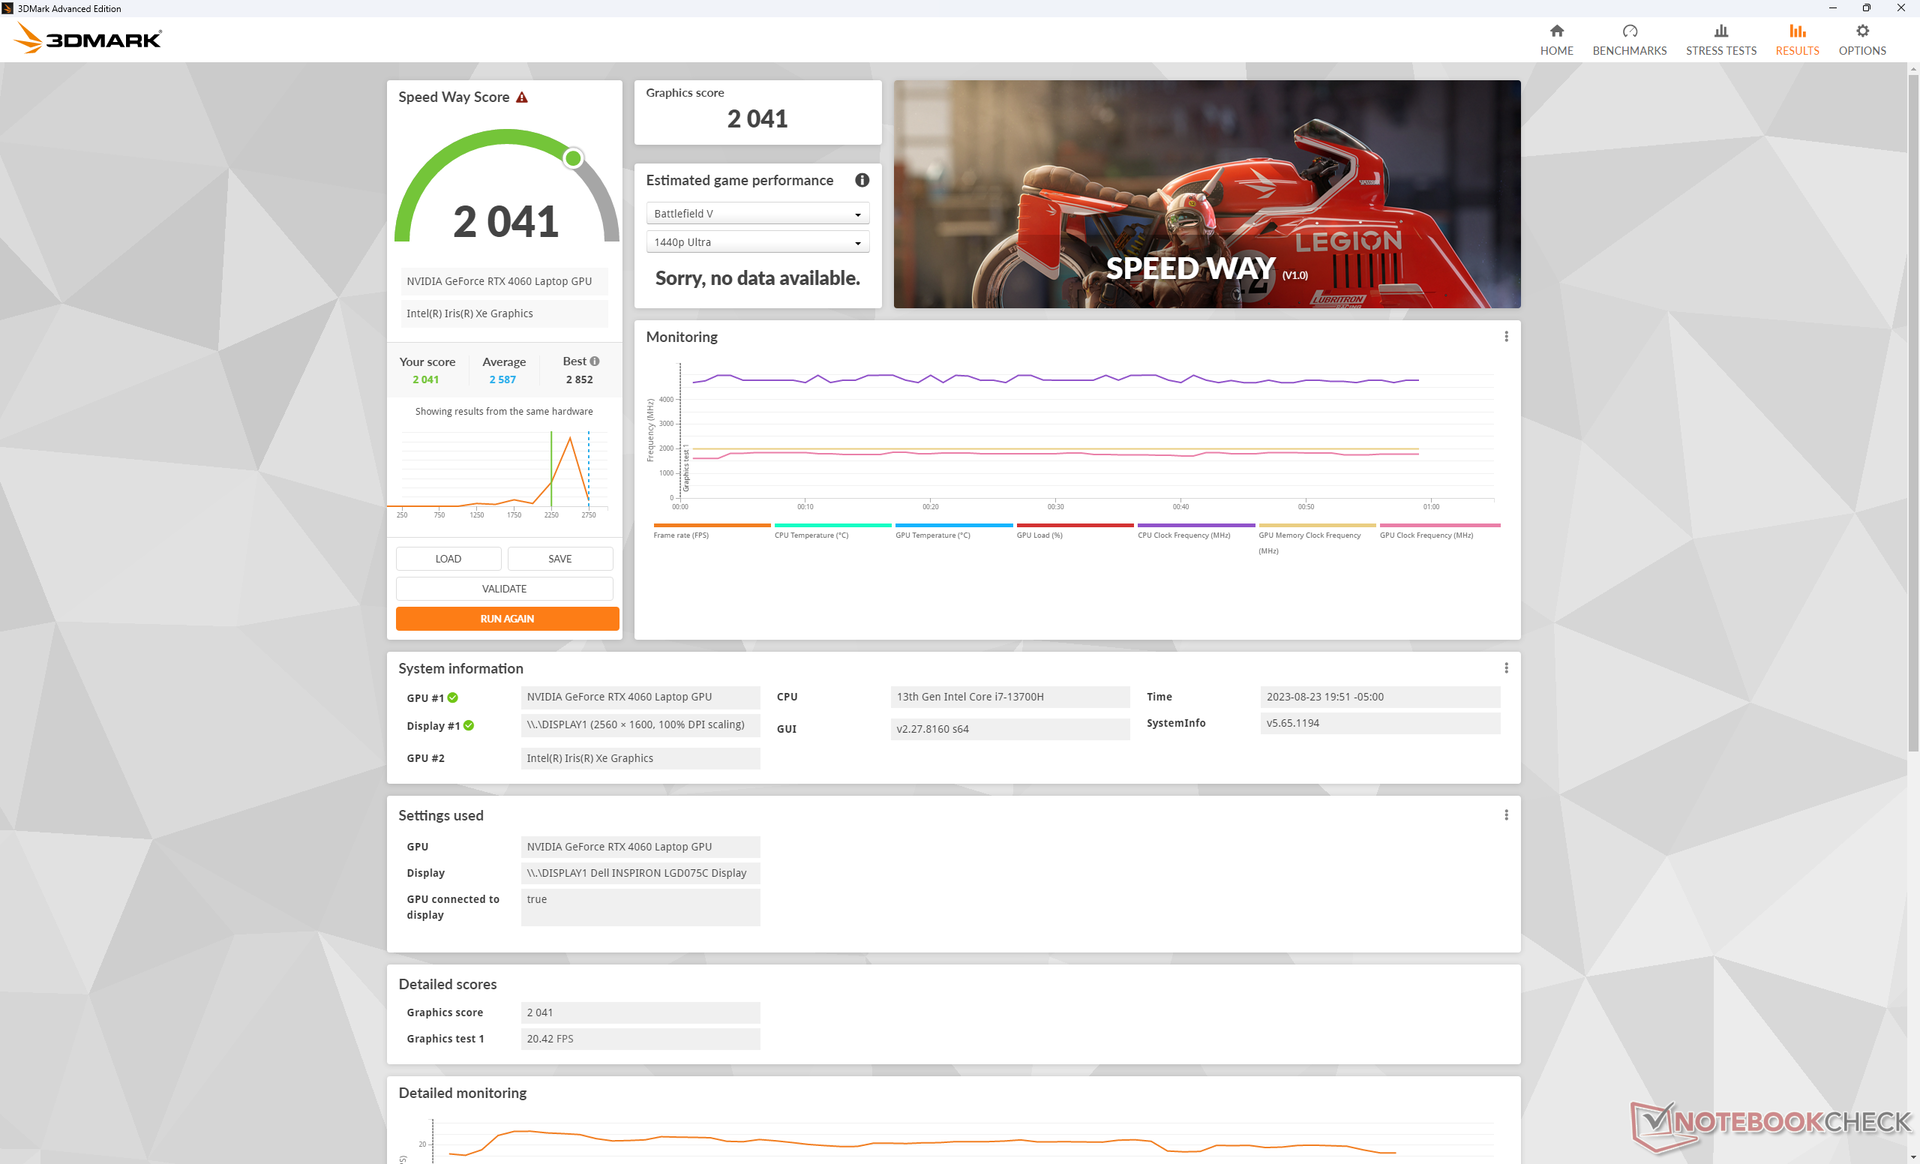
Performance du GPU
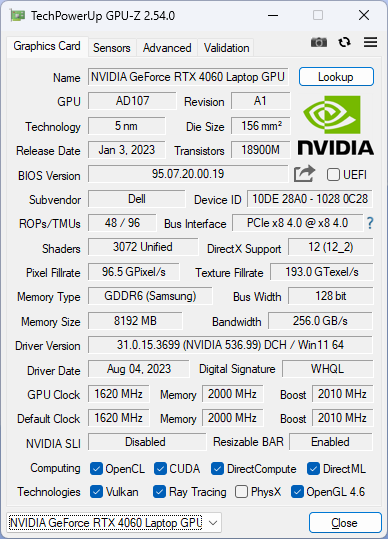
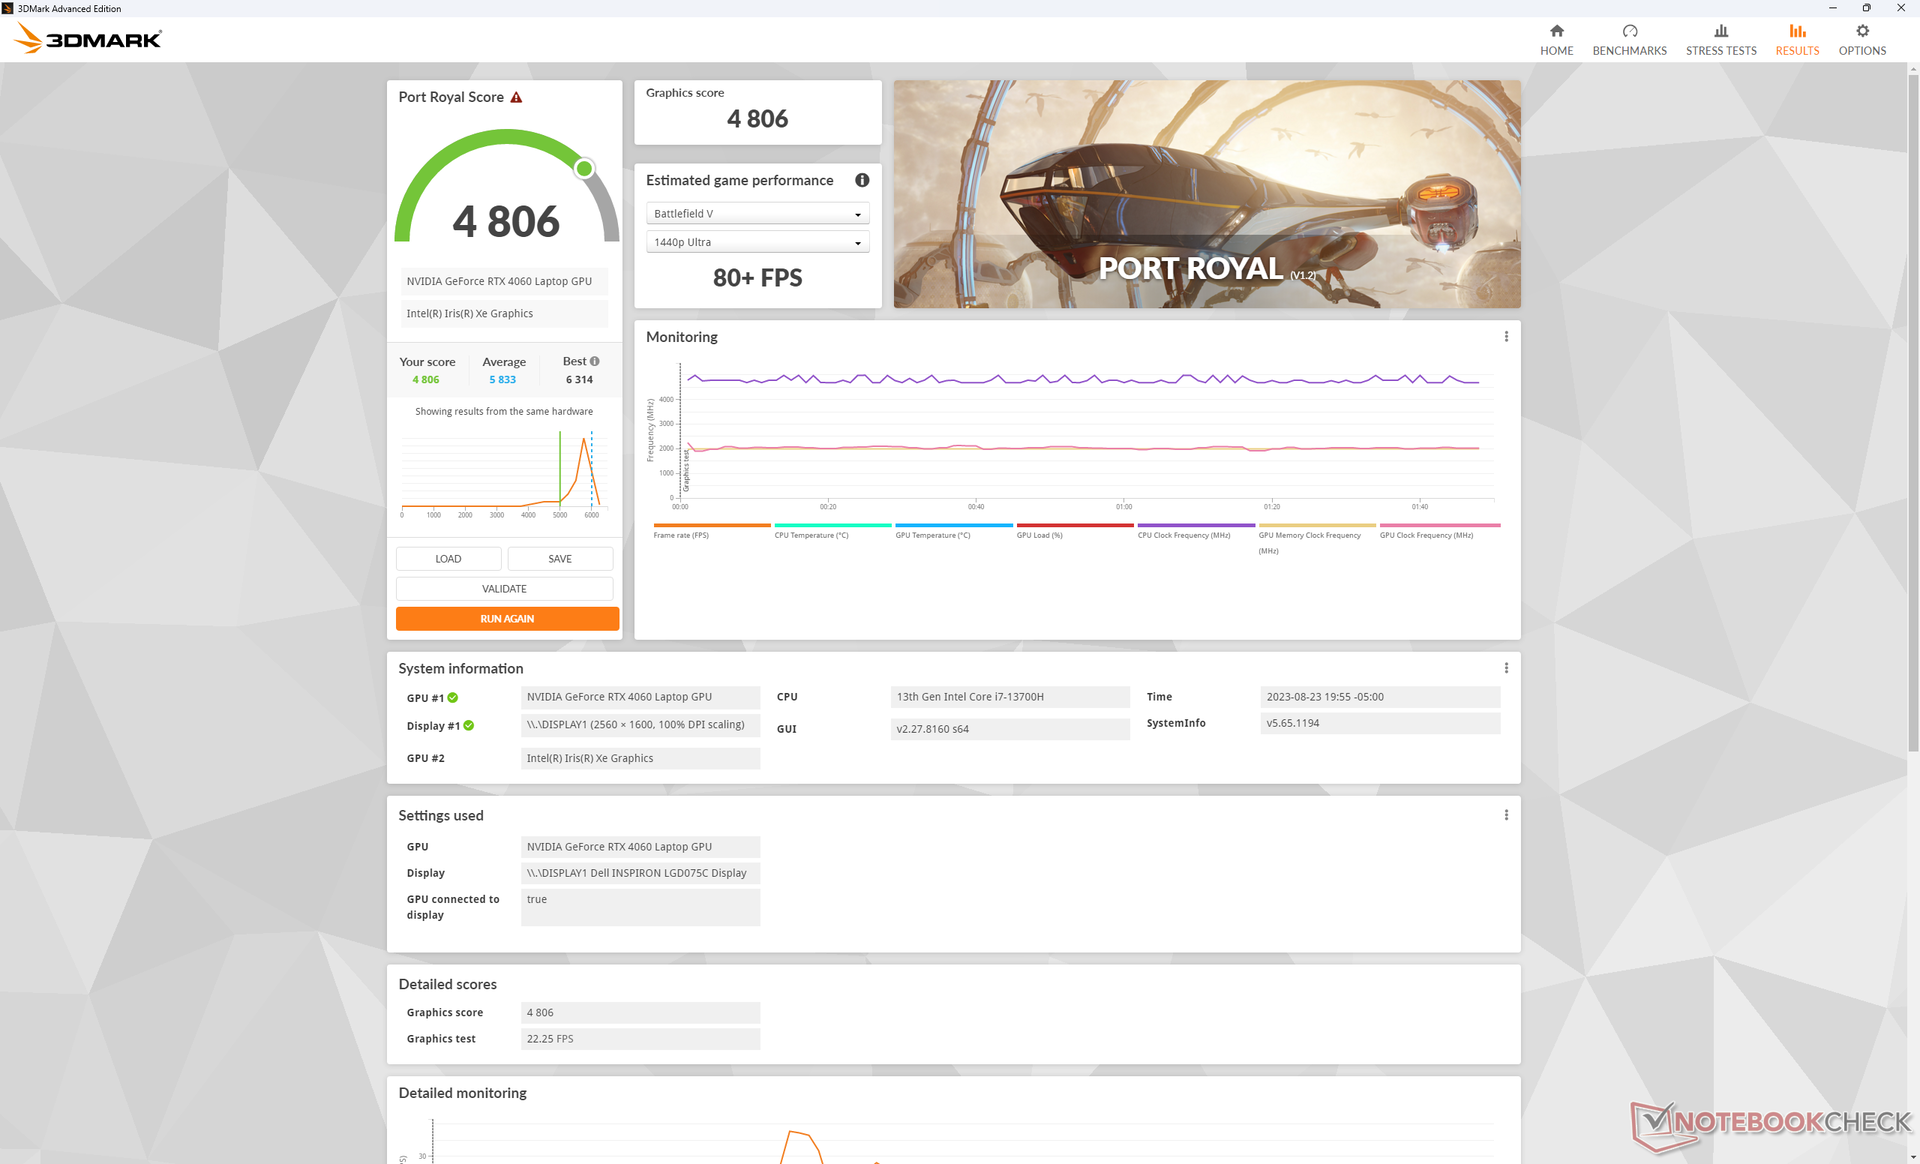
La GeForce RTX 4060 de notre Dell est environ 10 à 15 % plus lente que la moyenne des ordinateurs portables de notre base de données équipés de le même GPU. Le delta est probablement dû à la cible TGP relativement basse de 60 W de l'Inspiron 16 Plus 7630 puisque la plupart des ordinateurs portables avec la RTX 4060 ont tendance à être des ordinateurs portables dédiés au jeu optimisés pour des gammes de puissance de GPU plus élevées de 90 W ou plus. Les performances globales sont donc plus comparables à celles de la GeForce RTX 4050 dans le Lenovo Slim Pro 9i 16, ce qui est un peu décevant. Néanmoins, l'amélioration des performances d'une génération à l'autre par rapport à la RTX 3050 Ti de l'Inspiron 16 Plus 7620 de l'année dernière est toujours significative, de 40 à 60 %.
Les utilisateurs peuvent envisager de configurer l'Inspiron 16 Plus 7630 avec la RTX 4050, moins chère, car l'option RTX 4060 n'est pas très performante. Toutes les options de GPU visent le même TGP de 60 W.
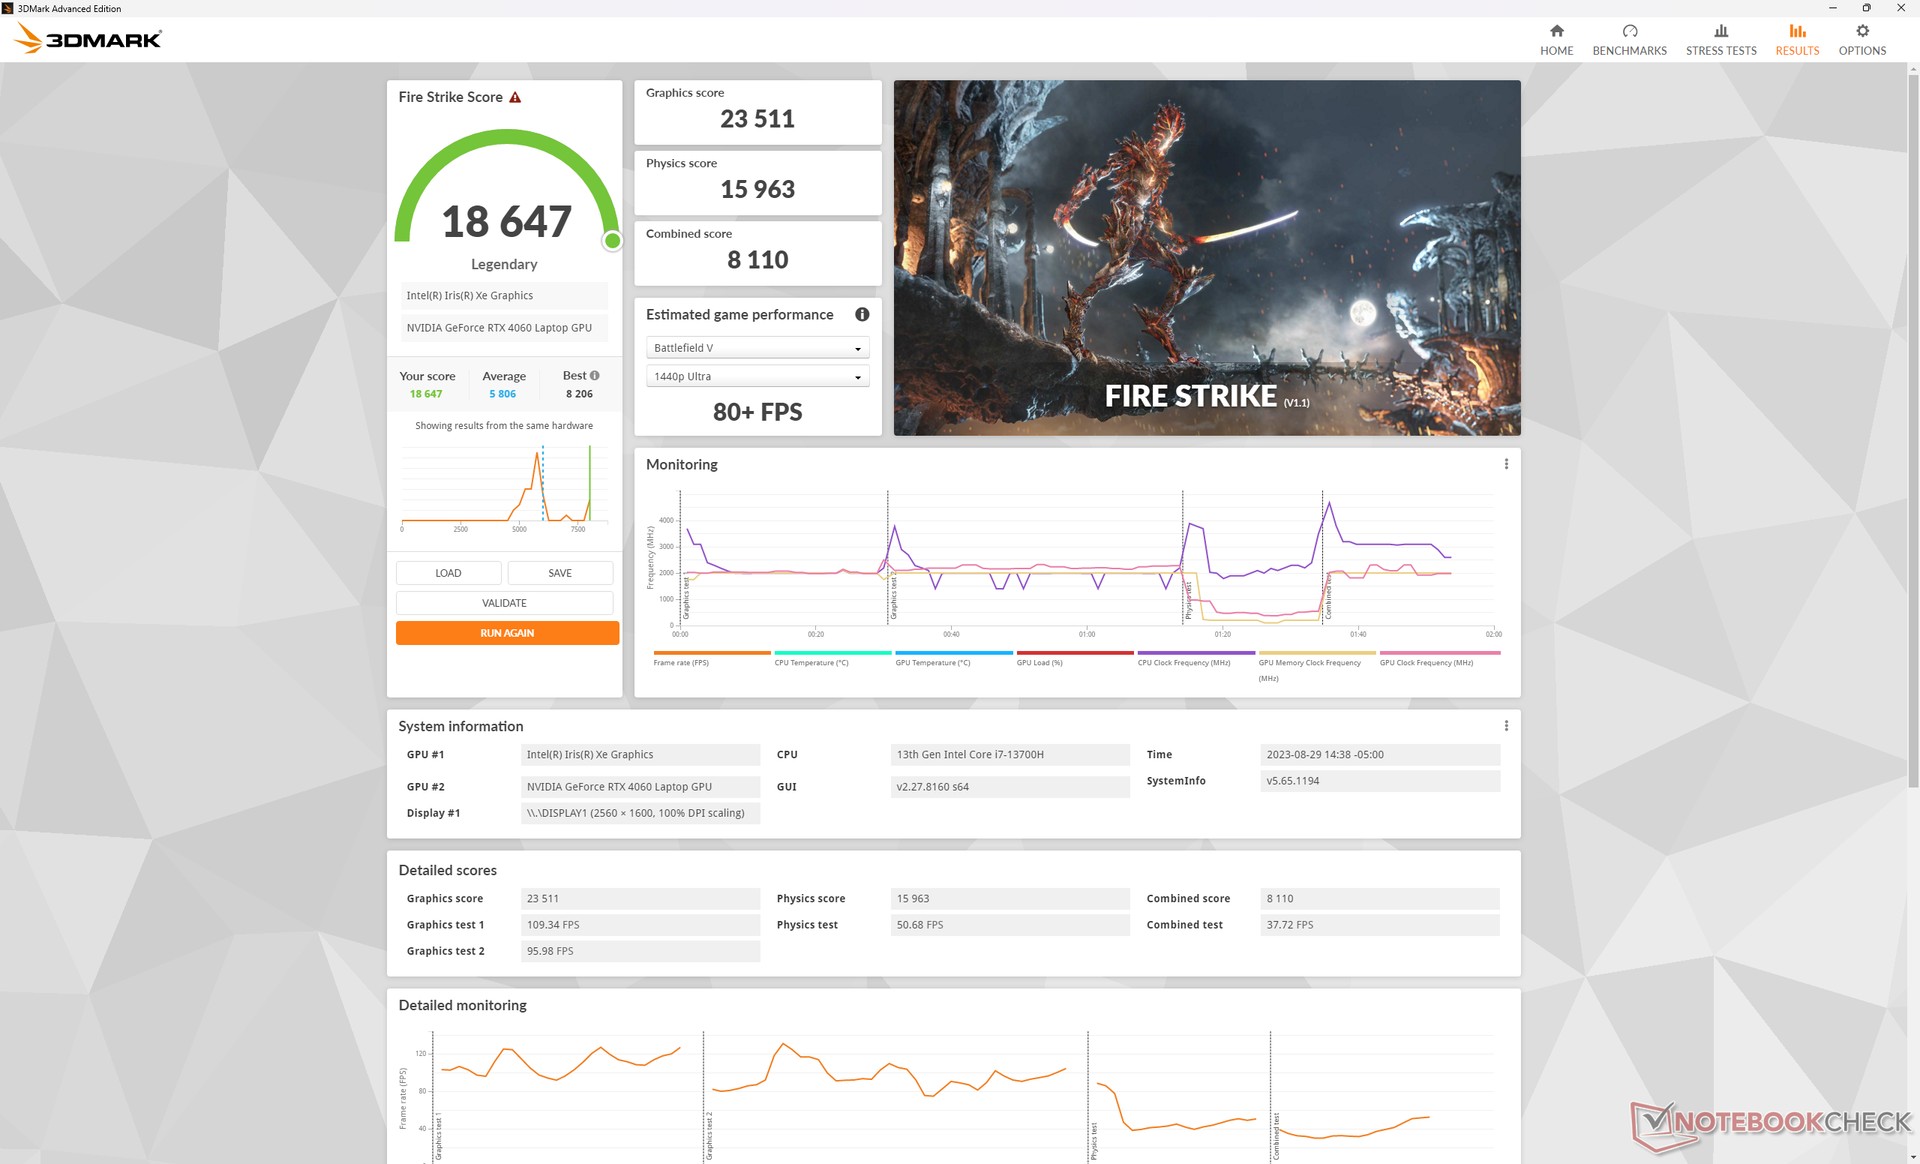
Le passage du mode Performance au mode Equilibré a un impact considérable sur les performances du CPU, tandis que les performances du GPU restent pratiquement inchangées, comme le montrent les résultats de notre site Fire Strike ci-dessous. Assurez-vous d'être en mode Performance si vous exécutez des tâches gourmandes en ressources processeur.
| Profil de puissance | Score graphique | Score physique | Score combiné |
| Puissance de la batterie | 19574 (-9%) | 10010 (-61%) | 4793 (-46%) |
| Mode équilibré | 23511 (-2%) | 15963 (-41%) | 8110 (-21%) |
| Mode Performance | 24008 | 26852 | 10239 |

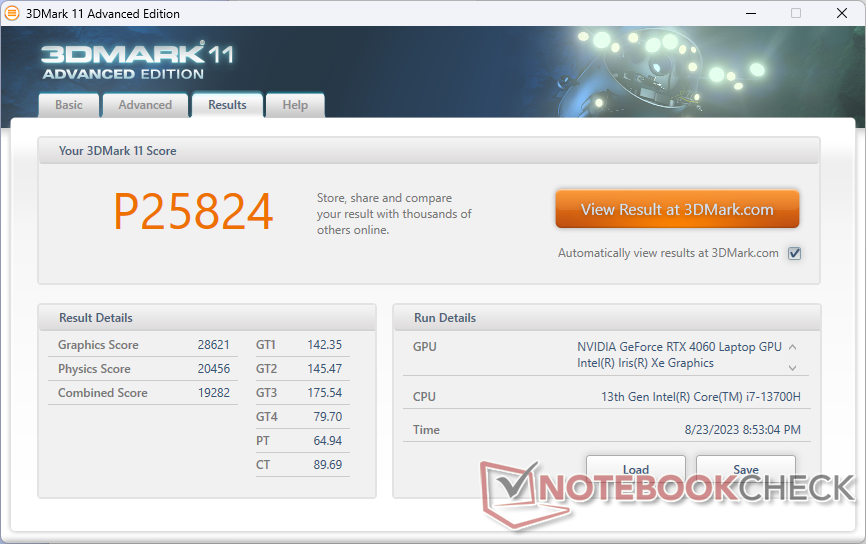
| 3DMark 11 Performance | 25824 points | |
| 3DMark Fire Strike Score | 19289 points | |
| 3DMark Time Spy Score | 8240 points | |
Aide | ||
* ... Moindre est la valeur, meilleures sont les performances
Performance des jeux
Comme prévu par les résultats 3DMark ci-dessus, les performances de jeu globales sont légèrement inférieures à la moyenne pour un ordinateur portable avec des cartes graphiques RTX 4060. Tiny Tina's Wonderlands, par exemple, tourne à 48 FPS avec les paramètres maximums de 1440p contre 57 FPS sur la plupart des autres portables RTX 4060. Le G-Sync n'est malheureusement pas pris en charge sur la série Inspiron 7630, ce qui aurait permis d'atténuer le frame tearing.
Witcher 3 FPS Chart
| Bas | Moyen | Élevé | Ultra | QHD | |
|---|---|---|---|---|---|
| The Witcher 3 (2015) | 409.3 | 275.3 | 169.5 | 90.9 | 68 |
| Dota 2 Reborn (2015) | 184.7 | 166.6 | 157.9 | 146.1 | |
| Final Fantasy XV Benchmark (2018) | 172.2 | 122.2 | 88.9 | 64.4 | |
| X-Plane 11.11 (2018) | 153.5 | 135.7 | 109.7 | ||
| Far Cry 5 (2018) | 133 | 120 | 115 | 103 | 83 |
| Strange Brigade (2018) | 378 | 234 | 185.9 | 161 | 110.9 |
| Cyberpunk 2077 1.6 (2022) | 108.1 | 84.2 | 72.9 | 65.7 | 40.8 |
| Tiny Tina's Wonderlands (2022) | 169.5 | 141.5 | 92.1 | 71.4 | 48 |
| F1 22 (2022) | 205 | 201 | 148.4 | 53.8 | 34.1 |
| Returnal (2023) | 71 | 68 | 63 | 57 | 39 |
Émissions
Bruit du système - Plus silencieux et plus fort qu'avant
Les ventilateurs internes peuvent être silencieux lorsqu'ils tournent au ralenti sur le bureau, mais ils tournent le plus souvent autour de 26 à 28 dB(A) lors de l'exécution de charges courantes comme les navigateurs Web ou les flux vidéo. Plus impressionnant encore, ils peuvent rester relativement silencieux pendant un bon moment même lorsque des charges plus élevées sont introduites alors que les ventilateurs de l'Inspiron 16 Plus 7620 s'activeraient plus rapidement et plus facilement. Lors de l'exécution de 3DMark 06, par exemple, le bruit du ventilateur n'atteignait 35 dB(A) que vers la fin de la première scène de référence de 90 secondes.
Le bruit du ventilateur augmente de manière significative lors de l'exécution de jeux. Si l'Inspiron 16 Plus 7630 est généralement plus silencieux que le modèle de l'année dernière lors de l'exécution de charges peu exigeantes, c'est l'inverse qui se produit lors de l'exécution de jeux. Le bruit du ventilateur atteint presque 53 dB(A) sur le site Witcher 3, contre un peu plus de 49 dB(A) sur l'Inspiron 16 Plus 7620. Néanmoins, la plage de 50 dB(A) est comparable à celle de concurrents tels que leSlim Pro 9i 16 ou l'Envy 16.
Il est intéressant de noter que le changement de profil d'alimentation entre le mode équilibré et le mode performance n'a pas d'impact sur le bruit du ventilateur lors des jeux, puisqu'il atteint toujours 52,5 dB(A) sur l'un ou l'autre réglage.
Degré de la nuisance sonore
| Au repos |
| 23.2 / 23.2 / 23.2 dB(A) |
| Fortement sollicité |
| 35.1 / 52.5 dB(A) |
 | ||
30 dB silencieux 40 dB(A) audible 50 dB(A) bruyant |
||
min: | ||
| Dell Inspiron 16 Plus 7630 GeForce RTX 4060 Laptop GPU, i7-13700H, WD PC SN740 SDDPTQD-1T00 | Dell Inspiron 16 Plus 7620 GeForce RTX 3050 Ti Laptop GPU, i7-12700H, Kioxia BG5 KBG50ZNS512G | Lenovo Slim Pro 9i 16IRP8 GeForce RTX 4050 Laptop GPU, i9-13905H, Samsung PM9A1 MZVL21T0HCLR | Asus Vivobook Pro 16X K6604JV-MX016W GeForce RTX 4060 Laptop GPU, i9-13980HX, Solidigm P41 Plus SSDPFKNU010TZ | HP Envy 16 h0112nr GeForce RTX 3060 Laptop GPU, i7-12700H, Micron 3400 1TB MTFDKBA1T0TFH | MSI Summit E16 Flip A12UDT-031 GeForce RTX 3050 Ti Laptop GPU, i7-1280P, Samsung PM9A1 MZVL22T0HBLB | |
|---|---|---|---|---|---|---|
| Noise | -11% | 1% | -21% | -6% | -14% | |
| arrêt / environnement * (dB) | 23.2 | 23.3 -0% | 22.7 2% | 25.2 -9% | 22.8 2% | 25 -8% |
| Idle Minimum * (dB) | 23.2 | 25.7 -11% | 22.7 2% | 26.6 -15% | 22.9 1% | 25 -8% |
| Idle Average * (dB) | 23.2 | 26.1 -13% | 22.7 2% | 26.6 -15% | 22.9 1% | 25 -8% |
| Idle Maximum * (dB) | 23.2 | 30.6 -32% | 27.5 -19% | 29.2 -26% | 30.5 -31% | 28.9 -25% |
| Load Average * (dB) | 35.1 | 46.2 -32% | 28.9 18% | 53.4 -52% | 41.4 -18% | 49.3 -40% |
| Witcher 3 ultra * (dB) | 52.5 | 49.2 6% | 52.6 -0% | 51.1 3% | ||
| Load Maximum * (dB) | 52.5 | 49.4 6% | 52.5 -0% | 56.9 -8% | 51.4 2% | 48.2 8% |
* ... Moindre est la valeur, meilleures sont les performances
Température
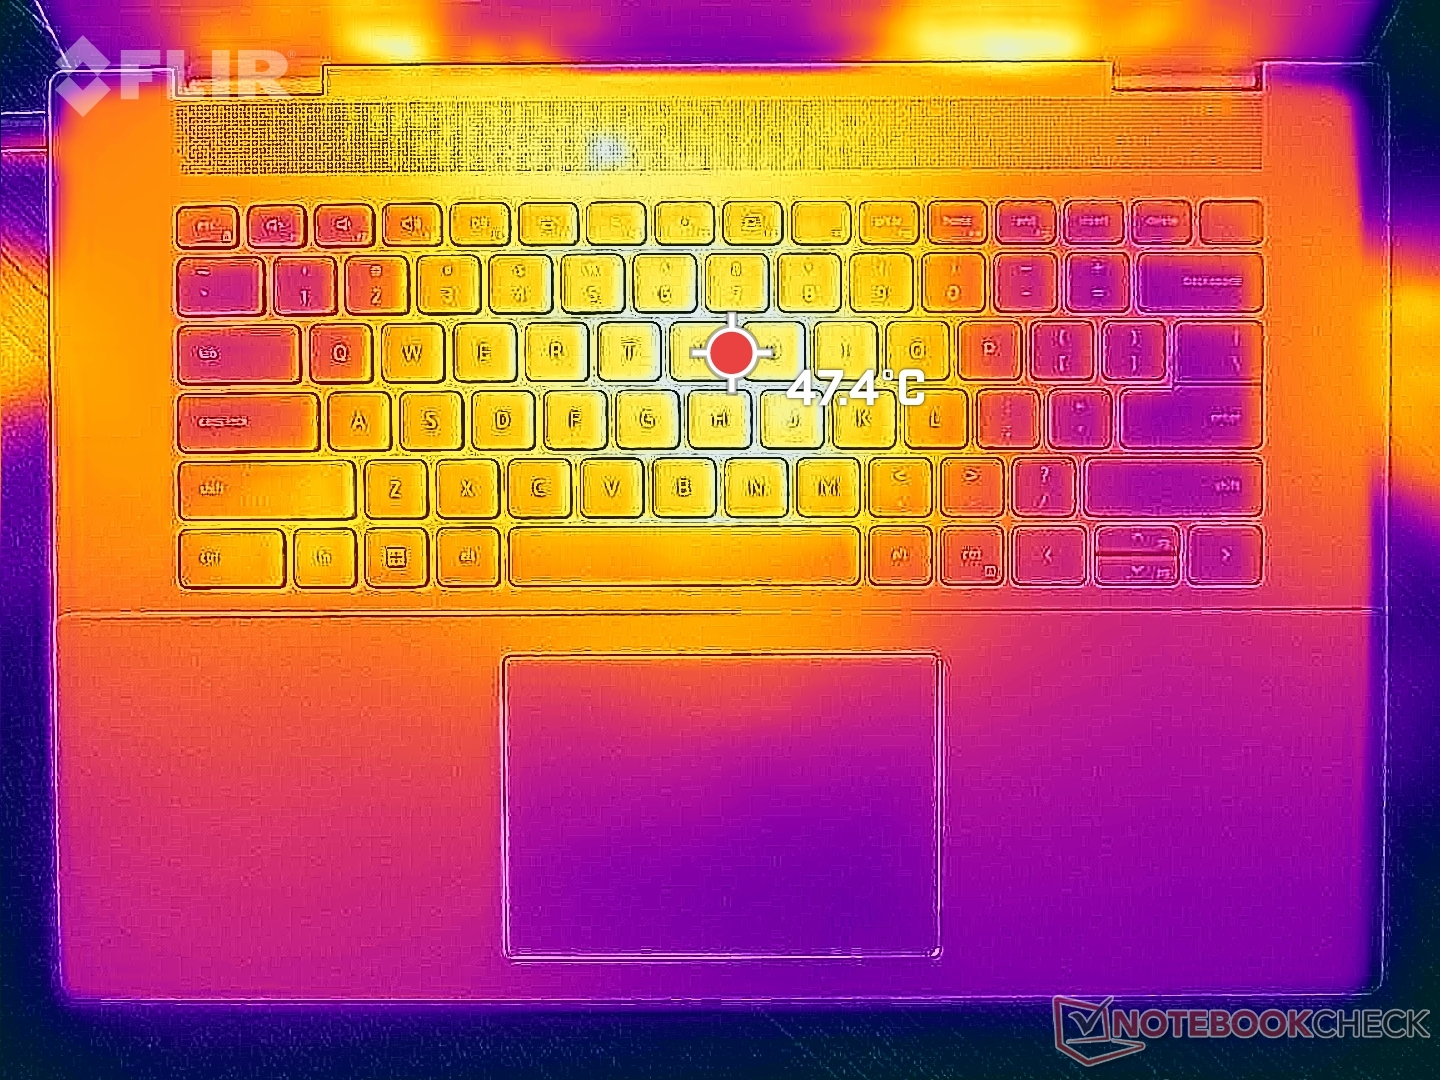
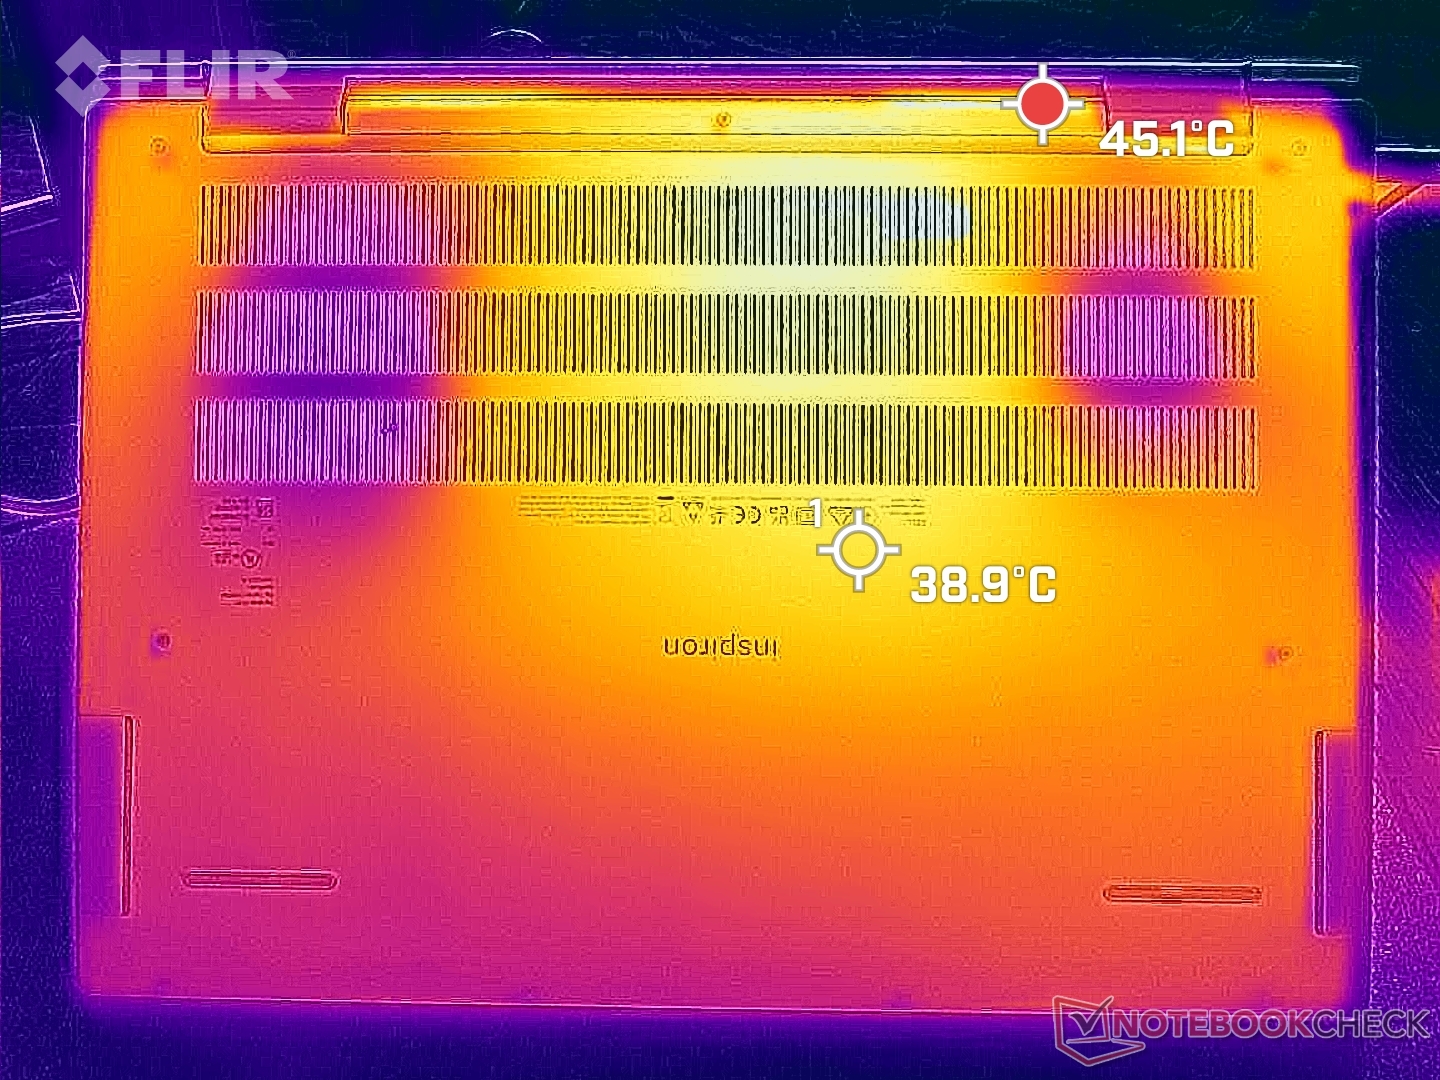
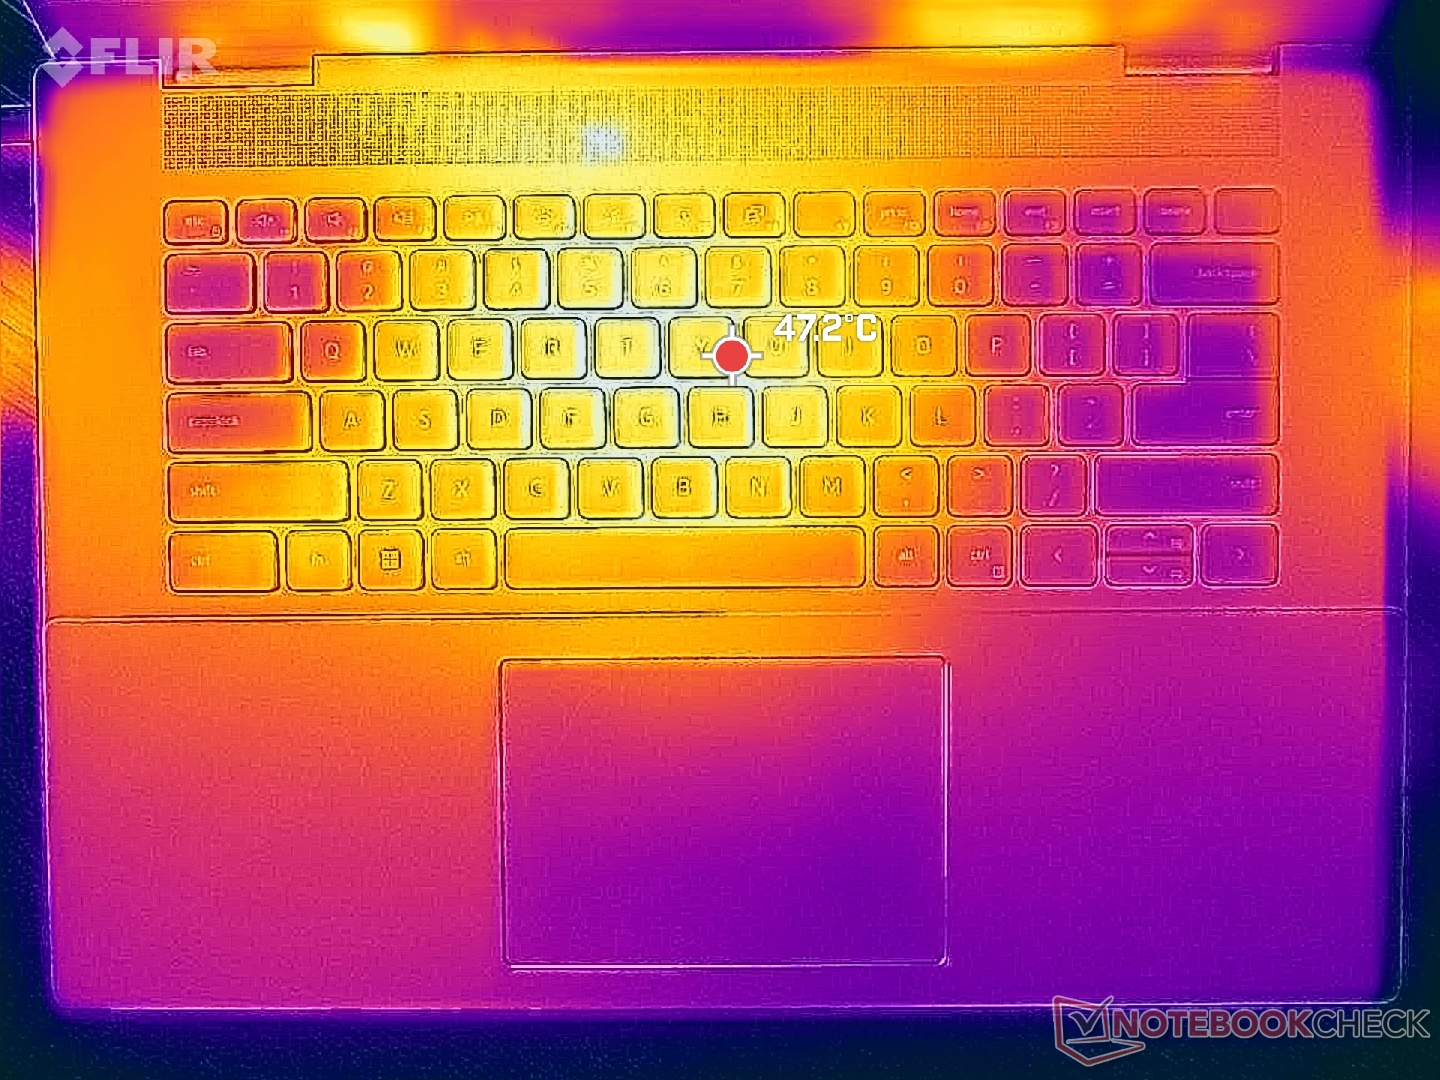
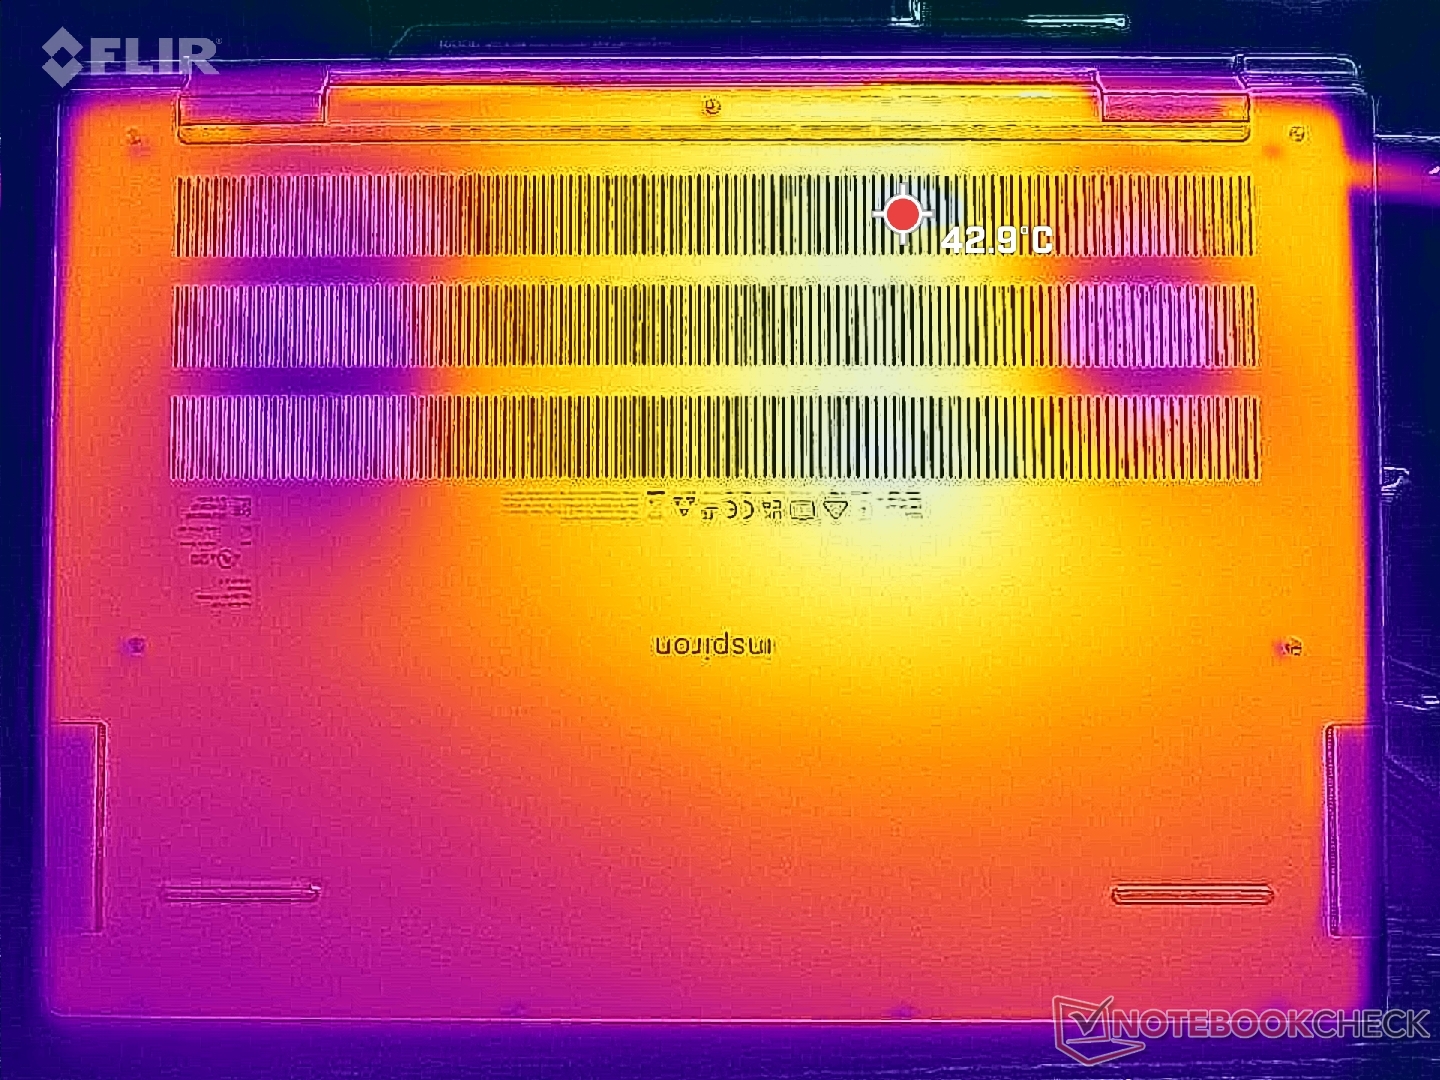
Les températures de surface lors de l'exécution de charges exigeantes comme les jeux sont plus chaudes que prévu. Les points chauds en haut et en bas peuvent atteindre respectivement 48°C et 43°C près du centre du clavier. Les repose-poignets peuvent également être très chauds, jusqu'à 37°C, contre 31°C sur l'Asus Vivobook Pro 16X.Asus Vivobook Pro 16X ou le HP Envy 16. C'est certainement plus chaud pour les mains que pour d'autres ordinateurs portables.
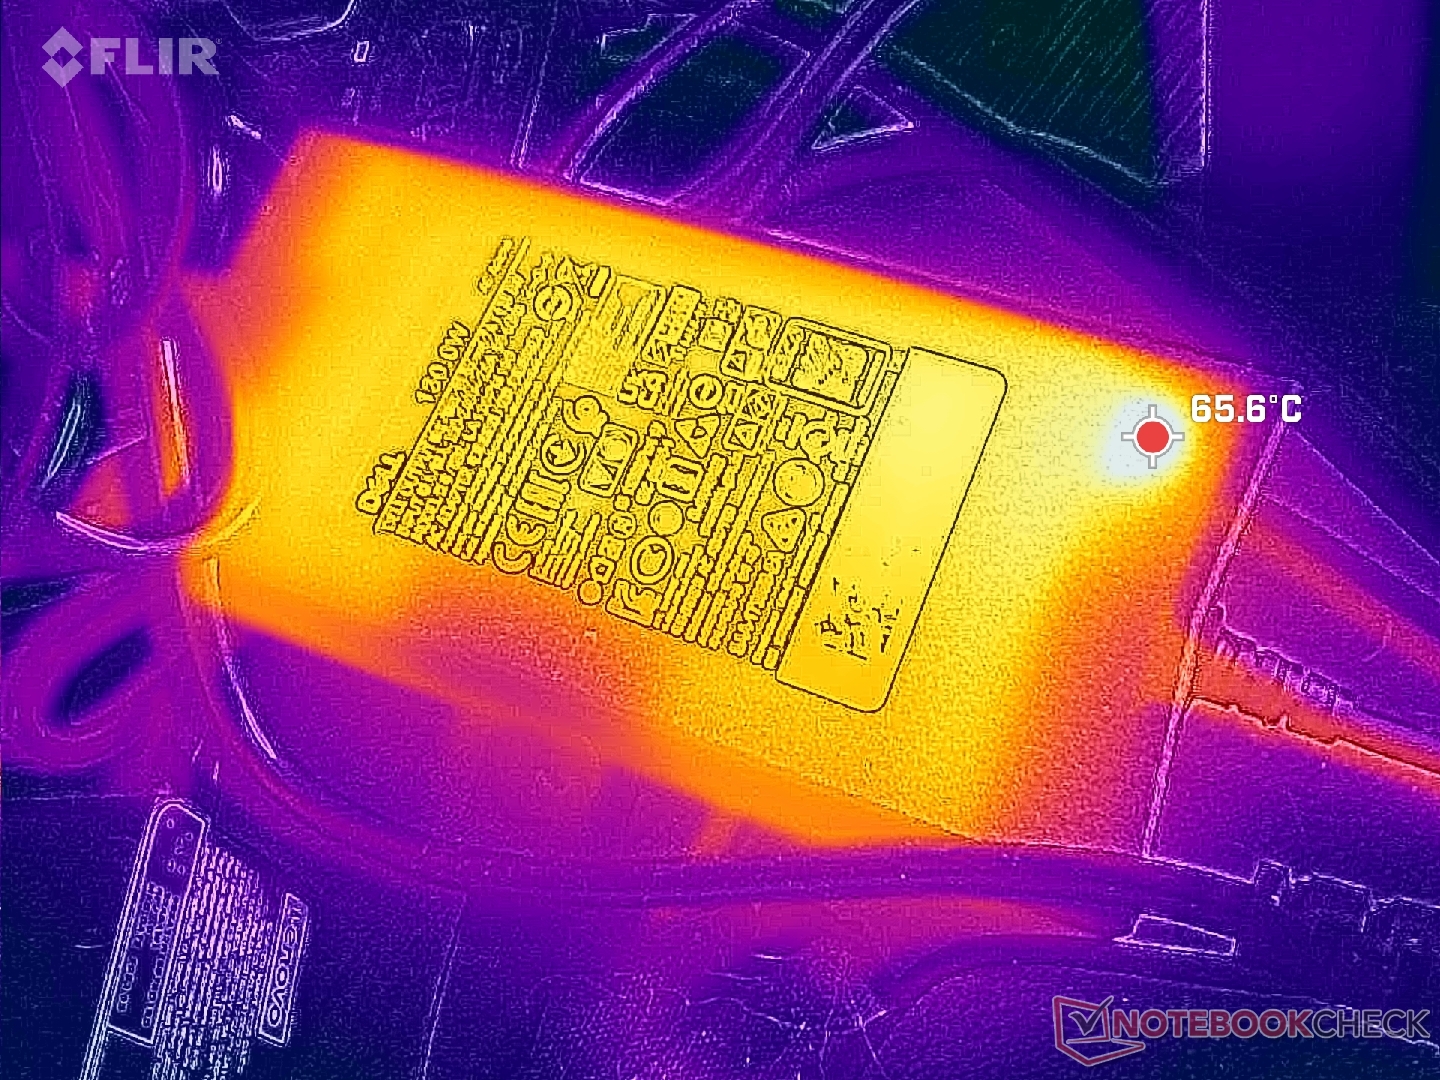
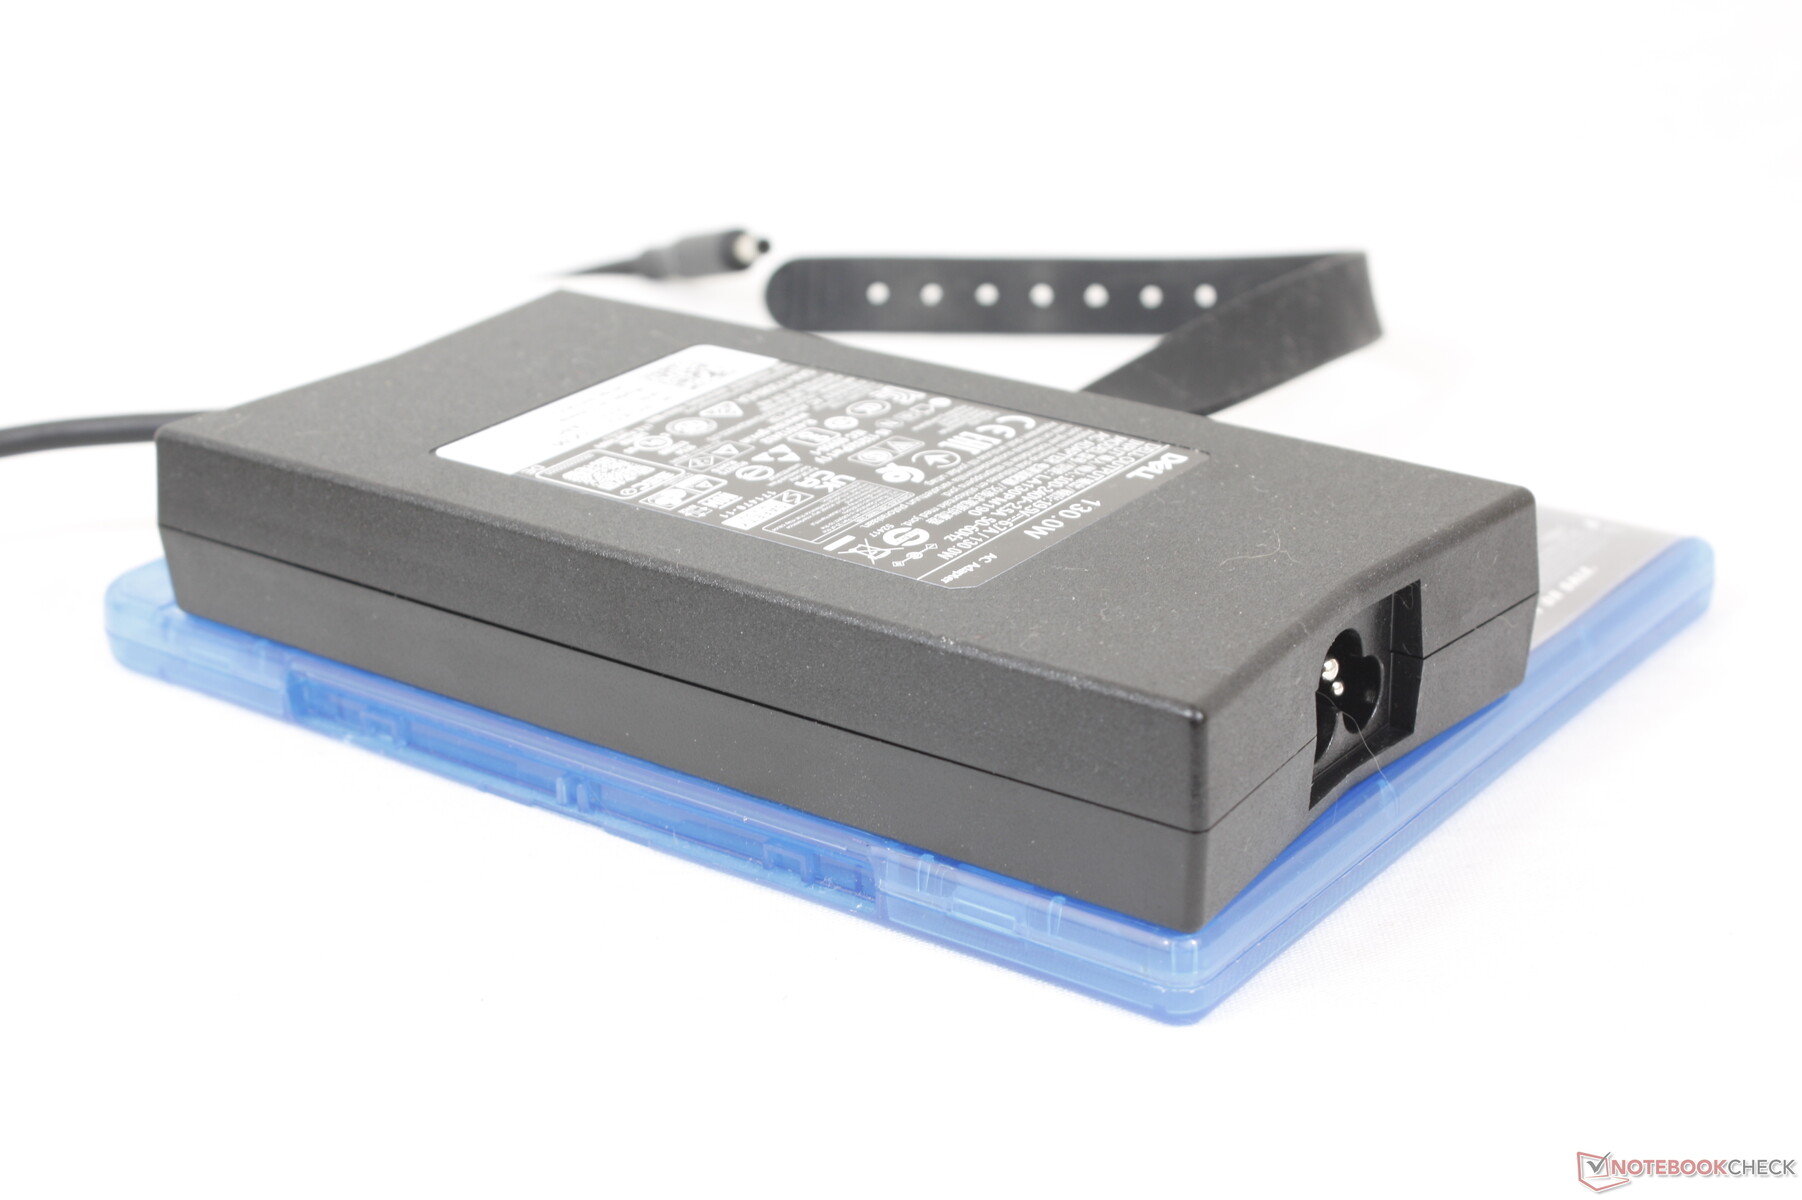
En outre, l'adaptateur secteur est nettement plus chaud que la moyenne, à plus de 65 °C. Vous devrez prévoir un espace suffisant pour l'adaptateur secteur, au cas où.
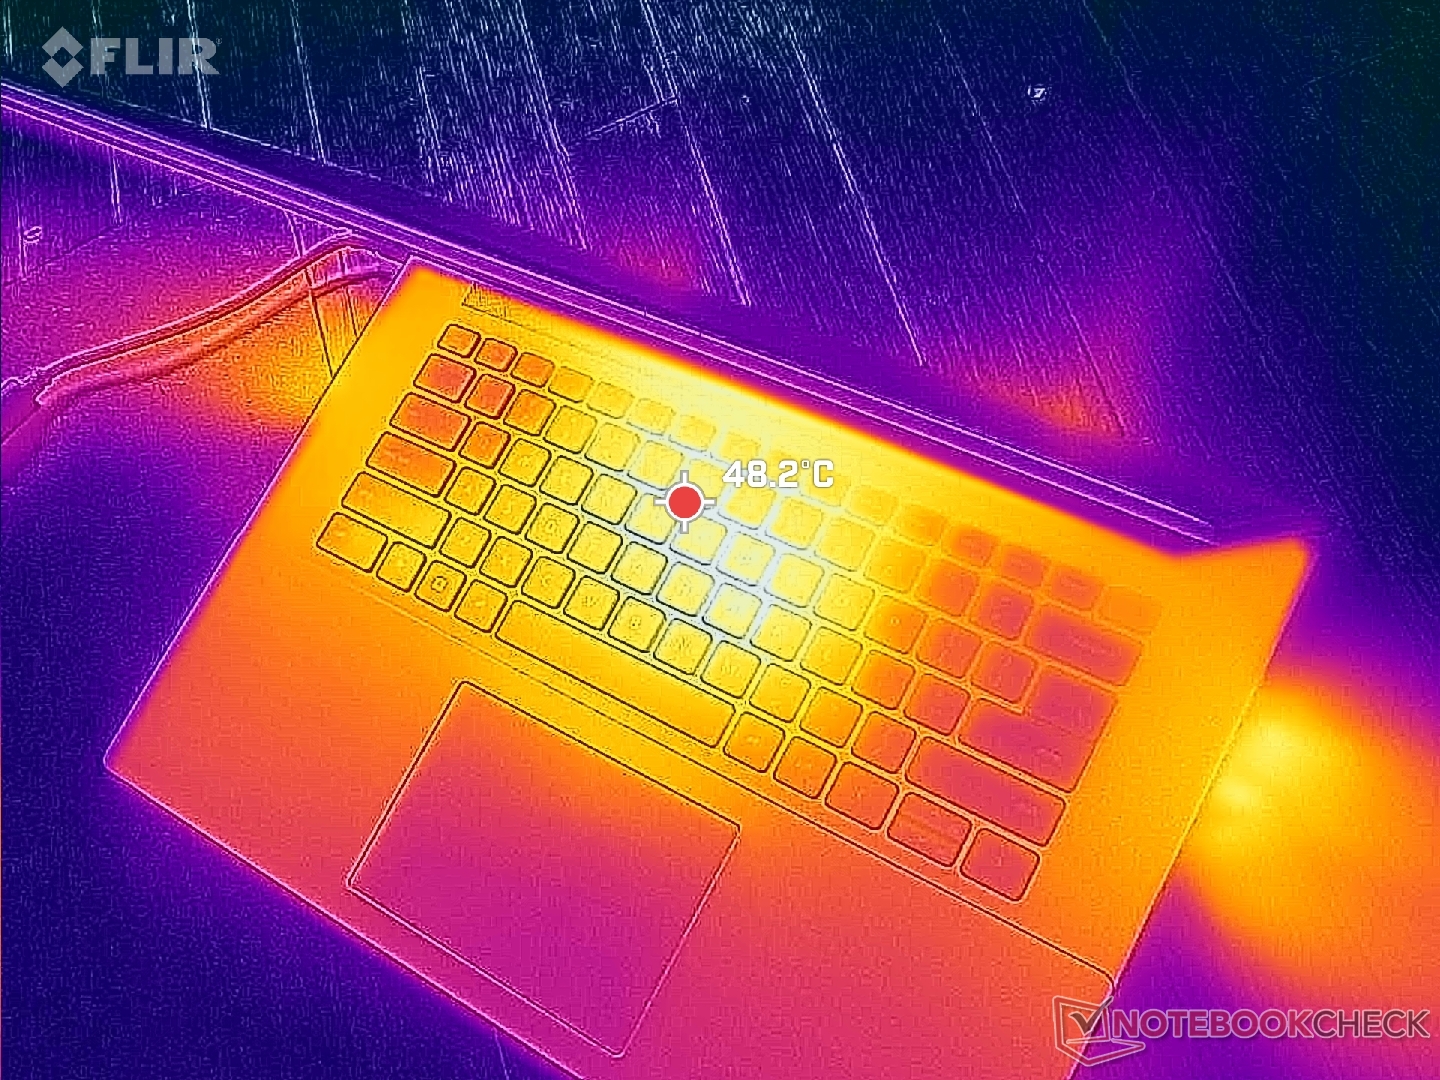
(-) La température maximale du côté supérieur est de 47.8 °C / 118 F, par rapport à la moyenne de 36.8 °C / 98 F, allant de 21 à 71 °C pour la classe Multimedia.
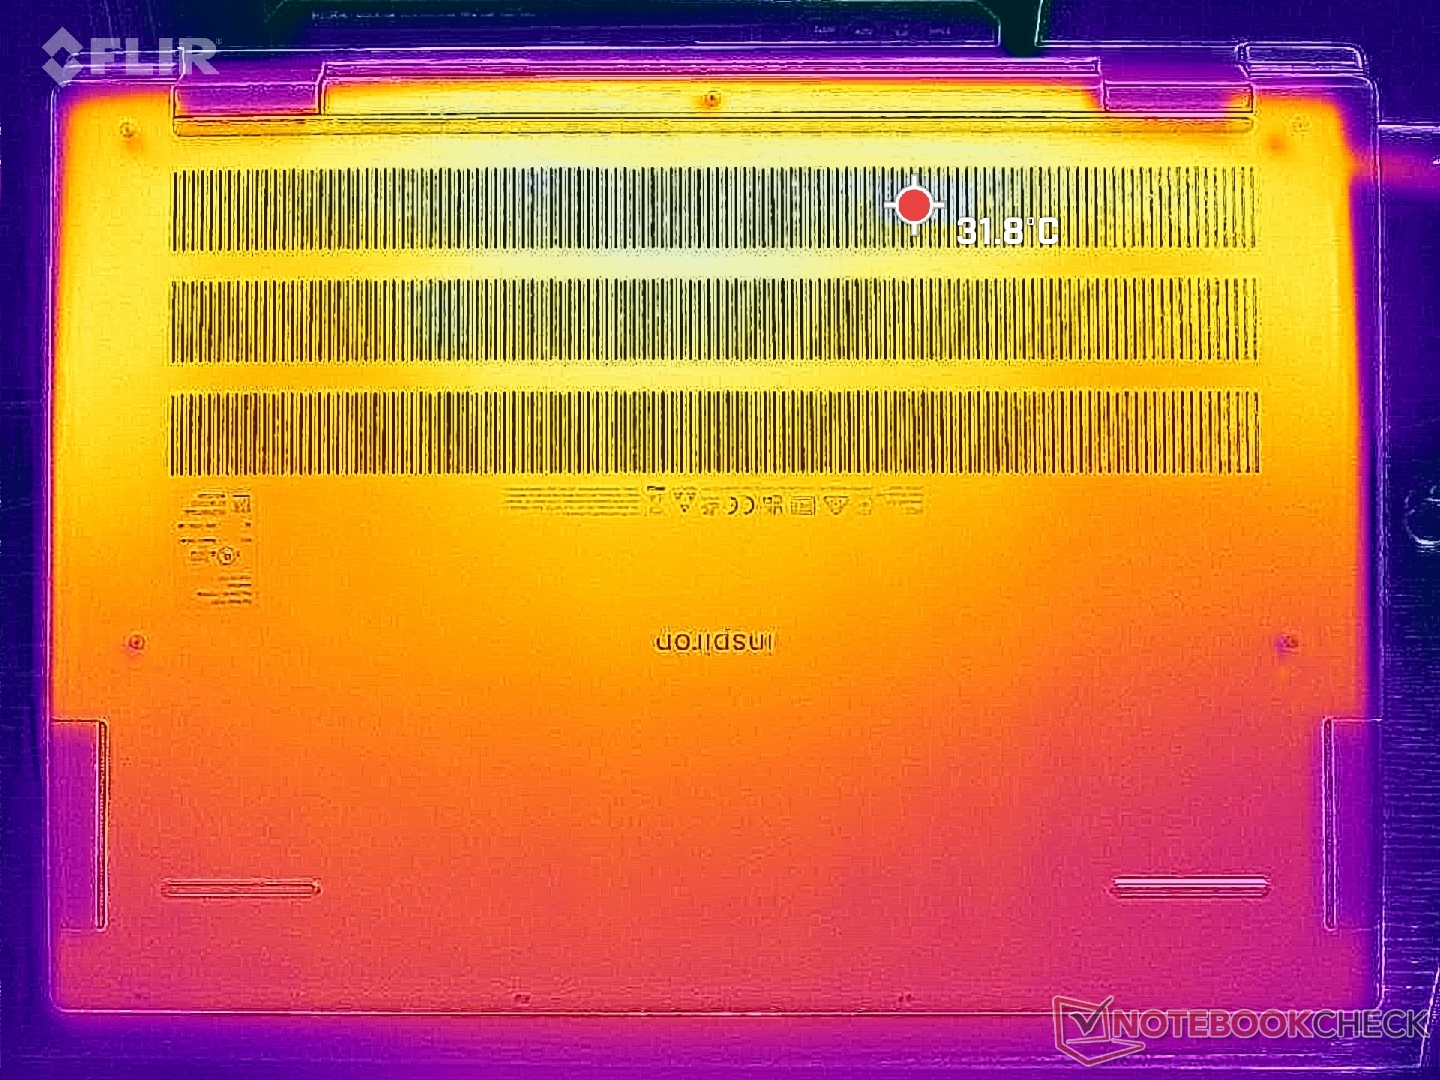
(±) Le fond chauffe jusqu'à un maximum de 42.2 °C / 108 F, contre une moyenne de 39.1 °C / 102 F
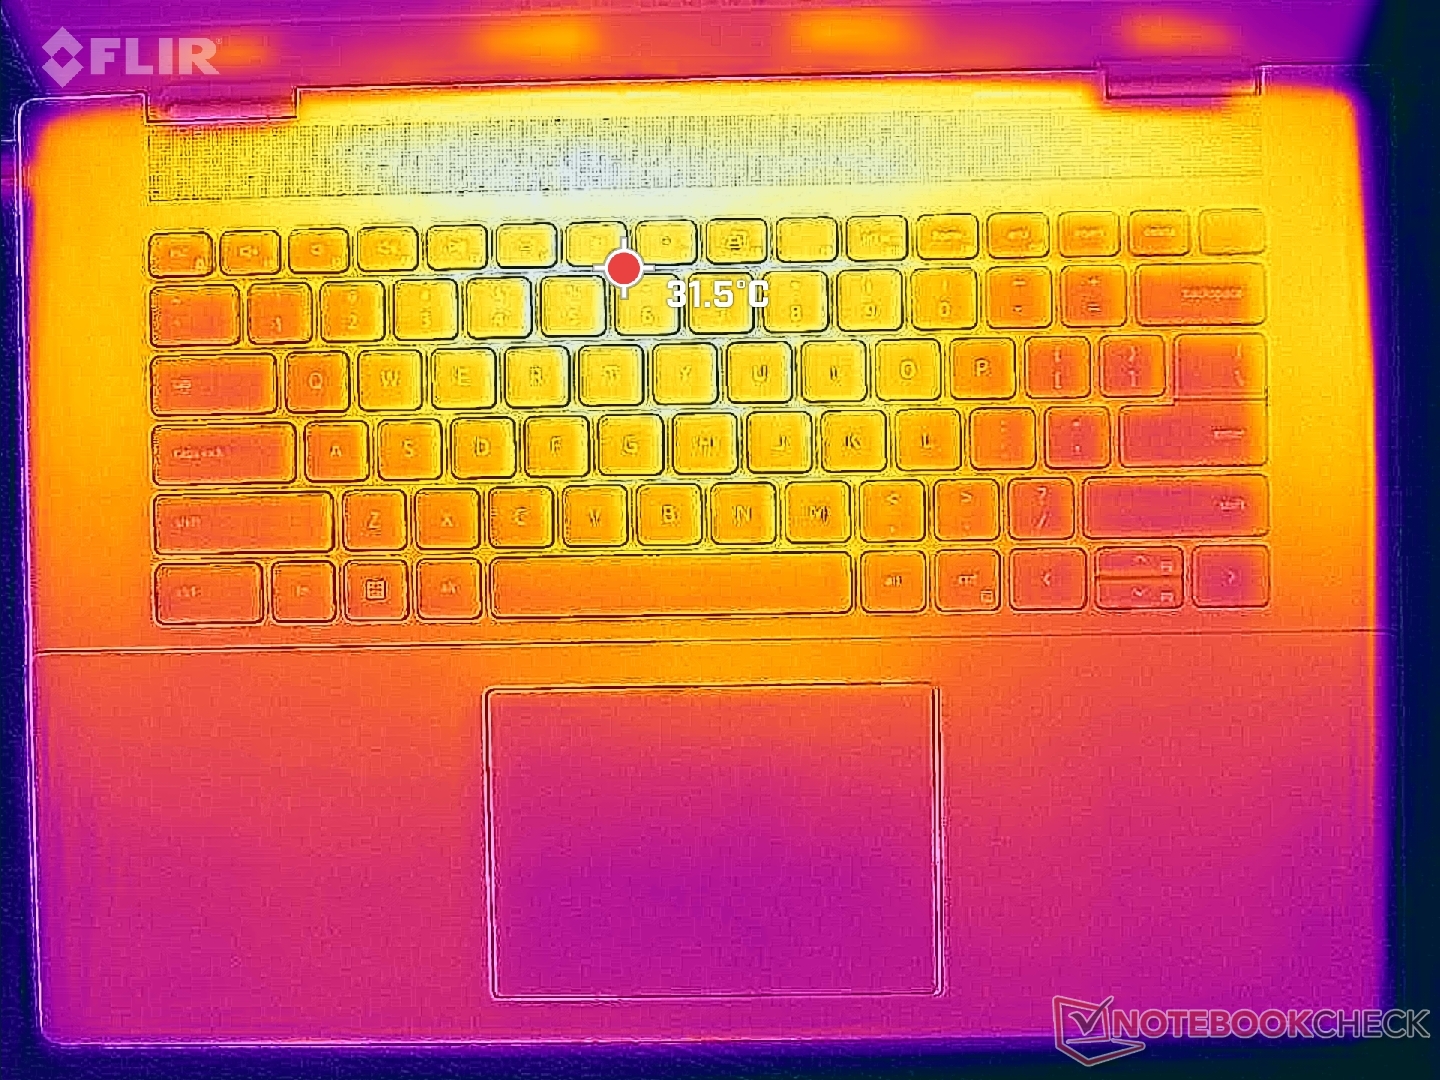
(±) En utilisation inactive, la température moyenne du côté supérieur est de 32 °C / 90 F, par rapport à la moyenne du dispositif de 31.3 °C / 88 F.
(-) En jouant à The Witcher 3, la température moyenne du côté supérieur est de 40.6 °C / 105 F, alors que la moyenne de l'appareil est de 31.3 °C / 88 F.
(±) Les repose-poignets et le pavé tactile peuvent devenir très chauds au toucher, avec un maximum de 36.6 °C / 97.9# F.
(-) La température moyenne de la zone de l'appui-paume de dispositifs similaires était de 28.7 °C / 83.7 F (-7.9 °C / #-14.2 F).
| Dell Inspiron 16 Plus 7630 Intel Core i7-13700H, NVIDIA GeForce RTX 4060 Laptop GPU | Dell Inspiron 16 Plus 7620 Intel Core i7-12700H, NVIDIA GeForce RTX 3050 Ti Laptop GPU | Lenovo Slim Pro 9i 16IRP8 Intel Core i9-13905H, NVIDIA GeForce RTX 4050 Laptop GPU | Asus Vivobook Pro 16X K6604JV-MX016W Intel Core i9-13980HX, NVIDIA GeForce RTX 4060 Laptop GPU | HP Envy 16 h0112nr Intel Core i7-12700H, NVIDIA GeForce RTX 3060 Laptop GPU | MSI Summit E16 Flip A12UDT-031 Intel Core i7-1280P, NVIDIA GeForce RTX 3050 Ti Laptop GPU | |
|---|---|---|---|---|---|---|
| Heat | 6% | 10% | -3% | 3% | 2% | |
| Maximum Upper Side * (°C) | 47.8 | 46 4% | 37.8 21% | 39.7 17% | 45.2 5% | 49.2 -3% |
| Maximum Bottom * (°C) | 42.2 | 45.8 -9% | 44.8 -6% | 60 -42% | 44 -4% | 50.2 -19% |
| Idle Upper Side * (°C) | 35.2 | 29.2 17% | 30.6 13% | 30.9 12% | 33.6 5% | 29.4 16% |
| Idle Bottom * (°C) | 35 | 31 11% | 31 11% | 34.7 1% | 32.6 7% | 30 14% |
* ... Moindre est la valeur, meilleures sont les performances
Test de stress
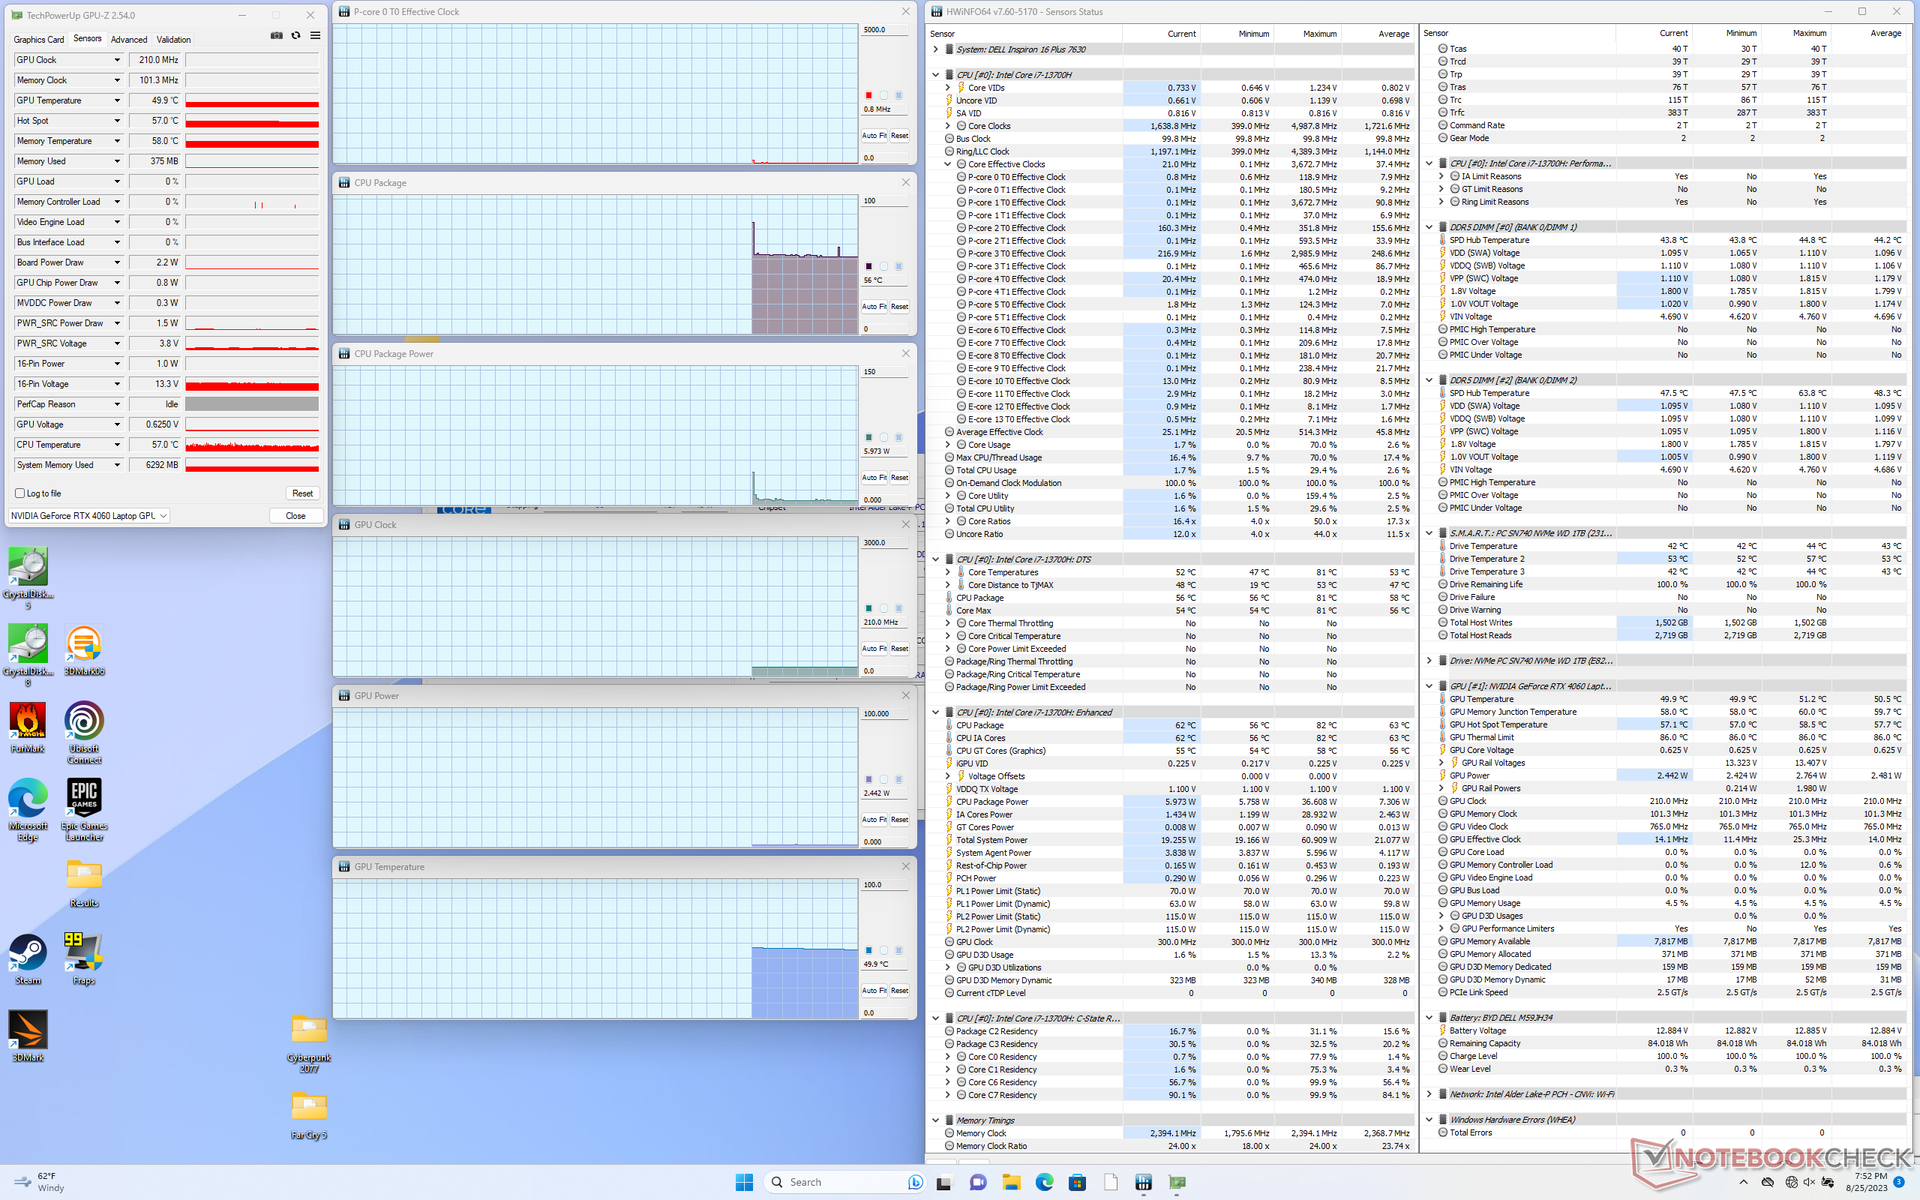
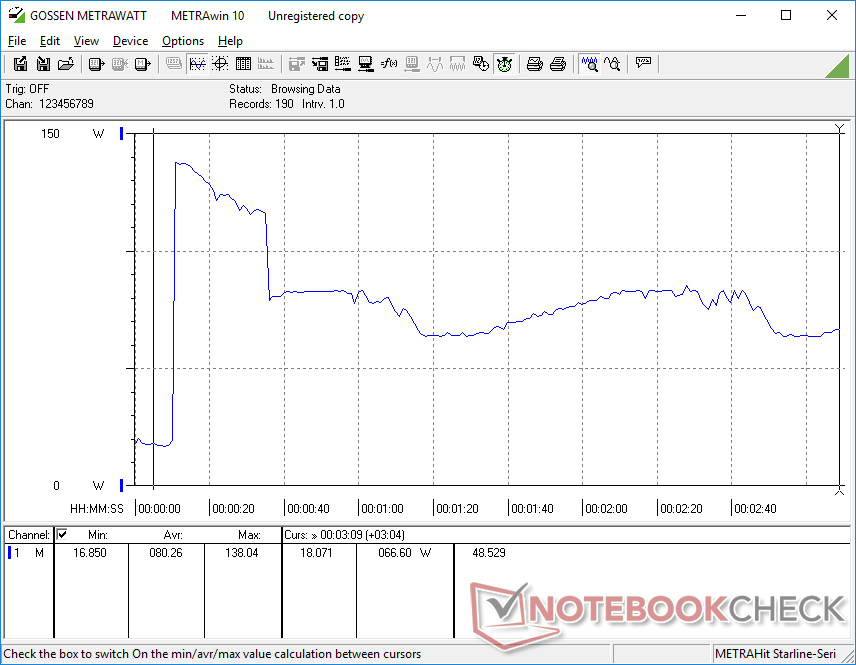
Lors de l'exécution de Prime95, le CPU atteint 3,4 GHz, 89 W et 100 C pendant quelques secondes avant de se stabiliser à environ 2,3 GHz et 50 W afin de maintenir une température plus raisonnable de 84 C. Le modèle de l'année dernière se stabilise également à peu près aux mêmes valeurs lors du même test.
En mode Witcher 3 en mode Performance pour représenter des charges de jeu typiques, le GPU Nvidia se stabilise à 2235 MHz, 71 C et 69 W selon HWiNFO. Le passage en mode équilibré n'a pas d'impact significatif sur ces valeurs, ce qui correspond à nos observations sur Fire Strike. Il est intéressant de noter que les températures du cœur sont beaucoup plus basses que celles que nous avons enregistrées sur l Inspiron 16 Plus 7620 lors de l'exécution du même jeu, probablement en raison du bruit de notre ventilateur plus fort et des améliorations globales apportées à la solution de refroidissement.
Notez que si HWiNFO indique une consommation GPU de 69 W en jeu, Dell annonce une consommation GPU de seulement 60 W. Nvidia Control Panel indique une consommation GPU cible de 70 W.
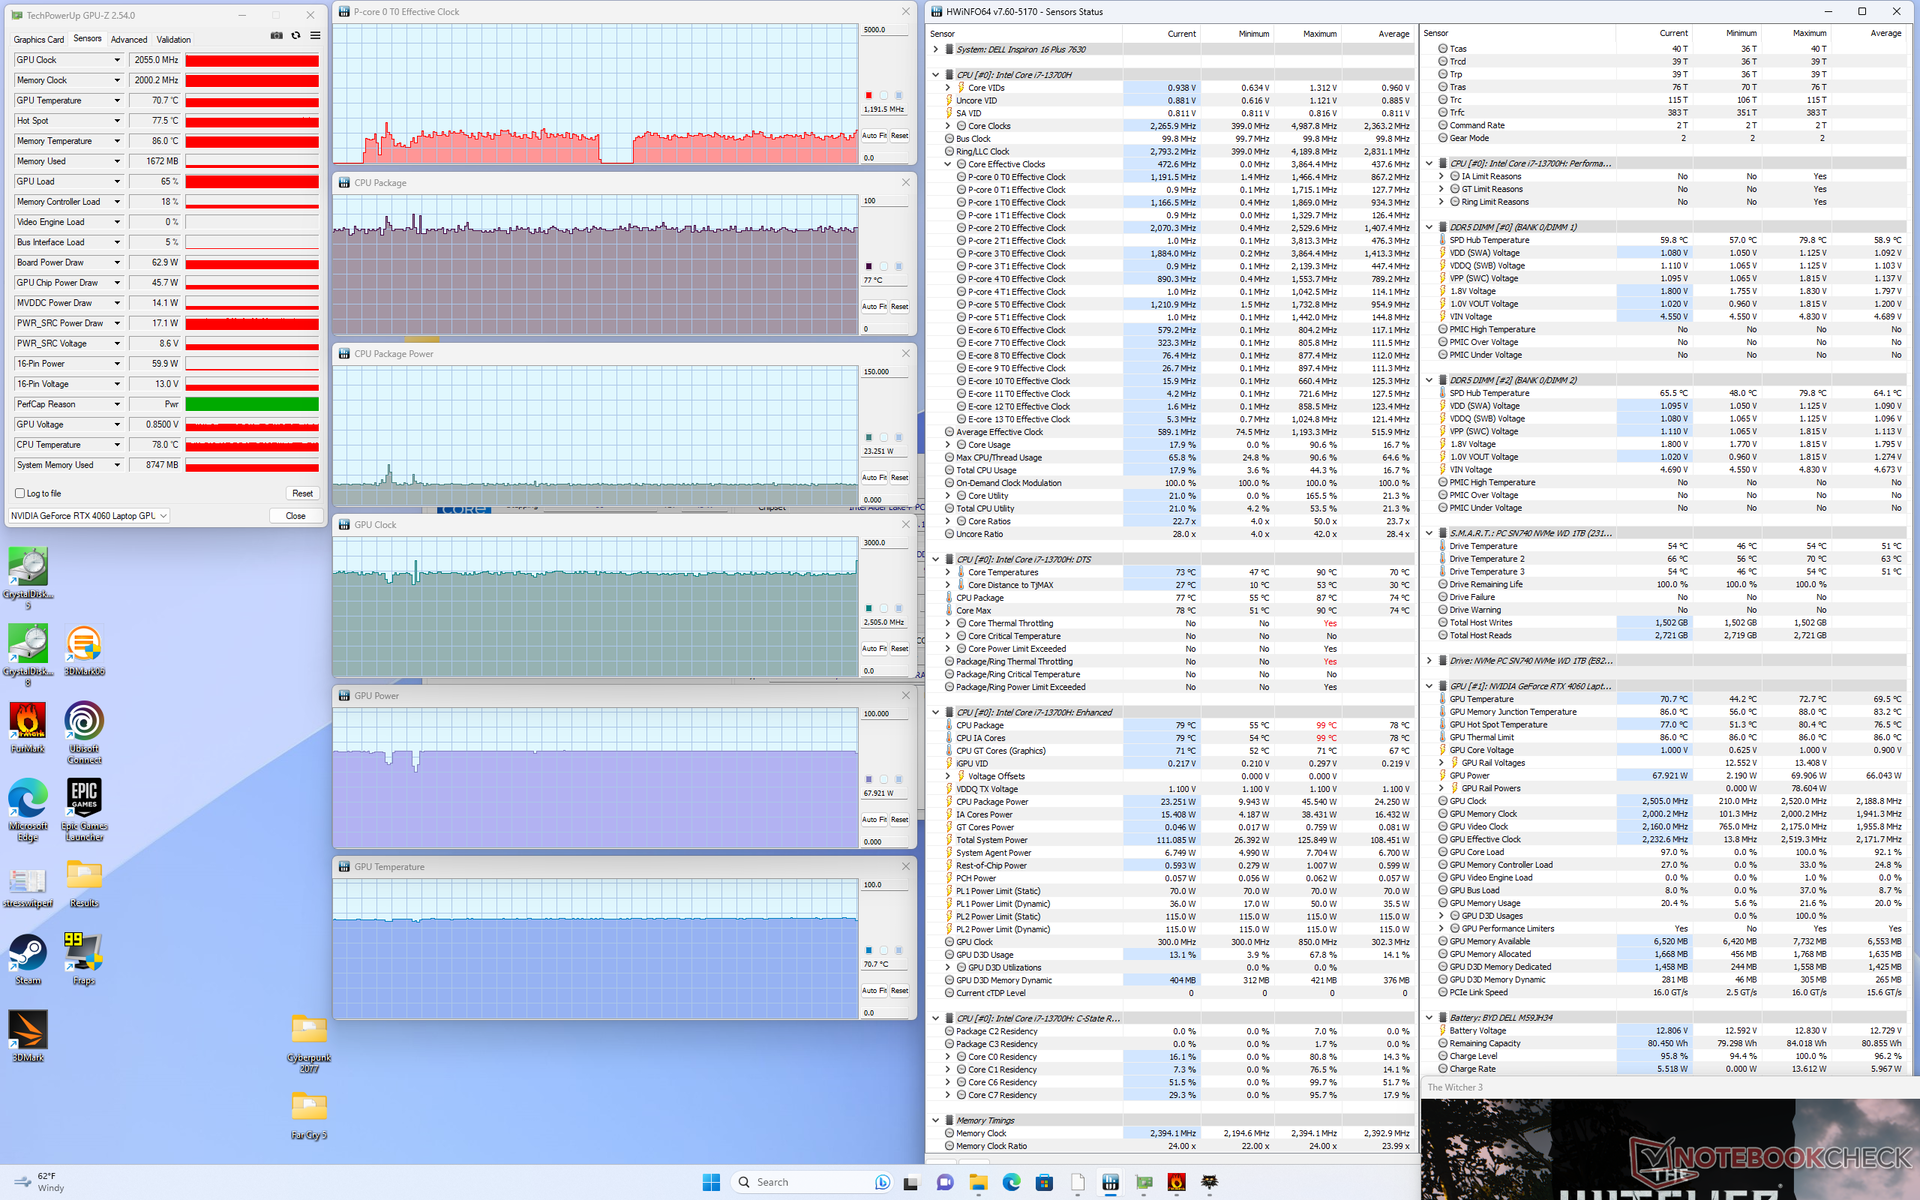
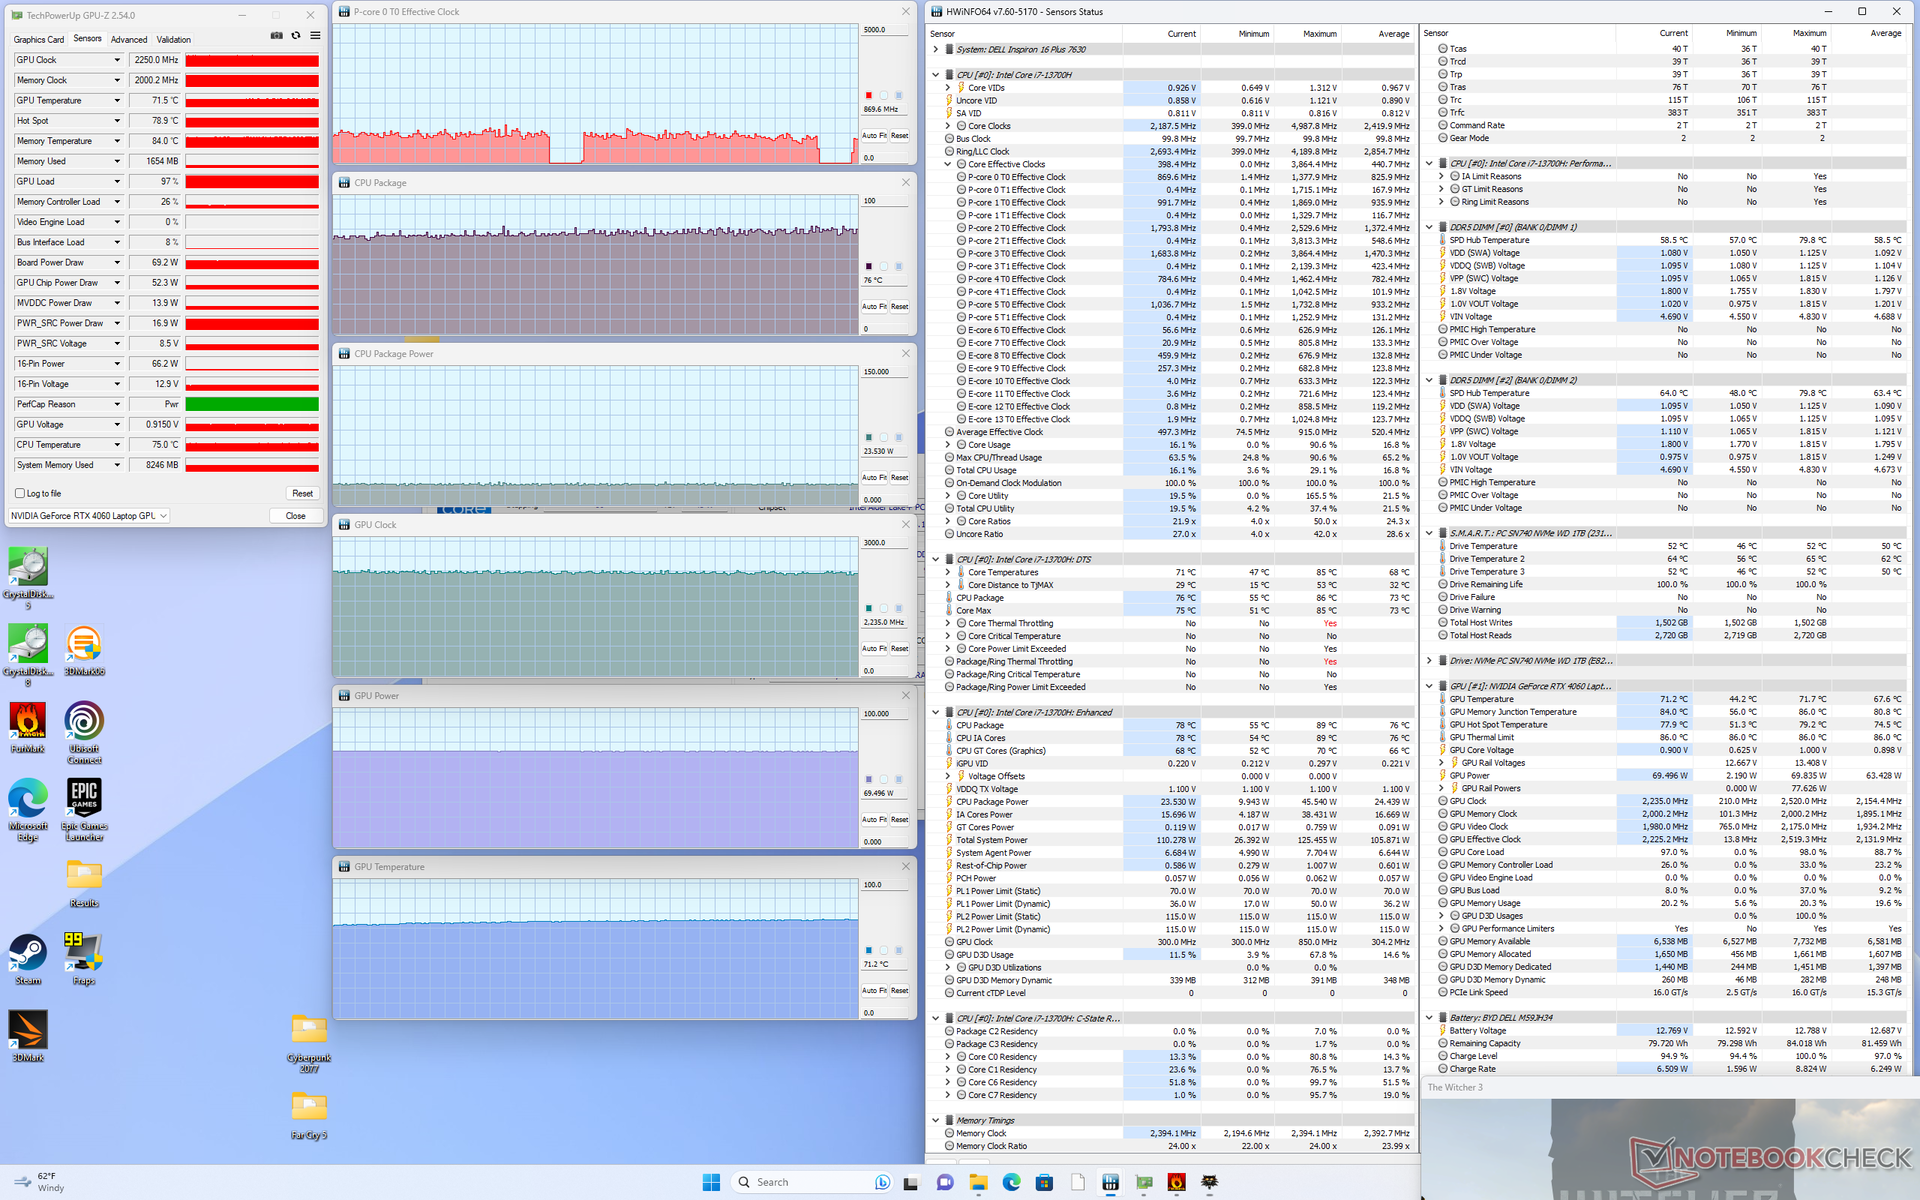
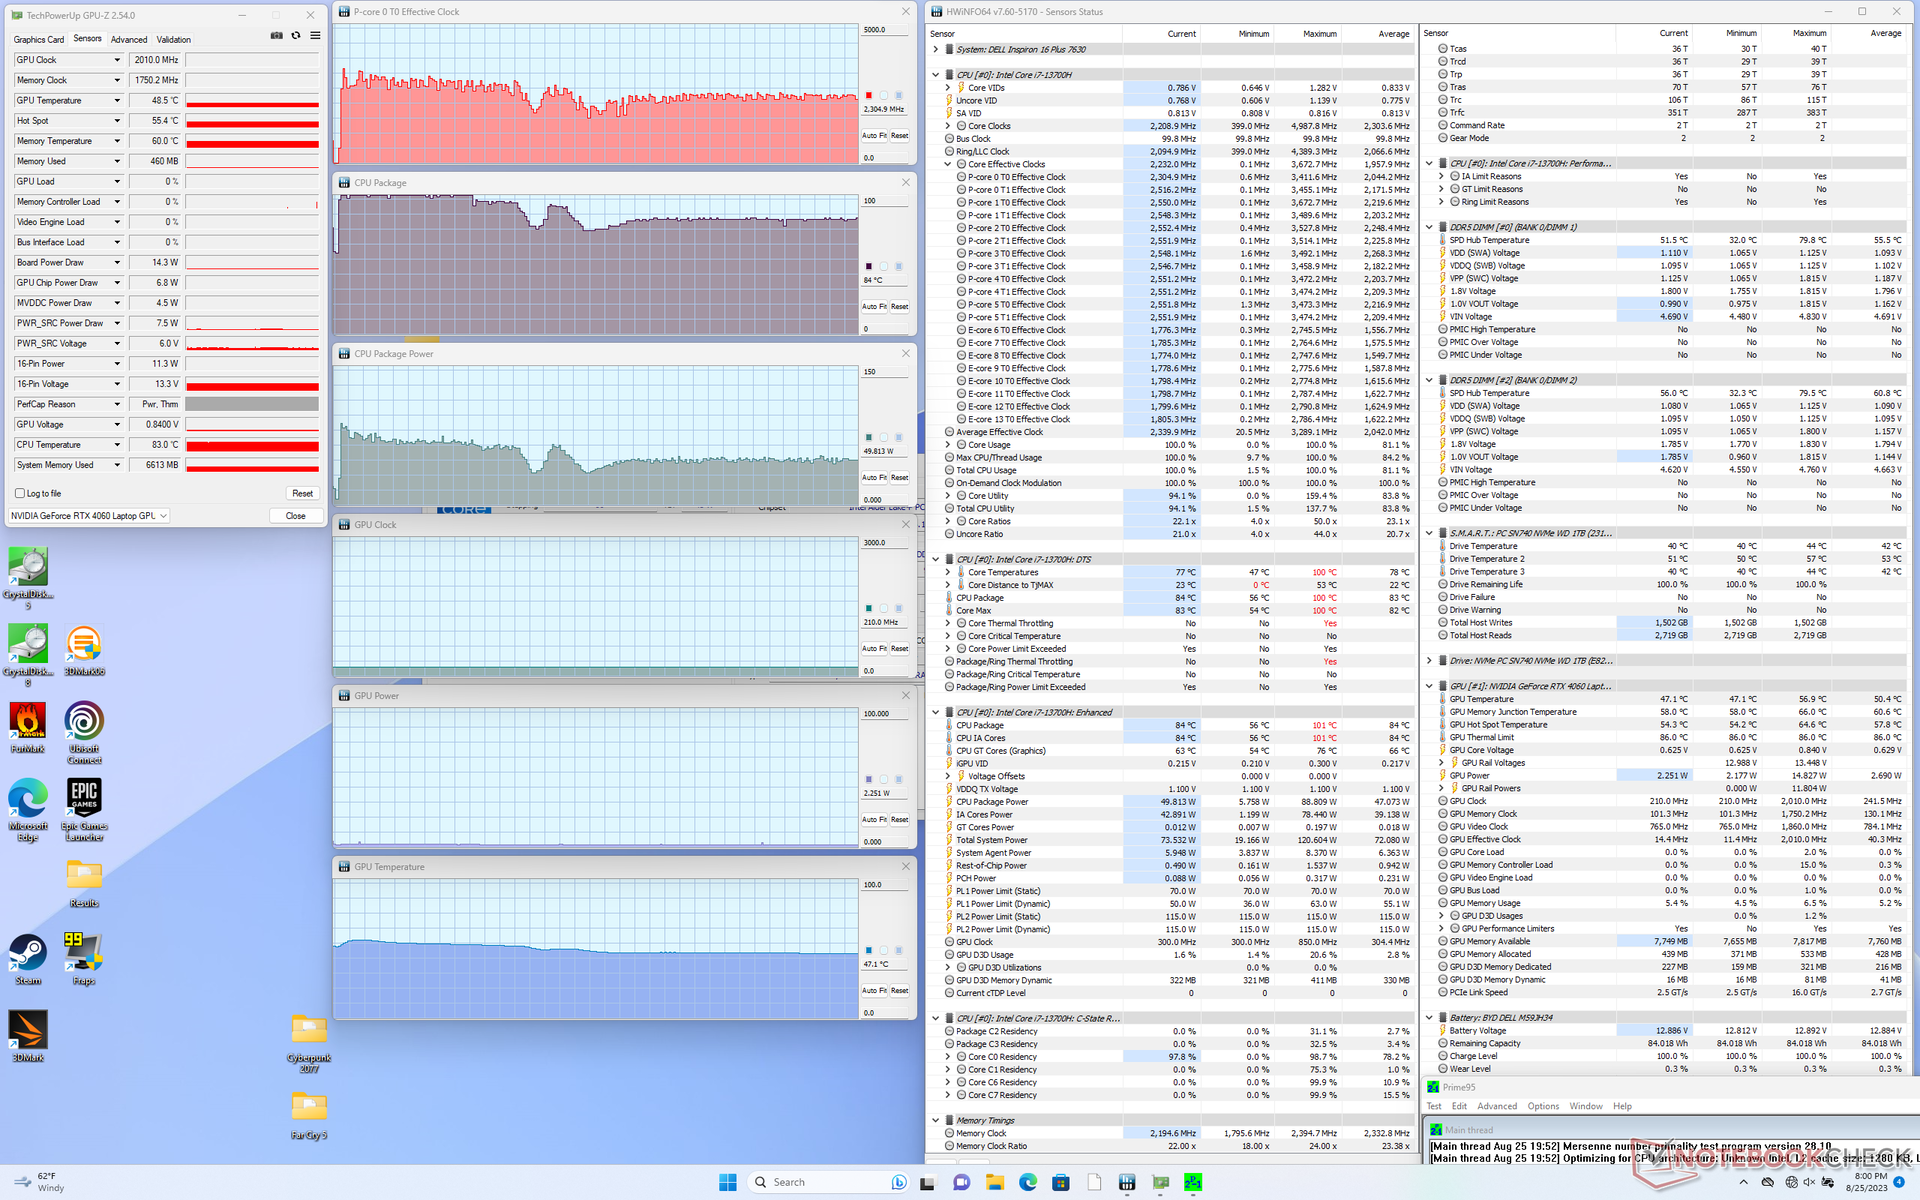
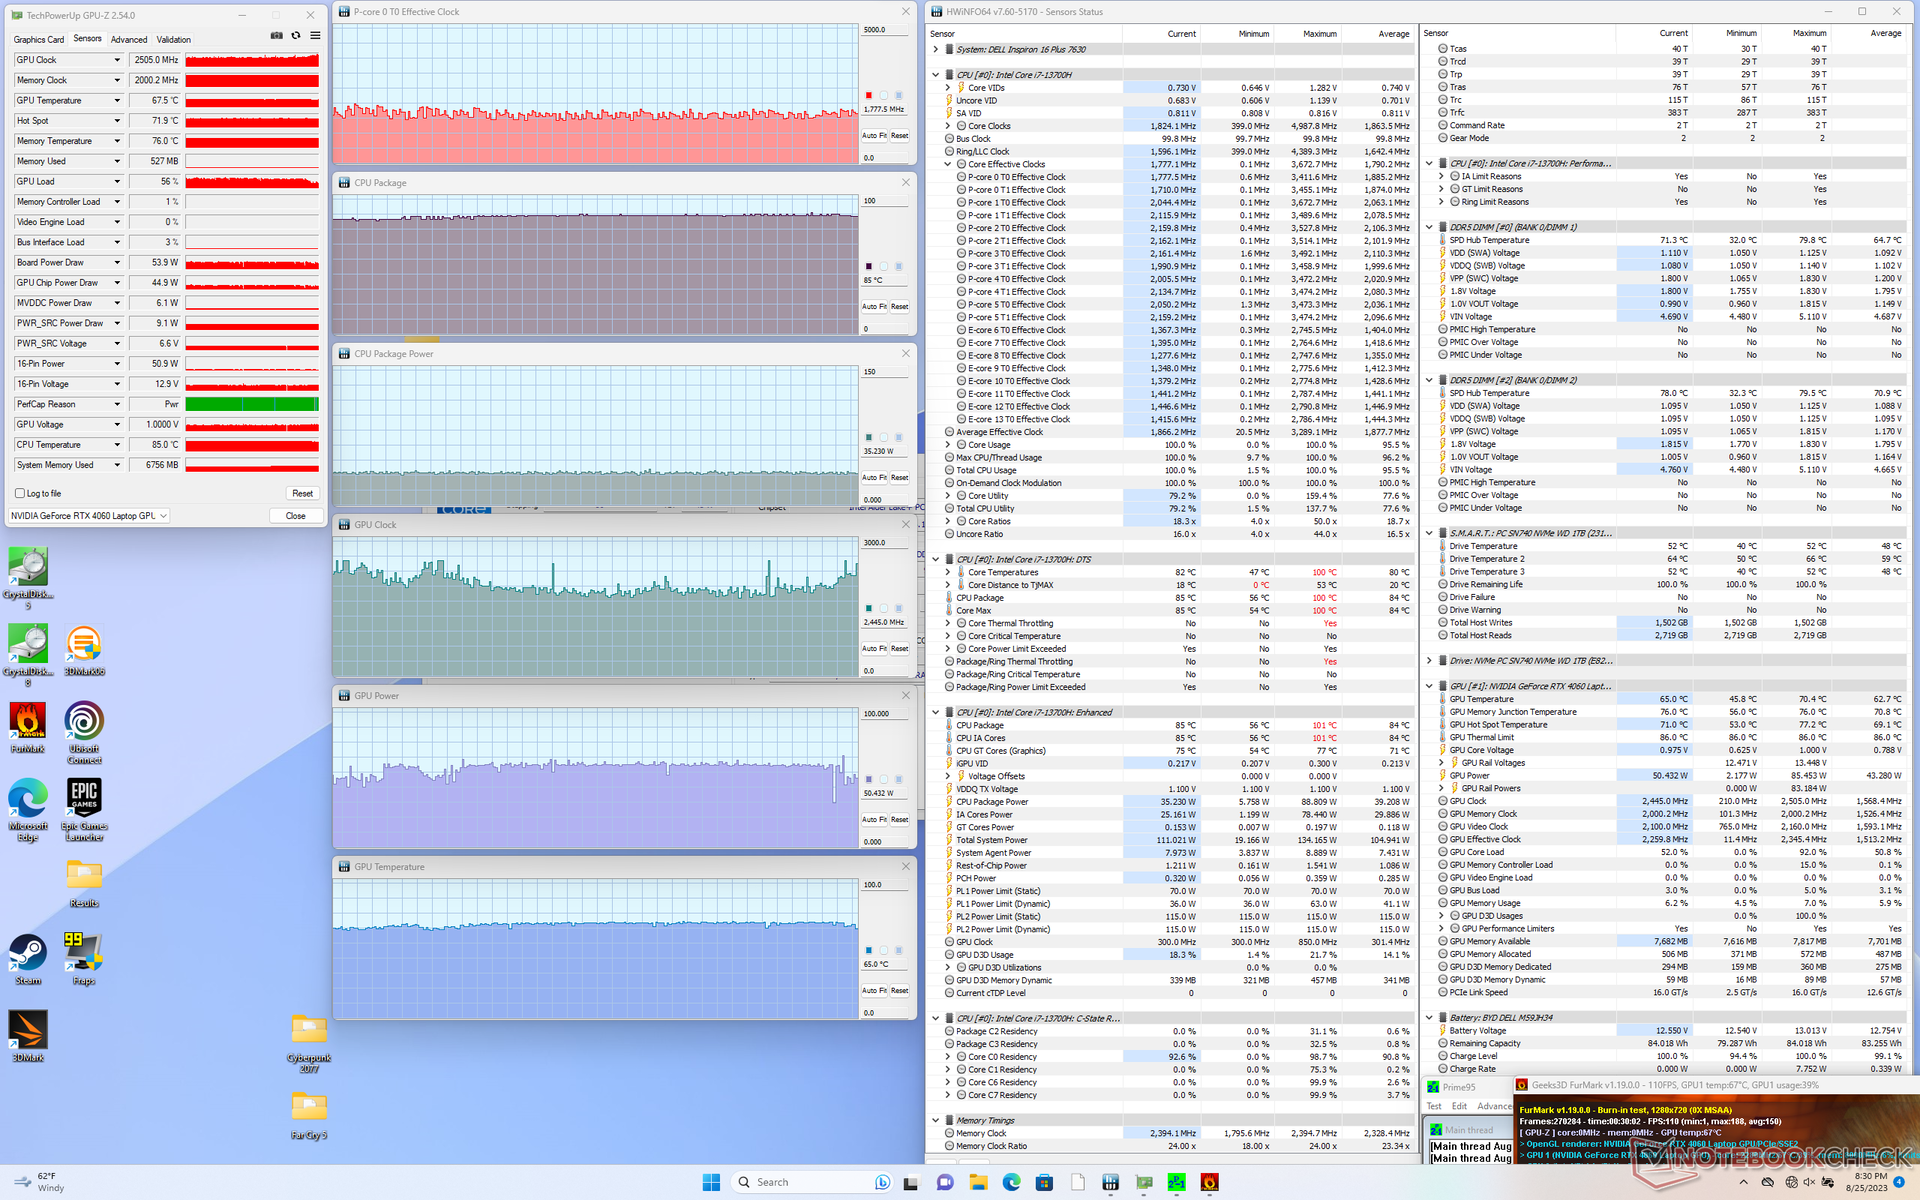
| Horloge du CPU (GHz) | Horloge du GPU (MHz) | Température moyenne du CPU (°C) | Température moyenne du GPU (°C) | |
| Système en veille | -- | -- | 56 | 50 |
| Prime95 Stress | 2.3 - 2.4 | -- | 84 | 47 |
| Prime95 + FurMark Stress | ~1.8 | ~2445 | 85 | 65 |
| Witcher 3 Stress(mode équilibré) | ~1.1 | 2055 | 77 | 71 |
| Witcher 3 Stress (mode Performance) | ~1.1 | 2250 | 76 | 71 |
Intervenants
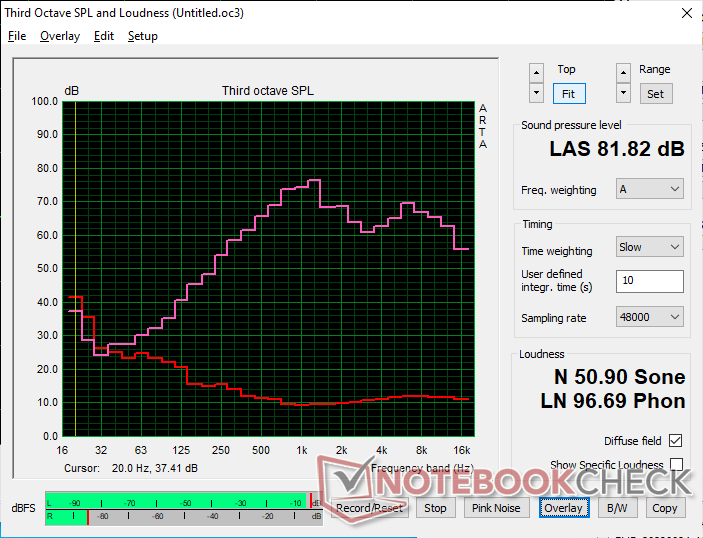
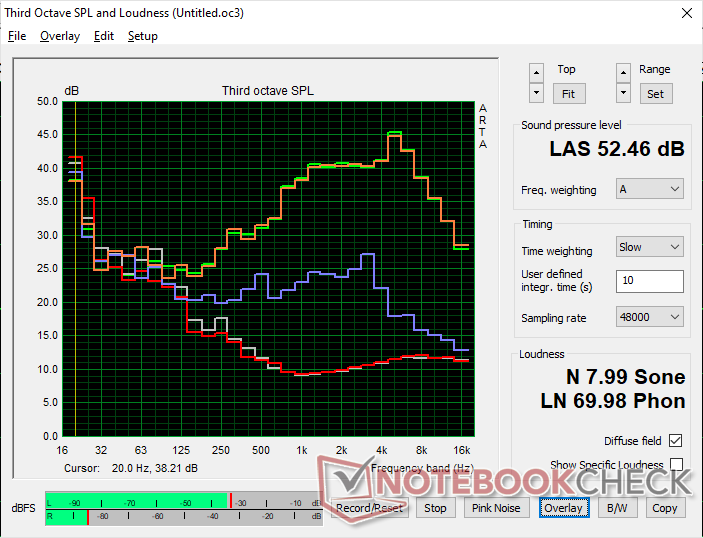
Dell Inspiron 16 Plus 7630 analyse audio
(±) | le niveau sonore du haut-parleur est moyen mais bon (81.8# dB)
Basses 100 - 315 Hz
(-) | presque aucune basse - en moyenne 17% plus bas que la médiane
(±) | la linéarité des basses est moyenne (8.4% delta à la fréquence précédente)
Médiums 400 - 2000 Hz
(±) | médiane supérieure - en moyenne 6.3% supérieure à la médiane
(+) | les médiums sont linéaires (6.2% delta à la fréquence précédente)
Aiguës 2 - 16 kHz
(+) | des sommets équilibrés - à seulement 2.2% de la médiane
(+) | les aigus sont linéaires (5.6% delta à la fréquence précédente)
Globalement 100 - 16 000 Hz
(±) | la linéarité du son global est moyenne (15.9% de différence avec la médiane)
Par rapport à la même classe
» 40% de tous les appareils testés de cette catégorie étaient meilleurs, 6% similaires, 54% pires
» Le meilleur avait un delta de 5%, la moyenne était de 17%, le pire était de 45%.
Par rapport à tous les appareils testés
» 25% de tous les appareils testés étaient meilleurs, 5% similaires, 70% pires
» Le meilleur avait un delta de 4%, la moyenne était de 24%, le pire était de 134%.
Apple MacBook Pro 16 2021 M1 Pro analyse audio
(+) | les haut-parleurs peuvent jouer relativement fort (84.7# dB)
Basses 100 - 315 Hz
(+) | bonne basse - seulement 3.8% loin de la médiane
(+) | les basses sont linéaires (5.2% delta à la fréquence précédente)
Médiums 400 - 2000 Hz
(+) | médiane équilibrée - seulement 1.3% de la médiane
(+) | les médiums sont linéaires (2.1% delta à la fréquence précédente)
Aiguës 2 - 16 kHz
(+) | des sommets équilibrés - à seulement 1.9% de la médiane
(+) | les aigus sont linéaires (2.7% delta à la fréquence précédente)
Globalement 100 - 16 000 Hz
(+) | le son global est linéaire (4.6% différence à la médiane)
Par rapport à la même classe
» 0% de tous les appareils testés de cette catégorie étaient meilleurs, 0% similaires, 100% pires
» Le meilleur avait un delta de 5%, la moyenne était de 17%, le pire était de 45%.
Par rapport à tous les appareils testés
» 0% de tous les appareils testés étaient meilleurs, 0% similaires, 100% pires
» Le meilleur avait un delta de 4%, la moyenne était de 24%, le pire était de 134%.
Gestion de l'énergie
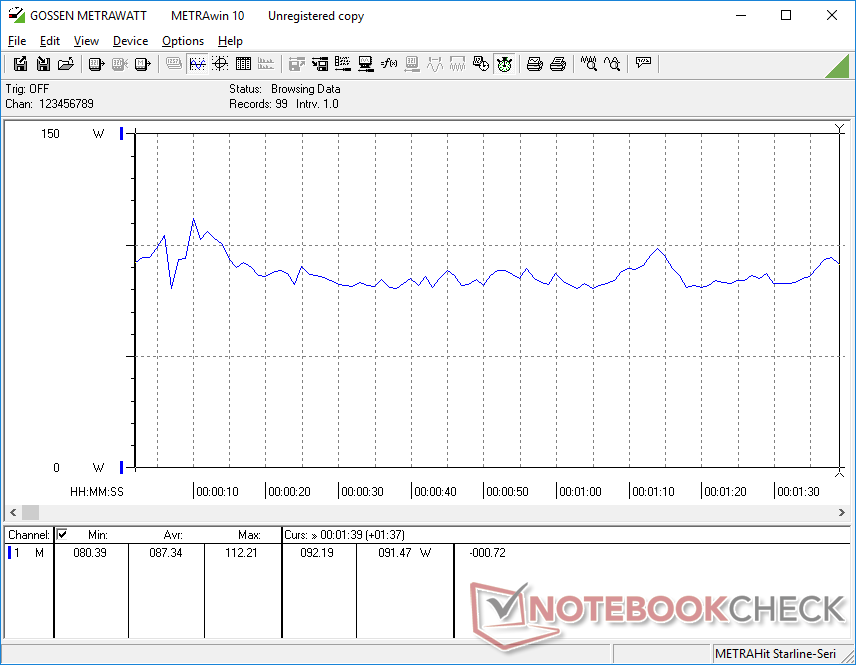
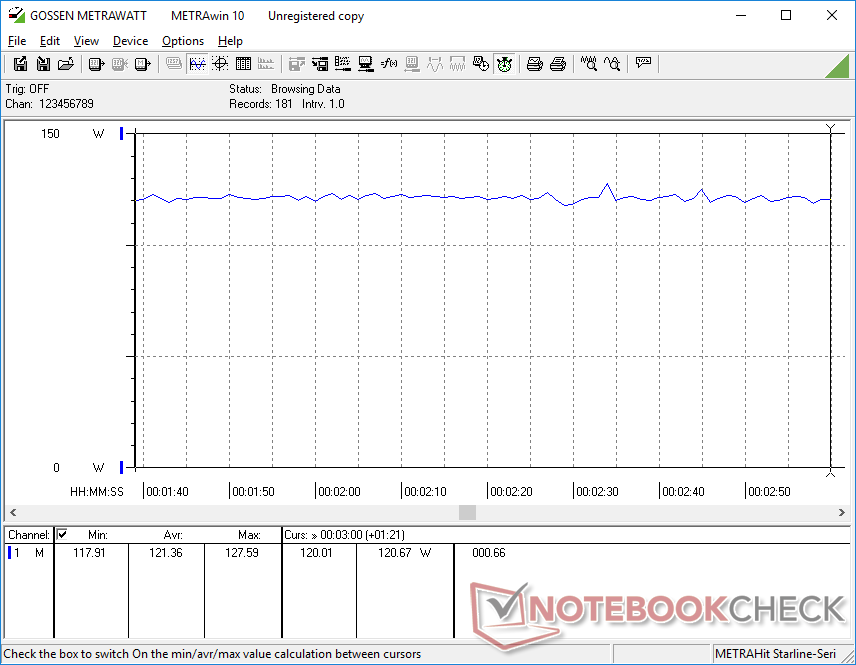
Consommation d'énergie - Performances élevées du GPU par watt
La consommation est légèrement supérieure à celle du modèle de l'année dernière lorsqu'il tourne au ralenti sur le bureau ou lorsqu'il exécute des jeux. L'augmentation de 8 % lors de l'exécution de jeux est toutefois bien faible par rapport à l'augmentation de 40 à 60 % des performances graphiques par rapport à la RTX 3050 Ti. Ainsi, les performances par watt sont toujours en faveur de notre modèle le plus récent, même si la consommation d'énergie peut être un peu plus élevée.
Les ordinateurs portables de jeu dotés du même processeur et du même GPU que notre Dell Inspiron, tels que leAcer Nitro 17ont tendance à être plus gourmands en énergie, car ils visent des niveaux de puissance plus élevés pour tirer davantage de performances des processeurs. Dans les jeux, par exemple, l'Acer demande environ 30 W de plus.
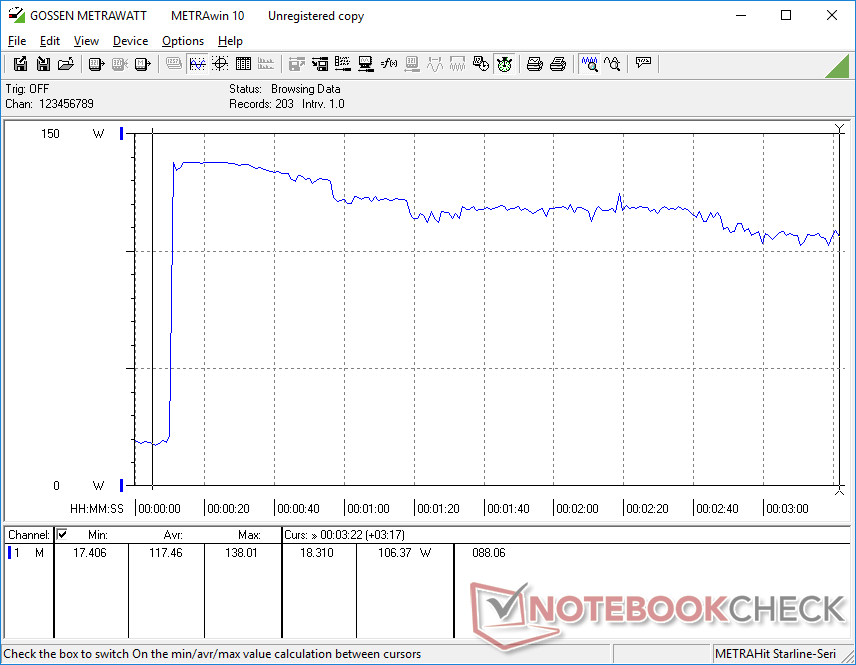
Nous avons pu mesurer une consommation maximale temporaire de 138 W à partir de l'adaptateur secteur de taille moyenne (~15 x 7,4 x 2,5 cm) de 130 W lorsque le CPU et le GPU sont utilisés à 100 %. Notez que les configurations sans carte graphique discrète sont livrées avec un adaptateur secteur plus petit de 90 W.
| Éteint/en veille | |
| Au repos | |
| Fortement sollicité |
|
Légende:
min: | |
| Dell Inspiron 16 Plus 7630 i7-13700H, GeForce RTX 4060 Laptop GPU, WD PC SN740 SDDPTQD-1T00, IPS, 2560x1600, 16" | Dell Inspiron 16 Plus 7620 i7-12700H, GeForce RTX 3050 Ti Laptop GPU, Kioxia BG5 KBG50ZNS512G, IPS, 3072x1920, 16" | Lenovo Slim Pro 9i 16IRP8 i9-13905H, GeForce RTX 4050 Laptop GPU, Samsung PM9A1 MZVL21T0HCLR, Mini-LED, 3200x2000, 16" | Asus Vivobook Pro 16X K6604JV-MX016W i9-13980HX, GeForce RTX 4060 Laptop GPU, Solidigm P41 Plus SSDPFKNU010TZ, OLED, 3200x2000, 16" | HP Envy 16 h0112nr i7-12700H, GeForce RTX 3060 Laptop GPU, Micron 3400 1TB MTFDKBA1T0TFH, OLED, 3840x2400, 16" | MSI Summit E16 Flip A12UDT-031 i7-1280P, GeForce RTX 3050 Ti Laptop GPU, Samsung PM9A1 MZVL22T0HBLB, IPS, 2560x1600, 16" | |
|---|---|---|---|---|---|---|
| Power Consumption | 15% | -28% | -23% | -9% | 22% | |
| Idle Minimum * (Watt) | 15.6 | 6.8 56% | 16 -3% | 13.8 12% | 10 36% | 9.8 37% |
| Idle Average * (Watt) | 17.7 | 9.6 46% | 30 -69% | 16 10% | 10.9 38% | 15.3 14% |
| Idle Maximum * (Watt) | 20.6 | 17 17% | 30.4 -48% | 19 8% | 27.8 -35% | 16.3 21% |
| Load Average * (Watt) | 87.4 | 117.5 -34% | 78.9 10% | 147 -68% | 116.4 -33% | 87 -0% |
| Witcher 3 ultra * (Watt) | 121.7 | 113.1 7% | 155.3 -28% | 147.8 -21% | 133.7 -10% | 86.1 29% |
| Load Maximum * (Watt) | 138 | 137.4 -0% | 180.4 -31% | 244 -77% | 209.8 -52% | 100 28% |
* ... Moindre est la valeur, meilleures sont les performances
Power Consumption Witcher 3 / Stresstest
Power Consumption external Monitor
Autonomie de la batterie
La capacité et l'autonomie de la batterie restent inchangées. Nous avons pu enregistrer 9,5 heures de navigation WLAN en mode équilibré, ce qui est plus long que sur des modèles concurrents comme leLenovo Slim Pro 9i 16IRP8 ou le HP Envy 16, d'au moins deux heures chacun.
Le chargement de la batterie vide à la batterie pleine prend environ 90 minutes avec l'adaptateur secteur fourni. Le système peut également être rechargé avec des adaptateurs USB-C tels que ceux qui sont livrés avec la série XPS.
| Dell Inspiron 16 Plus 7630 i7-13700H, GeForce RTX 4060 Laptop GPU, 86 Wh | Dell Inspiron 16 Plus 7620 i7-12700H, GeForce RTX 3050 Ti Laptop GPU, 86 Wh | Lenovo Slim Pro 9i 16IRP8 i9-13905H, GeForce RTX 4050 Laptop GPU, 75 Wh | Asus Vivobook Pro 16X K6604JV-MX016W i9-13980HX, GeForce RTX 4060 Laptop GPU, 90 Wh | HP Envy 16 h0112nr i7-12700H, GeForce RTX 3060 Laptop GPU, 83 Wh | MSI Summit E16 Flip A12UDT-031 i7-1280P, GeForce RTX 3050 Ti Laptop GPU, 82 Wh | |
|---|---|---|---|---|---|---|
| Autonomie de la batterie | -2% | -30% | -12% | -0% | -24% | |
| Reader / Idle (h) | 17.6 | 18.6 6% | 17.8 1% | |||
| WiFi v1.3 (h) | 9.4 | 9.6 2% | 6.6 -30% | 6.5 -31% | 7.9 -16% | 7.1 -24% |
| Load (h) | 1.4 | 1.2 -14% | 1.5 7% | 1.6 14% | ||
| H.264 (h) | 5.3 |
Points positifs
Points négatifs
Verdict - Mise à niveau pour un GPU plus rapide
Les améliorations par rapport à l'Inspiron 16 Plus 7620 de l'année dernière sont les suivantes Inspiron 16 Plus 7620 de l'année dernière sont plus importantes que prévu à bien des égards. Outre l'augmentation considérable des performances graphiques lors du passage de la RTX 3050 Ti à la RTX 4060, le bruit des ventilateurs plus ou moins fort entre les deux modèles est notable, de même que les températures plus fraîches sur le modèle le plus récent. Les options d'affichage sont différentes puisqu'elles incluent désormais un taux de rafraîchissement optionnel de 120 Hz, tandis que les mises à niveau SODIMM offrent désormais deux emplacements au lieu d'un. Les charnières plus rigides sont également un changement bienvenu pour réduire les risques de rupture prématurée. L'expérience utilisateur s'est suffisamment améliorée, même si les performances du processeur ne sont pas au rendez-vous et que le clavier reste le même qu'auparavant.
L'Inspiron 16 Plus 7630 est une question d'équilibre. Ses caractéristiques et ses performances sont juste suffisantes pour satisfaire la majorité des besoins en matière de multimédia et de jeux sans avoir à dépenser un bras et une jambe.
En tant qu'ordinateur portable multimédia et de jeu polyvalent, l'Inspiron 16 Plus 7630 manque cependant de quelques fonctionnalités que les ordinateurs portables multimédia et de jeu purs et durs ont tendance à avoir. Côté multimédia, les propriétaires de l'Inspiron 16 Plus 7630 ne bénéficieront pas de couleurs DCi-P3 plus vives, de résolutions natives plus élevées et d'un lecteur de carte SD intégré rapide. Côté jeu, le système ne dispose pas de G-Sync et de MUX et sa RTX 4060 est généralement plus lente que la moyenne. L'Inspiron 16 Plus 7630 est parfait pour la création de contenu et les jeux, mais les utilisateurs qui se tournent davantage vers la création de contenu devraient envisager un HP Envy 16 Plus HP Envy 16 ou un Asus ZenBook Pro Duo tandis que les joueurs invétérés se tourneront vers des machines dédiées aux jeux, comme un Modèle Dell G ou un Asus ROG.
Prix et disponibilité
Dell livre dès à présent l'Inspiron 16 Plus 7630 avec le Core i7 et la RTX 4060 au prix de 1250 USD.
Dell Inspiron 16 Plus 7630
- 08/30/2023 v7 (old)
Allen Ngo
Transparency
La sélection des appareils à examiner est effectuée par notre équipe éditoriale. L'échantillon de test a été prêté à l'auteur par le fabricant ou le détaillant pour les besoins de cet examen. Le prêteur n'a pas eu d'influence sur cette évaluation et le fabricant n'a pas reçu de copie de cette évaluation avant sa publication. Il n'y avait aucune obligation de publier cet article. En tant que média indépendant, Notebookcheck n'est pas soumis à l'autorité des fabricants, des détaillants ou des éditeurs.
Voici comment Notebookcheck teste
Chaque année, Notebookcheck examine de manière indépendante des centaines d'ordinateurs portables et de smartphones en utilisant des procédures standardisées afin de garantir que tous les résultats sont comparables. Nous avons continuellement développé nos méthodes de test depuis environ 20 ans et avons établi des normes industrielles dans le processus. Dans nos laboratoires de test, des équipements de mesure de haute qualité sont utilisés par des techniciens et des rédacteurs expérimentés. Ces tests impliquent un processus de validation en plusieurs étapes. Notre système d'évaluation complexe repose sur des centaines de mesures et de points de référence bien fondés, ce qui garantit l'objectivité.Price comparison

