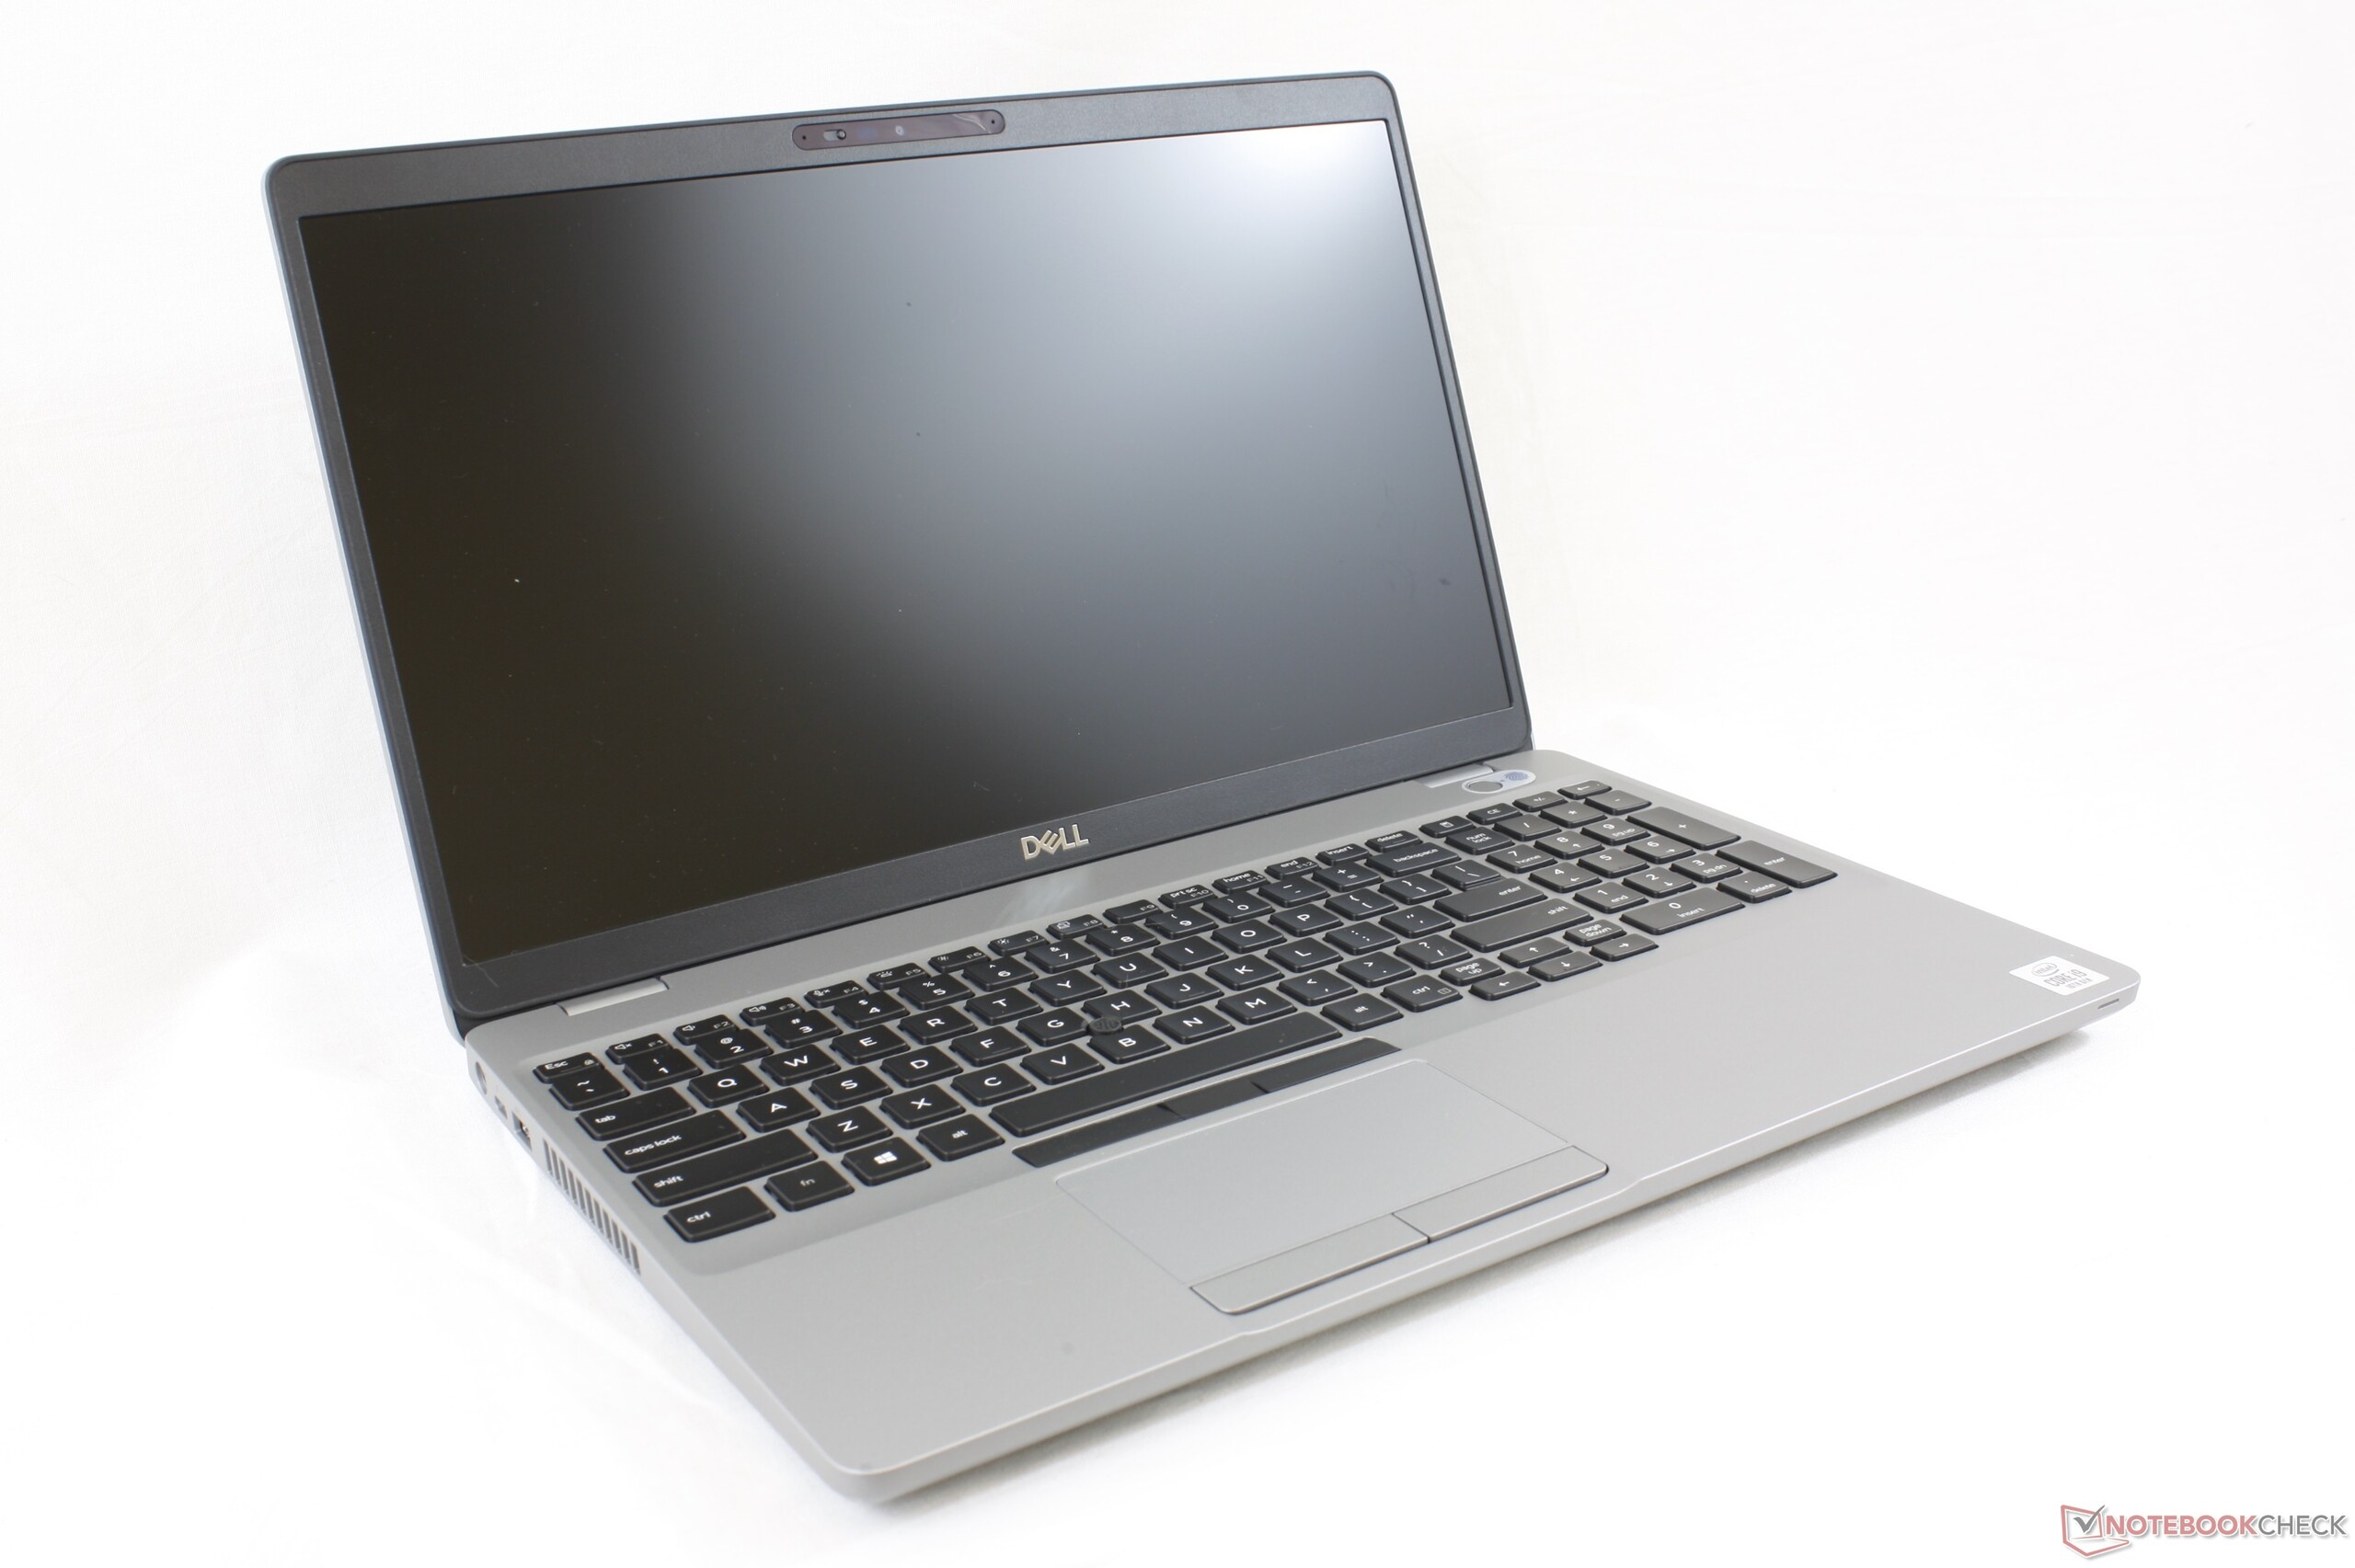
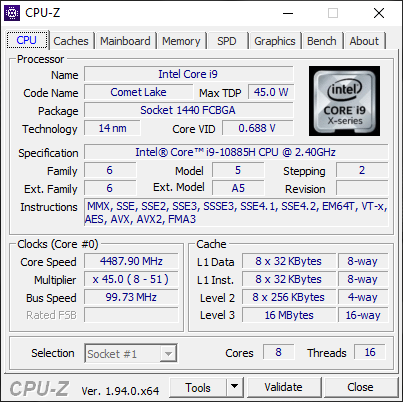
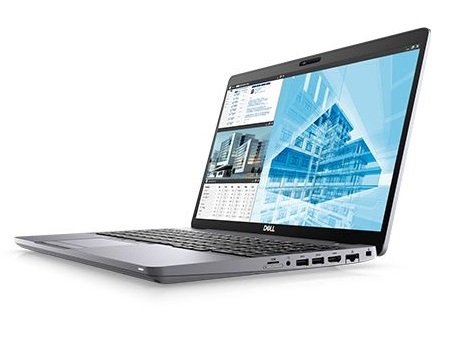
Test du Dell Precision 3551 (i9-10885H, Quadro P620, FHD) : les débuts de l'Intel Core i9-10885H
Note | Date | Modèle | Poids | Épaisseur | Taille | Résolution | Prix |
|---|---|---|---|---|---|---|---|
| 81.2 % v7 (old) | 10/20 | Dell Precision 3000 3551 i9-10885H, Quadro P620 | 2.2 kg | 24.92 mm | 15.60" | 1920x1080 | |
| 82.7 % v7 (old) | 11/20 | HP ZBook Firefly 15 G7 i7-10610U, Quadro P520 | 1.8 kg | 19.2 mm | 15.60" | 3840x2160 | |
| 86.3 % v7 (old) | 09/20 | Dell Precision 5550 P91F i7-10875H, Quadro T2000 Max-Q | 2 kg | 18 mm | 15.60" | 3840x2400 | |
| 81.2 % v7 (old) | 11/19 | Lenovo ThinkPad P53s-20N6001NGE i7-8565U, Quadro P520 | 1.9 kg | 19.95 mm | 15.60" | 1920x1080 | |
| 76 % v7 (old) | 10/19 | MSI WP65 i7-9750H, Quadro P620 | 1.9 kg | 21.7 mm | 15.60" | 1920x1080 | |
| 84.3 % v6 (old) | 08/18 | Dell Precision 3530 E-2176M, Quadro P600 | 2.3 kg | 24.3 mm | 15.60" | 1920x1080 |
| SD Card Reader | |
| average JPG Copy Test (av. of 3 runs) | |
| Dell Precision 5550 P91F (Toshiba Exceria Pro SDXC 64 GB UHS-II) | |
| Dell Precision 3530 (Toshiba Exceria Pro SDXC 64 GB UHS-II) | |
| Dell Precision 3000 3551 (Toshiba Exceria Pro M501 64 GB UHS-II) | |
| Lenovo ThinkPad P53s-20N6001NGE (Toshiba Exceria Pro M501 64 GB UHS-II) | |
| maximum AS SSD Seq Read Test (1GB) | |
| Dell Precision 3530 (Toshiba Exceria Pro SDXC 64 GB UHS-II) | |
| Dell Precision 5550 P91F (Toshiba Exceria Pro SDXC 64 GB UHS-II) | |
| Dell Precision 3000 3551 (Toshiba Exceria Pro M501 64 GB UHS-II) | |
| Lenovo ThinkPad P53s-20N6001NGE (Toshiba Exceria Pro M501 64 GB UHS-II) | |


| |||||||||||||||||||||||||
Homogénéité de la luminosité: 89 %
Valeur mesurée au centre, sur batterie: 235.5 cd/m²
Contraste: 942:1 (Valeurs des noirs: 0.25 cd/m²)
ΔE ColorChecker Calman: 5.44 | ∀{0.5-29.43 Ø4.71}
calibrated: 5.2
ΔE Greyscale Calman: 3.1 | ∀{0.09-98 Ø4.96}
56.1% sRGB (Argyll 1.6.3 3D)
35.5% AdobeRGB 1998 (Argyll 1.6.3 3D)
38.74% AdobeRGB 1998 (Argyll 3D)
56.5% sRGB (Argyll 3D)
37.5% Display P3 (Argyll 3D)
Gamma: 2.42
CCT: 7070 K
| Dell Precision 3000 3551 LG Philips 156WFD, IPS, 15.6", 1920x1080 | HP ZBook Firefly 15 G7 LGD064F, IPS LED, 15.6", 3840x2160 | Dell Precision 5550 P91F Sharp LQ156R1, IPS, 15.6", 3840x2400 | Lenovo ThinkPad P53s-20N6001NGE Lenovo LEN40BA, IPS, 15.6", 1920x1080 | MSI WP65 AU Optronics B156HAN02.1, IPS, 15.6", 1920x1080 | Dell Precision 3530 BOE BOE06F1, IPS, 15.6", 1920x1080 | |
|---|---|---|---|---|---|---|
| Display | 79% | 125% | 5% | 5% | 80% | |
| Display P3 Coverage (%) | 37.5 | 68.8 83% | 89.9 140% | 39.58 6% | 39.46 5% | 72.8 94% |
| sRGB Coverage (%) | 56.5 | 97.7 73% | 100 77% | 57.6 2% | 58.8 4% | 94.6 67% |
| AdobeRGB 1998 Coverage (%) | 38.74 | 69.8 80% | 99.9 158% | 40.89 6% | 40.69 5% | 69.3 79% |
| Response Times | -33% | -42% | -50% | -16% | -34% | |
| Response Time Grey 50% / Grey 80% * (ms) | 29.6 ? | 44 ? -49% | 46 ? -55% | 51.2 ? -73% | 37.6 ? -27% | 40.4 ? -36% |
| Response Time Black / White * (ms) | 26.4 ? | 30.8 ? -17% | 34 ? -29% | 33.6 ? -27% | 27.6 ? -5% | 34.8 ? -32% |
| PWM Frequency (Hz) | 1053 ? | |||||
| Screen | 51% | 33% | 4% | -2% | 10% | |
| Brightness middle (cd/m²) | 235.5 | 381 62% | 469.8 99% | 260 10% | 267.4 14% | 285.7 21% |
| Brightness (cd/m²) | 228 | 382 68% | 464 104% | 243 7% | 259 14% | 275 21% |
| Brightness Distribution (%) | 89 | 92 3% | 85 -4% | 88 -1% | 86 -3% | 85 -4% |
| Black Level * (cd/m²) | 0.25 | 0.21 16% | 0.42 -68% | 0.18 28% | 0.37 -48% | 0.31 -24% |
| Contrast (:1) | 942 | 1814 93% | 1119 19% | 1444 53% | 723 -23% | 922 -2% |
| Colorchecker dE 2000 * | 5.44 | 3 45% | 5.16 5% | 6 -10% | 4.21 23% | 5.84 -7% |
| Colorchecker dE 2000 max. * | 13.58 | 5.2 62% | 9.33 31% | 19.2 -41% | 21.1 -55% | 8.76 35% |
| Colorchecker dE 2000 calibrated * | 5.2 | 1.5 71% | 3.75 28% | 4.3 17% | 4.27 18% | 3.14 40% |
| Greyscale dE 2000 * | 3.1 | 3.5 -13% | 5.5 -77% | 4.2 -35% | 2.3 26% | 6.5 -110% |
| Gamma | 2.42 91% | 2.26 97% | 2 110% | 2.49 88% | 2.2 100% | 2.383 92% |
| CCT | 7070 92% | 7254 90% | 6198 105% | 6865 95% | 6578 99% | 7176 91% |
| Color Space (Percent of AdobeRGB 1998) (%) | 35.5 | 64.3 81% | 89.2 151% | 37.6 6% | 37.2 5% | 62 75% |
| Color Space (Percent of sRGB) (%) | 56.1 | 97.5 74% | 100 78% | 59.2 6% | 58.5 4% | 94 68% |
| Moyenne finale (programmes/paramètres) | 32% /
46% | 39% /
41% | -14% /
-3% | -4% /
-3% | 19% /
18% |
* ... Moindre est la valeur, meilleures sont les performances
Temps de réponse de l'écran
| ↔ Temps de réponse noir à blanc | ||
|---|---|---|
| 26.4 ms ... hausse ↗ et chute ↘ combinées | ↗ 14 ms hausse |  |
| ↘ 12.4 ms chute | ||
| L'écran souffre de latences relativement élevées, insuffisant pour le jeu. En comparaison, tous les appareils testés affichent entre 0.1 (minimum) et 240 (maximum) ms. » 66 % des appareils testés affichent de meilleures performances. Cela signifie que les latences relevées sont moins bonnes que la moyenne (19.8 ms) de tous les appareils testés. | ||
| ↔ Temps de réponse gris 50% à gris 80% | ||
| 29.6 ms ... hausse ↗ et chute ↘ combinées | ↗ 16.4 ms hausse | 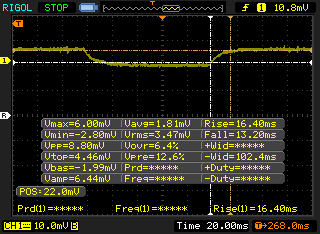 |
| ↘ 13.2 ms chute | ||
| L'écran souffre de latences relativement élevées, insuffisant pour le jeu. En comparaison, tous les appareils testés affichent entre 0.165 (minimum) et 636 (maximum) ms. » 40 % des appareils testés affichent de meilleures performances. Cela signifie que les latences relevées sont similaires à la moyenne (31 ms) de tous les appareils testés. | ||
Scintillement / MLI (Modulation de largeur d'impulsion)
| Scintillement / MLI (Modulation de largeur d'impulsion) non décelé | 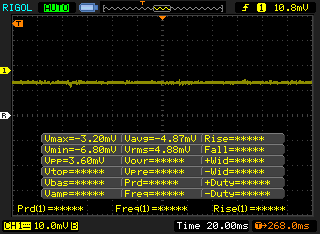 | ||
En comparaison, 52 % des appareils testés n'emploient pas MDI pour assombrir leur écran. Nous avons relevé une moyenne à 7754 (minimum : 5 - maximum : 343500) Hz dans le cas où une MDI était active. | |||
Cinebench R15: CPU Multi 64Bit | CPU Single 64Bit
Blender: v2.79 BMW27 CPU
7-Zip 18.03: 7z b 4 -mmt1 | 7z b 4
Geekbench 5.5: Single-Core | Multi-Core
HWBOT x265 Benchmark v2.2: 4k Preset
LibreOffice : 20 Documents To PDF
R Benchmark 2.5: Overall mean
| Cinebench R20 / CPU (Multi Core) | |
| MSI WS66 10TMT-207US | |
| Dell Precision 7550 | |
| Dell Precision 5550 P91F | |
| Moyenne Intel Core i9-10885H (2798 - 3762, n=3) | |
| Dell Precision 3000 3551 | |
| Acer ConceptD 3 Pro CN315-71P-73W1 | |
| Lenovo ThinkPad P1 2019-20QT000RGE | |
| HP ZBook Firefly 15 G7 | |
| Acer TravelMate P215-52 | |
| Cinebench R20 / CPU (Single Core) | |
| MSI WS66 10TMT-207US | |
| Dell Precision 5550 P91F | |
| Dell Precision 7550 | |
| Moyenne Intel Core i9-10885H (460 - 513, n=3) | |
| HP ZBook Firefly 15 G7 | |
| Dell Precision 3000 3551 | |
| Acer ConceptD 3 Pro CN315-71P-73W1 | |
| Lenovo ThinkPad P1 2019-20QT000RGE | |
| Acer TravelMate P215-52 | |
| Geekbench 5.5 / Single-Core | |
| MSI WS66 10TMT-207US | |
| Dell Precision 7550 | |
| Dell Precision 5550 P91F | |
| Moyenne Intel Core i9-10885H (1216 - 1376, n=3) | |
| HP ZBook Firefly 15 G7 | |
| Dell Precision 3000 3551 | |
| Acer ConceptD 3 Pro CN315-71P-73W1 | |
| Acer TravelMate P215-52 | |
| Geekbench 5.5 / Multi-Core | |
| Dell Precision 5550 P91F | |
| Dell Precision 7550 | |
| MSI WS66 10TMT-207US | |
| Moyenne Intel Core i9-10885H (6529 - 7693, n=3) | |
| Dell Precision 3000 3551 | |
| Acer ConceptD 3 Pro CN315-71P-73W1 | |
| HP ZBook Firefly 15 G7 | |
| Acer TravelMate P215-52 | |
| LibreOffice / 20 Documents To PDF | |
| HP ZBook Firefly 15 G7 | |
| Acer ConceptD 3 Pro CN315-71P-73W1 | |
| Acer TravelMate P215-52 | |
| Moyenne Intel Core i9-10885H (45.9 - 59.6, n=3) | |
| Dell Precision 7550 | |
| Dell Precision 3000 3551 | |
| MSI WS66 10TMT-207US | |
| Dell Precision 5550 P91F | |
| R Benchmark 2.5 / Overall mean | |
| Acer TravelMate P215-52 | |
| Acer ConceptD 3 Pro CN315-71P-73W1 | |
| HP ZBook Firefly 15 G7 | |
| Dell Precision 5550 P91F | |
| MSI WS66 10TMT-207US | |
| Dell Precision 3000 3551 | |
| Dell Precision 7550 | |
| Moyenne Intel Core i9-10885H (0.564 - 0.572, n=3) | |
Cinebench R15: CPU Multi 64Bit | CPU Single 64Bit
Blender: v2.79 BMW27 CPU
7-Zip 18.03: 7z b 4 -mmt1 | 7z b 4
Geekbench 5.5: Single-Core | Multi-Core
HWBOT x265 Benchmark v2.2: 4k Preset
LibreOffice : 20 Documents To PDF
R Benchmark 2.5: Overall mean
* ... Moindre est la valeur, meilleures sont les performances
| PCMark 8 Home Score Accelerated v2 | 4246 points | |
| PCMark 8 Work Score Accelerated v2 | 5287 points | |
| PCMark 10 Score | 5127 points | |
Aide | ||
| DPC Latencies / LatencyMon - interrupt to process latency (max), Web, Youtube, Prime95 | |
| Dell Precision 7550 | |
| HP ZBook Firefly 15 G7 | |
| MSI WS66 10TMT-207US | |
| Dell Precision 3000 3551 | |
| Dell Precision 5000 5750 P92F | |
| Dell Precision 5550 P91F | |
* ... Moindre est la valeur, meilleures sont les performances
| Dell Precision 3000 3551 Toshiba Kioxia XG6 KXG60PNV512G | HP ZBook Firefly 15 G7 Toshiba XG6 KXG60ZNV1T02 | Dell Precision 5550 P91F SK Hynix PC601A NVMe 1TB | Lenovo ThinkPad P53s-20N6001NGE Intel SSD 760p SSDPEKKW256G8 | MSI WP65 Samsung SSD PM981 MZVLB512HAJQ | Dell Precision 3530 SK hynix PC400 512 GB | |
|---|---|---|---|---|---|---|
| AS SSD | 13% | -53% | 4% | 10% | -13% | |
| Seq Read (MB/s) | 1833 | 2666 45% | 2039 11% | 2283 25% | 1097 -40% | 2682 46% |
| Seq Write (MB/s) | 1283 | 1257 -2% | 1376 7% | 1042 -19% | 1838 43% | 1272 -1% |
| 4K Read (MB/s) | 44.56 | 48.04 8% | 44.11 -1% | 46.62 5% | 52.9 19% | 25.98 -42% |
| 4K Write (MB/s) | 112.4 | 137.5 22% | 113.3 1% | 172.6 54% | 108.4 -4% | 102.8 -9% |
| 4K-64 Read (MB/s) | 1106 | 977 -12% | 1094 -1% | 759 -31% | 1509 36% | 994 -10% |
| 4K-64 Write (MB/s) | 1262 | 1142 -10% | 1630 29% | 916 -27% | 1695 34% | 908 -28% |
| Access Time Read * (ms) | 0.084 | 0.053 37% | 0.059 30% | 0.06 29% | 0.067 20% | 0.099 -18% |
| Access Time Write * (ms) | 0.105 | 0.03 71% | 0.99 -843% | 0.022 79% | 0.103 2% | 0.053 50% |
| Score Read (Points) | 1334 | 1292 -3% | 1342 1% | 1034 -22% | 1671 25% | 1288 -3% |
| Score Write (Points) | 1503 | 1406 -6% | 1881 25% | 1192 -21% | 1988 32% | 1138 -24% |
| Score Total (Points) | 3498 | 3297 -6% | 3883 11% | 2705 -23% | 4558 30% | 3013 -14% |
| Copy ISO MB/s (MB/s) | 2940 | 2489 -15% | 1800 -39% | 1701 -42% | ||
| Copy Program MB/s (MB/s) | 733 | 682 -7% | 569 -22% | 346.1 -53% | ||
| Copy Game MB/s (MB/s) | 1442 | 1515 5% | 1409 -2% | 1050 -27% | ||
| CrystalDiskMark 5.2 / 6 | 8% | -2% | 16% | 3% | -14% | |
| Write 4K (MB/s) | 120.9 | 133.1 10% | 122.6 1% | 195.9 62% | 126.9 5% | 113.6 -6% |
| Read 4K (MB/s) | 46.79 | 51.6 10% | 42.4 -9% | 74.9 60% | 44.91 -4% | 41.18 -12% |
| Write Seq (MB/s) | 1916 | 1986 4% | 2167 13% | 1194 -38% | 1944 1% | 1417 -26% |
| Read Seq (MB/s) | 2216 | 2208 0% | 1747 -21% | 2309 4% | 1449 -35% | 1896 -14% |
| Write 4K Q32T1 (MB/s) | 393.9 | 462.3 17% | 388.8 -1% | 507 29% | 531 35% | 355 -10% |
| Read 4K Q32T1 (MB/s) | 375.1 | 400.2 7% | 367.3 -2% | 624 66% | 579 54% | 404.3 8% |
| Write Seq Q32T1 (MB/s) | 2795 | 3074 10% | 2629 -6% | 1206 -57% | 1970 -30% | 1411 -50% |
| Read Seq Q32T1 (MB/s) | 3106 | 3268 5% | 3460 11% | 3091 0% | 2990 -4% | 3095 0% |
| Moyenne finale (programmes/paramètres) | 11% /
11% | -28% /
-35% | 10% /
9% | 7% /
7% | -14% /
-13% |
* ... Moindre est la valeur, meilleures sont les performances

Disk Throttling: DiskSpd Read Loop, Queue Depth 8
| 3DMark 06 Standard Score | 35322 points | |
| 3DMark 11 Performance | 6519 points | |
| 3DMark Cloud Gate Standard Score | 24082 points | |
| 3DMark Fire Strike Score | 4402 points | |
| 3DMark Time Spy Score | 1593 points | |
Aide | ||
| Bas | Moyen | Élevé | Ultra | |
|---|---|---|---|---|
| The Witcher 3 (2015) | 90.7 | 51.7 | 31.5 | 16.5 |
| Dota 2 Reborn (2015) | 156 | 139 | 90.2 | 82.8 |
| Final Fantasy XV Benchmark (2018) | 51.7 | 25.8 | 18.5 | |
| X-Plane 11.11 (2018) | 104 | 71.3 | 63.9 |
| Dell Precision 3000 3551 Quadro P620, i9-10885H, Toshiba Kioxia XG6 KXG60PNV512G | HP ZBook Firefly 15 G7 Quadro P520, i7-10610U, Toshiba XG6 KXG60ZNV1T02 | Dell Precision 5550 P91F Quadro T2000 Max-Q, i7-10875H, SK Hynix PC601A NVMe 1TB | Lenovo ThinkPad P53s-20N6001NGE Quadro P520, i7-8565U, Intel SSD 760p SSDPEKKW256G8 | MSI WP65 Quadro P620, i7-9750H, Samsung SSD PM981 MZVLB512HAJQ | Dell Precision 3530 Quadro P600, E-2176M, SK hynix PC400 512 GB | |
|---|---|---|---|---|---|---|
| Noise | 6% | 4% | 3% | -11% | -3% | |
| arrêt / environnement * (dB) | 25.8 | 29.3 -14% | 26.2 -2% | 29.2 -13% | 28.7 -11% | 28.1 -9% |
| Idle Minimum * (dB) | 26.2 | 29.3 -12% | 26.2 -0% | 29.2 -11% | 33.4 -27% | 28.3 -8% |
| Idle Average * (dB) | 26.2 | 29.3 -12% | 26.2 -0% | 29.2 -11% | 33.5 -28% | 28.3 -8% |
| Idle Maximum * (dB) | 26.2 | 30 -15% | 26.2 -0% | 30.8 -18% | 33.5 -28% | 28.4 -8% |
| Load Average * (dB) | 51.2 | 32.8 36% | 39.2 23% | 32.6 36% | 37 28% | 46.2 10% |
| Witcher 3 ultra * (dB) | 42.7 | 32.8 23% | 39 9% | 38.7 9% | ||
| Load Maximum * (dB) | 50.7 | 32.8 35% | 50.6 -0% | 33.8 33% | 59.5 -17% | 48.6 4% |
* ... Moindre est la valeur, meilleures sont les performances
Degré de la nuisance sonore
| Au repos |
| 26.2 / 26.2 / 26.2 dB(A) |
| Fortement sollicité |
| 51.2 / 50.7 dB(A) |
 | ||
30 dB silencieux 40 dB(A) audible 50 dB(A) bruyant |
||
min: | ||
(-) La température maximale du côté supérieur est de 47 °C / 117 F, par rapport à la moyenne de 38.2 °C / 101 F, allant de 22.2 à 69.8 °C pour la classe Workstation.
(-) Le fond chauffe jusqu'à un maximum de 54.6 °C / 130 F, contre une moyenne de 41.1 °C / 106 F
(+) En utilisation inactive, la température moyenne du côté supérieur est de 26.3 °C / 79 F, par rapport à la moyenne du dispositif de 32 °C / 90 F.
(±) En jouant à The Witcher 3, la température moyenne du côté supérieur est de 35.1 °C / 95 F, alors que la moyenne de l'appareil est de 32 °C / 90 F.
(+) Les repose-poignets et le pavé tactile sont plus froids que la température de la peau avec un maximum de 27.4 °C / 81.3 F et sont donc froids au toucher.
(±) La température moyenne de la zone de l'appui-paume de dispositifs similaires était de 27.8 °C / 82 F (+0.4 °C / #0.7 F).
Dell Precision 3000 3551 analyse audio
(+) | les haut-parleurs peuvent jouer relativement fort (84.5# dB)
Basses 100 - 315 Hz
(-) | presque aucune basse - en moyenne 19.8% plus bas que la médiane
(±) | la linéarité des basses est moyenne (10.1% delta à la fréquence précédente)
Médiums 400 - 2000 Hz
(+) | médiane équilibrée - seulement 4% de la médiane
(+) | les médiums sont linéaires (5.4% delta à la fréquence précédente)
Aiguës 2 - 16 kHz
(+) | des sommets équilibrés - à seulement 3.4% de la médiane
(+) | les aigus sont linéaires (2.9% delta à la fréquence précédente)
Globalement 100 - 16 000 Hz
(±) | la linéarité du son global est moyenne (15.5% de différence avec la médiane)
Par rapport à la même classe
» 35% de tous les appareils testés de cette catégorie étaient meilleurs, 10% similaires, 55% pires
» Le meilleur avait un delta de 7%, la moyenne était de 17%, le pire était de 35%.
Par rapport à tous les appareils testés
» 23% de tous les appareils testés étaient meilleurs, 4% similaires, 73% pires
» Le meilleur avait un delta de 4%, la moyenne était de 23%, le pire était de 134%.
Apple MacBook 12 (Early 2016) 1.1 GHz analyse audio
(+) | les haut-parleurs peuvent jouer relativement fort (83.6# dB)
Basses 100 - 315 Hz
(±) | basse réduite - en moyenne 11.3% inférieure à la médiane
(±) | la linéarité des basses est moyenne (14.2% delta à la fréquence précédente)
Médiums 400 - 2000 Hz
(+) | médiane équilibrée - seulement 2.4% de la médiane
(+) | les médiums sont linéaires (5.5% delta à la fréquence précédente)
Aiguës 2 - 16 kHz
(+) | des sommets équilibrés - à seulement 2% de la médiane
(+) | les aigus sont linéaires (4.5% delta à la fréquence précédente)
Globalement 100 - 16 000 Hz
(+) | le son global est linéaire (10.2% différence à la médiane)
Par rapport à la même classe
» 7% de tous les appareils testés de cette catégorie étaient meilleurs, 2% similaires, 90% pires
» Le meilleur avait un delta de 5%, la moyenne était de 18%, le pire était de 53%.
Par rapport à tous les appareils testés
» 5% de tous les appareils testés étaient meilleurs, 1% similaires, 94% pires
» Le meilleur avait un delta de 4%, la moyenne était de 23%, le pire était de 134%.
| Éteint/en veille | |
| Au repos | |
| Fortement sollicité |
|
Légende:
min: | |
| Dell Precision 3000 3551 i9-10885H, Quadro P620, Toshiba Kioxia XG6 KXG60PNV512G, IPS, 1920x1080, 15.6" | HP ZBook Firefly 15 G7 i7-10610U, Quadro P520, Toshiba XG6 KXG60ZNV1T02, IPS LED, 3840x2160, 15.6" | Dell Precision 5550 P91F i7-10875H, Quadro T2000 Max-Q, SK Hynix PC601A NVMe 1TB, IPS, 3840x2400, 15.6" | Lenovo ThinkPad P53s-20N6001NGE i7-8565U, Quadro P520, Intel SSD 760p SSDPEKKW256G8, IPS, 1920x1080, 15.6" | MSI WP65 i7-9750H, Quadro P620, Samsung SSD PM981 MZVLB512HAJQ, IPS, 1920x1080, 15.6" | Dell Precision 3530 E-2176M, Quadro P600, SK hynix PC400 512 GB, IPS, 1920x1080, 15.6" | |
|---|---|---|---|---|---|---|
| Power Consumption | 26% | -31% | 33% | -43% | -10% | |
| Idle Minimum * (Watt) | 5.7 | 3.5 39% | 5.6 2% | 2.74 52% | 5.6 2% | 5.3 7% |
| Idle Average * (Watt) | 8.7 | 6.7 23% | 11.2 -29% | 6.4 26% | 8.6 1% | 10.7 -23% |
| Idle Maximum * (Watt) | 9 | 9.6 -7% | 18.4 -104% | 9.7 -8% | 30.7 -241% | 14.1 -57% |
| Load Average * (Watt) | 100.2 | 60 40% | 114 -14% | 55.2 45% | 78 22% | 85.4 15% |
| Witcher 3 ultra * (Watt) | 56 | 49.3 12% | 76.7 -37% | 63.5 -13% | 75.5 -35% | |
| Load Maximum * (Watt) | 133.2 | 68.6 48% | 134.2 -1% | 69.4 48% | 170.2 -28% | 91.9 31% |
* ... Moindre est la valeur, meilleures sont les performances
| Dell Precision 3000 3551 i9-10885H, Quadro P620, 97 Wh | HP ZBook Firefly 15 G7 i7-10610U, Quadro P520, 53 Wh | Dell Precision 5550 P91F i7-10875H, Quadro T2000 Max-Q, 86 Wh | Lenovo ThinkPad P53s-20N6001NGE i7-8565U, Quadro P520, 57 Wh | MSI WP65 i7-9750H, Quadro P620, 51 Wh | Dell Precision 3530 E-2176M, Quadro P600, 92 Wh | |
|---|---|---|---|---|---|---|
| Autonomie de la batterie | -33% | -34% | -37% | -56% | -32% | |
| WiFi v1.3 (h) | 13.6 | 9.1 -33% | 9 -34% | 8.6 -37% | 6 -56% | 9.3 -32% |
| Load (h) | 2 | 1.4 | 2.5 | 0.6 | 1.6 | |
| Reader / Idle (h) | 22.6 | 25.2 | 10.1 | 18.8 |
Points positifs
Points négatifs
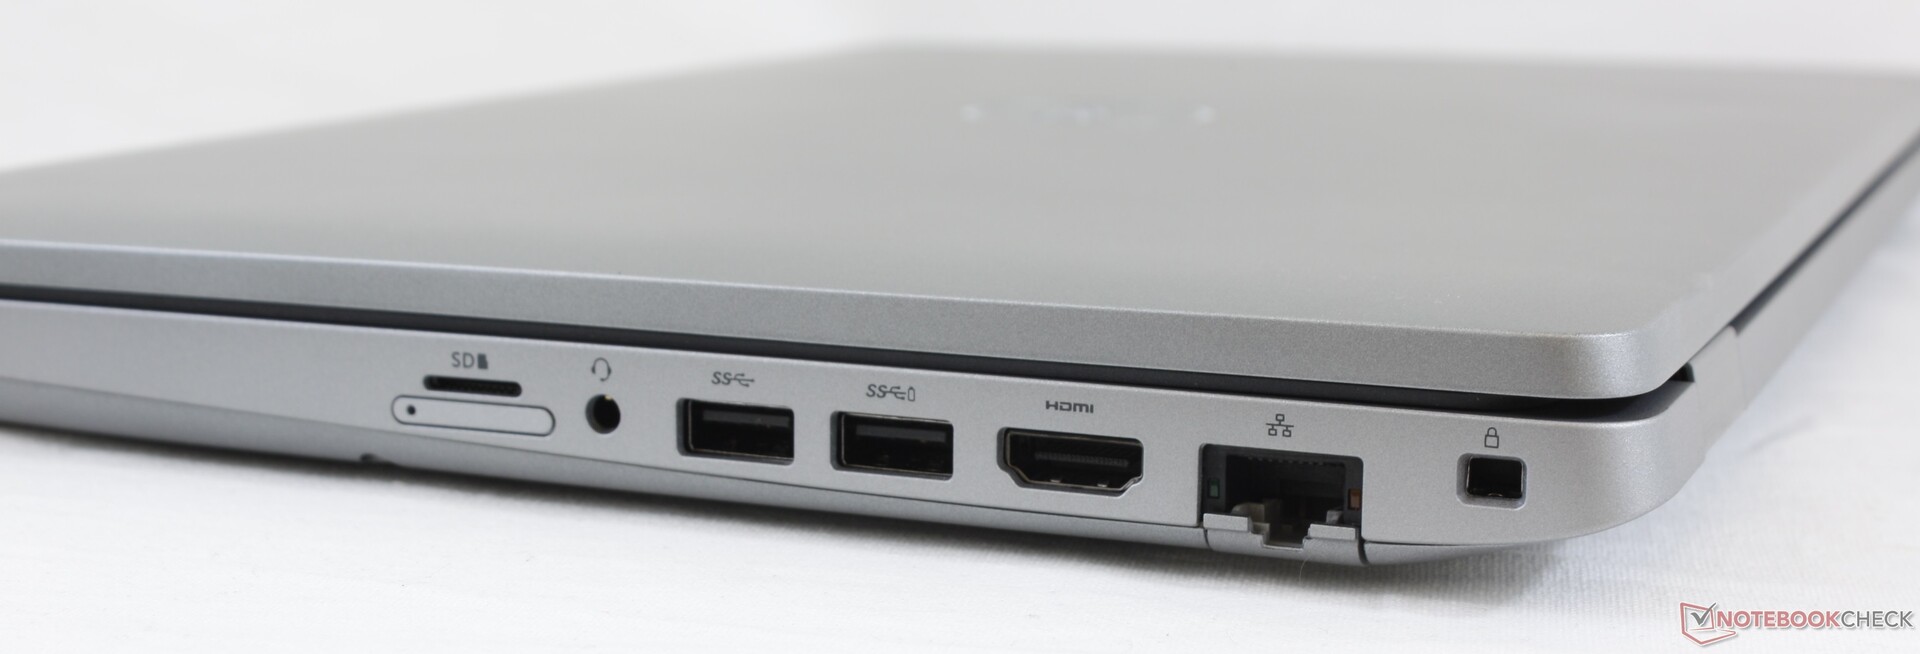
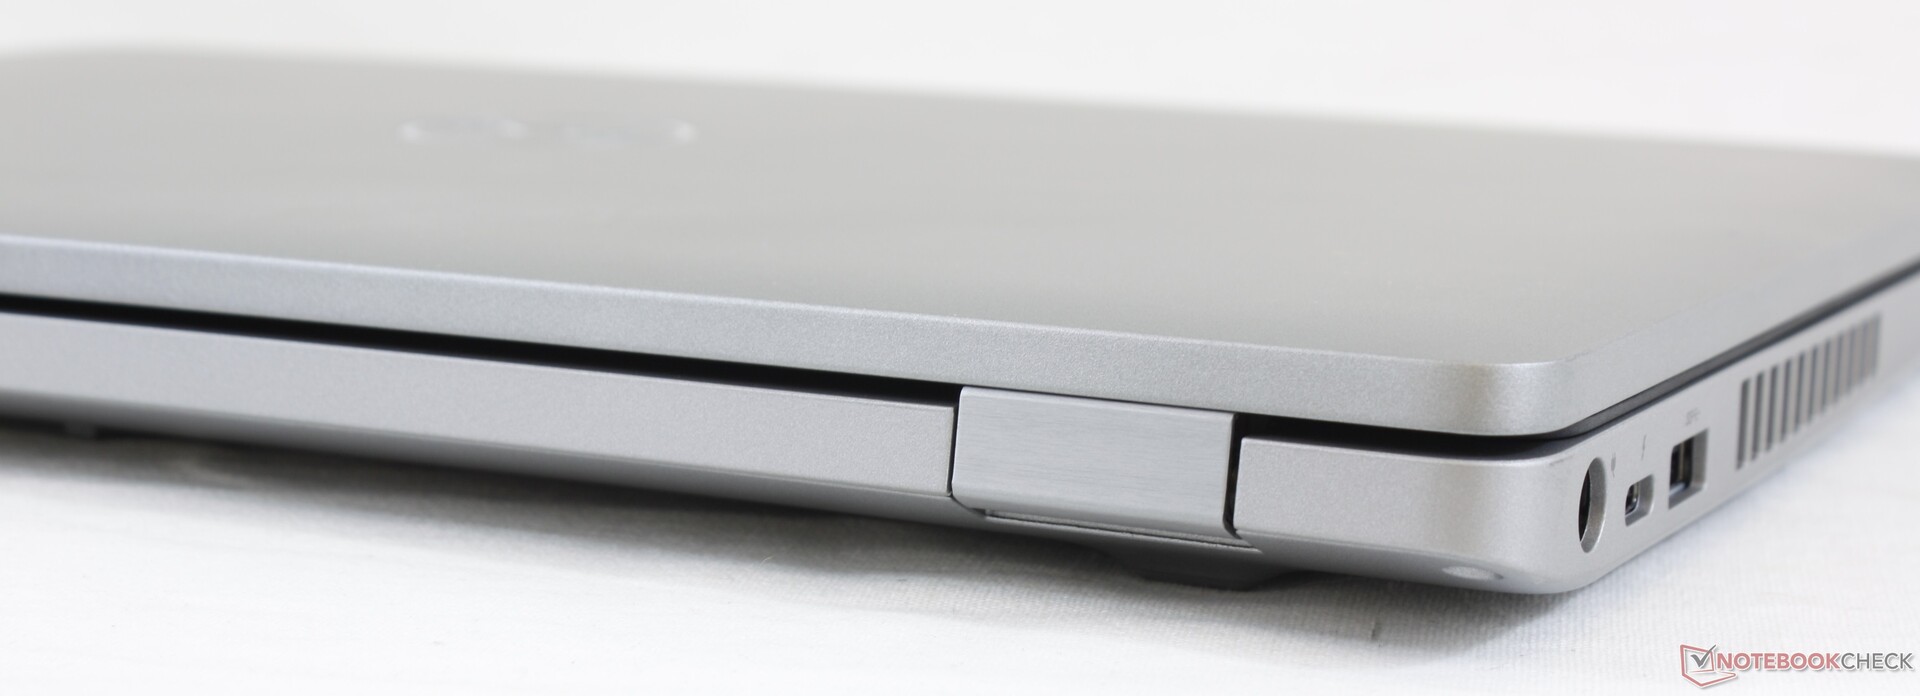
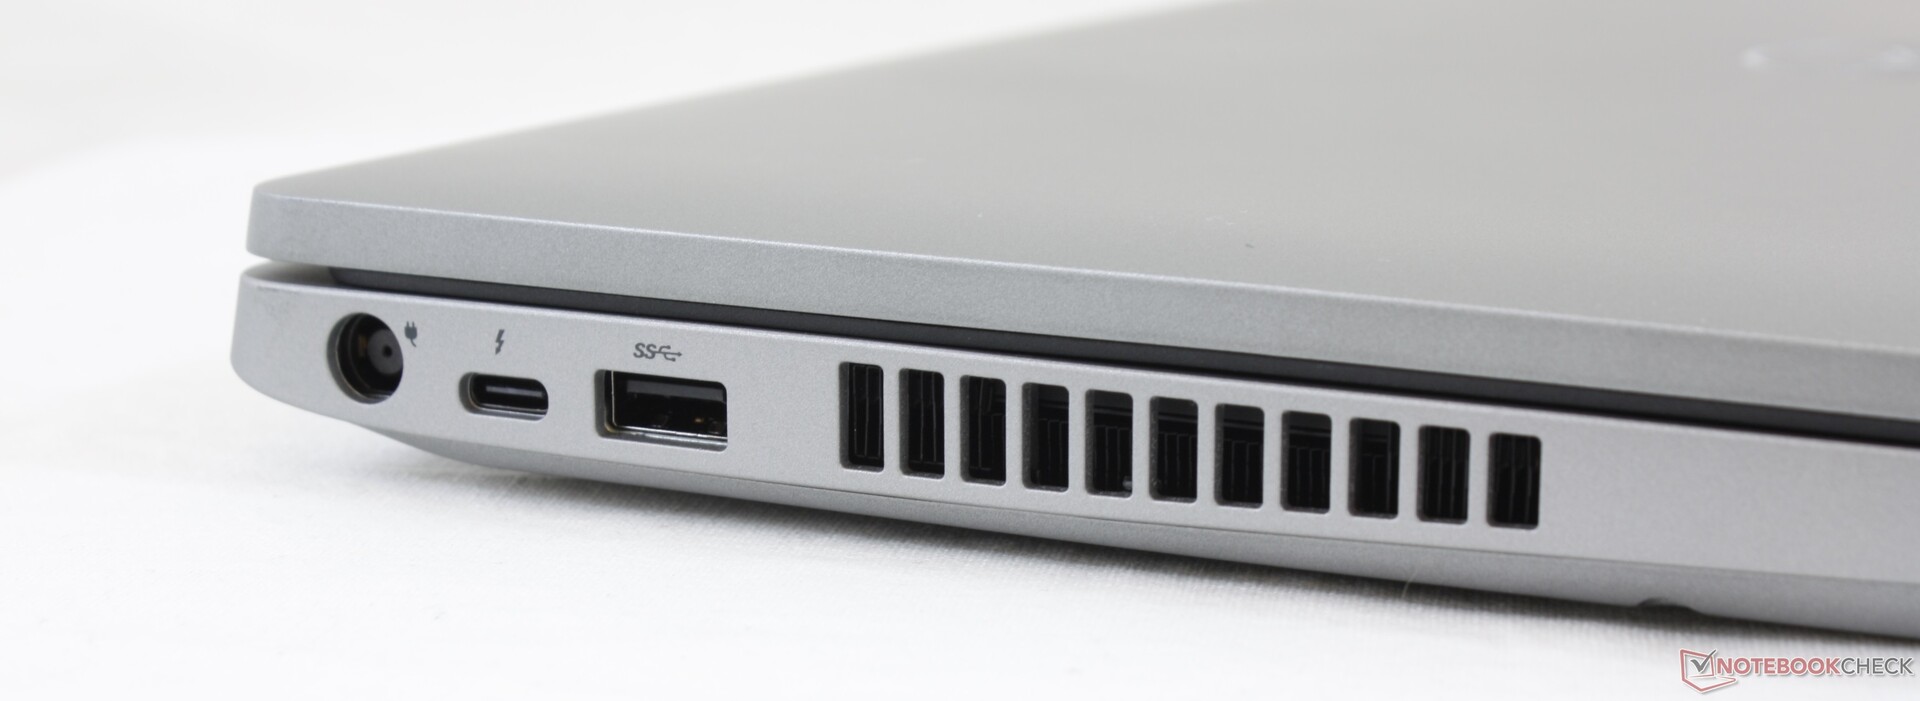
Le Precision 3551 possède les éléments de base d'une station de travail classique. TrackPoint, boutons de souris dédiés, carte à puce, WWAN, maintenance aisée, et nombre d'autres fonctionnalités dont un double stockage. Le Thunderbolt 3 est également de la partie, appréciable pour ce qui peut être considéré comme une station de travail "d'entrée de gamme". Si la connectivité et l'efficacité sont importants, alors le Precision 3551 sans fioritures sera un bon choix à prix contenu.
La station de travail devient moins séduisante quand on parle des performances et du design. Les graphismes sont limités à l'ancienne Quadro P620, et le Core i9-10885H aurait pu faire mieux en ce qui concerne la stabilité du Turbo Boost. L'allure est fonctionnelle, mais également terne. Il faudra regarder du côté des Precision 5000 ou 7000 plus chers pour avoir une machine plus fine et plus performante.
Ports nombreux et machine pratique, même si les performances graphiques restent limitées, et le design daté.
L’intégralité de cette critique est disponible en anglais en suivant ce lien.
Dell Precision 3000 3551
- 10/09/2020 v7 (old)
Allen Ngo
Price comparison
