Test du Lenovo ThinkPad E16 G1 Intel : le Core i5 au coude à coude avec le Ryzen 7 d'AMD

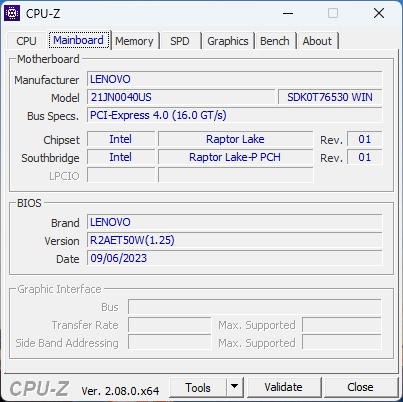
La série ThinkPad E se compose de modèles abordables destinés aux utilisateurs professionnels, contrairement à la série ThinkPad T, plus luxueuse, ou à la série ThinkPad X, plus élégante. Cette année marque l'introduction de la famille ThinkPad E16 de 16 pouces, qui vient compléter les ThinkPad E14 de 14 pouces Test du Lenovo ThinkPad E14 G5 Intel : le Core i7-1355U face au Ryzen 7 7730U et les ThinkPad E15 de 15 pouces Test du Lenovo ThinkPad E15 G3 AMD : PC portable professionnel bon marché avec Ryzen 7 . Deux versions du ThinkPad E16 sont disponibles au lancement, avec des processeurs Intel ou AMD. Nous avons récemment examiné la version AMD Ryzen 7 du ThinkPad E16, et le moment est venu de jeter un coup d'œil à la version Intel Core i5 du ThinkPad E16 pour voir ce qui les différencie l'une de l'autre.
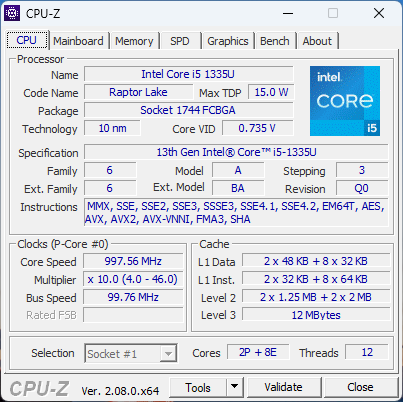
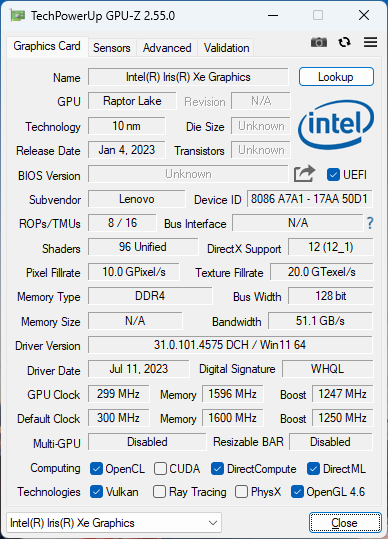
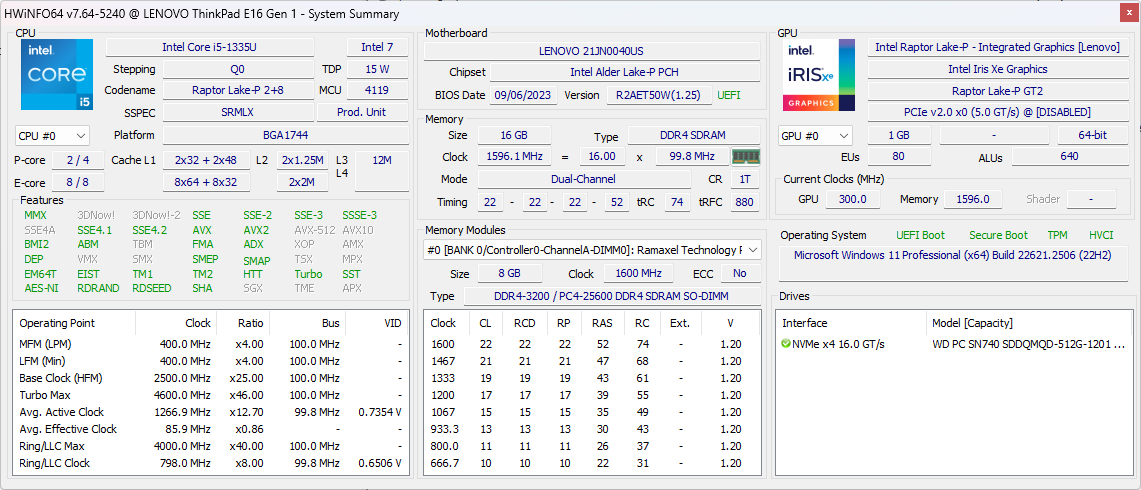
Le ThinkPad E16 que nous avons testé est une configuration bas de gamme avec le Core i5-1335U et l'écran tactile 1200p, pour un prix de détail de 800 à 900 dollars US. D'autres configurations peuvent aller jusqu'au Core i7-1365U, Core i7-1360P, ou même le Core i7-13700H avec des graphiques discrets GeForce MX550 et un écran 1600p de plus haute résolution pour des prix beaucoup plus élevés. Ces options ne sont pas encore disponibles au moment de la publication.
Parmi les alternatives au ThinkPad E16 figurent d'autres ordinateurs portables multimédias ou professionnels de 16 pouces, comme le Acer TravelMate P4, Samsung Galaxy Book3 Pro 16, ou LG Gram 16. Nous vous recommandons de consulter notre avis sur le ThinkPad E16 G1 version AMD car notre version Intel partage le même design de châssis et les mêmes caractéristiques physiques.
Plus de commentaires sur Lenovo :
Comparaison avec les concurrents potentiels
Note | Date | Modèle | Poids | Épaisseur | Taille | Résolution | Prix |
|---|---|---|---|---|---|---|---|
| 85.5 % v7 (old) | 11/23 | Lenovo ThinkPad E16 G1 Core i5-1335U i5-1335U, Iris Xe G7 80EUs | 1.8 kg | 19.85 mm | 16.00" | 1920x1200 | |
| 88.1 % v7 (old) | 09/23 | Lenovo ThinkPad E16 G1-21JUS08X00 R7 7730U, Vega 8 | 1.8 kg | 19.85 mm | 16.00" | 2560x1600 | |
| 84.6 % v7 (old) | 07/23 | Dell Inspiron 16 7635 2-in-1 R5 7530U, Vega 7 | 2 kg | 18.99 mm | 16.00" | 1920x1200 | |
| 86 % v7 (old) | 04/23 | Acer TravelMate P4 TMP416-51-55KN i5-1240P, Iris Xe G7 80EUs | 1.6 kg | 18.5 mm | 16.00" | 1920x1200 | |
| 85.6 % v7 (old) | 05/23 | Samsung Galaxy Book3 Pro 16 i5-1340P, Iris Xe G7 80EUs | 1.6 kg | 12.5 mm | 16.00" | 2880x1800 | |
| 86.6 % v7 (old) | 01/23 | LG Gram 16Z90Q i7-1260P, Iris Xe G7 96EUs | 1.2 kg | 16.8 mm | 16.00" | 2560x1600 |
Cas
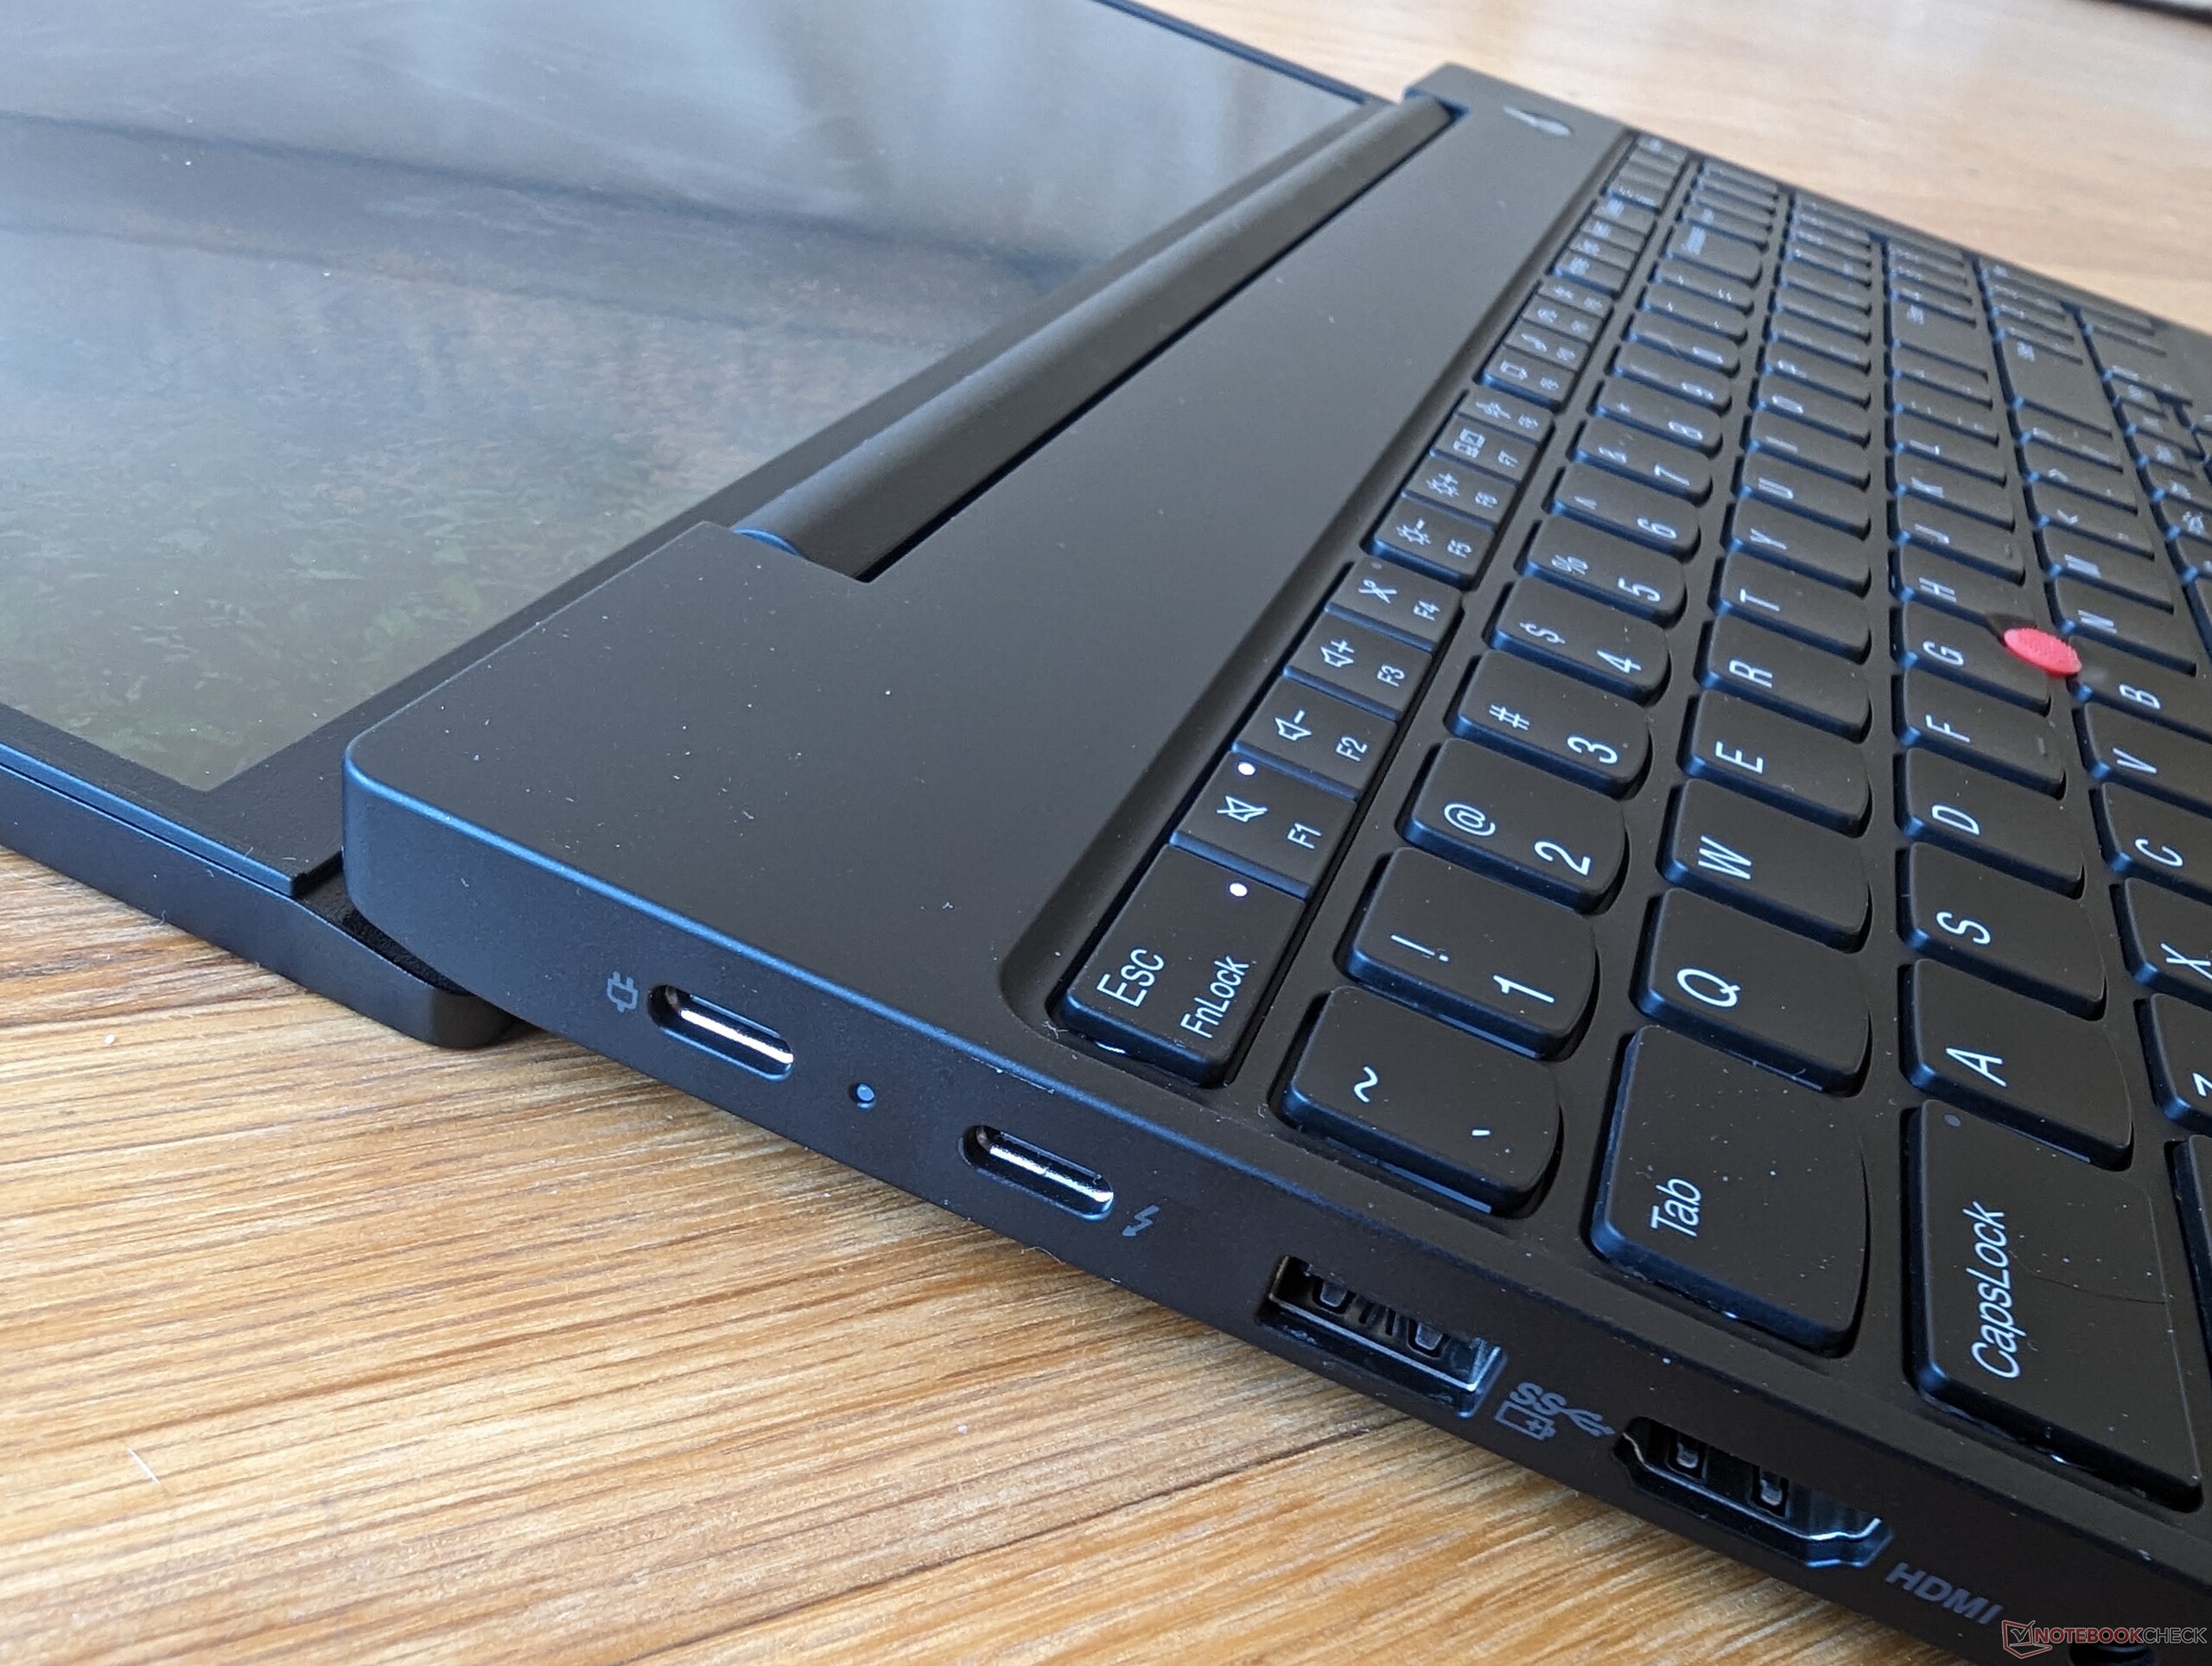
Le moyen le plus simple d'identifier une version Intel d'une version AMD est de rechercher le logo Thunderbolt sur le bord gauche. Thunderbolt n'est supporté que par les versions Intel, car les versions AMD actuelles ne sont pas livrées avec USB4.
Communication
Webcam


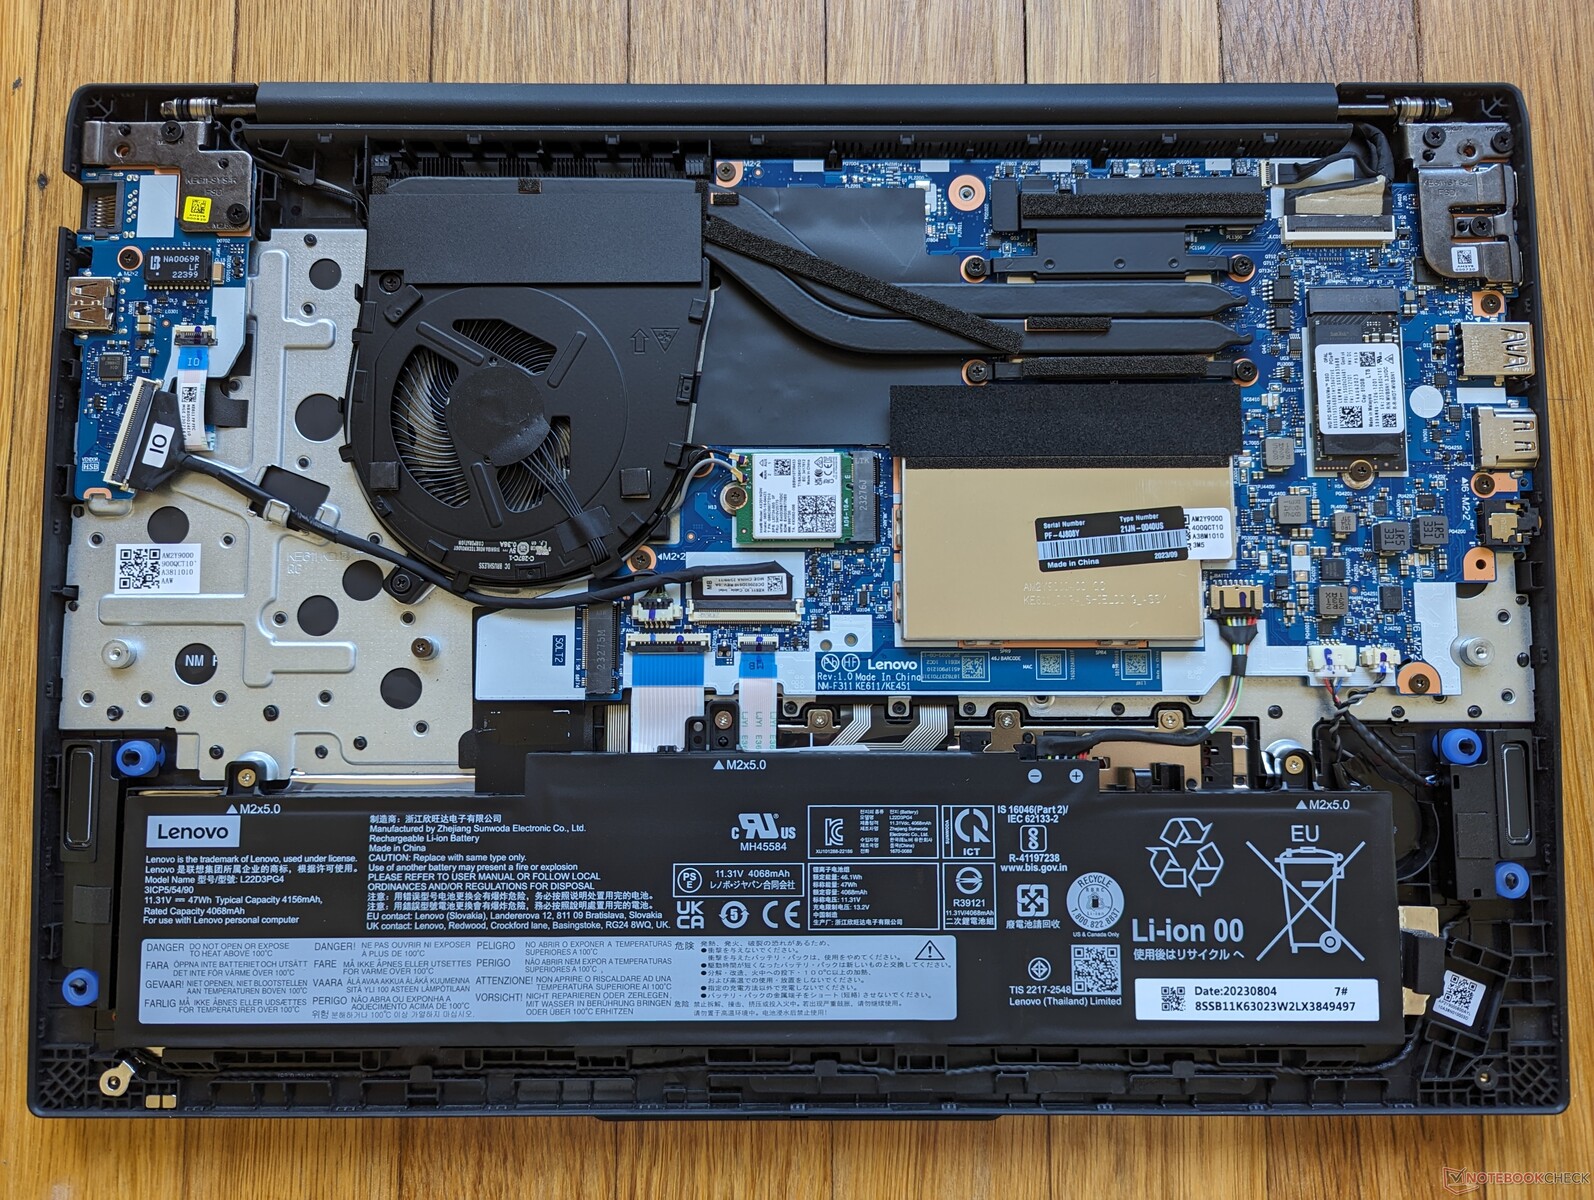
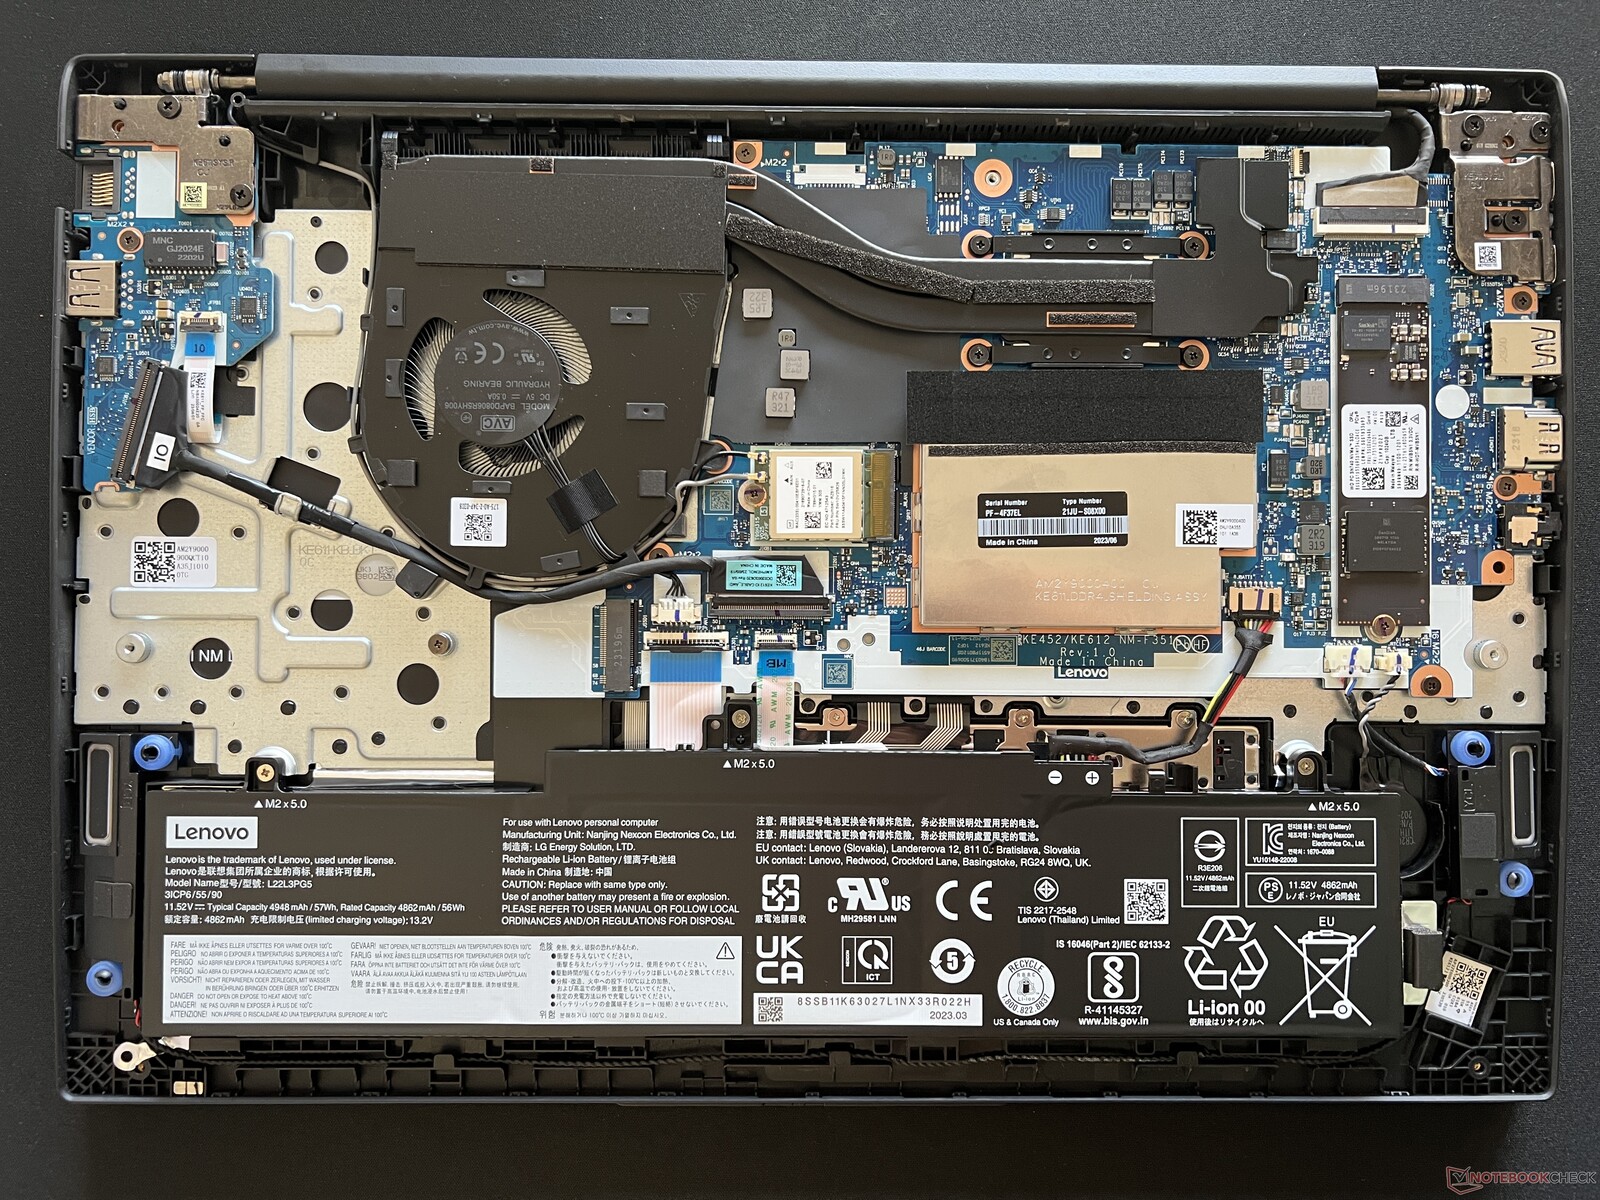
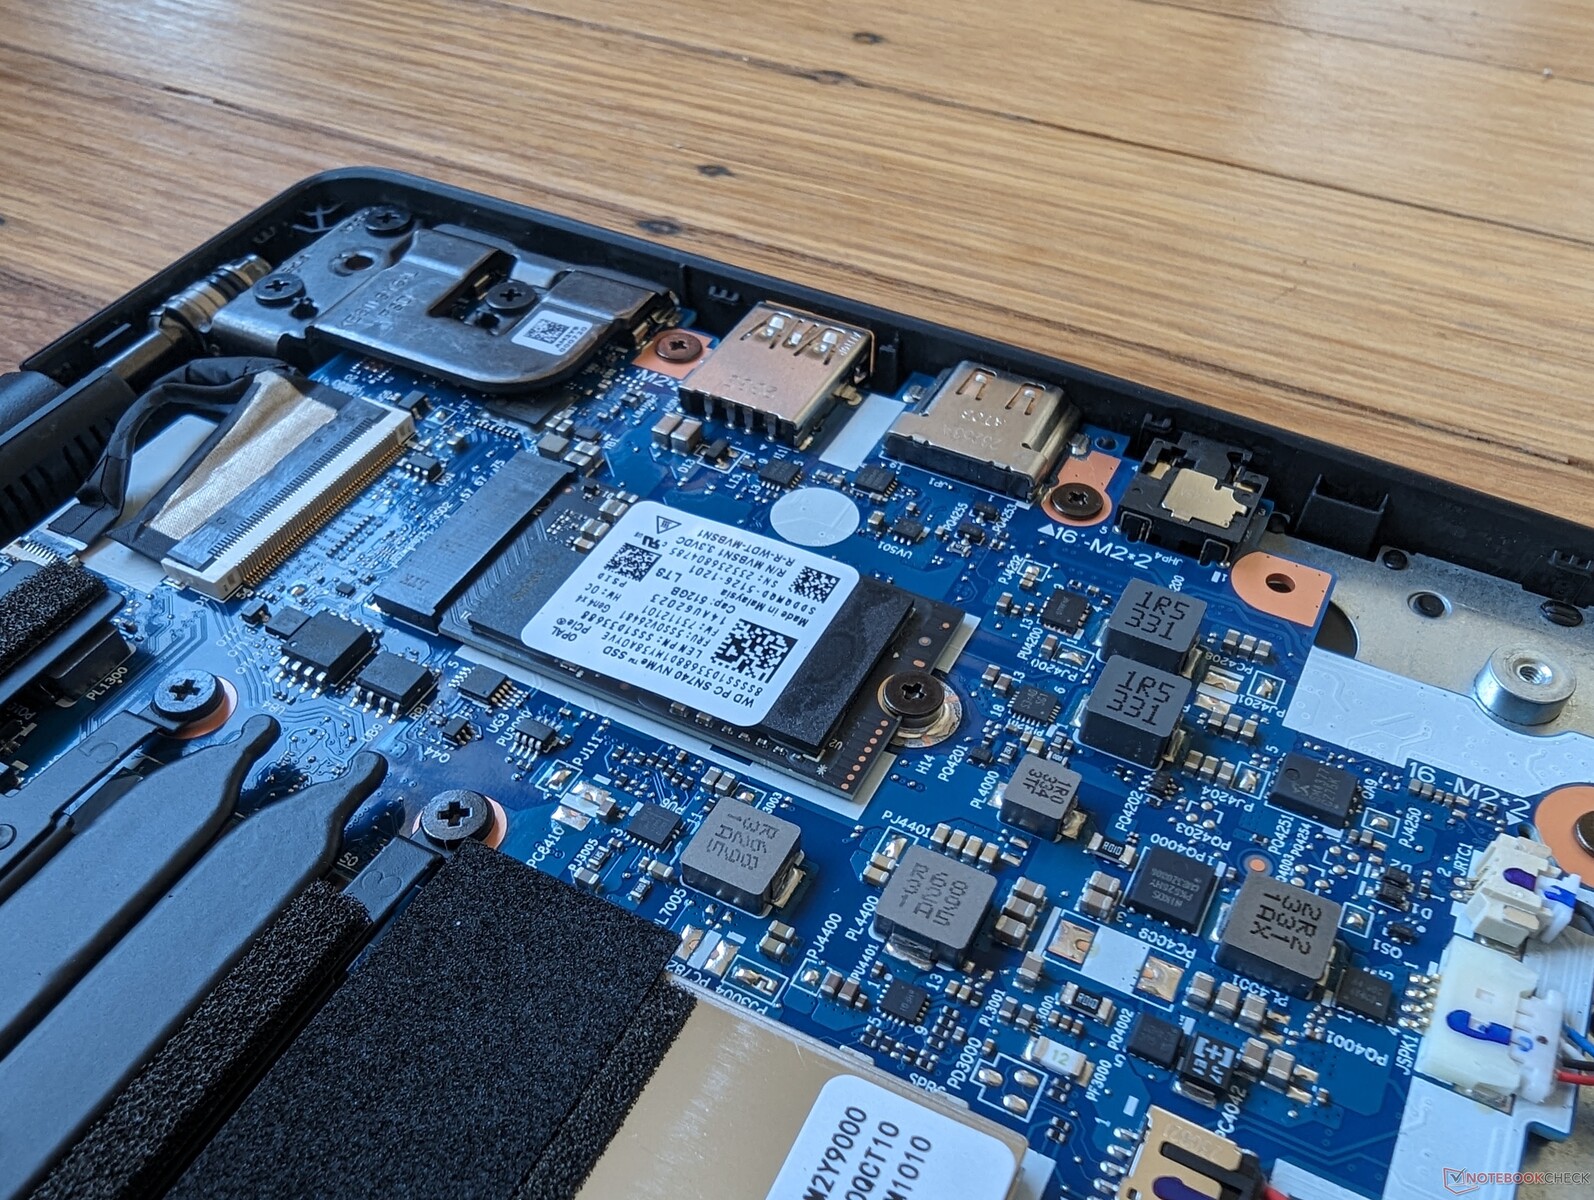
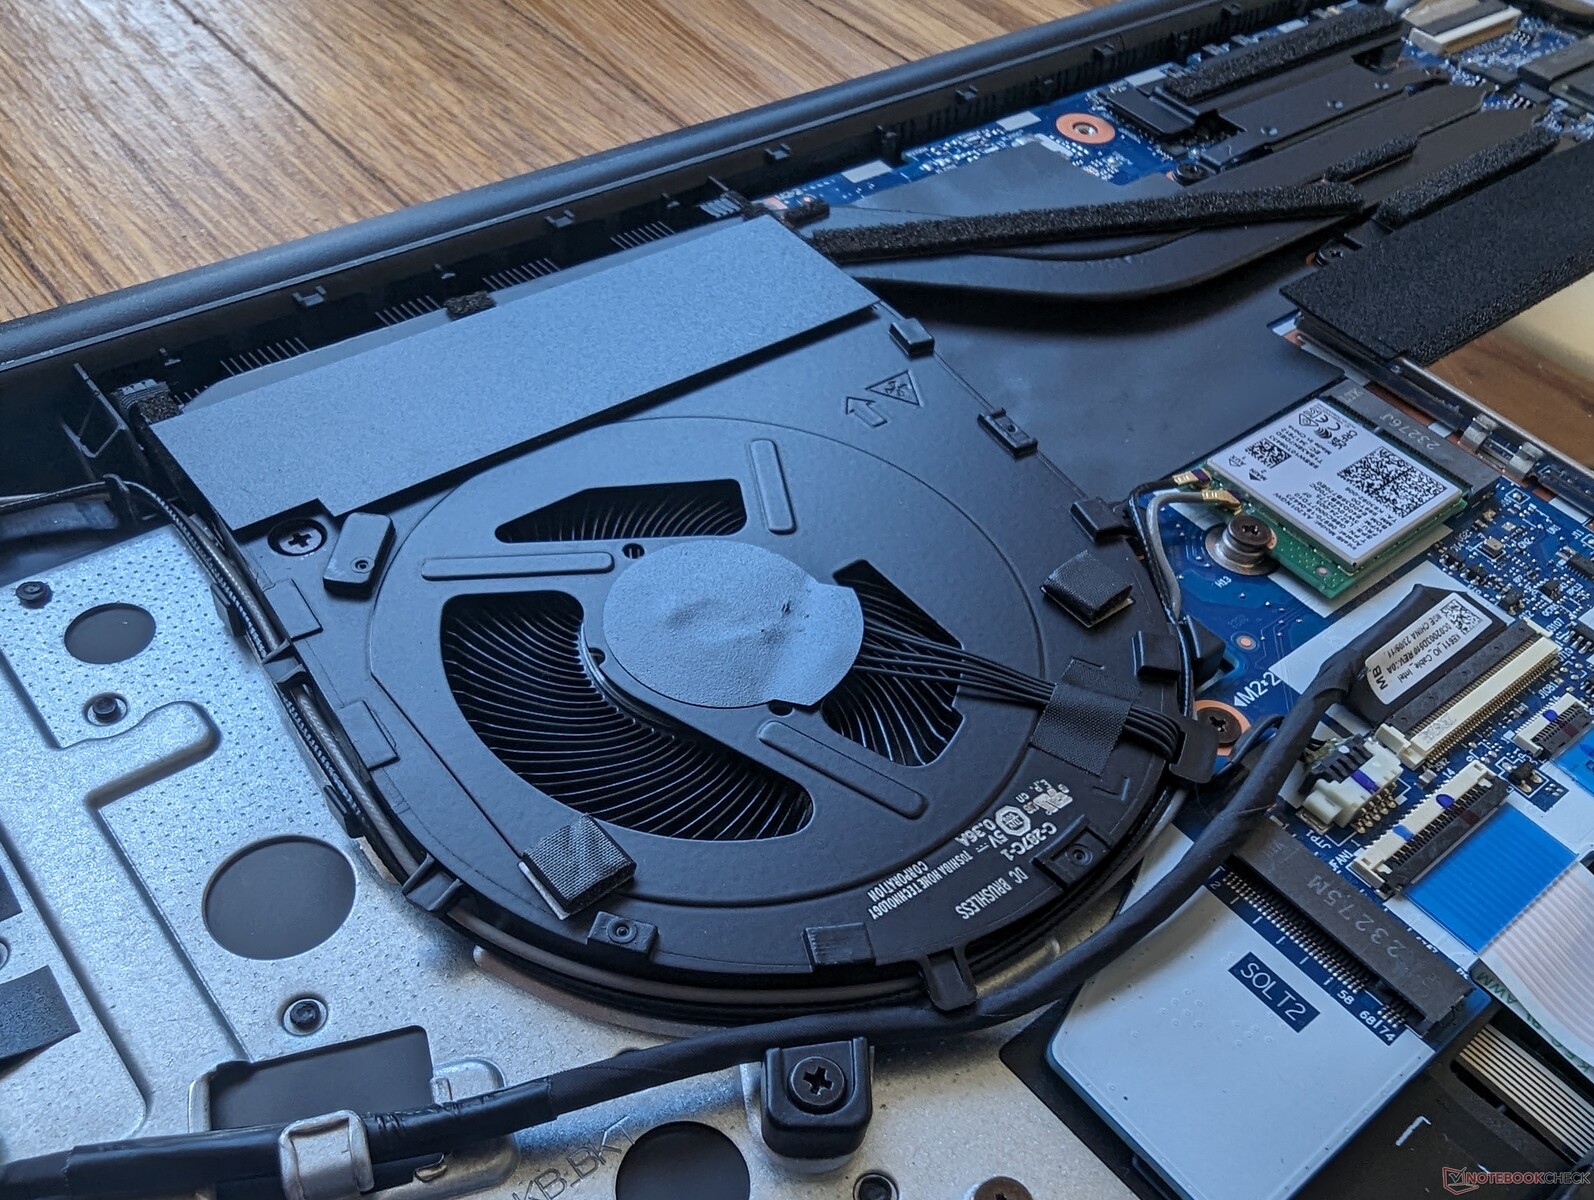
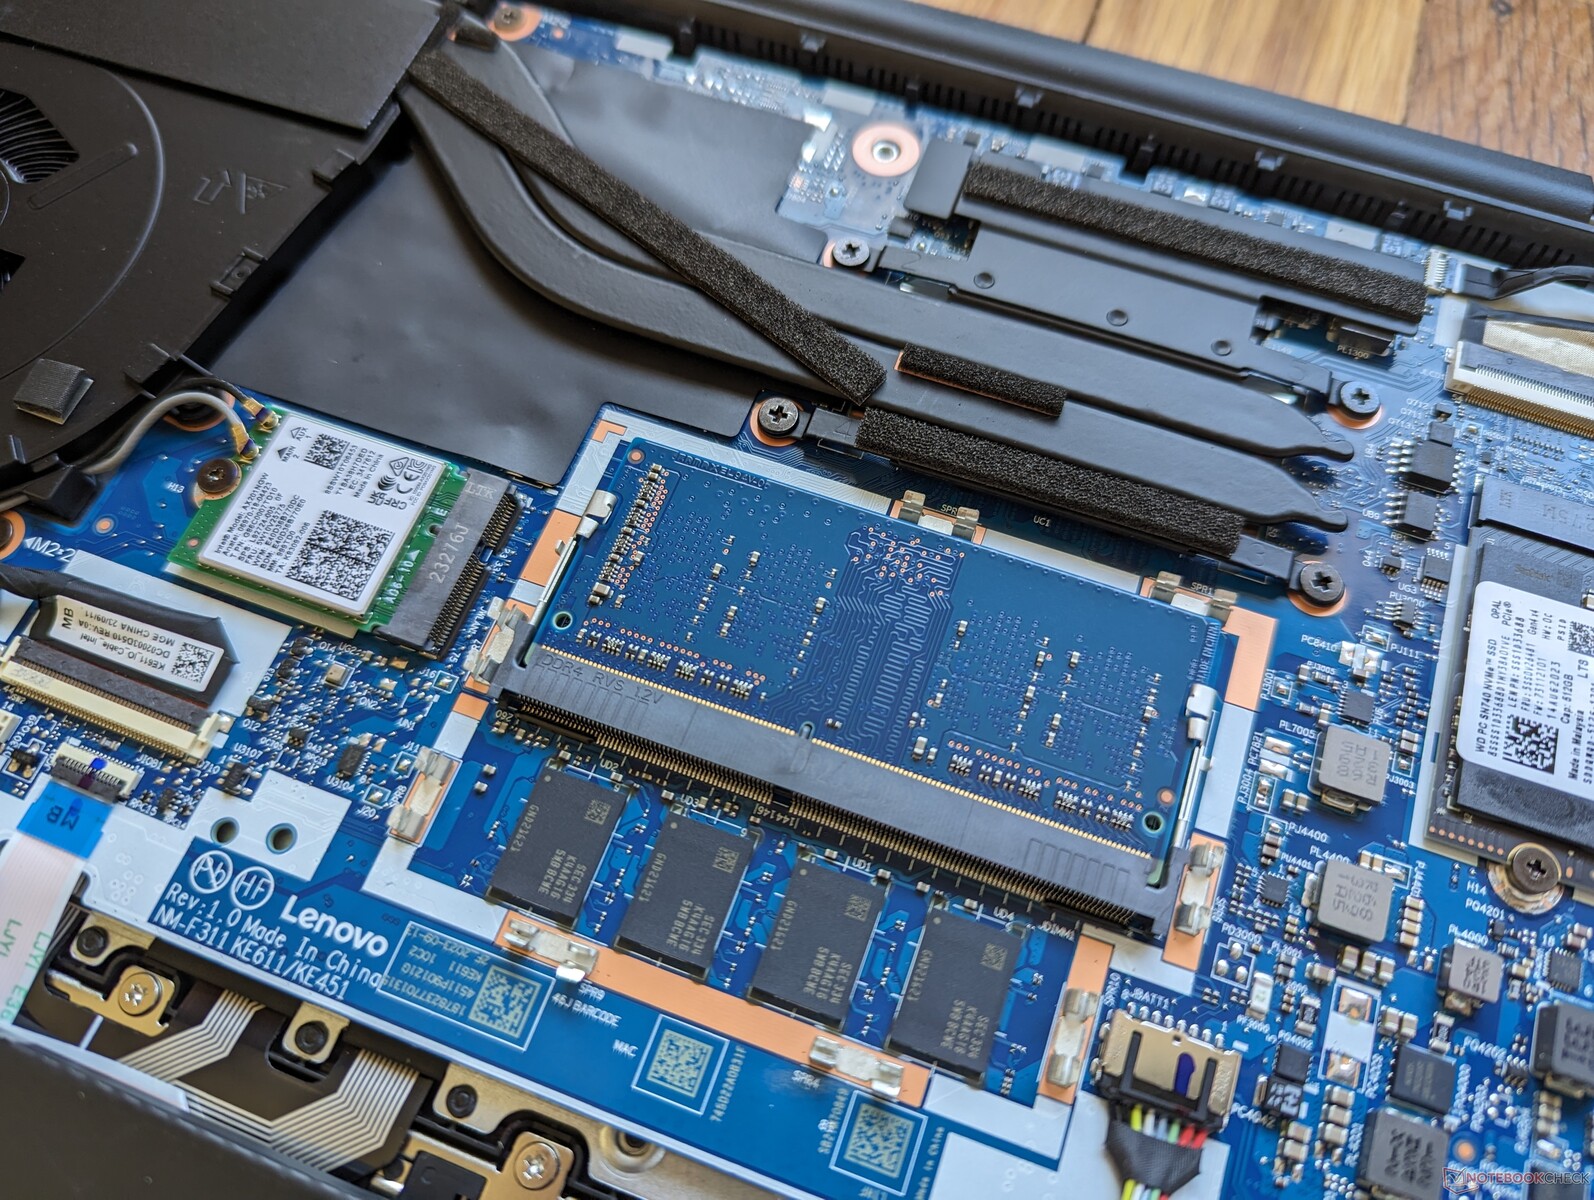
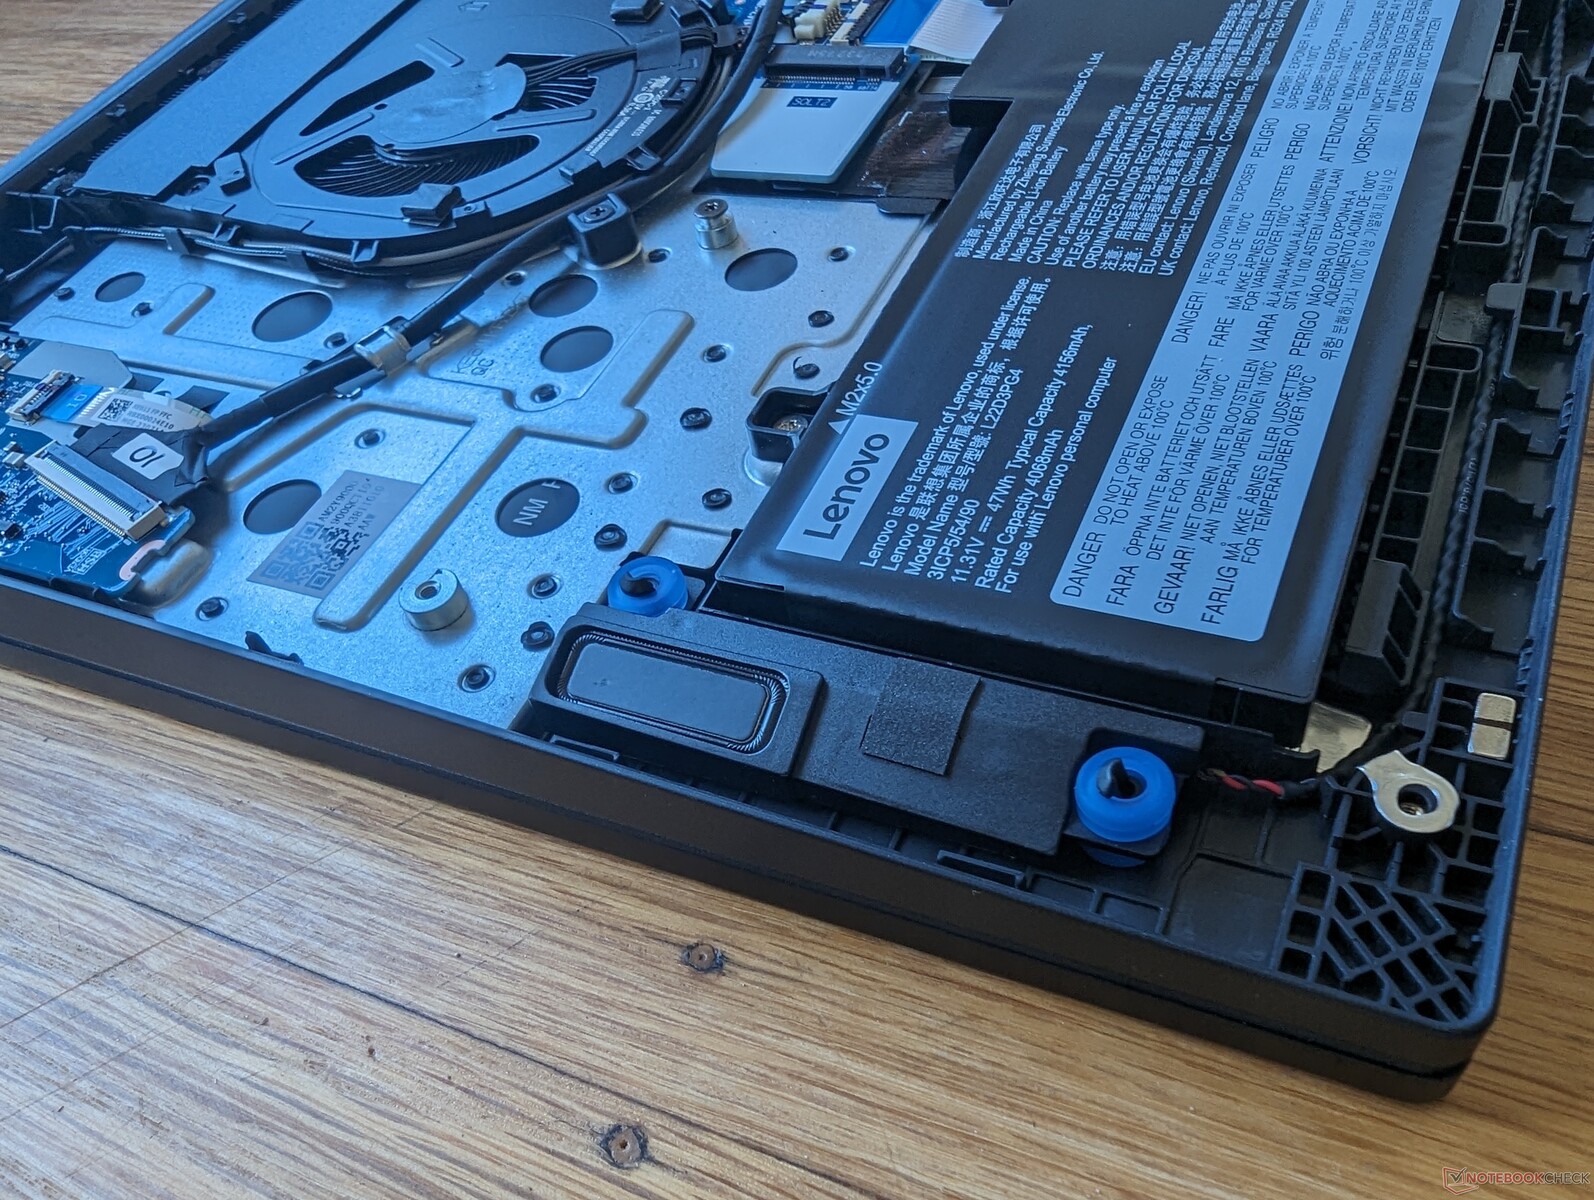
Maintenance
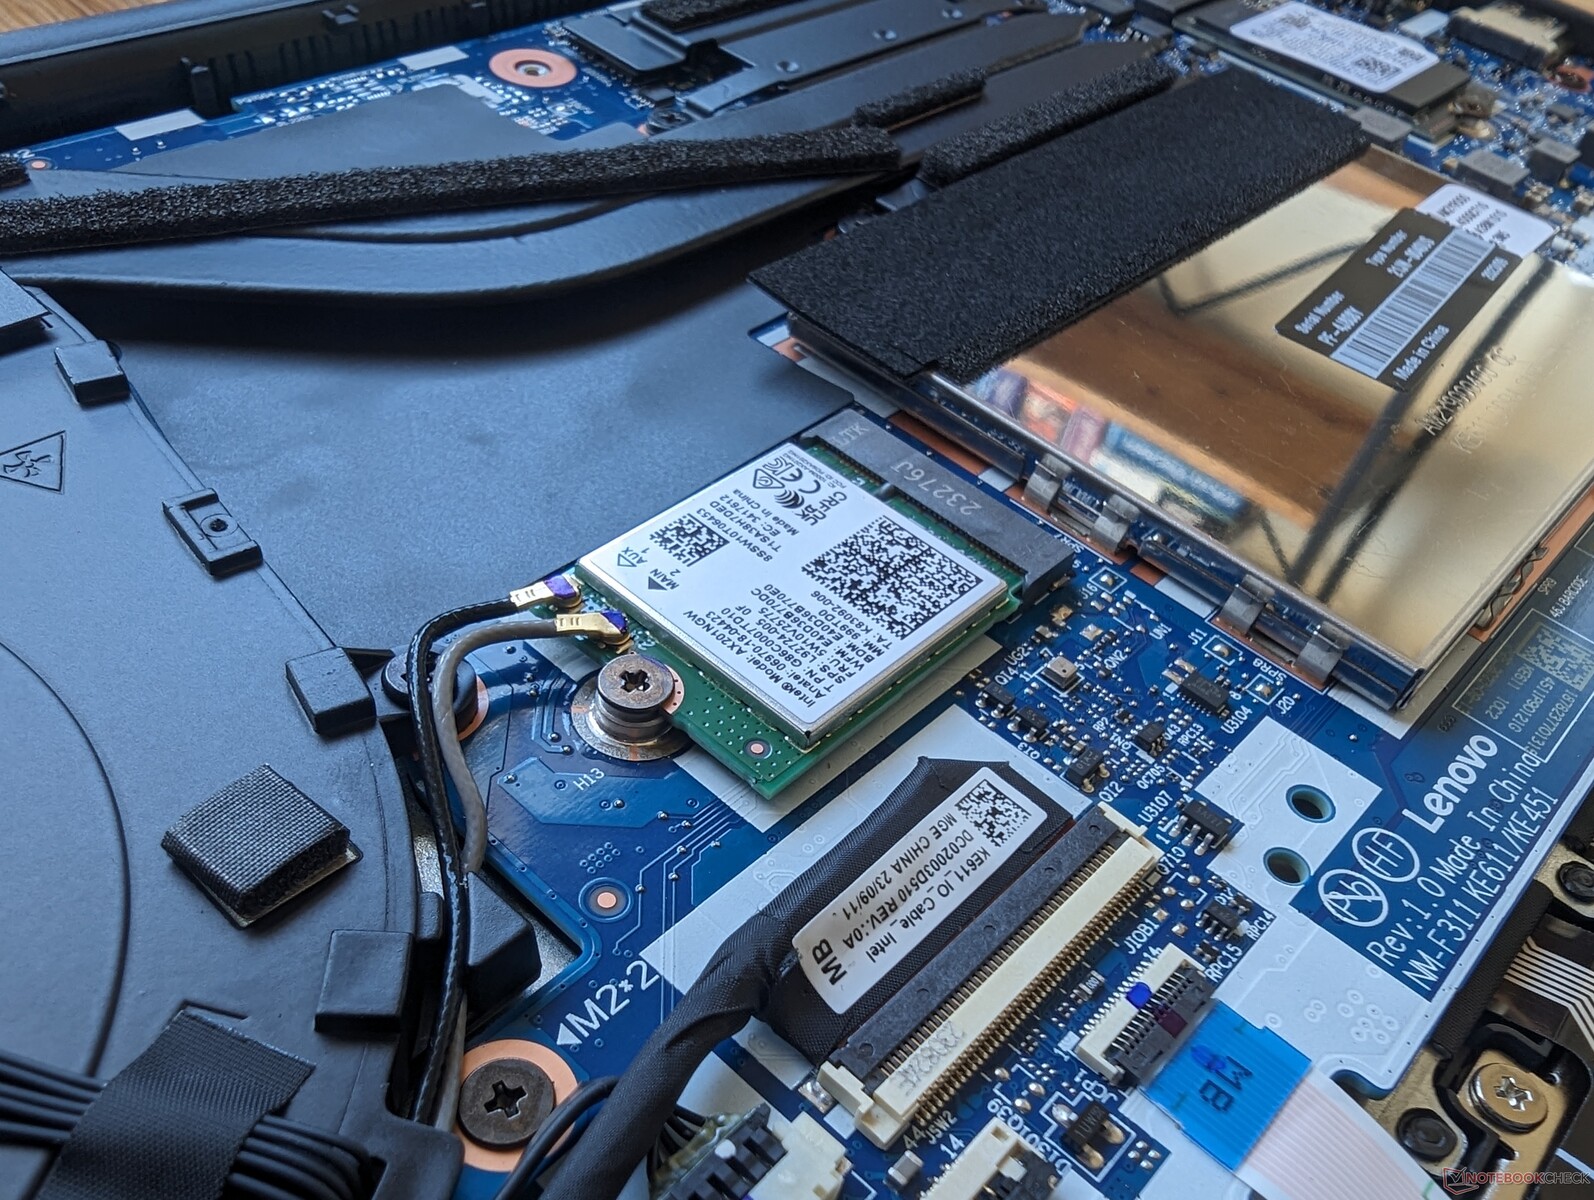
Les versions Intel et AMD prennent chacune en charge jusqu'à deux disques SSD M.2. Toutefois, la version Intel ne prend en charge que les disques d'une longueur maximale de 42 mm, tandis que la version AMD peut prendre en charge un disque d'une longueur maximale de 80 mm. Cette situation est similaire à celle que nous avons observée entre les petits ordinateurs 14 pouces ThinkPad E14 G5 Intel et AMD.
Garantie
Une garantie constructeur limitée d'un an s'applique si vous l'achetez aux États-Unis. Les modèles ThinkPad plus haut de gamme de la série T ou de la série X sont généralement assortis d'une garantie standard de trois ans.
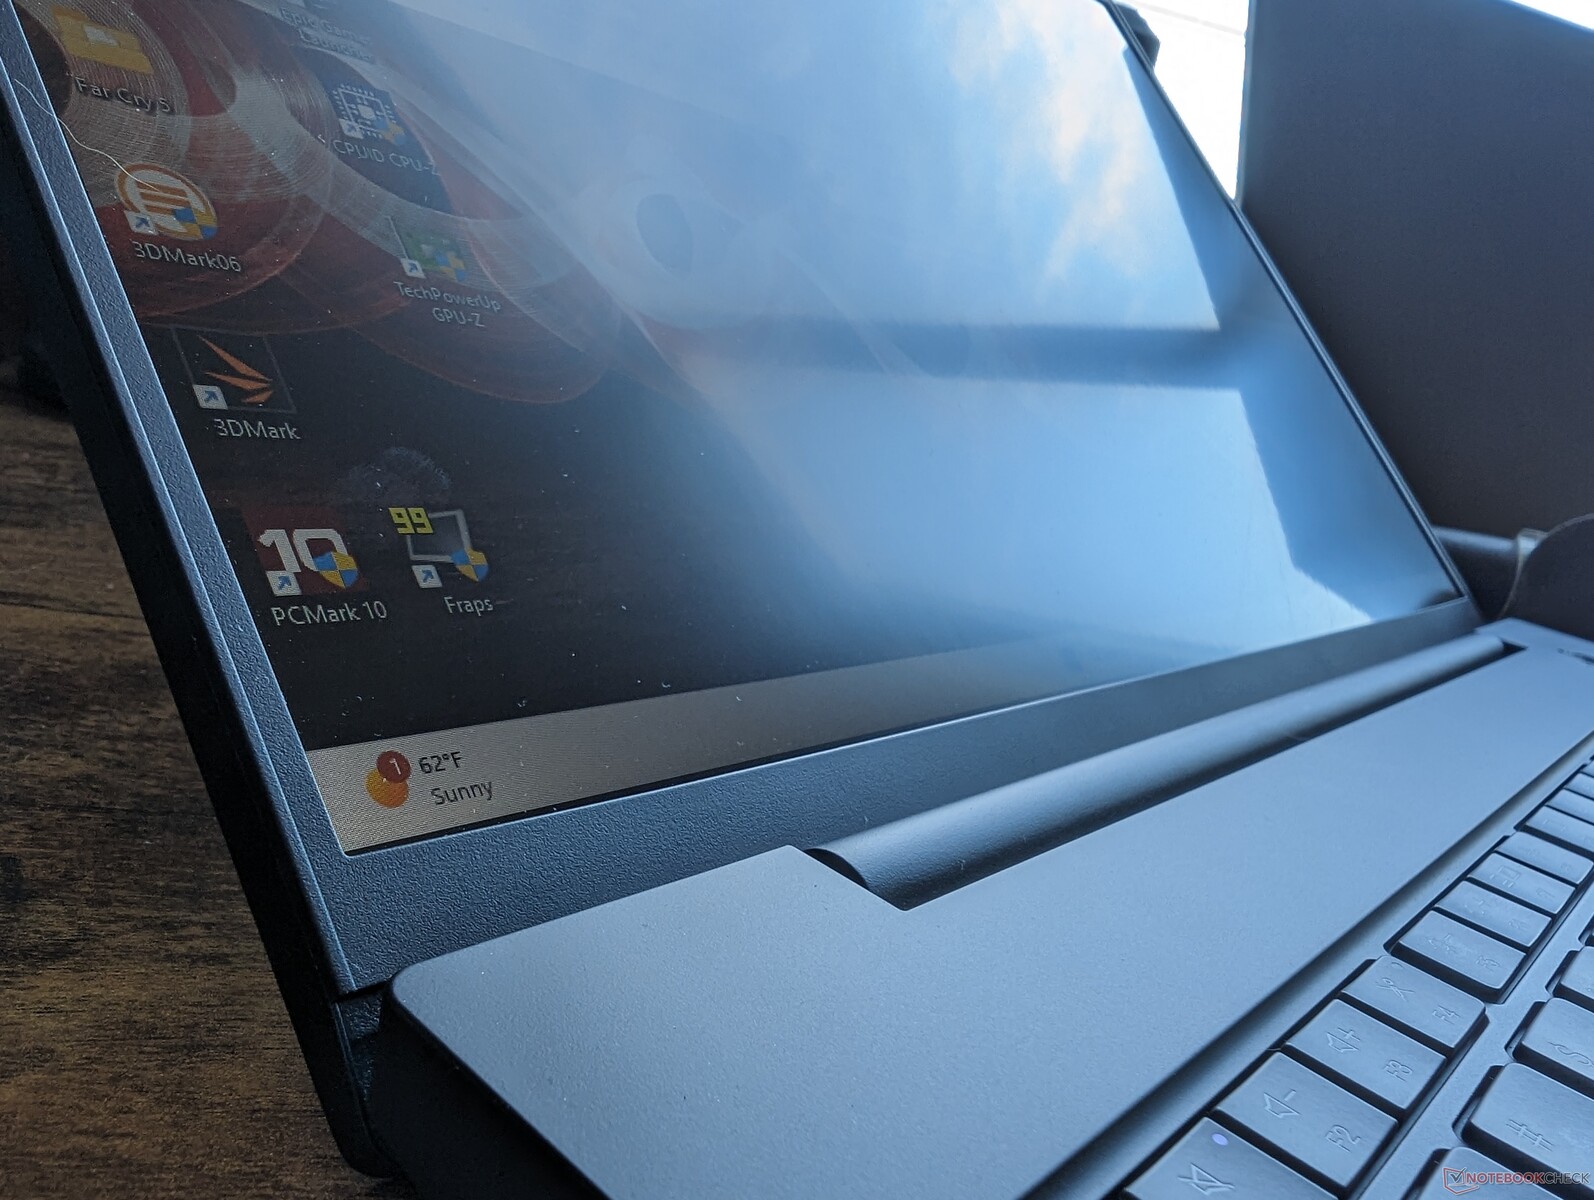
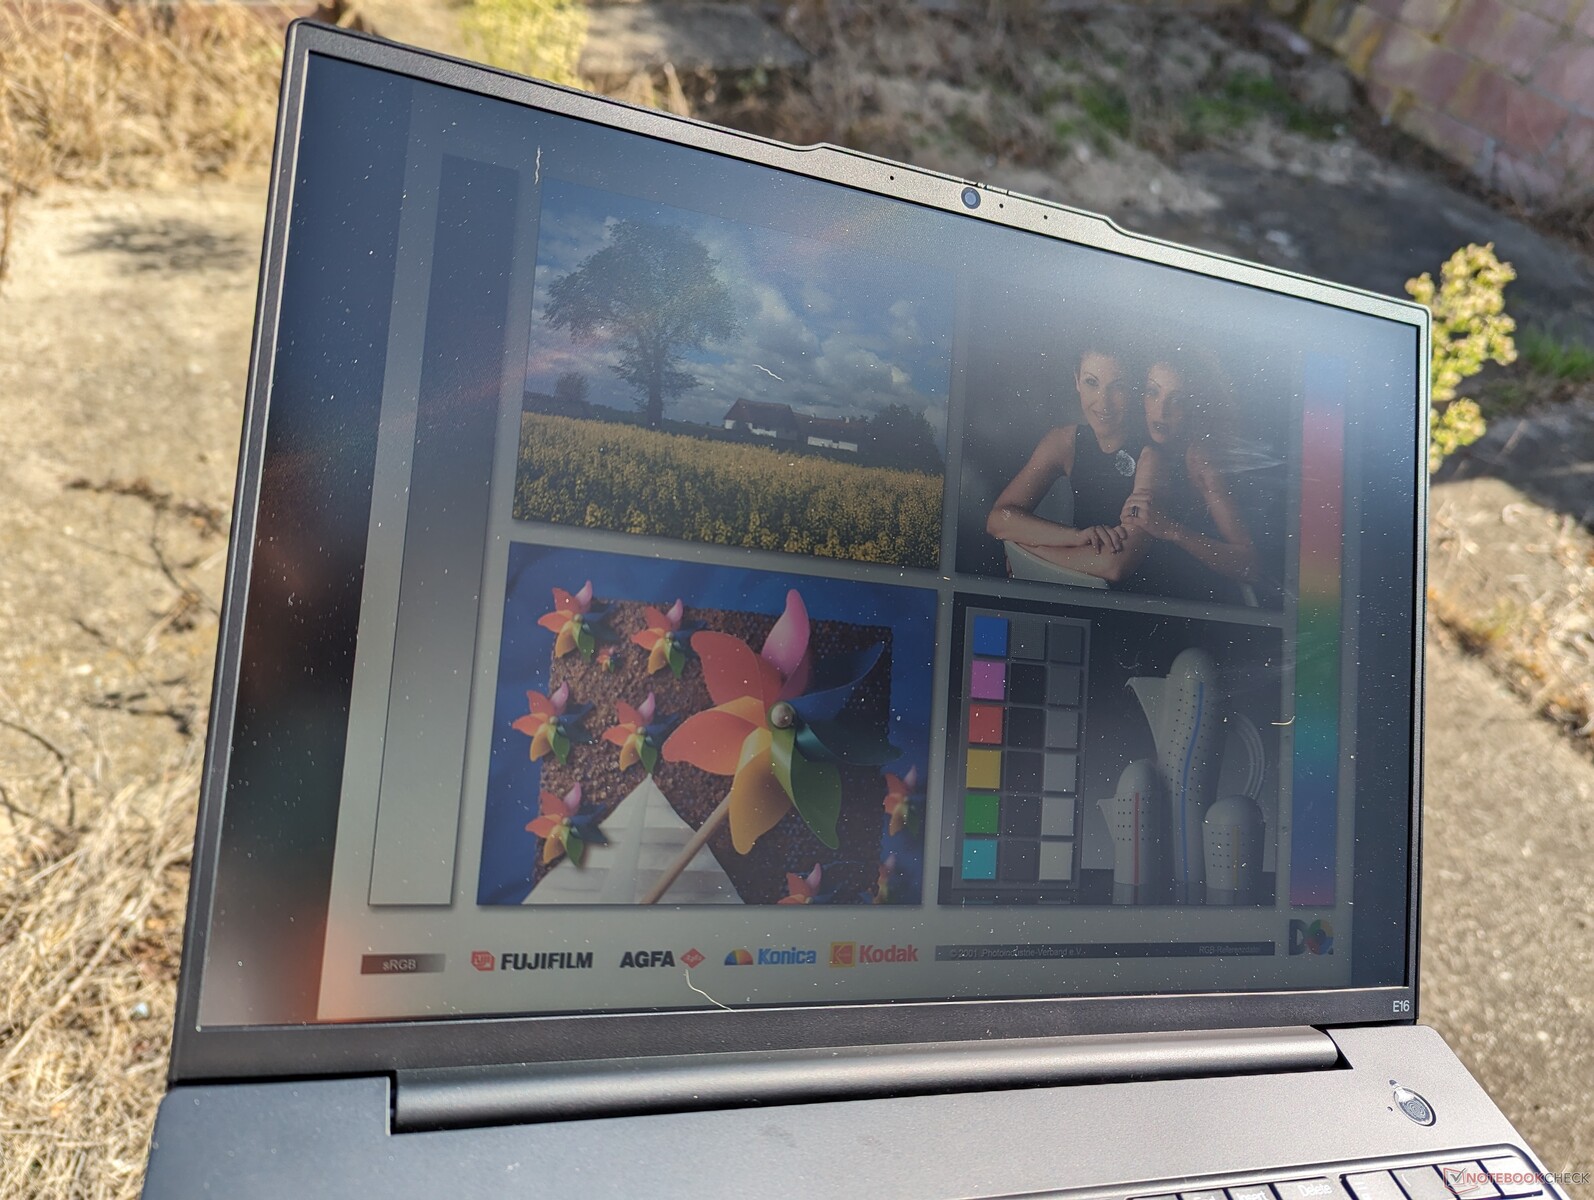
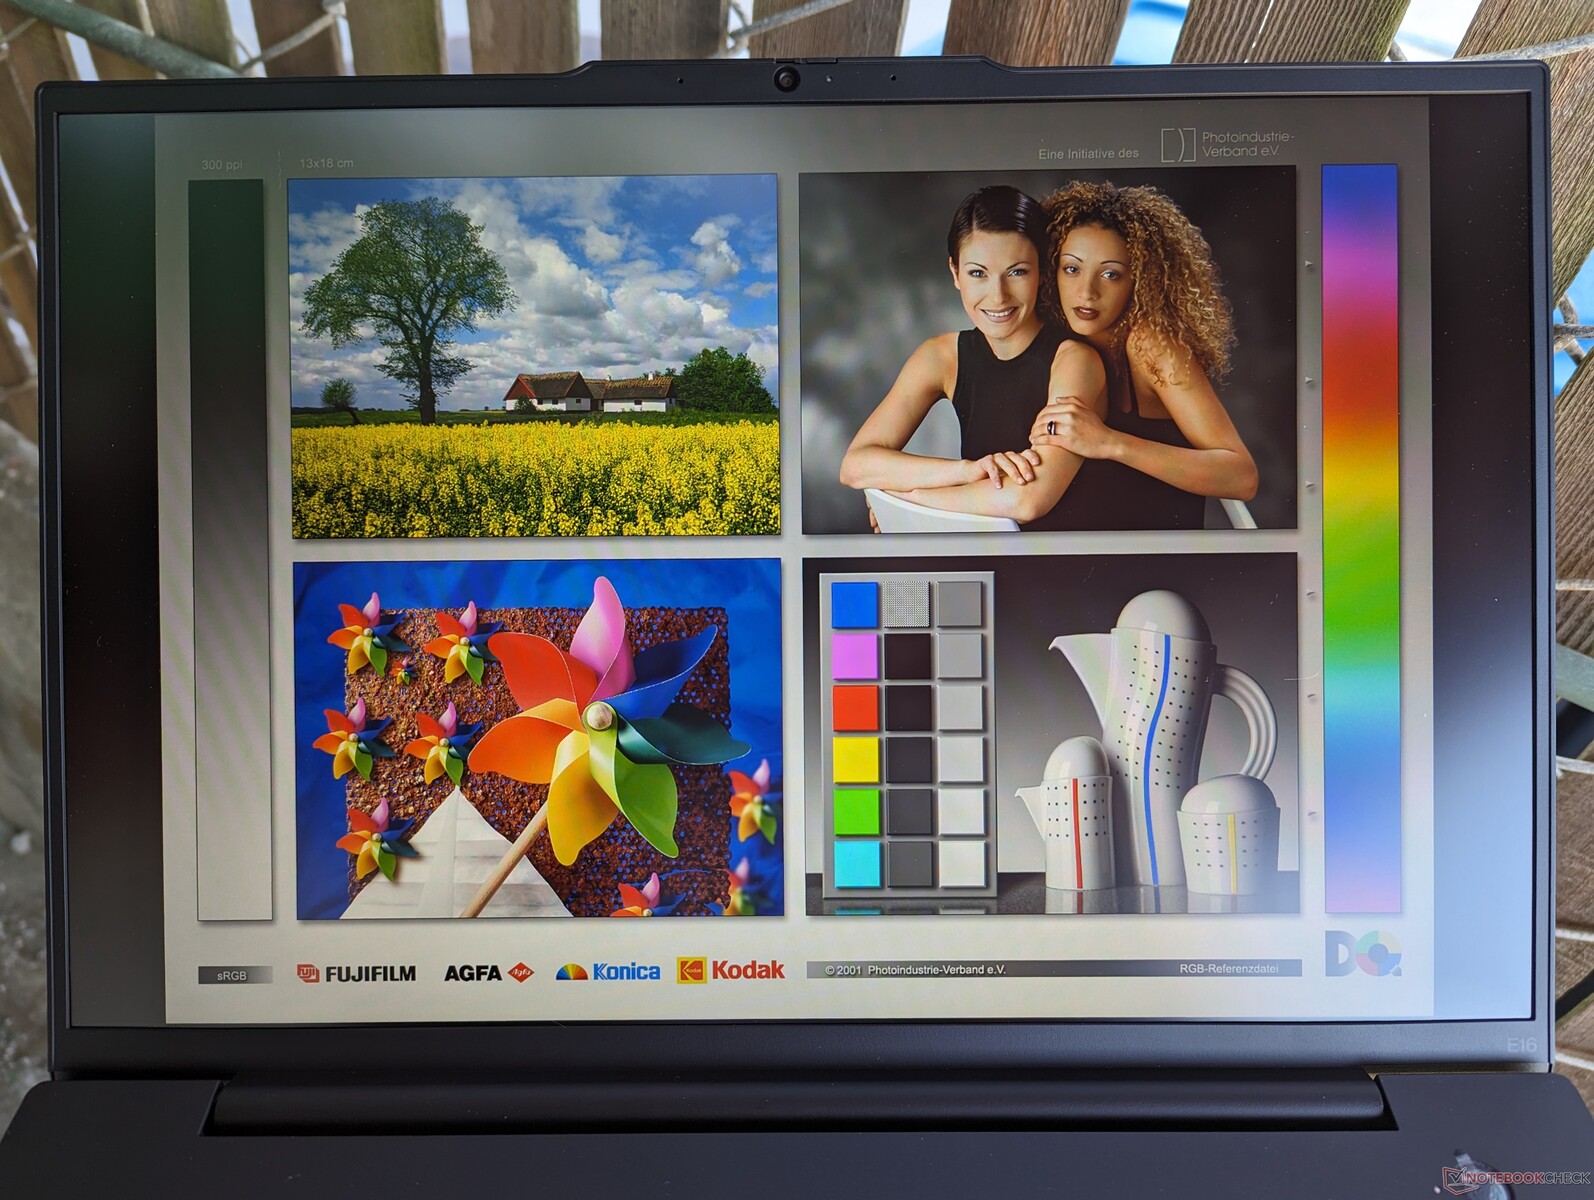
Affichage
Quatre options IPS mattes sont disponibles comme suit :
- 1200p, 60% sRGB, 300 nits, 60 Hz, non tactile
- 1200p, 60% sRGB, 300 nits, 60 Hz, tactile
- 1200p, 100% sRGB, 300 nits, 60 Hz, non tactile
- 1600p, 100% sRGB, 400 nits, 60 Hz, non tactile
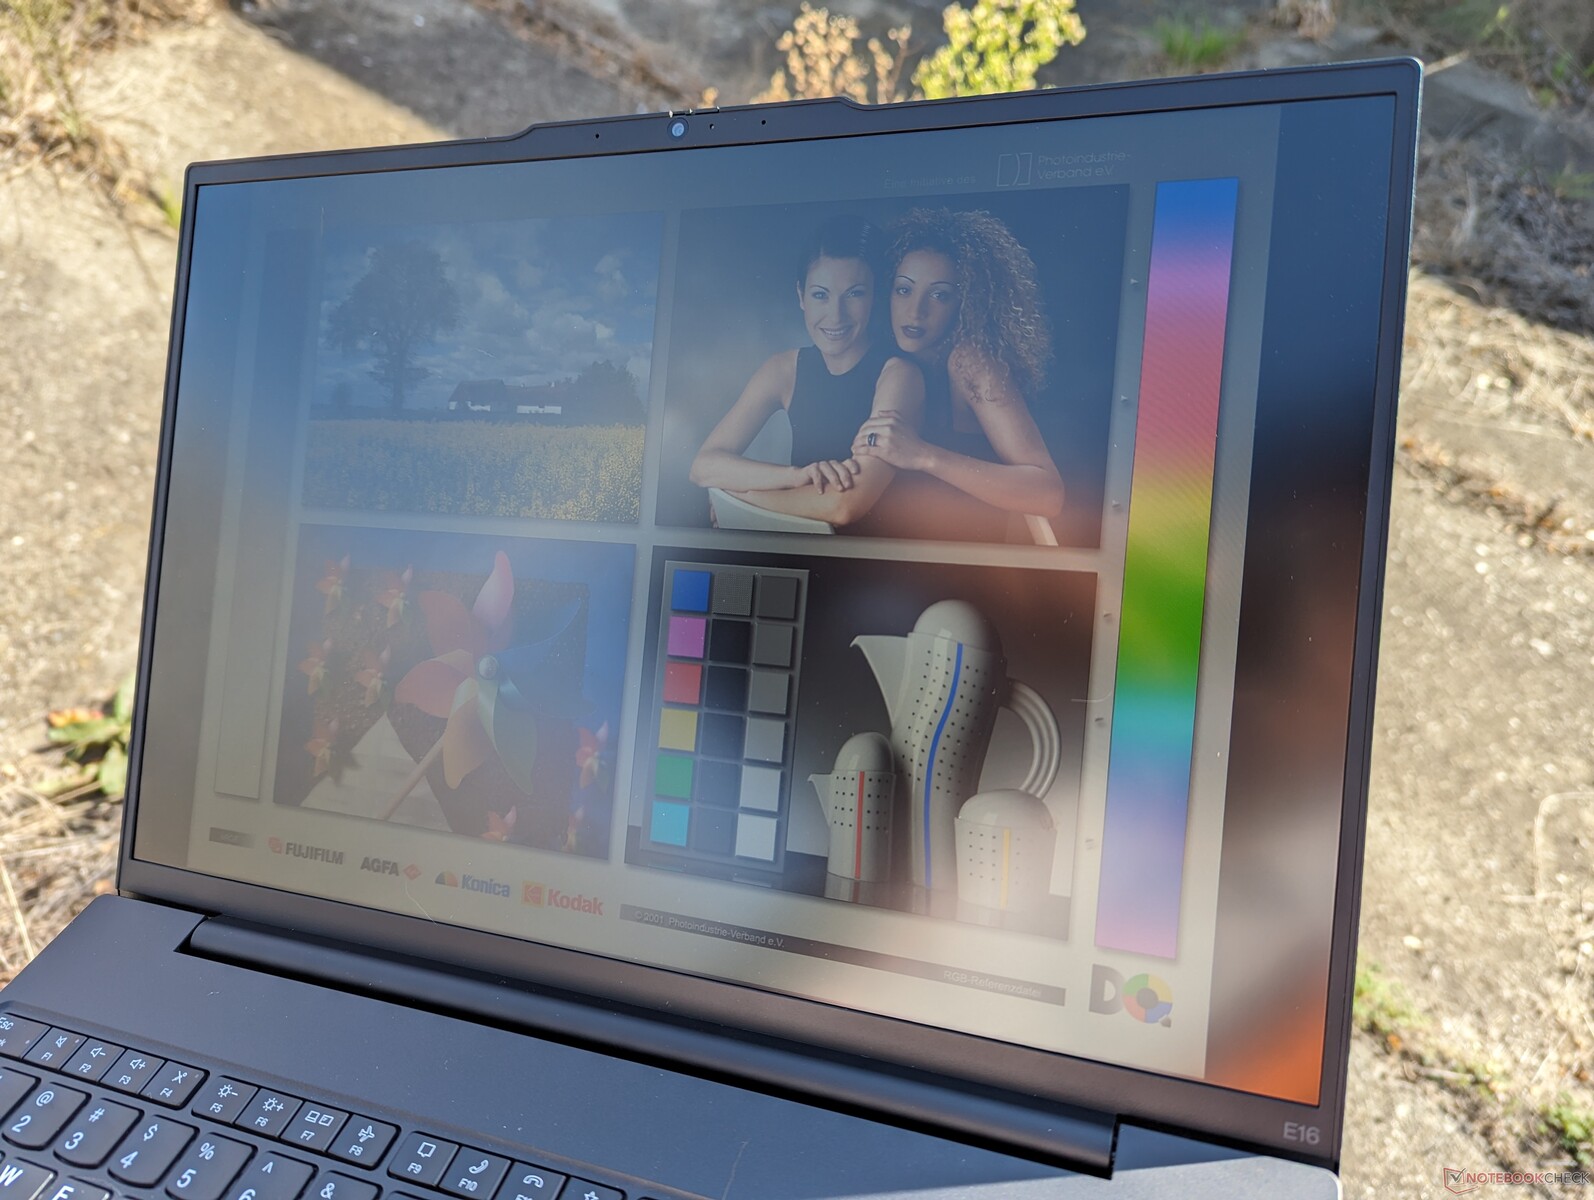
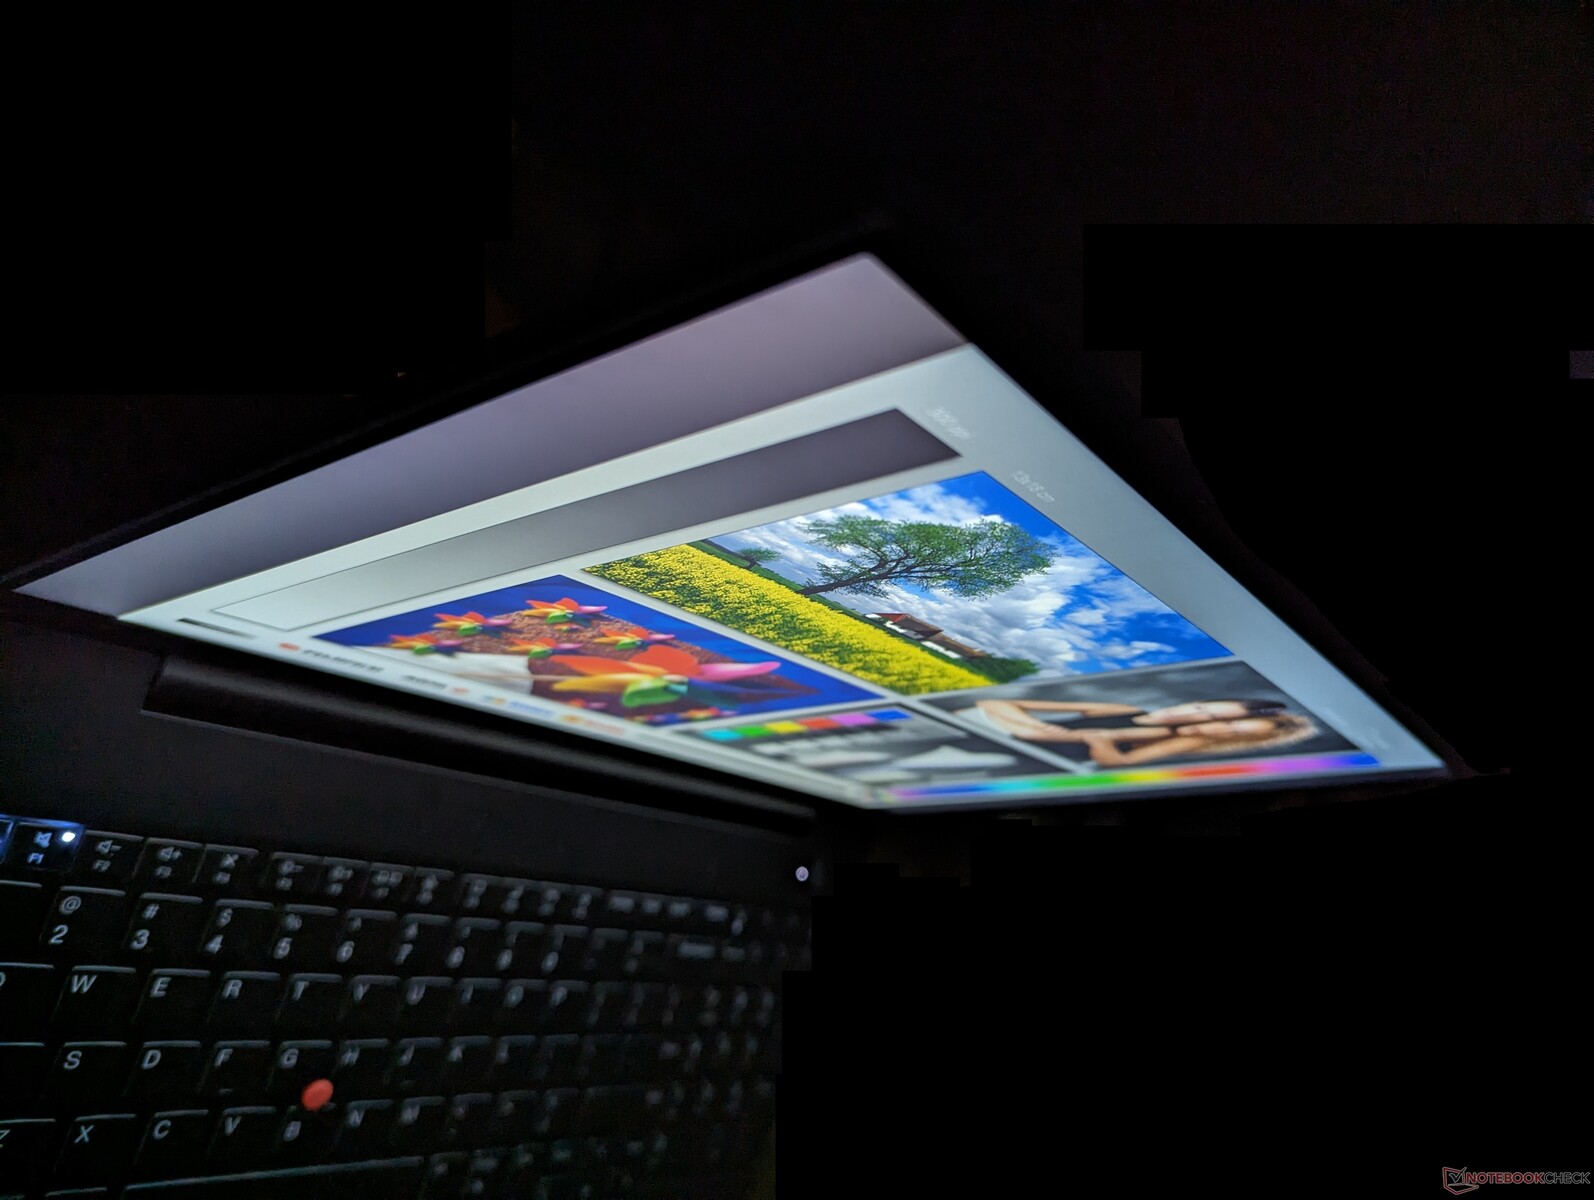
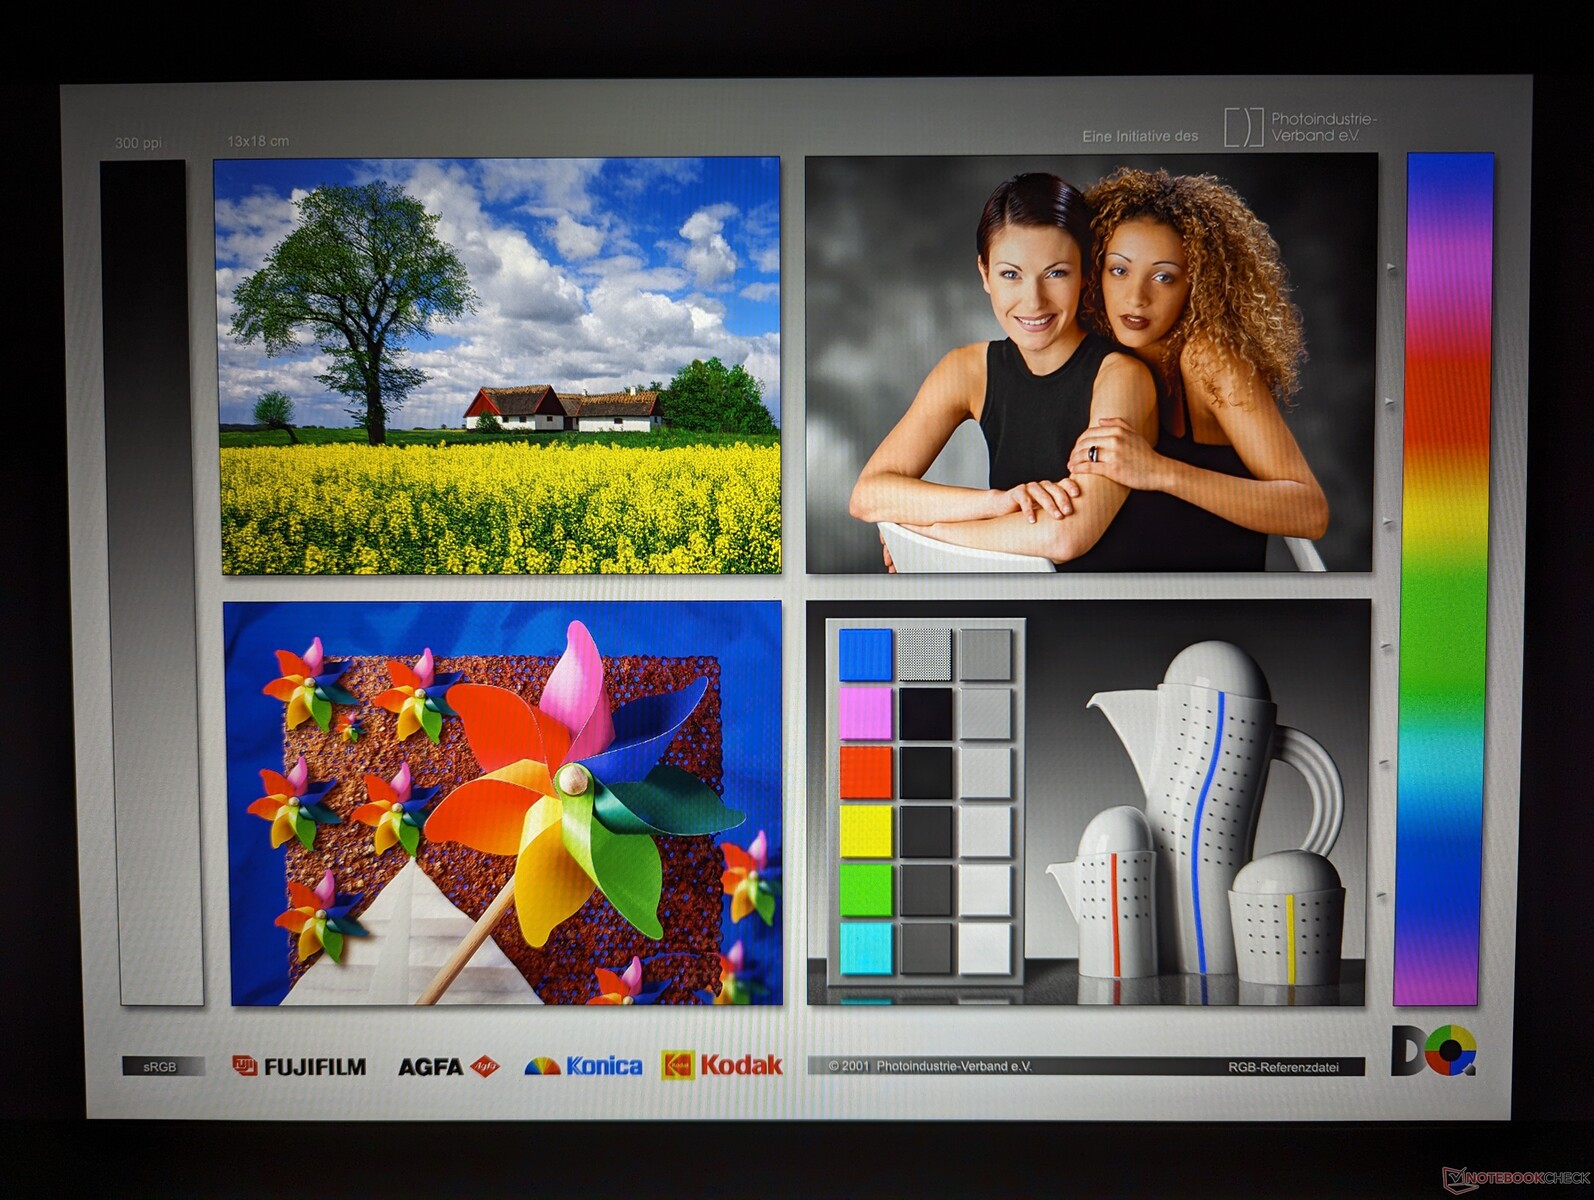
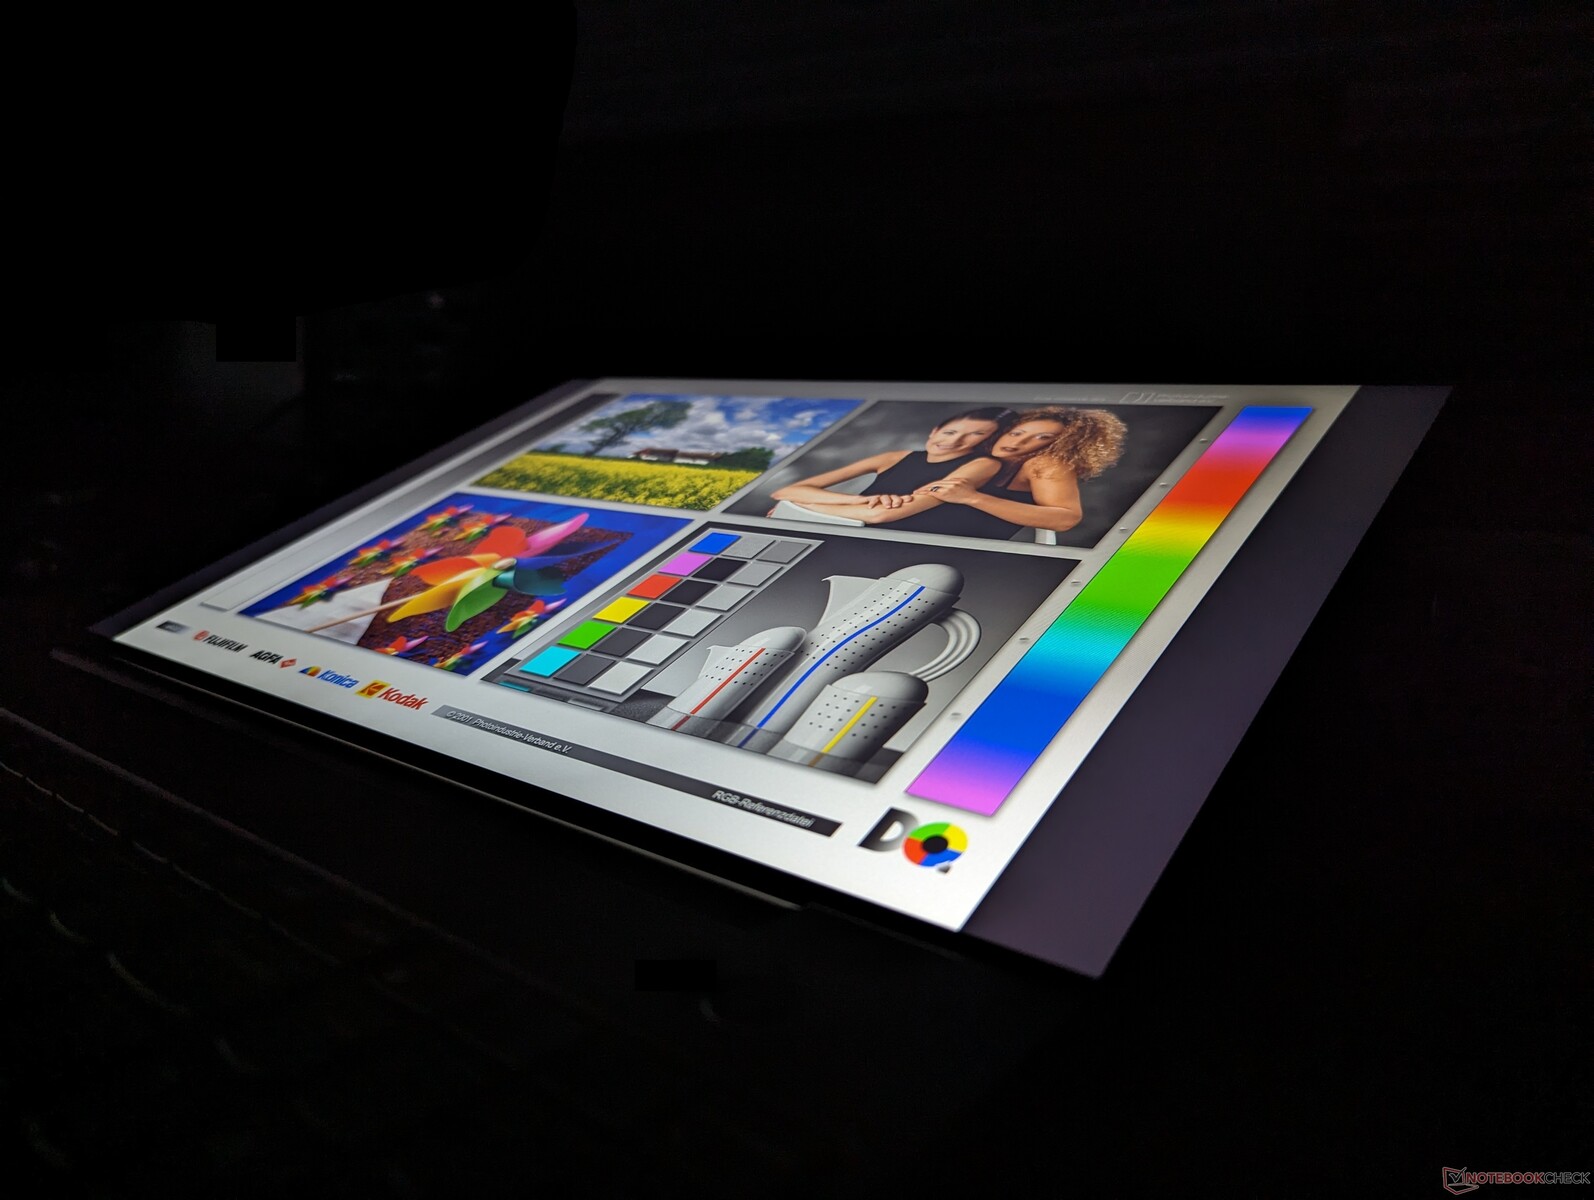
Notre modèle Intel est équipé de l'option en gras ci-dessus, tandis que notre modèle AMD est équipé de l'option 1600p. La qualité d'image est comme le jour et la nuit entre nos unités Intel et AMD, cette dernière apparaissant plus nette, plus vibrante et avec des temps de réponse plus rapides pour une expérience visuelle nettement meilleure. Nous vous recommandons d'éviter notre option de panneau spécifique, sauf si la fonctionnalité d'écran tactile est indispensable.

| |||||||||||||||||||||||||
Homogénéité de la luminosité: 91 %
Valeur mesurée au centre, sur batterie: 318.6 cd/m²
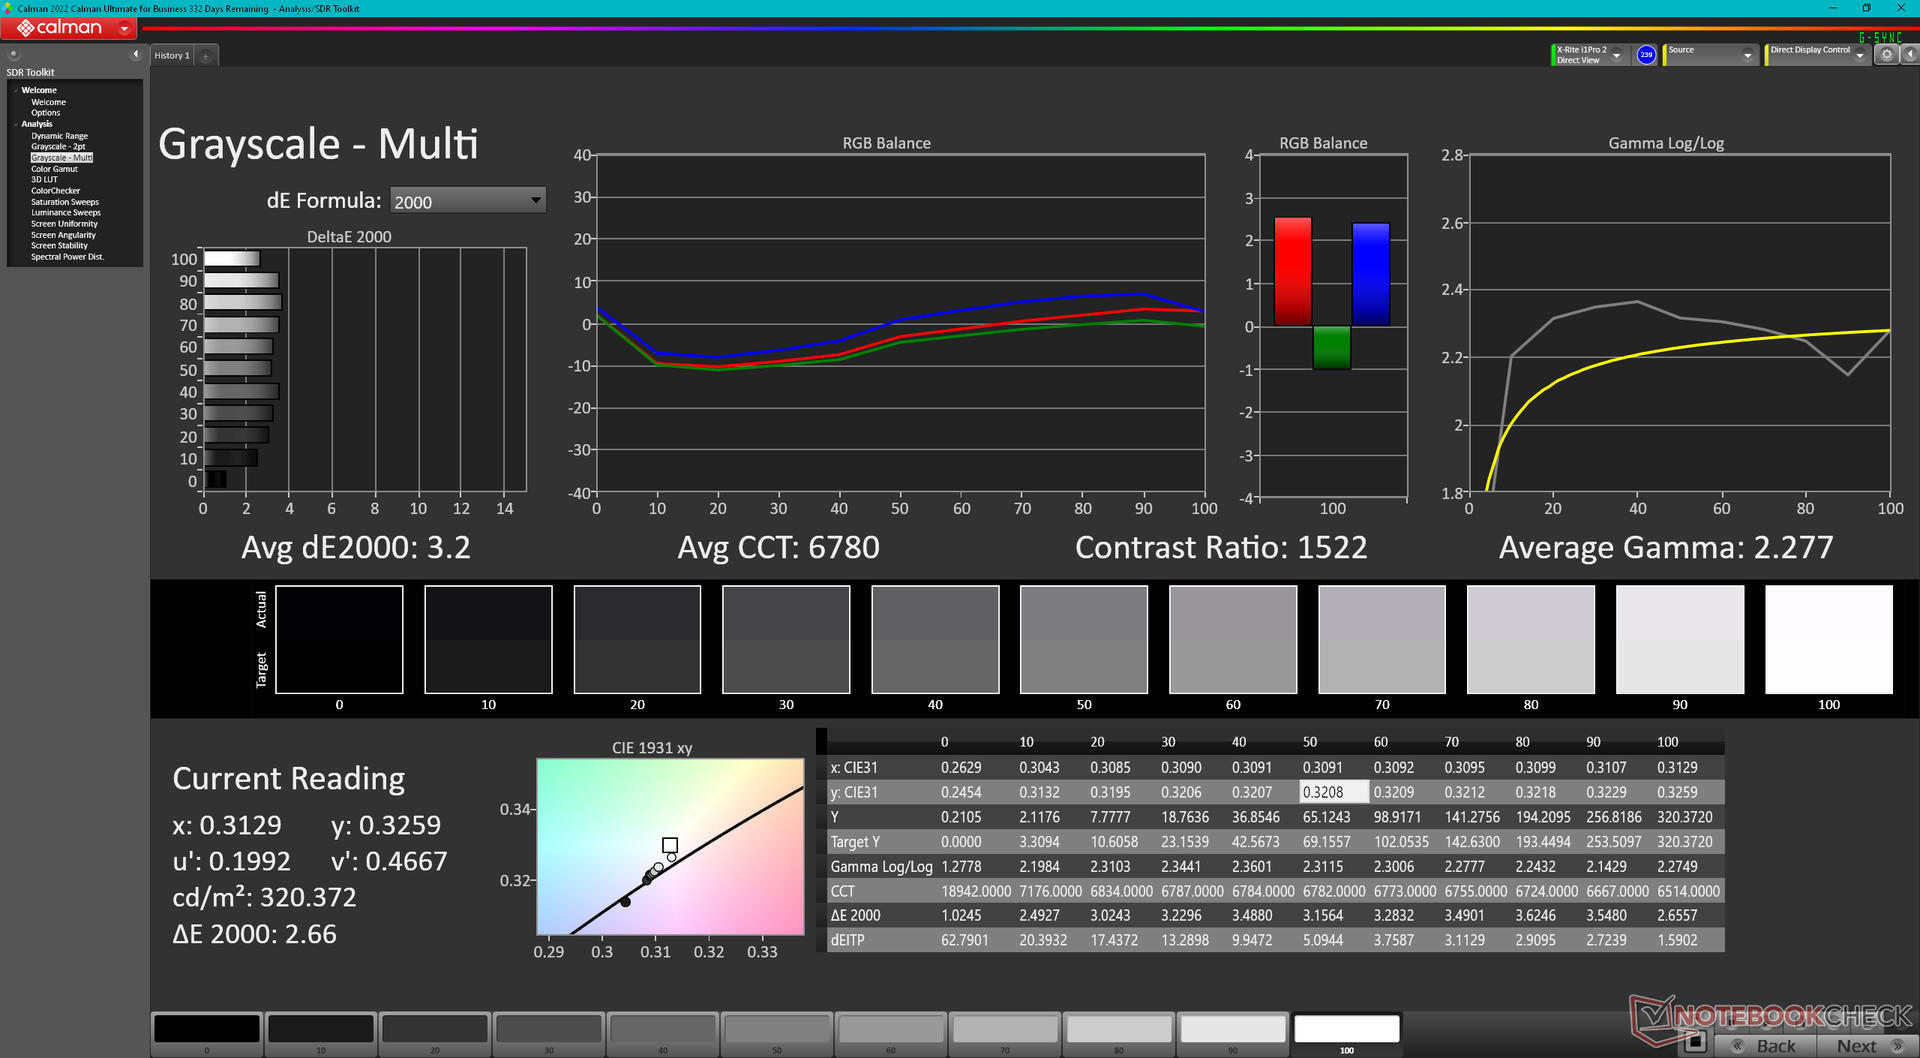
Contraste: 1099:1 (Valeurs des noirs: 0.29 cd/m²)
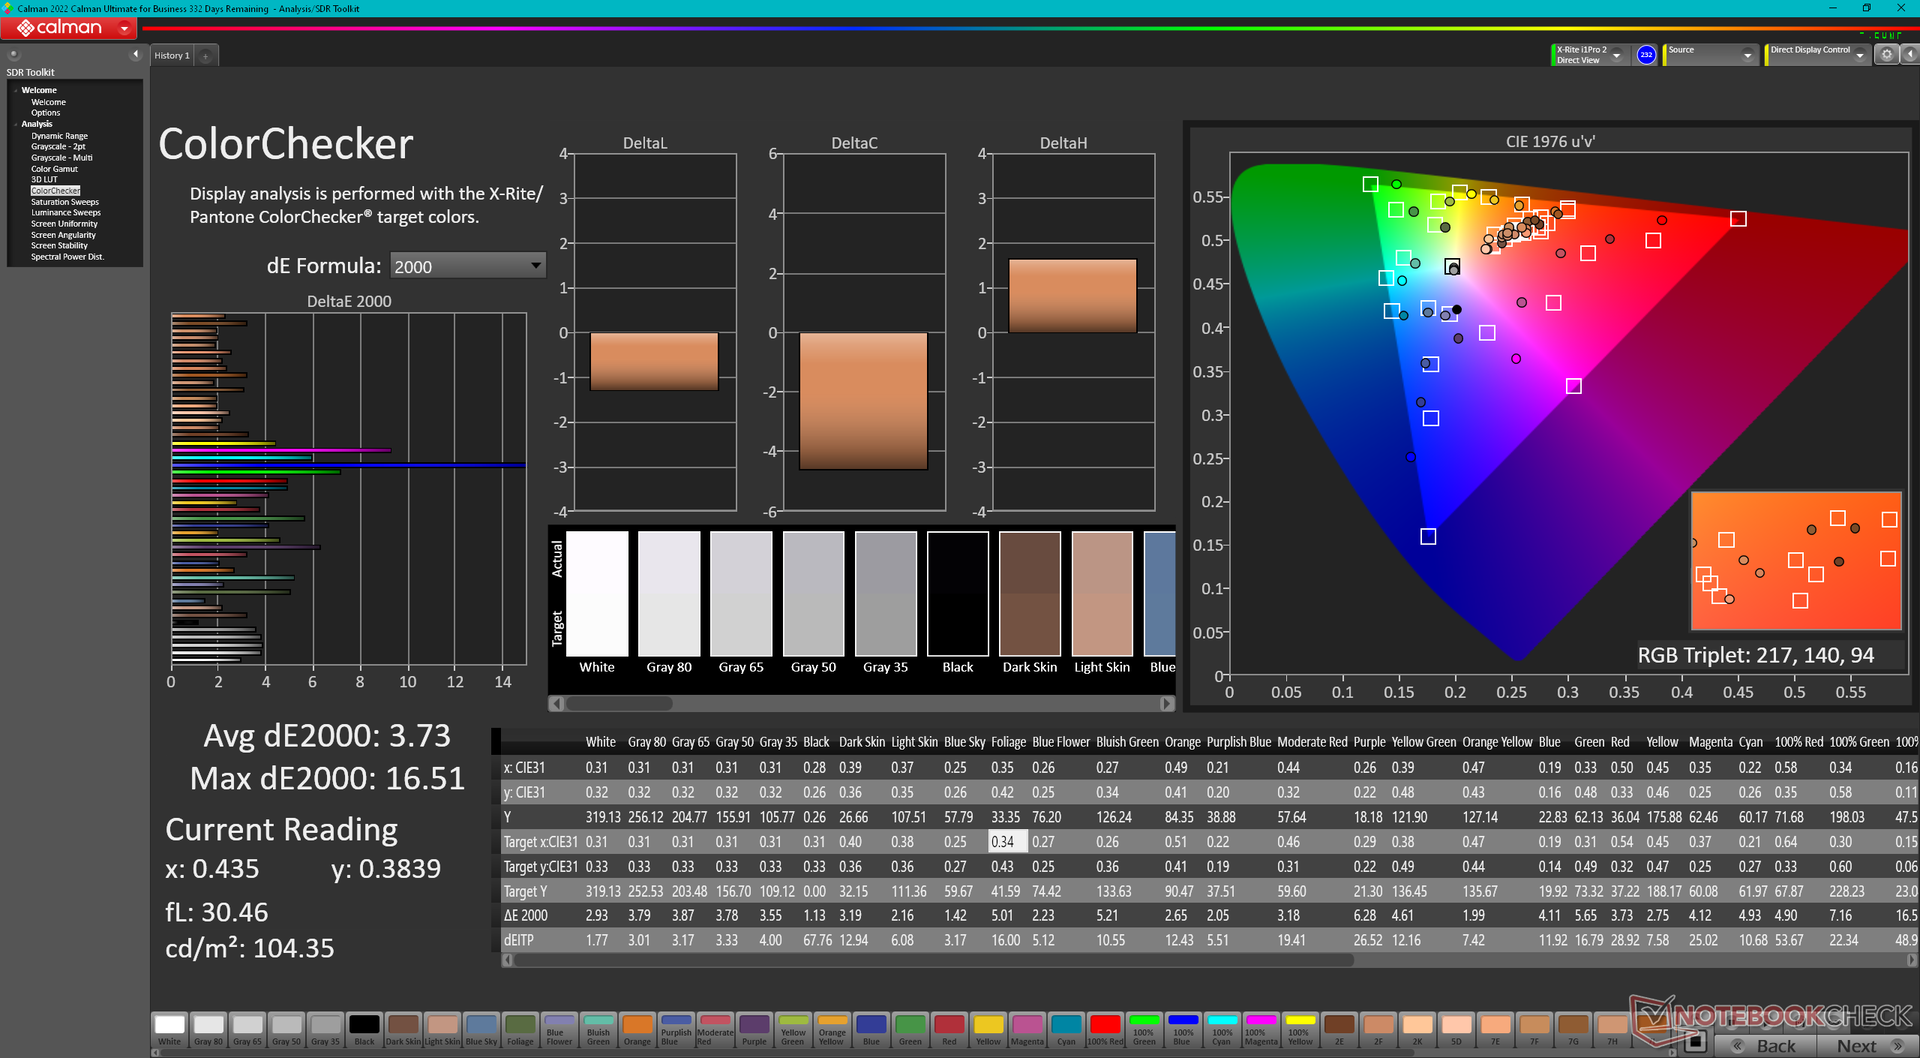
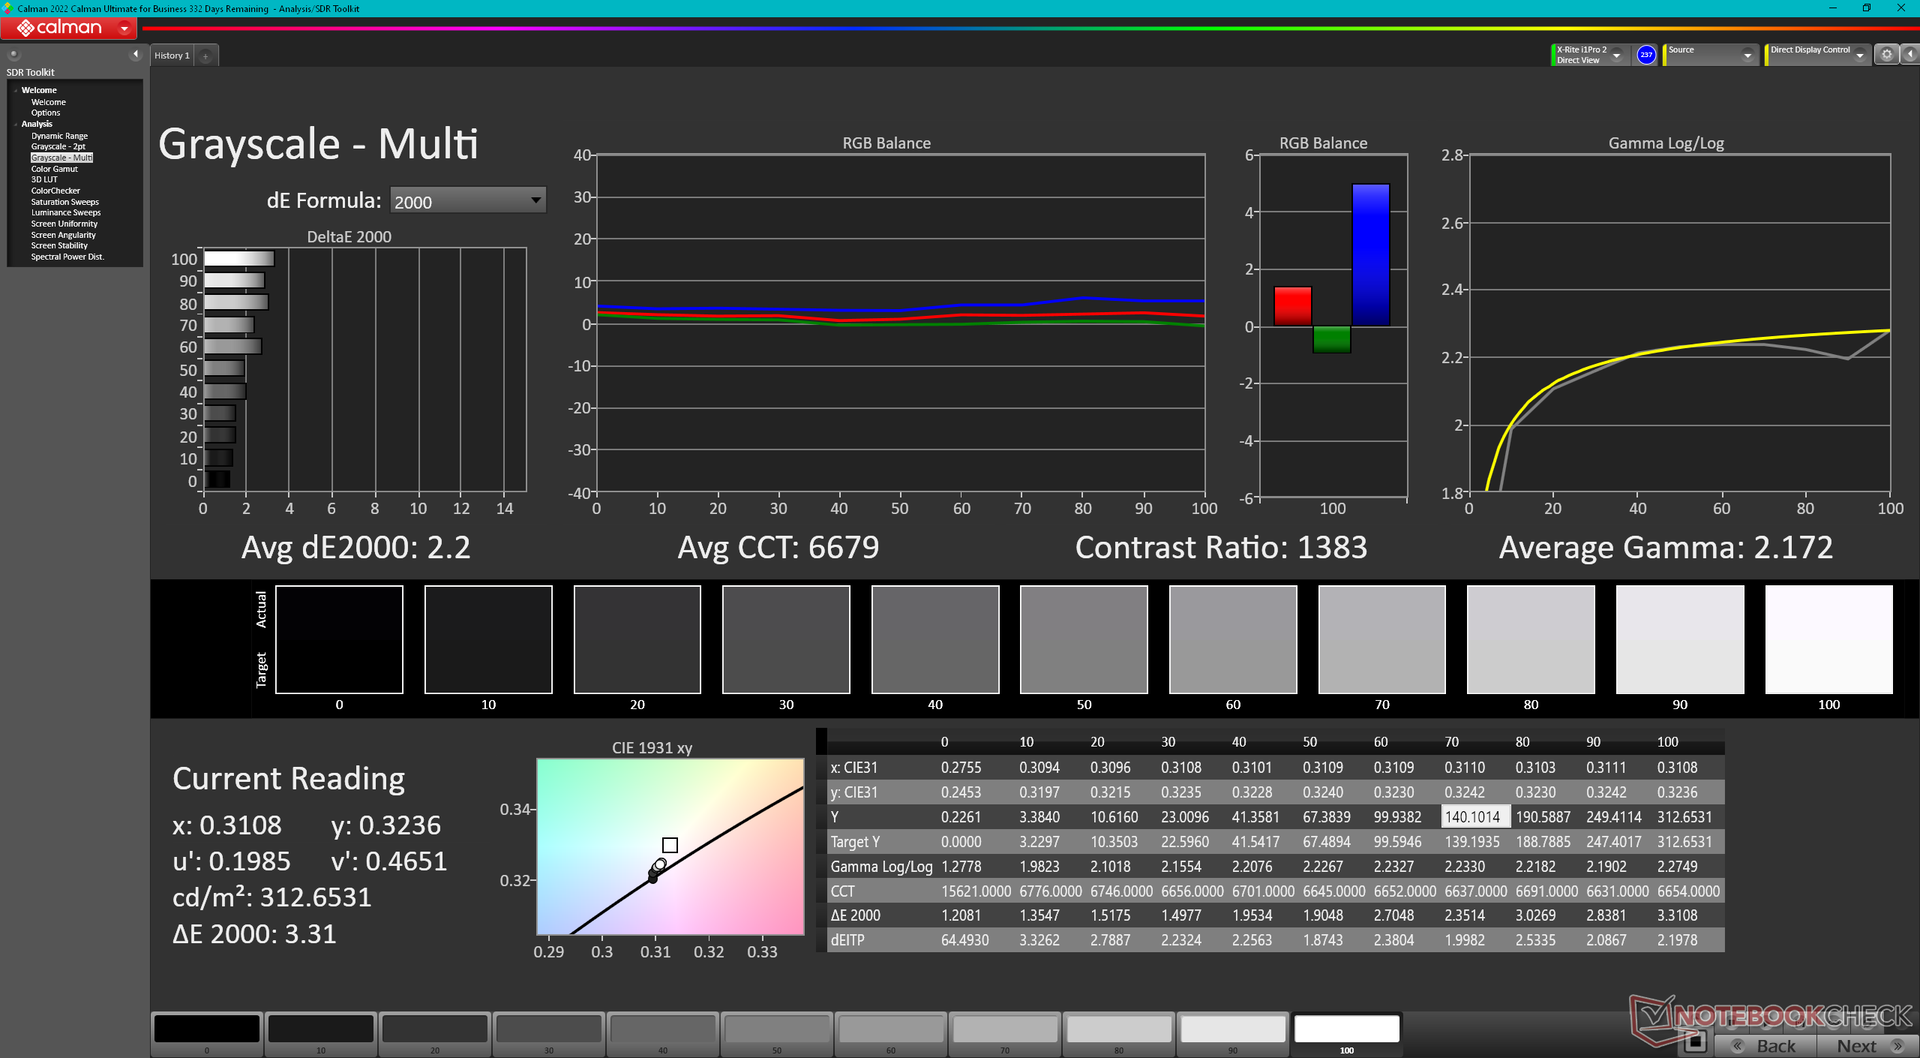
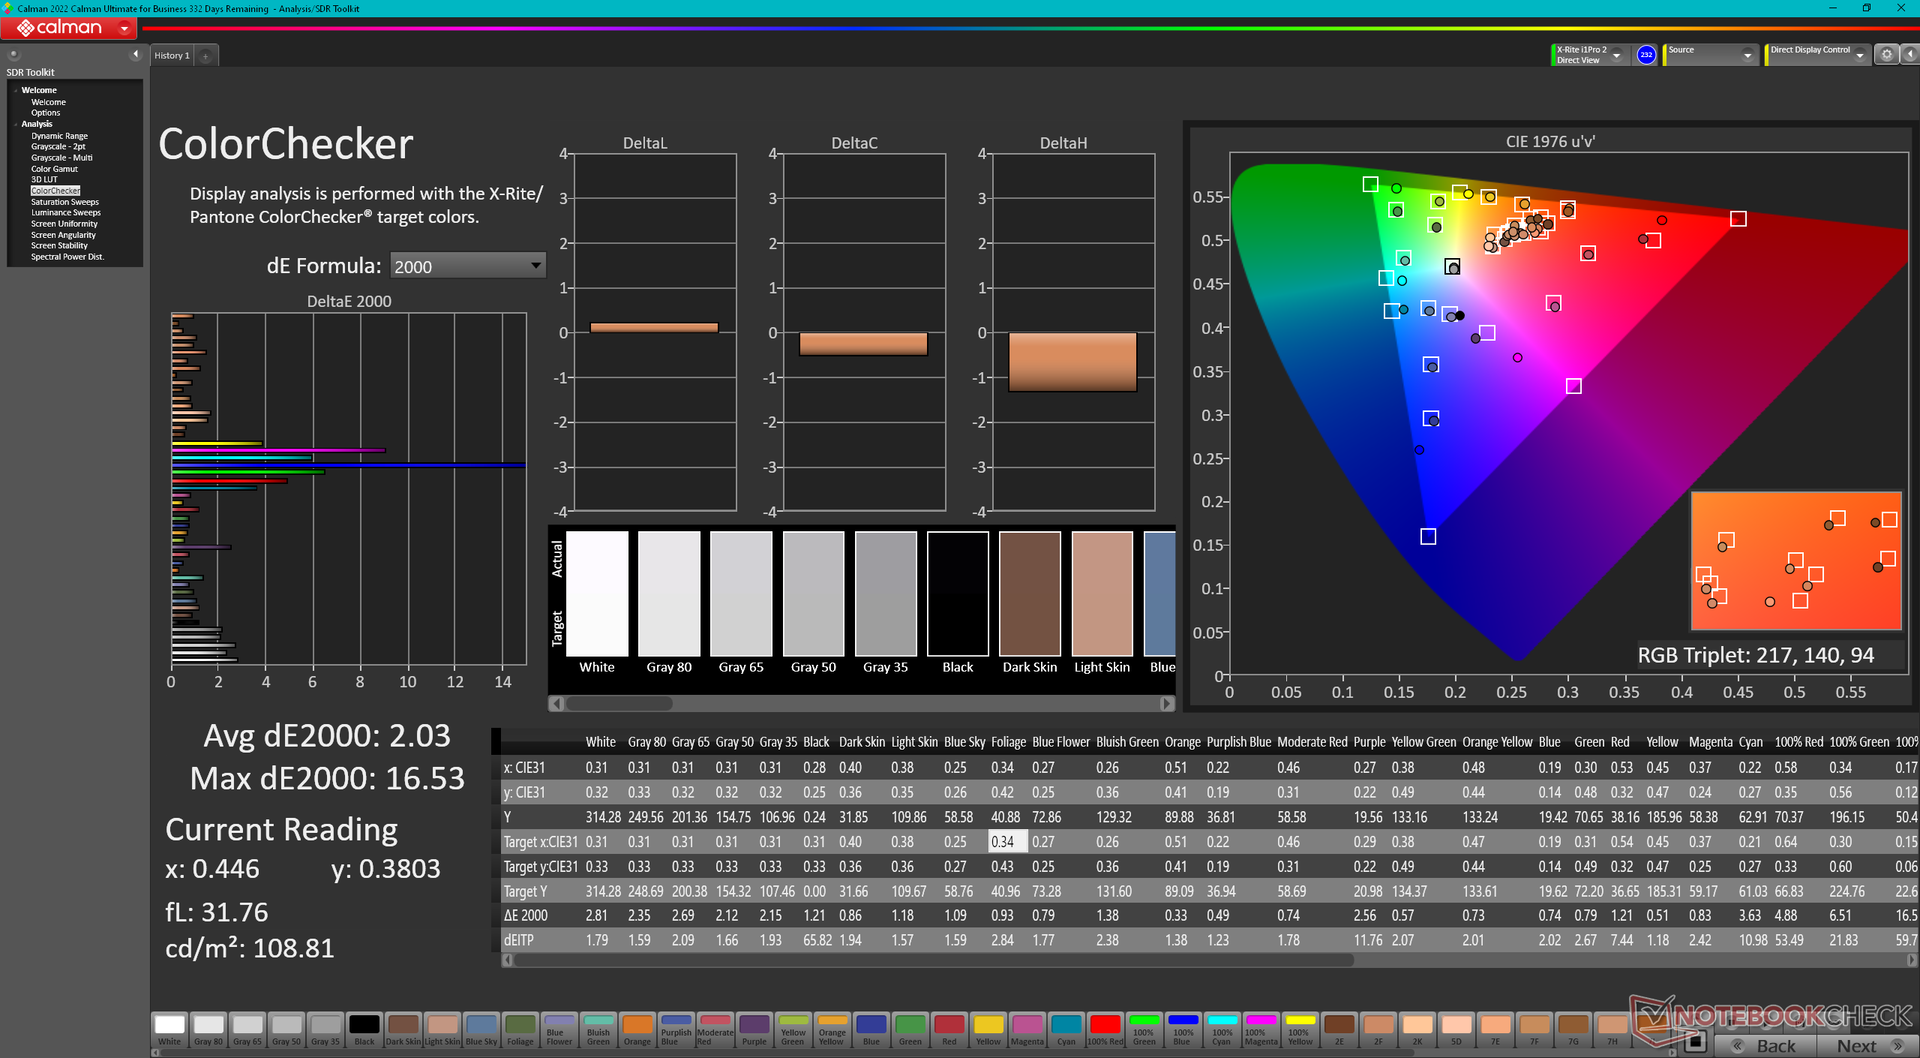
ΔE ColorChecker Calman: 3.73 | ∀{0.5-29.43 Ø4.73}
calibrated: 2.03
ΔE Greyscale Calman: 3.2 | ∀{0.09-98 Ø4.97}
43.3% AdobeRGB 1998 (Argyll 3D)
62.6% sRGB (Argyll 3D)
42% Display P3 (Argyll 3D)
Gamma: 2.28
CCT: 6780 K
| Lenovo ThinkPad E16 G1 Core i5-1335U R160NW41 R2, IPS, 1920x1200, 16" | Lenovo ThinkPad E16 G1-21JUS08X00 MNG007DA1-C, IPS, 2560x1600, 16" | Dell Inspiron 16 7635 2-in-1 Chi Mei 160JCA, IPS, 1920x1200, 16" | Acer TravelMate P4 TMP416-51-55KN BOE BOE0A32, IPS, 1920x1200, 16" | Samsung Galaxy Book3 Pro 16 Samsung ATNA60CL03-0, AMOLED, 2880x1800, 16" | LG Gram 16Z90Q LG LP160WQ1-SPB2 (LGD06EB), IPS, 2560x1600, 16" | |
|---|---|---|---|---|---|---|
| Display | 58% | 59% | -7% | 107% | 95% | |
| Display P3 Coverage (%) | 42 | 67.6 61% | 67.4 60% | 38.9 -7% | 99.7 137% | 96.8 130% |
| sRGB Coverage (%) | 62.6 | 95.3 52% | 98.2 57% | 58.1 -7% | 100 60% | 99.9 60% |
| AdobeRGB 1998 Coverage (%) | 43.3 | 70 62% | 69.5 61% | 40.2 -7% | 97 124% | 84.6 95% |
| Response Times | 30% | 38% | 62% | 95% | 16% | |
| Response Time Grey 50% / Grey 80% * (ms) | 46.4 ? | 32.4 ? 30% | 27.6 ? 41% | 20 ? 57% | 2 ? 96% | 45.7 ? 2% |
| Response Time Black / White * (ms) | 27.6 ? | 19.6 ? 29% | 18.2 ? 34% | 9 ? 67% | 2 ? 93% | 19.7 ? 29% |
| PWM Frequency (Hz) | ||||||
| Screen | 30% | 12% | -20% | 295% | 13% | |
| Brightness middle (cd/m²) | 318.6 | 404 27% | 301.3 -5% | 269 -16% | 412 29% | 366 15% |
| Brightness (cd/m²) | 302 | 389 29% | 269 -11% | 265 -12% | 412 36% | 347 15% |
| Brightness Distribution (%) | 91 | 91 0% | 79 -13% | 94 3% | 98 8% | 89 -2% |
| Black Level * (cd/m²) | 0.29 | 0.24 17% | 0.28 3% | 0.305 -5% | 0.015 95% | 0.32 -10% |
| Contrast (:1) | 1099 | 1683 53% | 1076 -2% | 882 -20% | 27467 2399% | 1144 4% |
| Colorchecker dE 2000 * | 3.73 | 2.1 44% | 3.1 17% | 4.89 -31% | 2.34 37% | 2.82 24% |
| Colorchecker dE 2000 max. * | 16.51 | 4.2 75% | 5.5 67% | 8.81 47% | 3.34 80% | 4.65 72% |
| Colorchecker dE 2000 calibrated * | 2.03 | 1.4 31% | 0.49 76% | 5.12 -152% | 2.95 -45% | 2.69 -33% |
| Greyscale dE 2000 * | 3.2 | 3.3 -3% | 3.9 -22% | 2.91 9% | 2.78 13% | 2.3 28% |
| Gamma | 2.28 96% | 2.24 98% | 2.19 100% | 2.28 96% | 2.5 88% | 1.971 112% |
| CCT | 6780 96% | 7038 92% | 6186 105% | 6920 94% | 6879 94% | 6796 96% |
| Moyenne finale (programmes/paramètres) | 39% /
36% | 36% /
26% | 12% /
-5% | 166% /
226% | 41% /
31% |
* ... Moindre est la valeur, meilleures sont les performances
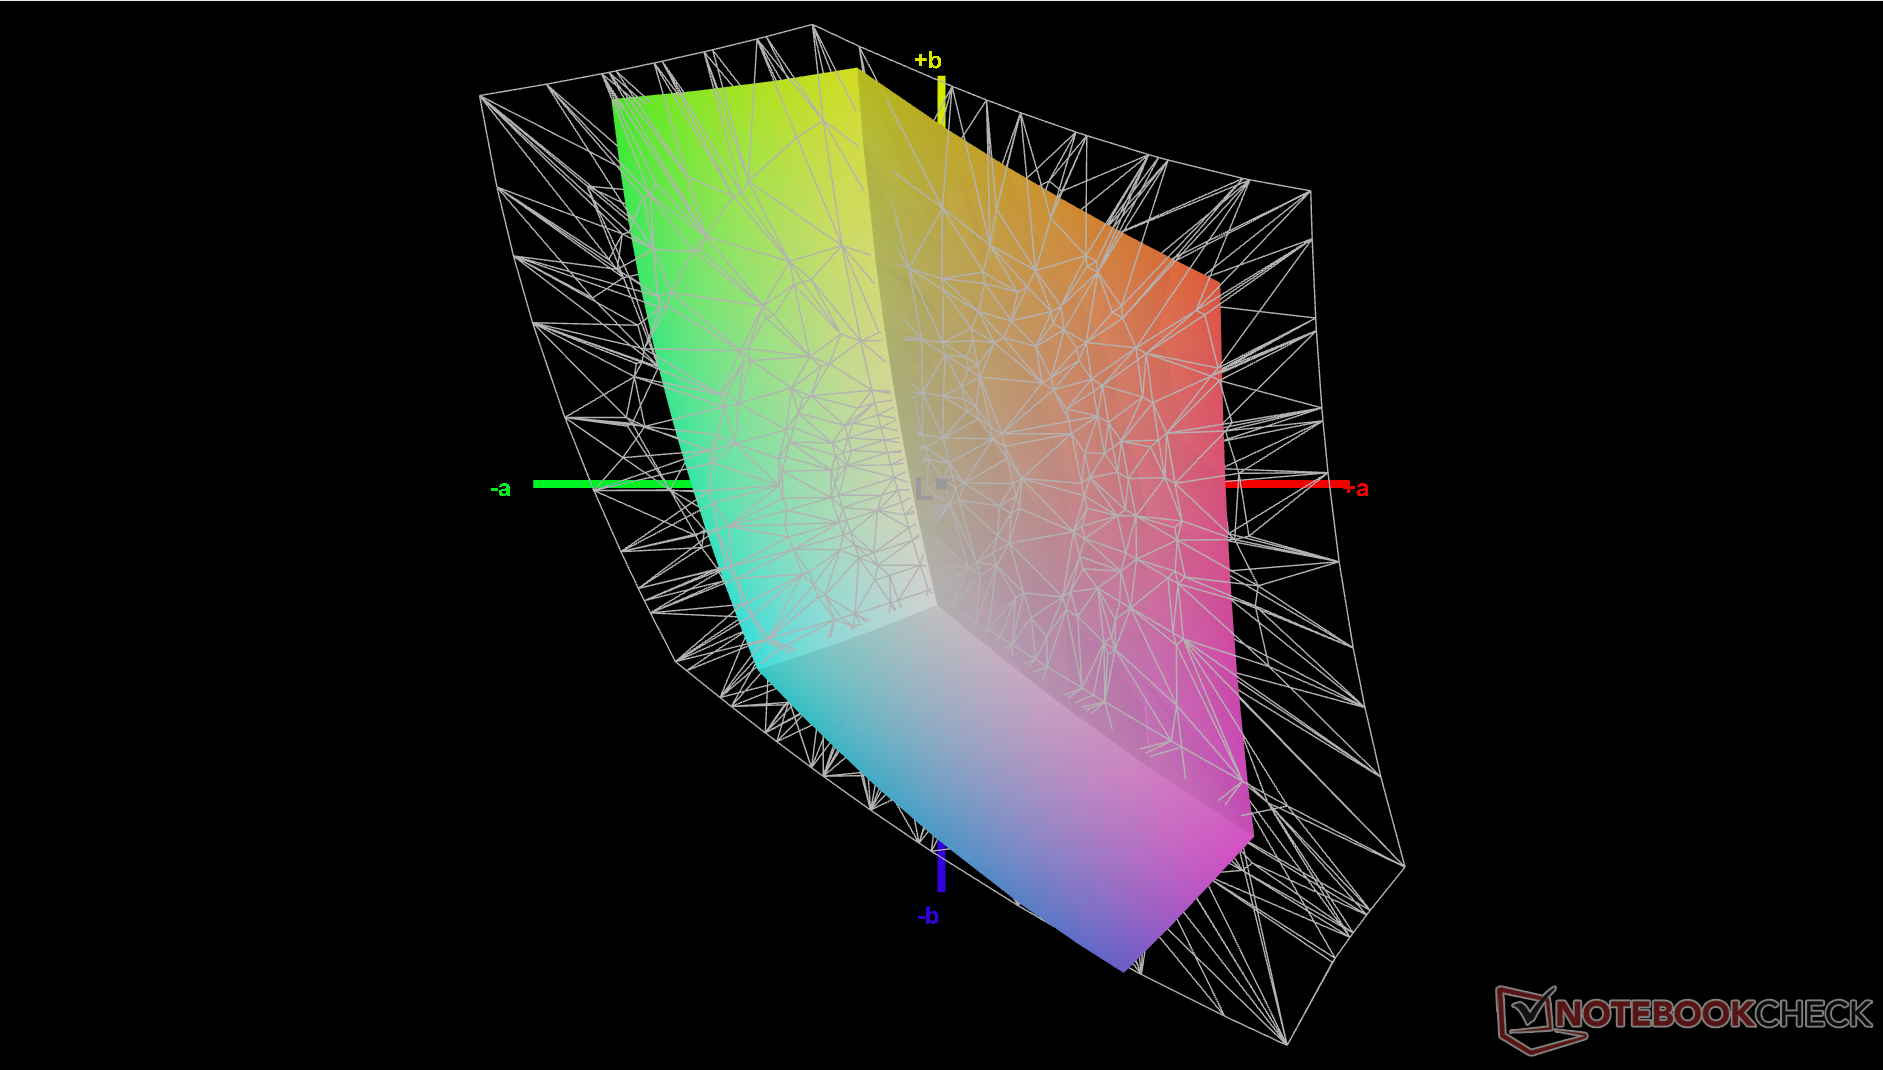
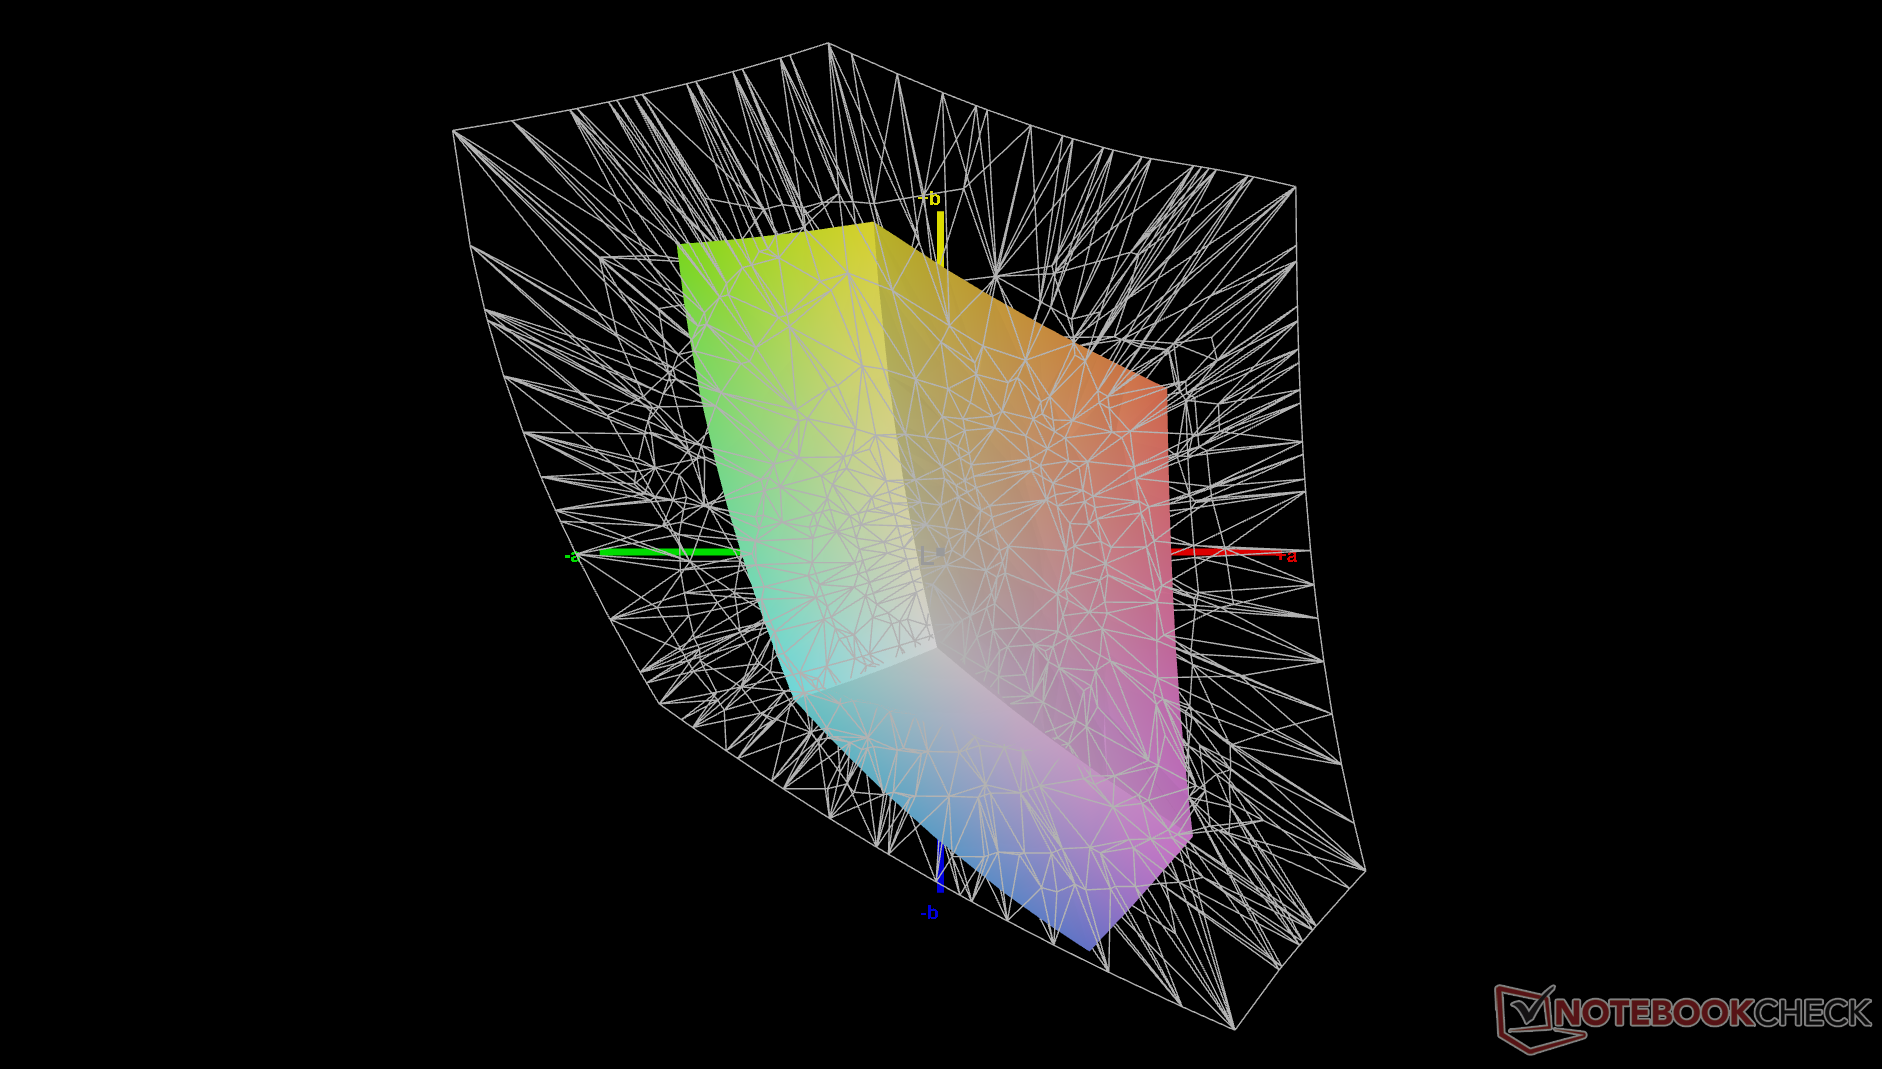
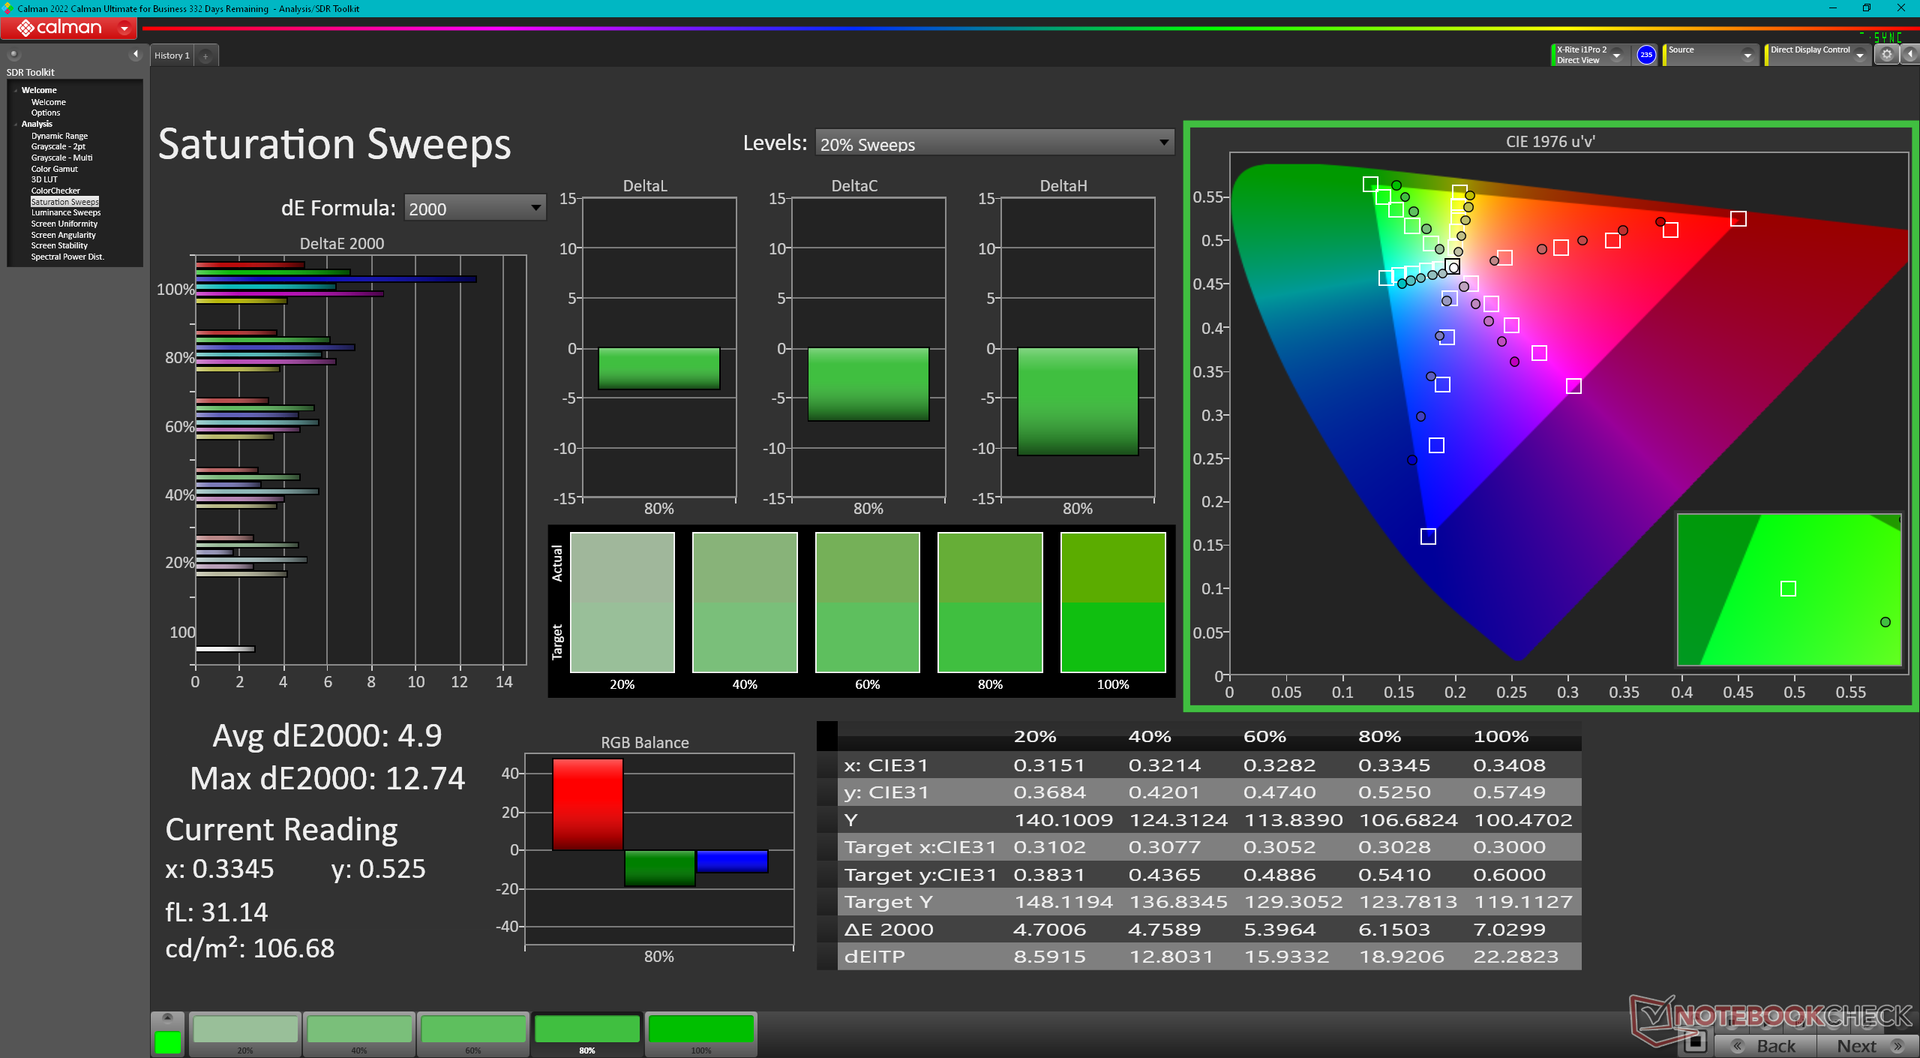
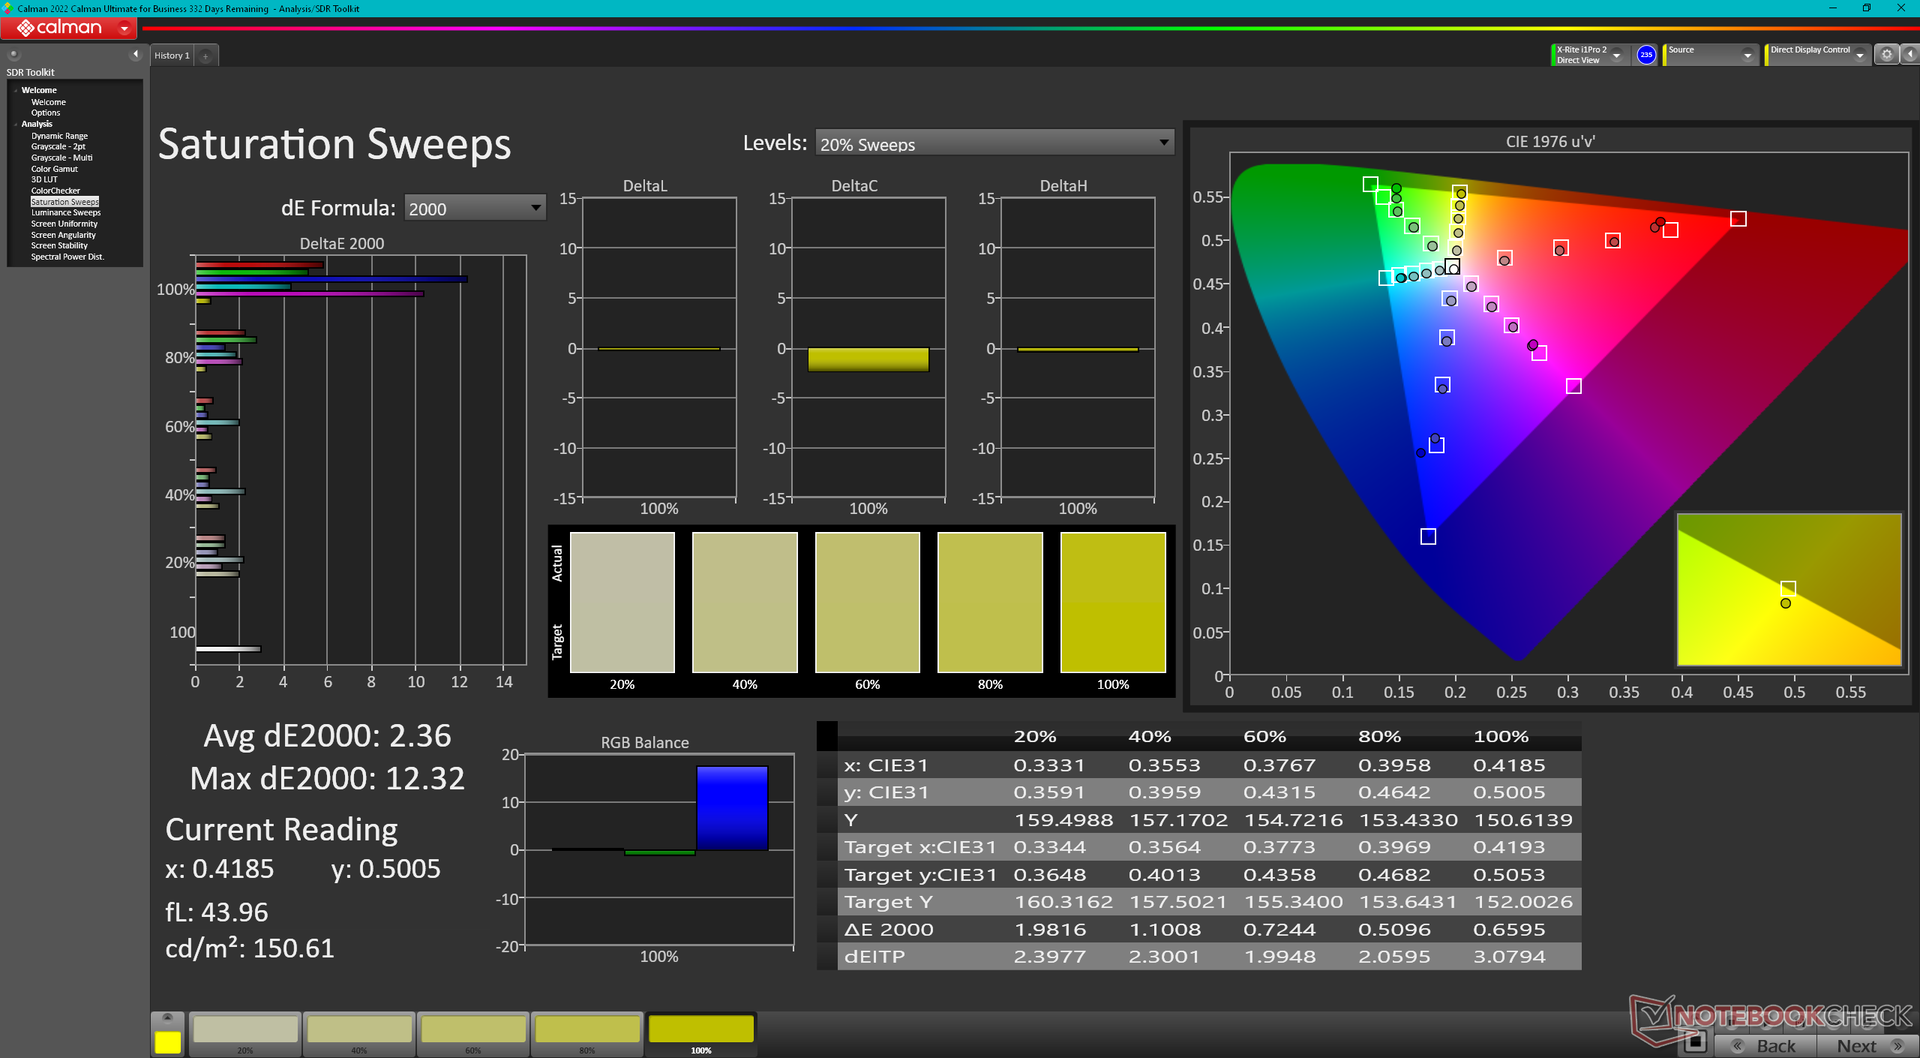
L'étalonnage de l'écran à l'aide d'un colorimètre X-Rite améliorerait légèrement les valeurs moyennes de deltaE en niveaux de gris et en couleurs, qui passeraient respectivement de 3,2 et 3,73 à 2,2 et 2,03. Cependant, les couleurs deviennent de plus en plus imprécises à des niveaux de saturation plus élevés, quoi qu'il arrive, en raison de la couverture étroite des couleurs sRGB mentionnée ci-dessus.
Temps de réponse de l'écran
| ↔ Temps de réponse noir à blanc | ||
|---|---|---|
| 27.6 ms ... hausse ↗ et chute ↘ combinées | ↗ 12.9 ms hausse | 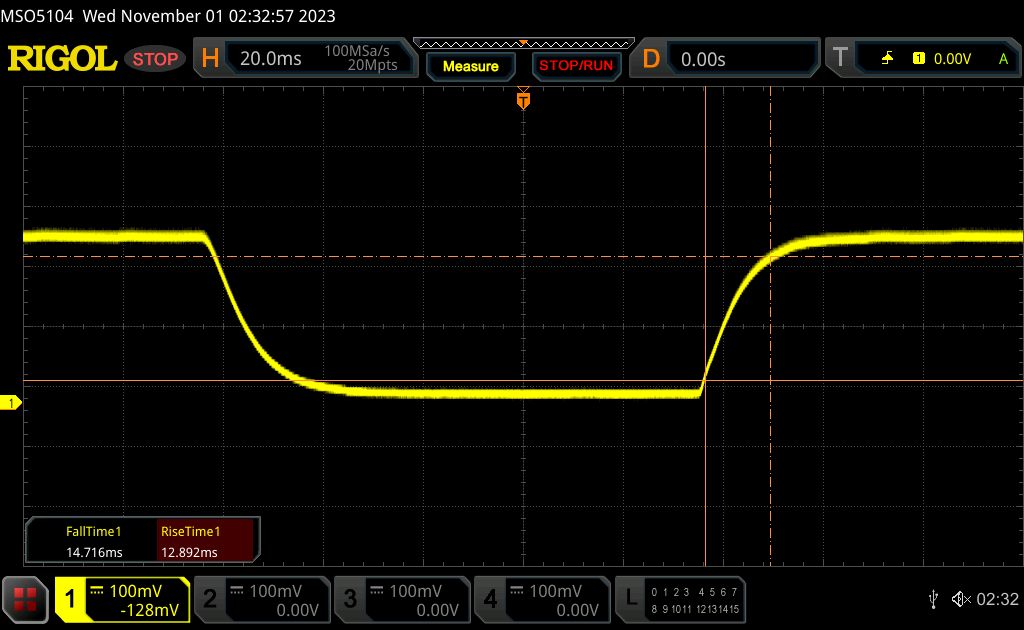 |
| ↘ 14.7 ms chute | ||
| L'écran souffre de latences relativement élevées, insuffisant pour le jeu. En comparaison, tous les appareils testés affichent entre 0.1 (minimum) et 240 (maximum) ms. » 70 % des appareils testés affichent de meilleures performances. Cela signifie que les latences relevées sont moins bonnes que la moyenne (19.9 ms) de tous les appareils testés. | ||
| ↔ Temps de réponse gris 50% à gris 80% | ||
| 46.4 ms ... hausse ↗ et chute ↘ combinées | ↗ 19.5 ms hausse | 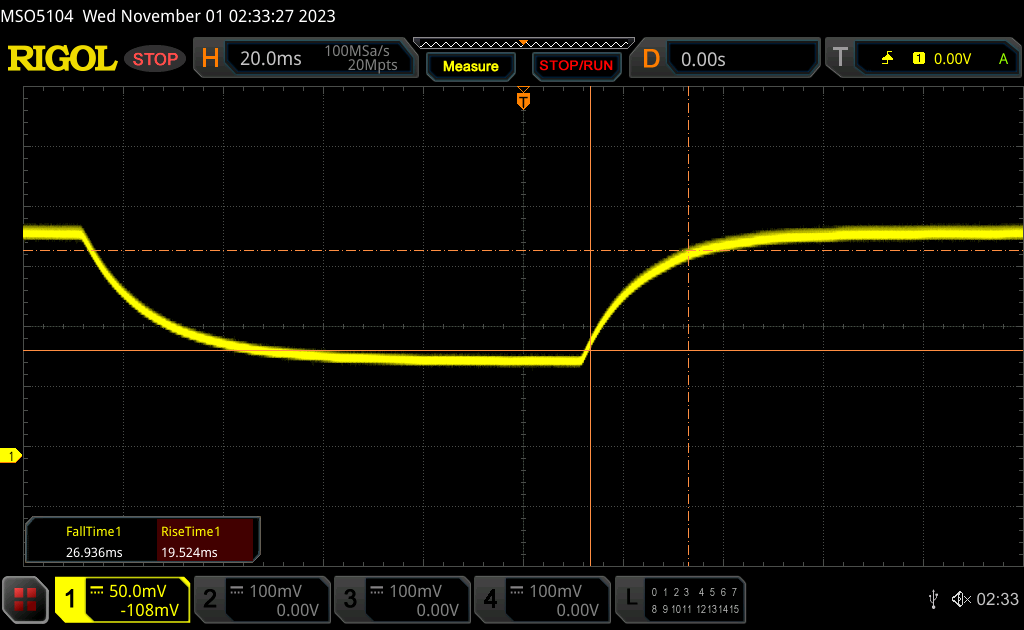 |
| ↘ 26.9 ms chute | ||
| L'écran souffre de latences très élevées, à éviter pour le jeu. En comparaison, tous les appareils testés affichent entre 0.165 (minimum) et 636 (maximum) ms. » 80 % des appareils testés affichent de meilleures performances. Cela signifie que les latences relevées sont moins bonnes que la moyenne (31.1 ms) de tous les appareils testés. | ||
Scintillement / MLI (Modulation de largeur d'impulsion)
| Scintillement / MLI (Modulation de largeur d'impulsion) non décelé | 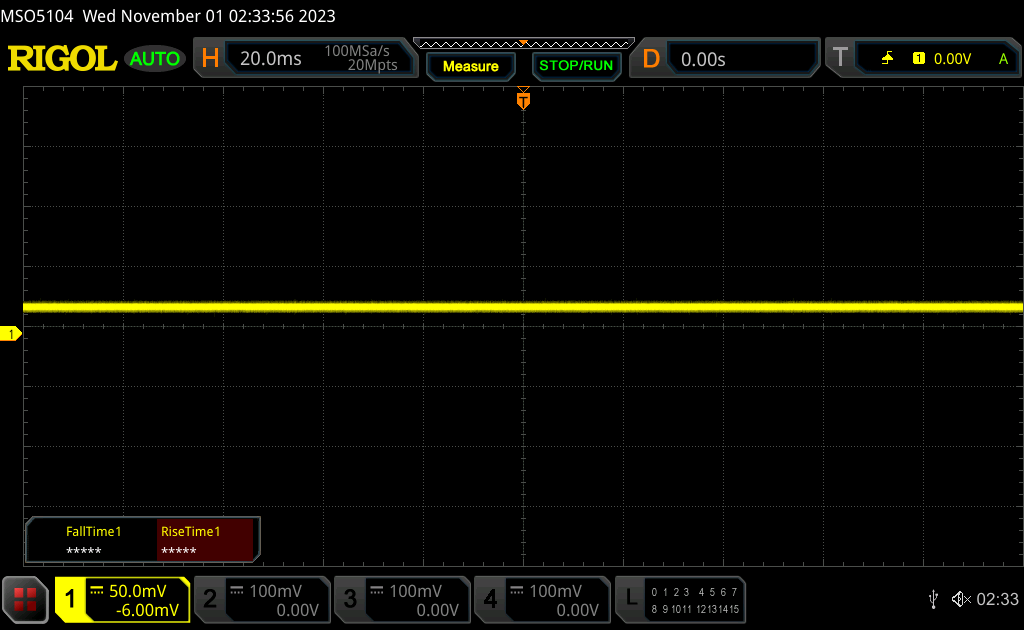 | ||
En comparaison, 52 % des appareils testés n'emploient pas MDI pour assombrir leur écran. Nous avons relevé une moyenne à 7784 (minimum : 5 - maximum : 343500) Hz dans le cas où une MDI était active. | |||
Performance
Conditions d'essai
Nous avons réglé Windows sur le mode Performance avant d'effectuer les tests de référence ci-dessous. Les utilisateurs doivent se familiariser avec le logiciel Vantage intégré, car il s'agit de la plaque tournante pour les fonctions spécifiques à Lenovo et les mises à jour du BIOS.


Processeur
Contrairement à la plupart des autres CPU Core i5 et Core i7, le processeur Core i5-1335U a des performances beaucoup plus proches de celles des processeurs plus coûteux Core i7-1355U que ce que l'on pourrait croire de prime abord. Selon les benchmarks, notre Core i5-1335U est à peine 5 à 10 % plus lent que le Core i7-1355U, ce qui signifie que vous pouvez économiser plusieurs centaines d'euros en optant pour la configuration Core i5 si vous n'êtes pas gêné par le léger déficit de performances du processeur. La principale raison de choisir l'option Core i7 est plutôt liée à sa carte graphique intégrée, comme le montre la section Performances du GPU ci-dessous.
En comparaison avec le Ryzen 7 7730U notre version Intel Core i5 est environ 10 à 15 % plus lente en termes de performances multithread, alors que l'inverse est vrai en ce qui concerne les performances single-thread.
Cinebench R15 Multi Loop
Cinebench R23: Multi Core | Single Core
Cinebench R20: CPU (Multi Core) | CPU (Single Core)
Cinebench R15: CPU Multi 64Bit | CPU Single 64Bit
Blender: v2.79 BMW27 CPU
7-Zip 18.03: 7z b 4 | 7z b 4 -mmt1
Geekbench 5.5: Multi-Core | Single-Core
HWBOT x265 Benchmark v2.2: 4k Preset
LibreOffice : 20 Documents To PDF
R Benchmark 2.5: Overall mean
* ... Moindre est la valeur, meilleures sont les performances
AIDA64: FP32 Ray-Trace | FPU Julia | CPU SHA3 | CPU Queen | FPU SinJulia | FPU Mandel | CPU AES | CPU ZLib | FP64 Ray-Trace | CPU PhotoWorxx
| Performance rating | |
| Lenovo ThinkPad E16 G1-21JUS08X00 | |
| Samsung Galaxy Book3 Pro 16 | |
| Dell Inspiron 16 7635 2-in-1 | |
| Acer TravelMate P4 TMP416-51-55KN | |
| Lenovo ThinkPad E16 G1 Core i5-1335U | |
| Moyenne Intel Core i5-1335U | |
| LG Gram 16Z90Q | |
| AIDA64 / FP32 Ray-Trace | |
| Lenovo ThinkPad E16 G1-21JUS08X00 | |
| Dell Inspiron 16 7635 2-in-1 | |
| Acer TravelMate P4 TMP416-51-55KN | |
| Samsung Galaxy Book3 Pro 16 | |
| Lenovo ThinkPad E16 G1 Core i5-1335U | |
| Moyenne Intel Core i5-1335U (5661 - 7809, n=11) | |
| LG Gram 16Z90Q | |
| AIDA64 / FPU Julia | |
| Lenovo ThinkPad E16 G1-21JUS08X00 | |
| Dell Inspiron 16 7635 2-in-1 | |
| Samsung Galaxy Book3 Pro 16 | |
| Acer TravelMate P4 TMP416-51-55KN | |
| Lenovo ThinkPad E16 G1 Core i5-1335U | |
| Moyenne Intel Core i5-1335U (29483 - 43636, n=11) | |
| LG Gram 16Z90Q | |
| AIDA64 / CPU SHA3 | |
| Samsung Galaxy Book3 Pro 16 | |
| Lenovo ThinkPad E16 G1-21JUS08X00 | |
| Acer TravelMate P4 TMP416-51-55KN | |
| Lenovo ThinkPad E16 G1 Core i5-1335U | |
| Dell Inspiron 16 7635 2-in-1 | |
| Moyenne Intel Core i5-1335U (1515 - 2278, n=11) | |
| LG Gram 16Z90Q | |
| AIDA64 / CPU Queen | |
| Lenovo ThinkPad E16 G1-21JUS08X00 | |
| Samsung Galaxy Book3 Pro 16 | |
| Acer TravelMate P4 TMP416-51-55KN | |
| LG Gram 16Z90Q | |
| Dell Inspiron 16 7635 2-in-1 | |
| Lenovo ThinkPad E16 G1 Core i5-1335U | |
| Moyenne Intel Core i5-1335U (53839 - 60992, n=11) | |
| AIDA64 / FPU SinJulia | |
| Lenovo ThinkPad E16 G1-21JUS08X00 | |
| Dell Inspiron 16 7635 2-in-1 | |
| Samsung Galaxy Book3 Pro 16 | |
| Acer TravelMate P4 TMP416-51-55KN | |
| Lenovo ThinkPad E16 G1 Core i5-1335U | |
| LG Gram 16Z90Q | |
| Moyenne Intel Core i5-1335U (3873 - 5008, n=11) | |
| AIDA64 / FPU Mandel | |
| Lenovo ThinkPad E16 G1-21JUS08X00 | |
| Dell Inspiron 16 7635 2-in-1 | |
| Samsung Galaxy Book3 Pro 16 | |
| Acer TravelMate P4 TMP416-51-55KN | |
| Lenovo ThinkPad E16 G1 Core i5-1335U | |
| Moyenne Intel Core i5-1335U (14376 - 20553, n=11) | |
| LG Gram 16Z90Q | |
| AIDA64 / CPU ZLib | |
| Samsung Galaxy Book3 Pro 16 | |
| Acer TravelMate P4 TMP416-51-55KN | |
| Lenovo ThinkPad E16 G1 Core i5-1335U | |
| Lenovo ThinkPad E16 G1-21JUS08X00 | |
| Dell Inspiron 16 7635 2-in-1 | |
| Moyenne Intel Core i5-1335U (378 - 676, n=11) | |
| LG Gram 16Z90Q | |
| AIDA64 / FP64 Ray-Trace | |
| Lenovo ThinkPad E16 G1-21JUS08X00 | |
| Dell Inspiron 16 7635 2-in-1 | |
| Acer TravelMate P4 TMP416-51-55KN | |
| Samsung Galaxy Book3 Pro 16 | |
| Lenovo ThinkPad E16 G1 Core i5-1335U | |
| LG Gram 16Z90Q | |
| Moyenne Intel Core i5-1335U (2878 - 4214, n=11) | |
| AIDA64 / CPU PhotoWorxx | |
| Samsung Galaxy Book3 Pro 16 | |
| LG Gram 16Z90Q | |
| Moyenne Intel Core i5-1335U (13584 - 41123, n=11) | |
| Acer TravelMate P4 TMP416-51-55KN | |
| Lenovo ThinkPad E16 G1 Core i5-1335U | |
| Dell Inspiron 16 7635 2-in-1 | |
| Lenovo ThinkPad E16 G1-21JUS08X00 | |
Performance du système
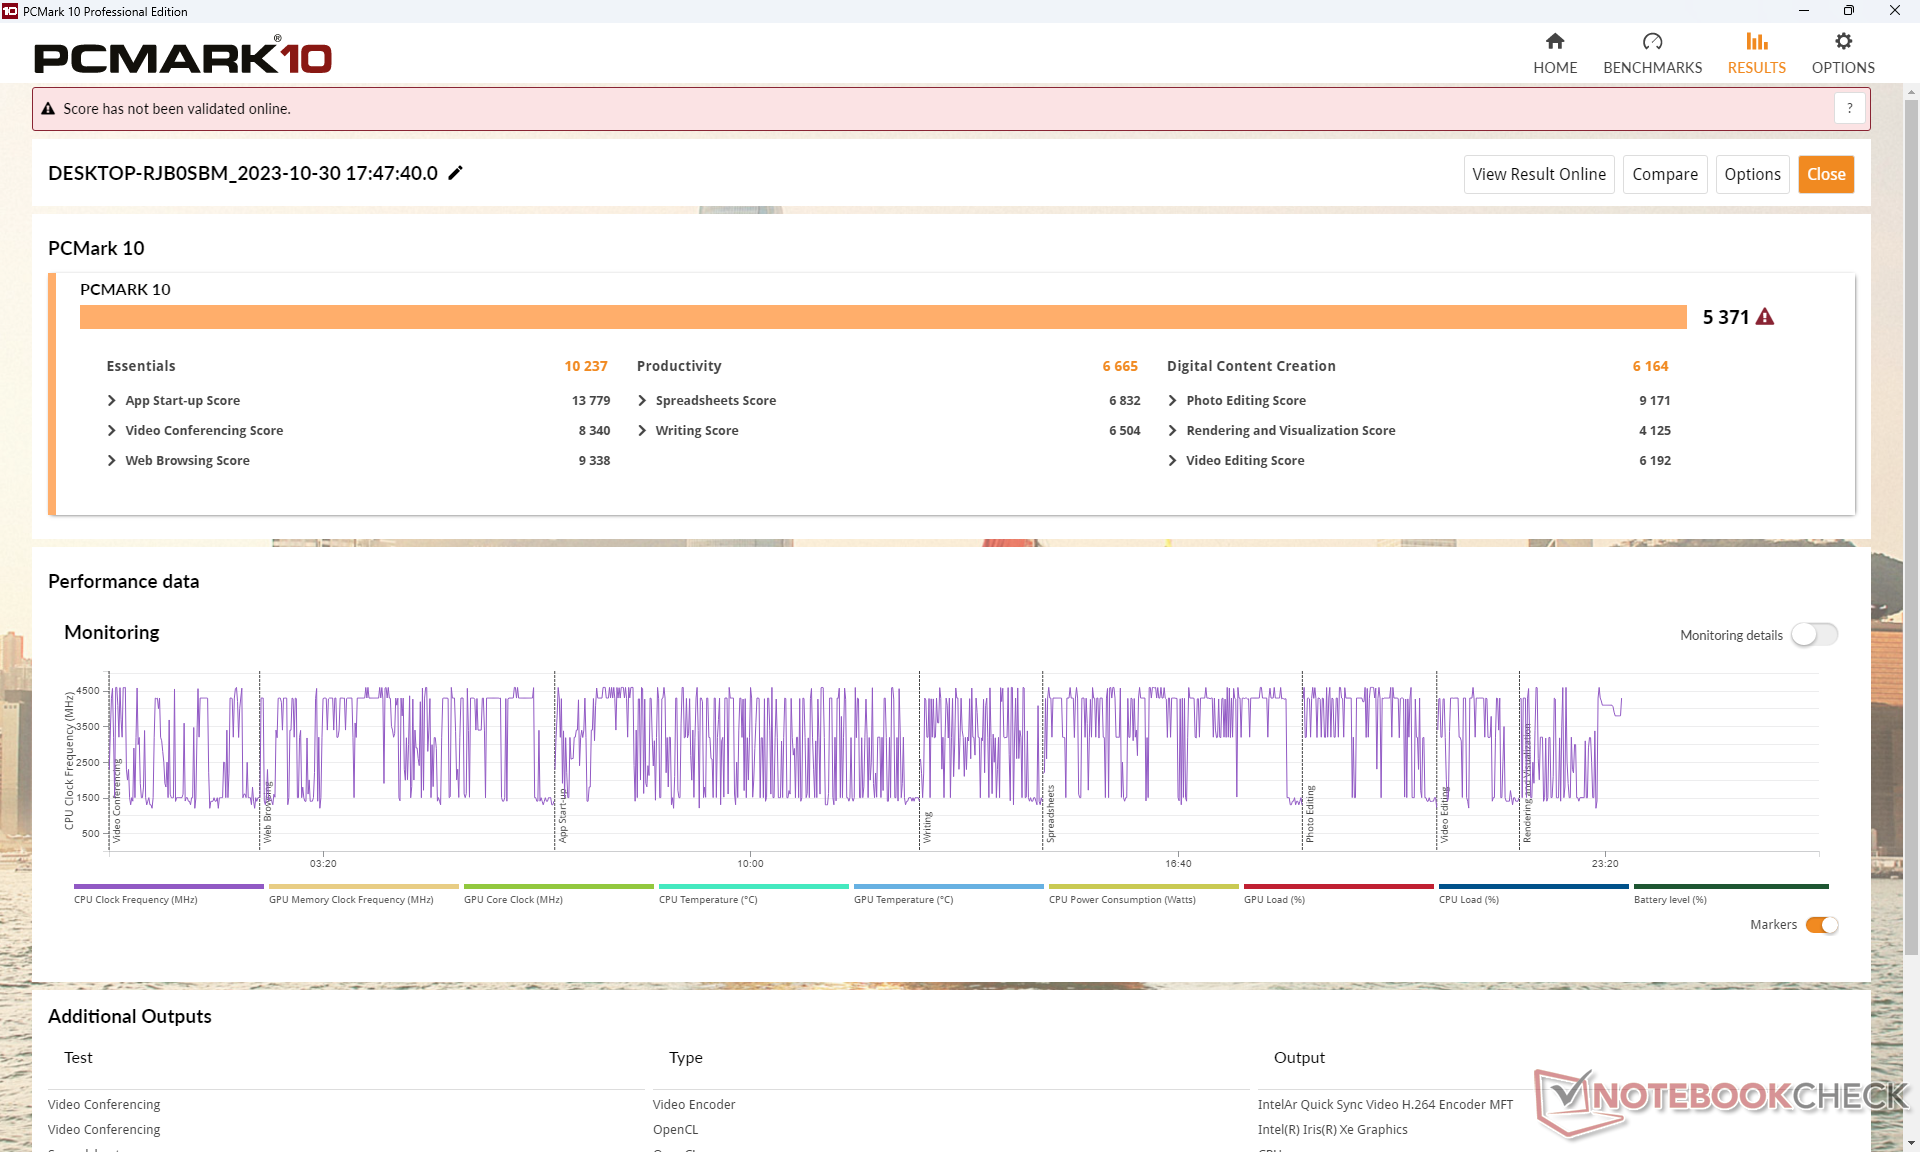
Les résultats de PCMark sont au coude à coude avec l'alternative Ryzen 7 AMD, sauf dans le sous-test Productivité, en raison des performances multithread supérieures de la Ryzen 7 7730U par rapport à notre Core i5-1335U.
CrossMark: Overall | Productivity | Creativity | Responsiveness
| PCMark 10 / Score | |
| Dell Inspiron 16 7635 2-in-1 | |
| Lenovo ThinkPad E16 G1-21JUS08X00 | |
| Samsung Galaxy Book3 Pro 16 | |
| Lenovo ThinkPad E16 G1 Core i5-1335U | |
| Moyenne Intel Core i5-1335U, Intel Iris Xe Graphics G7 80EUs (5068 - 5600, n=11) | |
| Acer TravelMate P4 TMP416-51-55KN | |
| LG Gram 16Z90Q | |
| PCMark 10 / Essentials | |
| Dell Inspiron 16 7635 2-in-1 | |
| Samsung Galaxy Book3 Pro 16 | |
| Lenovo ThinkPad E16 G1-21JUS08X00 | |
| Moyenne Intel Core i5-1335U, Intel Iris Xe Graphics G7 80EUs (9828 - 11912, n=11) | |
| Lenovo ThinkPad E16 G1 Core i5-1335U | |
| LG Gram 16Z90Q | |
| Acer TravelMate P4 TMP416-51-55KN | |
| PCMark 10 / Productivity | |
| Dell Inspiron 16 7635 2-in-1 | |
| Lenovo ThinkPad E16 G1-21JUS08X00 | |
| Moyenne Intel Core i5-1335U, Intel Iris Xe Graphics G7 80EUs (6196 - 7261, n=11) | |
| Acer TravelMate P4 TMP416-51-55KN | |
| Samsung Galaxy Book3 Pro 16 | |
| Lenovo ThinkPad E16 G1 Core i5-1335U | |
| LG Gram 16Z90Q | |
| PCMark 10 / Digital Content Creation | |
| Samsung Galaxy Book3 Pro 16 | |
| Acer TravelMate P4 TMP416-51-55KN | |
| Lenovo ThinkPad E16 G1 Core i5-1335U | |
| Lenovo ThinkPad E16 G1-21JUS08X00 | |
| LG Gram 16Z90Q | |
| Dell Inspiron 16 7635 2-in-1 | |
| Moyenne Intel Core i5-1335U, Intel Iris Xe Graphics G7 80EUs (5361 - 6164, n=11) | |
| CrossMark / Overall | |
| Samsung Galaxy Book3 Pro 16 | |
| Acer TravelMate P4 TMP416-51-55KN | |
| Moyenne Intel Core i5-1335U, Intel Iris Xe Graphics G7 80EUs (1339 - 1599, n=11) | |
| Lenovo ThinkPad E16 G1 Core i5-1335U | |
| Lenovo ThinkPad E16 G1-21JUS08X00 | |
| Dell Inspiron 16 7635 2-in-1 | |
| CrossMark / Productivity | |
| Samsung Galaxy Book3 Pro 16 | |
| Acer TravelMate P4 TMP416-51-55KN | |
| Moyenne Intel Core i5-1335U, Intel Iris Xe Graphics G7 80EUs (1337 - 1638, n=11) | |
| Lenovo ThinkPad E16 G1 Core i5-1335U | |
| Lenovo ThinkPad E16 G1-21JUS08X00 | |
| Dell Inspiron 16 7635 2-in-1 | |
| CrossMark / Creativity | |
| Samsung Galaxy Book3 Pro 16 | |
| Acer TravelMate P4 TMP416-51-55KN | |
| Moyenne Intel Core i5-1335U, Intel Iris Xe Graphics G7 80EUs (1315 - 1620, n=11) | |
| Lenovo ThinkPad E16 G1 Core i5-1335U | |
| Lenovo ThinkPad E16 G1-21JUS08X00 | |
| Dell Inspiron 16 7635 2-in-1 | |
| CrossMark / Responsiveness | |
| Acer TravelMate P4 TMP416-51-55KN | |
| Samsung Galaxy Book3 Pro 16 | |
| Moyenne Intel Core i5-1335U, Intel Iris Xe Graphics G7 80EUs (1023 - 1868, n=11) | |
| Lenovo ThinkPad E16 G1 Core i5-1335U | |
| Lenovo ThinkPad E16 G1-21JUS08X00 | |
| Dell Inspiron 16 7635 2-in-1 | |
| PCMark 10 Score | 5371 points | |
Aide | ||
| AIDA64 / Memory Copy | |
| LG Gram 16Z90Q | |
| Samsung Galaxy Book3 Pro 16 | |
| Moyenne Intel Core i5-1335U (22417 - 60884, n=11) | |
| Acer TravelMate P4 TMP416-51-55KN | |
| Dell Inspiron 16 7635 2-in-1 | |
| Lenovo ThinkPad E16 G1 Core i5-1335U | |
| Lenovo ThinkPad E16 G1-21JUS08X00 | |
| AIDA64 / Memory Read | |
| LG Gram 16Z90Q | |
| Samsung Galaxy Book3 Pro 16 | |
| Acer TravelMate P4 TMP416-51-55KN | |
| Moyenne Intel Core i5-1335U (23104 - 61555, n=11) | |
| Dell Inspiron 16 7635 2-in-1 | |
| Lenovo ThinkPad E16 G1-21JUS08X00 | |
| Lenovo ThinkPad E16 G1 Core i5-1335U | |
| AIDA64 / Memory Write | |
| Samsung Galaxy Book3 Pro 16 | |
| LG Gram 16Z90Q | |
| Moyenne Intel Core i5-1335U (22936 - 72584, n=11) | |
| Acer TravelMate P4 TMP416-51-55KN | |
| Lenovo ThinkPad E16 G1 Core i5-1335U | |
| Dell Inspiron 16 7635 2-in-1 | |
| Lenovo ThinkPad E16 G1-21JUS08X00 | |
| AIDA64 / Memory Latency | |
| Dell Inspiron 16 7635 2-in-1 | |
| LG Gram 16Z90Q | |
| Moyenne Intel Core i5-1335U (78.6 - 112.8, n=11) | |
| Samsung Galaxy Book3 Pro 16 | |
| Lenovo ThinkPad E16 G1-21JUS08X00 | |
| Lenovo ThinkPad E16 G1 Core i5-1335U | |
| Acer TravelMate P4 TMP416-51-55KN | |
* ... Moindre est la valeur, meilleures sont les performances
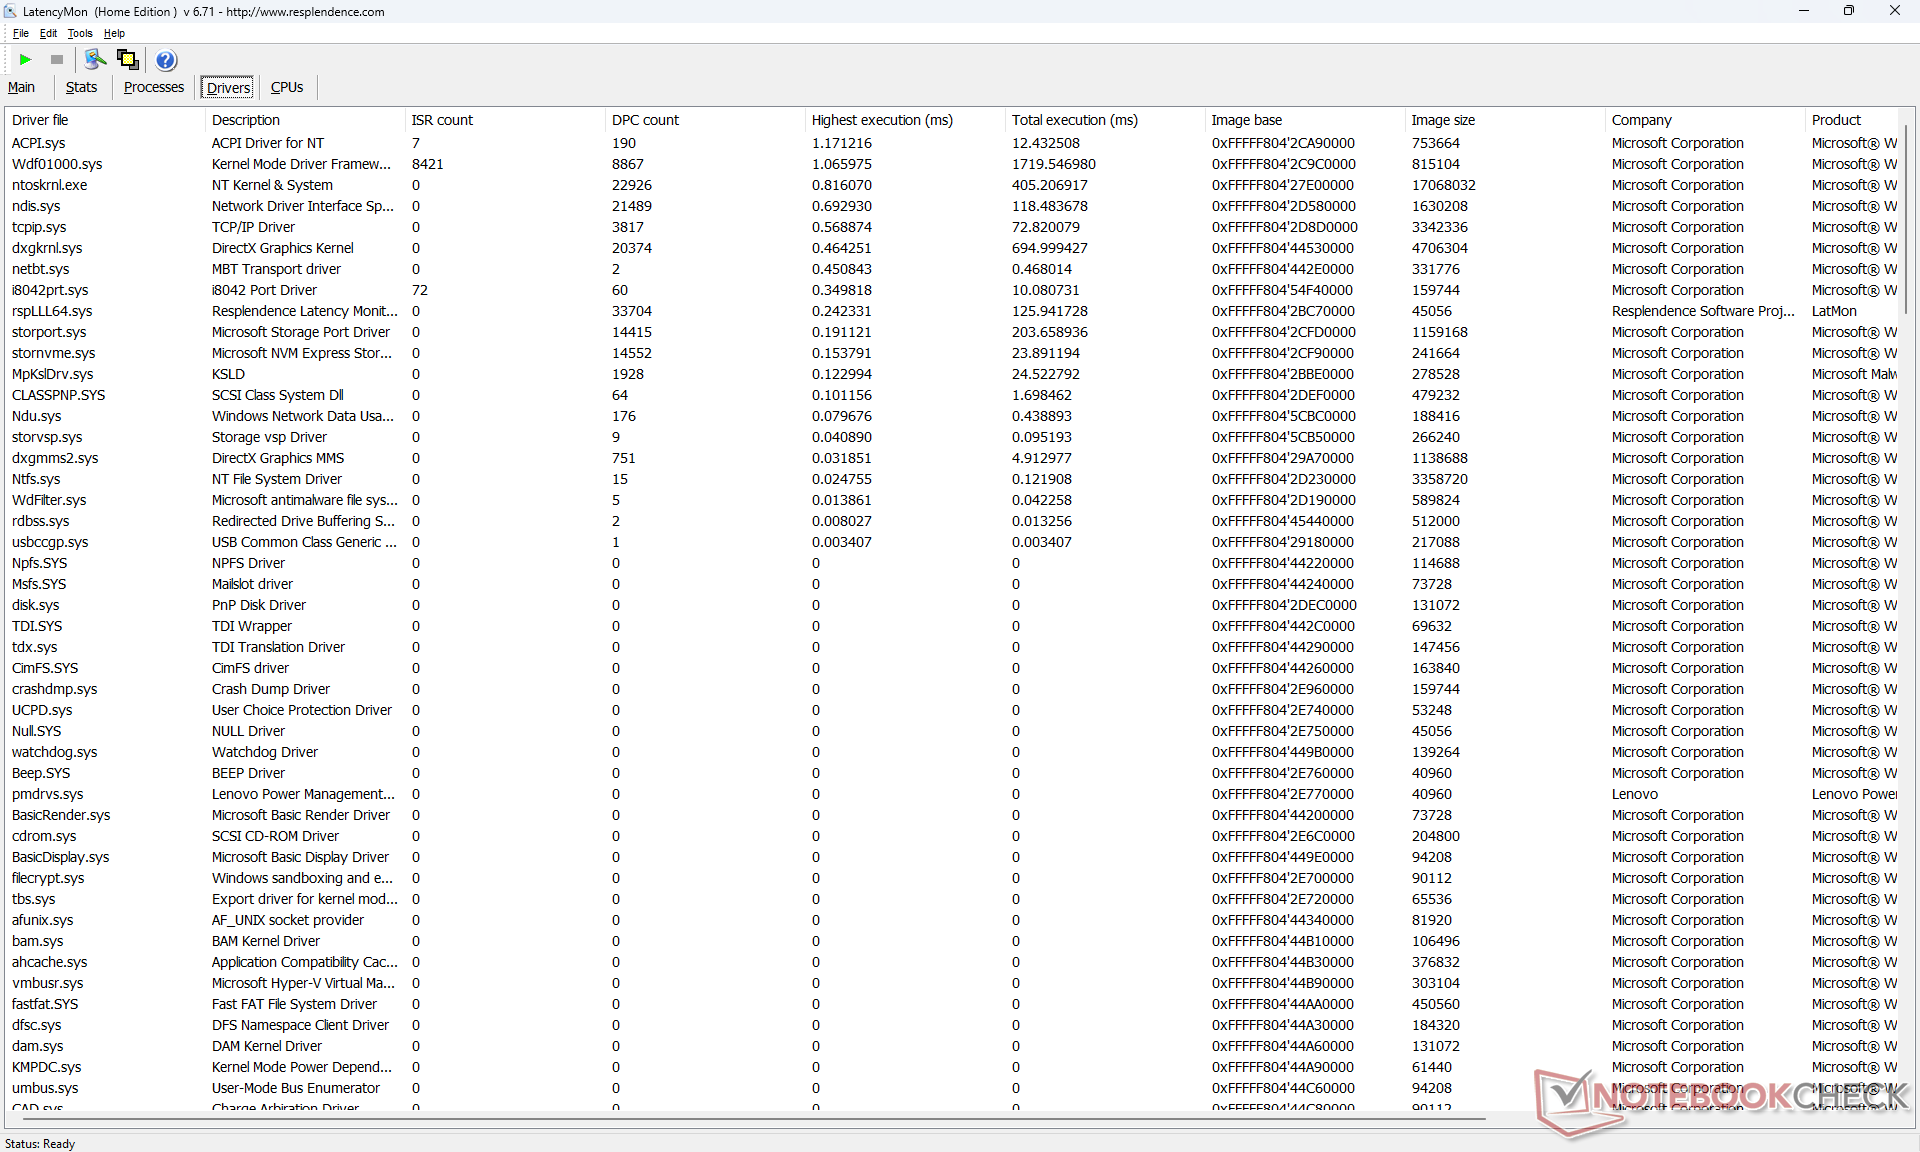
Latence DPC
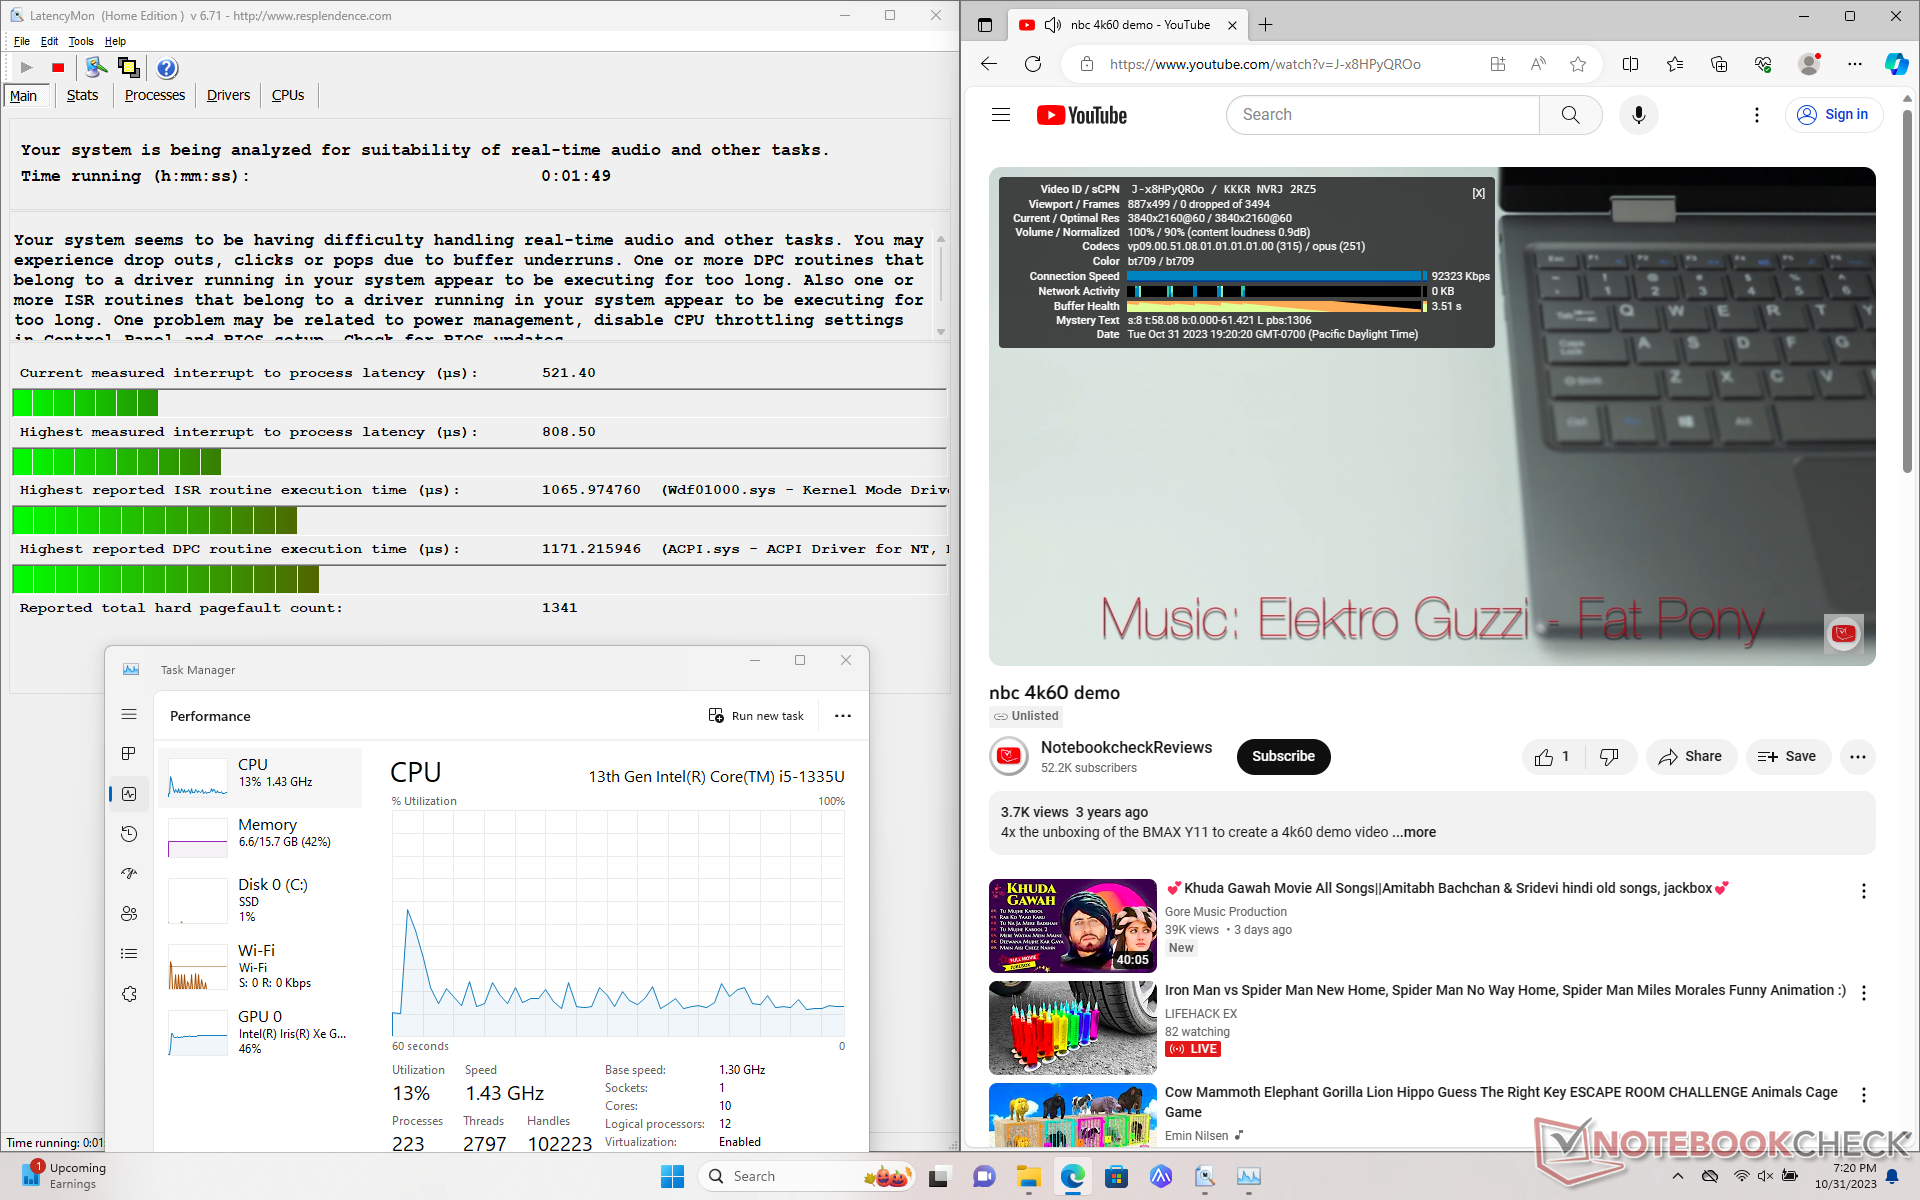
LatencyMon ne révèle que des problèmes mineurs de DPC lors de l'ouverture de plusieurs onglets de notre page d'accueil. la lecture de vidéos 4K à 60 FPS est par ailleurs parfaitement fluide, sans aucune perte d'images.
| DPC Latencies / LatencyMon - interrupt to process latency (max), Web, Youtube, Prime95 | |
| Acer TravelMate P4 TMP416-51-55KN | |
| LG Gram 16Z90Q | |
| Lenovo ThinkPad E16 G1-21JUS08X00 | |
| Lenovo ThinkPad E16 G1 Core i5-1335U | |
| Dell Inspiron 16 7635 2-in-1 | |
| Samsung Galaxy Book3 Pro 16 | |
* ... Moindre est la valeur, meilleures sont les performances
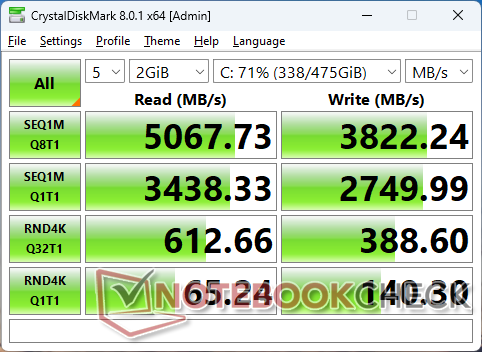
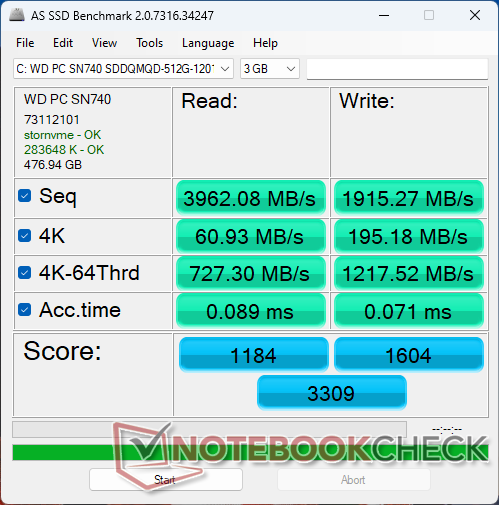
Dispositifs de stockage
Notre unité de test comprend le Western Digital SN740 qui est un SSD NVMe PCIe4 x4 de milieu de gamme offrant des taux de lecture et d'écriture séquentiels réels allant jusqu'à 5100 Mo/s et 3900 Mo/s, respectivement. Le disque 2242 n'aurait aucun problème à maintenir ces taux maximums malgré l'absence de coussinets thermiques ou d'aides au refroidissement.

* ... Moindre est la valeur, meilleures sont les performances
Disk Throttling: DiskSpd Read Loop, Queue Depth 8
Performance du GPU
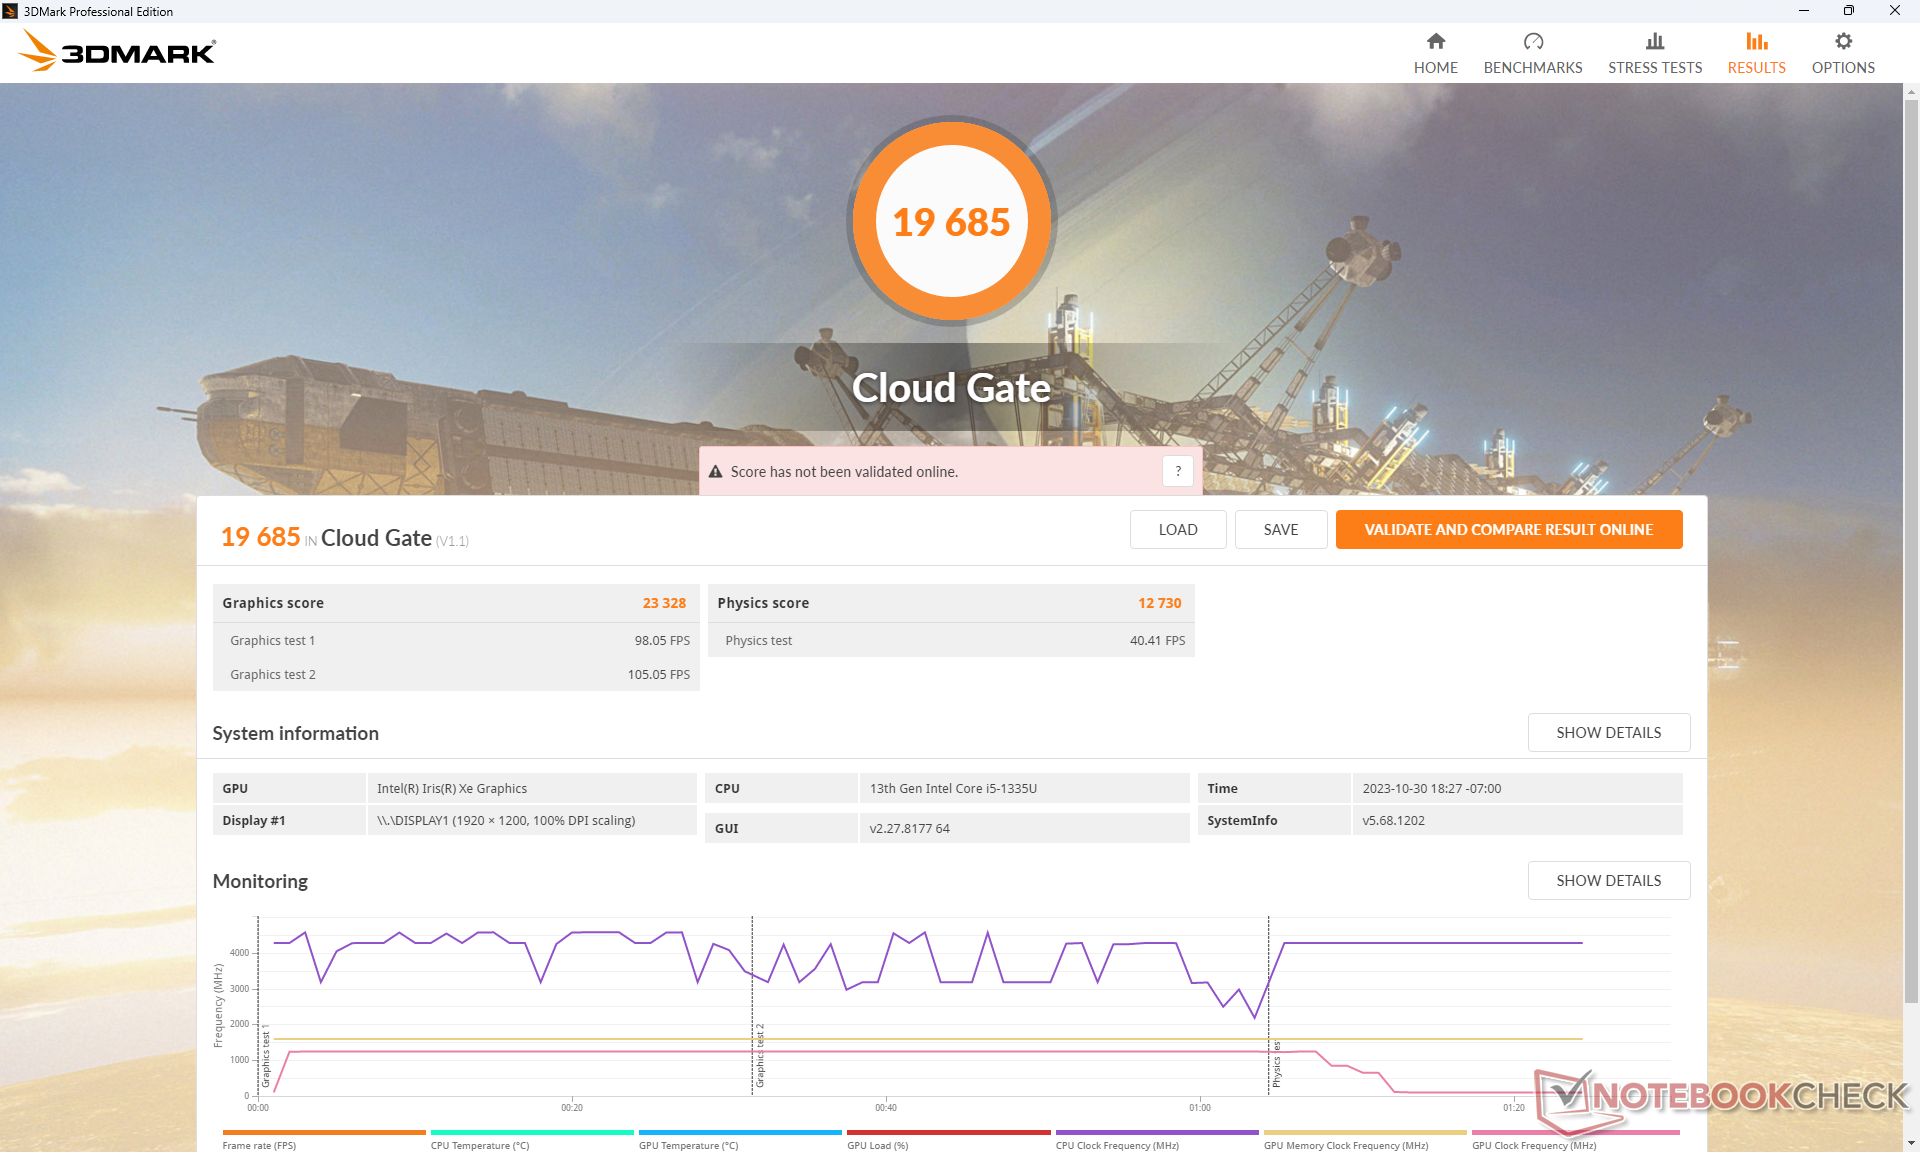
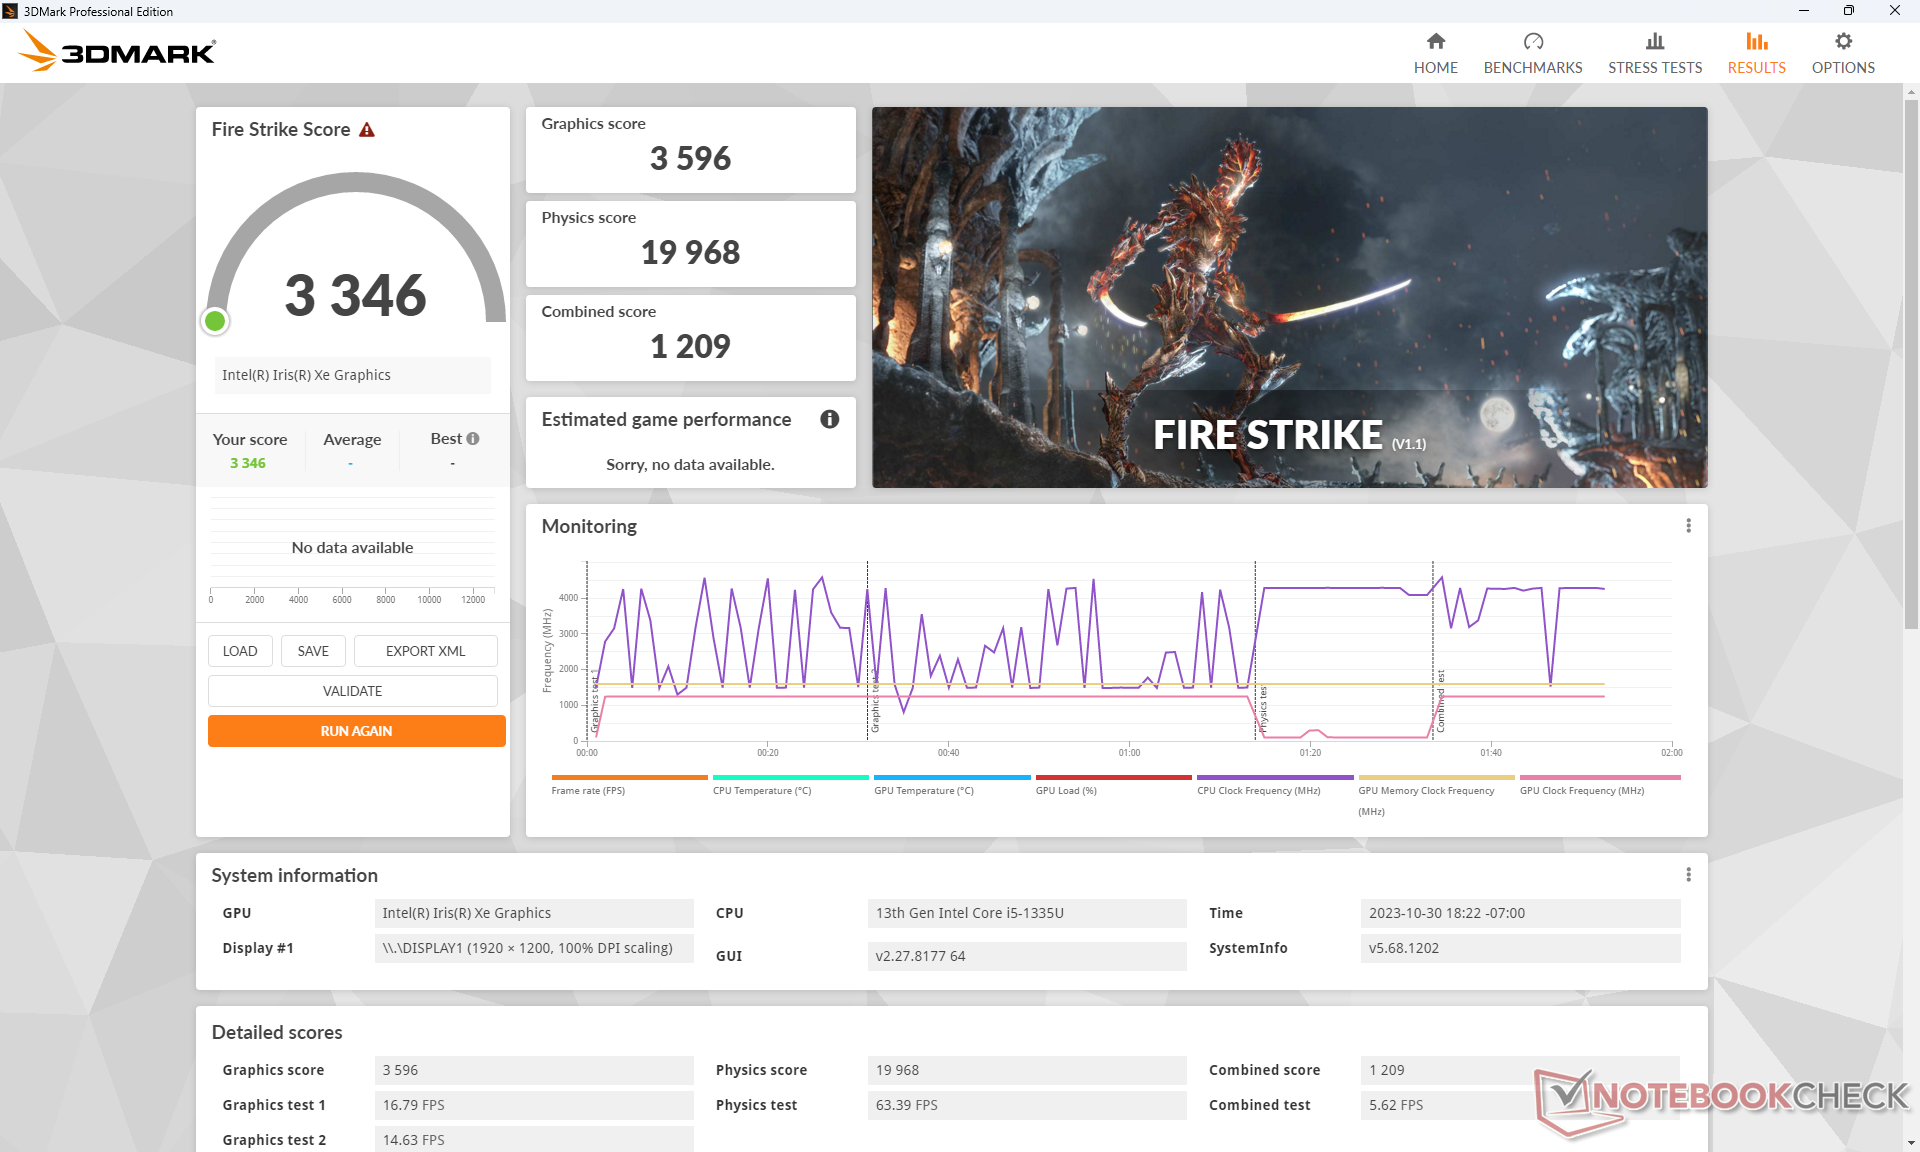
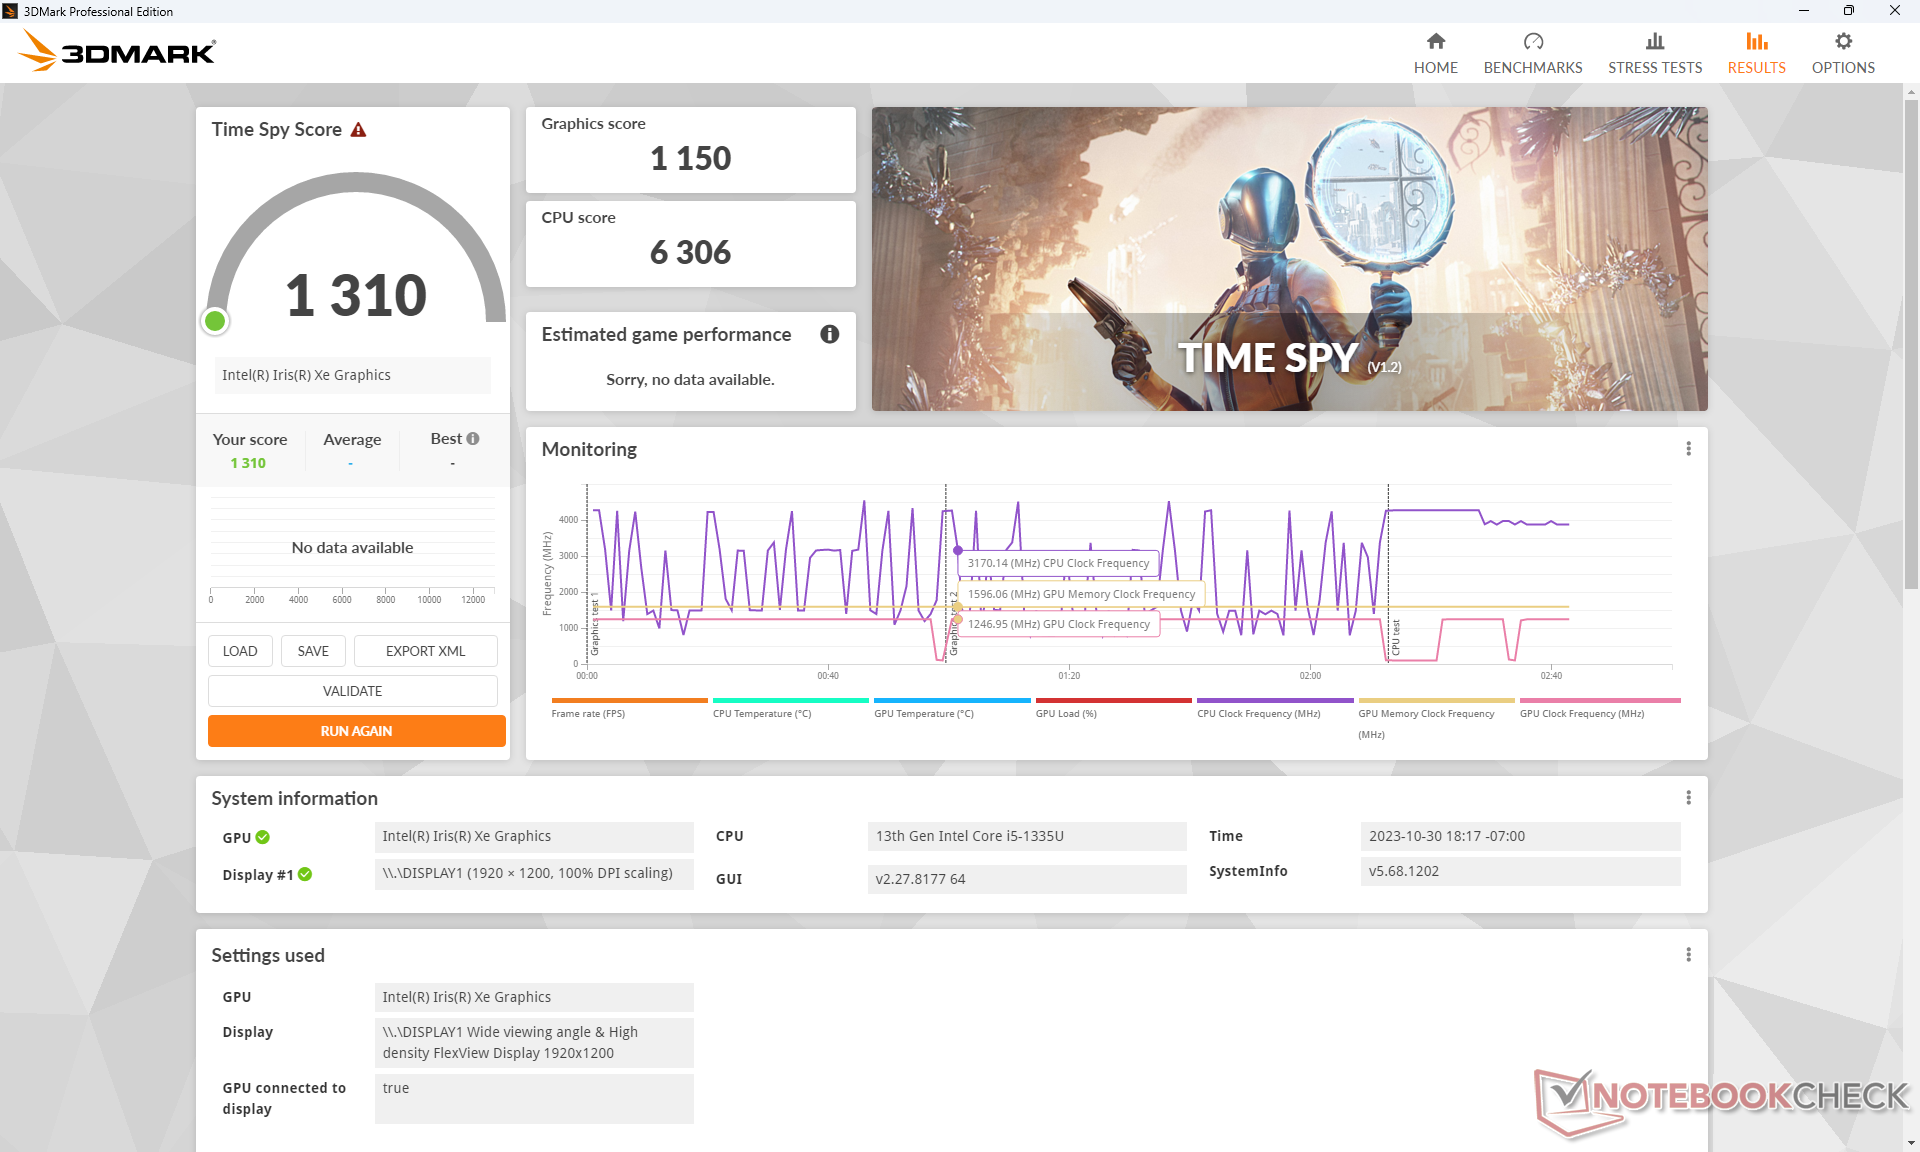
Notre système intégré Iris Xe 80 EUs se comporte comme prévu par rapport à d'autres ordinateurs portables équipés du même GPU, si ce n'est un peu plus lentement. En passant à la configuration Core i7 avec Iris Xe 96 EUs ou GeForce MX550 augmenterait les performances d'environ 25 à 30 % ou 70 à 100 %, respectivement.
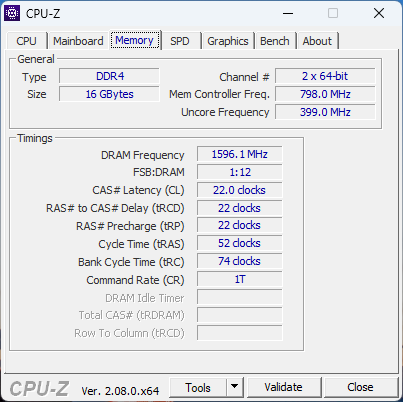
Veillez à configurer votre ordinateur avec une mémoire vive à double canal, faute de quoi les performances de l'iGPU en pâtiront considérablement.
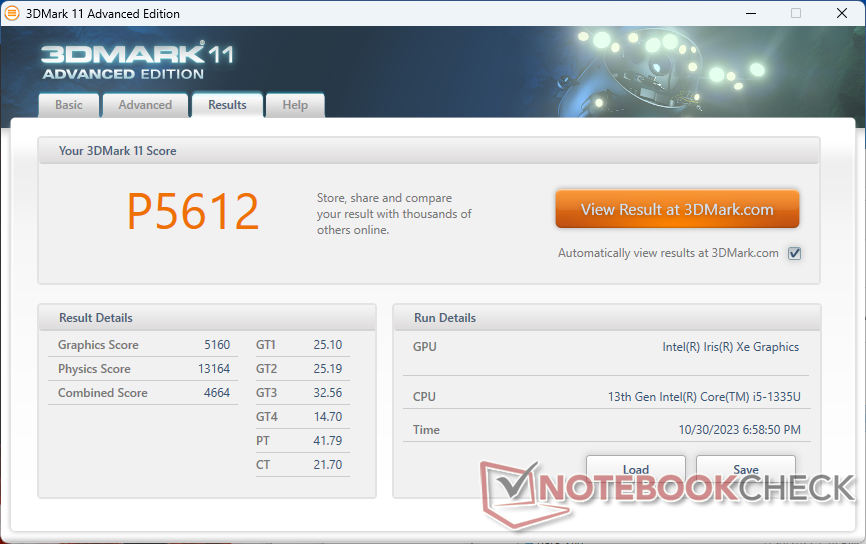
| 3DMark 11 Performance | 5612 points | |
| 3DMark Cloud Gate Standard Score | 19685 points | |
| 3DMark Fire Strike Score | 3346 points | |
| 3DMark Time Spy Score | 1310 points | |
Aide | ||
* ... Moindre est la valeur, meilleures sont les performances
Les taux de rafraîchissement au ralenti sur Witcher 3 chutaient assez fortement au début du test, ce qui laissait supposer une activité de fond interrompue. Heureusement, ce phénomène ne s'est pas reproduit pendant le reste du test.
Witcher 3 FPS Chart
| Bas | Moyen | Élevé | Ultra | |
|---|---|---|---|---|
| GTA V (2015) | 84.5 | 68.8 | 13.2 | 5.41 |
| The Witcher 3 (2015) | 73.6 | 45.1 | 22.1 | 11.1 |
| Dota 2 Reborn (2015) | 100.7 | 75.2 | 49.2 | 45 |
| Final Fantasy XV Benchmark (2018) | 31 | 16.9 | 12.1 | |
| X-Plane 11.11 (2018) | 28.6 | 22.5 | 21 | |
| Far Cry 5 (2018) | 40 | 19 | 18 | 17 |
| Strange Brigade (2018) | 70.3 | 27.3 | 22.4 | 18.3 |
| Cyberpunk 2077 1.6 (2022) | 14.1 | |||
| Tiny Tina's Wonderlands (2022) | 20.6 | 15.3 | 10.4 | 8.1 |
| F1 22 (2022) | 32.8 | 29.1 | 21.3 | 16.5 |
Émissions
Bruit du système
Le bruit du ventilateur est généralement plus fort que celui que nous avons constaté sur la version Ryzen 7, probablement en raison de la demande de puissance plus élevée de notre version Intel. La version AMD est capable de rester silencieuse plus longtemps lorsqu'elle est soumise à un stress. Lors de l'exécution de 3DMark 06, par exemple, le bruit du ventilateur reste relativement silencieux à un peu moins de 25 dB(A) contre près de 33 dB(A) sur notre version Intel.
Degré de la nuisance sonore
| Au repos |
| 24.6 / 24.6 / 24.6 dB(A) |
| Fortement sollicité |
| 32.7 / 39.2 dB(A) |
 | ||
30 dB silencieux 40 dB(A) audible 50 dB(A) bruyant |
||
min: | ||
| Lenovo ThinkPad E16 G1 Core i5-1335U Iris Xe G7 80EUs, i5-1335U | Lenovo ThinkPad E16 G1-21JUS08X00 Vega 8, R7 7730U, WD PC SN740 SDDPNQD-1T00 | Dell Inspiron 16 7635 2-in-1 Vega 7, R5 7530U, Kioxia BG5 KBG50ZNS512G | Acer TravelMate P4 TMP416-51-55KN Iris Xe G7 80EUs, i5-1240P, Micron 2450 512GB MTFDKBA512TFK | Samsung Galaxy Book3 Pro 16 Iris Xe G7 80EUs, i5-1340P, WD PC SN740 256GB SDDPNQD-256G | LG Gram 16Z90Q Iris Xe G7 96EUs, i7-1260P, Samsung PM9A1 MZVL21T0HCLR | |
|---|---|---|---|---|---|---|
| Noise | 11% | -7% | -10% | -14% | -7% | |
| arrêt / environnement * (dB) | 24.6 | 22.4 9% | 23.6 4% | 25.4 -3% | 25.2 -2% | 25 -2% |
| Idle Minimum * (dB) | 24.6 | 22.4 9% | 23.6 4% | 25.4 -3% | 25.2 -2% | 26 -6% |
| Idle Average * (dB) | 24.6 | 22.4 9% | 23.6 4% | 25.4 -3% | 25.2 -2% | 27 -10% |
| Idle Maximum * (dB) | 24.6 | 23.7 4% | 23.6 4% | 25.4 -3% | 29.3 -19% | 28 -14% |
| Load Average * (dB) | 32.7 | 24.8 24% | 40.3 -23% | 43.9 -34% | 46.4 -42% | 38 -16% |
| Witcher 3 ultra * (dB) | 34.7 | 29.8 14% | 44.2 -27% | 37 -7% | ||
| Load Maximum * (dB) | 39.2 | 36.1 8% | 44.2 -13% | 43.7 -11% | 46.4 -18% | 38 3% |
* ... Moindre est la valeur, meilleures sont les performances
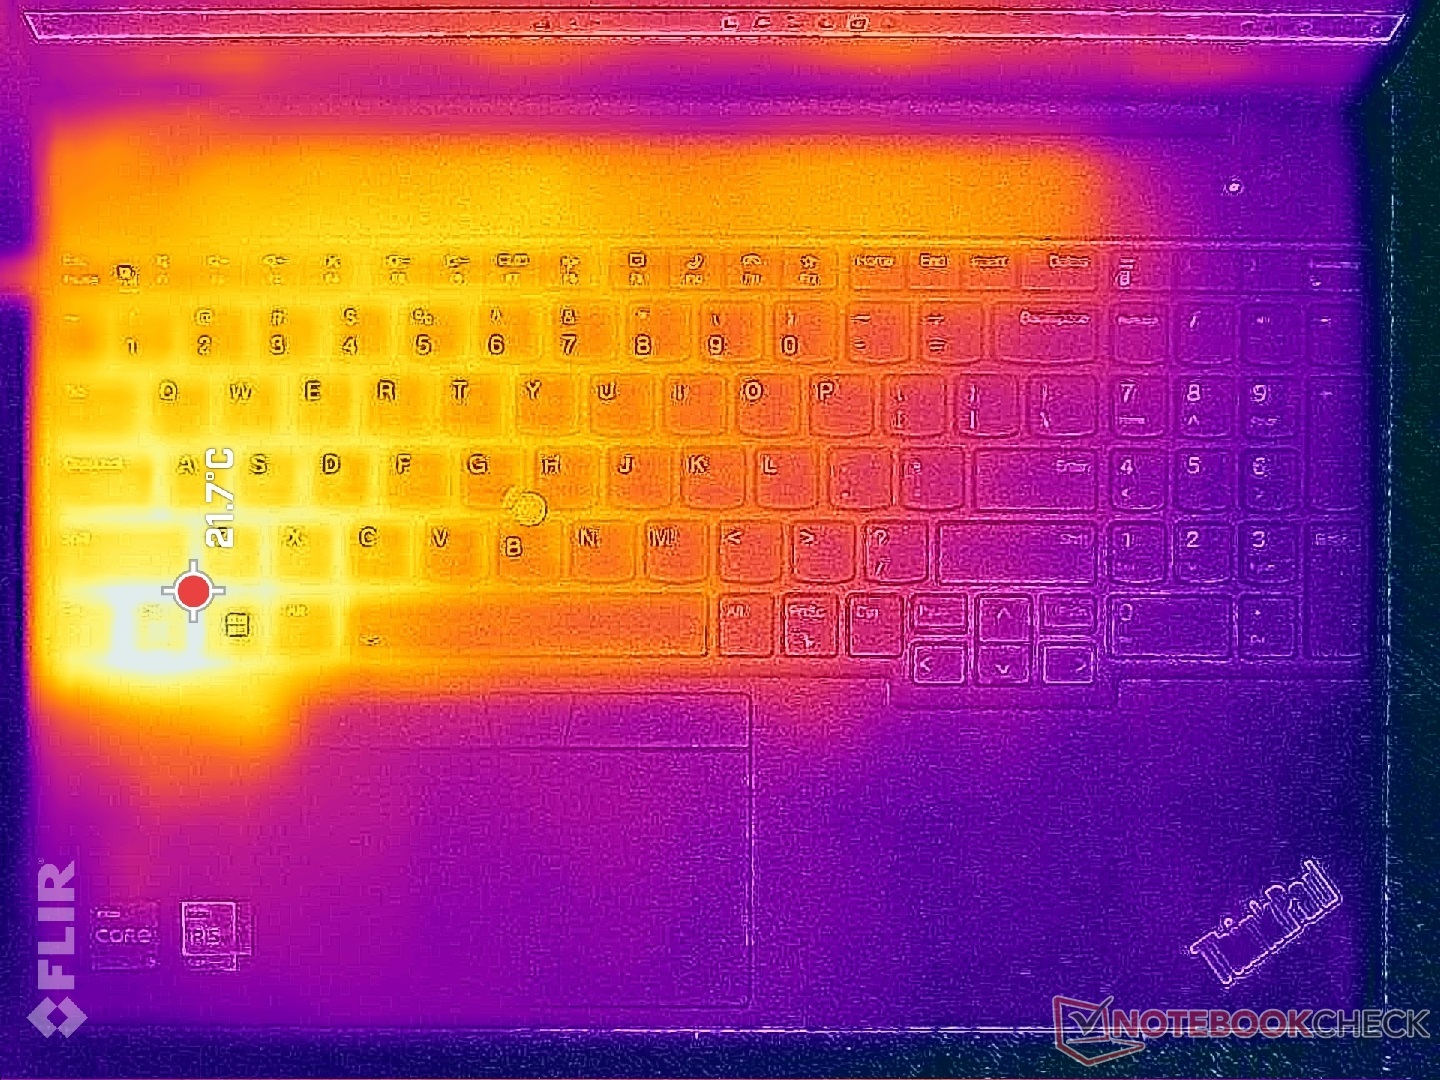
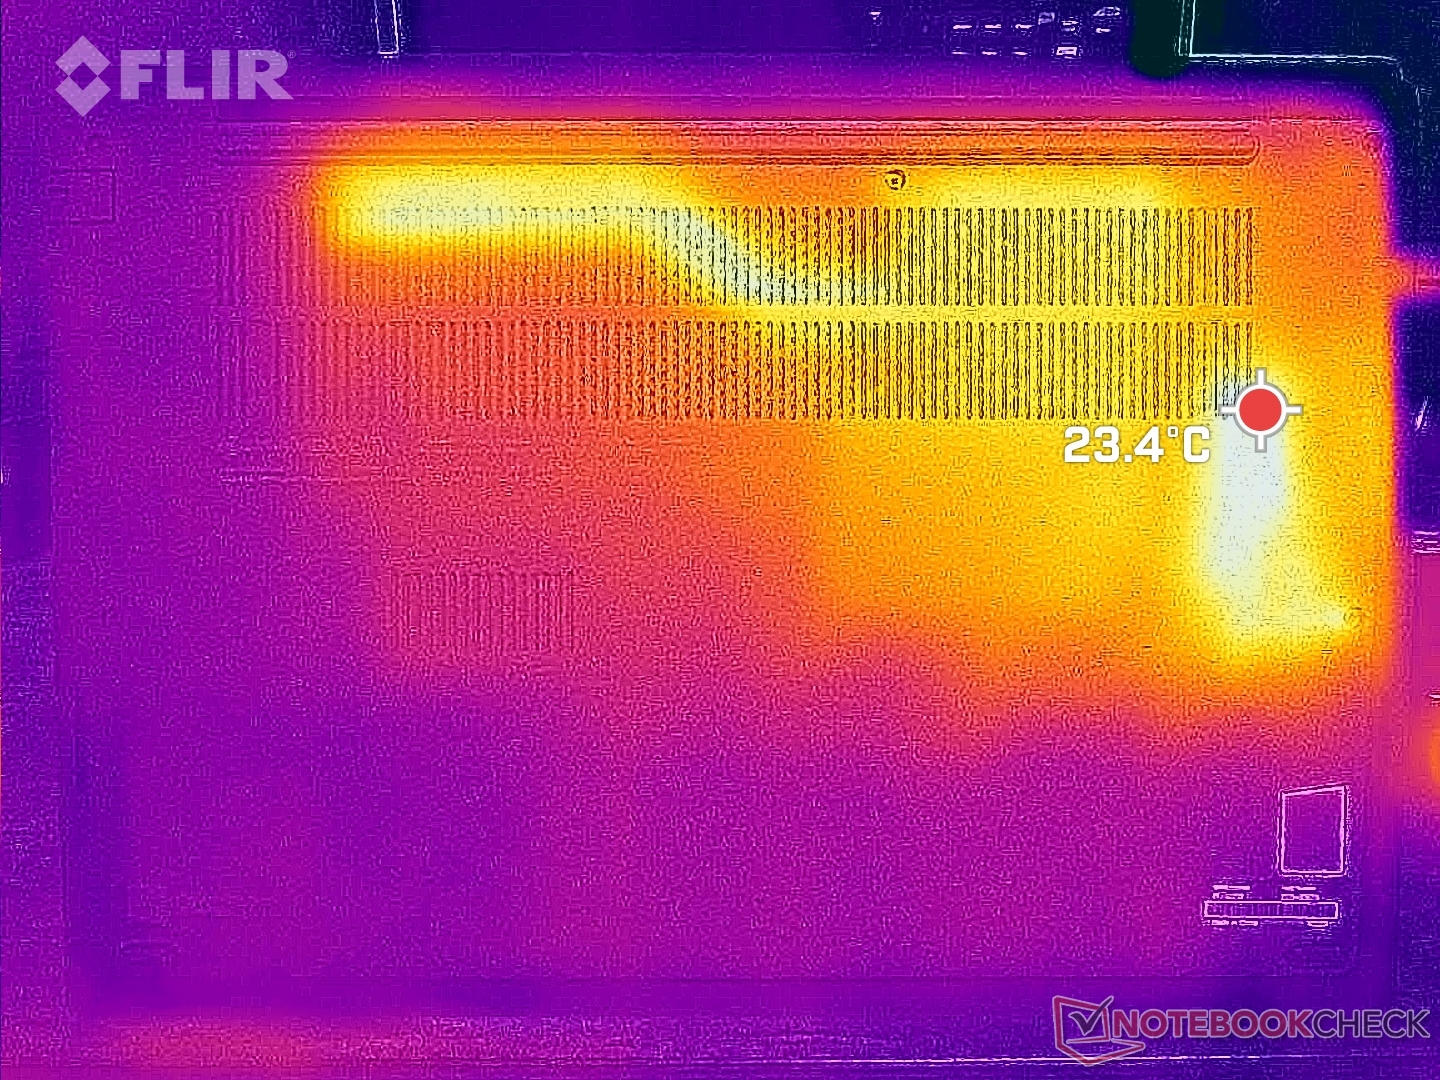
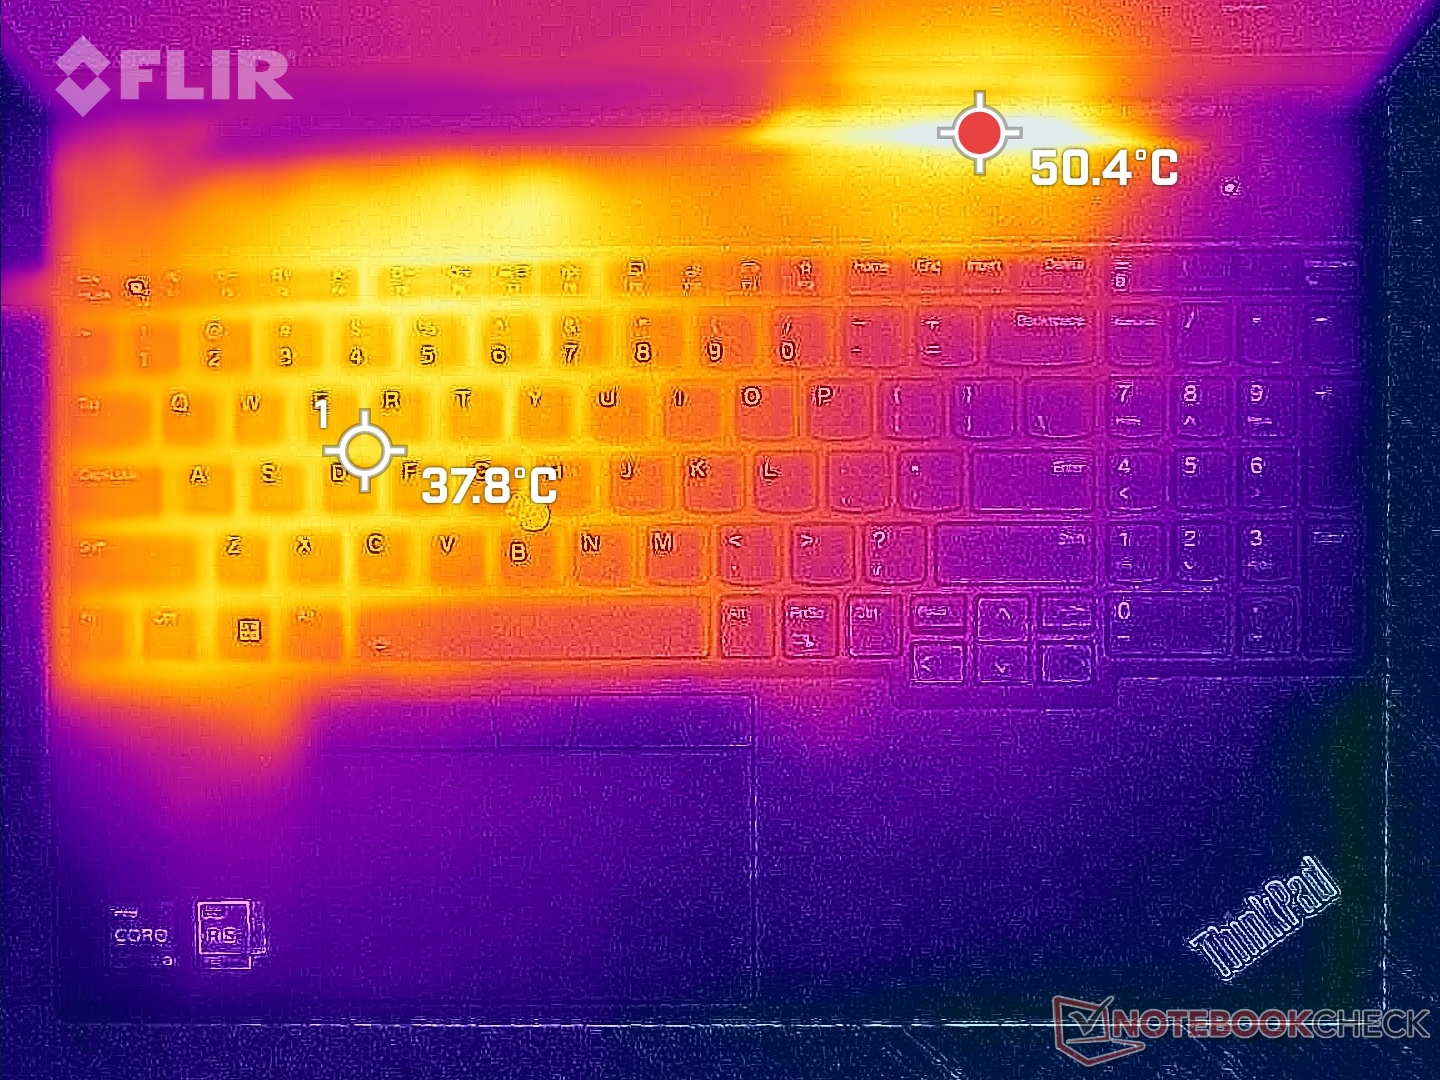
Température
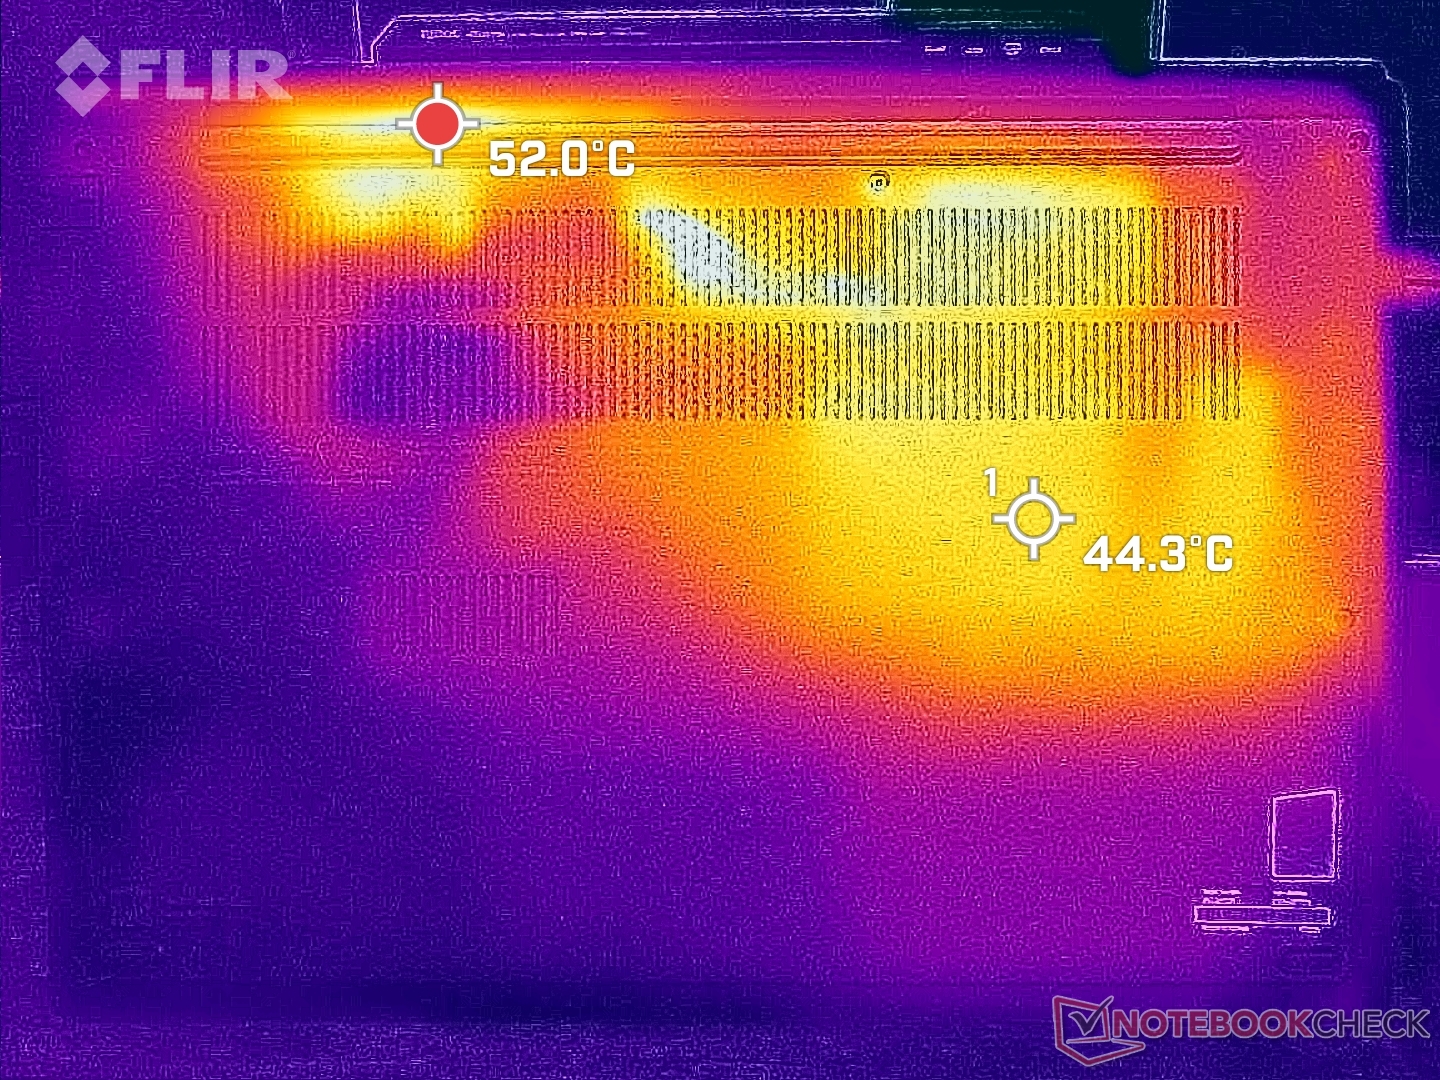
Les températures de surface sont plus élevées sur la moitié gauche de l'ordinateur portable que sur la droite, simplement en raison du positionnement du processeur et de la solution de refroidissement à l'intérieur. Les points chauds lors de l'exécution de charges exigeantes peuvent atteindre jusqu'à 38 C et 45 C sur les côtés supérieur et inférieur, respectivement, comme le montrent les cartes de température ci-dessous. Les résultats sont en fait plus froids de quelques degrés C que ce que nous avons enregistré sur la configuration AMD, peut-être en raison du ventilateur plus bruyant mentionné ci-dessus. Bien que les différences de température entre les quadrants les plus chauds et les plus froids soient perceptibles au toucher, elles ne sont pas inconfortables ou gênantes pendant l'utilisation.
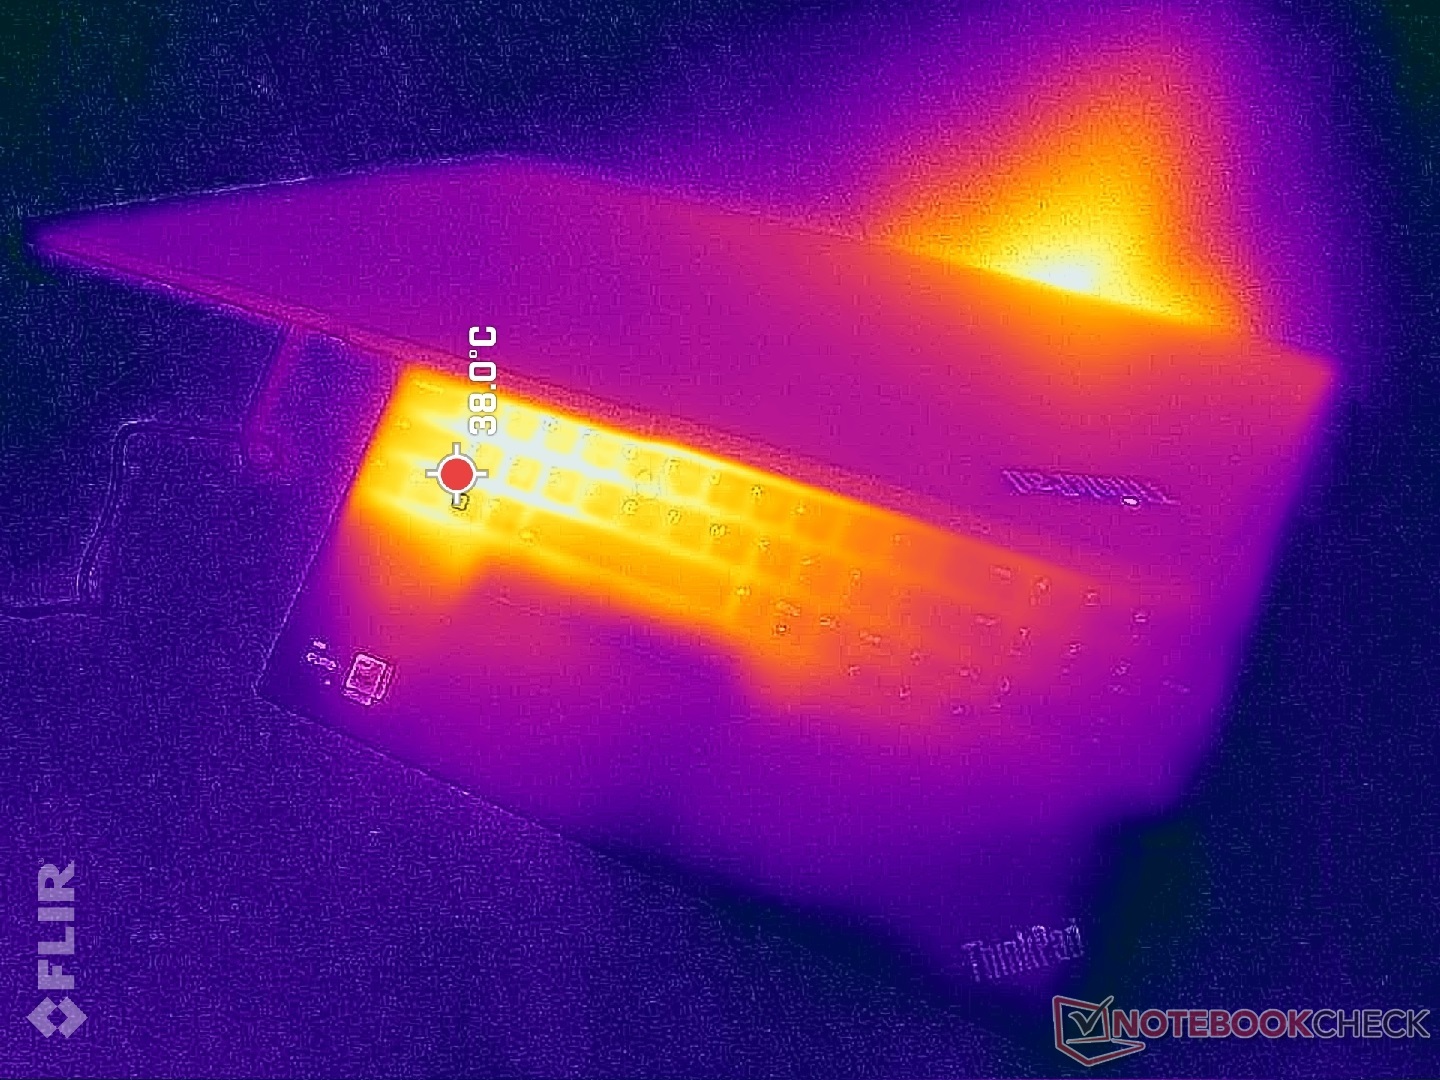
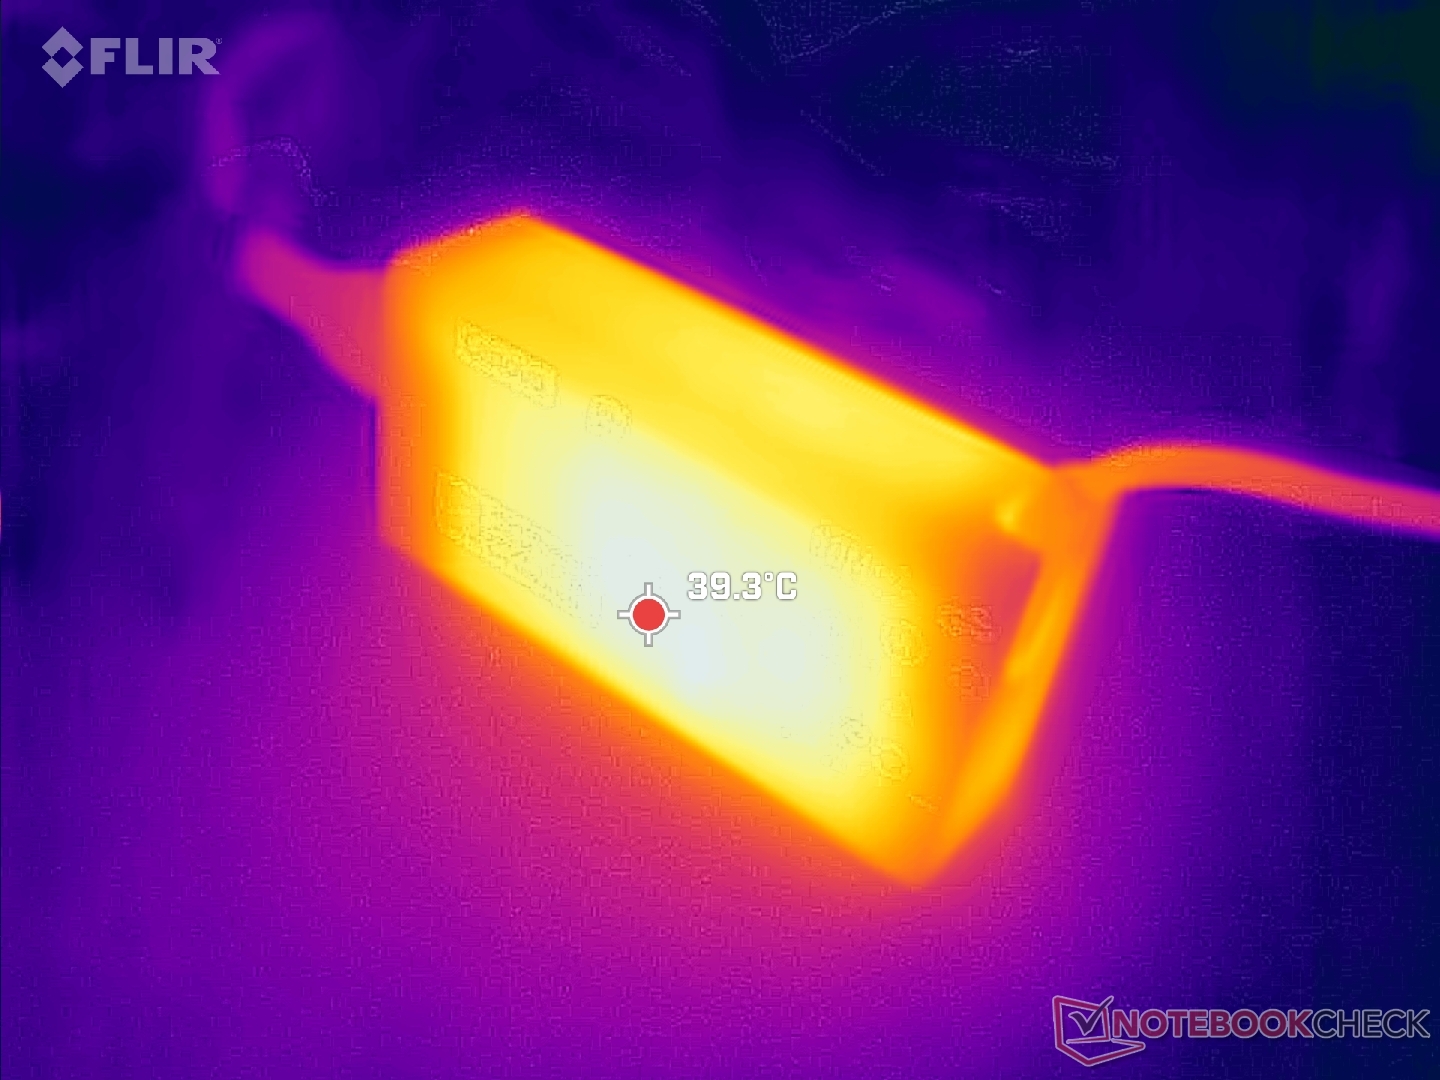
(±) La température maximale du côté supérieur est de 44 °C / 111 F, par rapport à la moyenne de 34.3 °C / 94 F, allant de 21.2 à 62.5 °C pour la classe Office.
(-) Le fond chauffe jusqu'à un maximum de 50.4 °C / 123 F, contre une moyenne de 36.8 °C / 98 F
(+) En utilisation inactive, la température moyenne du côté supérieur est de 24.3 °C / 76 F, par rapport à la moyenne du dispositif de 29.5 °C / 85 F.
(+) Les repose-poignets et le pavé tactile sont plus froids que la température de la peau avec un maximum de 27 °C / 80.6 F et sont donc froids au toucher.
(±) La température moyenne de la zone de l'appui-paume de dispositifs similaires était de 27.5 °C / 81.5 F (+0.5 °C / #0.9 F).
| Lenovo ThinkPad E16 G1 Core i5-1335U Intel Core i5-1335U, Intel Iris Xe Graphics G7 80EUs | Lenovo ThinkPad E16 G1-21JUS08X00 AMD Ryzen 7 7730U, AMD Radeon RX Vega 8 (Ryzen 4000/5000) | Dell Inspiron 16 7635 2-in-1 AMD Ryzen 5 7530U, AMD Radeon RX Vega 7 | Acer TravelMate P4 TMP416-51-55KN Intel Core i5-1240P, Intel Iris Xe Graphics G7 80EUs | Samsung Galaxy Book3 Pro 16 Intel Core i5-1340P, Intel Iris Xe Graphics G7 80EUs | LG Gram 16Z90Q Intel Core i7-1260P, Intel Iris Xe Graphics G7 96EUs | |
|---|---|---|---|---|---|---|
| Heat | 0% | 4% | -1% | -5% | 6% | |
| Maximum Upper Side * (°C) | 44 | 46.1 -5% | 41.6 5% | 38.6 12% | 41.6 5% | 45 -2% |
| Maximum Bottom * (°C) | 50.4 | 52.2 -4% | 39 23% | 44.4 12% | 45 11% | 43 15% |
| Idle Upper Side * (°C) | 27.2 | 25.7 6% | 29.4 -8% | 28.9 -6% | 31 -14% | 26 4% |
| Idle Bottom * (°C) | 27.8 | 26.7 4% | 28.6 -3% | 34 -22% | 33.6 -21% | 26 6% |
* ... Moindre est la valeur, meilleures sont les performances
Test de stress
Lors de l'exécution de Prime95, le processeur atteignait 4 GHz, 50 W et 94 C pendant les premières secondes seulement, avant de redescendre régulièrement et de se stabiliser à 2,4 GHz, 86 C et 28 W, le pic de Turbo Boost n'étant pas viable. La fourchette haute de 80°C est assez chaude pour un ordinateur portable de 16 pouces de la série Core U. En effectuant ce même test sur l'ordinateur portableAcer Swift Edge 16 équipé d'un Ryzen 7 7840U, par exemple, le processeur se stabiliserait à 64°C en comparaison.
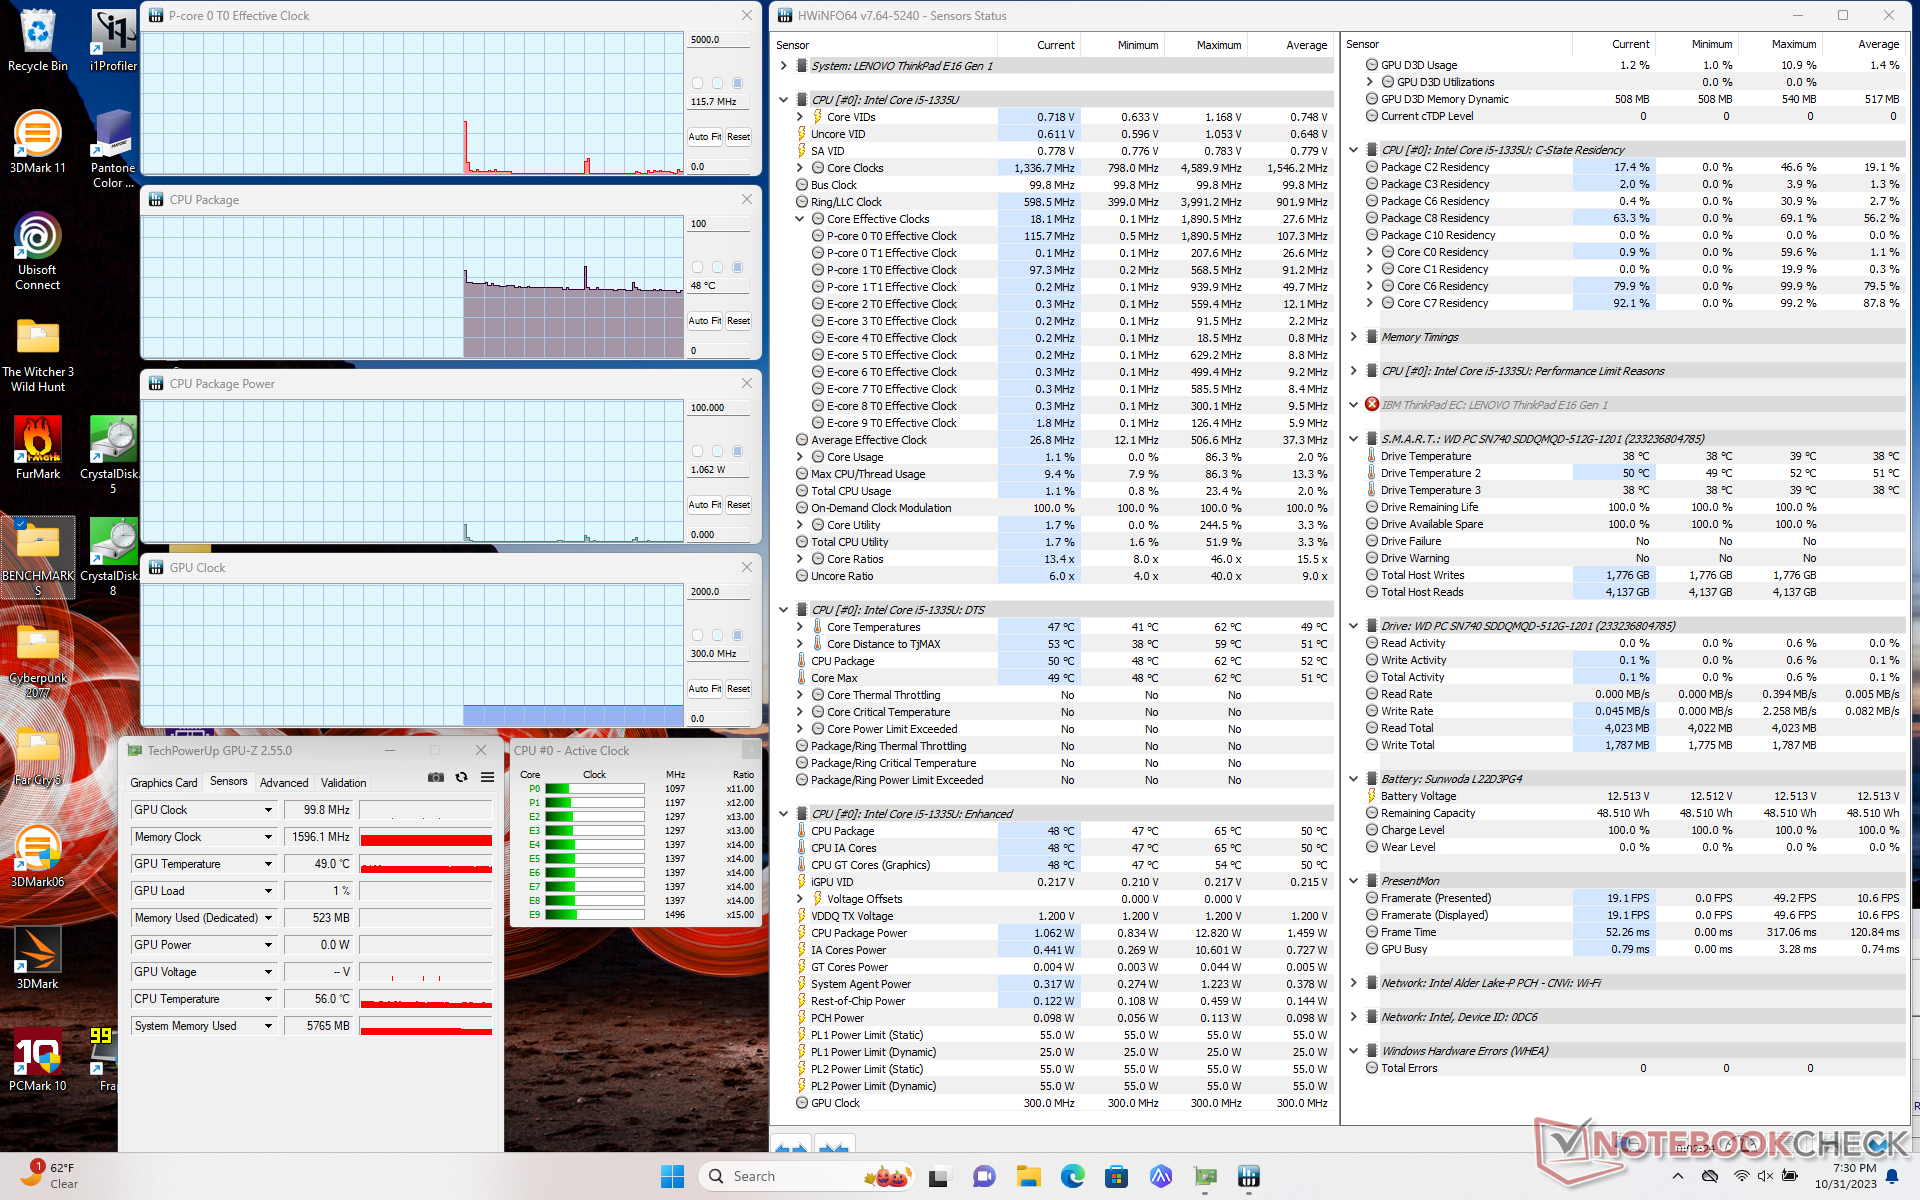
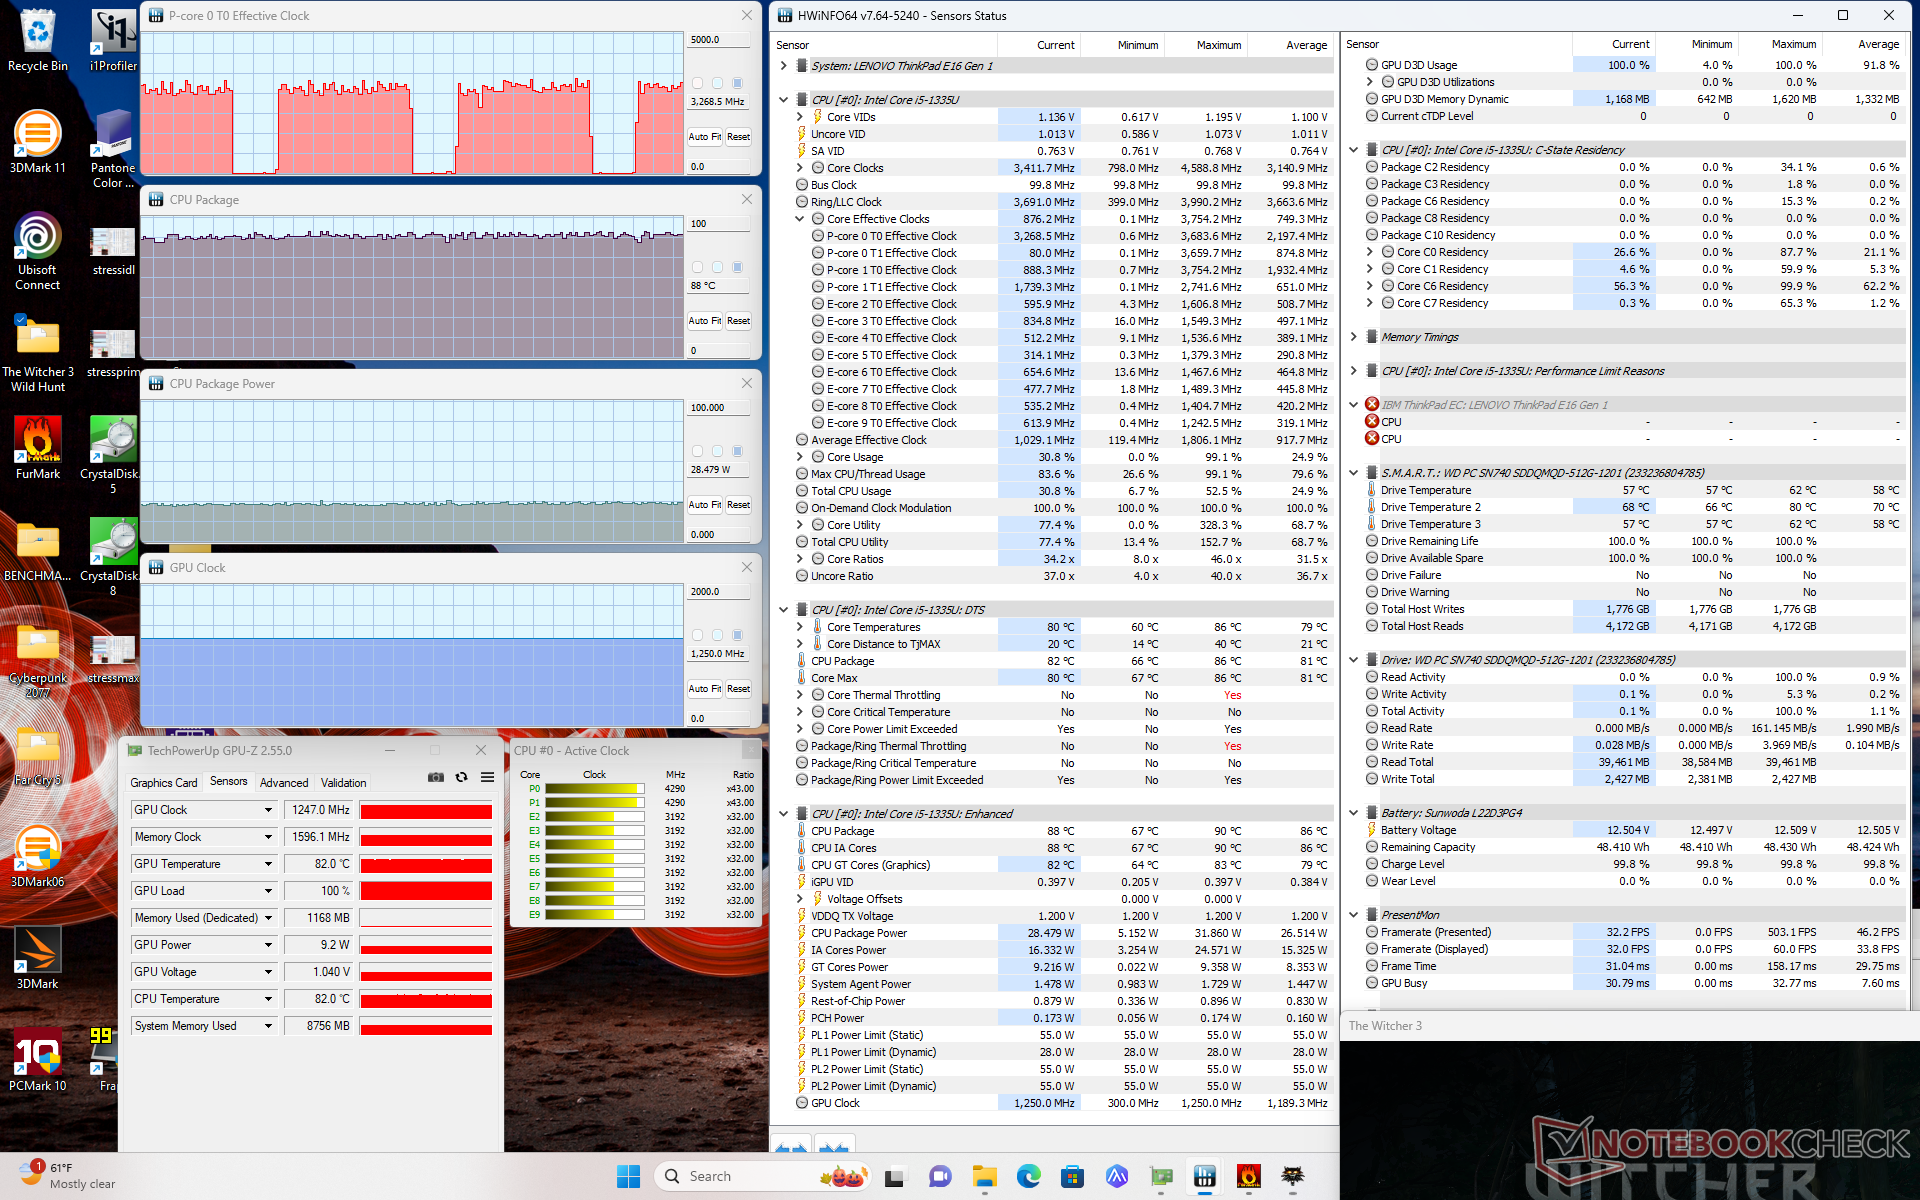
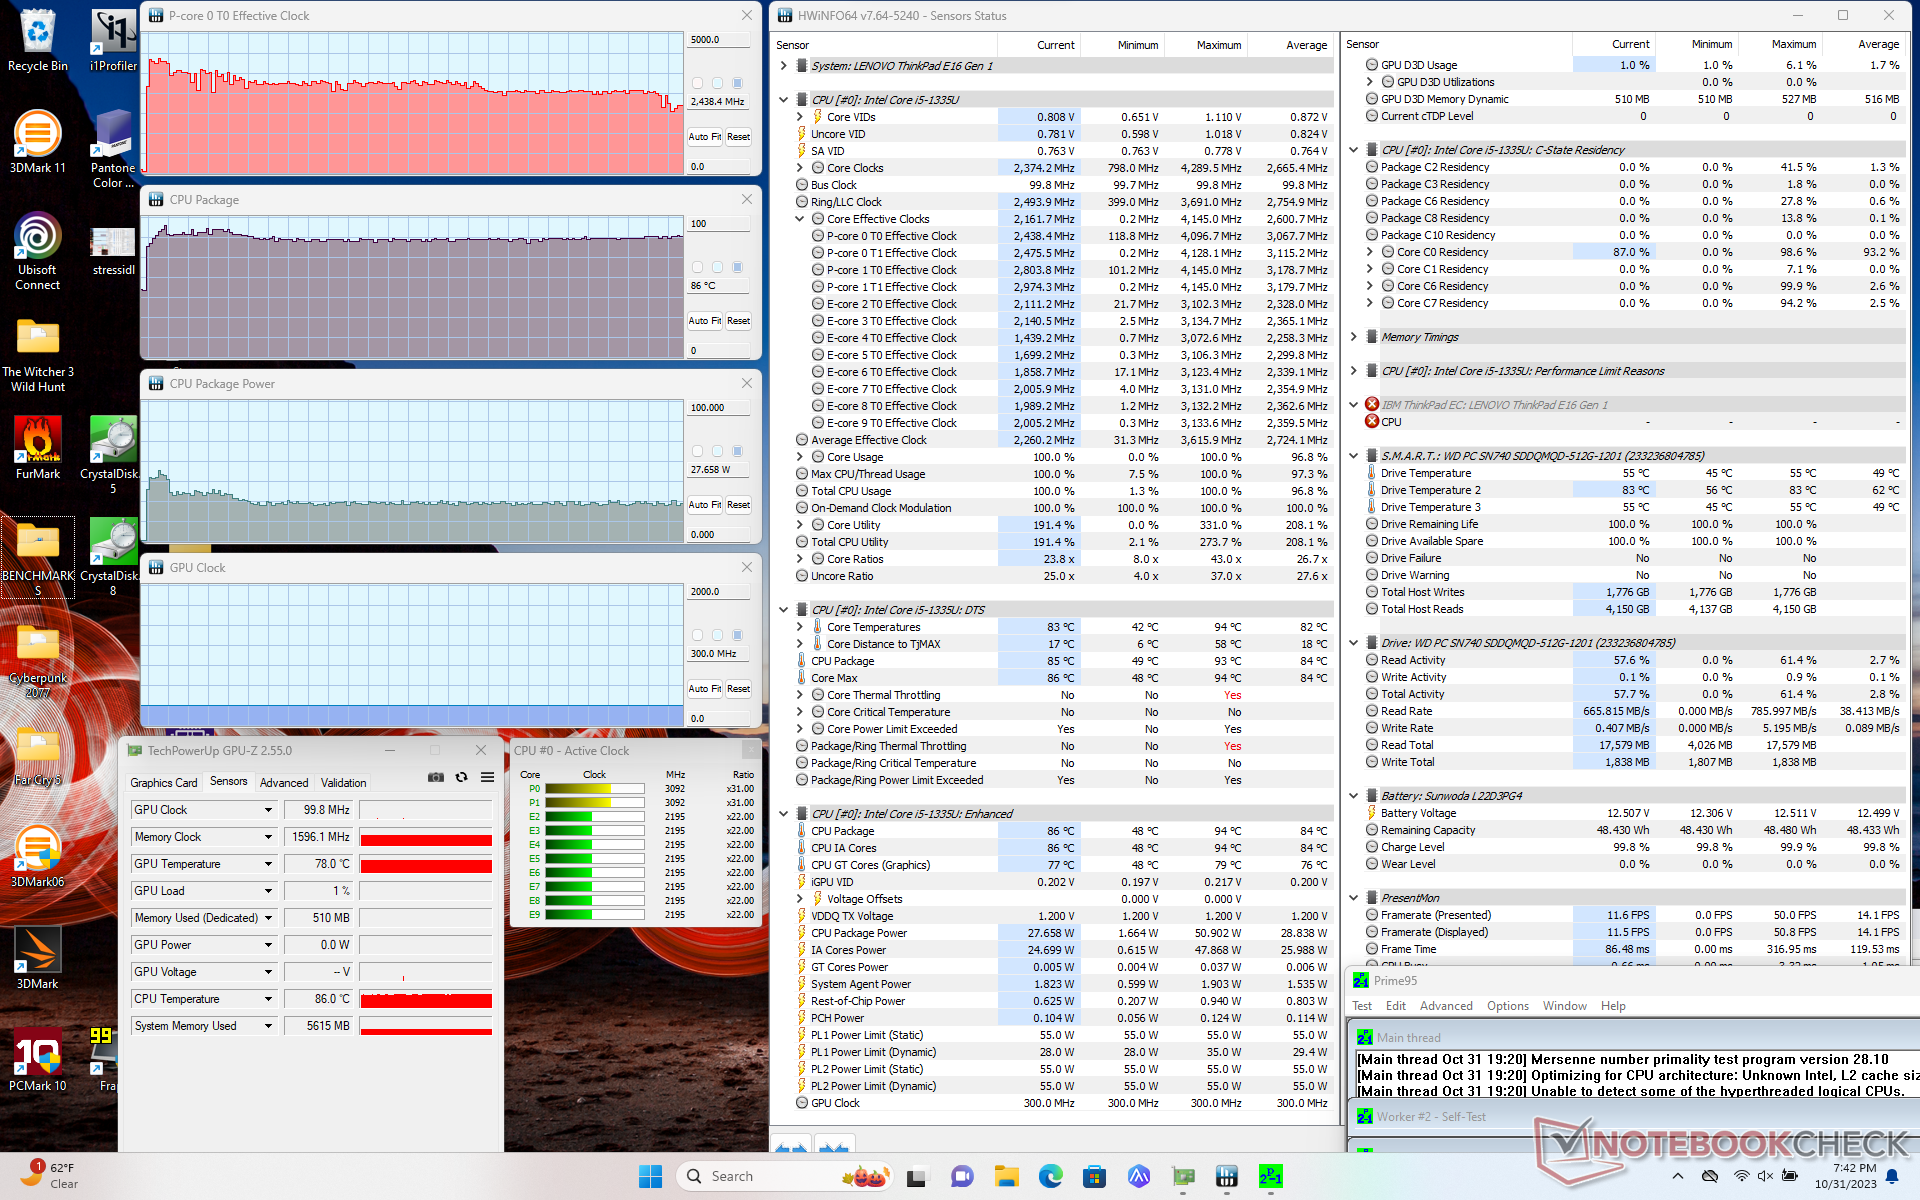
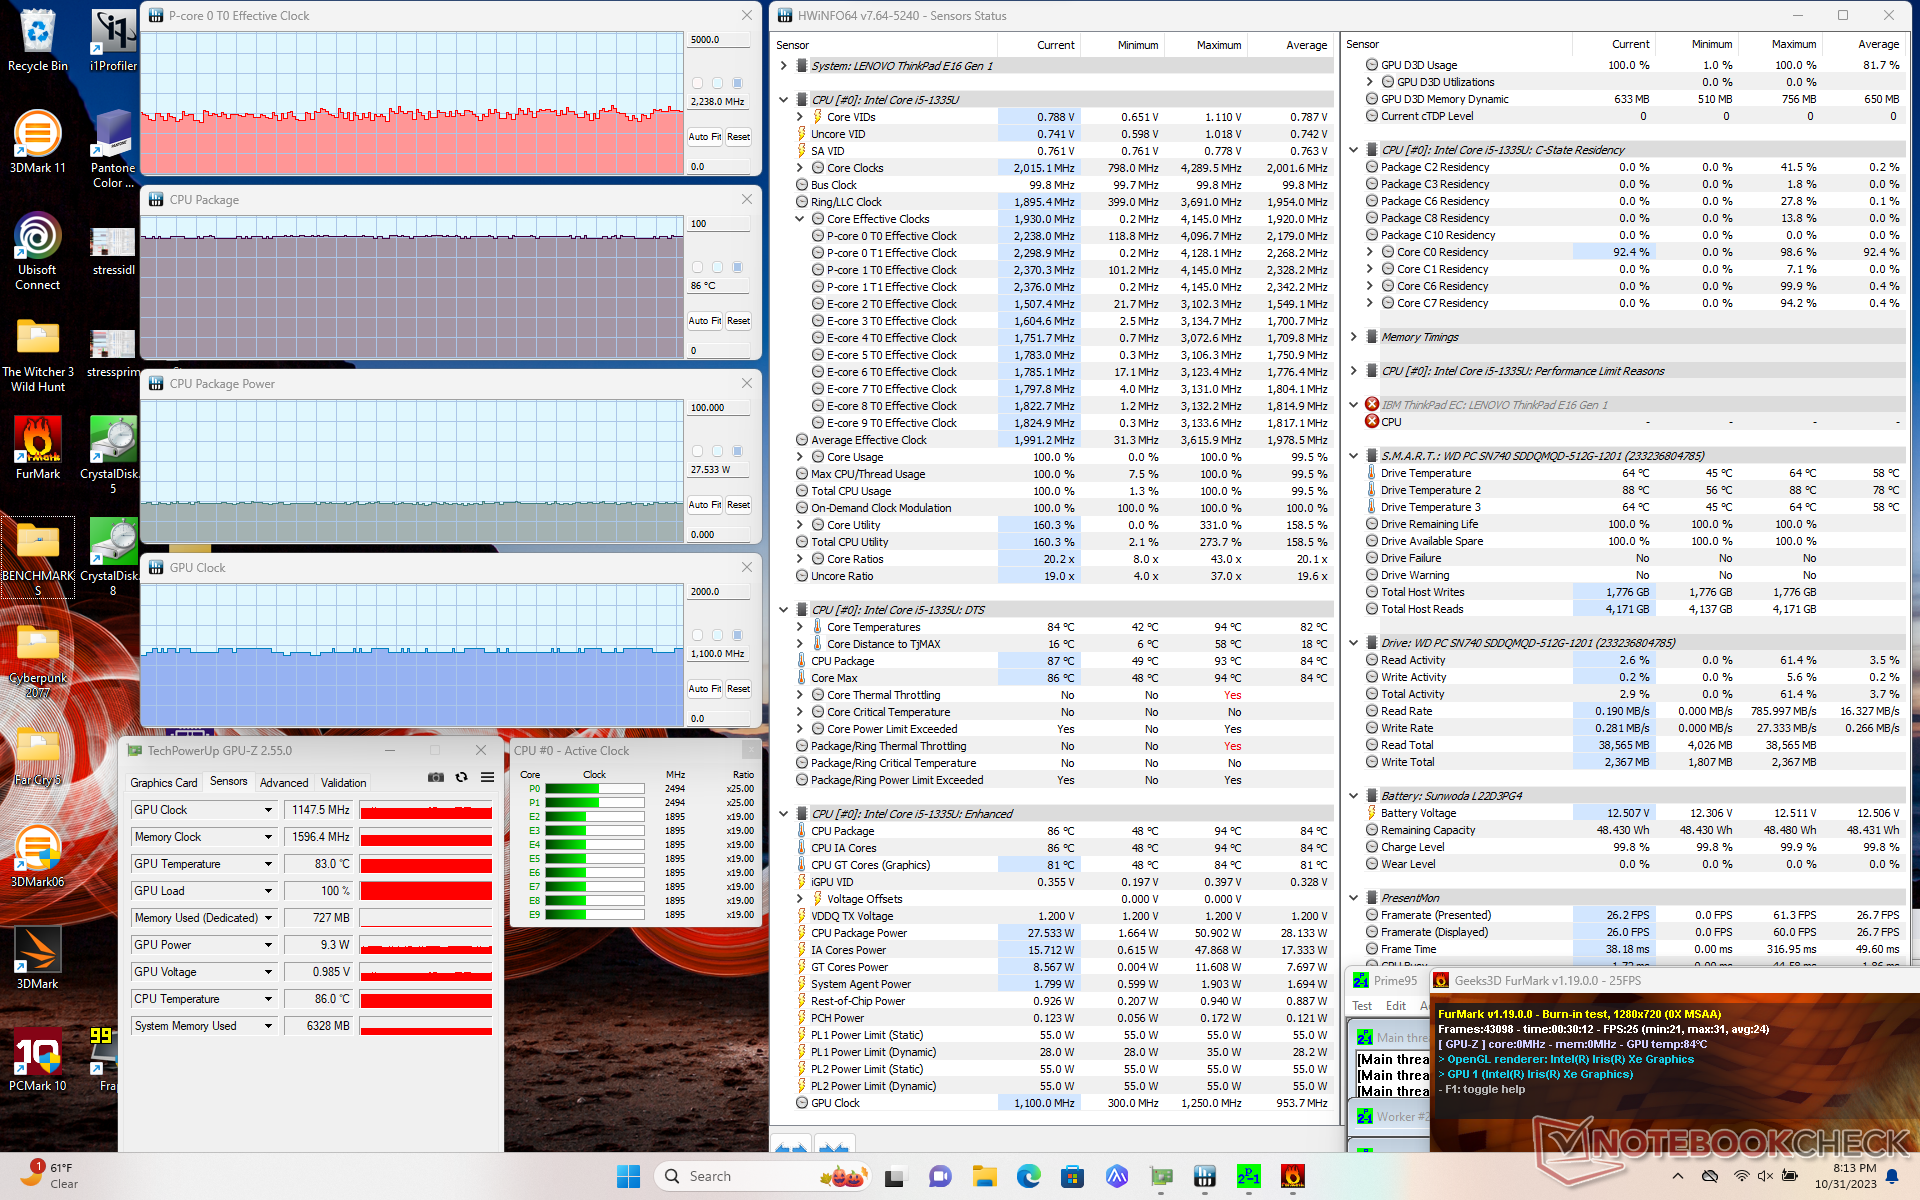
| Horloge du CPU (GHz) | Horloge du GPU (MHz) | Température moyenne du CPU (°C) | |
| Système au repos | -- | -- | 48 |
| Prime95 Stress | 2.4 | -- | 86 |
| Prime95 + FurMark Stress | ~2.2 | 1100 | 86 |
| Witcher 3 Stress | ~3.2 | 1250 | 88 |
Intervenants
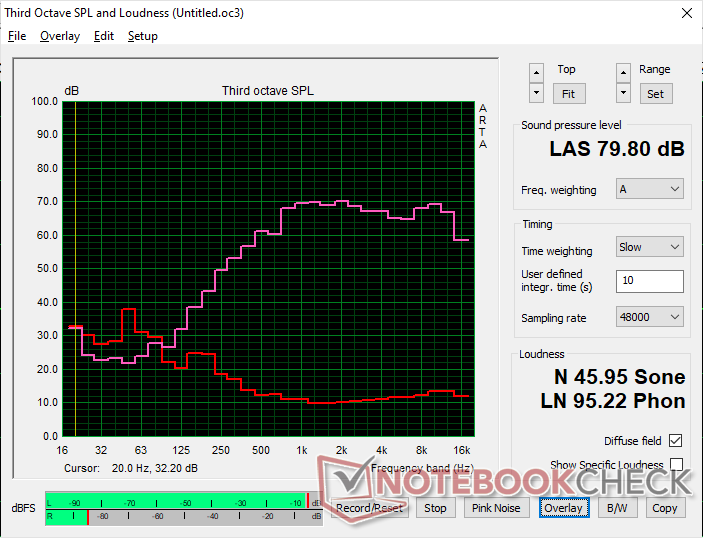
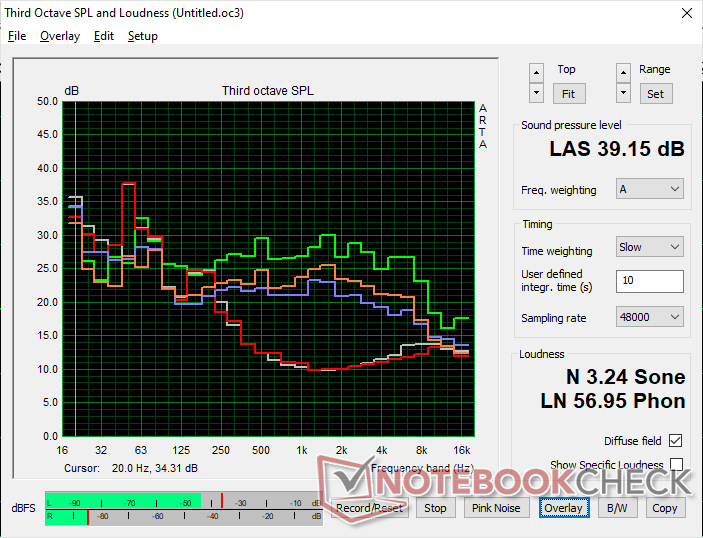
Lenovo ThinkPad E16 G1 Core i5-1335U analyse audio
(±) | le niveau sonore du haut-parleur est moyen mais bon (79.8# dB)
Basses 100 - 315 Hz
(-) | presque aucune basse - en moyenne 24.7% plus bas que la médiane
(±) | la linéarité des basses est moyenne (8.8% delta à la fréquence précédente)
Médiums 400 - 2000 Hz
(+) | médiane équilibrée - seulement 4.8% de la médiane
(+) | les médiums sont linéaires (4.8% delta à la fréquence précédente)
Aiguës 2 - 16 kHz
(+) | des sommets équilibrés - à seulement 2.1% de la médiane
(+) | les aigus sont linéaires (2.7% delta à la fréquence précédente)
Globalement 100 - 16 000 Hz
(±) | la linéarité du son global est moyenne (18.4% de différence avec la médiane)
Par rapport à la même classe
» 33% de tous les appareils testés de cette catégorie étaient meilleurs, 7% similaires, 60% pires
» Le meilleur avait un delta de 7%, la moyenne était de 21%, le pire était de 53%.
Par rapport à tous les appareils testés
» 41% de tous les appareils testés étaient meilleurs, 8% similaires, 52% pires
» Le meilleur avait un delta de 4%, la moyenne était de 24%, le pire était de 134%.
Apple MacBook Pro 16 2021 M1 Pro analyse audio
(+) | les haut-parleurs peuvent jouer relativement fort (84.7# dB)
Basses 100 - 315 Hz
(+) | bonne basse - seulement 3.8% loin de la médiane
(+) | les basses sont linéaires (5.2% delta à la fréquence précédente)
Médiums 400 - 2000 Hz
(+) | médiane équilibrée - seulement 1.3% de la médiane
(+) | les médiums sont linéaires (2.1% delta à la fréquence précédente)
Aiguës 2 - 16 kHz
(+) | des sommets équilibrés - à seulement 1.9% de la médiane
(+) | les aigus sont linéaires (2.7% delta à la fréquence précédente)
Globalement 100 - 16 000 Hz
(+) | le son global est linéaire (4.6% différence à la médiane)
Par rapport à la même classe
» 0% de tous les appareils testés de cette catégorie étaient meilleurs, 0% similaires, 100% pires
» Le meilleur avait un delta de 5%, la moyenne était de 17%, le pire était de 45%.
Par rapport à tous les appareils testés
» 0% de tous les appareils testés étaient meilleurs, 0% similaires, 100% pires
» Le meilleur avait un delta de 4%, la moyenne était de 24%, le pire était de 134%.
Gestion de l'énergie
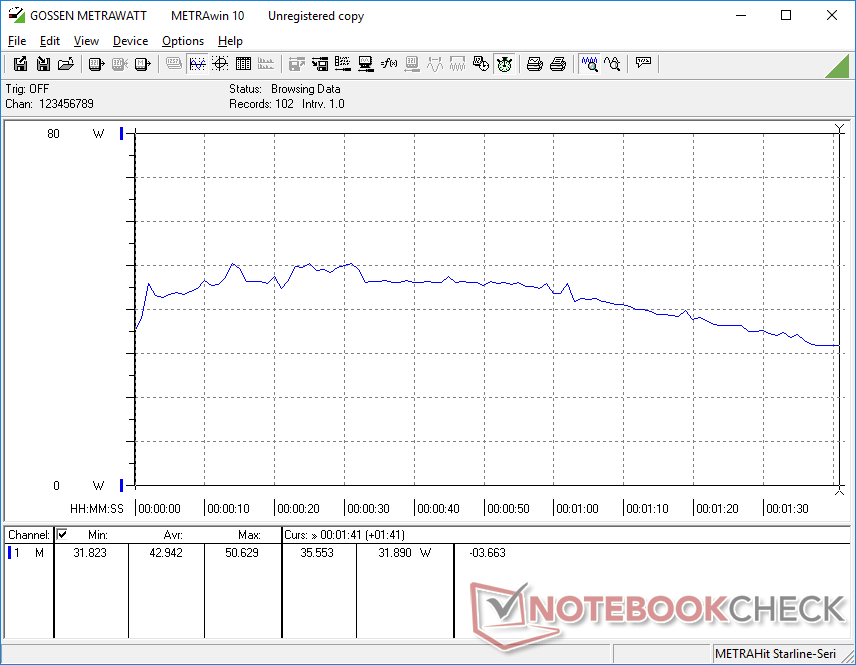
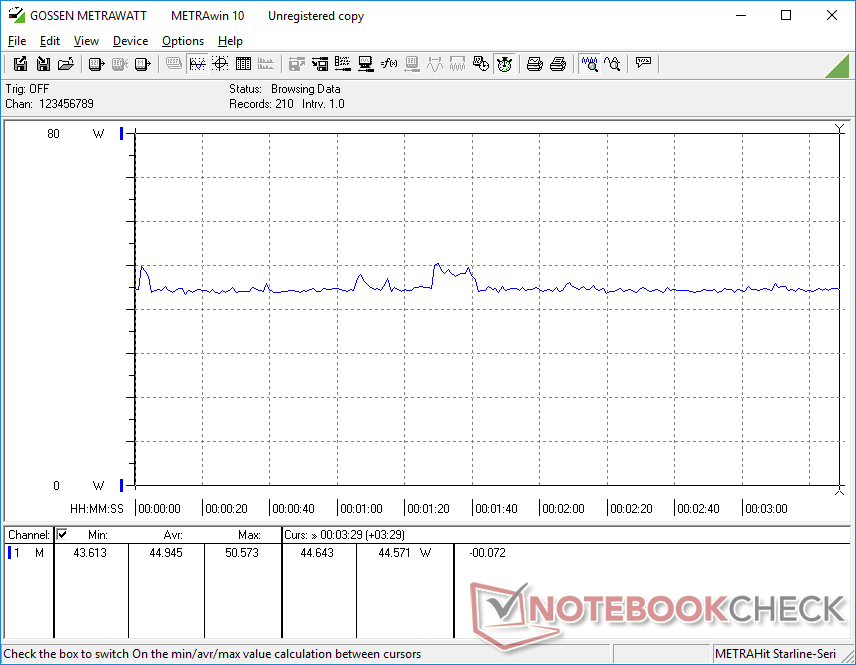
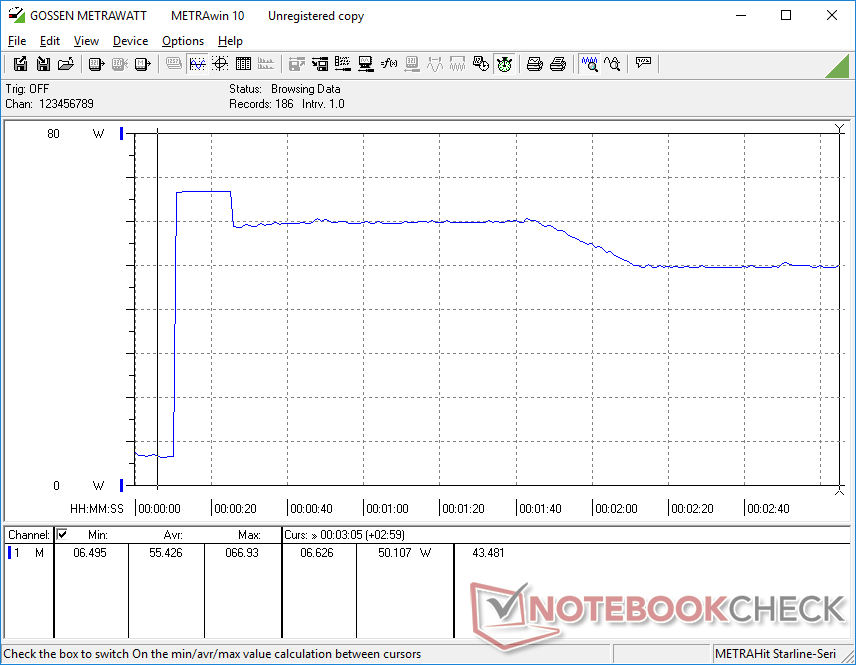
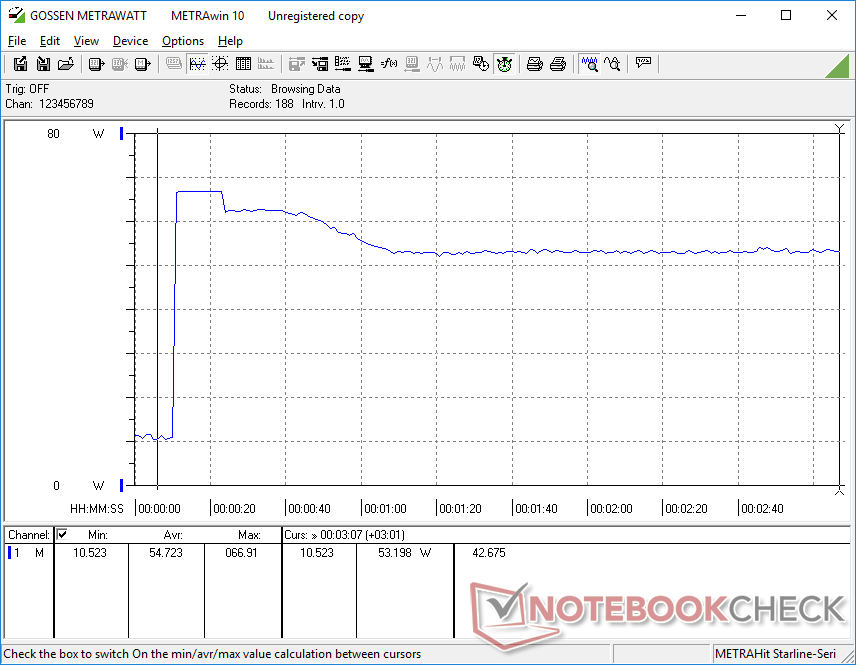
Consommation électrique
Le système Intel est généralement plus exigeant que la version AMD lors de l'exécution de tâches intensives, même si le processeur AMD est généralement plus rapide que le processeur Intel lorsqu'il s'agit de charges multithread. Lorsque nous lançons CineBench R15 xT, par exemple, la consommation peut atteindre 68 W sur notre unité Intel contre seulement 45 W sur l'unité AMD. Des résultats similaires peuvent être observés lors de l'exécution de Prime95. La consommation globale en mode ralenti sur le bureau ou lors de l'exécution de tâches intensives en GPU telles que Witcher 3 est à peu près la même entre les versions Intel et AMD.
| Éteint/en veille | |
| Au repos | |
| Fortement sollicité |
|
Légende:
min: | |
| Lenovo ThinkPad E16 G1 Core i5-1335U i5-1335U, Iris Xe G7 80EUs, , IPS, 1920x1200, 16" | Lenovo ThinkPad E16 G1-21JUS08X00 R7 7730U, Vega 8, WD PC SN740 SDDPNQD-1T00, IPS, 2560x1600, 16" | Dell Inspiron 16 7635 2-in-1 R5 7530U, Vega 7, Kioxia BG5 KBG50ZNS512G, IPS, 1920x1200, 16" | Acer TravelMate P4 TMP416-51-55KN i5-1240P, Iris Xe G7 80EUs, Micron 2450 512GB MTFDKBA512TFK, IPS, 1920x1200, 16" | Samsung Galaxy Book3 Pro 16 i5-1340P, Iris Xe G7 80EUs, WD PC SN740 256GB SDDPNQD-256G, AMOLED, 2880x1800, 16" | LG Gram 16Z90Q i7-1260P, Iris Xe G7 96EUs, Samsung PM9A1 MZVL21T0HCLR, IPS, 2560x1600, 16" | |
|---|---|---|---|---|---|---|
| Power Consumption | -3% | 2% | 1% | 9% | -7% | |
| Idle Minimum * (Watt) | 4.9 | 4.1 16% | 4.8 2% | 5.2 -6% | 3.9 20% | 5 -2% |
| Idle Average * (Watt) | 8.3 | 9.6 -16% | 7.6 8% | 7.1 14% | 4.8 42% | 8 4% |
| Idle Maximum * (Watt) | 8.6 | 10.2 -19% | 8.7 -1% | 9.6 -12% | 10 -16% | 14 -63% |
| Load Average * (Watt) | 42.9 | 47.3 -10% | 47.1 -10% | 47 -10% | 44 -3% | 47 -10% |
| Witcher 3 ultra * (Watt) | 44.9 | 46.7 -4% | 46.6 -4% | 43.3 4% | 42.3 6% | 37.8 16% |
| Load Maximum * (Watt) | 67 | 55.7 17% | 56.4 16% | 56 16% | 63 6% | 56 16% |
* ... Moindre est la valeur, meilleures sont les performances
Power Consumption Witcher 3 / Stresstest
Power Consumption external Monitor
Autonomie de la batterie
Le modèle est proposé avec deux options de capacité de batterie : 47 Wh et 57 Wh. Notre modèle Intel est livré avec la plus petite option, tandis que notre modèle AMD est livré avec la plus grande. L'autonomie de la batterie n'est que de la moitié de celle de notre modèle AMD pour seulement 5 heures de navigation dans le monde réel. Pour un portable de 16 pouces, l'option 47 Wh est bien plus petite que prévu et constitue un net recul.
La charge de la batterie est heureusement assez rapide (un peu plus d'une heure).
| Lenovo ThinkPad E16 G1 Core i5-1335U i5-1335U, Iris Xe G7 80EUs, 47 Wh | Lenovo ThinkPad E16 G1-21JUS08X00 R7 7730U, Vega 8, 57 Wh | Dell Inspiron 16 7635 2-in-1 R5 7530U, Vega 7, 64 Wh | Acer TravelMate P4 TMP416-51-55KN i5-1240P, Iris Xe G7 80EUs, 56 Wh | Samsung Galaxy Book3 Pro 16 i5-1340P, Iris Xe G7 80EUs, 76 Wh | LG Gram 16Z90Q i7-1260P, Iris Xe G7 96EUs, 80 Wh | |
|---|---|---|---|---|---|---|
| Autonomie de la batterie | 117% | 179% | 81% | 96% | 94% | |
| WiFi v1.3 (h) | 5.2 | 11.3 117% | 14.5 179% | 9.4 81% | 10.2 96% | 10.1 94% |
| H.264 (h) | 11.7 | 14.4 | ||||
| Load (h) | 1.3 | 1.9 | 2 | 2.6 | ||
| Reader / Idle (h) | 26 | 30.4 | 18.1 |
Points positifs
Points négatifs
Verdict - AMD remporte la palme de l'autonomie de la batterie
En optant pour le ThinkPad E16 G1 d'Intel au lieu d'AMD, vous obtiendrez la prise en charge de Thunderbolt, des performances plus rapides pour un seul thread et des performances graphiques intégrées plus rapides si vous choisissez le Core i7-1355U. Cependant, ces avantages ne sont pas à la hauteur de ce que vous offre la Version AMD offre : une durée de vie de la batterie nettement plus longue, des performances par watt plus élevées, des performances multithread plus rapides et la prise en charge des disques SSD M.2 2280. Par conséquent, vous devrez vraiment apprécier les capacités d'ancrage supérieures de la version Intel si vous décidez d'ignorer les options AMD.
Si vous ne prévoyez pas de connecter des moniteurs Thunderbolt ou des eGPU à votre ThinkPad E16 G1, les versions AMD peuvent offrir une meilleure autonomie et des performances multithread plus rapides que les options Intel, pour un prix à peu près équivalent.
Quelle que soit la version préférée, les utilisateurs devront faire attention à la taille de l'écran et de la batterie avant d'acheter. Malheureusement, tous les détaillants n'indiquent pas la couverture des couleurs ou la capacité de la batterie, et il est donc facile d'acheter accidentellement une configuration avec un écran plus bas de gamme ou une batterie plus petite de 47 Wh. Nous vous recommandons de viser une couverture sRGB complète et une batterie plus grande de 57 Wh si possible, car il s'agit de progrès significatifs par rapport à la configuration de base.
Prix et disponibilité
Lenovo livre maintenant le ThinkPad E16 G1 à partir de 638 USD pour la configuration Core i3 et de 724 USD pour la configuration Core i5.
Lenovo ThinkPad E16 G1 Core i5-1335U
- 11/02/2023 v7 (old)
Allen Ngo
Transparency
La sélection des appareils à examiner est effectuée par notre équipe éditoriale. L'échantillon de test a été prêté à l'auteur par le fabricant ou le détaillant pour les besoins de cet examen. Le prêteur n'a pas eu d'influence sur cette évaluation et le fabricant n'a pas reçu de copie de cette évaluation avant sa publication. Il n'y avait aucune obligation de publier cet article. En tant que média indépendant, Notebookcheck n'est pas soumis à l'autorité des fabricants, des détaillants ou des éditeurs.
Voici comment Notebookcheck teste
Chaque année, Notebookcheck examine de manière indépendante des centaines d'ordinateurs portables et de smartphones en utilisant des procédures standardisées afin de garantir que tous les résultats sont comparables. Nous avons continuellement développé nos méthodes de test depuis environ 20 ans et avons établi des normes industrielles dans le processus. Dans nos laboratoires de test, des équipements de mesure de haute qualité sont utilisés par des techniciens et des rédacteurs expérimentés. Ces tests impliquent un processus de validation en plusieurs étapes. Notre système d'évaluation complexe repose sur des centaines de mesures et de points de référence bien fondés, ce qui garantit l'objectivité.Price comparison

