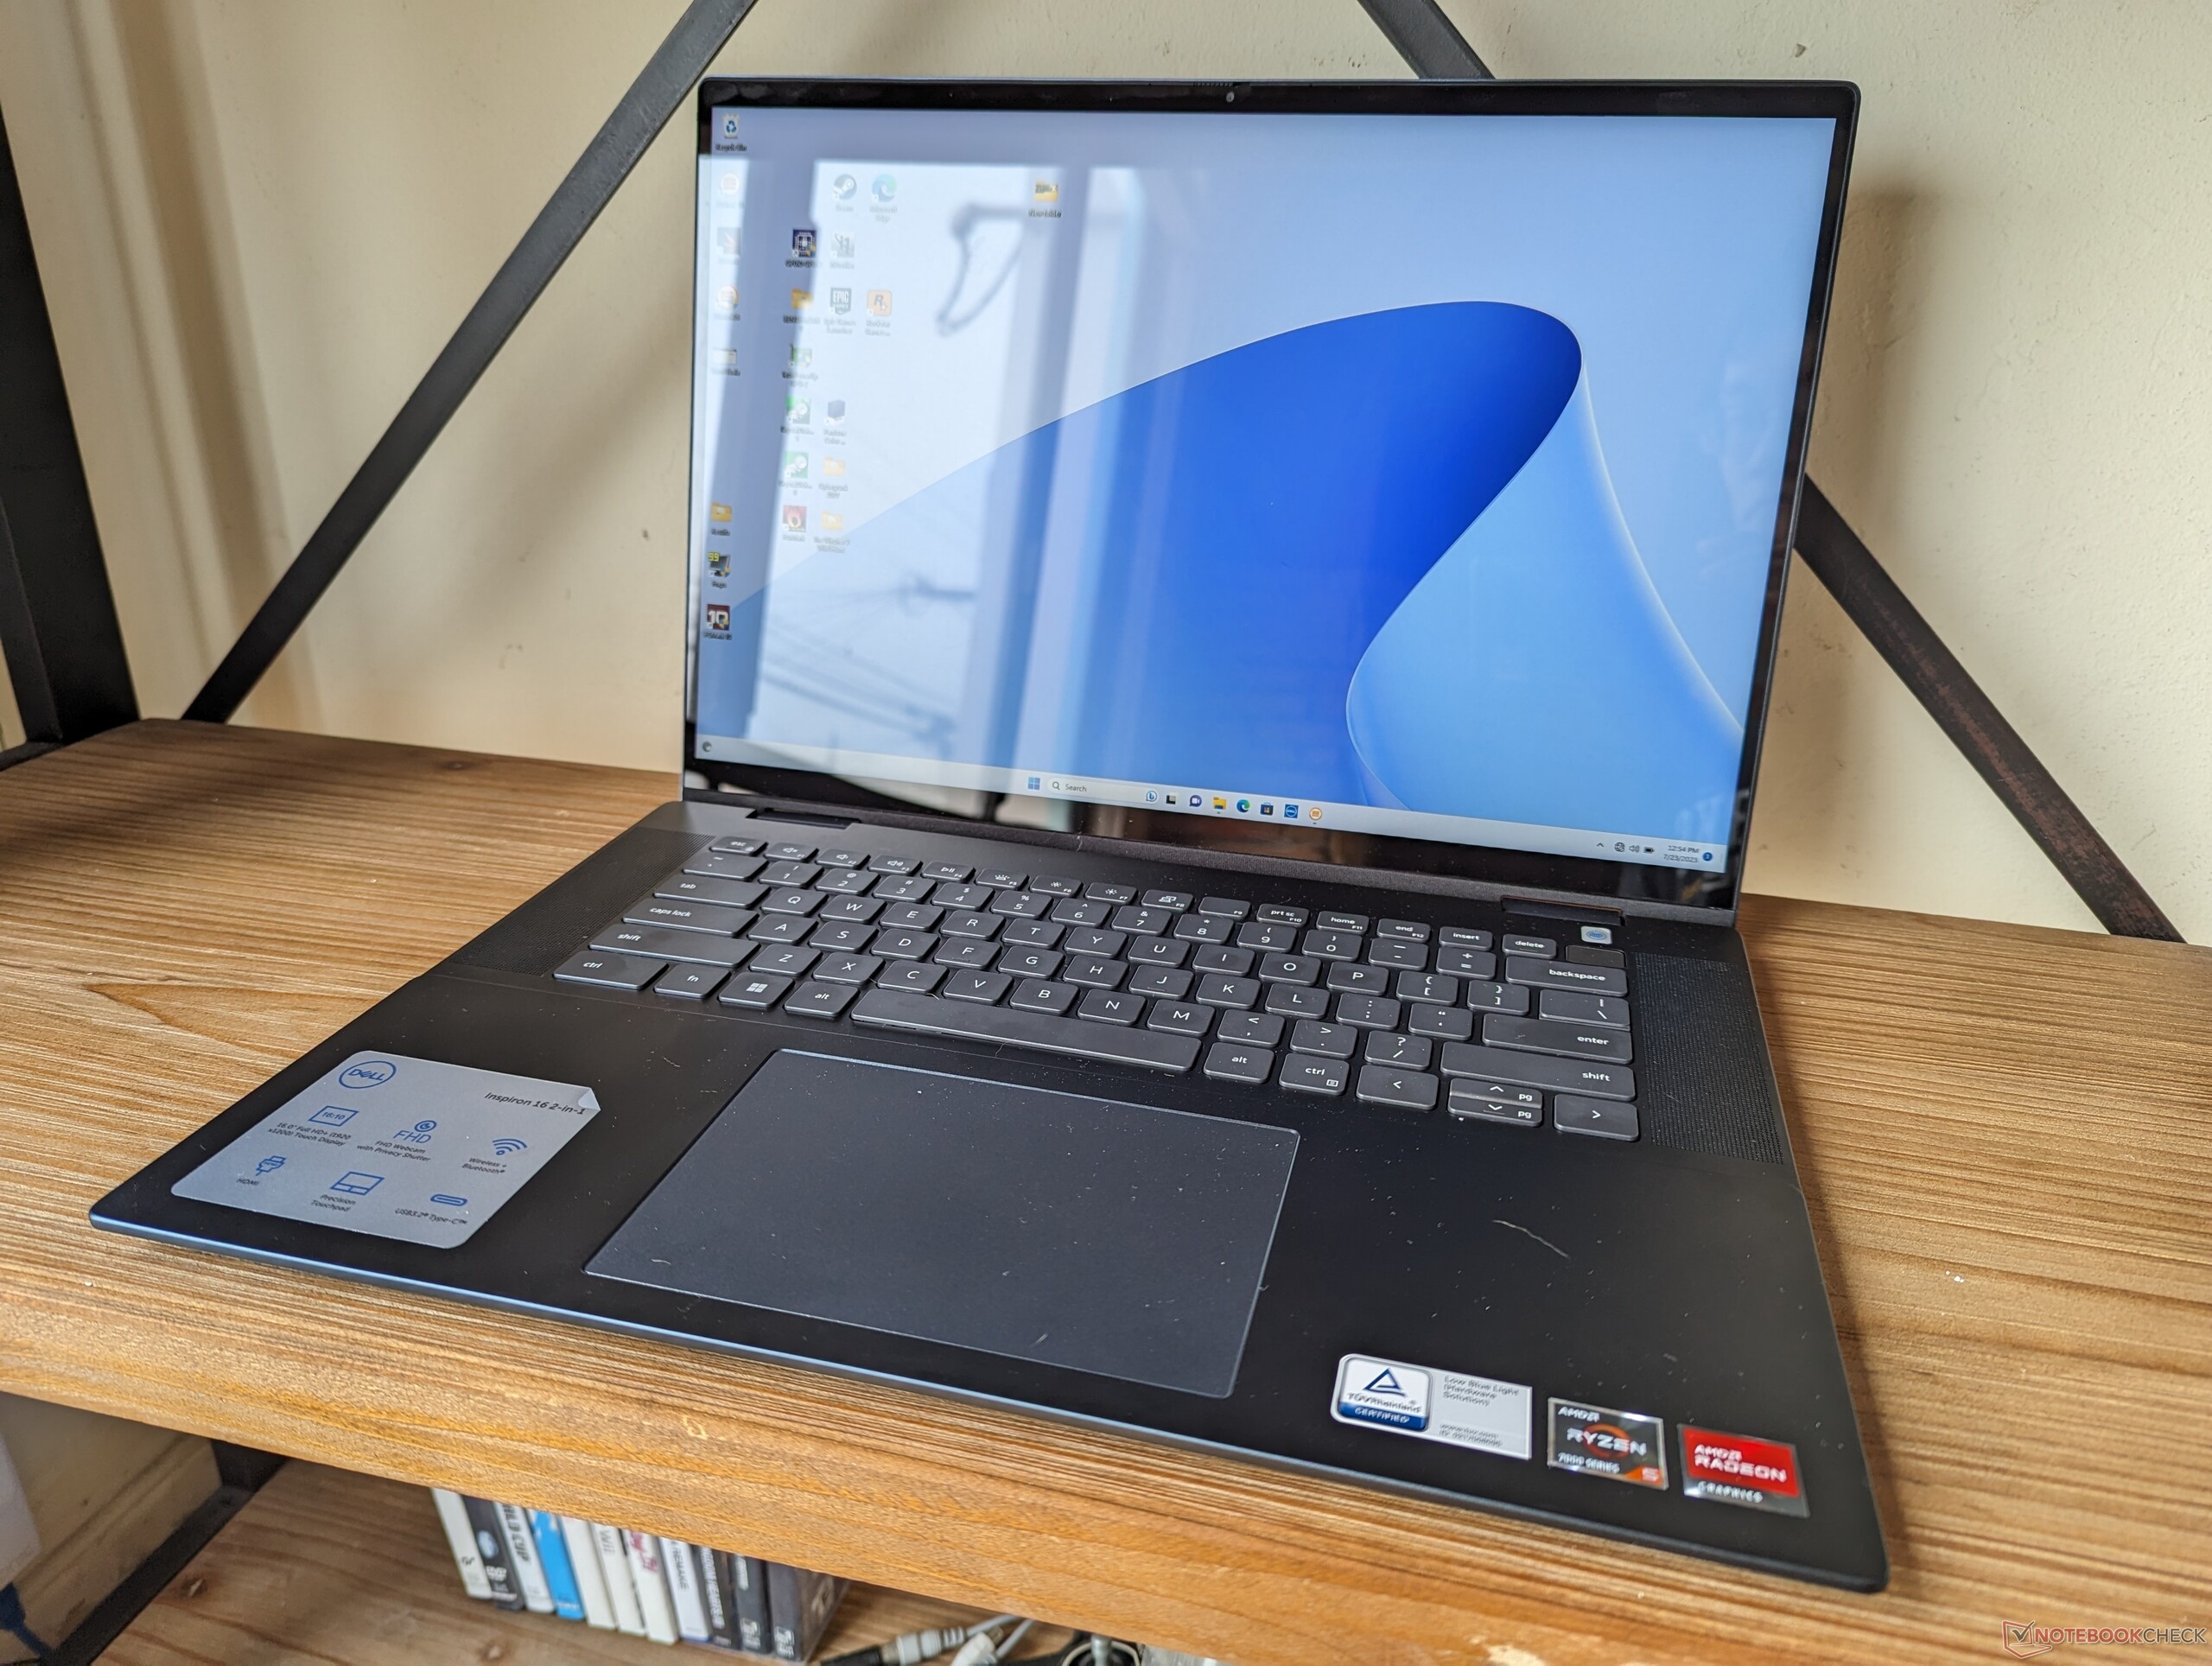
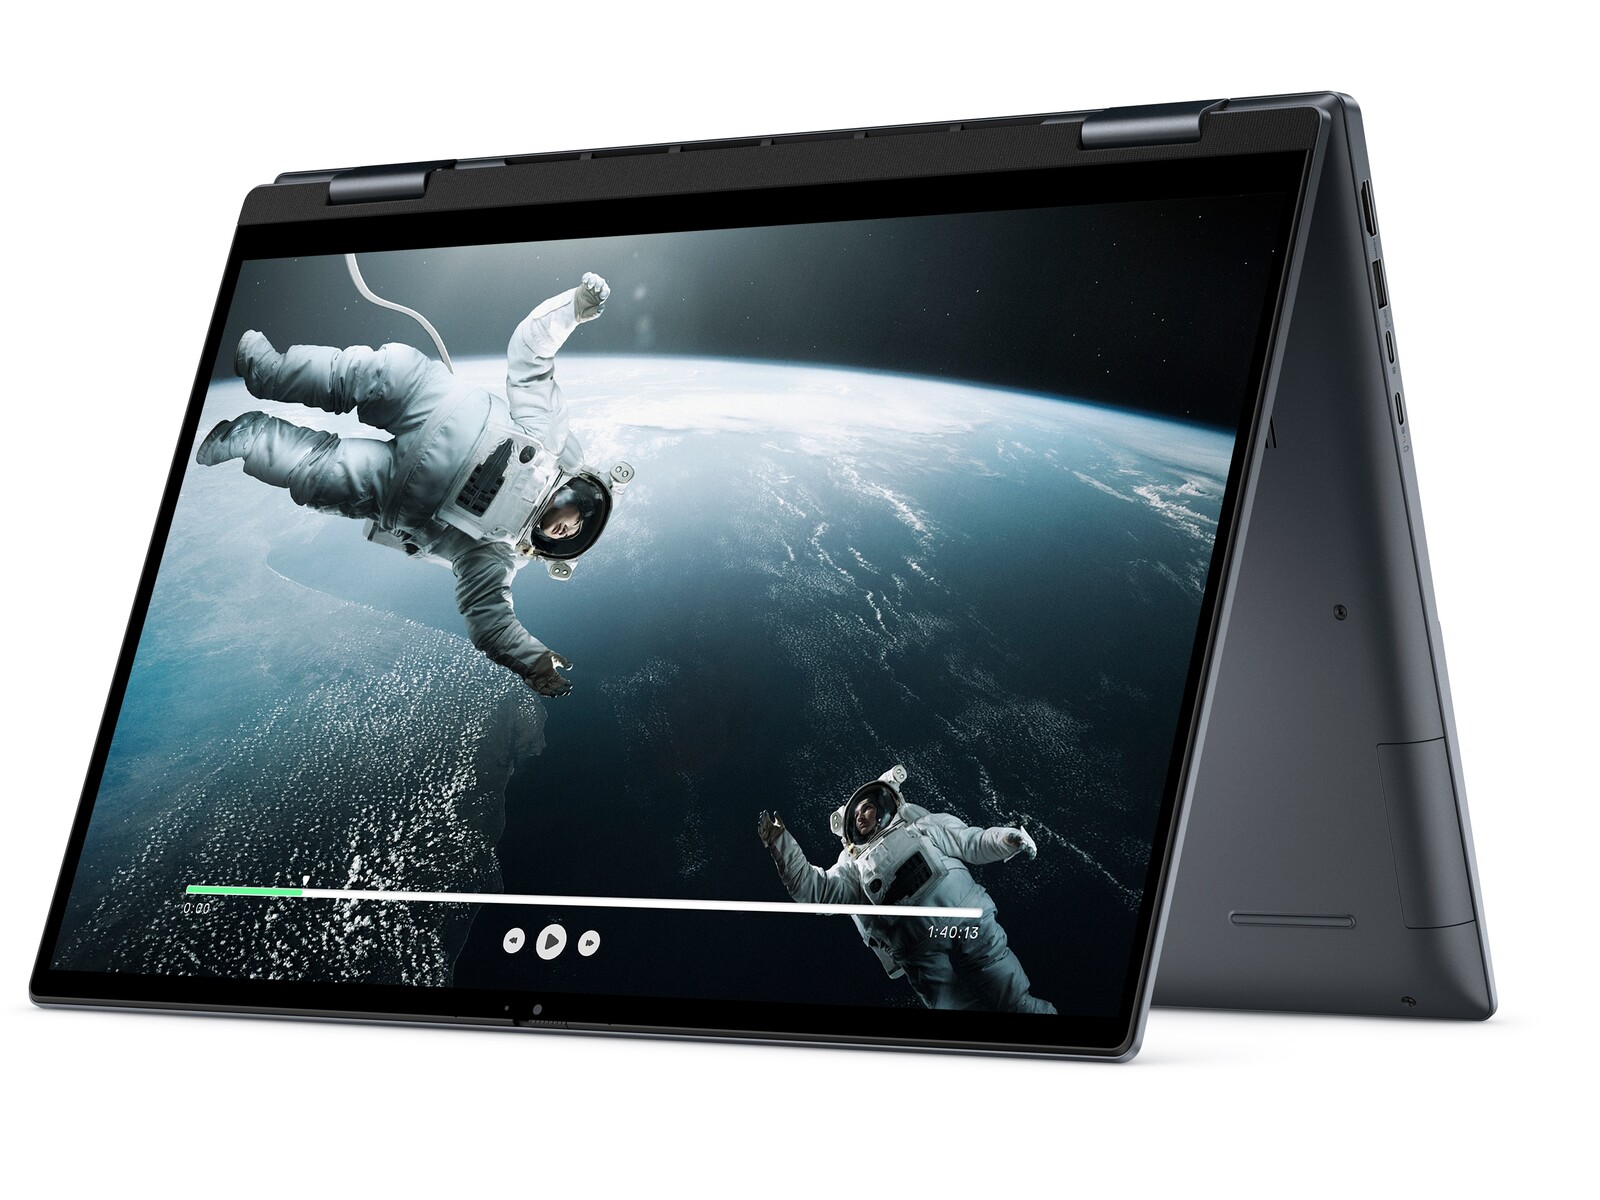
Test du Dell Inspiron 16 7635 : un Inspiron 16 7630 2-en-1 édulcoré avec AMD Ryzen

L'Inspiron 16 7635 2-en-1 est la version AMD de l'Inspiron 16 7630 2-en-1 basé sur Intel. Comme les autres modèles Inspiron, il s'adresse à la catégorie des consommateurs à petit budget ou de milieu de gamme, contrairement à la série des XPS, plus haut de gamme et centrés sur les entreprises ( Latitude ) ou les prosommateurs. Il succède directement à l'Inspiron 16 7620 2-en-1 de l'année dernière Inspiron 16 7620 2-en-1 de l'année dernière, avec de nouveaux processeurs et un design extérieur revu.
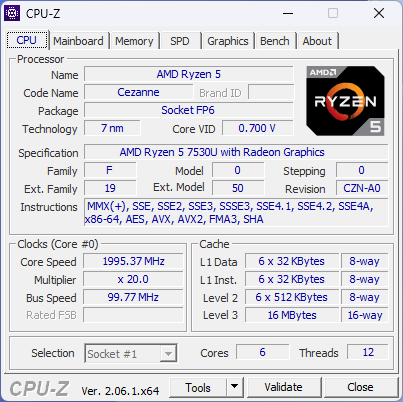
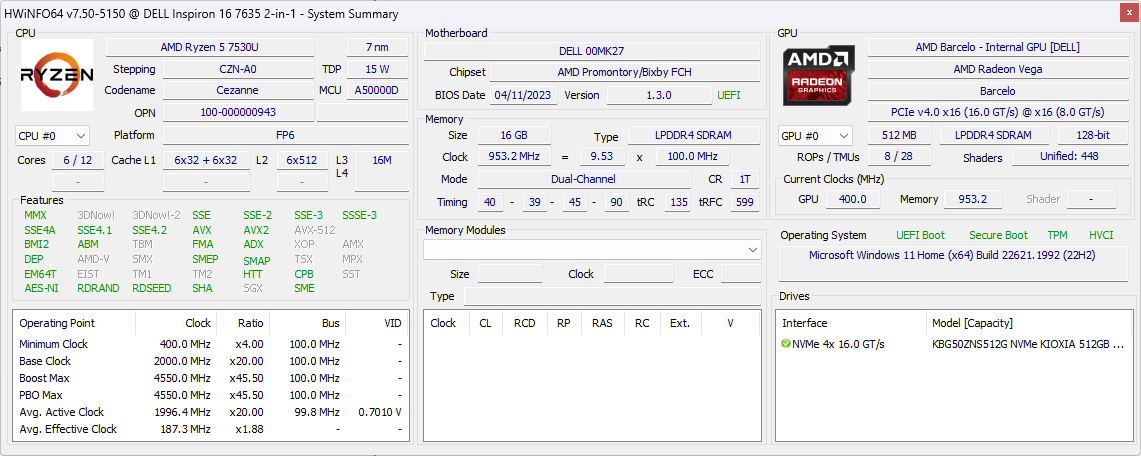
Notre unité de test spécifique est une configuration bas de gamme avec le CPU Zen 3 Ryzen 5 7530U, 16 Go de RAM LPDDR4x 4266 MHz soudée et un SSD NVMe de 512 Go pour environ 900 USD au détail. Une option Ryzen 7 7730U plus haut de gamme est disponible, mais tous les SKU AMD sont actuellement livrés avec le même écran IPS 1200p alors que la version Intel dispose d'une option OLED 2400p plus onéreuse.
Les alternatives à l'Inspiron 16 7635 2-en-1 comprennent d'autres grands ordinateurs portables convertibles comme le Lenovo Flex 5 16 ou le plus puissant MSI Summit E16 Flipou le HP Spectre x360 16.
Plus d'avis sur Dell :
Comparaison avec les concurrents potentiels
Note | Date | Modèle | Poids | Épaisseur | Taille | Résolution | Prix |
|---|---|---|---|---|---|---|---|
| 84.6 % v7 (old) | 07/23 | Dell Inspiron 16 7635 2-in-1 R5 7530U, Vega 7 | 2 kg | 18.99 mm | 16.00" | 1920x1200 | |
| 87.5 % v7 (old) | 06/23 | Acer Swift Edge SFE16-42-R1GM R7 7735U, Radeon 680M | 1.2 kg | 13.95 mm | 16.00" | 3840x2400 | |
| 85.8 % v7 (old) | 05/23 | Lenovo Yoga 7 16IRL8 i7-1355U, Iris Xe G7 96EUs | 2 kg | 16.99 mm | 16.00" | 1920x1200 | |
| 85.6 % v7 (old) | 05/23 | Samsung Galaxy Book3 Pro 16 i5-1340P, Iris Xe G7 80EUs | 1.6 kg | 12.5 mm | 16.00" | 2880x1800 | |
| 80.7 % v7 (old) | 04/23 | Lenovo IdeaPad Flex 5 16ABR G8 R7 7730U, Vega 8 | 2 kg | 18.7 mm | 16.00" | 1920x1200 | |
| 85.7 % v7 (old) | 06/22 | Dell Inspiron 16 7620 2-in-1 i7-1260P, Iris Xe G7 96EUs | 2.1 kg | 18.41 mm | 16.00" | 1920x1200 |
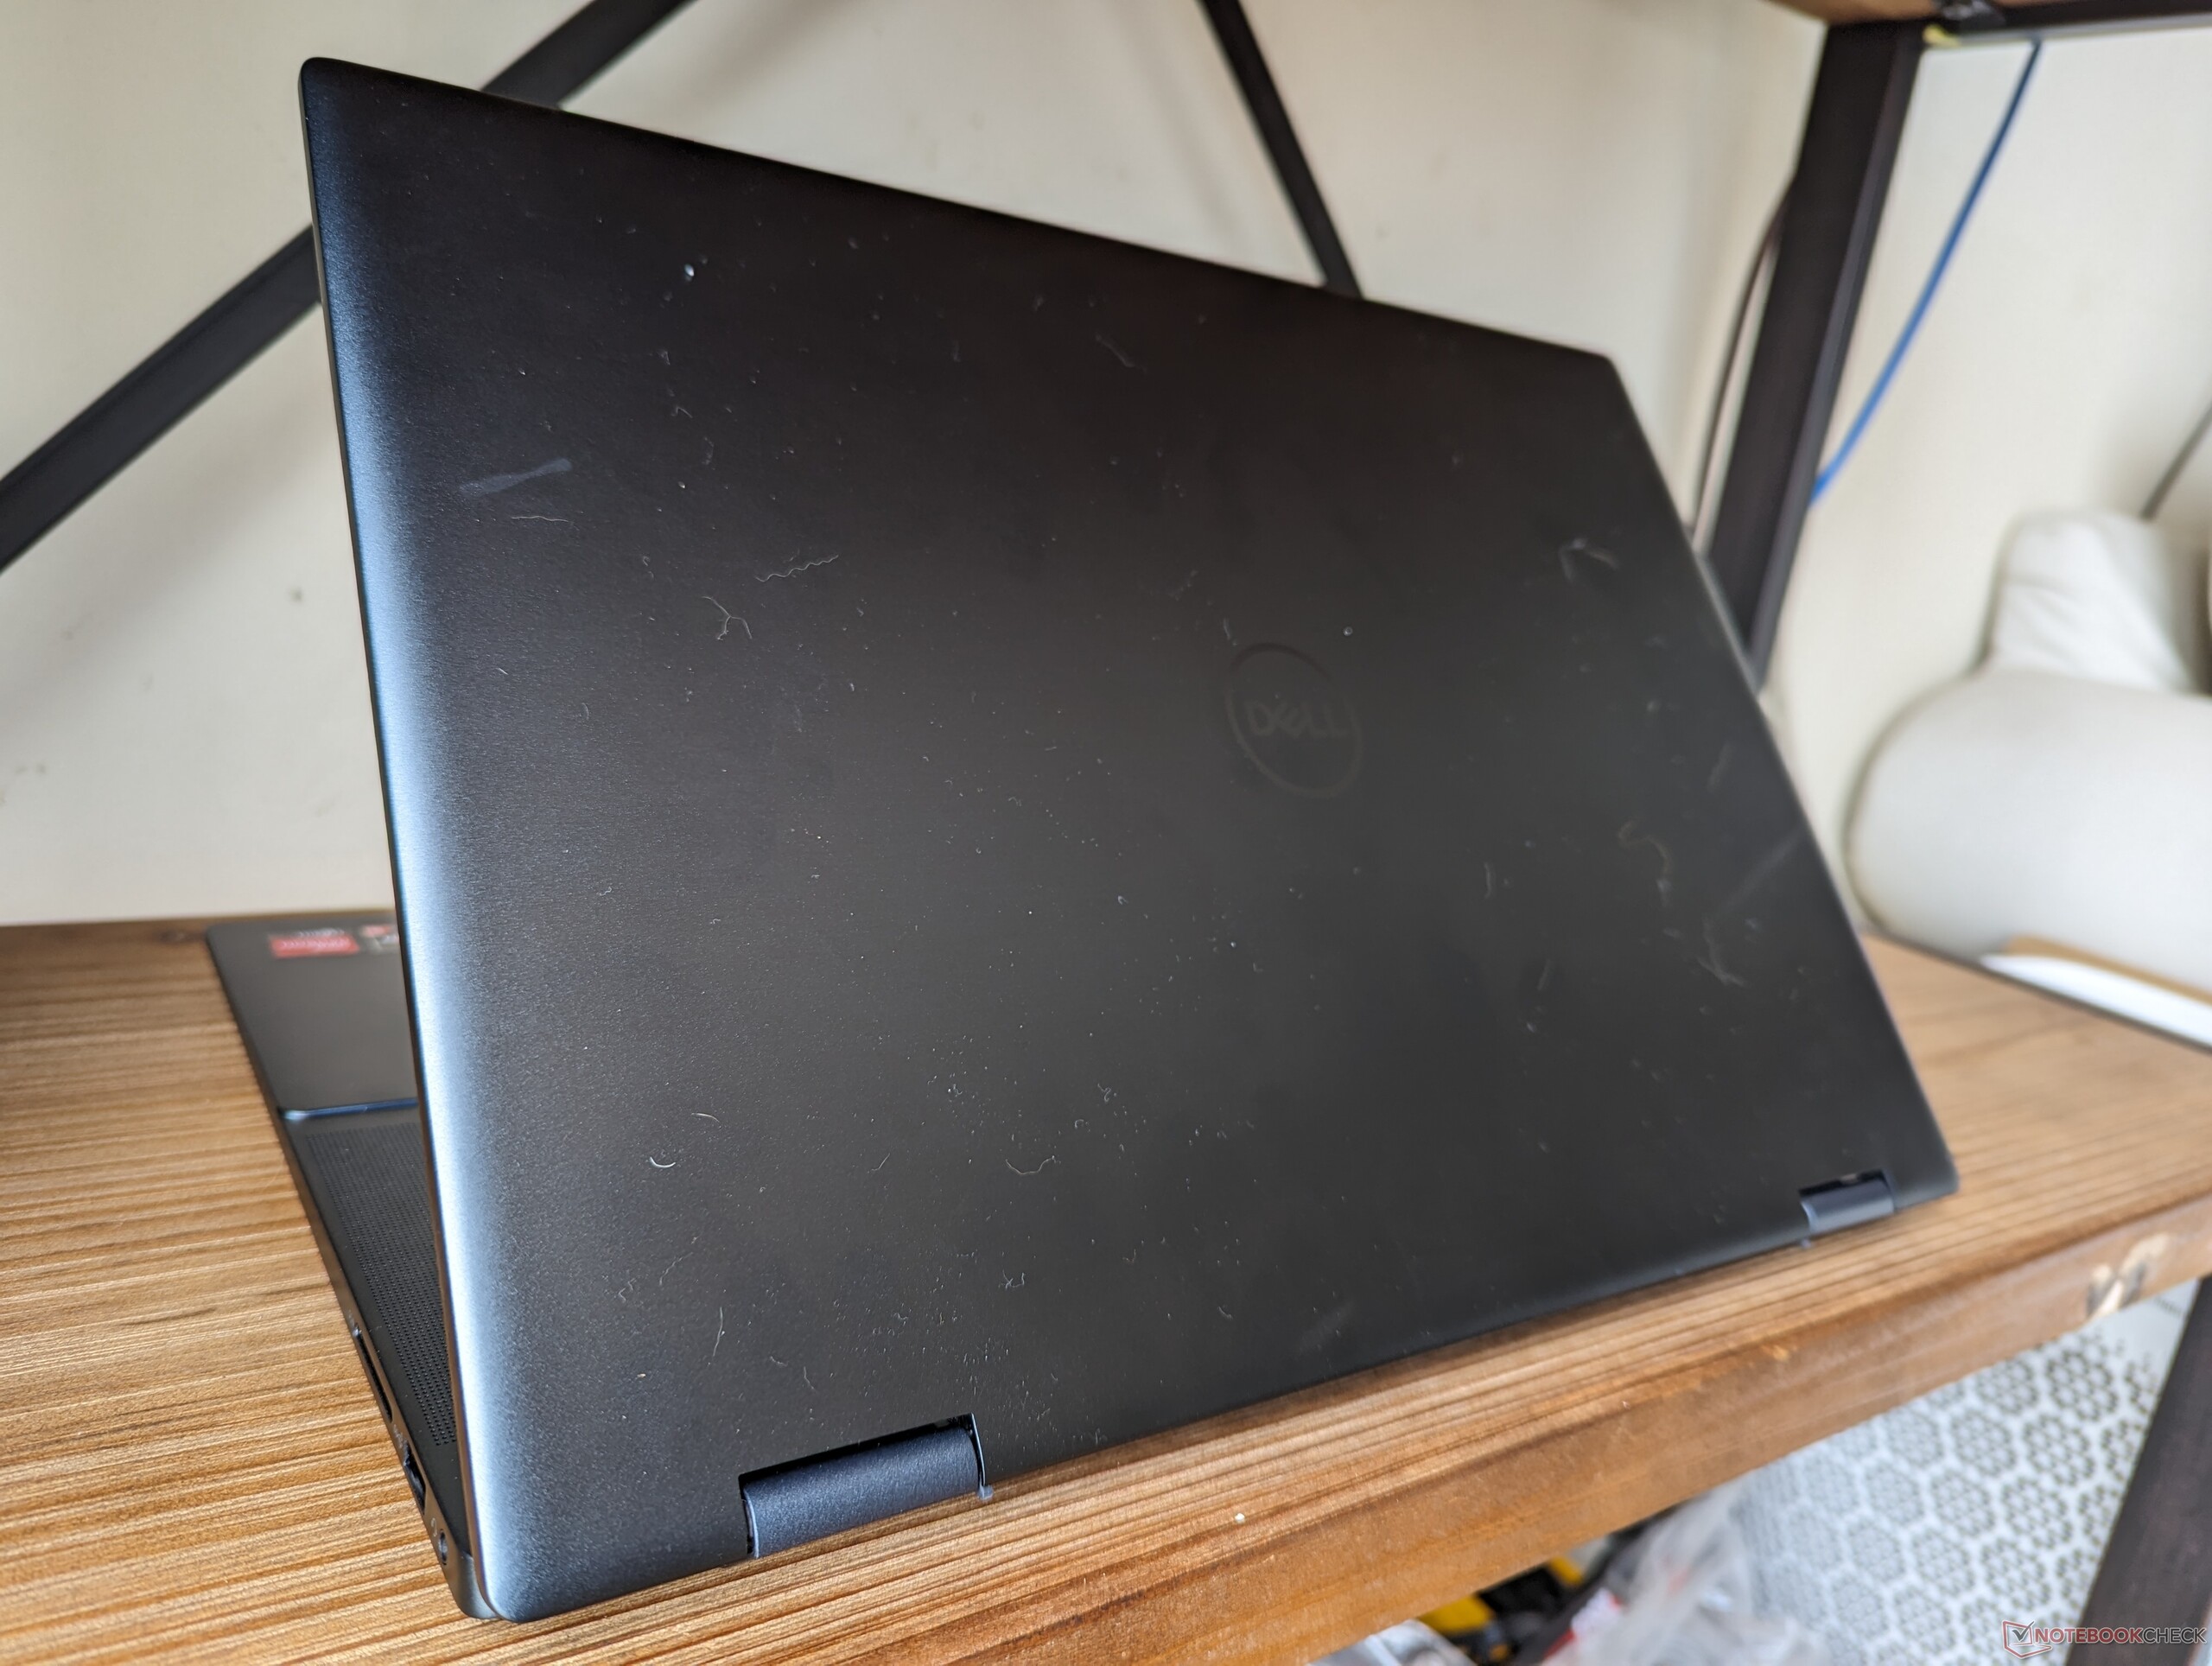
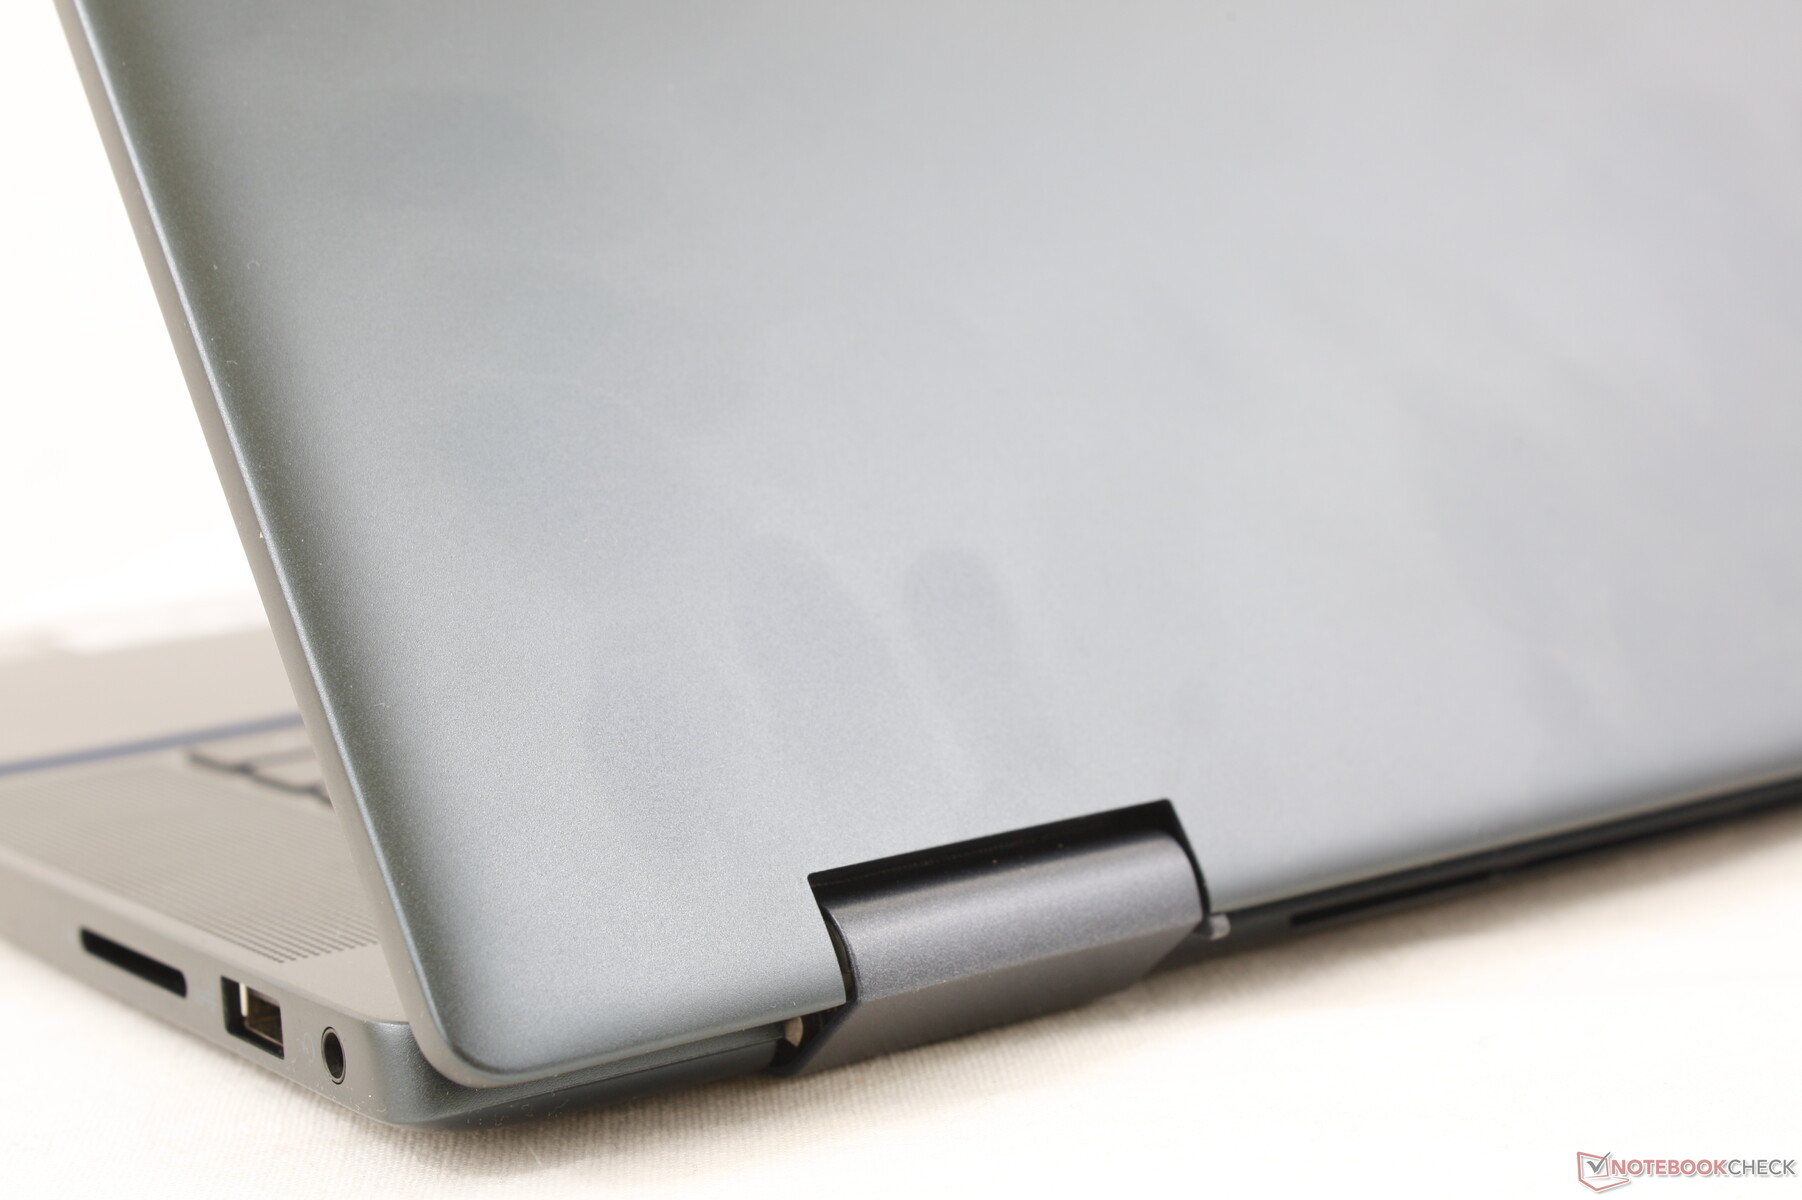
Cas - Goutte à goutte silencieuse de Mylar
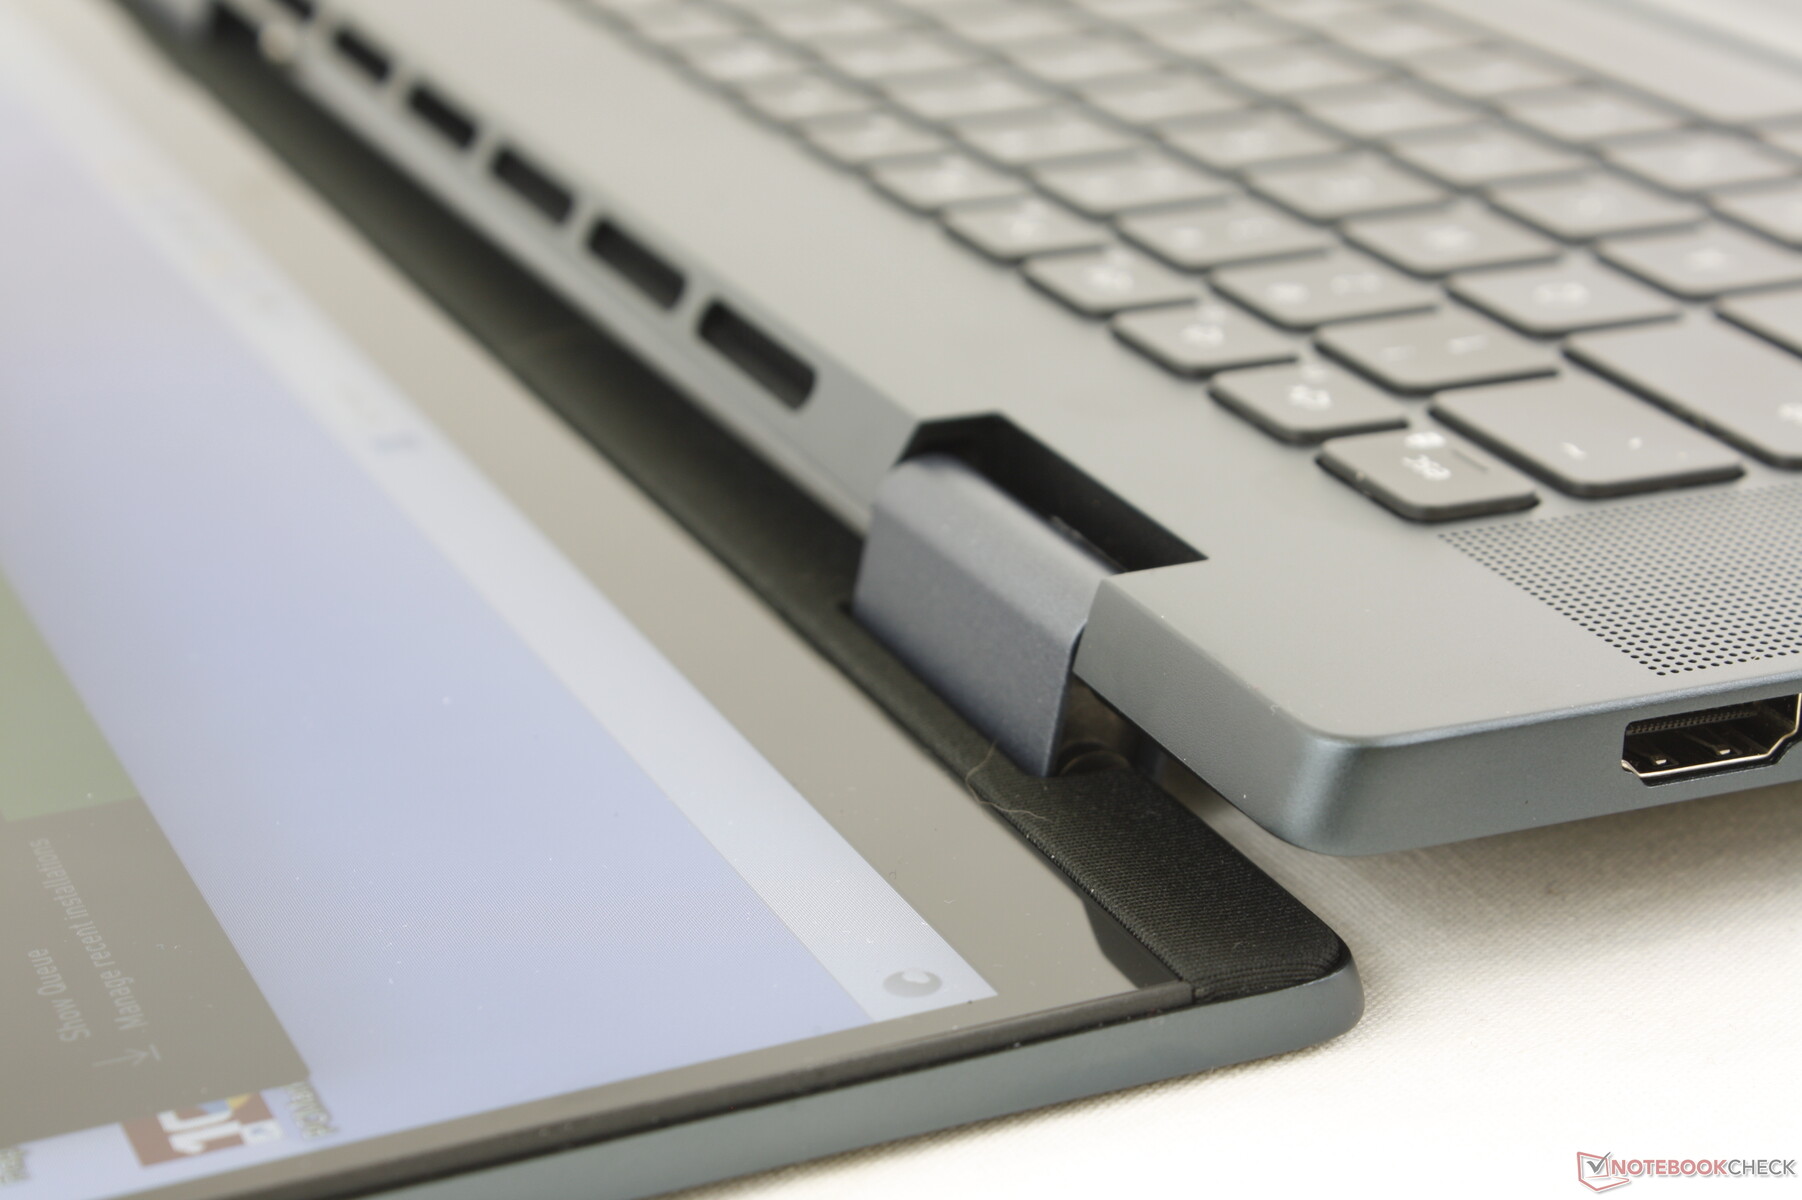
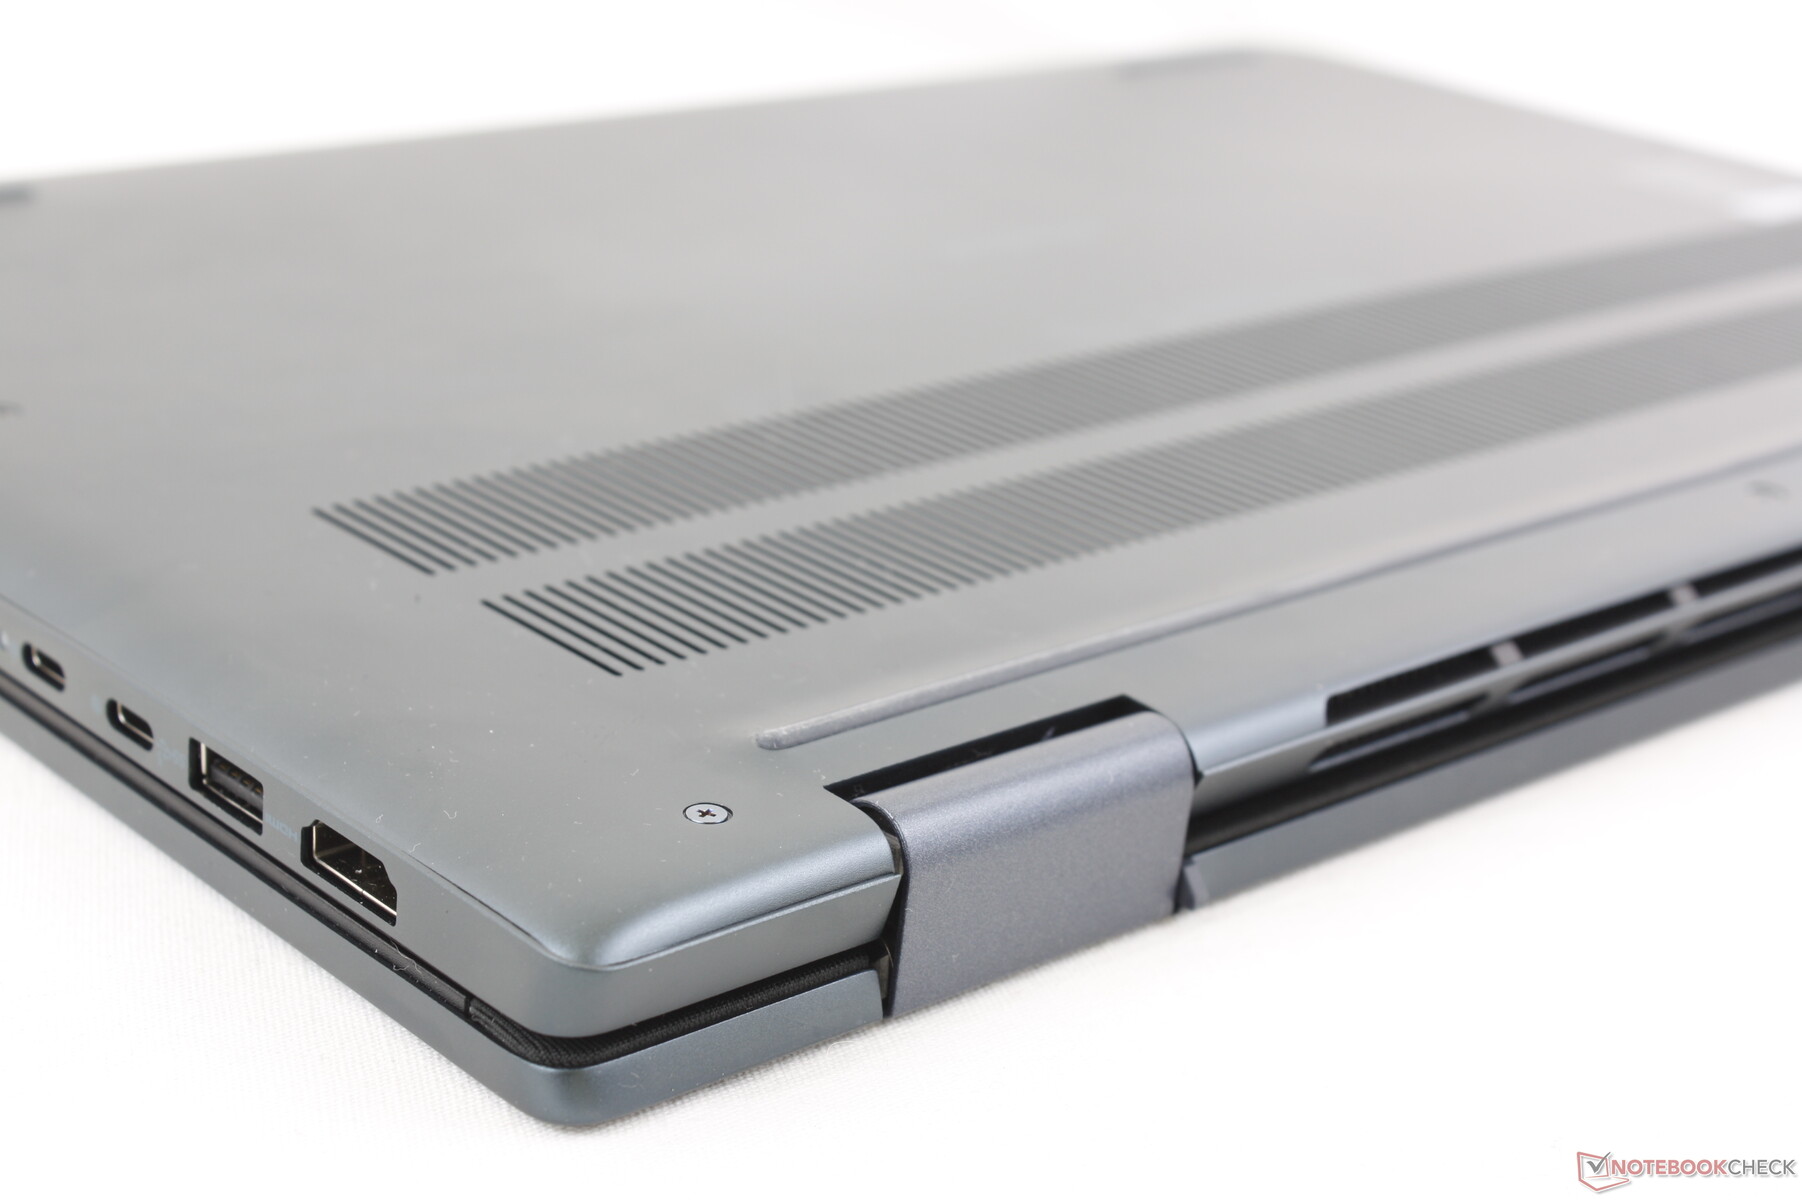
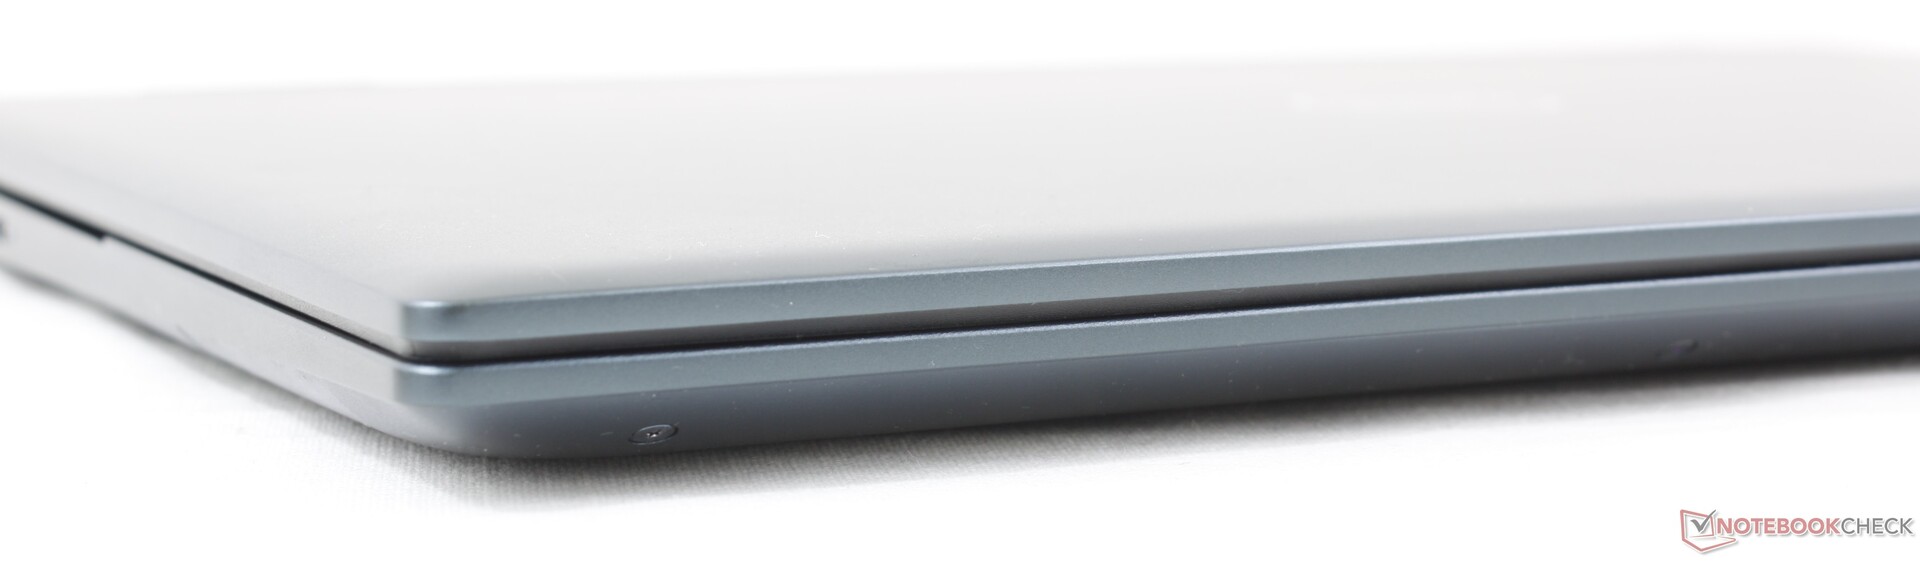
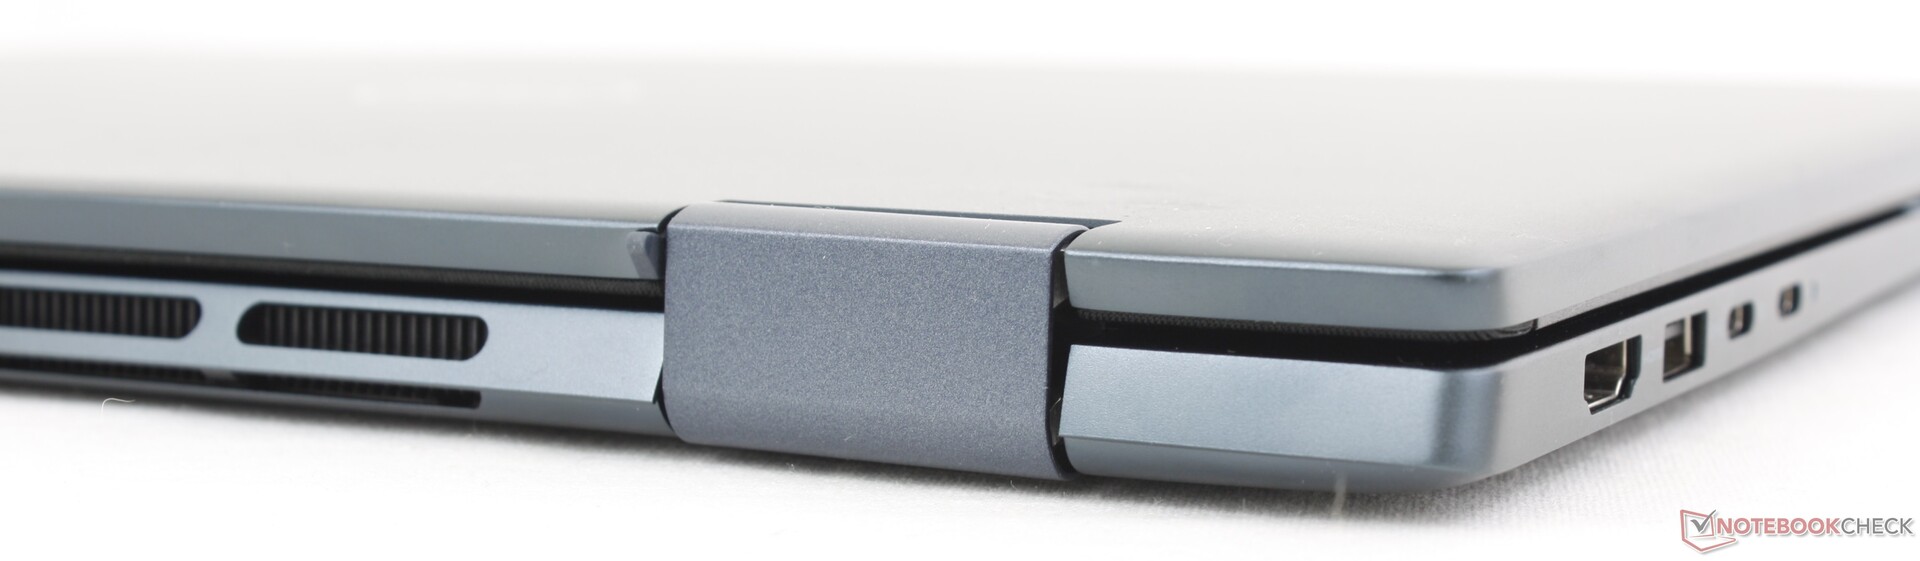
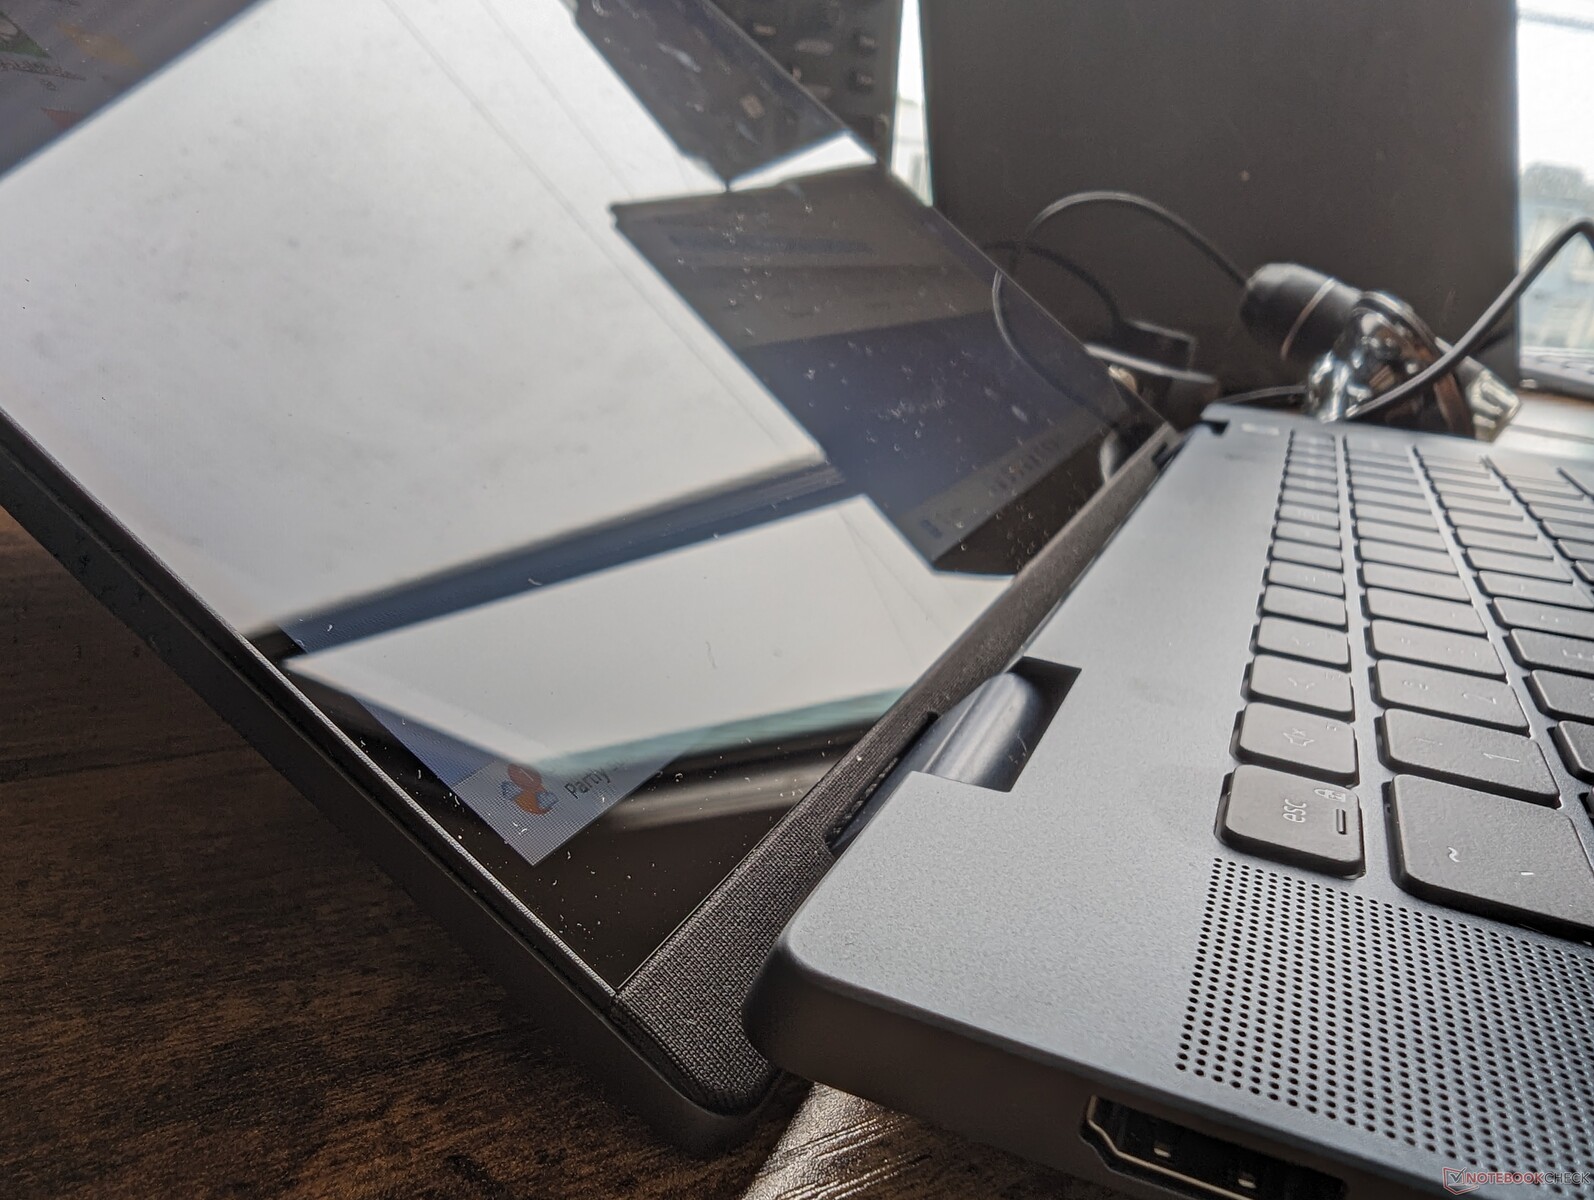
Dell a fait grand cas de l'utilisation du Mylar sur l'Inspiron 16 7620 2-en-1 de l'année dernière et il est donc un peu perplexe de le voir soudainement disparaître pour l'Inspiron 16 7630/7635 de cette année. Le châssis est désormais constitué d'une combinaison d'aluminium et de plastiques recyclés pour une apparence et une palette de couleurs plus monotones. Les charnières ont également été redessinées pour être plus plates et il y a maintenant des grilles de ventilation supplémentaires à l'arrière pour faciliter le refroidissement.
La qualité du châssis reste à peu près la même d'une année sur l'autre malgré les changements extérieurs. Le poids dense contribue à une base inflexible pour une première impression forte qui n'est qu'un ou deux pas en dessous du HP Spectre x360 16, beaucoup plus cher et tout aussi lourd.HP Spectre x360 16.
Peut-être par coïncidence, les dimensions et le poids sont presque identiques à ceux de l'IdeaPad Flex 5, le modèle concurrent.IdeaPad Flex 5 16. Le nouveau modèle n'est malheureusement pas plus petit ou plus léger que l'Inspiron 16 7620 2-en-1 de l'année dernière et reste donc un ordinateur portable relativement lourd, même dans la catégorie des 16 pouces.
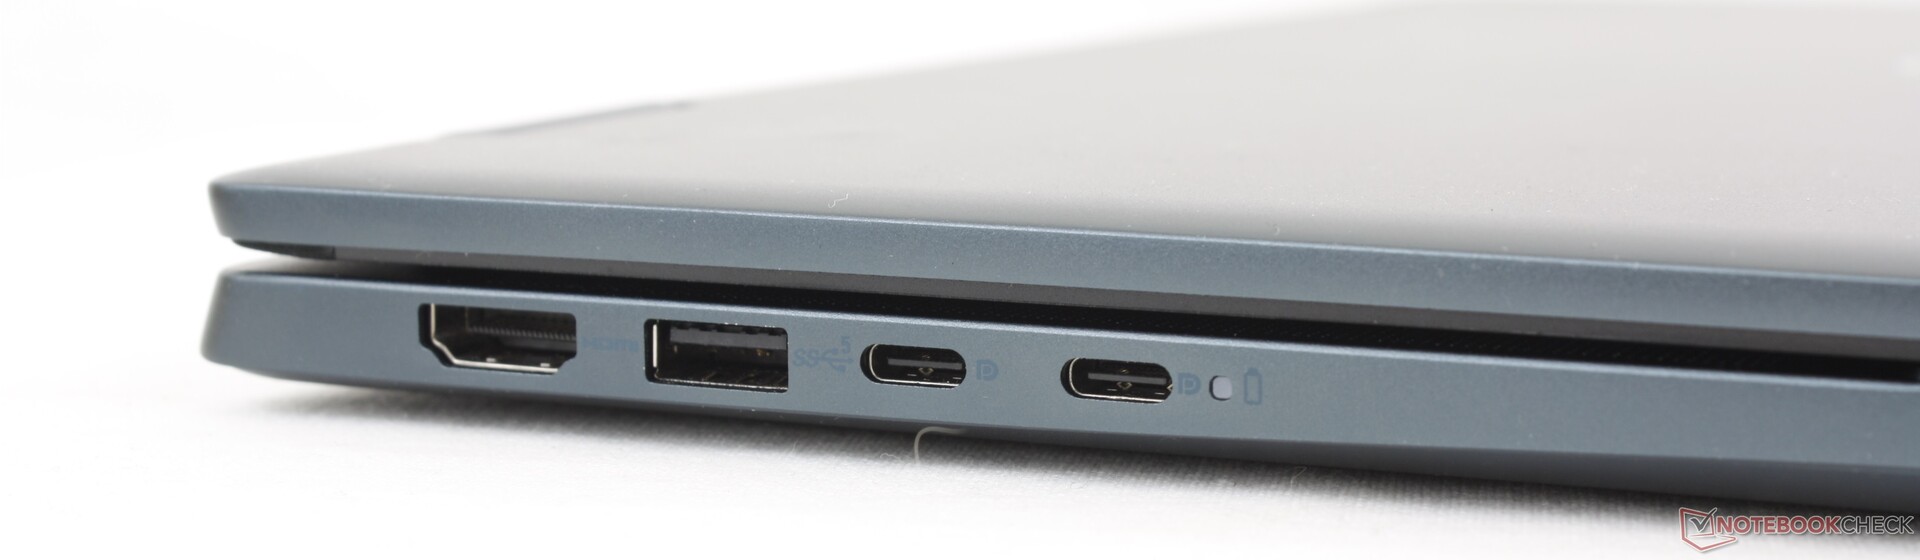
Connectivité - Pas de prise en charge Thunderbolt
Le modèle conserve tous les ports présents sur l'Inspiron 16 7620 2-en-1 de l'année dernière. La principale différence, cependant, est que notre configuration AMD ne supporte pas le Thunderbolt. La variété des ports reste néanmoins comparable à celle d'autres ordinateurs portables de 16 pouces comme l'IdeaPad Flex 5 16 ou l'Acer Swift Edge SFE16 Acer Swift Edge SFE16.
N'oubliez pas que le port HDMI n'est que 1.4 au lieu de 2.0. Pour une prise en charge correcte des moniteurs 4K externes à 60 Hz, veillez à utiliser plutôt les ports USB-C.
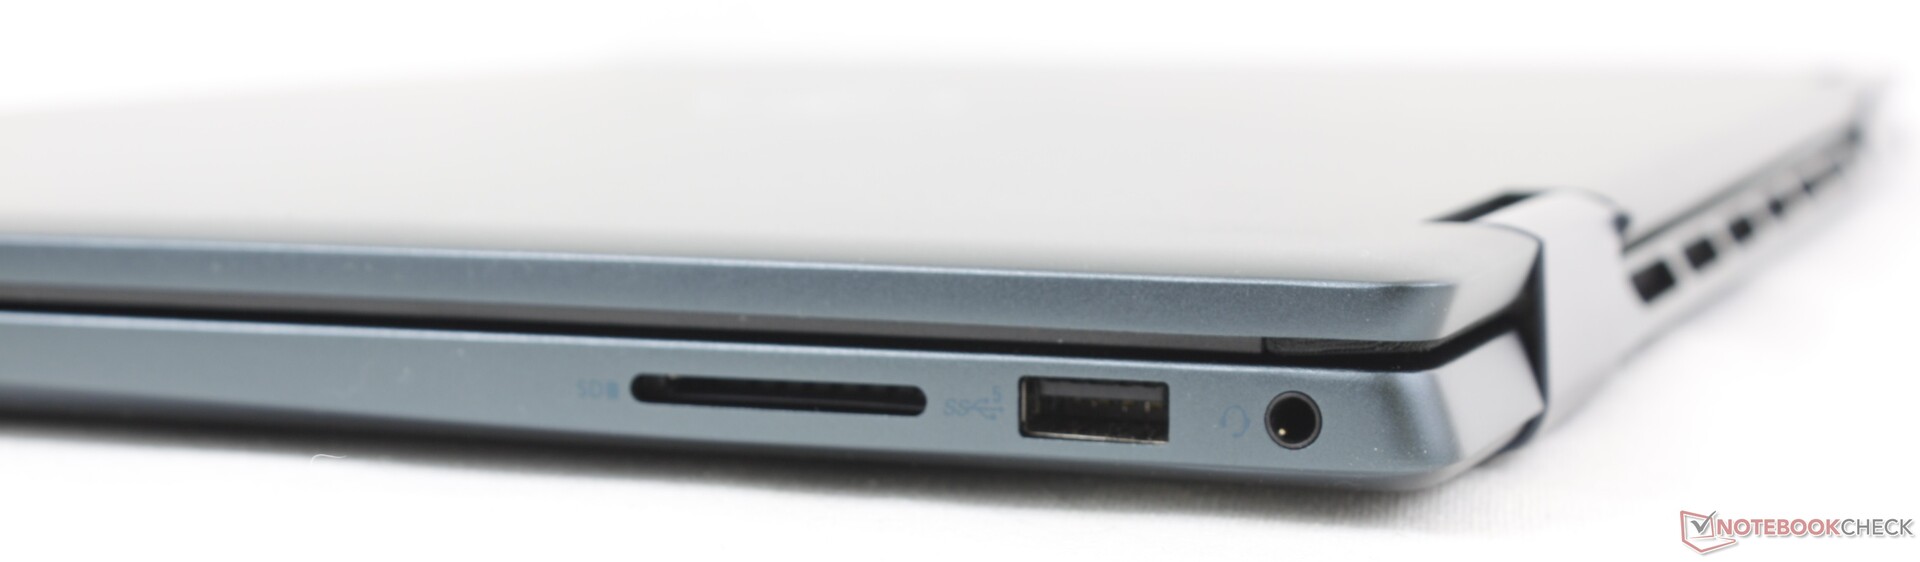
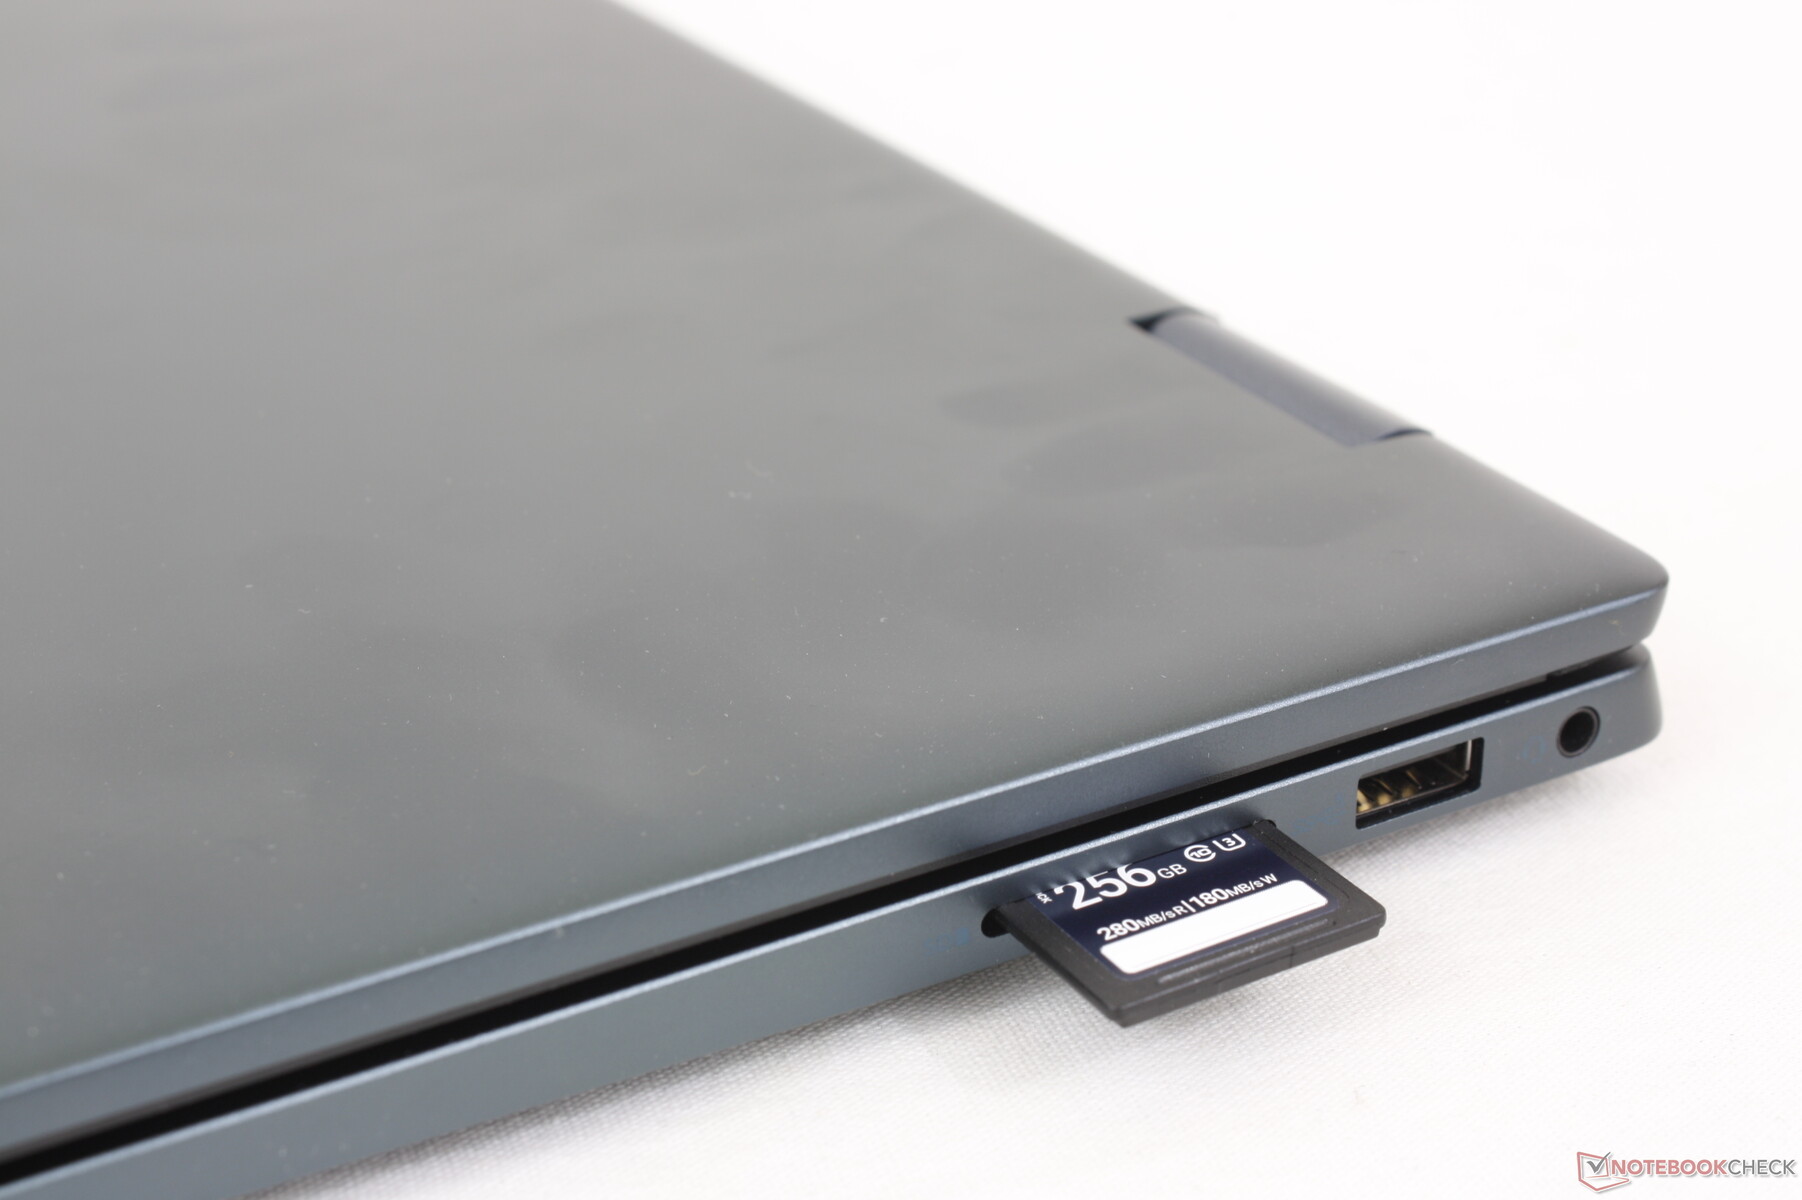
Lecteur de carte SD
Le lecteur de cartes intégré est légèrement plus rapide qu'auparavant, mais les taux de transfert sont encore deux fois moins rapides que sur les IdeaPad Flex 5 16 ou Book3 Pro 16 de Lenovo Galaxy Book3 Pro 16. Transférer 1 Go de photos depuis notre carte de test PNY UHS-II vers le bureau prend environ 32 secondes, contre 17 secondes sur le Lenovo susmentionné.
| SD Card Reader | |
| average JPG Copy Test (av. of 3 runs) | |
| Lenovo IdeaPad Flex 5 16ABR G8 (Angelibird AV Pro V60) | |
| Samsung Galaxy Book3 Pro 16 | |
| Lenovo Yoga 7 16IRL8 (AV Pro SD microSD 128 GB V60) | |
| Dell Inspiron 16 7635 2-in-1 (PNY EliteX-Pro60 V60 256 GB) | |
| Dell Inspiron 16 7620 2-in-1 (Toshiba Exceria Pro SDXC 64 GB UHS-II) | |
| maximum AS SSD Seq Read Test (1GB) | |
| Lenovo Yoga 7 16IRL8 (AV Pro SD microSD 128 GB V60) | |
| Lenovo IdeaPad Flex 5 16ABR G8 (Angelibird AV Pro V60) | |
| Samsung Galaxy Book3 Pro 16 | |
| Dell Inspiron 16 7635 2-in-1 (PNY EliteX-Pro60 V60 256 GB) | |
| Dell Inspiron 16 7620 2-in-1 (Toshiba Exceria Pro SDXC 64 GB UHS-II) | |
Communication
L'Inspiron d'AMD est livré avec le module MediaTek Wi-Fi 6E MT7922, tandis que l'Inspiron d'Intel est livré avec le module AX211. Les deux modules sont compatibles avec les routeurs Wi-Fi 6E ou 6 GHz. Les performances sont régulières et ne posent aucun problème lorsqu'ils sont associés à notre Asus AXE11000.
Webcam
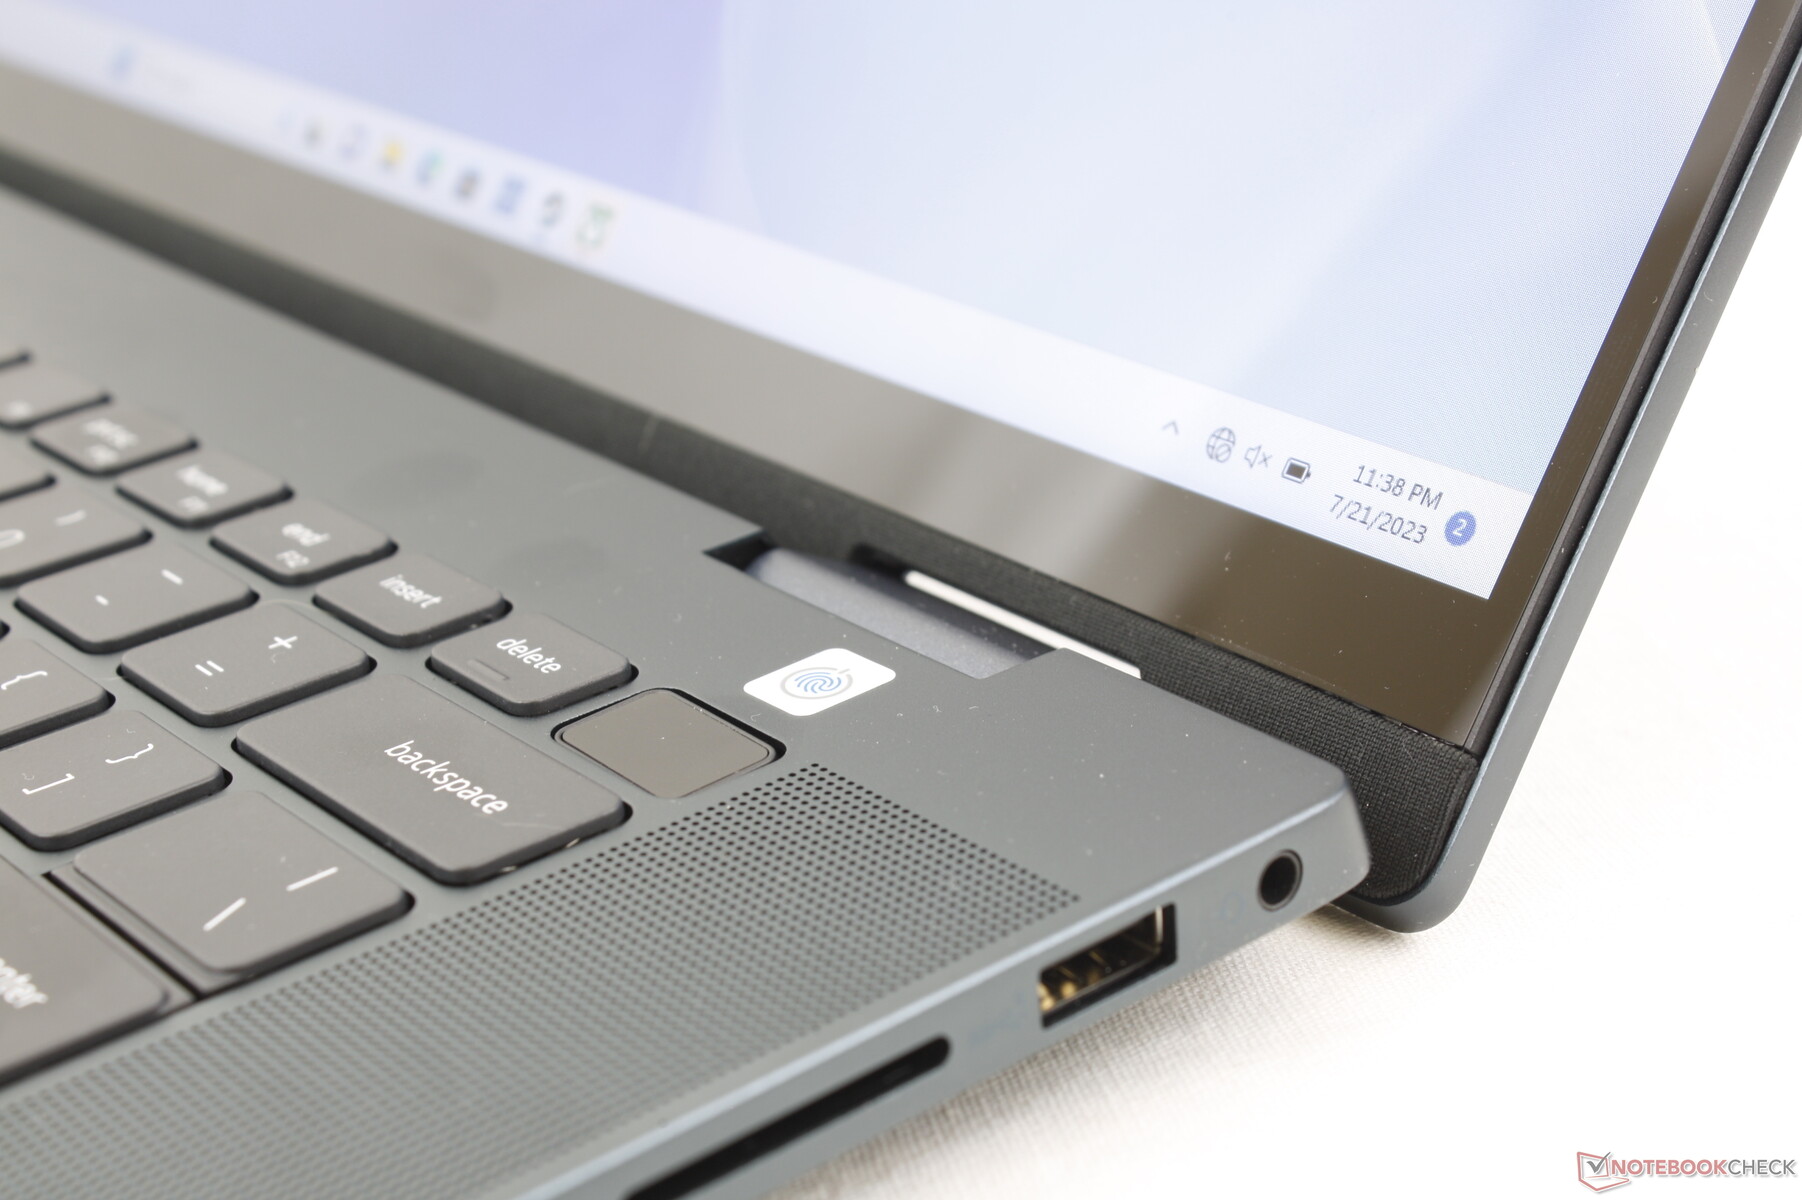
Une webcam 1080p et un obturateur de confidentialité sont livrés en standard sur toutes les configurations, pour une qualité d'image sans surprise. Seul le modèle Intel est toutefois équipé d'un capteur IR en option.


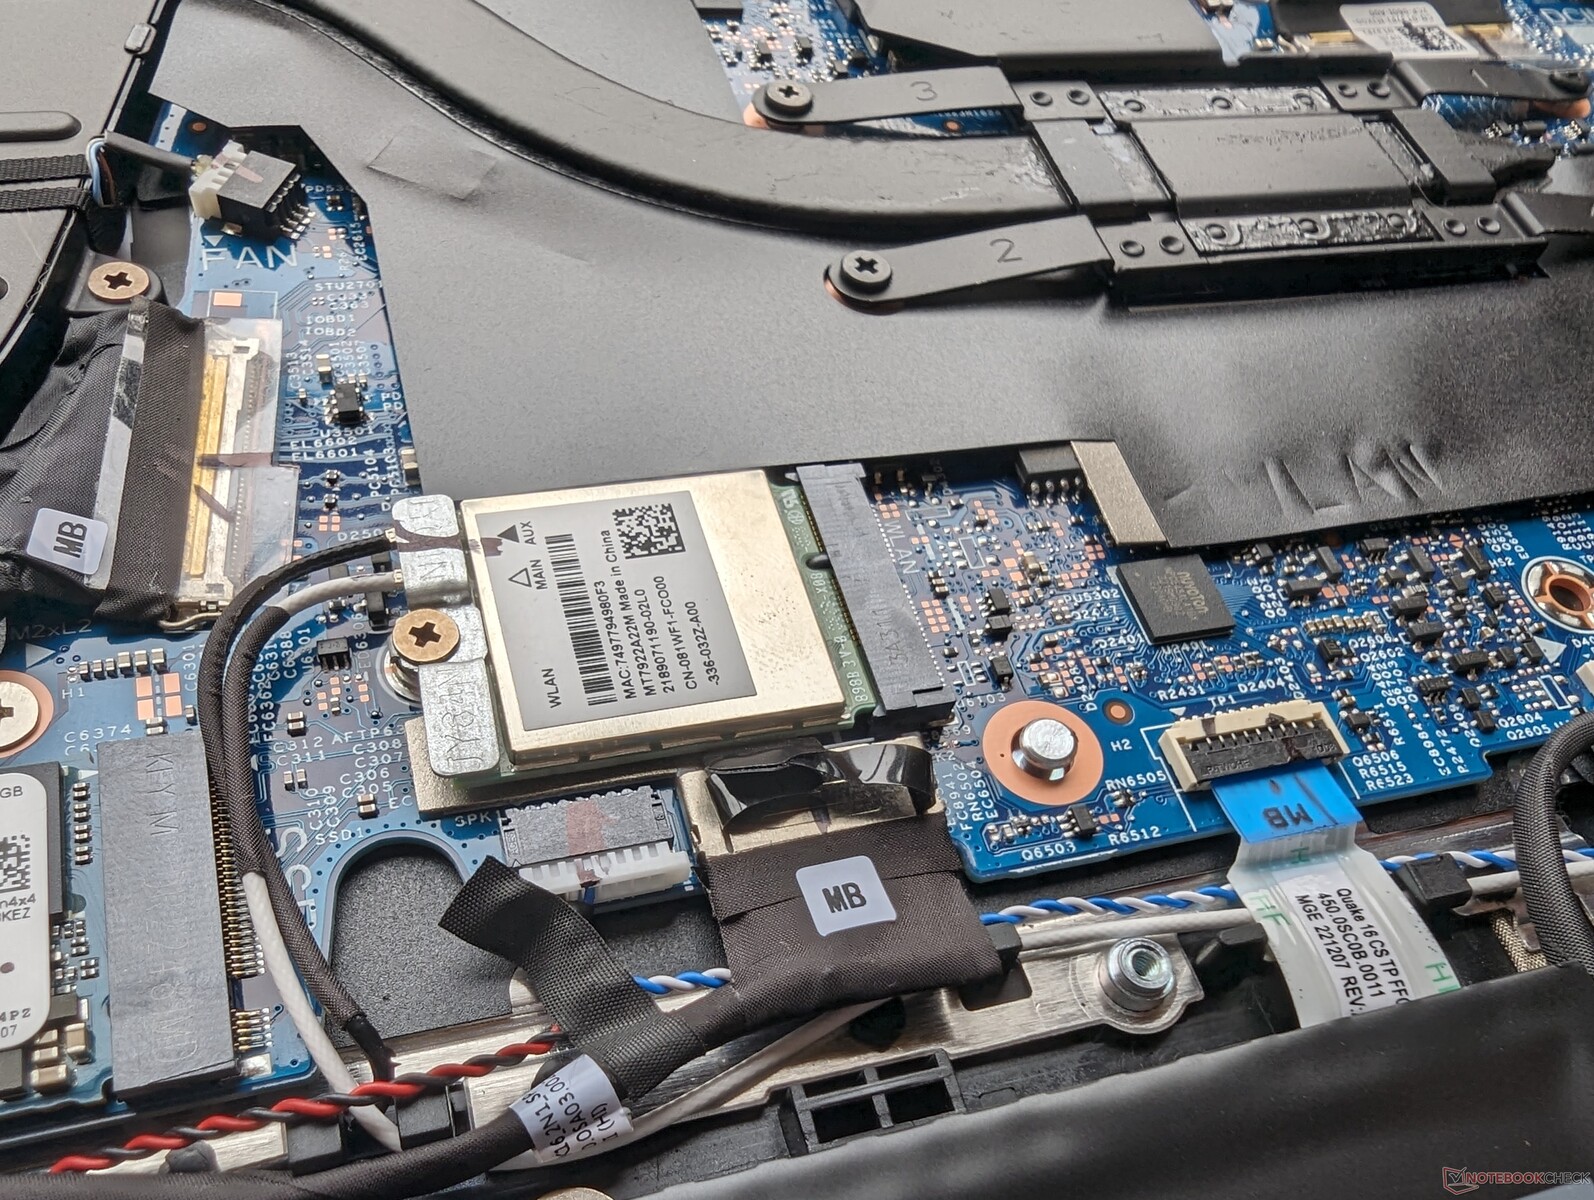
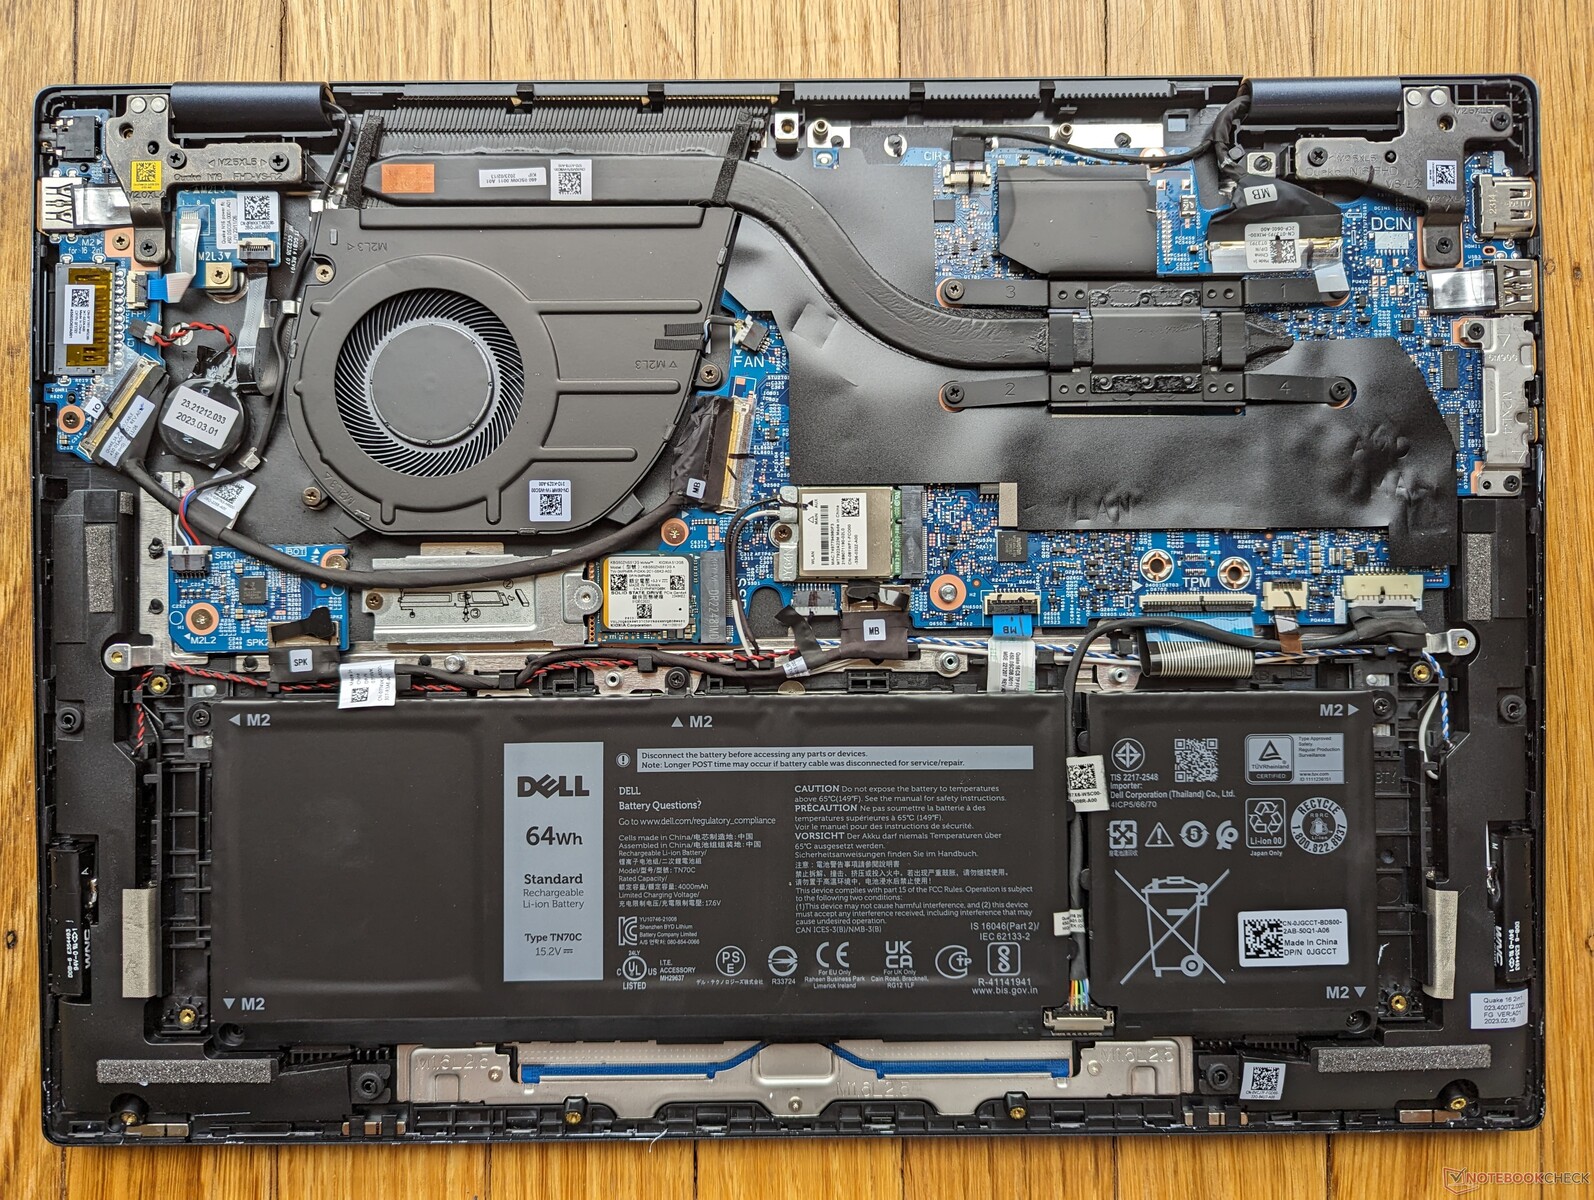
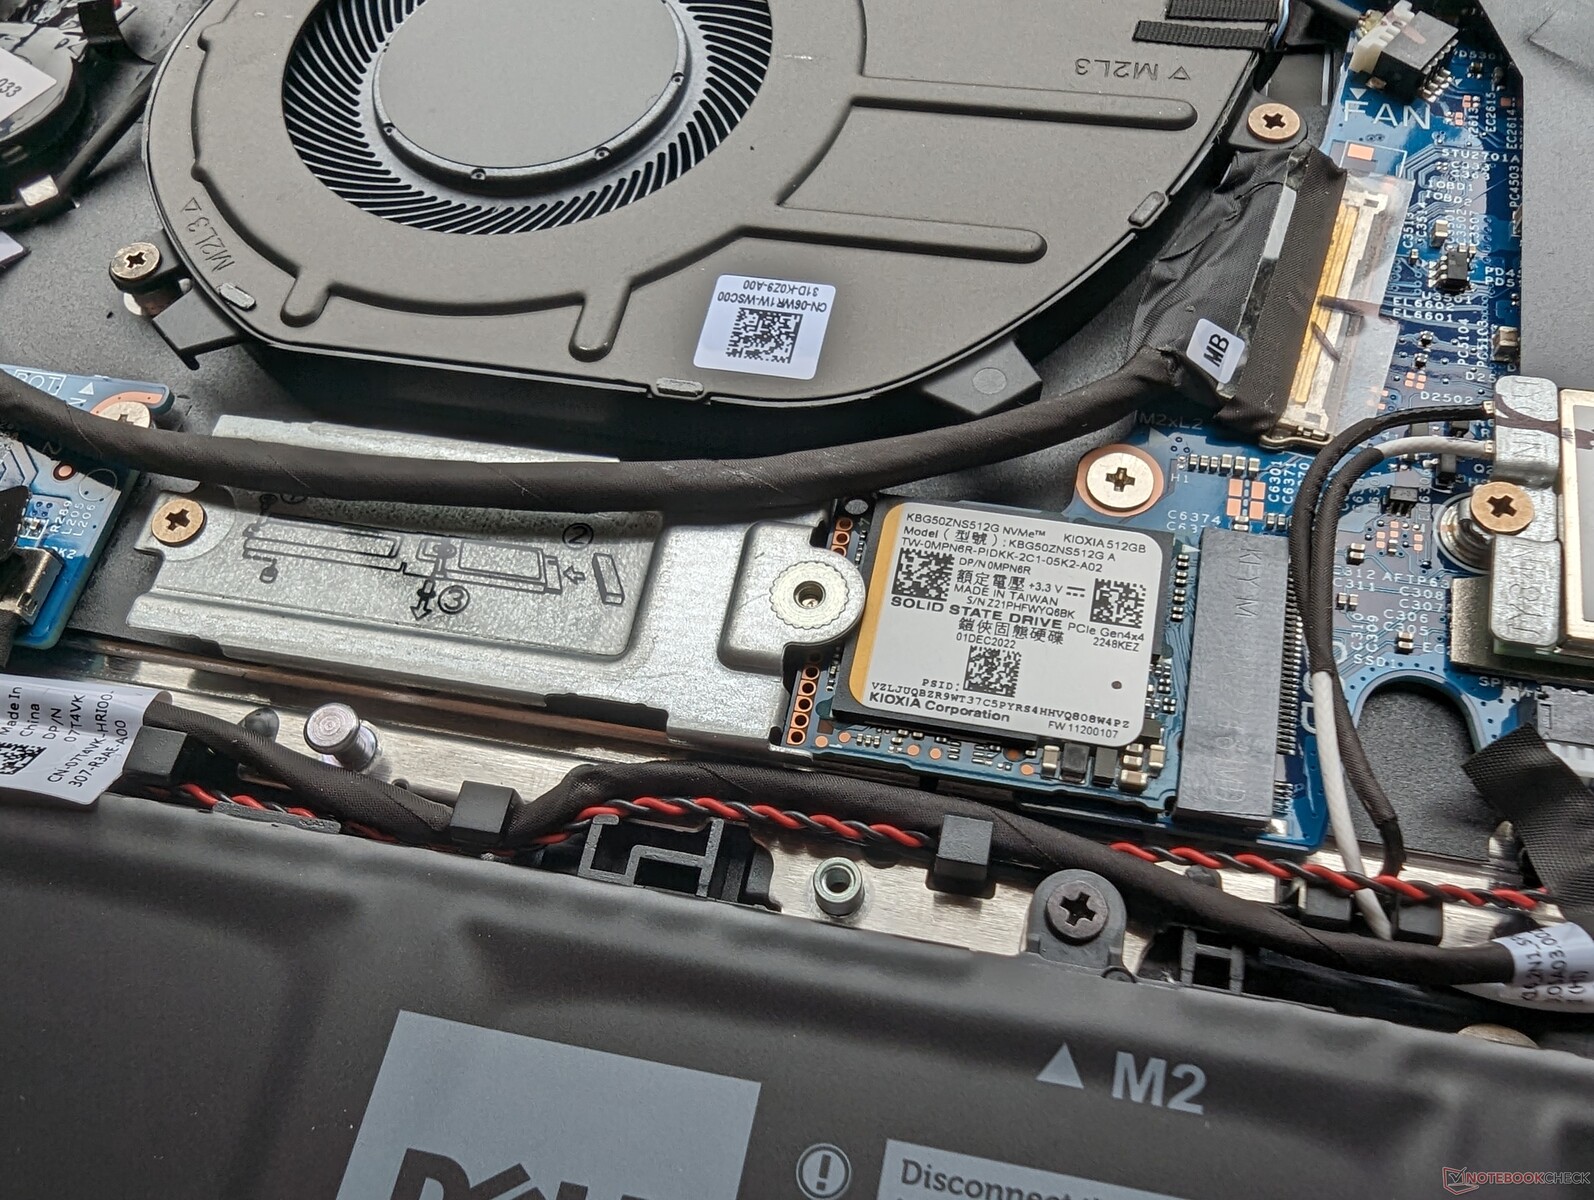
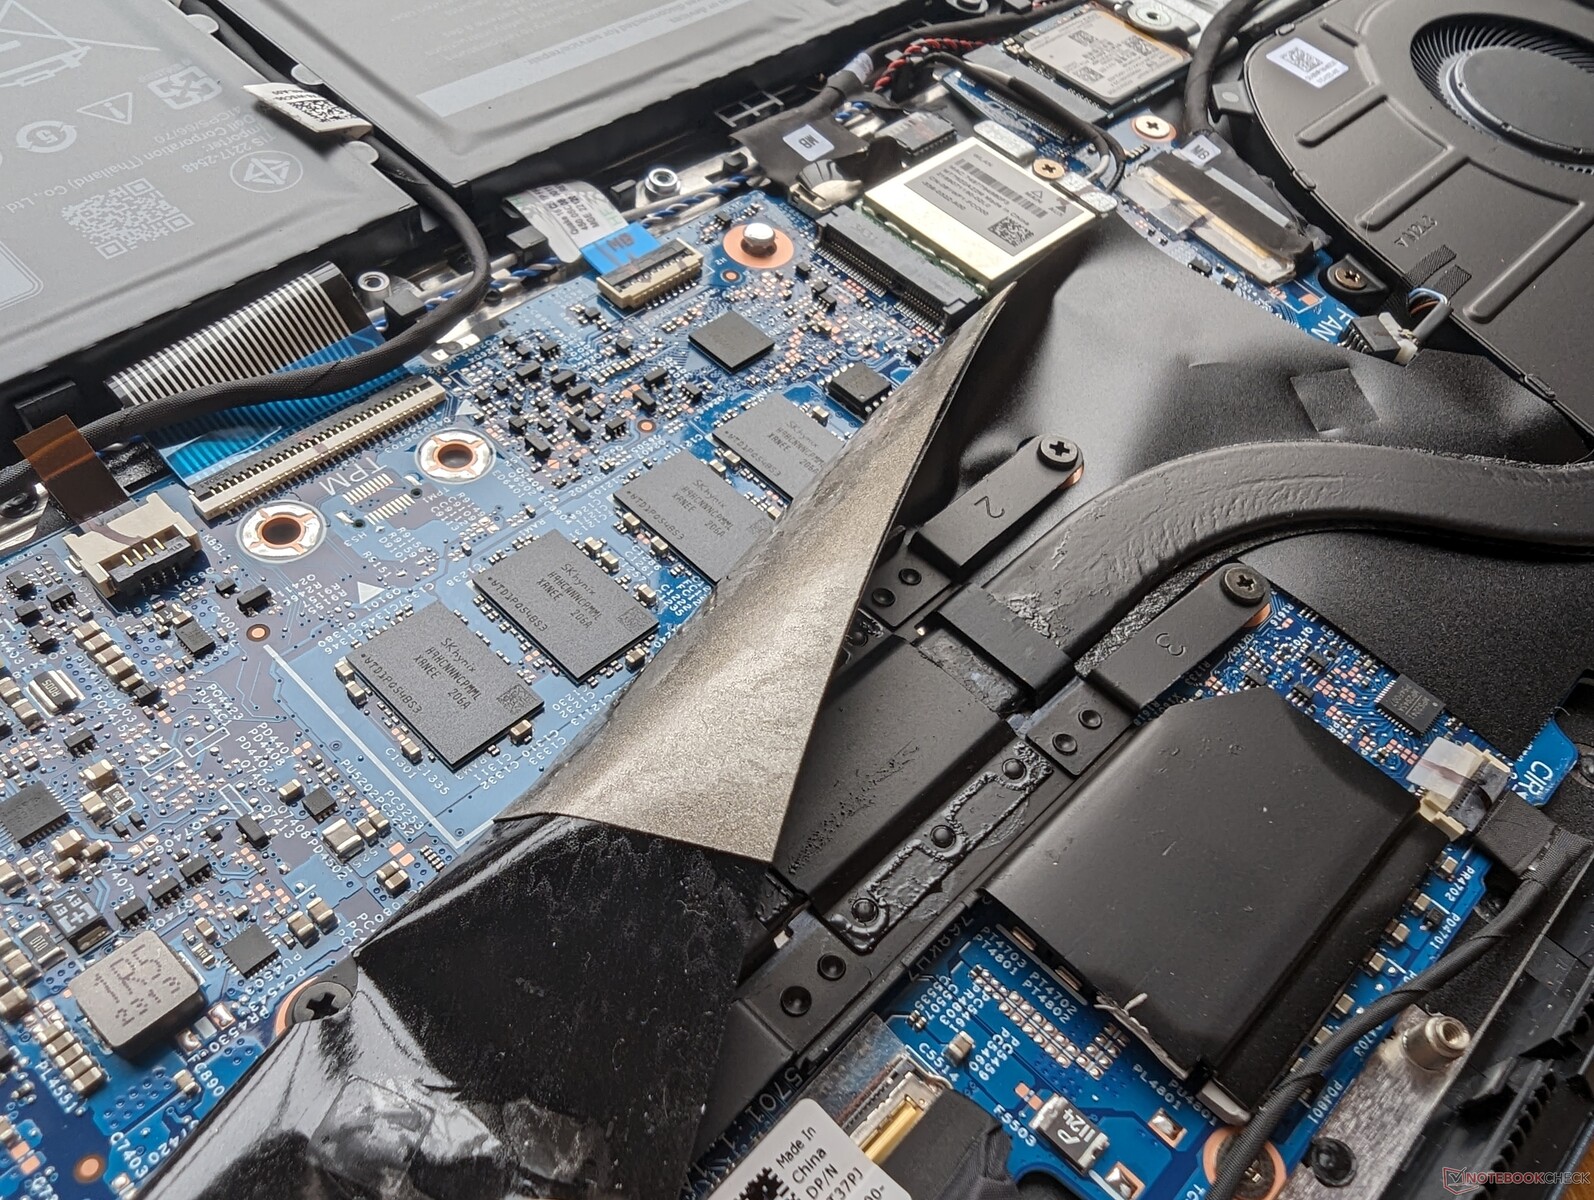
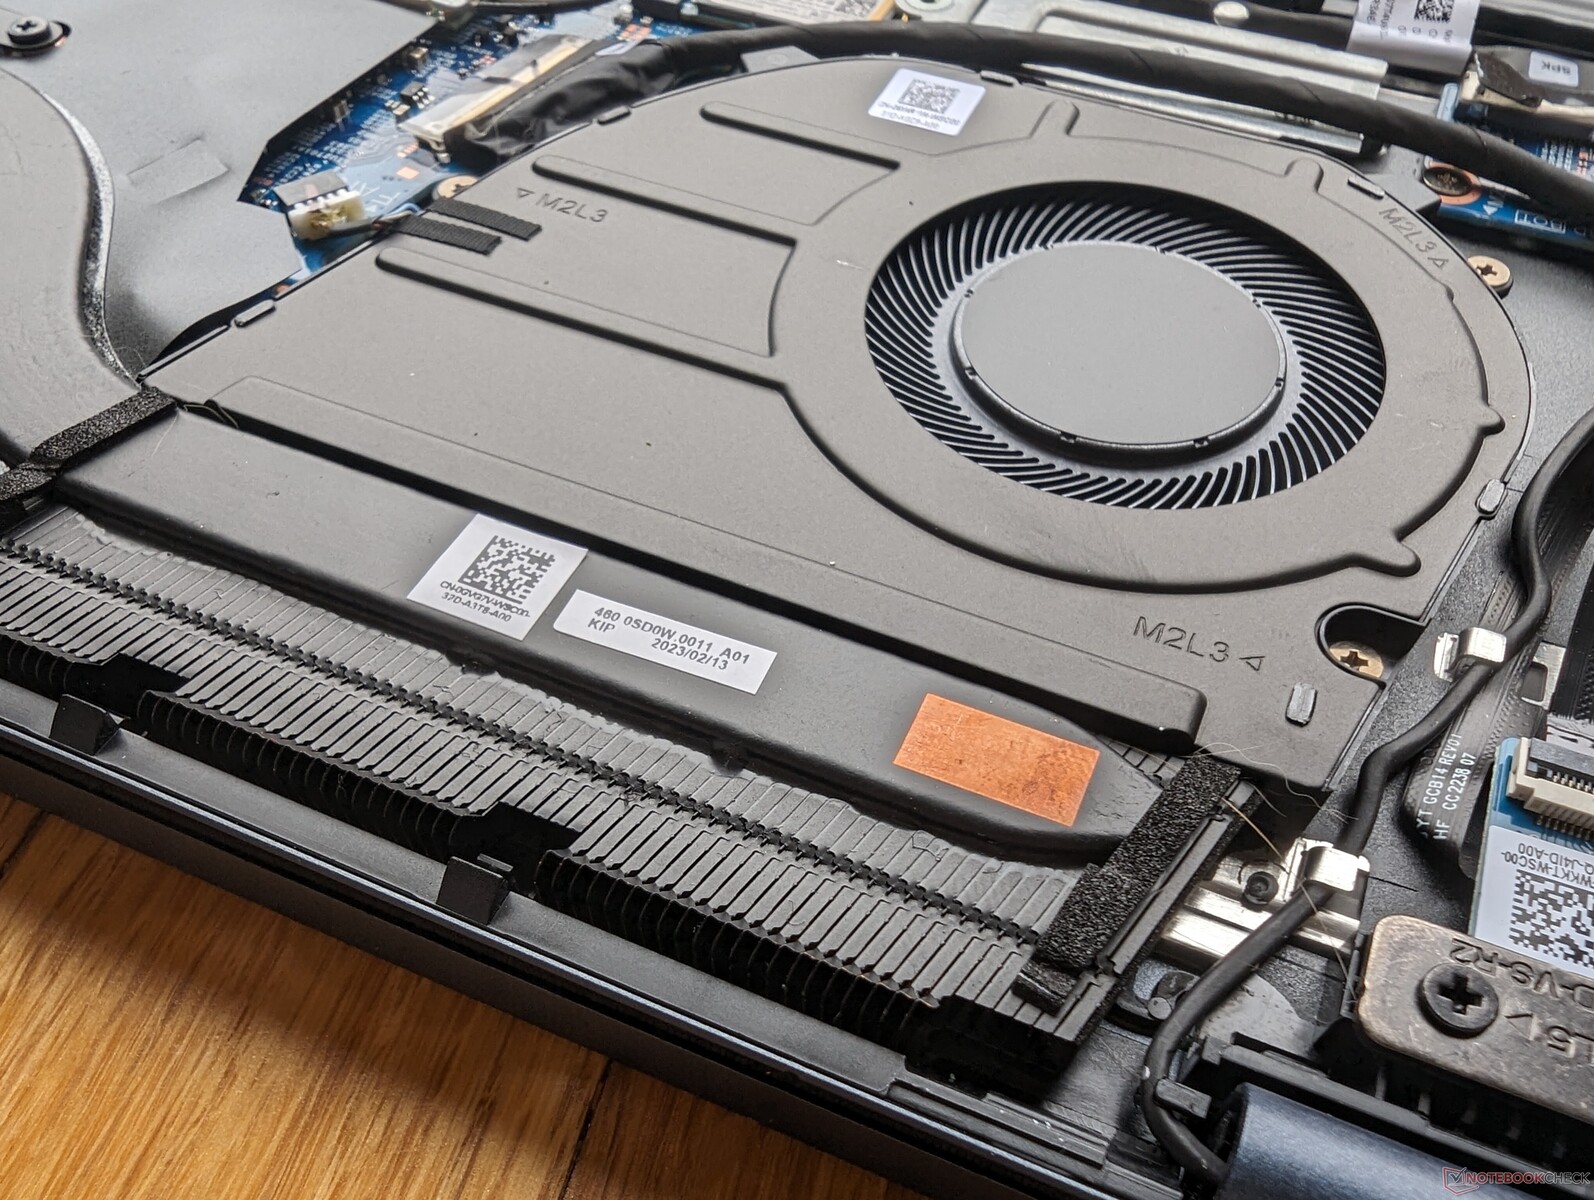
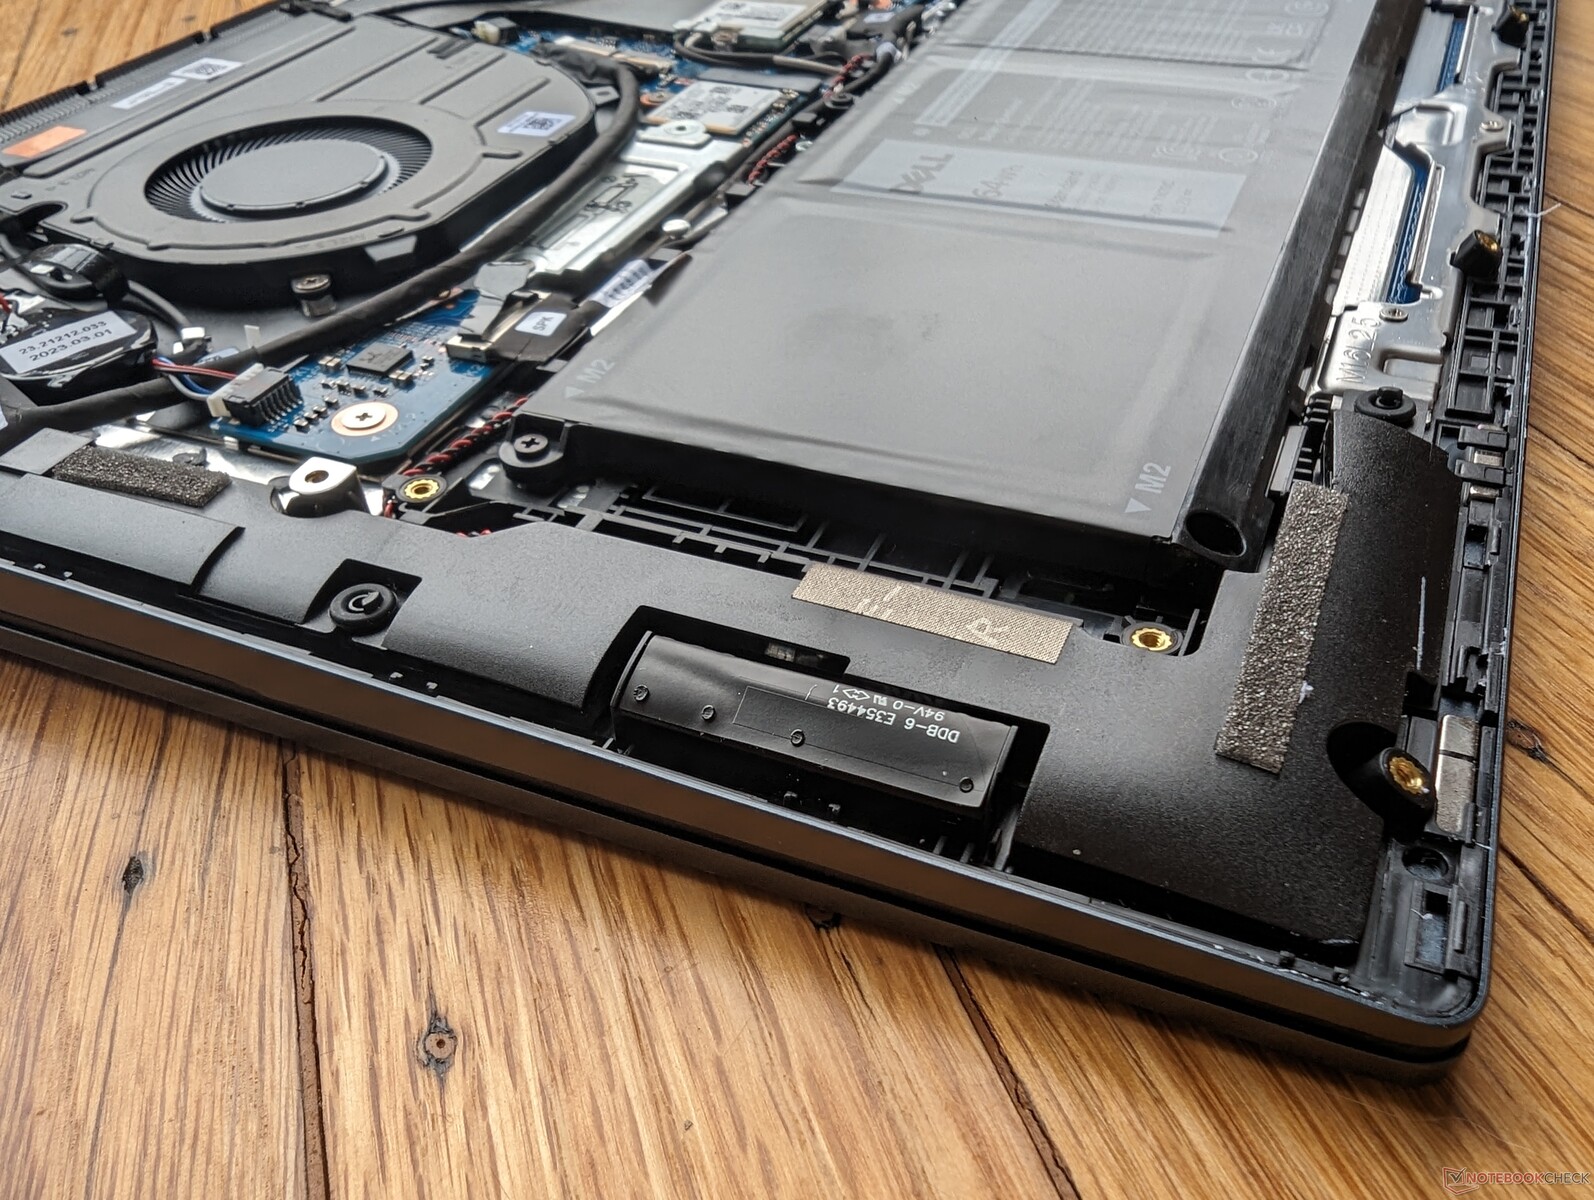
Maintenance
Le panneau inférieur est fixé par neuf vis Phillips. Nous recommandons donc d'utiliser un bord en plastique tranchant pour ouvrir le panneau avec précaution en commençant par l'arrière.
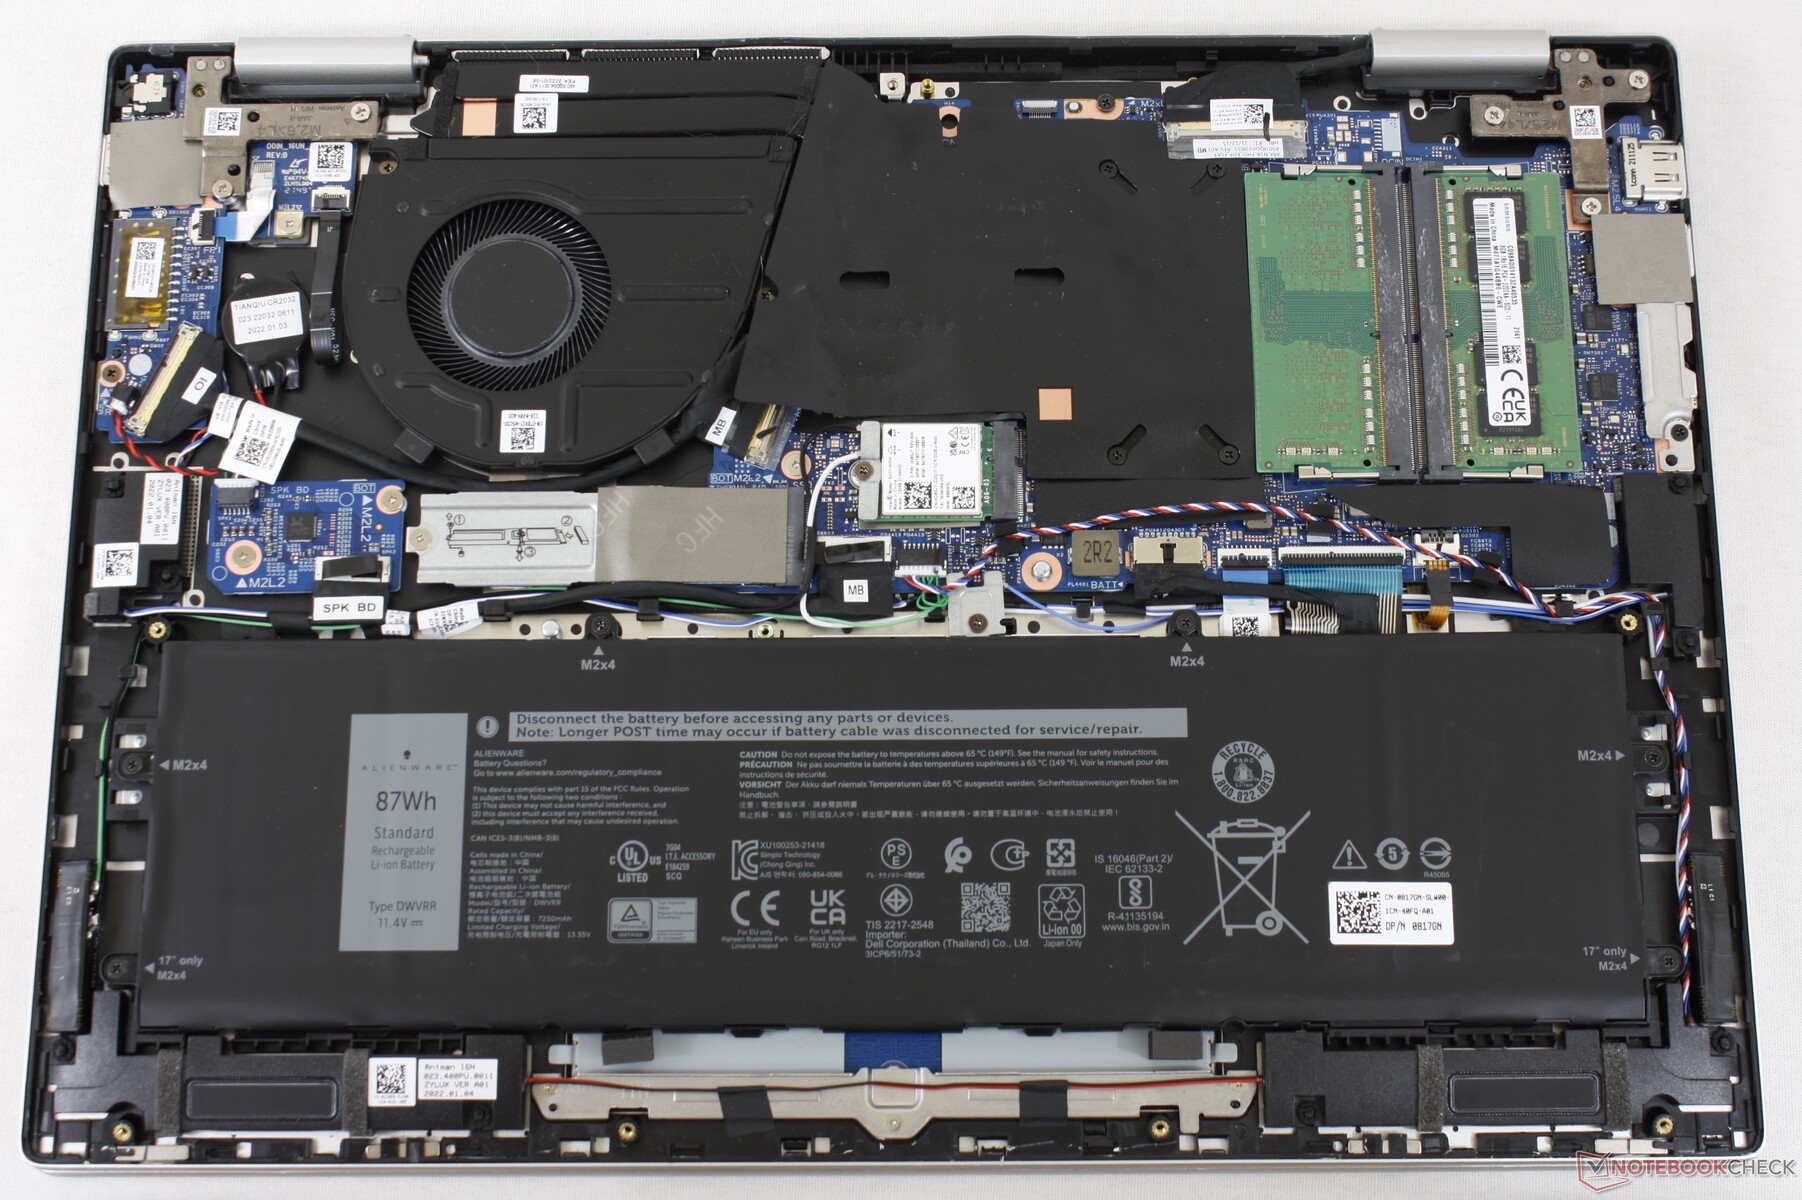
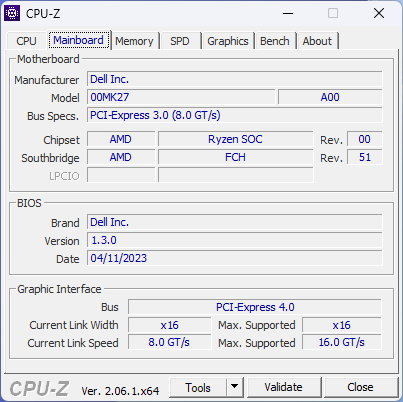
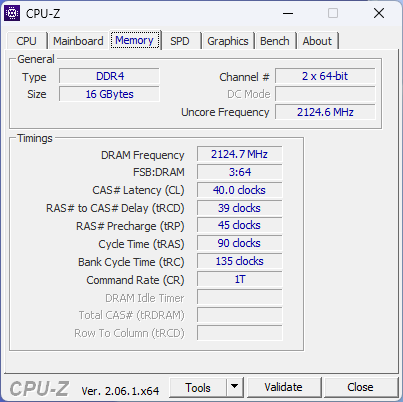
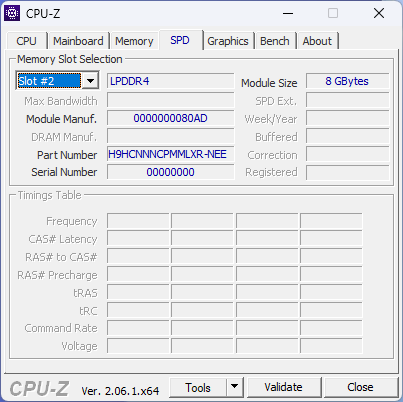
La RAM est désormais soudée sur le modèle 2023 alors qu'elle pouvait être mise à niveau par l'utilisateur sur la version 2022, comme le montrent les images ci-dessous.
Accessoires et garantie
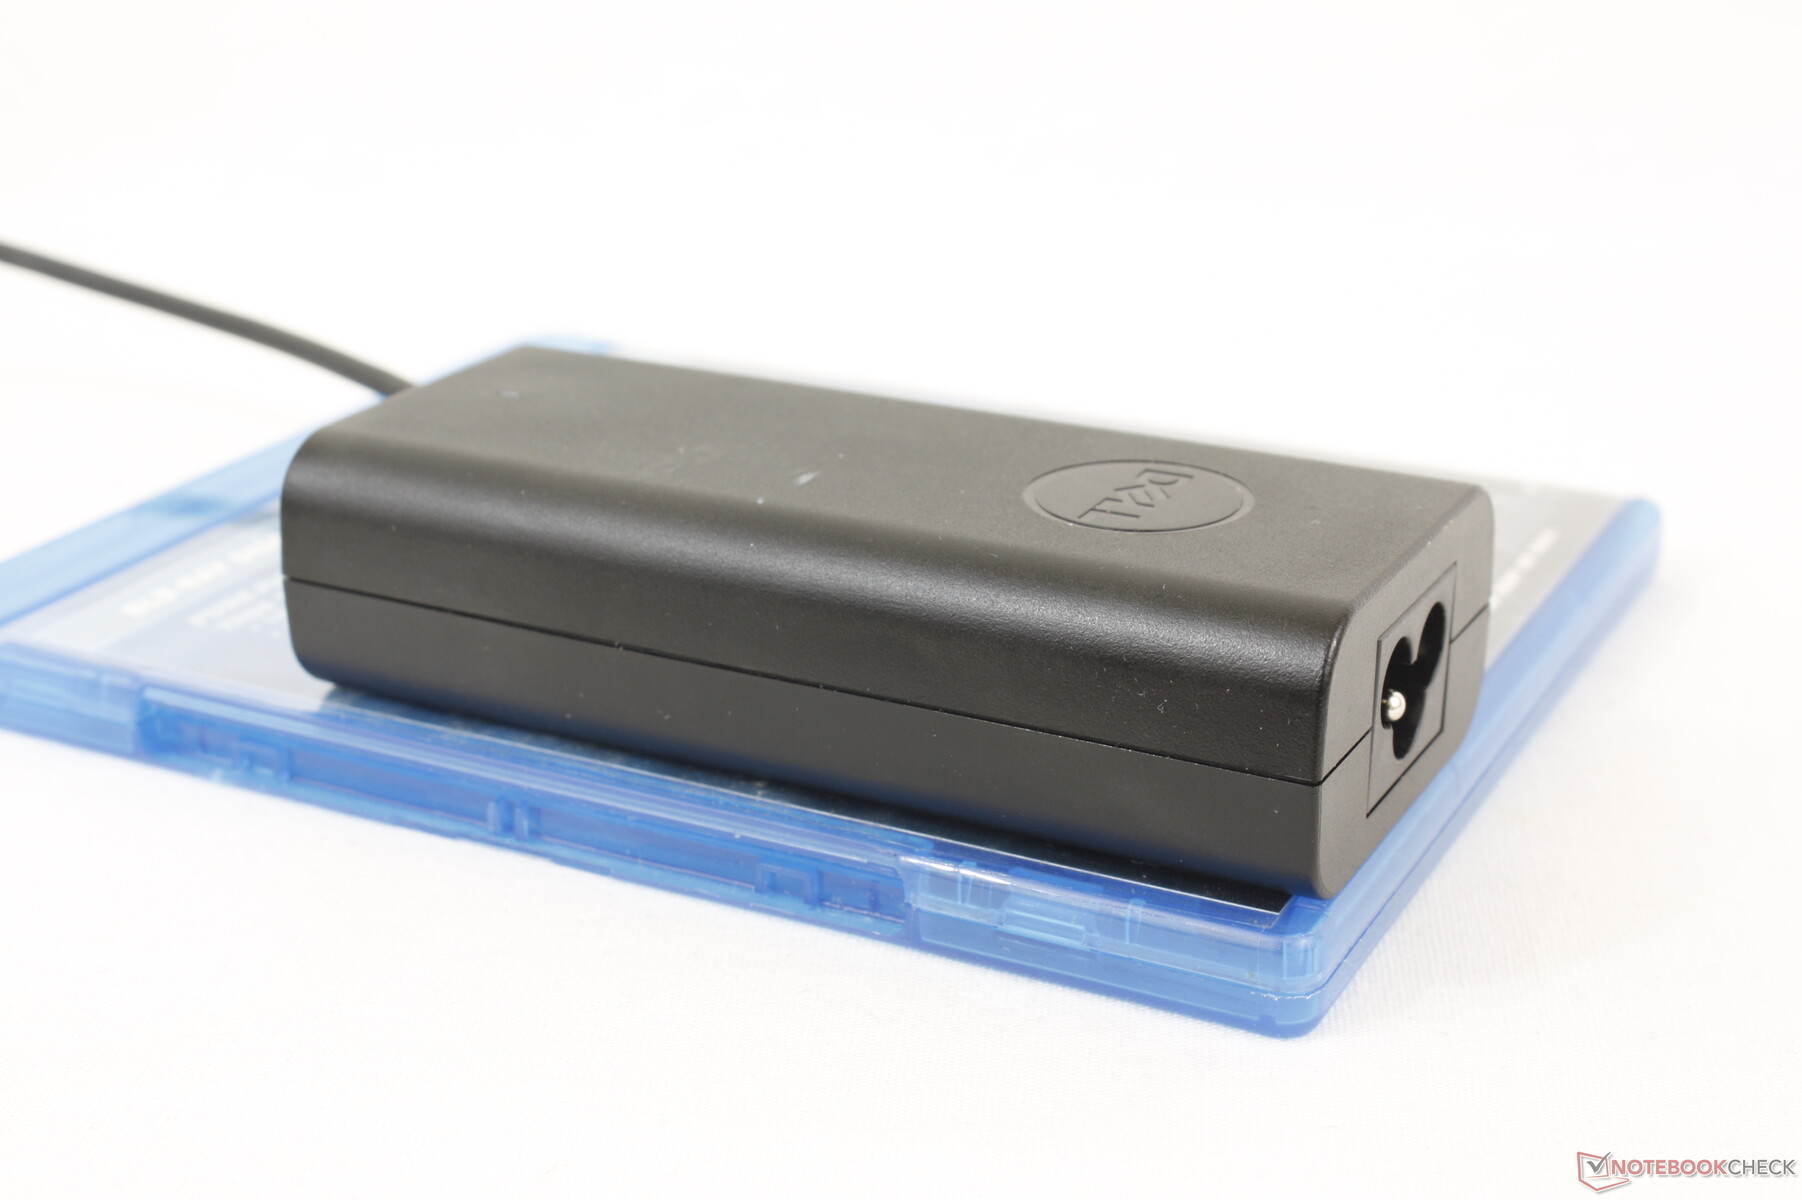
La boîte ne contient pas d'autres éléments que l'adaptateur secteur et la documentation. La garantie limitée habituelle d'un an du fabricant s'applique si l'appareil est acheté aux États-Unis.
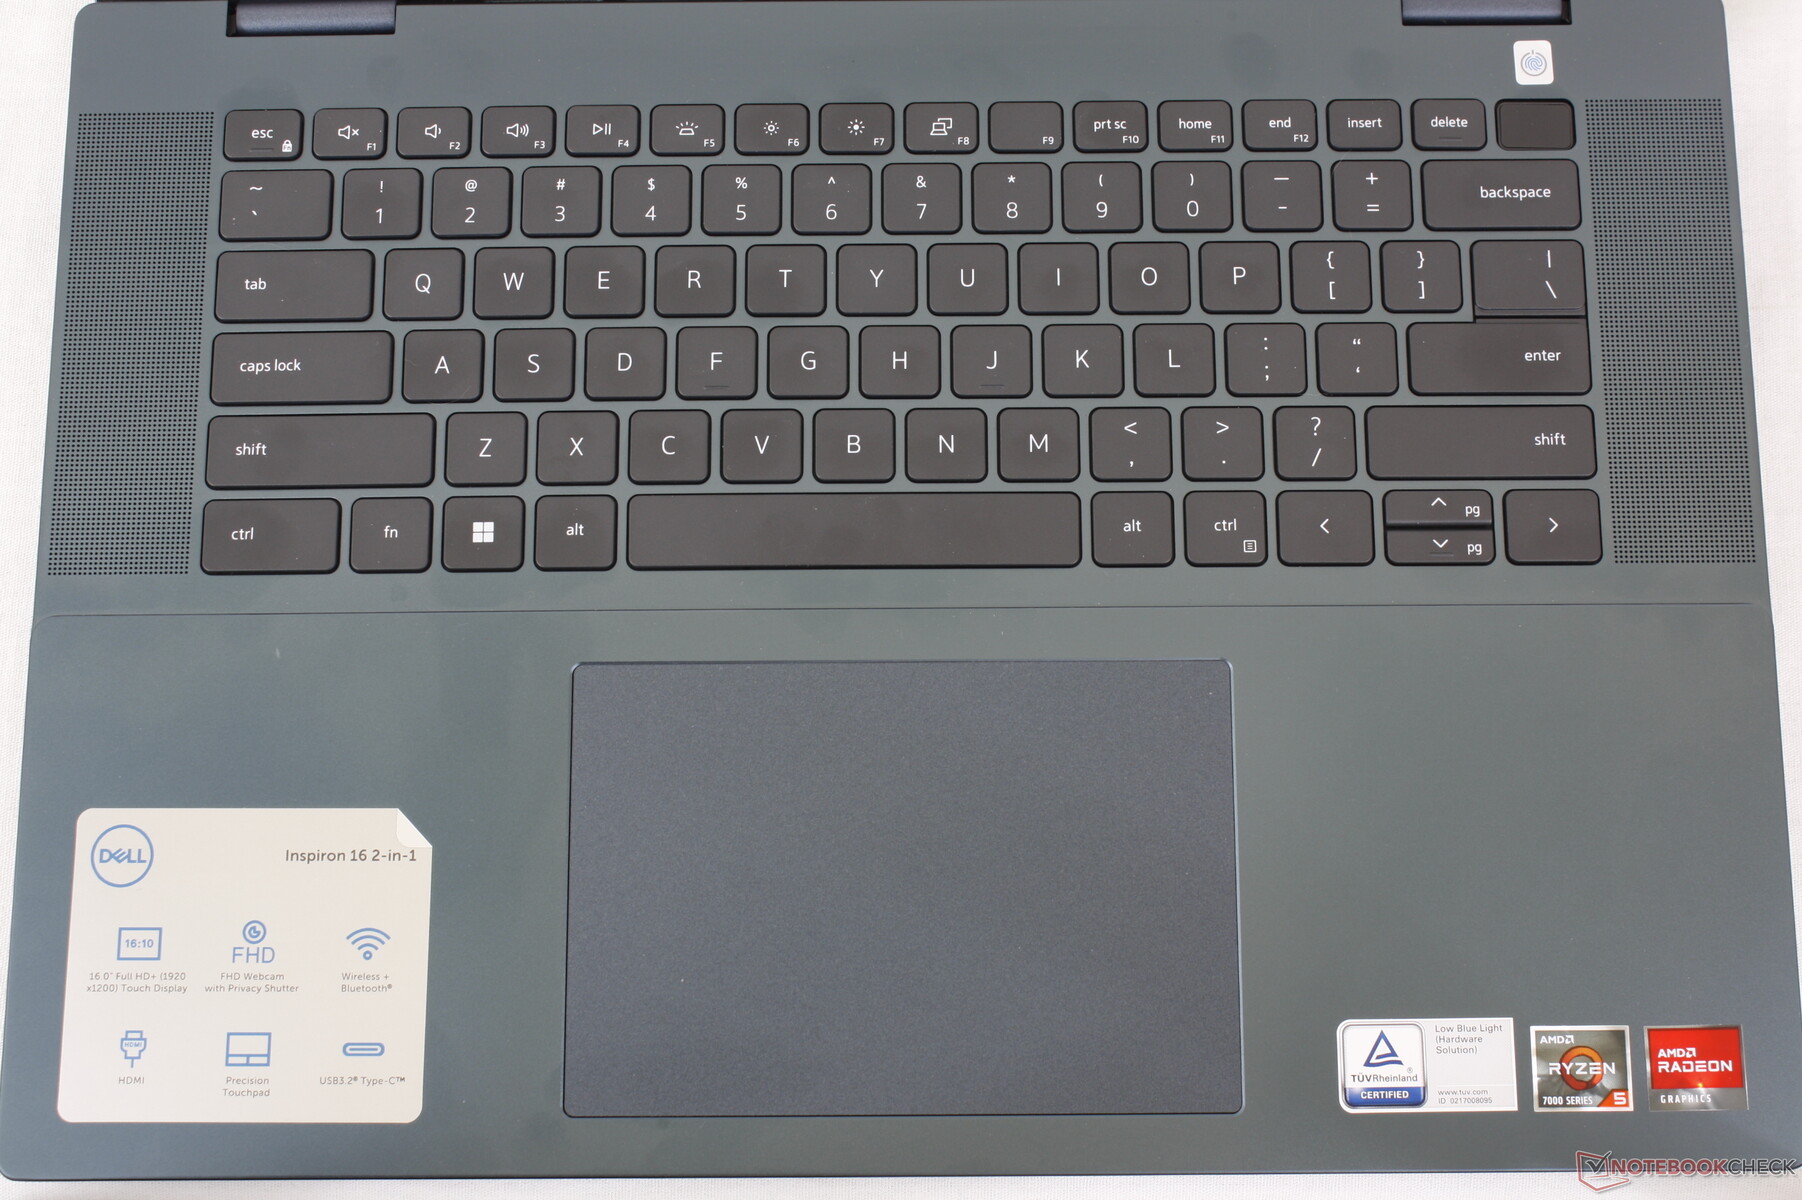
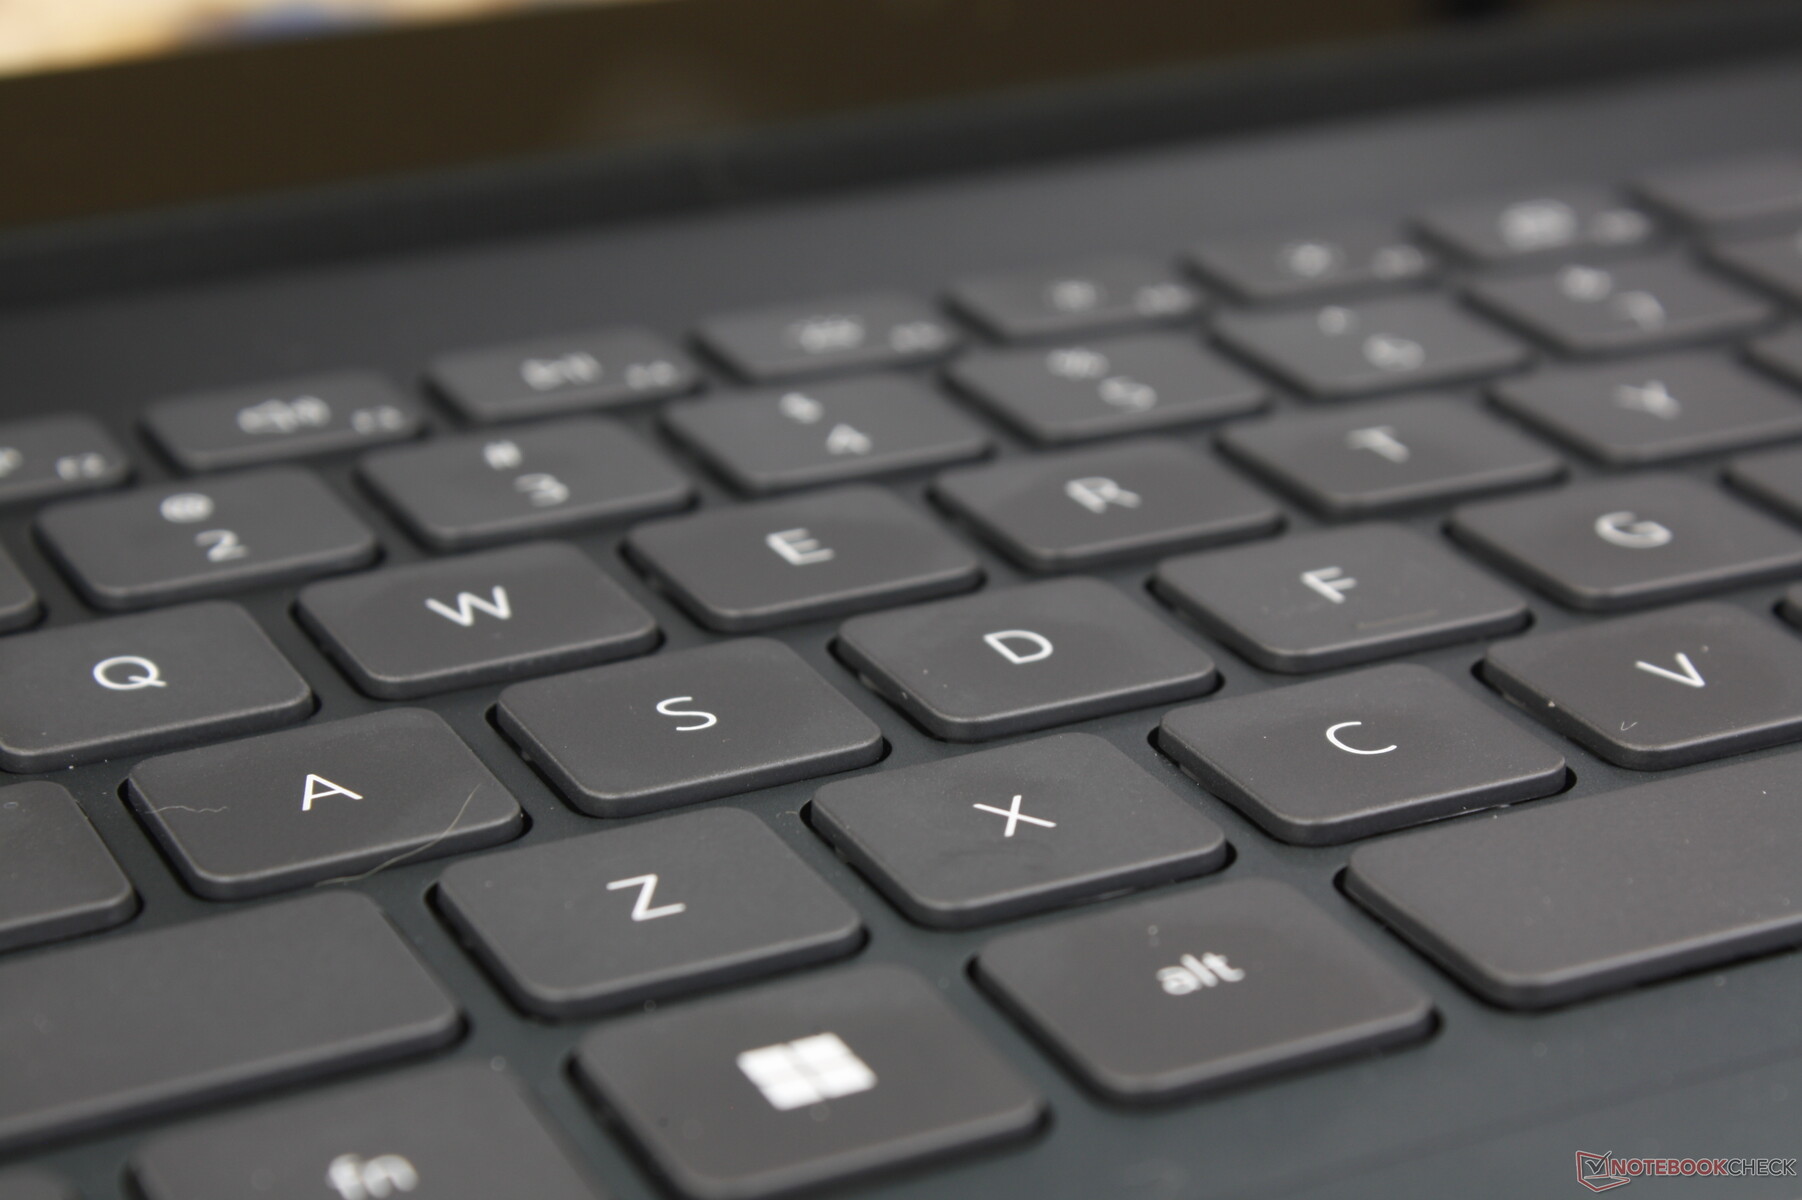
Dispositifs d'entrée
Clavier
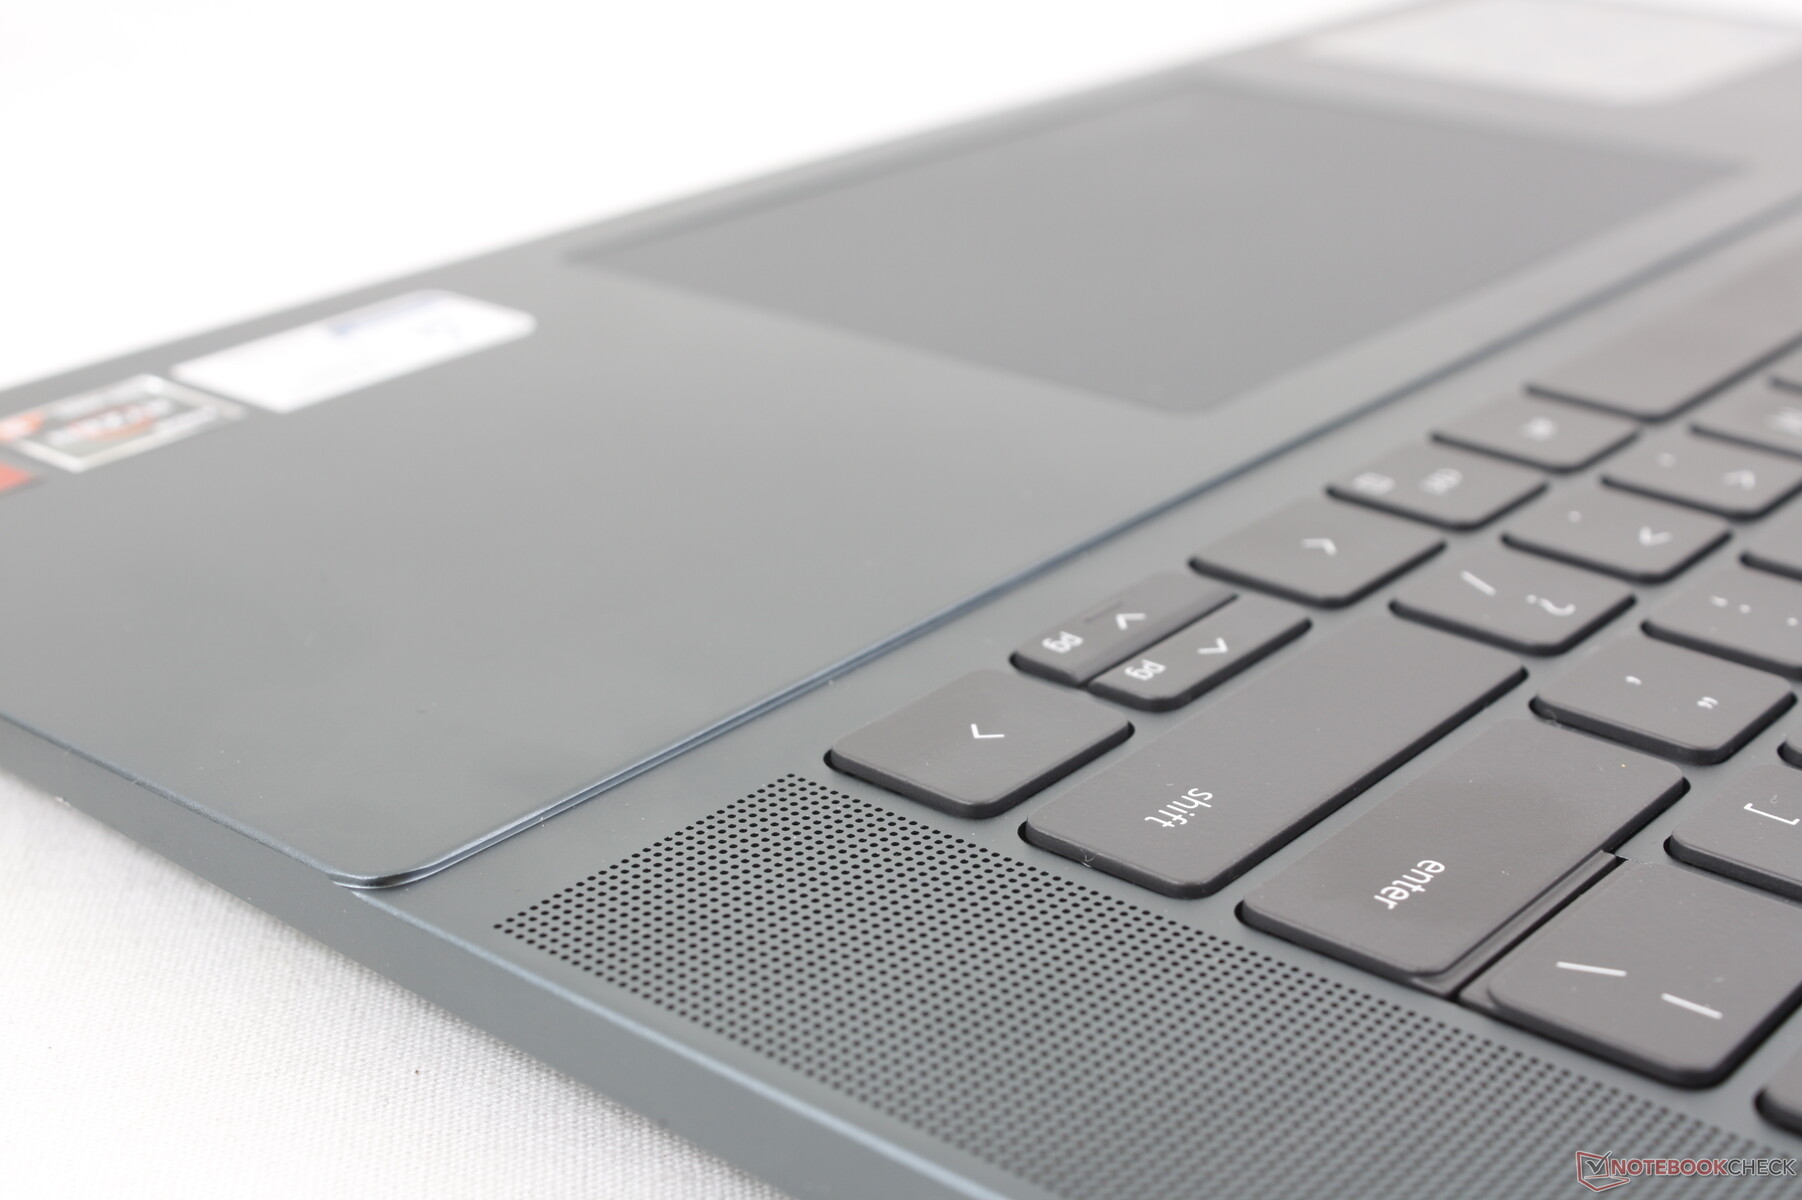
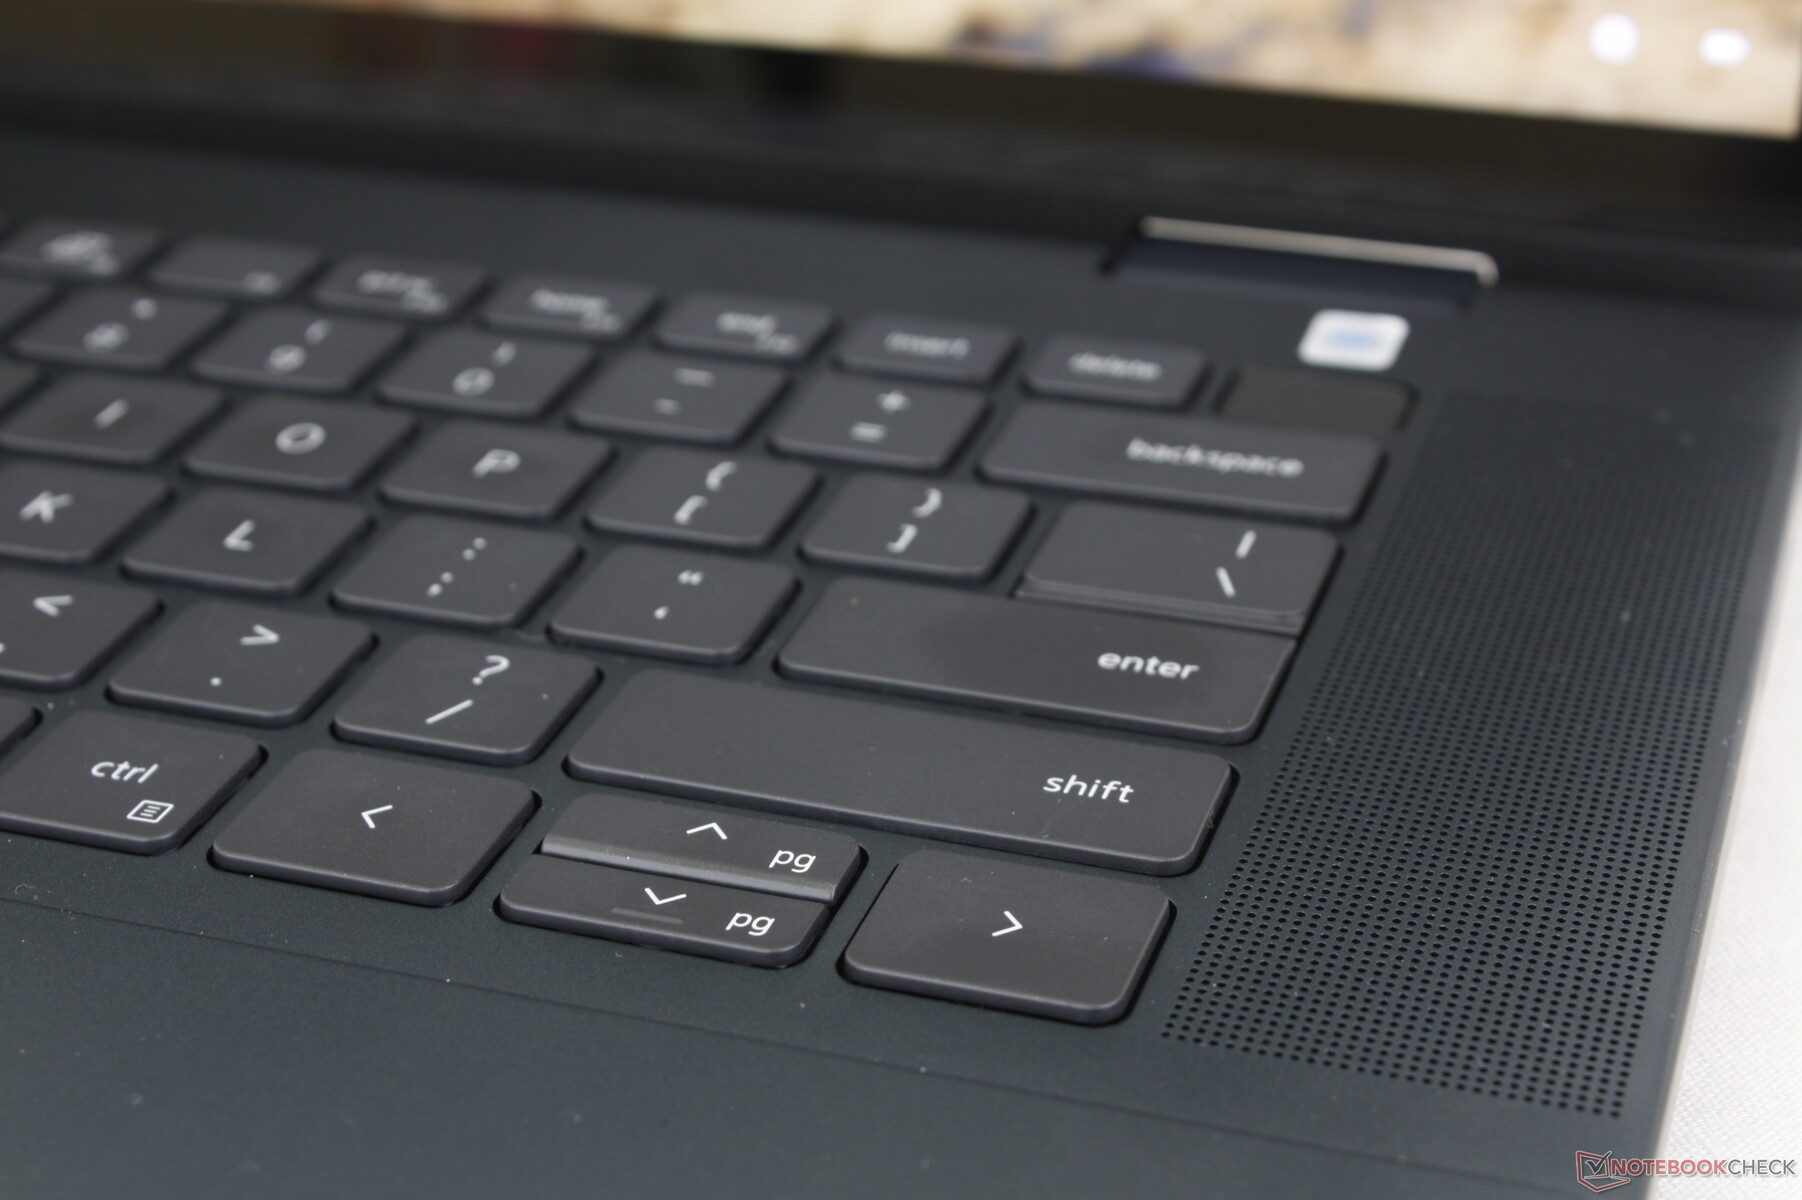
L'expérience de frappe est assez homogène sur les portables Inspiron et les touches QWERTY restent relativement souples et avec une faible course. Même l Inspiron 14 utilise le même clavier que l'Inspiron 16, la seule différence étant que l'Inspiron 16 intègre des haut-parleurs supplémentaires sur les côtés du clavier. L'ajout de haut-parleurs au lieu d'un pavé numérique confirme que l'Inspiron 16 7635 2-en-1 est avant tout un PC multimédia.
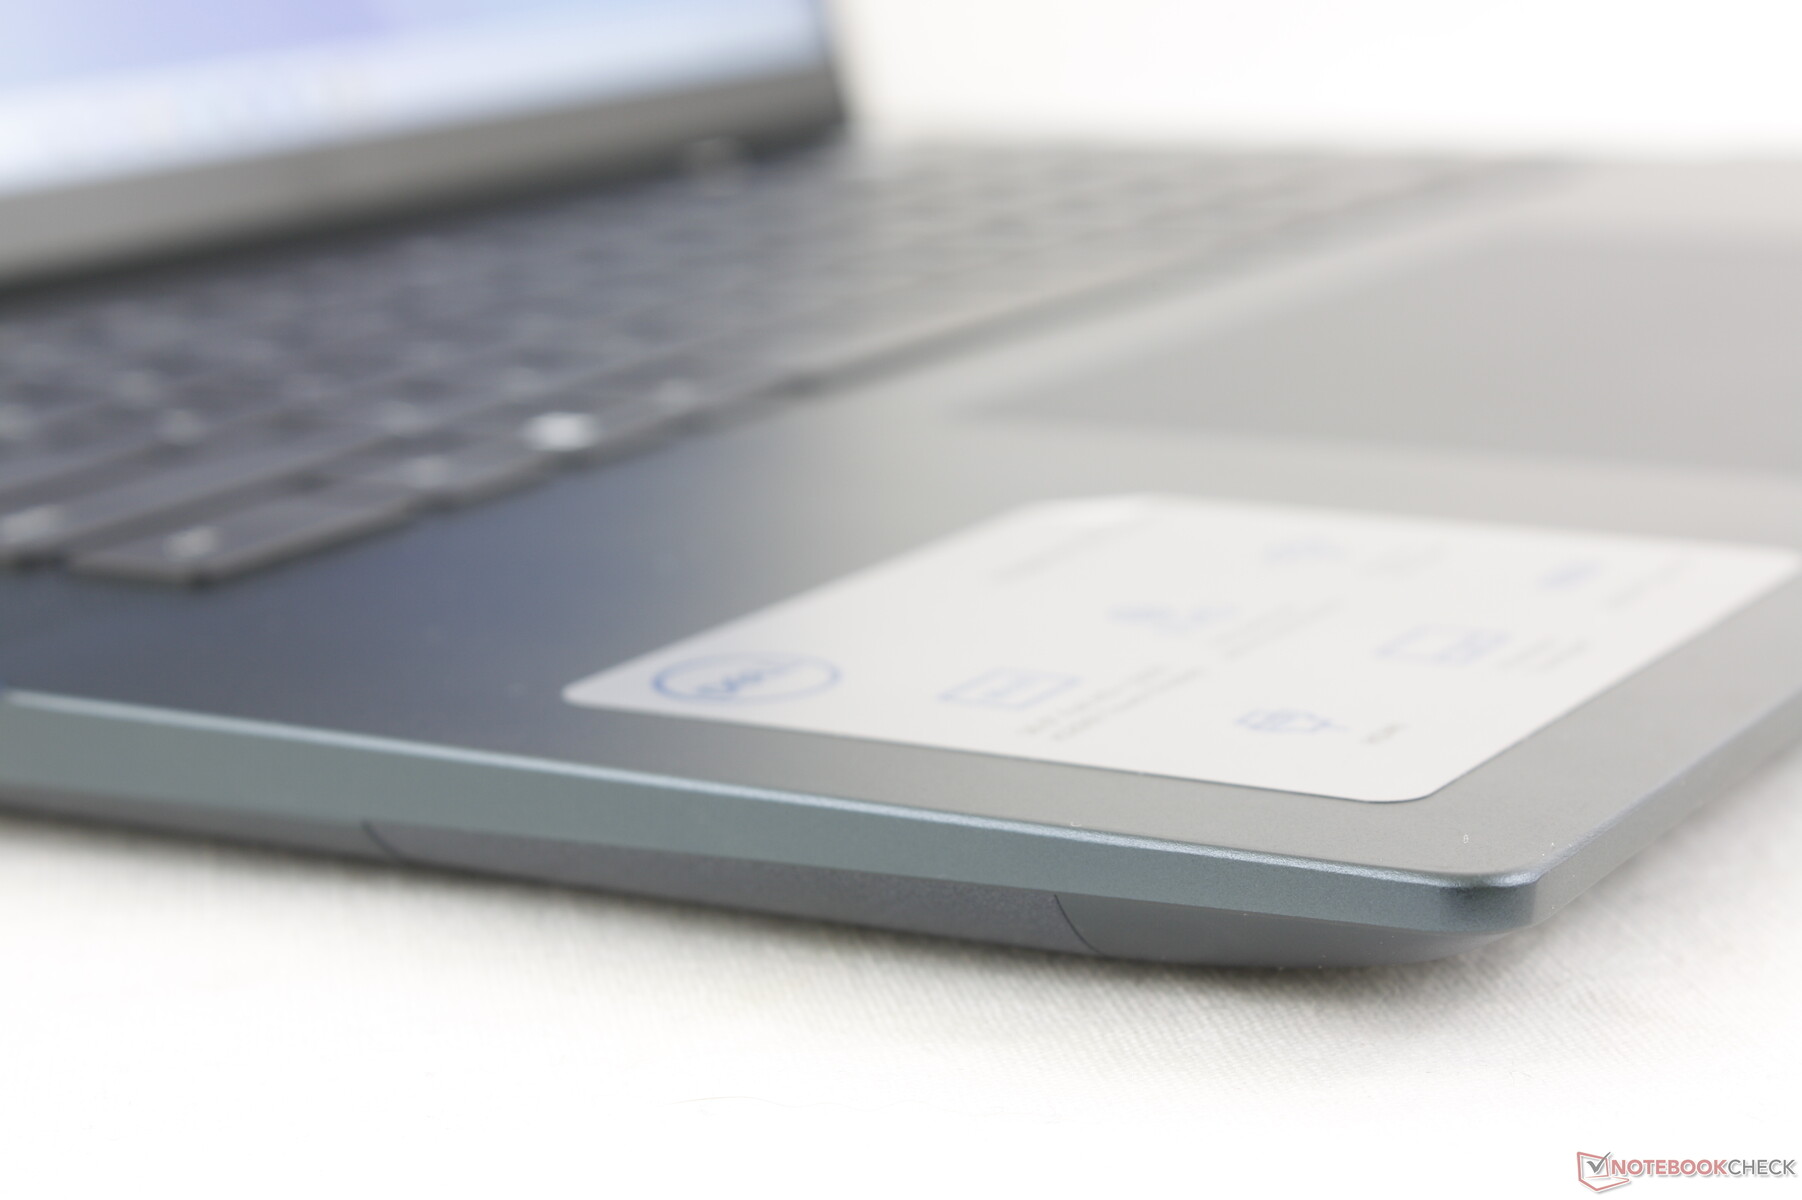
Pavé tactile
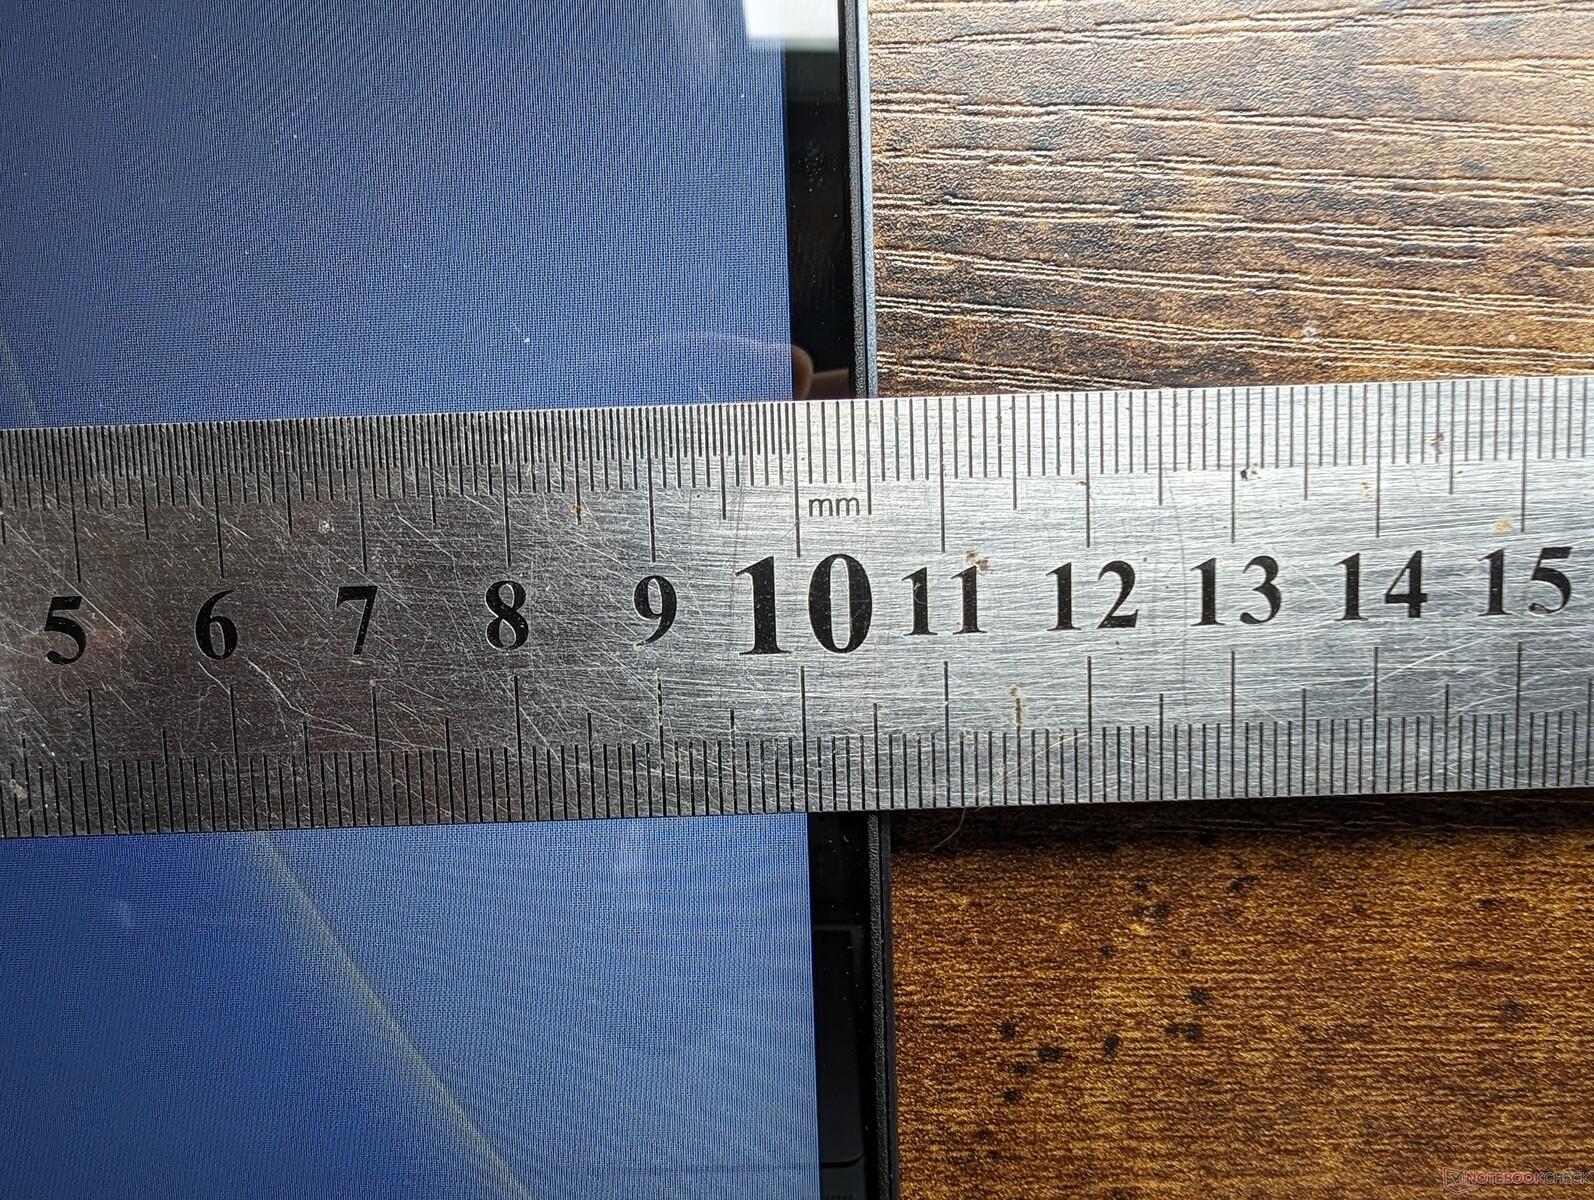
La taille du clavier (13,3 x 9 cm) n'a pas changé par rapport au modèle de l'année dernière, même si la conception visuelle du clavier est revenue à une apparence plus traditionnelle. Malheureusement, le retour d'information lorsque l'on clique sur la surface n'a pas été amélioré et reste donc doux et peu profond par rapport au pavé tactile plus ferme du HP Spectre pavé tactile.
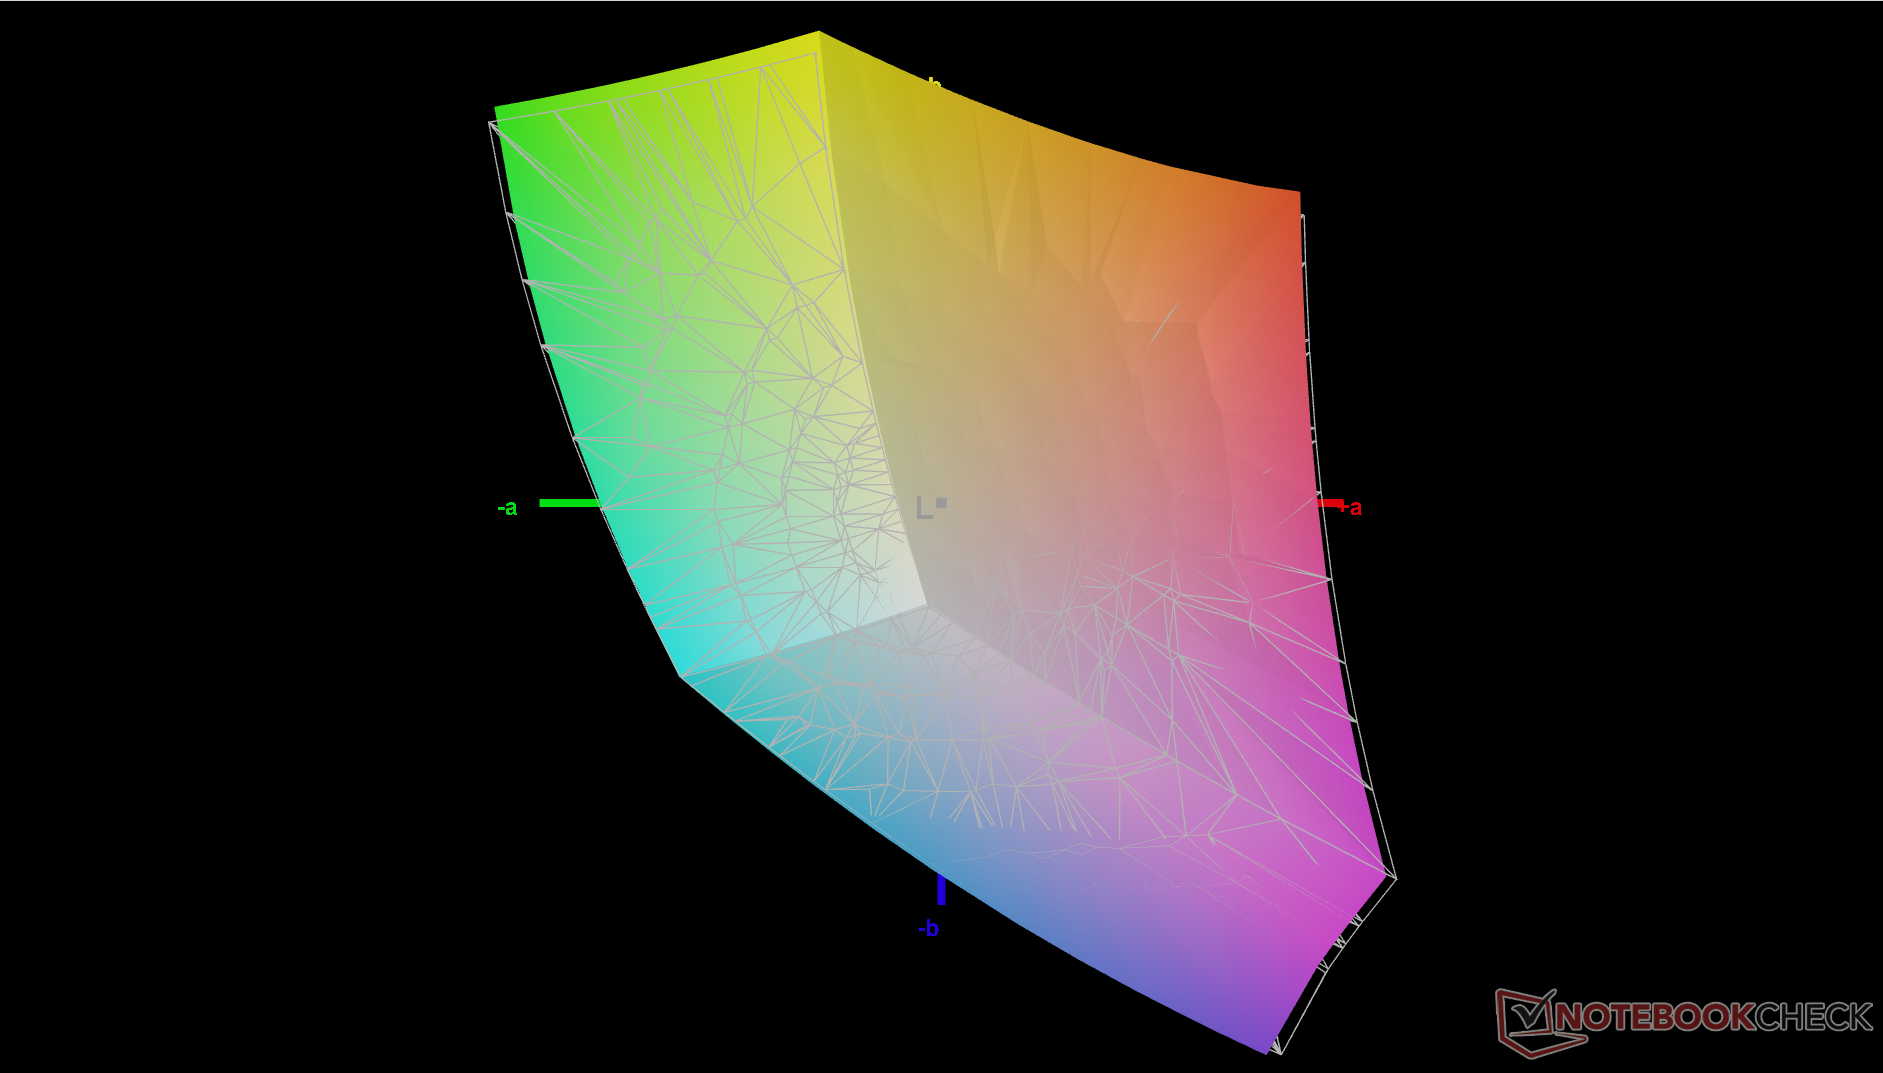
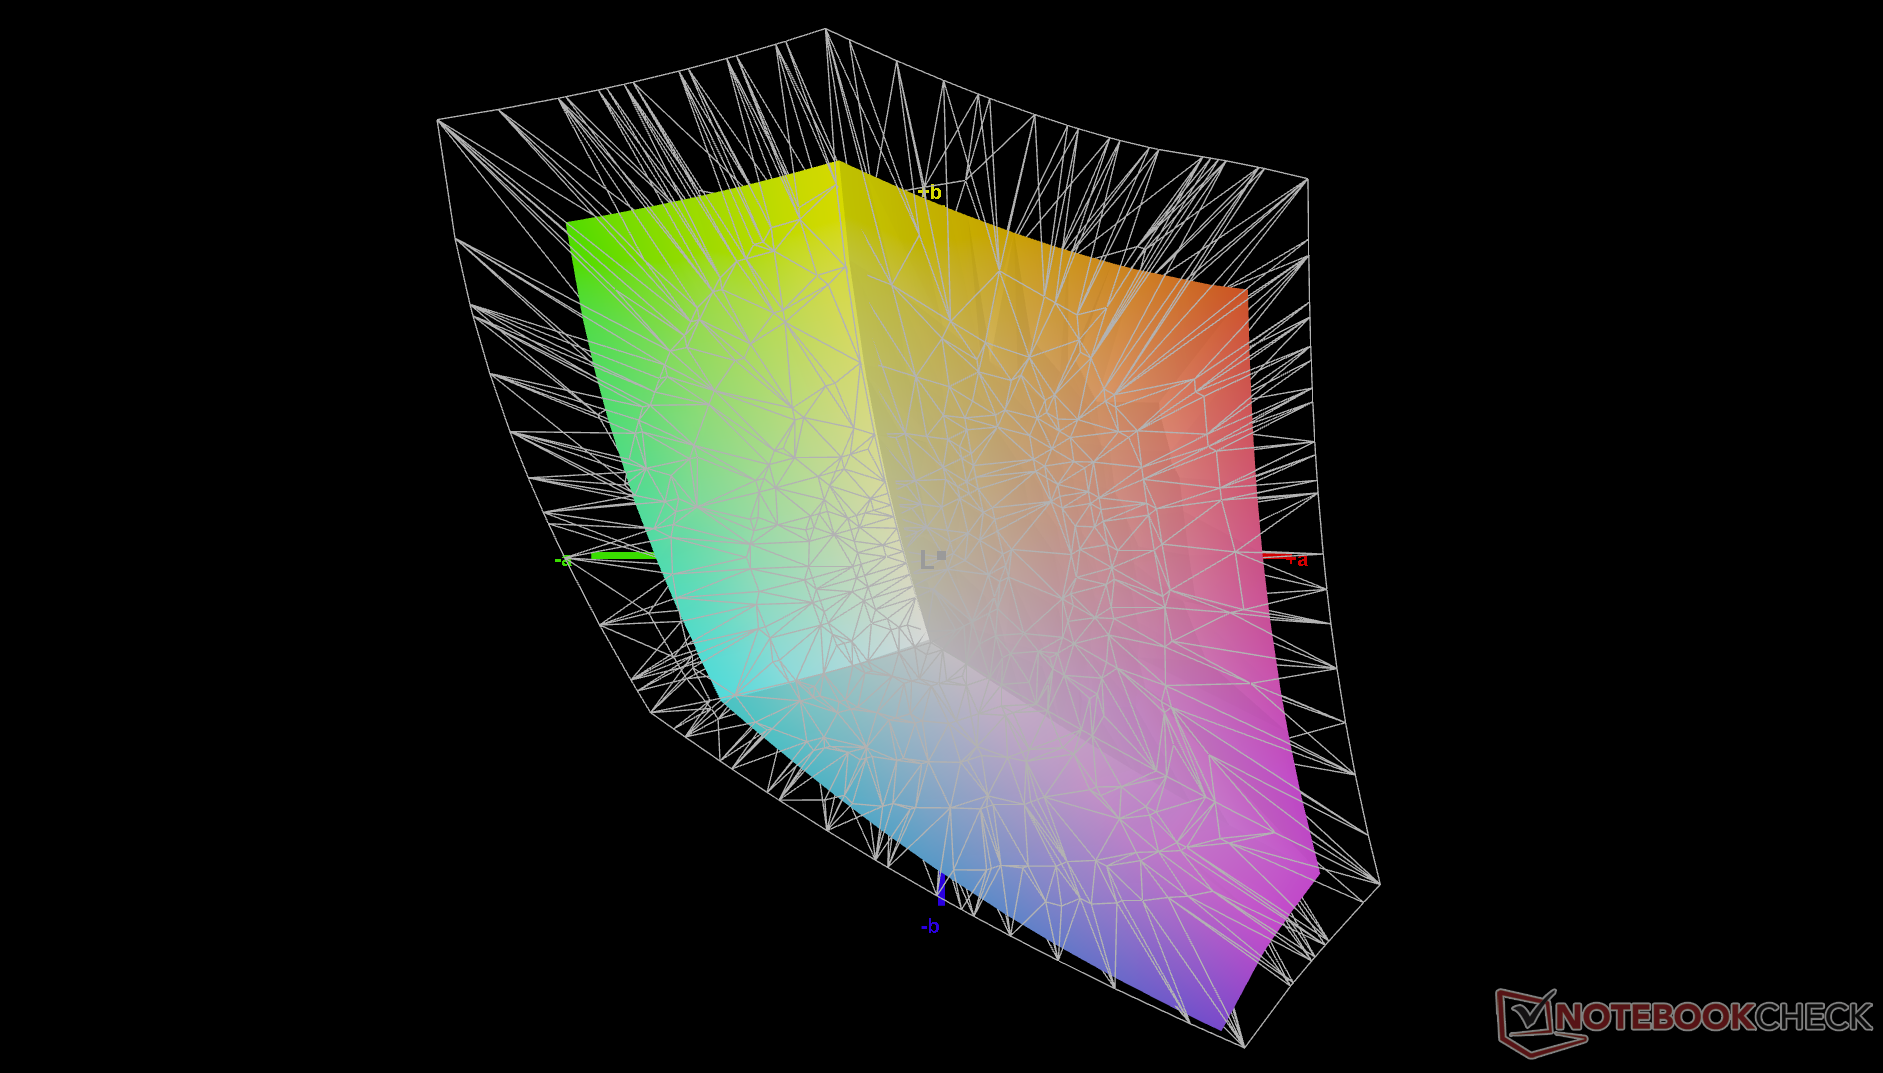
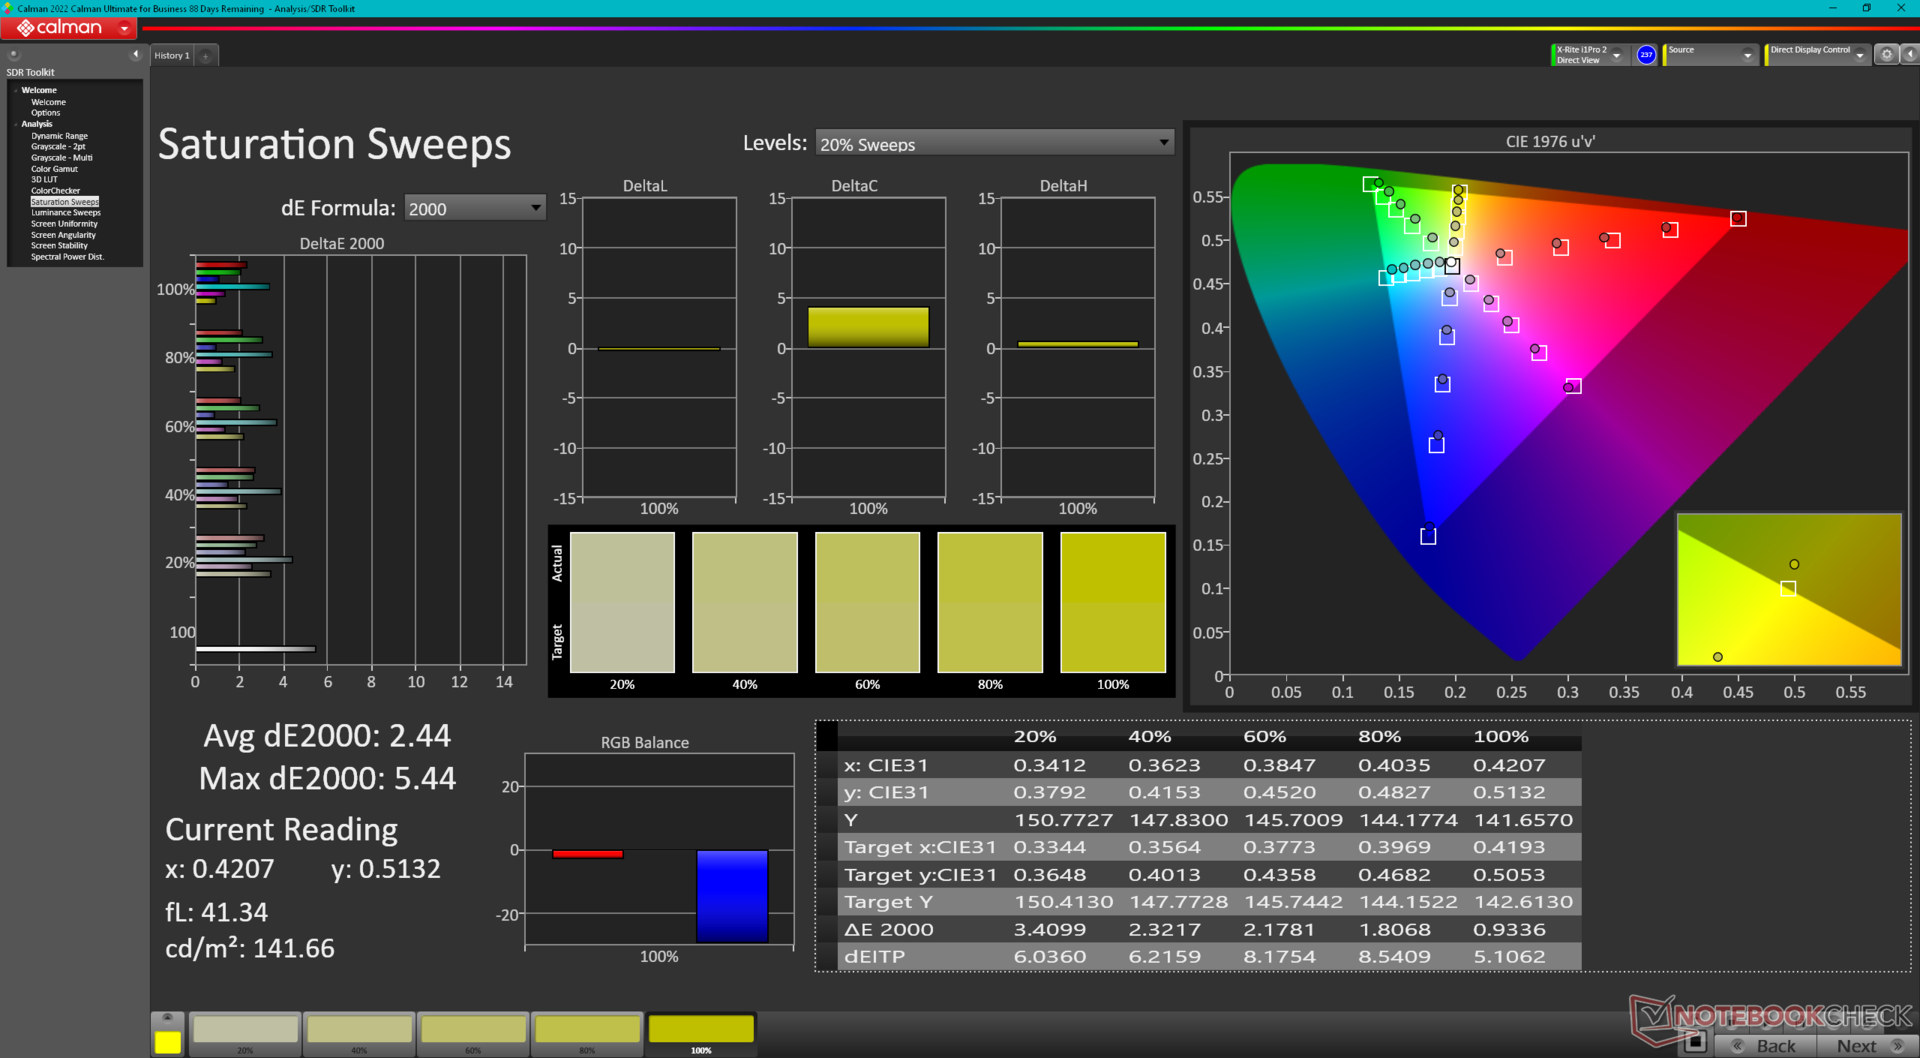
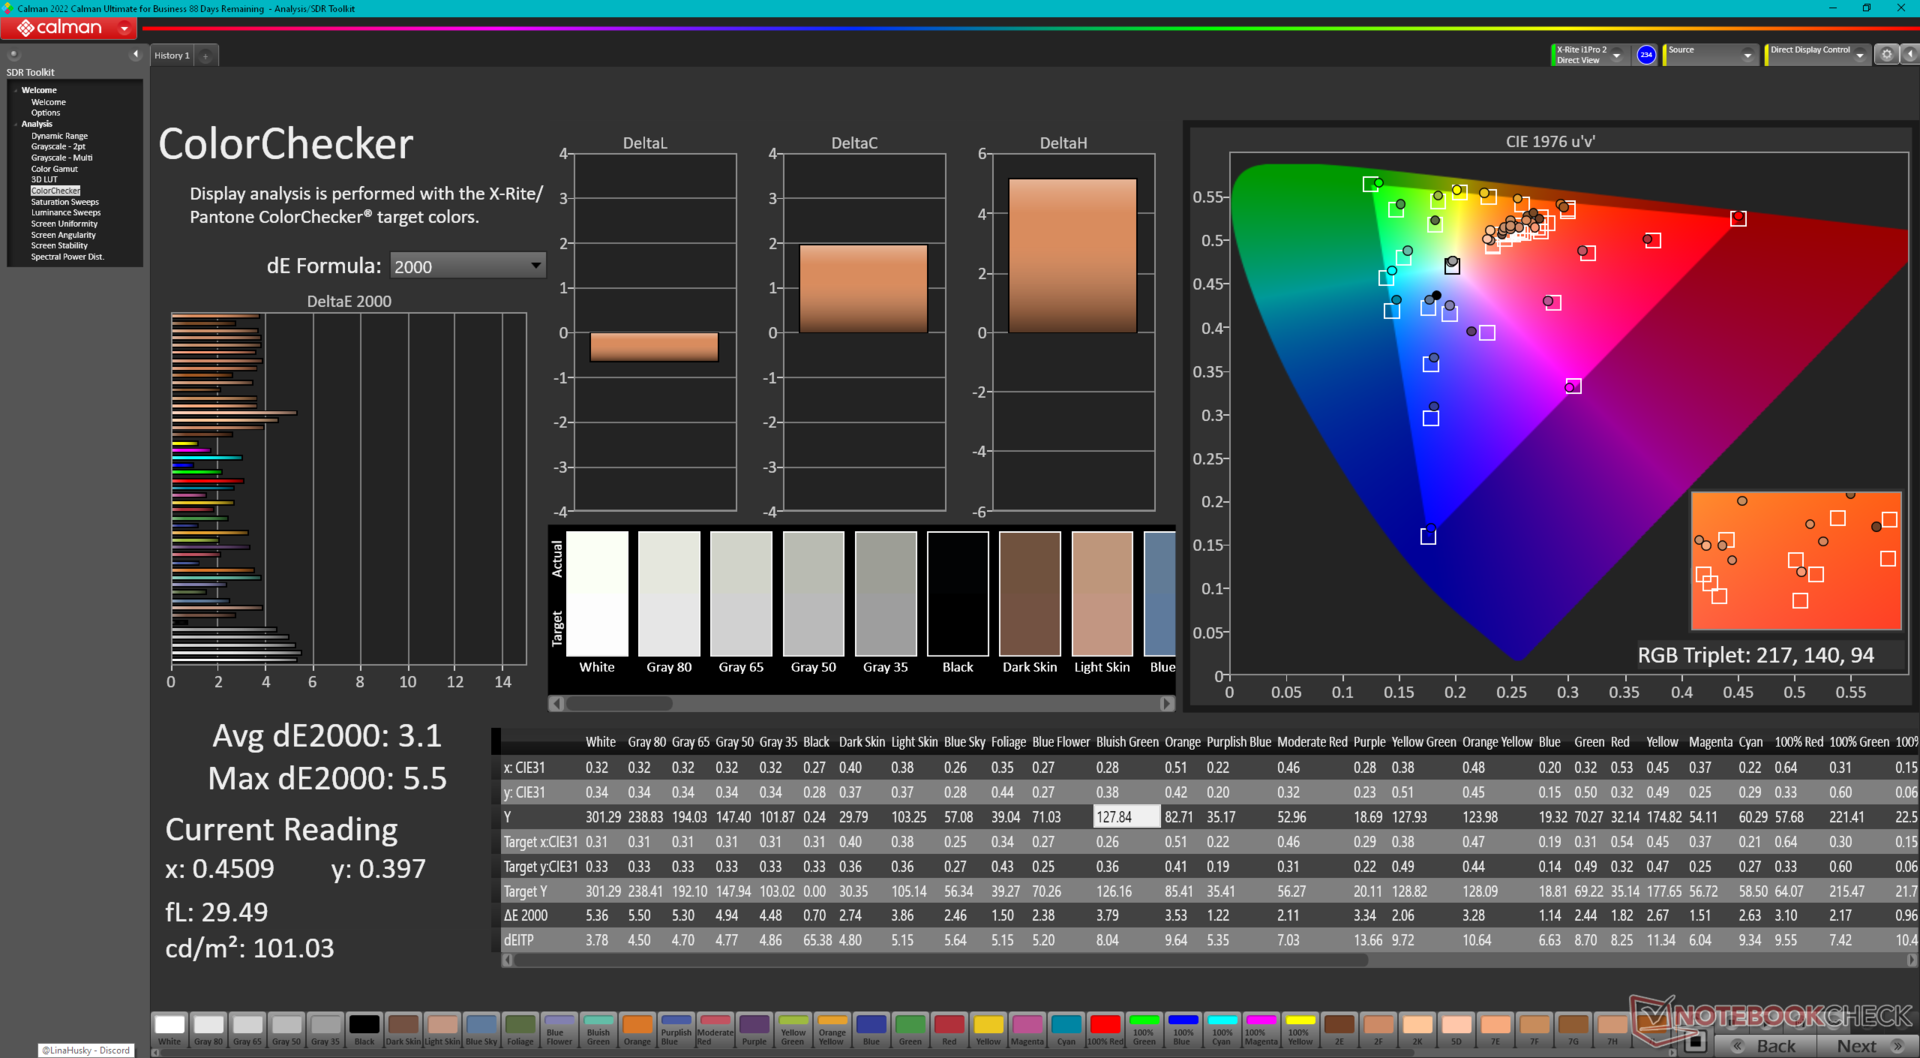
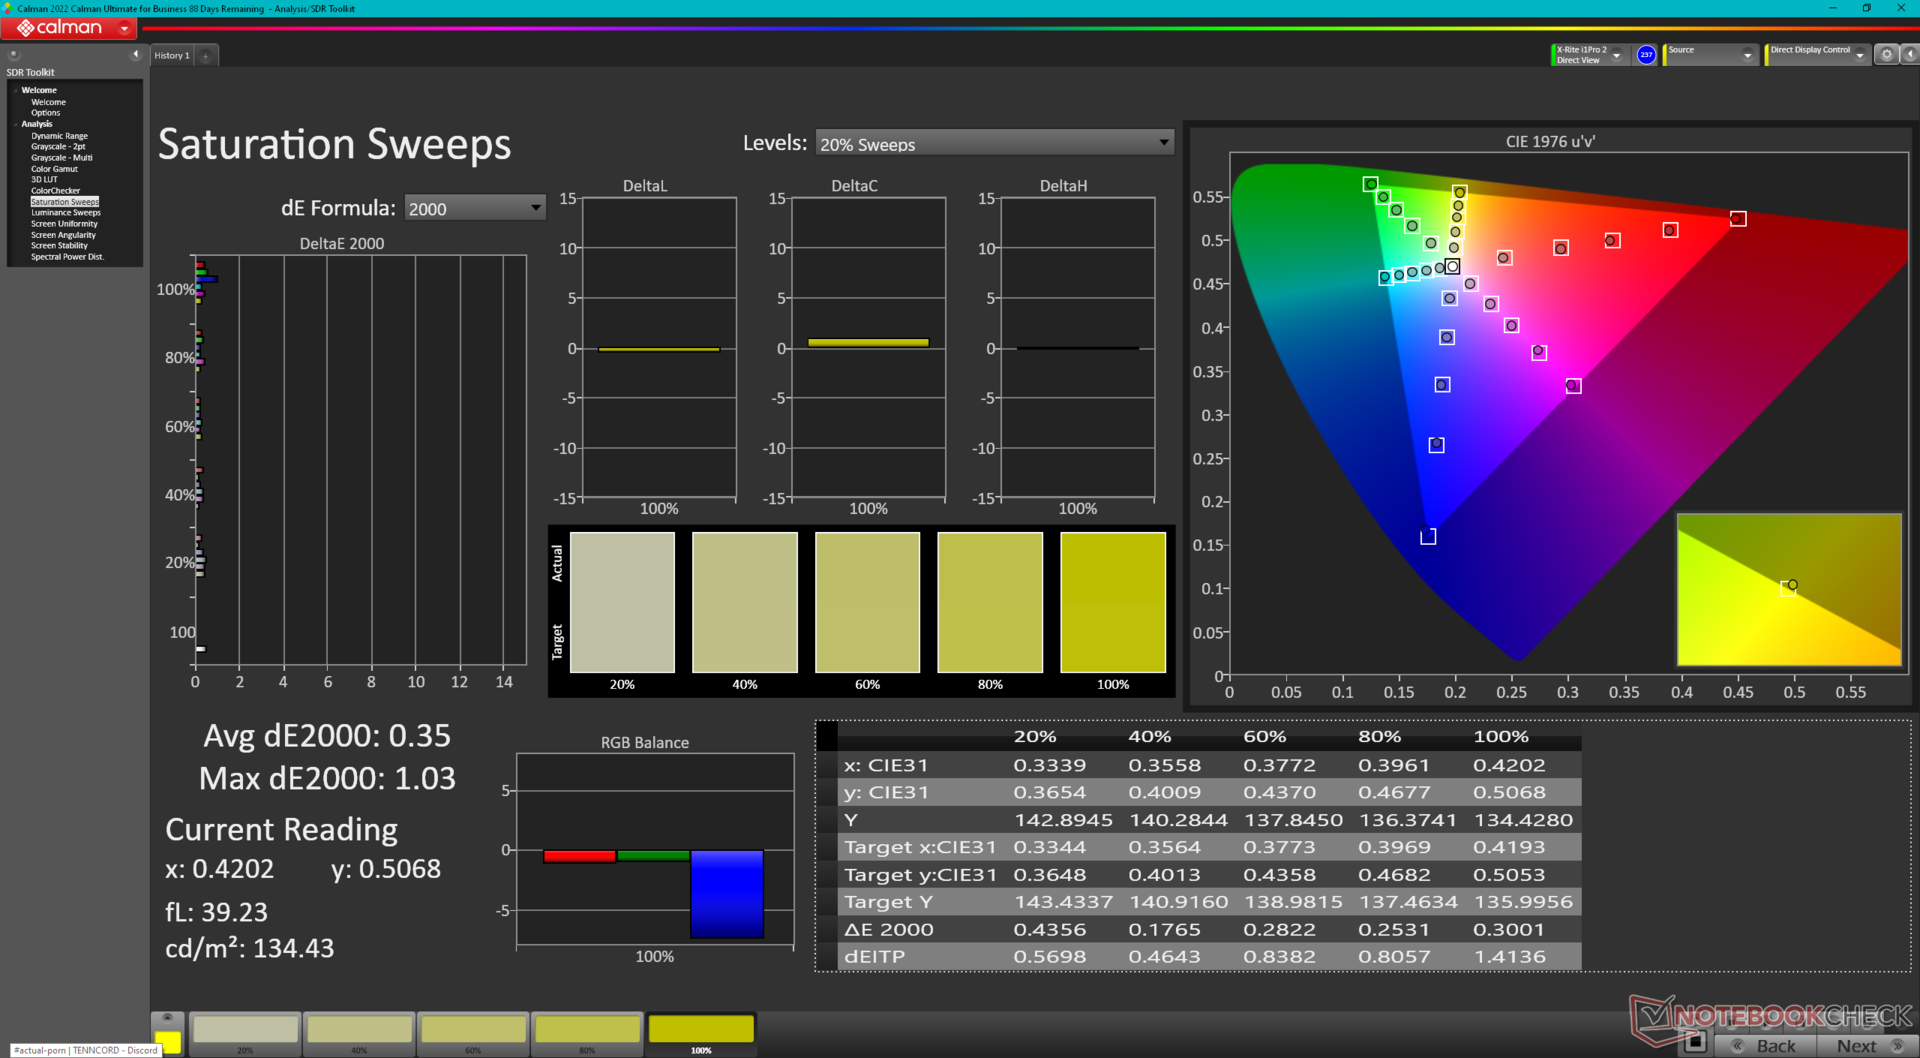
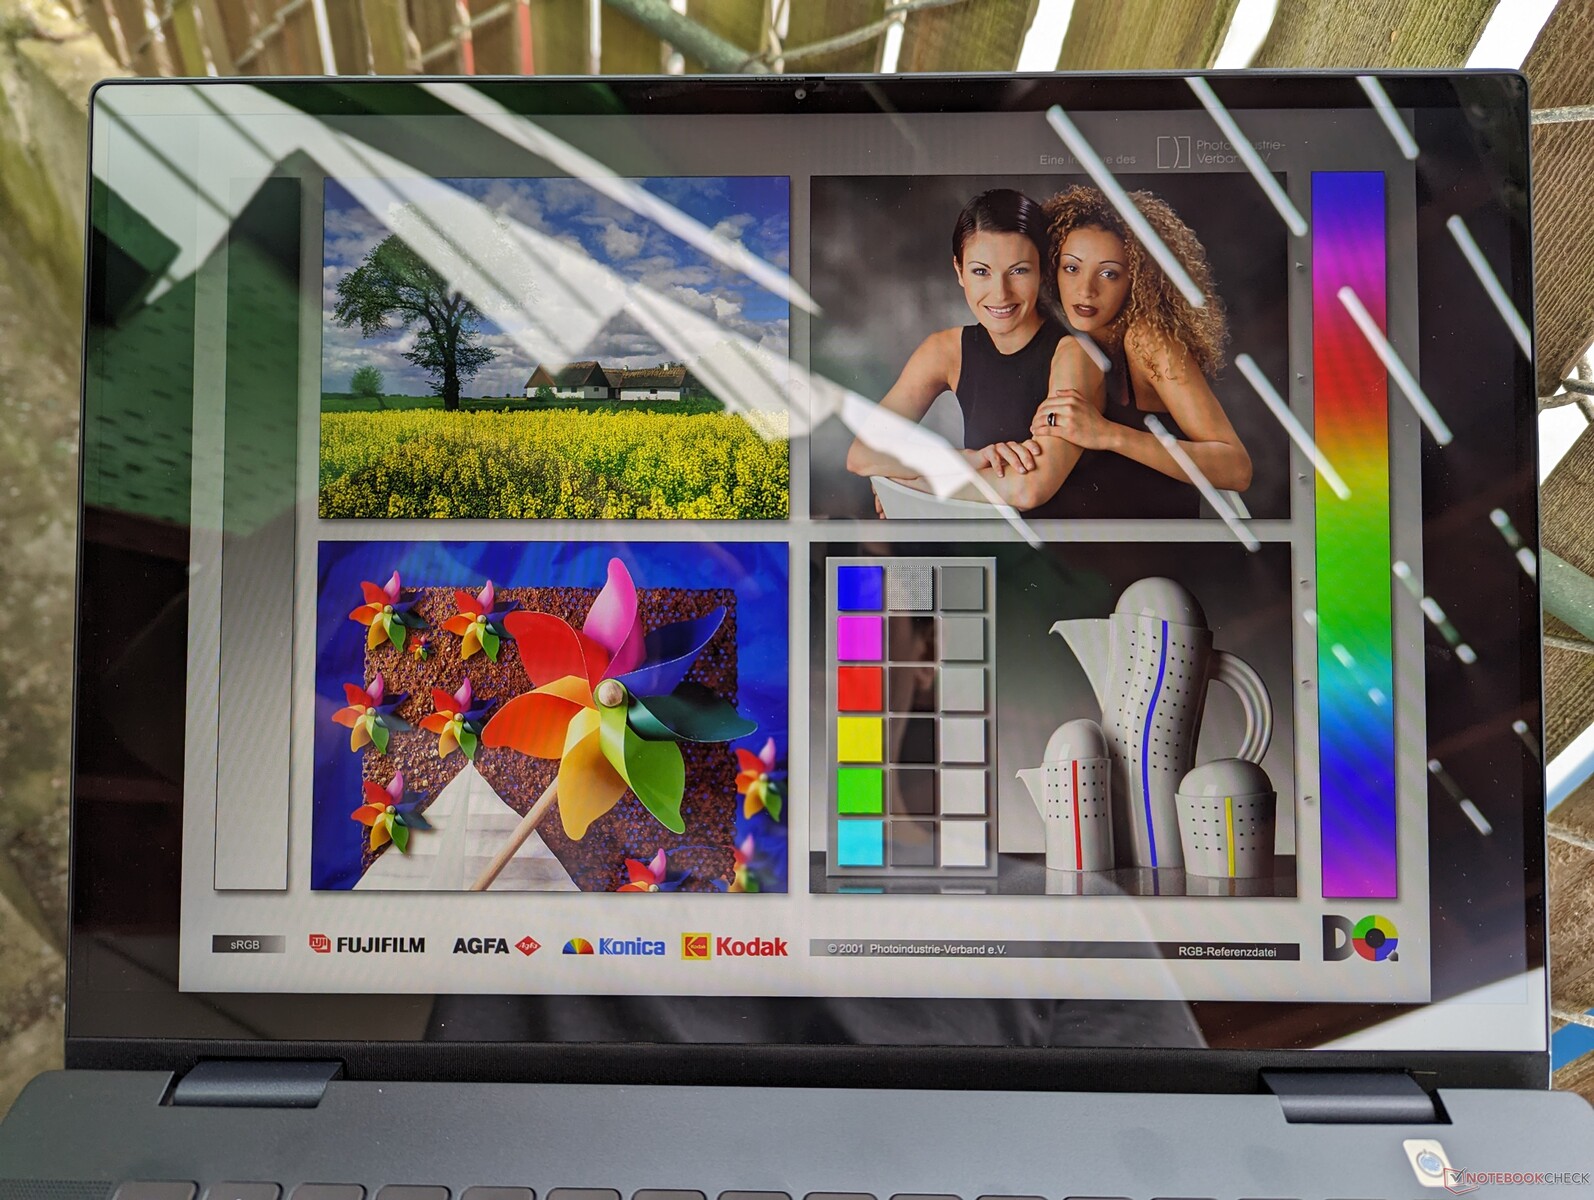
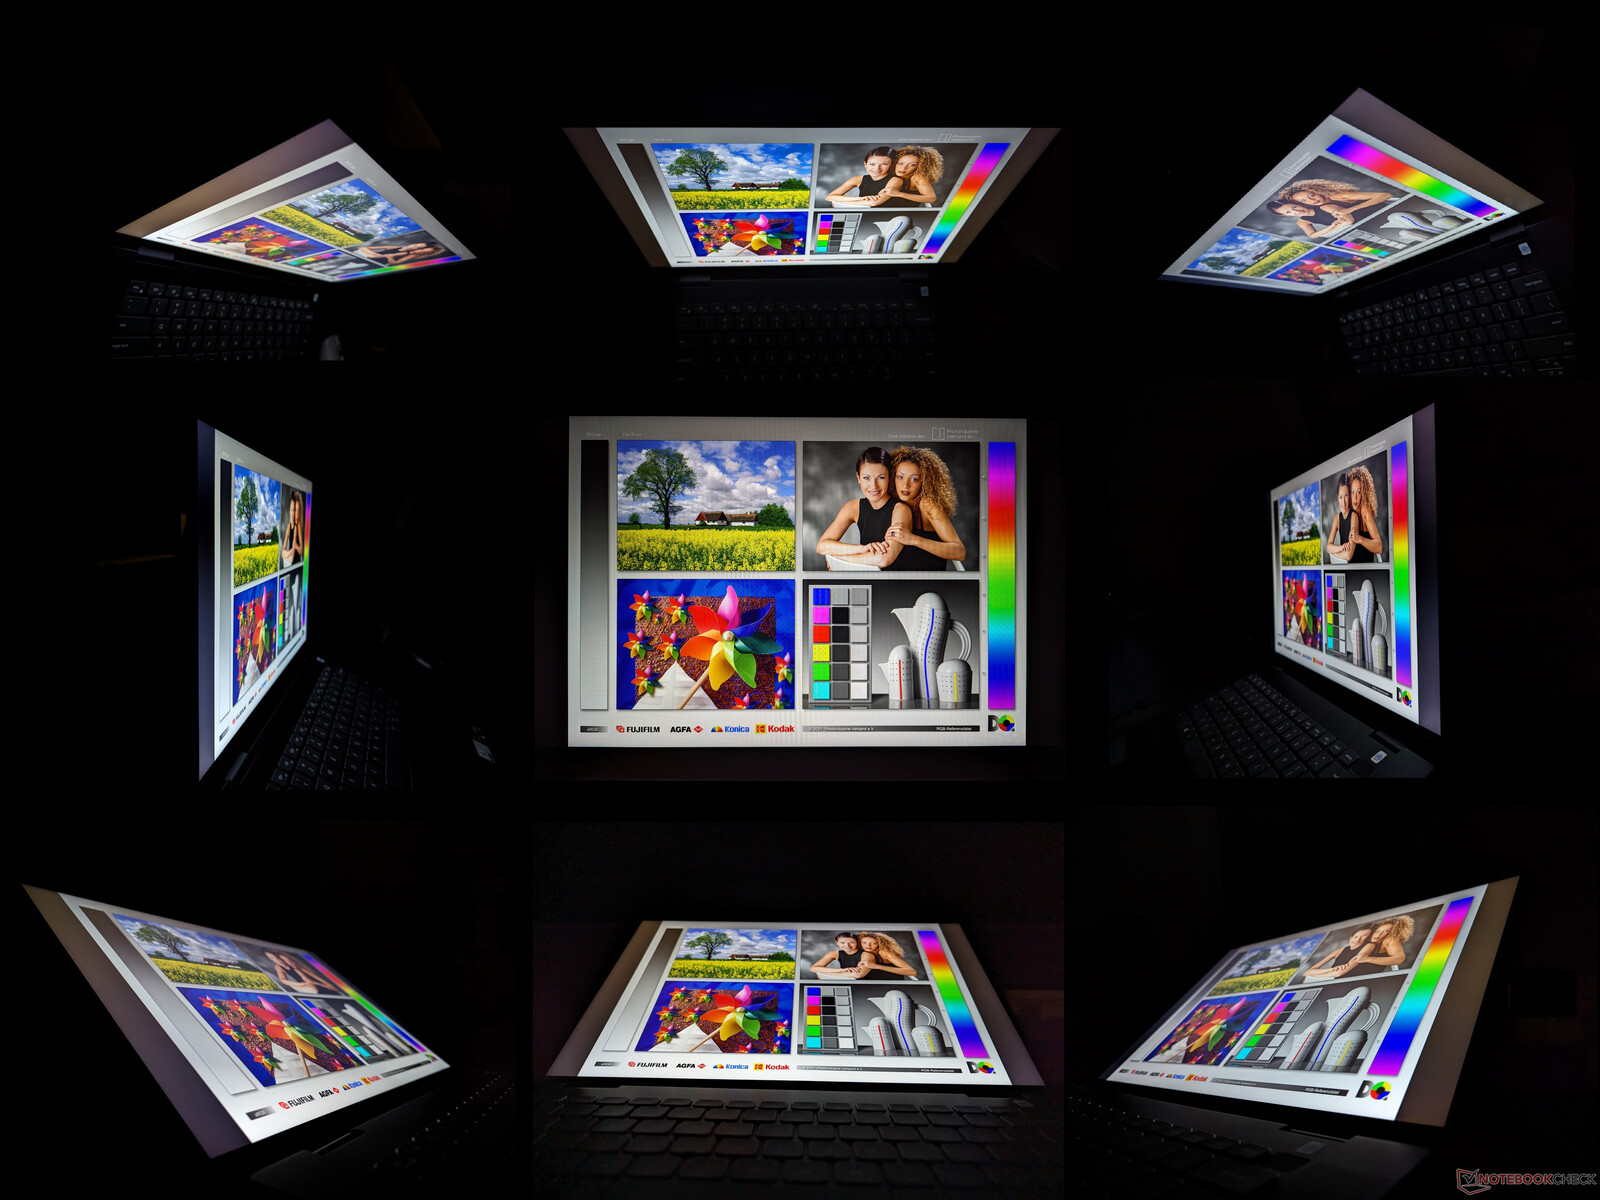
Affichage - Couleurs sRGB
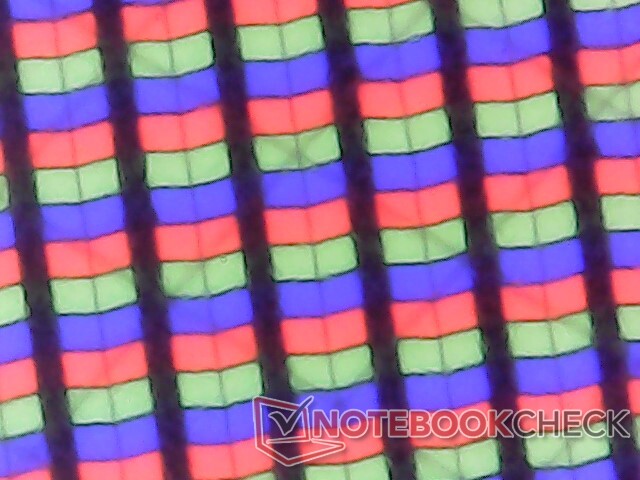
Ce modèle est le premier de notre base de données à être livré avec la dalle IPS Chi Mei 160JCA, alors que le modèle de l'année dernière était équipé de la dalle BOE NV16N45. Les attributs principaux sont pratiquement identiques entre les deux panneaux, y compris leur rapport de contraste de ~1000:1, leur couverture sRGB complète, leur taux de rafraîchissement de 60 Hz et leur temps de réponse moyen. L'expérience visuelle est donc essentiellement la même entre les modèles 2022 et 2023, sauf s'ils sont configurés avec l'option OLED 2400p sur l'Inspiron 16 7630 2-en-1 basé sur Intel.
Bien que notre écran Chi Mei soit de meilleure qualité que l'écran LEN160WUXGA de lIdeaPad Flex 5 16 en termes de couleurs, il aurait été intéressant de voir Dell aller plus loin cette année en incluant des options de taux de rafraîchissement plus rapides de 90 Hz ou 120 Hz pour une interface utilisateur plus fluide.
| |||||||||||||||||||||||||
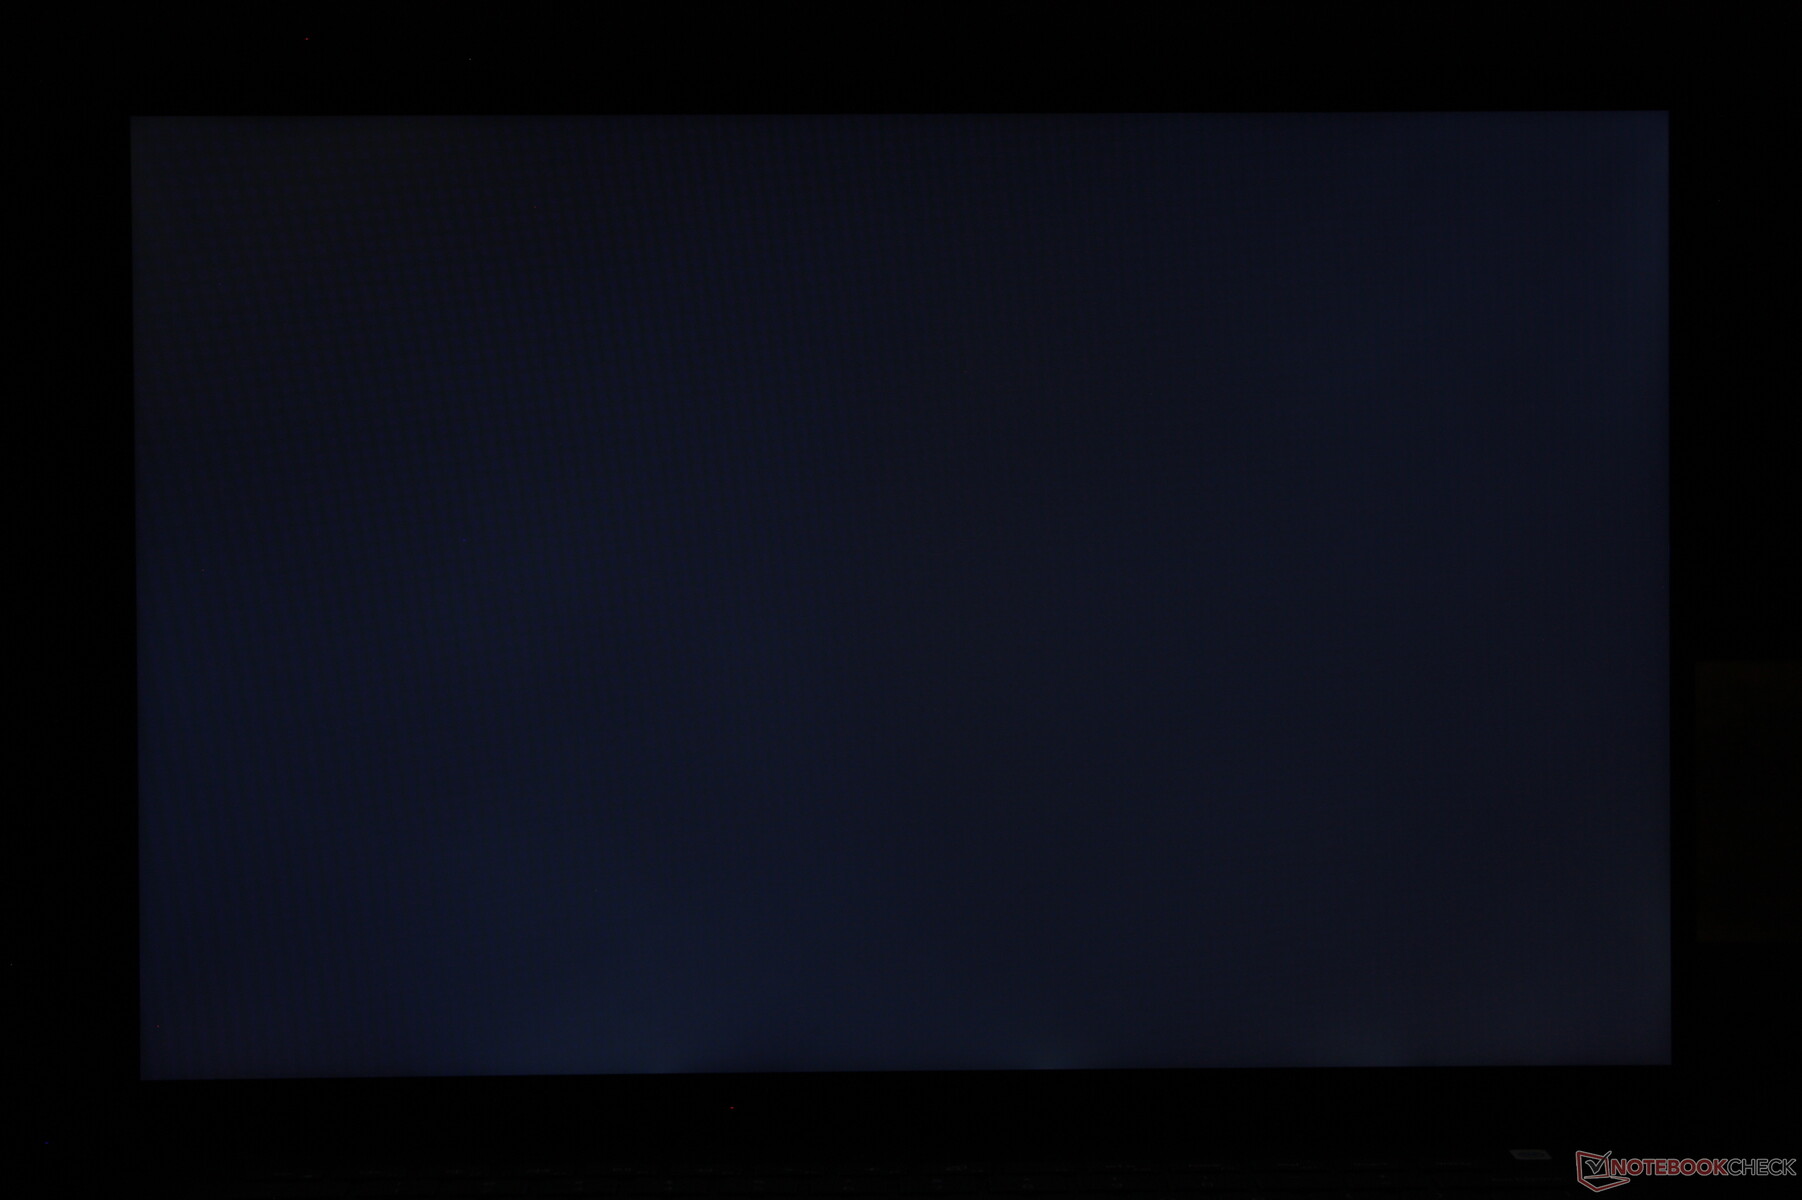
Homogénéité de la luminosité: 79 %
Valeur mesurée au centre, sur batterie: 301.3 cd/m²
Contraste: 1076:1 (Valeurs des noirs: 0.28 cd/m²)
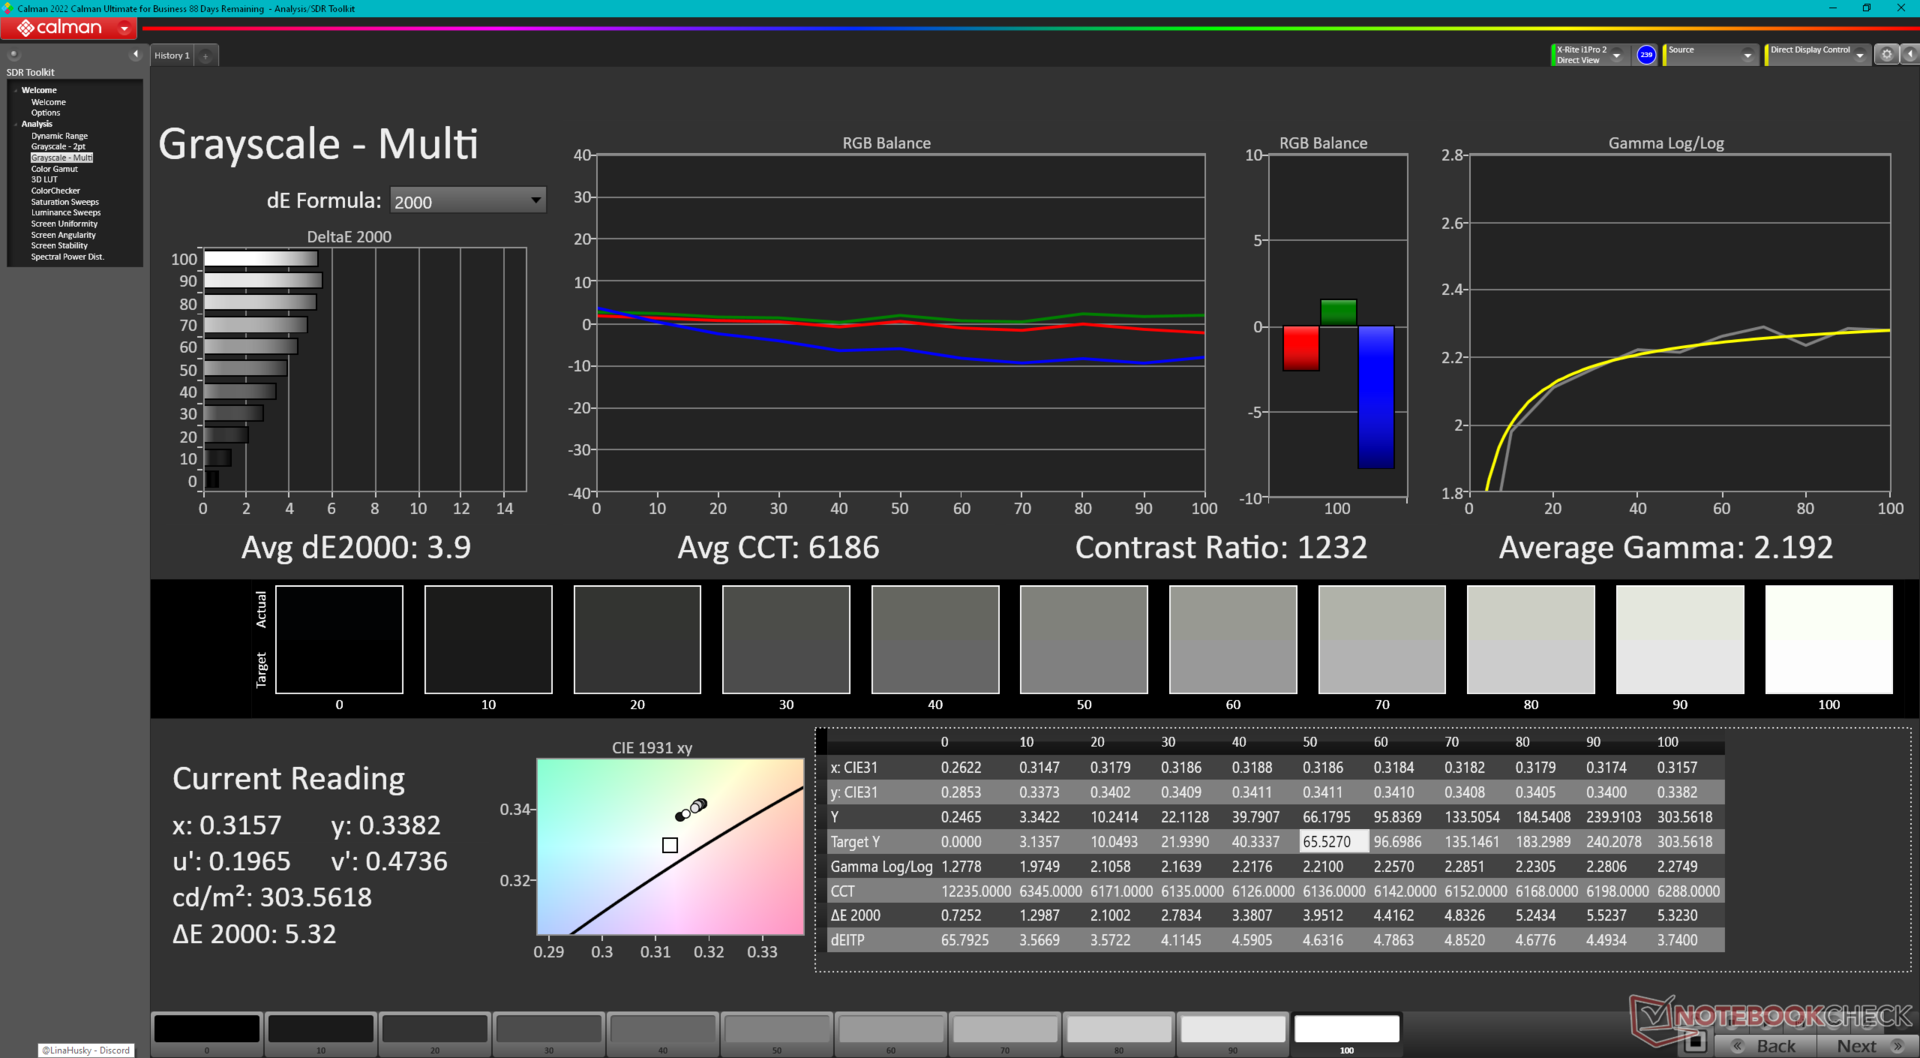
ΔE ColorChecker Calman: 3.1 | ∀{0.5-29.43 Ø4.71}
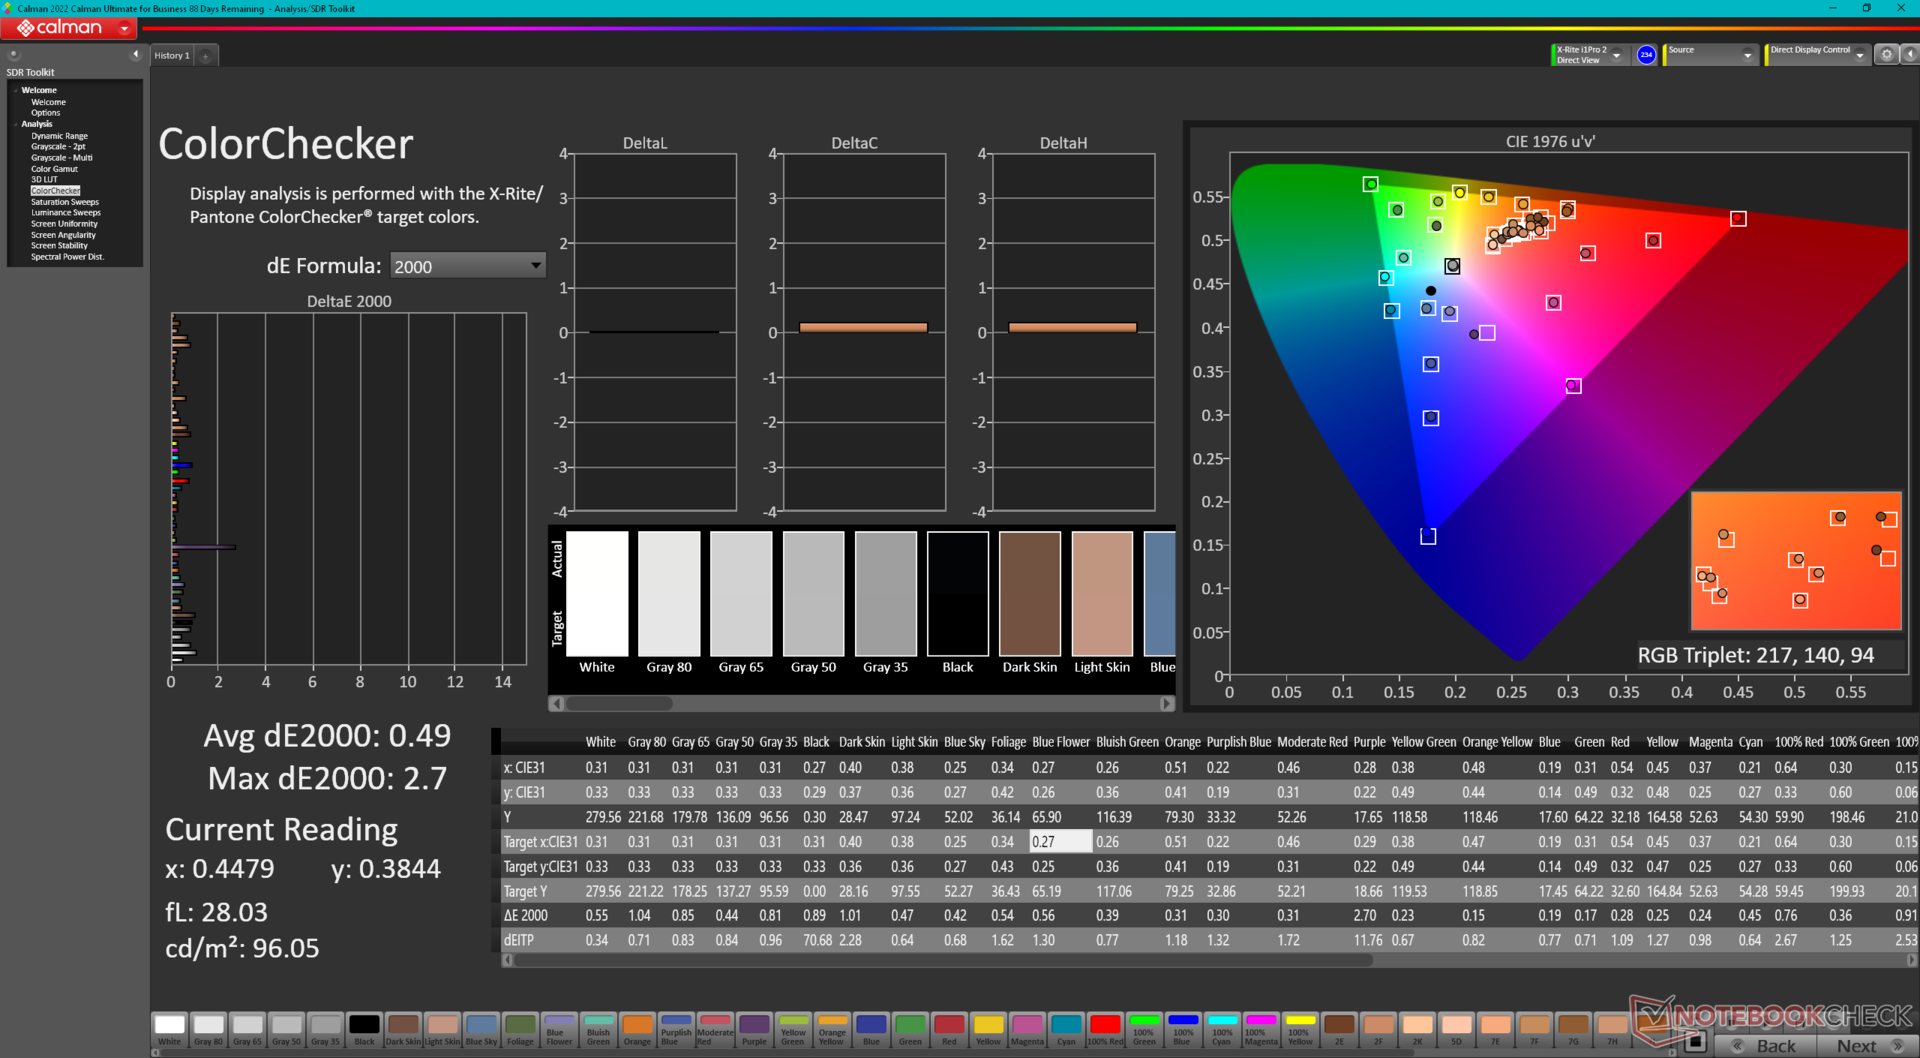
calibrated: 0.49
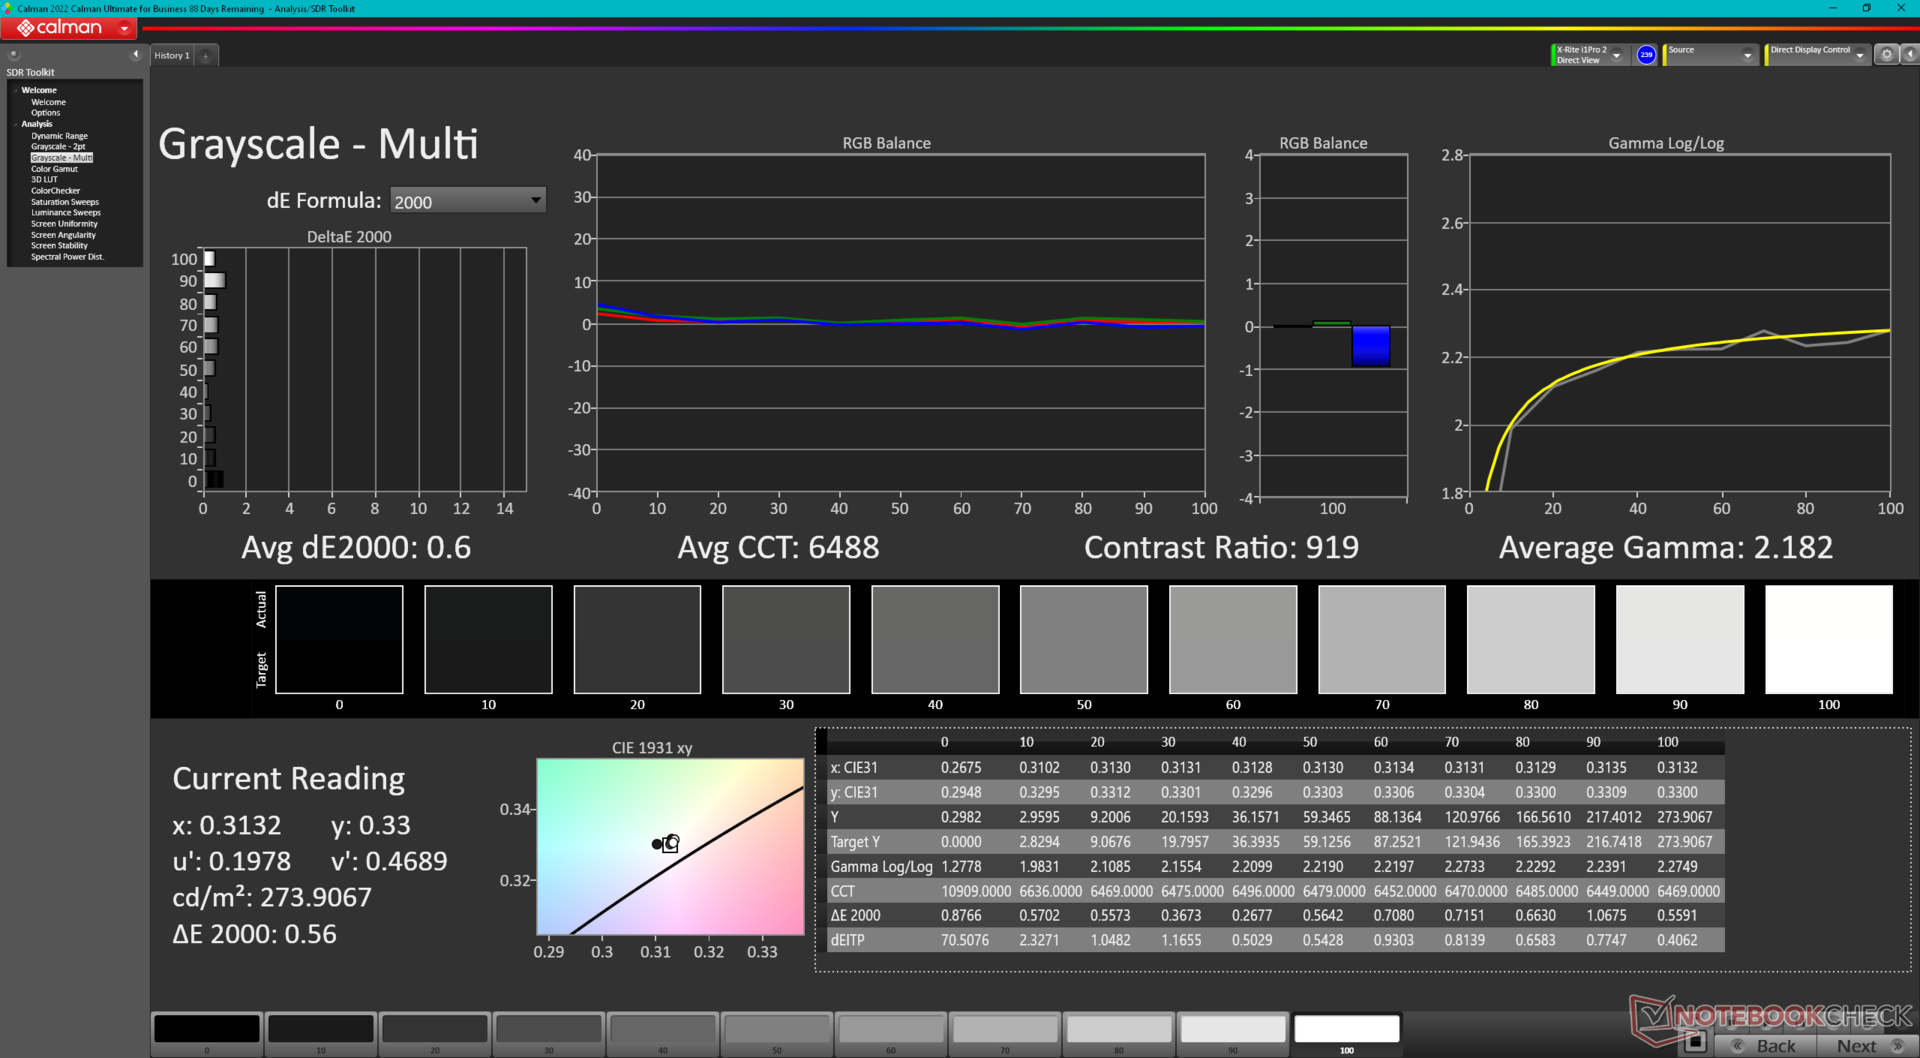
ΔE Greyscale Calman: 3.9 | ∀{0.09-98 Ø4.96}
69.5% AdobeRGB 1998 (Argyll 3D)
98.2% sRGB (Argyll 3D)
67.4% Display P3 (Argyll 3D)
Gamma: 2.19
CCT: 6186 K
| Dell Inspiron 16 7635 2-in-1 Chi Mei 160JCA, IPS, 1920x1200, 16" | Acer Swift Edge SFE16-42-R1GM Samsung SDC4168, OLED, 3840x2400, 16" | Lenovo Yoga 7 16IRL8 LEN160FHD, IPS, 1920x1200, 16" | Samsung Galaxy Book3 Pro 16 Samsung ATNA60CL03-0, AMOLED, 2880x1800, 16" | Lenovo IdeaPad Flex 5 16ABR G8 LEN160WUXGA, IPS, 1920x1200, 16" | Dell Inspiron 16 7620 2-in-1 BOE NV16N45, IPS, 1920x1200, 16" | |
|---|---|---|---|---|---|---|
| Display | 30% | -37% | 30% | -41% | -1% | |
| Display P3 Coverage (%) | 67.4 | 99.7 48% | 42 -38% | 99.7 48% | 40 -41% | 67 -1% |
| sRGB Coverage (%) | 98.2 | 100 2% | 62.8 -36% | 100 2% | 57.6 -41% | 95.9 -2% |
| AdobeRGB 1998 Coverage (%) | 69.5 | 97.2 40% | 43.5 -37% | 97 40% | 41.3 -41% | 69.3 0% |
| Response Times | 89% | -15% | 91% | -16% | -15% | |
| Response Time Grey 50% / Grey 80% * (ms) | 27.6 ? | 2 ? 93% | 31.8 ? -15% | 2 ? 93% | 33 ? -20% | 32 ? -16% |
| Response Time Black / White * (ms) | 18.2 ? | 3 ? 84% | 20.9 ? -15% | 2 ? 89% | 20.2 ? -11% | 20.8 ? -14% |
| PWM Frequency (Hz) | 239 ? | |||||
| Screen | -43% | -63% | 250% | -149% | -24% | |
| Brightness middle (cd/m²) | 301.3 | 369 22% | 279.4 -7% | 412 37% | 392 30% | 320.7 6% |
| Brightness (cd/m²) | 269 | 371 38% | 257 -4% | 412 53% | 371 38% | 309 15% |
| Brightness Distribution (%) | 79 | 97 23% | 81 3% | 98 24% | 89 13% | 90 14% |
| Black Level * (cd/m²) | 0.28 | 0.18 36% | 0.015 95% | 0.25 11% | 0.36 -29% | |
| Contrast (:1) | 1076 | 1552 44% | 27467 2453% | 1568 46% | 891 -17% | |
| Colorchecker dE 2000 * | 3.1 | 2.3 26% | 5.12 -65% | 2.34 25% | 7.3 -135% | 4.18 -35% |
| Colorchecker dE 2000 max. * | 5.5 | 4.37 21% | 19.42 -253% | 3.34 39% | 20.8 -278% | 8.48 -54% |
| Colorchecker dE 2000 calibrated * | 0.49 | 2.87 -486% | 1.84 -276% | 2.95 -502% | 5.4 -1002% | 0.77 -57% |
| Greyscale dE 2000 * | 3.9 | 1.83 53% | 5.5 -41% | 2.78 29% | 6.5 -67% | 6.3 -62% |
| Gamma | 2.19 100% | 2.39 92% | 2.22 99% | 2.5 88% | 2.29 96% | 2.21 100% |
| CCT | 6186 105% | 6392 102% | 6407 101% | 6879 94% | 5993 108% | 6258 104% |
| Moyenne finale (programmes/paramètres) | 25% /
-3% | -38% /
-50% | 124% /
180% | -69% /
-107% | -13% /
-18% |
* ... Moindre est la valeur, meilleures sont les performances
L'écran n'est pas pré-calibré, ce qui est normal pour un appareil à bas prix. Néanmoins, les valeurs moyennes de deltaE en niveaux de gris et en couleurs ne sont pas mauvaises, avec respectivement 3,9 et 3,1. Un étalonnage correct améliorerait encore les moyennes à 0,6 et 0,49. Nous recommandons donc d'appliquer notre profil ICM étalonné ci-dessus pour mieux exploiter les couleurs sRGB de la dalle.
Temps de réponse de l'écran
| ↔ Temps de réponse noir à blanc | ||
|---|---|---|
| 18.2 ms ... hausse ↗ et chute ↘ combinées | ↗ 9.6 ms hausse | 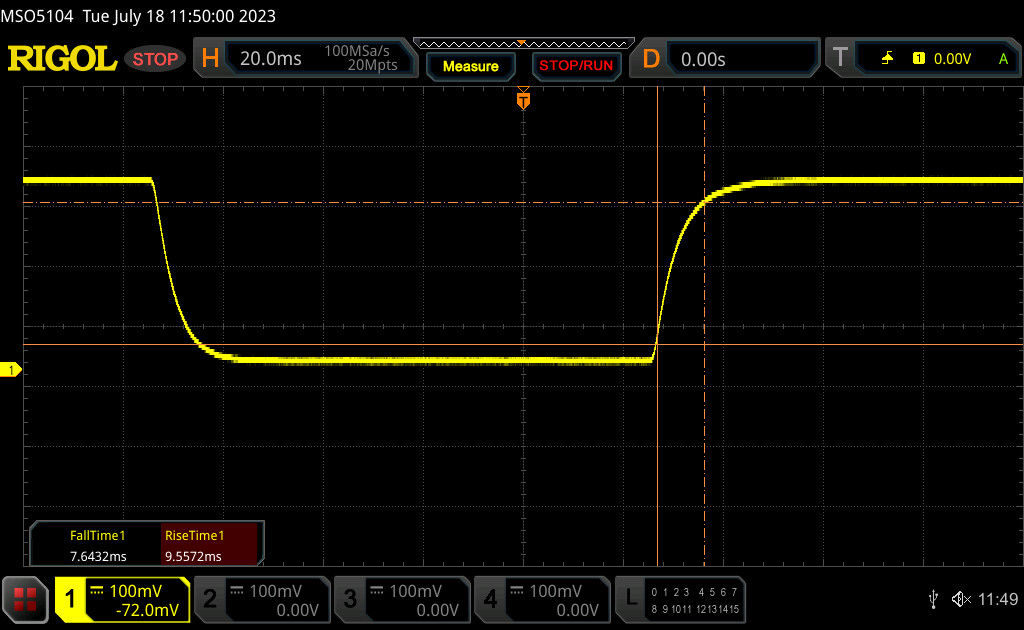 |
| ↘ 7.6 ms chute | ||
| L'écran montre de bons temps de réponse, mais insuffisant pour du jeu compétitif. En comparaison, tous les appareils testés affichent entre 0.1 (minimum) et 240 (maximum) ms. » 41 % des appareils testés affichent de meilleures performances. Cela signifie que les latences relevées sont similaires à la moyenne (19.8 ms) de tous les appareils testés. | ||
| ↔ Temps de réponse gris 50% à gris 80% | ||
| 27.6 ms ... hausse ↗ et chute ↘ combinées | ↗ 13.2 ms hausse | 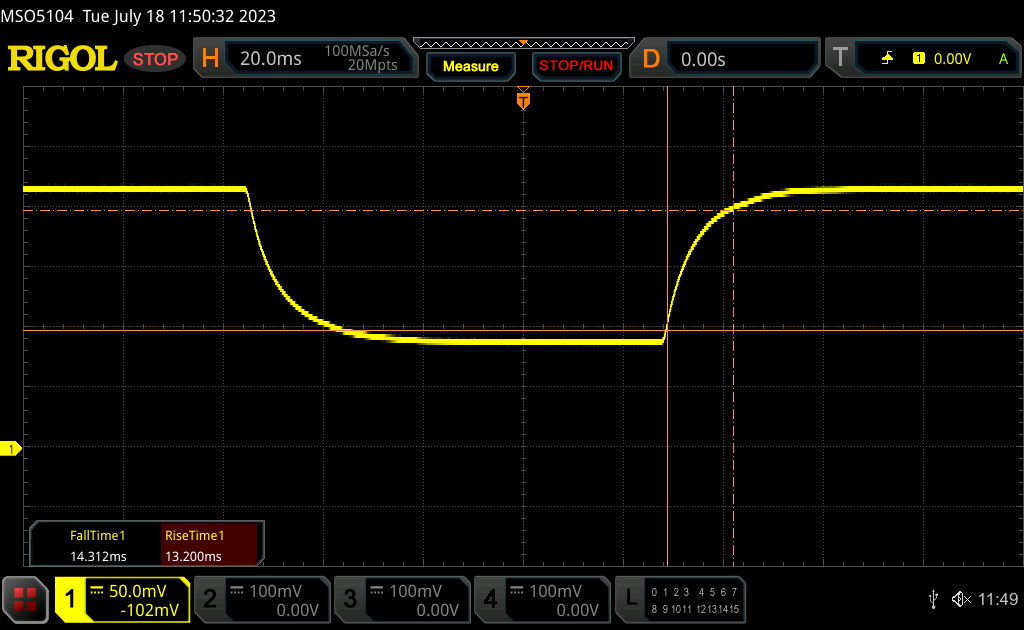 |
| ↘ 14.3 ms chute | ||
| L'écran souffre de latences relativement élevées, insuffisant pour le jeu. En comparaison, tous les appareils testés affichent entre 0.165 (minimum) et 636 (maximum) ms. » 38 % des appareils testés affichent de meilleures performances. Cela signifie que les latences relevées sont meilleures que la moyenne (30.9 ms) de tous les appareils testés. | ||
Scintillement / MLI (Modulation de largeur d'impulsion)
| Scintillement / MLI (Modulation de largeur d'impulsion) non décelé | 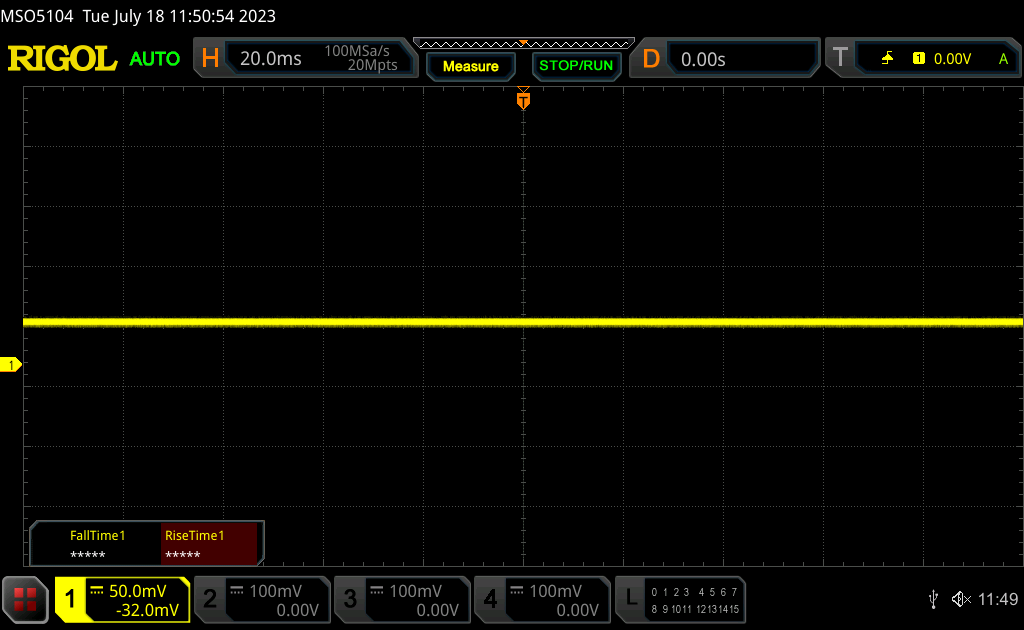 | ||
En comparaison, 52 % des appareils testés n'emploient pas MDI pour assombrir leur écran. Nous avons relevé une moyenne à 7744 (minimum : 5 - maximum : 343500) Hz dans le cas où une MDI était active. | |||
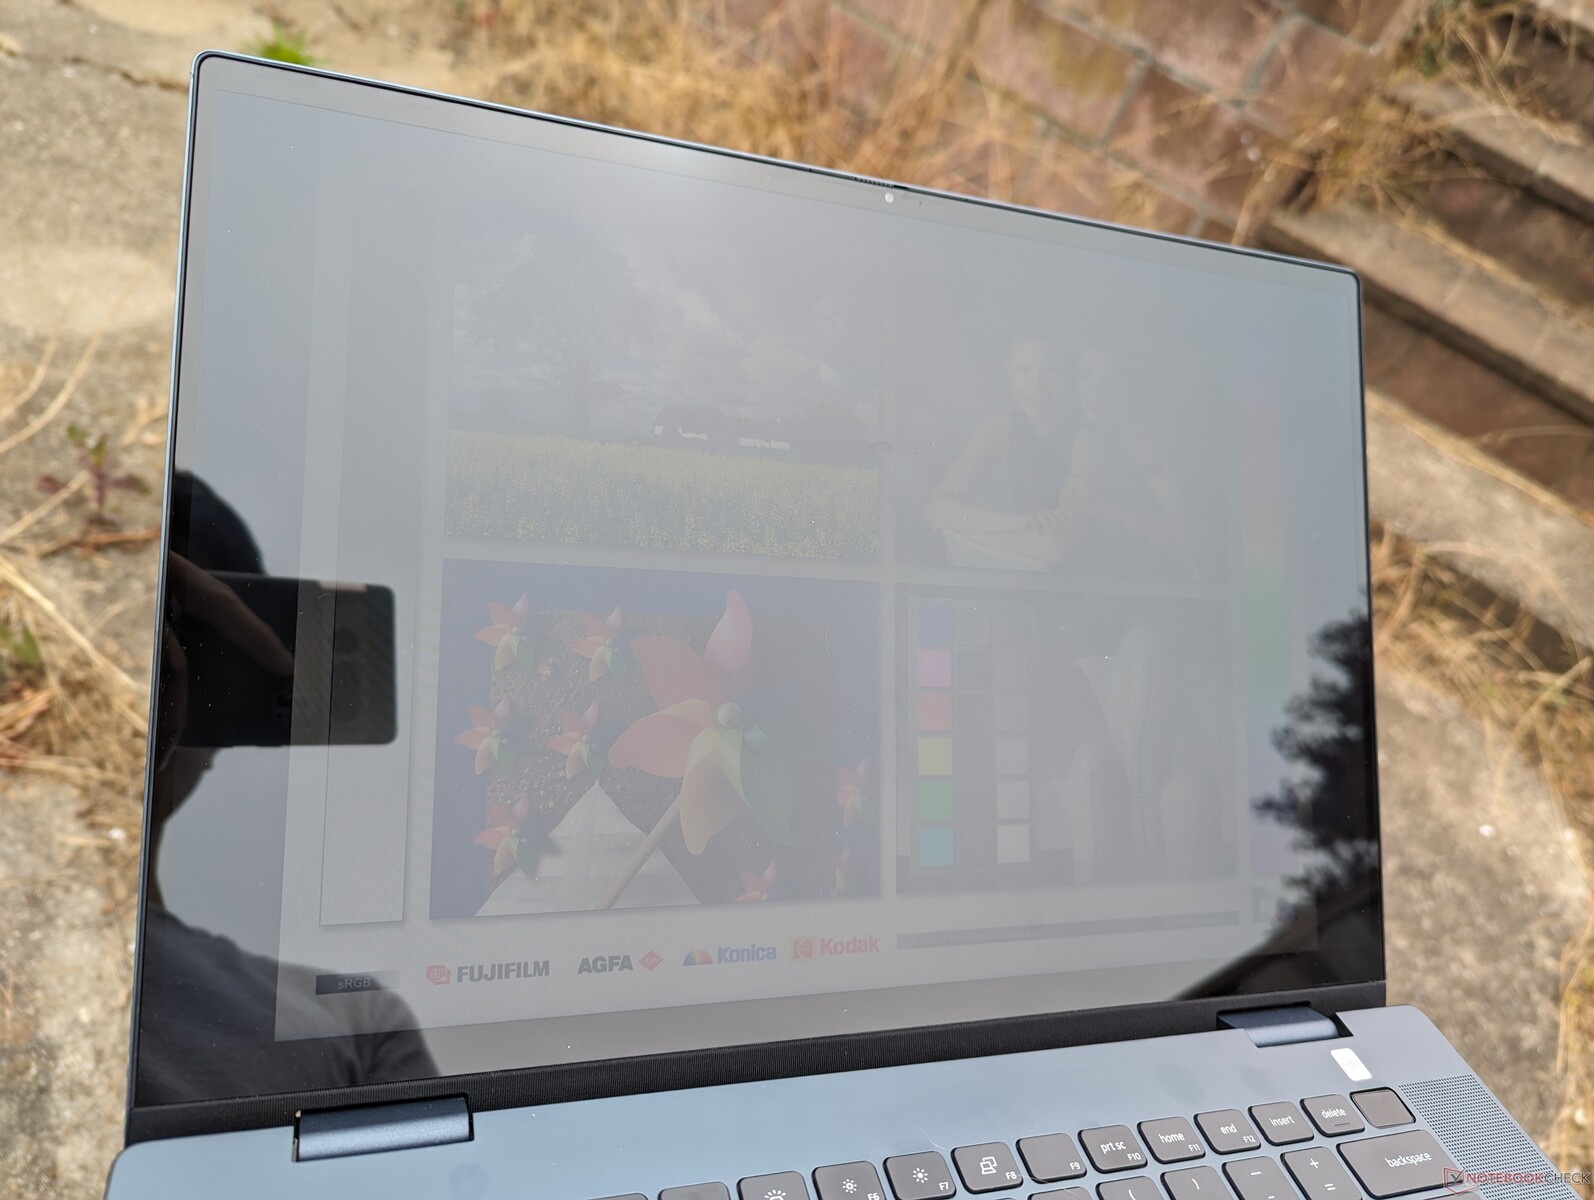
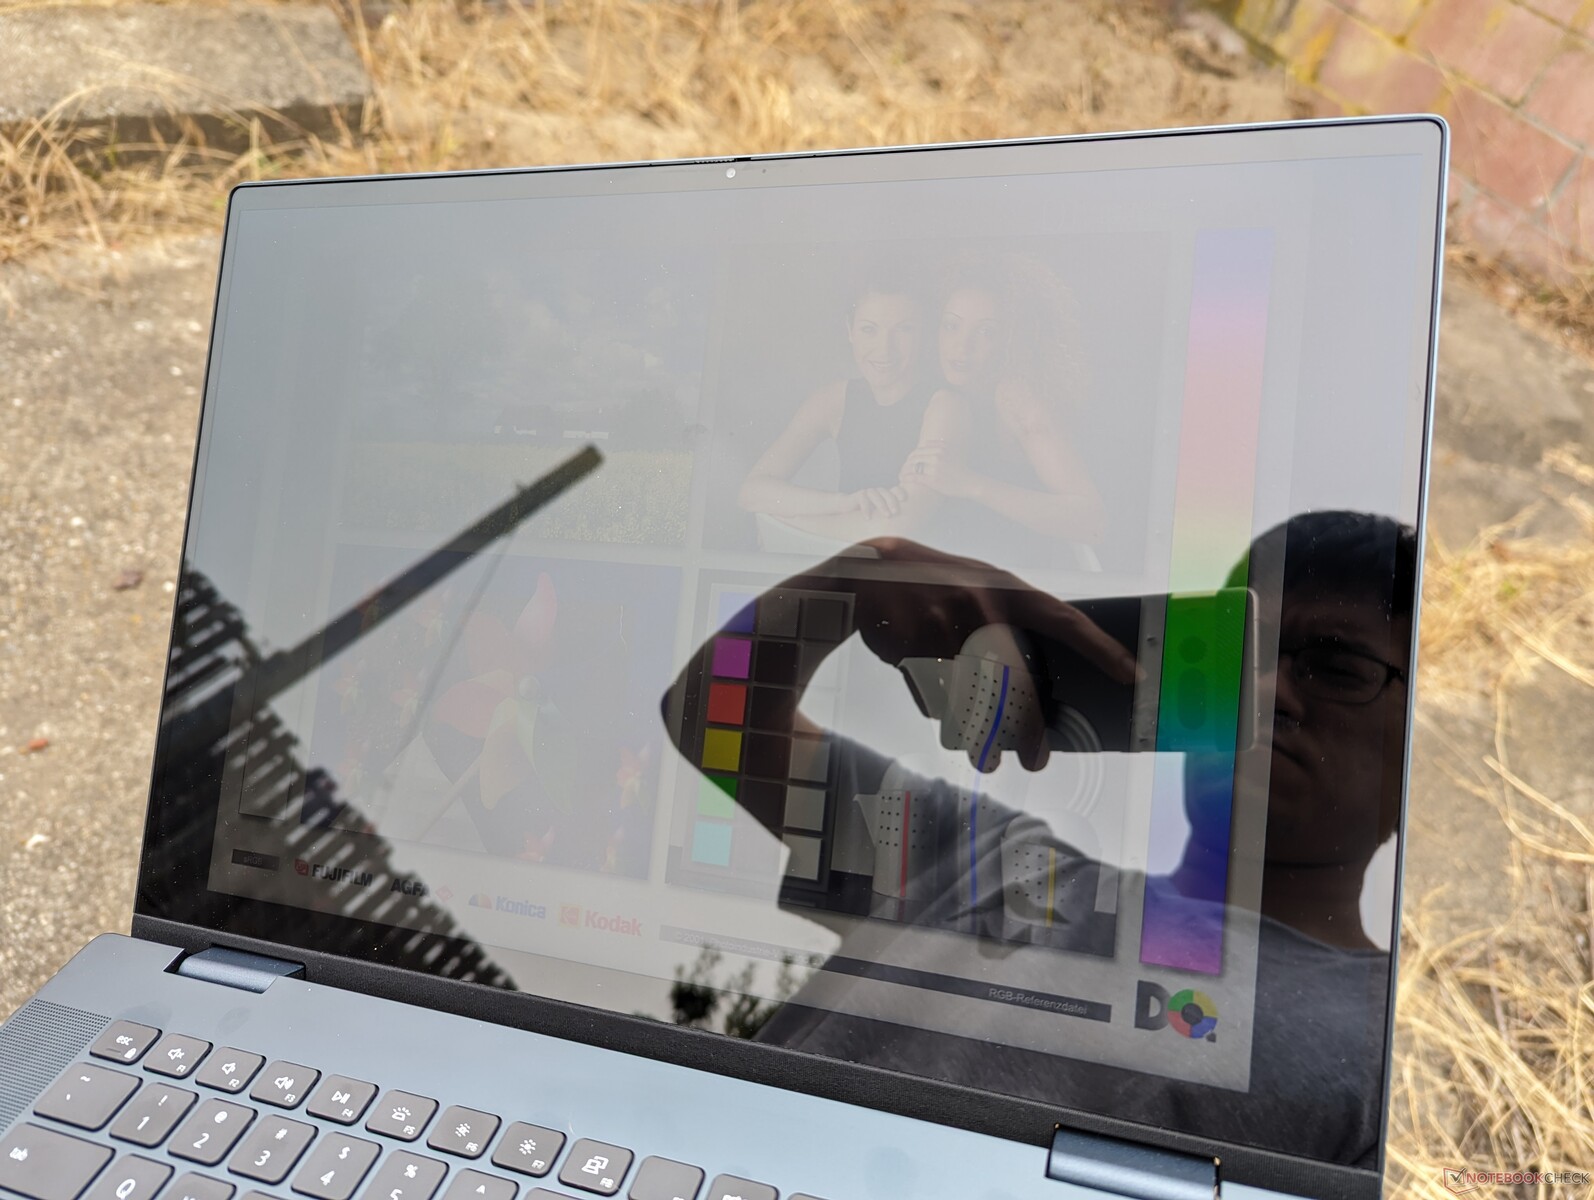
La visibilité en extérieur est au mieux moyenne, car l'écran tactile de 300 nits n'est pas assez lumineux pour réduire ou surmonter les éblouissements de manière significative. Les tablettes comme l iPad Pro 12.6 peuvent être deux fois plus lumineuses, voire plus. Le Dell est avant tout un convertible multimédia pour les environnements intérieurs.
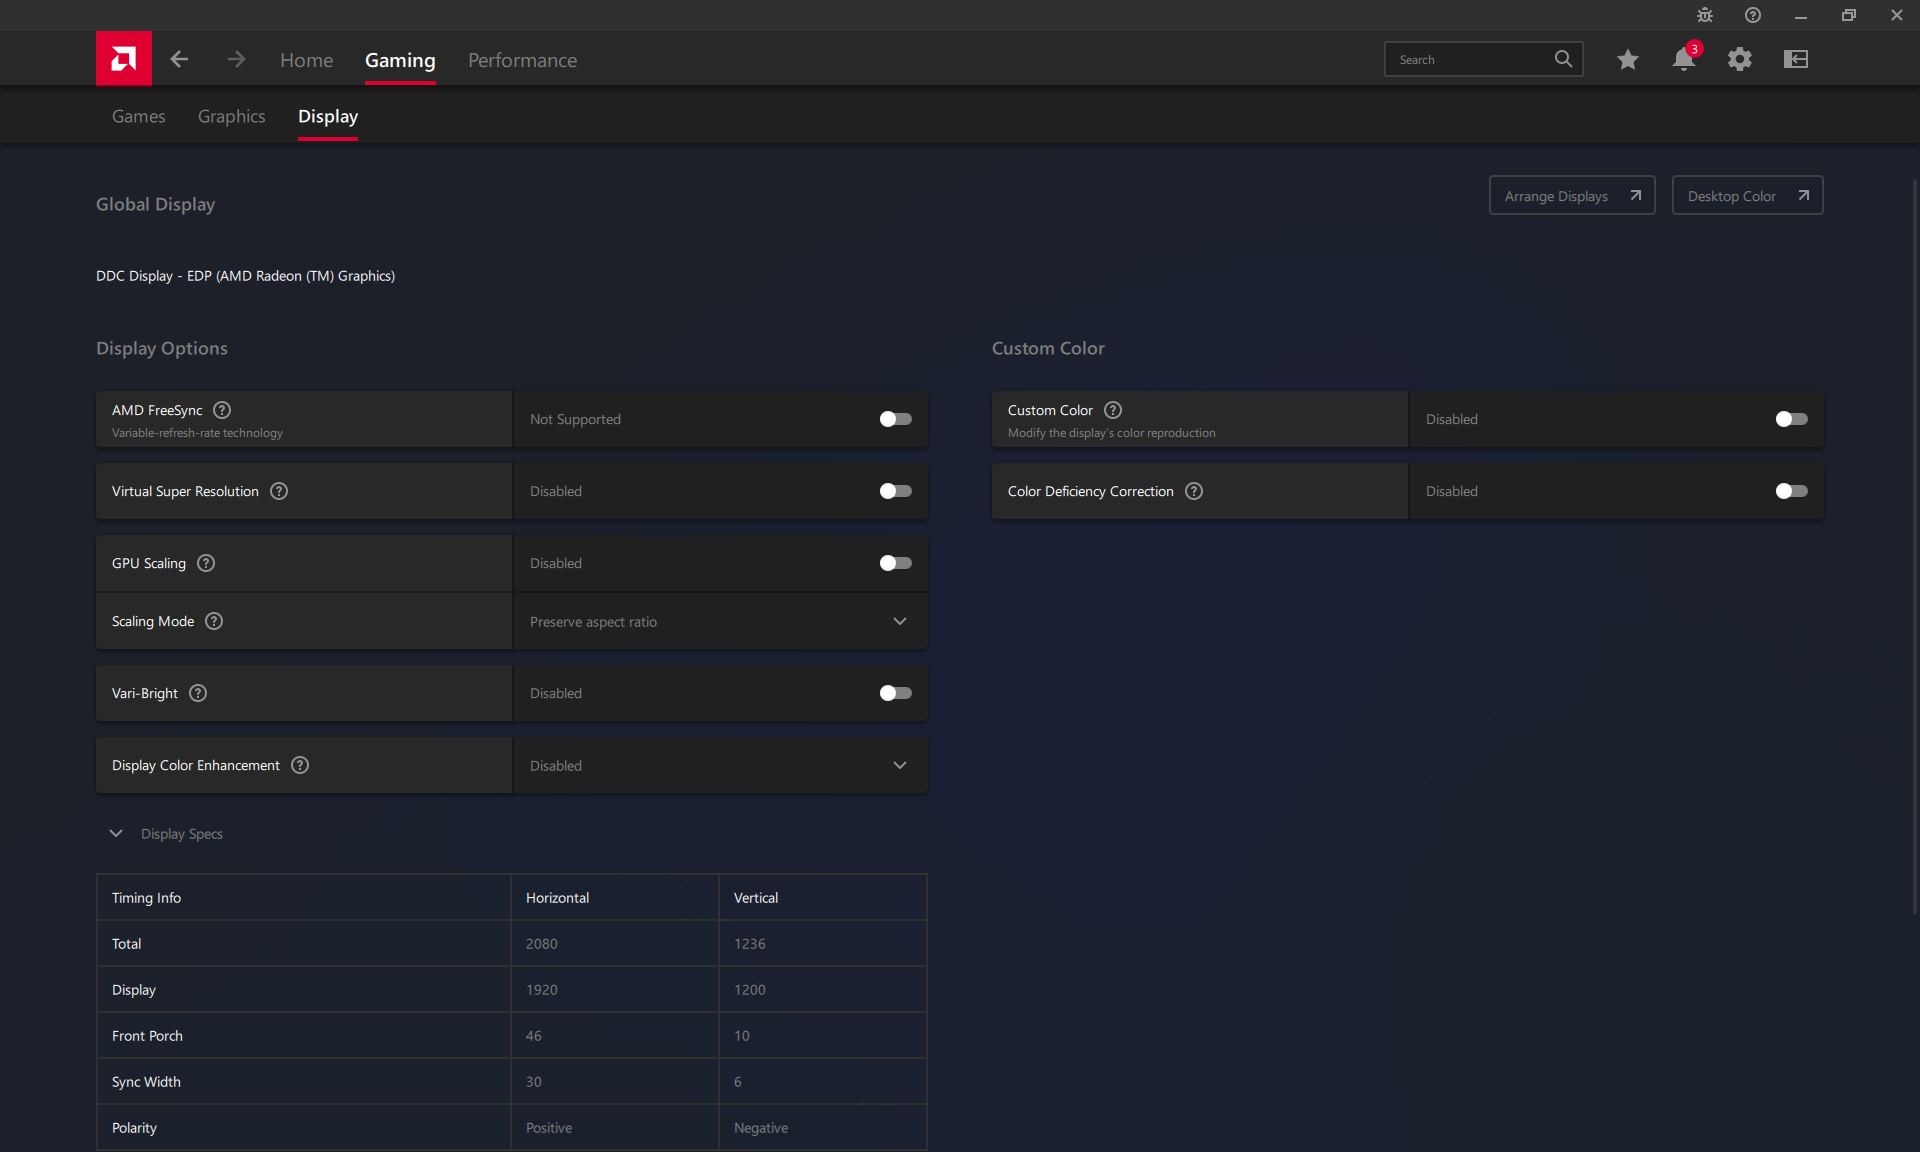
Veillez à désactiver AMD Vari-Bright via l'AMD Adrenalin, sans quoi la luminosité maximale est réduite lorsque l'ordinateur fonctionne sur batterie.
Performances - Tous les processeurs Ryzen 7000 ne sont pas des Zen 4
Conditions d'essai
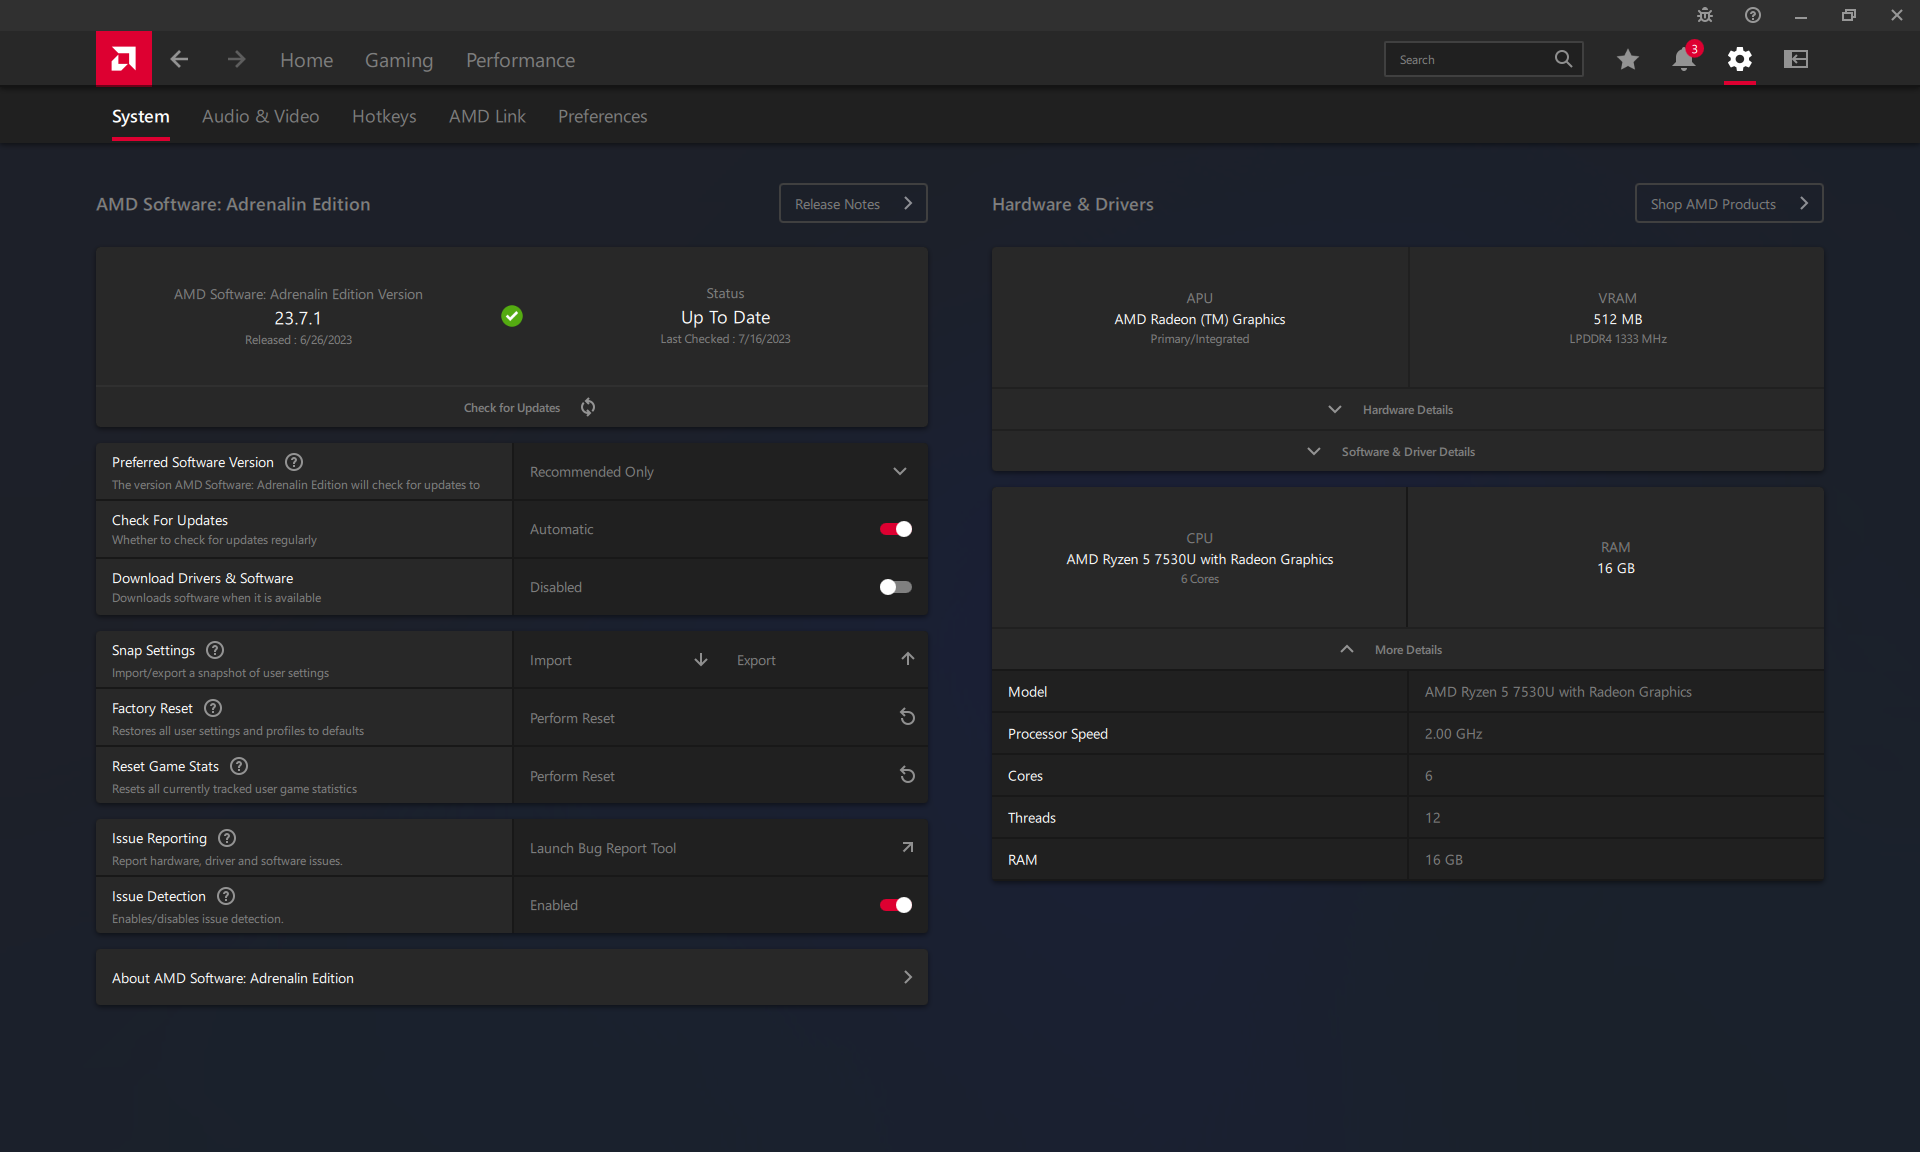
Nous avons réglé notre appareil en mode Performance via Windows avant d'effectuer les tests ci-dessous. Des paramètres graphiques supplémentaires sont disponibles sur AMD Adrenalin, qui n'était pas préchargé sur notre appareil. Nous recommandons d'installer l'outil de détection automatique AMD pour Adrenalin et les derniers pilotes graphiques.
Processeur
LeRyzen 5 7530U ont des performances presque identiques à celles des Ryzen 5 6600H de l'année dernière, mais avec une enveloppe de puissance plus faible pour des performances par watt plus élevées. Il s'agit donc d'un processeur de milieu de gamme comparable aux processeurs concurrents Core i5-1235U ou Core i7-1255U que l'on trouve sur de nombreux ultrabooks tels que lehP Spectre x360 13.5. Toutefois, comme le veut la coutume chez AMD, les performances d'un seul thread sont inférieures d'environ 15 à 20 % à celles des processeurs Intel susmentionnés.
En passant au processeur 8 cœurs Ryzen 7 7730U de notre Ryzen 5 7530U à 6 cœurs devrait améliorer les performances multithread d'environ 15 à 35 %, d'après notre expérience avec l'IdeaPad Flex 5 16. Le Core i7-1360P de l'Inspiron d'Intel serait encore plus performant.
Cinebench R15 Multi Loop
Cinebench R23: Multi Core | Single Core
Cinebench R20: CPU (Multi Core) | CPU (Single Core)
Cinebench R15: CPU Multi 64Bit | CPU Single 64Bit
Blender: v2.79 BMW27 CPU
7-Zip 18.03: 7z b 4 | 7z b 4 -mmt1
Geekbench 5.5: Multi-Core | Single-Core
HWBOT x265 Benchmark v2.2: 4k Preset
LibreOffice : 20 Documents To PDF
R Benchmark 2.5: Overall mean
* ... Moindre est la valeur, meilleures sont les performances
AIDA64: FP32 Ray-Trace | FPU Julia | CPU SHA3 | CPU Queen | FPU SinJulia | FPU Mandel | CPU AES | CPU ZLib | FP64 Ray-Trace | CPU PhotoWorxx
| Performance rating | |
| Acer Swift Edge SFE16-42-R1GM | |
| Lenovo IdeaPad Flex 5 16ABR G8 | |
| Samsung Galaxy Book3 Pro 16 | |
| Dell Inspiron 16 7635 2-in-1 | |
| Moyenne AMD Ryzen 5 7530U | |
| Lenovo Yoga 7 16IRL8 | |
| Dell Inspiron 16 7620 2-in-1 | |
| AIDA64 / FP32 Ray-Trace | |
| Lenovo IdeaPad Flex 5 16ABR G8 | |
| Acer Swift Edge SFE16-42-R1GM | |
| Dell Inspiron 16 7635 2-in-1 | |
| Moyenne AMD Ryzen 5 7530U (7609 - 10970, n=9) | |
| Samsung Galaxy Book3 Pro 16 | |
| Lenovo Yoga 7 16IRL8 | |
| Dell Inspiron 16 7620 2-in-1 | |
| AIDA64 / FPU Julia | |
| Lenovo IdeaPad Flex 5 16ABR G8 | |
| Acer Swift Edge SFE16-42-R1GM | |
| Dell Inspiron 16 7635 2-in-1 | |
| Moyenne AMD Ryzen 5 7530U (48473 - 68384, n=9) | |
| Samsung Galaxy Book3 Pro 16 | |
| Lenovo Yoga 7 16IRL8 | |
| Dell Inspiron 16 7620 2-in-1 | |
| AIDA64 / CPU SHA3 | |
| Samsung Galaxy Book3 Pro 16 | |
| Lenovo IdeaPad Flex 5 16ABR G8 | |
| Acer Swift Edge SFE16-42-R1GM | |
| Lenovo Yoga 7 16IRL8 | |
| Dell Inspiron 16 7635 2-in-1 | |
| Moyenne AMD Ryzen 5 7530U (1591 - 2323, n=9) | |
| Dell Inspiron 16 7620 2-in-1 | |
| AIDA64 / CPU Queen | |
| Lenovo IdeaPad Flex 5 16ABR G8 | |
| Acer Swift Edge SFE16-42-R1GM | |
| Samsung Galaxy Book3 Pro 16 | |
| Dell Inspiron 16 7620 2-in-1 | |
| Dell Inspiron 16 7635 2-in-1 | |
| Moyenne AMD Ryzen 5 7530U (66646 - 78105, n=8) | |
| Lenovo Yoga 7 16IRL8 | |
| AIDA64 / FPU SinJulia | |
| Acer Swift Edge SFE16-42-R1GM | |
| Lenovo IdeaPad Flex 5 16ABR G8 | |
| Dell Inspiron 16 7635 2-in-1 | |
| Moyenne AMD Ryzen 5 7530U (7611 - 9248, n=9) | |
| Samsung Galaxy Book3 Pro 16 | |
| Dell Inspiron 16 7620 2-in-1 | |
| Lenovo Yoga 7 16IRL8 | |
| AIDA64 / FPU Mandel | |
| Lenovo IdeaPad Flex 5 16ABR G8 | |
| Acer Swift Edge SFE16-42-R1GM | |
| Dell Inspiron 16 7635 2-in-1 | |
| Moyenne AMD Ryzen 5 7530U (26912 - 37624, n=9) | |
| Samsung Galaxy Book3 Pro 16 | |
| Lenovo Yoga 7 16IRL8 | |
| Dell Inspiron 16 7620 2-in-1 | |
| AIDA64 / CPU AES | |
| Samsung Galaxy Book3 Pro 16 | |
| Moyenne AMD Ryzen 5 7530U (33314 - 92360, n=9) | |
| Lenovo Yoga 7 16IRL8 | |
| Lenovo IdeaPad Flex 5 16ABR G8 | |
| Acer Swift Edge SFE16-42-R1GM | |
| Dell Inspiron 16 7620 2-in-1 | |
| Dell Inspiron 16 7635 2-in-1 | |
| AIDA64 / CPU ZLib | |
| Samsung Galaxy Book3 Pro 16 | |
| Lenovo Yoga 7 16IRL8 | |
| Acer Swift Edge SFE16-42-R1GM | |
| Lenovo IdeaPad Flex 5 16ABR G8 | |
| Dell Inspiron 16 7620 2-in-1 | |
| Dell Inspiron 16 7635 2-in-1 | |
| Moyenne AMD Ryzen 5 7530U (443 - 612, n=9) | |
| AIDA64 / FP64 Ray-Trace | |
| Lenovo IdeaPad Flex 5 16ABR G8 | |
| Acer Swift Edge SFE16-42-R1GM | |
| Dell Inspiron 16 7635 2-in-1 | |
| Moyenne AMD Ryzen 5 7530U (4008 - 5738, n=9) | |
| Samsung Galaxy Book3 Pro 16 | |
| Lenovo Yoga 7 16IRL8 | |
| Dell Inspiron 16 7620 2-in-1 | |
| AIDA64 / CPU PhotoWorxx | |
| Samsung Galaxy Book3 Pro 16 | |
| Lenovo Yoga 7 16IRL8 | |
| Acer Swift Edge SFE16-42-R1GM | |
| Dell Inspiron 16 7635 2-in-1 | |
| Lenovo IdeaPad Flex 5 16ABR G8 | |
| Dell Inspiron 16 7620 2-in-1 | |
| Moyenne AMD Ryzen 5 7530U (9832 - 19525, n=9) | |
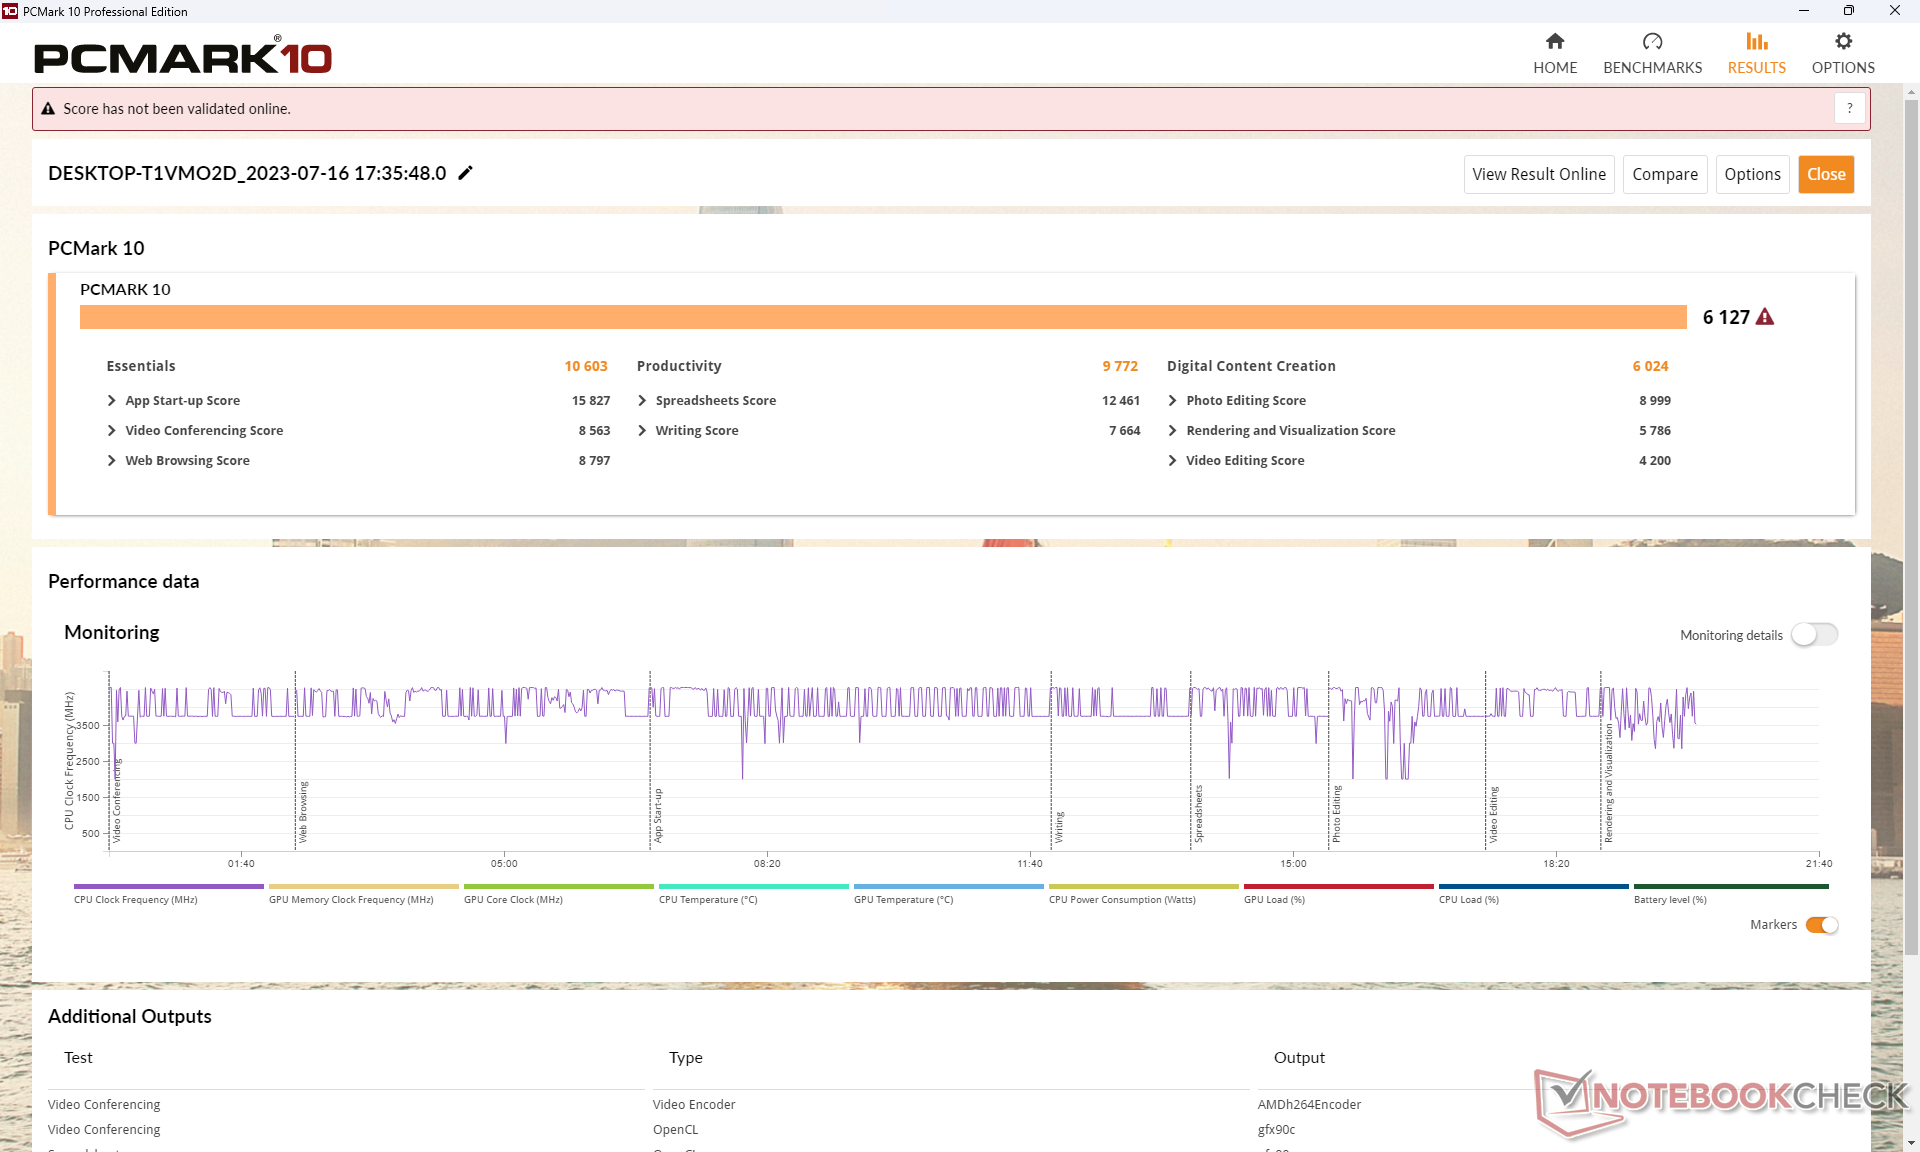
Performance du système
Les résultats de PCMark sont comparables à ceux d'autres ordinateurs équipés de processeurs Core-U et même Core-P, tels que le Samsung Galaxy Book3 Pro 16 ou le Dell Inspiron 16 7620 2-en-1 de l'année dernière. Il est intéressant de noter que le sous-test Productivité favorise notre système Dell par des marges plus importantes.
CrossMark: Overall | Productivity | Creativity | Responsiveness
| PCMark 10 / Score | |
| Lenovo IdeaPad Flex 5 16ABR G8 | |
| Acer Swift Edge SFE16-42-R1GM | |
| Dell Inspiron 16 7635 2-in-1 | |
| Moyenne AMD Ryzen 5 7530U, AMD Radeon RX Vega 7 (5686 - 6209, n=8) | |
| Lenovo Yoga 7 16IRL8 | |
| Samsung Galaxy Book3 Pro 16 | |
| Dell Inspiron 16 7620 2-in-1 | |
| PCMark 10 / Essentials | |
| Lenovo Yoga 7 16IRL8 | |
| Lenovo IdeaPad Flex 5 16ABR G8 | |
| Dell Inspiron 16 7635 2-in-1 | |
| Samsung Galaxy Book3 Pro 16 | |
| Moyenne AMD Ryzen 5 7530U, AMD Radeon RX Vega 7 (9183 - 11242, n=8) | |
| Dell Inspiron 16 7620 2-in-1 | |
| Acer Swift Edge SFE16-42-R1GM | |
| PCMark 10 / Productivity | |
| Moyenne AMD Ryzen 5 7530U, AMD Radeon RX Vega 7 (8983 - 14037, n=8) | |
| Dell Inspiron 16 7635 2-in-1 | |
| Lenovo IdeaPad Flex 5 16ABR G8 | |
| Acer Swift Edge SFE16-42-R1GM | |
| Lenovo Yoga 7 16IRL8 | |
| Samsung Galaxy Book3 Pro 16 | |
| Dell Inspiron 16 7620 2-in-1 | |
| PCMark 10 / Digital Content Creation | |
| Acer Swift Edge SFE16-42-R1GM | |
| Lenovo Yoga 7 16IRL8 | |
| Samsung Galaxy Book3 Pro 16 | |
| Lenovo IdeaPad Flex 5 16ABR G8 | |
| Dell Inspiron 16 7635 2-in-1 | |
| Dell Inspiron 16 7620 2-in-1 | |
| Moyenne AMD Ryzen 5 7530U, AMD Radeon RX Vega 7 (4941 - 6093, n=8) | |
| CrossMark / Overall | |
| Lenovo Yoga 7 16IRL8 | |
| Samsung Galaxy Book3 Pro 16 | |
| Dell Inspiron 16 7620 2-in-1 | |
| Acer Swift Edge SFE16-42-R1GM | |
| Lenovo IdeaPad Flex 5 16ABR G8 | |
| Moyenne AMD Ryzen 5 7530U, AMD Radeon RX Vega 7 (1029 - 1336, n=7) | |
| Dell Inspiron 16 7635 2-in-1 | |
| CrossMark / Productivity | |
| Lenovo Yoga 7 16IRL8 | |
| Samsung Galaxy Book3 Pro 16 | |
| Dell Inspiron 16 7620 2-in-1 | |
| Acer Swift Edge SFE16-42-R1GM | |
| Lenovo IdeaPad Flex 5 16ABR G8 | |
| Moyenne AMD Ryzen 5 7530U, AMD Radeon RX Vega 7 (1115 - 1370, n=7) | |
| Dell Inspiron 16 7635 2-in-1 | |
| CrossMark / Creativity | |
| Lenovo Yoga 7 16IRL8 | |
| Samsung Galaxy Book3 Pro 16 | |
| Dell Inspiron 16 7620 2-in-1 | |
| Lenovo IdeaPad Flex 5 16ABR G8 | |
| Acer Swift Edge SFE16-42-R1GM | |
| Dell Inspiron 16 7635 2-in-1 | |
| Moyenne AMD Ryzen 5 7530U, AMD Radeon RX Vega 7 (992 - 1390, n=7) | |
| CrossMark / Responsiveness | |
| Samsung Galaxy Book3 Pro 16 | |
| Lenovo Yoga 7 16IRL8 | |
| Dell Inspiron 16 7620 2-in-1 | |
| Acer Swift Edge SFE16-42-R1GM | |
| Moyenne AMD Ryzen 5 7530U, AMD Radeon RX Vega 7 (900 - 1096, n=7) | |
| Lenovo IdeaPad Flex 5 16ABR G8 | |
| Dell Inspiron 16 7635 2-in-1 | |
| PCMark 10 Score | 6127 points | |
Aide | ||
| AIDA64 / Memory Copy | |
| Samsung Galaxy Book3 Pro 16 | |
| Lenovo Yoga 7 16IRL8 | |
| Acer Swift Edge SFE16-42-R1GM | |
| Dell Inspiron 16 7635 2-in-1 | |
| Lenovo IdeaPad Flex 5 16ABR G8 | |
| Dell Inspiron 16 7620 2-in-1 | |
| Moyenne AMD Ryzen 5 7530U (20155 - 42853, n=9) | |
| AIDA64 / Memory Read | |
| Samsung Galaxy Book3 Pro 16 | |
| Lenovo Yoga 7 16IRL8 | |
| Acer Swift Edge SFE16-42-R1GM | |
| Dell Inspiron 16 7620 2-in-1 | |
| Dell Inspiron 16 7635 2-in-1 | |
| Lenovo IdeaPad Flex 5 16ABR G8 | |
| Moyenne AMD Ryzen 5 7530U (23068 - 40270, n=9) | |
| AIDA64 / Memory Write | |
| Samsung Galaxy Book3 Pro 16 | |
| Lenovo Yoga 7 16IRL8 | |
| Acer Swift Edge SFE16-42-R1GM | |
| Dell Inspiron 16 7620 2-in-1 | |
| Dell Inspiron 16 7635 2-in-1 | |
| Lenovo IdeaPad Flex 5 16ABR G8 | |
| Moyenne AMD Ryzen 5 7530U (22954 - 41838, n=9) | |
| AIDA64 / Memory Latency | |
| Lenovo IdeaPad Flex 5 16ABR G8 | |
| Dell Inspiron 16 7635 2-in-1 | |
| Acer Swift Edge SFE16-42-R1GM | |
| Moyenne AMD Ryzen 5 7530U (88.1 - 110.8, n=9) | |
| Lenovo Yoga 7 16IRL8 | |
| Samsung Galaxy Book3 Pro 16 | |
* ... Moindre est la valeur, meilleures sont les performances
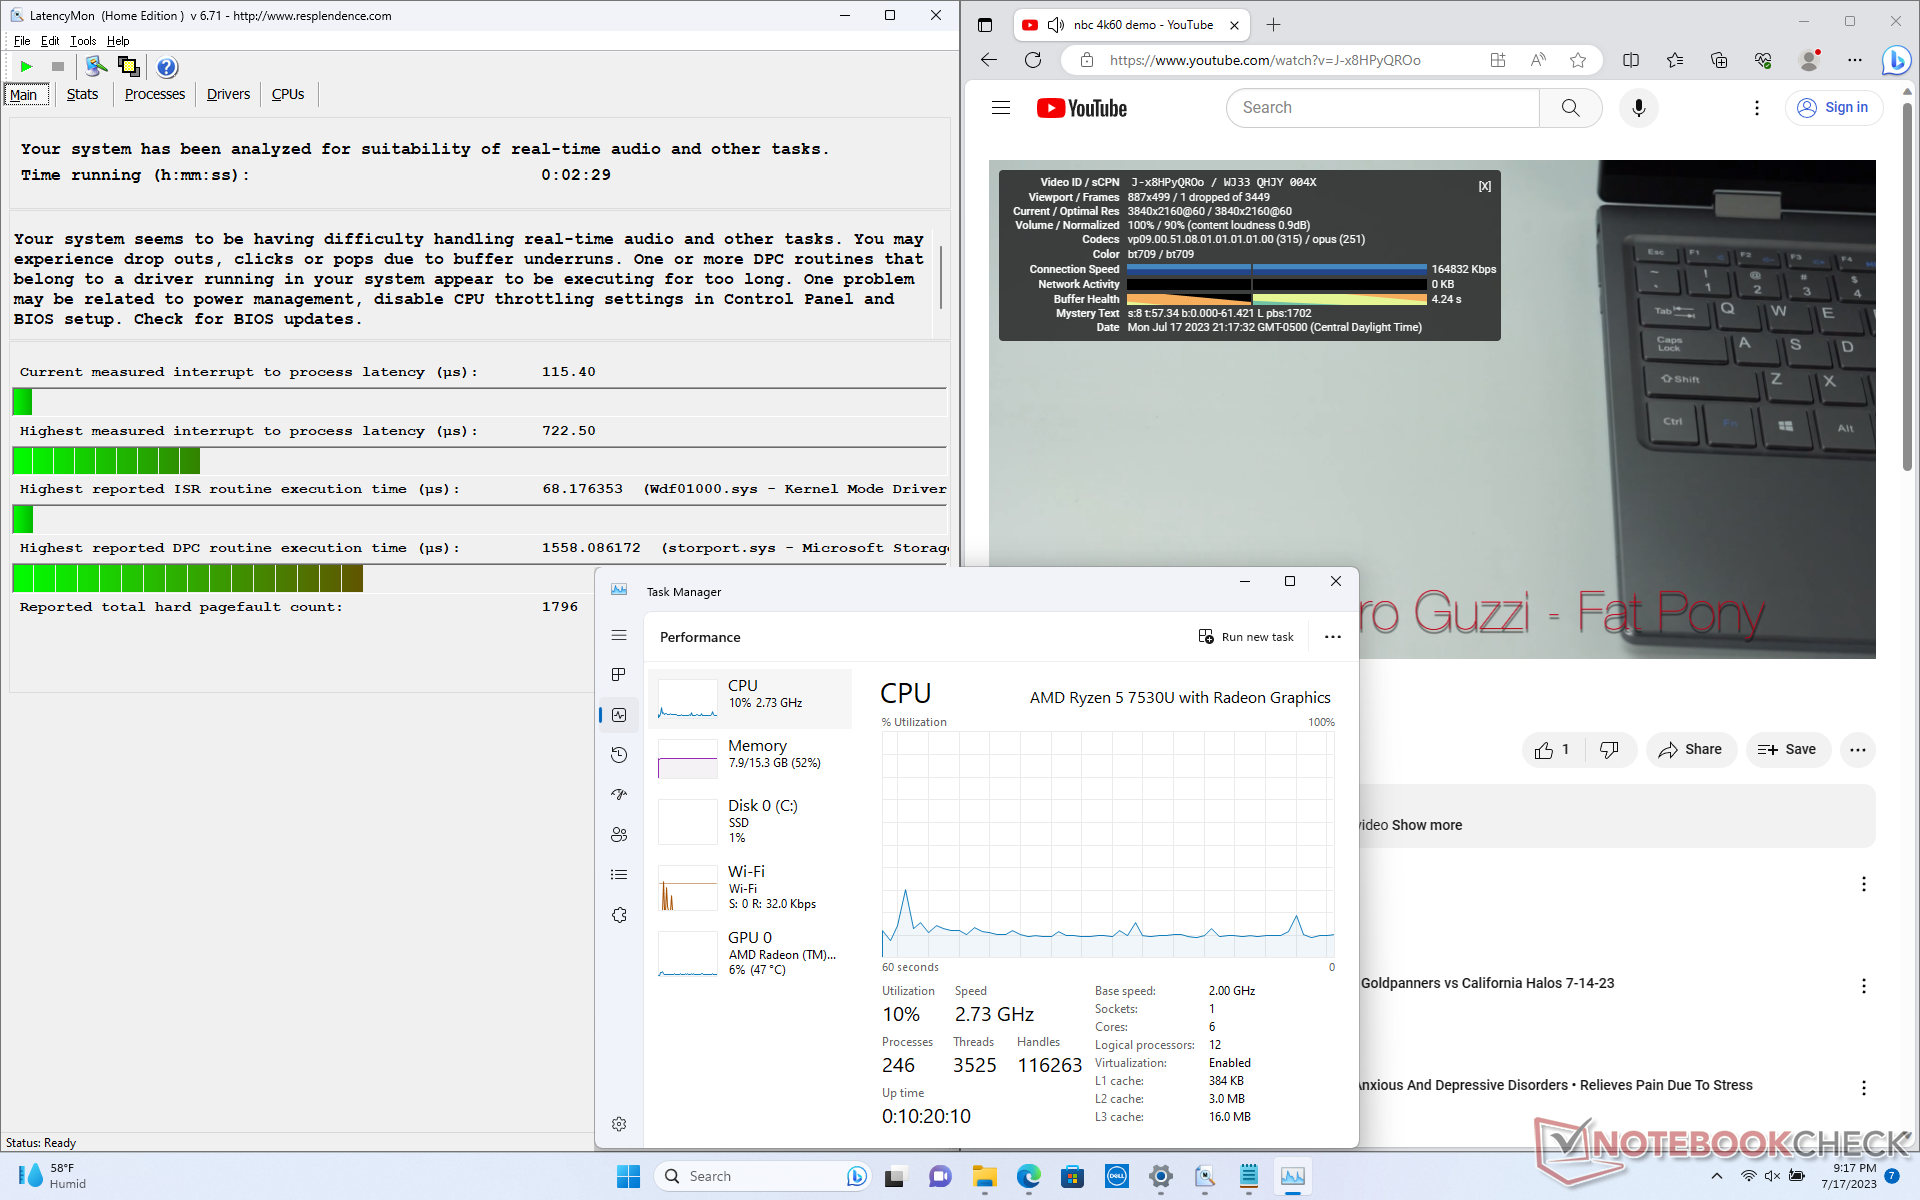
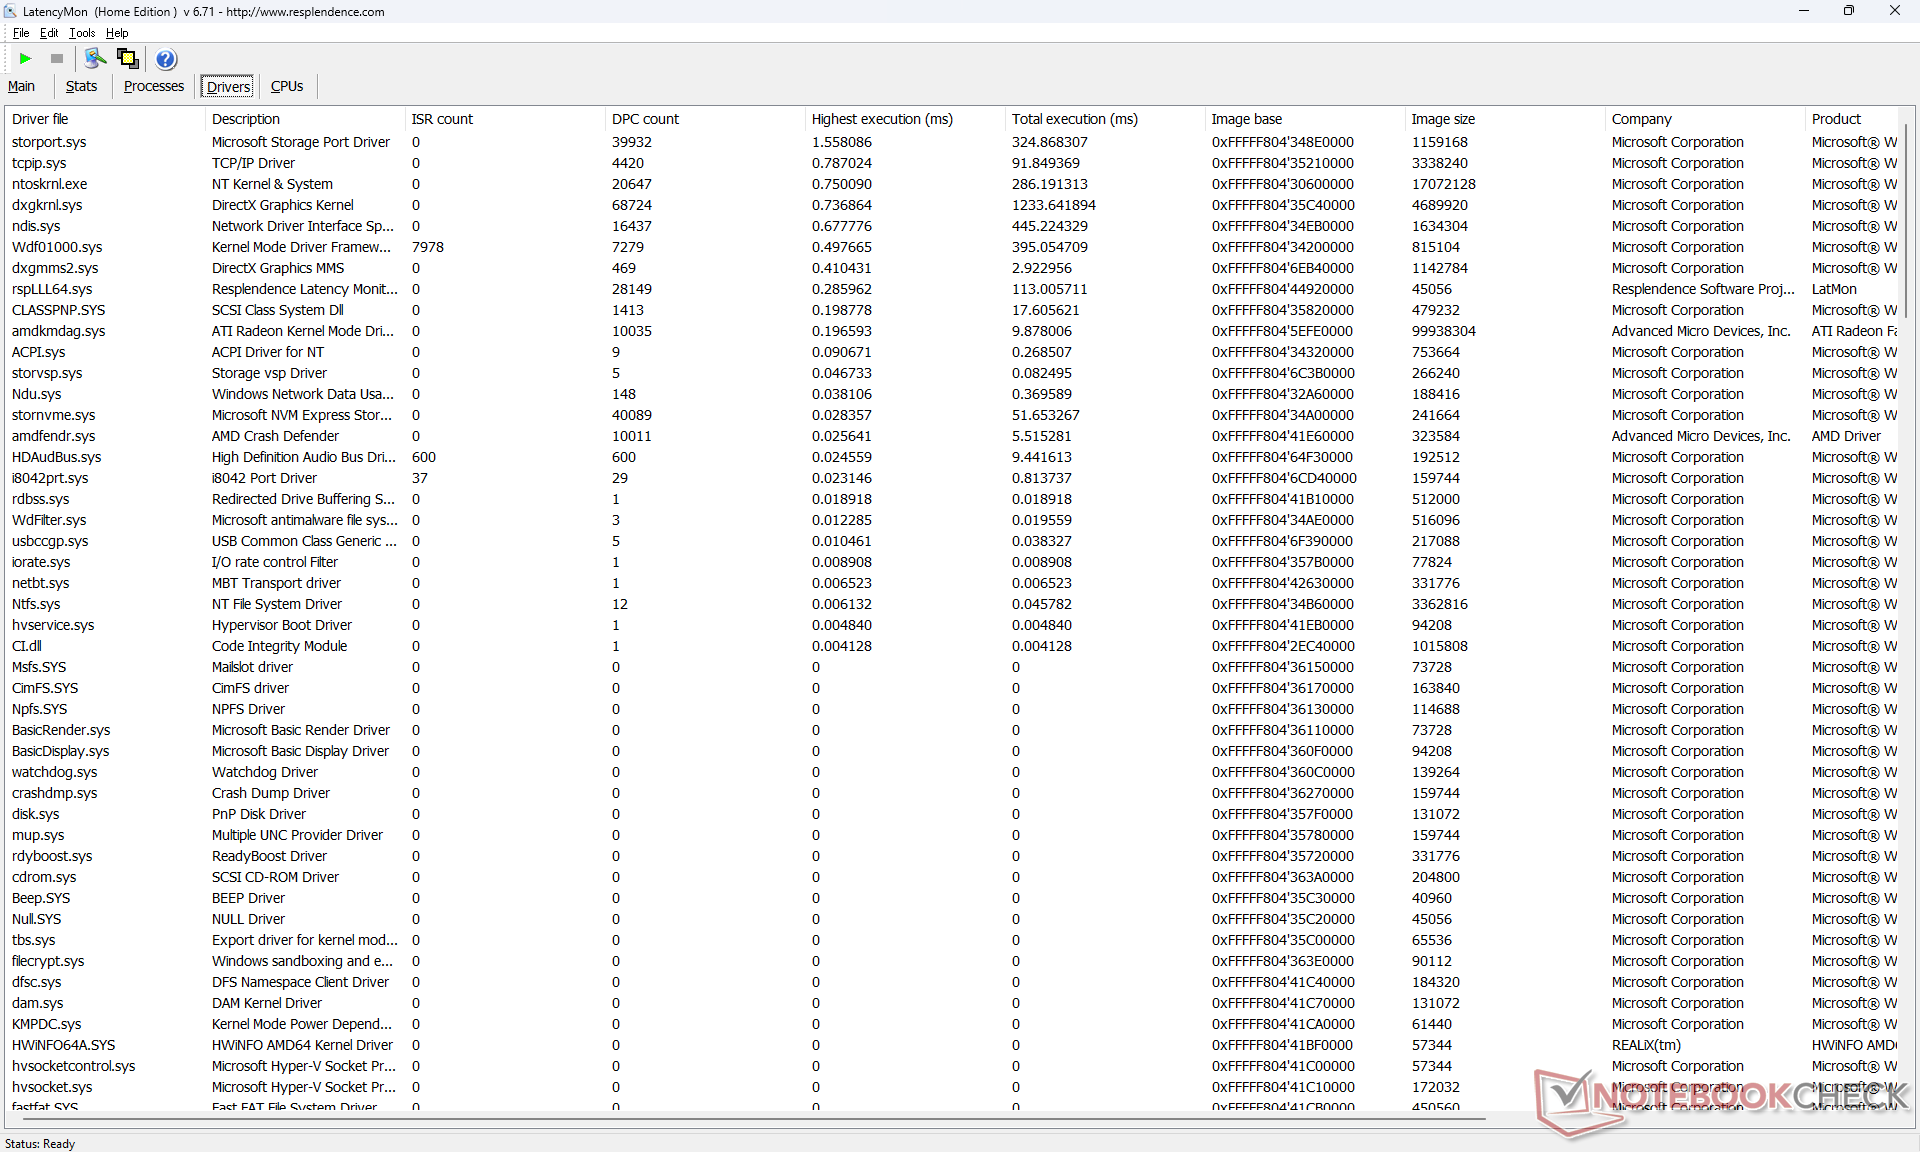
Latence DPC
LatencyMon ne signale que des problèmes mineurs de DPC lors de l'ouverture de plusieurs onglets de notre page d'accueil. la lecture de vidéos 4K à 60 FPS est par ailleurs excellente, avec une seule image perdue enregistrée au cours de notre vidéo de test d'une minute.
| DPC Latencies / LatencyMon - interrupt to process latency (max), Web, Youtube, Prime95 | |
| Acer Swift Edge SFE16-42-R1GM | |
| Lenovo IdeaPad Flex 5 16ABR G8 | |
| Lenovo Yoga 7 16IRL8 | |
| Dell Inspiron 16 7635 2-in-1 | |
| Dell Inspiron 16 7620 2-in-1 | |
| Samsung Galaxy Book3 Pro 16 | |
* ... Moindre est la valeur, meilleures sont les performances
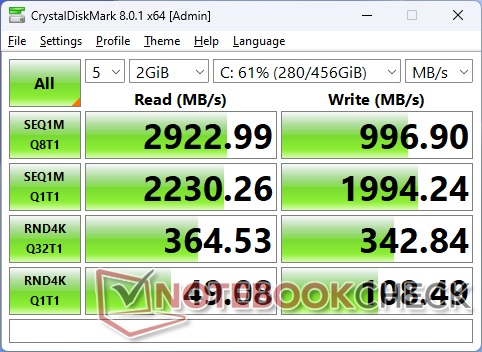
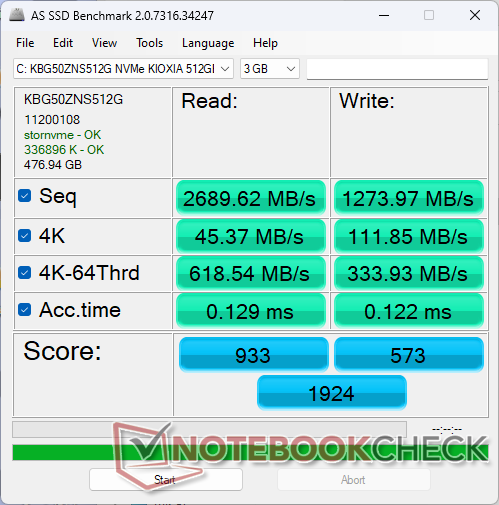
Dispositifs de stockage
Notre appareil de test est livré avec un appareil économique Kioxia KBG50ZNS512G PCIe4 x4 NVMe SSD qui offre des vitesses de lecture et d'écriture séquentielles maximales de 3500 Mo/s et 2700 Mo/s, respectivement, selon le fabricant. Dans nos tests de stress, cependant, nous ne sommes en mesure d'atteindre qu'un peu plus de 2200 Mo/s, même après de multiples re-tests, ce qui suggère que le disque peut avoir des problèmes pour maintenir les taux de transfert maximaux pendant des périodes prolongées. Néanmoins, cela ne pose généralement pas de problème pour la plupart des scénarios multimédias et des charges de travail quotidiennes des navigateurs.

| Drive Performance rating - Percent | |
| Acer Swift Edge SFE16-42-R1GM | |
| Lenovo Yoga 7 16IRL8 | |
| Samsung Galaxy Book3 Pro 16 | |
| Lenovo IdeaPad Flex 5 16ABR G8 | |
| Dell Inspiron 16 7635 2-in-1 | |
| Dell Inspiron 16 7620 2-in-1 | |
* ... Moindre est la valeur, meilleures sont les performances
Disk Throttling: DiskSpd Read Loop, Queue Depth 8
Performance du GPU
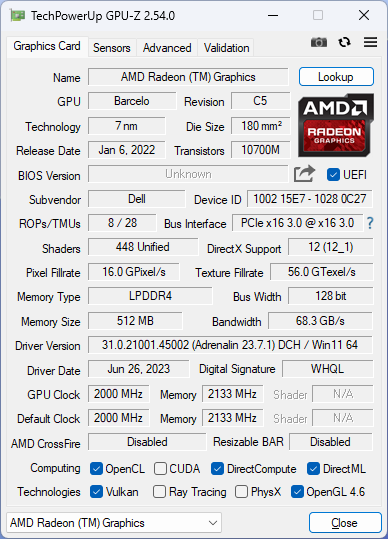
En tant que processeur Zen 3, le Ryzen 5 7530U utilise l'ancien processeur Radeon RX Vega 7 au lieu de la plus récente Radeon 680M ou 780M qui équipent les processeurs Zen 3+ et Zen 4, respectivement. C'est regrettable, car la Radeon 680M aurait permis d'améliorer les performances graphiques de 70 à 80 % et d'être plus rapide que n'importe quelle solution Iris Xe d'Intel. Au lieu de cela, les performances graphiques globales sont inférieures d'environ 25 % à celles de l'Iris Xe 96 EU vieillissante Iris Xe 96 EU. Nous nous attendons à ce que les performances soient encore plus faibles si l'ordinateur est configuré avec seulement 8 Go de mémoire vive soudée.
En passant à la Radeon RX Vega 8 dans la configuration Ryzen 7 7730U la plus haut de gamme devrait améliorer les performances graphiques de 5 %.
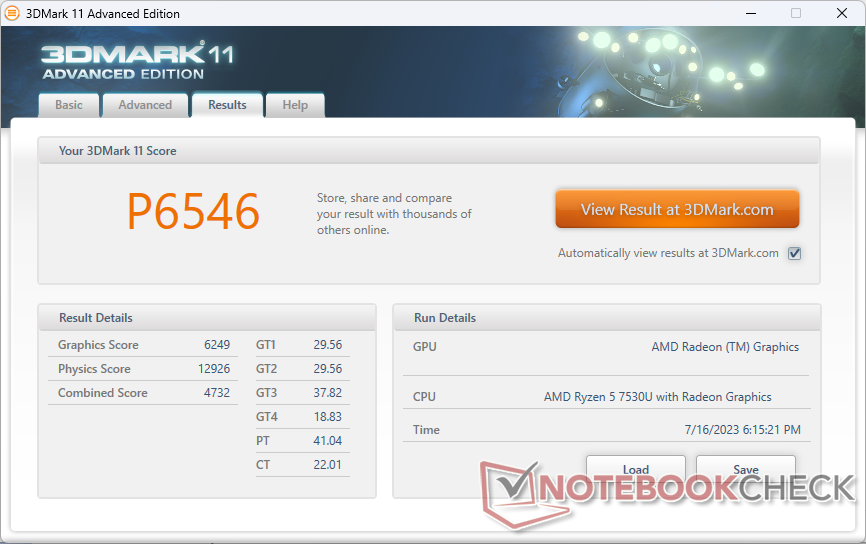
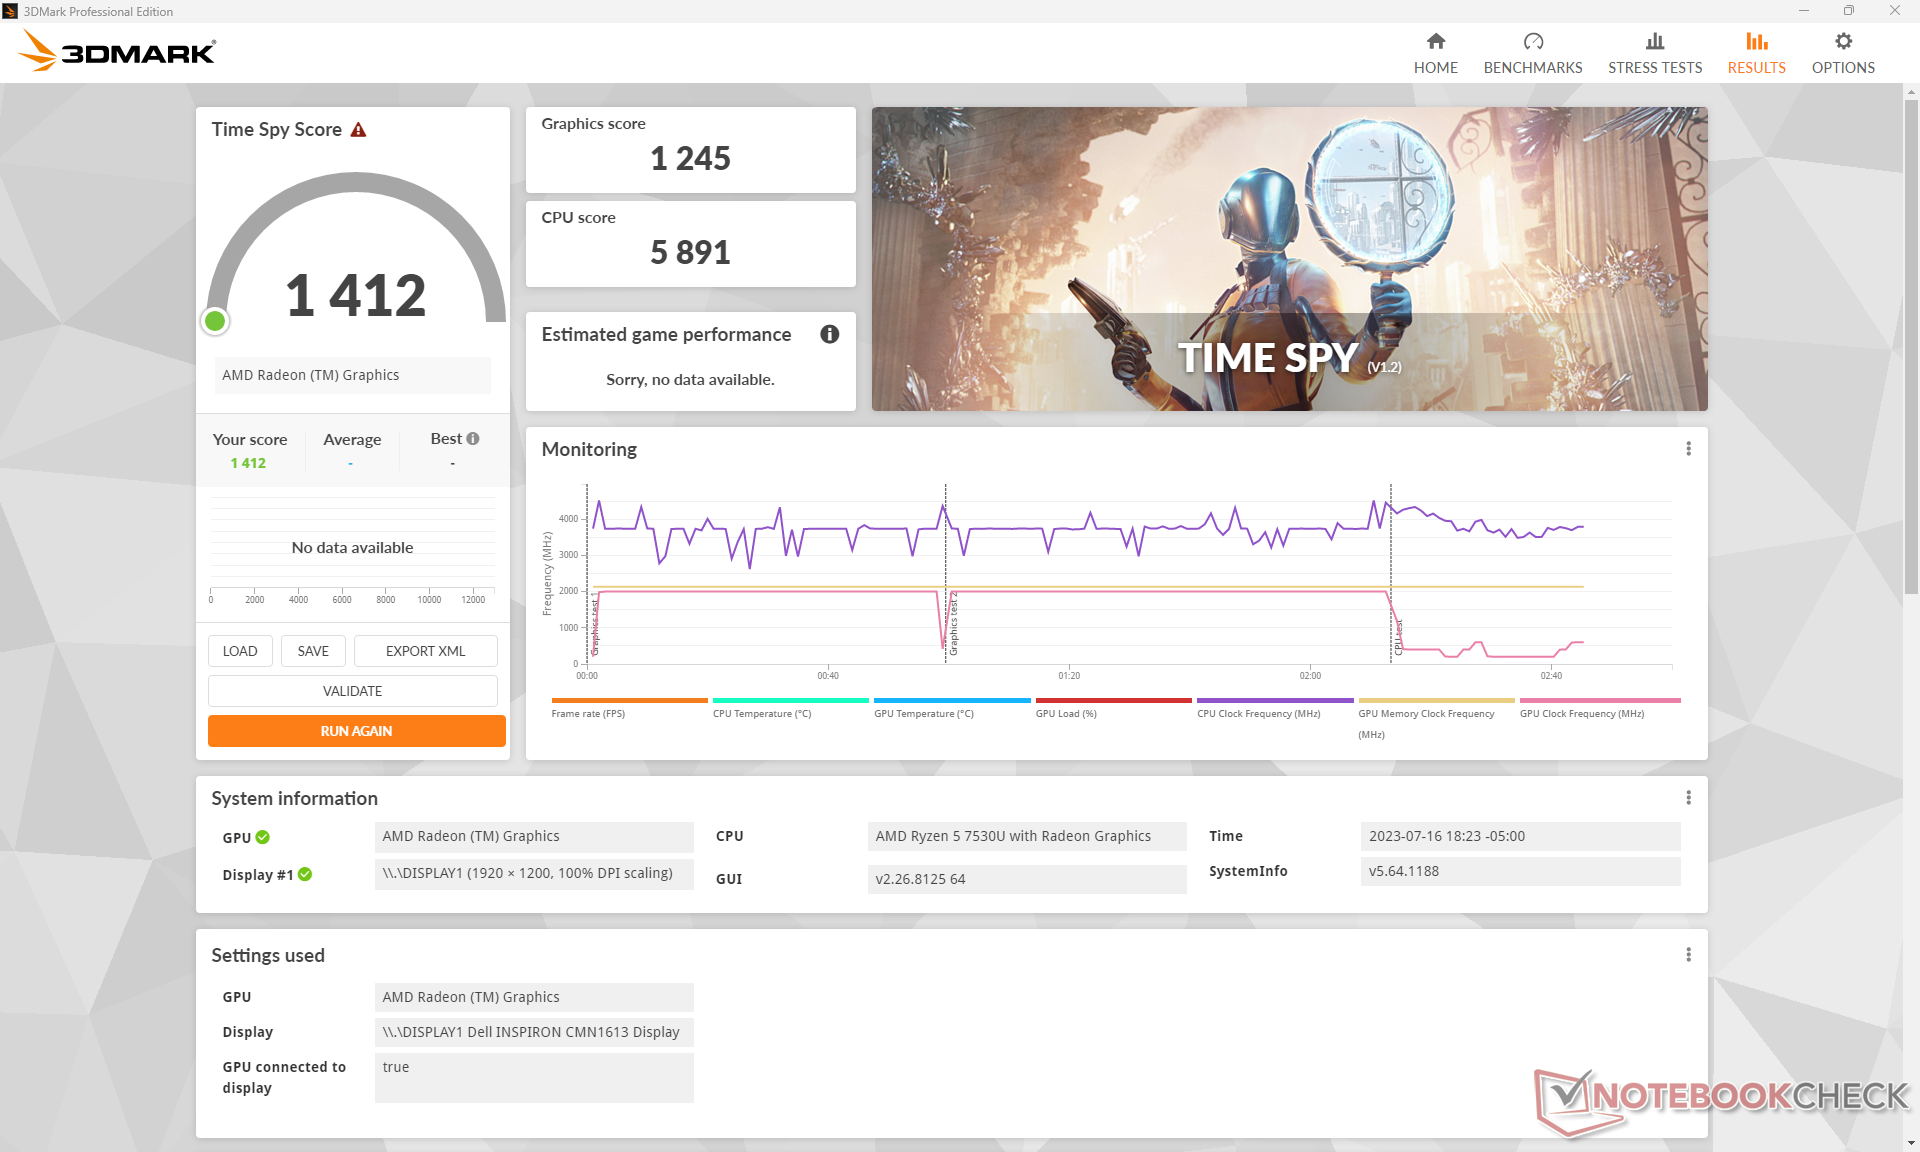
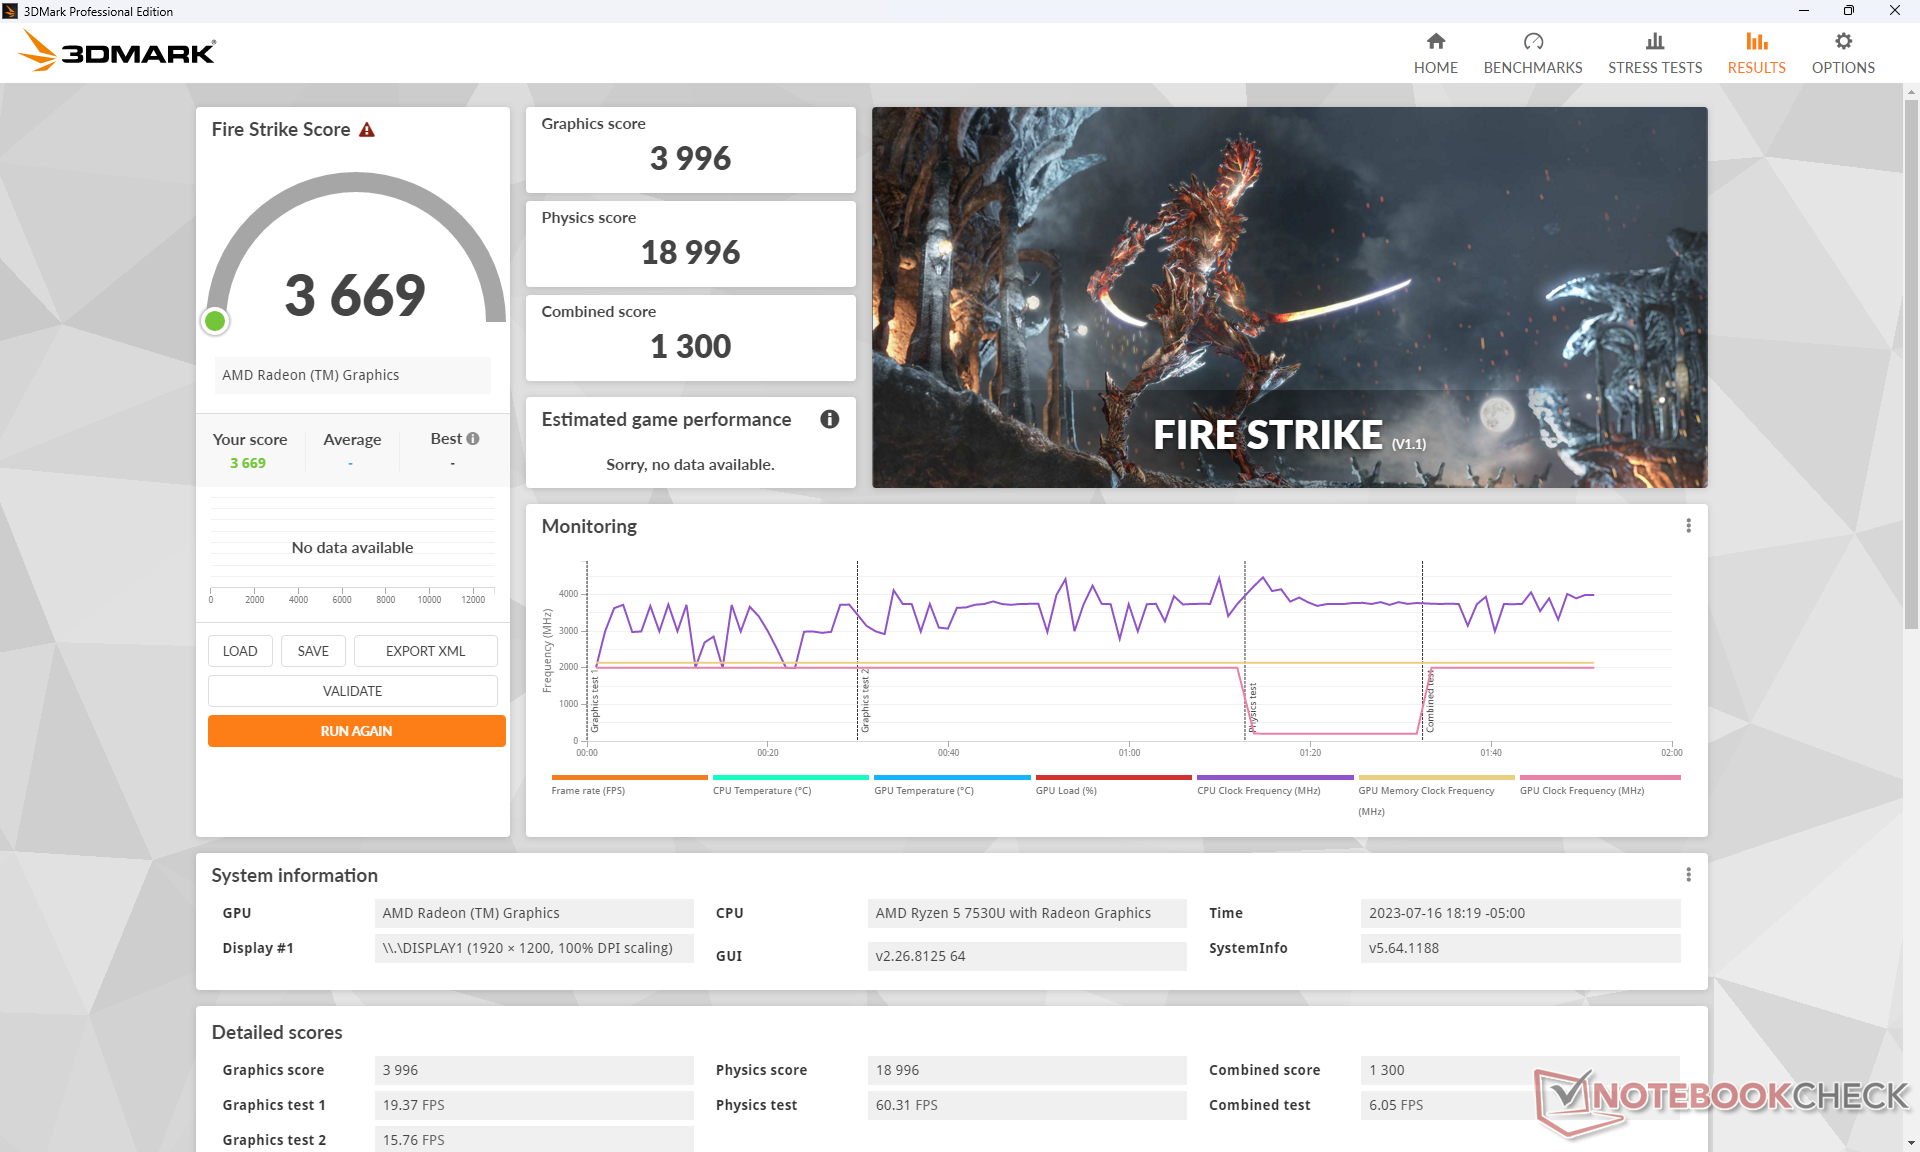
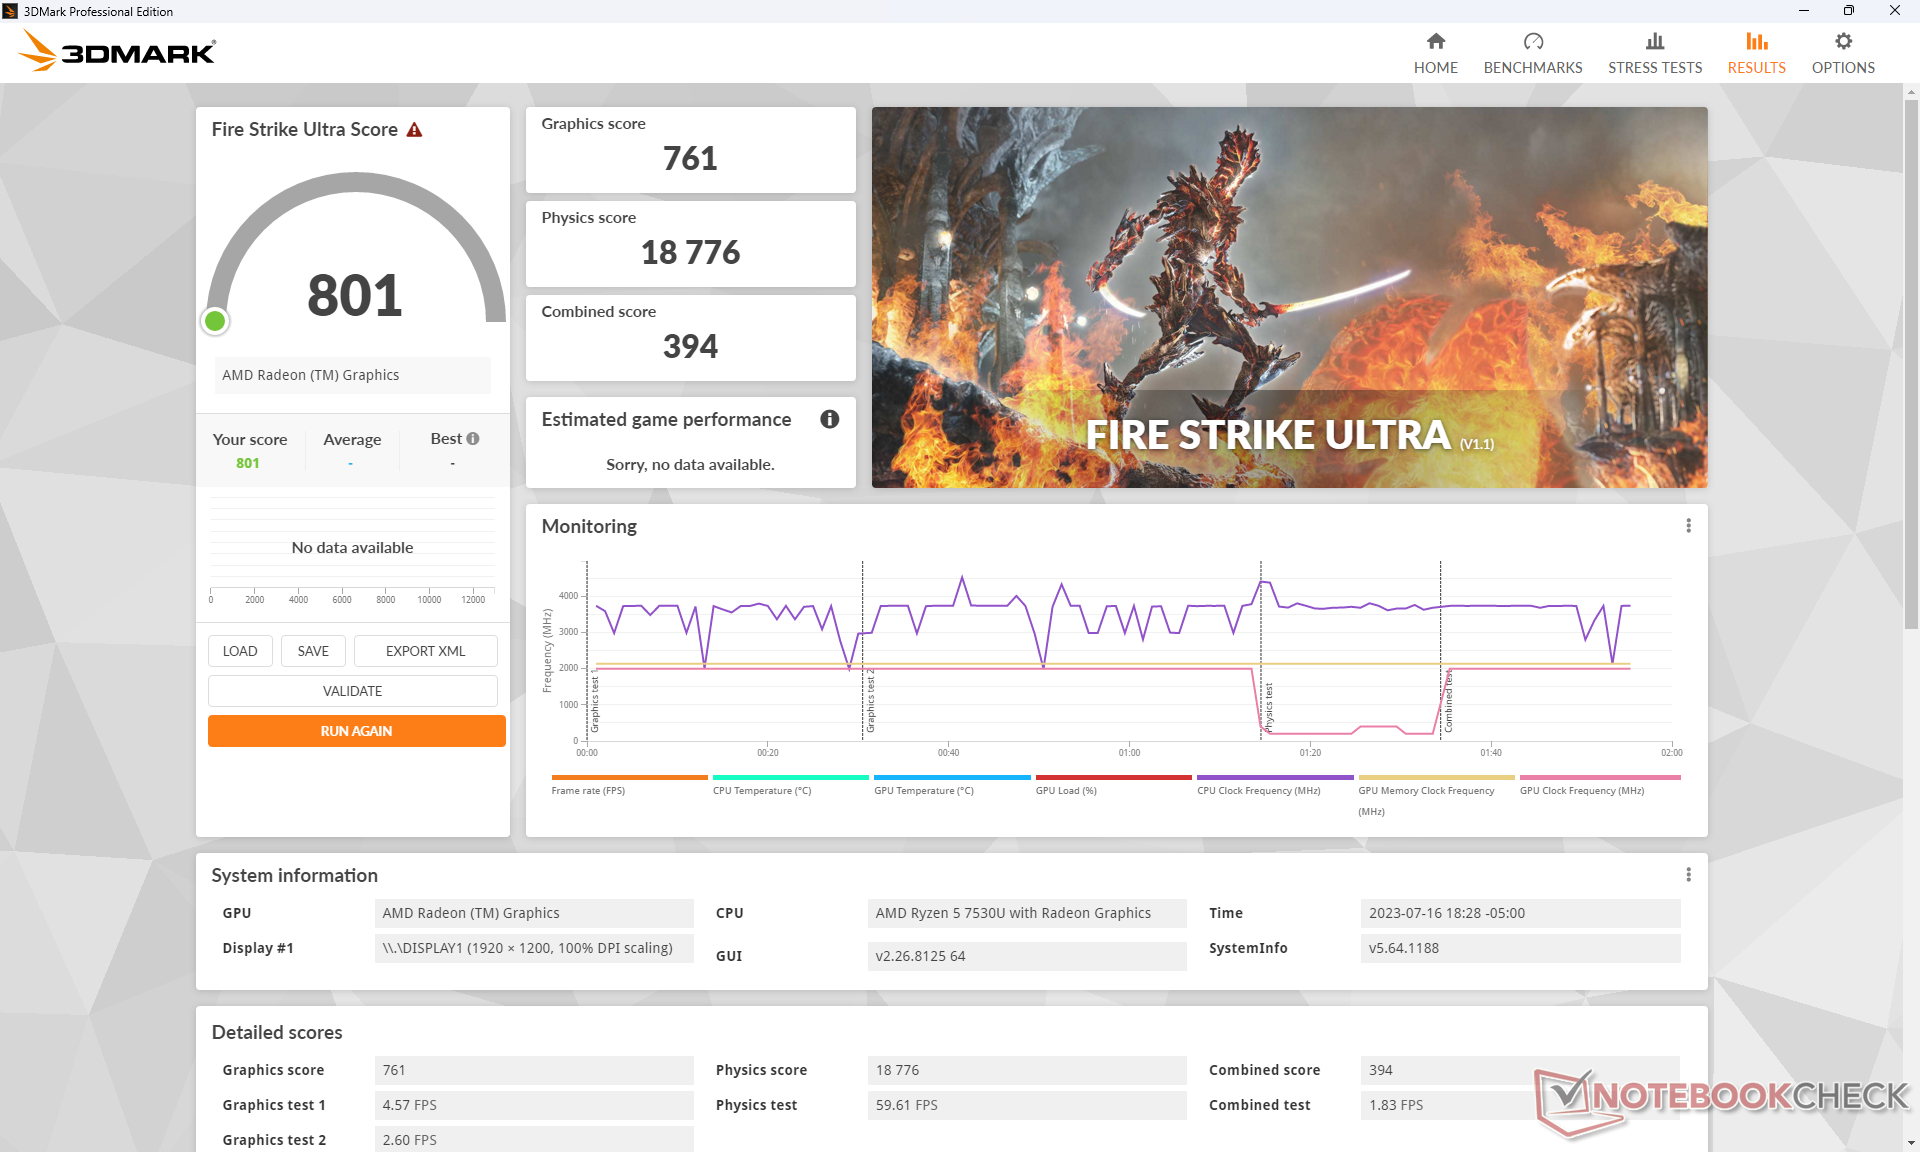
| 3DMark 11 Performance | 6546 points | |
| 3DMark Fire Strike Score | 3669 points | |
| 3DMark Time Spy Score | 1412 points | |
Aide | ||
* ... Moindre est la valeur, meilleures sont les performances
| Returnal | |
| 1280x720 Low Preset | |
| Beelink GTR7 7840HS | |
| Dell Inspiron 16 7635 2-in-1 | |
| Moyenne AMD Radeon RX Vega 7 (18 - 18, n=2) | |
| 1920x1080 Low Preset | |
| Beelink GTR7 7840HS | |
| Dell Inspiron 16 7635 2-in-1 | |
| Moyenne AMD Radeon RX Vega 7 (12 - 13, n=2) | |
| 1920x1080 Medium Preset | |
| Beelink GTR7 7840HS | |
| Dell Inspiron 16 7635 2-in-1 | |
| Moyenne AMD Radeon RX Vega 7 (11 - 12, n=2) | |
Les taux de rafraîchissement au ralenti sur Witcher 3 diminuait occasionnellement mais régulièrement de près de 15 images par seconde pendant de courtes périodes avant de revenir à la normale. Ce comportement est défavorable car il suggère des problèmes de pilote graphique ou une interruption de l'activité en arrière-plan au niveau du système d'exploitation.
Witcher 3 FPS Chart
| Bas | Moyen | Élevé | Ultra | |
|---|---|---|---|---|
| GTA V (2015) | 24.1 | 9.55 | ||
| The Witcher 3 (2015) | 79.6 | 24.5 | 15.7 | |
| Dota 2 Reborn (2015) | 109 | 90.7 | 55.4 | 52.4 |
| Final Fantasy XV Benchmark (2018) | 37.5 | 18.8 | 12.9 | |
| X-Plane 11.11 (2018) | 38.4 | 30.4 | 26.3 | |
| Strange Brigade (2018) | 86.8 | 33.8 | 28.1 | 23.2 |
| Cyberpunk 2077 1.6 (2022) | 20.3 | 15.3 | 10.5 | 8.5 |
| Tiny Tina's Wonderlands (2022) | 28.8 | 21.2 | 12.9 | 9.2 |
| F1 22 (2022) | 36.2 | 32.3 | 23.9 | 17.1 |
| Returnal (2023) | 13 | 12 |
Émissions
Bruit du système
Le ventilateur est généralement silencieux lors de faibles charges comme la navigation ou le streaming vidéo, où il tend à se situer dans la plage des 27 dB(A) contre un arrière-plan silencieux de 23,6 dB(A). Cependant, lors de charges plus lourdes comme 3DMark 06, le bruit du ventilateur grimpe rapidement à un peu plus de 40 dB(A), même avec le profil d'alimentation équilibré. Nous avons enregistré un bruit de ventilateur maximum d'un peu plus de 44 dB(A) lors de l'exécution de charges élevées comme les jeux, ce qui est encore plus bruyant que ce que nous avons enregistré sur l'ancien modèle de lInspiron 16 7620 2-en-1.
Degré de la nuisance sonore
| Au repos |
| 23.6 / 23.6 / 23.6 dB(A) |
| Fortement sollicité |
| 40.3 / 44.2 dB(A) |
 | ||
30 dB silencieux 40 dB(A) audible 50 dB(A) bruyant |
||
min: | ||
| Dell Inspiron 16 7635 2-in-1 Vega 7, R5 7530U, Kioxia BG5 KBG50ZNS512G | Acer Swift Edge SFE16-42-R1GM Radeon 680M, R7 7735U, Micron 3400 1TB MTFDKBA1T0TFH | Lenovo Yoga 7 16IRL8 Iris Xe G7 96EUs, i7-1355U, WD PC SN740 512GB SDDPMQD-512G-1101 | Samsung Galaxy Book3 Pro 16 Iris Xe G7 80EUs, i5-1340P, WD PC SN740 256GB SDDPNQD-256G | Lenovo IdeaPad Flex 5 16ABR G8 Vega 8, R7 7730U, Samsung PM9B1 1024GB MZAL41T0HBLB | Dell Inspiron 16 7620 2-in-1 Iris Xe G7 96EUs, i7-1260P, Toshiba KBG40ZNS512G NVMe | |
|---|---|---|---|---|---|---|
| Noise | -10% | -0% | -11% | -0% | 8% | |
| arrêt / environnement * (dB) | 23.6 | 25.7 -9% | 22.8 3% | 25.2 -7% | 24.2 -3% | 23.2 2% |
| Idle Minimum * (dB) | 23.6 | 25.7 -9% | 22.9 3% | 25.2 -7% | 24.2 -3% | 23.5 -0% |
| Idle Average * (dB) | 23.6 | 27 -14% | 22.9 3% | 25.2 -7% | 24.2 -3% | 23.5 -0% |
| Idle Maximum * (dB) | 23.6 | 29.3 -24% | 26.9 -14% | 29.3 -24% | 28.7 -22% | 23.5 -0% |
| Load Average * (dB) | 40.3 | 42.3 -5% | 41.7 -3% | 46.4 -15% | 33.1 18% | 29.4 27% |
| Witcher 3 ultra * (dB) | 44.2 | 41.5 6% | 41.8 5% | 35.6 19% | ||
| Load Maximum * (dB) | 44.2 | 42.7 3% | 43.6 1% | 46.4 -5% | 41.8 5% | 39.7 10% |
* ... Moindre est la valeur, meilleures sont les performances
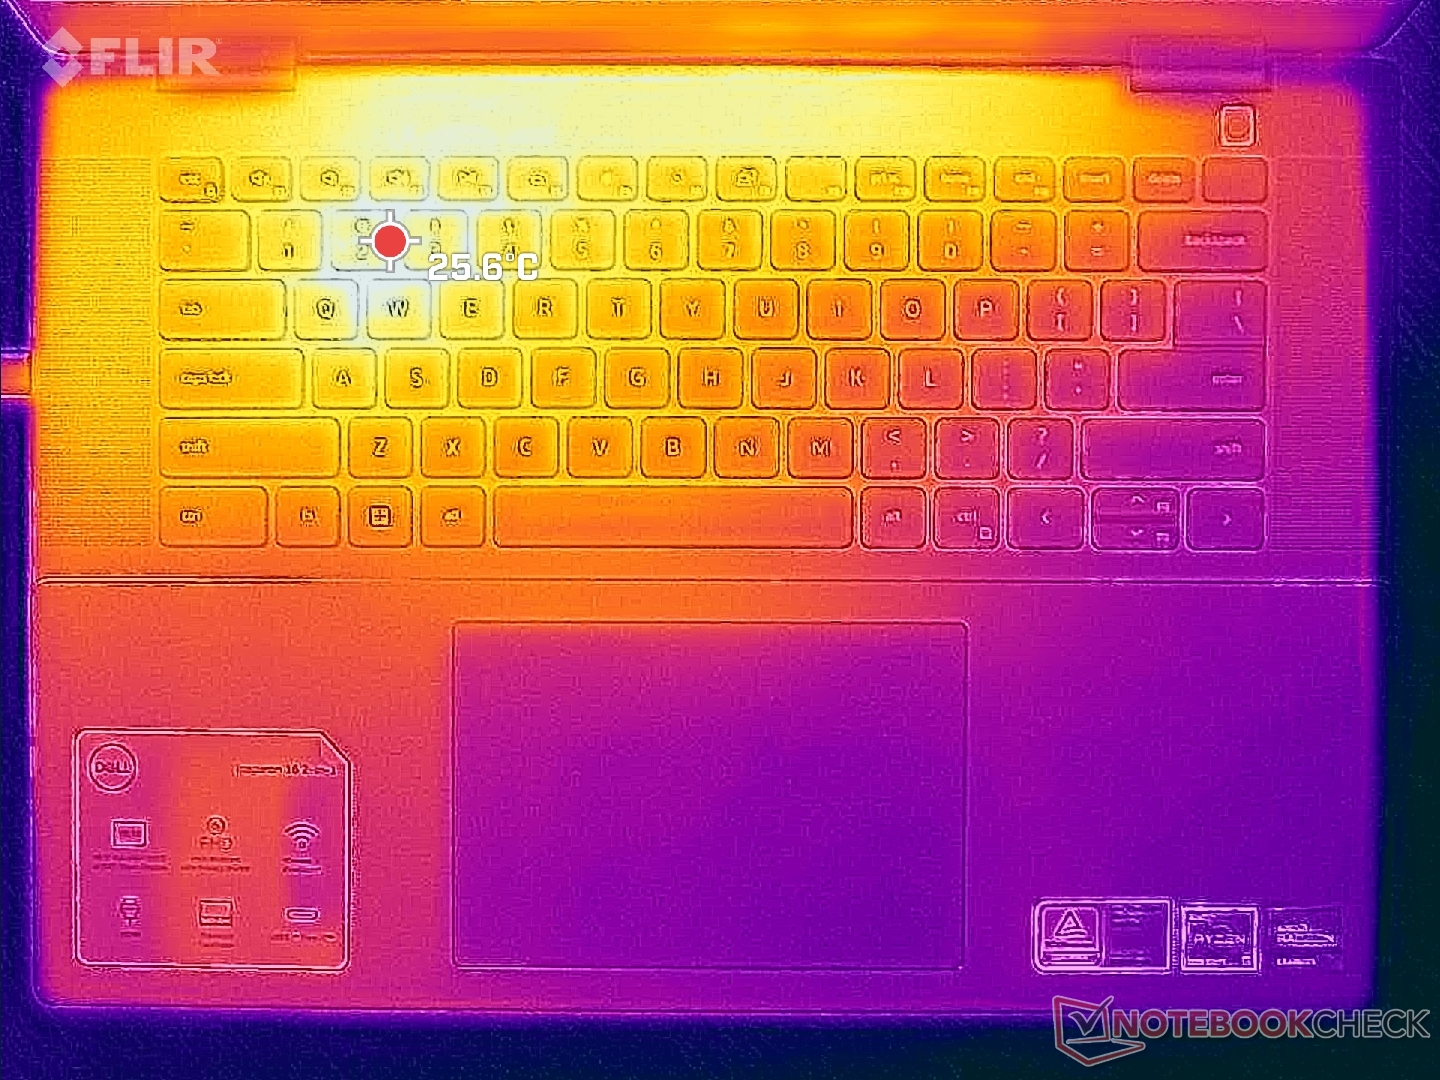
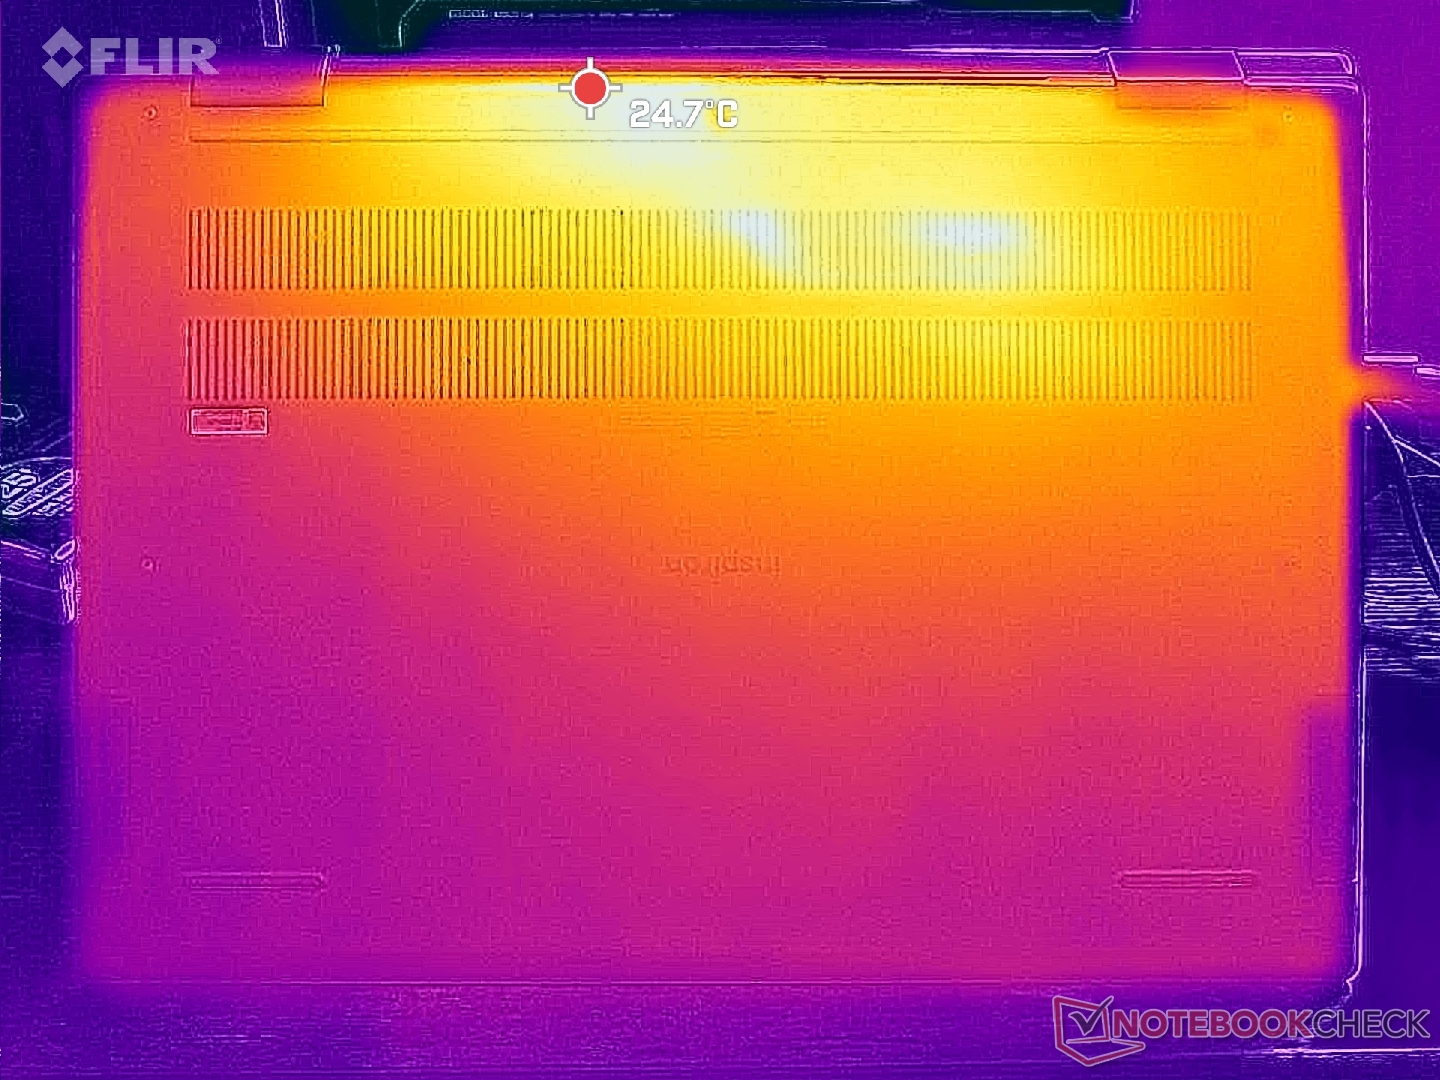
Température
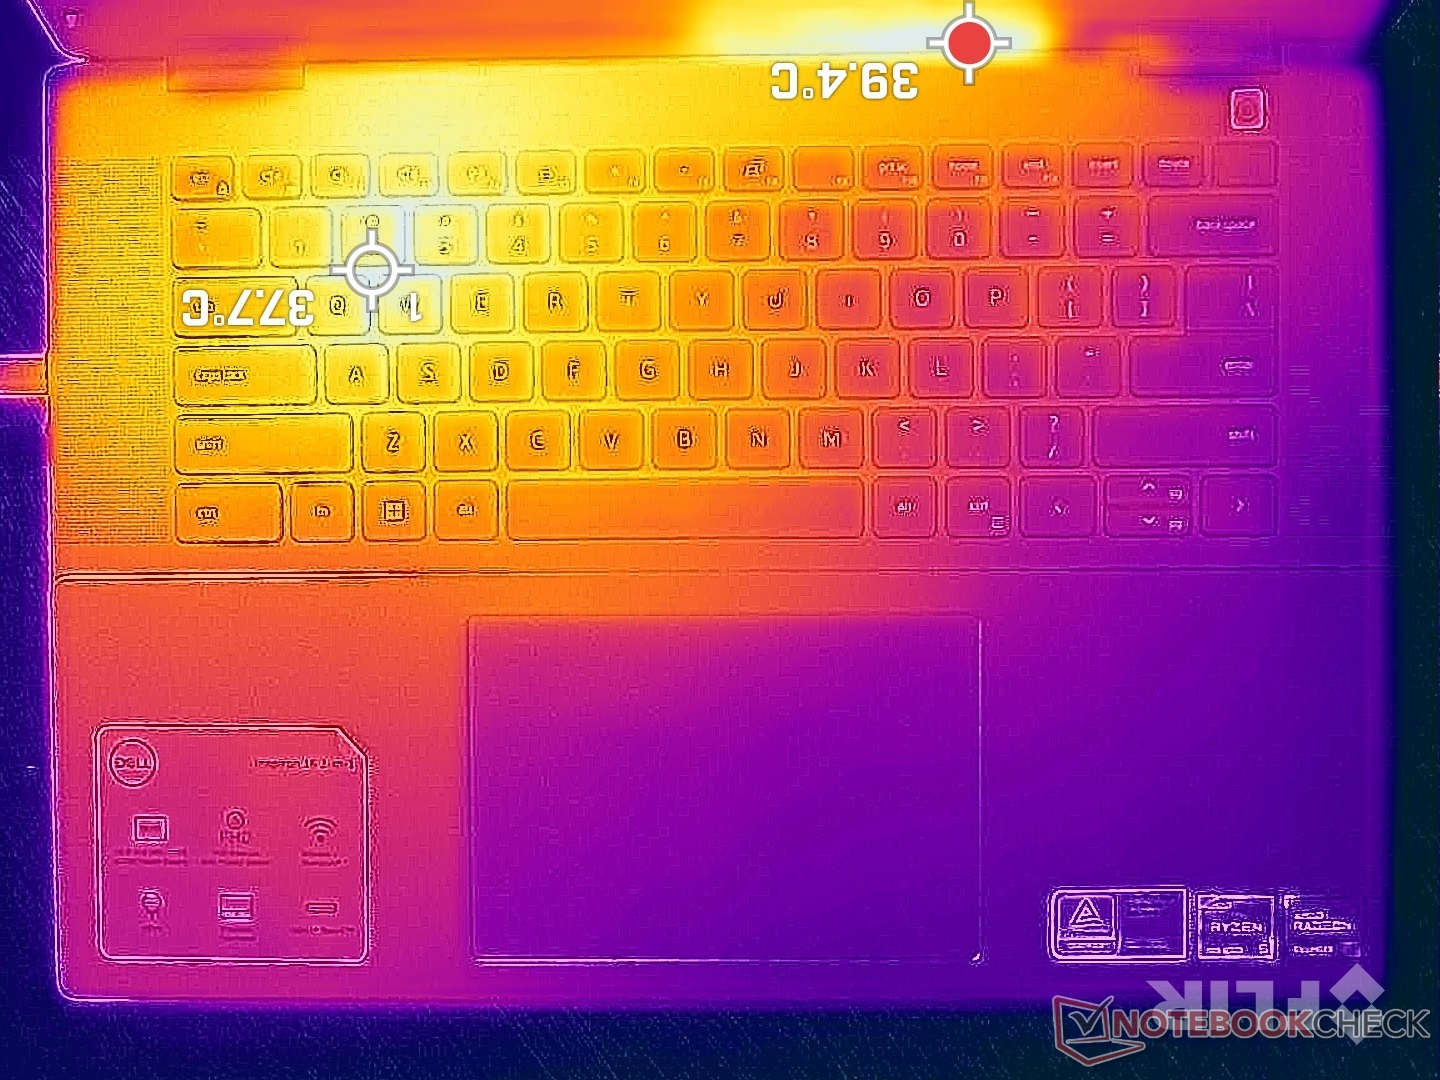
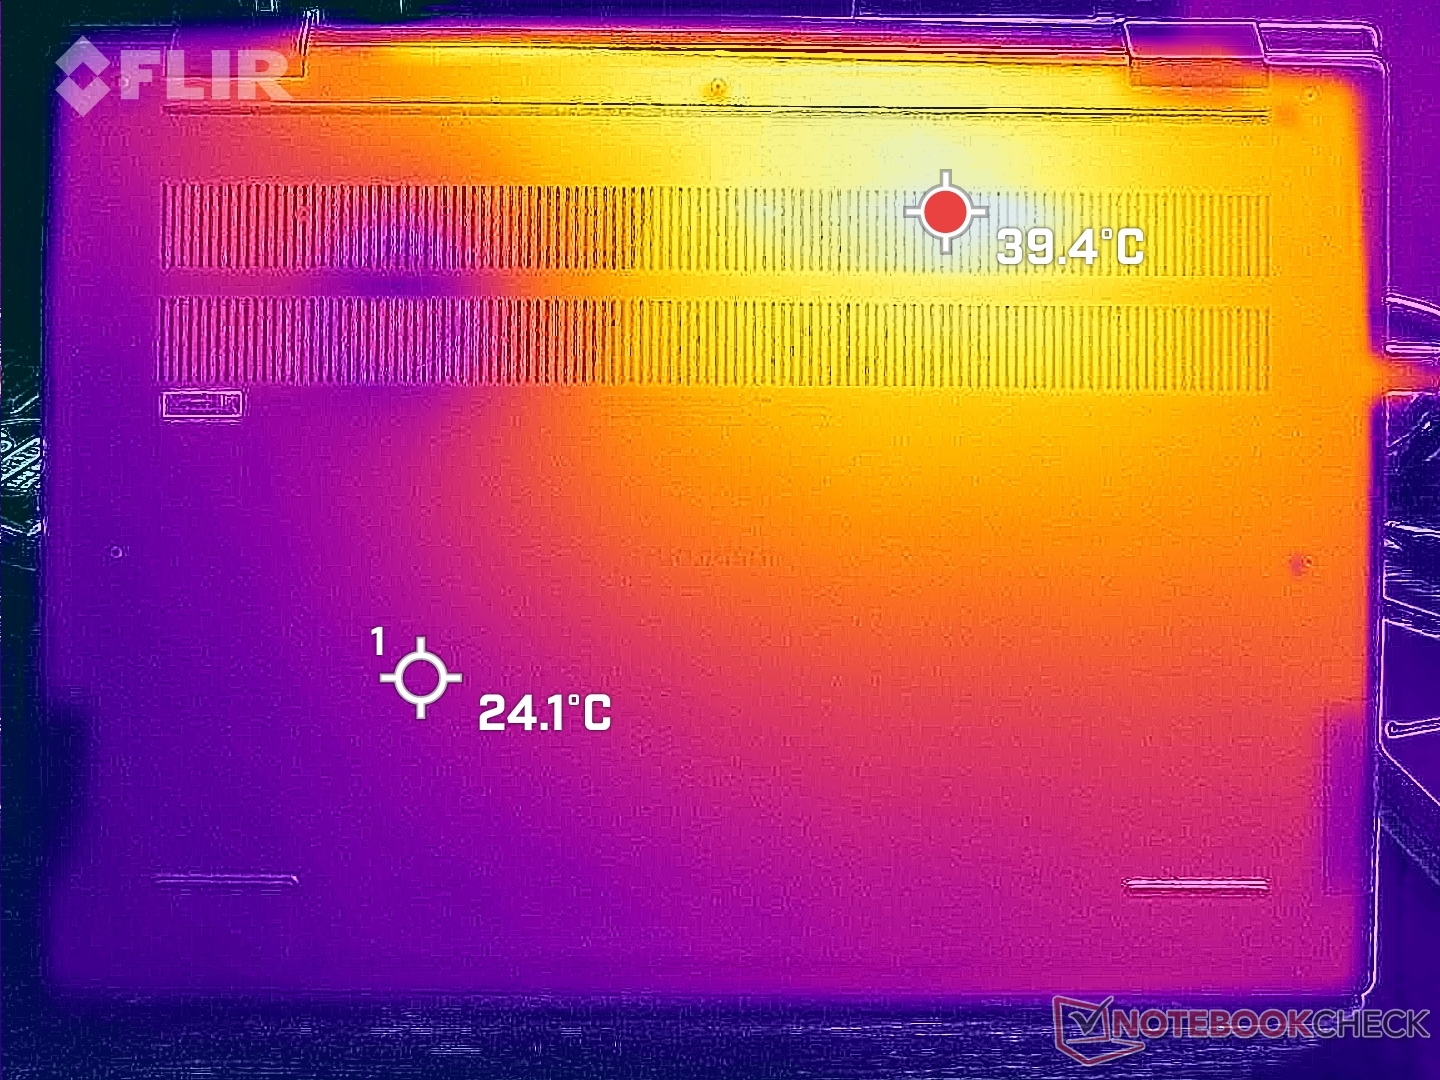
Les températures de surface sont les plus élevées sur la moitié gauche du clavier plutôt qu'au centre, car le positionnement du processeur a changé par rapport à la conception de l'année dernière. Les points chauds peuvent atteindre un peu plus de 40°C sur les surfaces supérieure et inférieure, ce qui est nettement moins chaud que sur l'IdeaPad Flex 5 de 16 ans.IdeaPad Flex 5 16 ou l'ancien Inspiron 16 7620 2-en-1 où les températures de surface peuvent atteindre près de 50°C en charge. Le bruit généralement plus fort du ventilateur de l'Inspiron 16 7635 2-en-1 peut être en partie responsable de ses températures de surface plus basses.
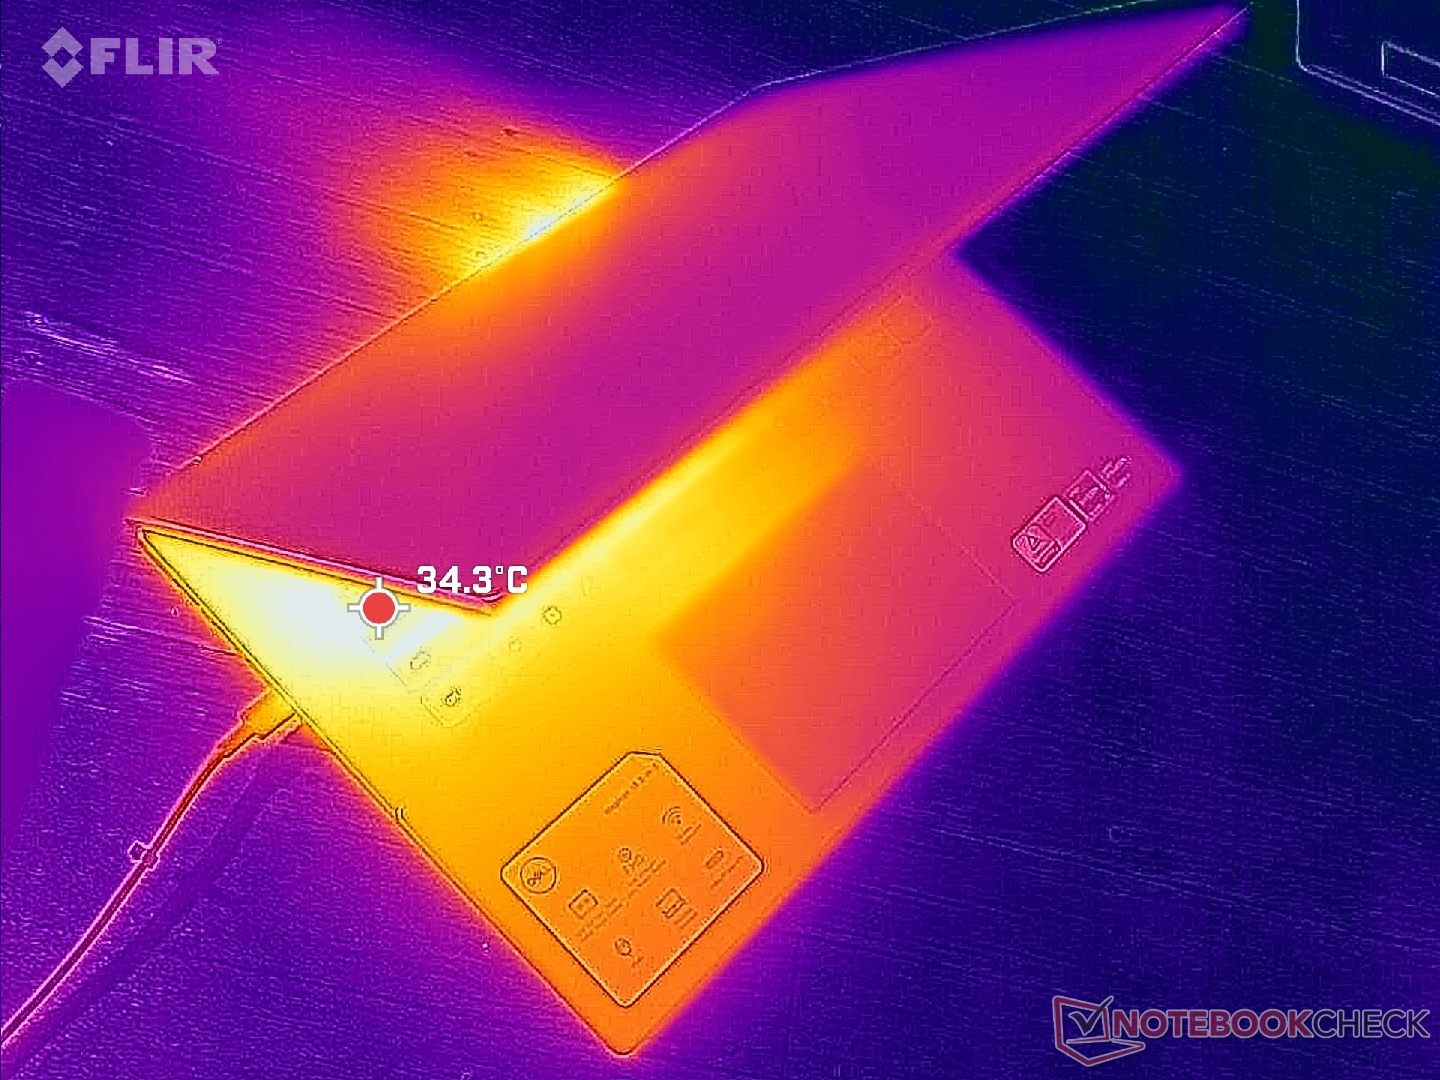
(±) La température maximale du côté supérieur est de 41.6 °C / 107 F, par rapport à la moyenne de 35.4 °C / 96 F, allant de 19.6 à 60 °C pour la classe Convertible.
(+) Le fond chauffe jusqu'à un maximum de 39 °C / 102 F, contre une moyenne de 36.9 °C / 98 F
(+) En utilisation inactive, la température moyenne du côté supérieur est de 25.8 °C / 78 F, par rapport à la moyenne du dispositif de 30.3 °C / 87 F.
(+) Les repose-poignets et le pavé tactile sont plus froids que la température de la peau avec un maximum de 31.4 °C / 88.5 F et sont donc froids au toucher.
(-) La température moyenne de la zone de l'appui-paume de dispositifs similaires était de 28 °C / 82.4 F (-3.4 °C / #-6.1 F).
| Dell Inspiron 16 7635 2-in-1 AMD Ryzen 5 7530U, AMD Radeon RX Vega 7 | Acer Swift Edge SFE16-42-R1GM AMD Ryzen 7 7735U, AMD Radeon 680M | Lenovo Yoga 7 16IRL8 Intel Core i7-1355U, Intel Iris Xe Graphics G7 96EUs | Samsung Galaxy Book3 Pro 16 Intel Core i5-1340P, Intel Iris Xe Graphics G7 80EUs | Lenovo IdeaPad Flex 5 16ABR G8 AMD Ryzen 7 7730U, AMD Radeon RX Vega 8 (Ryzen 4000/5000) | Dell Inspiron 16 7620 2-in-1 Intel Core i7-1260P, Intel Iris Xe Graphics G7 96EUs | |
|---|---|---|---|---|---|---|
| Heat | -15% | -1% | -9% | -5% | -13% | |
| Maximum Upper Side * (°C) | 41.6 | 49.4 -19% | 37.6 10% | 41.6 -0% | 51.4 -24% | 42.2 -1% |
| Maximum Bottom * (°C) | 39 | 44.7 -15% | 40 -3% | 45 -15% | 47.8 -23% | 47.4 -22% |
| Idle Upper Side * (°C) | 29.4 | 34 -16% | 30.4 -3% | 31 -5% | 24.8 16% | 32.2 -10% |
| Idle Bottom * (°C) | 28.6 | 31.6 -10% | 30.6 -7% | 33.6 -17% | 24.9 13% | 33.6 -17% |
* ... Moindre est la valeur, meilleures sont les performances
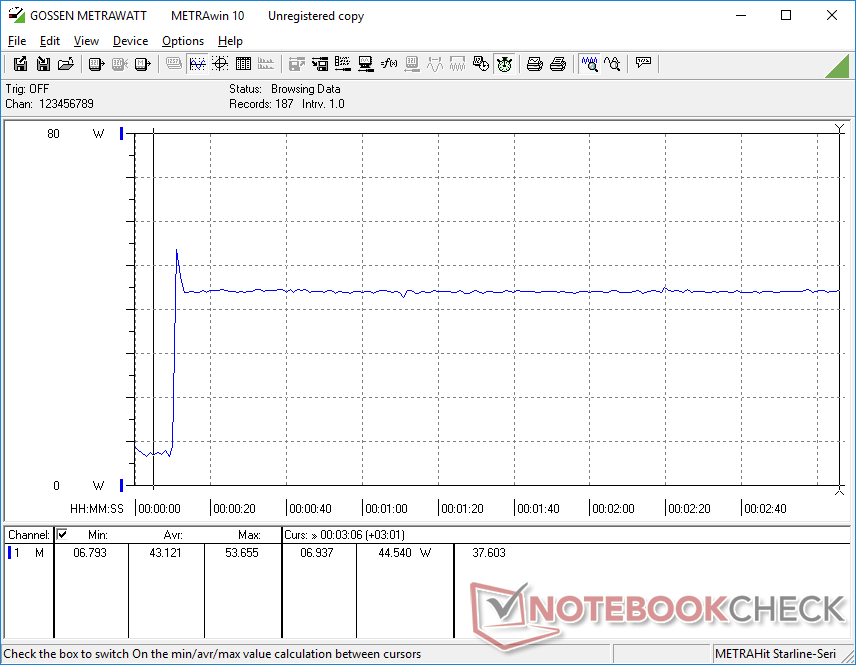
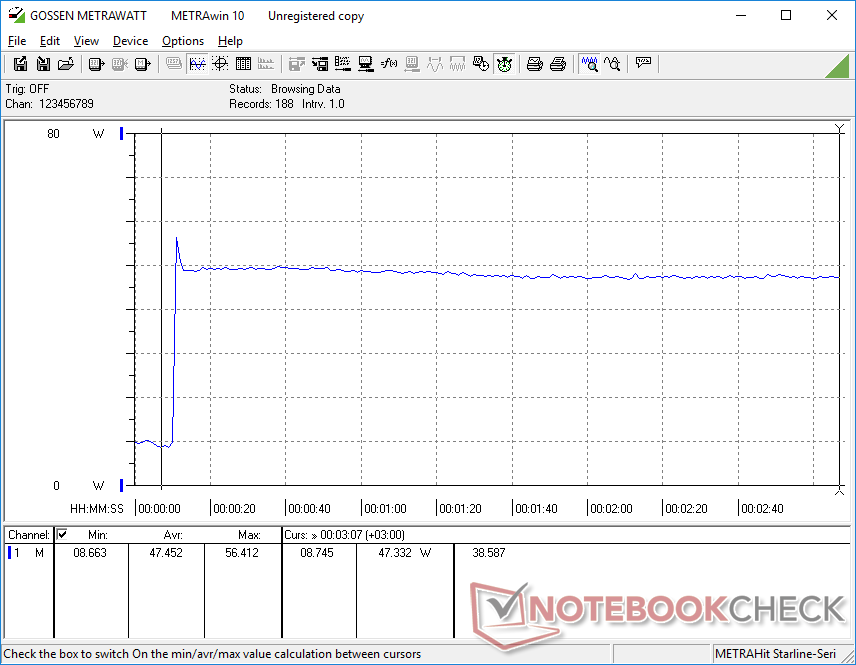
Test de stress
Les fréquences d'horloge du processeur, la consommation d'énergie de la carte et la température lors de l'exécution de Prime95 atteignaient respectivement 3,4 GHz, 35 W et 81 C. Le processeur s'est finalement stabilisé à 3 GHz, 28 W et 90 C après environ une minute, contre 81 C sur l'Inspiron 16 7620 2-en-1 de l'année dernière, alimenté par Intel.
L'utilisation de la batterie réduit légèrement les performances. Un test 3DMark 11 sur batterie donne des scores physiques et graphiques de 12497 et 5935 points, respectivement, contre 12926 et 6249 points sur secteur.
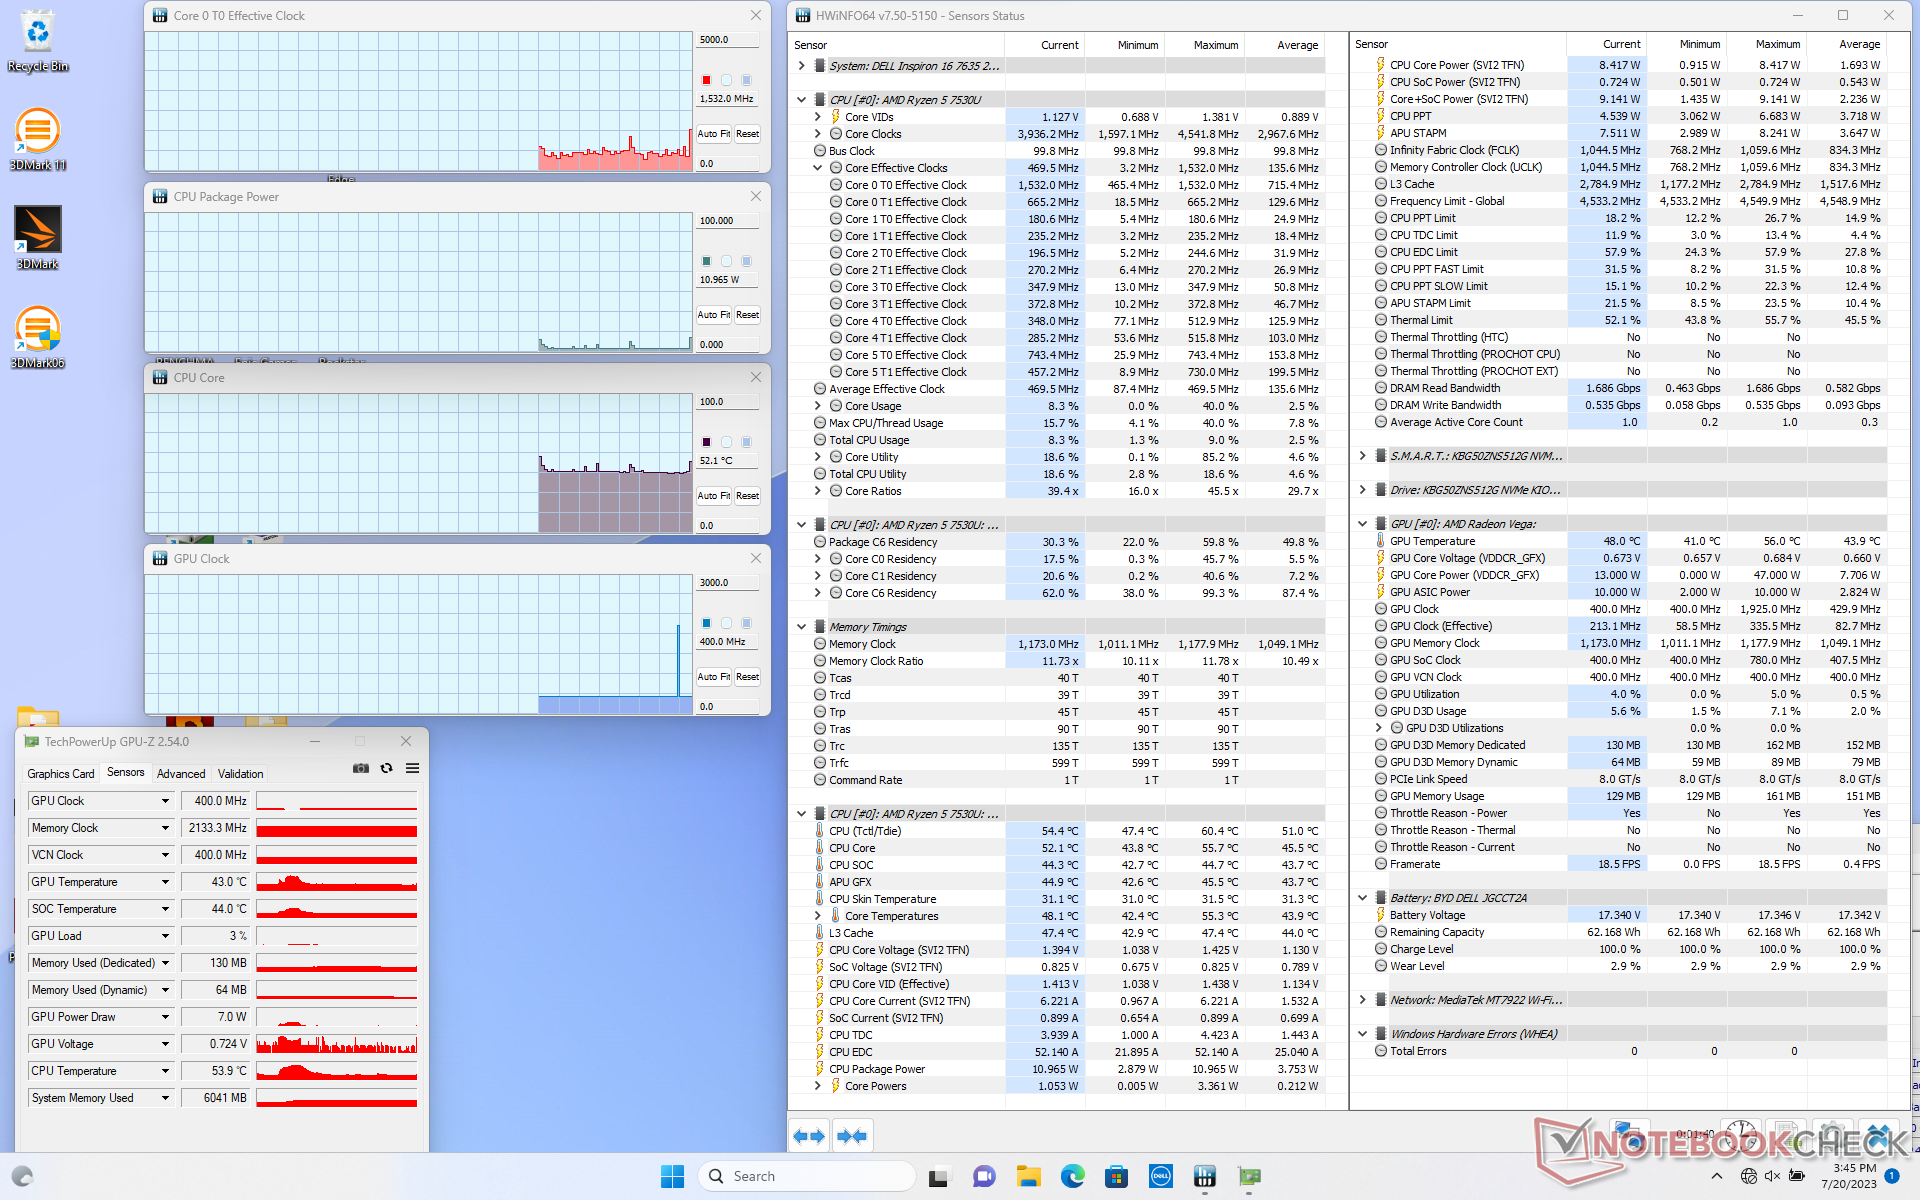
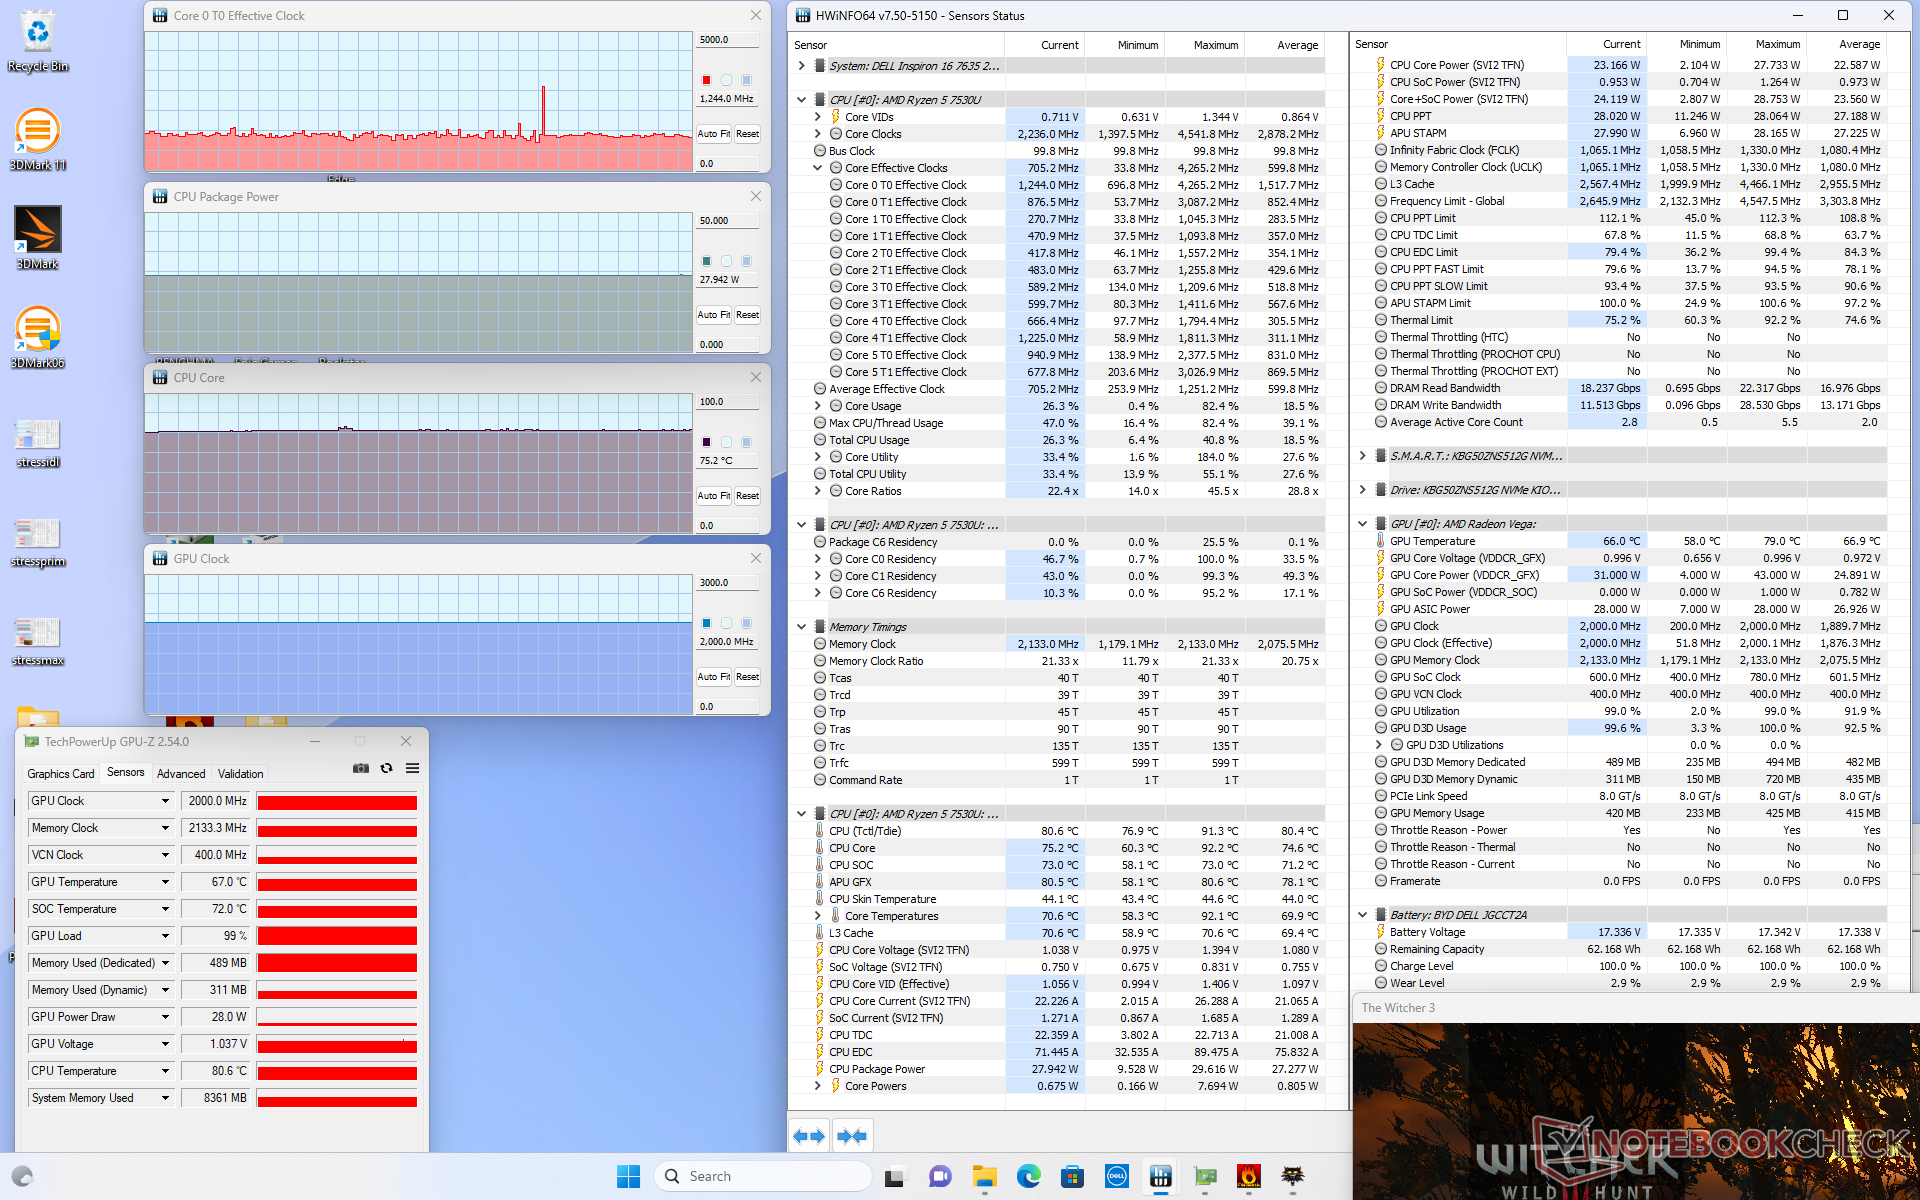
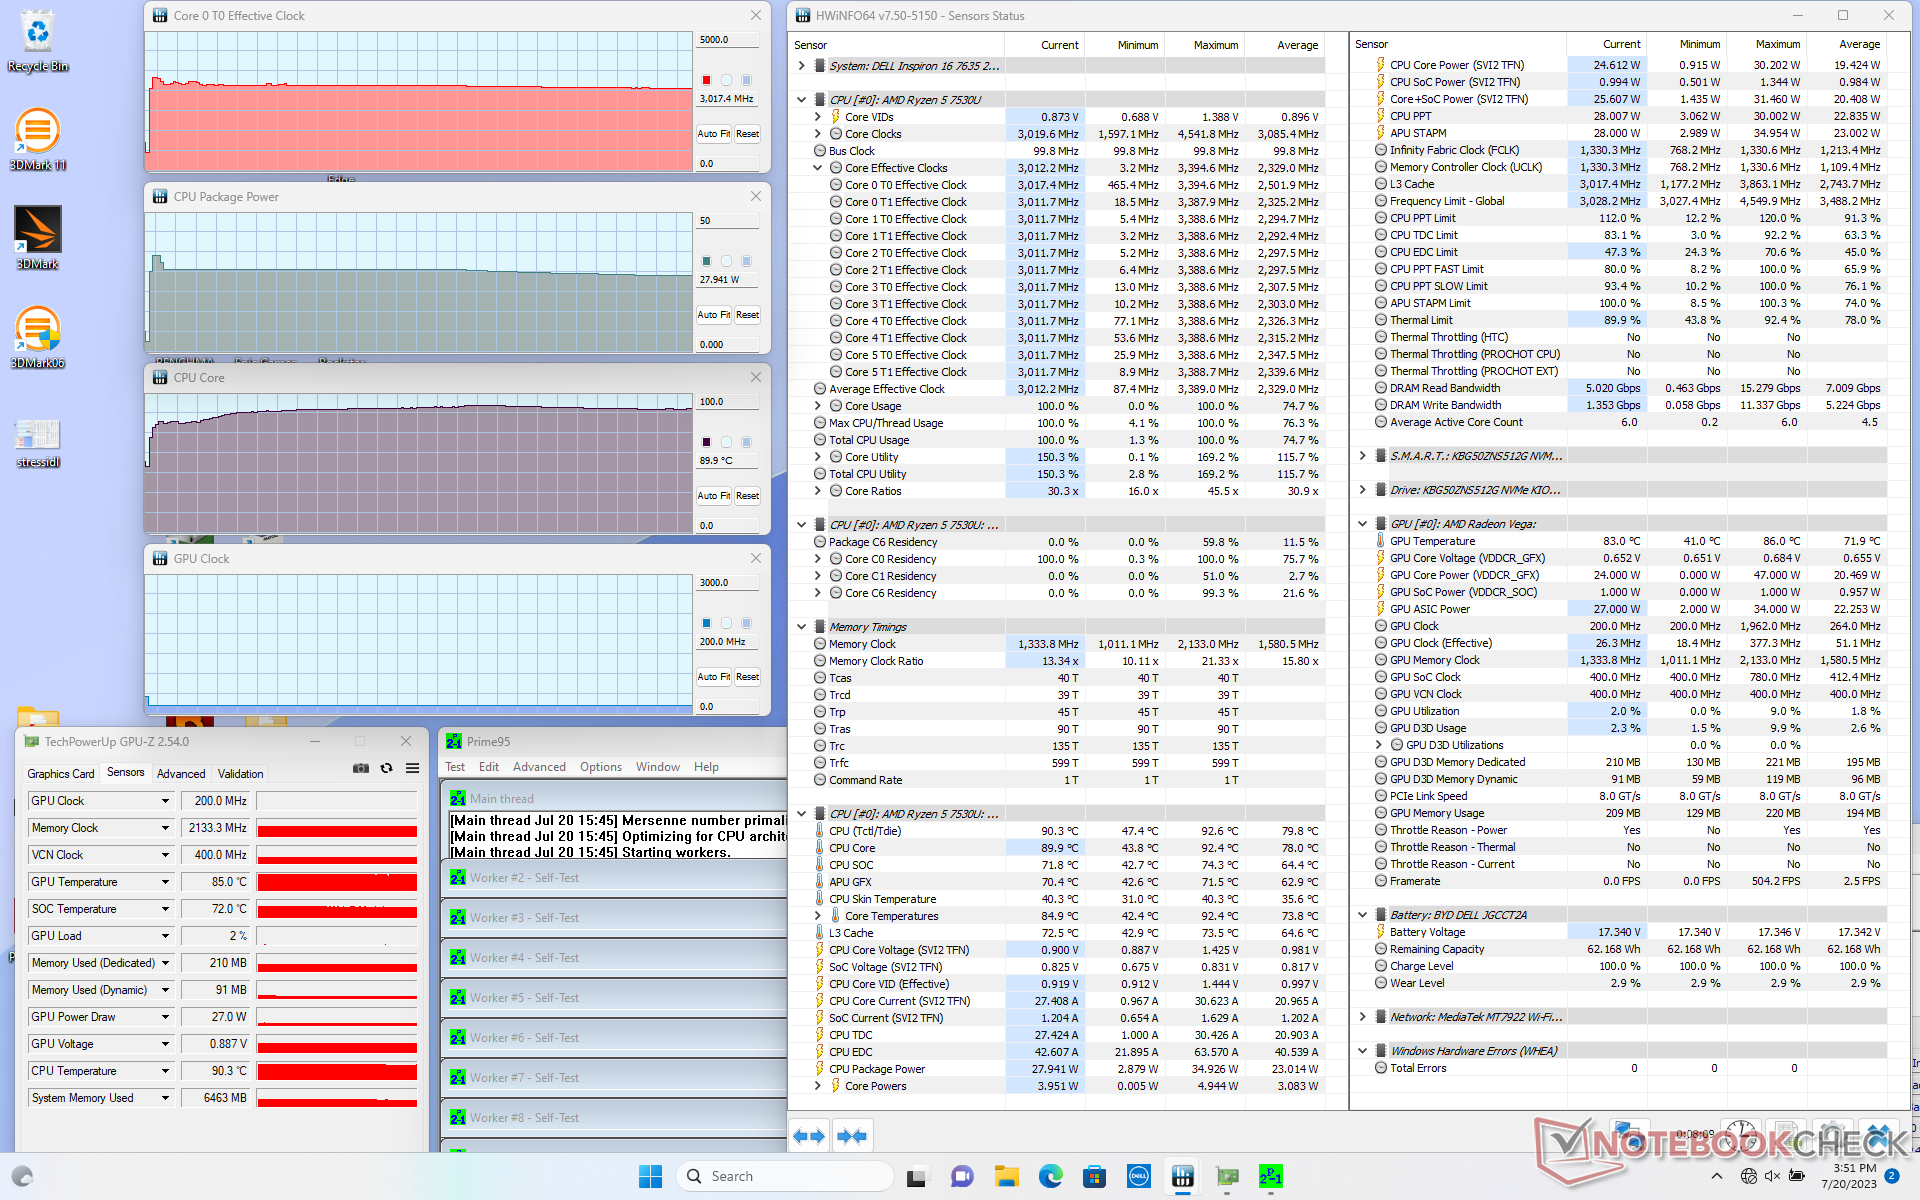
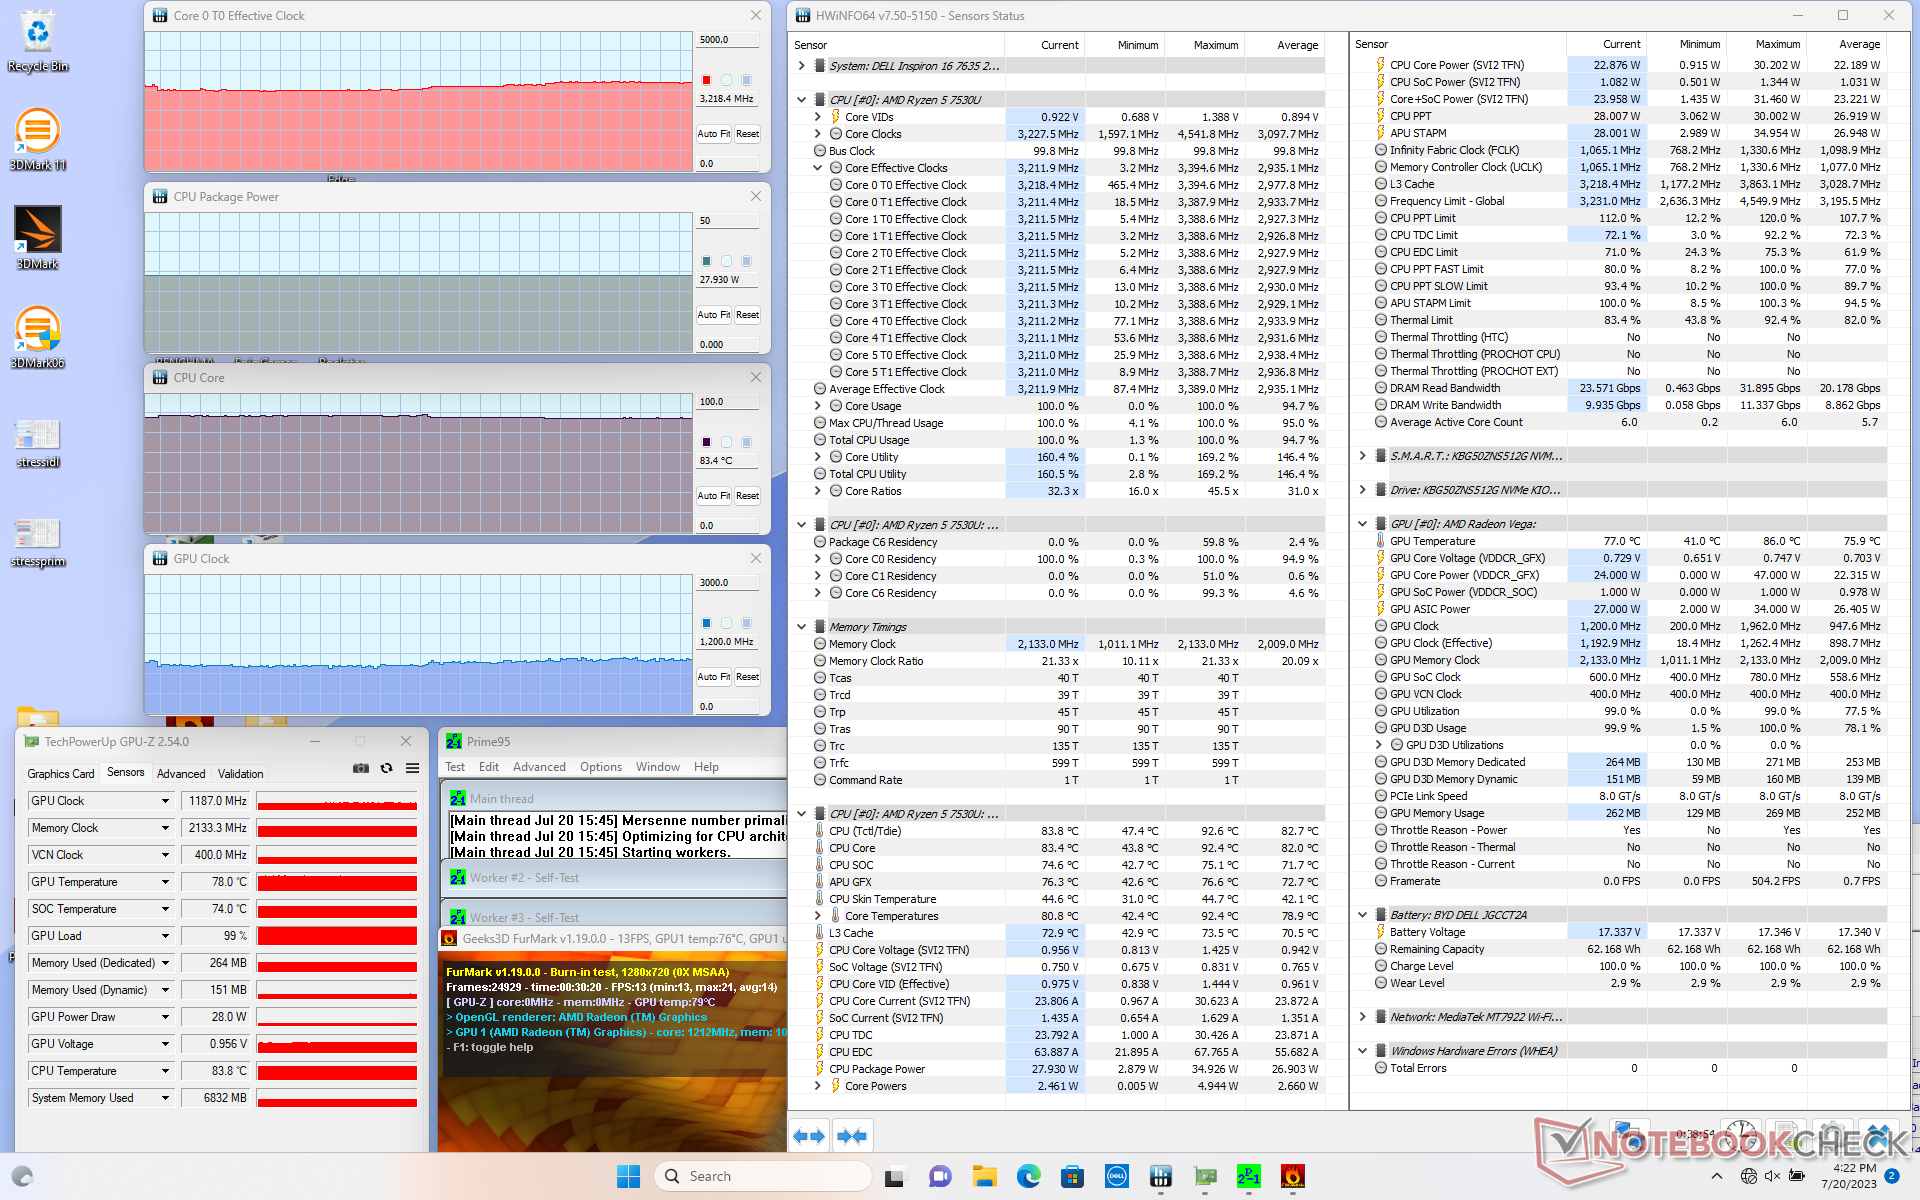
| Horloge du CPU (GHz) | Horloge du GPU (MHz) | Température moyenne du CPU (°C) | |
| Système au repos | -- | -- | 52 |
| Prime95 Stress | 3.0 | -- | 90 |
| Prime95 + FurMark Stress | 3.1 - 3.2 | 1187 | 83 |
| Witcher 3 Stress | 1.2 | 2000 | 75 |
Intervenants
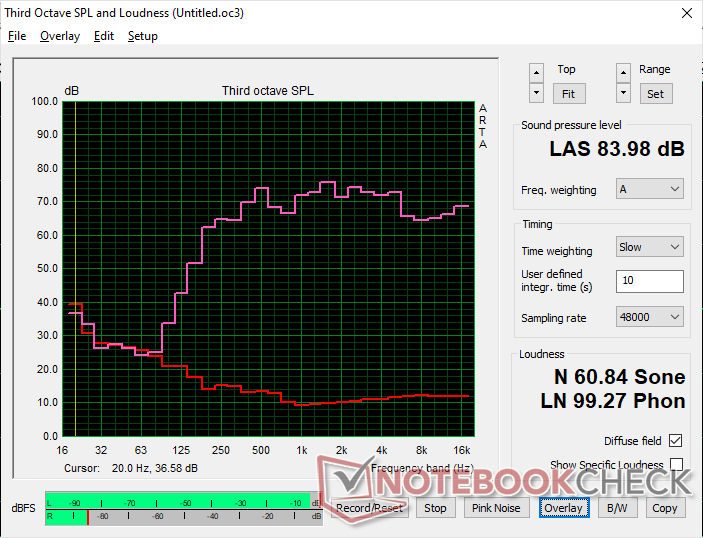
Dell Inspiron 16 7635 2-in-1 analyse audio
(+) | les haut-parleurs peuvent jouer relativement fort (84# dB)
Basses 100 - 315 Hz
(±) | basse réduite - en moyenne 14.9% inférieure à la médiane
(±) | la linéarité des basses est moyenne (11.9% delta à la fréquence précédente)
Médiums 400 - 2000 Hz
(+) | médiane équilibrée - seulement 3.5% de la médiane
(+) | les médiums sont linéaires (6.9% delta à la fréquence précédente)
Aiguës 2 - 16 kHz
(+) | des sommets équilibrés - à seulement 4.1% de la médiane
(+) | les aigus sont linéaires (3.7% delta à la fréquence précédente)
Globalement 100 - 16 000 Hz
(+) | le son global est linéaire (12.2% différence à la médiane)
Par rapport à la même classe
» 12% de tous les appareils testés de cette catégorie étaient meilleurs, 4% similaires, 84% pires
» Le meilleur avait un delta de 6%, la moyenne était de 20%, le pire était de 57%.
Par rapport à tous les appareils testés
» 10% de tous les appareils testés étaient meilleurs, 2% similaires, 88% pires
» Le meilleur avait un delta de 4%, la moyenne était de 23%, le pire était de 134%.
Apple MacBook Pro 16 2021 M1 Pro analyse audio
(+) | les haut-parleurs peuvent jouer relativement fort (84.7# dB)
Basses 100 - 315 Hz
(+) | bonne basse - seulement 3.8% loin de la médiane
(+) | les basses sont linéaires (5.2% delta à la fréquence précédente)
Médiums 400 - 2000 Hz
(+) | médiane équilibrée - seulement 1.3% de la médiane
(+) | les médiums sont linéaires (2.1% delta à la fréquence précédente)
Aiguës 2 - 16 kHz
(+) | des sommets équilibrés - à seulement 1.9% de la médiane
(+) | les aigus sont linéaires (2.7% delta à la fréquence précédente)
Globalement 100 - 16 000 Hz
(+) | le son global est linéaire (4.6% différence à la médiane)
Par rapport à la même classe
» 0% de tous les appareils testés de cette catégorie étaient meilleurs, 0% similaires, 100% pires
» Le meilleur avait un delta de 5%, la moyenne était de 17%, le pire était de 45%.
Par rapport à tous les appareils testés
» 0% de tous les appareils testés étaient meilleurs, 0% similaires, 100% pires
» Le meilleur avait un delta de 4%, la moyenne était de 23%, le pire était de 134%.
Gestion de l'énergie
Consommation électrique
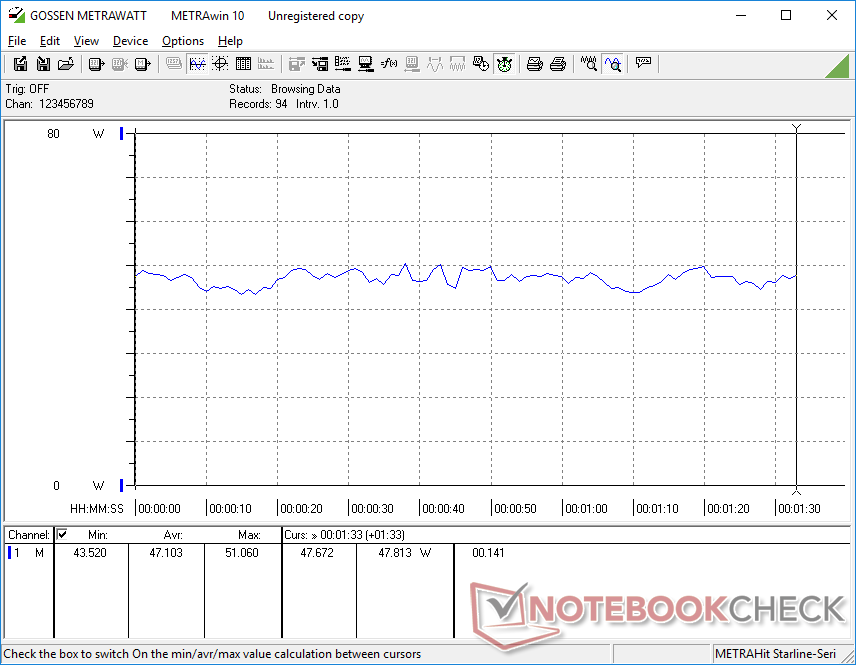
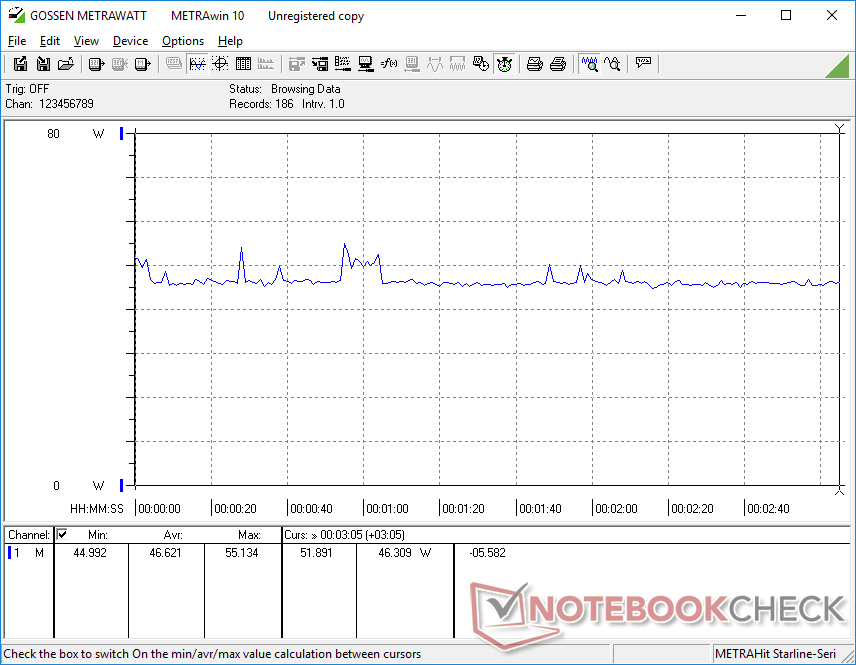
Dans la plupart des conditions, la consommation d'énergie est systématiquement inférieure à celle de l'Inspiron 16 7620 2-en-1 de l'année dernière, équipé d'un processeur Core-P, ce qui peut expliquer les bons résultats obtenus en matière d'autonomie de la batterie dans la section suivante. Elle est également inférieure à celle du Yoga 7 16IRL8 en moyenne, ce qui montre d'excellentes performances par watt par rapport à la concurrence.
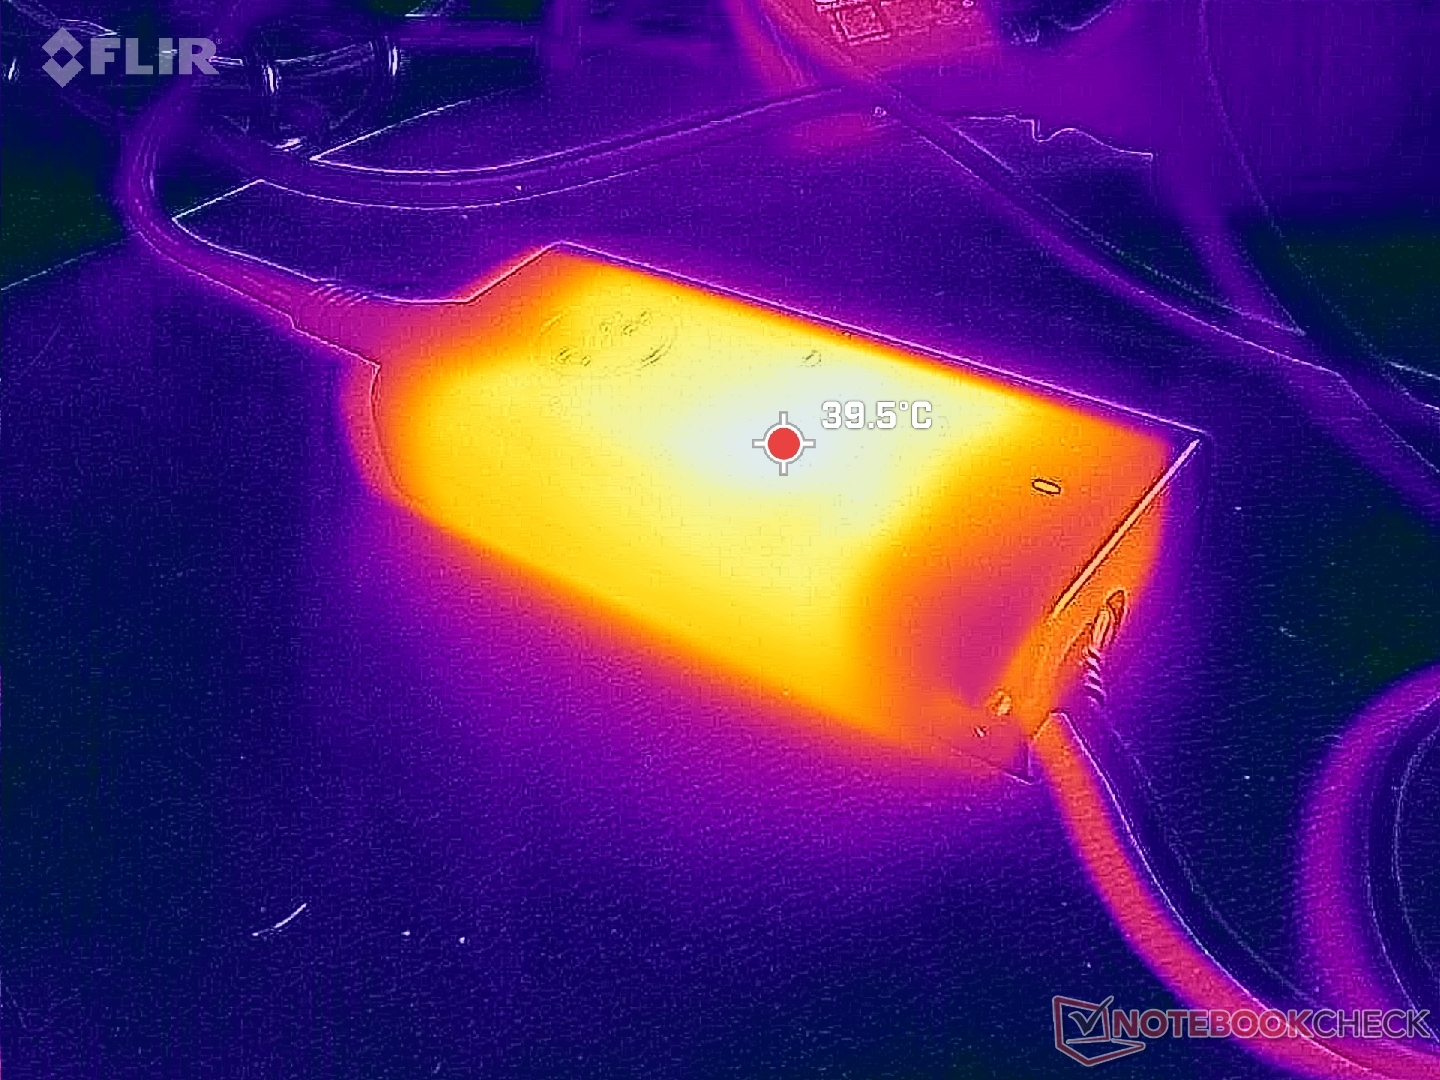
Nous avons pu mesurer une consommation maximale de 57 W à partir de l'adaptateur secteur 65 W de taille petite-moyenne (~11,2 x 5 x 2,8 cm) lorsque le CPU est utilisé à 100 %. Ce surdimensionnement important permet au système de continuer à se charger lors de l'exécution de charges exigeantes, même si c'est à un rythme plus lent, et au CPU de ne pas être bloqué par une taille insuffisante de l'adaptateur secteur.
| Éteint/en veille | |
| Au repos | |
| Fortement sollicité |
|
Légende:
min: | |
| Dell Inspiron 16 7635 2-in-1 R5 7530U, Vega 7, Kioxia BG5 KBG50ZNS512G, IPS, 1920x1200, 16" | Acer Swift Edge SFE16-42-R1GM R7 7735U, Radeon 680M, Micron 3400 1TB MTFDKBA1T0TFH, OLED, 3840x2400, 16" | Lenovo Yoga 7 16IRL8 i7-1355U, Iris Xe G7 96EUs, WD PC SN740 512GB SDDPMQD-512G-1101, IPS, 1920x1200, 16" | Samsung Galaxy Book3 Pro 16 i5-1340P, Iris Xe G7 80EUs, WD PC SN740 256GB SDDPNQD-256G, AMOLED, 2880x1800, 16" | Lenovo IdeaPad Flex 5 16ABR G8 R7 7730U, Vega 8, Samsung PM9B1 1024GB MZAL41T0HBLB, IPS, 1920x1200, 16" | Dell Inspiron 16 7620 2-in-1 i7-1260P, Iris Xe G7 96EUs, Toshiba KBG40ZNS512G NVMe, IPS, 1920x1200, 16" | |
|---|---|---|---|---|---|---|
| Power Consumption | -15% | -8% | 8% | -21% | -10% | |
| Idle Minimum * (Watt) | 4.8 | 8.6 -79% | 3.3 31% | 3.9 19% | 5.4 -13% | 5.3 -10% |
| Idle Average * (Watt) | 7.6 | 7.7 -1% | 10.2 -34% | 4.8 37% | 11.1 -46% | 8.3 -9% |
| Idle Maximum * (Watt) | 8.7 | 9.3 -7% | 10.3 -18% | 10 -15% | 11.6 -33% | 9.6 -10% |
| Load Average * (Watt) | 47.1 | 47.9 -2% | 55.2 -17% | 44 7% | 52.7 -12% | 54.3 -15% |
| Witcher 3 ultra * (Watt) | 46.6 | 46.3 1% | 43.8 6% | 42.3 9% | 47.6 -2% | 43.9 6% |
| Load Maximum * (Watt) | 56.4 | 56 1% | 65.7 -16% | 63 -12% | 67 -19% | 70 -24% |
* ... Moindre est la valeur, meilleures sont les performances
Power Consumption Witcher 3 / Stresstest
Power Consumption external Monitor
Autonomie de la batterie
L'Inspiron 16 7635 2-en-1 est équipé d'une batterie de 64 Wh, contre 86 Wh pour l'Inspiron 16 7630 2-en-1 ou 7620 2-en-1. Les utilisateurs d'AMD sont donc lésés, car la batterie plus puissante est pour l'instant réservée aux configurations Intel.
L'autonomie de la batterie est néanmoins très bonne malgré la plus petite batterie sur notre unité AMD. Nous avons pu enregistrer 14,5 heures d'utilisation réelle de la navigation WLAN, ce qui est presque identique à ce que nous avons enregistré sur l'Inspiron 16 7620 2-en-1 alimenté par Intel de l'année dernière. C'est plus long que l'Inspiron 16 7620 2-en-1 de l'année dernière, équipé d'un processeur Intel IdeaPad Flex 5 16 de plusieurs heures.
L'adaptateur secteur fourni permet de recharger l'ordinateur de son plein potentiel en 2 heures environ.
| Dell Inspiron 16 7635 2-in-1 R5 7530U, Vega 7, 64 Wh | Acer Swift Edge SFE16-42-R1GM R7 7735U, Radeon 680M, 54 Wh | Lenovo Yoga 7 16IRL8 i7-1355U, Iris Xe G7 96EUs, 71 Wh | Samsung Galaxy Book3 Pro 16 i5-1340P, Iris Xe G7 80EUs, 76 Wh | Lenovo IdeaPad Flex 5 16ABR G8 R7 7730U, Vega 8, 52.5 Wh | Dell Inspiron 16 7620 2-in-1 i7-1260P, Iris Xe G7 96EUs, 87 Wh | |
|---|---|---|---|---|---|---|
| Autonomie de la batterie | -43% | -17% | -3% | -37% | 11% | |
| Reader / Idle (h) | 26 | 10.9 -58% | 19 -27% | 30.4 17% | 17 -35% | |
| WiFi v1.3 (h) | 14.5 | 7.3 -50% | 9.4 -35% | 10.2 -30% | 9.8 -32% | 14.6 1% |
| Load (h) | 1.9 | 1.5 -21% | 2.1 11% | 2 5% | 1.1 -42% | 3.2 68% |
| H.264 (h) | 8.6 | 14.4 | 13.1 |
Points positifs
Points négatifs
Verdict - L'Inspiron 16 7630 2-en-1 est bien plus performant que les autres
L'Inspiron 16 7635 2-en-1 alimenté par AMD est plus qu'un simple changement de processeur par rapport à l'Inspiron 16 7630 2-en-1 alimenté par Intel. Il manque les options pour un écran tactile OLED de plus haute résolution, un capteur IR, des options graphiques discrètes, une batterie plus grande et la prise en charge de Thunderbolt, tout cela pour être un peu moins cher. Si vous êtes prêt à payer 100 $ de plus, nous vous recommandons d'opter pour le 2-en-1 Inspiron 16 7630 Core i7-1360P plutôt que pour notre configuration Ryzen 5, car il offre des performances CPU et GPU plus rapides et une capacité de stockage doublée. Il est un peu plus lourd de 100 g, mais les deux versions du modèle sont déjà assez lourdes avec 2 kg chacune.
Les couleurs sRGB plus profondes de l'Inspiron 16 7635 2-en-1 donnent à Dell l'avantage sur son concurrent Lenovo Flex 5 16.
Pour les prochaines révisions, nous aimerions vraiment voir des options de processeurs Zen 4 ou au moins Zen 3+ pour améliorer les performances graphiques médiocres. L'option Ryzen 7 7730U n'est pas recommandée car elle est plus chère, plus lente et avec moins de fonctionnalités que la configuration Core i7-1360P. L'Inspiron 16 7620 2-en-1 de l'année dernière mérite d'être considéré, d'autant plus que cette nouvelle version n'est ni plus légère, ni plus portable
.Prix et disponibilité
L'Inspiron 16 7635 2-en-1 et l'Inspiron 16 7630 2-en-1 sont désormais expédiés directement par Dell à partir de 650 et 800 USD, respectivement. La configuration que nous avons testée est vendue au prix de 900 dollars.
Dell Inspiron 16 7635 2-in-1
- 07/23/2023 v7 (old)
Allen Ngo
Transparency
La sélection des appareils à examiner est effectuée par notre équipe éditoriale. L'échantillon de test a été prêté à l'auteur par le fabricant ou le détaillant pour les besoins de cet examen. Le prêteur n'a pas eu d'influence sur cette évaluation et le fabricant n'a pas reçu de copie de cette évaluation avant sa publication. Il n'y avait aucune obligation de publier cet article. En tant que média indépendant, Notebookcheck n'est pas soumis à l'autorité des fabricants, des détaillants ou des éditeurs.
Voici comment Notebookcheck teste
Chaque année, Notebookcheck examine de manière indépendante des centaines d'ordinateurs portables et de smartphones en utilisant des procédures standardisées afin de garantir que tous les résultats sont comparables. Nous avons continuellement développé nos méthodes de test depuis environ 20 ans et avons établi des normes industrielles dans le processus. Dans nos laboratoires de test, des équipements de mesure de haute qualité sont utilisés par des techniciens et des rédacteurs expérimentés. Ces tests impliquent un processus de validation en plusieurs étapes. Notre système d'évaluation complexe repose sur des centaines de mesures et de points de référence bien fondés, ce qui garantit l'objectivité.Price comparison

