Test de l'Asus ROG Strix SCAR 17 X3D - Le PC portable de jeu le plus puissant au monde
Le ROG Strix SCAR 17 n'est peut-être pas le PC de jeu le plus moderne d'Asus, mais il est certainement l'un des plus rapides du marché. Nous avons déjà testé plusieurs configurations, notamment la version équipée du processeur Zen4 d'AMD Ryzen 9 7945HX ainsi que le portable Nvidia GeForce RTX 4090. Avec le tout nouveau ROG Strix SCAR 17 X3D, Asus a coopéré avec AMD pour être le premier fabricant à installer le nouveau Ryzen 9 7945HX3D dans un ordinateur portable dont les performances de jeu, déjà bonnes, seront encore améliorées grâce au 3D V-Cache supplémentaire.
En dehors du processeur, le ROG Strix SCAR 17 X3D n'offre rien de nouveau, ce qui signifie que nous nous concentrerons entièrement sur ses performances et ses émissions dans cette revue. Pour plus d'informations sur le boîtier, la connectivité, les périphériques d'entrée, l'écran et les haut-parleurs, vous pouvez consulter notre précédent test. Par ailleurs, nous vous conseillons de consulter notre article d'analyse pour accompagner le nouveau AMD Ryzen 9 7945HX3D, qui reprend toutes les informations techniques du processeur :
Comparaison avec les concurrents potentiels
Note | Date | Modèle | Poids | Épaisseur | Taille | Résolution | Prix |
|---|---|---|---|---|---|---|---|
| 87.2 % v7 (old) | 08/23 | Asus ROG Strix Scar 17 G733PYV-LL053X R9 7945HX3D, GeForce RTX 4090 Laptop GPU | 2.9 kg | 28.3 mm | 17.30" | 2560x1440 | |
| 88.3 % v7 (old) | 04/23 | Asus ROG Strix Scar 17 G733PY-XS96 R9 7945HX, GeForce RTX 4090 Laptop GPU | 2.9 kg | 28.3 mm | 17.30" | 2560x1440 | |
| 90.7 % v7 (old) | 04/23 | Alienware m18 R1 i9-13980HX, GeForce RTX 4090 Laptop GPU | 3.9 kg | 26.7 mm | 18.00" | 1920x1200 | |
| 86.6 % v7 (old) | 02/23 | Asus ROG Strix Scar 18 2023 G834JY-N6005W i9-13980HX, GeForce RTX 4090 Laptop GPU | 3.1 kg | 30.8 mm | 18.00" | 2560x1600 | |
| 89 % v7 (old) | 02/23 | MSI Titan GT77 HX 13VI i9-13950HX, GeForce RTX 4090 Laptop GPU | 3.5 kg | 23 mm | 17.30" | 3840x2160 | |
| 85.5 % v7 (old) | 06/23 | Schenker Key 17 Pro (Early 23) i9-13900HX, GeForce RTX 4090 Laptop GPU | 3.4 kg | 24.9 mm | 17.30" | 3840x2160 |
Performance - Le SCAR 17 X3D avec le meilleur d'AMD et de Nvidia
Par rapport à la version normale duROG Strix SCAR 17avec leRyzen 9 7945HXcette version présente un changement important concernant le refroidissement du processeur. En raison de la texture métallique de la surface du nouveau processeur 7945HX3D, aucun métal liquide ne peut être utilisé - à la place, le dispositif s'appuie sur une pâte thermique normale. En général, sa classification TDP reste la même selon Asus, mais cela a un impact sur les performances de l'ordinateur portable.
Conditions d'essai
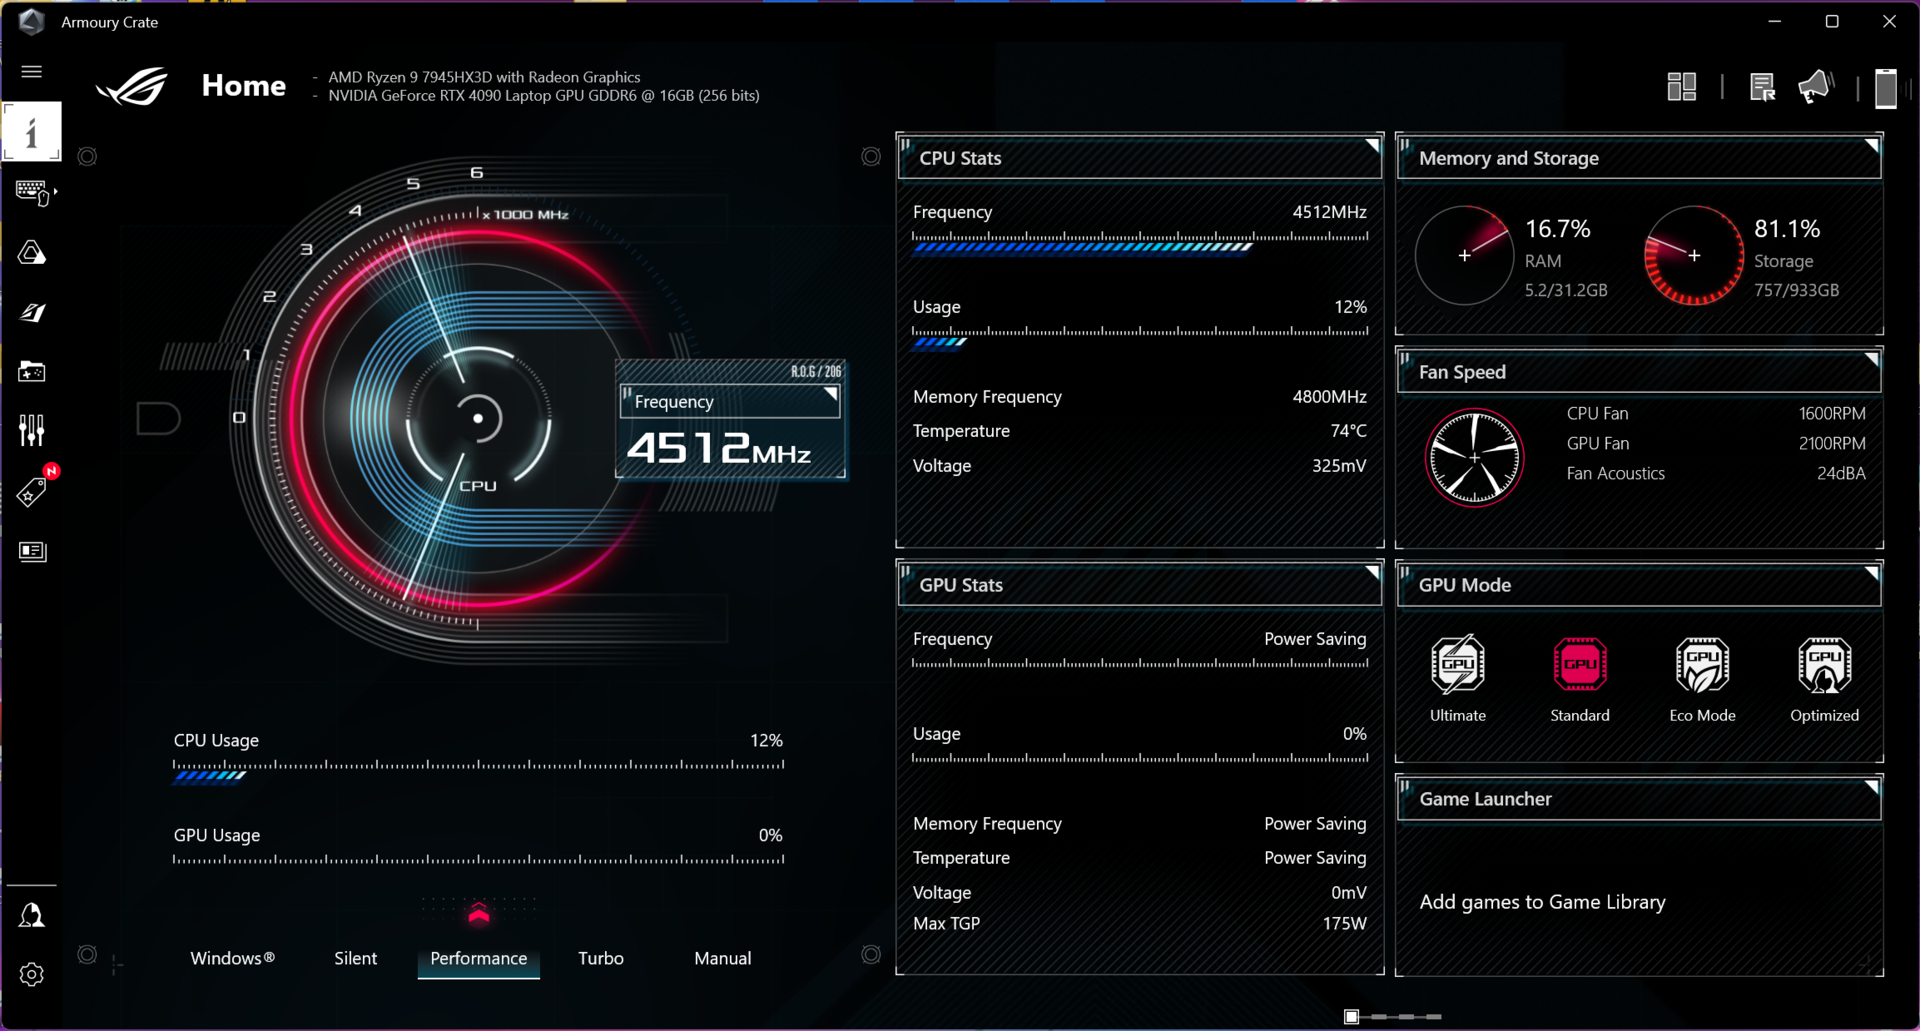
Le logiciel Armoury Crate préinstallé vous donne accès aux profils énergétiques bien connus Silent, Performance et Turbo. En outre, il existe un mode manuel qui vous permet de modifier les valeurs TDP/TGP pour le CPU/GPU. Il existe également plusieurs modes GPU - dans notre test, nous avons utilisé le mode Ultimate en coordination avec le profil énergétique Turbo. Le tableau suivant contient les valeurs TDP/TGP respectives des différents profils énergétiques. En mode batterie, le profil Turbo n'est pas disponible.
| Scénario | Silencieux | Performance | Turbo |
|---|---|---|---|
| Charge CPU | 65/55 watts | 90/85 watts | 125/90 watts |
| Charge GPU | D-Notify | 140 + 20 watts Dynamic Boost | 150 + 25 watts Dynamic Boost |
| Test de stress | CPU : 35 watts GPU : D-Notify |
CPU : 40 watts GPU : 150 watts |
CPU : 50 watts GPU : 175 watts |
Remarque : D-Notify est une fonction spécifique à Nvidia. Lorsque la fonction D-Notify est activée, le GPU augmente sa consommation d'énergie en fonction de l'application/charge jusqu'à ce que le GPU atteigne une température de 75 °C. Dans ce cas, le TGP est limité à 55 watts.
Processeur - Ryzen 9 7945HX3D
Les nouveauxAMD Ryzen 9 7945HX3Dsont identiques à celles de la version normale de la sérieRyzen 9 7945HX: 16 cœurs Zen4 (32 threads) avec une horloge maximale de 5,4 GHz. Cependant, sur le nouveau modèle, le cache de 80 Mo (16 Mo L2 + 64 Mo L3) est augmenté d'un cache L3 supplémentaire de 64 Mo. Vous trouverez toutes les informations techniques à ce sujet dans notre analyse du nouveau Ryzen 9 7945HX3D.
Contrairement au SCAR 17 avec le Ryzen 9 7945HX normal, les benchmarks effectués avec la nouvelle version ont montré des valeurs de consommation d'énergie totale inférieures. Nous avons noté un maximum de 115 watts qui s'est rapidement équilibré à 100 watts. Ici, le métal liquide manquant se fait déjà remarquer. Les résultats du benchmark sont toujours phénoménaux dans l'ensemble - bien que les modèles 7945HX normaux aient un léger avantage lorsqu'il s'agit de la performance pure du processeur. Là encore, les performances totales sont comparables à celles des processeurs Intel HX, qui n'ont fait mieux que dans certains tests à cœur unique. En même temps, il ne faut pas oublier que les puces Intel consomment beaucoup plus d'énergie - en utilisation monocœur et surtout lorsque tous les cœurs sont sollicités. Pour comparer : Le Ryzen 9 7945HX3D avec 100 watts était considérablement plus rapide dans les tests multicœurs que le Core i9-13980HX à 170 watts.
En utilisation sur batterie, le processeur utilise un maximum de 85 watts pendant un court laps de temps, après quoi il s'équilibre rapidement à 55 watts. Dans le test Cinebench R23 Multi, cela a suffi pour obtenir 24 127 points, ce qui équivaut à un déficit de 26 %. L'utilisation d'un seul cœur n'est pas limitée. Vous trouverez d'autres tests de performances du processeur dans notre section technique .
Cinebench R15 Multi continuous test
Cinebench R23: Multi Core | Single Core
Cinebench R20: CPU (Multi Core) | CPU (Single Core)
Cinebench R15: CPU Multi 64Bit | CPU Single 64Bit
Blender: v2.79 BMW27 CPU
7-Zip 18.03: 7z b 4 | 7z b 4 -mmt1
Geekbench 5.5: Multi-Core | Single-Core
HWBOT x265 Benchmark v2.2: 4k Preset
LibreOffice : 20 Documents To PDF
R Benchmark 2.5: Overall mean
| CPU Performance rating | |
| Asus ROG Strix Scar 17 G733PY-XS96 | |
| Asus ROG Strix Scar 17 G733PYV-LL053X | |
| Moyenne AMD Ryzen 9 7945HX3D | |
| Asus ROG Strix Scar 18 2023 G834JY-N6005W | |
| Alienware m18 R1 | |
| MSI Titan GT77 HX 13VI | |
| Lenovo Legion Pro 7 RTX4090 | |
| Schenker Key 17 Pro (Early 23) | |
| Moyenne de la classe Gaming | |
| Lenovo Legion Pro 5 16ARX8 | |
| Asus ROG Zephyrus M16 GU604VY-NM042X | |
| Cinebench R23 / Multi Core | |
| Asus ROG Strix Scar 17 G733PY-XS96 | |
| MSI Titan GT77 HX 13VI | |
| Asus ROG Strix Scar 17 G733PYV-LL053X | |
| Moyenne AMD Ryzen 9 7945HX3D (n=1) | |
| Alienware m18 R1 | |
| Asus ROG Strix Scar 18 2023 G834JY-N6005W | |
| Lenovo Legion Pro 7 RTX4090 | |
| Schenker Key 17 Pro (Early 23) | |
| Moyenne de la classe Gaming (10488 - 42661, n=104, 2 dernières années) | |
| Asus ROG Zephyrus M16 GU604VY-NM042X | |
| Lenovo Legion Pro 5 16ARX8 | |
| Cinebench R23 / Single Core | |
| Asus ROG Strix Scar 18 2023 G834JY-N6005W | |
| Alienware m18 R1 | |
| MSI Titan GT77 HX 13VI | |
| Lenovo Legion Pro 7 RTX4090 | |
| Schenker Key 17 Pro (Early 23) | |
| Moyenne de la classe Gaming (1601 - 2415, n=104, 2 dernières années) | |
| Asus ROG Zephyrus M16 GU604VY-NM042X | |
| Asus ROG Strix Scar 17 G733PYV-LL053X | |
| Moyenne AMD Ryzen 9 7945HX3D (n=1) | |
| Asus ROG Strix Scar 17 G733PY-XS96 | |
| Lenovo Legion Pro 5 16ARX8 | |
| Cinebench R20 / CPU (Multi Core) | |
| Asus ROG Strix Scar 17 G733PY-XS96 | |
| Asus ROG Strix Scar 17 G733PYV-LL053X | |
| Moyenne AMD Ryzen 9 7945HX3D (n=1) | |
| MSI Titan GT77 HX 13VI | |
| Alienware m18 R1 | |
| Asus ROG Strix Scar 18 2023 G834JY-N6005W | |
| Lenovo Legion Pro 7 RTX4090 | |
| Schenker Key 17 Pro (Early 23) | |
| Moyenne de la classe Gaming (4029 - 16433, n=103, 2 dernières années) | |
| Asus ROG Zephyrus M16 GU604VY-NM042X | |
| Lenovo Legion Pro 5 16ARX8 | |
| Cinebench R20 / CPU (Single Core) | |
| Asus ROG Strix Scar 18 2023 G834JY-N6005W | |
| Alienware m18 R1 | |
| MSI Titan GT77 HX 13VI | |
| Moyenne de la classe Gaming (622 - 913, n=103, 2 dernières années) | |
| Schenker Key 17 Pro (Early 23) | |
| Lenovo Legion Pro 7 RTX4090 | |
| Asus ROG Strix Scar 17 G733PYV-LL053X | |
| Moyenne AMD Ryzen 9 7945HX3D (n=1) | |
| Asus ROG Zephyrus M16 GU604VY-NM042X | |
| Asus ROG Strix Scar 17 G733PY-XS96 | |
| Lenovo Legion Pro 5 16ARX8 | |
| Cinebench R15 / CPU Multi 64Bit | |
| Asus ROG Strix Scar 17 G733PYV-LL053X | |
| Moyenne AMD Ryzen 9 7945HX3D (n=1) | |
| Asus ROG Strix Scar 17 G733PY-XS96 | |
| MSI Titan GT77 HX 13VI | |
| Alienware m18 R1 | |
| Asus ROG Strix Scar 18 2023 G834JY-N6005W | |
| Lenovo Legion Pro 7 RTX4090 | |
| Schenker Key 17 Pro (Early 23) | |
| Moyenne de la classe Gaming (1578 - 6330, n=102, 2 dernières années) | |
| Asus ROG Zephyrus M16 GU604VY-NM042X | |
| Lenovo Legion Pro 5 16ARX8 | |
| Cinebench R15 / CPU Single 64Bit | |
| Asus ROG Strix Scar 18 2023 G834JY-N6005W | |
| Asus ROG Strix Scar 17 G733PYV-LL053X | |
| Moyenne AMD Ryzen 9 7945HX3D (n=1) | |
| Asus ROG Strix Scar 17 G733PY-XS96 | |
| Alienware m18 R1 | |
| MSI Titan GT77 HX 13VI | |
| Moyenne de la classe Gaming (188.8 - 350, n=103, 2 dernières années) | |
| Lenovo Legion Pro 5 16ARX8 | |
| Asus ROG Zephyrus M16 GU604VY-NM042X | |
| Schenker Key 17 Pro (Early 23) | |
| Lenovo Legion Pro 7 RTX4090 | |
| Blender / v2.79 BMW27 CPU | |
| Lenovo Legion Pro 5 16ARX8 | |
| Asus ROG Zephyrus M16 GU604VY-NM042X | |
| Moyenne de la classe Gaming (79 - 330, n=101, 2 dernières années) | |
| Schenker Key 17 Pro (Early 23) | |
| Lenovo Legion Pro 7 RTX4090 | |
| Asus ROG Strix Scar 18 2023 G834JY-N6005W | |
| MSI Titan GT77 HX 13VI | |
| Alienware m18 R1 | |
| Asus ROG Strix Scar 17 G733PYV-LL053X | |
| Moyenne AMD Ryzen 9 7945HX3D (n=1) | |
| Asus ROG Strix Scar 17 G733PY-XS96 | |
| 7-Zip 18.03 / 7z b 4 | |
| Asus ROG Strix Scar 17 G733PY-XS96 | |
| Asus ROG Strix Scar 17 G733PYV-LL053X | |
| Moyenne AMD Ryzen 9 7945HX3D (n=1) | |
| Alienware m18 R1 | |
| MSI Titan GT77 HX 13VI | |
| Asus ROG Strix Scar 18 2023 G834JY-N6005W | |
| Lenovo Legion Pro 7 RTX4090 | |
| Schenker Key 17 Pro (Early 23) | |
| Moyenne de la classe Gaming (33491 - 148086, n=102, 2 dernières années) | |
| Asus ROG Zephyrus M16 GU604VY-NM042X | |
| Lenovo Legion Pro 5 16ARX8 | |
| 7-Zip 18.03 / 7z b 4 -mmt1 | |
| Asus ROG Strix Scar 17 G733PY-XS96 | |
| Asus ROG Strix Scar 17 G733PYV-LL053X | |
| Moyenne AMD Ryzen 9 7945HX3D (n=1) | |
| Lenovo Legion Pro 5 16ARX8 | |
| Asus ROG Strix Scar 18 2023 G834JY-N6005W | |
| Lenovo Legion Pro 7 RTX4090 | |
| MSI Titan GT77 HX 13VI | |
| Alienware m18 R1 | |
| Schenker Key 17 Pro (Early 23) | |
| Moyenne de la classe Gaming (4824 - 7436, n=102, 2 dernières années) | |
| Asus ROG Zephyrus M16 GU604VY-NM042X | |
| Geekbench 5.5 / Multi-Core | |
| Alienware m18 R1 | |
| Asus ROG Strix Scar 18 2023 G834JY-N6005W | |
| MSI Titan GT77 HX 13VI | |
| Lenovo Legion Pro 7 RTX4090 | |
| Asus ROG Strix Scar 17 G733PYV-LL053X | |
| Moyenne AMD Ryzen 9 7945HX3D (n=1) | |
| Schenker Key 17 Pro (Early 23) | |
| Asus ROG Strix Scar 17 G733PY-XS96 | |
| Moyenne de la classe Gaming (6460 - 28263, n=102, 2 dernières années) | |
| Asus ROG Zephyrus M16 GU604VY-NM042X | |
| Lenovo Legion Pro 5 16ARX8 | |
| Geekbench 5.5 / Single-Core | |
| Asus ROG Strix Scar 17 G733PYV-LL053X | |
| Moyenne AMD Ryzen 9 7945HX3D (n=1) | |
| Asus ROG Strix Scar 18 2023 G834JY-N6005W | |
| Moyenne de la classe Gaming (1403 - 2474, n=102, 2 dernières années) | |
| Alienware m18 R1 | |
| Asus ROG Strix Scar 17 G733PY-XS96 | |
| MSI Titan GT77 HX 13VI | |
| Lenovo Legion Pro 5 16ARX8 | |
| Lenovo Legion Pro 7 RTX4090 | |
| Asus ROG Zephyrus M16 GU604VY-NM042X | |
| Schenker Key 17 Pro (Early 23) | |
| HWBOT x265 Benchmark v2.2 / 4k Preset | |
| Asus ROG Strix Scar 17 G733PY-XS96 | |
| Asus ROG Strix Scar 17 G733PYV-LL053X | |
| Moyenne AMD Ryzen 9 7945HX3D (n=1) | |
| Asus ROG Strix Scar 18 2023 G834JY-N6005W | |
| Alienware m18 R1 | |
| MSI Titan GT77 HX 13VI | |
| Lenovo Legion Pro 7 RTX4090 | |
| Moyenne de la classe Gaming (11.5 - 44.4, n=102, 2 dernières années) | |
| Schenker Key 17 Pro (Early 23) | |
| Lenovo Legion Pro 5 16ARX8 | |
| Asus ROG Zephyrus M16 GU604VY-NM042X | |
| LibreOffice / 20 Documents To PDF | |
| Asus ROG Zephyrus M16 GU604VY-NM042X | |
| Moyenne de la classe Gaming (33.2 - 88.8, n=102, 2 dernières années) | |
| Alienware m18 R1 | |
| MSI Titan GT77 HX 13VI | |
| Schenker Key 17 Pro (Early 23) | |
| Lenovo Legion Pro 7 RTX4090 | |
| Asus ROG Strix Scar 17 G733PYV-LL053X | |
| Moyenne AMD Ryzen 9 7945HX3D (n=1) | |
| Lenovo Legion Pro 5 16ARX8 | |
| Asus ROG Strix Scar 17 G733PY-XS96 | |
| Asus ROG Strix Scar 18 2023 G834JY-N6005W | |
| R Benchmark 2.5 / Overall mean | |
| Moyenne de la classe Gaming (0.3439 - 0.59, n=102, 2 dernières années) | |
| Lenovo Legion Pro 5 16ARX8 | |
| Asus ROG Strix Scar 17 G733PYV-LL053X | |
| Moyenne AMD Ryzen 9 7945HX3D (n=1) | |
| Asus ROG Zephyrus M16 GU604VY-NM042X | |
| Asus ROG Strix Scar 17 G733PY-XS96 | |
| MSI Titan GT77 HX 13VI | |
| Lenovo Legion Pro 7 RTX4090 | |
| Schenker Key 17 Pro (Early 23) | |
| Alienware m18 R1 | |
| Asus ROG Strix Scar 18 2023 G834JY-N6005W | |
* ... Moindre est la valeur, meilleures sont les performances
AIDA64: FP32 Ray-Trace | FPU Julia | CPU SHA3 | CPU Queen | FPU SinJulia | FPU Mandel | CPU AES | CPU ZLib | FP64 Ray-Trace | CPU PhotoWorxx
| Performance rating | |
| Asus ROG Strix Scar 17 G733PYV-LL053X | |
| Moyenne AMD Ryzen 9 7945HX3D | |
| Asus ROG Strix Scar 17 G733PY-XS96 | |
| Alienware m18 R1 | |
| Asus ROG Strix Scar 18 2023 G834JY-N6005W | |
| MSI Titan GT77 HX 13VI | |
| Lenovo Legion Pro 7 RTX4090 | |
| Moyenne de la classe Gaming | |
| Schenker Key 17 Pro (Early 23) | |
| Lenovo Legion Pro 5 16ARX8 | |
| Asus ROG Zephyrus M16 GU604VY-NM042X | |
| AIDA64 / FP32 Ray-Trace | |
| Asus ROG Strix Scar 17 G733PY-XS96 | |
| Asus ROG Strix Scar 17 G733PYV-LL053X | |
| Moyenne AMD Ryzen 9 7945HX3D (n=1) | |
| Moyenne de la classe Gaming (10227 - 85542, n=102, 2 dernières années) | |
| Lenovo Legion Pro 5 16ARX8 | |
| Alienware m18 R1 | |
| MSI Titan GT77 HX 13VI | |
| Asus ROG Strix Scar 18 2023 G834JY-N6005W | |
| Lenovo Legion Pro 7 RTX4090 | |
| Schenker Key 17 Pro (Early 23) | |
| Asus ROG Zephyrus M16 GU604VY-NM042X | |
| AIDA64 / FPU Julia | |
| Asus ROG Strix Scar 17 G733PY-XS96 | |
| Asus ROG Strix Scar 17 G733PYV-LL053X | |
| Moyenne AMD Ryzen 9 7945HX3D (n=1) | |
| Alienware m18 R1 | |
| Moyenne de la classe Gaming (51376 - 372155, n=102, 2 dernières années) | |
| MSI Titan GT77 HX 13VI | |
| Asus ROG Strix Scar 18 2023 G834JY-N6005W | |
| Lenovo Legion Pro 7 RTX4090 | |
| Lenovo Legion Pro 5 16ARX8 | |
| Schenker Key 17 Pro (Early 23) | |
| Asus ROG Zephyrus M16 GU604VY-NM042X | |
| AIDA64 / CPU SHA3 | |
| Asus ROG Strix Scar 17 G733PY-XS96 | |
| Asus ROG Strix Scar 17 G733PYV-LL053X | |
| Moyenne AMD Ryzen 9 7945HX3D (n=1) | |
| Alienware m18 R1 | |
| MSI Titan GT77 HX 13VI | |
| Asus ROG Strix Scar 18 2023 G834JY-N6005W | |
| Lenovo Legion Pro 7 RTX4090 | |
| Moyenne de la classe Gaming (2180 - 10115, n=102, 2 dernières années) | |
| Schenker Key 17 Pro (Early 23) | |
| Lenovo Legion Pro 5 16ARX8 | |
| Asus ROG Zephyrus M16 GU604VY-NM042X | |
| AIDA64 / CPU Queen | |
| Asus ROG Strix Scar 17 G733PY-XS96 | |
| Asus ROG Strix Scar 17 G733PYV-LL053X | |
| Moyenne AMD Ryzen 9 7945HX3D (n=1) | |
| Alienware m18 R1 | |
| Asus ROG Strix Scar 18 2023 G834JY-N6005W | |
| MSI Titan GT77 HX 13VI | |
| Schenker Key 17 Pro (Early 23) | |
| Lenovo Legion Pro 7 RTX4090 | |
| Lenovo Legion Pro 5 16ARX8 | |
| Asus ROG Zephyrus M16 GU604VY-NM042X | |
| Moyenne de la classe Gaming (49785 - 173351, n=86, 2 dernières années) | |
| AIDA64 / FPU SinJulia | |
| Asus ROG Strix Scar 17 G733PY-XS96 | |
| Asus ROG Strix Scar 17 G733PYV-LL053X | |
| Moyenne AMD Ryzen 9 7945HX3D (n=1) | |
| Asus ROG Strix Scar 18 2023 G834JY-N6005W | |
| MSI Titan GT77 HX 13VI | |
| Alienware m18 R1 | |
| Lenovo Legion Pro 5 16ARX8 | |
| Lenovo Legion Pro 7 RTX4090 | |
| Moyenne de la classe Gaming (4424 - 33636, n=102, 2 dernières années) | |
| Schenker Key 17 Pro (Early 23) | |
| Asus ROG Zephyrus M16 GU604VY-NM042X | |
| AIDA64 / FPU Mandel | |
| Asus ROG Strix Scar 17 G733PY-XS96 | |
| Asus ROG Strix Scar 17 G733PYV-LL053X | |
| Moyenne AMD Ryzen 9 7945HX3D (n=1) | |
| Moyenne de la classe Gaming (25115 - 196829, n=102, 2 dernières années) | |
| Alienware m18 R1 | |
| MSI Titan GT77 HX 13VI | |
| Asus ROG Strix Scar 18 2023 G834JY-N6005W | |
| Lenovo Legion Pro 7 RTX4090 | |
| Lenovo Legion Pro 5 16ARX8 | |
| Schenker Key 17 Pro (Early 23) | |
| Asus ROG Zephyrus M16 GU604VY-NM042X | |
| AIDA64 / CPU ZLib | |
| Asus ROG Strix Scar 17 G733PY-XS96 | |
| MSI Titan GT77 HX 13VI | |
| Asus ROG Strix Scar 17 G733PYV-LL053X | |
| Moyenne AMD Ryzen 9 7945HX3D (n=1) | |
| Asus ROG Strix Scar 18 2023 G834JY-N6005W | |
| Alienware m18 R1 | |
| Lenovo Legion Pro 7 RTX4090 | |
| Schenker Key 17 Pro (Early 23) | |
| Moyenne de la classe Gaming (574 - 2531, n=102, 2 dernières années) | |
| Asus ROG Zephyrus M16 GU604VY-NM042X | |
| Lenovo Legion Pro 5 16ARX8 | |
| AIDA64 / FP64 Ray-Trace | |
| Asus ROG Strix Scar 17 G733PY-XS96 | |
| Asus ROG Strix Scar 17 G733PYV-LL053X | |
| Moyenne AMD Ryzen 9 7945HX3D (n=1) | |
| Moyenne de la classe Gaming (5509 - 45446, n=102, 2 dernières années) | |
| Alienware m18 R1 | |
| Lenovo Legion Pro 5 16ARX8 | |
| MSI Titan GT77 HX 13VI | |
| Asus ROG Strix Scar 18 2023 G834JY-N6005W | |
| Lenovo Legion Pro 7 RTX4090 | |
| Schenker Key 17 Pro (Early 23) | |
| Asus ROG Zephyrus M16 GU604VY-NM042X | |
| AIDA64 / CPU PhotoWorxx | |
| Alienware m18 R1 | |
| Lenovo Legion Pro 7 RTX4090 | |
| Schenker Key 17 Pro (Early 23) | |
| Asus ROG Zephyrus M16 GU604VY-NM042X | |
| Moyenne de la classe Gaming (12271 - 89891, n=102, 2 dernières années) | |
| Asus ROG Strix Scar 18 2023 G834JY-N6005W | |
| MSI Titan GT77 HX 13VI | |
| Asus ROG Strix Scar 17 G733PYV-LL053X | |
| Moyenne AMD Ryzen 9 7945HX3D (n=1) | |
| Asus ROG Strix Scar 17 G733PY-XS96 | |
| Lenovo Legion Pro 5 16ARX8 | |
Performance du système
Le nouveau ROG Strix SCAR 17 X3D a également fait mieux que la concurrence dans le test synthétique PCMark 10 - bien que les différences ne soient pas importantes et qu'en utilisation quotidienne, tous les appareils de comparaison soient extrêmement rapides. Dans le test CrossMark multiplateforme, l'appareil de test AMD n'est arrivé que juste derrière ses concurrents Intel les plus rapides.
CrossMark: Overall | Productivity | Creativity | Responsiveness
| PCMark 10 / Score | |
| Asus ROG Strix Scar 17 G733PYV-LL053X | |
| Moyenne AMD Ryzen 9 7945HX3D, NVIDIA GeForce RTX 4090 Laptop GPU (n=1) | |
| Schenker Key 17 Pro (Early 23) | |
| MSI Titan GT77 HX 13VI | |
| Asus ROG Strix Scar 18 2023 G834JY-N6005W | |
| Alienware m18 R1 | |
| Asus ROG Strix Scar 17 G733PY-XS96 | |
| Moyenne de la classe Gaming (5828 - 12414, n=93, 2 dernières années) | |
| Asus ROG Zephyrus M16 GU604VY-NM042X | |
| Lenovo Legion Pro 5 16ARX8 | |
| Lenovo Legion Pro 7 RTX4090 | |
| PCMark 10 / Essentials | |
| MSI Titan GT77 HX 13VI | |
| Asus ROG Zephyrus M16 GU604VY-NM042X | |
| Asus ROG Strix Scar 17 G733PYV-LL053X | |
| Moyenne AMD Ryzen 9 7945HX3D, NVIDIA GeForce RTX 4090 Laptop GPU (n=1) | |
| Schenker Key 17 Pro (Early 23) | |
| Alienware m18 R1 | |
| Asus ROG Strix Scar 17 G733PY-XS96 | |
| Lenovo Legion Pro 7 RTX4090 | |
| Lenovo Legion Pro 5 16ARX8 | |
| Moyenne de la classe Gaming (8810 - 11935, n=97, 2 dernières années) | |
| PCMark 10 / Productivity | |
| Moyenne de la classe Gaming (6845 - 25323, n=95, 2 dernières années) | |
| Schenker Key 17 Pro (Early 23) | |
| Asus ROG Zephyrus M16 GU604VY-NM042X | |
| Asus ROG Strix Scar 17 G733PYV-LL053X | |
| Moyenne AMD Ryzen 9 7945HX3D, NVIDIA GeForce RTX 4090 Laptop GPU (n=1) | |
| Asus ROG Strix Scar 17 G733PY-XS96 | |
| Lenovo Legion Pro 5 16ARX8 | |
| Alienware m18 R1 | |
| MSI Titan GT77 HX 13VI | |
| Lenovo Legion Pro 7 RTX4090 | |
| PCMark 10 / Digital Content Creation | |
| MSI Titan GT77 HX 13VI | |
| Asus ROG Strix Scar 17 G733PYV-LL053X | |
| Moyenne AMD Ryzen 9 7945HX3D, NVIDIA GeForce RTX 4090 Laptop GPU (n=1) | |
| Alienware m18 R1 | |
| Asus ROG Strix Scar 17 G733PY-XS96 | |
| Schenker Key 17 Pro (Early 23) | |
| Lenovo Legion Pro 7 RTX4090 | |
| Moyenne de la classe Gaming (7602 - 19954, n=95, 2 dernières années) | |
| Lenovo Legion Pro 5 16ARX8 | |
| Asus ROG Zephyrus M16 GU604VY-NM042X | |
| CrossMark / Overall | |
| Schenker Key 17 Pro (Early 23) | |
| Alienware m18 R1 | |
| MSI Titan GT77 HX 13VI | |
| Asus ROG Strix Scar 17 G733PYV-LL053X | |
| Moyenne AMD Ryzen 9 7945HX3D, NVIDIA GeForce RTX 4090 Laptop GPU (n=1) | |
| Asus ROG Strix Scar 18 2023 G834JY-N6005W | |
| Lenovo Legion Pro 5 16ARX8 | |
| Asus ROG Strix Scar 17 G733PY-XS96 | |
| Moyenne de la classe Gaming (1366 - 2409, n=94, 2 dernières années) | |
| Asus ROG Zephyrus M16 GU604VY-NM042X | |
| CrossMark / Productivity | |
| Schenker Key 17 Pro (Early 23) | |
| Alienware m18 R1 | |
| MSI Titan GT77 HX 13VI | |
| Asus ROG Strix Scar 17 G733PYV-LL053X | |
| Moyenne AMD Ryzen 9 7945HX3D, NVIDIA GeForce RTX 4090 Laptop GPU (n=1) | |
| Lenovo Legion Pro 5 16ARX8 | |
| Asus ROG Strix Scar 18 2023 G834JY-N6005W | |
| Moyenne de la classe Gaming (1386 - 2254, n=94, 2 dernières années) | |
| Asus ROG Zephyrus M16 GU604VY-NM042X | |
| Asus ROG Strix Scar 17 G733PY-XS96 | |
| CrossMark / Creativity | |
| Alienware m18 R1 | |
| Asus ROG Strix Scar 18 2023 G834JY-N6005W | |
| Schenker Key 17 Pro (Early 23) | |
| MSI Titan GT77 HX 13VI | |
| Asus ROG Strix Scar 17 G733PYV-LL053X | |
| Moyenne AMD Ryzen 9 7945HX3D, NVIDIA GeForce RTX 4090 Laptop GPU (n=1) | |
| Asus ROG Strix Scar 17 G733PY-XS96 | |
| Moyenne de la classe Gaming (1343 - 2786, n=94, 2 dernières années) | |
| Asus ROG Zephyrus M16 GU604VY-NM042X | |
| Lenovo Legion Pro 5 16ARX8 | |
| CrossMark / Responsiveness | |
| Schenker Key 17 Pro (Early 23) | |
| Alienware m18 R1 | |
| MSI Titan GT77 HX 13VI | |
| Lenovo Legion Pro 5 16ARX8 | |
| Moyenne de la classe Gaming (1226 - 2334, n=94, 2 dernières années) | |
| Asus ROG Zephyrus M16 GU604VY-NM042X | |
| Asus ROG Strix Scar 17 G733PYV-LL053X | |
| Moyenne AMD Ryzen 9 7945HX3D, NVIDIA GeForce RTX 4090 Laptop GPU (n=1) | |
| Asus ROG Strix Scar 18 2023 G834JY-N6005W | |
| Asus ROG Strix Scar 17 G733PY-XS96 | |
| PCMark 10 Score | 9117 points | |
Aide | ||
| AIDA64 / Memory Copy | |
| Alienware m18 R1 | |
| Schenker Key 17 Pro (Early 23) | |
| Lenovo Legion Pro 7 RTX4090 | |
| Moyenne de la classe Gaming (21750 - 129946, n=102, 2 dernières années) | |
| Asus ROG Zephyrus M16 GU604VY-NM042X | |
| Asus ROG Strix Scar 18 2023 G834JY-N6005W | |
| MSI Titan GT77 HX 13VI | |
| Asus ROG Strix Scar 17 G733PYV-LL053X | |
| Moyenne AMD Ryzen 9 7945HX3D (n=1) | |
| Lenovo Legion Pro 5 16ARX8 | |
| Asus ROG Strix Scar 17 G733PY-XS96 | |
| AIDA64 / Memory Read | |
| Alienware m18 R1 | |
| Lenovo Legion Pro 7 RTX4090 | |
| Schenker Key 17 Pro (Early 23) | |
| Asus ROG Strix Scar 18 2023 G834JY-N6005W | |
| Moyenne de la classe Gaming (22956 - 118858, n=102, 2 dernières années) | |
| Asus ROG Zephyrus M16 GU604VY-NM042X | |
| MSI Titan GT77 HX 13VI | |
| Asus ROG Strix Scar 17 G733PYV-LL053X | |
| Moyenne AMD Ryzen 9 7945HX3D (n=1) | |
| Asus ROG Strix Scar 17 G733PY-XS96 | |
| Lenovo Legion Pro 5 16ARX8 | |
| AIDA64 / Memory Write | |
| Alienware m18 R1 | |
| Schenker Key 17 Pro (Early 23) | |
| Lenovo Legion Pro 7 RTX4090 | |
| Moyenne de la classe Gaming (22297 - 135096, n=102, 2 dernières années) | |
| Asus ROG Zephyrus M16 GU604VY-NM042X | |
| Asus ROG Strix Scar 18 2023 G834JY-N6005W | |
| MSI Titan GT77 HX 13VI | |
| Asus ROG Strix Scar 17 G733PY-XS96 | |
| Asus ROG Strix Scar 17 G733PYV-LL053X | |
| Moyenne AMD Ryzen 9 7945HX3D (n=1) | |
| Lenovo Legion Pro 5 16ARX8 | |
| AIDA64 / Memory Latency | |
| Moyenne de la classe Gaming (75.3 - 165.4, n=102, 2 dernières années) | |
| MSI Titan GT77 HX 13VI | |
| Asus ROG Strix Scar 18 2023 G834JY-N6005W | |
| Schenker Key 17 Pro (Early 23) | |
| Asus ROG Strix Scar 17 G733PYV-LL053X | |
| Moyenne AMD Ryzen 9 7945HX3D (n=1) | |
| Asus ROG Zephyrus M16 GU604VY-NM042X | |
| Lenovo Legion Pro 5 16ARX8 | |
| Lenovo Legion Pro 7 RTX4090 | |
| Asus ROG Strix Scar 17 G733PY-XS96 | |
| Alienware m18 R1 | |
* ... Moindre est la valeur, meilleures sont les performances
Latence DPC
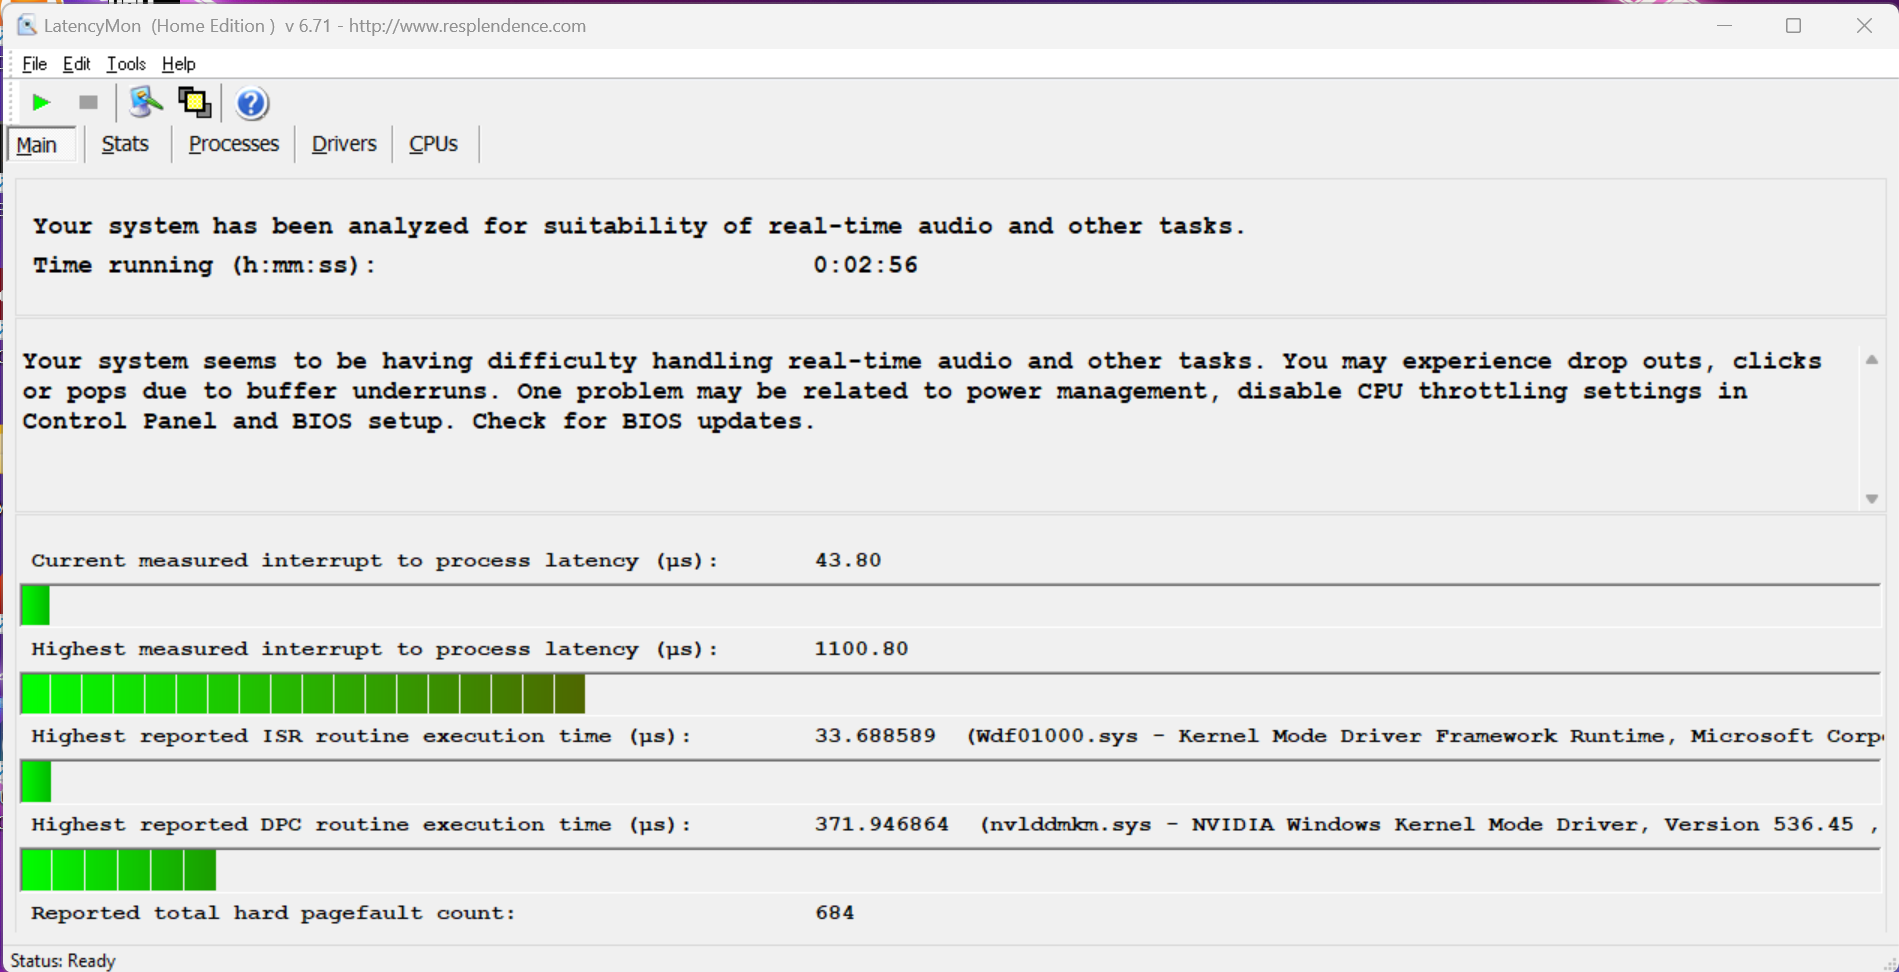
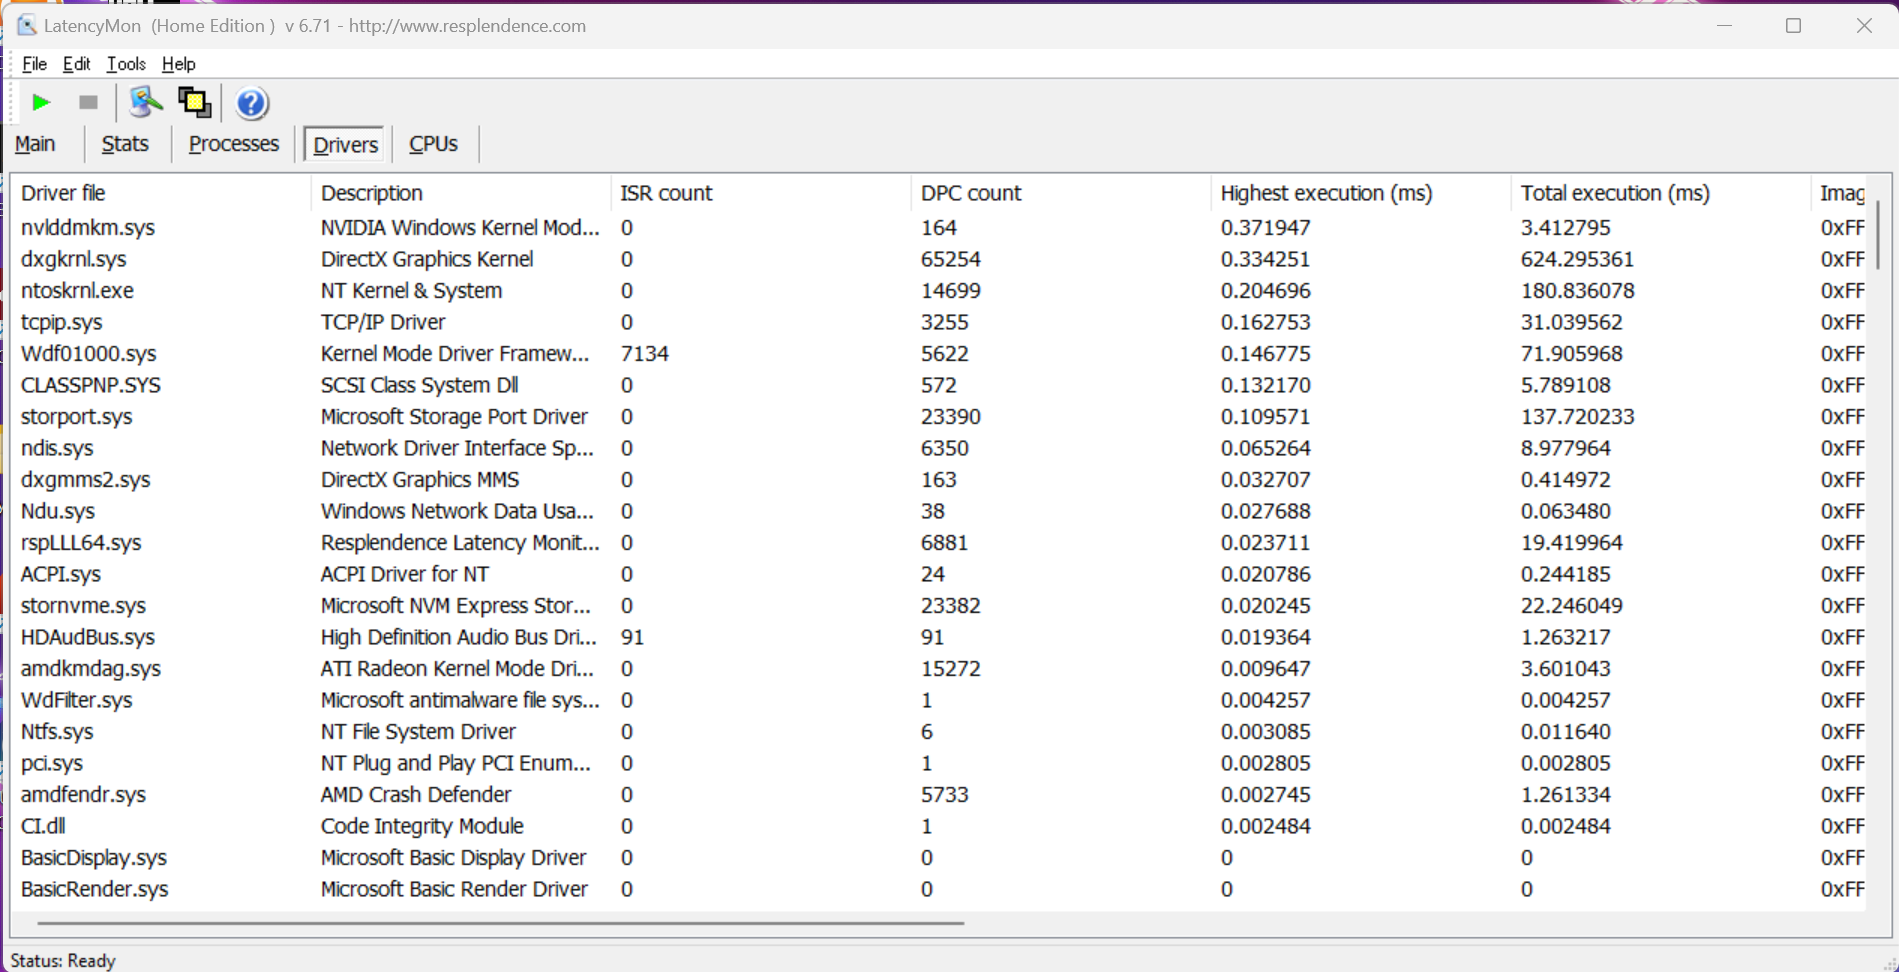
Dans notre test de latence standardisé (navigation web, lecture YouTube 4K, charge CPU), notre appareil de test a montré de légères restrictions lors de l'utilisation d'applications audio en temps réel avec la version actuelle du BIOS.
| DPC Latencies / LatencyMon - interrupt to process latency (max), Web, Youtube, Prime95 | |
| Asus ROG Strix Scar 17 G733PYV-LL053X | |
* ... Moindre est la valeur, meilleures sont les performances
Dispositifs de stockage
Un SSD de 1 To de SK Hynix (PC801) est installé dans le ROG Strix SCAR 17 X3D. Le SSD M.2 2280 est connecté via l'interface rapide PCIe 4.0 et offre de très bons taux de transfert. De plus, ses performances restent stables même en cas de charge permanente. Après le premier démarrage, les utilisateurs disposent de 868 Go, mais grâce au second emplacement M.2 (également M.2 2280, PCIe 4.0), l'espace de stockage peut être étendu si nécessaire. D'autres benchmarks SSD sont listés ici.

Reading continuous performance: DiskSpd Read Loop, Queue Depth 8
Carte graphique - GeForce RTX 4090 Laptop
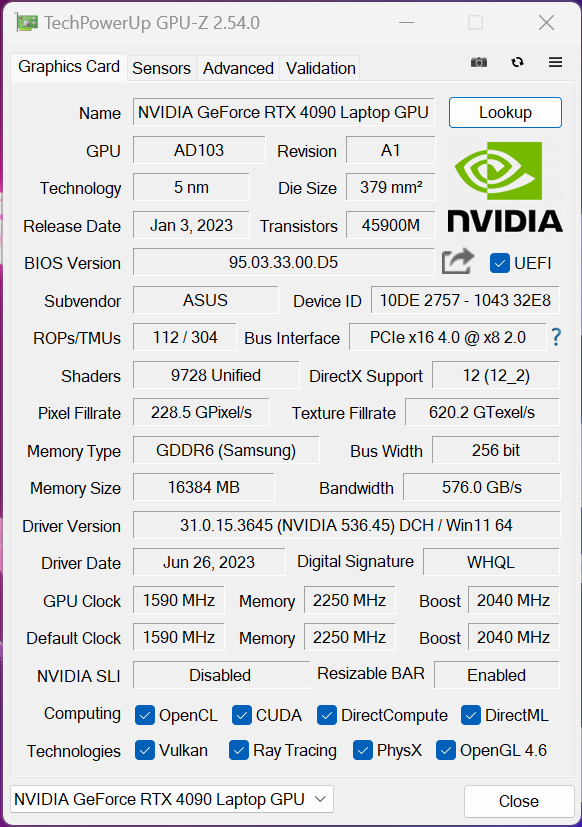
Le ROG Strix SCAR 17 X3D prend en charge la technologie Advanced Optimus de Nvidia. Lors de l'exécution de tâches simples, le processeur intégréRadeon 610Ms'occupe du traitement graphique et pour les tâches plus exigeantes (par exemple les jeux), l'ordinateur portable passe automatiquement à la carte graphique dédiée, laGeForce Ordinateur portable RTX 4090. Grâce à un commutateur MUX intégré, l'iGPU peut être désactivé sans qu'il soit nécessaire de redémarrer complètement l'ordinateur portable. Avec une consommation maximale de 175 watts (150 watts TGP + 25 watts Dynamic Boost), il s'agit de l'une des versions les plus rapides du RTX 4090 Laptop.
Il peut y avoir une ou deux différences dans les benchmarks mais dans l'ensemble, les ordinateurs portables équipés de la RTX 4090 Laptop fonctionnent pratiquement de la même manière. En utilisation sur batterie, le GeForce RTX 4090 Laptop a pu consommer un maximum de 55 watts, ce qui a suffi à lui assurer un score graphique de 5 590 points dans notre test Time Spy. Cela correspond à un déficit de 75 %. D'autres benchmarks GPU sont disponibles sur ici.
| 3DMark 11 Performance | 47621 points | |
| 3DMark Fire Strike Score | 41279 points | |
| 3DMark Time Spy Score | 19832 points | |
| 3DMark Steel Nomad Score | 5139 points | |
Aide | ||
| Blender / v3.3 Classroom OPTIX/RTX | |
| Lenovo Legion Pro 5 16ARX8 | |
| Moyenne de la classe Gaming (9 - 32, n=103, 2 dernières années) | |
| Asus ROG Zephyrus M16 GU604VY-NM042X | |
| Moyenne NVIDIA GeForce RTX 4090 Laptop GPU (9 - 19, n=39) | |
| Lenovo Legion Pro 7 RTX4090 | |
| MSI Titan GT77 HX 13VI | |
| Asus ROG Strix Scar 17 G733PY-XS96 | |
| Schenker Key 17 Pro (Early 23) | |
| Asus ROG Strix Scar 17 G733PYV-LL053X | |
| Asus ROG Strix Scar 18 2023 G834JY-N6005W | |
| Blender / v3.3 Classroom CUDA | |
| Lenovo Legion Pro 5 16ARX8 | |
| Moyenne de la classe Gaming (15 - 228, n=103, 2 dernières années) | |
| Schenker Key 17 Pro (Early 23) | |
| Moyenne NVIDIA GeForce RTX 4090 Laptop GPU (16 - 24, n=39) | |
| Asus ROG Strix Scar 18 2023 G834JY-N6005W | |
| Asus ROG Strix Scar 18 2023 G834JY-N6005W | |
| Asus ROG Zephyrus M16 GU604VY-NM042X | |
| Lenovo Legion Pro 7 RTX4090 | |
| Asus ROG Strix Scar 17 G733PYV-LL053X | |
| MSI Titan GT77 HX 13VI | |
| Alienware m18 R1 | |
| Asus ROG Strix Scar 17 G733PY-XS96 | |
| Blender / v3.3 Classroom CPU | |
| Asus ROG Zephyrus M16 GU604VY-NM042X | |
| Lenovo Legion Pro 5 16ARX8 | |
| Moyenne de la classe Gaming (122 - 565, n=99, 2 dernières années) | |
| Schenker Key 17 Pro (Early 23) | |
| Moyenne NVIDIA GeForce RTX 4090 Laptop GPU (144 - 305, n=39) | |
| Lenovo Legion Pro 7 RTX4090 | |
| Asus ROG Strix Scar 18 2023 G834JY-N6005W | |
| MSI Titan GT77 HX 13VI | |
| Alienware m18 R1 | |
| Asus ROG Strix Scar 17 G733PYV-LL053X | |
| Asus ROG Strix Scar 17 G733PY-XS96 | |
* ... Moindre est la valeur, meilleures sont les performances
Performance des jeux
Il est maintenant temps de jeter un coup d'œil aux benchmarks de jeu. Tout d'abord, nous allons nous intéresser à la résolution Full HD. Ici, les nouveaux processeursRyzen 9 7945HX3Da pu clairement montrer ses forces dans certains jeux et nous avons souvent noté des avantages en pourcentage à deux chiffres ; dans Far Cry 5, nous avons même mesuré un avantage de 36 % par rapport au Ryzen 9 7945HX normal ainsi qu'aux CPU HX d'Intel. Cependant, il n'y avait aucun avantage dans certains jeux, comme The Witcher 3 ou Call of Duty Modern Warfare 2.
| The Witcher 3 - 1920x1080 Ultra Graphics & Postprocessing (HBAO+) | |
| Alienware m18 R1 | |
| Asus ROG Strix Scar 17 G733PYV-LL053X | |
| Schenker Key 17 Pro (Early 23) | |
| Asus ROG Strix Scar 17 G733PY-XS96 | |
| Lenovo Legion Pro 7 RTX4090 | |
| MSI Titan GT77 HX 13VI | |
| Moyenne de la classe Gaming (104.7 - 240, n=7, 2 dernières années) | |
| Lenovo Legion Pro 5 16ARX8 | |
| Shadow of the Tomb Raider - 1920x1080 Highest Preset AA:T | |
| Asus ROG Strix Scar 17 G733PYV-LL053X | |
| Asus ROG Strix Scar 17 G733PY-XS96 | |
| MSI Titan GT77 HX 13VI | |
| Lenovo Legion Pro 5 16ARX8 | |
| Asus ROG Strix Scar 18 2023 G834JY-N6005W | |
| Moyenne de la classe Gaming (96 - 116, n=2, 2 dernières années) | |
| Far Cry 6 - 1920x1080 Ultra Graphics Quality + HD Textures AA:T | |
| Asus ROG Strix Scar 17 G733PYV-LL053X | |
| MSI Titan GT77 HX 13VI | |
| Moyenne de la classe Gaming (n=12 dernières années) | |
| Asus ROG Strix Scar 17 G733PY-XS96 | |
| Lenovo Legion Pro 5 16ARX8 | |
| Call of Duty Modern Warfare 2 2022 - 1920x1080 Extreme Quality Preset AA:T2X Filmic SM | |
| Asus ROG Strix Scar 17 G733PYV-LL053X | |
| Asus ROG Strix Scar 17 G733PY-XS96 | |
| MSI Titan GT77 HX 13VI | |
| Asus ROG Strix Scar 18 2023 G834JY-N6005W | |
| Lenovo Legion Pro 5 16ARX8 | |
| Cyberpunk 2077 1.6 - 1920x1080 Ultra Preset | |
| Asus ROG Strix Scar 17 G733PYV-LL053X | |
| MSI Titan GT77 HX 13VI | |
| Asus ROG Strix Scar 17 G733PY-XS96 | |
| Alienware m18 R1 | |
| Asus ROG Strix Scar 18 2023 G834JY-N6005W | |
| Lenovo Legion Pro 5 16ARX8 | |
En résolution QHD, le nouveau processeur a également montré ses avantages, bien que la différence ne soit pas aussi importante que pour les paramètres 1080p. Au total, le Ryzen 9 7945HX3D est toujours capable d'offrir de meilleures performances que ses concurrents - parfois même suffisamment pour s'assurer un pourcentage d'avantage à deux chiffres.
| Shadow of the Tomb Raider - 2560x1440 Highest Preset AA:T | |
| Asus ROG Strix Scar 17 G733PYV-LL053X | |
| Asus ROG Strix Scar 17 G733PY-XS96 | |
| MSI Titan GT77 HX 13VI | |
| Lenovo Legion Pro 7 RTX4090 | |
| Far Cry 5 - 2560x1440 Ultra Preset AA:T | |
| Asus ROG Strix Scar 17 G733PYV-LL053X | |
| MSI Titan GT77 HX 13VI | |
| Asus ROG Strix Scar 17 G733PY-XS96 | |
| Far Cry 6 - 2560x1440 Ultra Graphics Quality + HD Textures AA:T | |
| Asus ROG Strix Scar 17 G733PYV-LL053X | |
| MSI Titan GT77 HX 13VI | |
| Asus ROG Strix Scar 17 G733PY-XS96 | |
| Final Fantasy XV Benchmark - 2560x1440 High Quality | |
| MSI Titan GT77 HX 13VI | |
| Alienware m18 R1 | |
| Schenker Key 17 Pro (Early 23) | |
| Lenovo Legion Pro 7 RTX4090 | |
| Asus ROG Strix Scar 17 G733PYV-LL053X | |
| Asus ROG Strix Scar 17 G733PY-XS96 | |
| GTA V - 2560x1440 Highest AA:4xMSAA + FX AF:16x | |
| Asus ROG Strix Scar 17 G733PYV-LL053X | |
| Alienware m18 R1 | |
| Schenker Key 17 Pro (Early 23) | |
| MSI Titan GT77 HX 13VI | |
| Lenovo Legion Pro 7 RTX4090 | |
| Asus ROG Strix Scar 17 G733PY-XS96 | |
| F1 22 - 2560x1440 Ultra High Preset AA:T AF:16x | |
| Alienware m18 R1 | |
| Asus ROG Strix Scar 17 G733PY-XS96 | |
| Asus ROG Strix Scar 17 G733PYV-LL053X | |
| MSI Titan GT77 HX 13VI | |
| Lenovo Legion Pro 7 RTX4090 | |
| Call of Duty Modern Warfare 2 2022 - 2560x1440 Extreme Quality Preset AA:T2X Filmic SM | |
| Asus ROG Strix Scar 17 G733PYV-LL053X | |
| MSI Titan GT77 HX 13VI | |
| Asus ROG Strix Scar 17 G733PY-XS96 | |
| Lenovo Legion Pro 7 RTX4090 | |
| Cyberpunk 2077 1.6 - 2560x1440 Ultra Preset | |
| Asus ROG Strix Scar 17 G733PYV-LL053X | |
| Asus ROG Strix Scar 17 G733PY-XS96 | |
| Alienware m18 R1 | |
| Lenovo Legion Pro 7 RTX4090 | |
| MSI Titan GT77 HX 13VI | |
En résolution 4K, le nouveau Ryzen 9 7945HX3D ne présente aucun avantage par rapport au Ryzen 9 7945HX classique ou aux processeurs mobiles HX d'Intel - bien que tous les modèles se situent à un niveau comparable.
| Shadow of the Tomb Raider - 3840x2160 Highest Preset AA:T | |
| Lenovo Legion Pro 7 RTX4090 | |
| Asus ROG Strix Scar 17 G733PY-XS96 | |
| Asus ROG Strix Scar 17 G733PYV-LL053X | |
| MSI Titan GT77 HX 13VI | |
| Far Cry 5 - 3840x2160 Ultra Preset AA:T | |
| MSI Titan GT77 HX 13VI | |
| Asus ROG Strix Scar 17 G733PYV-LL053X | |
| Asus ROG Strix Scar 17 G733PY-XS96 | |
| Far Cry 6 - 3840x2160 Ultra Graphics Quality + HD Textures AA:T | |
| MSI Titan GT77 HX 13VI | |
| Asus ROG Strix Scar 17 G733PYV-LL053X | |
| Asus ROG Strix Scar 17 G733PY-XS96 | |
| Final Fantasy XV Benchmark - 3840x2160 High Quality | |
| MSI Titan GT77 HX 13VI | |
| Asus ROG Strix Scar 17 G733PY-XS96 | |
| Alienware m18 R1 | |
| Schenker Key 17 Pro (Early 23) | |
| Lenovo Legion Pro 7 RTX4090 | |
| Asus ROG Strix Scar 17 G733PYV-LL053X | |
| GTA V - 3840x2160 High/On (Advanced Graphics Off) AA:FX AF:8x | |
| Asus ROG Strix Scar 17 G733PYV-LL053X | |
| Alienware m18 R1 | |
| MSI Titan GT77 HX 13VI | |
| Lenovo Legion Pro 7 RTX4090 | |
| Asus ROG Strix Scar 17 G733PY-XS96 | |
| Schenker Key 17 Pro (Early 23) | |
| F1 22 - 3840x2160 Ultra High Preset AA:T AF:16x | |
| Lenovo Legion Pro 7 RTX4090 | |
| Asus ROG Strix Scar 17 G733PY-XS96 | |
| Alienware m18 R1 | |
| Asus ROG Strix Scar 17 G733PYV-LL053X | |
| MSI Titan GT77 HX 13VI | |
| Call of Duty Modern Warfare 2 2022 - 3840x2160 Extreme Quality Preset AA:T2X Filmic SM | |
| MSI Titan GT77 HX 13VI | |
| Asus ROG Strix Scar 17 G733PYV-LL053X | |
| Asus ROG Strix Scar 17 G733PY-XS96 | |
| Lenovo Legion Pro 7 RTX4090 | |
| Cyberpunk 2077 1.6 - 3840x2160 Ultra Preset | |
| MSI Titan GT77 HX 13VI | |
| Asus ROG Strix Scar 17 G733PYV-LL053X | |
| Lenovo Legion Pro 7 RTX4090 | |
| Alienware m18 R1 | |
| Asus ROG Strix Scar 17 G733PY-XS96 | |
| Bas | Moyen | Élevé | Ultra | QHD DLSS | QHD | 4K DLSS | 4K | |
|---|---|---|---|---|---|---|---|---|
| GTA V (2015) | 187.1 | 167.7 | 160.6 | 182.7 | ||||
| The Witcher 3 (2015) | 414 | 207 | 163 | 155 | ||||
| Dota 2 Reborn (2015) | 288 | 255 | 244 | 220 | 205 | |||
| Final Fantasy XV Benchmark (2018) | 229 | 180 | 151.2 | 85 | ||||
| X-Plane 11.11 (2018) | 196.3 | 190.3 | 166.2 | 139.5 | ||||
| Far Cry 5 (2018) | 248 | 232 | 218 | 194 | 110 | |||
| Strange Brigade (2018) | 460 | 420 | 318 | 161 | ||||
| Shadow of the Tomb Raider (2018) | 293 | 271 | 199 | 104 | ||||
| Assassin´s Creed Valhalla (2020) | 195 | 178 | 138 | 80 | ||||
| F1 2021 (2021) | 685 | 616 | 470 | 271 | 204 | 115.1 | ||
| Far Cry 6 (2021) | 182 | 167 | 146 | 88 | ||||
| Cyberpunk 2077 1.6 (2022) | 205 | 157 | 116 | 51 | ||||
| F1 22 (2022) | 281 | 135.9 | 91.8 | 45 | ||||
| Call of Duty Modern Warfare 2 2022 (2022) | 190 | 182 | 136 | 83 | ||||
| Star Wars Jedi Survivor (2023) | 106 | 103 | 71 | 39 | ||||
| F1 23 (2023) | 374 | 132 | 85.1 | 73.5 | 42.2 | |||
| Baldur's Gate 3 (2023) | 178.8 | 133.3 | 114 | 74.6 | ||||
| Cyberpunk 2077 (2023) | 158 | 99.5 | 44.2 | |||||
| Alan Wake 2 (2023) | 116.1 | 82 | 43.4 | |||||
| F1 24 (2024) | 144.9 | 150.4 | 96.8 | 83.2 | 48.4 | |||
| Call of Duty Black Ops 6 (2024) | 150 | 129 | 119 | 78 | 76 | |||
| Indiana Jones and the Great Circle (2024) | 128.4 | 117.9 | 100.5 | 60.6 | ||||
| Monster Hunter Wilds (2025) | 85.6 | 81.7 | 69.4 | 58.5 | 42.8 | |||
| Assassin's Creed Shadows (2025) | 55 | 56 | 47 | 46 | 34 |
Émissions - Le SCAR 17 émet un bruit de bobine gênant
Émissions sonores
Bien sûr, il faut s'attendre à entendre les ventilateurs d'un appareil aussi puissant, mais l'ordinateur portable dispose d'un mode silencieux qui désactive complètement les ventilateurs dans le cadre d'une utilisation quotidienne. C'est très pratique si vous surfez sur le web, écrivez des e-mails ou regardez des vidéos. Le jeu n'est pas possible dans ce mode et dans ce cas, nous avons noté des valeurs d'émission de bruit relativement décentes d'environ 41 dB(A). Cependant, nous avons malheureusement noté des bruits de bobine très gênants lors de nos tests de jeu (et jamais lors d'autres utilisations). Les ventilateurs sont considérablement plus bruyants en mode Performance et Turbo (~48 dB(A) & 54 dB(A)), ce qui couvre même le bruit de la bobine. Quoi qu'il en soit, nous recommandons l'utilisation d'un casque pour l'un ou l'autre de ces modes. Le tableau suivant montre les émissions sonores des ventilateurs dans différentes applications et profils énergétiques.
| Scénario | Silencieux | Performance | Turbo |
|---|---|---|---|
| 3DMark 06 | 30 dB(A) | 35.5 dB(A) | 53.4 dB(A) |
| The Witcher 3 (réglages Ultra) | 40.9 dB(A) | 48.5 dB(A) | 53.4 dB(A) |
| Cyberpunk 2077 (réglages Ultra) | 40,9 dB(A) | 48,5 dB(A) | 53,4 dB(A) |
| Stress test | 40.9 dB(A) | 48.5 dB(A) | 53.4 dB(A) |
Degré de la nuisance sonore
| Au repos |
| 23 / 27.7 / 34.7 dB(A) |
| Fortement sollicité |
| 53.4 / 53.4 dB(A) |
 | ||
30 dB silencieux 40 dB(A) audible 50 dB(A) bruyant |
||
min: | ||
| Asus ROG Strix Scar 17 G733PYV-LL053X GeForce RTX 4090 Laptop GPU, R9 7945HX3D, SK hynix PC801 HFS001TEJ9X101N | Asus ROG Strix Scar 17 G733PY-XS96 GeForce RTX 4090 Laptop GPU, R9 7945HX, SK hynix PC801 HFS001TEJ9X101N | Alienware m18 R1 GeForce RTX 4090 Laptop GPU, i9-13980HX, SK hynix PC801 HFS001TEJ9X101N | Asus ROG Strix Scar 18 2023 G834JY-N6005W GeForce RTX 4090 Laptop GPU, i9-13980HX, 2x Samsung PM9A1 MZVL21T0HCLR (RAID 0) | MSI Titan GT77 HX 13VI GeForce RTX 4090 Laptop GPU, i9-13950HX, Samsung PM9A1 MZVL22T0HBLB | Schenker Key 17 Pro (Early 23) GeForce RTX 4090 Laptop GPU, i9-13900HX, Samsung 990 Pro 2 TB MZVL72T0HDLB | |
|---|---|---|---|---|---|---|
| Noise | 9% | 12% | 2% | -5% | -17% | |
| arrêt / environnement * (dB) | 23 | 22.7 1% | 22.8 1% | 23.9 -4% | 24.6 -7% | 26 -13% |
| Idle Minimum * (dB) | 23 | 23.5 -2% | 23 -0% | 23.9 -4% | 29.2 -27% | 26 -13% |
| Idle Average * (dB) | 27.7 | 27.7 -0% | 23 17% | 32.6 -18% | 29.2 -5% | 33 -19% |
| Idle Maximum * (dB) | 34.7 | 27.7 20% | 23 34% | 32.6 6% | 29.2 16% | 46 -33% |
| Load Average * (dB) | 53.4 | 30.5 43% | 35.6 33% | 35.9 33% | 50.7 5% | 56 -5% |
| Witcher 3 ultra * (dB) | 53.4 | 51.4 4% | 51.3 4% | 53.3 -0% | 62 -16% | |
| Load Maximum * (dB) | 53.4 | 54.1 -1% | 56.7 -6% | 55.8 -4% | 61 -14% | 64 -20% |
* ... Moindre est la valeur, meilleures sont les performances
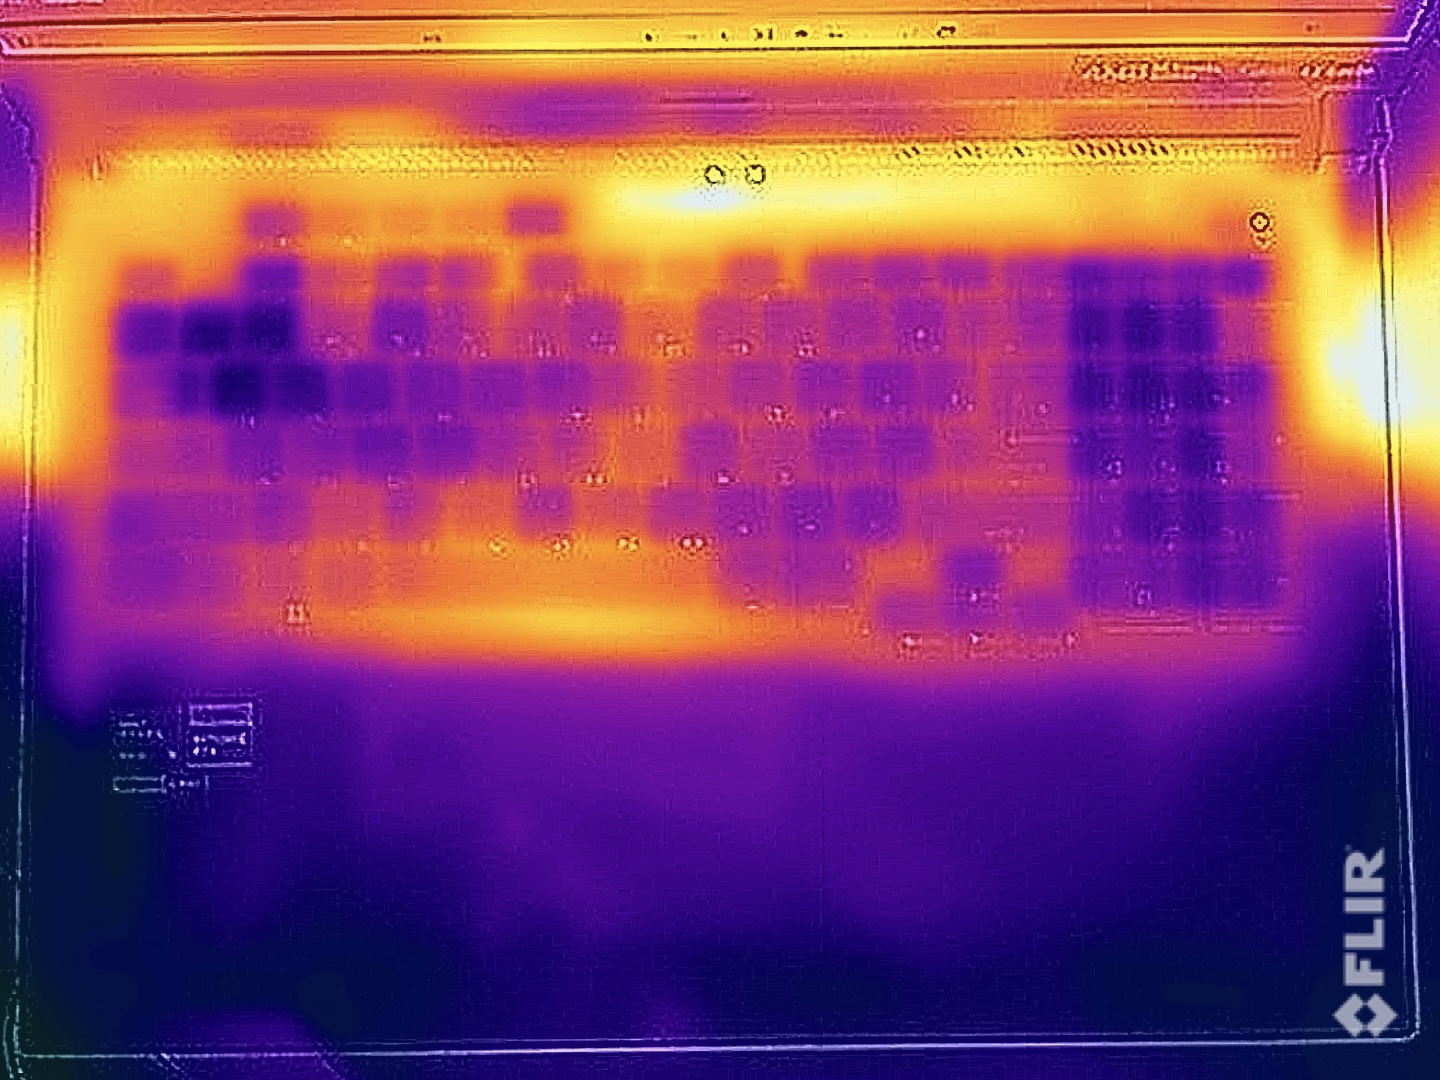
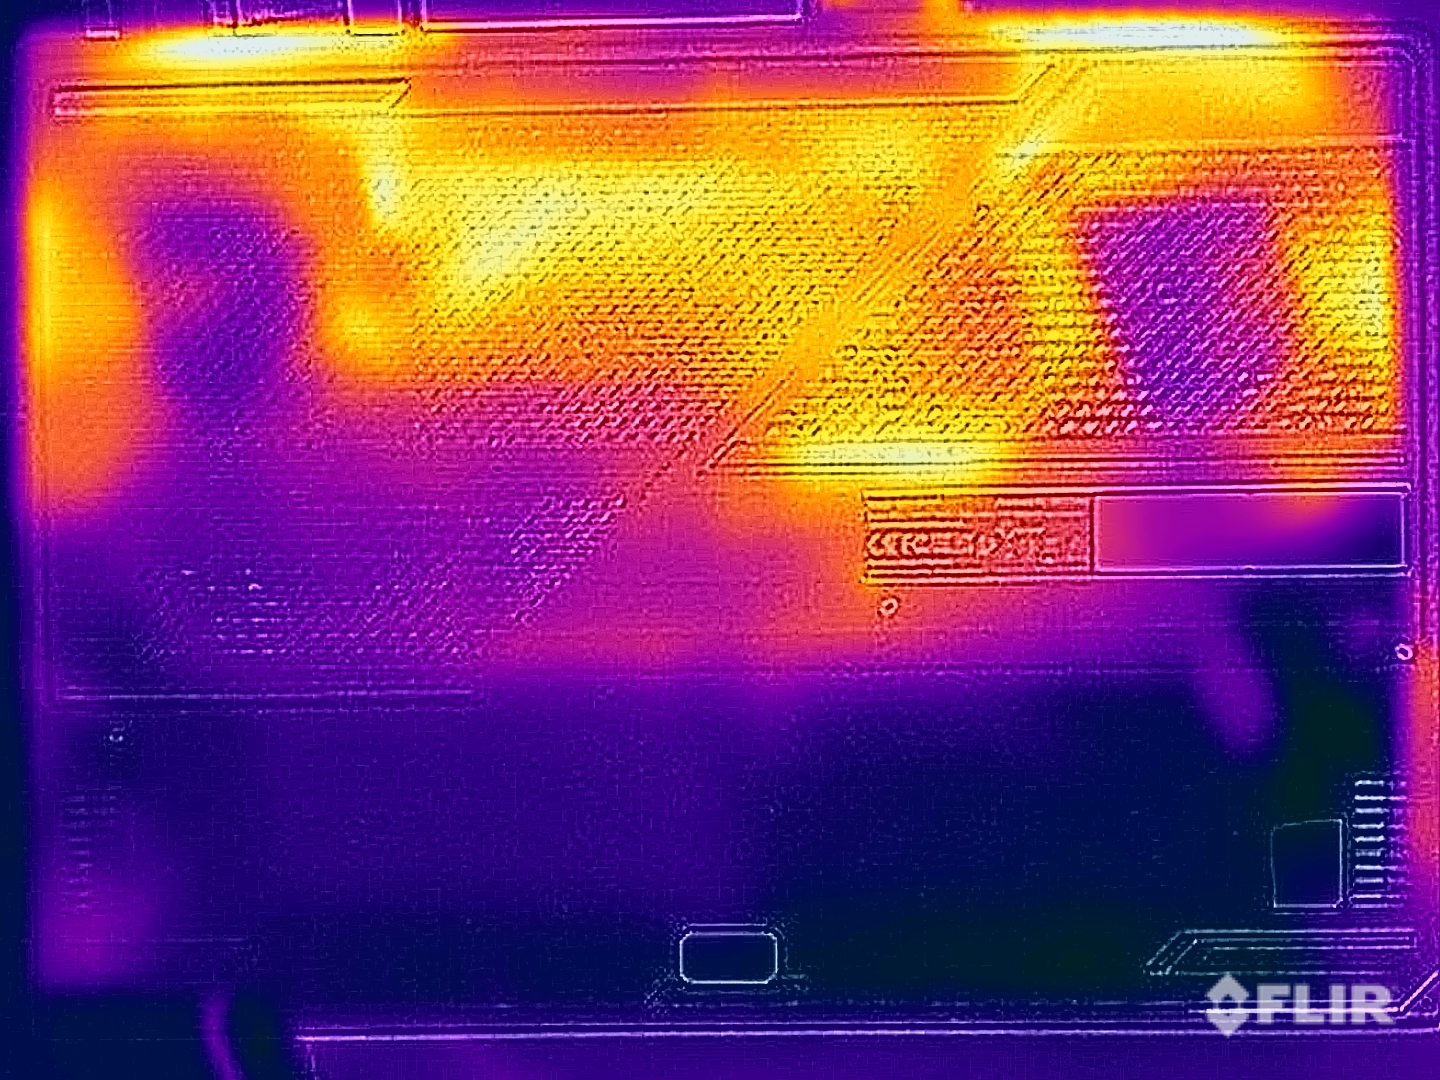
Température
Même sous charge, les températures de surface de l'ordinateur portable se sont avérées tout à fait correctes - vous pouvez facilement placer le SCAR 17 sur vos cuisses pendant que vous jouez sans aucune plainte (bien que vous ne voudrez probablement pas le faire en raison de sa taille). Pendant le test de stress, le GPU a été favorisé, ce qui était déjà clair en regardant les configurations TDP/TGP. Au début du test, le processeur consommait 85 watts et le GPU 120 watts - après quelques minutes, le processeur s'équilibrait à 50 watts et la carte graphique consommait 175 watts.
(±) La température maximale du côté supérieur est de 40.1 °C / 104 F, par rapport à la moyenne de 40.4 °C / 105 F, allant de 21.2 à 68.8 °C pour la classe Gaming.
(-) Le fond chauffe jusqu'à un maximum de 46.7 °C / 116 F, contre une moyenne de 43.2 °C / 110 F
(+) En utilisation inactive, la température moyenne du côté supérieur est de 25.8 °C / 78 F, par rapport à la moyenne du dispositif de 33.9 °C / 93 F.
(±) En jouant à The Witcher 3, la température moyenne du côté supérieur est de 33.3 °C / 92 F, alors que la moyenne de l'appareil est de 33.9 °C / 93 F.
(+) Les repose-poignets et le pavé tactile sont plus froids que la température de la peau avec un maximum de 25.6 °C / 78.1 F et sont donc froids au toucher.
(+) La température moyenne de la zone de l'appui-paume de dispositifs similaires était de 28.8 °C / 83.8 F (+3.2 °C / #5.7 F).
| Asus ROG Strix Scar 17 G733PYV-LL053X AMD Ryzen 9 7945HX3D, NVIDIA GeForce RTX 4090 Laptop GPU | Asus ROG Strix Scar 17 G733PY-XS96 AMD Ryzen 9 7945HX, NVIDIA GeForce RTX 4090 Laptop GPU | Alienware m18 R1 Intel Core i9-13980HX, NVIDIA GeForce RTX 4090 Laptop GPU | Asus ROG Strix Scar 18 2023 G834JY-N6005W Intel Core i9-13980HX, NVIDIA GeForce RTX 4090 Laptop GPU | MSI Titan GT77 HX 13VI Intel Core i9-13950HX, NVIDIA GeForce RTX 4090 Laptop GPU | Schenker Key 17 Pro (Early 23) Intel Core i9-13900HX, NVIDIA GeForce RTX 4090 Laptop GPU | |
|---|---|---|---|---|---|---|
| Heat | 7% | 4% | -15% | 1% | -29% | |
| Maximum Upper Side * (°C) | 40.1 | 34.6 14% | 39 3% | 54 -35% | 40.6 -1% | 57 -42% |
| Maximum Bottom * (°C) | 46.7 | 35.6 24% | 36.4 22% | 46 1% | 41.1 12% | 60 -28% |
| Idle Upper Side * (°C) | 26.5 | 27.2 -3% | 29.2 -10% | 30 -13% | 26.2 1% | 32 -21% |
| Idle Bottom * (°C) | 27.7 | 30 -8% | 27.8 -0% | 31 -12% | 30.3 -9% | 34 -23% |
* ... Moindre est la valeur, meilleures sont les performances
Gestion de l'énergie - Un ordinateur portable de jeu peu endurant
Consommation électrique
Sans surprise, le SCAR 17 X3D consomme beaucoup d'énergie et au début du test de stress, nous avons mesuré environ 328 watts. Après quelques instants, la consommation s'est stabilisée à 300 watts - pendant le jeu, elle se situait entre 260 et 300 watts. Par conséquent, la prise d'alimentation fournie est suffisamment grande.
| Éteint/en veille | |
| Au repos | |
| Fortement sollicité |
|
Légende:
min: | |
| Asus ROG Strix Scar 17 G733PYV-LL053X R9 7945HX3D, GeForce RTX 4090 Laptop GPU, SK hynix PC801 HFS001TEJ9X101N, IPS, 2560x1440, 17.3" | Asus ROG Strix Scar 17 G733PY-XS96 R9 7945HX, GeForce RTX 4090 Laptop GPU, SK hynix PC801 HFS001TEJ9X101N, IPS, 2560x1440, 17.3" | Alienware m18 R1 i9-13980HX, GeForce RTX 4090 Laptop GPU, SK hynix PC801 HFS001TEJ9X101N, IPS, 1920x1200, 18" | Asus ROG Strix Scar 18 2023 G834JY-N6005W i9-13980HX, GeForce RTX 4090 Laptop GPU, 2x Samsung PM9A1 MZVL21T0HCLR (RAID 0), IPS, 2560x1600, 18" | MSI Titan GT77 HX 13VI i9-13950HX, GeForce RTX 4090 Laptop GPU, Samsung PM9A1 MZVL22T0HBLB, Mini-LED, 3840x2160, 17.3" | Schenker Key 17 Pro (Early 23) i9-13900HX, GeForce RTX 4090 Laptop GPU, Samsung 990 Pro 2 TB MZVL72T0HDLB, IPS, 3840x2160, 17.3" | Moyenne NVIDIA GeForce RTX 4090 Laptop GPU | Moyenne de la classe Gaming | |
|---|---|---|---|---|---|---|---|---|
| Power Consumption | -13% | -46% | -32% | -6% | -10% | -15% | 8% | |
| Idle Minimum * (Watt) | 15.4 | 14.5 6% | 21.6 -40% | 17.3 -12% | 14 9% | 18 -17% | 16.2 ? -5% | 13.1 ? 15% |
| Idle Average * (Watt) | 21.6 | 21.1 2% | 25.2 -17% | 27 -25% | 21.6 -0% | 20 7% | 23.1 ? -7% | 19 ? 12% |
| Idle Maximum * (Watt) | 22.2 | 42.8 -93% | 56.7 -155% | 46 -107% | 24.8 -12% | 25 -13% | 34.2 ? -54% | 24.6 ? -11% |
| Load Average * (Watt) | 116.7 | 116.7 -0% | 164.1 -41% | 133 -14% | 122.5 -5% | 136 -17% | 130.5 ? -12% | 111.3 ? 5% |
| Witcher 3 ultra * (Watt) | 262 | 278 -6% | 311 -19% | 265 -1% | 292 -11% | |||
| Cyberpunk 2077 ultra external monitor * (Watt) | 272 | |||||||
| Load Maximum * (Watt) | 327.1 | 279.6 15% | 338.9 -4% | 329 -1% | 418 -28% | 358 -9% | 324 ? 1% | 260 ? 21% |
* ... Moindre est la valeur, meilleures sont les performances
Power consumption Witcher 3 / stress test
Power consumption with external monitor
Délais d'exécution
La batterie de 90 Wh permet une autonomie de 4 à 5 heures dans les tests WLAN 60 Hz et vidéo (en fonction de la luminosité), ce qui correspond à la consommation en veille. Ce n'est pas beaucoup et certains concurrents offrent plus d'endurance. Toutefois, par rapport à son prédécesseurl'endurance de l'ordinateur portable s'est au moins un peu améliorée.
| Asus ROG Strix Scar 17 G733PYV-LL053X R9 7945HX3D, GeForce RTX 4090 Laptop GPU, 90 Wh | Asus ROG Strix Scar 17 G733PY-XS96 R9 7945HX, GeForce RTX 4090 Laptop GPU, 90 Wh | Alienware m18 R1 i9-13980HX, GeForce RTX 4090 Laptop GPU, 97 Wh | Asus ROG Strix Scar 18 2023 G834JY-N6005W i9-13980HX, GeForce RTX 4090 Laptop GPU, 90 Wh | MSI Titan GT77 HX 13VI i9-13950HX, GeForce RTX 4090 Laptop GPU, 99.9 Wh | Schenker Key 17 Pro (Early 23) i9-13900HX, GeForce RTX 4090 Laptop GPU, 99 Wh | Moyenne de la classe Gaming | |
|---|---|---|---|---|---|---|---|
| Autonomie de la batterie | -15% | -16% | 29% | 29% | 44% | 60% | |
| H.264 (h) | 5 | 7 40% | 6 20% | 8.27 ? 65% | |||
| WiFi v1.3 (h) | 4.8 | 4.1 -15% | 4.3 -10% | 7.1 48% | 5.3 10% | 6.9 44% | 7.08 ? 48% |
| Load (h) | 0.9 | 0.7 -22% | 0.9 0% | 1.4 56% | 1.496 ? 66% | ||
| Witcher 3 ultra (h) | 0.9 |
Points positifs
Points négatifs
Verdict - Le ROG Strix SCAR 17 X3D est désormais encore plus rapide
Grâce aux nouveauxAMD Ryzen 9 9745HX3Dle ROG Strix SCAR 17 X3D d'Asus est encore plus rapide, ce qui en fait l'un des ordinateurs portables de jeu les plus rapides qui soient. Le nouveau processeur, grâce à son 3D V-Cache supplémentaire, est capable d'afficher des pourcentages d'augmentation de performance à deux chiffres - en particulier pour les jeux en 1080p. Dans les résolutions QHD plus élevées, ses avantages ne sont pas aussi importants et en 4K, il n'y a pas vraiment de différence par rapport au Ryzen 9 7945HX classique.
Comme le nouveau Ryzen 9 7945HX3D n'est pas compatible avec le liquid metal, ses performances maximales en matière de CPU multicœur sont en fait un peu moins bonnes que celles du Ryzen 9 7945HX, ce qui est la conséquence directe de son refroidissement plus faible. En fin de compte, leurs performances sont comparables dans l'utilisation quotidienne, et les puces continuent d'être beaucoup plus efficaces que les processeurs HX d'Intel.
Grâce à l'AMD Ryzen 9 7945HX3D, le nouveau ROG Strix SCAR 17 3DX est encore plus rapide pour les jeux en résolution Full HD/QHD. Il est ainsi présenté comme l'ordinateur portable de jeu le plus rapide du marché.
En effet, bien que les performances soient bonnes, le design de l'ordinateur, avec son écran 16:9, semble un peu dépassé à ce stade. En outre, nous aurions aimé voir une version plus réservée du ProArt qui pourrait être utilisé discrètement comme station de travail. Son mode silencieux, normalement pratique, peut à peine être utilisé pendant les jeux, car vous entendez constamment un bruit de bobine agaçant et nous vous recommandons d'utiliser un casque pour tout autre profil énergétique. Le bruit de la bobine et l'unité de refroidissement bruyante empêchent également cet ordinateur portable d'obtenir une meilleure note.
Prix et disponibilité
Le nouveau Asus ROG Strix SCAR 17 X3D est disponible à partir du 22 août. Dès que nous aurons des informations officielles sur les prix, nous mettrons à jour cet article.
Asus ROG Strix Scar 17 G733PYV-LL053X
- 08/22/2023 v7 (old)
Andreas Osthoff
Transparency
La sélection des appareils à examiner est effectuée par notre équipe éditoriale. L'échantillon de test a été prêté à l'auteur par le fabricant ou le détaillant pour les besoins de cet examen. Le prêteur n'a pas eu d'influence sur cette évaluation et le fabricant n'a pas reçu de copie de cette évaluation avant sa publication. Il n'y avait aucune obligation de publier cet article. En tant que média indépendant, Notebookcheck n'est pas soumis à l'autorité des fabricants, des détaillants ou des éditeurs.
Voici comment Notebookcheck teste
Chaque année, Notebookcheck examine de manière indépendante des centaines d'ordinateurs portables et de smartphones en utilisant des procédures standardisées afin de garantir que tous les résultats sont comparables. Nous avons continuellement développé nos méthodes de test depuis environ 20 ans et avons établi des normes industrielles dans le processus. Dans nos laboratoires de test, des équipements de mesure de haute qualité sont utilisés par des techniciens et des rédacteurs expérimentés. Ces tests impliquent un processus de validation en plusieurs étapes. Notre système d'évaluation complexe repose sur des centaines de mesures et de points de référence bien fondés, ce qui garantit l'objectivité.Price comparison

