
Verdict
Le Nitro V 15 est actuellement vendu à un peu plus de 1 000 euros. Les acheteurs qui n'ont pas d'attentes particulièrement élevées obtiendront un ordinateur portable de jeu capable qui n'atteindra peut-être pas les niveaux de performance les plus élevés, mais qui, mis à part sa gamme de couleurs d'affichage limitée, ne commet pas d'erreur majeure. En commençant par le châssis, qui présente un couvercle texturé attrayant, l'appareil offre également des périphériques d'entrée décents et une solide sélection de ports, y compris Thunderbolt 4.
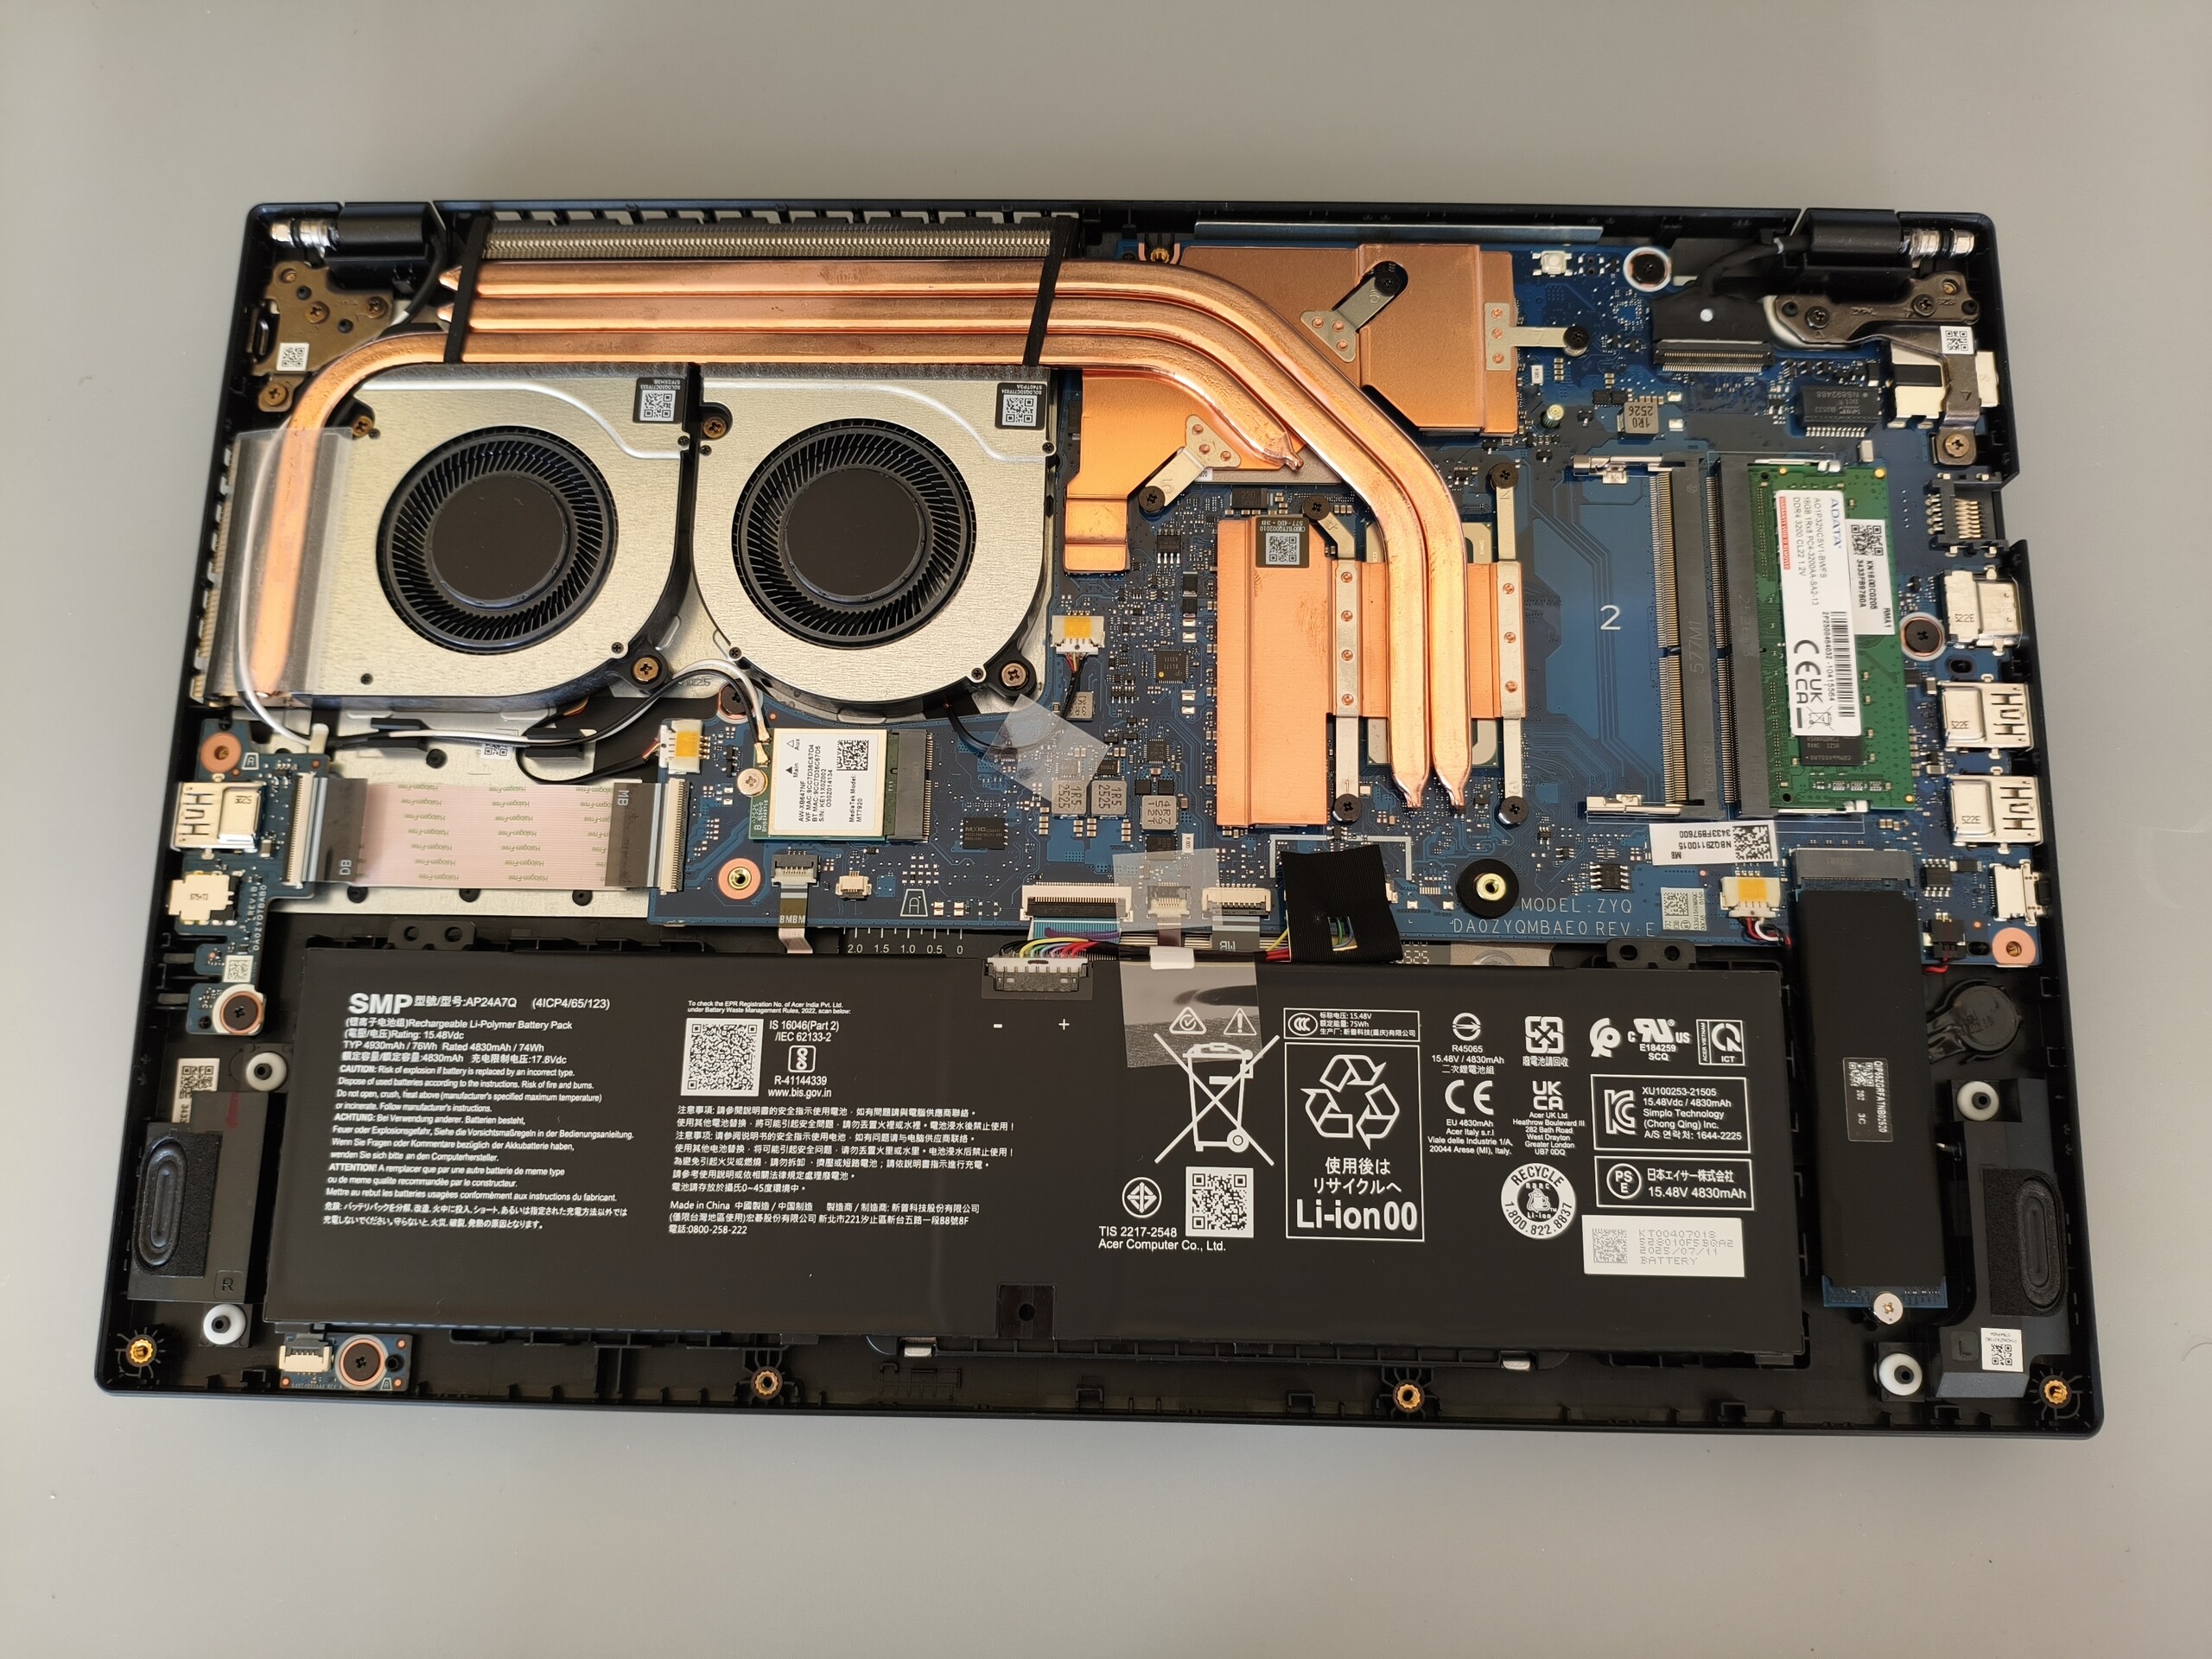
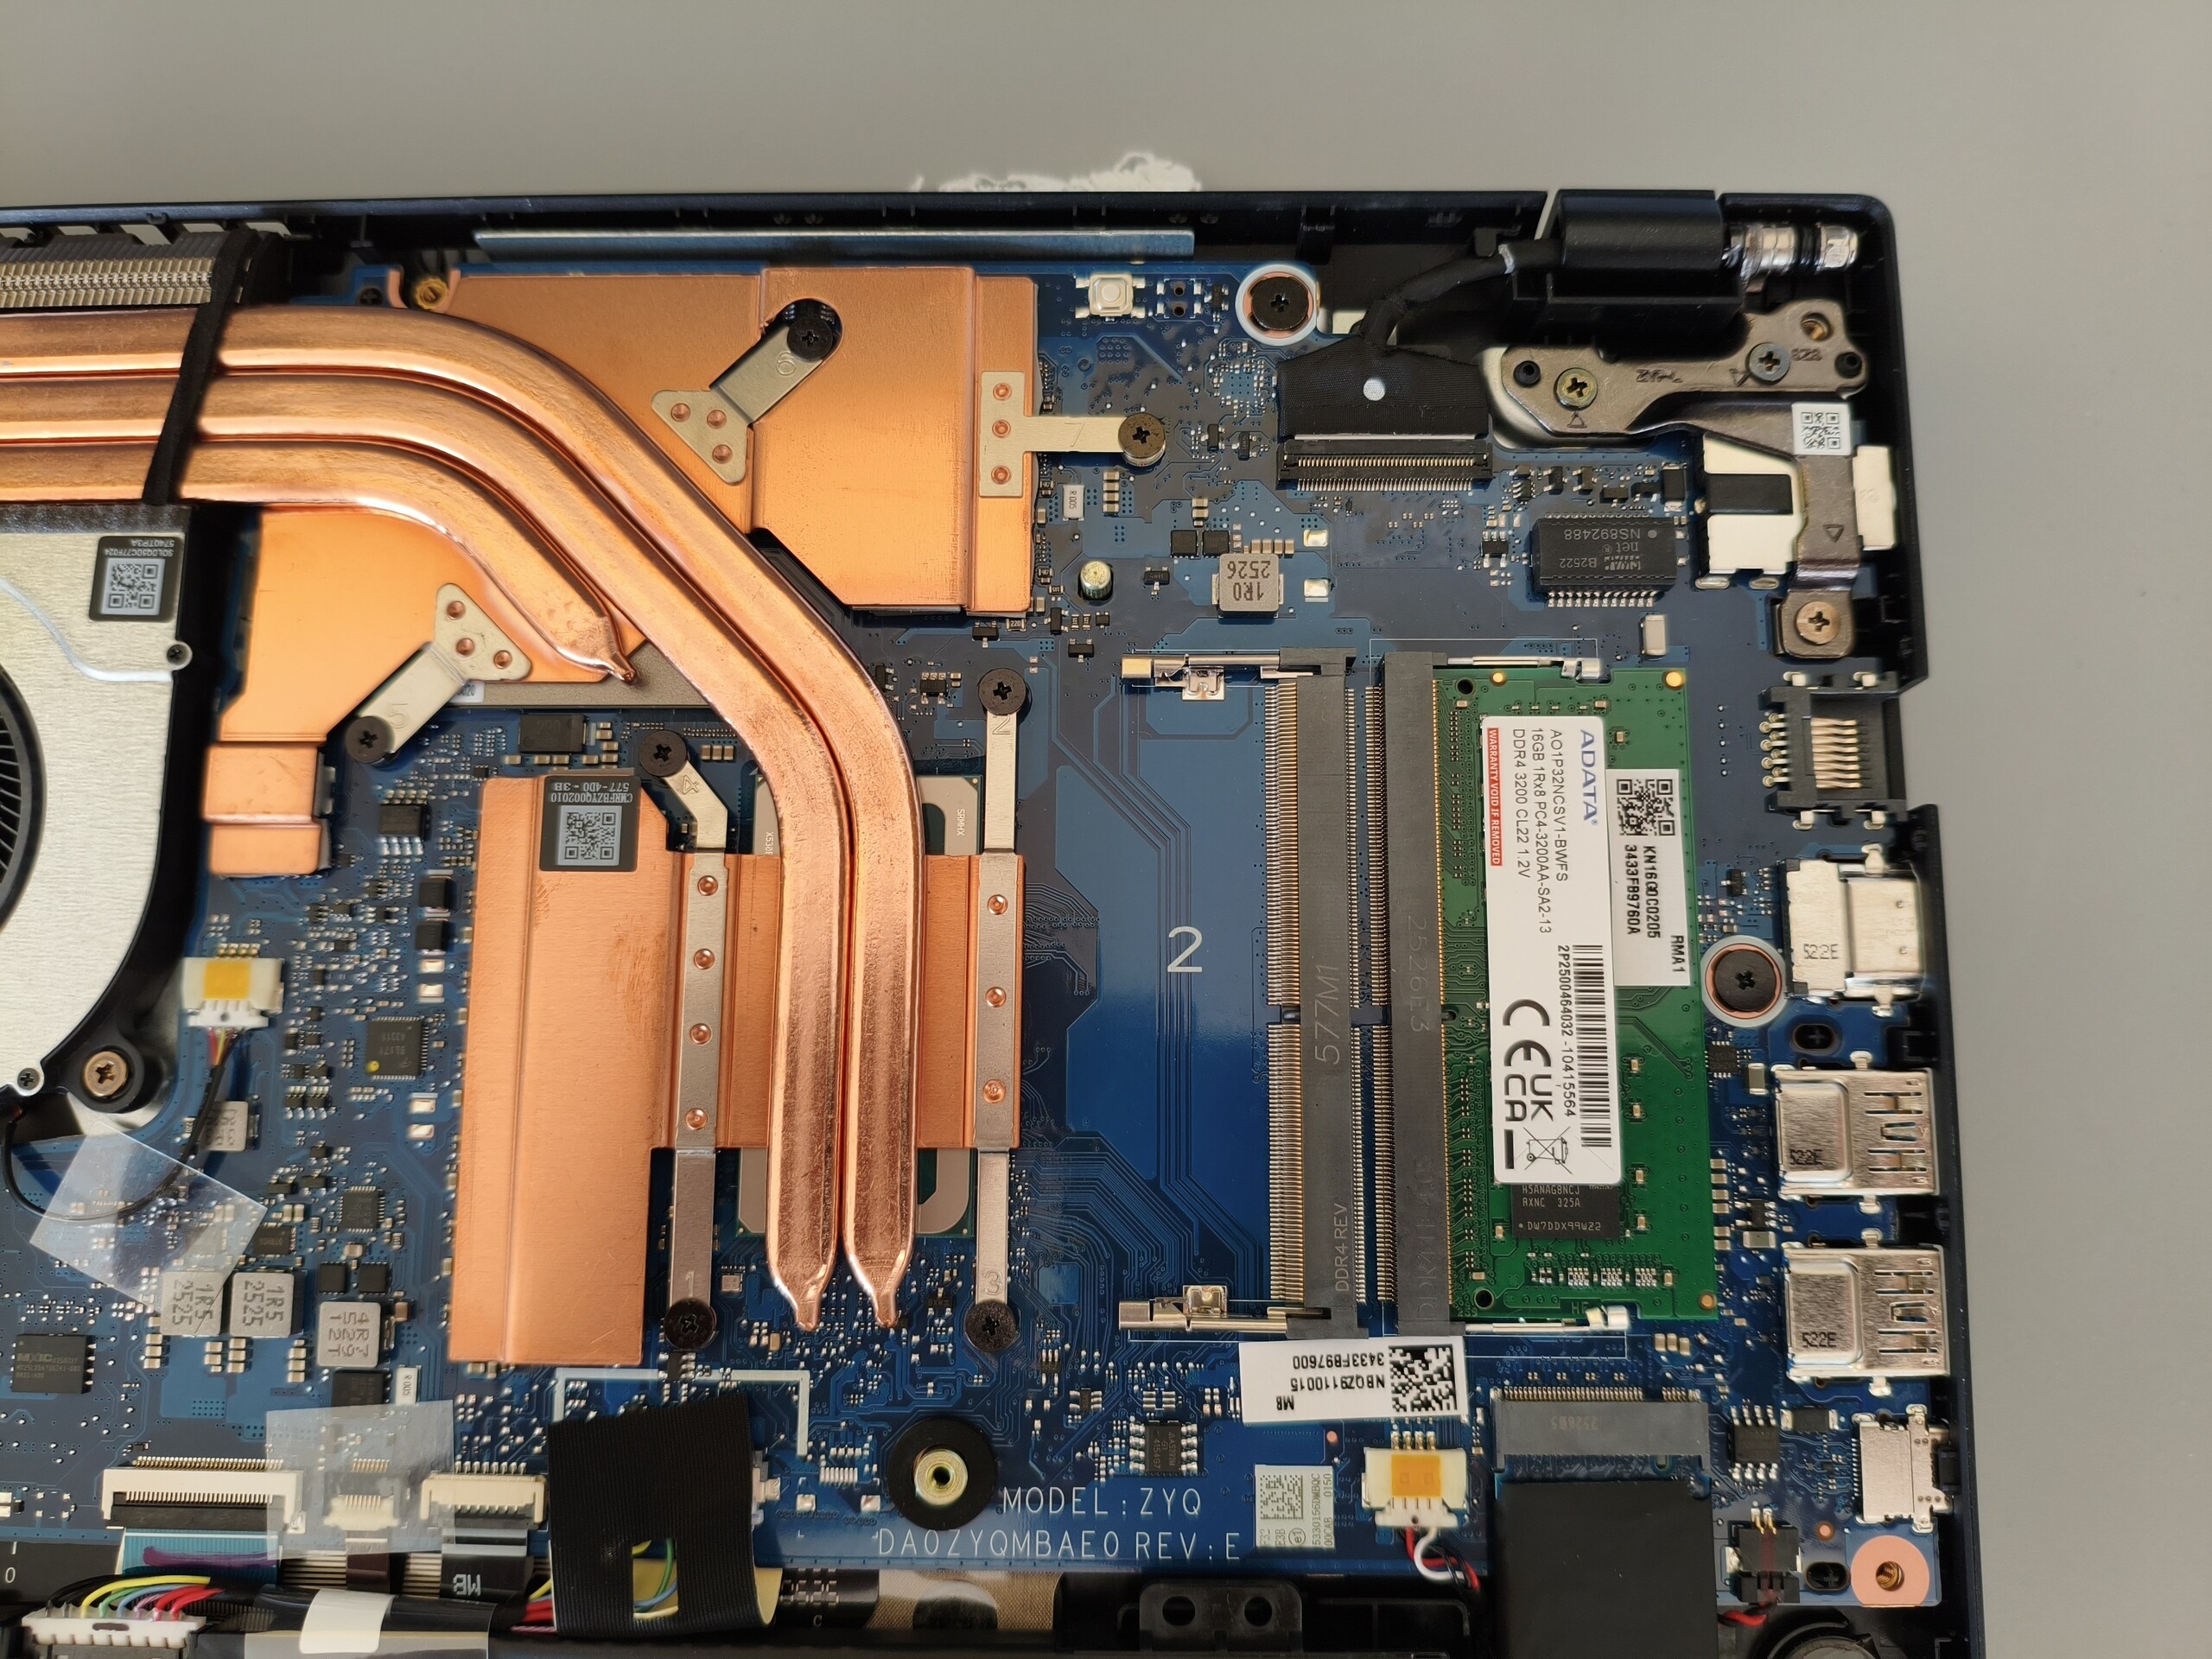
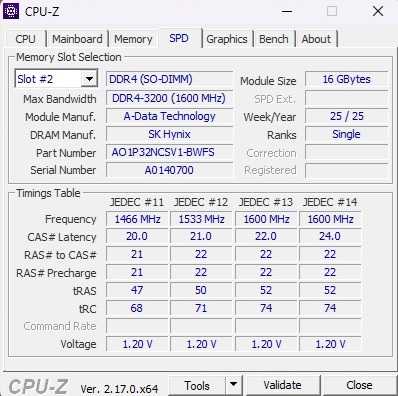
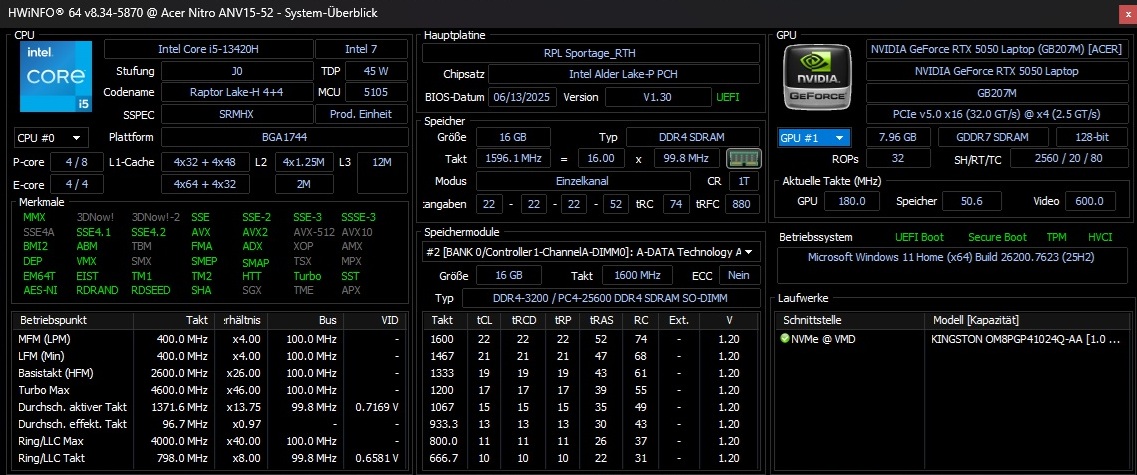
Comme la RAM (2 x 8 Go DDR4) et le SSD (1 TB M.2) ne sont pas soudés, la mémoire et le stockage peuvent être mis à niveau si nécessaire. Malheureusement, les performances de jeu sont quelque peu freinées, car le Core i5-13420H et la RTX 5050 ne sont pas en mesure d'exploiter pleinement leur potentiel dans cette configuration. Dans l'ensemble, cet ordinateur portable de 15 pouces manque de peu d'obtenir la note "Bien".
D'autres ordinateurs portables dans cette catégorie de prix et de performances méritent d'être pris en considération, notamment le MSI Cyborg 15et le HP Victus 15 et le Lenovo LOQ 15.
Points positifs
Points négatifs
Prix et disponibilité
L'Acer Nitro V 15 ANV15-52-50S2 testé est disponible auprès de divers détaillants en ligne à des prix débutant à environ 1 050 euros (par exemple, sur Notebooksbilliger). Les prix et la disponibilité peuvent varier d'une région à l'autre.
Spécifications
Cas
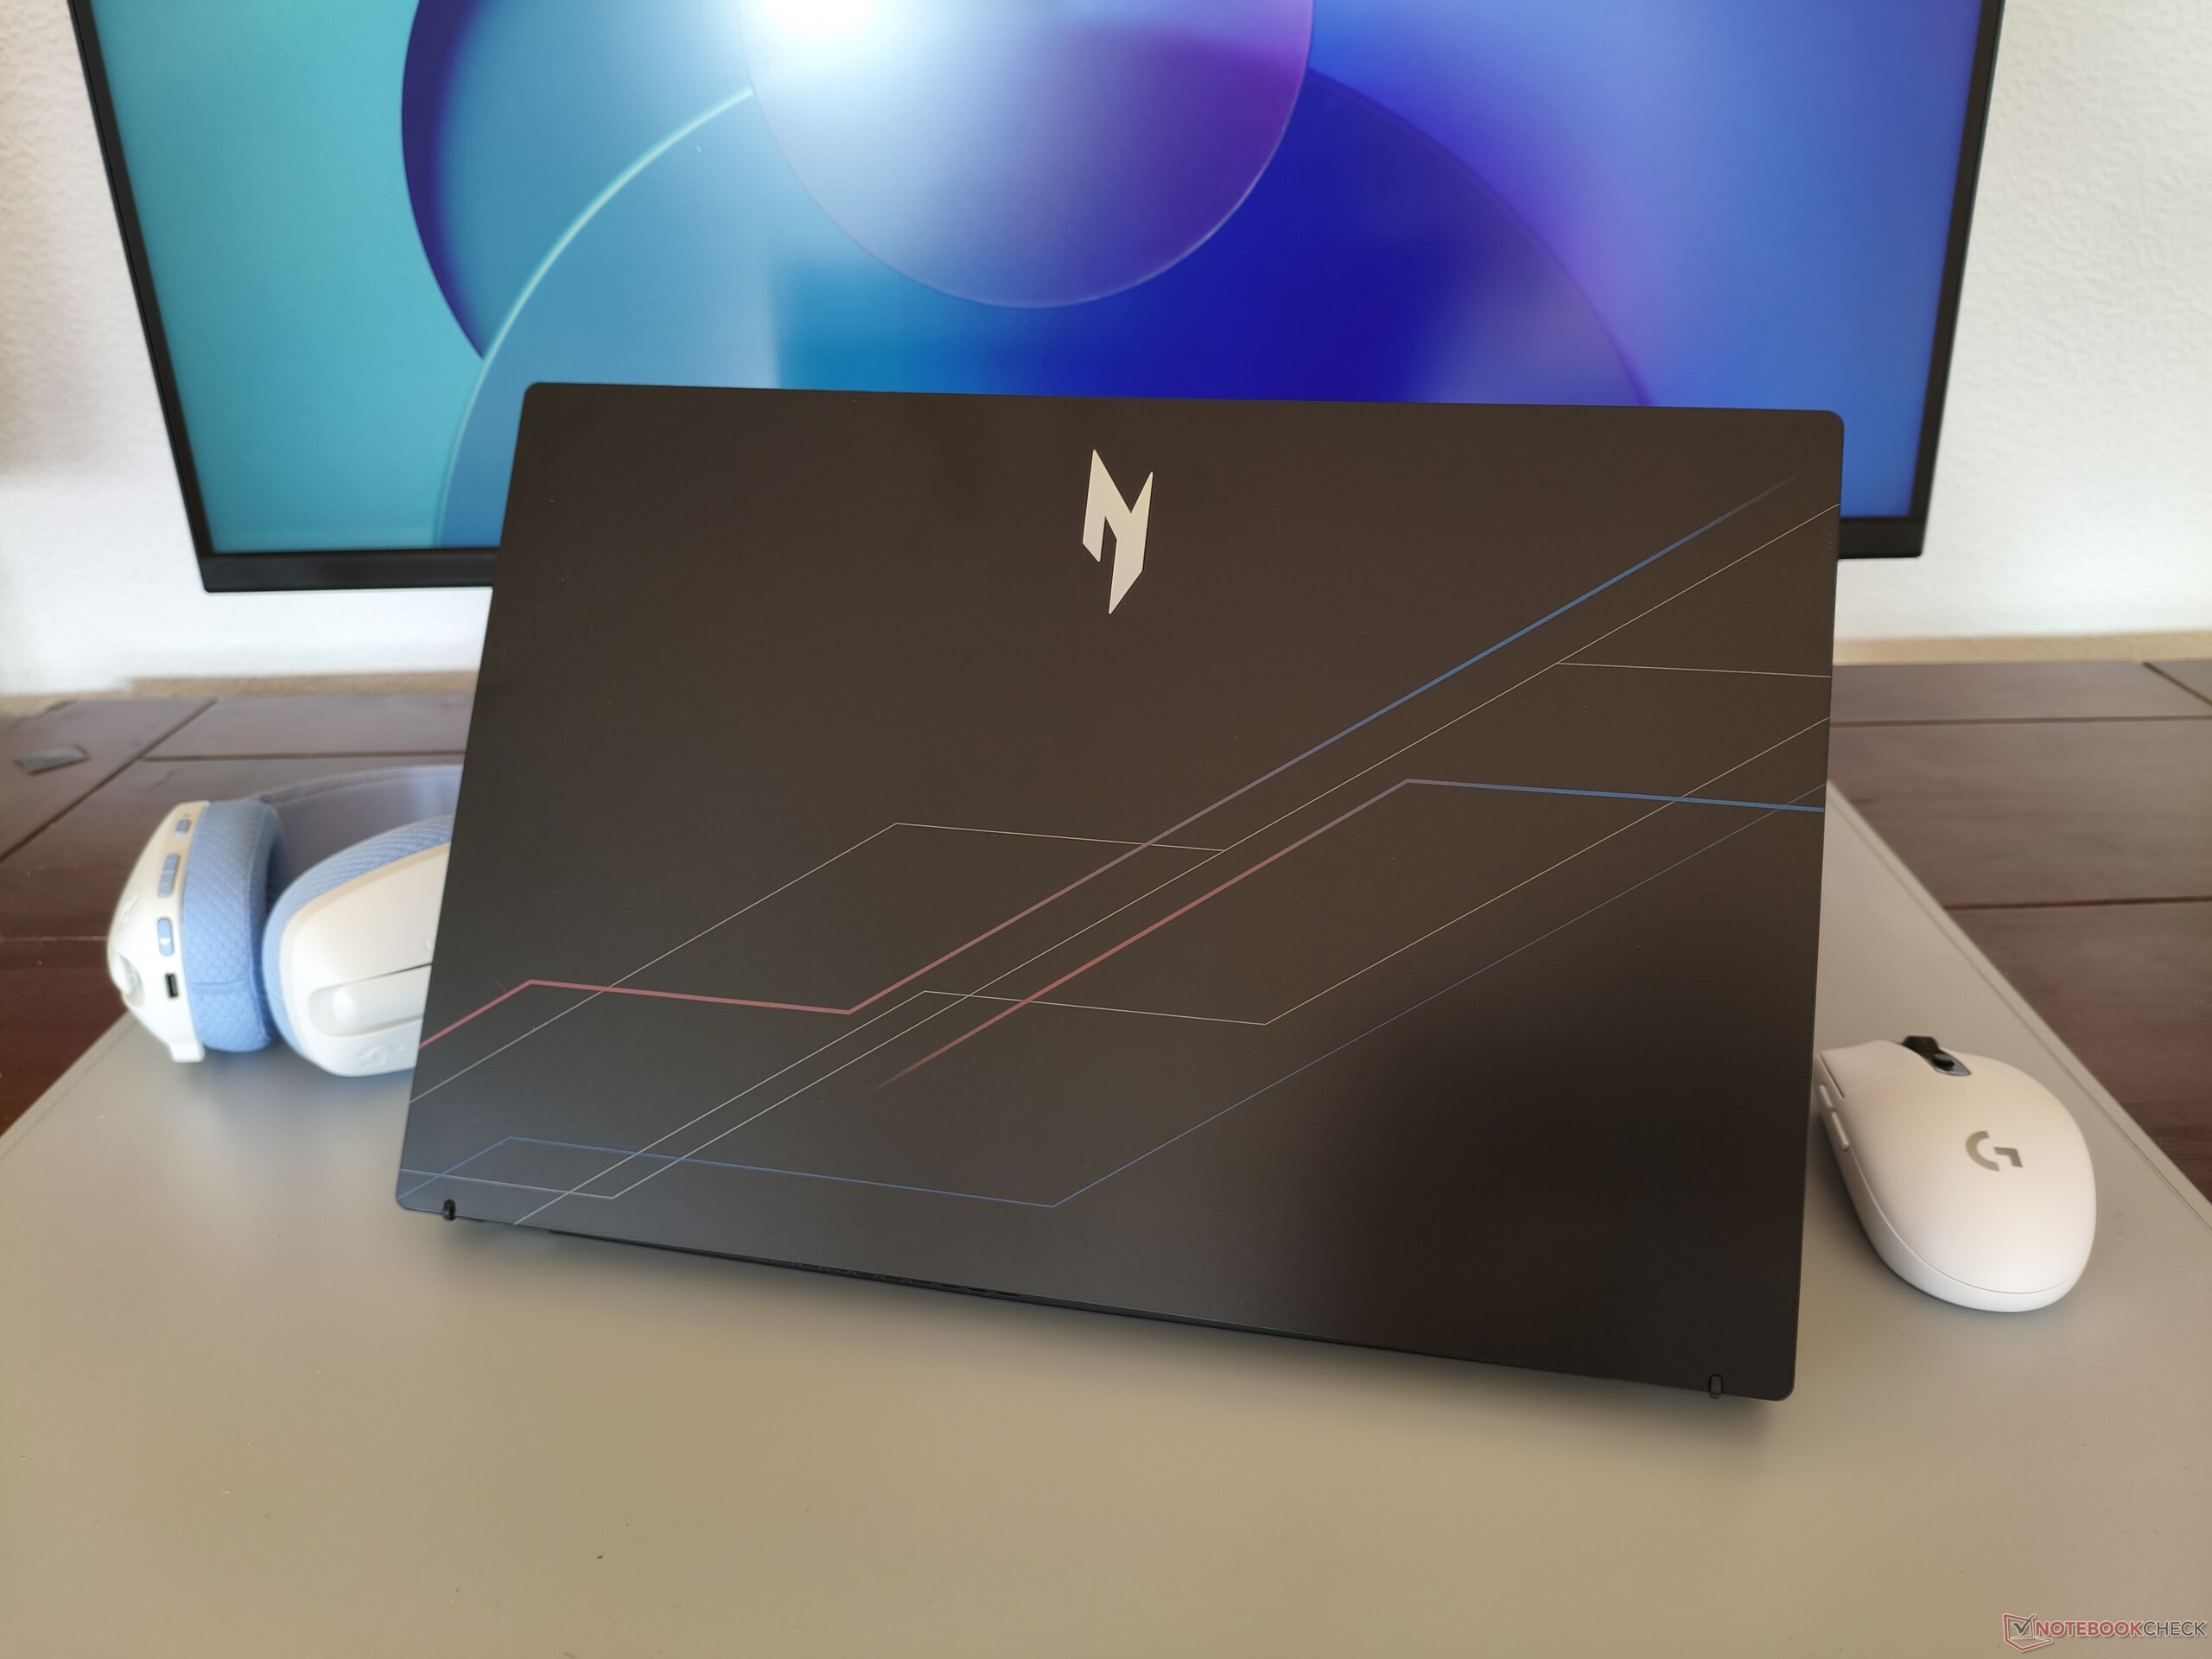
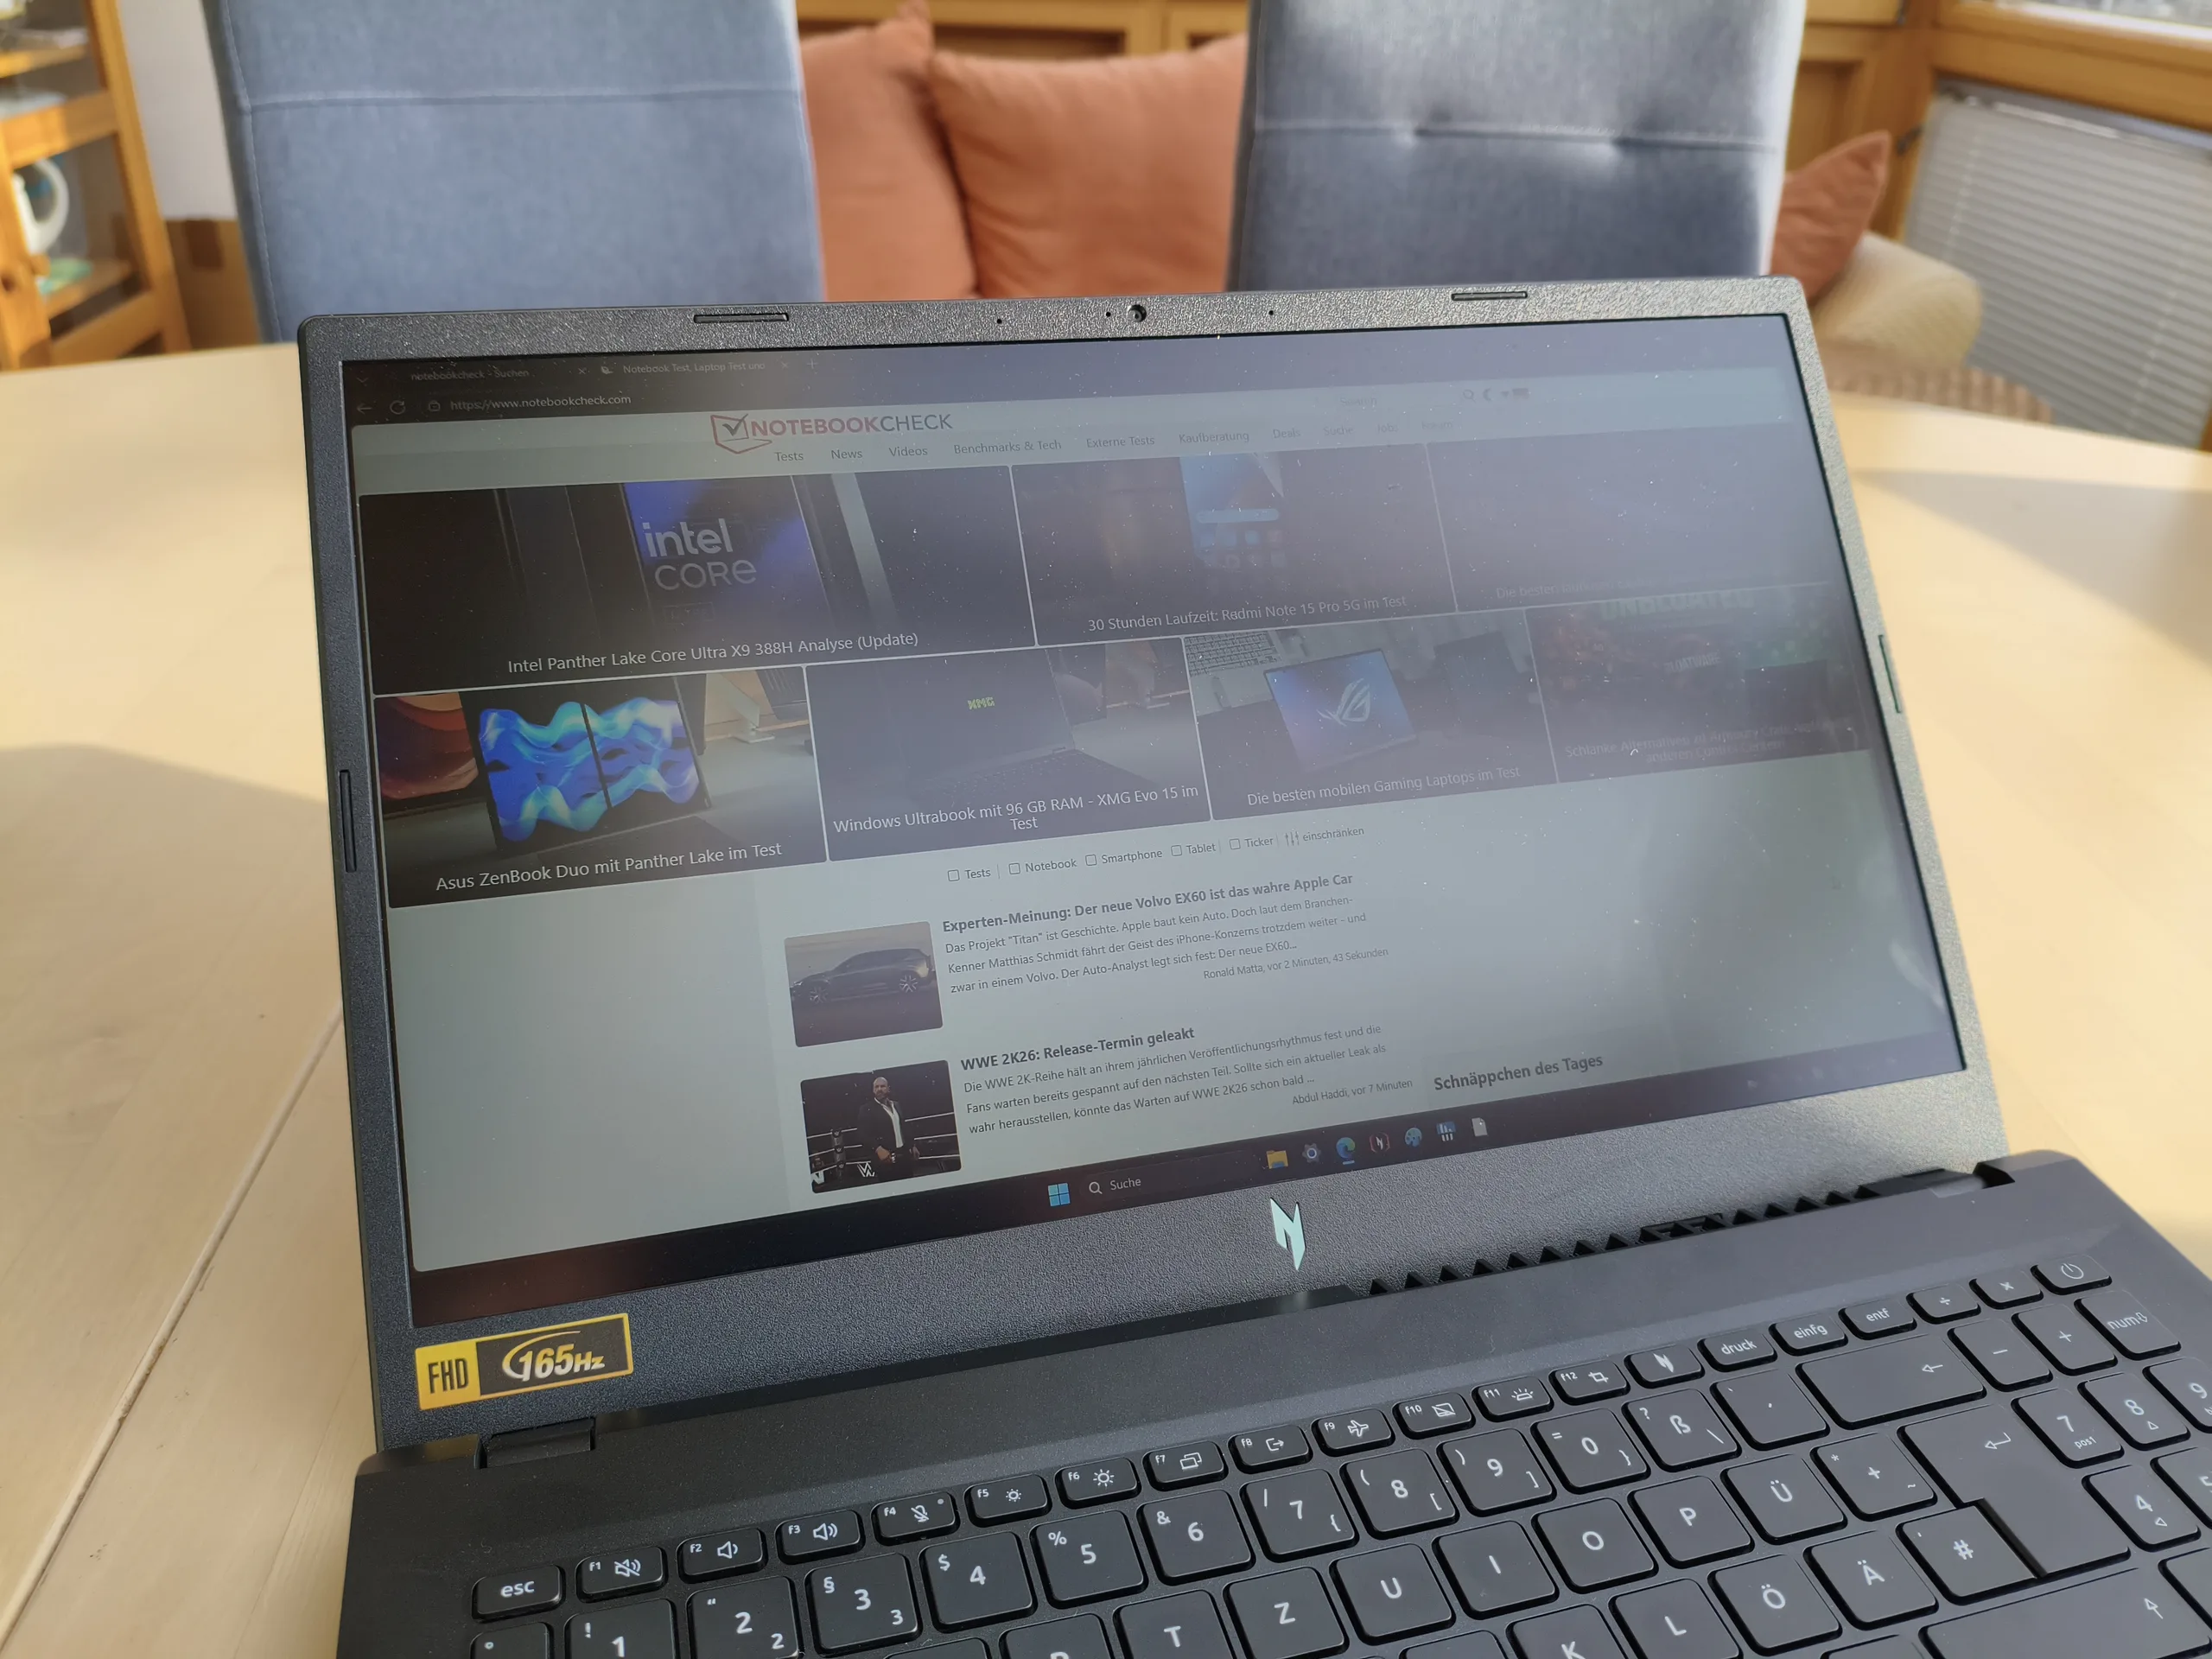
Acer utilise un châssis entièrement en plastique qui est généralement bien fini, bien que certaines zones présentent une flexion notable. Les charnières sont un peu lâches et permettent à l'écran de s'ouvrir à un angle maximal d'environ 145°. Avec un poids de 2,1 kg, l'ordinateur portable correspond à son prédécesseur en termes de poids, tandis que le design général reste similaire, mais pas entièrement inchangé.

Connectivité
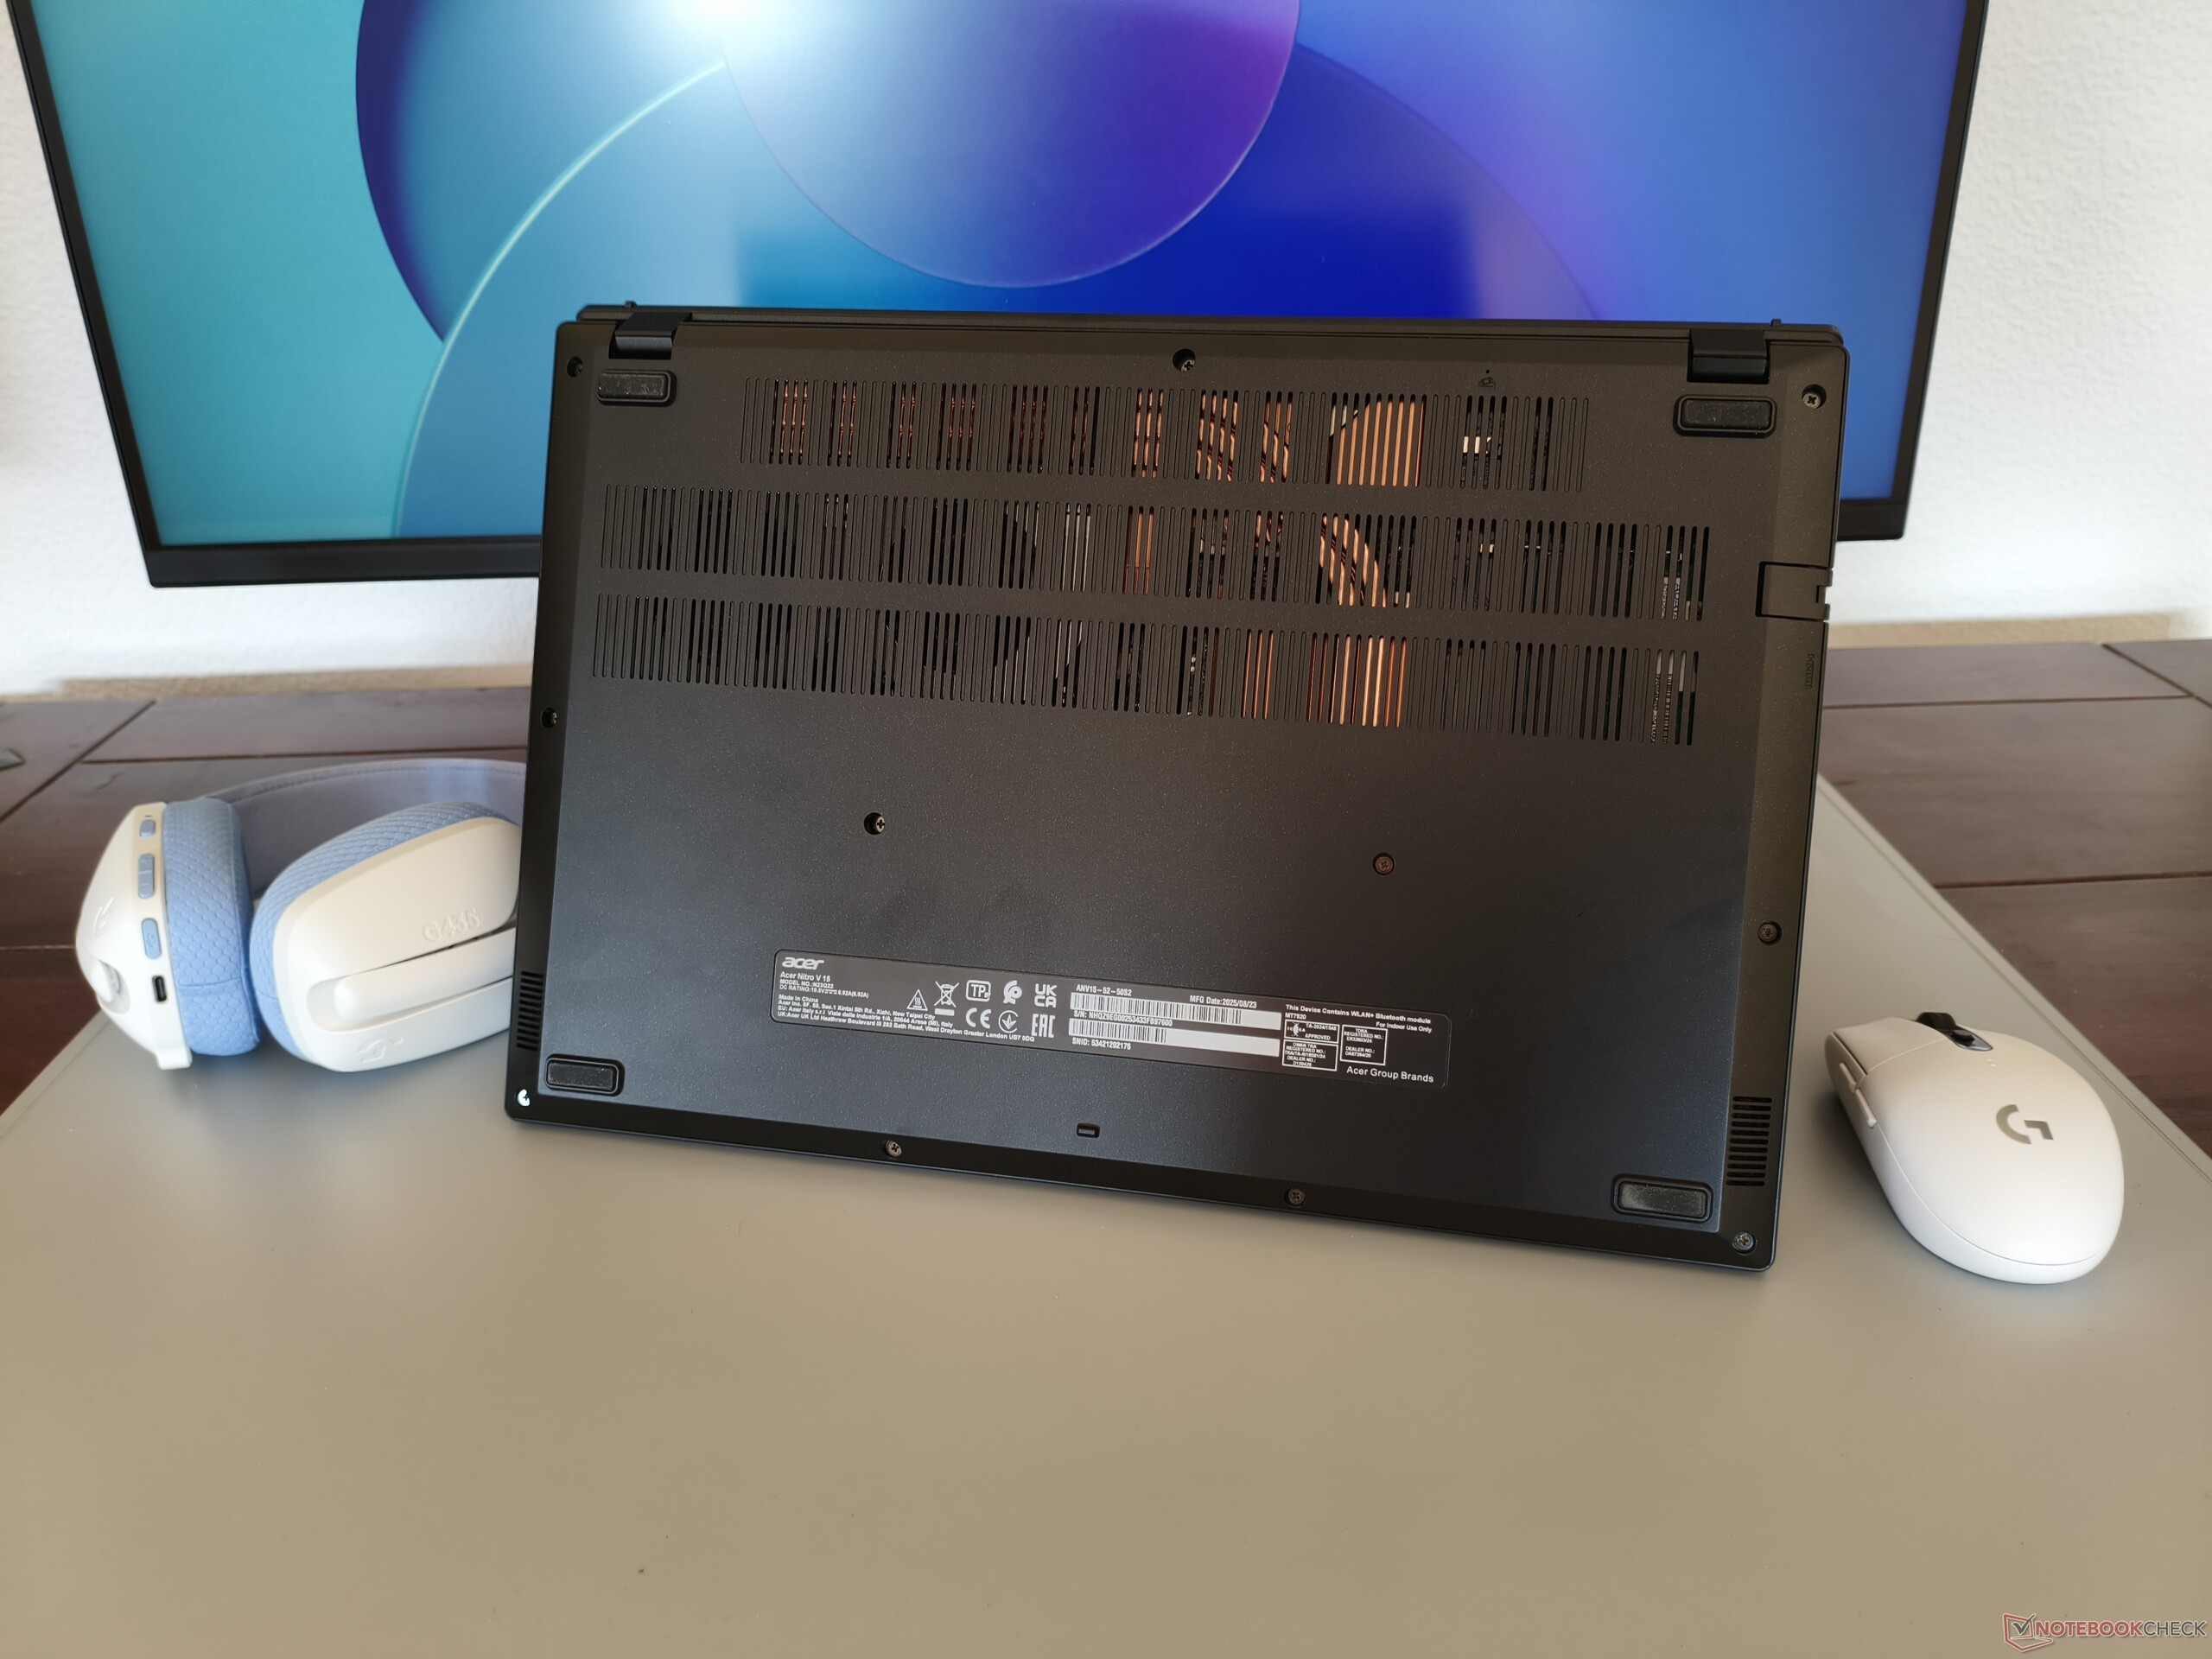
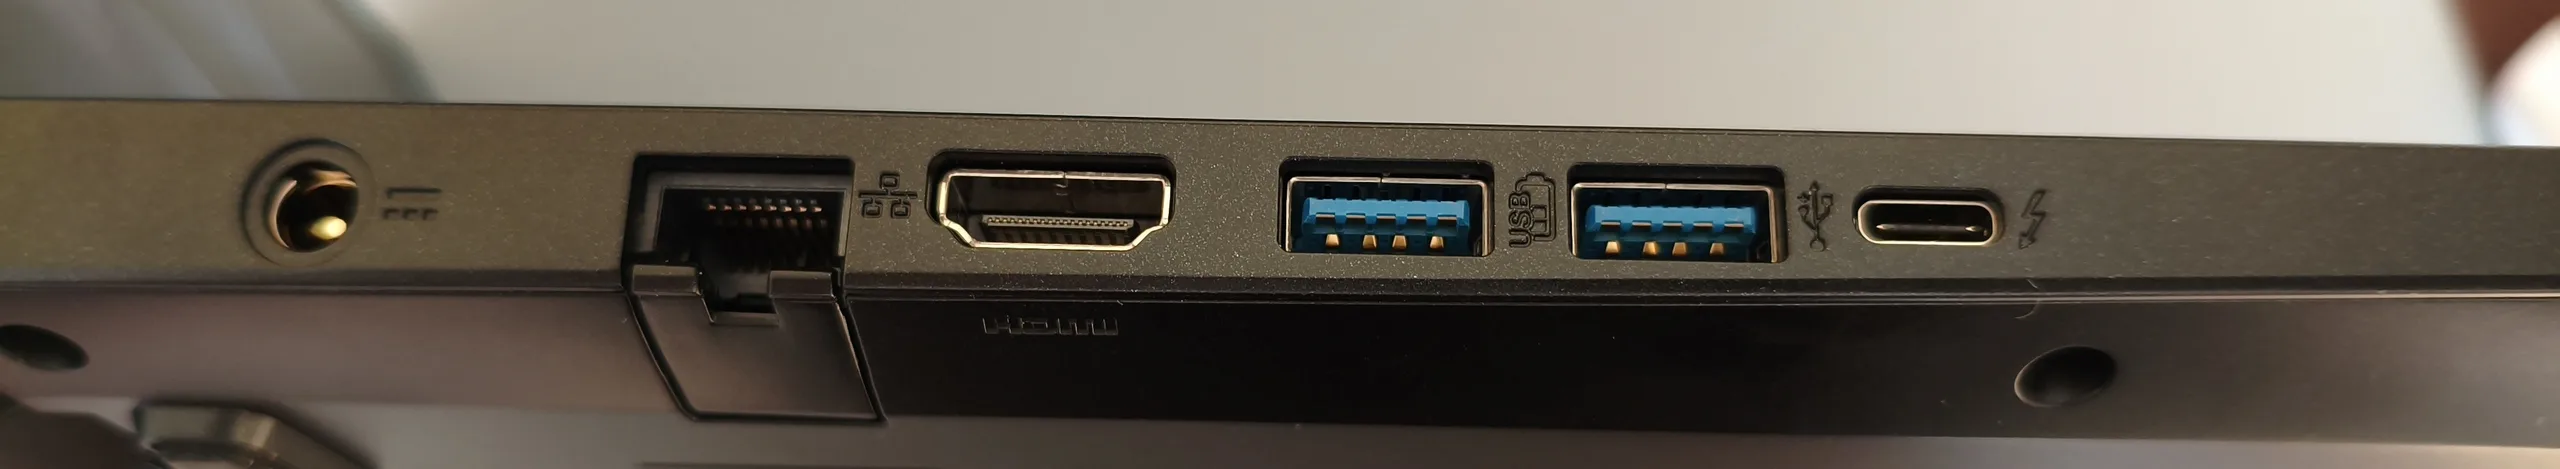
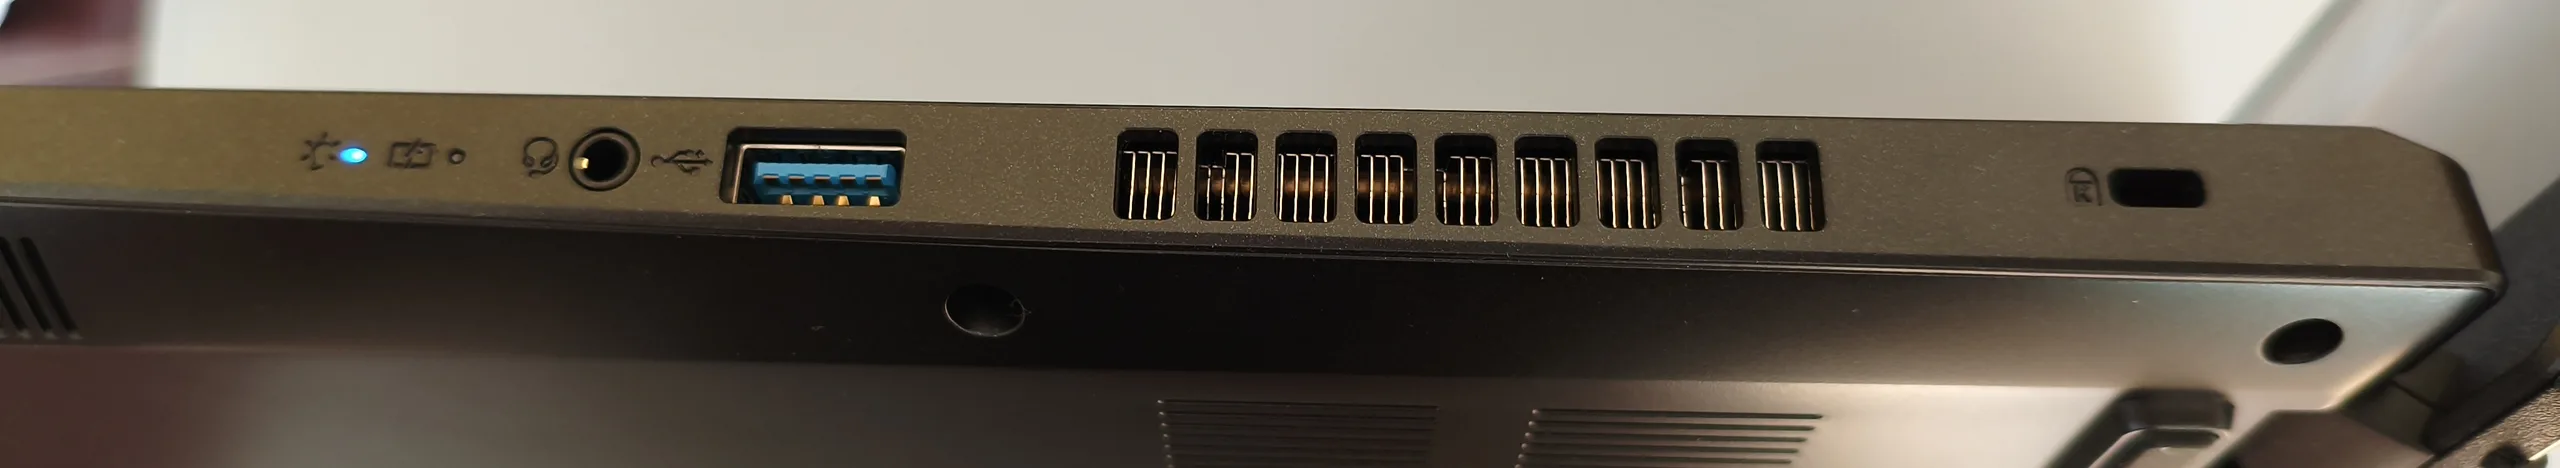
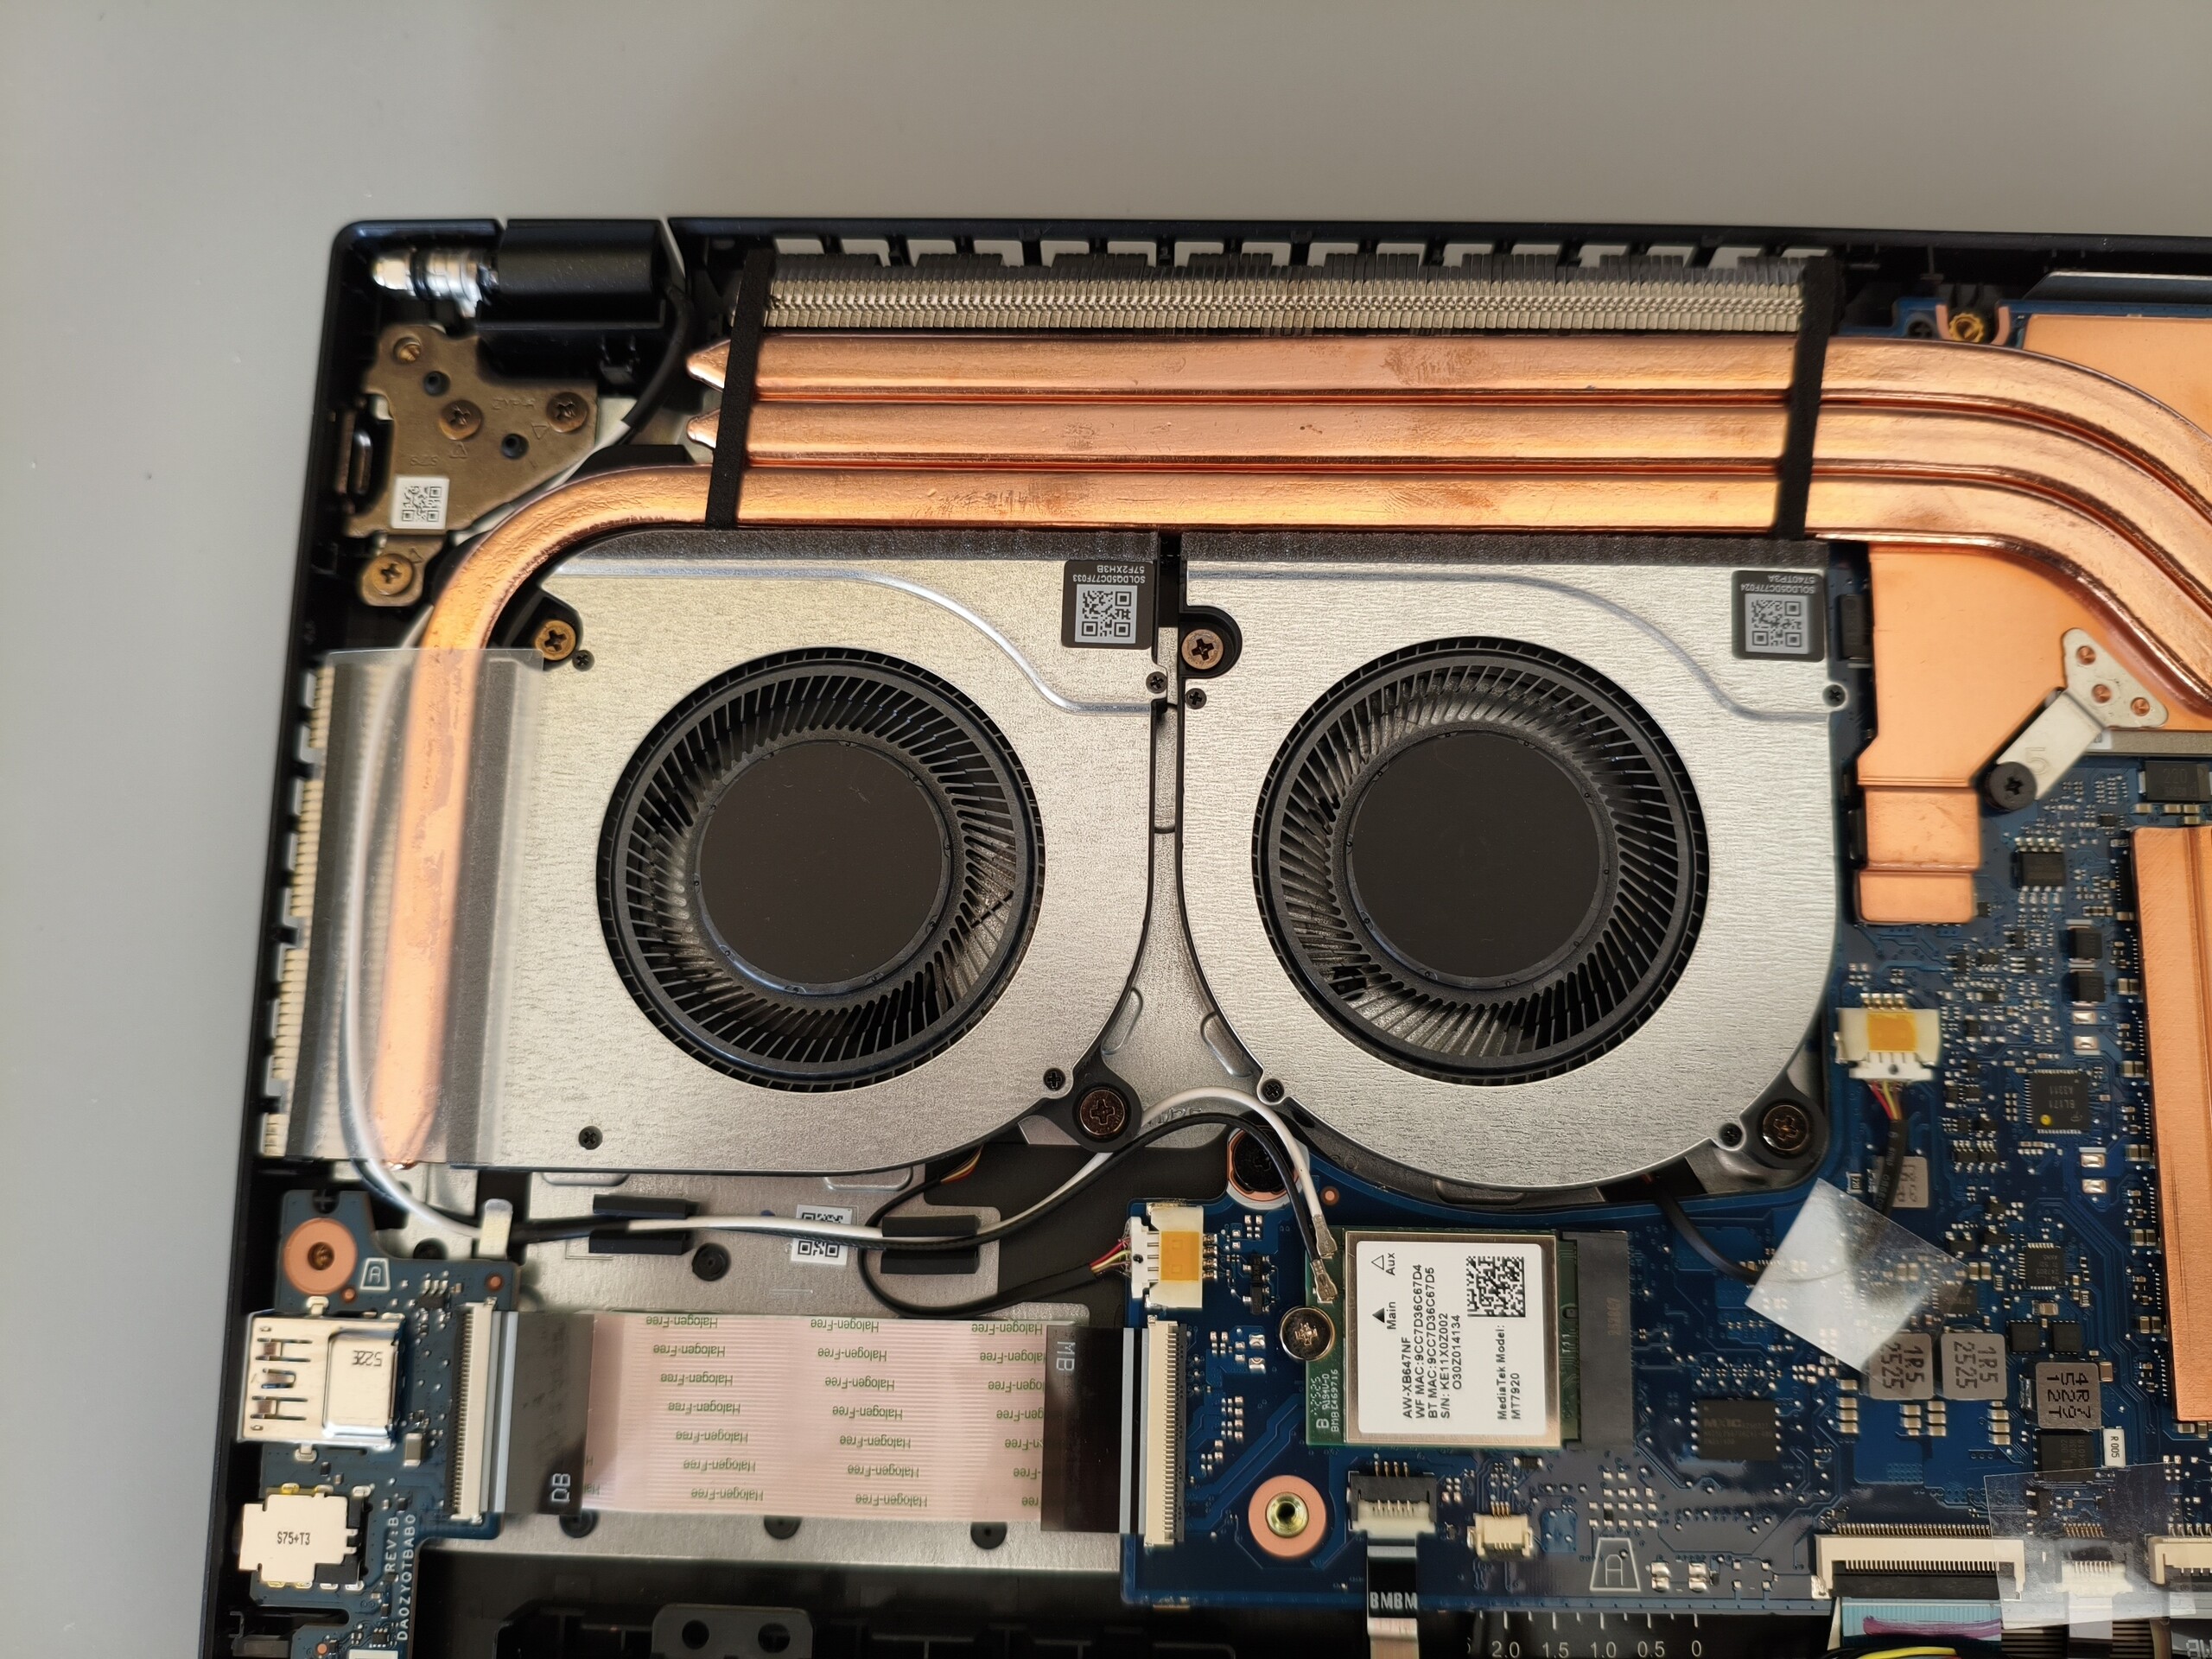
Hormis l'absence d'un lecteur de cartes, la sélection des ports laisse peu de place à la critique. Le port Gigabit LAN, la sortie HDMI et la prise audio de 3,5 mm sont complétés par trois ports USB-A et un connecteur Thunderbolt 4. Un emplacement pour verrou Kensington est également inclus. Le module Wi-Fi 6E offre des performances moyennes, et la webcam plutôt molle produit des résultats tout aussi peu impressionnants. Pour accéder aux composants internes, il faut retirer 11 vis cruciformes. Vous trouverez des images de l'intérieur plus bas.
Communication
Webcam


Maintenance
Dispositifs d'entrée
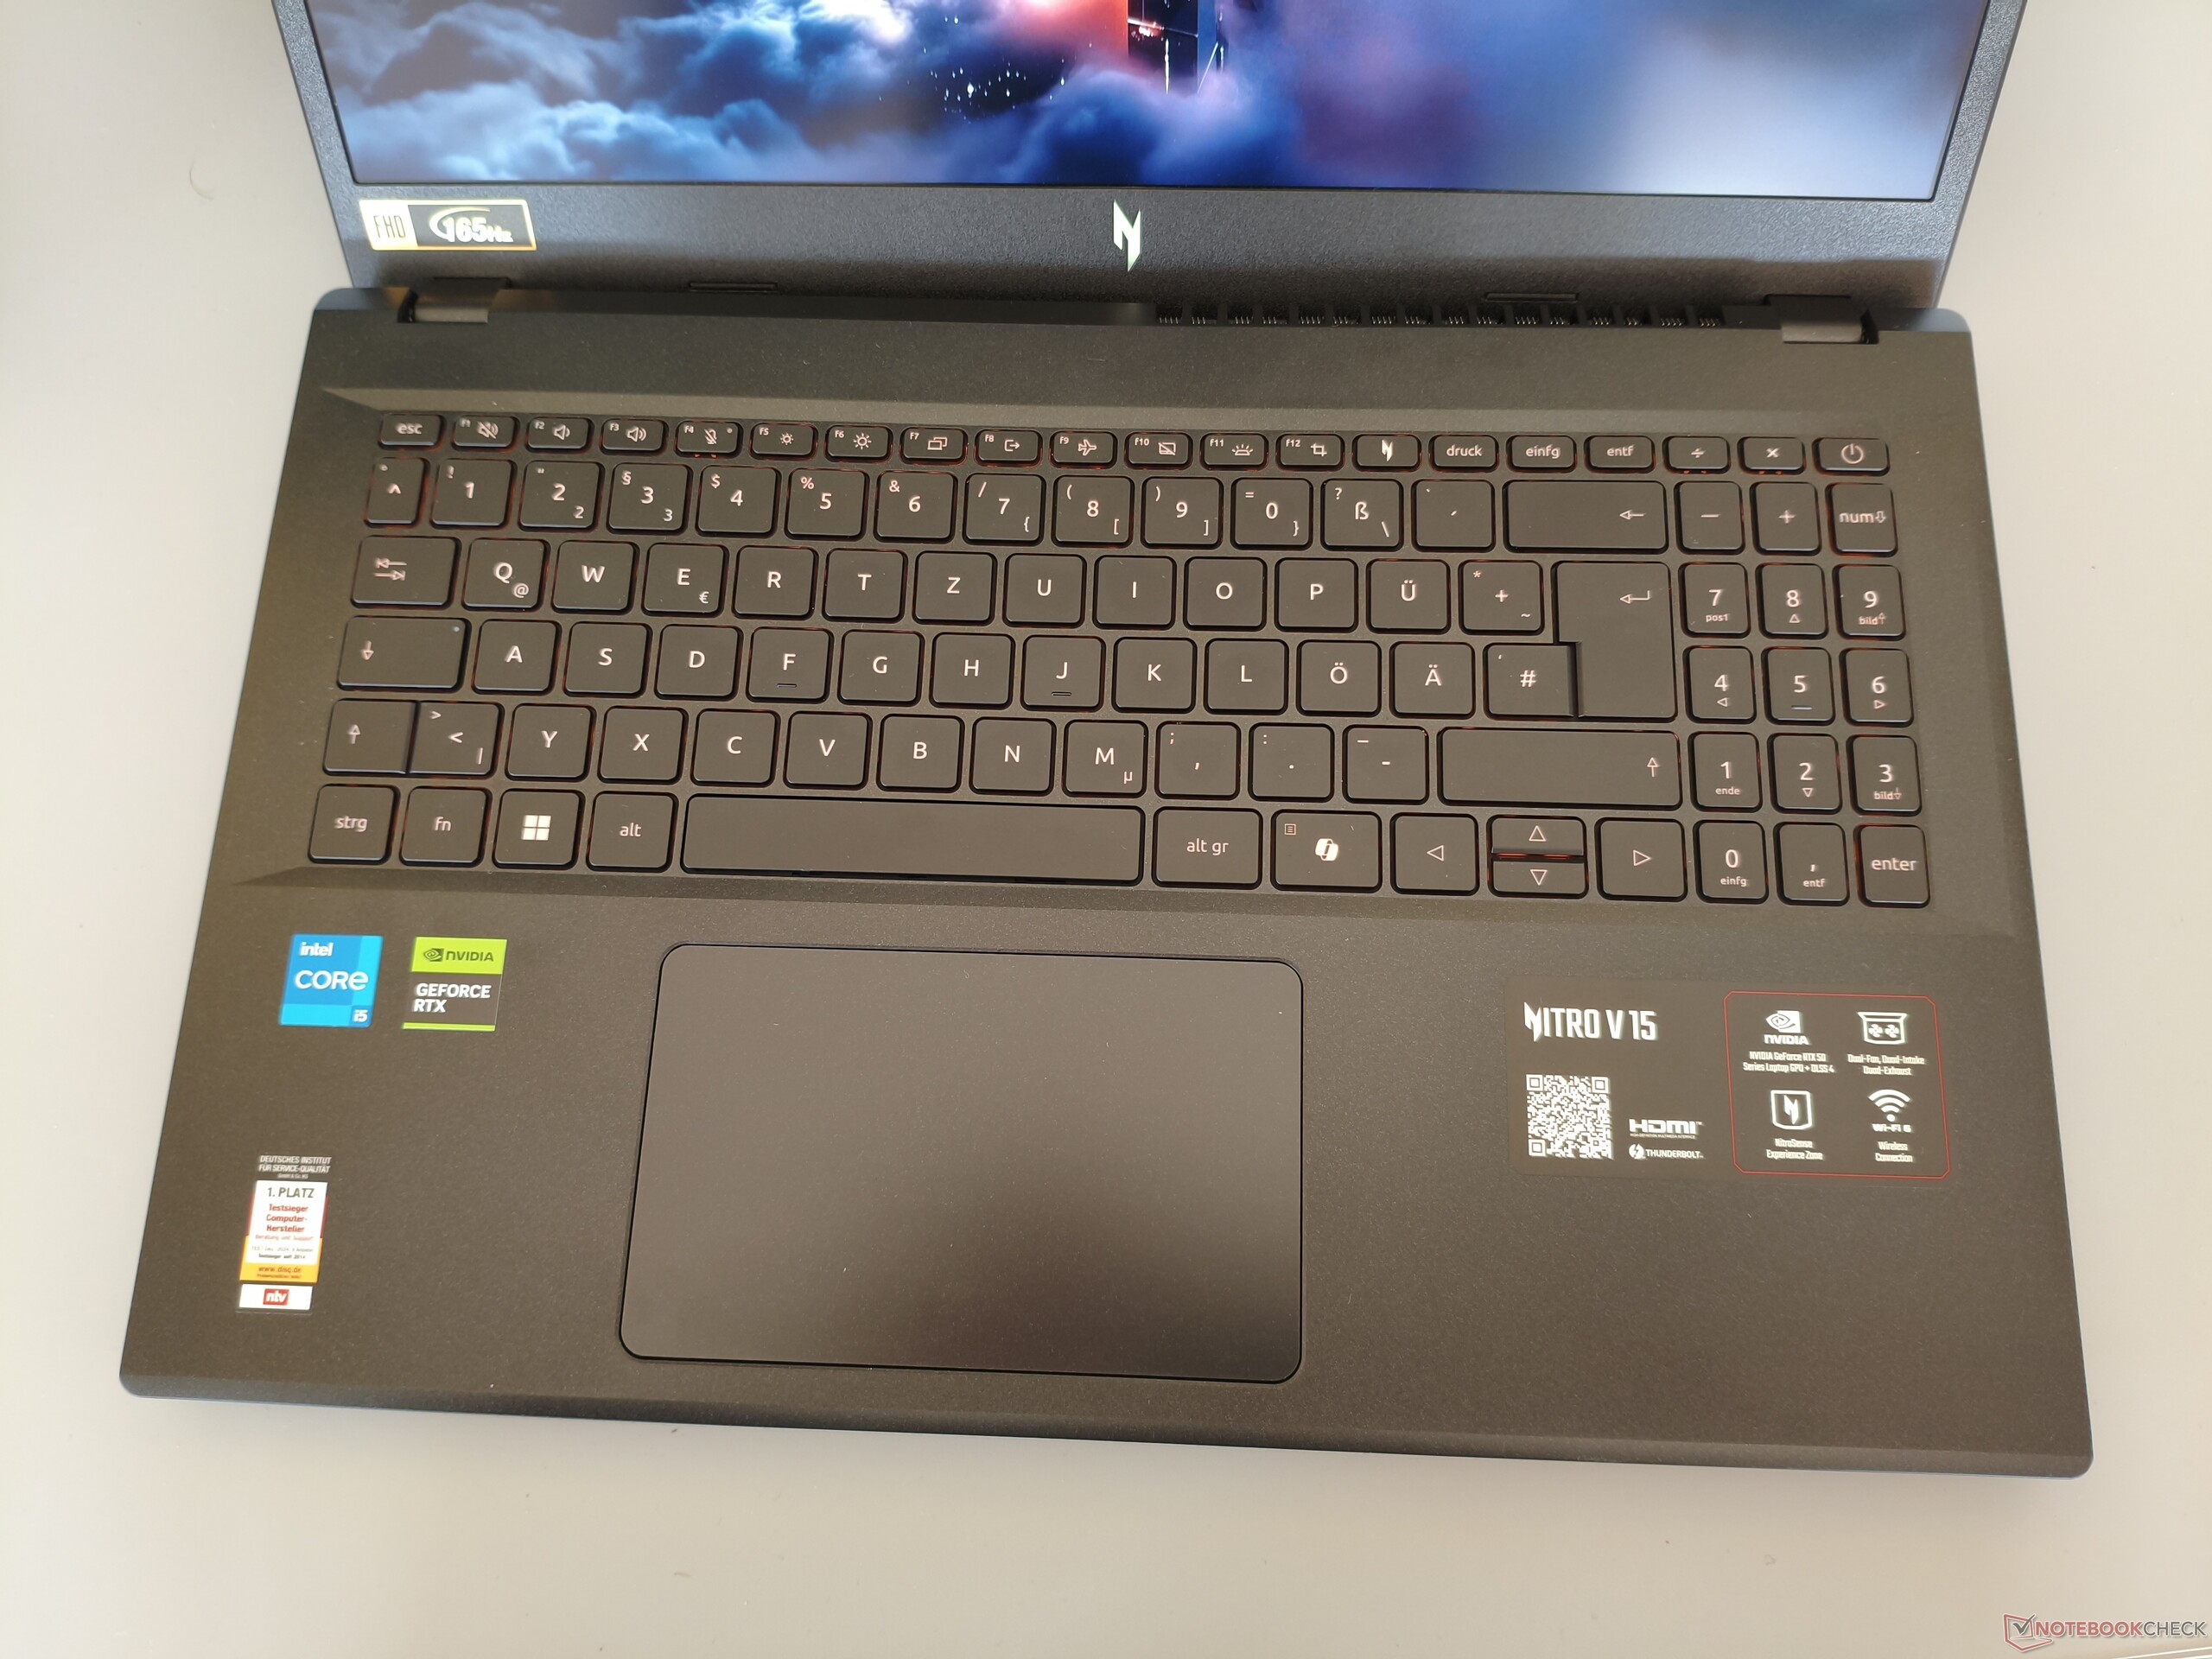
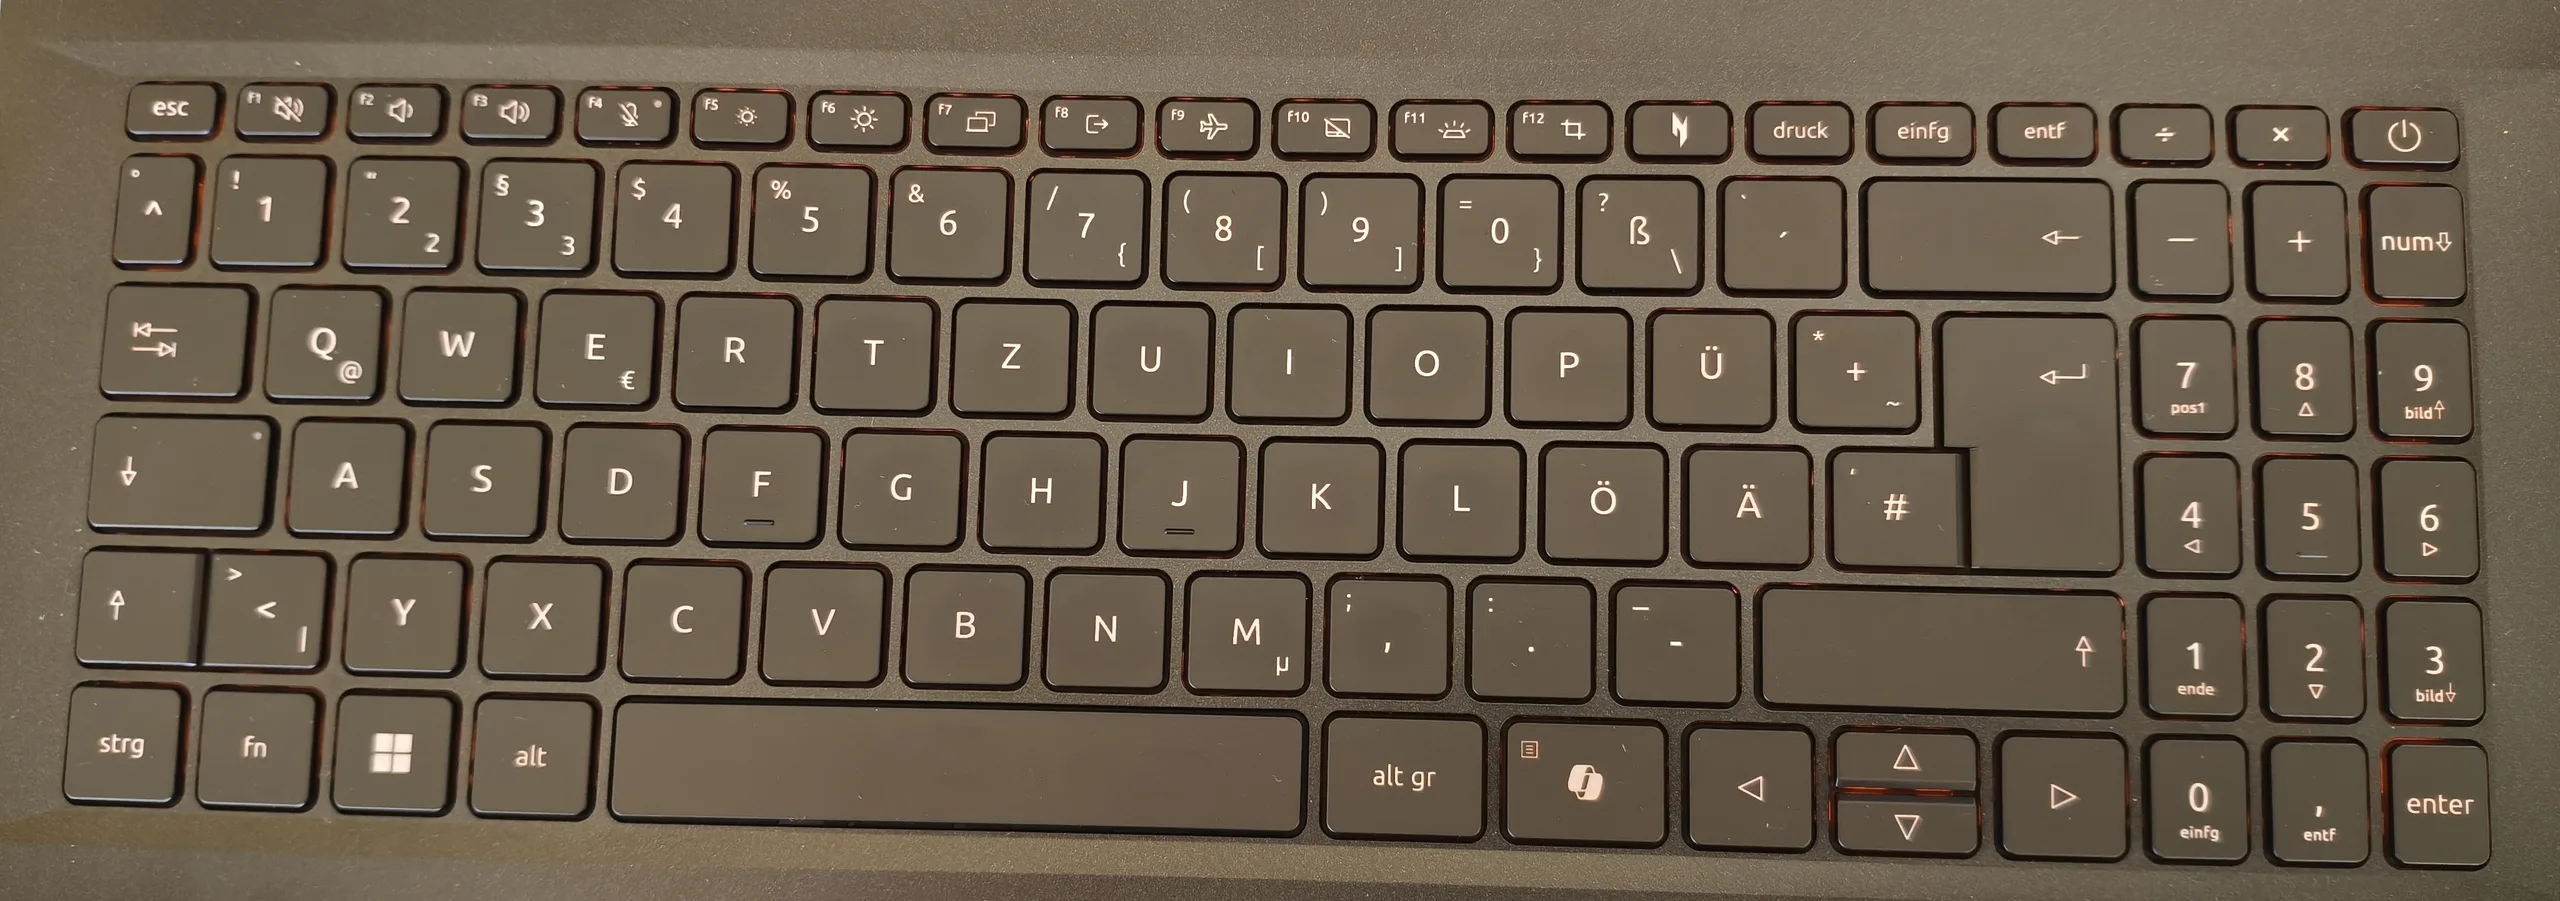
Nous n'avons pas été entièrement satisfaits de la disposition du clavier. Nous avons notamment critiqué le pavé numérique à trois colonnes au lieu de quatre, ainsi que les touches fléchées centrales, plutôt petites. L'expérience de frappe est typique des claviers à dôme en caoutchouc et n'a donc rien de particulièrement remarquable. Le rétroéclairage peut également être amélioré. L'éclairage orange n'est pas particulièrement brillant, même lorsqu'il est réglé au maximum. En revanche, l'ordinateur portable de 15 pouces est doté d'un pavé tactile assez grand, mesurant 12,6 x 7,8 cm, même s'il semble un peu mou lorsqu'on clique dessus.
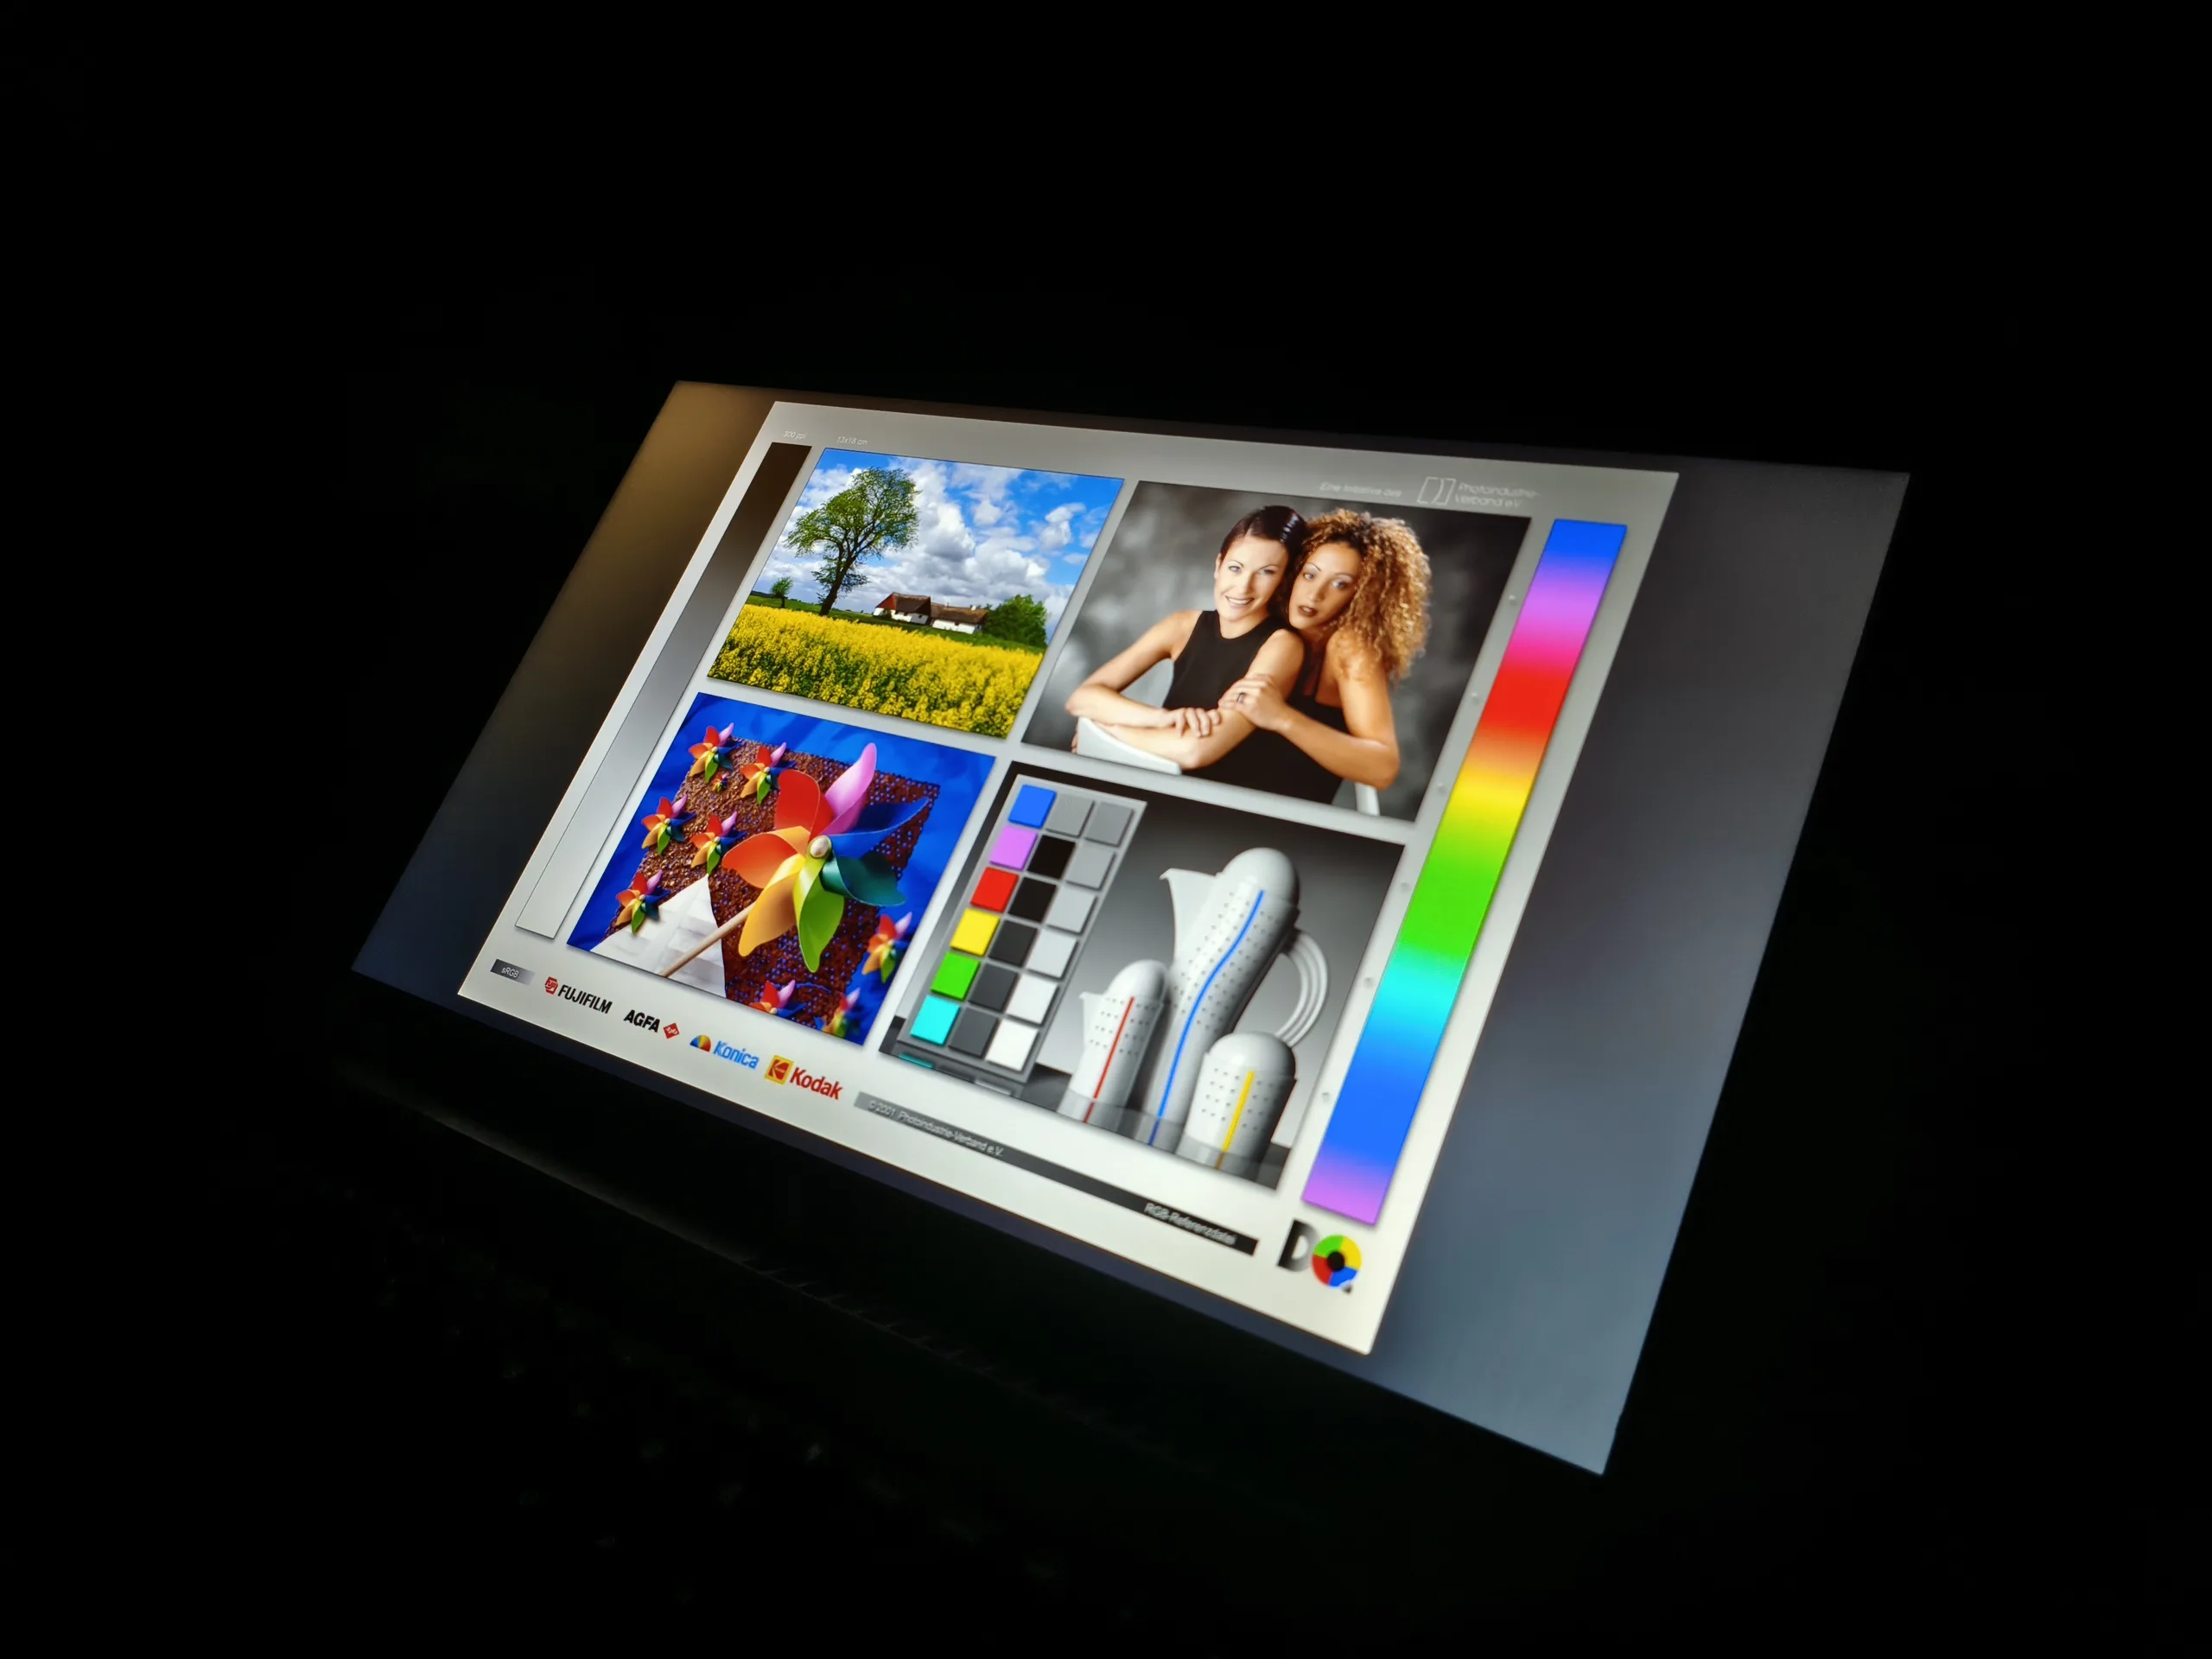
Affichage
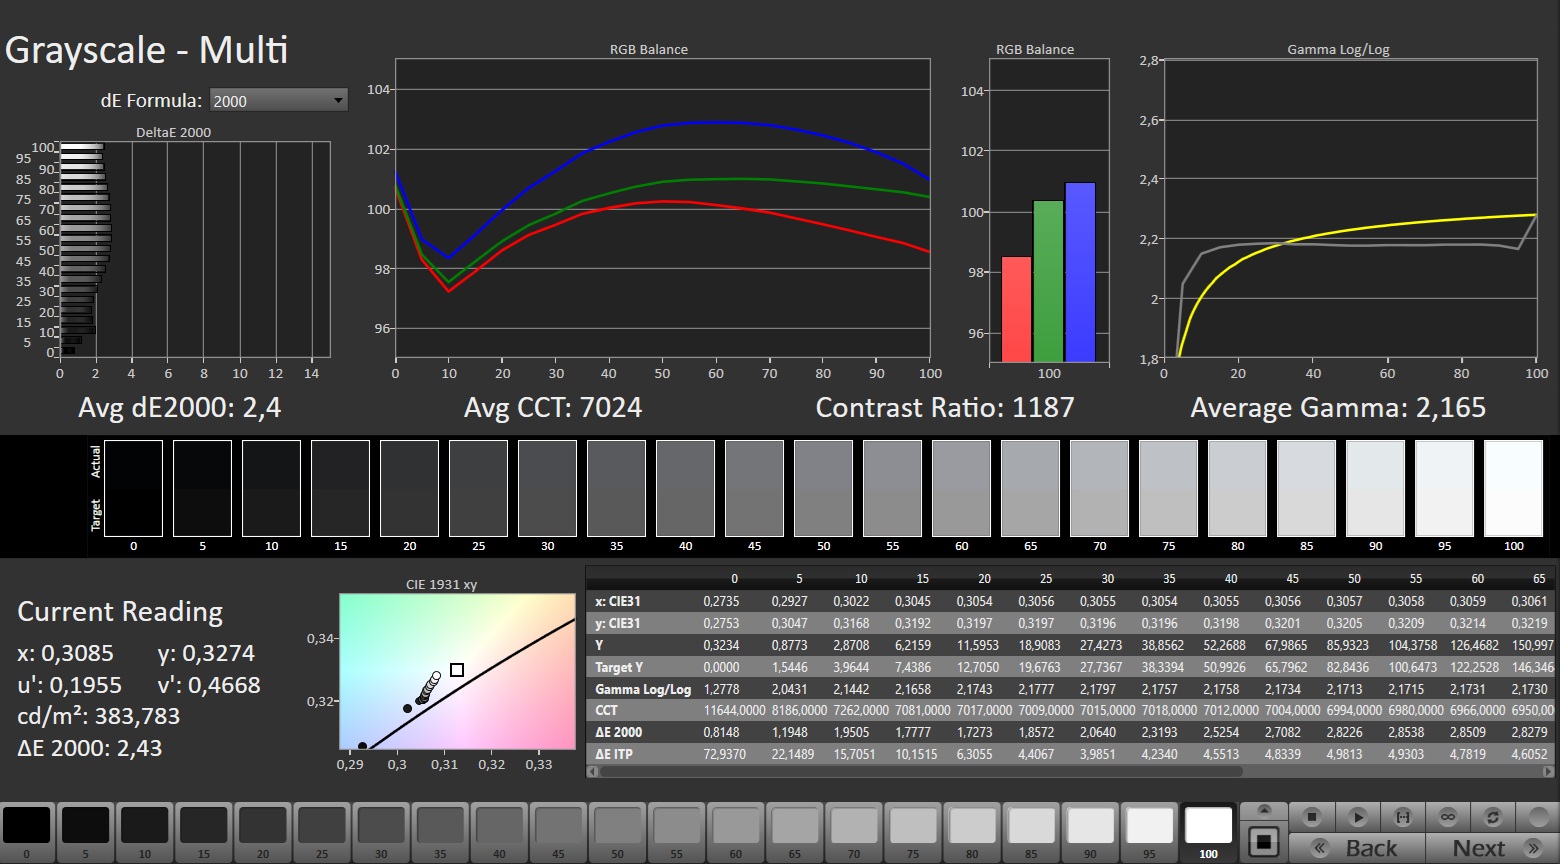
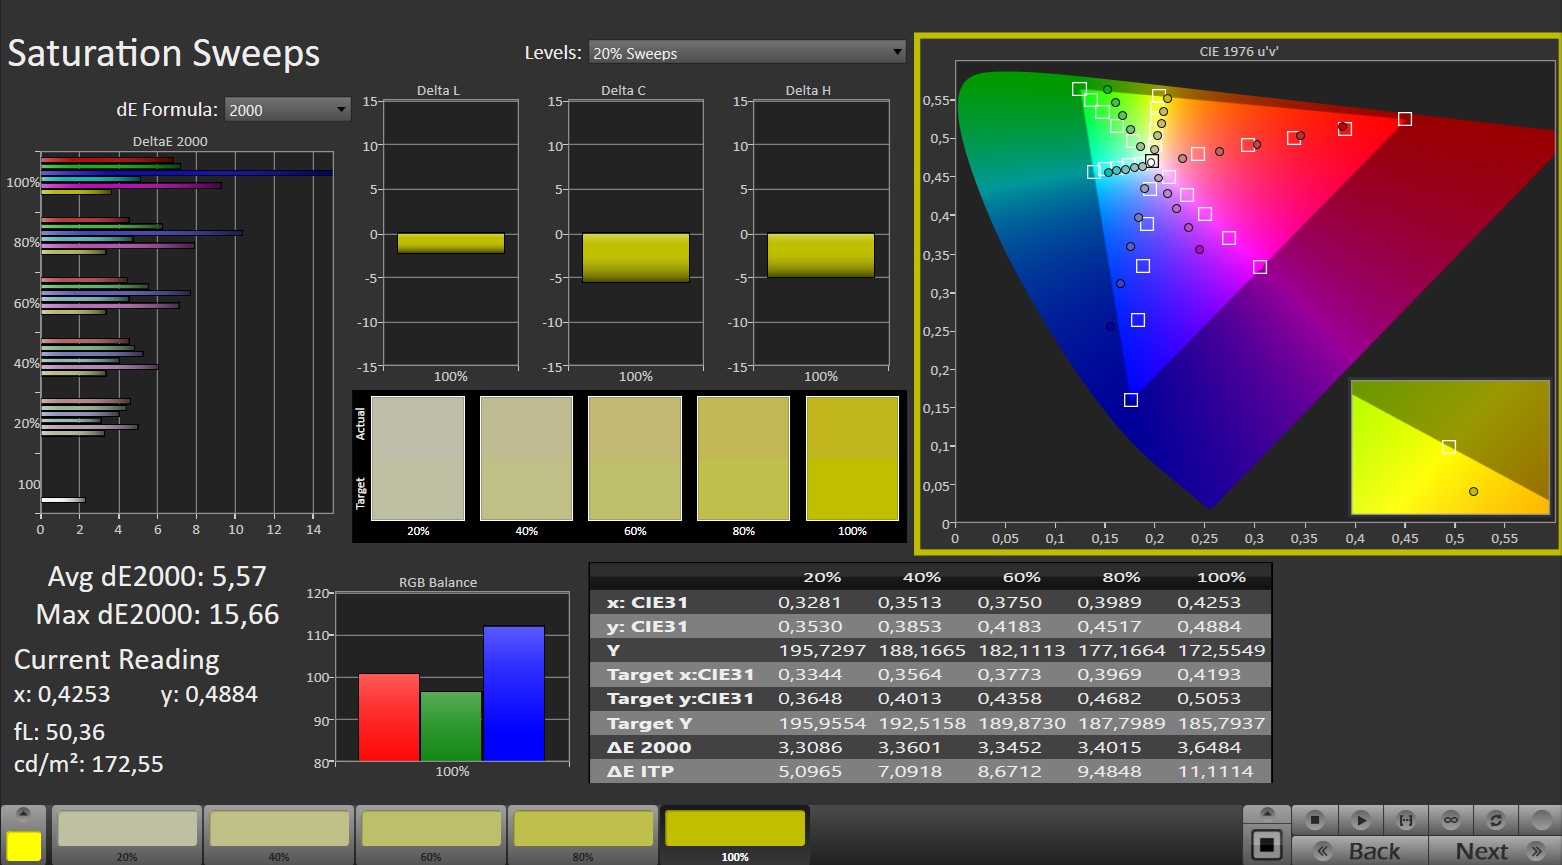
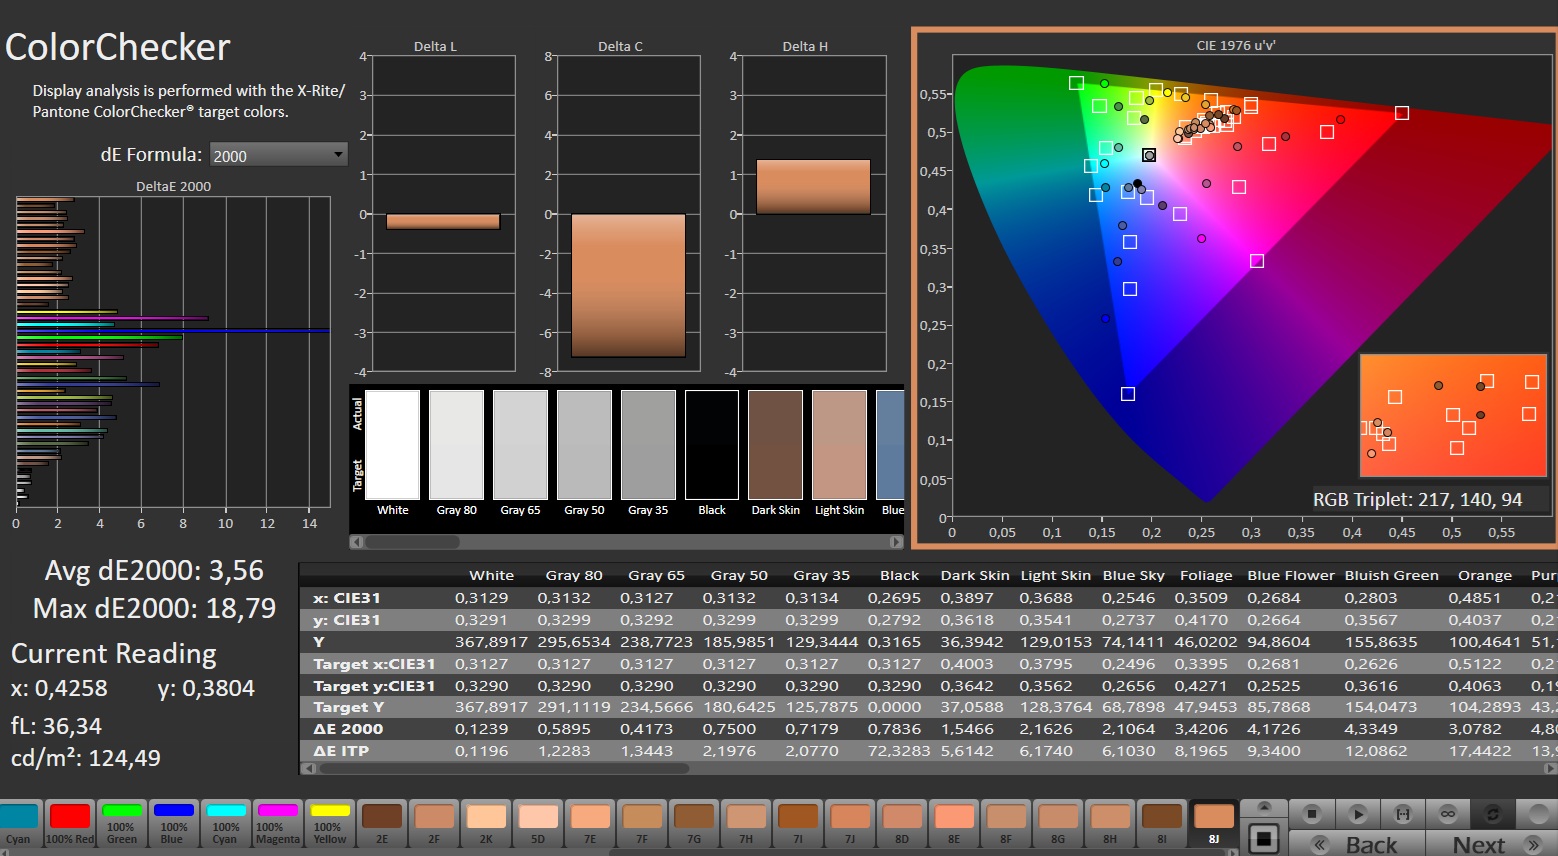
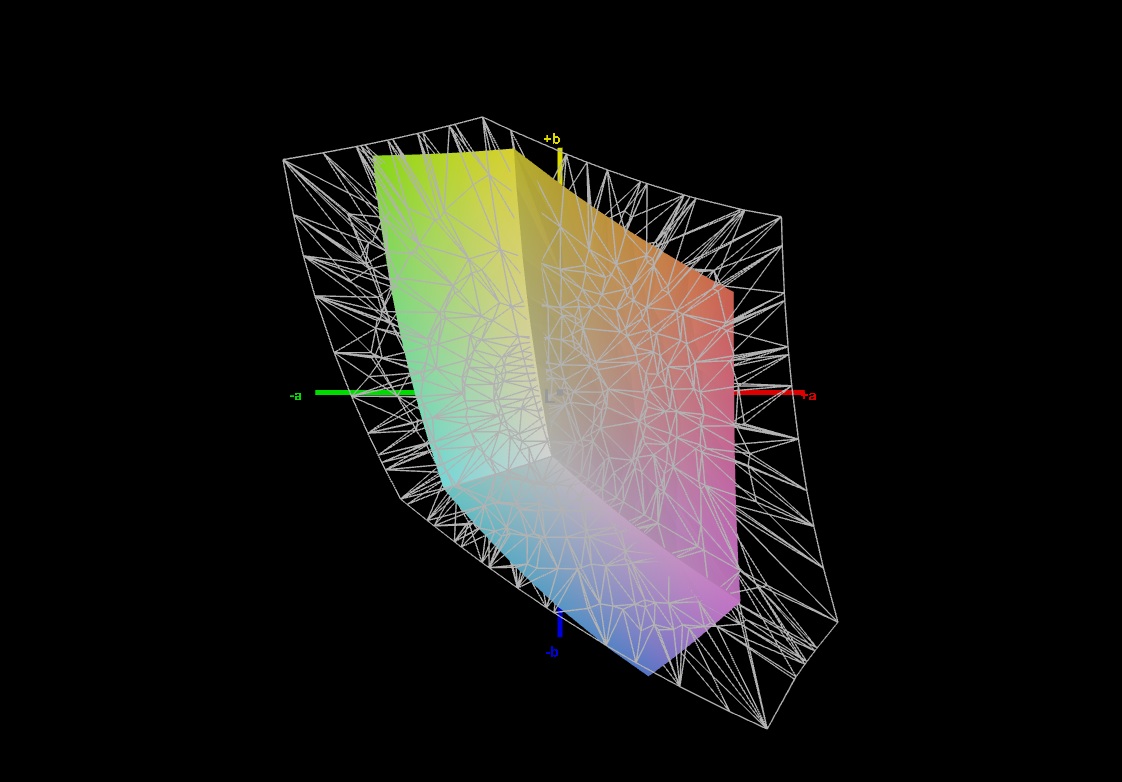
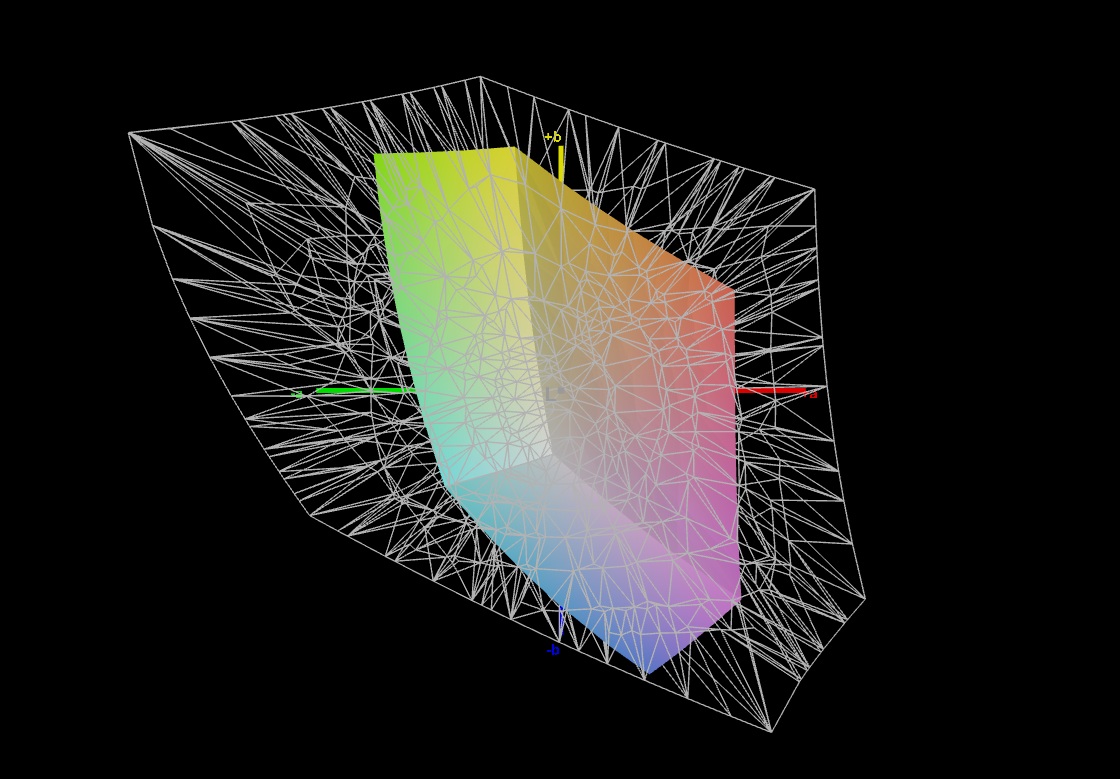
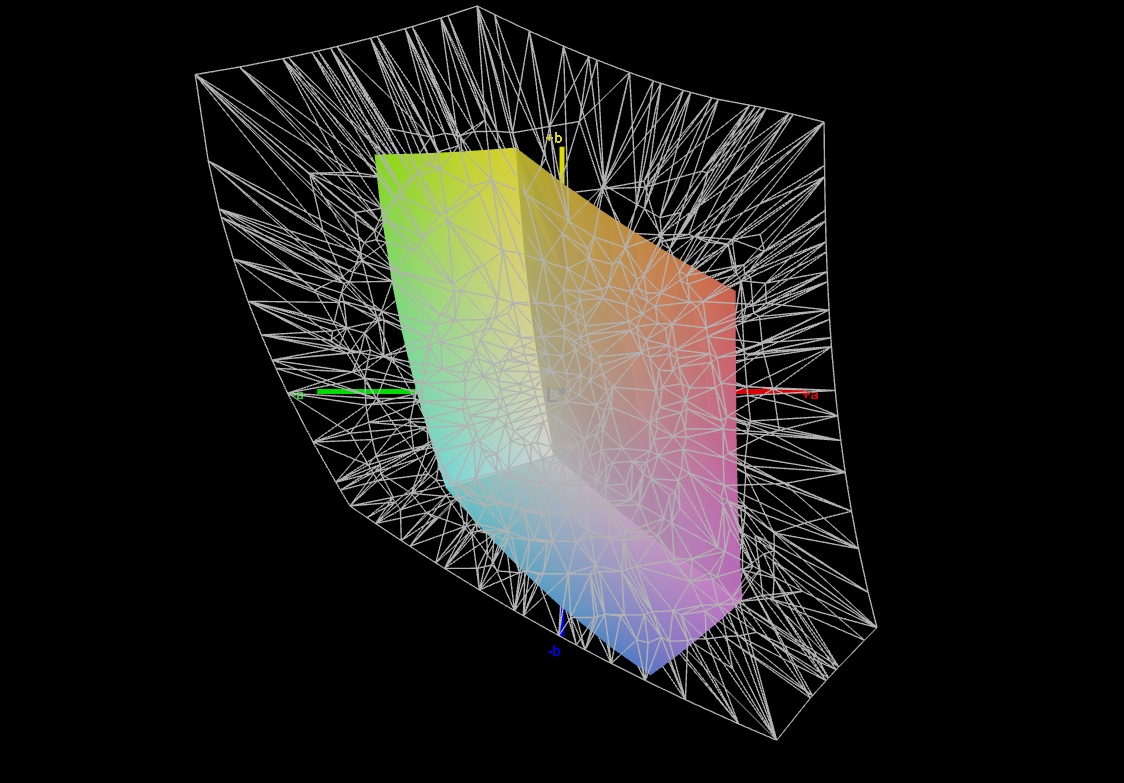
Malheureusement, la couverture limitée des couleurs reste un problème pour les ordinateurs portables de jeu les plus abordables, même en 2026. Comme le Cyborg 15 et le Victus 15, le Nitro V 15 reste en dessous de la barre des 70 % sRGB, ce qui donne une image plutôt pâle. Le verdict concernant la luminosité est plus positif. Bien que la moyenne de 347 cd/m² ne soit pas exceptionnelle, la plupart des concurrents se situent en dessous de ce chiffre. Les autres valeurs sont typiques d'une dalle IPS, qu'il s'agisse du niveau de noir de 0,31 cd/m² ou du rapport de contraste de 1.232:1. Il en va de même pour les angles de vision.
| |||||||||||||||||||||||||
Homogénéité de la luminosité: 86 %
Valeur mesurée au centre, sur batterie: 382 cd/m²
Contraste: 1232:1 (Valeurs des noirs: 0.31 cd/m²)
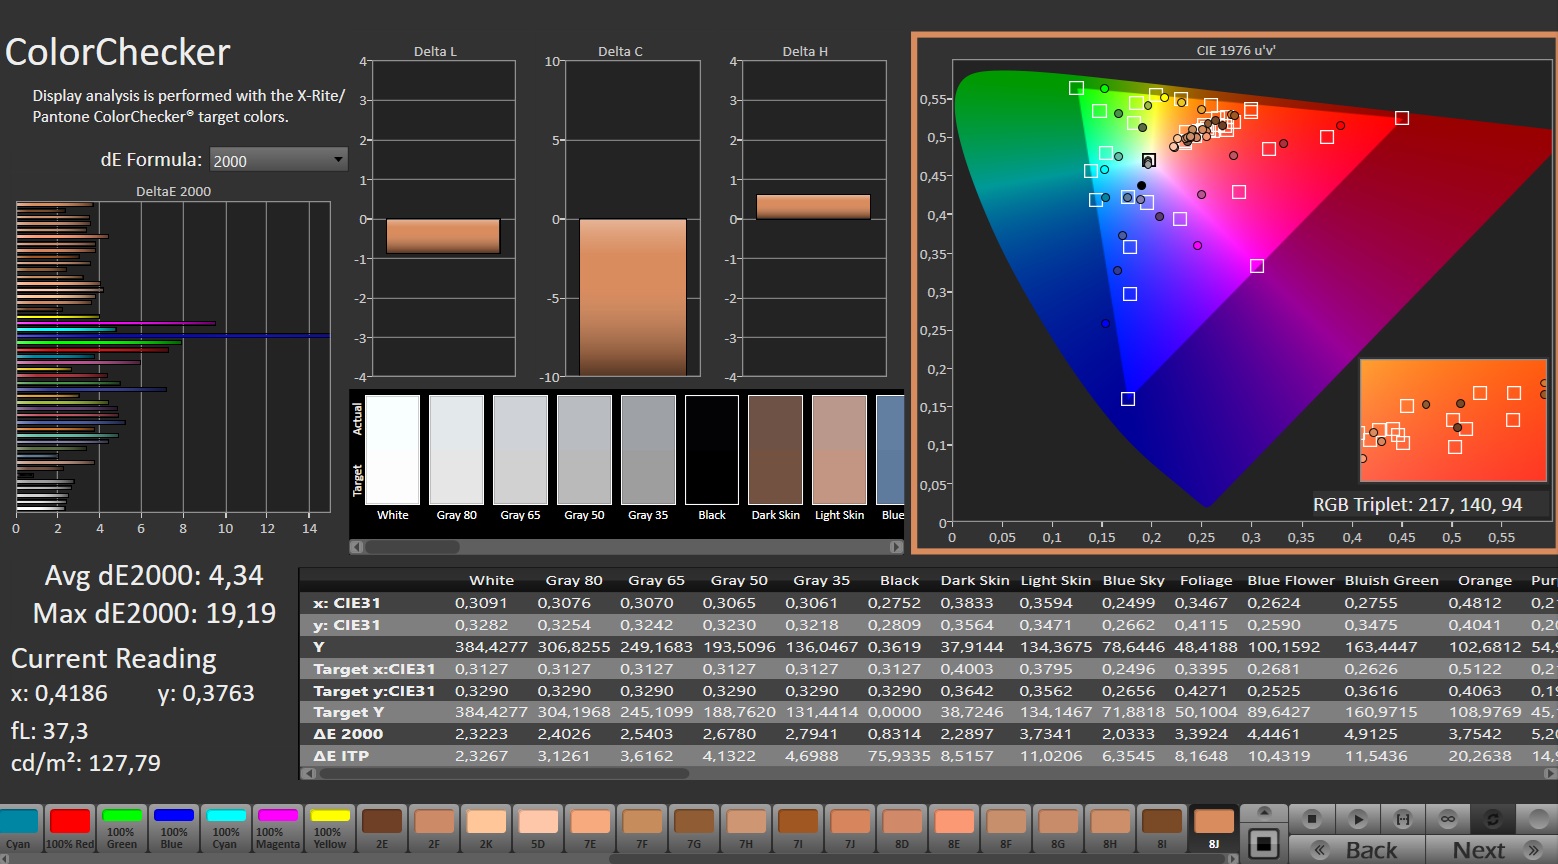
ΔE ColorChecker Calman: 4.34 | ∀{0.5-29.43 Ø4.74}
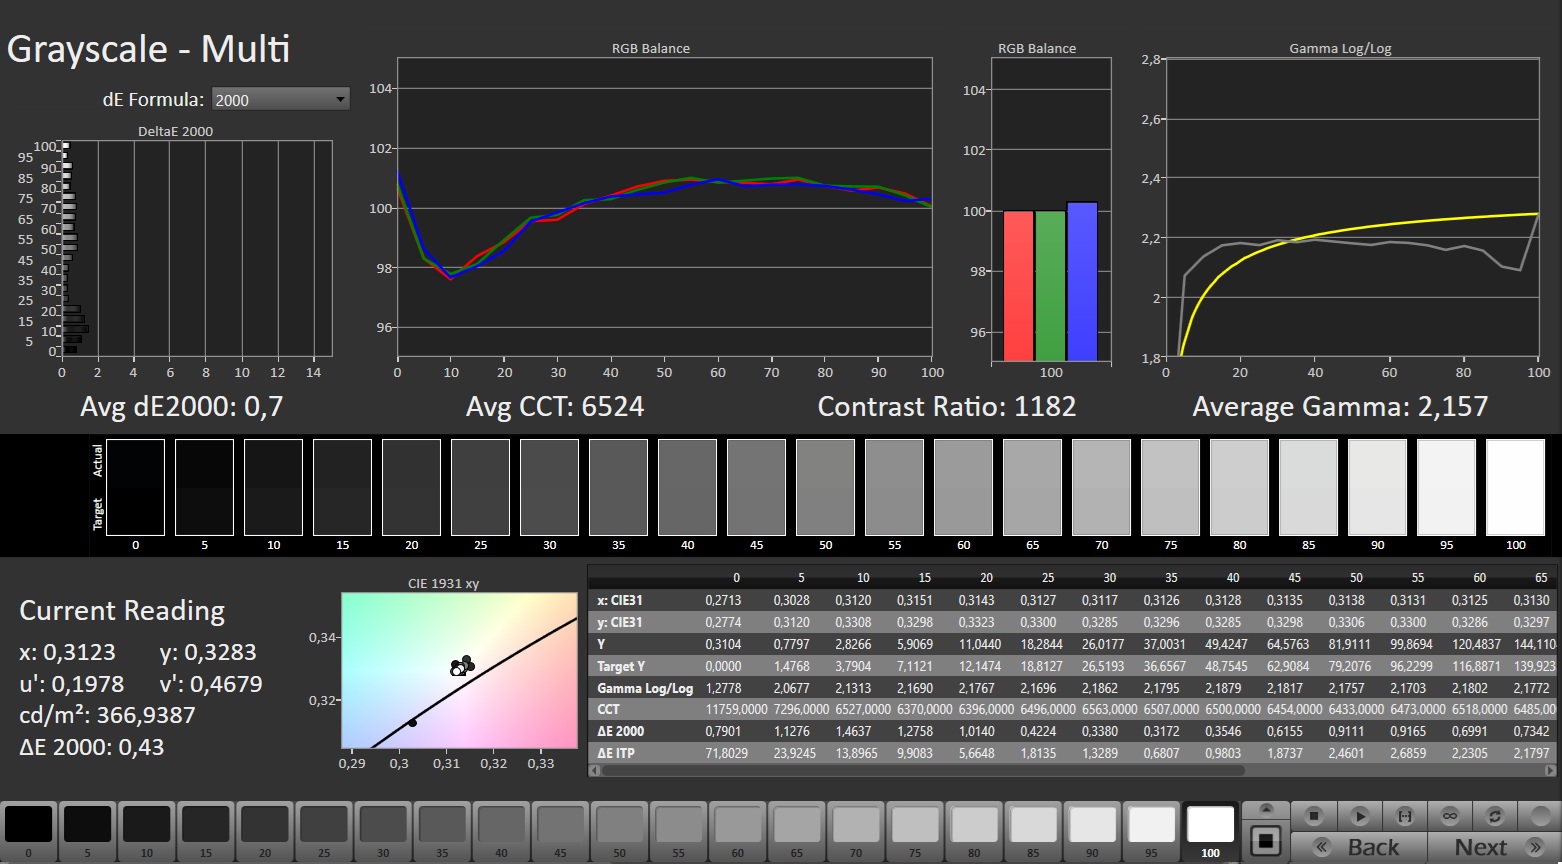
calibrated: 3.56
ΔE Greyscale Calman: 2.4 | ∀{0.09-98 Ø4.99}
41.6% AdobeRGB 1998 (Argyll 3D)
60.3% sRGB (Argyll 3D)
40.3% Display P3 (Argyll 3D)
Gamma: 2.165
CCT: 7024 K
| Acer Nitro V 15 ANV15-52-50S2 BOEhydis NE156FHM-NXA, IPS, 1920x1080, 15.6", 165 Hz | Acer Nitro V 15 ANV15-51-582S LG LP156WFJ-SPB4 (LGD0742), IPS, 1920x1080, 15.6", 144 Hz | HP Victus 15-fa2160ng CMN1560, IPS, 1920x1080, 15.6", 144 Hz | MSI Cyborg 15 B2RWEKG CMN N156HRA-EA1, IPS, 1920x1080, 15.6", 144 Hz | Lenovo LOQ 15AHP10 CSOT MNF601BA1-4, IPS, 1920x1080, 15.6", 144 Hz | Lenovo Legion 5 15AHP G10 LEN151WQXGA, OLED, 2560x1600, 15.1", 165 Hz | |
|---|---|---|---|---|---|---|
| Display | -0% | -1% | 8% | 66% | 117% | |
| Display P3 Coverage (%) | 40.3 | 40 -1% | 43 7% | 43.4 8% | 67.3 67% | 99.9 148% |
| sRGB Coverage (%) | 60.3 | 60 0% | 64.3 7% | 64.8 7% | 99.2 65% | 100 66% |
| AdobeRGB 1998 Coverage (%) | 41.6 | 41.4 0% | 34.7 -17% | 44.9 8% | 69.1 66% | 98.3 136% |
| Response Times | -6% | 16% | 17% | 6% | 99% | |
| Response Time Grey 50% / Grey 80% * (ms) | 39 ? | 34.2 ? 12% | 28.6 ? 27% | 27.6 ? 29% | 33.9 ? 13% | 0.42 ? 99% |
| Response Time Black / White * (ms) | 20.8 ? | 25.8 ? -24% | 20 ? 4% | 20 ? 4% | 21.2 ? -2% | 0.4 ? 98% |
| PWM Frequency (Hz) | 1152 ? | |||||
| PWM Amplitude * (%) | 11 | |||||
| Screen | -23% | -6% | -2% | 31% | 50% | |
| Brightness middle (cd/m²) | 382 | 292 -24% | 324 -15% | 286 -25% | 318 -17% | 492 29% |
| Brightness (cd/m²) | 347 | 263 -24% | 303 -13% | 272 -22% | 300 -14% | 495 43% |
| Brightness Distribution (%) | 86 | 80 -7% | 87 1% | 87 1% | 89 3% | 92 7% |
| Black Level * (cd/m²) | 0.31 | 0.25 19% | 0.26 16% | 0.17 45% | 0.2 35% | |
| Contrast (:1) | 1232 | 1168 -5% | 1246 1% | 1682 37% | 1590 29% | |
| Colorchecker dE 2000 * | 4.34 | 7.15 -65% | 4.7 -8% | 4.61 -6% | 1.33 69% | 0.9 79% |
| Colorchecker dE 2000 max. * | 19.19 | 15.51 19% | 18.19 5% | 19.59 -2% | 4.42 77% | 1.8 91% |
| Colorchecker dE 2000 calibrated * | 3.56 | 4.13 -16% | 2.93 18% | 2.99 16% | 0.94 74% | |
| Greyscale dE 2000 * | 2.4 | 4.9 -104% | 3.9 -63% | 3.9 -63% | 1.9 21% | 1.2 50% |
| Gamma | 2.165 102% | 2.014 109% | 2.21 100% | 2.236 98% | 2.187 101% | 2.16 102% |
| CCT | 7024 93% | 7178 91% | 7541 86% | 6792 96% | 6678 97% | 6291 103% |
| Moyenne finale (programmes/paramètres) | -10% /
-16% | 3% /
-2% | 8% /
3% | 34% /
35% | 89% /
77% |
* ... Moindre est la valeur, meilleures sont les performances

Temps de réponse de l'écran
| ↔ Temps de réponse noir à blanc | ||
|---|---|---|
| 20.8 ms ... hausse ↗ et chute ↘ combinées | ↗ 10 ms hausse | 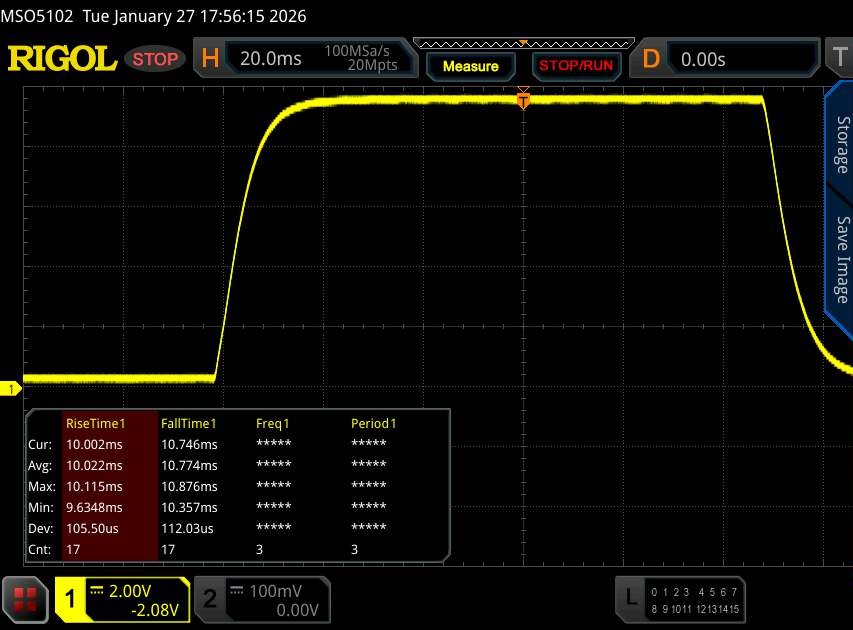 |
| ↘ 10.8 ms chute | ||
| L'écran montre de bons temps de réponse, mais insuffisant pour du jeu compétitif. En comparaison, tous les appareils testés affichent entre 0.1 (minimum) et 240 (maximum) ms. » 46 % des appareils testés affichent de meilleures performances. Cela signifie que les latences relevées sont similaires à la moyenne (20 ms) de tous les appareils testés. | ||
| ↔ Temps de réponse gris 50% à gris 80% | ||
| 39 ms ... hausse ↗ et chute ↘ combinées | ↗ 17.6 ms hausse | 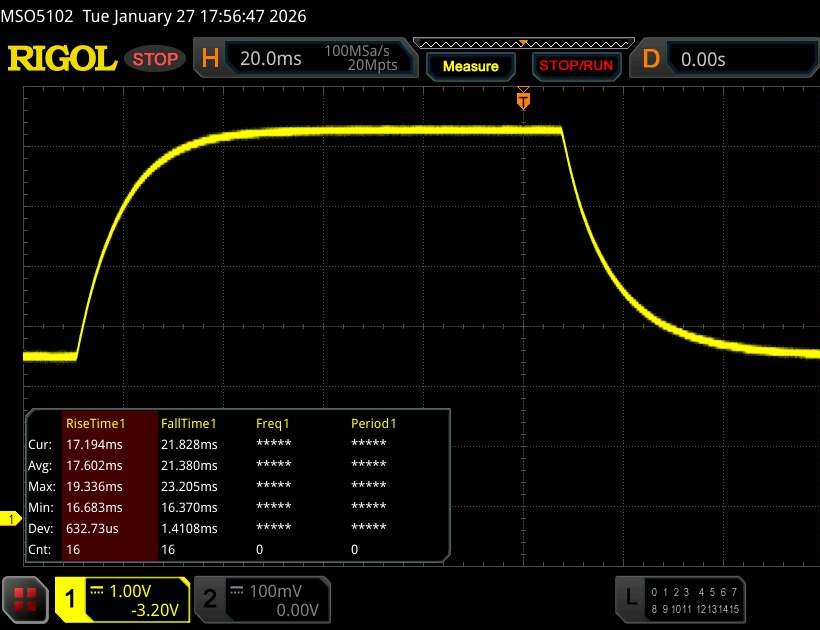 |
| ↘ 21.4 ms chute | ||
| L'écran souffre de latences très élevées, à éviter pour le jeu. En comparaison, tous les appareils testés affichent entre 0.165 (minimum) et 636 (maximum) ms. » 58 % des appareils testés affichent de meilleures performances. Cela signifie que les latences relevées sont moins bonnes que la moyenne (31.3 ms) de tous les appareils testés. | ||
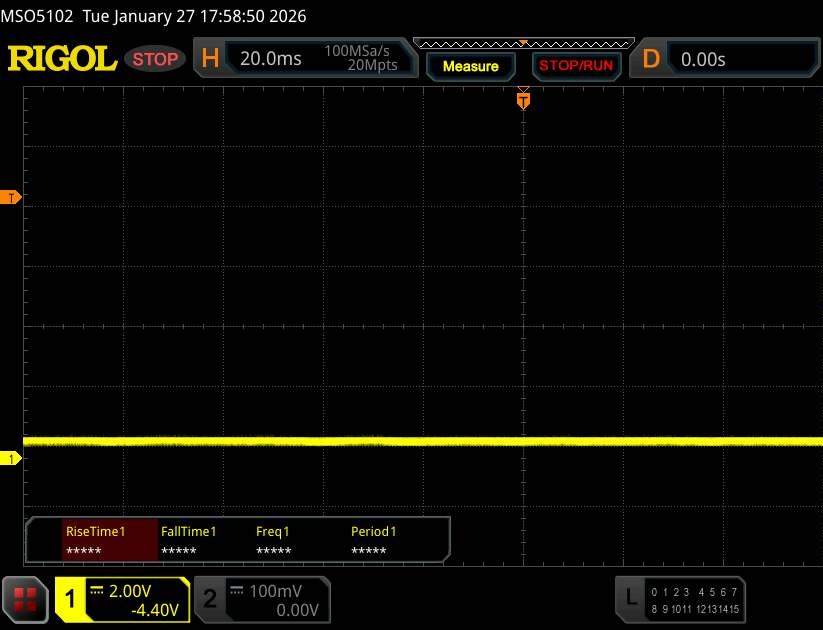
Scintillement / MLI (Modulation de largeur d'impulsion)
| Scintillement / MLI (Modulation de largeur d'impulsion) non décelé |  | ||
En comparaison, 53 % des appareils testés n'emploient pas MDI pour assombrir leur écran. Nous avons relevé une moyenne à 7923 (minimum : 5 - maximum : 343500) Hz dans le cas où une MDI était active. | |||
Performance
Le Nitro V 15 appartient au segment du milieu de gamme, bien que les performances dans certains domaines tendent à se rapprocher de l'entrée de gamme. Les acheteurs prêts à dépenser un peu plus peuvent également opter pour des configurations dotées d'un processeur plus rapide (Core i7-13620H) ou d'un GPU plus puissant (GeForce GPU RTX 5060 pour ordinateur portable).
Conditions d'essai
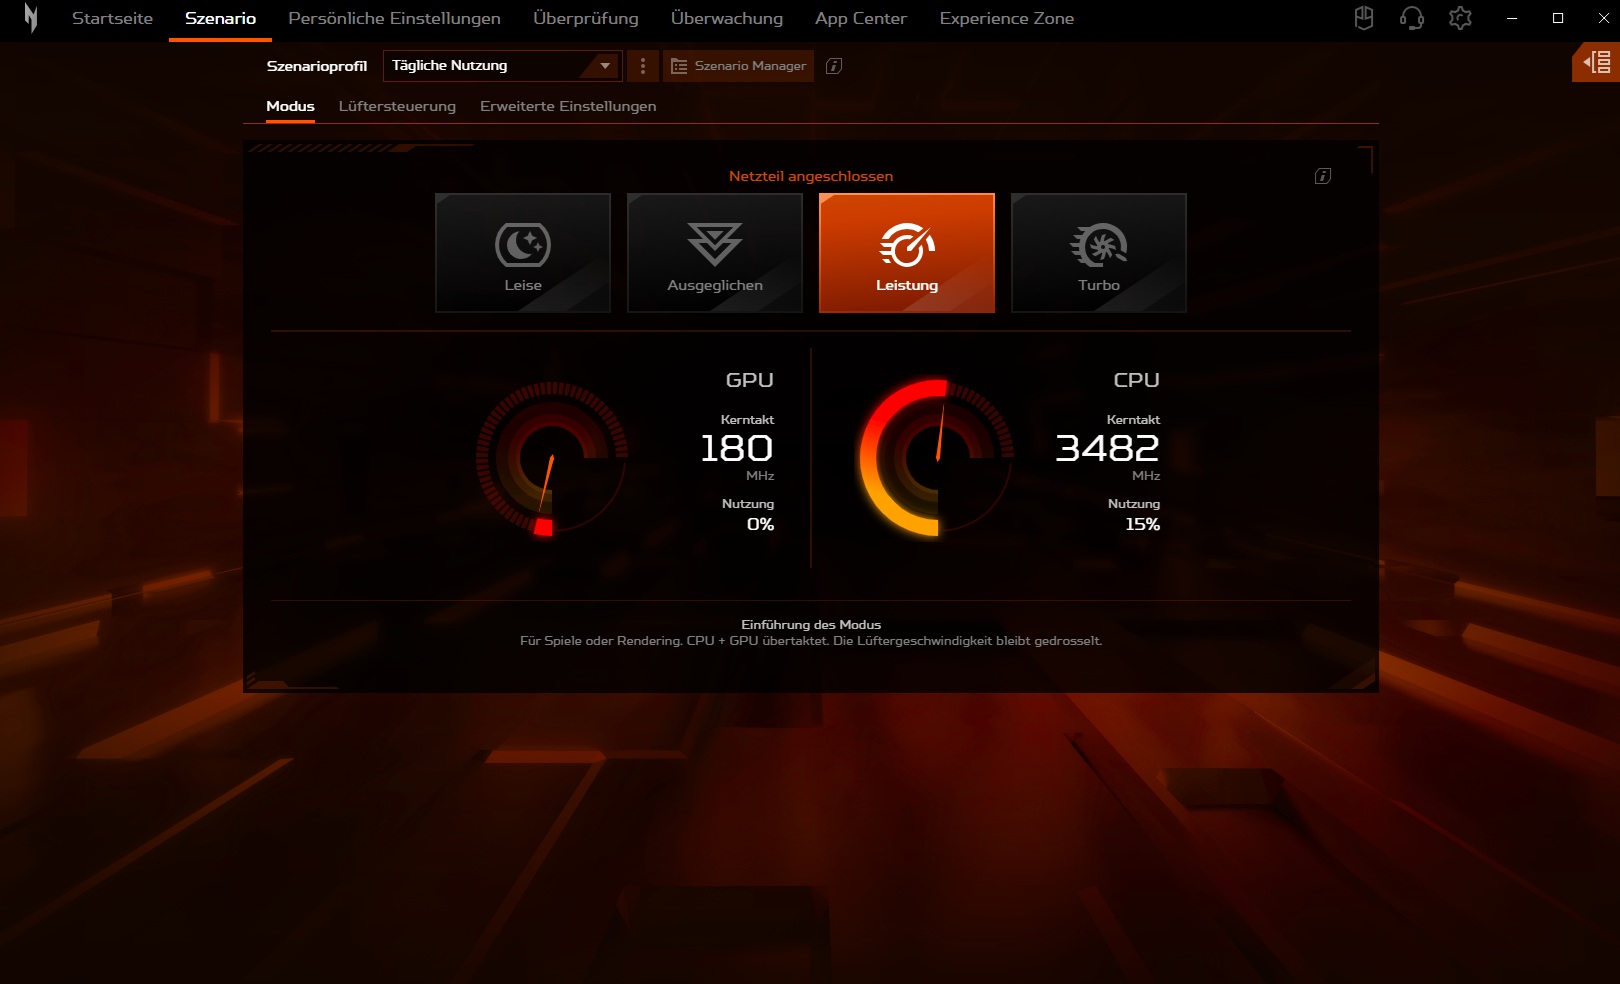
L'utilitaire NitroSense propose quatre modes de fonctionnement, dont vous trouverez les différences dans le tableau ci-dessous. Toutes nos mesures ont été effectuées en mode Performance, à l'exception du test de la batterie, qui a été réalisé en mode Équilibré.
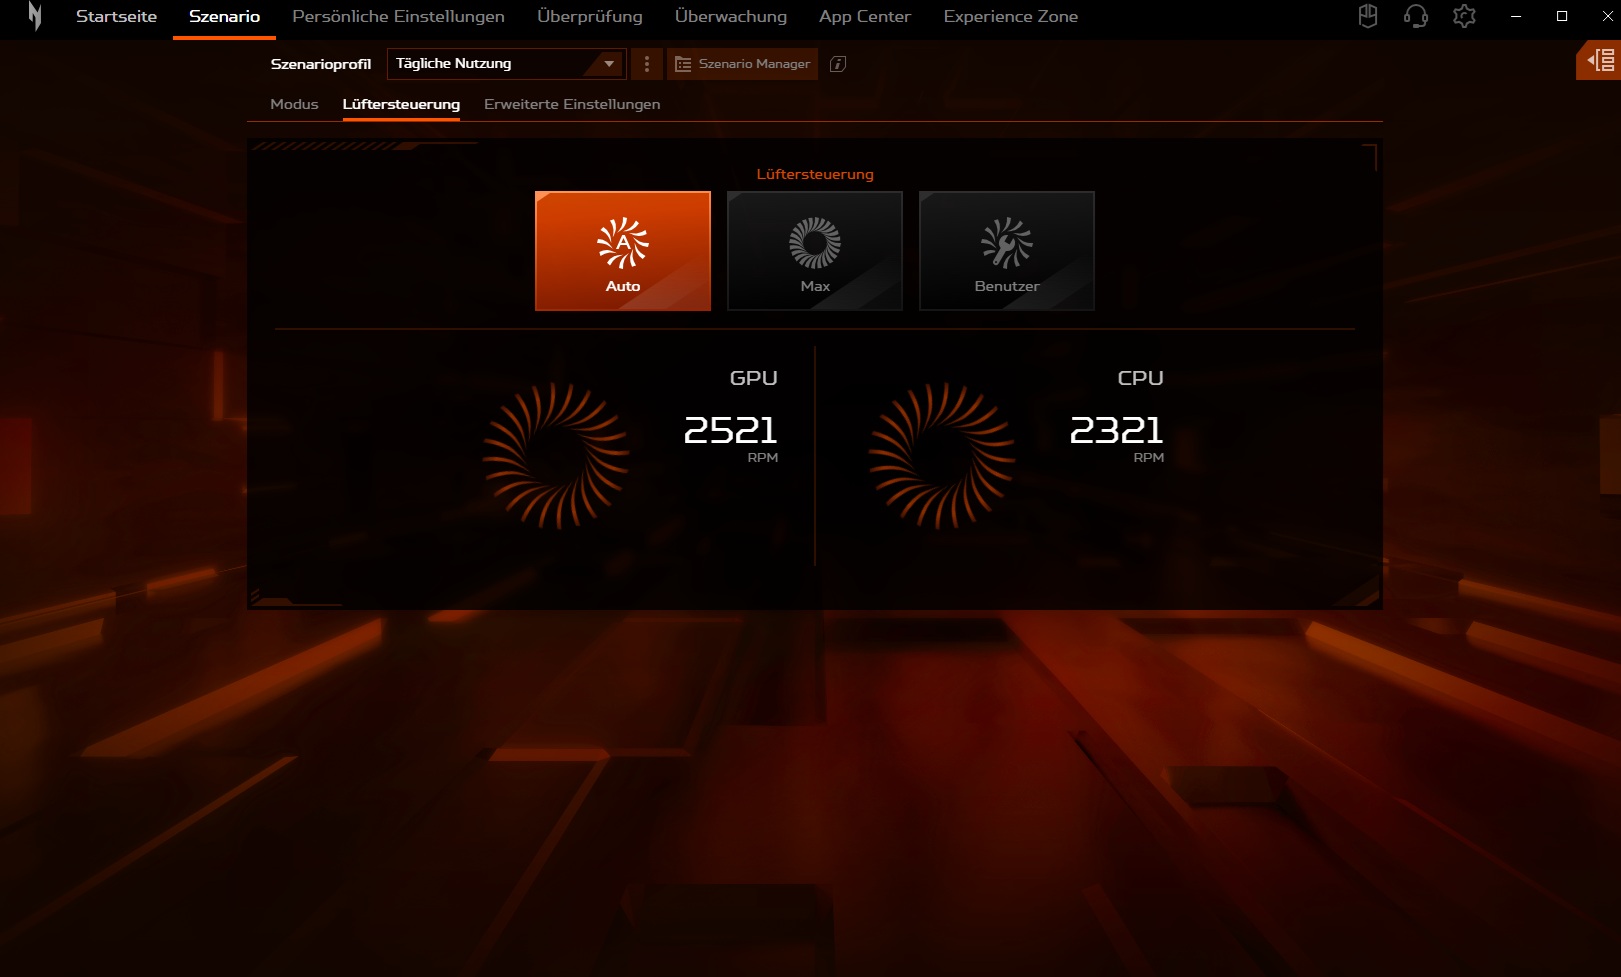
| Mode | Silent | Balanced | Performance | Turbo |
| Bruit Cyberpunk 2077 | 33 dB(A) | 45 dB(A) | 52 dB(A) | 55 dB(A) |
| Taux de rafraîchissement de Cyberpunk 2077 (FHD/Ultra) | 45.1 fps | 59 fps | 61.3 fps | 63 fps |
| Consommation du GPU | ~50 W | ~60 W | ~70 W | ~75 W |
| CPU PL1 | 16 W | 45 W | 50 W | 55 W |
| CPU PL2 | 64 W | 115 W | 115 W | 115 W |
| Score multicœur Cinebench R15 | 934 points | 1769 points | 1775 points | 1782 points |
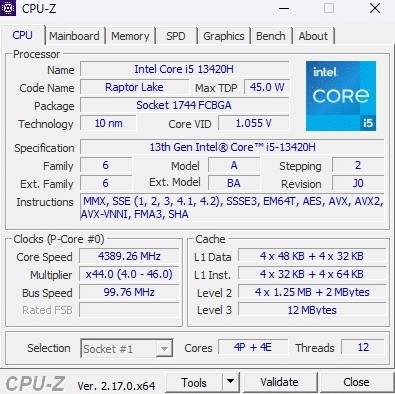
Processeur
La version installée du Core i5-13420H est un modèle qui n'est plus particulièrement nouveau, issu de la génération Raptor Lake d'Intel. Il dispose de quatre cœurs de performance (avec Hyper-Threading) et de quatre cœurs d'efficacité (sans Hyper-Threading), permettant jusqu'à 12 threads simultanés.
Les benchmarks du processeur n'ont révélé aucune irrégularité. Les performances restent stables et correspondent à celles d'autres appareils équipés du i5-13420H. Les modèles concurrents basés sur des processeurs AMD, tels que le Ryzen 7 250 et Ryzen 7 260.
Test d'endurance multicœur Cinebench R15
* ... Moindre est la valeur, meilleures sont les performances
AIDA64: FP32 Ray-Trace | FPU Julia | CPU SHA3 | CPU Queen | FPU SinJulia | FPU Mandel | CPU AES | CPU ZLib | FP64 Ray-Trace | CPU PhotoWorxx
| Performance rating | |
| Moyenne de la classe Gaming | |
| Lenovo Legion 5 15AHP G10 | |
| Lenovo LOQ 15AHP10 | |
| MSI Cyborg 15 B2RWEKG | |
| Acer Nitro V 15 ANV15-51-582S | |
| Acer Nitro V 15 ANV15-52-50S2 | |
| Moyenne Intel Core i5-13420H | |
| HP Victus 15-fa2160ng | |
| AIDA64 / FP32 Ray-Trace | |
| Moyenne de la classe Gaming (10227 - 85542, n=123, 2 dernières années) | |
| Lenovo Legion 5 15AHP G10 | |
| Lenovo LOQ 15AHP10 | |
| Acer Nitro V 15 ANV15-52-50S2 | |
| MSI Cyborg 15 B2RWEKG | |
| Acer Nitro V 15 ANV15-51-582S | |
| Moyenne Intel Core i5-13420H (7922 - 12134, n=5) | |
| HP Victus 15-fa2160ng | |
| AIDA64 / FPU Julia | |
| Moyenne de la classe Gaming (51376 - 238426, n=123, 2 dernières années) | |
| Lenovo Legion 5 15AHP G10 | |
| Lenovo LOQ 15AHP10 | |
| Acer Nitro V 15 ANV15-51-582S | |
| Acer Nitro V 15 ANV15-52-50S2 | |
| MSI Cyborg 15 B2RWEKG | |
| Moyenne Intel Core i5-13420H (40587 - 59715, n=5) | |
| HP Victus 15-fa2160ng | |
| AIDA64 / CPU SHA3 | |
| Moyenne de la classe Gaming (2180 - 9817, n=123, 2 dernières années) | |
| Lenovo Legion 5 15AHP G10 | |
| Lenovo LOQ 15AHP10 | |
| Acer Nitro V 15 ANV15-51-582S | |
| Acer Nitro V 15 ANV15-52-50S2 | |
| HP Victus 15-fa2160ng | |
| MSI Cyborg 15 B2RWEKG | |
| Moyenne Intel Core i5-13420H (1724 - 2634, n=5) | |
| AIDA64 / CPU Queen | |
| Lenovo Legion 5 15AHP G10 | |
| Moyenne de la classe Gaming (49785 - 173351, n=120, 2 dernières années) | |
| Lenovo LOQ 15AHP10 | |
| MSI Cyborg 15 B2RWEKG | |
| Moyenne Intel Core i5-13420H (69803 - 74956, n=5) | |
| Acer Nitro V 15 ANV15-51-582S | |
| Acer Nitro V 15 ANV15-52-50S2 | |
| HP Victus 15-fa2160ng | |
| AIDA64 / FPU SinJulia | |
| Lenovo Legion 5 15AHP G10 | |
| Lenovo LOQ 15AHP10 | |
| Moyenne de la classe Gaming (4424 - 33636, n=123, 2 dernières années) | |
| MSI Cyborg 15 B2RWEKG | |
| Acer Nitro V 15 ANV15-52-50S2 | |
| Acer Nitro V 15 ANV15-51-582S | |
| HP Victus 15-fa2160ng | |
| Moyenne Intel Core i5-13420H (5485 - 6644, n=5) | |
| AIDA64 / FPU Mandel | |
| Moyenne de la classe Gaming (25115 - 128721, n=123, 2 dernières années) | |
| Lenovo Legion 5 15AHP G10 | |
| Lenovo LOQ 15AHP10 | |
| Acer Nitro V 15 ANV15-52-50S2 | |
| MSI Cyborg 15 B2RWEKG | |
| Acer Nitro V 15 ANV15-51-582S | |
| Moyenne Intel Core i5-13420H (19684 - 30163, n=5) | |
| HP Victus 15-fa2160ng | |
| AIDA64 / CPU AES | |
| Moyenne de la classe Gaming (39258 - 247074, n=123, 2 dernières années) | |
| Acer Nitro V 15 ANV15-51-582S | |
| Lenovo Legion 5 15AHP G10 | |
| Lenovo LOQ 15AHP10 | |
| Moyenne Intel Core i5-13420H (35531 - 93100, n=5) | |
| MSI Cyborg 15 B2RWEKG | |
| Acer Nitro V 15 ANV15-52-50S2 | |
| HP Victus 15-fa2160ng | |
| AIDA64 / CPU ZLib | |
| Moyenne de la classe Gaming (574 - 2531, n=123, 2 dernières années) | |
| Lenovo Legion 5 15AHP G10 | |
| Lenovo LOQ 15AHP10 | |
| Acer Nitro V 15 ANV15-52-50S2 | |
| Acer Nitro V 15 ANV15-51-582S | |
| HP Victus 15-fa2160ng | |
| MSI Cyborg 15 B2RWEKG | |
| Moyenne Intel Core i5-13420H (509 - 746, n=5) | |
| AIDA64 / FP64 Ray-Trace | |
| Moyenne de la classe Gaming (5509 - 45446, n=123, 2 dernières années) | |
| Lenovo Legion 5 15AHP G10 | |
| Lenovo LOQ 15AHP10 | |
| Acer Nitro V 15 ANV15-52-50S2 | |
| MSI Cyborg 15 B2RWEKG | |
| Acer Nitro V 15 ANV15-51-582S | |
| Moyenne Intel Core i5-13420H (4283 - 6627, n=5) | |
| HP Victus 15-fa2160ng | |
| AIDA64 / CPU PhotoWorxx | |
| Moyenne de la classe Gaming (12271 - 62916, n=123, 2 dernières années) | |
| Lenovo Legion 5 15AHP G10 | |
| MSI Cyborg 15 B2RWEKG | |
| Acer Nitro V 15 ANV15-51-582S | |
| Lenovo LOQ 15AHP10 | |
| HP Victus 15-fa2160ng | |
| Moyenne Intel Core i5-13420H (12330 - 37044, n=5) | |
| Acer Nitro V 15 ANV15-52-50S2 | |
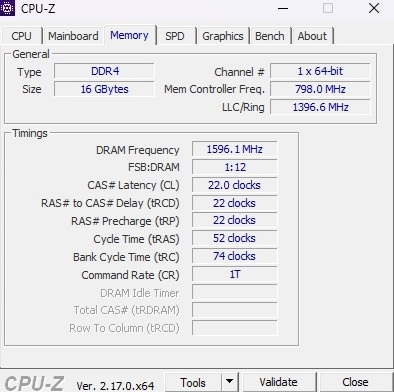
Performance du système
Les performances globales du système ne sont pas remarquables et placent le Nitro V 15 au milieu de la comparaison. Seules les performances de la mémoire s'avèrent quelque peu décevantes.
PCMark 10: Productivity | Digital Content Creation
CrossMark: Overall | Productivity | Creativity | Responsiveness
WebXPRT 3: Overall
WebXPRT 4: Overall
Mozilla Kraken 1.1: Total
| Performance rating | |
| Moyenne de la classe Gaming | |
| Lenovo Legion 5 15AHP G10 | |
| Lenovo LOQ 15AHP10 -2! | |
| MSI Cyborg 15 B2RWEKG | |
| Acer Nitro V 15 ANV15-52-50S2 | |
| Moyenne Intel Core i5-13420H, NVIDIA GeForce RTX 5050 Laptop | |
| Acer Nitro V 15 ANV15-51-582S -4! | |
| HP Victus 15-fa2160ng | |
| PCMark 10 / Productivity | |
| MSI Cyborg 15 B2RWEKG | |
| Acer Nitro V 15 ANV15-52-50S2 | |
| Moyenne de la classe Gaming (6662 - 16716, n=107, 2 dernières années) | |
| Lenovo Legion 5 15AHP G10 | |
| Lenovo LOQ 15AHP10 | |
| Moyenne Intel Core i5-13420H, NVIDIA GeForce RTX 5050 Laptop (6845 - 10967, n=2) | |
| Acer Nitro V 15 ANV15-51-582S | |
| HP Victus 15-fa2160ng | |
| PCMark 10 / Digital Content Creation | |
| Lenovo Legion 5 15AHP G10 | |
| Moyenne de la classe Gaming (7602 - 19351, n=107, 2 dernières années) | |
| Lenovo LOQ 15AHP10 | |
| Acer Nitro V 15 ANV15-51-582S | |
| HP Victus 15-fa2160ng | |
| Moyenne Intel Core i5-13420H, NVIDIA GeForce RTX 5050 Laptop (8618 - 8879, n=2) | |
| Acer Nitro V 15 ANV15-52-50S2 | |
| MSI Cyborg 15 B2RWEKG | |
| CrossMark / Overall | |
| Moyenne de la classe Gaming (1366 - 2344, n=107, 2 dernières années) | |
| Lenovo Legion 5 15AHP G10 | |
| Lenovo LOQ 15AHP10 | |
| MSI Cyborg 15 B2RWEKG | |
| Acer Nitro V 15 ANV15-52-50S2 | |
| Moyenne Intel Core i5-13420H, NVIDIA GeForce RTX 5050 Laptop (1366 - 1381, n=2) | |
| HP Victus 15-fa2160ng | |
| CrossMark / Productivity | |
| Moyenne de la classe Gaming (1386 - 2211, n=107, 2 dernières années) | |
| Lenovo LOQ 15AHP10 | |
| Lenovo Legion 5 15AHP G10 | |
| MSI Cyborg 15 B2RWEKG | |
| Acer Nitro V 15 ANV15-52-50S2 | |
| Moyenne Intel Core i5-13420H, NVIDIA GeForce RTX 5050 Laptop (1386 - 1426, n=2) | |
| HP Victus 15-fa2160ng | |
| CrossMark / Creativity | |
| Moyenne de la classe Gaming (1343 - 2729, n=107, 2 dernières années) | |
| Lenovo Legion 5 15AHP G10 | |
| MSI Cyborg 15 B2RWEKG | |
| Lenovo LOQ 15AHP10 | |
| HP Victus 15-fa2160ng | |
| Moyenne Intel Core i5-13420H, NVIDIA GeForce RTX 5050 Laptop (1343 - 1387, n=2) | |
| Acer Nitro V 15 ANV15-52-50S2 | |
| CrossMark / Responsiveness | |
| Moyenne de la classe Gaming (1226 - 2330, n=107, 2 dernières années) | |
| Lenovo LOQ 15AHP10 | |
| Lenovo Legion 5 15AHP G10 | |
| MSI Cyborg 15 B2RWEKG | |
| Acer Nitro V 15 ANV15-52-50S2 | |
| Moyenne Intel Core i5-13420H, NVIDIA GeForce RTX 5050 Laptop (1249 - 1364, n=2) | |
| HP Victus 15-fa2160ng | |
| WebXPRT 3 / Overall | |
| Moyenne de la classe Gaming (237 - 532, n=110, 2 dernières années) | |
| Lenovo Legion 5 15AHP G10 | |
| Acer Nitro V 15 ANV15-51-582S | |
| MSI Cyborg 15 B2RWEKG | |
| HP Victus 15-fa2160ng | |
| Moyenne Intel Core i5-13420H, NVIDIA GeForce RTX 5050 Laptop (242 - 247, n=2) | |
| Acer Nitro V 15 ANV15-52-50S2 | |
| WebXPRT 4 / Overall | |
| Moyenne de la classe Gaming (176.4 - 345, n=108, 2 dernières années) | |
| Lenovo Legion 5 15AHP G10 | |
| MSI Cyborg 15 B2RWEKG | |
| Acer Nitro V 15 ANV15-51-582S | |
| HP Victus 15-fa2160ng | |
| Moyenne Intel Core i5-13420H, NVIDIA GeForce RTX 5050 Laptop (220 - 226, n=2) | |
| Acer Nitro V 15 ANV15-52-50S2 | |
| Mozilla Kraken 1.1 / Total | |
| Acer Nitro V 15 ANV15-52-50S2 | |
| Moyenne Intel Core i5-13420H, NVIDIA GeForce RTX 5050 Laptop (577 - 586, n=2) | |
| HP Victus 15-fa2160ng | |
| Acer Nitro V 15 ANV15-51-582S | |
| MSI Cyborg 15 B2RWEKG | |
| Lenovo LOQ 15AHP10 | |
| Lenovo Legion 5 15AHP G10 | |
| Moyenne de la classe Gaming (397 - 594, n=116, 2 dernières années) | |
* ... Moindre est la valeur, meilleures sont les performances
| AIDA64 / Memory Copy | |
| Moyenne de la classe Gaming (21750 - 108104, n=123, 2 dernières années) | |
| Lenovo Legion 5 15AHP G10 | |
| MSI Cyborg 15 B2RWEKG | |
| Acer Nitro V 15 ANV15-51-582S | |
| Lenovo LOQ 15AHP10 | |
| Moyenne Intel Core i5-13420H (22003 - 59609, n=5) | |
| HP Victus 15-fa2160ng | |
| Acer Nitro V 15 ANV15-52-50S2 | |
| AIDA64 / Memory Read | |
| Moyenne de la classe Gaming (22956 - 104349, n=123, 2 dernières années) | |
| MSI Cyborg 15 B2RWEKG | |
| Lenovo Legion 5 15AHP G10 | |
| Acer Nitro V 15 ANV15-51-582S | |
| Moyenne Intel Core i5-13420H (23499 - 68085, n=5) | |
| HP Victus 15-fa2160ng | |
| Lenovo LOQ 15AHP10 | |
| Acer Nitro V 15 ANV15-52-50S2 | |
| AIDA64 / Memory Write | |
| Lenovo Legion 5 15AHP G10 | |
| Moyenne de la classe Gaming (22297 - 133486, n=123, 2 dernières années) | |
| MSI Cyborg 15 B2RWEKG | |
| Lenovo LOQ 15AHP10 | |
| Acer Nitro V 15 ANV15-51-582S | |
| Moyenne Intel Core i5-13420H (21429 - 62529, n=5) | |
| HP Victus 15-fa2160ng | |
| Acer Nitro V 15 ANV15-52-50S2 | |
| AIDA64 / Memory Latency | |
| Moyenne de la classe Gaming (75.3 - 259, n=123, 2 dernières années) | |
| HP Victus 15-fa2160ng | |
| MSI Cyborg 15 B2RWEKG | |
| Acer Nitro V 15 ANV15-52-50S2 | |
| Lenovo LOQ 15AHP10 | |
| Moyenne Intel Core i5-13420H (90.2 - 103.6, n=5) | |
| Lenovo Legion 5 15AHP G10 | |
| Acer Nitro V 15 ANV15-51-582S | |
* ... Moindre est la valeur, meilleures sont les performances
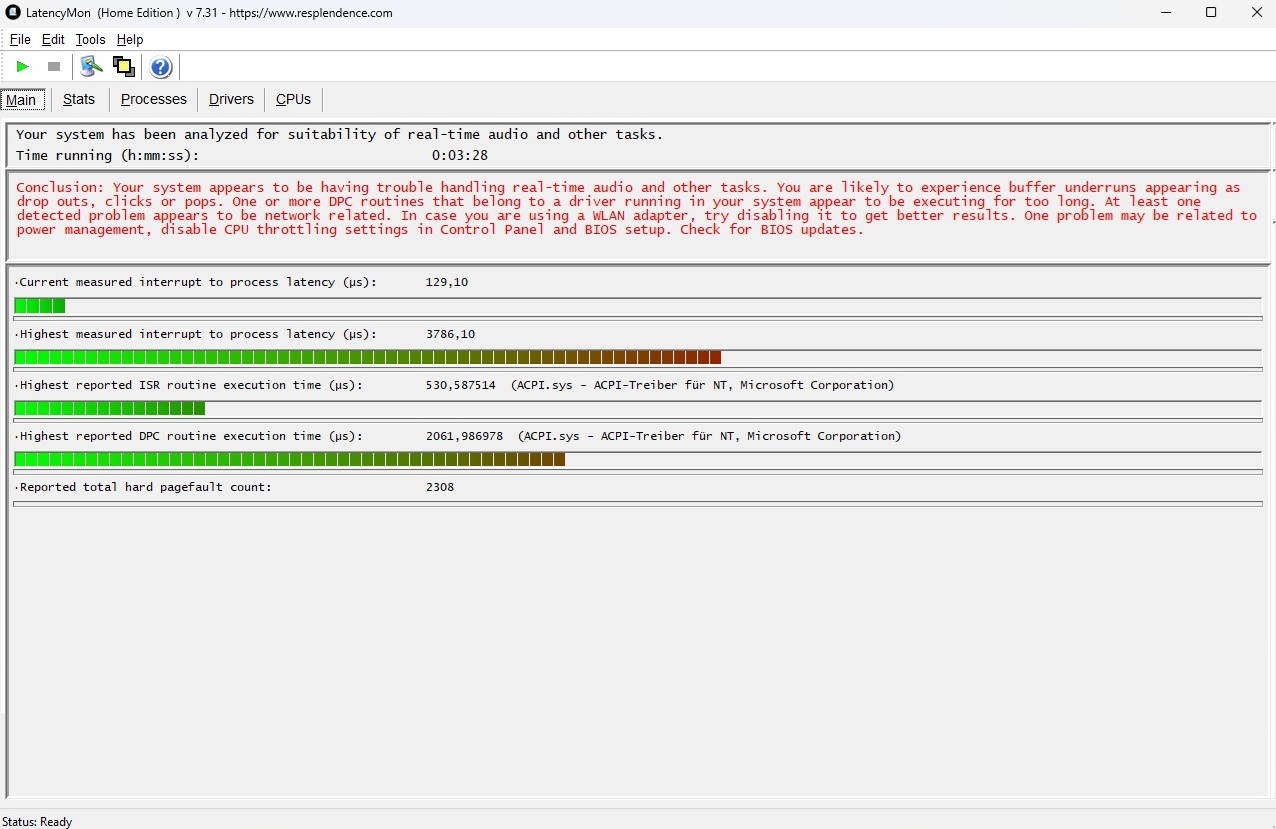
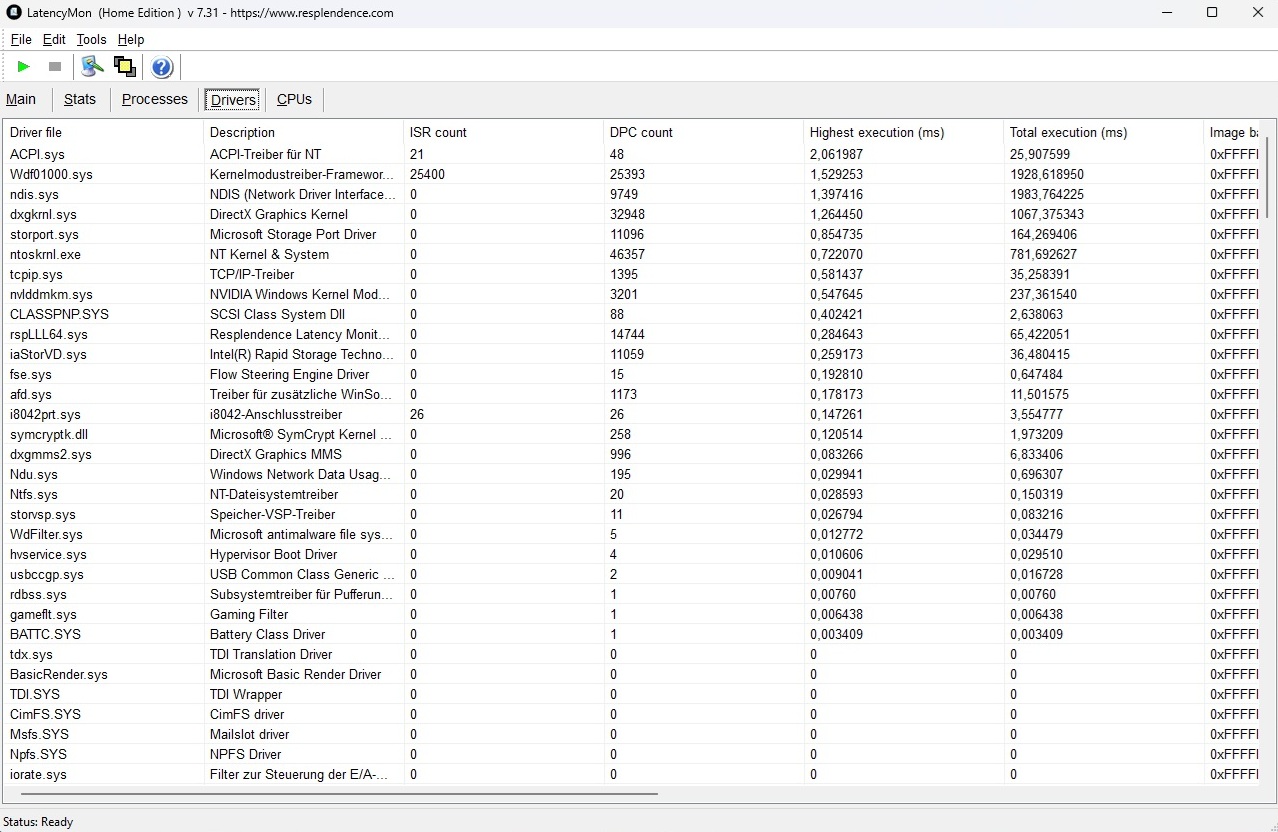
Latences DPC
Les résultats en matière de latence sont tout aussi modestes que ceux du Cyborg 15 récemment testé. Son prédécesseur a obtenu des valeurs nettement inférieures (c'est-à-dire meilleures) à cet égard.
| DPC Latencies / LatencyMon - interrupt to process latency (max), Web, Youtube, Prime95 | |
| MSI Cyborg 15 B2RWEKG | |
| Acer Nitro V 15 ANV15-52-50S2 | |
| HP Victus 15-fa2160ng | |
| Lenovo Legion 5 15AHP G10 | |
| Lenovo LOQ 15AHP10 | |
| Acer Nitro V 15 ANV15-51-582S | |
* ... Moindre est la valeur, meilleures sont les performances
Stockage
Le SSD Kingston de 1 To souffre malheureusement d'une baisse de performance en cas de charge soutenue. Toutefois, ce problème n'est pas propre au Nitro V 15 et affecte également plusieurs concurrents, dont le Lenovo LOQ 15.

* ... Moindre est la valeur, meilleures sont les performances
Performances de lecture soutenues : Boucle de lecture DiskSpd (profondeur de file d'attente 8)
Performance du GPU
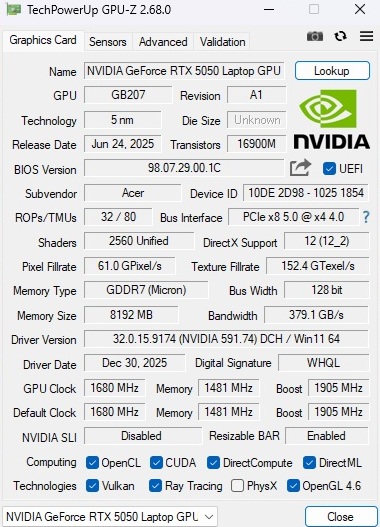
Grâce à son TGP maximal de 75 watts, la GeForce RTX 5050 offre des performances en ligne avec la moyenne précédemment enregistrée pour ce GPU. Cependant, la différence par rapport à la RTX 4050 de son prédécesseur.
| 3DMark 11 Performance | 21647 points | |
| 3DMark Fire Strike Score | 20647 points | |
| 3DMark Time Spy Score | 8449 points | |
Aide | ||
* ... Moindre est la valeur, meilleures sont les performances
Performances de jeu
Les jeux plus anciens ou moins exigeants fonctionnent généralement sans problème à la résolution native de 1 920 x 1 080, même avec les paramètres maximums. Cependant, avec les titres actuels ou plus exigeants, les réglages moyens à élevés sont souvent la limite pratique si l'on souhaite obtenir des taux de rafraîchissement supérieurs à 40 FPS. L'upscaling peut être utilisé comme alternative si nécessaire.
Avec DLSS réglé sur le mode Qualité, par exemple, Jusqu'à l'aube a atteint 44 FPS sur le préréglage Ultra au lieu de 36 FPS. Comme d'habitude, il est possible d'atteindre des taux de rafraîchissement encore plus élevés en générant des images.
| Bas | Moyen | Élevé | Ultra | |
|---|---|---|---|---|
| Dota 2 Reborn (2015) | 86.3 | 92.1 | 86.5 | |
| X-Plane 11.11 (2018) | 71.9 | 67.1 | ||
| Strange Brigade (2018) | 185 | 164.8 | 154.6 | |
| Baldur's Gate 3 (2023) | 89.2 | 70.9 | 68.1 | |
| Cyberpunk 2077 (2023) | 77.5 | 67.8 | 61.3 | |
| Until Dawn (2024) | 53.3 | 47.6 | 36.4 | |
| ARC Raiders (2025) | 81 | 68.7 | 49.2 |
| ARC Raiders | |
| 1920x1080 Epic Preset + Epic Raytracing AA:TSR | |
| Moyenne de la classe Gaming (43.5 - 89.5, n=10, 2 dernières années) | |
| Moyenne NVIDIA GeForce RTX 5050 Laptop (43.5 - 58.2, n=4) | |
| Acer Nitro V 15 ANV15-52-50S2 | |
| MSI Cyborg 15 B2RWEKG | |
| 1920x1080 High Preset AA:TSR | |
| Moyenne de la classe Gaming (64.5 - 129.2, n=10, 2 dernières années) | |
| Moyenne NVIDIA GeForce RTX 5050 Laptop (64.5 - 85.9, n=4) | |
| Acer Nitro V 15 ANV15-52-50S2 | |
| MSI Cyborg 15 B2RWEKG | |
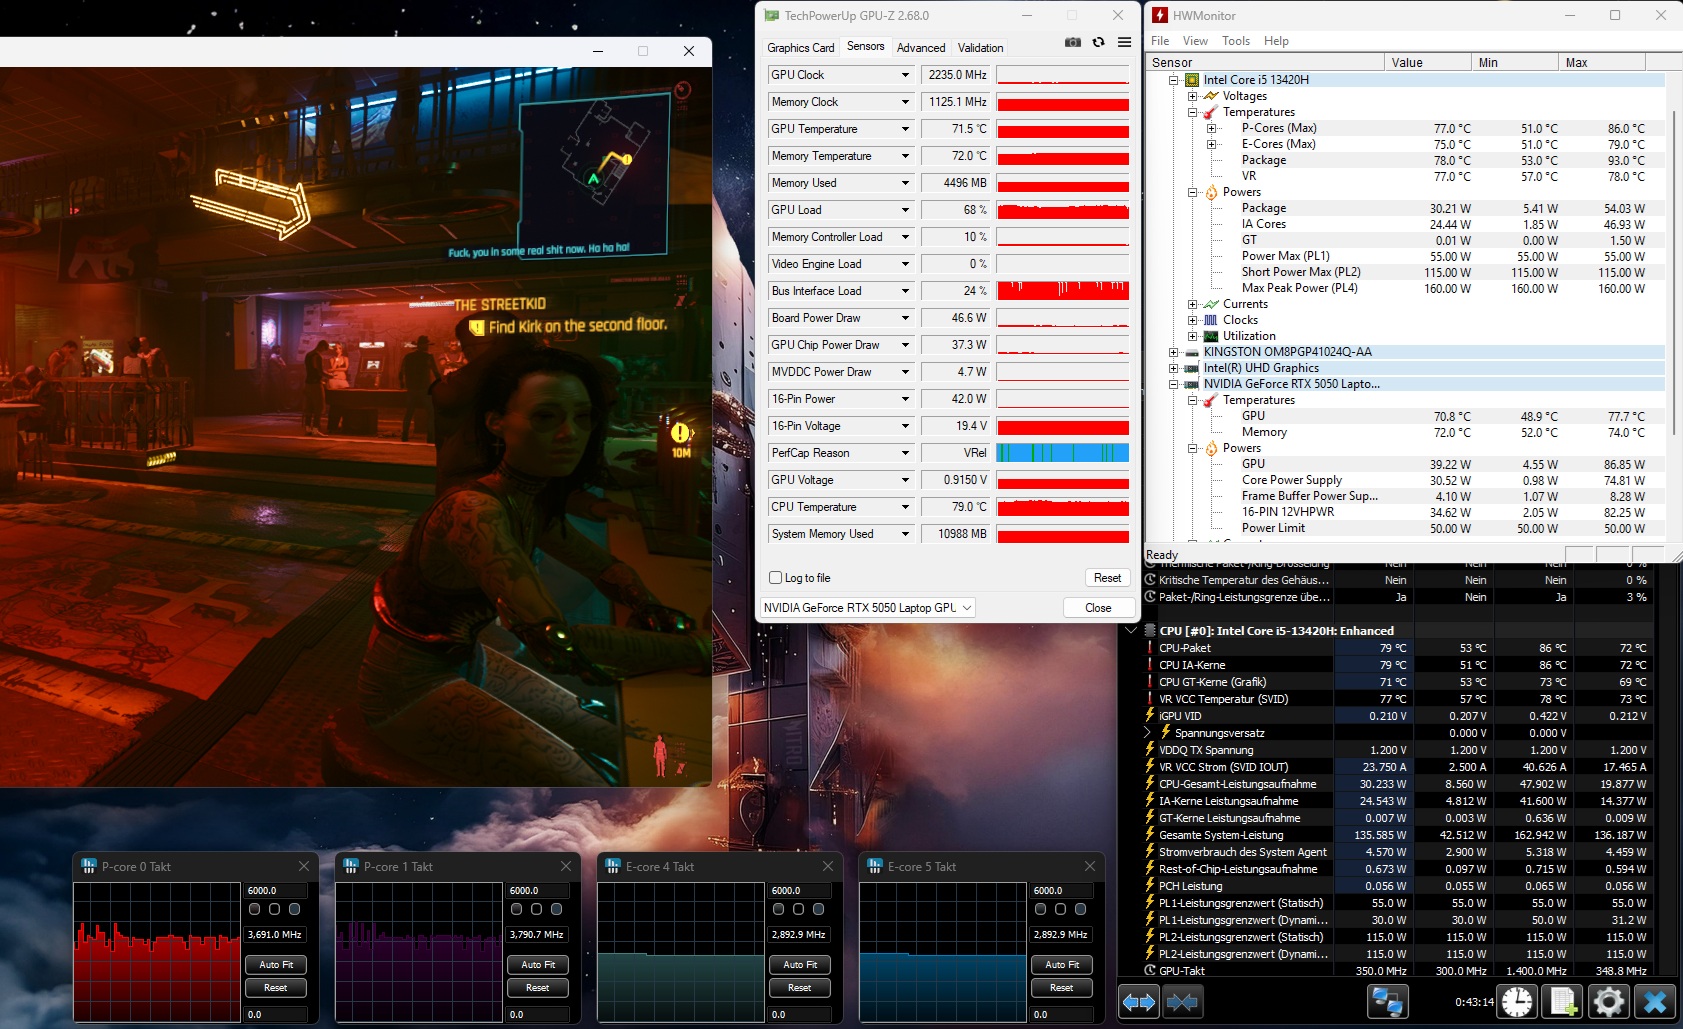
Cyberpunk 2077 Ultra FPS chart
Émissions
Émissions sonores
En charge, l'Acer Nitro V 15 devient légèrement plus bruyant que la plupart de ses concurrents, avec 48 à 54 dB(A). Les utilisateurs plus sensibles peuvent bien sûr choisir un autre mode de fonctionnement. Dans Cyberpunk 2077le passage en mode équilibré réduit le niveau sonore de 52 à 45 dB(A) sans sacrifier beaucoup de performances.
Degré de la nuisance sonore
| Au repos |
| 28 / 29 / 33 dB(A) |
| Fortement sollicité |
| 48 / 54 dB(A) |
 | ||
30 dB silencieux 40 dB(A) audible 50 dB(A) bruyant |
||
min: | ||
| Acer Nitro V 15 ANV15-52-50S2 i5-13420H, GeForce RTX 5050 Laptop | Acer Nitro V 15 ANV15-51-582S i5-13420H, GeForce RTX 4050 Laptop GPU | HP Victus 15-fa2160ng i5-13420H, GeForce RTX 5050 Laptop | MSI Cyborg 15 B2RWEKG Core 7 240H, GeForce RTX 5050 Laptop | Lenovo LOQ 15AHP10 R7 250, GeForce RTX 5060 Laptop | Lenovo Legion 5 15AHP G10 R7 260, GeForce RTX 5060 Laptop | |
|---|---|---|---|---|---|---|
| Noise | 3% | 7% | 6% | -23% | 10% | |
| arrêt / environnement * (dB) | 24 | 25 -4% | 24 -0% | 24 -0% | 25 -4% | 25.5 -6% |
| Idle Minimum * (dB) | 28 | 25 11% | 28 -0% | 25 11% | 43 -54% | 25.5 9% |
| Idle Average * (dB) | 29 | 29 -0% | 29 -0% | 28 3% | 45 -55% | 25.5 12% |
| Idle Maximum * (dB) | 33 | 30 9% | 30 9% | 33 -0% | 48 -45% | 26.9 18% |
| Load Average * (dB) | 48 | 49 -2% | 40 17% | 44 8% | 53 -10% | 34.6 28% |
| Cyberpunk 2077 ultra * (dB) | 52 | 46 12% | 45 13% | 51 2% | 50.1 4% | |
| Load Maximum * (dB) | 54 | 51 6% | 48 11% | 50 7% | 53 2% | 50.1 7% |
| Witcher 3 ultra * (dB) | 49 |
* ... Moindre est la valeur, meilleures sont les performances
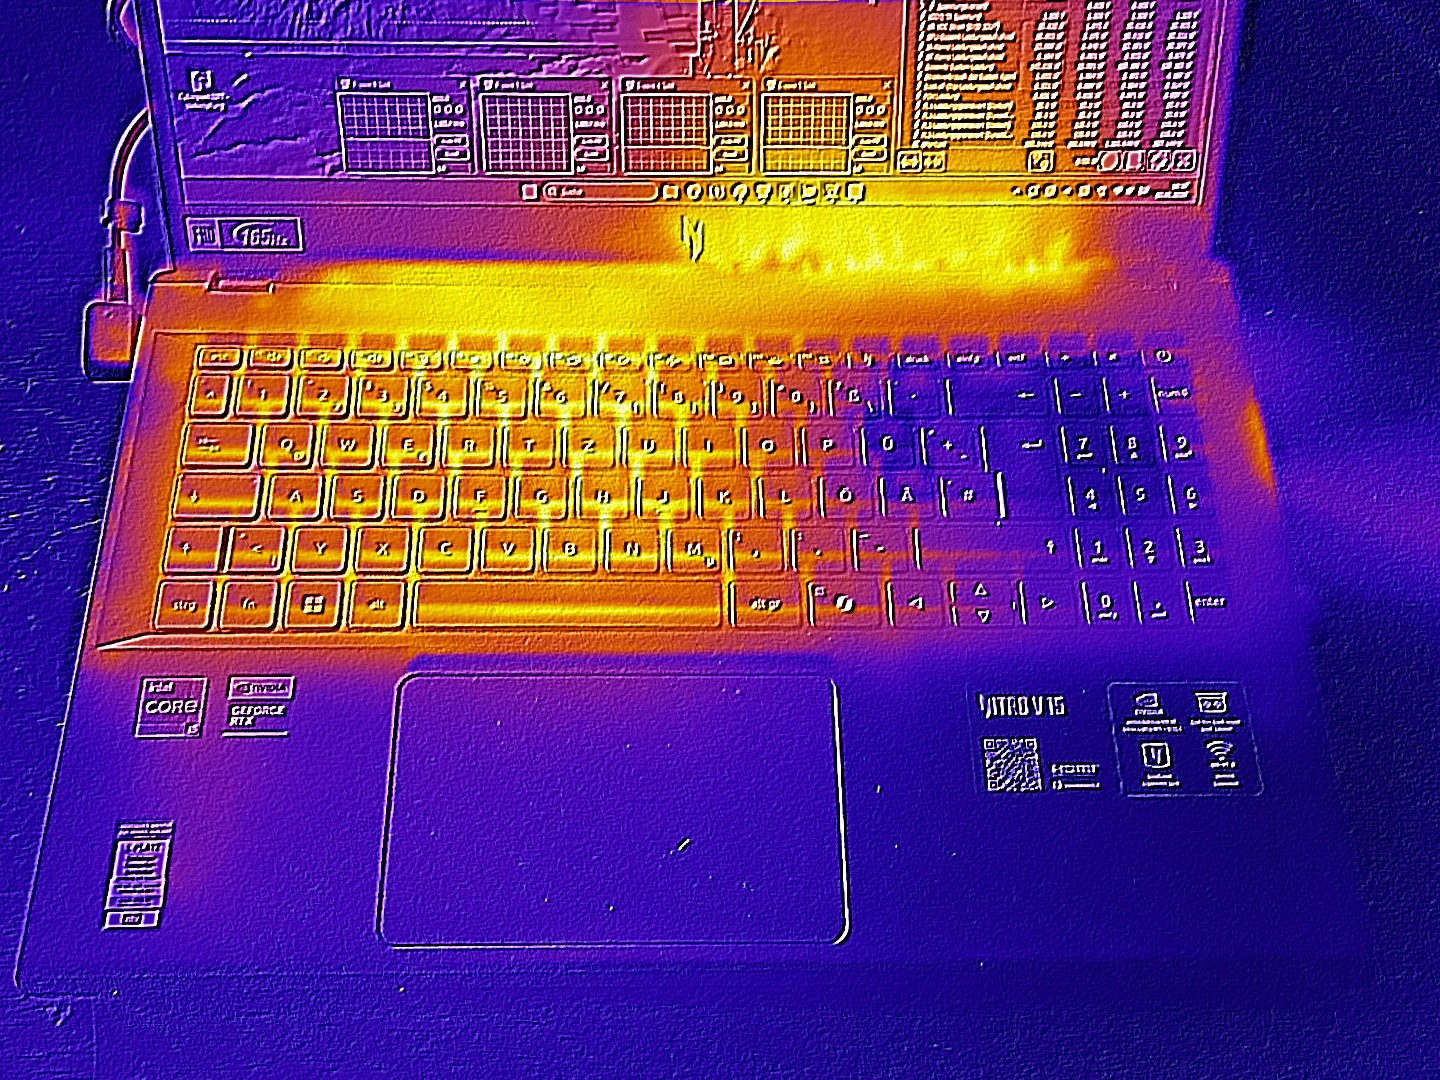
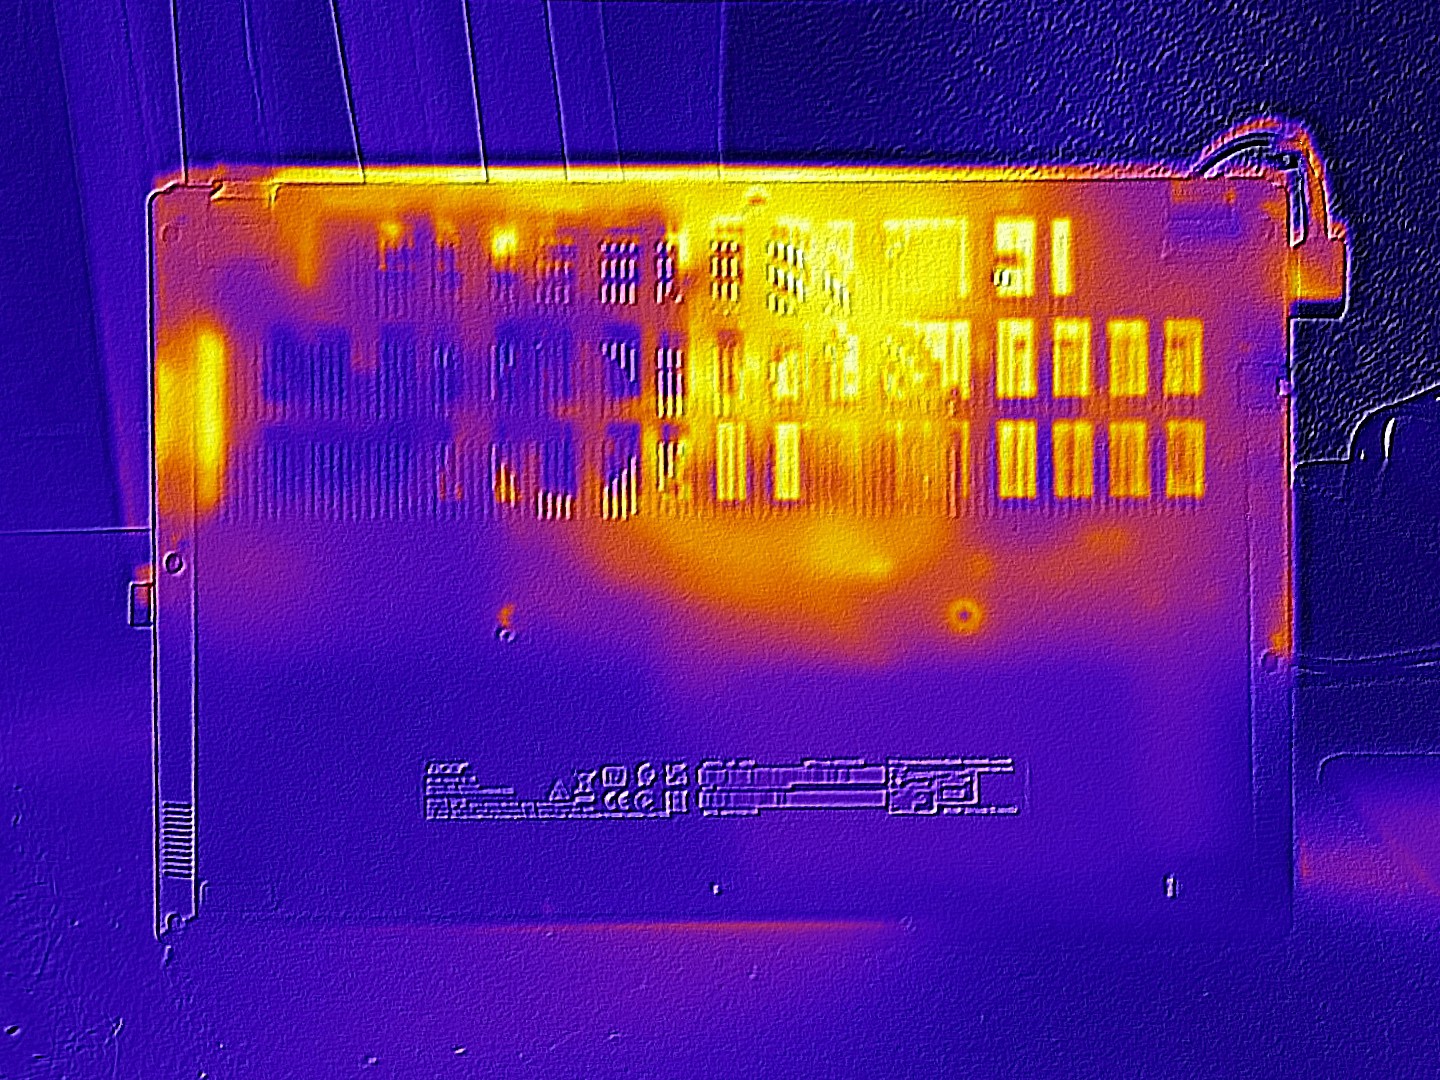
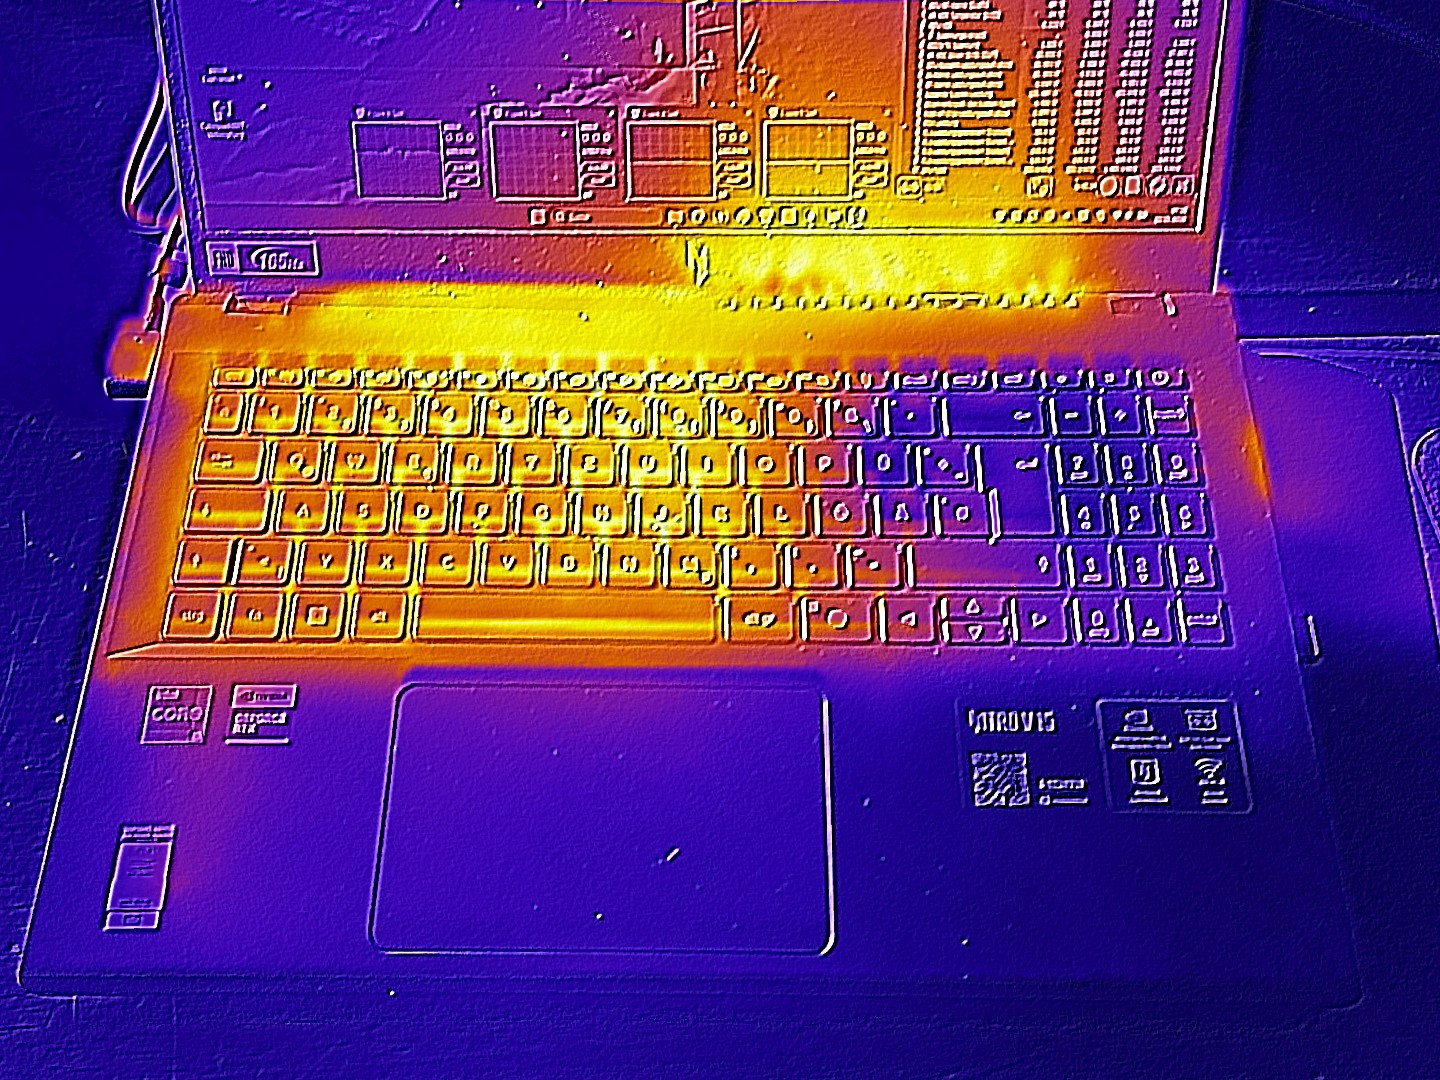
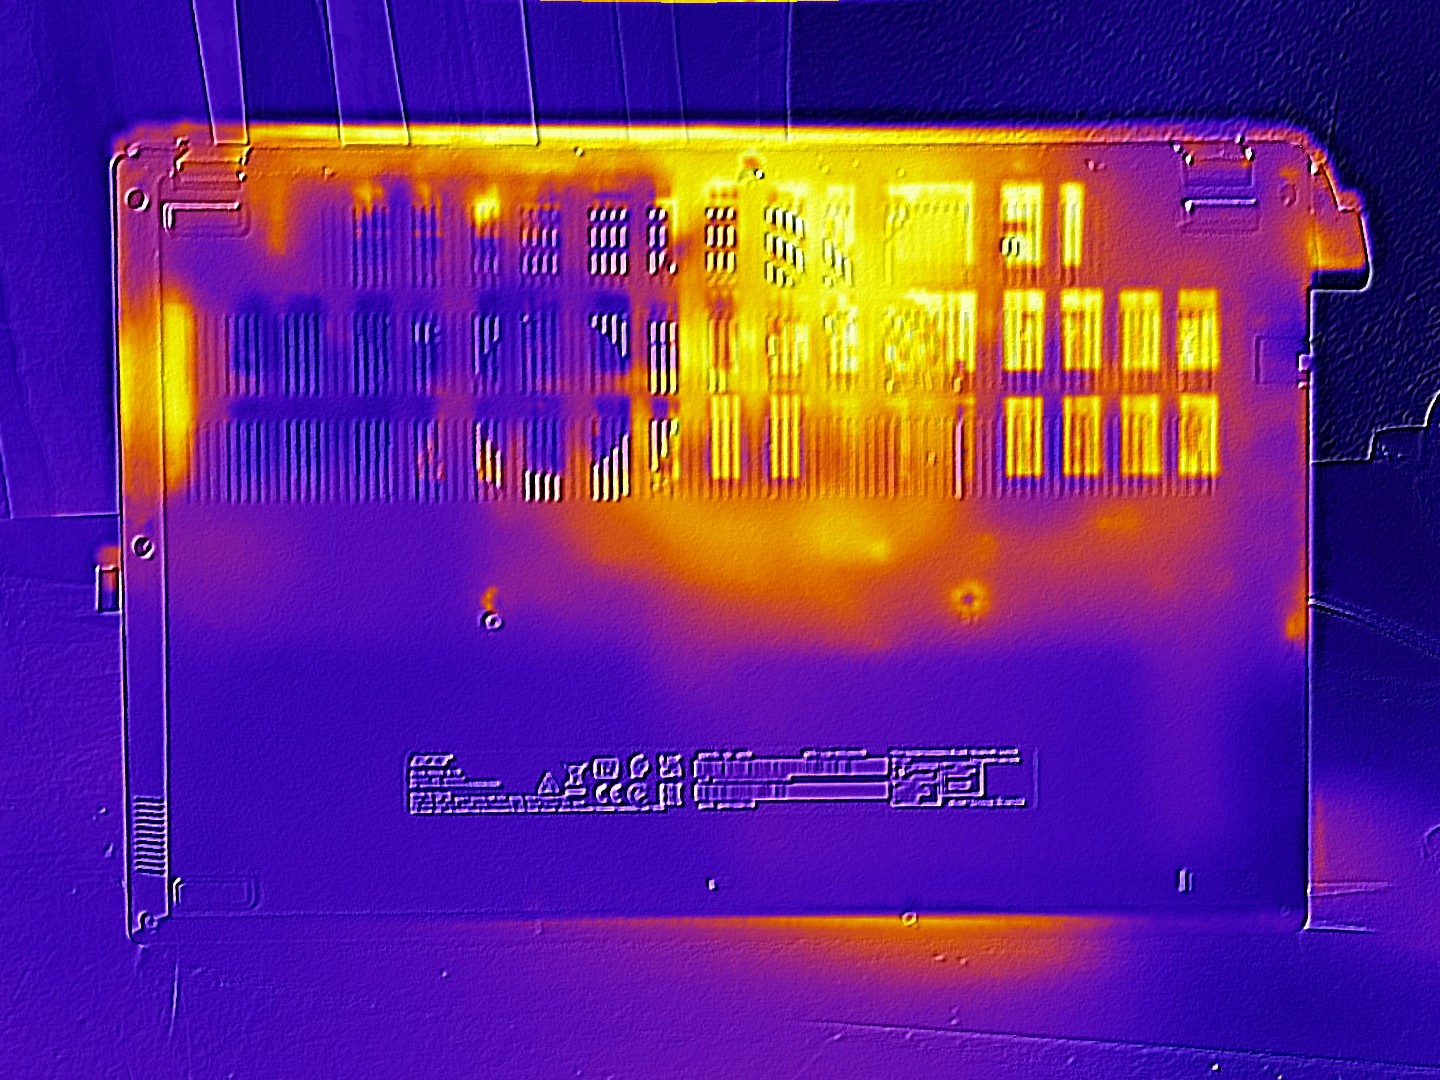
Température
Les températures sont conformes aux attentes pour un ordinateur portable RTX 5050. En mode veille, le châssis reste agréablement frais.
(-) La température maximale du côté supérieur est de 46 °C / 115 F, par rapport à la moyenne de 40.4 °C / 105 F, allant de 21.2 à 68.8 °C pour la classe Gaming.
(-) Le fond chauffe jusqu'à un maximum de 49 °C / 120 F, contre une moyenne de 43.3 °C / 110 F
(+) En utilisation inactive, la température moyenne du côté supérieur est de 25.8 °C / 78 F, par rapport à la moyenne du dispositif de 33.9 °C / 93 F.
(±) 3: The average temperature for the upper side is 37.8 °C / 100 F, compared to the average of 33.9 °C / 93 F for the class Gaming.
(+) Les repose-poignets et le pavé tactile sont plus froids que la température de la peau avec un maximum de 31 °C / 87.8 F et sont donc froids au toucher.
(-) La température moyenne de la zone de l'appui-paume de dispositifs similaires était de 28.8 °C / 83.8 F (-2.2 °C / #-4 F).
| Acer Nitro V 15 ANV15-52-50S2 i5-13420H, GeForce RTX 5050 Laptop | Acer Nitro V 15 ANV15-51-582S i5-13420H, GeForce RTX 4050 Laptop GPU | HP Victus 15-fa2160ng i5-13420H, GeForce RTX 5050 Laptop | MSI Cyborg 15 B2RWEKG Core 7 240H, GeForce RTX 5050 Laptop | Lenovo LOQ 15AHP10 R7 250, GeForce RTX 5060 Laptop | Lenovo Legion 5 15AHP G10 R7 260, GeForce RTX 5060 Laptop | |
|---|---|---|---|---|---|---|
| Heat | 3% | -2% | -12% | -9% | 1% | |
| Maximum Upper Side * (°C) | 46 | 46 -0% | 43 7% | 46 -0% | 49 -7% | 42.2 8% |
| Maximum Bottom * (°C) | 49 | 48 2% | 43 12% | 45 8% | 58 -18% | 51.7 -6% |
| Idle Upper Side * (°C) | 28 | 27 4% | 37 -32% | 36 -29% | 32 -14% | 28.5 -2% |
| Idle Bottom * (°C) | 30 | 28 7% | 28 7% | 38 -27% | 29 3% | 29.2 3% |
* ... Moindre est la valeur, meilleures sont les performances
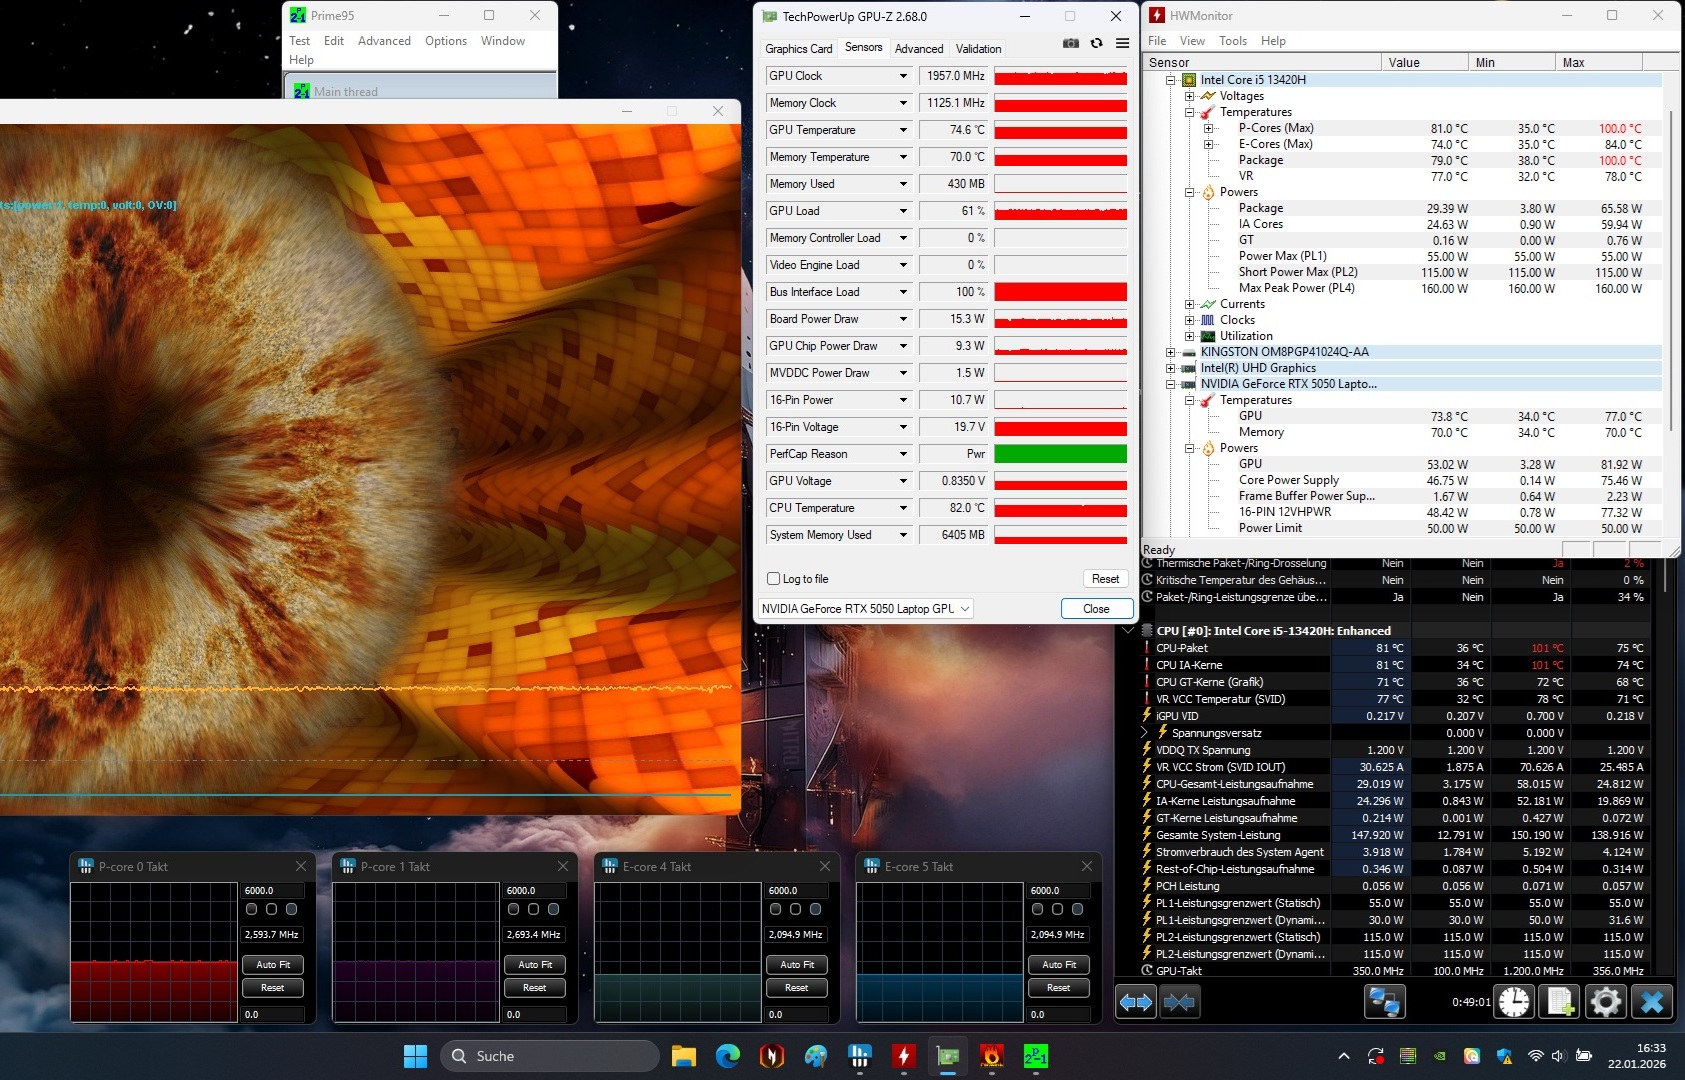
Épreuve d'effort
Notre test de stress à l'aide des outils FurMark et Prime95 a poussé le GPU à environ 75 °C, tandis que le CPU s'est stabilisé à environ 80 °C après une courte période.
Haut-parleur
La qualité sonore se situe dans la moyenne. Comme pour la plupart des ordinateurs portables, les basses en particulier laissent à désirer.
Acer Nitro V 15 ANV15-52-50S2 analyse audio
(+) | les haut-parleurs peuvent jouer relativement fort (83# dB)
Basses 100 - 315 Hz
(-) | presque aucune basse - en moyenne 27.5% plus bas que la médiane
(-) | les basses ne sont pas linéaires (15% delta à la fréquence précédente)
Médiums 400 - 2000 Hz
(+) | médiane équilibrée - seulement 4.7% de la médiane
(+) | les médiums sont linéaires (4.4% delta à la fréquence précédente)
Aiguës 2 - 16 kHz
(+) | des sommets équilibrés - à seulement 2% de la médiane
(+) | les aigus sont linéaires (4.5% delta à la fréquence précédente)
Globalement 100 - 16 000 Hz
(±) | la linéarité du son global est moyenne (17.9% de différence avec la médiane)
Par rapport à la même classe
» 54% de tous les appareils testés de cette catégorie étaient meilleurs, 9% similaires, 37% pires
» Le meilleur avait un delta de 6%, la moyenne était de 18%, le pire était de 132%.
Par rapport à tous les appareils testés
» 37% de tous les appareils testés étaient meilleurs, 8% similaires, 55% pires
» Le meilleur avait un delta de 4%, la moyenne était de 24%, le pire était de 134%.
HP Victus 15-fa2160ng analyse audio
(+) | les haut-parleurs peuvent jouer relativement fort (83# dB)
Basses 100 - 315 Hz
(-) | presque aucune basse - en moyenne 23.8% plus bas que la médiane
(±) | la linéarité des basses est moyenne (12% delta à la fréquence précédente)
Médiums 400 - 2000 Hz
(+) | médiane équilibrée - seulement 2.1% de la médiane
(+) | les médiums sont linéaires (4% delta à la fréquence précédente)
Aiguës 2 - 16 kHz
(±) | sommets plus élevés - en moyenne 5.5% plus élevés que la médiane
(+) | les aigus sont linéaires (4.5% delta à la fréquence précédente)
Globalement 100 - 16 000 Hz
(±) | la linéarité du son global est moyenne (17.8% de différence avec la médiane)
Par rapport à la même classe
» 53% de tous les appareils testés de cette catégorie étaient meilleurs, 10% similaires, 37% pires
» Le meilleur avait un delta de 6%, la moyenne était de 18%, le pire était de 132%.
Par rapport à tous les appareils testés
» 36% de tous les appareils testés étaient meilleurs, 8% similaires, 56% pires
» Le meilleur avait un delta de 4%, la moyenne était de 24%, le pire était de 134%.
Gestion de l'énergie
la consommation d'énergie
Avec une moyenne de 18 watts, la consommation en mode veille pourrait être plus faible. En charge, le 15 pouces consomme entre 66 et 119 watts, de sorte que l'alimentation de 135 watts incluse n'est pas surchargée.
| Éteint/en veille | |
| Au repos | |
| Fortement sollicité |
|
Légende:
min: | |
| Acer Nitro V 15 ANV15-52-50S2 i5-13420H, GeForce RTX 5050 Laptop | Acer Nitro V 15 ANV15-51-582S i5-13420H, GeForce RTX 4050 Laptop GPU | HP Victus 15-fa2160ng i5-13420H, GeForce RTX 5050 Laptop | MSI Cyborg 15 B2RWEKG Core 7 240H, GeForce RTX 5050 Laptop | Lenovo LOQ 15AHP10 R7 250, GeForce RTX 5060 Laptop | Lenovo Legion 5 15AHP G10 R7 260, GeForce RTX 5060 Laptop | Moyenne de la classe Gaming | |
|---|---|---|---|---|---|---|---|
| Power Consumption | 26% | 2% | 4% | -28% | -10% | -38% | |
| Idle Minimum * (Watt) | 16.8 | 7 58% | 7.9 53% | 14.9 11% | 20 -19% | 6.9 59% | 13.4 ? 20% |
| Idle Average * (Watt) | 17.6 | 8 55% | 9.2 48% | 16.3 7% | 20.7 -18% | 10.7 39% | 19.1 ? -9% |
| Idle Maximum * (Watt) | 19.8 | 11 44% | 13.5 32% | 22.2 -12% | 22.7 -15% | 11.3 43% | 24.5 ? -24% |
| Load Average * (Watt) | 66 | 76 -15% | 78 -18% | 72 -9% | 71 -8% | 69.7 -6% | 108.3 ? -64% |
| Cyberpunk 2077 ultra * (Watt) | 106.5 | 128.4 -21% | 90.3 15% | 153.1 -44% | 162.6 -53% | ||
| Cyberpunk 2077 ultra external monitor * (Watt) | 105 | 126.7 -21% | 89.6 15% | 151.1 -44% | 165 -57% | ||
| Load Maximum * (Watt) | 119 | 136 -14% | 187 -57% | 117 2% | 172 -45% | 233.6 -96% | 253 ? -113% |
| Witcher 3 ultra * (Watt) | 98.2 |
* ... Moindre est la valeur, meilleures sont les performances
consommation d'énergie Cyberpunk / Stress test
consommation d'énergie avec moniteur externe
Durée de vie de la batterie
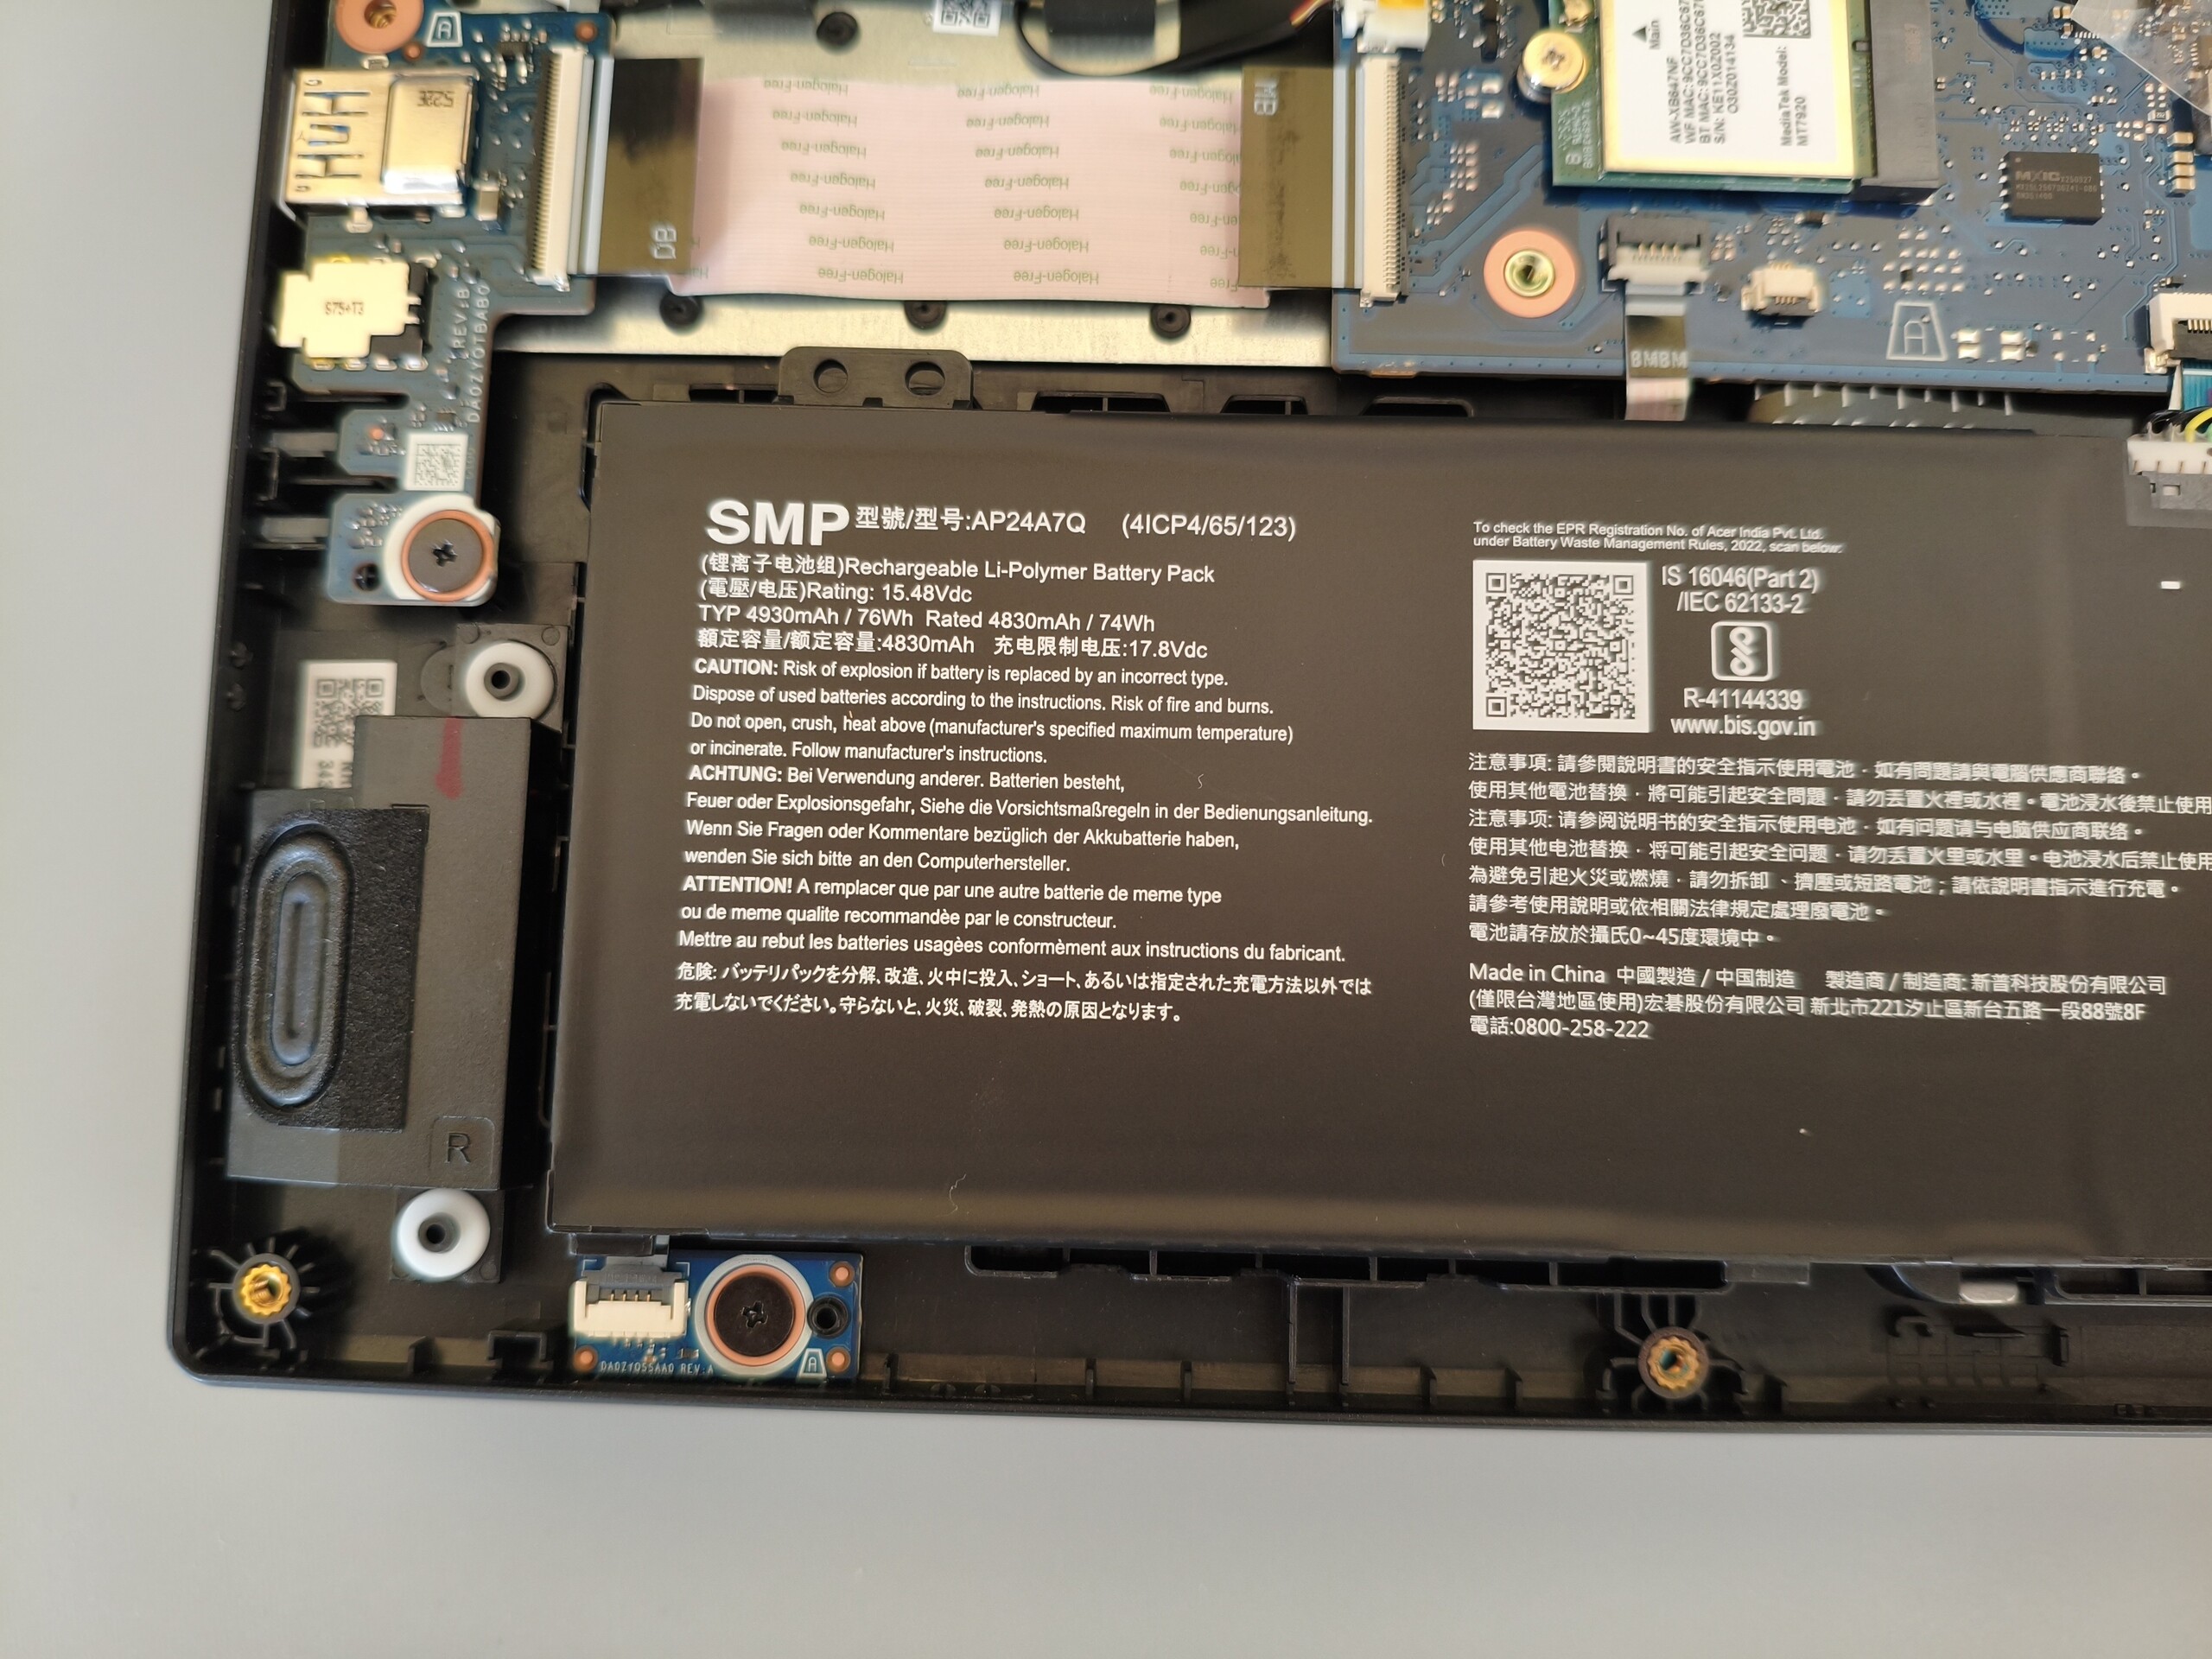
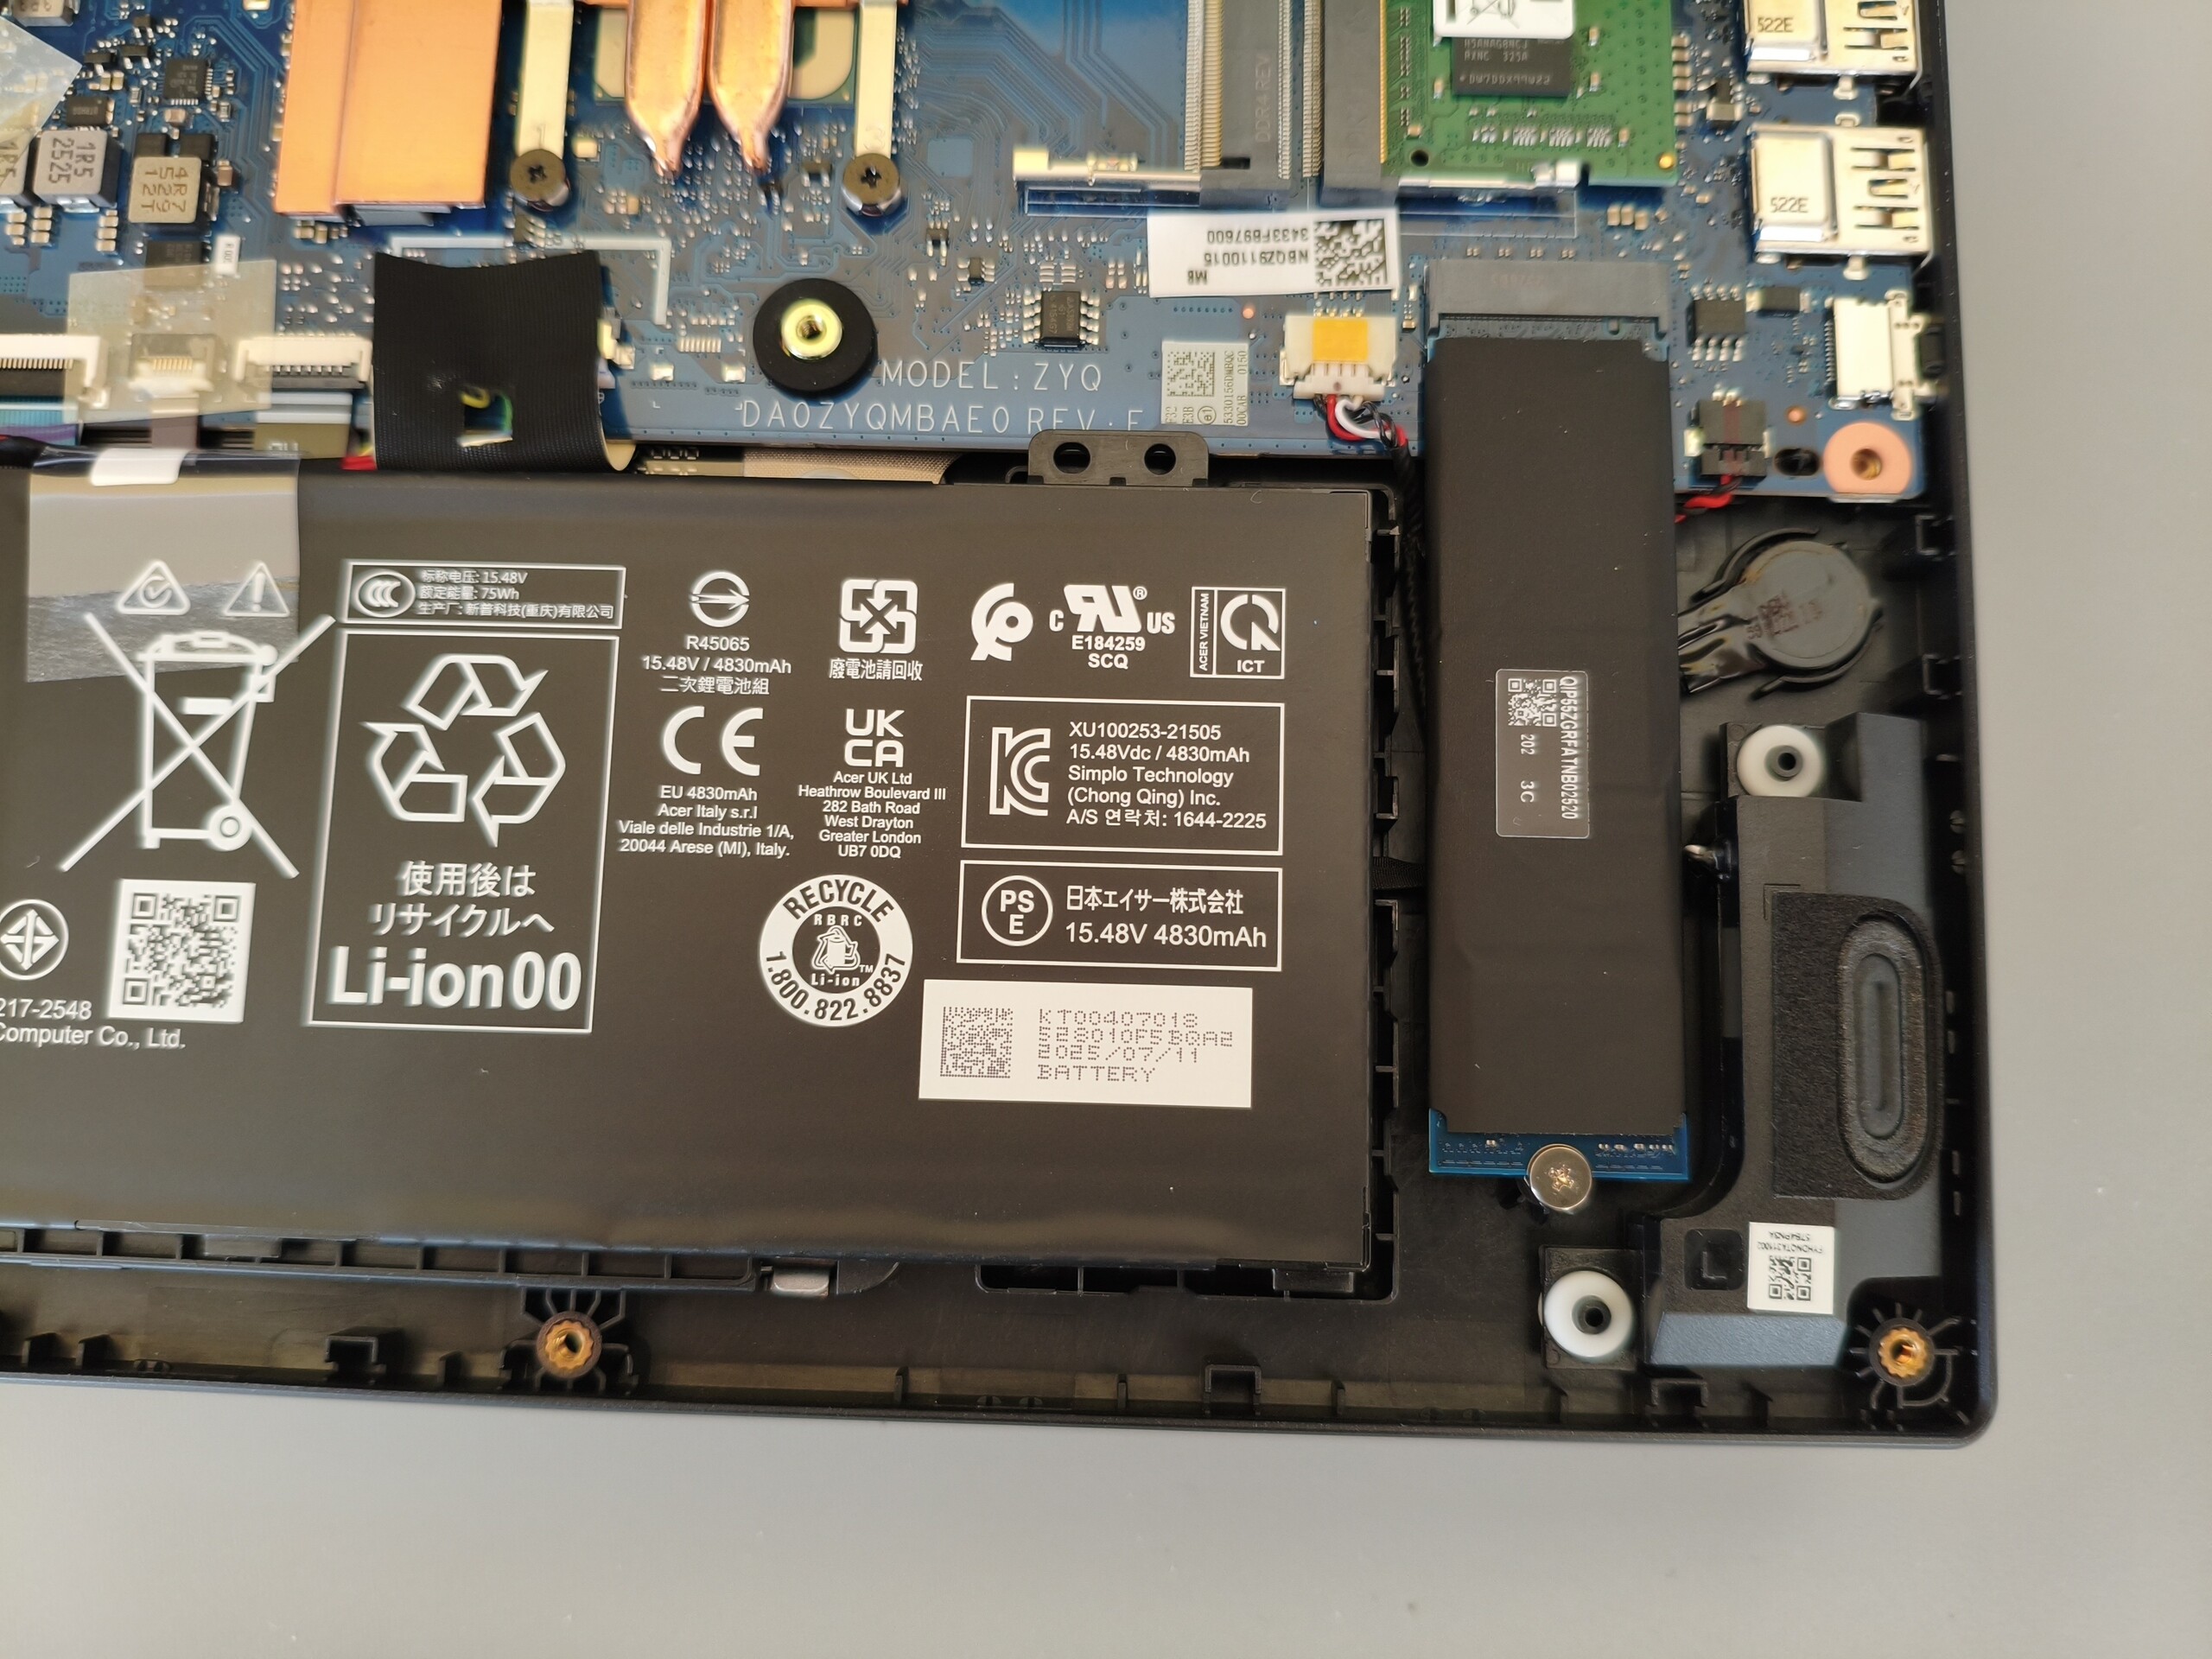
Bien que la capacité de la batterie ait augmenté de manière significative, passant de 57 à 76 Wh, l'autonomie est moins bonne que celle de son prédécesseur. Lors de notre test Wi-Fi avec une luminosité réduite à 150 cd/m², l'appareil n'a tenu qu'environ 5,5 heures, ce qui reste acceptable par rapport à la concurrence.
| Acer Nitro V 15 ANV15-52-50S2 i5-13420H, GeForce RTX 5050 Laptop, 76 Wh | Acer Nitro V 15 ANV15-51-582S i5-13420H, GeForce RTX 4050 Laptop GPU, 57 Wh | HP Victus 15-fa2160ng i5-13420H, GeForce RTX 5050 Laptop, 70 Wh | MSI Cyborg 15 B2RWEKG Core 7 240H, GeForce RTX 5050 Laptop, 55.2 Wh | Lenovo LOQ 15AHP10 R7 250, GeForce RTX 5060 Laptop, 60 Wh | Lenovo Legion 5 15AHP G10 R7 260, GeForce RTX 5060 Laptop, 80 Wh | Moyenne de la classe Gaming | |
|---|---|---|---|---|---|---|---|
| Autonomie de la batterie | 71% | -22% | -2% | -18% | 76% | 24% | |
| WiFi v1.3 (h) | 5.5 | 9.4 71% | 4.3 -22% | 5.4 -2% | 4.5 -18% | 9.7 76% | 6.83 ? 24% |
| Reader / Idle (h) | 21.5 | 6.9 | 9.1 ? | ||||
| Load (h) | 1.7 | 1.3 | 1.2 | 1.512 ? | |||
| H.264 (h) | 11.5 | 8.02 ? | |||||
| Cyberpunk 2077 ultra 150cd (h) | 0.9 |
Notebookcheck note globale
Avec une gamme de couleurs plus étendue, le Nitro V 15 serait un digne rival du Lenovo LOQ 15. En l'état, cependant, il n'atteint que le niveau du HP Victus 15 et du MSI Cyborg 15dont le prix est similaire (environ 1 000 euros), mais dont les résultats globaux sont légèrement supérieurs.
Acer Nitro V 15 ANV15-52-50S2
- 01/29/2026 v8
Florian Glaser
 Total Sustainability Score:
 Les alternatives possibles en un coup d'œil
Image | Modèle | Prix | Poids | Épaisseur | Écran |
|---|---|---|---|---|---|
1. 73.7%  | Acer Nitro V 15 ANV15-52-50S2 Intel Core i5-13420H ⎘ NVIDIA GeForce RTX 5050 Laptop ⎘ 16 Go Mémoire, 1024 Go SSD | Prix de liste: 1049 EUR | 2.1 kg | 23.5 mm | 15.60" 1920x1080 141 PPI IPS |
2. 82.8% v7 (old)  | Acer Nitro V 15 ANV15-51-582S Intel Core i5-13420H ⎘ NVIDIA GeForce RTX 4050 Laptop GPU ⎘ 16 Go Mémoire, 512 Go SSD | Amazon: 1. $88.00 HPDELGB Replacement for Acer... 2. $136.34 Replacement Display, Compati... 3. $909.99 acer Nitro V 15 ANV15-51-93P... Prix de liste: 900 EUR | 2.1 kg | 23.5 mm | 15.60" 1920x1080 141 PPI IPS |
3. 75.8%  | HP Victus 15-fa2160ng Intel Core i5-13420H ⎘ NVIDIA GeForce RTX 5050 Laptop ⎘ 24 Go Mémoire, 512 Go SSD | Amazon: Prix de liste: 1000 EUR | 2.4 kg | 23.5 mm | 15.60" 1920x1080 141 PPI IPS |
4. 75.2%  | MSI Cyborg 15 B2RWEKG Intel Core 7 240H ⎘ NVIDIA GeForce RTX 5050 Laptop ⎘ 16 Go Mémoire, 512 Go SSD | Amazon: Prix de liste: 1099 EUR | 2.2 kg | 23.2 mm | 15.60" 1920x1080 141 PPI IPS |
5. 77.5% 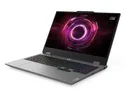 | Lenovo LOQ 15AHP10 AMD Ryzen 7 250 ⎘ NVIDIA GeForce RTX 5060 Laptop ⎘ 16 Go Mémoire, 1024 Go SSD | Amazon: | 2.4 kg | 24 mm | 15.60" 1920x1080 141 PPI IPS |
6. 87.2% 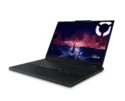 | Lenovo Legion 5 15AHP G10 AMD Ryzen 7 260 ⎘ NVIDIA GeForce RTX 5060 Laptop ⎘ 32 Go Mémoire, 1024 Go SSD | Amazon: Prix de liste: 1449€ | 1.9 kg | 21.5 mm | 15.10" 2560x1600 200 PPI OLED |
Transparency
La sélection des appareils à examiner est effectuée par notre équipe éditoriale. L'échantillon de test a été prêté à l'auteur par le fabricant ou le détaillant pour les besoins de cet examen. Le prêteur n'a pas eu d'influence sur cette évaluation et le fabricant n'a pas reçu de copie de cette évaluation avant sa publication. Il n'y avait aucune obligation de publier cet article. En tant que média indépendant, Notebookcheck n'est pas soumis à l'autorité des fabricants, des détaillants ou des éditeurs.
Voici comment Notebookcheck teste
Chaque année, Notebookcheck examine de manière indépendante des centaines d'ordinateurs portables et de smartphones en utilisant des procédures standardisées afin de garantir que tous les résultats sont comparables. Nous avons continuellement développé nos méthodes de test depuis environ 20 ans et avons établi des normes industrielles dans le processus. Dans nos laboratoires de test, des équipements de mesure de haute qualité sont utilisés par des techniciens et des rédacteurs expérimentés. Ces tests impliquent un processus de validation en plusieurs étapes. Notre système d'évaluation complexe repose sur des centaines de mesures et de points de référence bien fondés, ce qui garantit l'objectivité.