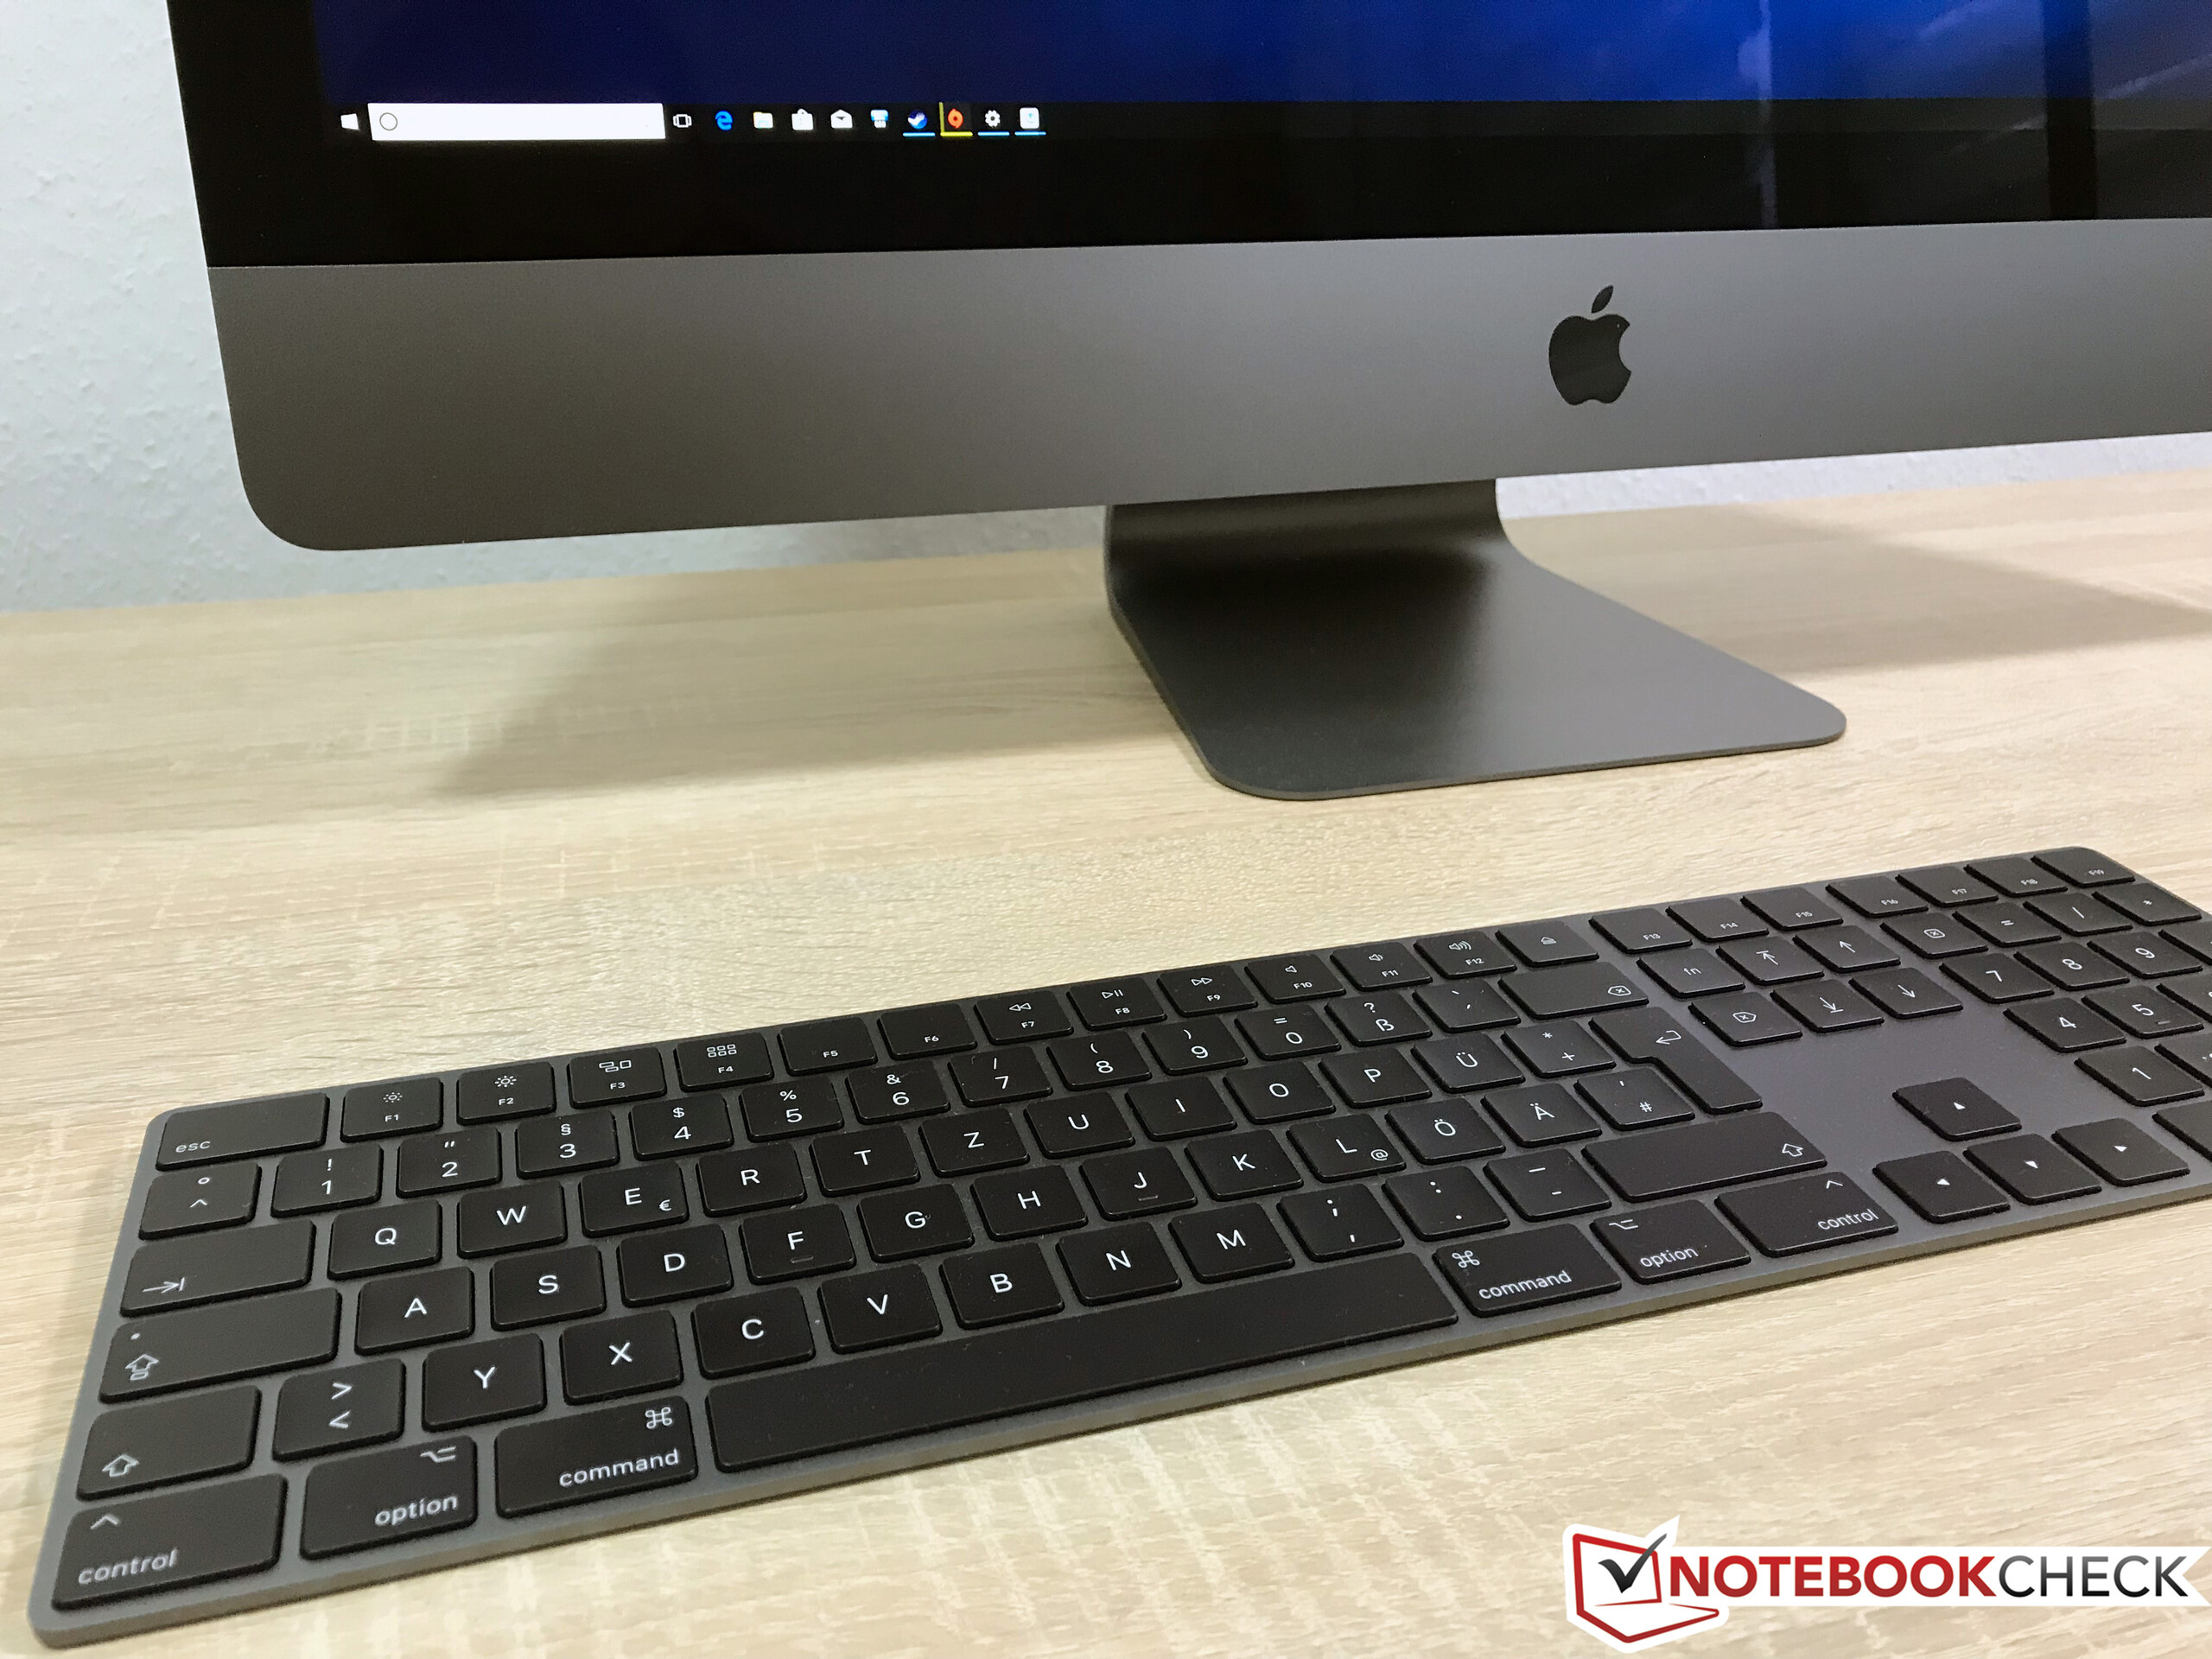
Courte critique de l'Apple iMac Pro (Xeon W-2140B, Radeon Pro Vega 56)
| SD Card Reader | |
| average JPG Copy Test (av. of 3 runs) | |
| Dell Precision 5520 UHD (Toshiba Exceria Pro SDXC 64 GB UHS-II) | |
| Lenovo ThinkPad P71-20HK0004GE | |
| Apple iMac Pro (Toshiba Exceria Pro SDXC 64 GB UHS-II) | |
| maximum AS SSD Seq Read Test (1GB) | |
| Dell Precision 5520 UHD (Toshiba Exceria Pro SDXC 64 GB UHS-II) | |
| Lenovo ThinkPad P71-20HK0004GE | |
| Apple iMac Pro (Toshiba Exceria Pro SDXC 64 GB UHS-II) | |
| |||||||||||||||||||||||||
Homogénéité de la luminosité: 87 %
Contraste: 919:1 (Valeurs des noirs: 0.54 cd/m²)
ΔE ColorChecker Calman: 3 | ∀{0.5-29.43 Ø4.72}
calibrated: 0.9
ΔE Greyscale Calman: 2.5 | ∀{0.09-98 Ø4.97}
100% sRGB (Argyll 1.6.3 3D)
79.4% AdobeRGB 1998 (Argyll 1.6.3 3D)
88.8% AdobeRGB 1998 (Argyll 3D)
100% sRGB (Argyll 3D)
99% Display P3 (Argyll 3D)
Gamma: 2.22
CCT: 6824 K
| Apple iMac Pro APPAE1E, , 5120x2880, 27" | Apple iMac Retina 5K 27 Late 2015 3.2 GHz M390 MK472D/A 5120x2880, 27" | Apple MacBook Pro 15 2017 (2.8 GHz, 555) APPA031, , 2880x1800, 15.4" | Lenovo ThinkPad P71-20HK0004GE LEN4123, VVX17P051J00, , 3840x2160, 17.3" | Dell Precision 5520 UHD SHP1476, , 3840x2160, 15.6" | Dell Precision 7720 SHP1446 (LQ173D1), , 3840x2160, 17.3" | HP ZBook 17 G4-Y3J82AV Sharp SHP144C, , 3840x2160, 17.3" | |
|---|---|---|---|---|---|---|---|
| Display | -0% | -1% | -18% | 0% | 0% | ||
| Display P3 Coverage (%) | 99 | 99.3 0% | 97.9 -1% | 67.4 -32% | 87.6 -12% | 88 -11% | |
| sRGB Coverage (%) | 100 | 100 0% | 99.9 0% | 98.5 -1% | 100 0% | 100 0% | |
| AdobeRGB 1998 Coverage (%) | 88.8 | 88.2 -1% | 85.9 -3% | 68.9 -22% | 99.2 12% | 99.6 12% | |
| Response Times | -6% | -69% | -26% | -108% | -122% | -96% | |
| Response Time Grey 50% / Grey 80% * (ms) | 30.4 ? | 30.4 ? -0% | 48 ? -58% | 39.2 ? -29% | 59.2 ? -95% | 60 ? -97% | 56.8 ? -87% |
| Response Time Black / White * (ms) | 18.8 ? | 20.8 ? -11% | 33.8 ? -80% | 23.2 ? -23% | 41.6 ? -121% | 46.4 ? -147% | 38.4 ? -104% |
| PWM Frequency (Hz) | 208.3 ? | 119000 ? | 1412 ? | 1020 ? | 1020 ? | ||
| Screen | -1% | 23% | 9% | -10% | -5% | 17% | |
| Brightness middle (cd/m²) | 496 | 429 -14% | 545 10% | 358 -28% | 372.4 -25% | 464 -6% | 391 -21% |
| Brightness (cd/m²) | 468 | 424 -9% | 523 12% | 338 -28% | 368 -21% | 441 -6% | 360 -23% |
| Brightness Distribution (%) | 87 | 95 9% | 86 -1% | 83 -5% | 90 3% | 89 2% | 87 0% |
| Black Level * (cd/m²) | 0.54 | 0.58 -7% | 0.44 19% | 0.31 43% | 0.48 11% | 0.45 17% | 0.35 35% |
| Contrast (:1) | 919 | 740 -19% | 1239 35% | 1155 26% | 776 -16% | 1031 12% | 1117 22% |
| Colorchecker dE 2000 * | 3 | 2.8 7% | 1.6 47% | 2.1 30% | 2.6 13% | 3.2 -7% | 1.3 57% |
| Colorchecker dE 2000 max. * | 5.8 | 3.8 34% | 3.6 38% | 5.6 3% | 6.1 -5% | 2.5 57% | |
| Colorchecker dE 2000 calibrated * | 0.9 | ||||||
| Greyscale dE 2000 * | 2.5 | 1.97 21% | 1.9 24% | 2 20% | 3.7 -48% | 4.2 -68% | 1.8 28% |
| Gamma | 2.22 99% | 2.13 103% | 2.26 97% | 2.16 102% | 2.14 103% | 2.01 109% | 2.11 104% |
| CCT | 6824 95% | 6889 94% | 6834 95% | 6216 105% | 7096 92% | 6736 96% | 6461 101% |
| Color Space (Percent of AdobeRGB 1998) (%) | 79.4 | 79 -1% | 77 -3% | 63 -21% | 88.1 11% | 87.9 11% | |
| Color Space (Percent of sRGB) (%) | 100 | 99.97 0% | 99.97 0% | 99 -1% | 100 0% | 100 0% | |
| Moyenne finale (programmes/paramètres) | -2% /
-2% | -16% /
3% | -9% /
3% | -45% /
-25% | -42% /
-20% | -26% /
-2% |
* ... Moindre est la valeur, meilleures sont les performances
Temps de réponse de l'écran
| ↔ Temps de réponse noir à blanc | ||
|---|---|---|
| 18.8 ms ... hausse ↗ et chute ↘ combinées | ↗ 11.2 ms hausse | 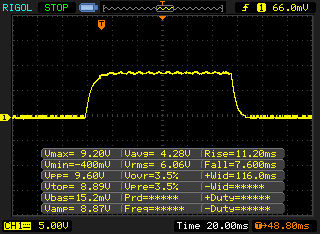 |
| ↘ 7.6 ms chute | ||
| L'écran montre de bons temps de réponse, mais insuffisant pour du jeu compétitif. En comparaison, tous les appareils testés affichent entre 0.1 (minimum) et 240 (maximum) ms. » 42 % des appareils testés affichent de meilleures performances. Cela signifie que les latences relevées sont similaires à la moyenne (19.8 ms) de tous les appareils testés. | ||
| ↔ Temps de réponse gris 50% à gris 80% | ||
| 30.4 ms ... hausse ↗ et chute ↘ combinées | ↗ 14 ms hausse | 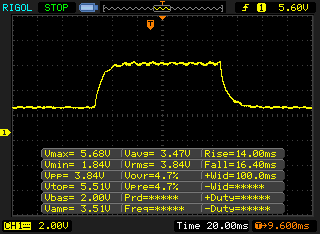 |
| ↘ 16.4 ms chute | ||
| L'écran souffre de latences très élevées, à éviter pour le jeu. En comparaison, tous les appareils testés affichent entre 0.165 (minimum) et 636 (maximum) ms. » 41 % des appareils testés affichent de meilleures performances. Cela signifie que les latences relevées sont similaires à la moyenne (31 ms) de tous les appareils testés. | ||
Scintillement / MLI (Modulation de largeur d'impulsion)
| Scintillement / MLI (Modulation de largeur d'impulsion) décelé | 208.3 Hz | ≤ 50 Niveau de luminosité | 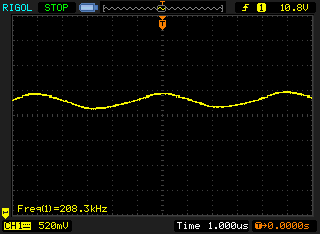 |
Le rétroéclairage de l'écran scintille à la fréquence de 208.3 Hz (certainement du fait de l'utilisation d'une MDI - Modulation de largeur d'impulsion) à un niveau de luminosité inférieur ou égal à 50 % . Aucun scintillement ne devrait être perceptible au-dessus de cette valeur. La fréquence de rafraîchissement de 208.3 Hz est relativement faible, les personnes les plus sensibles devraient percevoir un scintillement et être sujettes à une fatigue oculaire accrue (avec le niveau de luminosité indiqué) En comparaison, 52 % des appareils testés n'emploient pas MDI pour assombrir leur écran. Nous avons relevé une moyenne à 7772 (minimum : 5 - maximum : 343500) Hz dans le cas où une MDI était active. | |||
| PCMark 8 Home Score Accelerated v2 | 4327 points | |
| PCMark 8 Creative Score Accelerated v2 | 7689 points | |
| PCMark 8 Work Score Accelerated v2 | 4614 points | |
| PCMark 10 Score | 6050 points | |
Aide | ||

| SiSoft Sandra 2016 | |
| Image Processing | |
| Apple iMac Pro | |
| Dell Precision 7720 | |
| HP ZBook 17 G4-Y3J82AV | |
| Lenovo ThinkPad P71-20HK0004GE | |
| GP Cryptography (Higher Security AES256+SHA2-512) | |
| Apple iMac Pro | |
| HP ZBook 17 G4-Y3J82AV | |
| Dell Precision 7720 | |
| Lenovo ThinkPad P71-20HK0004GE | |
| GP Financial Analysis (FP High/Double Precision) | |
| Dell Precision 7720 | |
| HP ZBook 17 G4-Y3J82AV | |
| Apple iMac Pro | |
| Lenovo ThinkPad P71-20HK0004GE | |
| 3DMark 06 Standard Score | 35787 points | |
| 3DMark 11 Performance | 20785 points | |
| 3DMark Fire Strike Score | 15302 points | |
| 3DMark Time Spy Score | 5831 points | |
Aide | ||
| Bas | Moyen | Élevé | Ultra | 4K | |
|---|---|---|---|---|---|
| The Witcher 3 (2015) | 115.7 | 63.9 | 41.6 | ||
| Dota 2 Reborn (2015) | 112 | 107.4 | 102.3 | 95.8 | |
| Rainbow Six Siege (2015) | 198.7 | 135.7 | 70.2 | ||
| Rise of the Tomb Raider (2016) | 94 | 74.8 | 39.3 | ||
| For Honor (2017) | 142.6 | 134.9 | 105.6 | 43.6 | |
| Ghost Recon Wildlands (2017) | 81.7 | 76 | 45.1 | 34.7 | |
| Assassin´s Creed Origins (2017) | 70 | 65 | 57 | 33 |
Degré de la nuisance sonore
| Au repos |
| 29.8 / 29.8 / 29.8 dB(A) |
| Fortement sollicité |
| 39.7 / 47.9 dB(A) |
 | ||
30 dB silencieux 40 dB(A) audible 50 dB(A) bruyant |
||
min: | ||
(+) La température maximale du côté supérieur est de 31.2 °C / 88 F, par rapport à la moyenne de 33.9 °C / 93 F, allant de 25 à 47 °C pour la classe Desktop.
(-) Le fond chauffe jusqu'à un maximum de 46.1 °C / 115 F, contre une moyenne de 33.6 °C / 92 F
(+) En utilisation inactive, la température moyenne du côté supérieur est de 24.2 °C / 76 F, par rapport à la moyenne du dispositif de 29.5 °C / 85 F.
Apple iMac Pro analyse audio
(+) | les haut-parleurs peuvent jouer relativement fort (86.1# dB)
Basses 100 - 315 Hz
(+) | bonne basse - seulement 3.5% loin de la médiane
(±) | la linéarité des basses est moyenne (7.6% delta à la fréquence précédente)
Médiums 400 - 2000 Hz
(+) | médiane équilibrée - seulement 1.7% de la médiane
(+) | les médiums sont linéaires (4.1% delta à la fréquence précédente)
Aiguës 2 - 16 kHz
(±) | sommets réduits - en moyenne 8.2% plus bas que la médiane
(+) | les aigus sont linéaires (4.8% delta à la fréquence précédente)
Globalement 100 - 16 000 Hz
(+) | le son global est linéaire (9.2% différence à la médiane)
Par rapport à la même classe
» 33% de tous les appareils testés de cette catégorie étaient meilleurs, 11% similaires, 56% pires
» Le meilleur avait un delta de 6%, la moyenne était de 16%, le pire était de 46%.
Par rapport à tous les appareils testés
» 3% de tous les appareils testés étaient meilleurs, 1% similaires, 96% pires
» Le meilleur avait un delta de 4%, la moyenne était de 24%, le pire était de 134%.
Apple MacBook 12 (Early 2016) 1.1 GHz analyse audio
(+) | les haut-parleurs peuvent jouer relativement fort (83.6# dB)
Basses 100 - 315 Hz
(±) | basse réduite - en moyenne 11.3% inférieure à la médiane
(±) | la linéarité des basses est moyenne (14.2% delta à la fréquence précédente)
Médiums 400 - 2000 Hz
(+) | médiane équilibrée - seulement 2.4% de la médiane
(+) | les médiums sont linéaires (5.5% delta à la fréquence précédente)
Aiguës 2 - 16 kHz
(+) | des sommets équilibrés - à seulement 2% de la médiane
(+) | les aigus sont linéaires (4.5% delta à la fréquence précédente)
Globalement 100 - 16 000 Hz
(+) | le son global est linéaire (10.2% différence à la médiane)
Par rapport à la même classe
» 7% de tous les appareils testés de cette catégorie étaient meilleurs, 2% similaires, 91% pires
» Le meilleur avait un delta de 5%, la moyenne était de 18%, le pire était de 53%.
Par rapport à tous les appareils testés
» 5% de tous les appareils testés étaient meilleurs, 1% similaires, 94% pires
» Le meilleur avait un delta de 4%, la moyenne était de 24%, le pire était de 134%.
| Éteint/en veille | |
| Au repos | |
| Fortement sollicité |
|
Légende:
min: | |
Points positifs
Points négatifs
A-t-on vraiment besoin d’un iMac Pro, ou peut-on se contenter d’un iMac classique ? Si vous vous posez cette question, c’est que vous n’avez sans doute pas besoin de la version Pro, parce que les composants professionnels sont pour des utilisateurs bien précis. Les cœurs supplémentaires des processeurs Xeon doivent pouvoir être utilisés, sinon les processeurs ne sont pas plus rapides. Il en va de même pour les cartes graphiques. S’il en est ainsi, vous pouvez juste acquérir l’iMac 5K classique, qui est bien plus abordable et propose le même écran.
Mais de toutes façons l’iMac Pro n’est pas vraiment une station de travail convaincante. Oui, il possède de très bonnes performances, mais le système de refroidissement avait déjà du mal avec les composants d’entrée de gamme, en cas de sollicitations maximales. L’écran pourrait être par défaut mieux calibré, et il faudra un écran externe pour le travail graphique dans un environnement AdobeRGB. Parmi les défauts pour un système professionnel, on compte aussi une évolutivité limitée et difficile et des services limités. Si vous voulez un système qui fonctionne, vous devrez acheter des services additionnels comme la réparation sur site. D’autres fabricants comme Dell, HP et Lenovo font nettement mieux à cet égard.
Le prix de l’appareil d’entrée de gamme est élevé, mais pas totalement délirant au vu des composants (le processeur Intel Xeon seul coûte à lui seul plus de 1 100 $). Mais nous ne pouvons comprendre les énormes hausses de prix pour la RAM et le stockage additionnels. L’iMac Pro possède un attrait certain et s’avère performant, mais il n’est pas le bon choix pour les professionnels.
L’intégralité de cette critique est disponible en anglais en suivant ce lien.
Apple iMac Pro
- 06/27/2018 v6 (old)
Andreas Osthoff
Price comparison
