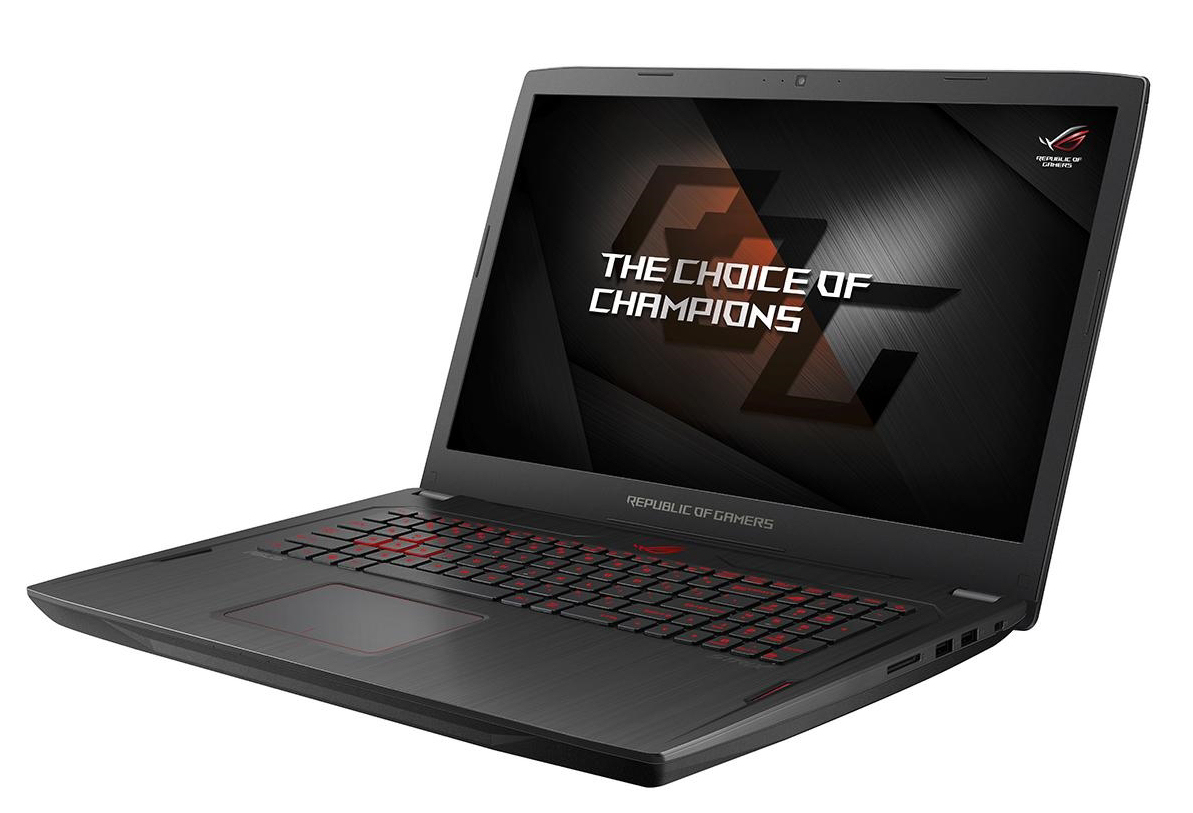
Courte critique du PC portable Asus ROG Strix GL702ZC (Ryzen 5 1600, Radeon RX 580, FHD)
| SD Card Reader | |
| average JPG Copy Test (av. of 3 runs) | |
| Acer Predator Helios 300 (Toshiba Exceria Pro SDXC 64 GB UHS-II) | |
| Nexoc G739 (Toshiba Exceria Pro SDXC 64 GB UHS-II) | |
| HP Omen 17-w206ng (Toshiba Exceria Pro SDXC 64 GB UHS-II) | |
| Asus GL702ZC-GC104T (Toshiba Exceria Pro SDXC 64 GB UHS-II) | |
| Asus ROG Strix GL702ZC-GC204T (Toshiba Exceria Pro SDXC 64 GB UHS-II) | |
| MSI GF72VR 7RF (Toshiba Exceria Pro SDXC 64 GB UHS-II) | |
| MSI GL72 7RDX-602 (Toshiba Exceria Pro SDXC 64 GB UHS-II) | |
| maximum AS SSD Seq Read Test (1GB) | |
| Asus ROG Strix GL702ZC-GC204T (Toshiba Exceria Pro SDXC 64 GB UHS-II) | |
| Asus GL702ZC-GC104T (Toshiba Exceria Pro SDXC 64 GB UHS-II) | |
| Nexoc G739 (Toshiba Exceria Pro SDXC 64 GB UHS-II) | |
| HP Omen 17-w206ng (Toshiba Exceria Pro SDXC 64 GB UHS-II) | |
| Acer Predator Helios 300 (Toshiba Exceria Pro SDXC 64 GB UHS-II) | |
| MSI GF72VR 7RF (Toshiba Exceria Pro SDXC 64 GB UHS-II) | |
| MSI GL72 7RDX-602 (Toshiba Exceria Pro SDXC 64 GB UHS-II) | |
| |||||||||||||||||||||||||
Homogénéité de la luminosité: 82 %
Valeur mesurée au centre, sur batterie: 415 cd/m²
Contraste: 988:1 (Valeurs des noirs: 0.42 cd/m²)
ΔE ColorChecker Calman: 4.95 | ∀{0.5-29.43 Ø4.73}
ΔE Greyscale Calman: 4.69 | ∀{0.09-98 Ø4.97}
82% sRGB (Argyll 1.6.3 3D)
54% AdobeRGB 1998 (Argyll 1.6.3 3D)
60.4% AdobeRGB 1998 (Argyll 3D)
82.6% sRGB (Argyll 3D)
65.4% Display P3 (Argyll 3D)
Gamma: 2.33
CCT: 6485 K
| Asus ROG Strix GL702ZC-GC204T IPS, 1920x1080, 17.3" | Asus GL702ZC-GC104T IPS, 1920x1080, 17.3" | MSI GF72VR 7RF TN LED, 1920x1080, 17.3" | Acer Predator Helios 300 AH-IPS, WLED, 1920x1080, 17.3" | MSI GL72 7RDX-602 TN LED, 1920x1080, 17.3" | Nexoc G739 IPS, 1920x1080, 17.3" | HP Omen 17-w206ng IPS, 1920x1080, 17.3" | |
|---|---|---|---|---|---|---|---|
| Display | 3% | 34% | 3% | 8% | 7% | 9% | |
| Display P3 Coverage (%) | 65.4 | 67.1 3% | 90.8 39% | 66.8 2% | 65.2 0% | 66.7 2% | 67.2 3% |
| sRGB Coverage (%) | 82.6 | 85.4 3% | 99.8 21% | 85.8 4% | 94.3 14% | 91 10% | 93.1 13% |
| AdobeRGB 1998 Coverage (%) | 60.4 | 62.5 3% | 85.6 42% | 62.8 4% | 65.6 9% | 66.4 10% | 67.4 12% |
| Response Times | -4% | 39% | 7% | 3% | -24% | -10% | |
| Response Time Grey 50% / Grey 80% * (ms) | 36 ? | 39.2 ? -9% | 24.4 ? 32% | 36 ? -0% | 29 ? 19% | 45 ? -25% | 38 ? -6% |
| Response Time Black / White * (ms) | 23 ? | 22.8 ? 1% | 12.6 ? 45% | 20 ? 13% | 26 ? -13% | 28 ? -22% | 26 ? -13% |
| PWM Frequency (Hz) | 122000 ? | 25000 ? | 119000 ? | 961 | 450 ? | 200 ? | |
| Screen | 9% | -13% | 4% | -42% | 11% | 5% | |
| Brightness middle (cd/m²) | 415 | 379 -9% | 329.2 -21% | 384 -7% | 299 -28% | 312 -25% | 318 -23% |
| Brightness (cd/m²) | 365 | 354 -3% | 318 -13% | 373 2% | 274 -25% | 304 -17% | 295 -19% |
| Brightness Distribution (%) | 82 | 89 9% | 92 12% | 93 13% | 80 -2% | 85 4% | 79 -4% |
| Black Level * (cd/m²) | 0.42 | 0.31 26% | 0.4 5% | 0.35 17% | 0.25 40% | 0.23 45% | 0.25 40% |
| Contrast (:1) | 988 | 1223 24% | 823 -17% | 1097 11% | 1196 21% | 1357 37% | 1272 29% |
| Colorchecker dE 2000 * | 4.95 | 4.32 13% | 6.4 -29% | 4.81 3% | 12.92 -161% | 4.19 15% | 4.7 5% |
| Colorchecker dE 2000 max. * | 9.34 | 8.56 8% | 11.7 -25% | 8.69 7% | 19.91 -113% | 8.7 7% | 8.8 6% |
| Greyscale dE 2000 * | 4.69 | 4 15% | 9.2 -96% | 5.33 -14% | 13.16 -181% | 3.72 21% | 5 -7% |
| Gamma | 2.33 94% | 2.47 89% | 2.18 101% | 2.45 90% | 2.36 93% | 2.29 96% | 2.28 96% |
| CCT | 6485 100% | 6984 93% | 10484 62% | 7137 91% | 15046 43% | 7104 91% | 7374 88% |
| Color Space (Percent of AdobeRGB 1998) (%) | 54 | 56 4% | 76 41% | 56 4% | 60 11% | 59 9% | 61 13% |
| Color Space (Percent of sRGB) (%) | 82 | 85 4% | 92 12% | 86 5% | 94 15% | 91 11% | 93 13% |
| Moyenne finale (programmes/paramètres) | 3% /
6% | 20% /
3% | 5% /
4% | -10% /
-26% | -2% /
5% | 1% /
4% |
* ... Moindre est la valeur, meilleures sont les performances
Scintillement / MLI (Modulation de largeur d'impulsion)
| Scintillement / MLI (Modulation de largeur d'impulsion) non décelé | ||
En comparaison, 52 % des appareils testés n'emploient pas MDI pour assombrir leur écran. Nous avons relevé une moyenne à 7791 (minimum : 5 - maximum : 343500) Hz dans le cas où une MDI était active. | ||
Temps de réponse de l'écran
| ↔ Temps de réponse noir à blanc | ||
|---|---|---|
| 23 ms ... hausse ↗ et chute ↘ combinées | ↗ 14 ms hausse | 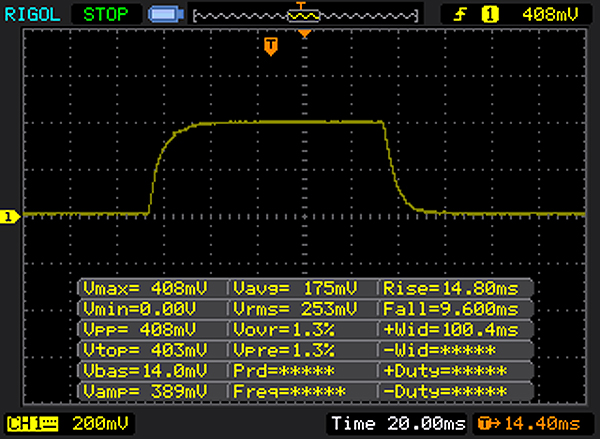 |
| ↘ 9 ms chute | ||
| L'écran montre de bons temps de réponse, mais insuffisant pour du jeu compétitif. En comparaison, tous les appareils testés affichent entre 0.1 (minimum) et 240 (maximum) ms. » 52 % des appareils testés affichent de meilleures performances. Cela signifie que les latences relevées sont moins bonnes que la moyenne (19.9 ms) de tous les appareils testés. | ||
| ↔ Temps de réponse gris 50% à gris 80% | ||
| 36 ms ... hausse ↗ et chute ↘ combinées | ↗ 18 ms hausse | 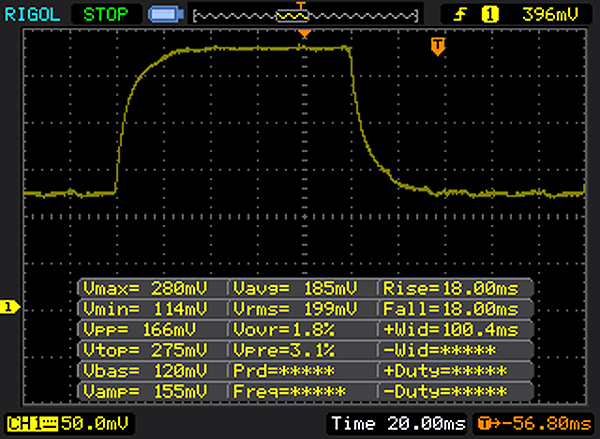 |
| ↘ 18 ms chute | ||
| L'écran souffre de latences très élevées, à éviter pour le jeu. En comparaison, tous les appareils testés affichent entre 0.165 (minimum) et 636 (maximum) ms. » 50 % des appareils testés affichent de meilleures performances. Cela signifie que les latences relevées sont moins bonnes que la moyenne (31.1 ms) de tous les appareils testés. | ||
| Cinebench R15 | |
| CPU Single 64Bit | |
| Schenker XMG U507 2017 | |
| Eurocom Sky X9C | |
| Smart7 Karme GX17E G2 | |
| Guru Mars K | |
| Courte critique des processeurs Coffee Lake i7-8700K et i5-8400 | |
| Nexoc G739 | |
| Gigabyte Aero 15X | |
| Acer Predator Helios 300 | |
| HP Omen 17-w206ng | |
| MSI GL72 7RDX-602 | |
| Acer Aspire VX15 VX5-591G-589S | |
| MSI GF72VR 7RF | |
| Asus GL702ZC-GC104T | |
| Acer Aspire Nitro BE VN7-793G-5811 | |
| Asus ROG Strix GL702ZC-GC204T | |
| CPU Multi 64Bit | |
| Asus GL702ZC-GC104T | |
| Eurocom Sky X9C | |
| Asus ROG Strix GL702ZC-GC204T | |
| Smart7 Karme GX17E G2 | |
| Courte critique des processeurs Coffee Lake i7-8700K et i5-8400 | |
| Schenker XMG U507 2017 | |
| Guru Mars K | |
| Nexoc G739 | |
| Gigabyte Aero 15X | |
| Acer Predator Helios 300 | |
| MSI GL72 7RDX-602 | |
| HP Omen 17-w206ng | |
| MSI GF72VR 7RF | |
| Acer Aspire Nitro BE VN7-793G-5811 | |
| Acer Aspire VX15 VX5-591G-589S | |
| Cinebench R10 | |
| Rendering Multiple CPUs 32Bit | |
| Eurocom Sky X9C | |
| Courte critique des processeurs Coffee Lake i7-8700K et i5-8400 | |
| Asus GL702ZC-GC104T | |
| MSI GF72VR 7RF | |
| Asus ROG Strix GL702ZC-GC204T | |
| Gigabyte Aero 15X | |
| Acer Predator Helios 300 | |
| Acer Aspire VX15 VX5-591G-589S | |
| Acer Aspire Nitro BE VN7-793G-5811 | |
| Rendering Single 32Bit | |
| Eurocom Sky X9C | |
| MSI GF72VR 7RF | |
| Courte critique des processeurs Coffee Lake i7-8700K et i5-8400 | |
| Gigabyte Aero 15X | |
| Acer Predator Helios 300 | |
| Acer Aspire Nitro BE VN7-793G-5811 | |
| Acer Aspire VX15 VX5-591G-589S | |
| Asus ROG Strix GL702ZC-GC204T | |
| Asus GL702ZC-GC104T | |
| Geekbench 3 | |
| 32 Bit Multi-Core Score | |
| Asus GL702ZC-GC104T | |
| Asus ROG Strix GL702ZC-GC204T | |
| Gigabyte Aero 15X | |
| Acer Aspire VX15 VX5-591G-589S | |
| Acer Aspire Nitro BE VN7-793G-5811 | |
| 32 Bit Single-Core Score | |
| Gigabyte Aero 15X | |
| Asus GL702ZC-GC104T | |
| Acer Aspire VX15 VX5-591G-589S | |
| Acer Aspire Nitro BE VN7-793G-5811 | |
| Asus ROG Strix GL702ZC-GC204T | |
| Geekbench 4.0 | |
| 64 Bit Multi-Core Score | |
| Courte critique des processeurs Coffee Lake i7-8700K et i5-8400 | |
| Asus ROG Strix GL702ZC-GC204T | |
| Gigabyte Aero 15X | |
| Acer Aspire Nitro BE VN7-793G-5811 | |
| Acer Aspire VX15 VX5-591G-589S | |
| 64 Bit Single-Core Score | |
| Courte critique des processeurs Coffee Lake i7-8700K et i5-8400 | |
| Gigabyte Aero 15X | |
| Acer Aspire Nitro BE VN7-793G-5811 | |
| Asus ROG Strix GL702ZC-GC204T | |
| Acer Aspire VX15 VX5-591G-589S | |
| Geekbench 4.4 | |
| 64 Bit Multi-Core Score | |
| Courte critique des processeurs Coffee Lake i7-8700K et i5-8400 | |
| Asus GL702ZC-GC104T | |
| Asus ROG Strix GL702ZC-GC204T | |
| Gigabyte Aero 15X | |
| Acer Aspire Nitro BE VN7-793G-5811 | |
| Acer Aspire VX15 VX5-591G-589S | |
| 64 Bit Single-Core Score | |
| Courte critique des processeurs Coffee Lake i7-8700K et i5-8400 | |
| Gigabyte Aero 15X | |
| Acer Aspire Nitro BE VN7-793G-5811 | |
| Asus GL702ZC-GC104T | |
| Asus ROG Strix GL702ZC-GC204T | |
| Acer Aspire VX15 VX5-591G-589S | |
| Mozilla Kraken 1.1 - Total | |
| Asus GL702ZC-GC104T (Edge 15) | |
| MSI GF72VR 7RF (Microsoft Edge 40.15063.674.0) | |
| Asus ROG Strix GL702ZC-GC204T (Edge 41) | |
| Acer Predator Helios 300 (Edge 40.15063.0.0) | |
| MSI GL72 7RDX-602 (EDGE 38.14393.1066.0) | |
| Gigabyte Aero 15X (Edge 41) | |
| Nexoc G739 (Edge 38.14393.0.0) | |
| Eurocom Sky X9C (Edge 41.16299.15.0) | |
| Octane V2 - Total Score | |
| Eurocom Sky X9C (Edge 41.16299.15.0) | |
| Nexoc G739 (Edge 38.14393.0.0) | |
| MSI GL72 7RDX-602 (EDGE 38.14393.1066.0) | |
| Gigabyte Aero 15X (Edge 41) | |
| Acer Predator Helios 300 (Edge 40.15063.0.0) | |
| Asus GL702ZC-GC104T (Edge 15) | |
| Asus ROG Strix GL702ZC-GC204T (Edge 41) | |
| JetStream 1.1 - 1.1 Total | |
| Eurocom Sky X9C (Edge 41.16299.15.0) | |
| Gigabyte Aero 15X (Edge 41) | |
| Nexoc G739 (Edge 38.14393.0.0) | |
| MSI GF72VR 7RF (Microsoft Edge 40.15063.674.0) | |
| MSI GL72 7RDX-602 (EDGE 38.14393.1066.0) | |
| HP Omen 17-w206ng | |
| Acer Predator Helios 300 (Edge 40.15063.0.0) | |
| Acer Aspire Nitro BE VN7-793G-5811 (Edge 40) | |
| Acer Aspire VX15 VX5-591G-589S (Edge 38) | |
| Asus GL702ZC-GC104T (Edge 15) | |
| Asus ROG Strix GL702ZC-GC204T (Edge 41) | |
* ... Moindre est la valeur, meilleures sont les performances
| PCMark 7 Score | 5444 points | |
| PCMark 8 Home Score Accelerated v2 | 4186 points | |
| PCMark 8 Creative Score Accelerated v2 | 5608 points | |
| PCMark 8 Work Score Accelerated v2 | 4988 points | |
| PCMark 10 Score | 4440 points | |
Aide | ||
| PCMark 8 - Home Score Accelerated v2 | |
| Acer Predator Helios 300 | |
| Nexoc G739 | |
| HP Omen 17-w206ng | |
| Asus ROG Strix GL702ZC-GC204T | |
| Asus GL702ZC-GC104T | |
| MSI GF72VR 7RF | |
| MSI GL72 7RDX-602 | |

| Asus ROG Strix GL702ZC-GC204T Seagate Mobile HDD 1TB ST1000LX015-1U7172 | Acer Predator Helios 300 Intel SSD 600p SSDPEKKW512G7 | MSI GL72 7RDX-602 HGST Travelstar 7K1000 HTS721010A9E630 | Nexoc G739 Samsung PM961 MZVLW256HEHP | HP Omen 17-w206ng Samsung PM961 MZVLW256HEHP | |
|---|---|---|---|---|---|
| CrystalDiskMark 3.0 | 37802% | 119% | 50561% | 47936% | |
| Read Seq (MB/s) | 92.5 | 899 872% | 135.3 46% | 1666 1701% | 1606 1636% |
| Write Seq (MB/s) | 105.1 | 569 441% | 127 21% | 1192 1034% | 1176 1019% |
| Read 512 (MB/s) | 37.67 | 580 1440% | 45.57 21% | 857 2175% | 846 2146% |
| Write 512 (MB/s) | 101.8 | 425.9 318% | 58.3 -43% | 827 712% | 805 691% |
| Read 4k (MB/s) | 0.484 | 34.29 6985% | 0.582 20% | 60.7 12441% | 59.9 12276% |
| Write 4k (MB/s) | 0.169 | 125.5 74160% | 1.022 505% | 154.5 91320% | 155.6 91971% |
| Read 4k QD32 (MB/s) | 1.294 | 457.7 35271% | 1.068 -17% | 636 49050% | 588 45340% |
| Write 4k QD32 (MB/s) | 0.221 | 404.5 182932% | 1.102 399% | 544 246054% | 505 228407% |
| 3DMark 06 Standard Score | 28909 points | |
| 3DMark 11 Performance | 12626 points | |
| 3DMark Cloud Gate Standard Score | 28295 points | |
| 3DMark Fire Strike Score | 9866 points | |
| 3DMark Time Spy Score | 3718 points | |
Aide | ||
| 3DMark 11 - 1280x720 Performance GPU | |
| Eurocom Sky X9C | |
| Guru Mars K | |
| Smart7 Karme GX17E G2 | |
| MSI GS63VR 7RG-005 | |
| Acer Predator Helios 300 | |
| Asus GL702ZC-GC104T | |
| Asus ROG Strix GL702ZC-GC204T | |
| MSI GF72VR 7RF | |
| HP Omen 15t-ce000 | |
| Acer Aspire Nitro BE VN7-793G-5811 | |
| HP Omen 17-w206ng | |
| MSI GL72 7RDX-602 | |
| Bas | Moyen | Élevé | Ultra | |
|---|---|---|---|---|
| X-Plane 10.25 (2013) | 72 | 42.2 | 21.8 | 20.6 |
| Dragon Age: Inquisition (2014) | 163.5 | 102.6 | 81.3 | 54.1 |
| GTA V (2015) | 120.4 | 115.5 | 83.4 | 39.6 |
| The Witcher 3 (2015) | 173 | 121 | 68.9 | 36 |
| Dota 2 Reborn (2015) | 86 | 77 | 76.3 | 69 |
| World of Warships (2015) | 135.1 | 115 | 101 | 95.9 |
| Anno 2205 (2015) | 98.6 | 95.4 | 65.5 | 25.7 |
| XCOM 2 (2016) | 82 | 66 | 51.1 | 24.5 |
| Hitman 2016 (2016) | 56.2 | 54.4 | 49.8 | 47.7 |
| Ashes of the Singularity (2016) | 35.3 | 30 | 29.2 | |
| Overwatch (2016) | 276.3 | 276 | 191.1 | 96.2 |
| Mafia 3 (2016) | 55.9 | 45.9 | 35 | |
| Civilization 6 (2016) | 105.6 | 84.8 | 69.8 | 63.5 |
| Mass Effect Andromeda (2017) | 38.2 | 33.6 | 27.1 | 25.1 |
| Warhammer 40.000: Dawn of War III (2017) | 106.7 | 72.3 | 69.4 | 53.4 |
| Team Fortress 2 (2017) | 108 | 105 | 102 | 101 |
| FIFA 18 (2017) | 242.9 | 242.2 | 218.1 | 215.4 |
| Middle-earth: Shadow of War (2017) | 117 | 85 | 66 | 49 |
| The Evil Within 2 (2017) | 56.4 | 47.1 | 45.4 | 44.3 |
| ELEX (2017) | 117.1 | 80 | 63.5 | 48.6 |
| Destiny 2 (2017) | 97.6 | 91.4 | 83.3 | 69.7 |
| Assassin´s Creed Origins (2017) | 50 | 44 | 43 | 37 |
| Call of Duty WWII (2017) | 132.3 | 128.8 | 68 | 39.1 |
| Need for Speed Payback (2017) | 92.8 | 86 | 78.5 | 75.6 |
| Star Wars Battlefront 2 (2017) | 62 | 53.9 | 45.6 | 45.7 |
| Fortnite (2018) | 238.5 | 183.1 | 80.6 | 59.5 |
| Middle-earth: Shadow of War - 1920x1080 Ultra Preset AA:T | |
| Eurocom Sky X9C | |
| Gigabyte Aero 15X | |
| MSI GS63VR 7RG-005 | |
| PC Zentrum Defiance IV | |
| Asus ROG Strix GL702ZC-GC204T | |
| HP Omen 15t-ce000 | |
| The Witcher 3 - 1920x1080 High Graphics & Postprocessing (Nvidia HairWorks Off) | |
| Eurocom Sky X9C | |
| Guru Mars K | |
| Gigabyte Aero 15X | |
| MSI GS63VR 7RG-005 | |
| Saelic Vidi G771D | |
| Acer Aspire V17 Nitro BE VN7-793G-706L | |
| PC Zentrum Defiance IV | |
| Acer Predator Helios 300 | |
| Asus ROG Strix GL702ZC-GC204T | |
| HP Omen 15t-ce000 | |
| MSI GF62VR 7RF-877 | |
| Asus GL702ZC-GC104T | |
| Schenker XMG P507 | |
| Nexoc G739 | |
| HP Omen 17-w206ng | |
| Acer Nitro 5 AN515-51-788E | |
| Acer Aspire Nitro BE VN7-793G-5811 | |
| MSI GL72 7RDX-602 | |
| World of Warships - 1920x1080 Very High Preset AA:High FX AF:16x | |
| Asus ROG Strix GL702ZC-GC204T | |
| Acer Aspire V17 Nitro BE VN7-793G-706L | |
| Need for Speed Payback - 1920x1080 Ultra Preset | |
| MSI GS63VR 7RG-005 | |
| Asus ROG Strix GL702ZC-GC204T | |
| PC Zentrum Defiance IV | |
| Call of Duty WWII - 1920x1080 High / On AA:Filmic 1X SM | |
| MSI GS63VR 7RG-005 | |
| PC Zentrum Defiance IV | |
| Asus ROG Strix GL702ZC-GC204T | |
| Civilization 6 - 1920x1080 Ultra Preset AA:4xMS | |
| Asus ROG Strix GL702ZC-GC204T | |
| MSI GS73VR 7RF | |
| HP Omen 17-w100ng | |
| GTA V - 1920x1080 Highest AA:4xMSAA + FX AF:16x | |
| Asus GL702VM-GC102D | |
| Asus ROG Strix GL702ZC-GC204T | |
| Hitman 2016 - 1920x1080 Ultra / On AA:SM AF:16x | |
| MSI GS73VR 7RF | |
| Asus Strix GL502VM-FY039T | |
| MSI GF62VR 7RF-877 | |
| Schenker XMG P507 | |
| Asus ROG Strix GL702ZC-GC204T | |
| MSI GF72VR 7RF | |
| Mafia 3 - 1366x768 Medium Preset | |
| Eurocom Sky X9C | |
| Saelic Vidi G771D | |
| MSI GF62VR 7RF-877 | |
| Asus GL702VM-GC102D | |
| Asus ROG Strix GL702ZC-GC204T | |
| Star Wars Battlefront 2 - 1920x1080 Ultra Preset | |
| PC Zentrum Defiance IV | |
| Asus ROG Strix GL702ZC-GC204T | |
| Overwatch - 1920x1080 Epic (Render Scale 100 %) AA:SM AF:16x | |
| Eurocom Sky X9C | |
| Schenker XMG P507 | |
| Asus ROG Strix GL702ZC-GC204T | |
| Destiny 2 - 1920x1080 Highest Preset AA:SM AF:16x | |
| Eurocom Sky X9C | |
| PC Zentrum Defiance IV | |
| Asus ROG Strix GL702ZC-GC204T | |
Degré de la nuisance sonore
| Au repos |
| 30.6 / 32.7 / 32.7 dB(A) |
| Disque dur |
| 31.2 dB(A) |
| Fortement sollicité |
| 38.9 / 50.6 dB(A) |
 | ||
30 dB silencieux 40 dB(A) audible 50 dB(A) bruyant |
||
min: | ||
(-) La température maximale du côté supérieur est de 54.3 °C / 130 F, par rapport à la moyenne de 40.4 °C / 105 F, allant de 21.2 à 68.8 °C pour la classe Gaming.
(-) Le fond chauffe jusqu'à un maximum de 51 °C / 124 F, contre une moyenne de 43.2 °C / 110 F
(+) En utilisation inactive, la température moyenne du côté supérieur est de 4 °C / 39 F, par rapport à la moyenne du dispositif de 33.9 °C / 93 F.
(+) En jouant à The Witcher 3, la température moyenne du côté supérieur est de 6.2 °C / 43 F, alors que la moyenne de l'appareil est de 33.9 °C / 93 F.
(+) Les repose-poignets et le pavé tactile atteignent la température maximale de la peau (34 °C / 93.2 F) et ne sont donc pas chauds.
(-) La température moyenne de la zone de l'appui-paume de dispositifs similaires était de 28.8 °C / 83.8 F (-5.2 °C / #-9.4 F).
Asus ROG Strix GL702ZC-GC204T analyse audio
(-) | haut-parleurs pas très forts (70.2 dB)
Basses 100 - 315 Hz
(+) | bonne basse - seulement 3.9% loin de la médiane
(±) | la linéarité des basses est moyenne (7.5% delta à la fréquence précédente)
Médiums 400 - 2000 Hz
(+) | médiane équilibrée - seulement 4.4% de la médiane
(+) | les médiums sont linéaires (4.6% delta à la fréquence précédente)
Aiguës 2 - 16 kHz
(+) | des sommets équilibrés - à seulement 3.2% de la médiane
(±) | la linéarité des aigus est moyenne (7.7% delta à la fréquence précédente)
Globalement 100 - 16 000 Hz
(+) | le son global est linéaire (13.5% différence à la médiane)
Par rapport à la même classe
» 19% de tous les appareils testés de cette catégorie étaient meilleurs, 7% similaires, 73% pires
» Le meilleur avait un delta de 6%, la moyenne était de 18%, le pire était de 132%.
Par rapport à tous les appareils testés
» 14% de tous les appareils testés étaient meilleurs, 4% similaires, 82% pires
» Le meilleur avait un delta de 4%, la moyenne était de 24%, le pire était de 134%.
Apple MacBook 12 (Early 2016) 1.1 GHz analyse audio
(+) | les haut-parleurs peuvent jouer relativement fort (83.6# dB)
Basses 100 - 315 Hz
(±) | basse réduite - en moyenne 11.3% inférieure à la médiane
(±) | la linéarité des basses est moyenne (14.2% delta à la fréquence précédente)
Médiums 400 - 2000 Hz
(+) | médiane équilibrée - seulement 2.4% de la médiane
(+) | les médiums sont linéaires (5.5% delta à la fréquence précédente)
Aiguës 2 - 16 kHz
(+) | des sommets équilibrés - à seulement 2% de la médiane
(+) | les aigus sont linéaires (4.5% delta à la fréquence précédente)
Globalement 100 - 16 000 Hz
(+) | le son global est linéaire (10.2% différence à la médiane)
Par rapport à la même classe
» 7% de tous les appareils testés de cette catégorie étaient meilleurs, 2% similaires, 91% pires
» Le meilleur avait un delta de 5%, la moyenne était de 18%, le pire était de 53%.
Par rapport à tous les appareils testés
» 5% de tous les appareils testés étaient meilleurs, 1% similaires, 94% pires
» Le meilleur avait un delta de 4%, la moyenne était de 24%, le pire était de 134%.
| Éteint/en veille | |
| Au repos | |
| Fortement sollicité |
|
Légende:
min: | |
| Battery Runtime - WiFi Websurfing | |
| HP Omen 17-w206ng | |
| Nexoc G739 | |
| Acer Predator Helios 300 | |
| MSI GL72 7RDX-602 | |
| MSI GF72VR 7RF | |
| Asus GL702ZC-GC104T | |
| Asus ROG Strix GL702ZC-GC204T | |
Points positifs
Points négatifs
Le portable de jeu d’Asus fait tourner fluidement la plupart des jeux en Full HD, et avec des réglages graphiques élevés. Seuls quelques rares titres nécessitent de baisser la résolution et / ou les paramètres graphiques. La technologie FreeSync d’AMD permet une expérience fluide de jeu sur un écran 60 Hz. L’écran mat IPS séduit avec un contraste élevé, une bonne luminosité, et des angles de vision stables.
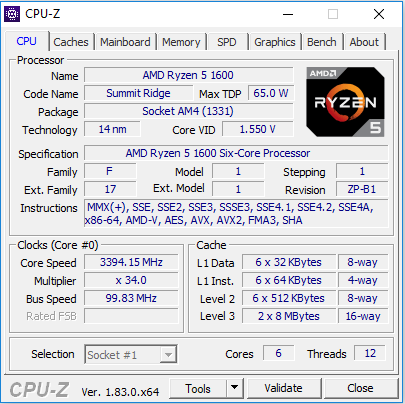
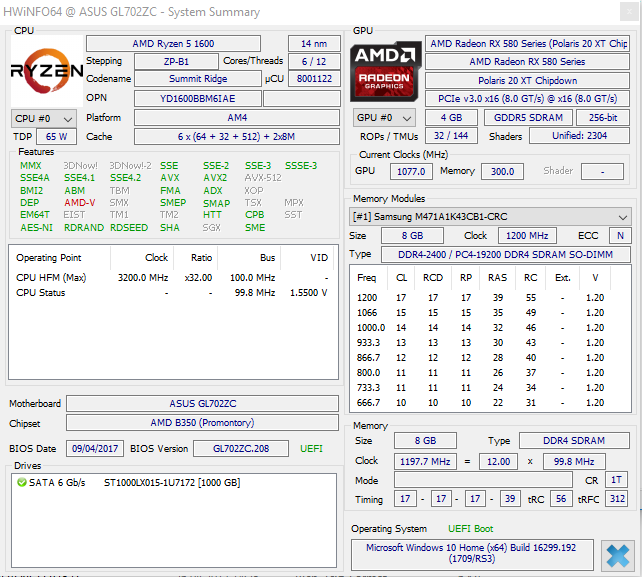
Le processeur hexacœurs intégré nous a fait une bonne impression.
Il permet une puissance de calcul plus que suffisante pour tous les logiciels modernes. Ses performances multicœurs sont meilleures que celles des concurrents Intel – il n’est battu que par le Core i7-8700K, qui n’est pas vraiment dans la même gamme puisqu'il s'agit d'une puce 95 watt qui coûte beaucoup plus cher. Le portable possède un stockage abondant. Asus l’a équipé d’un disque hybride de 1 To. Pour ne pas gonfler le prix, Asus a choisi de ne pas intégrer de SSD. Mais on peut en rajouter un après l’achat, un emplacement M.2 2280 étant disponible.
Le portable étant équipé d’un GPU dédié puissant, il consomme beaucoup, même au repos. De ce fait, ceux qui voudraient l’utiliser uniquement pour une utilisation quotidienne devraient rester à l’écart : le portable d’Asus manque d’un GPU dédié plus efficient. De plus, il est trop bruyant pour une utilisation bureautique.
Ce modèle d’entrée de gamme de la série GL702ZC coûte 1 200 €. En termes de prix, il est donc comparable aux portables équipés d’un processeur Intel Core et d’une carte graphique Nvidia GeForce GTX 1060. Ces appareils, généralement équipés à la fois d’une carte graphique dédiée et d’une intégrée peuvent être utilisés au bureau. Ils consomment moins et sont bien moins bruyants – on pense par exemple à l’Acer Aspire V17 Nitro BE VN7-793G. De ce fait, le GL702ZC cible ceux qui veulent le plus de performances multicœur possibles pour un prix maîtrisé, et qui apprécient de pouvoir remplacer le CPU.
L’intégralité de cette critique est disponible en anglais en suivant ce lien.
Asus ROG Strix GL702ZC-GC204T
- 02/02/2018 v6 (old)
Sascha Mölck