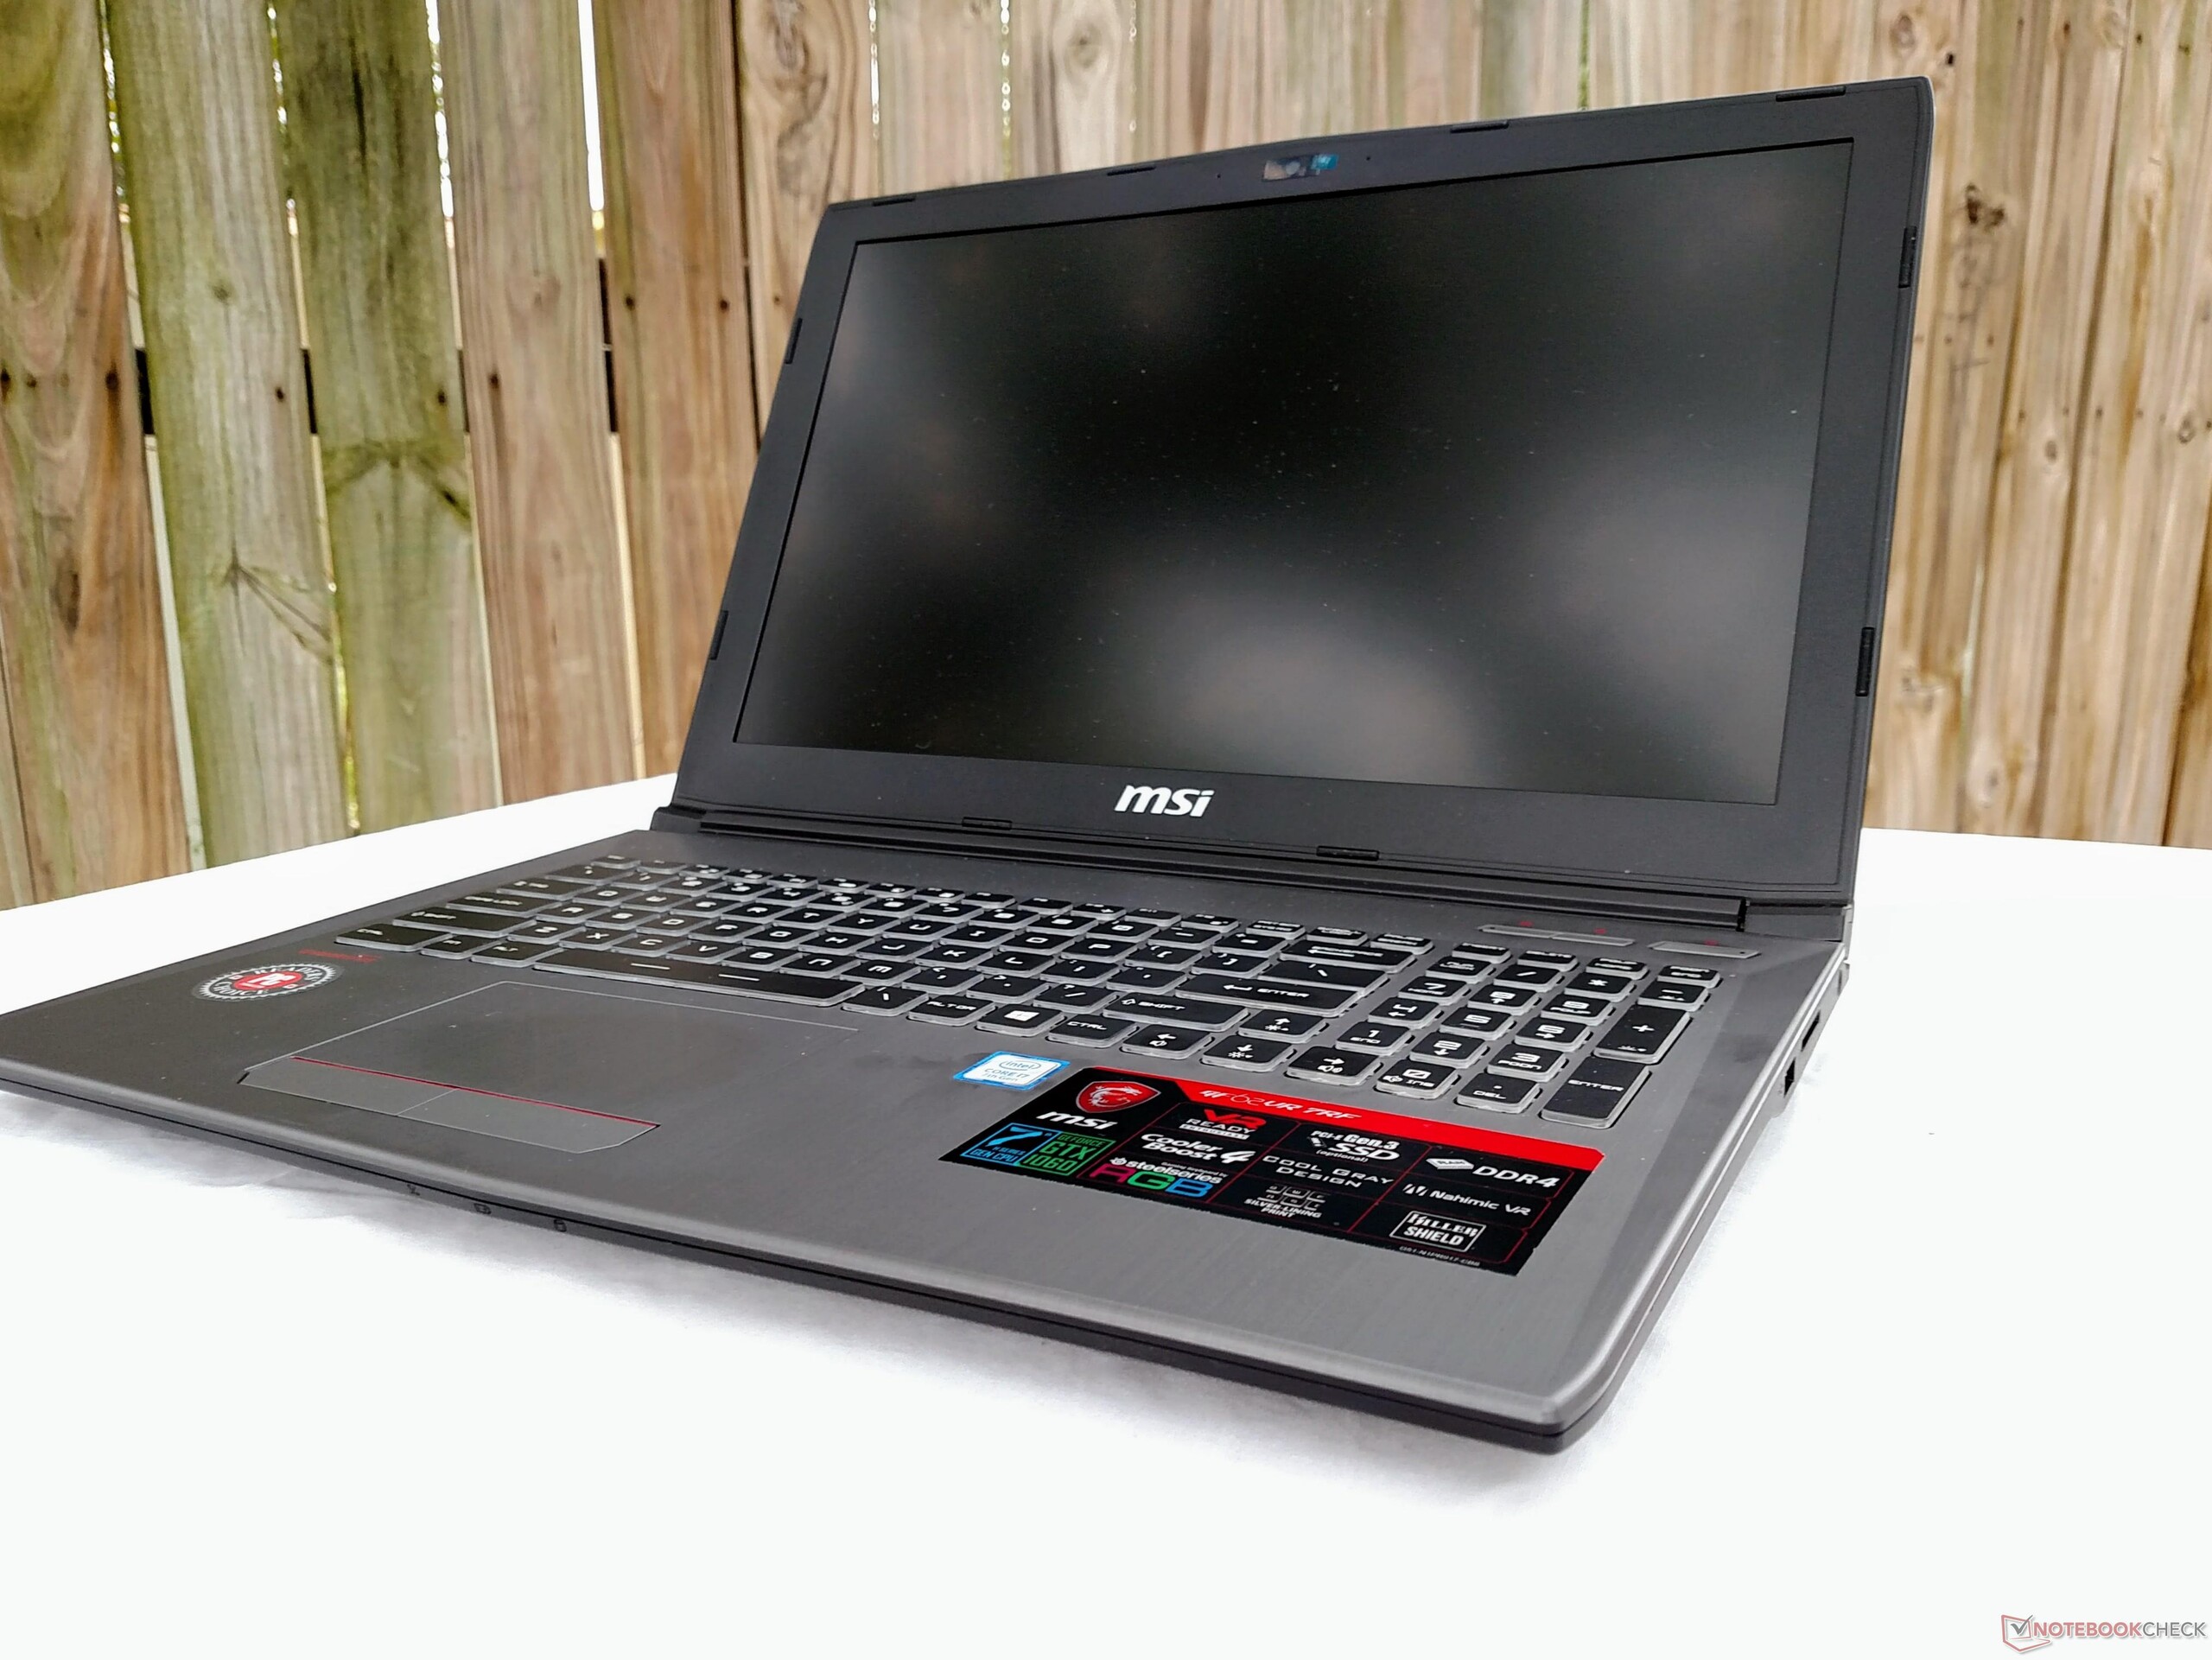
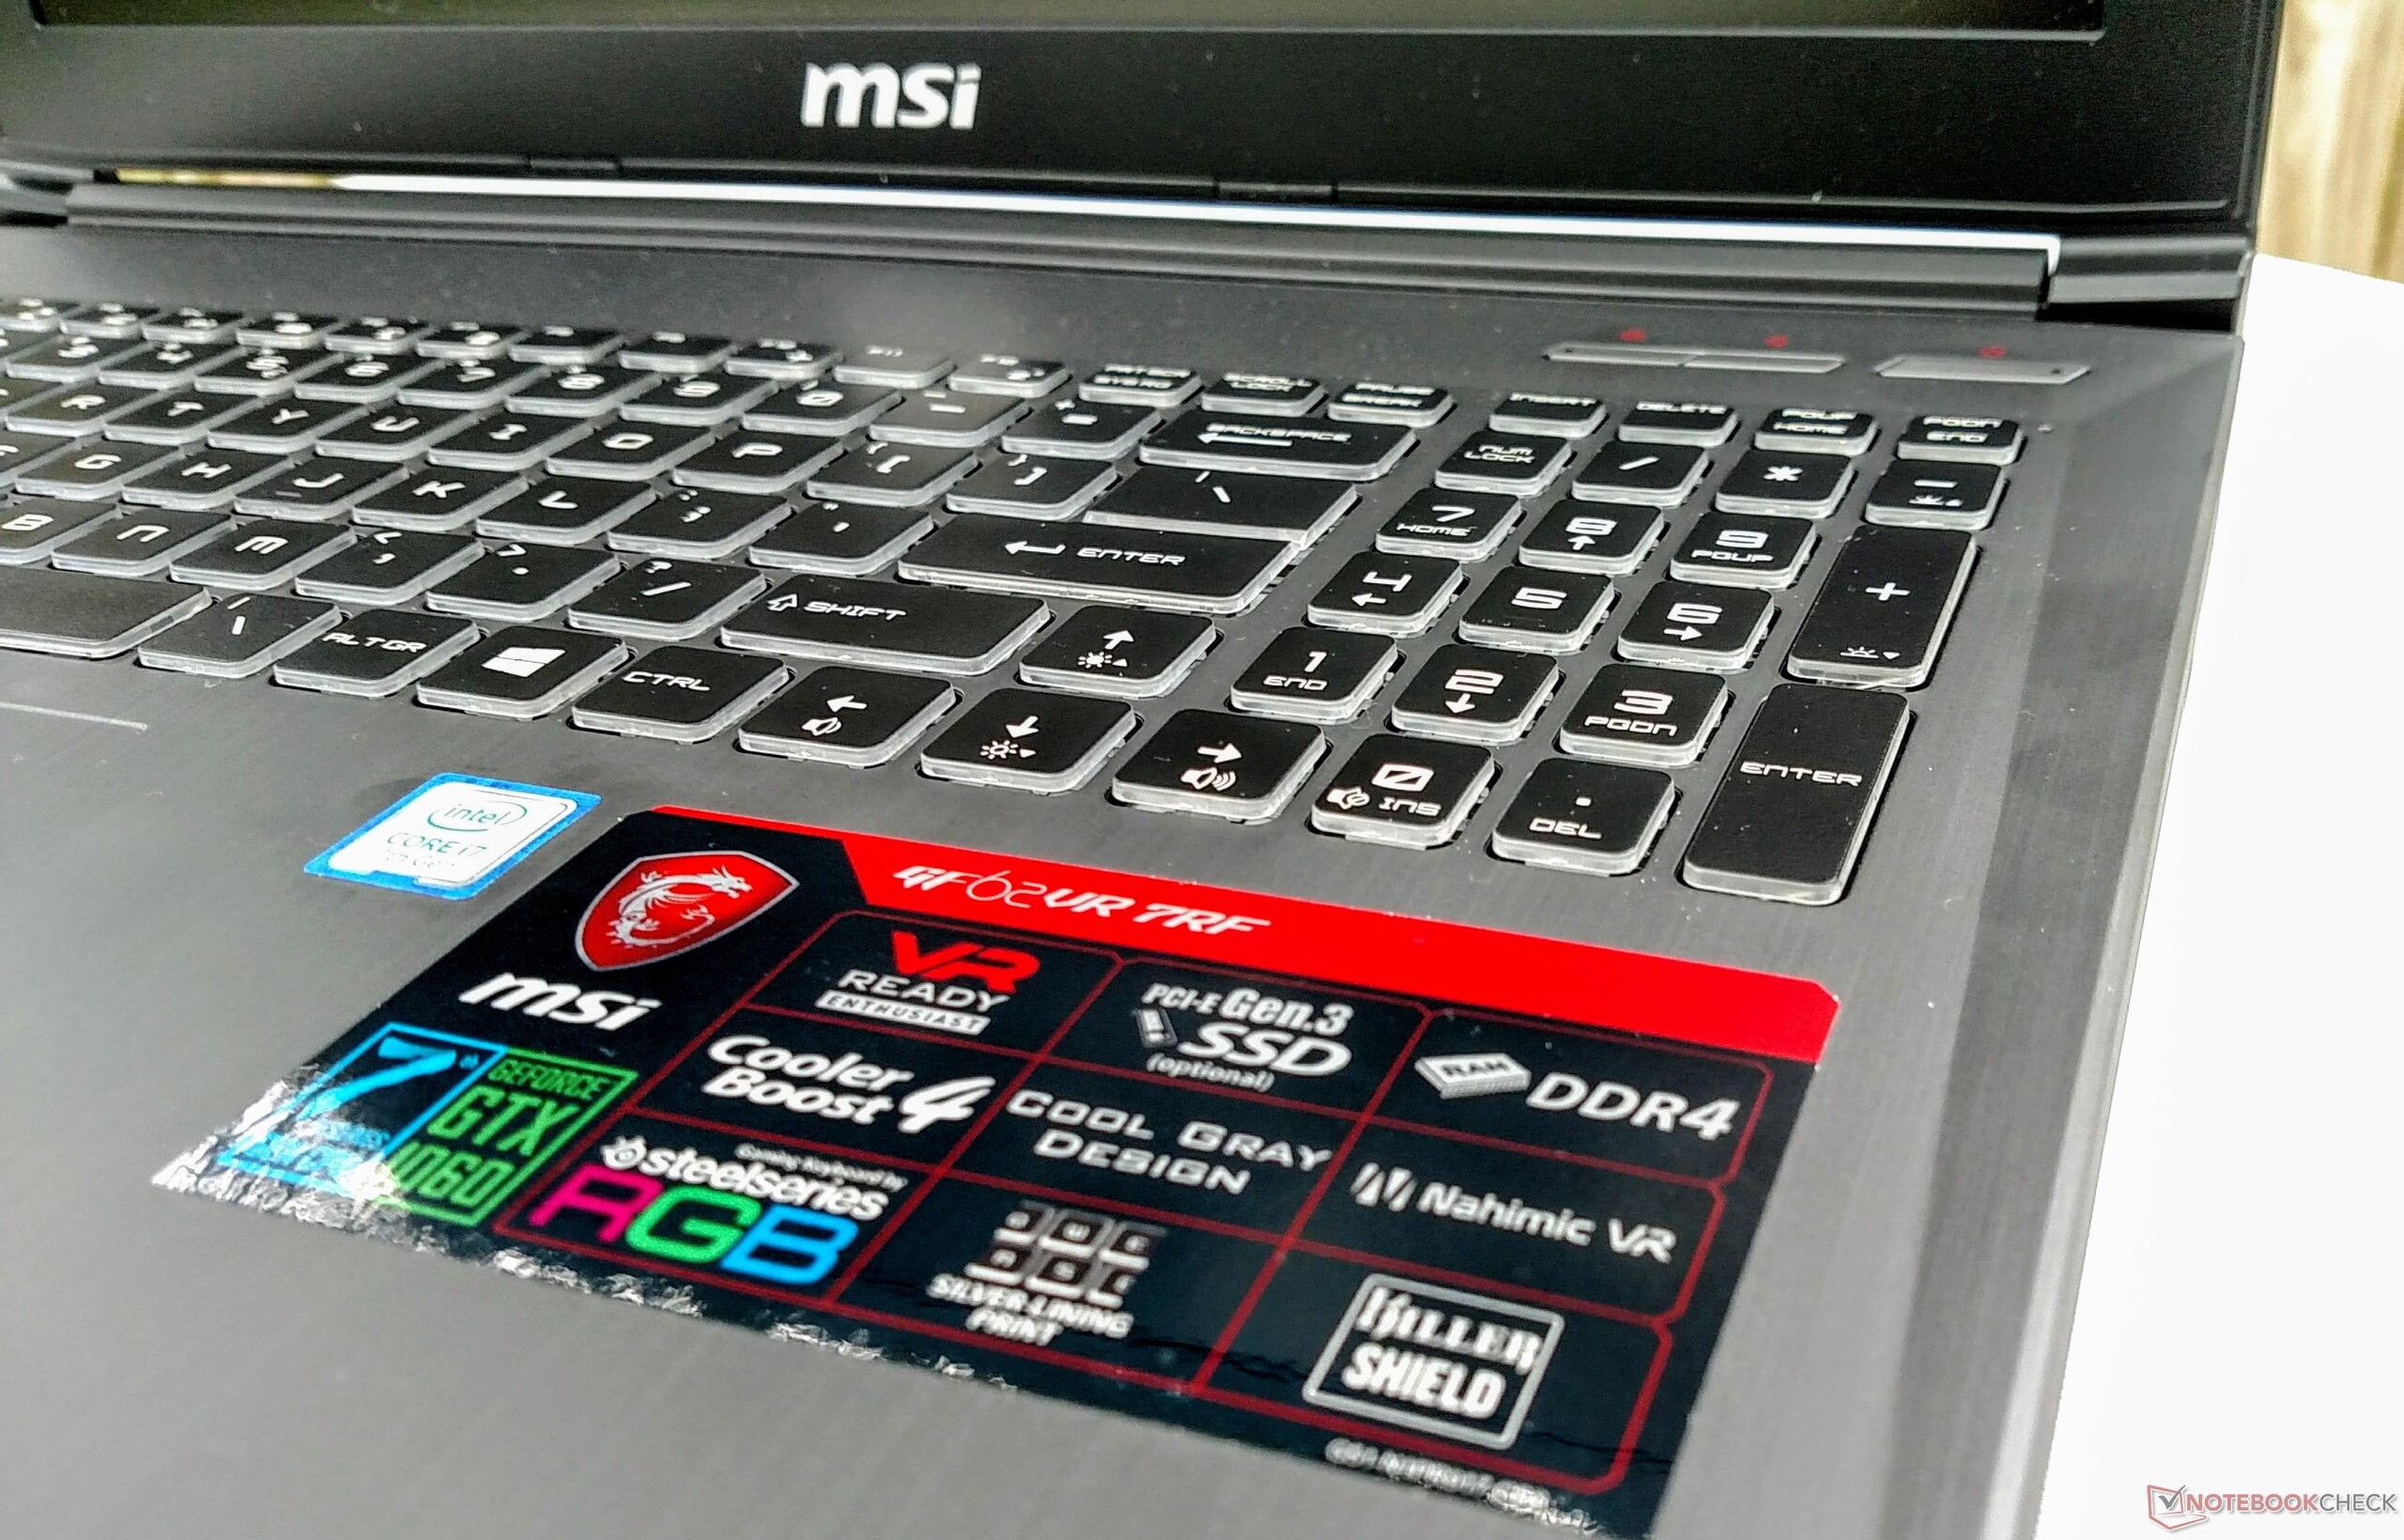
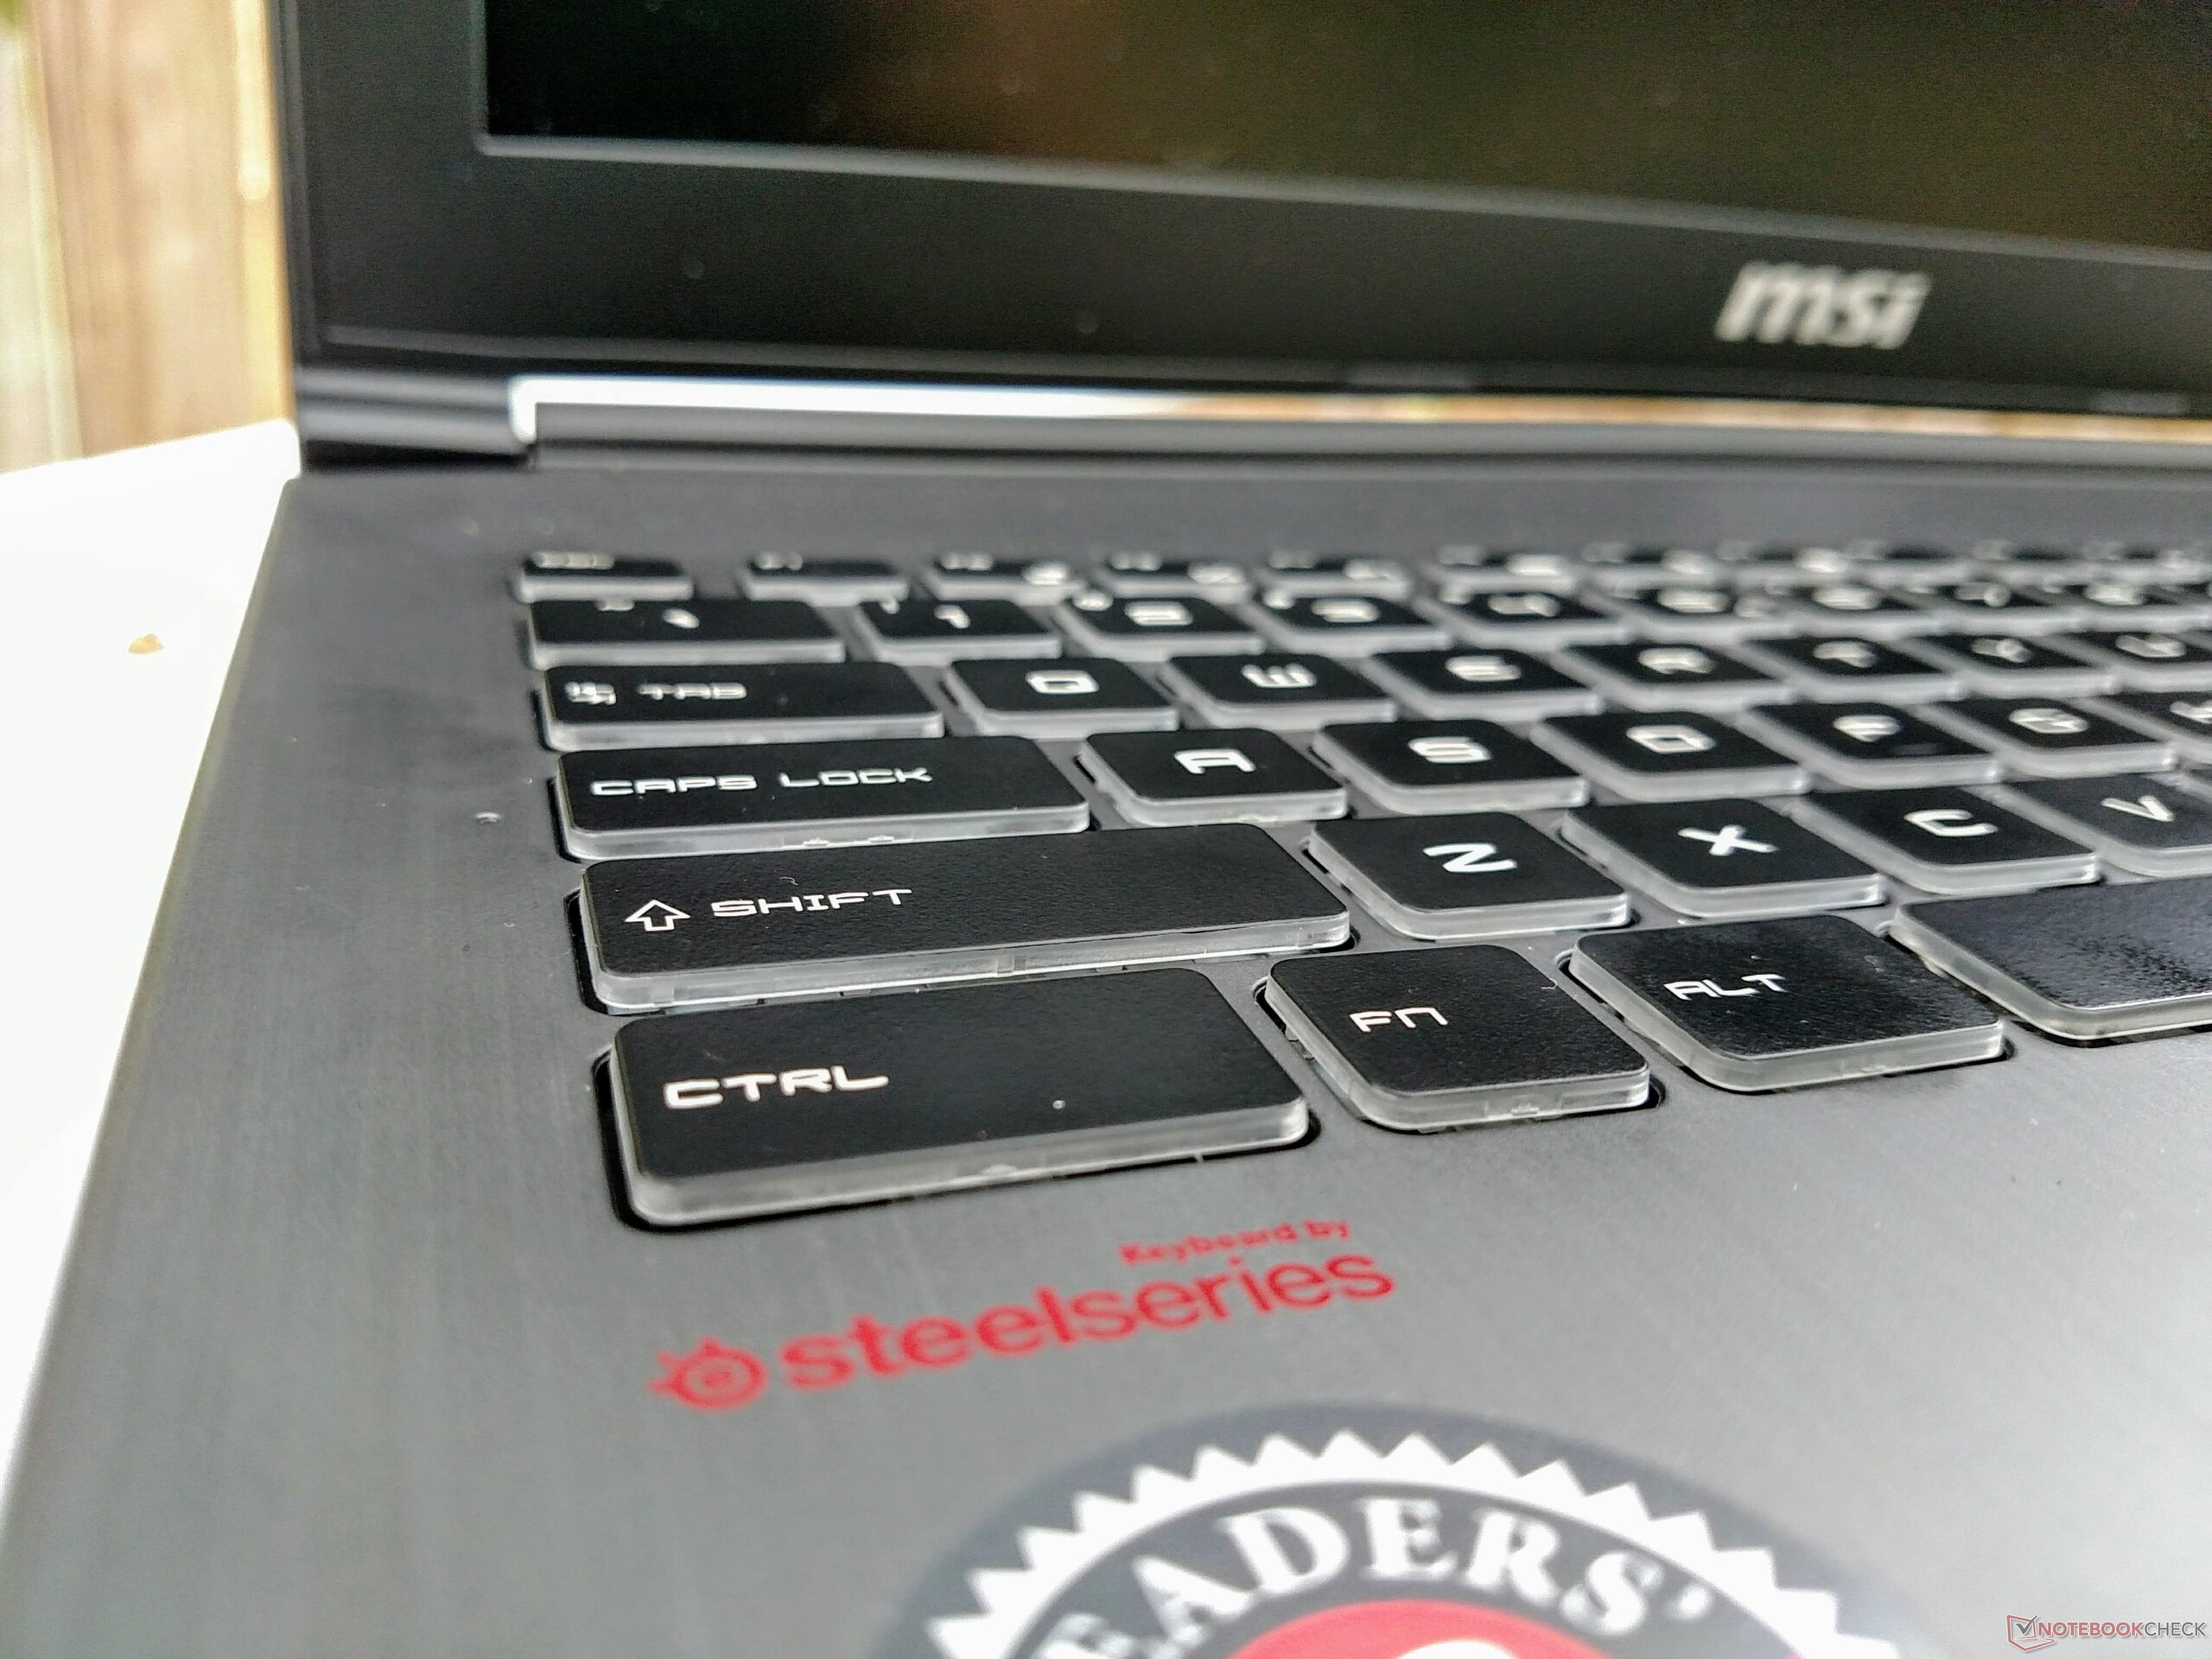
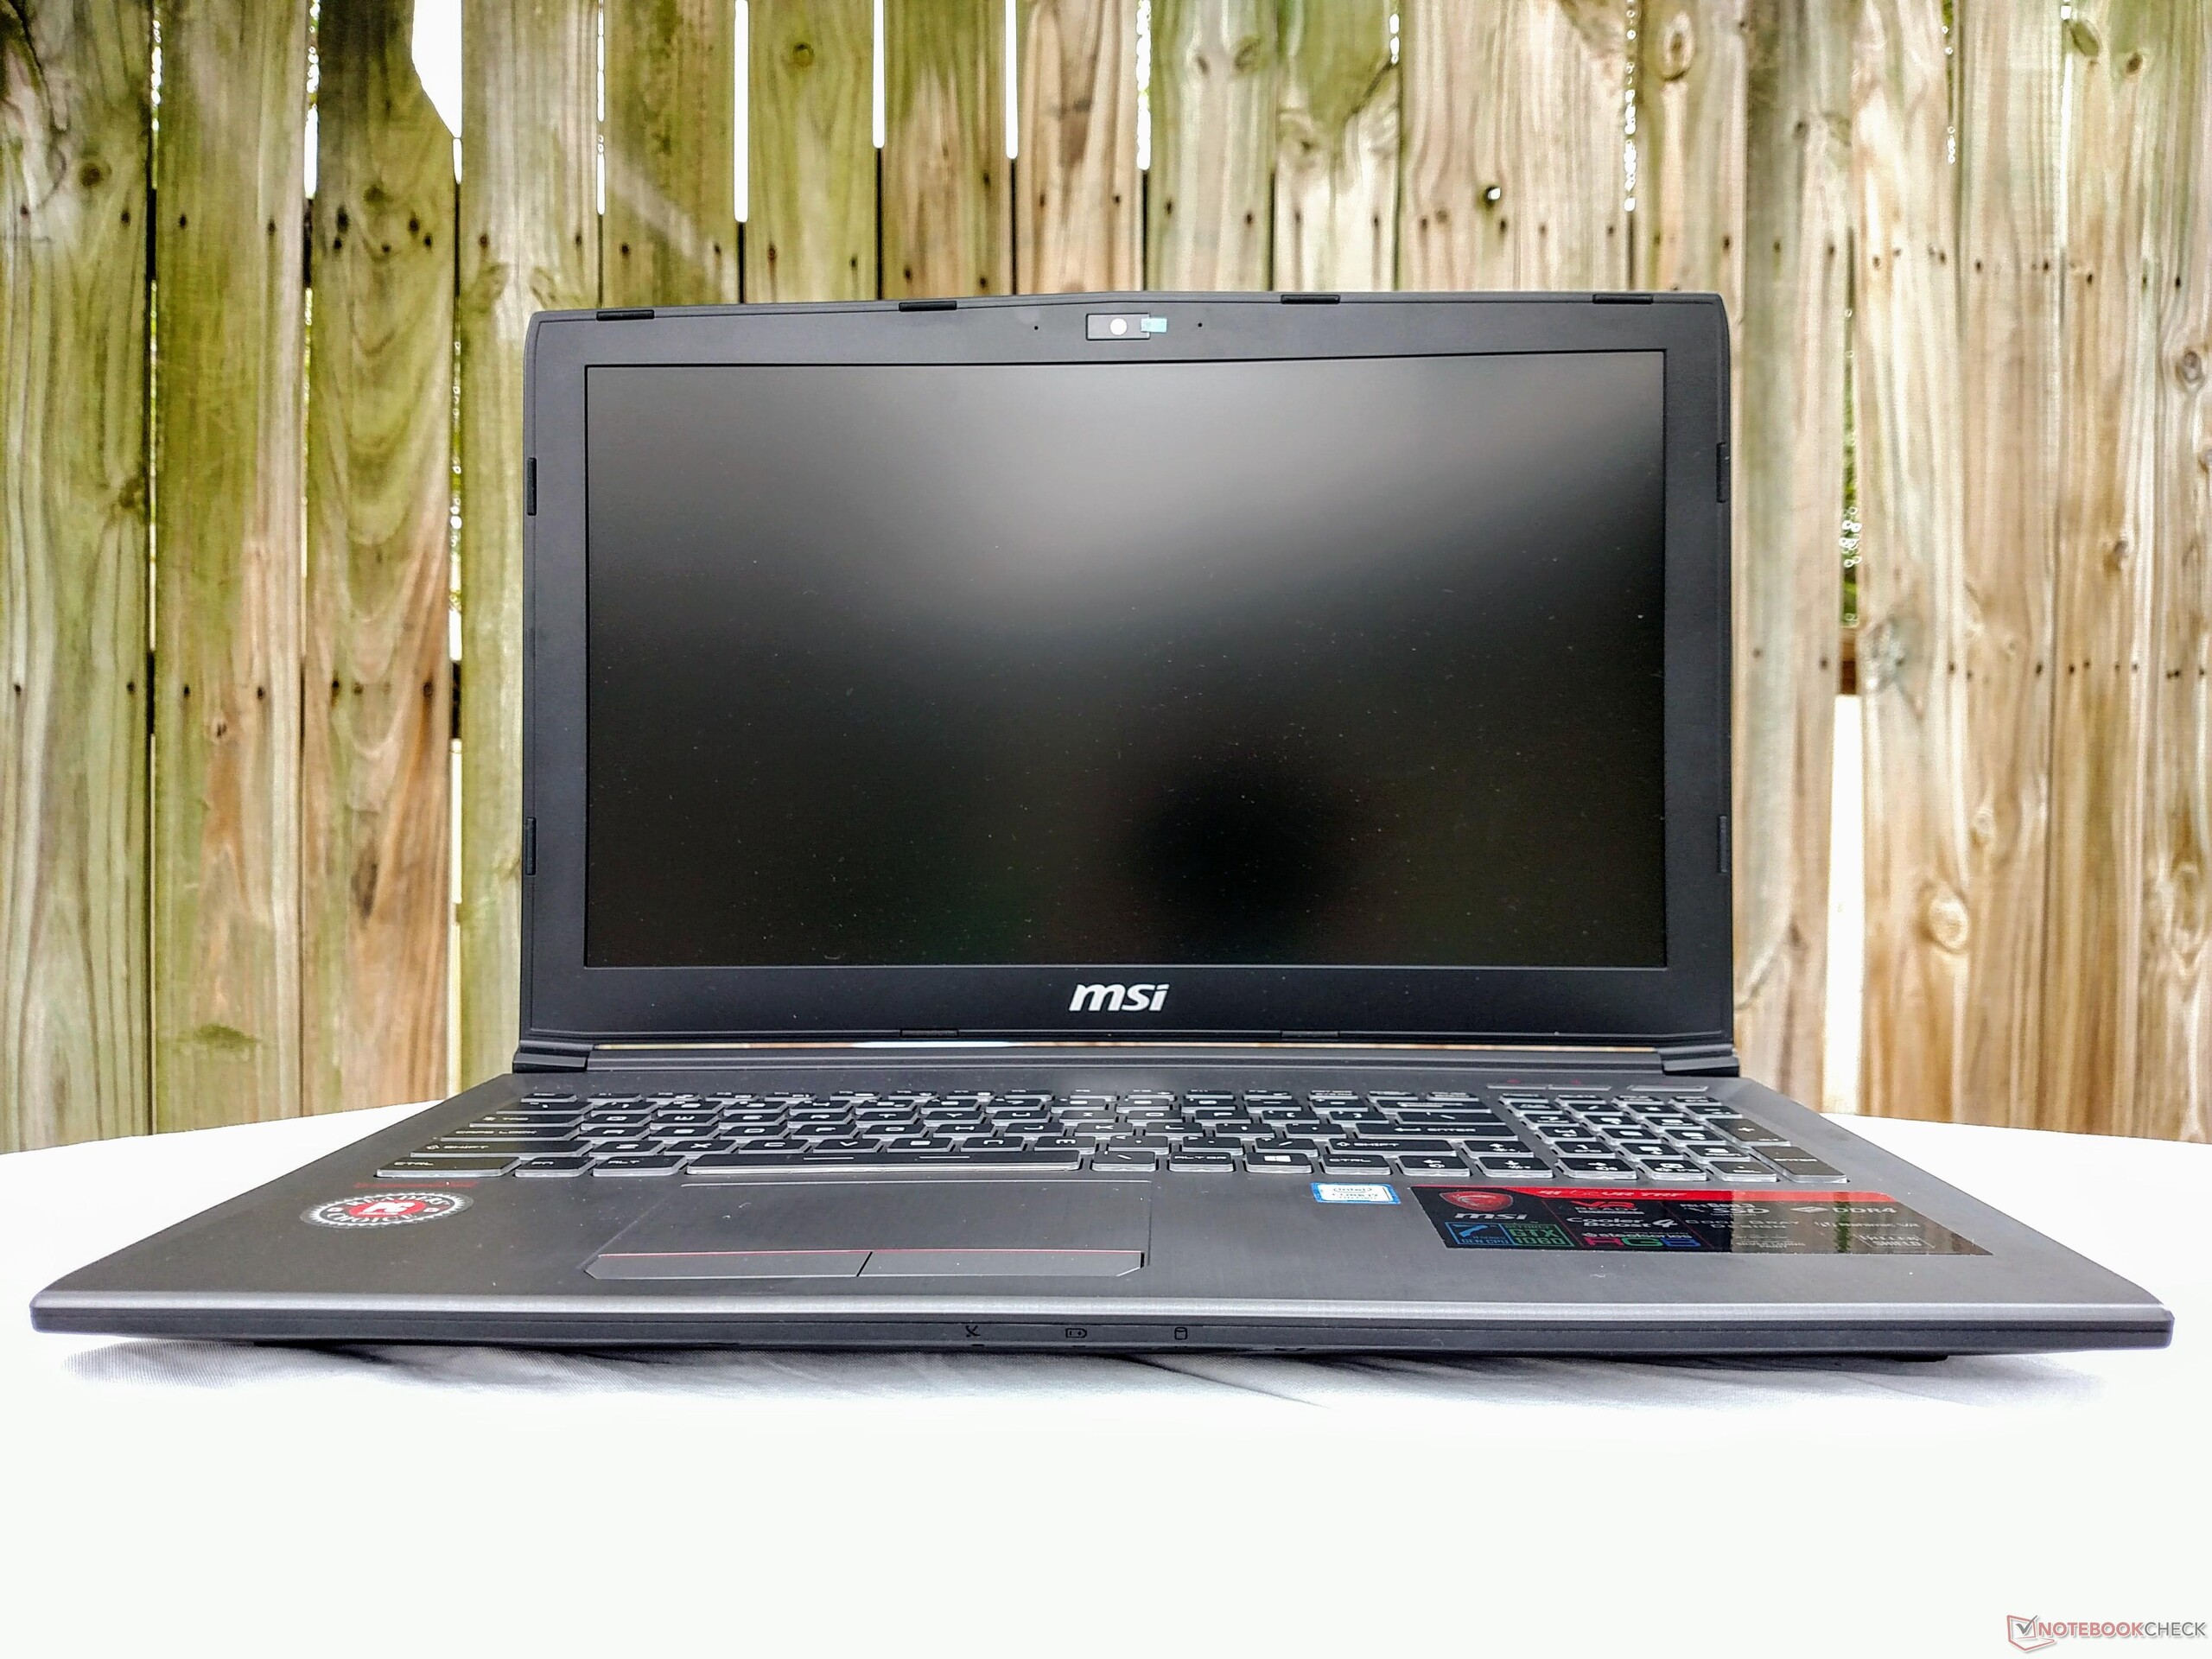
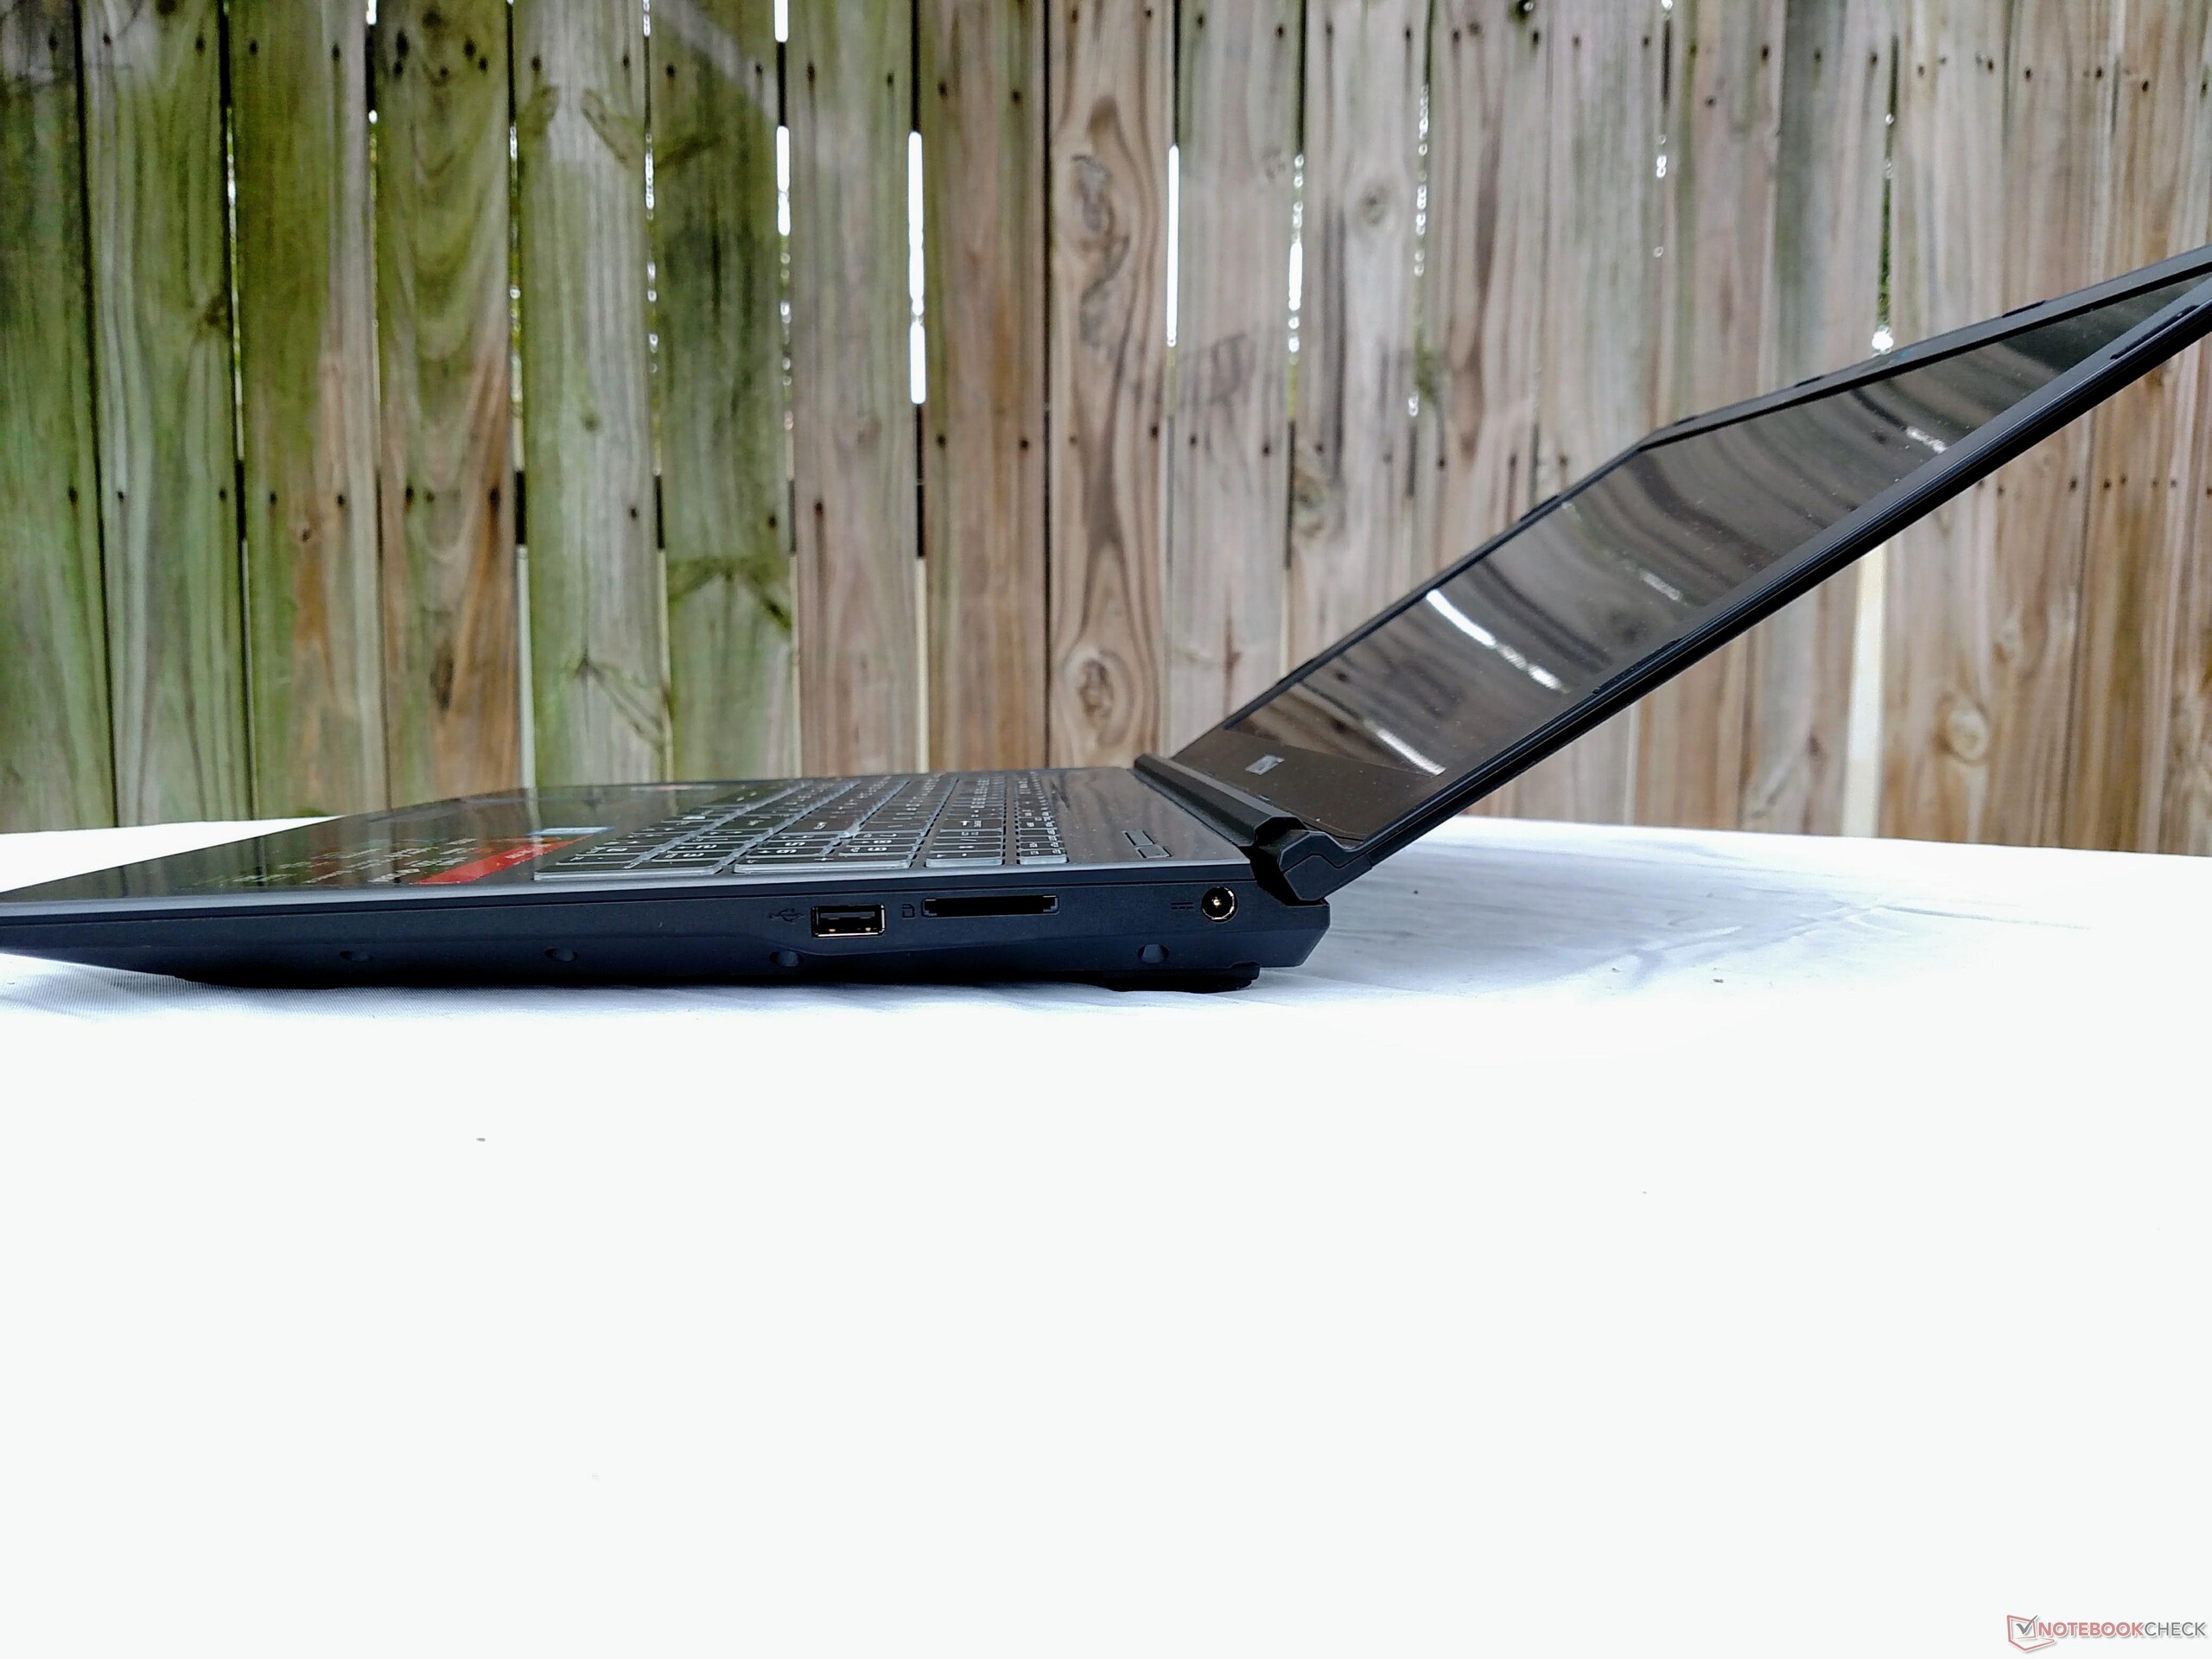
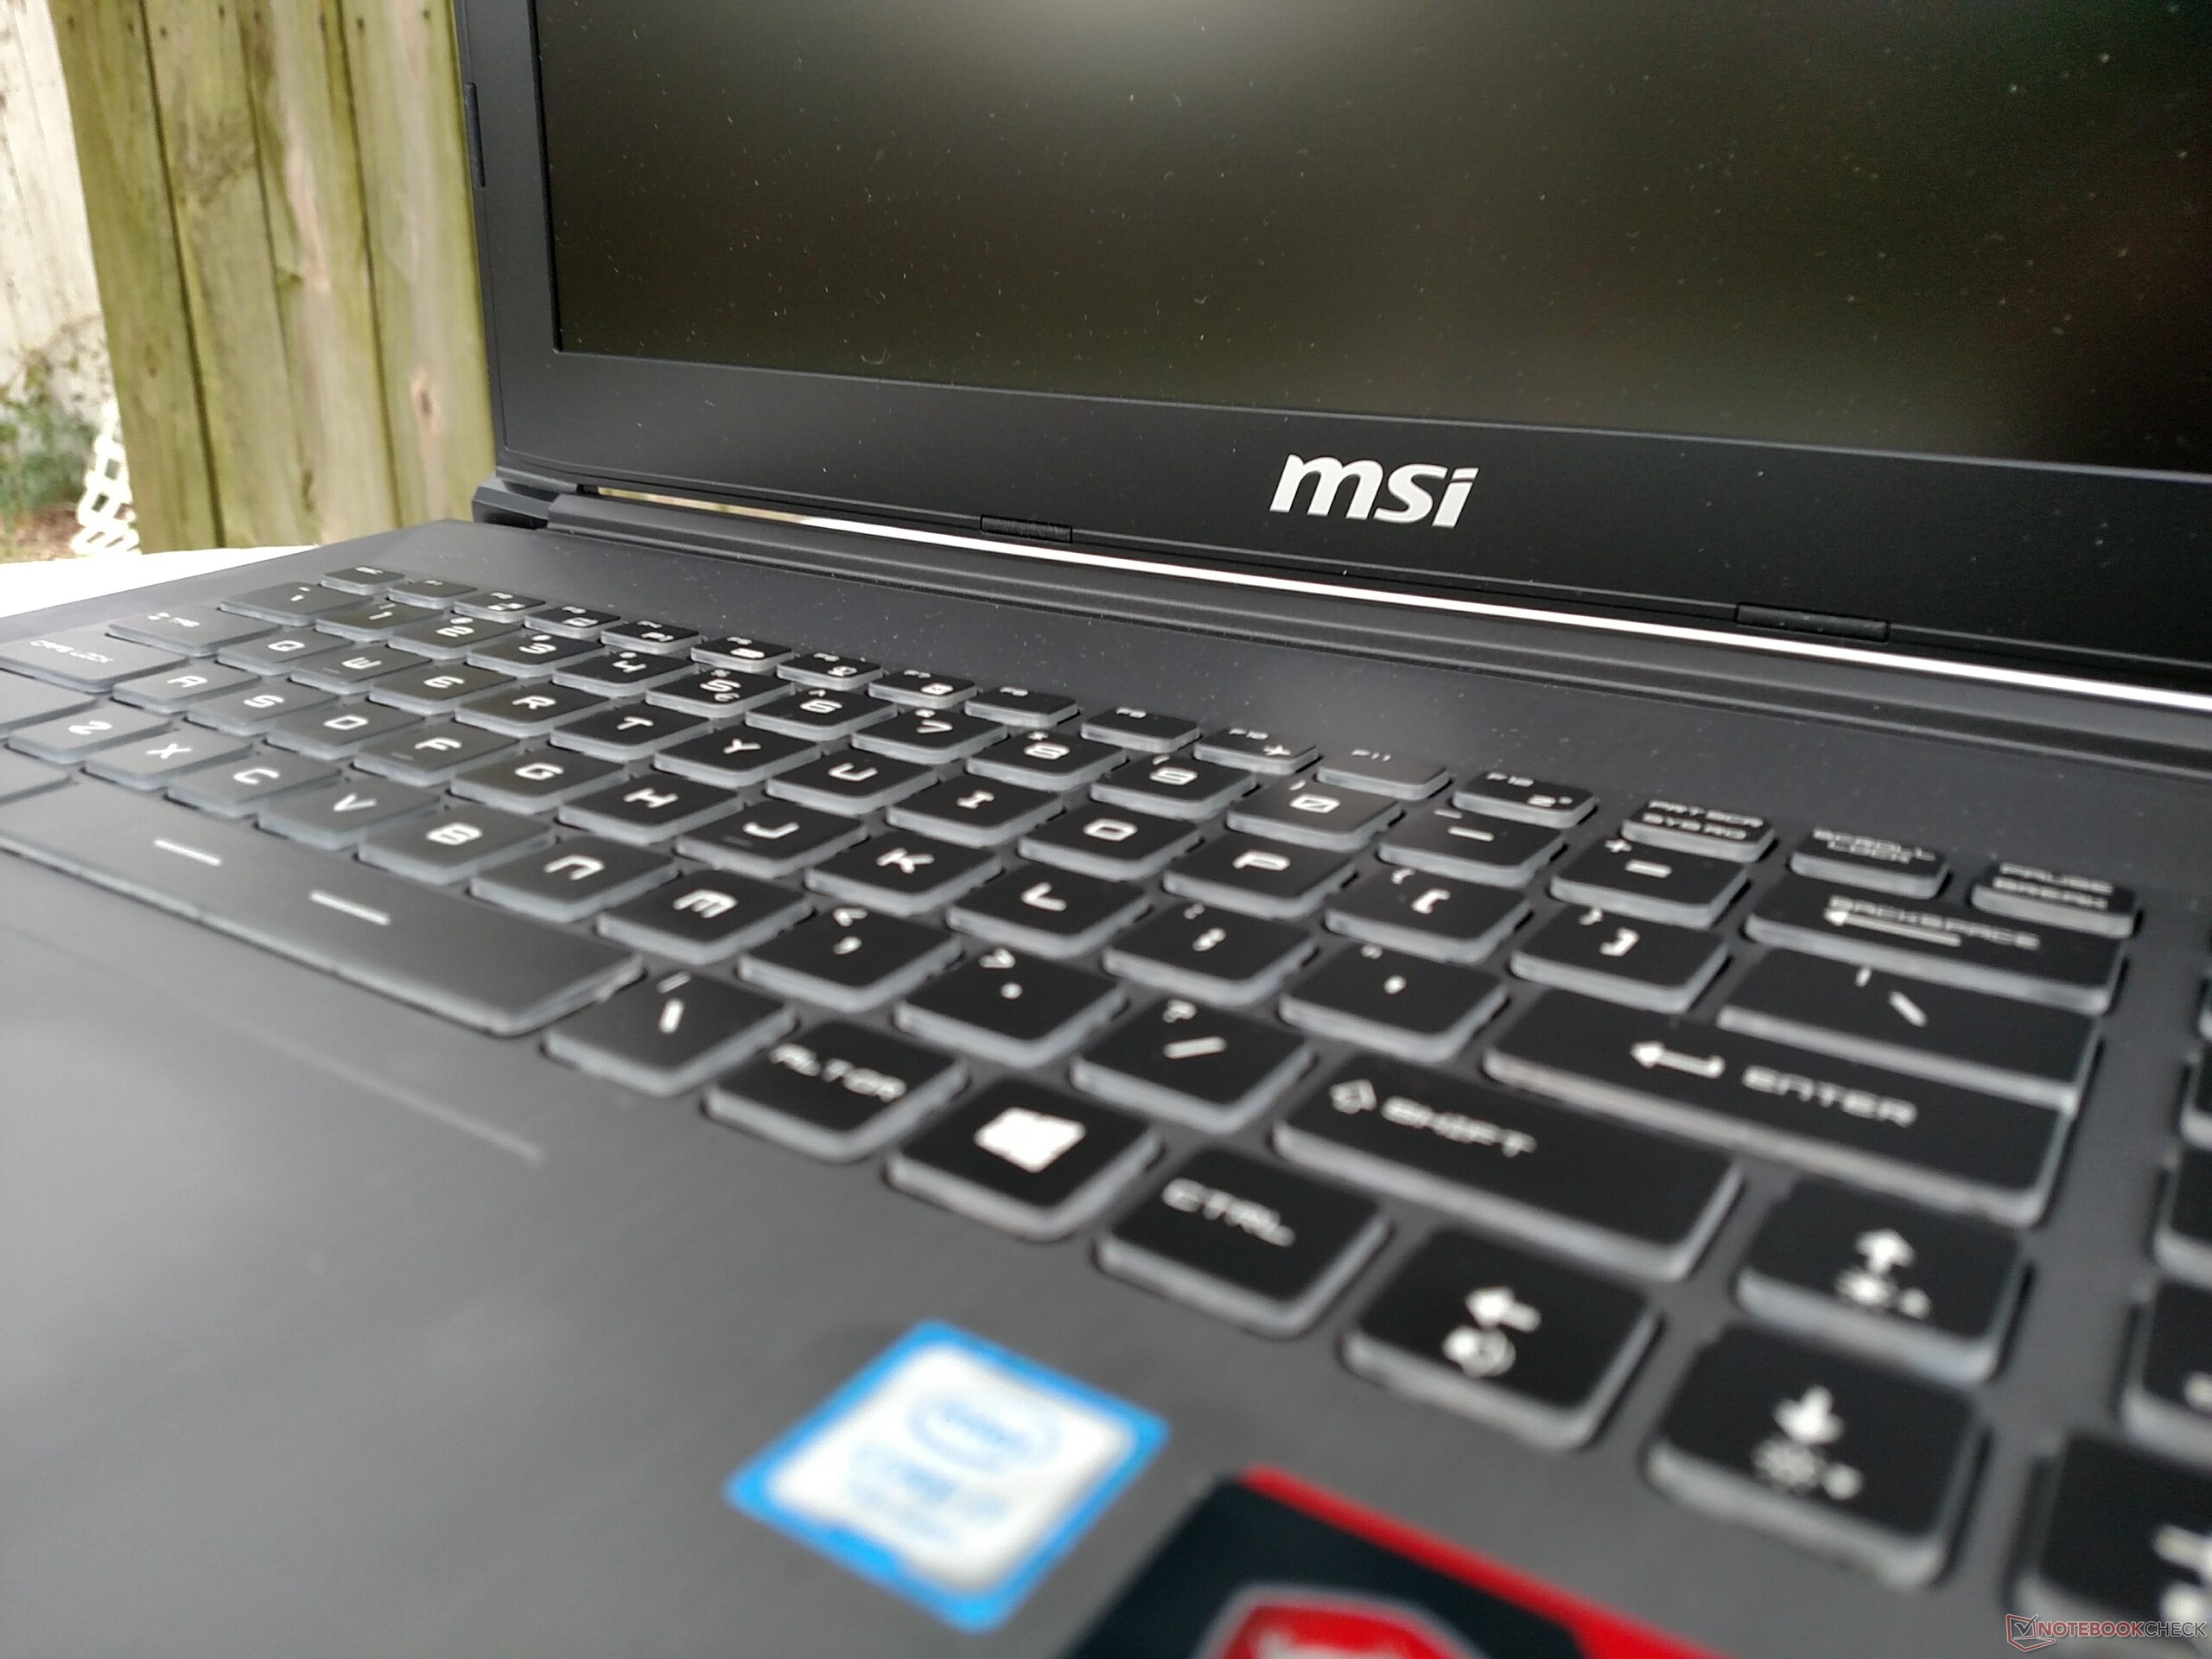
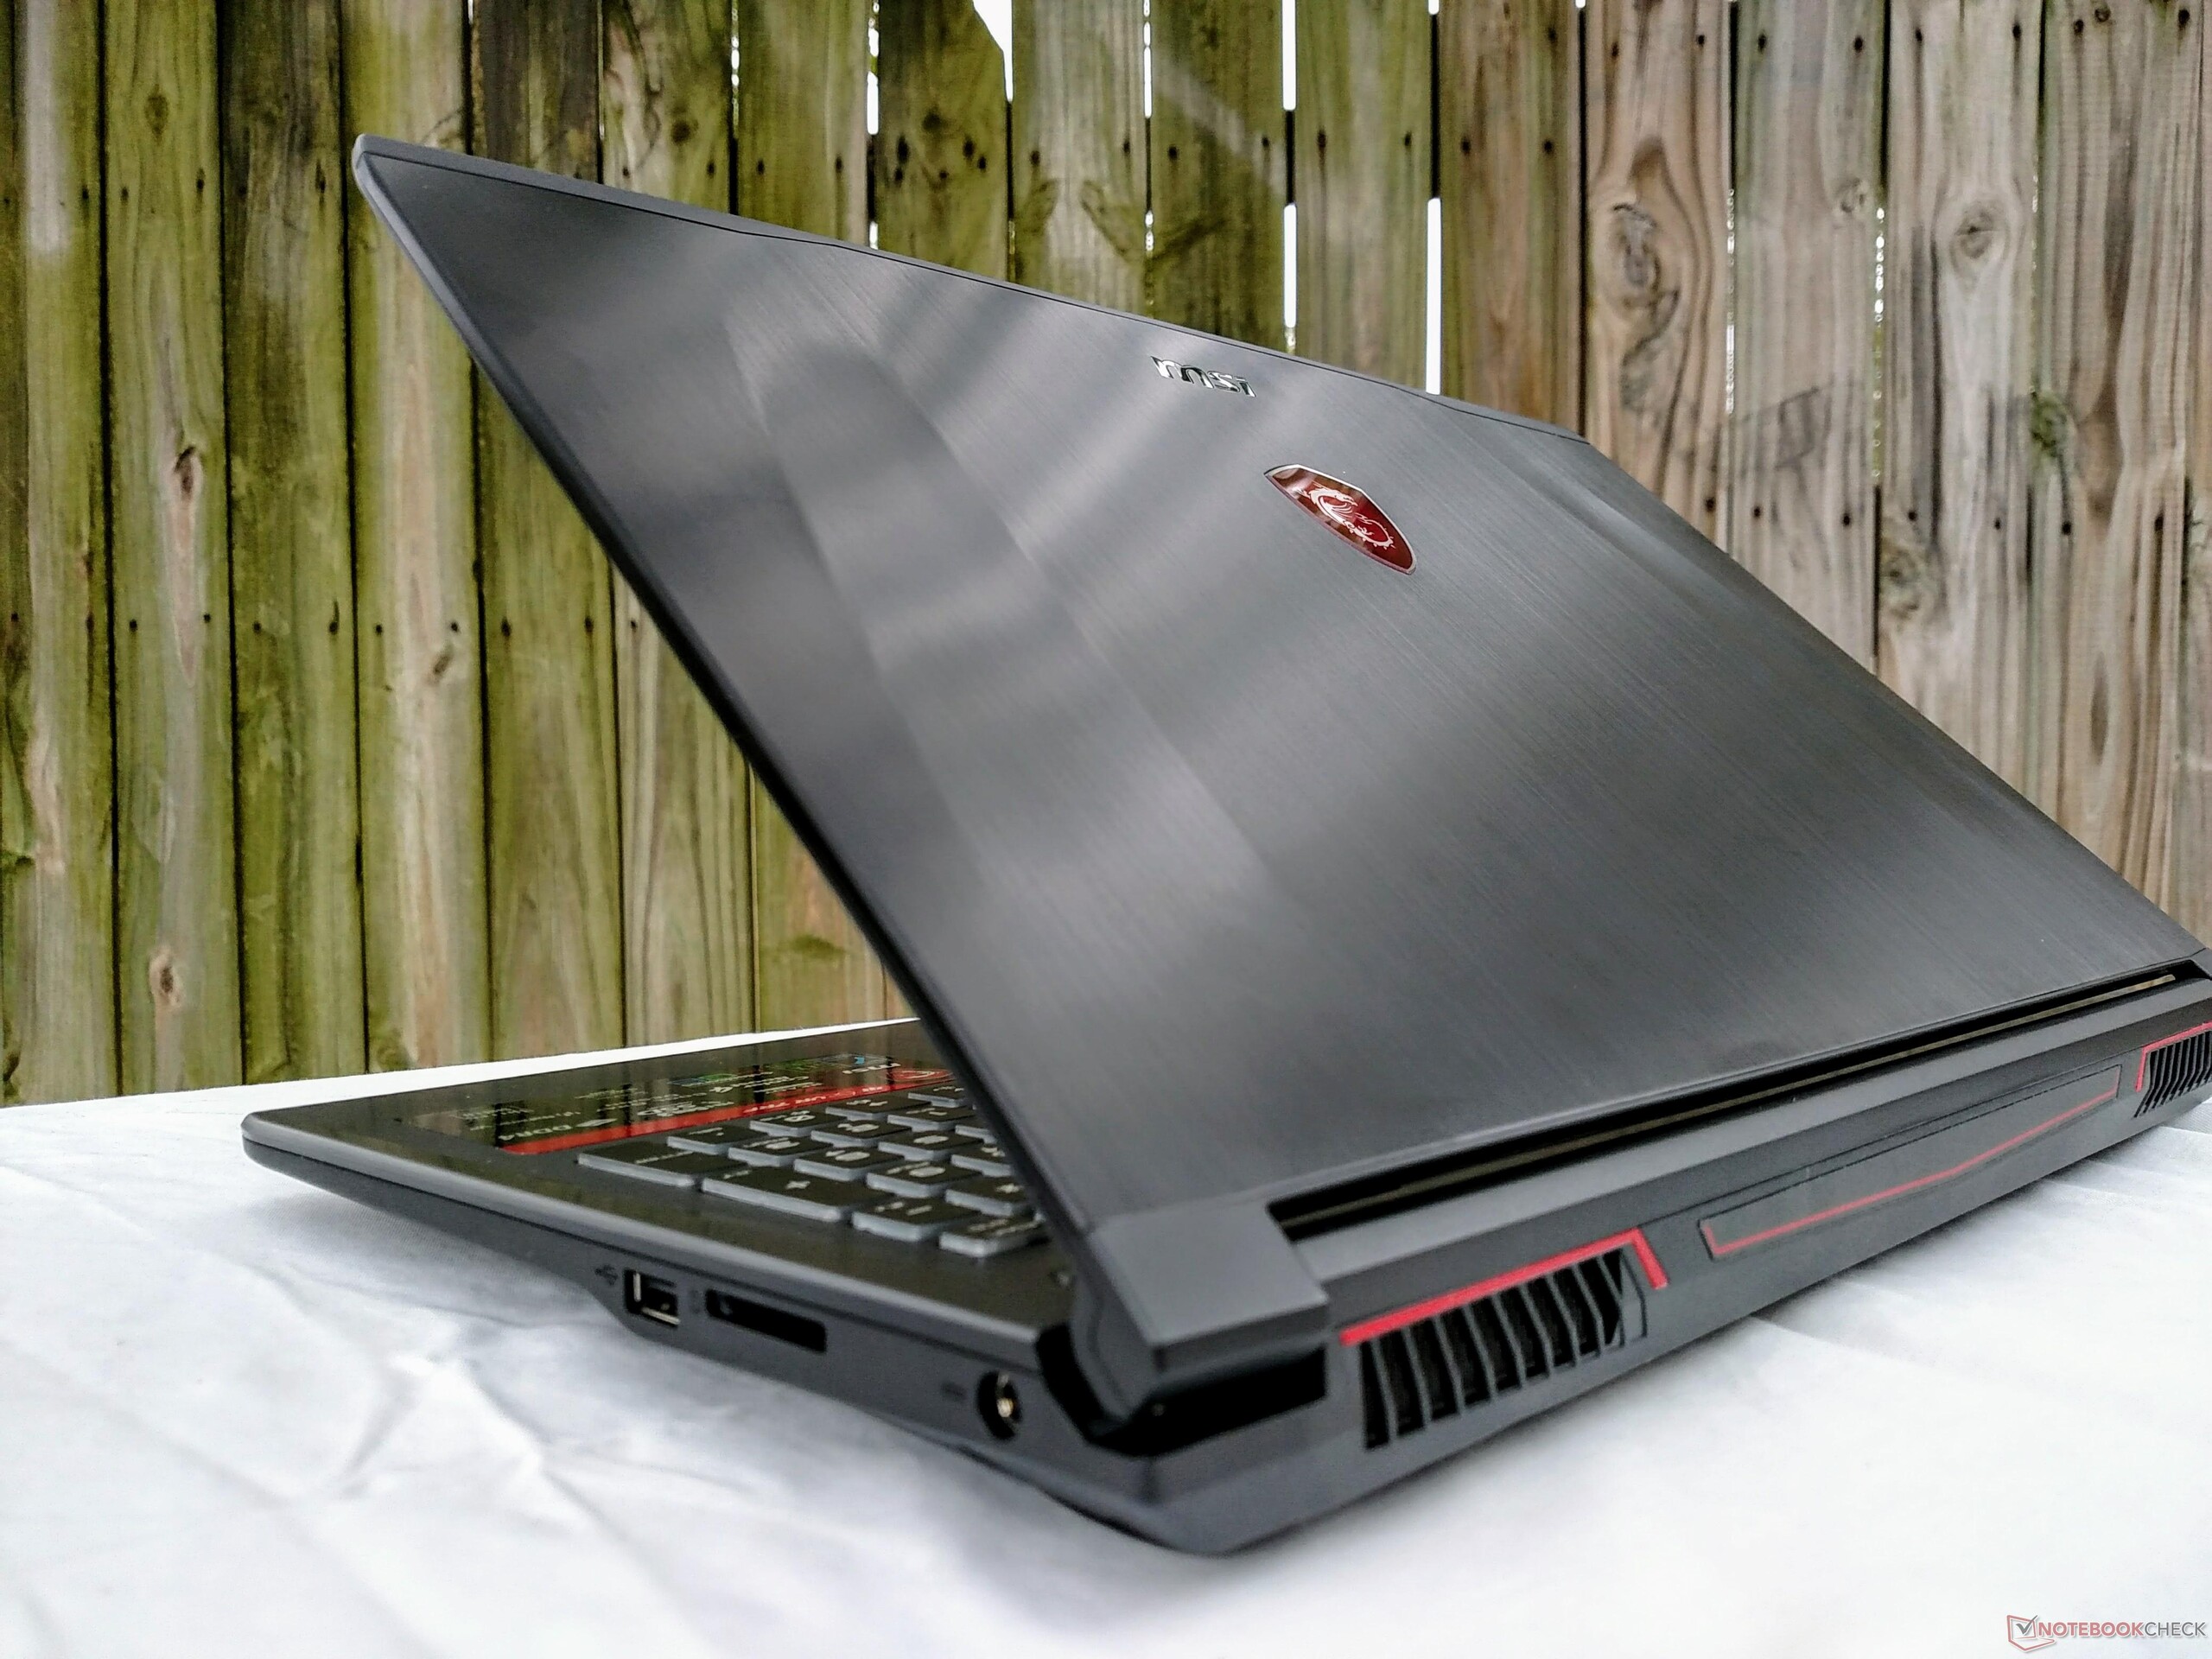
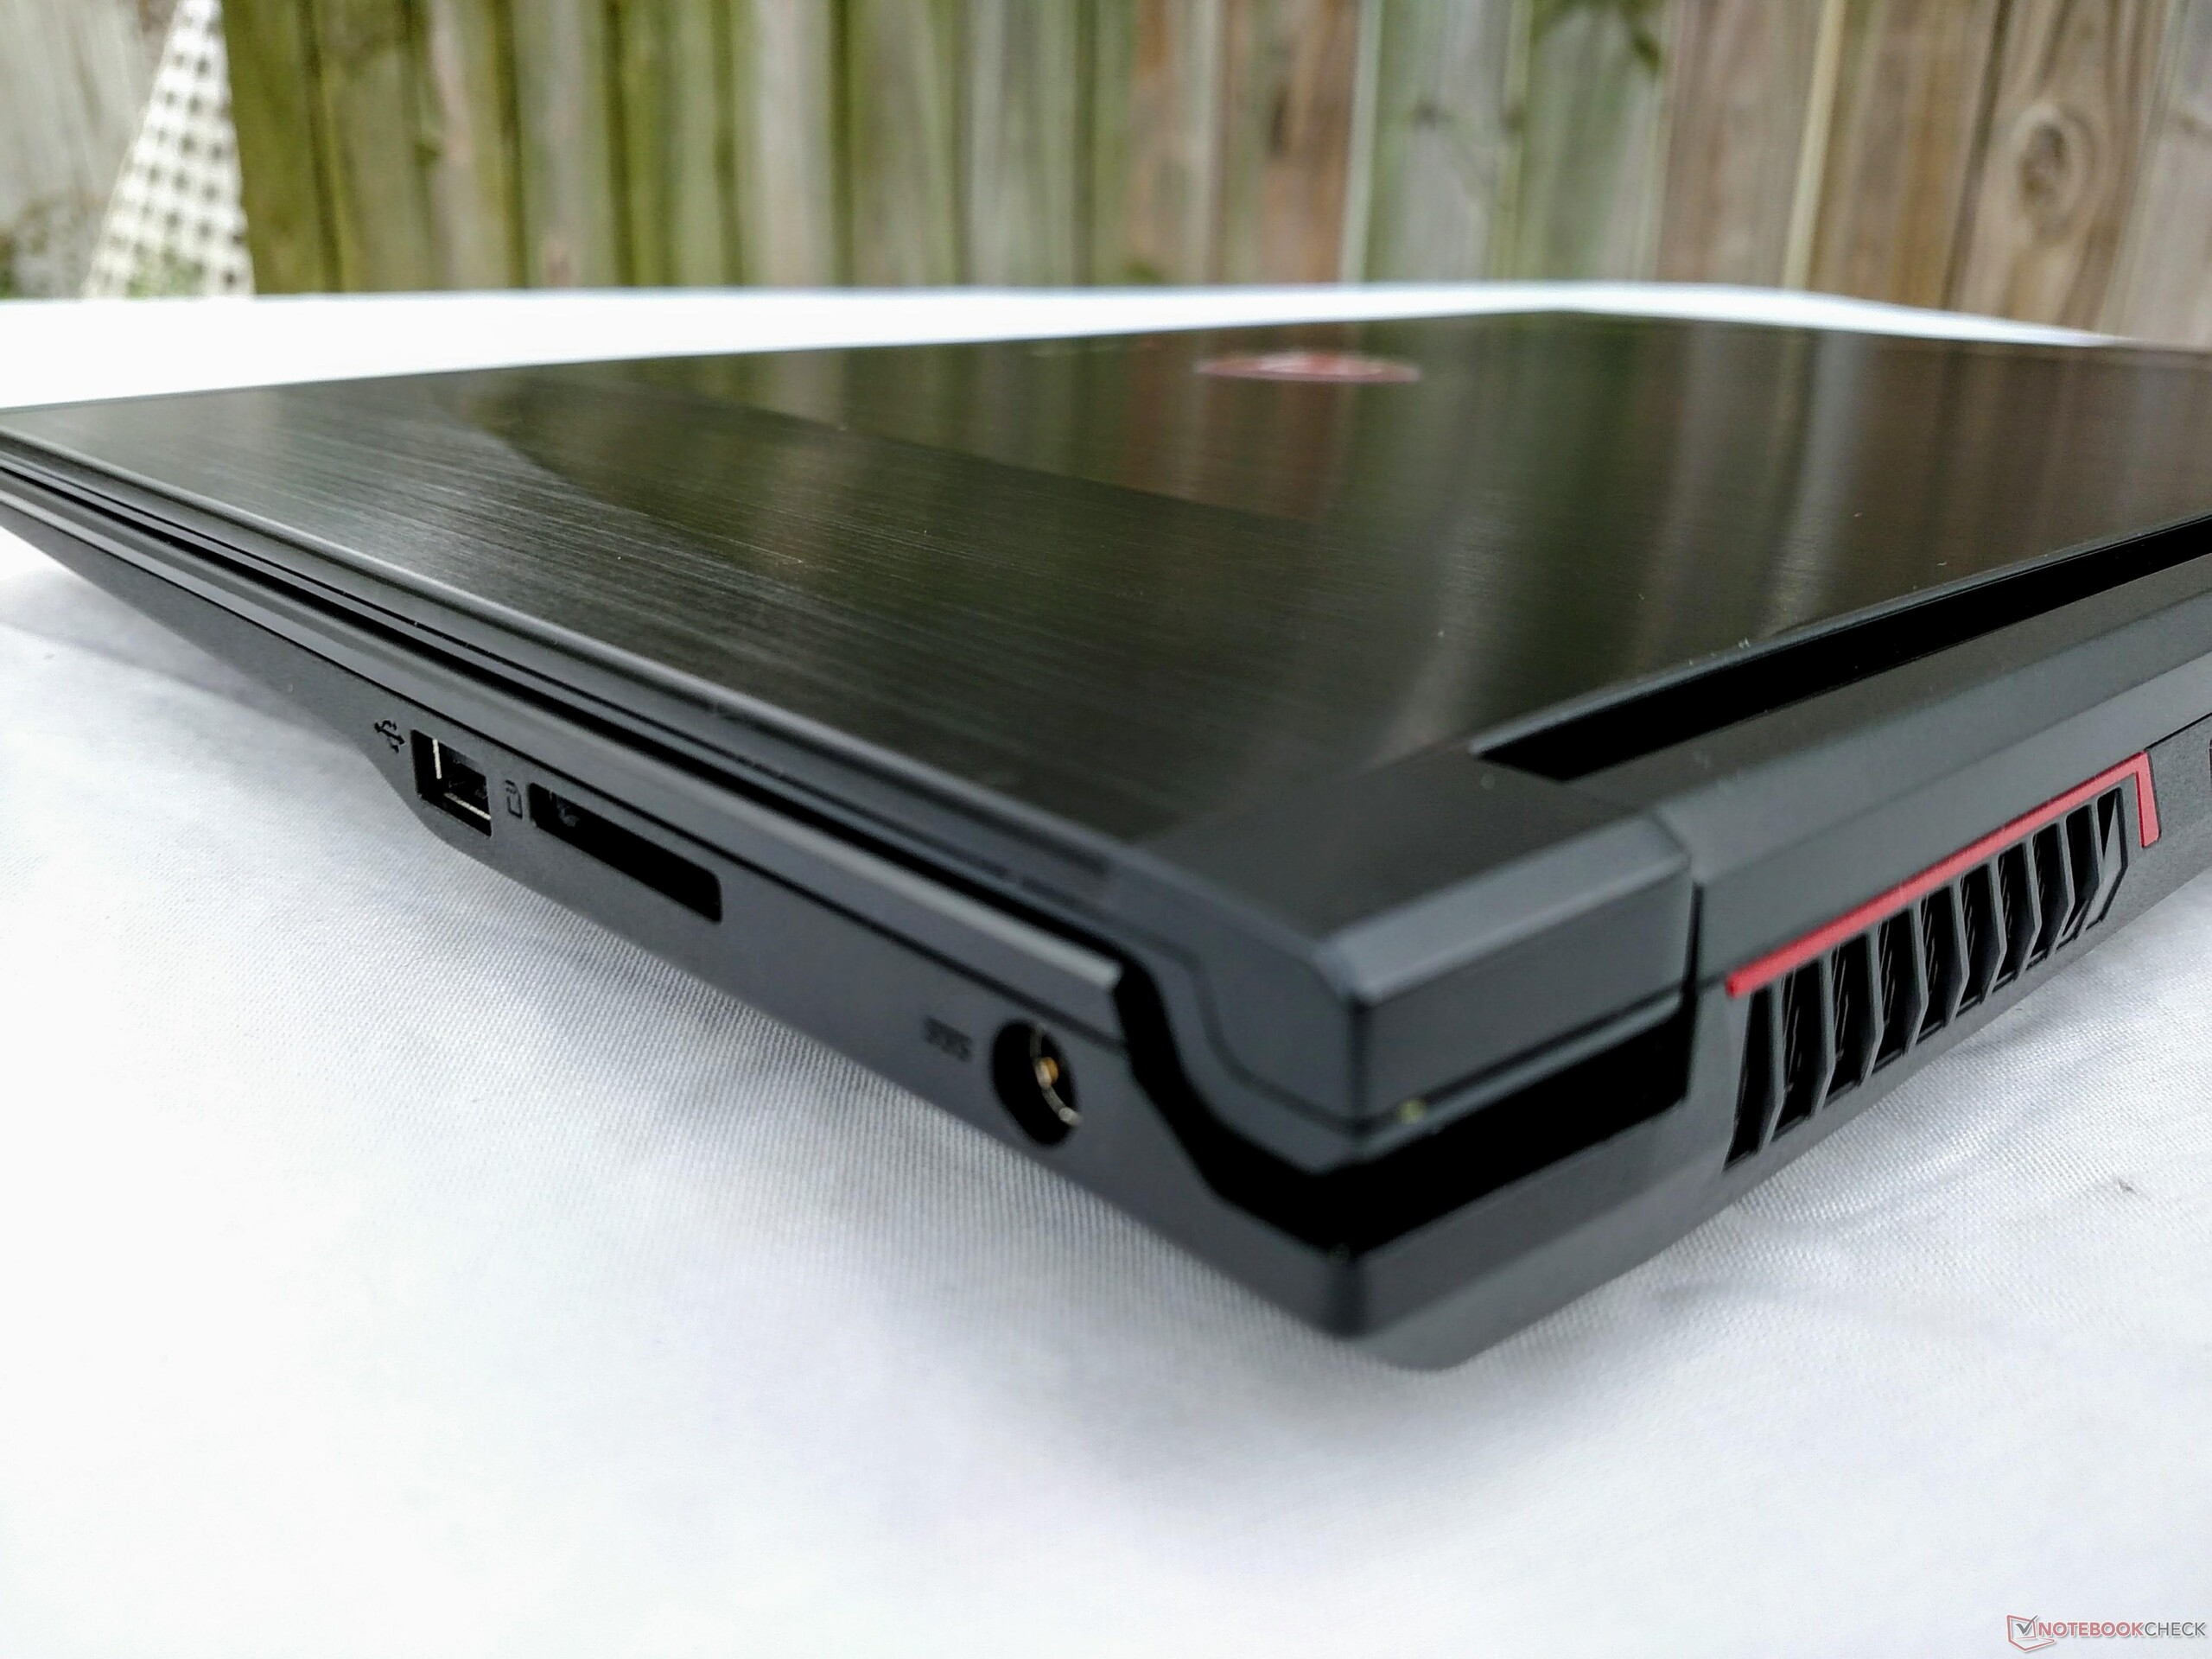
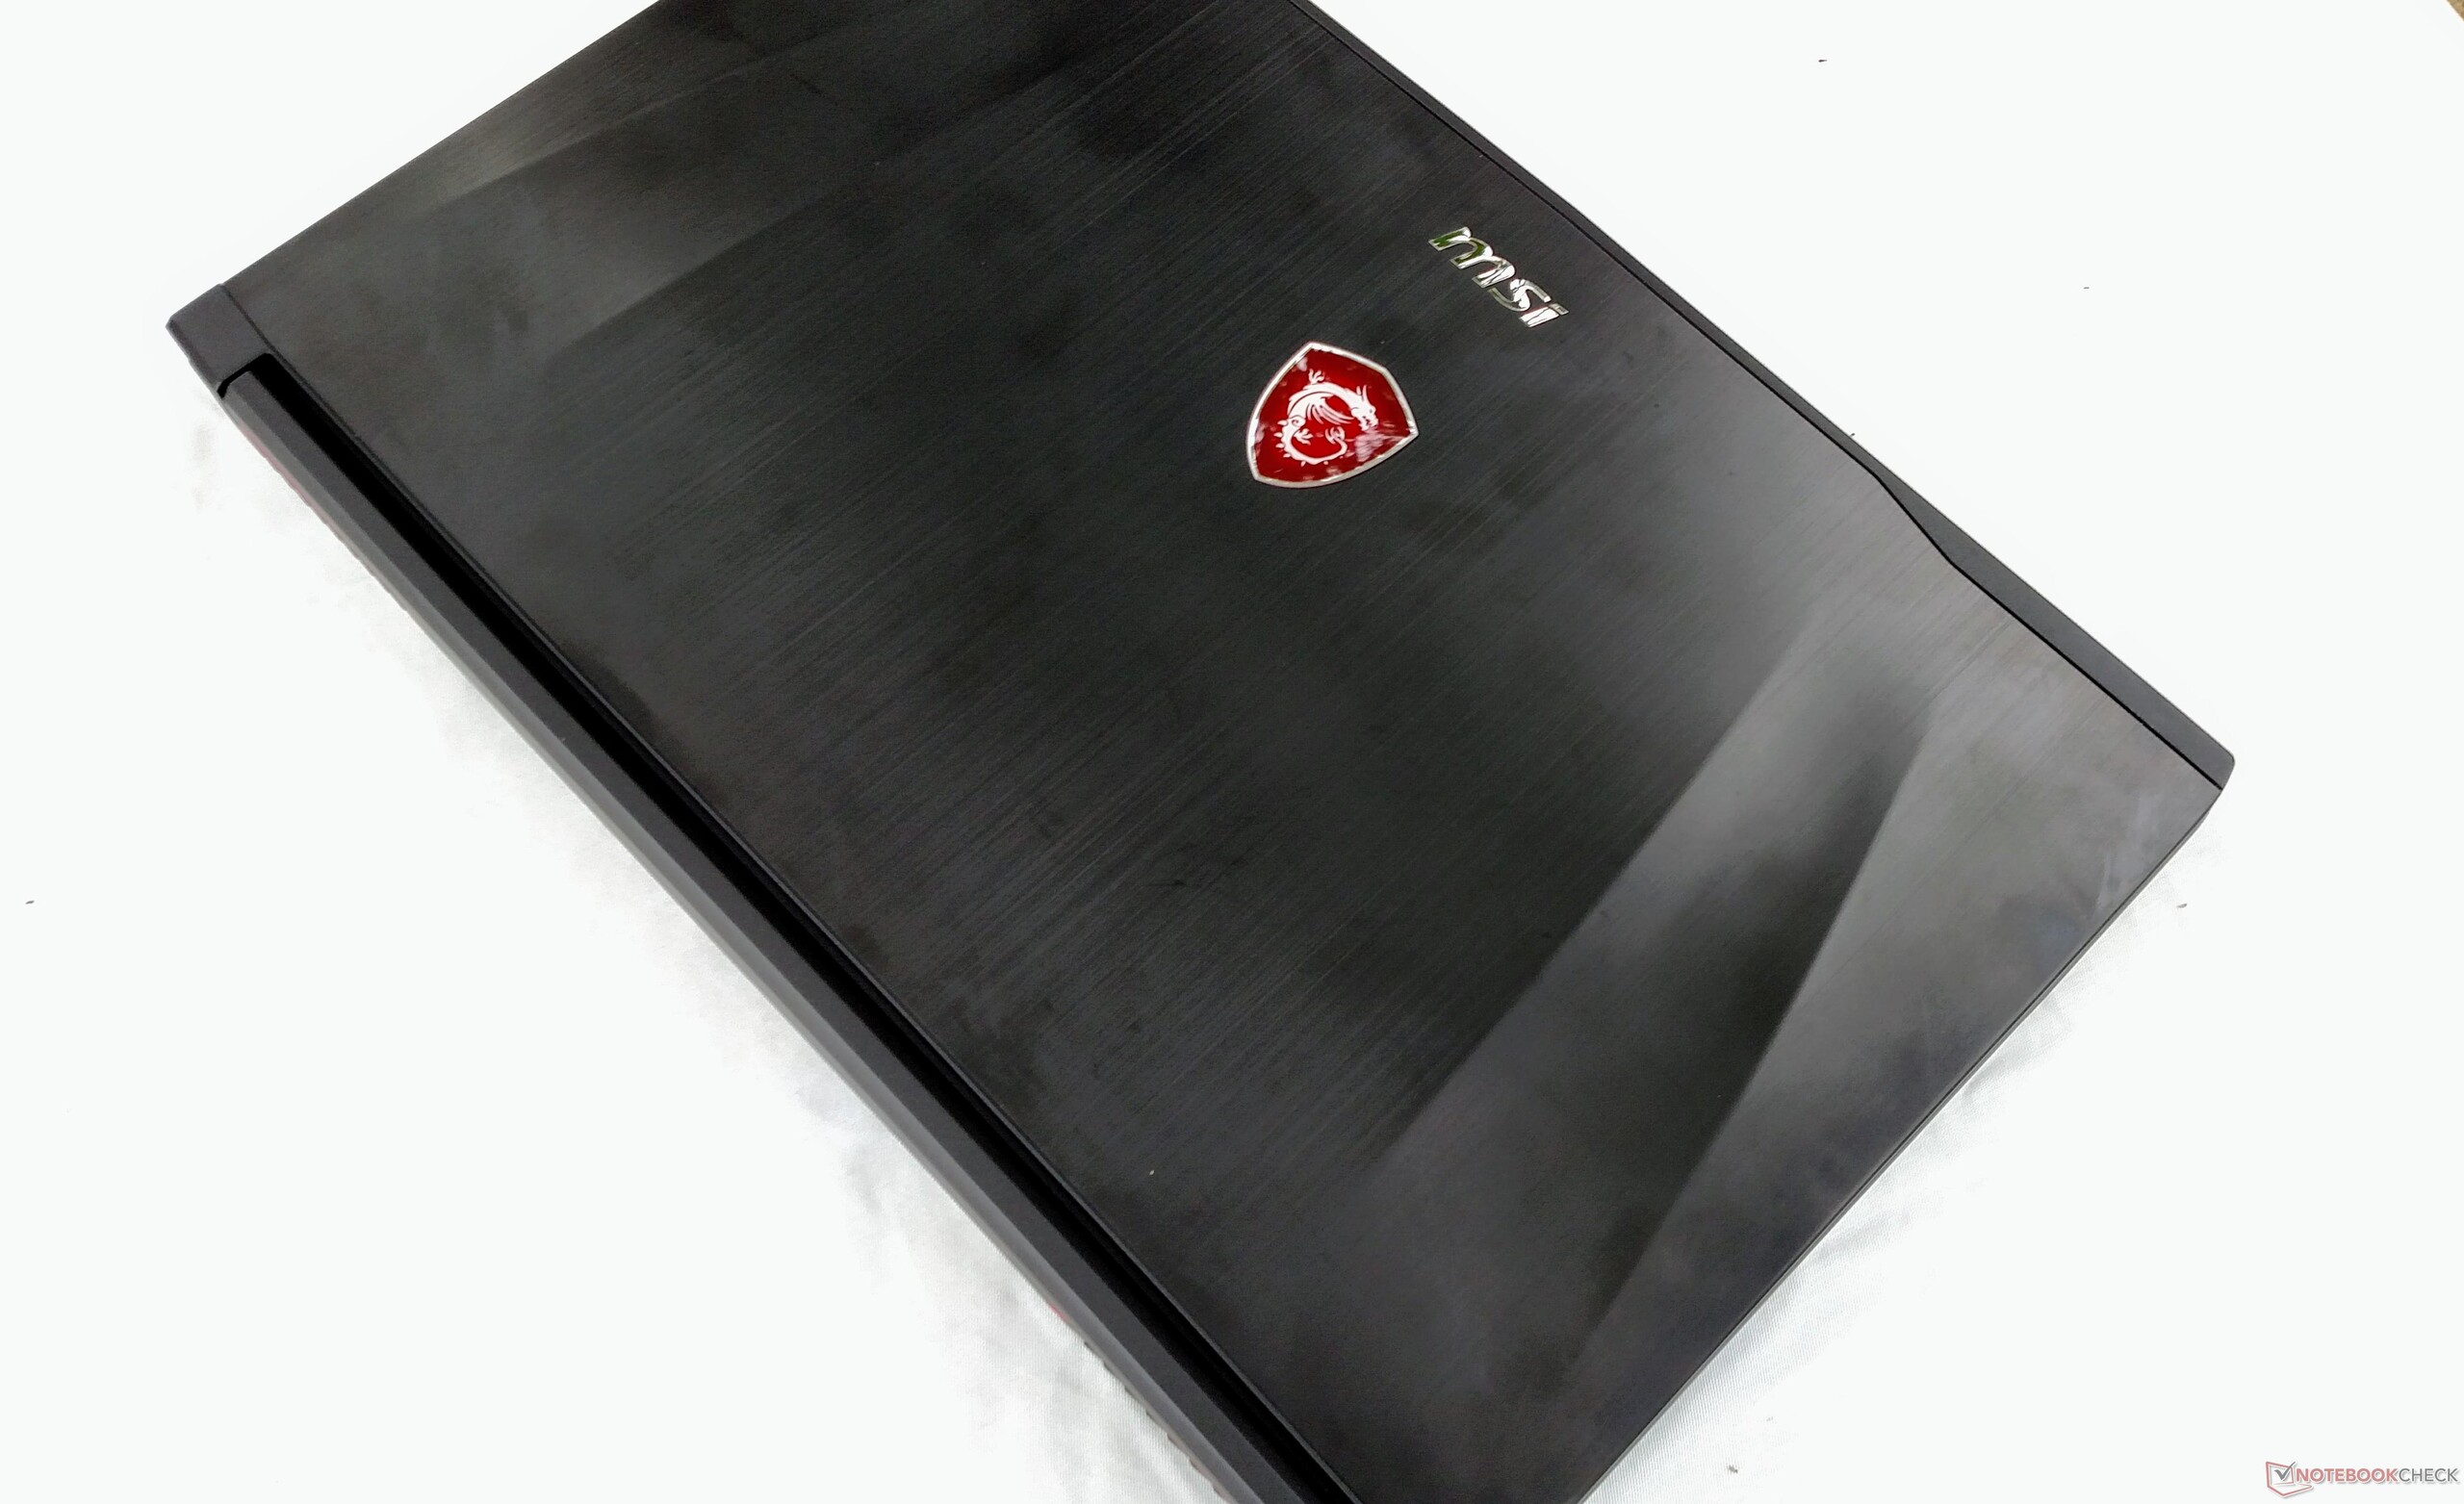
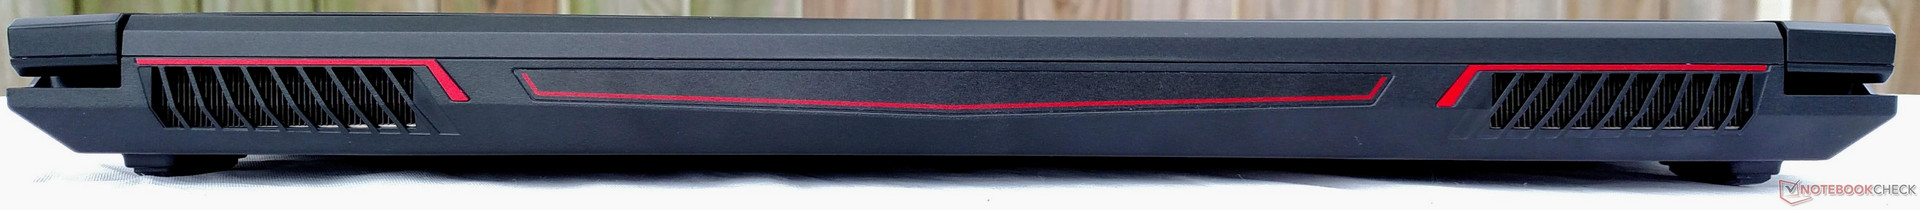
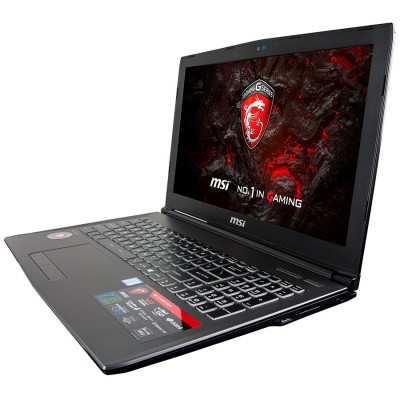
Courte critique du PC portable MSI GF62VR 7RF (7700HQ, GTX 1060, FHD 60 Hz)
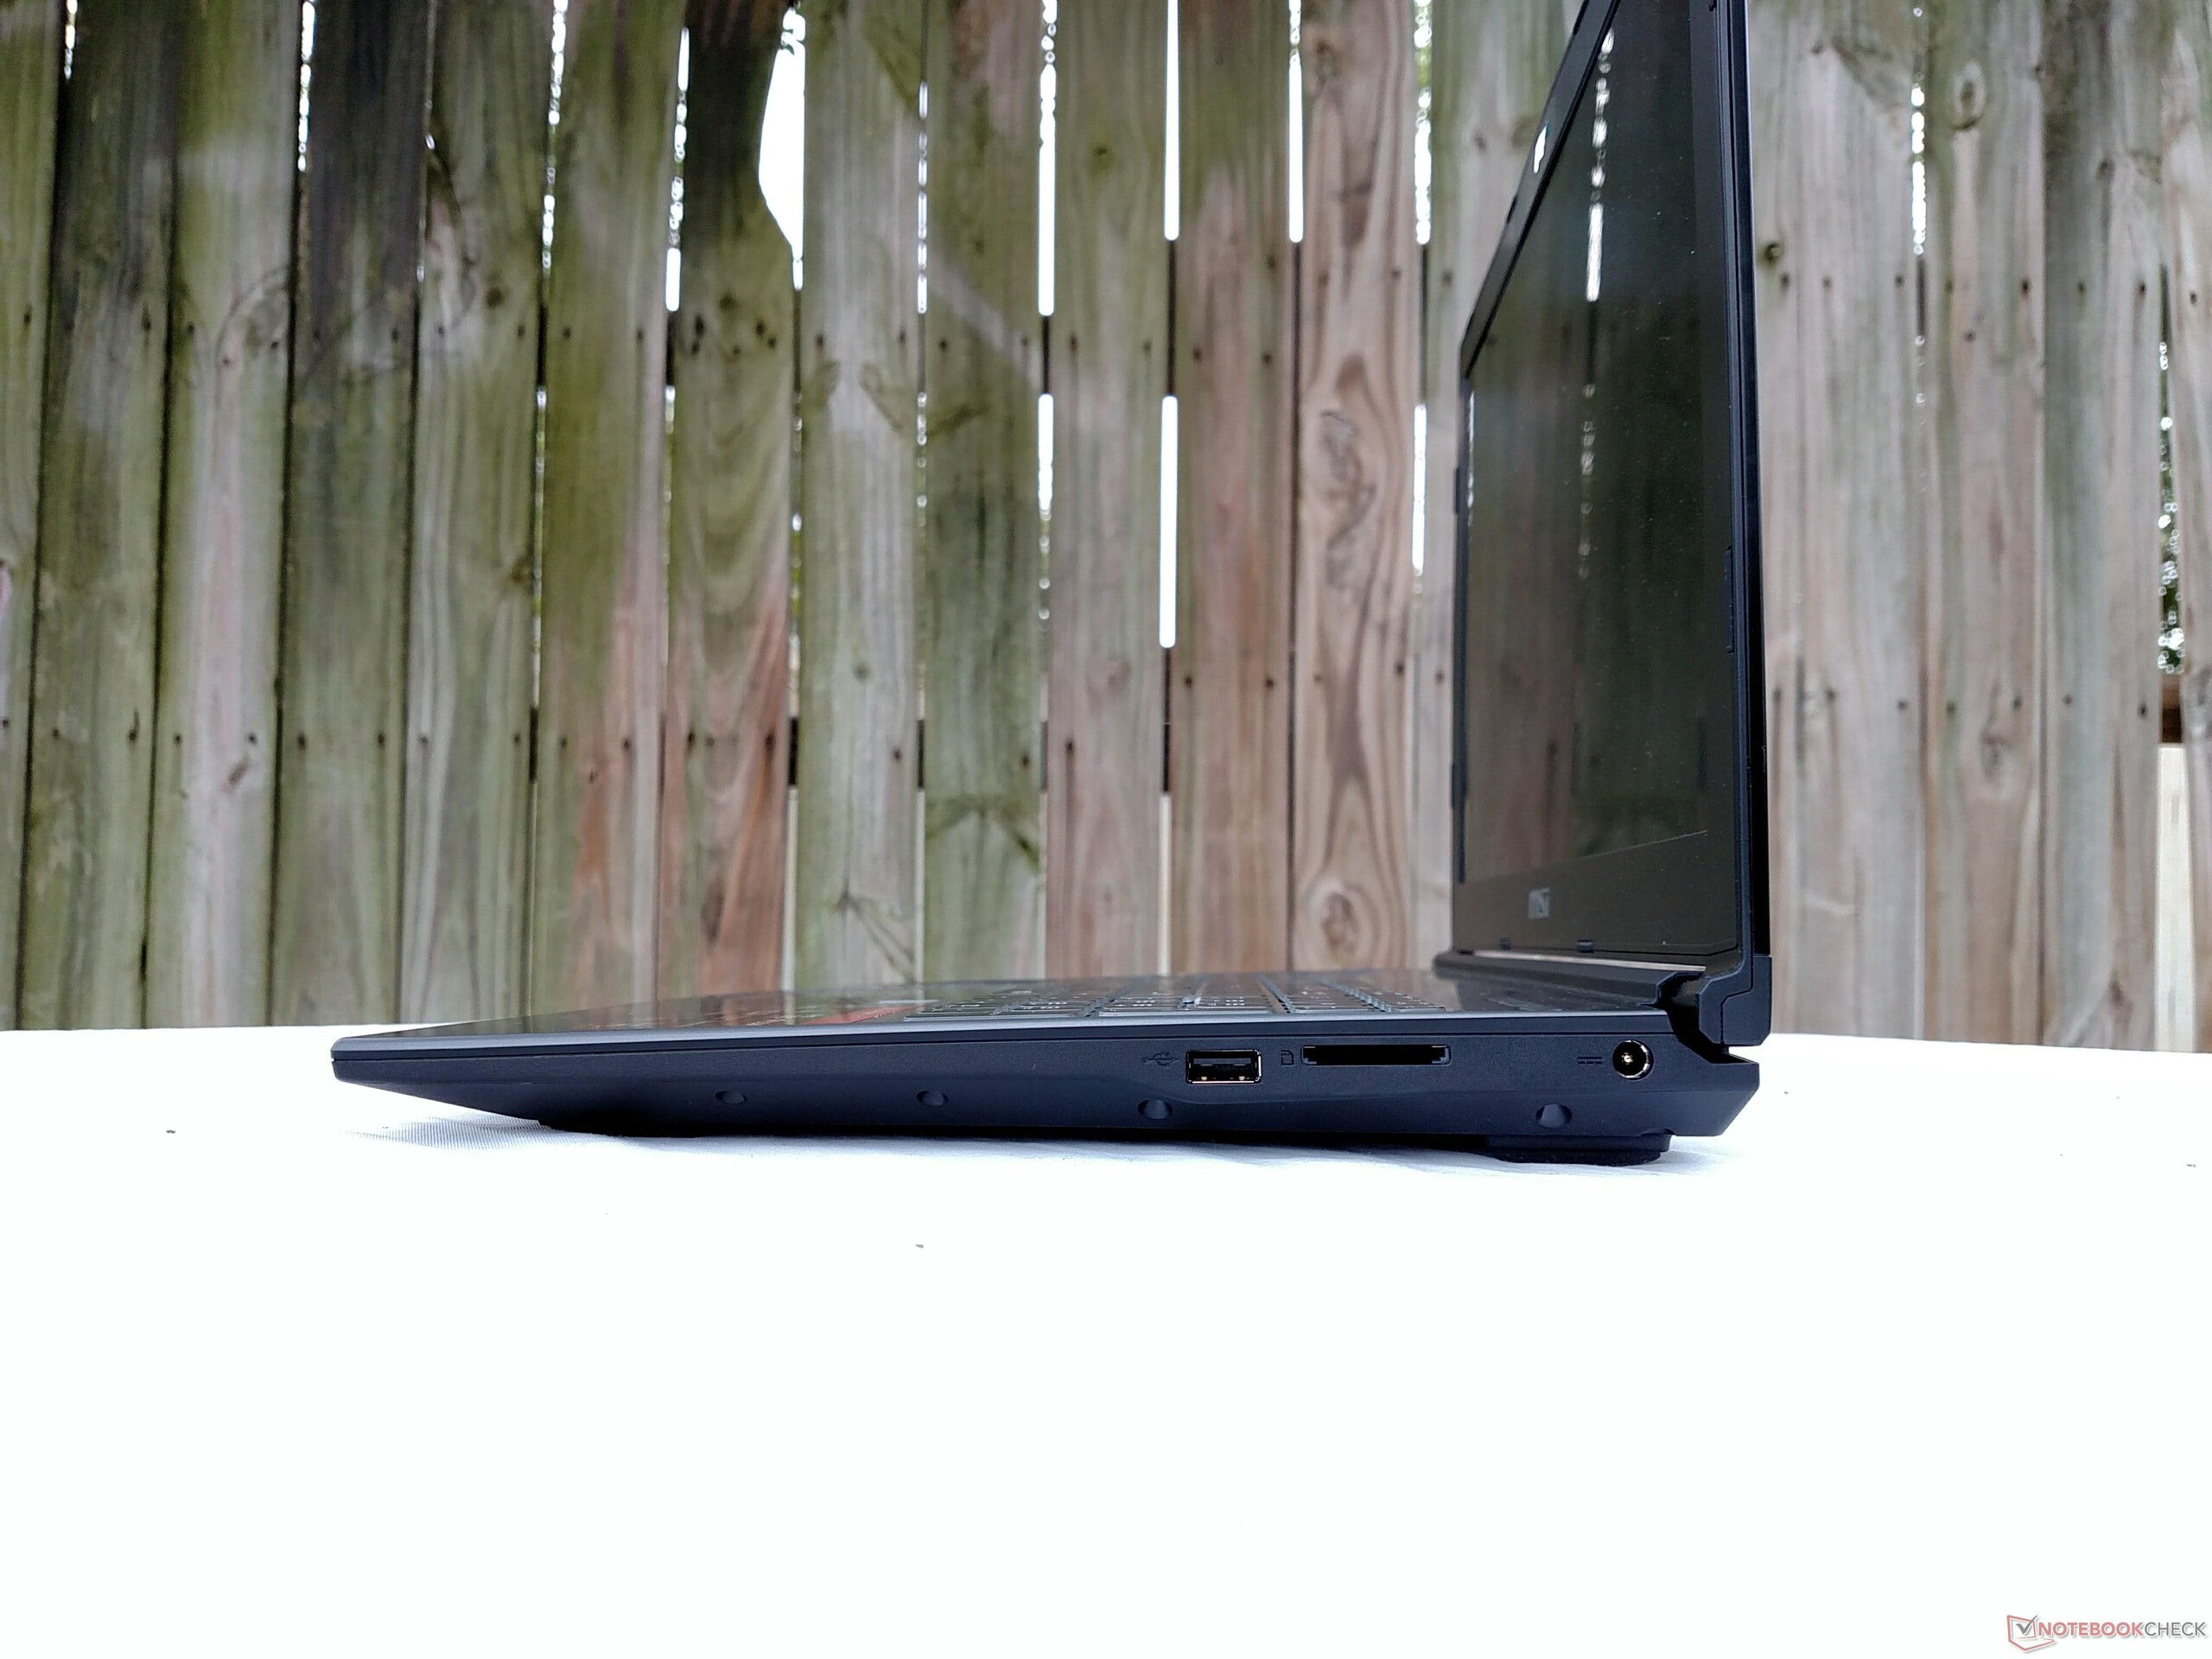
| SD Card Reader | |
| average JPG Copy Test (av. of 3 runs) | |
| Asus Strix GL502VM-DS74 | |
| Gigabyte Aero 15 | |
| Schenker XMG A517 | |
| HP Omen 15-ce002ng | |
| Gigabyte P55W v7 | |
| MSI GF62VR 7RF-877 | |
| MSI GE62VR 6RF-001US | |
| maximum AS SSD Seq Read Test (1GB) | |
| Asus Strix GL502VM-DS74 | |
| Gigabyte Aero 15 | |
| Gigabyte P55W v7 | |
| Schenker XMG A517 | |
| HP Omen 15-ce002ng | |
| MSI GF62VR 7RF-877 | |
| MSI GE62VR 6RF-001US | |
| |||||||||||||||||||||||||
Homogénéité de la luminosité: 88 %
Valeur mesurée au centre, sur batterie: 223.9 cd/m²
Contraste: 400:1 (Valeurs des noirs: 0.56 cd/m²)
ΔE ColorChecker Calman: 9.7 | ∀{0.5-29.43 Ø4.73}
ΔE Greyscale Calman: 12.9 | ∀{0.09-98 Ø4.97}
100% sRGB (Argyll 1.6.3 3D)
75% AdobeRGB 1998 (Argyll 1.6.3 3D)
83.9% AdobeRGB 1998 (Argyll 3D)
99.9% sRGB (Argyll 3D)
85.6% Display P3 (Argyll 3D)
Gamma: 2.18
CCT: 15225 K
| MSI GF62VR 7RF-877 Chi Mei N156HGA-EAL, TN LED, 15.6", 1920x1080 | MSI GE62VR 6RF-001US IPS, 15.6", 1920x1080 | Schenker XMG A517 LG Philips LP156WF6 (LGD046F), IPS, 15.6", 1920x1080 | Gigabyte Aero 15 N156HCA-EA1 (CMN15D7), IPS, 15.6", 1920x1080 | Gigabyte P55W v7 LG Philips LP156WF6 (LGD046F), IPS, 15.6", 1920x1080 | Asus Strix GL502VM-DS74 IPS, 15.6", 1920x1080 | HP Omen 15-ce002ng AUO42ED, IPS, 15.6", 1920x1080 | Samsung Odyssey NP800G5M-X01US IPS, 15.6", 1920x1080 | |
|---|---|---|---|---|---|---|---|---|
| Display | -22% | -22% | -17% | -24% | -22% | -18% | -39% | |
| Display P3 Coverage (%) | 85.6 | 65.6 -23% | 65 -24% | 65.2 -24% | 63.5 -26% | 64.8 -24% | 65.8 -23% | 47.11 -45% |
| sRGB Coverage (%) | 99.9 | 84.3 -16% | 85.1 -15% | 92.5 -7% | 82 -18% | 84.9 -15% | 90.9 -9% | 70.4 -30% |
| AdobeRGB 1998 Coverage (%) | 83.9 | 61.7 -26% | 62.2 -26% | 66.5 -21% | 59.9 -29% | 62 -26% | 66.5 -21% | 48.71 -42% |
| Response Times | 9% | 15% | -9% | 12% | -10% | -8% | -8% | |
| Response Time Grey 50% / Grey 80% * (ms) | 49.6 ? | 36.8 ? 26% | 36 ? 27% | 42.8 ? 14% | 37 ? 25% | 42 ? 15% | 43.2 ? 13% | 38.8 ? 22% |
| Response Time Black / White * (ms) | 24.4 ? | 26.4 ? -8% | 24 ? 2% | 32 ? -31% | 25 ? -2% | 32.8 ? -34% | 31.2 ? -28% | 33.6 ? -38% |
| PWM Frequency (Hz) | 25510 ? | 21000 ? | 26000 ? | 19230 ? | ||||
| Screen | 63% | 38% | 38% | 38% | 40% | 50% | 11% | |
| Brightness middle (cd/m²) | 223.9 | 302 35% | 320 43% | 320 43% | 287 28% | 307.8 37% | 304 36% | 255.9 14% |
| Brightness (cd/m²) | 208 | 303 46% | 311 50% | 316 52% | 289 39% | 301 45% | 289 39% | 249 20% |
| Brightness Distribution (%) | 88 | 87 -1% | 90 2% | 90 2% | 87 -1% | 88 0% | 86 -2% | 90 2% |
| Black Level * (cd/m²) | 0.56 | 0.169 70% | 0.36 36% | 0.36 36% | 0.29 48% | 0.33 41% | 0.26 54% | 0.48 14% |
| Contrast (:1) | 400 | 1787 347% | 889 122% | 889 122% | 990 148% | 933 133% | 1169 192% | 533 33% |
| Colorchecker dE 2000 * | 9.7 | 4.61 52% | 5.08 48% | 4.62 52% | 4.92 49% | 4.5 54% | 3.46 64% | 5.9 39% |
| Colorchecker dE 2000 max. * | 19.7 | 9.98 49% | 10.73 46% | 9.75 51% | 11 44% | 10 49% | 7.72 61% | 18.9 4% |
| Greyscale dE 2000 * | 12.9 | 3.32 74% | 4.04 69% | 6 53% | 3.66 72% | 2.9 78% | 2.46 81% | 5.6 57% |
| Gamma | 2.18 101% | 2.24 98% | 2.34 94% | 2.46 89% | 2.32 95% | 2.22 99% | 2.38 92% | 2.21 100% |
| CCT | 15225 43% | 6358 102% | 7029 92% | 6761 96% | 6482 100% | 1136 572% | 6915 94% | 7250 90% |
| Color Space (Percent of AdobeRGB 1998) (%) | 75 | 55.4 -26% | 56 -25% | 60 -20% | 54 -28% | 55.4 -26% | 59 -21% | 44.8 -40% |
| Color Space (Percent of sRGB) (%) | 100 | 84.4 -16% | 85 -15% | 92 -8% | 82 -18% | 84.8 -15% | 91 -9% | 70.1 -30% |
| Moyenne finale (programmes/paramètres) | 17% /
39% | 10% /
23% | 4% /
21% | 9% /
22% | 3% /
21% | 8% /
28% | -12% /
-1% |
* ... Moindre est la valeur, meilleures sont les performances
Temps de réponse de l'écran
| ↔ Temps de réponse noir à blanc | ||
|---|---|---|
| 24.4 ms ... hausse ↗ et chute ↘ combinées | ↗ 20 ms hausse | 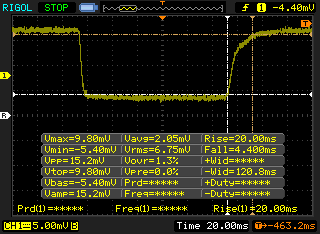 |
| ↘ 4.4 ms chute | ||
| L'écran montre de bons temps de réponse, mais insuffisant pour du jeu compétitif. En comparaison, tous les appareils testés affichent entre 0.1 (minimum) et 240 (maximum) ms. » 57 % des appareils testés affichent de meilleures performances. Cela signifie que les latences relevées sont moins bonnes que la moyenne (19.9 ms) de tous les appareils testés. | ||
| ↔ Temps de réponse gris 50% à gris 80% | ||
| 49.6 ms ... hausse ↗ et chute ↘ combinées | ↗ 24.8 ms hausse | 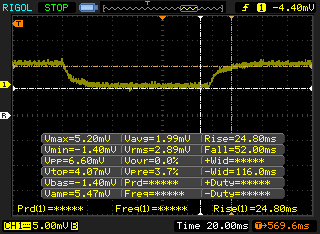 |
| ↘ 24.8 ms chute | ||
| L'écran souffre de latences très élevées, à éviter pour le jeu. En comparaison, tous les appareils testés affichent entre 0.165 (minimum) et 636 (maximum) ms. » 85 % des appareils testés affichent de meilleures performances. Cela signifie que les latences relevées sont moins bonnes que la moyenne (31.1 ms) de tous les appareils testés. | ||
Scintillement / MLI (Modulation de largeur d'impulsion)
| Scintillement / MLI (Modulation de largeur d'impulsion) décelé | 25510 Hz | ≤ 20 Niveau de luminosité | 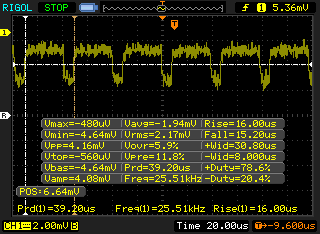 |
Le rétroéclairage de l'écran scintille à la fréquence de 25510 Hz (certainement du fait de l'utilisation d'une MDI - Modulation de largeur d'impulsion) à un niveau de luminosité inférieur ou égal à 20 % . Aucun scintillement ne devrait être perceptible au-dessus de cette valeur. La fréquence de rafraîchissement de 25510 Hz est élevée, la grande majorité des utilisateurs ne devrait pas percevoir de scintillements et être sujette à une fatigue oculaire accrue. En comparaison, 52 % des appareils testés n'emploient pas MDI pour assombrir leur écran. Nous avons relevé une moyenne à 7798 (minimum : 5 - maximum : 343500) Hz dans le cas où une MDI était active. | |||
| Cinebench R15 | |
| CPU Single 64Bit | |
| Aorus X9 | |
| Alienware 15 R3 Max-Q | |
| Lenovo Legion Y920-17IKB | |
| HP Omen 15-ce002ng | |
| Asus Strix GL502VM-DS74 | |
| Gigabyte P55W v7 | |
| Samsung Odyssey NP800G5M-X01US | |
| Lenovo Legion Y520-15IKBM 80YY001APB | |
| Acer Aspire VX15 VX5-591G-589S | |
| MSI GF62VR 7RF-877 | |
| Dell Inspiron 15 7566 PL | |
| MSI GE62VR 6RF-001US | |
| CPU Multi 64Bit | |
| Aorus X9 | |
| Lenovo Legion Y920-17IKB | |
| Lenovo Legion Y920-17IKB | |
| Alienware 15 R3 Max-Q | |
| Asus Strix GL502VM-DS74 | |
| HP Omen 15-ce002ng | |
| Samsung Odyssey NP800G5M-X01US | |
| MSI GF62VR 7RF-877 | |
| Gigabyte P55W v7 | |
| Dell Inspiron 15 7566 PL | |
| MSI GE62VR 6RF-001US | |
| Lenovo Legion Y520-15IKBM 80YY001APB | |
| Acer Aspire VX15 VX5-591G-589S | |
| Cinebench R10 | |
| Rendering Multiple CPUs 32Bit | |
| Alienware 15 R3 Max-Q | |
| Samsung Odyssey NP800G5M-X01US | |
| Asus Strix GL502VM-DS74 | |
| HP Omen 15-ce002ng | |
| MSI GF62VR 7RF-877 | |
| MSI GE62VR 6RF-001US | |
| Acer Aspire VX15 VX5-591G-589S | |
| Rendering Single 32Bit | |
| Alienware 15 R3 Max-Q | |
| Asus Strix GL502VM-DS74 | |
| Samsung Odyssey NP800G5M-X01US | |
| HP Omen 15-ce002ng | |
| MSI GF62VR 7RF-877 | |
| Acer Aspire VX15 VX5-591G-589S | |
| MSI GE62VR 6RF-001US | |
| wPrime 2.10 - 1024m | |
| Lenovo Legion Y520-15IKBM 80YY001APB | |
| Lenovo Legion Y920-17IKB | |
| Dell Inspiron 15 7566 PL | |
| MSI GE62VR 6RF-001US | |
| MSI GF62VR 7RF-877 | |
| Asus Strix GL502VM-DS74 | |
| Samsung Odyssey NP800G5M-X01US | |
* ... Moindre est la valeur, meilleures sont les performances
| PCMark 8 | |
| Home Score Accelerated v2 | |
| Lenovo Legion Y920-17IKB | |
| Alienware 15 R3 Max-Q | |
| Aorus X9 | |
| Asus Strix GL502VM-DS74 | |
| HP Omen 15-ce002ng | |
| Asus FX502VM-AS73 | |
| MSI GS63VR 7RF-228US | |
| MSI GF62VR 7RF-877 | |
| MSI GE62VR 6RF-001US | |
| Gigabyte P55W v7 | |
| Acer Aspire VX15 VX5-591G-589S | |
| Work Score Accelerated v2 | |
| Lenovo Legion Y920-17IKB | |
| Asus Strix GL502VM-DS74 | |
| HP Omen 15-ce002ng | |
| Gigabyte P55W v7 | |
| Alienware 15 R3 Max-Q | |
| MSI GS63VR 7RF-228US | |
| Aorus X9 | |
| MSI GF62VR 7RF-877 | |
| MSI GE62VR 6RF-001US | |
| Asus FX502VM-AS73 | |
| Creative Score Accelerated v2 | |
| Alienware 15 R3 Max-Q | |
| Lenovo Legion Y920-17IKB | |
| Asus Strix GL502VM-DS74 | |
| Asus FX502VM-AS73 | |
| MSI GS63VR 7RF-228US | |
| MSI GE62VR 6RF-001US | |
| MSI GF62VR 7RF-877 | |
| PCMark 8 Home Score Accelerated v2 | 4069 points | |
| PCMark 8 Creative Score Accelerated v2 | 5136 points | |
| PCMark 8 Work Score Accelerated v2 | 5090 points | |
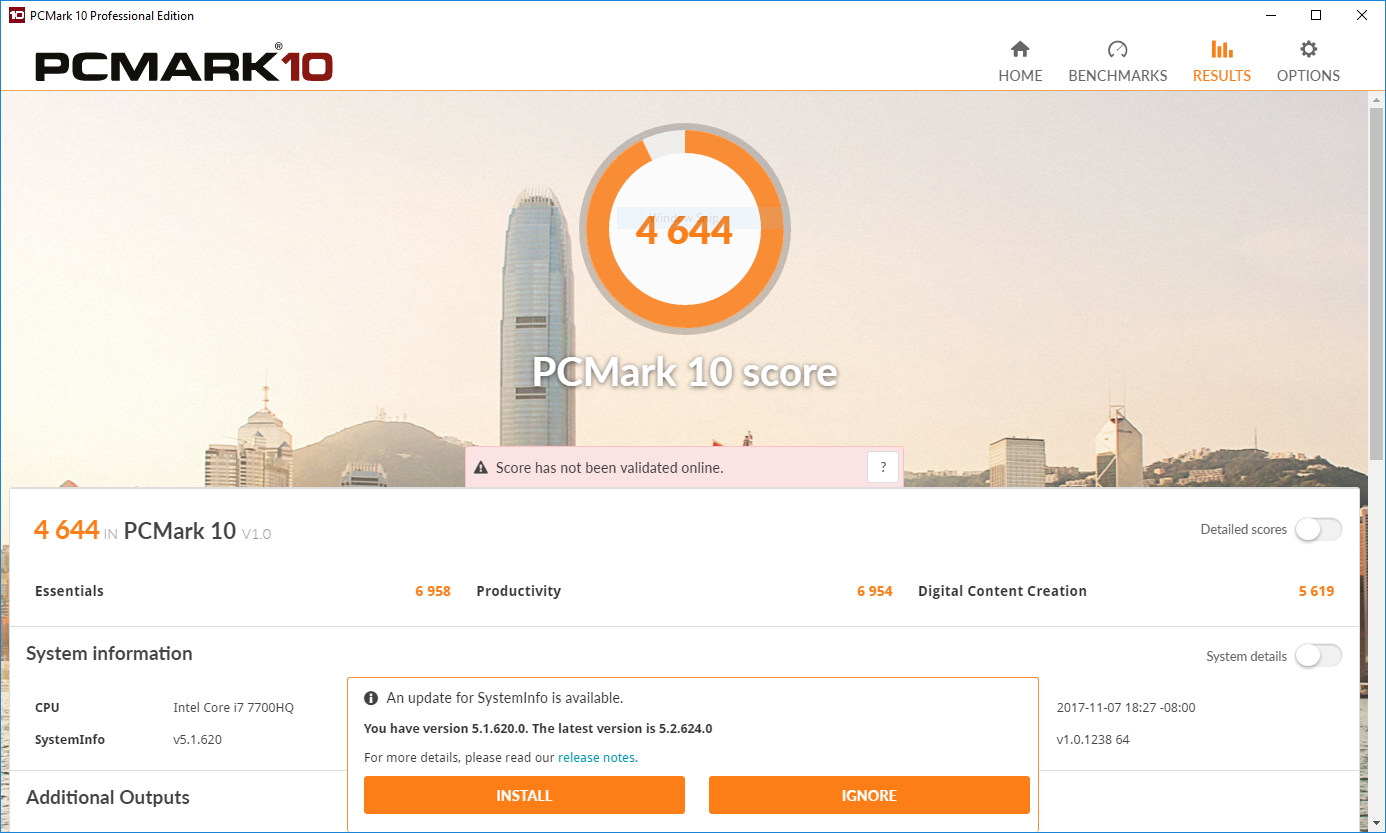
| PCMark 10 Score | 4644 points | |
Aide | ||
| MSI GF62VR 7RF-877 Intel SSD 600p SSDPEKKW256G7 | MSI GE62VR 6RF-001US Samsung SM951 MZVPV512HDGL m.2 PCI-e | Lenovo Legion Y520-15IKBM 80YY001APB ADATA SX7000NP 256 GB | Schenker XMG A517 Samsung SSD 960 Evo 500GB m.2 NVMe | Gigabyte P55W v7 Liteonit CV3-8D256 | Asus Strix GL502VM-DS74 Samsung SSD 960 Evo 250GB m.2 NVMe | Samsung Odyssey NP800G5M-X01US Samsung PM961 NVMe MZVLW128HEGR | Dell Inspiron 15 7566 PL Toshiba SG5 THNSNK128GVN8 | Acer Aspire VX15 VX5-591G-589S Hynix HFS128G39TND | |
|---|---|---|---|---|---|---|---|---|---|
| AS SSD | 93% | 4% | 180% | -41% | 39% | 33% | -50% | -89% | |
| Copy Game MB/s (MB/s) | 471.7 | 898 90% | 1100 133% | 240.5 -49% | 157.6 -67% | ||||
| Copy Program MB/s (MB/s) | 286.5 | 403.5 41% | 483.6 69% | 299.5 5% | 111.1 -61% | ||||
| Copy ISO MB/s (MB/s) | 1069 | 1225 15% | 1599 50% | 1560 46% | 195 -82% | ||||
| Score Total (Points) | 1324 | 2572 94% | 898 -32% | 4063 207% | 840 -37% | 3501 164% | 1592 20% | 710 -46% | 882 -33% |
| Score Write (Points) | 693 | 581 -16% | 291 -58% | 1575 127% | 248 -64% | 1028 48% | 376 -46% | 218 -69% | 218 -69% |
| Score Read (Points) | 448 | 1327 196% | 409 -9% | 1677 274% | 393 -12% | 1670 273% | 852 90% | 332 -26% | 444 -1% |
| Access Time Write * (ms) | 0.03 | 0.038 -27% | 0.033 -10% | 0.026 13% | 0.083 -177% | 0.3 -900% | 0.031 -3% | 0.08 -167% | 0.261 -770% |
| Access Time Read * (ms) | 0.09 | 0.039 57% | 0.069 23% | 0.036 60% | 0.088 2% | 0.41 -356% | 0.066 27% | 0.099 -10% | 0.077 14% |
| 4K-64 Write (MB/s) | 551 | 329.8 -40% | 100.7 -82% | 1263 129% | 166.6 -70% | 768 39% | 176.4 -68% | 111.8 -80% | 113.9 -79% |
| 4K-64 Read (MB/s) | 280.1 | 1092 290% | 255.9 -9% | 1359 385% | 318.3 14% | 1375 391% | 564 101% | 256.9 -8% | 361.4 29% |
| 4K Write (MB/s) | 118.3 | 103 -13% | 110.6 -7% | 147 24% | 48.47 -59% | 118 0% | 124.1 5% | 92.6 -22% | 90.8 -23% |
| 4K Read (MB/s) | 31.27 | 44.04 41% | 30.9 -1% | 48 54% | 23.34 -25% | 44.55 42% | 44.75 43% | 25.39 -19% | 32.29 3% |
| Seq Write (MB/s) | 234.9 | 1480 530% | 795 238% | 1662 608% | 328.1 40% | 1424 506% | 752 220% | 134.1 -43% | 130.2 -45% |
| Seq Read (MB/s) | 1371 | 1912 39% | 1221 -11% | 2694 96% | 514 -63% | 2505 83% | 2433 77% | 493.2 -64% | 507 -63% |
* ... Moindre est la valeur, meilleures sont les performances

| 3DMark | |
| 1280x720 Cloud Gate Standard Graphics | |
| Aorus X9 | |
| MSI GT75VR 7RF-012 Titan Pro | |
| Alienware 15 R3 Max-Q | |
| MSI GF62VR 7RF-877 | |
| Asus Strix GL502VM-DS74 | |
| Lenovo Legion Y920-17IKB | |
| MSI GE62VR 6RF-001US | |
| Lenovo Legion Y520-15IKBM 80YY001APB | |
| Gigabyte P55W v7 | |
| Acer Predator 15 G9-592-7925 | |
| Acer Aspire Nitro BE VN7-793G-5811 | |
| Asus Strix GL502VT-DS74 | |
| Samsung Odyssey NP800G5M-X01US | |
| 1920x1080 Fire Strike Graphics | |
| Aorus X9 | |
| MSI GT75VR 7RF-012 Titan Pro | |
| Alienware 15 R3 Max-Q | |
| Lenovo Legion Y920-17IKB | |
| MSI GF62VR 7RF-877 | |
| MSI GE62VR 6RF-001US | |
| Gigabyte P55W v7 | |
| Asus Strix GL502VM-DS74 | |
| Lenovo Legion Y520-15IKBM 80YY001APB | |
| Acer Aspire Nitro BE VN7-793G-5811 | |
| Acer Predator 15 G9-592-7925 | |
| Asus Strix GL502VT-DS74 | |
| Samsung Odyssey NP800G5M-X01US | |
| 1920x1080 Ice Storm Extreme Graphics | |
| Alienware 15 R3 Max-Q | |
| Asus Strix GL502VM-DS74 | |
| Acer Aspire Nitro BE VN7-793G-5811 | |
| MSI GF62VR 7RF-877 | |
| Asus Strix GL502VT-DS74 | |
| Samsung Odyssey NP800G5M-X01US | |
| MSI GE62VR 6RF-001US | |
| Lenovo Legion Y520-15IKBM 80YY001APB | |
| 3DMark 11 | |
| 1280x720 Performance GPU | |
| Aorus X9 | |
| MSI GT75VR 7RF-012 Titan Pro | |
| Alienware 15 R3 Max-Q | |
| Lenovo Legion Y920-17IKB | |
| MSI GE62VR 6RF-001US | |
| Gigabyte P55W v7 | |
| Asus Strix GL502VM-DS74 | |
| Lenovo Legion Y520-15IKBM 80YY001APB | |
| Acer Aspire Nitro BE VN7-793G-5811 | |
| Acer Predator 15 G9-592-7925 | |
| Asus Strix GL502VT-DS74 | |
| Acer Aspire VX15 VX5-591G-589S | |
| Samsung Odyssey NP800G5M-X01US | |
| 1280x720 Performance Combined | |
| Aorus X9 | |
| MSI GT75VR 7RF-012 Titan Pro | |
| Alienware 15 R3 Max-Q | |
| Lenovo Legion Y920-17IKB | |
| Asus Strix GL502VM-DS74 | |
| Acer Predator 15 G9-592-7925 | |
| MSI GE62VR 6RF-001US | |
| Asus Strix GL502VT-DS74 | |
| Samsung Odyssey NP800G5M-X01US | |
| Gigabyte P55W v7 | |
| Acer Aspire Nitro BE VN7-793G-5811 | |
| Lenovo Legion Y520-15IKBM 80YY001APB | |
| Acer Aspire VX15 VX5-591G-589S | |
| 3DMark Ice Storm Standard Score | 116682 points | |
| 3DMark Cloud Gate Standard Score | 25422 points | |
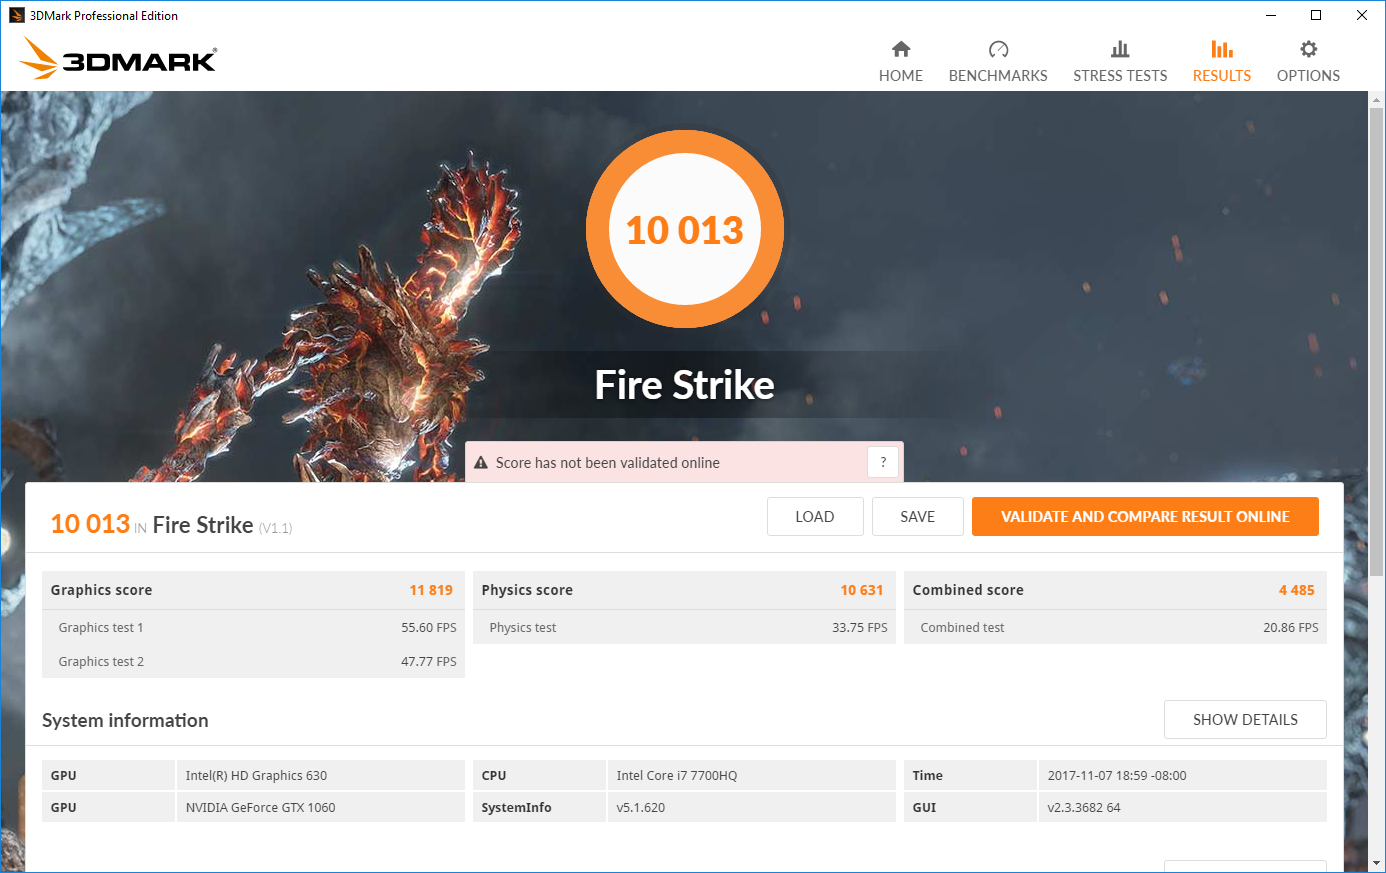
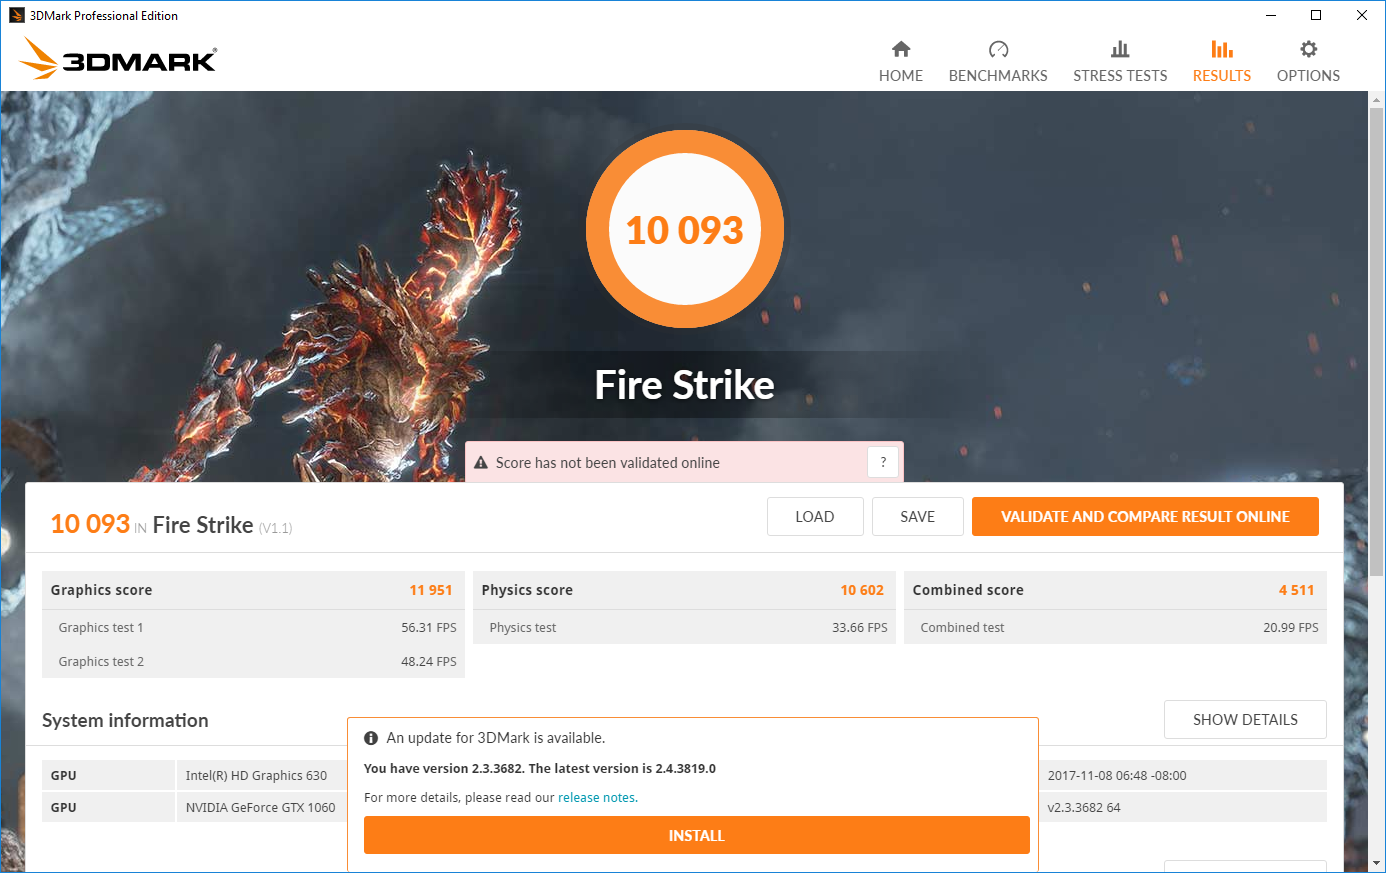
| 3DMark Fire Strike Score | 10093 points | |
| 3DMark Fire Strike Extreme Score | 5256 points | |
Aide | ||
| BioShock Infinite - 1920x1080 Ultra Preset, DX11 (DDOF) | |
| Alienware 15 R3 Max-Q | |
| Lenovo Legion Y920-17IKB | |
| MSI GF62VR 7RF-877 | |
| Asus FX502VM-AS73 | |
| MSI GS63VR 7RF-228US | |
| Hyperbook N85-7300-8-12-1060 | |
| MSI GE72VR-6RF16H21 | |
| MSI GE62VR 6RF-001US | |
| Lenovo Legion Y520-15IKBM 80YY001APB | |
| Acer Aspire Nitro BE VN7-793G-5811 | |
| Acer Aspire VX15 VX5-591G-589S | |
| Dell Inspiron 15 7566 PL | |
| Metro: Last Light - 1920x1080 Very High (DX11) AF:16x | |
| Lenovo Legion Y920-17IKB | |
| Asus FX502VM-AS73 | |
| MSI GS63VR 7RF-228US | |
| MSI GF62VR 7RF-877 | |
| MSI GE62VR 6RF-001US | |
| Thief - 1920x1080 Very High Preset AA:FXAA & High SS AF:8x | |
| Lenovo Legion Y920-17IKB | |
| Asus FX502VM-AS73 | |
| MSI GS63VR 7RF-228US | |
| MSI GF62VR 7RF-877 | |
| MSI GE62VR 6RF-001US | |
| Hyperbook N85-7300-8-12-1060 | |
| Lenovo Legion Y520-15IKBM 80YY001APB | |
| Dell Inspiron 15 7566 PL | |
| The Witcher 3 | |
| 1920x1080 Ultra Graphics & Postprocessing (HBAO+) | |
| Aorus X9 | |
| Alienware 15 R3 Max-Q | |
| Lenovo Legion Y920-17IKB | |
| Lenovo Legion Y920-17IKB | |
| MSI GS63VR 7RF-228US | |
| Hyperbook N85-7300-8-12-1060 | |
| MSI GF62VR 7RF-877 | |
| Gigabyte P55W v7 | |
| Gigabyte Aero 15 | |
| MSI GE72VR-6RF16H21 | |
| Lenovo Legion Y520-15IKBM 80YY001APB | |
| HP Omen 15-ce002ng | |
| Acer Aspire Nitro BE VN7-793G-5811 | |
| Dell Inspiron 15 7566 PL | |
| 1920x1080 High Graphics & Postprocessing (Nvidia HairWorks Off) | |
| Aorus X9 | |
| Alienware 15 R3 Max-Q | |
| MSI GS63VR 7RF-228US | |
| Gigabyte P55W v7 | |
| Gigabyte Aero 15 | |
| MSI GF62VR 7RF-877 | |
| MSI GE72VR-6RF16H21 | |
| HP Omen 15-ce002ng | |
| Hyperbook N85-7300-8-12-1060 | |
| Lenovo Legion Y520-15IKBM 80YY001APB | |
| Acer Aspire Nitro BE VN7-793G-5811 | |
| Dell Inspiron 15 7566 PL | |
| Fallout 4 | |
| 1920x1080 Ultra Preset AA:T AF:16x | |
| Asus FX502VM-AS73 | |
| MSI GF62VR 7RF-877 | |
| MSI GS63VR 7RF-228US | |
| MSI GE62VR 6RF-001US | |
| 1920x1080 High Preset AA:T AF:16x | |
| MSI GF62VR 7RF-877 | |
| Rise of the Tomb Raider | |
| 1920x1080 Very High Preset AA:FX AF:16x | |
| Lenovo Legion Y920-17IKB | |
| MSI GS63VR 7RF-228US | |
| Gigabyte P55W v7 | |
| Asus FX502VM-AS73 | |
| MSI GF62VR 7RF-877 | |
| MSI GE72VR-6RF16H21 | |
| MSI GE62VR 6RF-001US | |
| HP Omen 15-ce002ng | |
| 1920x1080 High Preset AA:FX AF:4x | |
| MSI GF62VR 7RF-877 | |
| Gigabyte P55W v7 | |
| MSI GE72VR-6RF16H21 | |
| HP Omen 15-ce002ng | |
| Hitman 2016 | |
| 1920x1080 Ultra / On AA:SM AF:16x | |
| MSI GF62VR 7RF-877 | |
| 1920x1080 High / On AA:FX AF:8x | |
| MSI GF62VR 7RF-877 | |
| Doom | |
| 1920x1080 Ultra Preset AA:SM | |
| Asus FX502VM-AS73 | |
| MSI GF62VR 7RF-877 | |
| MSI GS63VR 7RF-228US | |
| HP Omen 15-ce002ng | |
| MSI GE62VR 6RF-001US | |
| 1920x1080 High Preset AA:FX | |
| MSI GF62VR 7RF-877 | |
| HP Omen 15-ce002ng | |
| Rocket League | |
| 1920x1080 High Quality AA:High FX | |
| Aorus X9 | |
| MSI GF62VR 7RF-877 | |
| HP Omen 15-ce002ng | |
| 3840x2160 High Quality AA:High FX | |
| Aorus X9 | |
| MSI GF62VR 7RF-877 | |
| HP Omen 15-ce002ng | |
| 1920x1080 Quality AA:Medium FX | |
| MSI GF62VR 7RF-877 | |
| HP Omen 15-ce002ng | |
| Dirt 4 | |
| 3840x2160 Ultra Preset AF:16x | |
| MSI GF62VR 7RF-877 | |
| 1920x1080 Ultra Preset AA:4xMS AF:16x | |
| Aorus X9 | |
| MSI GF62VR 7RF-877 | |
| HP Omen 15-ce002ng | |
| 1920x1080 High Preset AA:2xMS AF:8x | |
| Aorus X9 | |
| MSI GF62VR 7RF-877 | |
| HP Omen 15-ce002ng | |
| Playerunknown's Battlegrounds (PUBG) | |
| 1920x1080 Ultra Preset | |
| Aorus X9 | |
| MSI GF62VR 7RF-877 | |
| 1920x1080 High Preset | |
| Aorus X9 | |
| MSI GF62VR 7RF-877 | |
| Bas | Moyen | Élevé | Ultra | 4K | |
|---|---|---|---|---|---|
| BioShock Infinite (2013) | 108 | ||||
| Metro: Last Light (2013) | 75 | ||||
| Thief (2014) | 71 | ||||
| The Witcher 3 (2015) | 68 | 39 | |||
| Batman: Arkham Knight (2015) | 86 | 61 | |||
| Metal Gear Solid V (2015) | 60 | 60 | |||
| Fallout 4 (2015) | 83 | 69 | |||
| Just Cause 3 (2015) | 79 | 70 | |||
| Rise of the Tomb Raider (2016) | 73 | 60 | |||
| Hitman 2016 (2016) | 58 | 51 | |||
| Ashes of the Singularity (2016) | 45 | ||||
| Doom (2016) | 99 | 93 | |||
| Mafia 3 (2016) | 48 | 40 | |||
| Farming Simulator 17 (2016) | 162 | 150 | |||
| Resident Evil 7 (2017) | 104 | 83 | |||
| Rocket League (2017) | 238 | 171 | 64 | ||
| Dirt 4 (2017) | 98 | 58 | 31 | ||
| Playerunknown's Battlegrounds (PUBG) (2017) | 69 | 53 |
Degré de la nuisance sonore
| Au repos |
| 33.5 / 33.5 / 33.5 dB(A) |
| Fortement sollicité |
| 41.3 / 53.5 dB(A) |
 | ||
30 dB silencieux 40 dB(A) audible 50 dB(A) bruyant |
||
min: | ||
| MSI GF62VR 7RF-877 GeForce GTX 1060 Mobile, i7-7700HQ, Intel SSD 600p SSDPEKKW256G7 | MSI GE62VR 6RF-001US GeForce GTX 1060 Mobile, 6700HQ, Samsung SM951 MZVPV512HDGL m.2 PCI-e | Gigabyte P55W v7 GeForce GTX 1060 Mobile, i7-7700HQ, Liteonit CV3-8D256 | Lenovo Legion Y520-15IKBM 80YY001APB GeForce GTX 1060 Max-Q, i5-7300HQ, ADATA SX7000NP 256 GB | Schenker XMG A517 GeForce GTX 1060 Mobile, i7-7700HQ, Samsung SSD 960 Evo 500GB m.2 NVMe | Gigabyte Aero 15 GeForce GTX 1060 Mobile, i7-7700HQ, Lite-On CX2-8B512-Q11 | Asus Strix GL502VM-DS74 GeForce GTX 1060 Mobile, i7-7700HQ, Samsung SSD 960 Evo 250GB m.2 NVMe | HP Omen 15-ce002ng GeForce GTX 1060 Max-Q, i7-7700HQ, Samsung PM961 MZVLW256HEHP | Samsung Odyssey NP800G5M-X01US GeForce GTX 1050 Mobile, i7-7700HQ, Samsung PM961 NVMe MZVLW128HEGR | |
|---|---|---|---|---|---|---|---|---|---|
| Noise | 0% | 0% | 6% | -1% | 3% | -2% | 2% | 5% | |
| arrêt / environnement * (dB) | 28.1 | 28.2 -0% | 30 -7% | 30 -7% | 31 -10% | 30.8 -10% | 30 -7% | 28.1 -0% | |
| Idle Minimum * (dB) | 33.5 | 32.8 2% | 33 1% | 30.5 9% | 30 10% | 32 4% | 32 4% | 30 10% | 28.1 16% |
| Idle Average * (dB) | 33.5 | 32.9 2% | 34 -1% | 33 1% | 35 -4% | 33 1% | 32 4% | 33 1% | 29.1 13% |
| Idle Maximum * (dB) | 33.5 | 32.9 2% | 35 -4% | 36.1 -8% | 40 -19% | 34 -1% | 32 4% | 37 -10% | 29.1 13% |
| Load Average * (dB) | 41.3 | 41.6 -1% | 39 6% | 39.4 5% | 43 -4% | 39 6% | 48.3 -17% | 41 1% | 49.2 -19% |
| Witcher 3 ultra * (dB) | 48.5 | 43 11% | 43 11% | 42 13% | |||||
| Load Maximum * (dB) | 53.5 | 55 -3% | 50 7% | 41.5 22% | 49 8% | 50 7% | 51.2 4% | 50 7% | 49.2 8% |
* ... Moindre est la valeur, meilleures sont les performances
(-) La température maximale du côté supérieur est de 48.2 °C / 119 F, par rapport à la moyenne de 40.4 °C / 105 F, allant de 21.2 à 68.8 °C pour la classe Gaming.
(-) Le fond chauffe jusqu'à un maximum de 46 °C / 115 F, contre une moyenne de 43.2 °C / 110 F
(+) En utilisation inactive, la température moyenne du côté supérieur est de 29.8 °C / 86 F, par rapport à la moyenne du dispositif de 33.9 °C / 93 F.
(±) En jouant à The Witcher 3, la température moyenne du côté supérieur est de 37.9 °C / 100 F, alors que la moyenne de l'appareil est de 33.9 °C / 93 F.
(-) Les repose-poignets et le pavé tactile peuvent devenir très chauds au toucher, avec un maximum de 44.2 °C / 111.6# F.
(-) La température moyenne de la zone de l'appui-paume de dispositifs similaires était de 28.8 °C / 83.8 F (-15.4 °C / #-27.8 F).
MSI GF62VR 7RF-877 analyse audio
(+) | les haut-parleurs peuvent jouer relativement fort (84.9# dB)
Basses 100 - 315 Hz
(-) | presque aucune basse - en moyenne 27.4% plus bas que la médiane
(±) | la linéarité des basses est moyenne (10.4% delta à la fréquence précédente)
Médiums 400 - 2000 Hz
(±) | médiane supérieure - en moyenne 8.5% supérieure à la médiane
(±) | la linéarité des médiums est moyenne (9.5% delta à la fréquence précédente)
Aiguës 2 - 16 kHz
(±) | sommets plus élevés - en moyenne 8% plus élevés que la médiane
(±) | la linéarité des aigus est moyenne (8% delta à la fréquence précédente)
Globalement 100 - 16 000 Hz
(-) | le son global n'est pas linéaire (31.8% de différence à la médiane)
Par rapport à la même classe
» 97% de tous les appareils testés de cette catégorie étaient meilleurs, 1% similaires, 2% pires
» Le meilleur avait un delta de 6%, la moyenne était de 18%, le pire était de 132%.
Par rapport à tous les appareils testés
» 91% de tous les appareils testés étaient meilleurs, 2% similaires, 7% pires
» Le meilleur avait un delta de 4%, la moyenne était de 24%, le pire était de 134%.
MSI GE62VR 6RF-001US analyse audio
(±) | le niveau sonore du haut-parleur est moyen mais bon (76.9# dB)
Basses 100 - 315 Hz
(±) | basse réduite - en moyenne 13.1% inférieure à la médiane
(±) | la linéarité des basses est moyenne (12% delta à la fréquence précédente)
Médiums 400 - 2000 Hz
(+) | médiane équilibrée - seulement 3% de la médiane
(±) | la linéarité des médiums est moyenne (12% delta à la fréquence précédente)
Aiguës 2 - 16 kHz
(+) | des sommets équilibrés - à seulement 4.4% de la médiane
(±) | la linéarité des aigus est moyenne (10.1% delta à la fréquence précédente)
Globalement 100 - 16 000 Hz
(±) | la linéarité du son global est moyenne (18.6% de différence avec la médiane)
Par rapport à la même classe
» 60% de tous les appareils testés de cette catégorie étaient meilleurs, 9% similaires, 31% pires
» Le meilleur avait un delta de 6%, la moyenne était de 18%, le pire était de 132%.
Par rapport à tous les appareils testés
» 42% de tous les appareils testés étaient meilleurs, 8% similaires, 50% pires
» Le meilleur avait un delta de 4%, la moyenne était de 24%, le pire était de 134%.
| Éteint/en veille | |
| Au repos | |
| Fortement sollicité |
|
Légende:
min: | |
| MSI GF62VR 7RF-877 i7-7700HQ, GeForce GTX 1060 Mobile, Intel SSD 600p SSDPEKKW256G7, TN LED, 1920x1080, 15.6" | MSI GE62VR 6RF-001US 6700HQ, GeForce GTX 1060 Mobile, Samsung SM951 MZVPV512HDGL m.2 PCI-e, IPS, 1920x1080, 15.6" | Gigabyte P55W v7 i7-7700HQ, GeForce GTX 1060 Mobile, Liteonit CV3-8D256, IPS, 1920x1080, 15.6" | Lenovo Legion Y520-15IKBM 80YY001APB i5-7300HQ, GeForce GTX 1060 Max-Q, ADATA SX7000NP 256 GB, IPS, 1920x1080, 15.6" | Schenker XMG A517 i7-7700HQ, GeForce GTX 1060 Mobile, Samsung SSD 960 Evo 500GB m.2 NVMe, IPS, 1920x1080, 15.6" | Gigabyte Aero 15 i7-7700HQ, GeForce GTX 1060 Mobile, Lite-On CX2-8B512-Q11, IPS, 1920x1080, 15.6" | Asus Strix GL502VM-DS74 i7-7700HQ, GeForce GTX 1060 Mobile, Samsung SSD 960 Evo 250GB m.2 NVMe, IPS, 1920x1080, 15.6" | HP Omen 15-ce002ng i7-7700HQ, GeForce GTX 1060 Max-Q, Samsung PM961 MZVLW256HEHP, IPS, 1920x1080, 15.6" | Samsung Odyssey NP800G5M-X01US i7-7700HQ, GeForce GTX 1050 Mobile, Samsung PM961 NVMe MZVLW128HEGR, IPS, 1920x1080, 15.6" | |
|---|---|---|---|---|---|---|---|---|---|
| Power Consumption | -45% | 21% | 30% | 9% | 9% | -82% | -12% | 34% | |
| Idle Minimum * (Watt) | 16.2 | 25.4 -57% | 8 51% | 3.9 76% | 8 51% | 12 26% | 38.3 -136% | 18 -11% | 6.7 59% |
| Idle Average * (Watt) | 18.2 | 30.3 -66% | 13 29% | 10.7 41% | 12 34% | 15 18% | 40.5 -123% | 23 -26% | 8.9 51% |
| Idle Maximum * (Watt) | 18.9 | 31.5 -67% | 18 5% | 11.2 41% | 25 -32% | 20 -6% | 42.2 -123% | 30 -59% | 10.8 43% |
| Load Average * (Watt) | 82.7 | 111.8 -35% | 76 8% | 111.5 -35% | 85 -3% | 82 1% | 110.4 -33% | 85 -3% | 81.8 1% |
| Witcher 3 ultra * (Watt) | 125.7 | 110 12% | 111 12% | 96 24% | 92.2 27% | ||||
| Load Maximum * (Watt) | 162.3 | 163.2 -1% | 143 12% | 115.5 29% | 180 -11% | 161 1% | 155.7 4% | 158 3% | 122.7 24% |
* ... Moindre est la valeur, meilleures sont les performances
| MSI GF62VR 7RF-877 i7-7700HQ, GeForce GTX 1060 Mobile, 41 Wh | MSI GE62VR 6RF-001US 6700HQ, GeForce GTX 1060 Mobile, 51 Wh | Gigabyte P55W v7 i7-7700HQ, GeForce GTX 1060 Mobile, 63 Wh | Lenovo Legion Y520-15IKBM 80YY001APB i5-7300HQ, GeForce GTX 1060 Max-Q, 45 Wh | Schenker XMG A517 i7-7700HQ, GeForce GTX 1060 Mobile, 62 Wh | Gigabyte Aero 15 i7-7700HQ, GeForce GTX 1060 Mobile, 94.24 Wh | Asus Strix GL502VM-DS74 i7-7700HQ, GeForce GTX 1060 Mobile, 64 Wh | HP Omen 15-ce002ng i7-7700HQ, GeForce GTX 1060 Max-Q, 70 Wh | Samsung Odyssey NP800G5M-X01US i7-7700HQ, GeForce GTX 1050 Mobile, 43 Wh | |
|---|---|---|---|---|---|---|---|---|---|
| Autonomie de la batterie | -14% | 235% | 300% | 158% | 239% | -6% | 71% | 161% | |
| Reader / Idle (h) | 2.8 | 2.3 -18% | 13.2 371% | 11.2 300% | 7.5 168% | 10.6 279% | 1.7 -39% | 4.3 54% | 10.2 264% |
| WiFi v1.3 (h) | 1.9 | 1.7 -11% | 5.8 205% | 5 163% | 7 268% | 1.5 -21% | 3.3 74% | 4.4 132% | |
| Load (h) | 0.7 | 0.6 -14% | 1.6 129% | 1.7 143% | 1.9 171% | 1 43% | 1.3 86% | 1.3 86% | |
| WiFi (h) | 4 |
Points positifs
Points négatifs

Sur le papier, le MSI GF62VR n’a rien de spécial. Alors qu’il offre de bonnes performances et un écran riche en couleurs, il est limité par un écran TN de mauvaise qualité (couleurs peu fidèles), et par des ventilateurs au son très aigu. Le GF62VR est tout de compromis, chaque point positif possède sa contrepartie négative. Il en résulte un portable de jeu qui ne répond pas à toutes les exigences (surtout en ce qui concerne l’écran, le bruit, et la qualité de construction).
Mais en prenant en compte son prix, la machine devient bien plus séduisante. A 1 300 $, le GF62VR se situe dans les prix des portables équipés d’une GTX 1050 Ti. La plupart des portables équipés de façon similaire sont plus chers d'environ 2-300 €. Ajoutez à cela que les performances de jeu sont plutôt meilleures que chez la concurrence, et le GF62VR devient l’un des portable de jeu au meilleur rapport équipement / prix du marché.
Mais il faut accepter les compromis de l’appareil, pour profiter de cet excellent rapport performances / prix : son écran, vraiment mauvais et qui doit être recalibré, ses ventilateurs bruyants, et son châssis en plastique qui essaie d’imiter les châssis haut-de-gamme. Mais ce compromis peut valoir le coup pour certains utilisateurs.
Pour ceux qui ne se soucient pas beaucoup de l’esthétique, et qui veulent juste pouvoir jouer en déplacement, il est difficile de trouver mieux que le GF62VR. Son principal concurrent est l’ancien GE62VR, qu’il remplace : si vous en trouvez un avec un écran IPS, il pourrait être plus intéressant. Mais si vous voulez un ordinateur portable de jeu récent, avec une GTX 1060 et avec un excellent rapport équipement / prix, alors le GF62VR devrait être en tête de votre liste.
L’intégralité de cette critique est disponible en anglais en suivant ce lien.
MSI GF62VR 7RF-877
- 11/10/2017 v6 (old)
Sam Medley
Price comparison
