Verdict - Les plus grands changements pour la série
La révision de la révision du XPS 2022 de 2022 était une telle tangente pour la série que nombre de ses nouvelles fonctionnalités ont reçu des réponses mitigées de la part des fans de longue date du XPS. Pour 2026, cette dernière révision s'attaque à de nombreuses critiques en apportant des améliorations ergonomiques significatives. Le châssis est plus rigide, les touches de fonction tactiles ont disparu, le pavé tactile est plus facile à voir et la webcam dépasse désormais les 1080p pour rivaliser avec la plupart des concurrents. L'entretien est un peu plus difficile, mais c'est un petit prix à payer si l'on considère à quel point le nouveau design est plus solide et à quel point les haut-parleurs de 10 W sont plus bruyants.
Sur le plan des performances, Panther Lake a fait des merveilles pour la série XPS 14, qui se rapproche de la RTX 4050 de GeForce, sans poids ni consommation supplémentaires. Même les joueurs trouveront l'Arc B390 très puissant pour un GPU intégré.
Plusieurs aspects du XPS 14 peuvent encore être améliorés. L'absence d'un obturateur pour l'appareil photo, par exemple, et la disparition de l'emplacement MicroSD peuvent être une épine dans le pied des créateurs de contenu. Les performances Turbo Boost et le support HDR sont plus faibles que sur des concurrents comme le Asus ExpertBook Ultra tandis que les touches relativement douces ne sont pas idéales pour les dactylographes. Il est également regrettable que l'écran du nouveau XPS 14 soit plus petit d'un demi-pouce que celui de l'ancien modèle, ce qui réduit l'espace disponible à l'écran.
Le nouveau XPS 14 est néanmoins la révision la plus raffinée jusqu'à présent pour la série et il est plus facile de le recommander que le XPS 14 2025 Dell 14 Premium.
Points positifs
Points négatifs
Prix et disponibilité
Dell livre actuellement le 2026 XPS 14 à partir de 1600 $ pour la configuration de base ou de 2200 $ pour la configuration telle qu'elle a été examinée.
- $2,267.80Dell XPS 14 Premium Laptop DA14250-14.5-inch Touch 3.2K OLED 48-120Hz Display, Intel Core Ultra 7 255H, Intel Arc Graphics, 32GB Memory, 1TB SSD, Backlit English Keyboard with Fingerprint Reader
- $1,899.00Dell XPS 14 9440 14.5" Notebook - Full HD Plus - Intel Core Ultra 7 155H - Intel Evo Platform - 16 GB - 512 GB SSD - English Keyboard - Platinum
- $1,299.99Dell XPS 13 9345 12-Core AI Laptop, 13.4" 2K 120Hz Business Laptop, Snapdragon X Elite, 16GB LPDDR5X RAM, 1TB SSD, Wi-Fi 7, Backlit, Fingerprint Reader, Windows 11 Pro
Table des matières
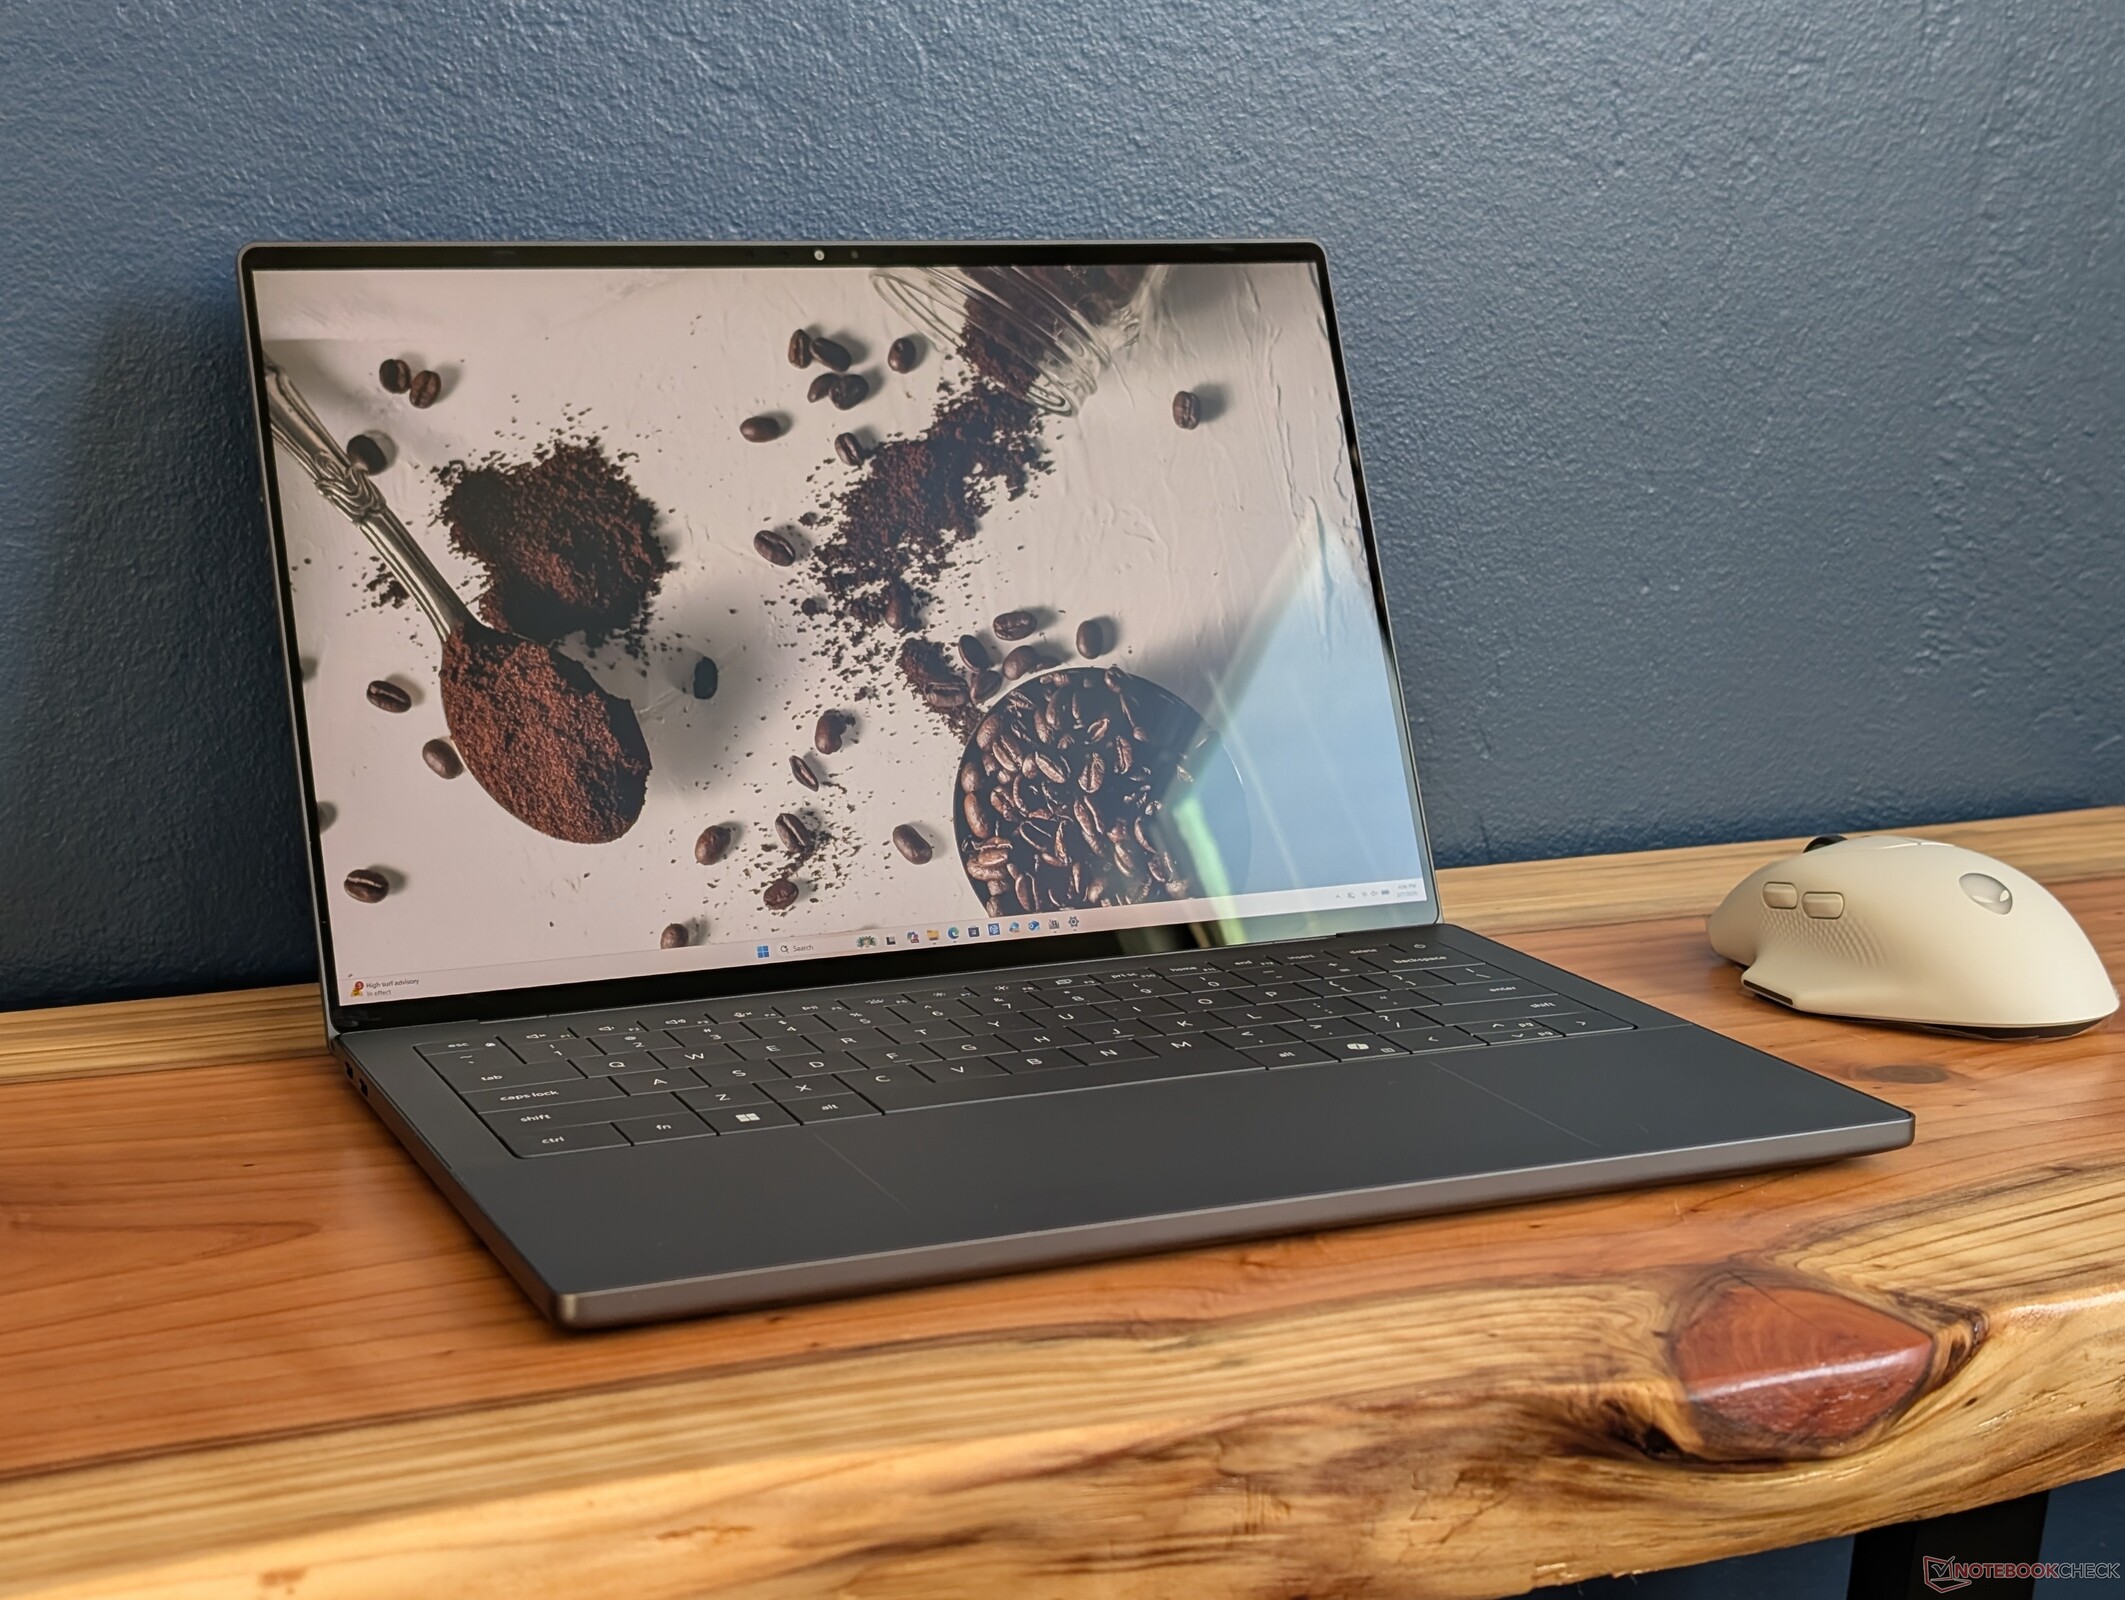
Après une année de transition sans doute déroutante l'abandon de la marque XPS, Dell revient à un nom reconnaissable avec le XPS 14 2026dell revient à ce nom reconnaissable avec le XPS 14 2026 équipé de la dernière plateforme CPU Panther Lake d'Intel. Le modèle arbore un tout nouveau design extérieur par rapport à la génération précédente 2025 Dell 14 Premium ou 2024 XPS 14.
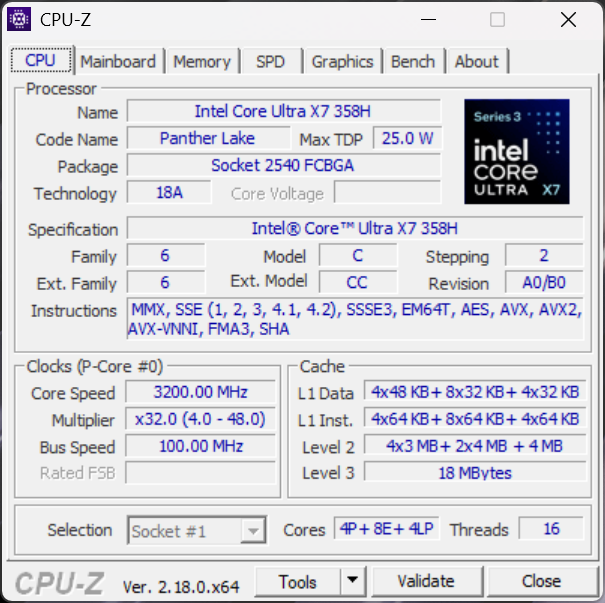
Notre unité de test est une configuration intermédiaire avec le CPU Core Ultra X7 358H et l'écran tactile OLED 2,8K pour environ 2200 USD. Les SKUs inférieurs sont livrés avec le Core Ultra 5 325 et un écran 2K non tactile, tandis que le SKU le plus haut de gamme comprend le Core Ultra X9 388H.
Le XPS 14 peut être remplacé par d'autres ordinateurs portables ultraminces destinés aux consommateurs, tels que le Asus ExpertBook Ultra, HP EliteBook X G1i 14 AI, Lenovo Yoga Pro 7 14IAH10.
Plus de commentaires sur Dell :
Spécifications
Cas - Une bonne évolution
Le châssis redessiné a été largement présenté dans notre vidéo de présentation originale, comme indiqué ci-dessous. Visuellement, le changement le plus notable concerne les bords avant et latéraux qui sont désormais plus plats et non plus effilés. Le bord avant est donc aussi épais que le bord arrière, à l'instar du MacBook Pro ou Razer Blade.
Esthétiquement, les logos sur le système ont également été modifiés : alors que les logos "Dell" et "XPS" sur le modèle 2025 se trouvaient respectivement sur les couvercles supérieur et inférieur, le logo "Dell" se trouve maintenant en bas tandis que le logo "XPS" se trouve en haut.
Le modèle 2026 est à la fois plus fin et plus léger que le modèle précédent, tout en donnant l'impression d'être plus dense et plus rigide, en particulier sur le bord avant. Toutefois, cette différence peut être attribuée en grande partie au passage d'un écran de 14,5 pouces à un écran de 14,0 pouces. Il est néanmoins plus lourd que ses concurrents comme le HP EliteBook X G1i 14 ou l ExpertBook Ultra de 200 à 300 grammes chacun.


Connectivité
Les trois ports USB-C Thunderbolt 4 du design de l'année dernière sont de retour. Malheureusement, les utilisateurs de cartes SD ont été lésés, car le lecteur a été abandonné.


Communication

Webcam
Malgré l'amélioration considérable de la résolution, qui passe de 2 MP à 8 MP sur le Dell 14 Premium, il n'y a toujours pas d'obturateur physique.


Maintenance
Les procédures d'entretien sont à la fois différentes et légèrement plus difficiles que pour le modèle précédent. Après avoir retiré les quatre vis T5 du bas, le clavier doit être soigneusement séparé de la base à l'aide d'un bord tranchant pour révéler les composants de la carte mère.
Le guide d'entretien officiel est disponible à l'adresse suivante : https://www.dell.com/support/manuals/en-us/xps-da14260-laptop/xps-14-da14260-service-manual/removing-the-palm-rest-and-keyboard-assembly?guid=guid-0eecac99-8d50-4eb2-8f50-211d7d34123d&lang=en-us.

Durabilité
Le système se compose de 75 % d'aluminium recyclé pour les couvercles supérieur et inférieur, de 50 % de cobalt recyclé dans la batterie, de 90 % d'acier recyclé pour les touches, de 10 % de verre recyclé pour l'écran tactile OLED SKU et de 100 % de cuivre recyclé dans certaines parties du circuit imprimé. L'emballage lui-même est entièrement recyclable et ne contient aucun plastique.
Accessoires et garantie
La boîte ne contient pas d'autres éléments que l'adaptateur secteur et la documentation. La garantie limitée habituelle d'un an du fabricant s'applique si l'appareil est acheté aux États-Unis.
Périphériques d'entrée - Finis les boutons tactiles !
Clavier
Le nouveau XPS 14 répond à certaines préoccupations liées à l'ancienne conception du clavier et du pavé tactile. La plus évidente est l'omission de la rangée supérieure de touches tactiles au profit de touches plus traditionnelles, à l'instar du Dell Pro 13 Premium. La course des touches et le retour d'information sont par ailleurs similaires à la disposition en treillis zéro de l'année dernière, que nous trouvons moins profonde et plus douce que les touches du Lenovo ThinkPad T14 ou de la série HP EliteBook 14.
Pavé tactile
Alors que le pavé tactile sans couture du modèle de l'année dernière était assez spacieux, il n'avait pas de bordures visuelles et il était donc difficile de savoir où la surface tactile commençait ou se terminait. Le nouveau XPS 14 ajoute une gravure subtile le long des côtés du pavé tactile (~15,2 x 7,5 cm) pour améliorer la convivialité sans être visuellement intrusif. Le retour haptique aurait pu être plus fort, mais au moins il n'est pas trop sensible, contrairement à ce que nous avons expérimenté sur le clickpad haptique de l ExpertBook Ultra.


Affichage
Deux options d'affichage sont disponibles :
- 1920 x 1200, non tactile, mat, 500 nits, 100% sRGB, IPS, 1 - 120 Hz
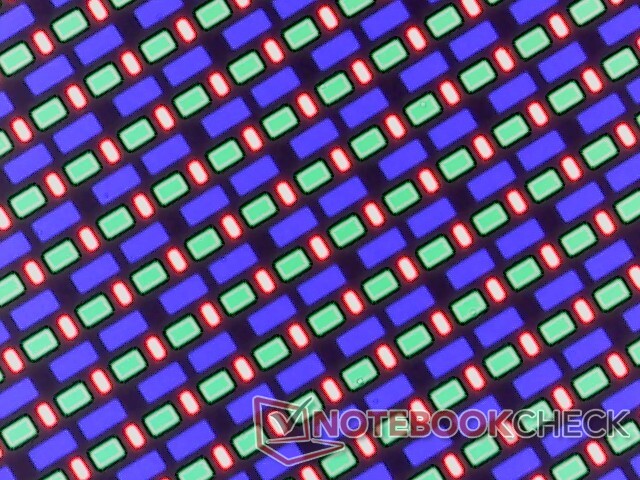
- 2880 x 1800, écran tactile, brillant, 500 nits, 100% DCI-P3, OLED, 20 - 120 Hz
Le XPS 14 utilise un écran OLED brillant Gorilla Glass 3 plus traditionnel, contrairement à l'écran OLED tandem mat Gorilla Glass Victus de l'ExpertBook Ultra. L'écran OLED n'est pas aussi granuleux que celui de l'Asus, mais la luminosité HDR maximale n'est que la moitié de la luminosité maximale, pour un support HDR plus faible.
Dell a changé de fournisseur OLED, passant de Samsung sur le modèle de l'année dernière à LG Philips pour cette révision 2026. Les caractéristiques principales sont très similaires entre les panneaux, à l'exception de leur différence de taille (14 pouces contre 14,5 pouces)


| |||||||||||||||||||||||||
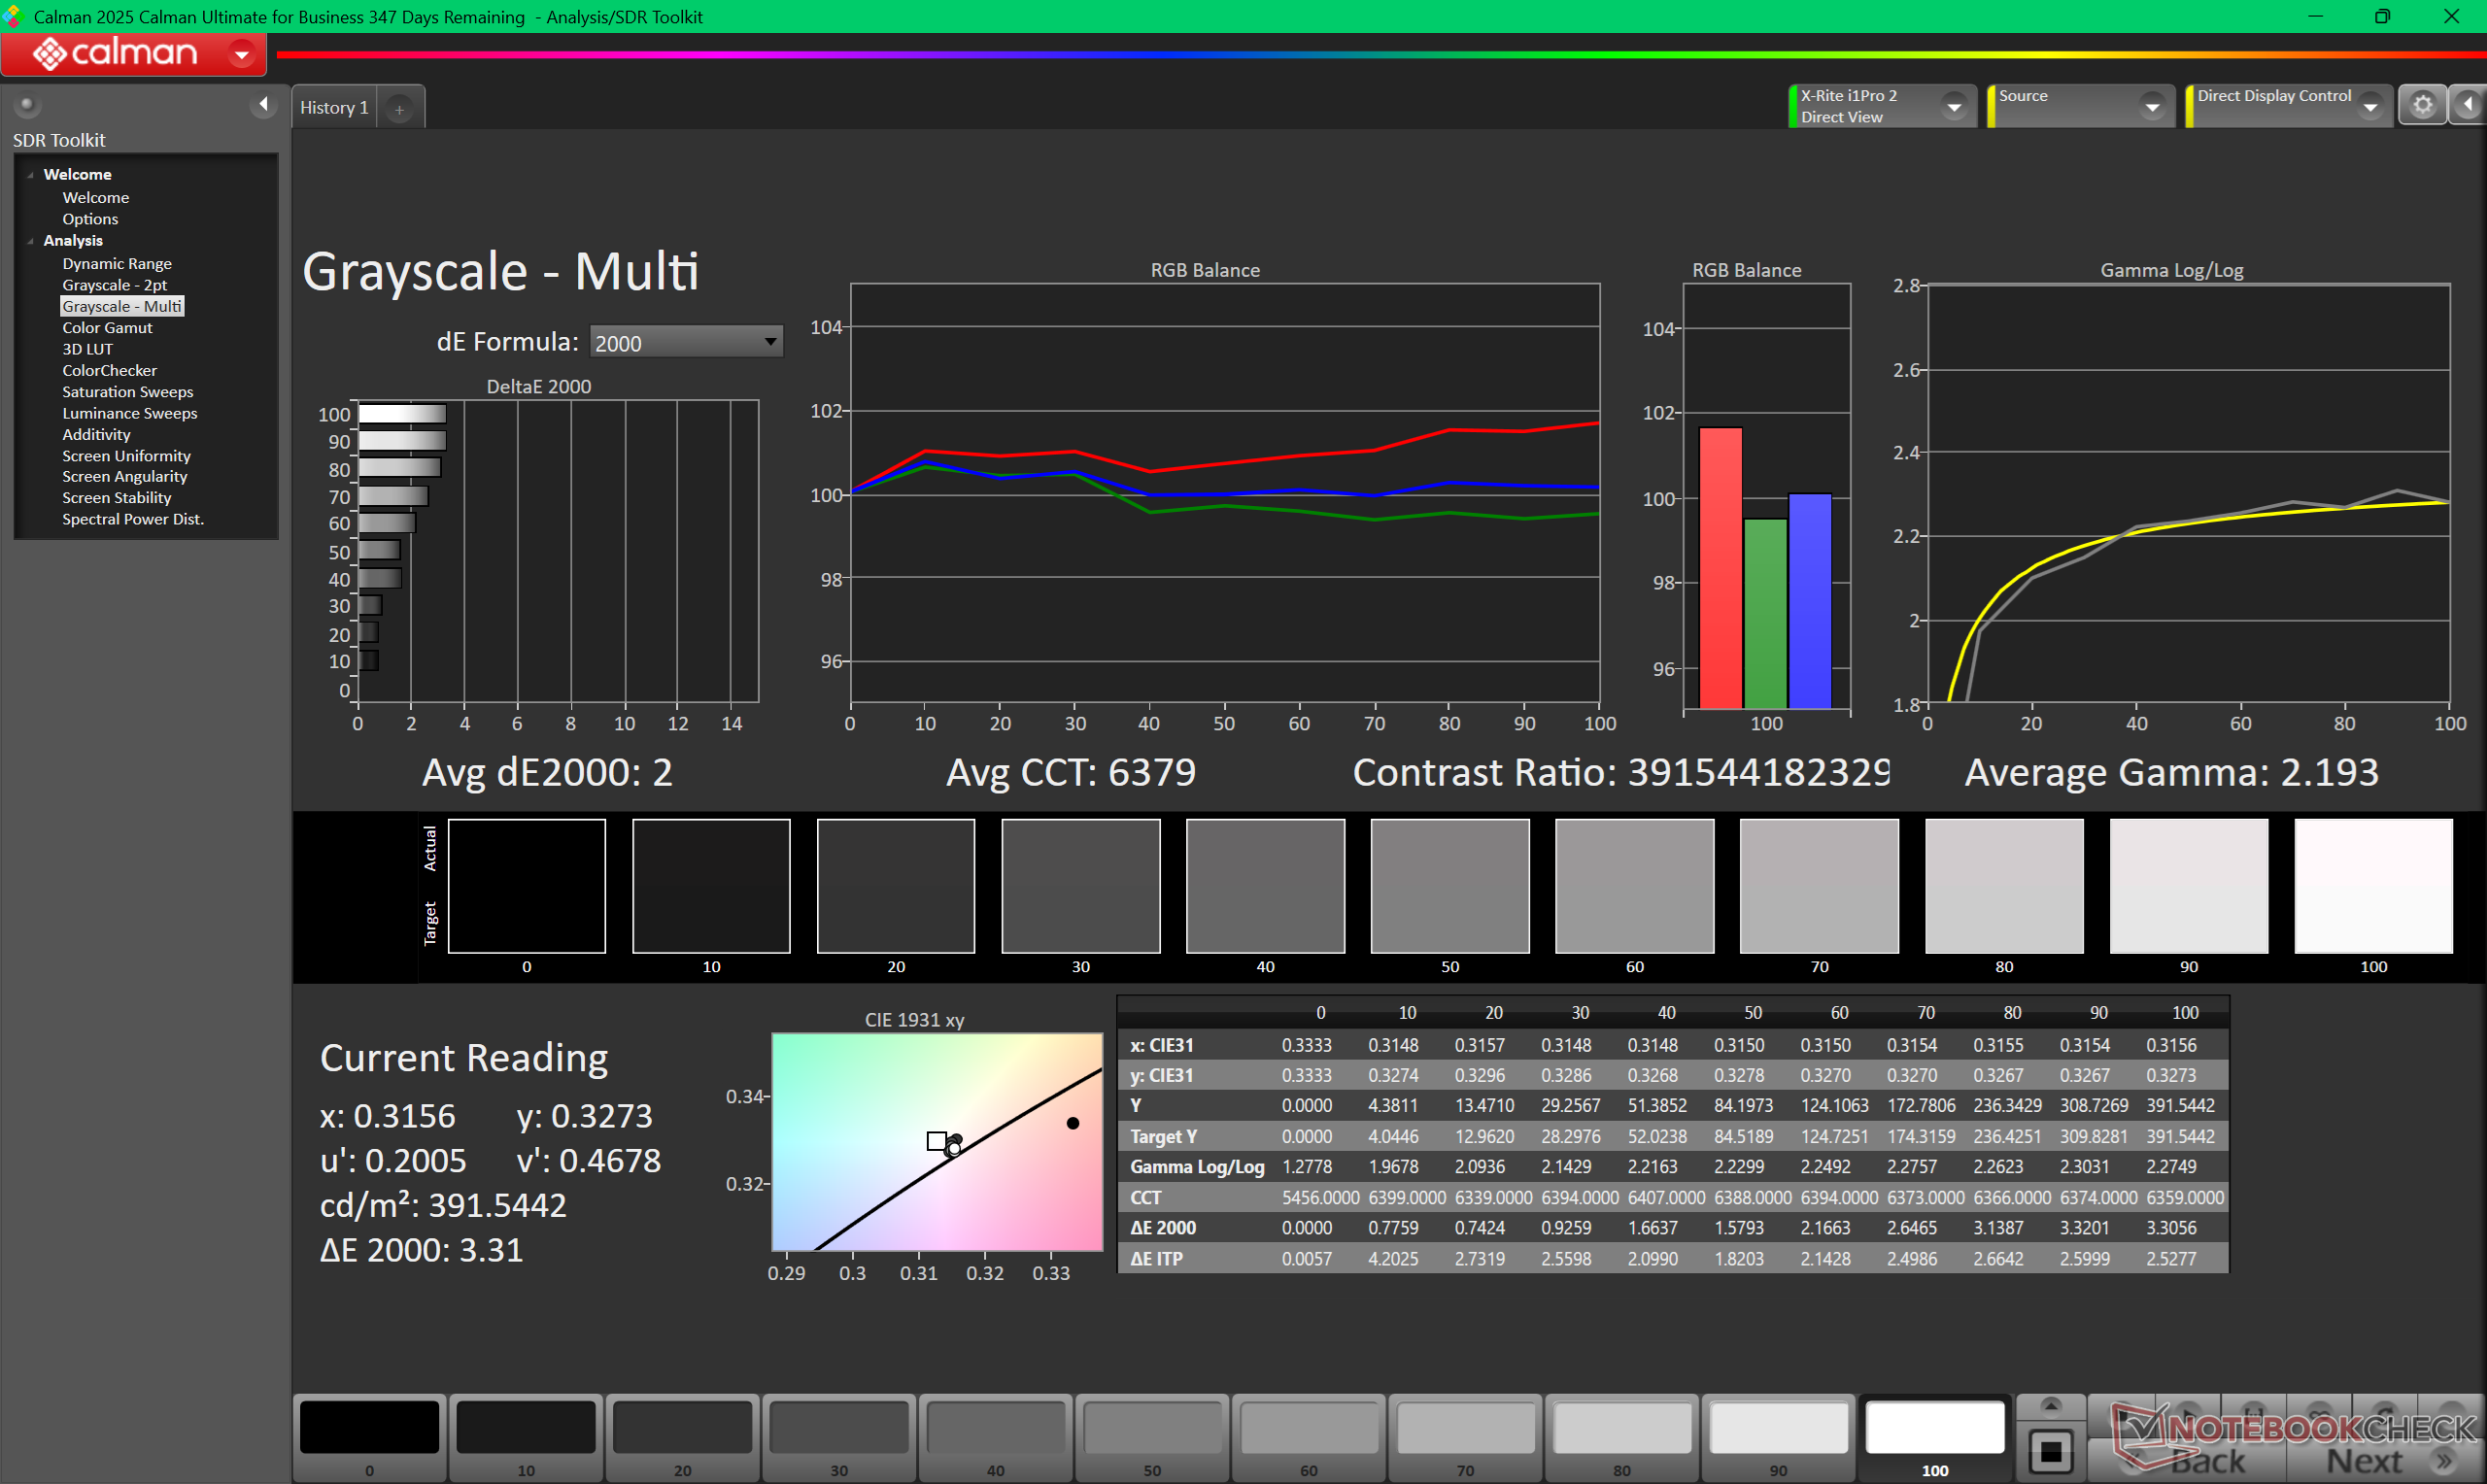
Homogénéité de la luminosité: 96 %
Valeur mesurée au centre, sur batterie: 393.8 cd/m²
Contraste: ∞:1 (Valeurs des noirs: 0 cd/m²)
ΔE ColorChecker Calman: 1.27 | ∀{0.5-29.43 Ø4.73}
calibrated: 0.71
ΔE Greyscale Calman: 2 | ∀{0.09-98 Ø4.98}
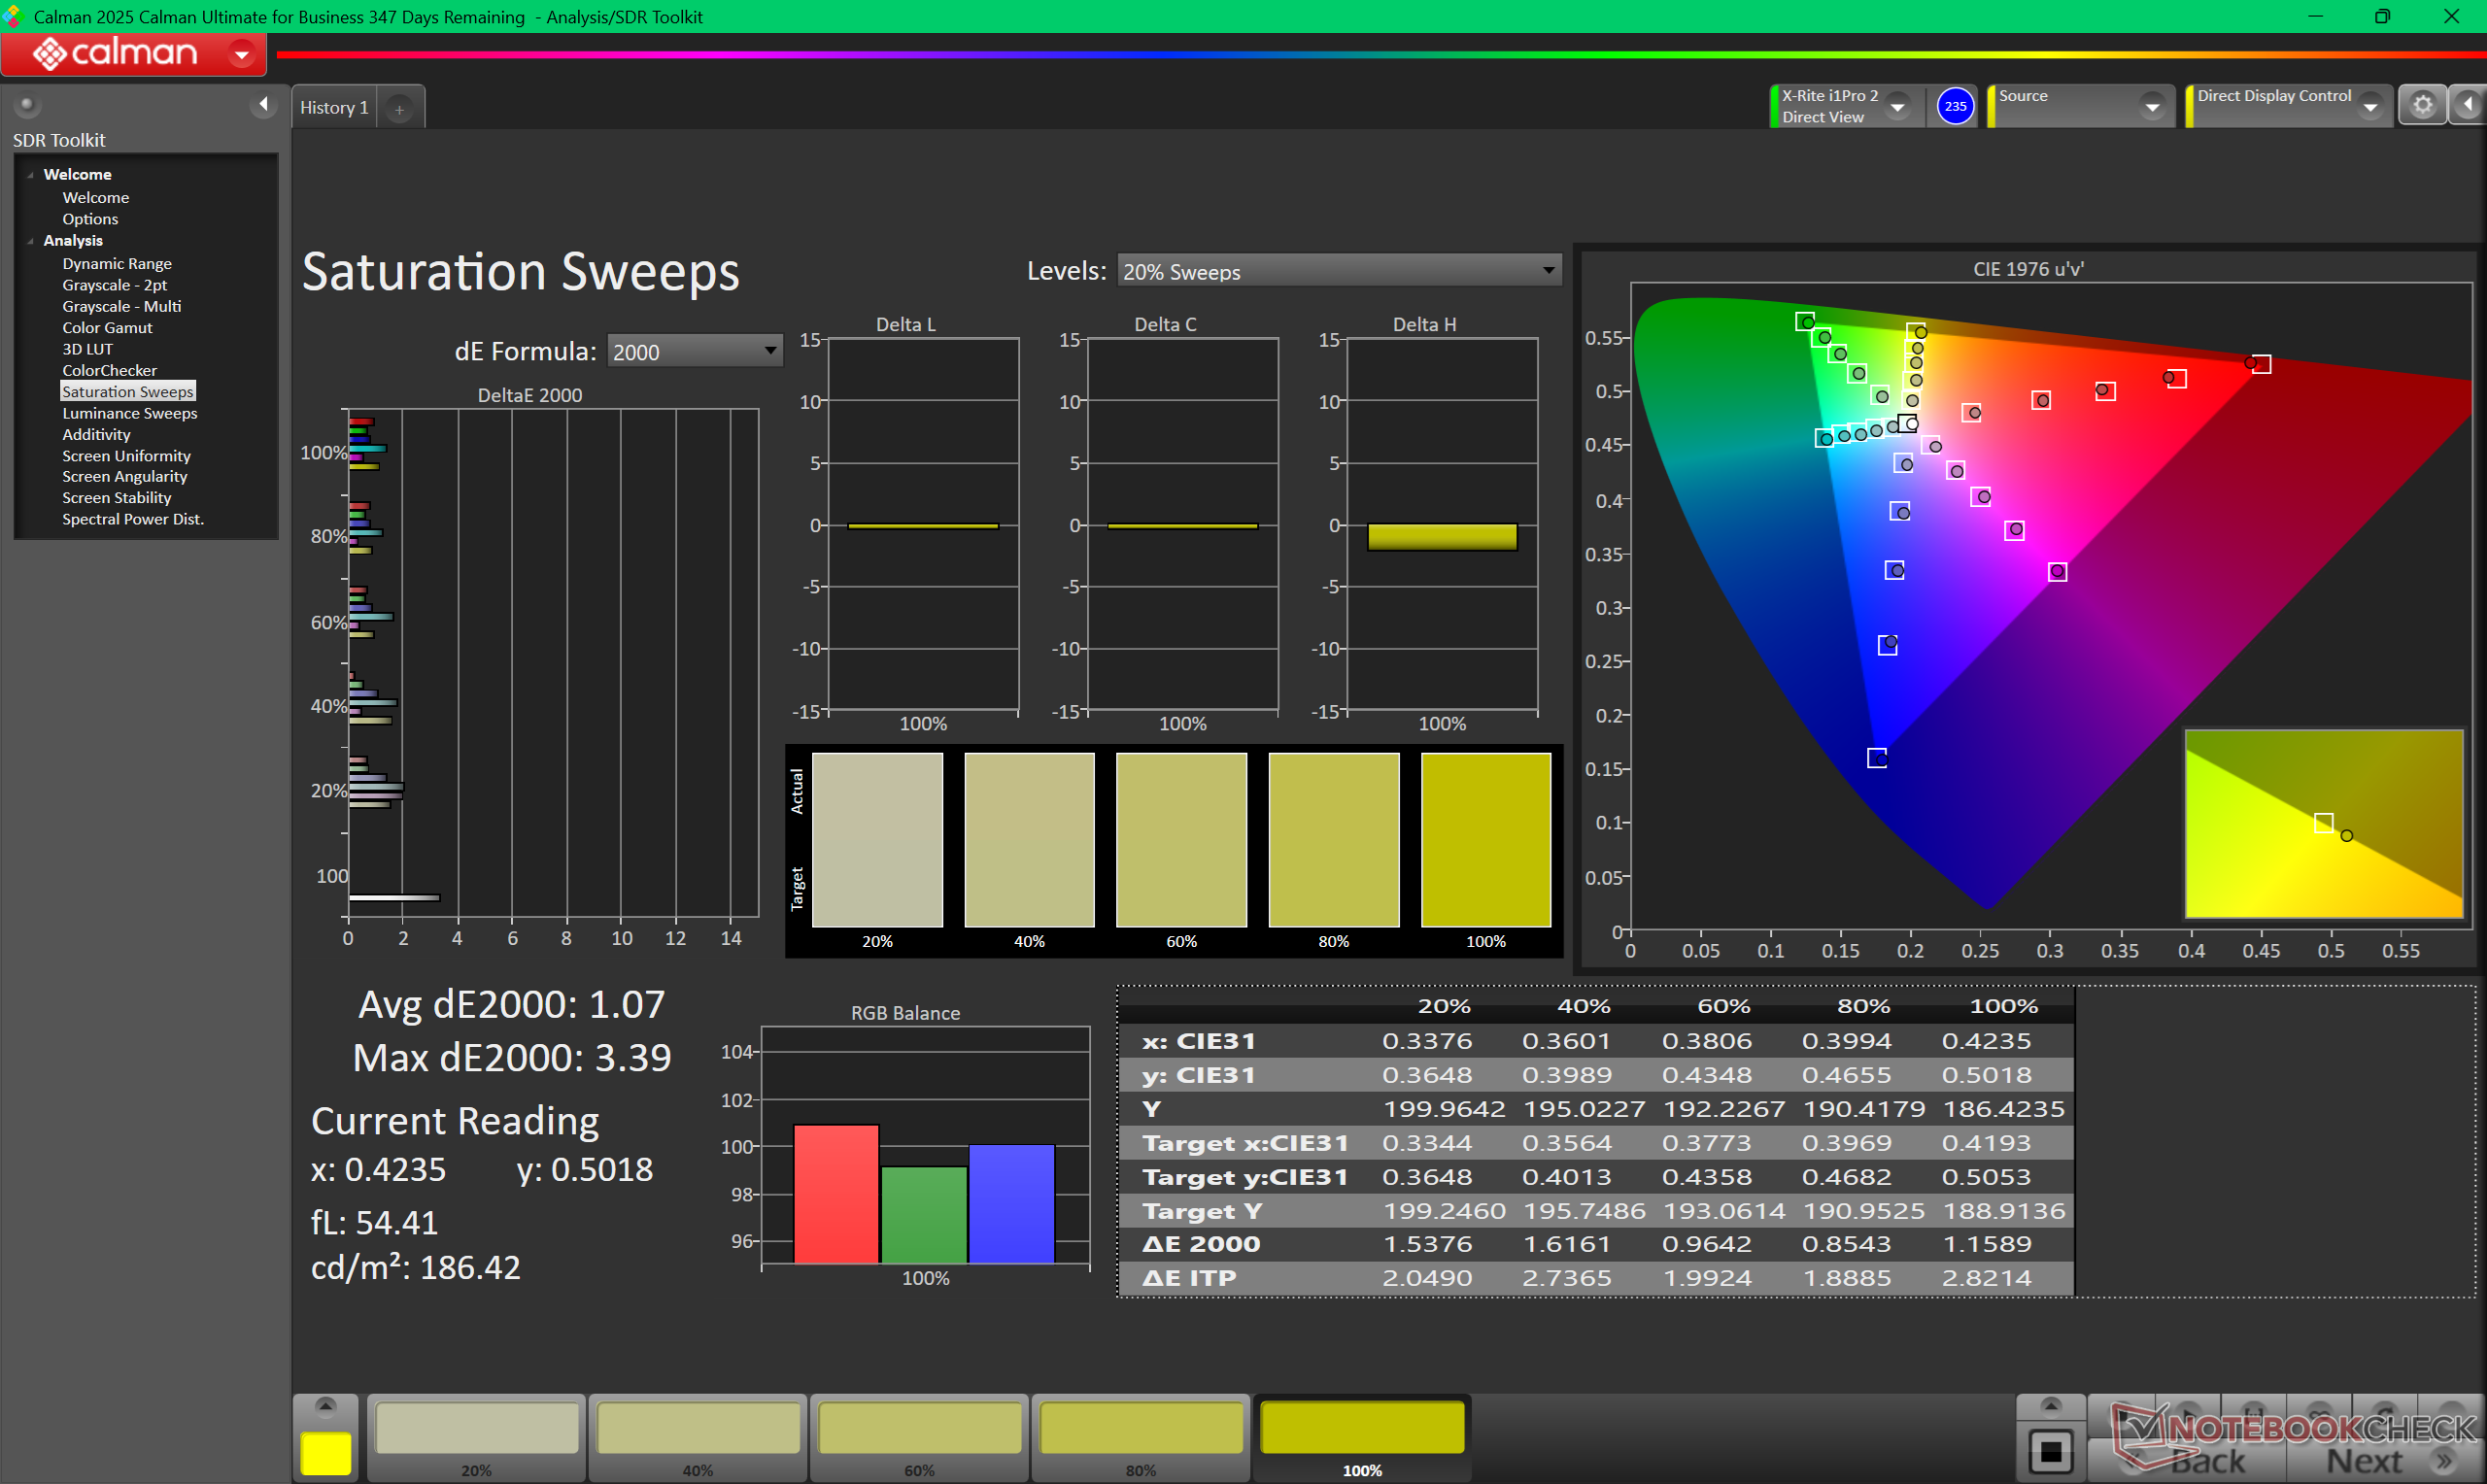
98.2% AdobeRGB 1998 (Argyll 3D)
100% sRGB (Argyll 3D)
99.7% Display P3 (Argyll 3D)
Gamma: 2.19
CCT: 6379 K
| Dell XPS 14 Core Ultra X7 358H LG Philips 140WT2, OLED, 2880x1800, 14", 120 Hz | Dell 14 Premium Samsung 145FB02, OLED, 3200x2000, 14.5", 120 Hz | Dell XPS 14 2024 OLED SDC41A2, OLED, 3200x2000, 14.5", 120 Hz | Asus ExpertBook Ultra B9406CAA Samsung ATNA40LE01-0, OLED, 2880x1800, 14", 120 Hz | Lenovo Yoga Pro 7 14IAH10 LEN145WQ+, OLED, 3000x1876, 14.5", 120 Hz | HP EliteBook X G1i 14 AI IPS, 1920x1200, 14", 60 Hz | |
|---|---|---|---|---|---|---|
| Display | -4% | -4% | -5% | -1% | -20% | |
| Display P3 Coverage (%) | 99.7 | 99.3 0% | 98.5 -1% | 96.2 -4% | 99.5 0% | 69.9 -30% |
| sRGB Coverage (%) | 100 | 100 0% | 100 0% | 100 0% | 99.4 -1% | 98.4 -2% |
| AdobeRGB 1998 Coverage (%) | 98.2 | 87.2 -11% | 87.2 -11% | 86.7 -12% | 95.5 -3% | 71.6 -27% |
| Response Times | 11% | 16% | 15% | 37% | -4079% | |
| Response Time Grey 50% / Grey 80% * (ms) | 0.75 ? | 0.72 ? 4% | 0.7 ? 7% | 0.71 ? 5% | 0.63 ? 16% | 42.3 ? -5540% |
| Response Time Black / White * (ms) | 1.03 ? | 0.96 ? 7% | 0.77 ? 25% | 0.94 ? 9% | 0.54 ? 48% | 28 ? -2618% |
| PWM Frequency (Hz) | 240.62 ? | 475 | 480 | 968.8 ? | 120 ? | |
| PWM Amplitude * (%) | 29 | 23 21% | 20 31% | 15 48% | ||
| Screen | -61% | -12% | 23% | 33% | -33% | |
| Brightness middle (cd/m²) | 393.8 | 349.3 -11% | 351 -11% | 600.5 52% | 497 26% | 487.5 24% |
| Brightness (cd/m²) | 389 | 352 -10% | 353 -9% | 612 57% | 500 29% | 469 21% |
| Brightness Distribution (%) | 96 | 98 2% | 97 1% | 96 0% | 96 0% | 91 -5% |
| Black Level * (cd/m²) | 0.26 | |||||
| Colorchecker dE 2000 * | 1.27 | 3.47 -173% | 1.7 -34% | 1.18 7% | 0.7 45% | 2.37 -87% |
| Colorchecker dE 2000 max. * | 3.35 | 7.38 -120% | 2.2 34% | 3.4 -1% | 1.7 49% | 5.77 -72% |
| Colorchecker dE 2000 calibrated * | 0.71 | 1.3 -83% | 0.8 -13% | 0.73 -3% | 0.86 -21% | |
| Greyscale dE 2000 * | 2 | 2.6 -30% | 3.1 -55% | 1 50% | 1 50% | 3.8 -90% |
| Gamma | 2.19 100% | 2.22 99% | 2.12 104% | 2.27 97% | 2.22 99% | 2.14 103% |
| CCT | 6379 102% | 6758 96% | 6616 98% | 6567 99% | 6404 101% | 6540 99% |
| Contrast (:1) | 1875 | |||||
| Moyenne finale (programmes/paramètres) | -18% /
-31% | 0% /
-6% | 11% /
15% | 23% /
26% | -1377% /
-704% |
* ... Moindre est la valeur, meilleures sont les performances


L'écran est livré bien calibré avec des valeurs moyennes de niveaux de gris et de couleurs deltaE inférieures ou égales à 2. Un étalonnage plus poussé de l'écran à l'aide de notre colorimètre n'améliorerait les couleurs que de façon marginale.


Temps de réponse de l'écran
| ↔ Temps de réponse noir à blanc | ||
|---|---|---|
| 1.03 ms ... hausse ↗ et chute ↘ combinées | ↗ 0.53 ms hausse | 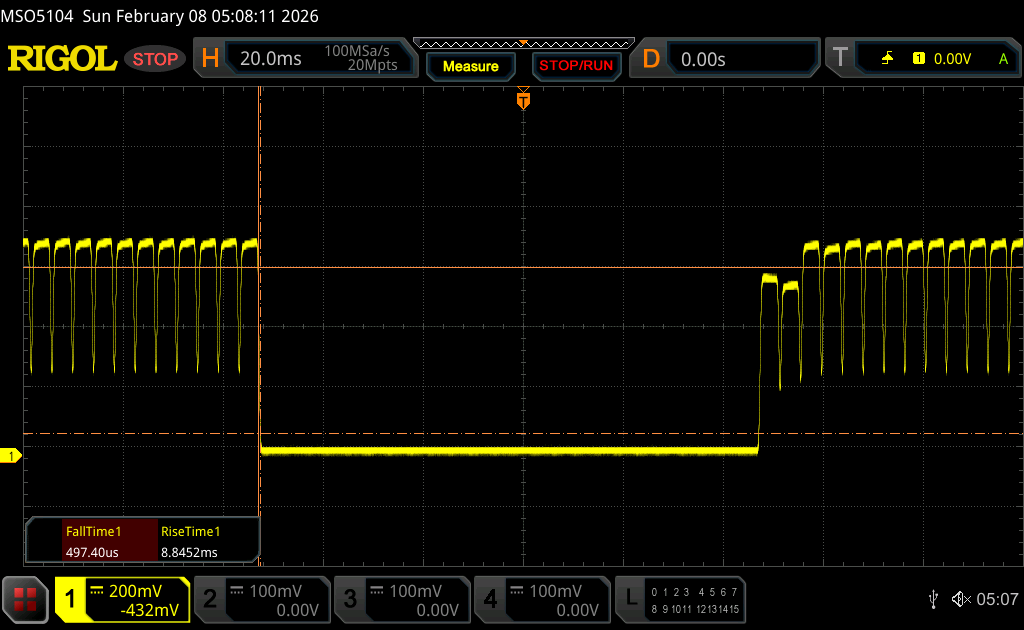 |
| ↘ 0.5 ms chute | ||
| L'écran montre de très faibles temps de réponse, parfait pour le jeu. En comparaison, tous les appareils testés affichent entre 0.1 (minimum) et 240 (maximum) ms. » 4 % des appareils testés affichent de meilleures performances. Cela signifie que les latences relevées sont meilleures que la moyenne (19.9 ms) de tous les appareils testés. | ||
| ↔ Temps de réponse gris 50% à gris 80% | ||
| 0.75 ms ... hausse ↗ et chute ↘ combinées | ↗ 0.43 ms hausse | 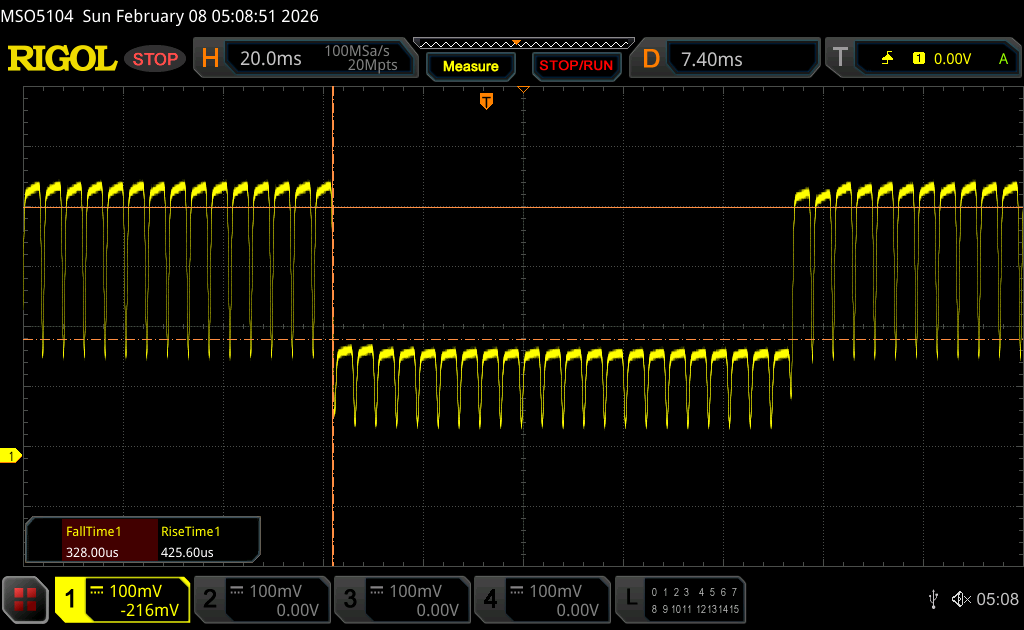 |
| ↘ 0.32 ms chute | ||
| L'écran montre de très faibles temps de réponse, parfait pour le jeu. En comparaison, tous les appareils testés affichent entre 0.165 (minimum) et 636 (maximum) ms. » 2 % des appareils testés affichent de meilleures performances. Cela signifie que les latences relevées sont meilleures que la moyenne (31.1 ms) de tous les appareils testés. | ||
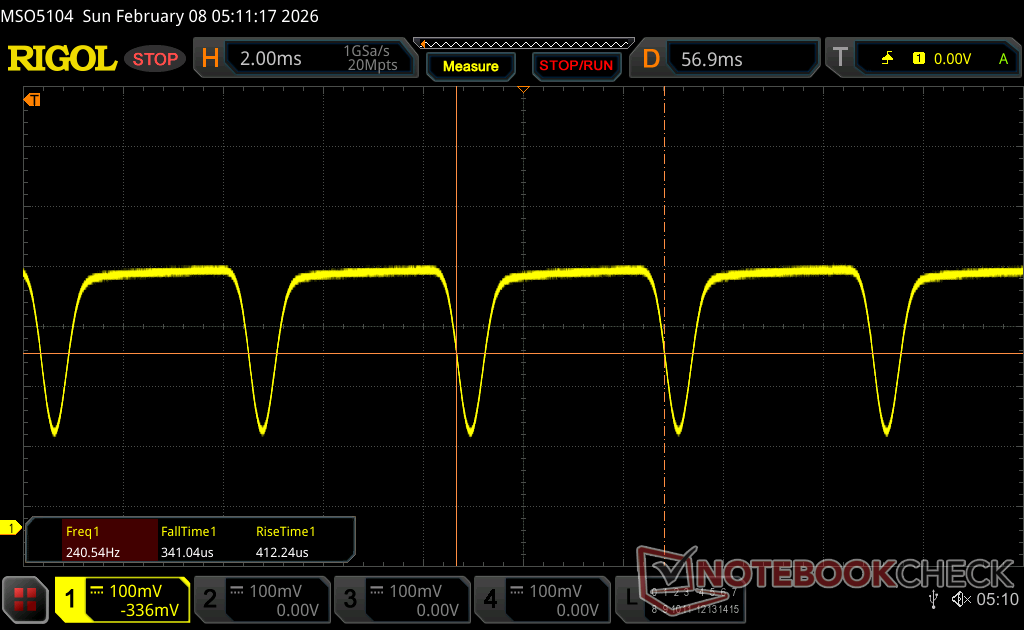
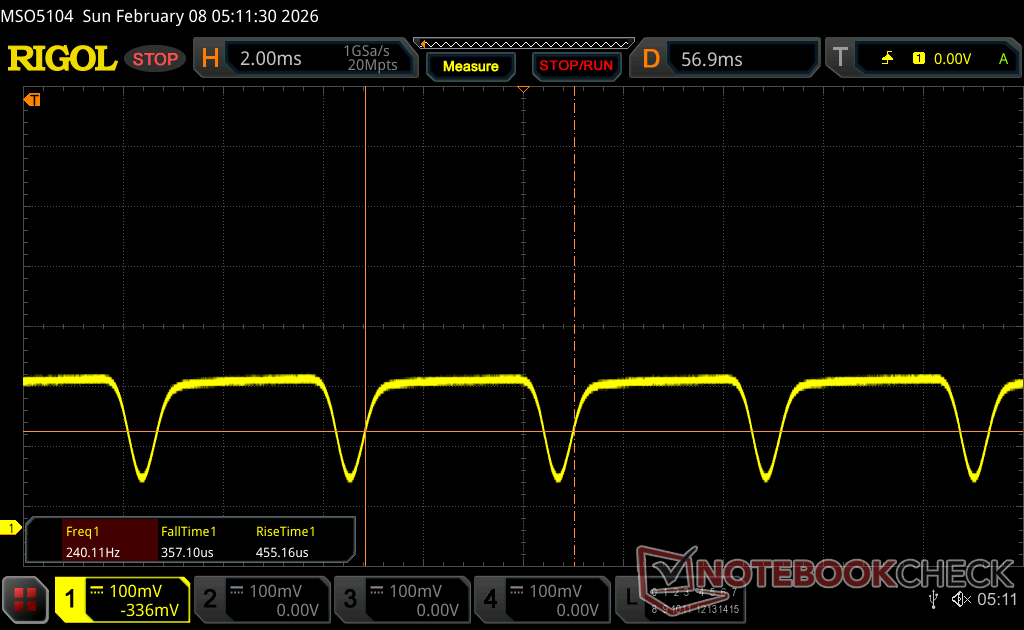
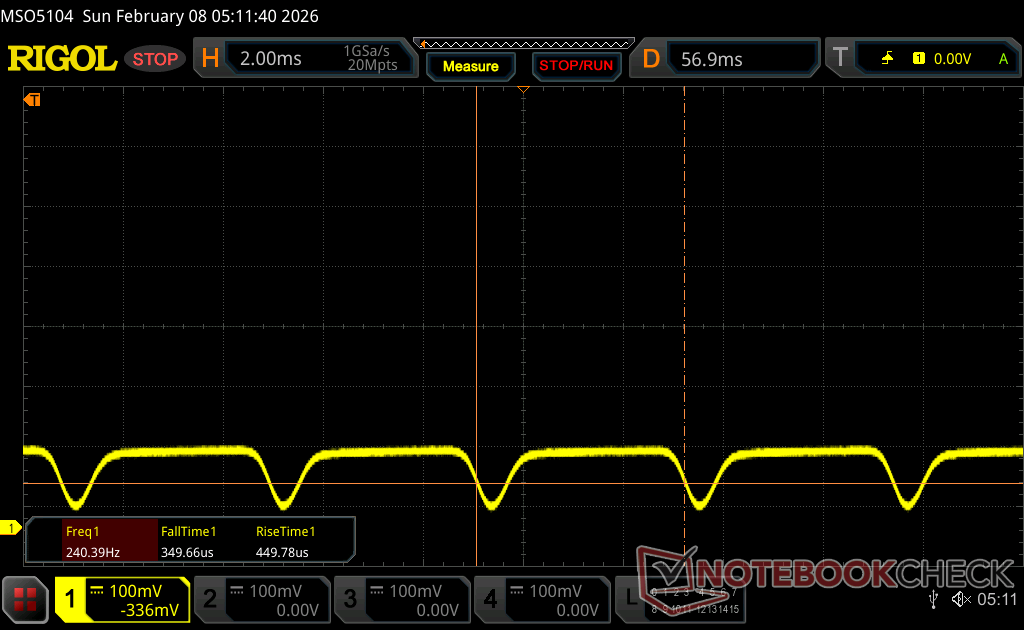
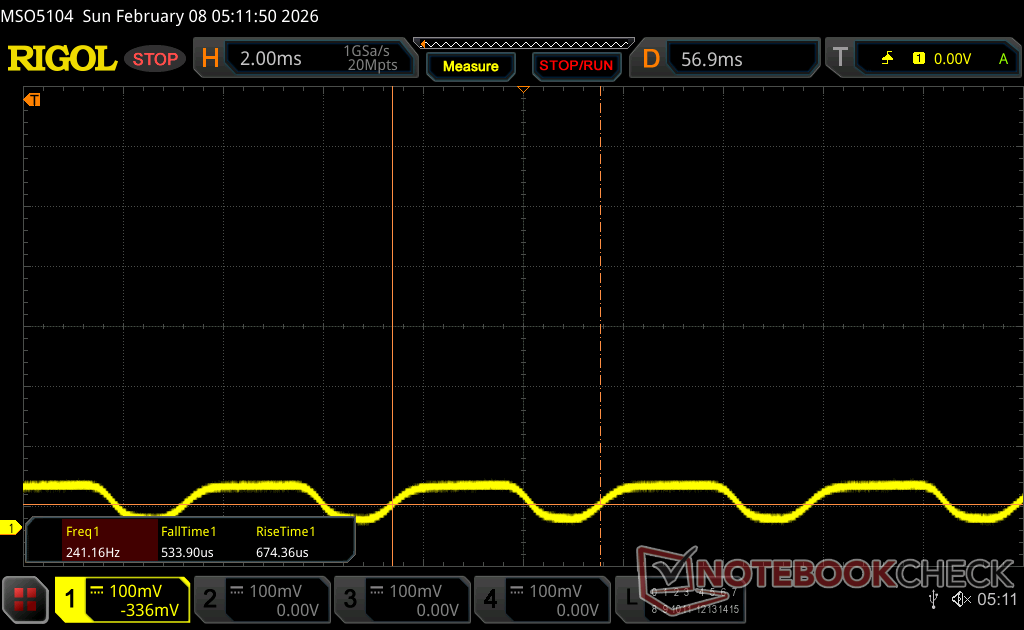
Scintillement / MLI (Modulation de largeur d'impulsion)
| Scintillement / MLI (Modulation de largeur d'impulsion) décelé | 240.62 Hz Amplitude: 29 % | ≤ 100 Niveau de luminosité | 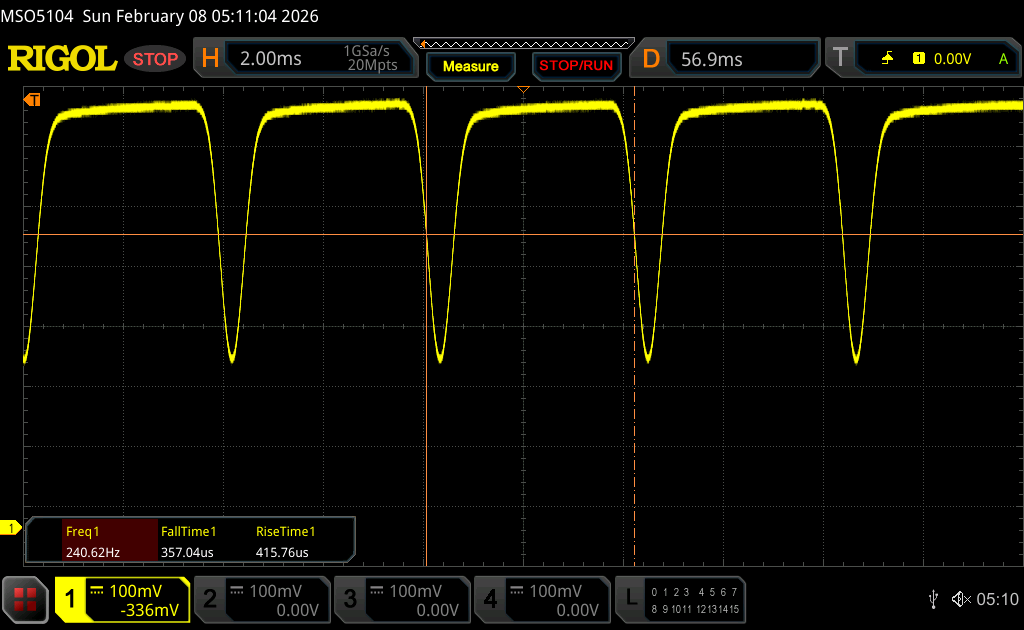 |
Le rétroéclairage de l'écran scintille à la fréquence de 240.62 Hz (certainement du fait de l'utilisation d'une MDI - Modulation de largeur d'impulsion) à un niveau de luminosité inférieur ou égal à 100 % . Aucun scintillement ne devrait être perceptible au-dessus de cette valeur. La fréquence de rafraîchissement de 240.62 Hz est relativement faible, les personnes les plus sensibles devraient percevoir un scintillement et être sujettes à une fatigue oculaire accrue (avec le niveau de luminosité indiqué) En comparaison, 52 % des appareils testés n'emploient pas MDI pour assombrir leur écran. Nous avons relevé une moyenne à 7841 (minimum : 5 - maximum : 343500) Hz dans le cas où une MDI était active. | |||
La visibilité à l'extérieur est correcte à l'ombre, mais elle est trop faible et réfléchissante dans des conditions plus lumineuses.


Performance - Panther Lake Boost
Conditions d'essai
Nous avons réglé Windows et Dell Optimizer sur le mode Performance avant d'effectuer les tests ci-dessous.
Processeur
Les performances brutes de l'unité centrale se situent à moins de 5 % de celles de l'unité centrale Core Ultra 7 255H en moyenne dans le Dell 14 Premium de l'année dernière et les propriétaires actuels ne devraient donc pas s'attendre à des améliorations significatives à cet égard. De plus, les performances multithread sont réduites de 25 % lors de l'exécution en boucle de CineBench R15 xT, comme le montre le graphique de comparaison ci-dessous. L'Asus ExpertBook Ultra, qui est livré avec le même Core Ultra X7 358H Que notre ordinateur Dell, accélèrerait nettement moins pour des performances plus rapides.
En passant au processeur le plus haut de gamme Core Ultra X9 388H Ne devrait améliorer les performances que de 5 à 10 %, d'après notre expérience avec l'Asus ZenBook Duo.
Cinebench R15 Multi Loop
Cinebench R23: Multi Core | Single Core
Cinebench R20: CPU (Multi Core) | CPU (Single Core)
Cinebench R15: CPU Multi 64Bit | CPU Single 64Bit
Blender: v2.79 BMW27 CPU
7-Zip 18.03: 7z b 4 | 7z b 4 -mmt1
Geekbench 6.6: Multi-Core | Single-Core
Geekbench 5.5: Multi-Core | Single-Core
HWBOT x265 Benchmark v2.2: 4k Preset
LibreOffice : 20 Documents To PDF
R Benchmark 2.5: Overall mean
* ... Moindre est la valeur, meilleures sont les performances
AIDA64: FP32 Ray-Trace | FPU Julia | CPU SHA3 | CPU Queen | FPU SinJulia | FPU Mandel | CPU AES | CPU ZLib | FP64 Ray-Trace | CPU PhotoWorxx
| Performance rating | |
| Lenovo Yoga Pro 7 14IAH10 | |
| Dell XPS 14 Core Ultra X7 358H | |
| Moyenne Intel Core Ultra X7 358H | |
| Dell XPS 14 2024 OLED | |
| HP EliteBook X G1i 14 AI | |
| Asus ExpertBook Ultra B9406CAA | |
| AIDA64 / FP32 Ray-Trace | |
| Lenovo Yoga Pro 7 14IAH10 | |
| Moyenne Intel Core Ultra X7 358H (12221 - 17932, n=8) | |
| Dell XPS 14 Core Ultra X7 358H | |
| HP EliteBook X G1i 14 AI | |
| Asus ExpertBook Ultra B9406CAA | |
| Dell XPS 14 2024 OLED | |
| AIDA64 / FPU Julia | |
| Lenovo Yoga Pro 7 14IAH10 | |
| Moyenne Intel Core Ultra X7 358H (29930 - 95525, n=8) | |
| Dell XPS 14 Core Ultra X7 358H | |
| Dell XPS 14 2024 OLED | |
| HP EliteBook X G1i 14 AI | |
| Asus ExpertBook Ultra B9406CAA | |
| AIDA64 / CPU SHA3 | |
| Lenovo Yoga Pro 7 14IAH10 | |
| Asus ExpertBook Ultra B9406CAA | |
| Moyenne Intel Core Ultra X7 358H (3910 - 4911, n=8) | |
| Dell XPS 14 Core Ultra X7 358H | |
| Dell XPS 14 2024 OLED | |
| HP EliteBook X G1i 14 AI | |
| AIDA64 / CPU Queen | |
| Dell XPS 14 2024 OLED | |
| Lenovo Yoga Pro 7 14IAH10 | |
| Dell XPS 14 Core Ultra X7 358H | |
| Moyenne Intel Core Ultra X7 358H (63425 - 63827, n=2) | |
| Asus ExpertBook Ultra B9406CAA | |
| HP EliteBook X G1i 14 AI | |
| AIDA64 / FPU SinJulia | |
| Lenovo Yoga Pro 7 14IAH10 | |
| Dell XPS 14 2024 OLED | |
| Dell XPS 14 Core Ultra X7 358H | |
| Moyenne Intel Core Ultra X7 358H (4735 - 7038, n=8) | |
| Asus ExpertBook Ultra B9406CAA | |
| HP EliteBook X G1i 14 AI | |
| AIDA64 / FPU Mandel | |
| Lenovo Yoga Pro 7 14IAH10 | |
| Moyenne Intel Core Ultra X7 358H (14716 - 50734, n=8) | |
| Dell XPS 14 Core Ultra X7 358H | |
| HP EliteBook X G1i 14 AI | |
| Dell XPS 14 2024 OLED | |
| Asus ExpertBook Ultra B9406CAA | |
| AIDA64 / CPU AES | |
| Lenovo Yoga Pro 7 14IAH10 | |
| Dell XPS 14 Core Ultra X7 358H | |
| Dell XPS 14 2024 OLED | |
| Moyenne Intel Core Ultra X7 358H (5127 - 67510, n=8) | |
| HP EliteBook X G1i 14 AI | |
| Asus ExpertBook Ultra B9406CAA | |
| AIDA64 / CPU ZLib | |
| Lenovo Yoga Pro 7 14IAH10 | |
| Asus ExpertBook Ultra B9406CAA | |
| Dell XPS 14 Core Ultra X7 358H | |
| Moyenne Intel Core Ultra X7 358H (932 - 1179, n=8) | |
| Dell XPS 14 2024 OLED | |
| HP EliteBook X G1i 14 AI | |
| AIDA64 / FP64 Ray-Trace | |
| Lenovo Yoga Pro 7 14IAH10 | |
| Moyenne Intel Core Ultra X7 358H (6506 - 9447, n=8) | |
| Dell XPS 14 Core Ultra X7 358H | |
| HP EliteBook X G1i 14 AI | |
| Asus ExpertBook Ultra B9406CAA | |
| Dell XPS 14 2024 OLED | |
| AIDA64 / CPU PhotoWorxx | |
| Dell XPS 14 Core Ultra X7 358H | |
| Moyenne Intel Core Ultra X7 358H (30538 - 88154, n=8) | |
| Lenovo Yoga Pro 7 14IAH10 | |
| HP EliteBook X G1i 14 AI | |
| Dell XPS 14 2024 OLED | |
| Asus ExpertBook Ultra B9406CAA | |
Performance du système
Les scores PCMark sont parmi les plus élevés de tous les ordinateurs portables dotés d'une carte graphique intégrée. Les scores des sous-tests Productivité et Création de contenu numérique, en particulier, représentent des améliorations significatives par rapport aux modèles de la génération précédente.

PCMark 10: Score | Essentials | Productivity | Digital Content Creation
CrossMark: Overall | Productivity | Creativity | Responsiveness
WebXPRT 3: Overall
WebXPRT 4: Overall
Mozilla Kraken 1.1: Total
Geekbench AI: Single Precision GPU 1.7 | Half Precision GPU 1.7 | Quantized GPU 1.7
| Performance rating | |
| Dell XPS 14 Core Ultra X7 358H | |
| Moyenne Intel Core Ultra X7 358H, Intel Arc B390 12 Xe3 Panther Lake iGPU | |
| Asus ExpertBook Ultra B9406CAA | |
| Lenovo Yoga Pro 7 14IAH10 -3! | |
| HP EliteBook X G1i 14 AI | |
| Dell XPS 14 2024 OLED -3! | |
| Dell 14 Premium | |
| PCMark 10 / Score | |
| Dell XPS 14 Core Ultra X7 358H | |
| Moyenne Intel Core Ultra X7 358H, Intel Arc B390 12 Xe3 Panther Lake iGPU (8834 - 9880, n=8) | |
| Asus ExpertBook Ultra B9406CAA | |
| Lenovo Yoga Pro 7 14IAH10 | |
| HP EliteBook X G1i 14 AI | |
| Dell 14 Premium | |
| Dell XPS 14 2024 OLED | |
| PCMark 10 / Essentials | |
| Dell XPS 14 Core Ultra X7 358H | |
| Moyenne Intel Core Ultra X7 358H, Intel Arc B390 12 Xe3 Panther Lake iGPU (10282 - 11263, n=7) | |
| Lenovo Yoga Pro 7 14IAH10 | |
| Asus ExpertBook Ultra B9406CAA | |
| Dell 14 Premium | |
| HP EliteBook X G1i 14 AI | |
| Dell XPS 14 2024 OLED | |
| PCMark 10 / Productivity | |
| Dell XPS 14 Core Ultra X7 358H | |
| Moyenne Intel Core Ultra X7 358H, Intel Arc B390 12 Xe3 Panther Lake iGPU (13908 - 16780, n=7) | |
| Asus ExpertBook Ultra B9406CAA | |
| HP EliteBook X G1i 14 AI | |
| Lenovo Yoga Pro 7 14IAH10 | |
| Dell XPS 14 2024 OLED | |
| Dell 14 Premium | |
| PCMark 10 / Digital Content Creation | |
| Dell XPS 14 Core Ultra X7 358H | |
| Moyenne Intel Core Ultra X7 358H, Intel Arc B390 12 Xe3 Panther Lake iGPU (13082 - 13893, n=7) | |
| Asus ExpertBook Ultra B9406CAA | |
| Lenovo Yoga Pro 7 14IAH10 | |
| Dell 14 Premium | |
| HP EliteBook X G1i 14 AI | |
| Dell XPS 14 2024 OLED | |
| CrossMark / Overall | |
| Moyenne Intel Core Ultra X7 358H, Intel Arc B390 12 Xe3 Panther Lake iGPU (1884 - 2119, n=8) | |
| Lenovo Yoga Pro 7 14IAH10 | |
| Dell XPS 14 Core Ultra X7 358H | |
| Asus ExpertBook Ultra B9406CAA | |
| Dell XPS 14 2024 OLED | |
| HP EliteBook X G1i 14 AI | |
| Dell 14 Premium | |
| CrossMark / Productivity | |
| Lenovo Yoga Pro 7 14IAH10 | |
| Moyenne Intel Core Ultra X7 358H, Intel Arc B390 12 Xe3 Panther Lake iGPU (1678 - 1928, n=8) | |
| Dell XPS 14 Core Ultra X7 358H | |
| Asus ExpertBook Ultra B9406CAA | |
| HP EliteBook X G1i 14 AI | |
| Dell XPS 14 2024 OLED | |
| Dell 14 Premium | |
| CrossMark / Creativity | |
| Moyenne Intel Core Ultra X7 358H, Intel Arc B390 12 Xe3 Panther Lake iGPU (2241 - 2529, n=8) | |
| Dell XPS 14 Core Ultra X7 358H | |
| Lenovo Yoga Pro 7 14IAH10 | |
| Asus ExpertBook Ultra B9406CAA | |
| Dell XPS 14 2024 OLED | |
| HP EliteBook X G1i 14 AI | |
| Dell 14 Premium | |
| CrossMark / Responsiveness | |
| Moyenne Intel Core Ultra X7 358H, Intel Arc B390 12 Xe3 Panther Lake iGPU (1560 - 1837, n=8) | |
| Asus ExpertBook Ultra B9406CAA | |
| Lenovo Yoga Pro 7 14IAH10 | |
| Dell XPS 14 Core Ultra X7 358H | |
| Dell XPS 14 2024 OLED | |
| HP EliteBook X G1i 14 AI | |
| Dell 14 Premium | |
| WebXPRT 3 / Overall | |
| Dell XPS 14 Core Ultra X7 358H | |
| Lenovo Yoga Pro 7 14IAH10 | |
| Moyenne Intel Core Ultra X7 358H, Intel Arc B390 12 Xe3 Panther Lake iGPU (293 - 338, n=8) | |
| HP EliteBook X G1i 14 AI | |
| Asus ExpertBook Ultra B9406CAA | |
| Dell 14 Premium | |
| Dell XPS 14 2024 OLED | |
| WebXPRT 4 / Overall | |
| Lenovo Yoga Pro 7 14IAH10 | |
| Dell XPS 14 Core Ultra X7 358H | |
| Moyenne Intel Core Ultra X7 358H, Intel Arc B390 12 Xe3 Panther Lake iGPU (278 - 305, n=7) | |
| HP EliteBook X G1i 14 AI | |
| Asus ExpertBook Ultra B9406CAA | |
| Dell 14 Premium | |
| Dell XPS 14 2024 OLED | |
| Mozilla Kraken 1.1 / Total | |
| Dell XPS 14 2024 OLED | |
| Dell 14 Premium | |
| HP EliteBook X G1i 14 AI | |
| Moyenne Intel Core Ultra X7 358H, Intel Arc B390 12 Xe3 Panther Lake iGPU (445 - 460, n=8) | |
| Asus ExpertBook Ultra B9406CAA | |
| Dell XPS 14 Core Ultra X7 358H | |
| Lenovo Yoga Pro 7 14IAH10 | |
| Geekbench AI / Single Precision GPU 1.7 | |
| Asus ExpertBook Ultra B9406CAA | |
| Dell XPS 14 Core Ultra X7 358H | |
| Moyenne Intel Core Ultra X7 358H, Intel Arc B390 12 Xe3 Panther Lake iGPU (9783 - 12255, n=6) | |
| HP EliteBook X G1i 14 AI | |
| Dell 14 Premium | |
| Geekbench AI / Half Precision GPU 1.7 | |
| Asus ExpertBook Ultra B9406CAA | |
| Moyenne Intel Core Ultra X7 358H, Intel Arc B390 12 Xe3 Panther Lake iGPU (16188 - 21963, n=6) | |
| Dell XPS 14 Core Ultra X7 358H | |
| HP EliteBook X G1i 14 AI | |
| Dell 14 Premium | |
| Geekbench AI / Quantized GPU 1.7 | |
| Asus ExpertBook Ultra B9406CAA | |
| Dell XPS 14 Core Ultra X7 358H | |
| Moyenne Intel Core Ultra X7 358H, Intel Arc B390 12 Xe3 Panther Lake iGPU (6908 - 8011, n=6) | |
| HP EliteBook X G1i 14 AI | |
| Dell 14 Premium | |
* ... Moindre est la valeur, meilleures sont les performances
| PCMark 10 Score | 9880 points | |
Aide | ||
| AIDA64 / Memory Copy | |
| Dell XPS 14 Core Ultra X7 358H | |
| Moyenne Intel Core Ultra X7 358H (102745 - 132135, n=7) | |
| Lenovo Yoga Pro 7 14IAH10 | |
| HP EliteBook X G1i 14 AI | |
| Dell XPS 14 2024 OLED | |
| AIDA64 / Memory Read | |
| Asus ExpertBook Ultra B9406CAA | |
| Dell XPS 14 Core Ultra X7 358H | |
| Moyenne Intel Core Ultra X7 358H (97755 - 118888, n=8) | |
| Dell XPS 14 2024 OLED | |
| Lenovo Yoga Pro 7 14IAH10 | |
| HP EliteBook X G1i 14 AI | |
| AIDA64 / Memory Write | |
| Dell XPS 14 Core Ultra X7 358H | |
| Moyenne Intel Core Ultra X7 358H (105984 - 134998, n=8) | |
| Asus ExpertBook Ultra B9406CAA | |
| HP EliteBook X G1i 14 AI | |
| Lenovo Yoga Pro 7 14IAH10 | |
| Dell XPS 14 2024 OLED | |
| AIDA64 / Memory Latency | |
| Dell XPS 14 2024 OLED | |
| Lenovo Yoga Pro 7 14IAH10 | |
| HP EliteBook X G1i 14 AI | |
| Dell XPS 14 Core Ultra X7 358H | |
| Moyenne Intel Core Ultra X7 358H (84.6 - 101.9, n=8) | |
* ... Moindre est la valeur, meilleures sont les performances
Latence DPC
LatencyMon ne signale que des problèmes mineurs de DPC et aucune perte d'images lors de la lecture de contenus vidéo 4K60.


| DPC Latencies / LatencyMon - interrupt to process latency (max), Web, Youtube, Prime95 | |
| Dell 14 Premium | |
| Dell XPS 14 2024 OLED | |
| Lenovo Yoga Pro 7 14IAH10 | |
| Dell XPS 14 Core Ultra X7 358H | |
| HP EliteBook X G1i 14 AI | |
| Asus ExpertBook Ultra B9406CAA | |
* ... Moindre est la valeur, meilleures sont les performances
Dispositifs de stockage
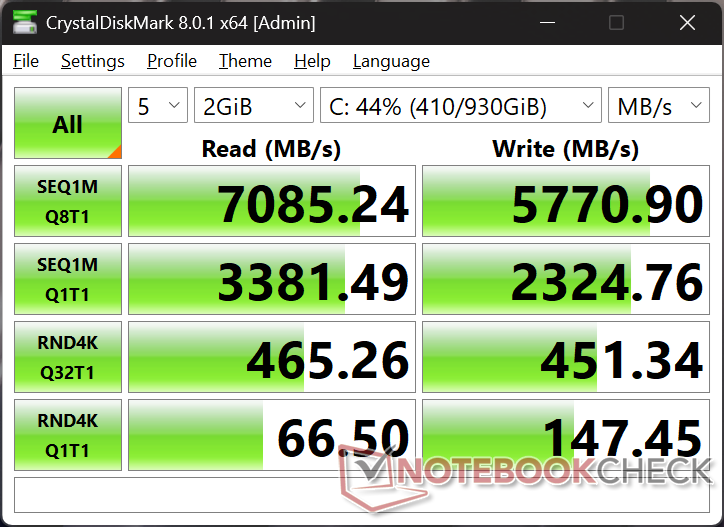
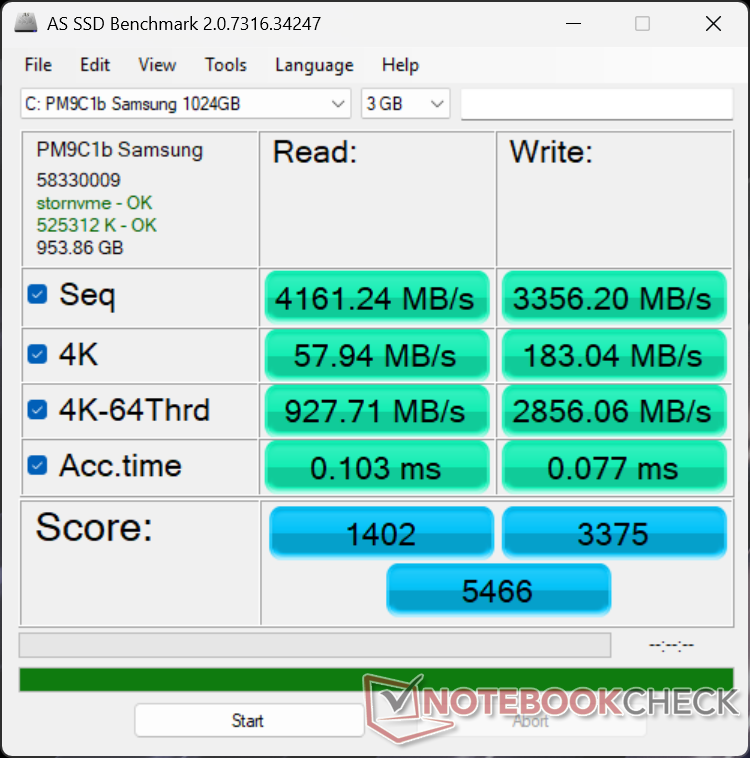
Le SSD Samsung PM9C1b PCIe4 x4 NVMe peut soutenir des taux de transfert de 7000 Mo/s sans aucun problème d'étranglement pour être légèrement plus rapide que le disque Kioxia dans le Dell 14 Premium.


| Drive Performance rating - Percent | |
| Asus ExpertBook Ultra B9406CAA | |
| Lenovo Yoga Pro 7 14IAH10 | |
| Dell XPS 14 Core Ultra X7 358H | |
| Dell XPS 14 2024 OLED | |
| Dell 14 Premium | |
| HP EliteBook X G1i 14 AI | |
* ... Moindre est la valeur, meilleures sont les performances
Throttoir de disque : Boucle de lecture DiskSpd, profondeur de la file d'attente 8
Performance du GPU
Le système intégré Arc B390 est l'un des points forts du XPS 14 2026. Les performances d'une année sur l'autre représentent une amélioration considérable par rapport à l'Arc 140T Arc 140T dans le Dell 14 Premium 2025, qu'il égale ou dépasse même le XPS 14 2024 avec des cartes graphiques dédiées GeForce RTX 4050 dédiée. les scores 3DMark sont environ deux fois supérieurs à ceux de l'Arc 140T, tout en étant 25 à 40 % plus élevés que ceux de la RTX 4050. Pour les opérations de rendu professionnelles, les cœurs CUDA du GPU Nvidia restent cependant plus rapides d'environ 35 %.
L'utilisation de la batterie n'a malheureusement qu'un léger impact sur les performances, comme le montre notre tableau de résultats Fire Strike ci-dessous. Le déficit peut être encore plus important si vous utilisez le mode équilibré au lieu du mode performance.
| Profil d'alimentation | Score graphique | Score physique | Score combiné |
| Mode Performance | 17324 | 25143 | 4879 |
| Mode équilibré | 14560 (-16%) | 21811 (-13%) | 4073 (-17%) |
| Alimentation par batterie | 15875 (-8%) | 27090 (-8%) | 4578 (-6%) |
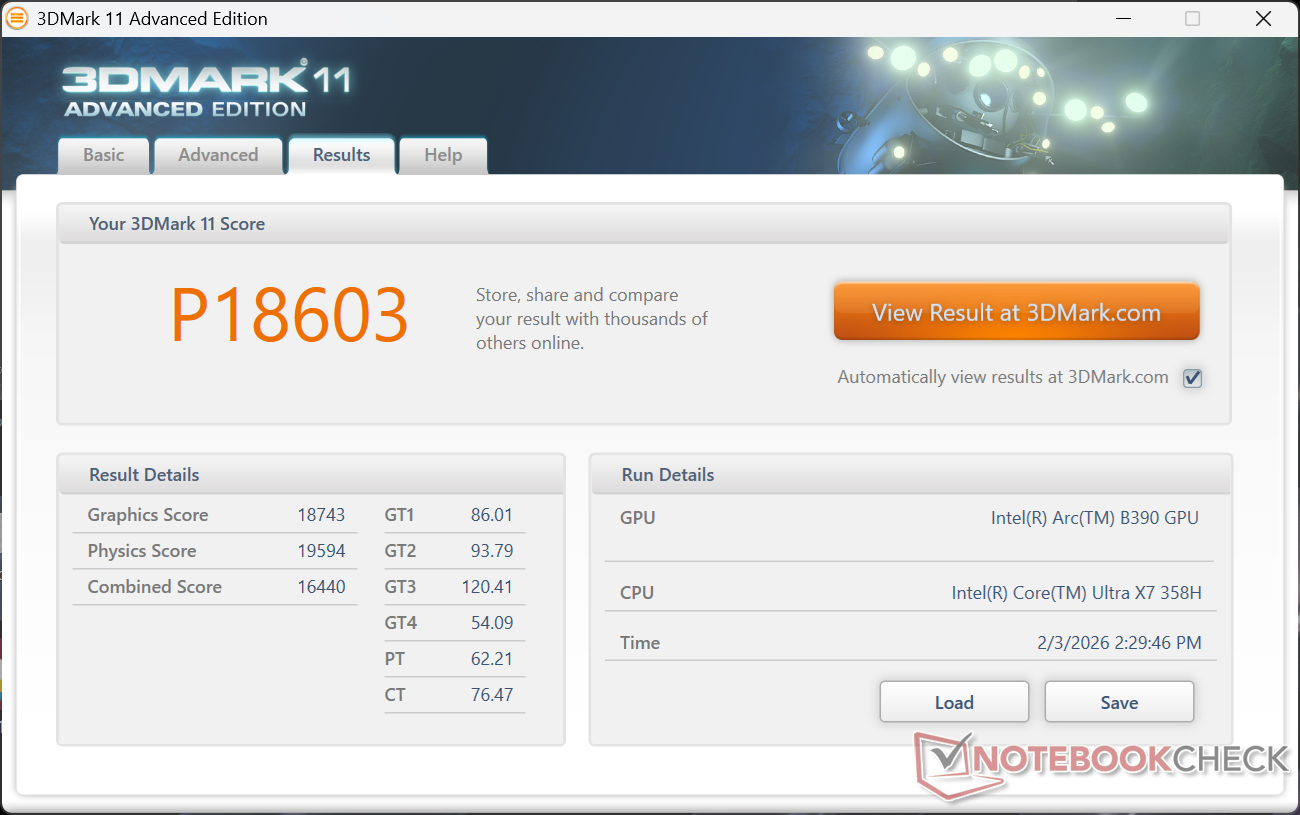


| 3DMark 11 Performance | 18603 points | |
| 3DMark Cloud Gate Standard Score | 48038 points | |
| 3DMark Fire Strike Score | 14336 points | |
| 3DMark Time Spy Score | 7546 points | |
Aide | ||
* ... Moindre est la valeur, meilleures sont les performances
Performances des jeux
Bien qu'il ne s'agisse pas d'un ordinateur portable de jeu, le nouveau XPS 14 peut faire tourner des titres exigeants comme Black Myth Wukong à des paramètres 1080p décents. Notez que les performances de jeu globales ne sont que de 10 % en moyenne par rapport à la XPS 14 équipée de la RTX 4050, même si nos scores synthétiques 3DMark suggèrent des écarts plus importants.
| Performance rating - Percent | |
| Dell XPS 14 2024 OLED | |
| Asus ExpertBook Ultra B9406CAA | |
| Dell XPS 14 Core Ultra X7 358H | |
| HP EliteBook X G1i 14 AI | |
| Lenovo Yoga Pro 7 14IAH10 | |
| Dell 14 Premium | |
| Cyberpunk 2077 - 1920x1080 Ultra Preset (FSR off) | |
| Asus ExpertBook Ultra B9406CAA | |
| Dell XPS 14 Core Ultra X7 358H | |
| Dell XPS 14 2024 OLED | |
| HP EliteBook X G1i 14 AI | |
| Lenovo Yoga Pro 7 14IAH10 | |
| Dell 14 Premium | |
| Baldur's Gate 3 - 1920x1080 Ultra Preset AA:T | |
| Asus ExpertBook Ultra B9406CAA | |
| Dell XPS 14 Core Ultra X7 358H | |
| Dell XPS 14 2024 OLED | |
| HP EliteBook X G1i 14 AI | |
| Lenovo Yoga Pro 7 14IAH10 | |
| Dell 14 Premium | |
| GTA V - 1920x1080 Highest AA:4xMSAA + FX AF:16x | |
| Dell XPS 14 2024 OLED | |
| Asus ExpertBook Ultra B9406CAA | |
| Dell XPS 14 Core Ultra X7 358H | |
| HP EliteBook X G1i 14 AI | |
| Lenovo Yoga Pro 7 14IAH10 | |
| Dell 14 Premium | |
| Final Fantasy XV Benchmark - 1920x1080 High Quality | |
| Asus ExpertBook Ultra B9406CAA | |
| Dell XPS 14 Core Ultra X7 358H | |
| Dell XPS 14 2024 OLED | |
| HP EliteBook X G1i 14 AI | |
| Dell 14 Premium | |
| Lenovo Yoga Pro 7 14IAH10 | |
| Strange Brigade - 1920x1080 ultra AA:ultra AF:16 | |
| Asus ExpertBook Ultra B9406CAA | |
| Dell XPS 14 Core Ultra X7 358H | |
| Dell XPS 14 2024 OLED | |
| Lenovo Yoga Pro 7 14IAH10 | |
| HP EliteBook X G1i 14 AI | |
| Dell 14 Premium | |
| Dota 2 Reborn - 1920x1080 ultra (3/3) best looking | |
| Dell XPS 14 Core Ultra X7 358H | |
| Dell XPS 14 2024 OLED | |
| Asus ExpertBook Ultra B9406CAA | |
| HP EliteBook X G1i 14 AI | |
| Lenovo Yoga Pro 7 14IAH10 | |
| Dell 14 Premium | |
| X-Plane 11.11 - 1920x1080 high (fps_test=3) | |
| Dell XPS 14 2024 OLED | |
| Dell 14 Premium | |
| Dell XPS 14 Core Ultra X7 358H | |
| Asus ExpertBook Ultra B9406CAA | |
| Lenovo Yoga Pro 7 14IAH10 | |
| HP EliteBook X G1i 14 AI | |
Cyberpunk 2077 ultra FPS Chart
| Bas | Moyen | Élevé | Ultra | QHD | |
|---|---|---|---|---|---|
| GTA V (2015) | 176.7 | 171 | 98.2 | 43.3 | 30.9 |
| Dota 2 Reborn (2015) | 135 | 95.4 | 107.6 | 105.4 | |
| Final Fantasy XV Benchmark (2018) | 123.5 | 73.7 | 52.8 | 39 | |
| X-Plane 11.11 (2018) | 59.7 | 47.1 | 40.3 | ||
| Strange Brigade (2018) | 384 | 138.6 | 103.3 | 95.1 | 71.7 |
| Baldur's Gate 3 (2023) | 64.3 | 55.4 | 49 | 48.7 | 34.9 |
| Cyberpunk 2077 (2023) | 68.6 | 56.2 | 46.9 | 40.9 | 24.7 |
| F1 24 (2024) | 145.9 | 132.2 | 100.7 | 36.2 | 23.8 |
| Black Myth: Wukong (2024) | 43 | 34 | 26 | 14 | 11 |
| ARC Raiders (2025) | 104.3 | 57 | 42.4 | 28 | 19.2 |
Émissions
Bruit du système
Le nouveau XPS 14 est capable de rester silencieux plus longtemps que le modèle de l'année dernière. Lors de l'exécution de 3DMark 06, par exemple, le bruit du ventilateur se stabilise à 34 dB(A) vers la fin de la première scène de benchmark, contre 39 dB(A) sur l'ancien modèle Arrow Lake. Sinon, le bruit du ventilateur plafonne toujours à environ 45 dB(A), ce qui est similaire à ce qu'il était auparavant.


Degré de la nuisance sonore
| Au repos |
| 23.3 / 23.3 / 23.3 dB(A) |
| Fortement sollicité |
| 34 / 45.7 dB(A) |
 | ||
30 dB silencieux 40 dB(A) audible 50 dB(A) bruyant |
||
min: | ||
| Dell XPS 14 Core Ultra X7 358H Ultra X7 358H, Arc B390 Panther Lake iGPU | Dell 14 Premium Ultra 7 255H, Arc 140T | Dell XPS 14 2024 OLED Ultra 7 155H, GeForce RTX 4050 Laptop GPU | Asus ExpertBook Ultra B9406CAA Ultra X7 358H, Arc B390 Panther Lake iGPU | Lenovo Yoga Pro 7 14IAH10 Ultra 9 285H, Arc 140T | HP EliteBook X G1i 14 AI Core Ultra 7 268V, Arc 140V | |
|---|---|---|---|---|---|---|
| Noise | -3% | -8% | 3% | -11% | -10% | |
| arrêt / environnement * (dB) | 22.9 | 23 -0% | 24.3 -6% | 22.9 -0% | 24.5 -7% | 28.2 -23% |
| Idle Minimum * (dB) | 23.3 | 23.2 -0% | 24.3 -4% | 23.4 -0% | 24.5 -5% | 28.4 -22% |
| Idle Average * (dB) | 23.3 | 24 -3% | 26.5 -14% | 23.4 -0% | 24.5 -5% | 28.4 -22% |
| Idle Maximum * (dB) | 23.3 | 24.7 -6% | 28.5 -22% | 23.4 -0% | 24.5 -5% | 28.8 -24% |
| Load Average * (dB) | 34 | 39 -15% | 37 -9% | 28.6 16% | 46.9 -38% | 33.5 1% |
| Cyberpunk 2077 ultra * (dB) | 43.5 | 43 1% | 42.8 2% | 46.9 -8% | 39.1 10% | |
| Load Maximum * (dB) | 45.7 | 44.9 2% | 43.3 5% | 45.2 1% | 48.7 -7% | 40.4 12% |
| Witcher 3 ultra * (dB) | 39.1 |
* ... Moindre est la valeur, meilleures sont les performances
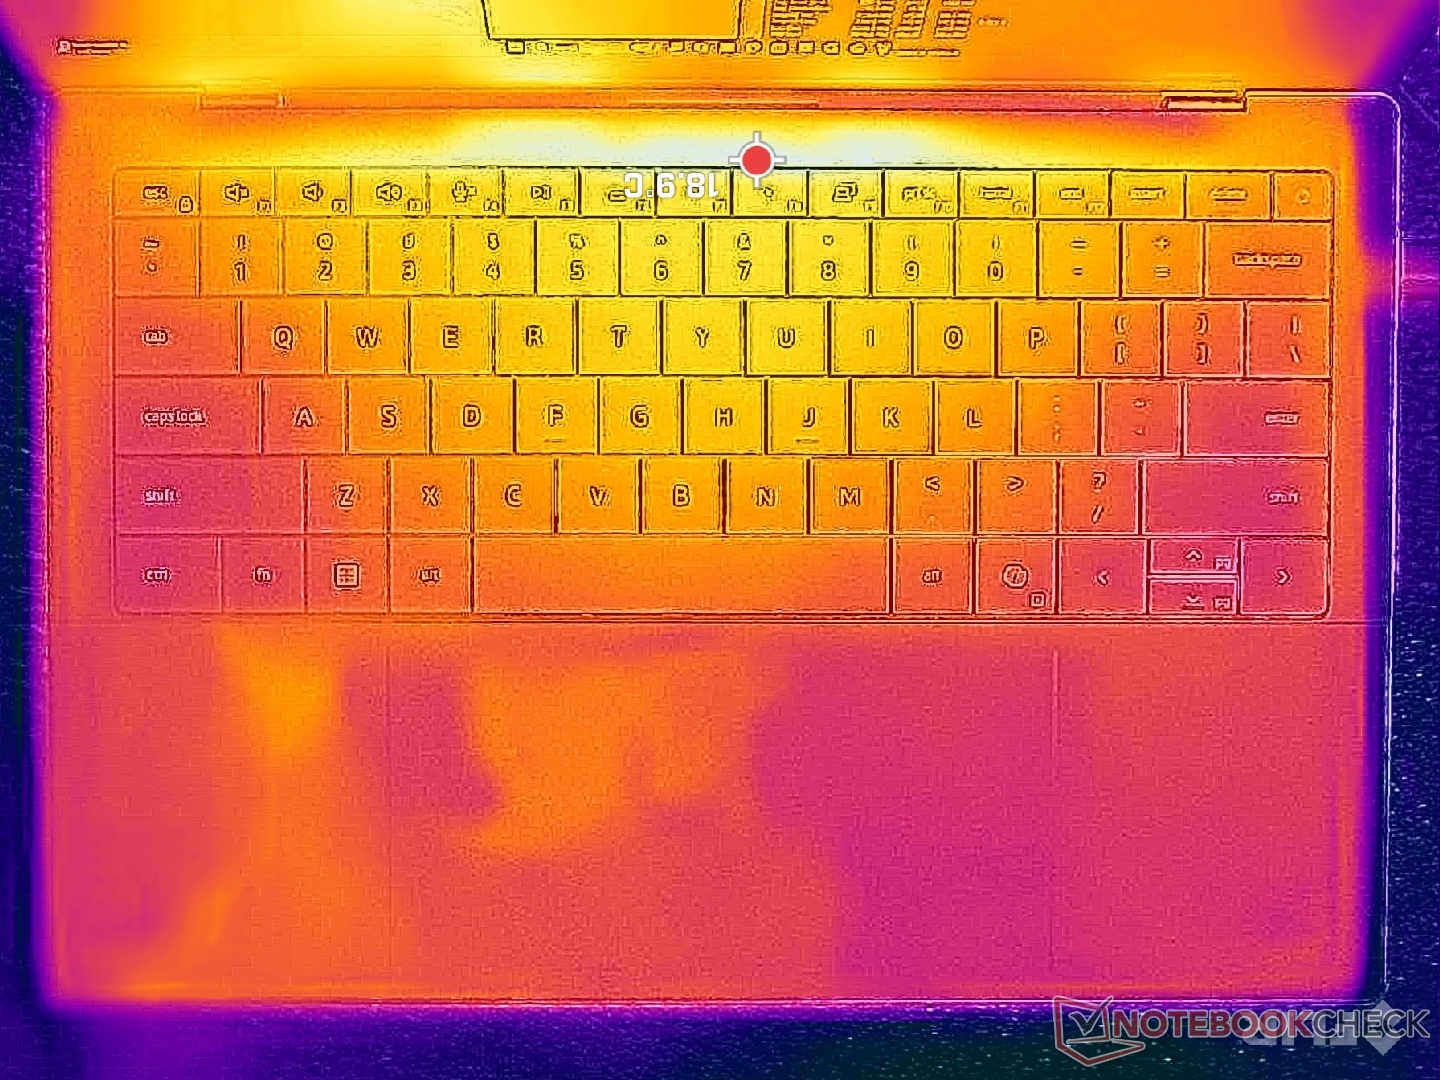
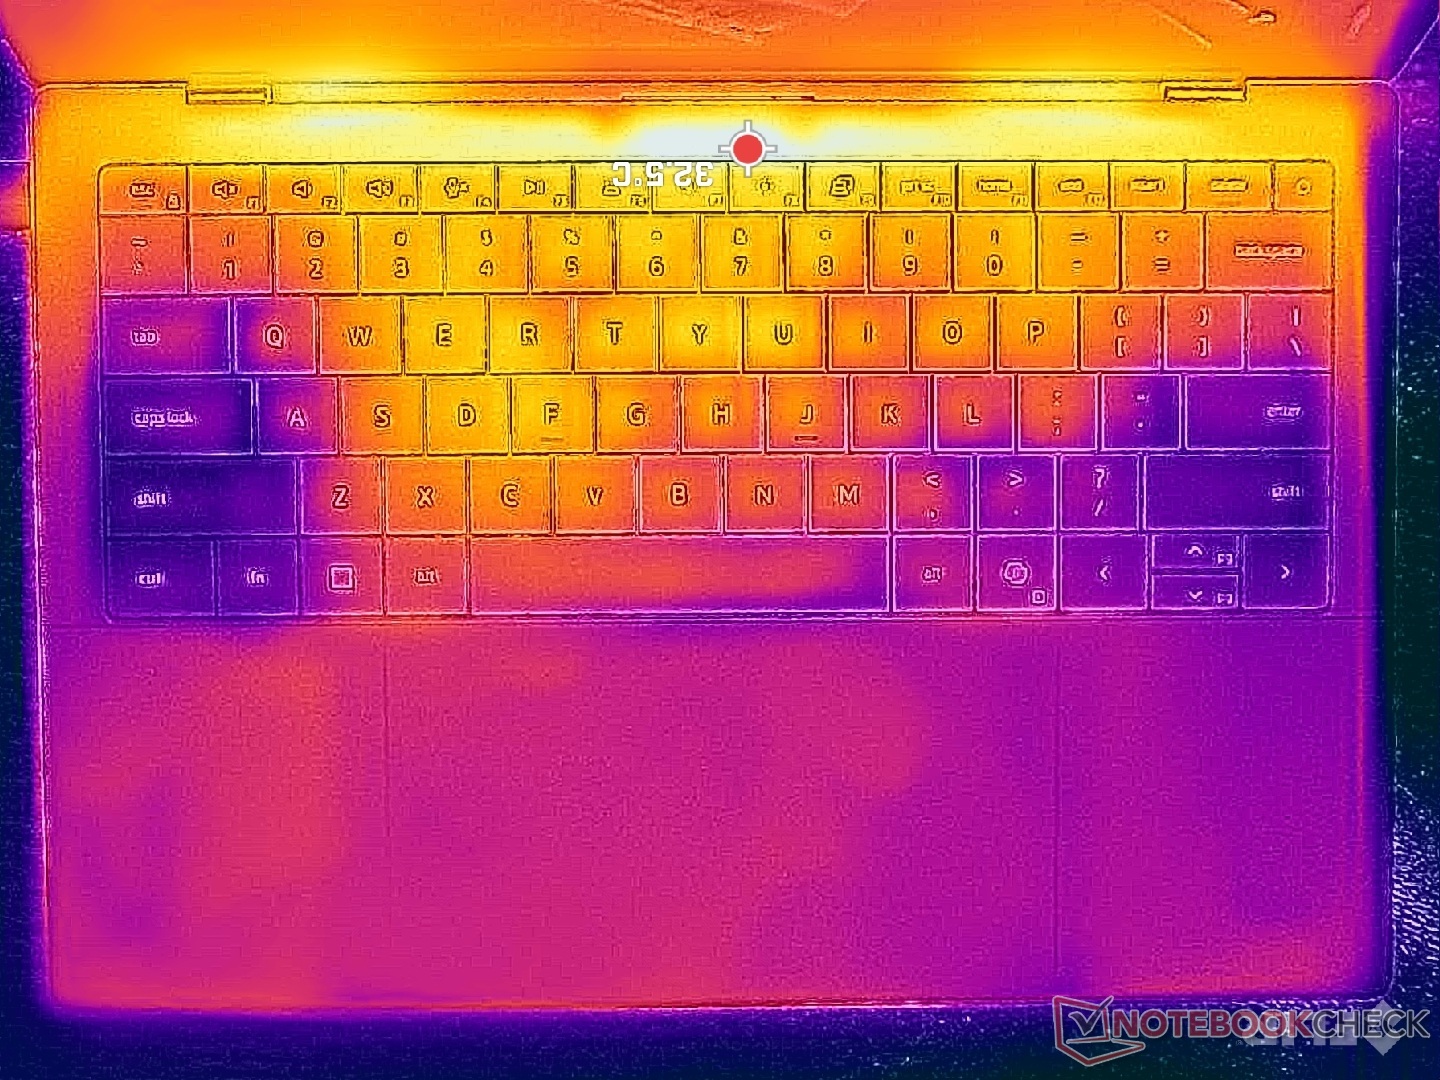
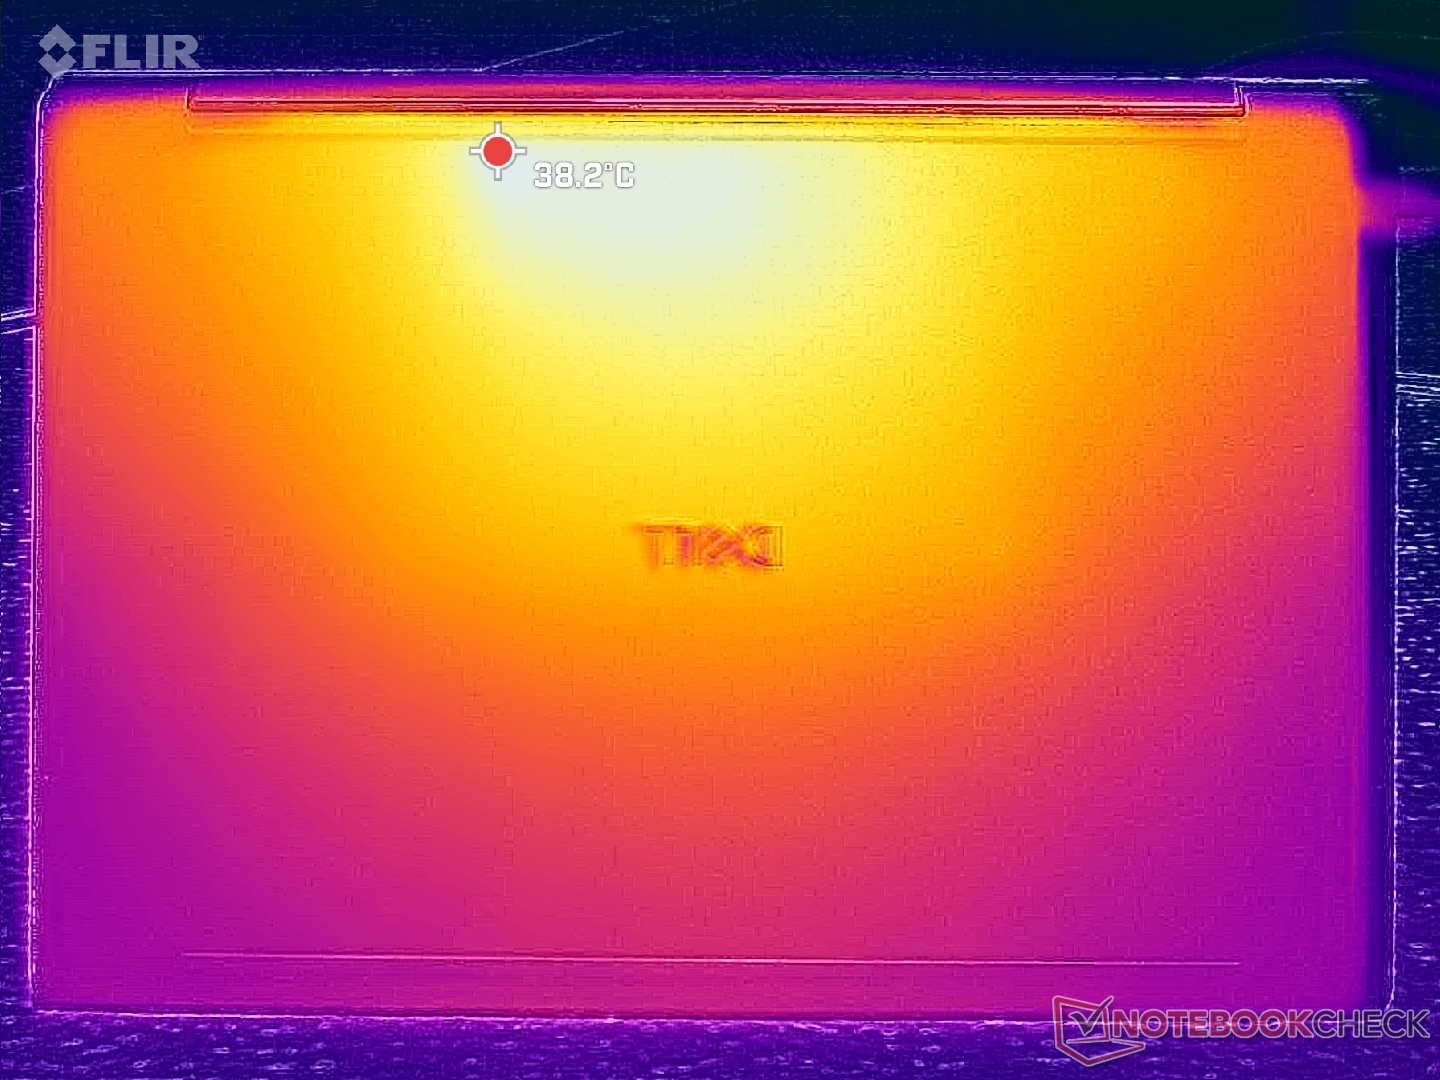
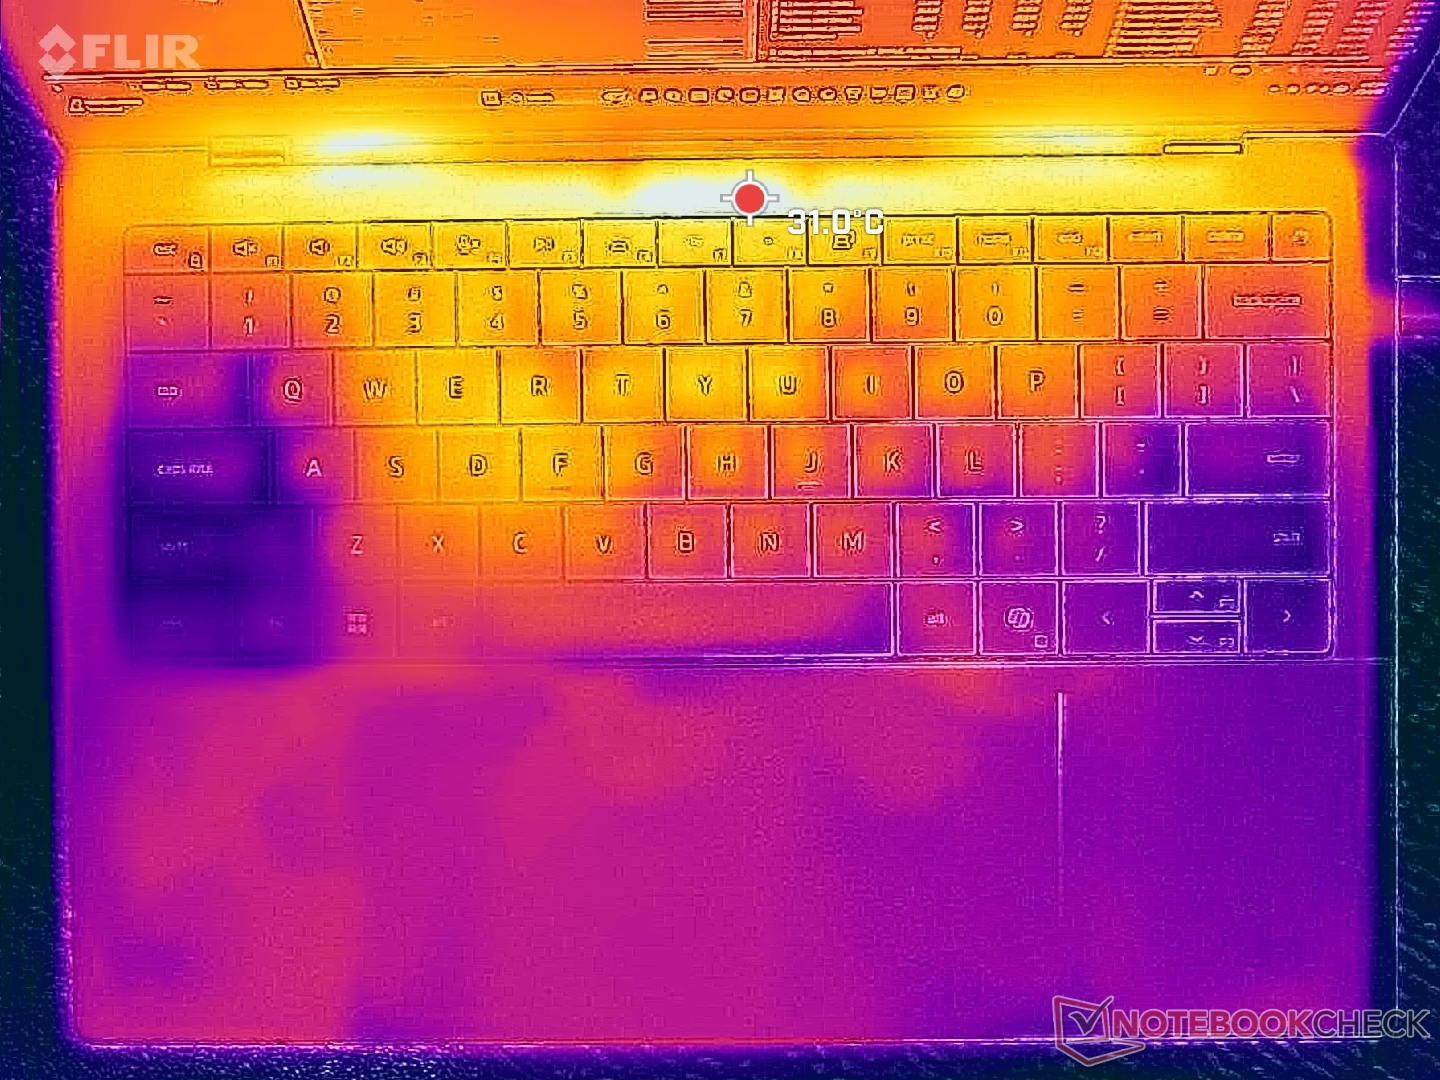
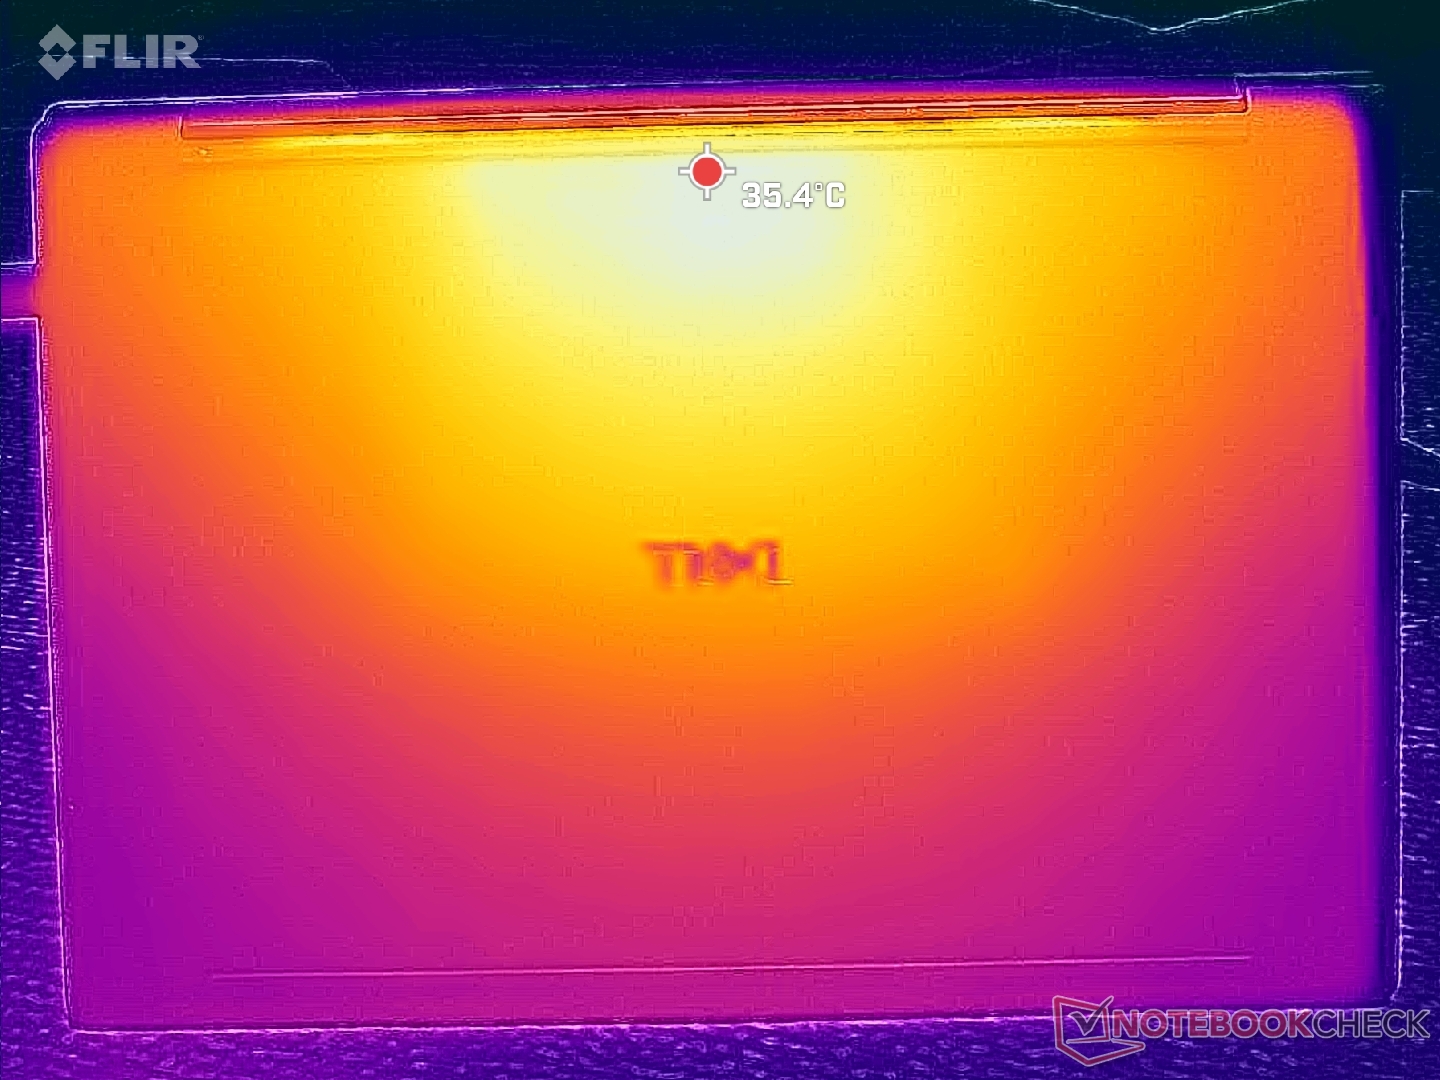
Température
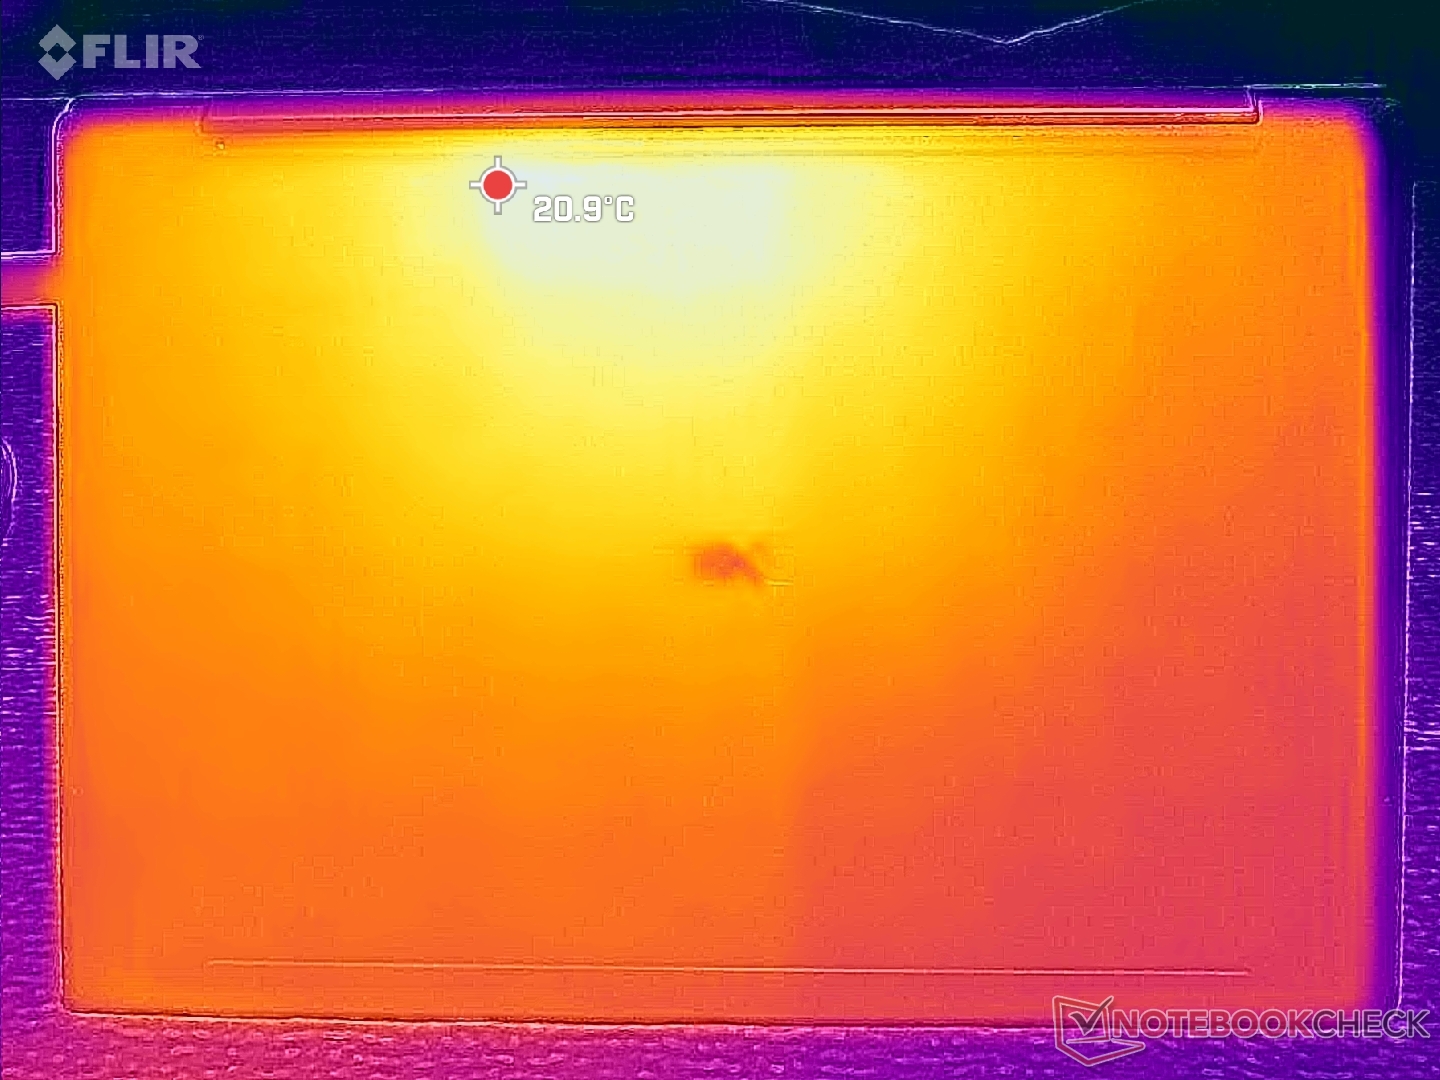
Les températures de surface sont légèrement plus élevées que celles que nous avons enregistrées sur le Dell 14 Premium 2025, en particulier sur la partie inférieure (couvercle D) lors de l'exécution de charges plus exigeantes. Le point chaud atteint 36°C à 39°C contre 34°C sur le modèle de l'année dernière. Les différences sont par ailleurs minimes et pas assez chaudes pour être gênantes pendant l'utilisation.
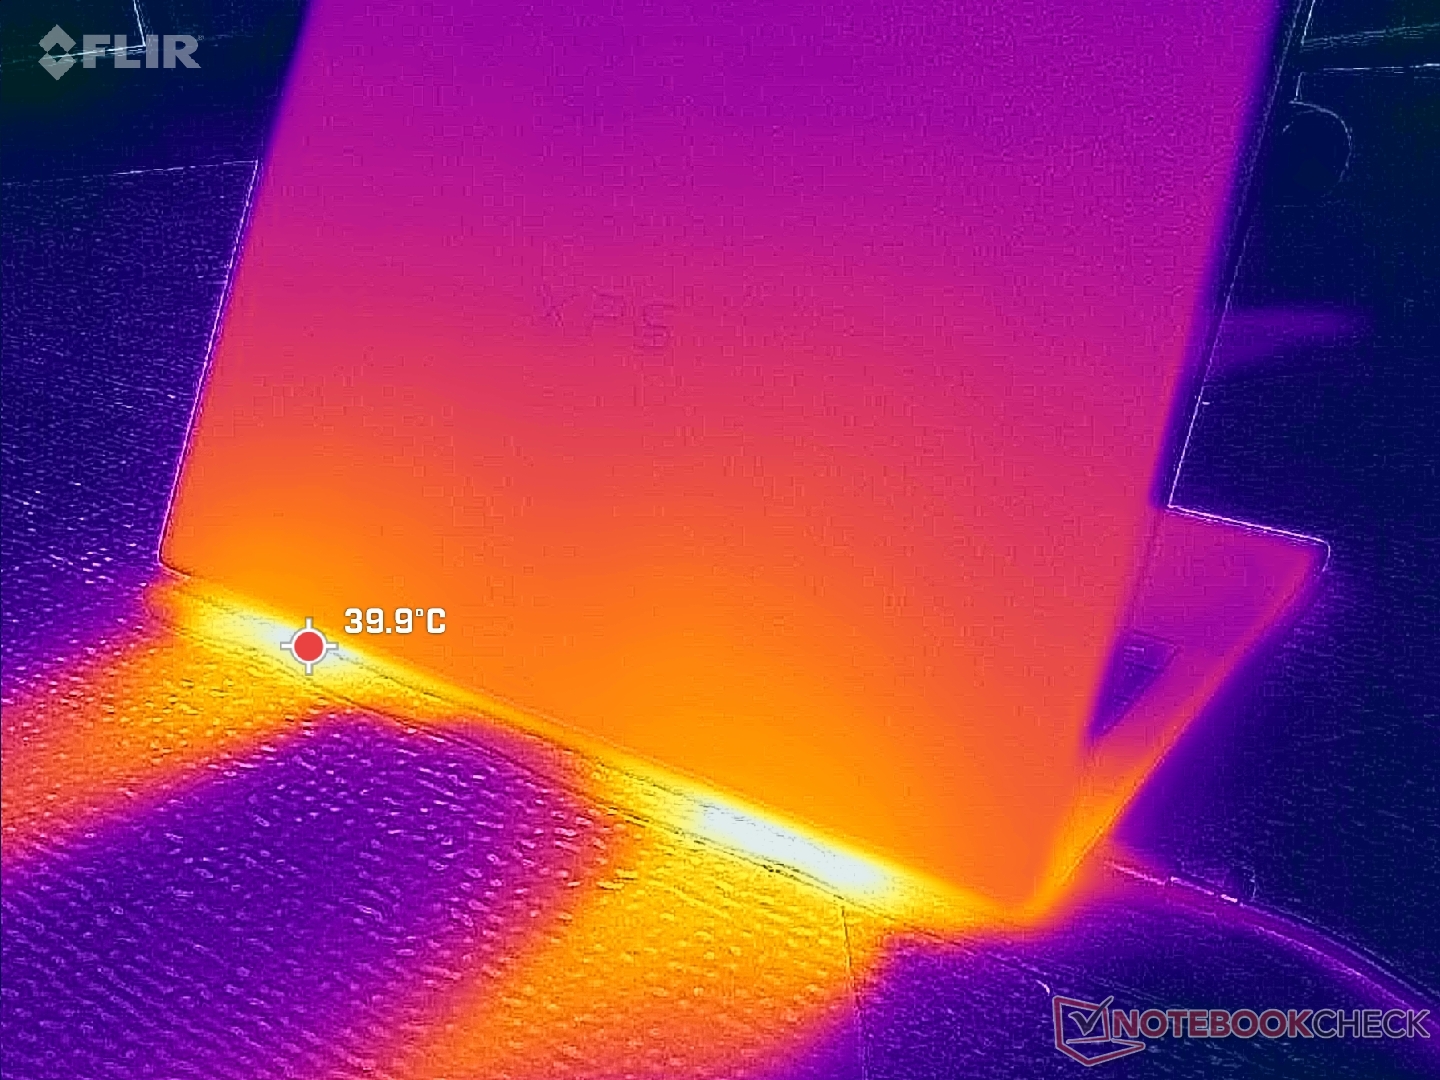
(+) La température maximale du côté supérieur est de 34 °C / 93 F, par rapport à la moyenne de 36.8 °C / 98 F, allant de 21 à 71 °C pour la classe Multimedia.
(+) Le fond chauffe jusqu'à un maximum de 35.8 °C / 96 F, contre une moyenne de 39.1 °C / 102 F
(+) En utilisation inactive, la température moyenne du côté supérieur est de 24.6 °C / 76 F, par rapport à la moyenne du dispositif de 31.3 °C / 88 F.
(+) 3: The average temperature for the upper side is 30.1 °C / 86 F, compared to the average of 31.3 °C / 88 F for the class Multimedia.
(+) Les repose-poignets et le pavé tactile sont plus froids que la température de la peau avec un maximum de 31.2 °C / 88.2 F et sont donc froids au toucher.
(-) La température moyenne de la zone de l'appui-paume de dispositifs similaires était de 28.7 °C / 83.7 F (-2.5 °C / #-4.5 F).
| Dell XPS 14 Core Ultra X7 358H Ultra X7 358H, Arc B390 Panther Lake iGPU | Dell 14 Premium Ultra 7 255H, Arc 140T | Dell XPS 14 2024 OLED Ultra 7 155H, GeForce RTX 4050 Laptop GPU | Asus ExpertBook Ultra B9406CAA Ultra X7 358H, Arc B390 Panther Lake iGPU | Lenovo Yoga Pro 7 14IAH10 Ultra 9 285H, Arc 140T | HP EliteBook X G1i 14 AI Core Ultra 7 268V, Arc 140V | |
|---|---|---|---|---|---|---|
| Heat | 2% | -12% | -4% | -8% | 5% | |
| Maximum Upper Side * (°C) | 34 | 33 3% | 40.5 -19% | 38.6 -14% | 38.1 -12% | 35 -3% |
| Maximum Bottom * (°C) | 35.8 | 33.6 6% | 42.6 -19% | 38.4 -7% | 36.5 -2% | 33.4 7% |
| Idle Upper Side * (°C) | 25.6 | 26.4 -3% | 26.9 -5% | 24.6 4% | 28.2 -10% | 23.8 7% |
| Idle Bottom * (°C) | 26.4 | 25.6 3% | 27.8 -5% | 26 2% | 28.8 -9% | 24.2 8% |
* ... Moindre est la valeur, meilleures sont les performances
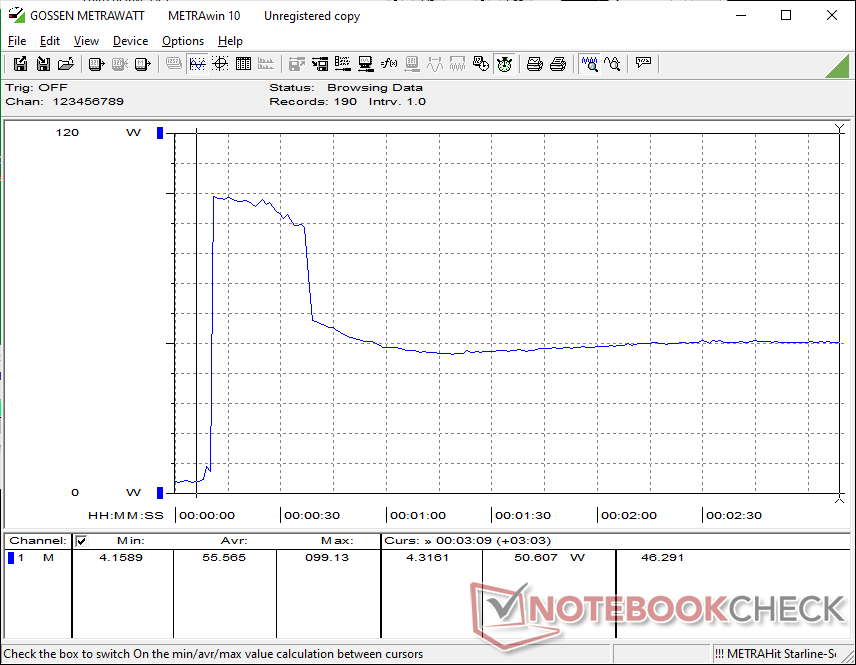
Test de stress

Lors de l'exécution du stress Prime95, le CPU atteignait 3 GHz, 69 W et 100 C avant de retomber à 2 GHz, 30 W et 74 C environ 30 secondes plus tard. La durabilité du Turbo Boost est donc limitée, ce qui correspond à nos observations CineBench R15 ci-dessus. En comparaison, le même processeur dans l ExpertBook Ultra se stabiliserait à une température plus élevée de 48 W pour une performance plus rapide du processeur.
La fréquence d'horloge et la température du GPU se stabilisent à 2000 MHz et 63°C avec Cyberpunk 2077, contre 2500 MHz et 88°C sur l'Asus susmentionné, même en mode Ultra Performance.


| Horloge moyenne du CPU (GHz) | Horloge du GPU (MHz) | Température moyenne du CPU (°C) | |
| Système au repos | -- | -- | 41 |
| Prime95 Stress | 2.0 | -- | 74 |
| Prime95 + FurMark Stress | 1.5 | 1350 | 67 |
| Cyberpunk 2077 Stress (mode Performance) | 0.8 | 2000 | 63 |
| Cyberpunk 2077 Stress (mode équilibré) | 0.8 | 1950 | 62 |
Intervenants
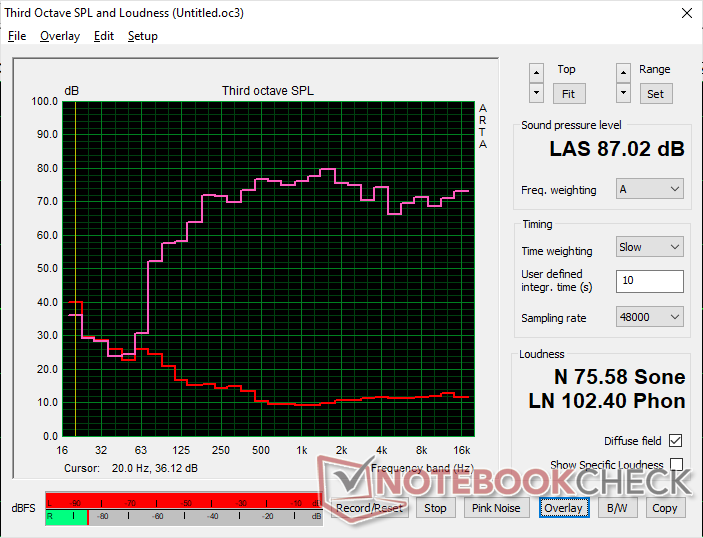

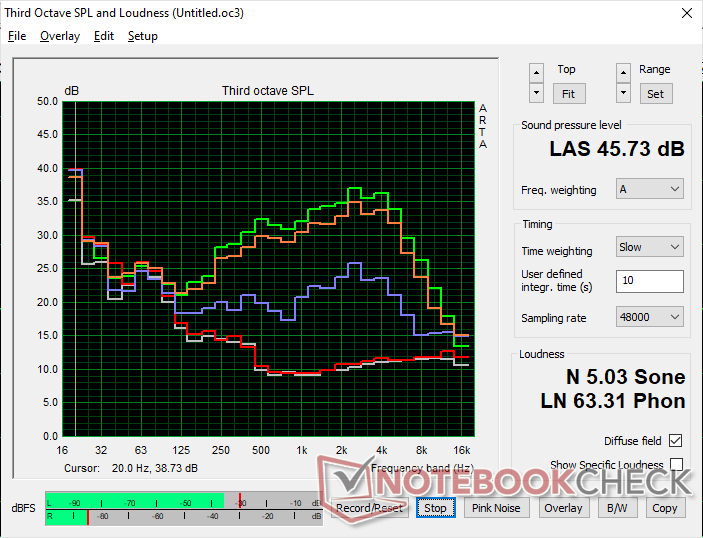
Dell XPS 14 Core Ultra X7 358H analyse audio
(+) | les haut-parleurs peuvent jouer relativement fort (87# dB)
Basses 100 - 315 Hz
(±) | basse réduite - en moyenne 7.6% inférieure à la médiane
(+) | les basses sont linéaires (5.9% delta à la fréquence précédente)
Médiums 400 - 2000 Hz
(+) | médiane équilibrée - seulement 3.2% de la médiane
(+) | les médiums sont linéaires (3.6% delta à la fréquence précédente)
Aiguës 2 - 16 kHz
(+) | des sommets équilibrés - à seulement 3.3% de la médiane
(+) | les aigus sont linéaires (5.8% delta à la fréquence précédente)
Globalement 100 - 16 000 Hz
(+) | le son global est linéaire (7.3% différence à la médiane)
Par rapport à la même classe
» 6% de tous les appareils testés de cette catégorie étaient meilleurs, 1% similaires, 93% pires
» Le meilleur avait un delta de 5%, la moyenne était de 17%, le pire était de 45%.
Par rapport à tous les appareils testés
» 1% de tous les appareils testés étaient meilleurs, 0% similaires, 99% pires
» Le meilleur avait un delta de 4%, la moyenne était de 24%, le pire était de 134%.
Apple MacBook Pro 16 2021 M1 Pro analyse audio
(+) | les haut-parleurs peuvent jouer relativement fort (84.7# dB)
Basses 100 - 315 Hz
(+) | bonne basse - seulement 3.8% loin de la médiane
(+) | les basses sont linéaires (5.2% delta à la fréquence précédente)
Médiums 400 - 2000 Hz
(+) | médiane équilibrée - seulement 1.3% de la médiane
(+) | les médiums sont linéaires (2.1% delta à la fréquence précédente)
Aiguës 2 - 16 kHz
(+) | des sommets équilibrés - à seulement 1.9% de la médiane
(+) | les aigus sont linéaires (2.7% delta à la fréquence précédente)
Globalement 100 - 16 000 Hz
(+) | le son global est linéaire (4.6% différence à la médiane)
Par rapport à la même classe
» 0% de tous les appareils testés de cette catégorie étaient meilleurs, 0% similaires, 100% pires
» Le meilleur avait un delta de 5%, la moyenne était de 17%, le pire était de 45%.
Par rapport à tous les appareils testés
» 0% de tous les appareils testés étaient meilleurs, 0% similaires, 100% pires
» Le meilleur avait un delta de 4%, la moyenne était de 24%, le pire était de 134%.
Gestion de l'énergie
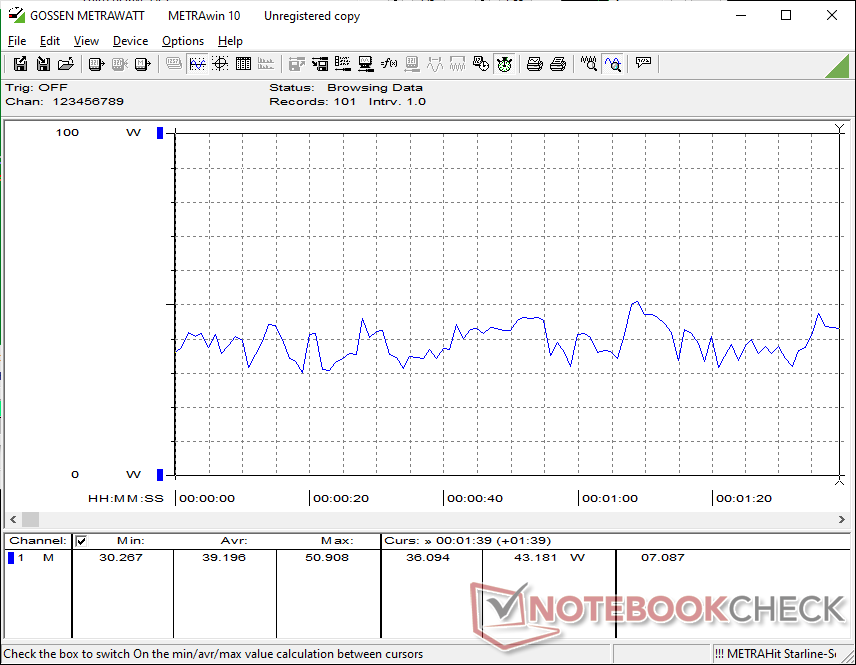
Consommation électrique
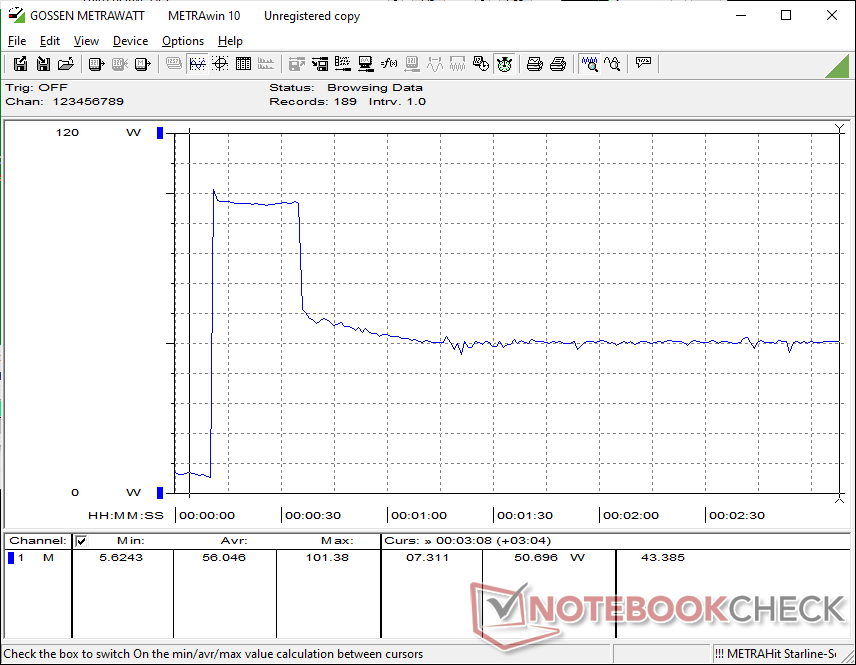
Les performances graphiques par watt sont l'un des points forts du XPS 14 2026, grâce à Panther Lake. L'exécution de Cyberpunk 2077, par exemple, demande à peu près la même chose que le XPS 14 2025 et pourtant les performances sont environ 80 % plus rapides, ce qui représente une amélioration significative d'une année sur l'autre. Néanmoins, les gains en termes de performances CPU par watt par rapport au Core Ultra 7 255H de l'année dernière sont comparativement mineurs.
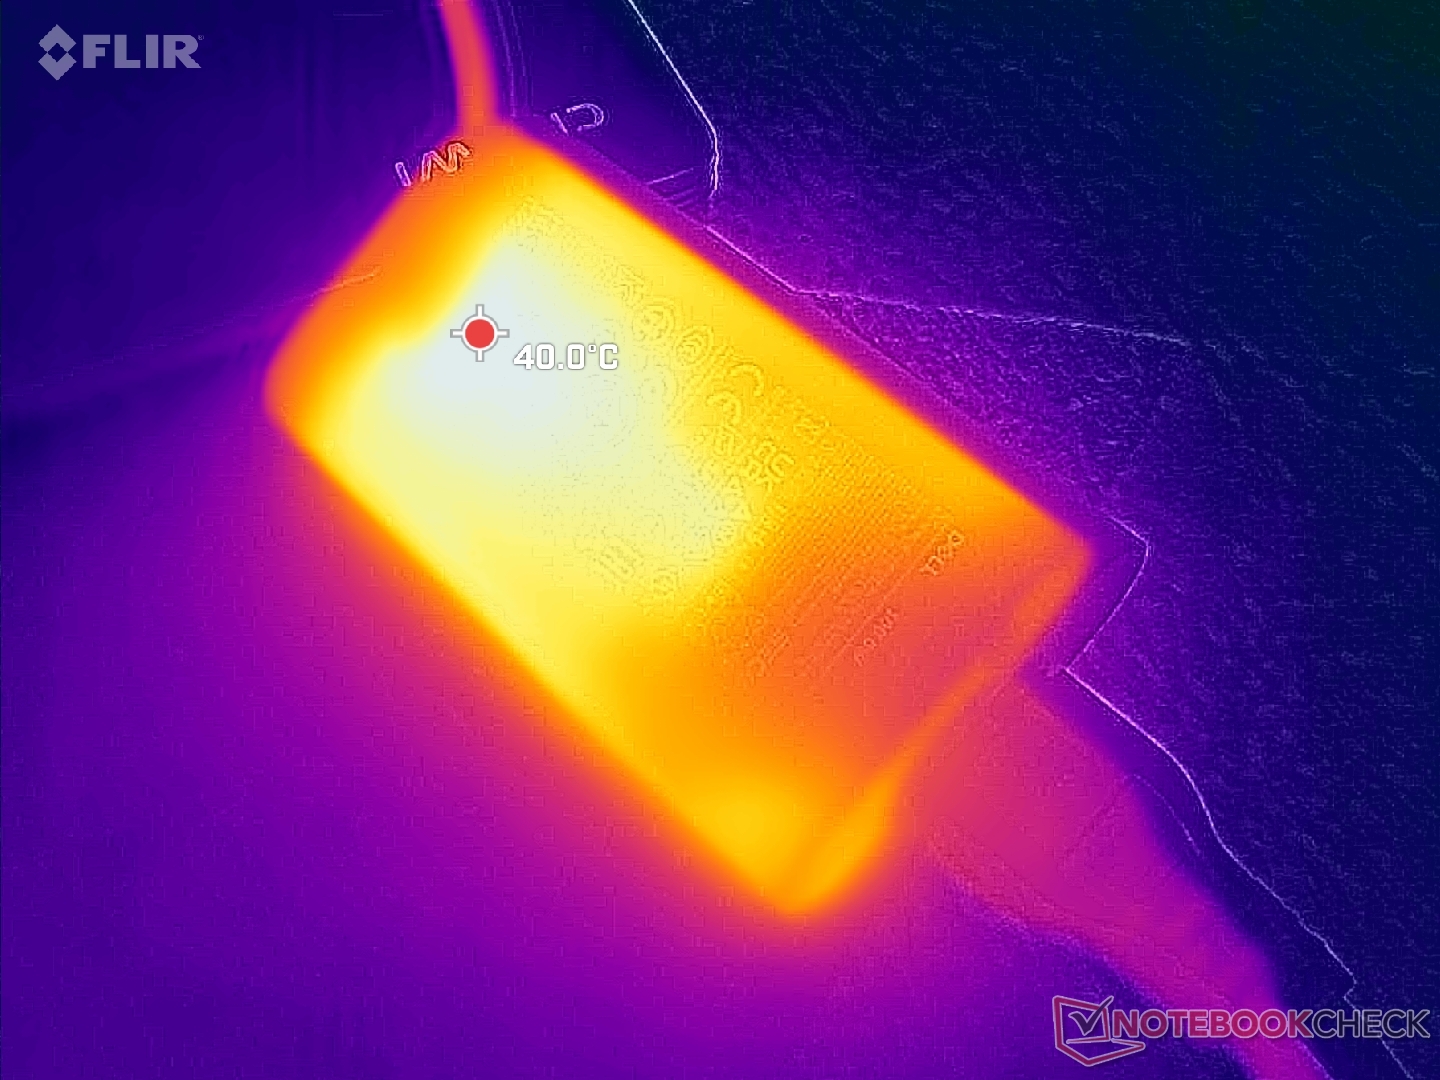
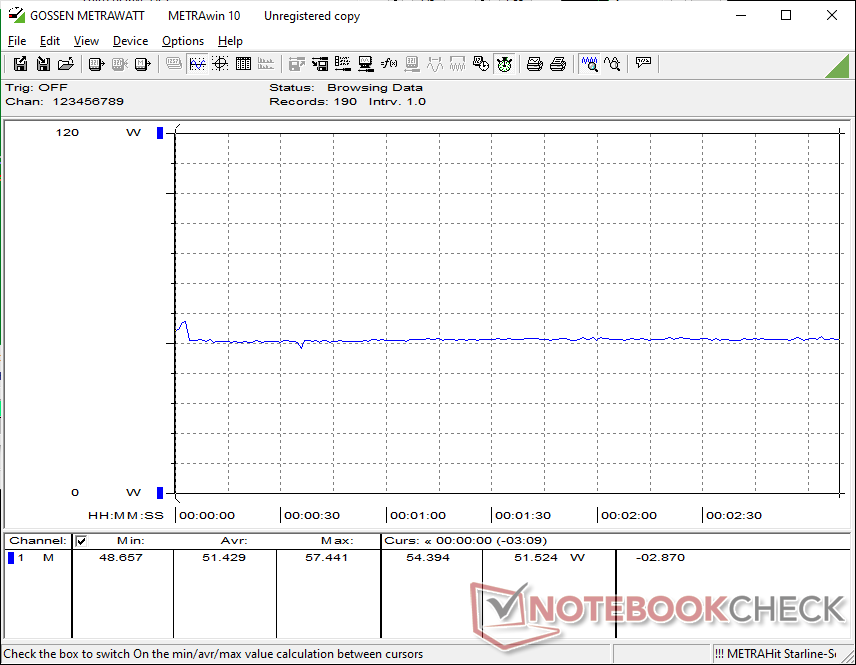
Nous sommes en mesure d'enregistrer une consommation maximale temporaire de 102 W à partir du petit (~10,2 x 5,5 x 2,2 cm) adaptateur secteur USB-C 100 W lorsque le CPU est pleinement sollicité, ce qui est beaucoup plus élevé que sur le 2025 XPS 14 dans des conditions similaires. Le plafond de puissance plus élevé illustre le plafond Turbo Boost plus élevé de Panther Lake-H par rapport à Arrow Lake-H.
| Éteint/en veille | |
| Au repos | |
| Fortement sollicité |
|
Légende:
min: | |
| Dell XPS 14 Core Ultra X7 358H Ultra X7 358H, Arc B390 Panther Lake iGPU, Samsung PM9C1b MZVL81T0HFLB-00BH1, OLED, 2880x1800, 14" | Dell 14 Premium Ultra 7 255H, Arc 140T, Kioxia BG6 KBG6AZNV1T02, OLED, 3200x2000, 14.5" | Dell XPS 14 2024 OLED Ultra 7 155H, GeForce RTX 4050 Laptop GPU, Samsung PM9A1 MZVL21T0HCLR, OLED, 3200x2000, 14.5" | Asus ExpertBook Ultra B9406CAA Ultra X7 358H, Arc B390 Panther Lake iGPU, Samsung PM9E1 MZVLC2T0HBLD, OLED, 2880x1800, 14" | Lenovo Yoga Pro 7 14IAH10 Ultra 9 285H, Arc 140T, WD PC SN7100S SDFPMSL-1T00-1101, OLED, 3000x1876, 14.5" | HP EliteBook X G1i 14 AI Core Ultra 7 268V, Arc 140V, Kioxia XG8 KXG80ZNV512G, IPS, 1920x1200, 14" | |
|---|---|---|---|---|---|---|
| Power Consumption | -20% | -88% | 1% | -73% | 12% | |
| Idle Minimum * (Watt) | 3.1 | 4.4 -42% | 8.1 -161% | 3.5 -13% | 7.9 -155% | 2.5 19% |
| Idle Average * (Watt) | 3.6 | 6.1 -69% | 9.9 -175% | 4 -11% | 10.5 -192% | 5.4 -50% |
| Idle Maximum * (Watt) | 10 | 13.7 -37% | 10.4 -4% | 5.3 47% | 10.8 -8% | 5.8 42% |
| Load Average * (Watt) | 39.2 | 53.8 -37% | 75.6 -93% | 43.7 -11% | 64 -63% | 36.9 6% |
| Cyberpunk 2077 ultra * (Watt) | 51.4 | 50.7 1% | 61.3 -19% | 76.3 -48% | 48.5 6% | |
| Cyberpunk 2077 ultra external monitor * (Watt) | 51.2 | 46.5 9% | 61.4 -20% | 72.6 -42% | 44.9 12% | |
| Load Maximum * (Watt) | 101.4 | 62.7 38% | 107.1 -6% | 63.4 37% | 103.2 -2% | 54.6 46% |
| Witcher 3 ultra * (Watt) | 65.6 |
* ... Moindre est la valeur, meilleures sont les performances
Consommation électrique Cyberpunk / Stress Test
Consommation électrique du moniteur externe
Autonomie de la batterie

L'autonomie du WLAN dure près de 17 heures en mode équilibré, ce qui est très proche de ce que nous avons enregistré sur l'ExpertBook Ultra équipé de la même manière. Cependant, notez que Windows VRR n'est pas automatiquement activé pour un taux de rafraîchissement fixe par défaut de 120 Hz ; l'activer manuellement ferait chuter le taux de rafraîchissement à seulement 20 Hz en mode statique pour des durées d'utilisation potentiellement plus longues.
L'adaptateur secteur fourni permet de recharger l'ordinateur de sa capacité maximale en 1,5 à 2 heures.
| Dell XPS 14 Core Ultra X7 358H Ultra X7 358H, Arc B390 Panther Lake iGPU, 70 Wh | Dell 14 Premium Ultra 7 255H, Arc 140T, 69.5 Wh | Dell XPS 14 2024 OLED Ultra 7 155H, GeForce RTX 4050 Laptop GPU, 69.5 Wh | Asus ExpertBook Ultra B9406CAA Ultra X7 358H, Arc B390 Panther Lake iGPU, 70 Wh | Lenovo Yoga Pro 7 14IAH10 Ultra 9 285H, Arc 140T, 84 Wh | HP EliteBook X G1i 14 AI Core Ultra 7 268V, Arc 140V, 68 Wh | |
|---|---|---|---|---|---|---|
| Autonomie de la batterie | -36% | -54% | -4% | -39% | 10% | |
| WiFi v1.3 (h) | 16.8 | 10.8 -36% | 7.8 -54% | 16.1 -4% | 10.3 -39% | 18.5 10% |
| H.264 (h) | 10.6 | |||||
| Load (h) | 1.3 |
Notebookcheck Rating
Le XPS 14 2026 représente une amélioration significative par rapport à la génération précédente, notamment en termes de performances par watt, mais la facilité d'entretien en pâtit quelque peu.
Dell XPS 14 Core Ultra X7 358H
- 02/07/2026 v8
Allen Ngo
 Total Sustainability Score:
 Comparaison avec des concurrents potentiels
Image | Modèle | Prix | Poids | Épaisseur | Écran |
|---|---|---|---|---|---|
1. 87.4%  | Dell XPS 14 Core Ultra X7 358H Intel Core Ultra X7 358H ⎘ Intel Arc B390 12 Xe3 Panther Lake iGPU ⎘ 32 Go Mémoire, 1000 Go SSD | Amazon: 1. $2,267.80 Dell XPS 14 Premium Laptop D... 2. $1,899.00 Dell XPS 14 9440 14.5" Noteb... 3. $1,299.99 Dell XPS 13 9345 12-Core AI ... Prix de liste: 2200 USD | 1.4 kg | 14.62 mm | 14.00" 2880x1800 243 PPI OLED |
2. 82.5%  | Dell 14 Premium Intel Core Ultra 7 255H ⎘ Intel Arc Graphics 140T ⎘ 32 Go Mémoire, 1024 Go SSD | Amazon: Prix de liste: 1950 USD | 1.7 kg | 18 mm | 14.50" 3200x2000 260 PPI OLED |
3. 86.3% v7 (old)  | Dell XPS 14 2024 OLED Intel Core Ultra 7 155H ⎘ NVIDIA GeForce RTX 4050 Laptop GPU ⎘ 32 Go Mémoire, 1024 Go SSD | Amazon: Prix de liste: 2949€ | 1.8 kg | 19 mm | 14.50" 3200x2000 260 PPI OLED |
4. 87.6%  | Asus ExpertBook Ultra B9406CAA Intel Core Ultra X7 358H ⎘ Intel Arc B390 12 Xe3 Panther Lake iGPU ⎘ 32 Go Mémoire, 2048 Go SSD | Amazon: | 1.1 kg | 15.9 mm | 14.00" 2880x1800 243 PPI OLED |
5. 87.3%  | Lenovo Yoga Pro 7 14IAH10 Intel Core Ultra 9 285H ⎘ Intel Arc Graphics 140T ⎘ 32 Go Mémoire, 1024 Go SSD | Amazon: Prix de liste: 1500€ | 1.6 kg | 18.9 mm | 14.50" 3000x1876 244 PPI OLED |
6. 85.1%  | HP EliteBook X G1i 14 AI Intel Core Ultra 7 268V ⎘ Intel Arc Graphics 140V ⎘ 32 Go Mémoire, 512 Go SSD | Amazon: Prix de liste: 3300 USD | 1.2 kg | 15 mm | 14.00" 1920x1200 162 PPI IPS |
Transparency
La sélection des appareils à examiner est effectuée par notre équipe éditoriale. L'échantillon de test a été prêté à l'auteur par le fabricant ou le détaillant pour les besoins de cet examen. Le prêteur n'a pas eu d'influence sur cette évaluation et le fabricant n'a pas reçu de copie de cette évaluation avant sa publication. Il n'y avait aucune obligation de publier cet article. En tant que média indépendant, Notebookcheck n'est pas soumis à l'autorité des fabricants, des détaillants ou des éditeurs.
Voici comment Notebookcheck teste
Chaque année, Notebookcheck examine de manière indépendante des centaines d'ordinateurs portables et de smartphones en utilisant des procédures standardisées afin de garantir que tous les résultats sont comparables. Nous avons continuellement développé nos méthodes de test depuis environ 20 ans et avons établi des normes industrielles dans le processus. Dans nos laboratoires de test, des équipements de mesure de haute qualité sont utilisés par des techniciens et des rédacteurs expérimentés. Ces tests impliquent un processus de validation en plusieurs étapes. Notre système d'évaluation complexe repose sur des centaines de mesures et de points de référence bien fondés, ce qui garantit l'objectivité.
