Test de l'Asus TUF Gaming A17 FA707XI : 140 W GeForce RTX 4070 pour $1400

Le Asus TUF Gaming A17 FA707 est la version AMD du TUF Gaming F17 FX707 basé sur Intel. La série TUF se compose d'ordinateurs portables de jeu de milieu de gamme qui contrastent avec la série ROG, plus chère et plus haut de gamme.
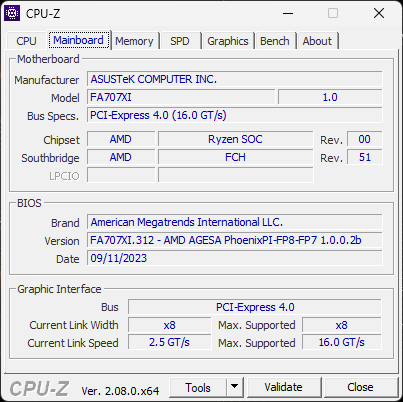
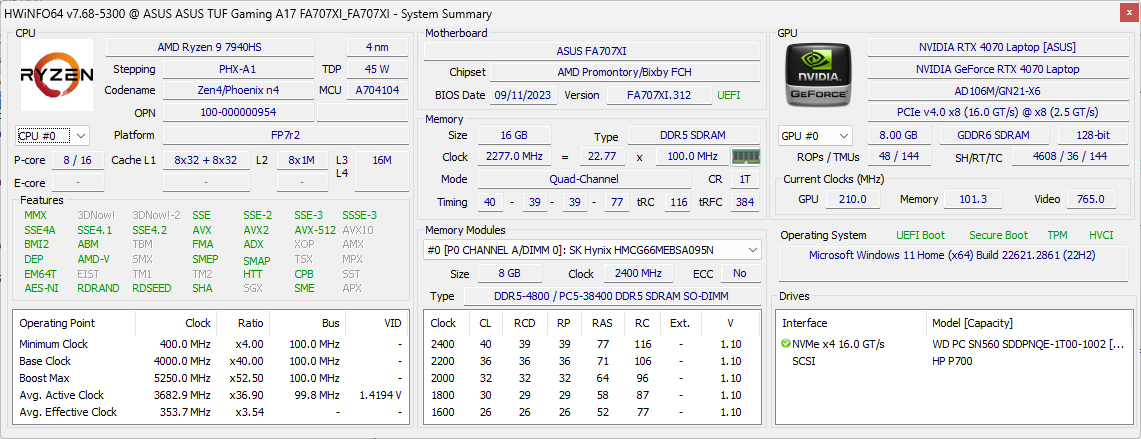
Notre configuration est la dernière SKU avec le CPU Zen 4 Ryzen 9 7940HS, un GPU RTX 4070 de 140 W GeForce et un écran IPS 1080p 144 Hz pour un prix de détail d'environ $1400 USD. D'autres SKUs de ce modèle sont livrés avec le Ryzen 7 7735HS plus lent, GeForce RTX 4050 ou 4060, ou un écran 1440p de plus haute résolution avec des taux de rafraîchissement encore plus rapides de 240 Hz ou 360 Hz.
Les alternatives au TUF Gaming A17 comprennent d'autres ordinateurs portables de jeu de milieu de gamme comme le MSI Pulse 17, HP Pavilion Gaming 17, Lenovo Legion série 5ou la série Acer Nitro 17.
Plus de commentaires sur Asus :
Comparaison avec les concurrents potentiels
Note | Date | Modèle | Poids | Épaisseur | Taille | Résolution | Prix |
|---|---|---|---|---|---|---|---|
| 85.6 % v7 (old) | 01/24 | Asus TUF Gaming A17 FA707XI-NS94 R9 7940HS, GeForce RTX 4070 Laptop GPU | 2.5 kg | 25.4 mm | 17.30" | 1920x1080 | |
| 84.1 % v7 (old) | 04/22 | Asus TUF Gaming F17 FX707Z-HX011W i7-12700H, GeForce RTX 3060 Laptop GPU | 2.5 kg | 25 mm | 17.30" | 1920x1080 | |
| 86.3 % v7 (old) | 07/23 | MSI Pulse 17 B13VGK i7-13700H, GeForce RTX 4070 Laptop GPU | 2.7 kg | 27.2 mm | 17.30" | 1920x1080 | |
| 82.1 % v7 (old) | 02/23 | MSI Katana 17 B13VFK i7-13620H, GeForce RTX 4060 Laptop GPU | 2.8 kg | 25.2 mm | 17.30" | 1920x1080 | |
| 90.1 % v7 (old) | 05/22 | Razer Blade 17 (i7-12800H, RTX 3070 Ti) i7-12800H, GeForce RTX 3070 Ti Laptop GPU | 2.8 kg | 19.9 mm | 17.30" | 2560x1440 | |
| 82.7 % v7 (old) | 09/22 | HP Pavilion Gaming 17-cd2146ng i5-11300H, GeForce RTX 3050 Ti Laptop GPU | 2.8 kg | 25 mm | 17.30" | 1920x1080 |
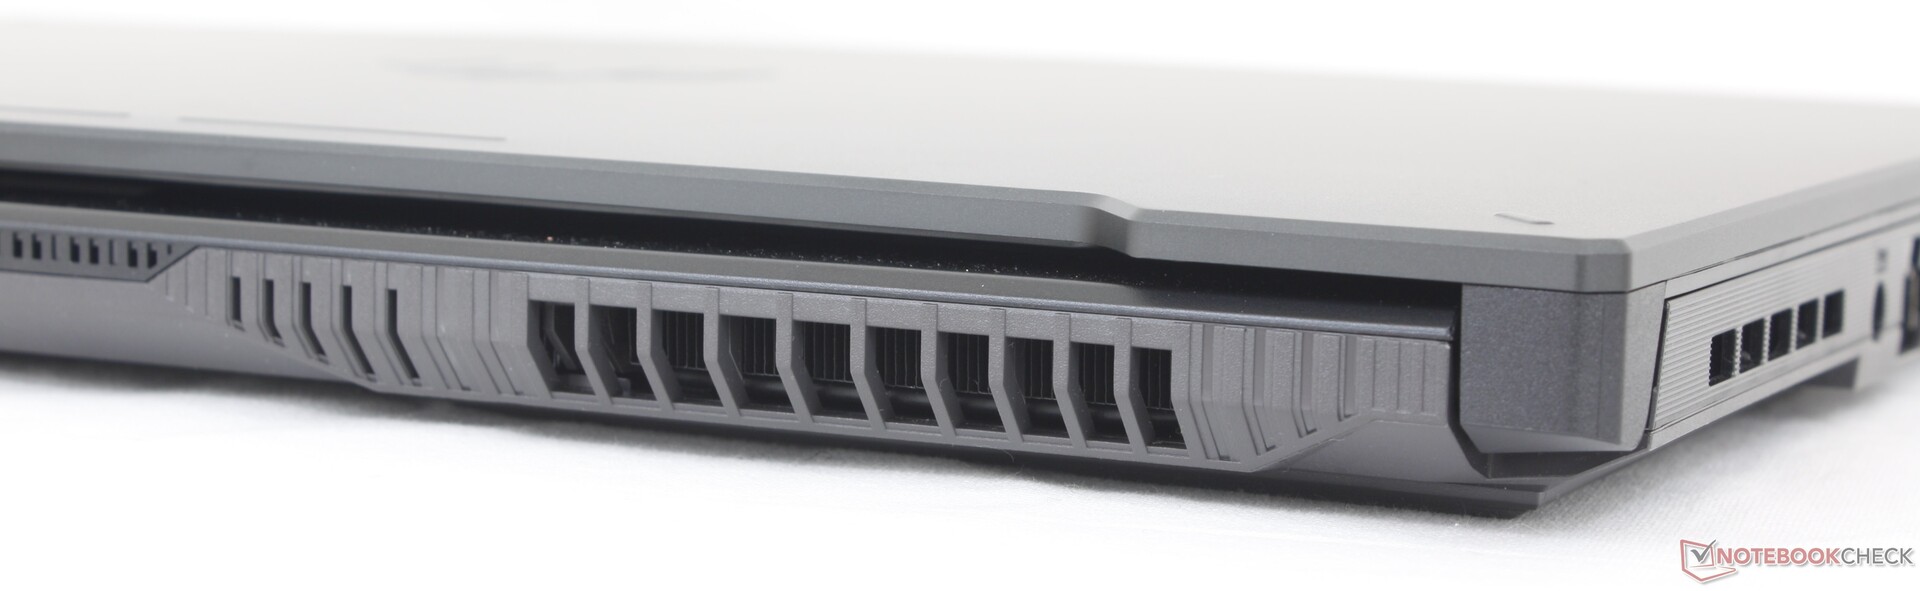
Cas
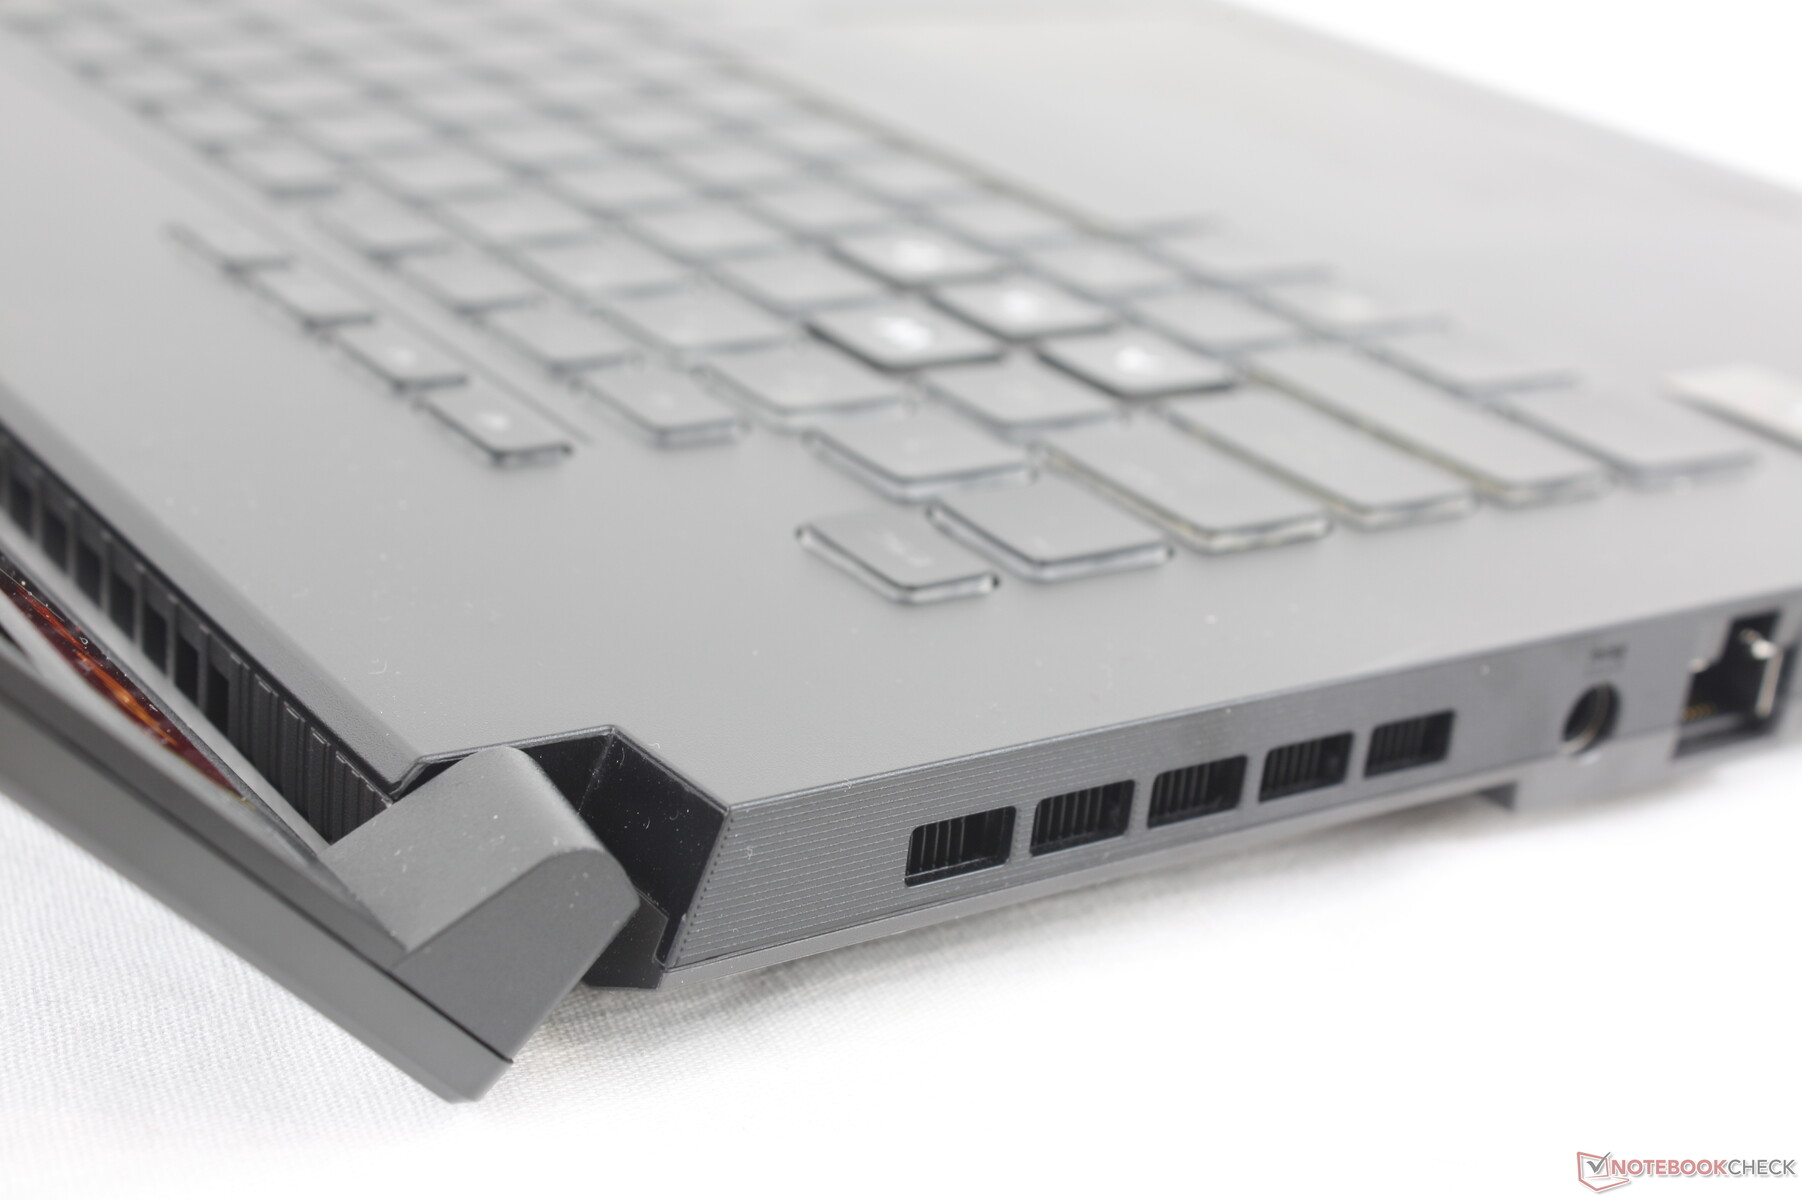
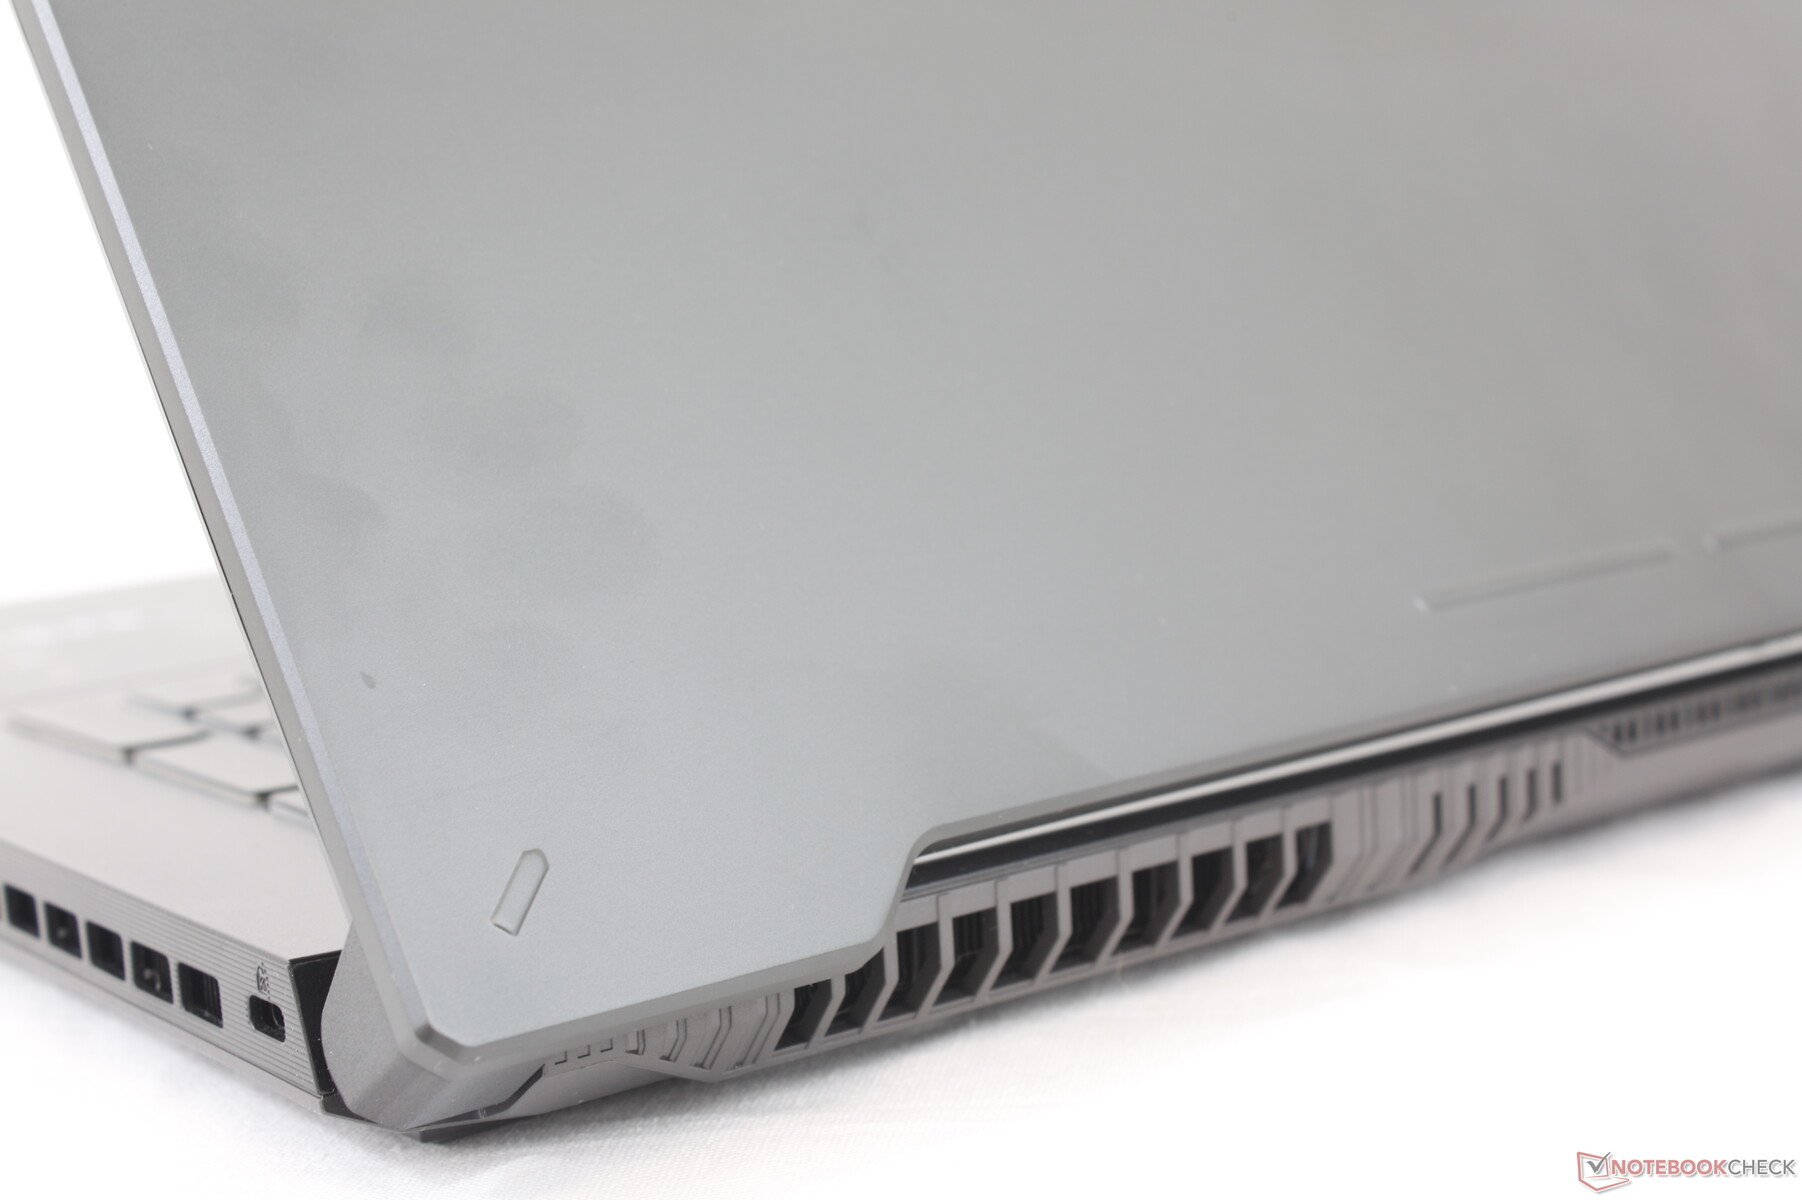
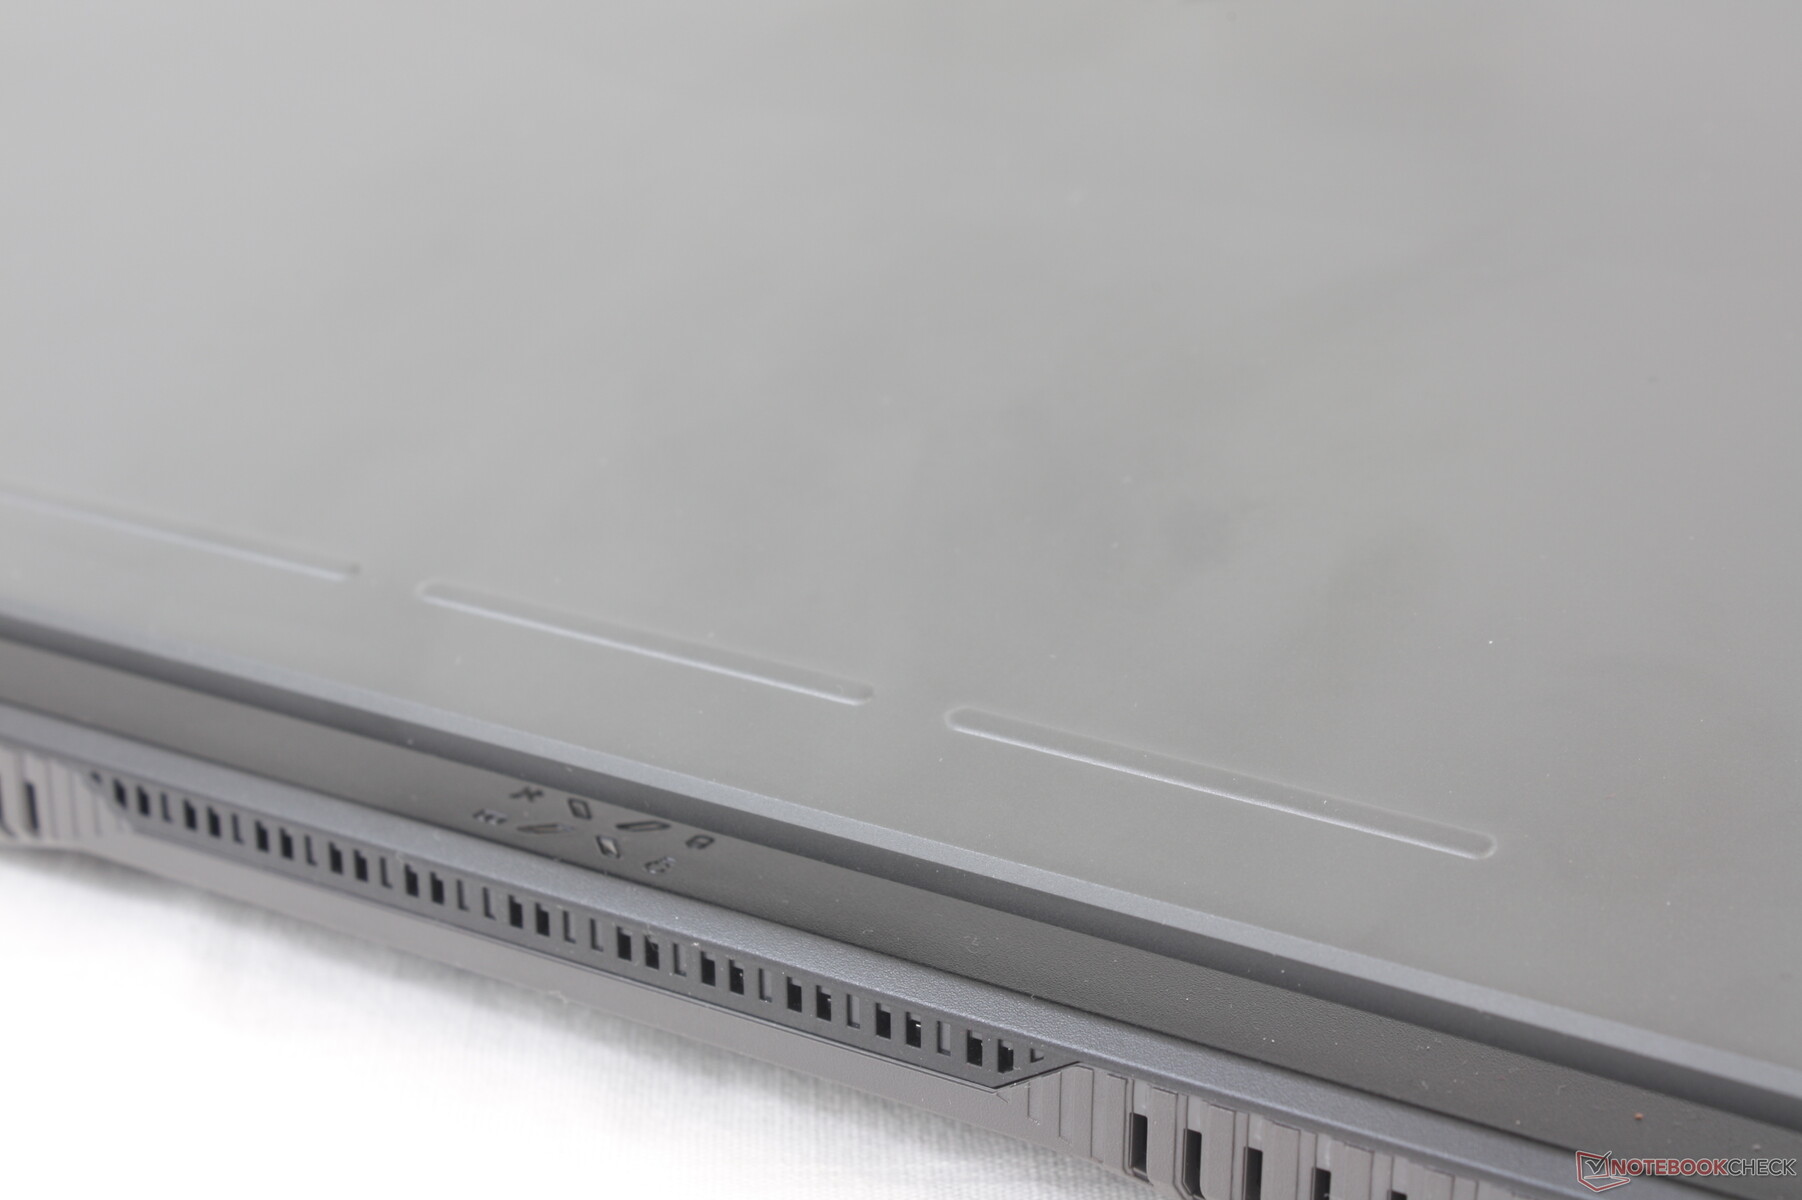
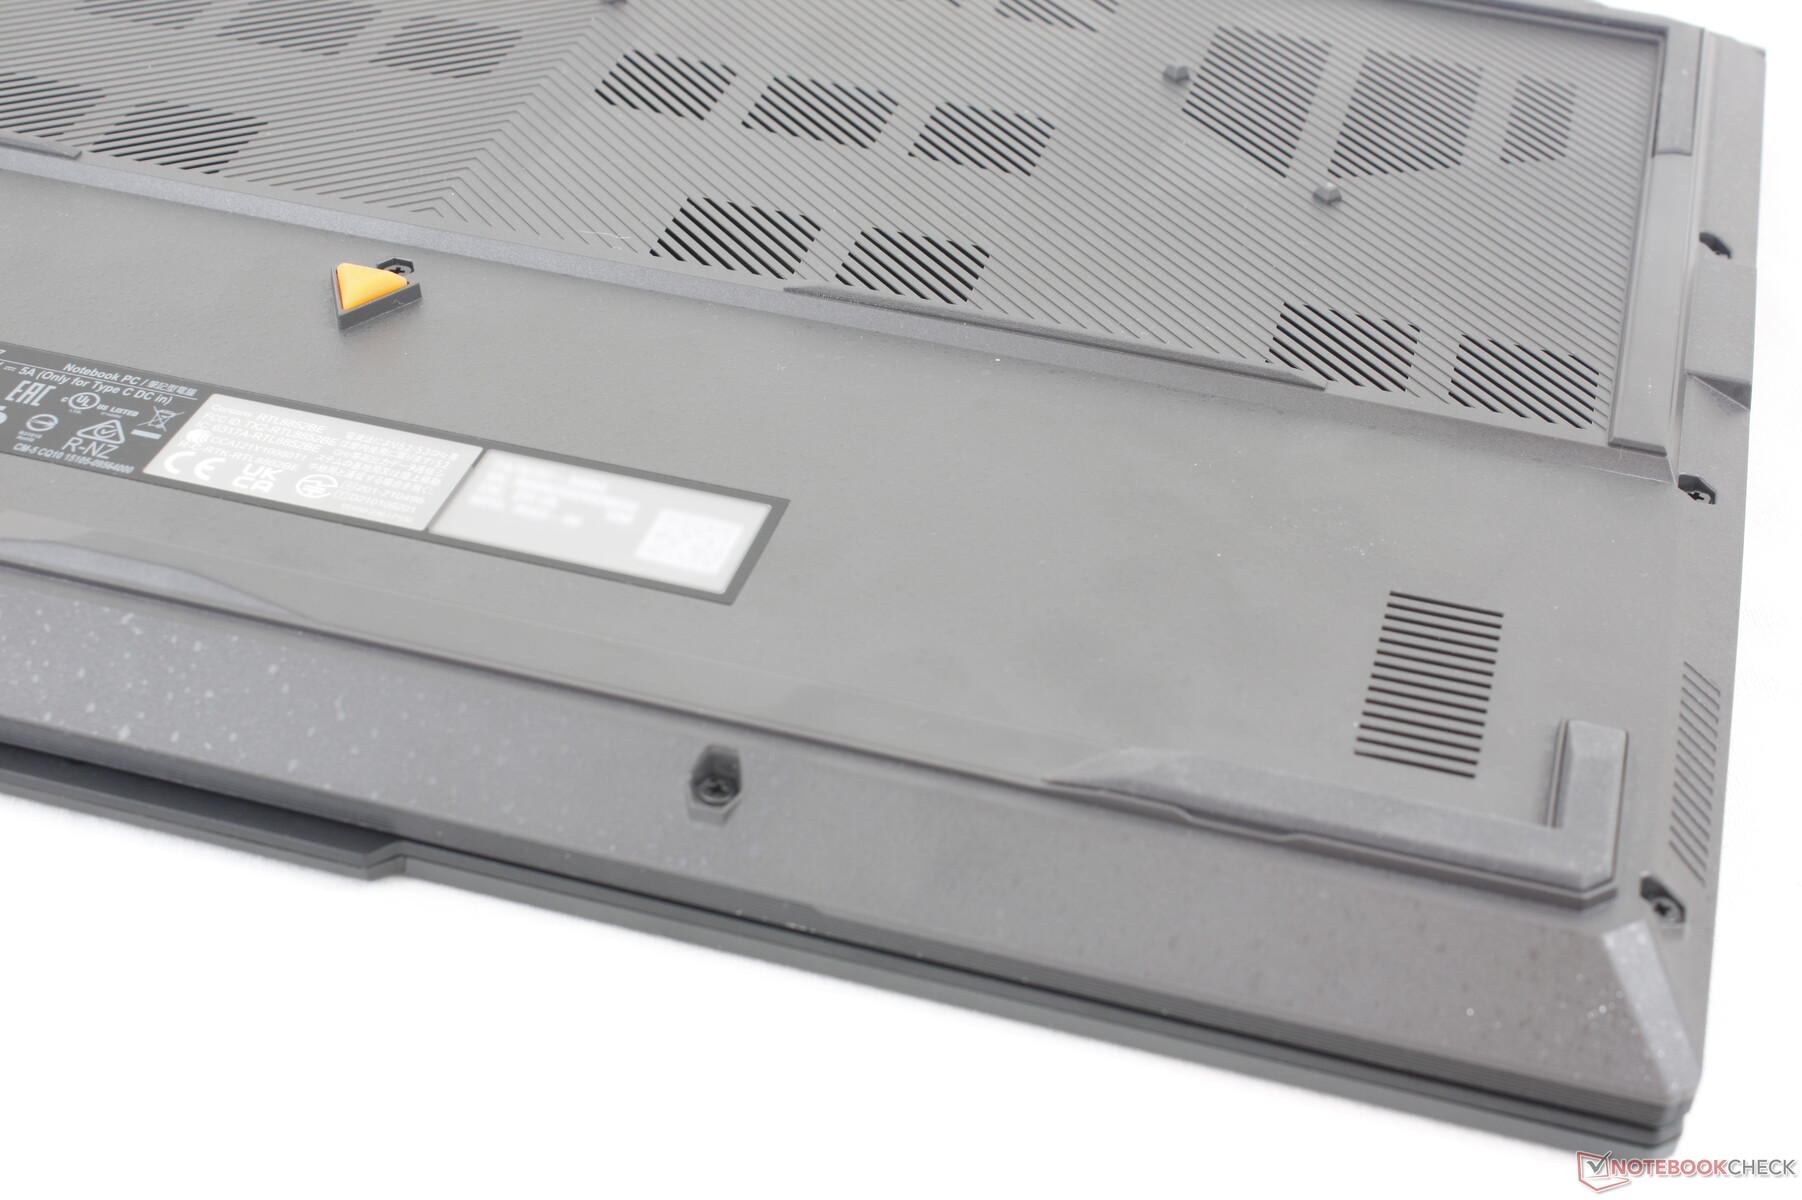
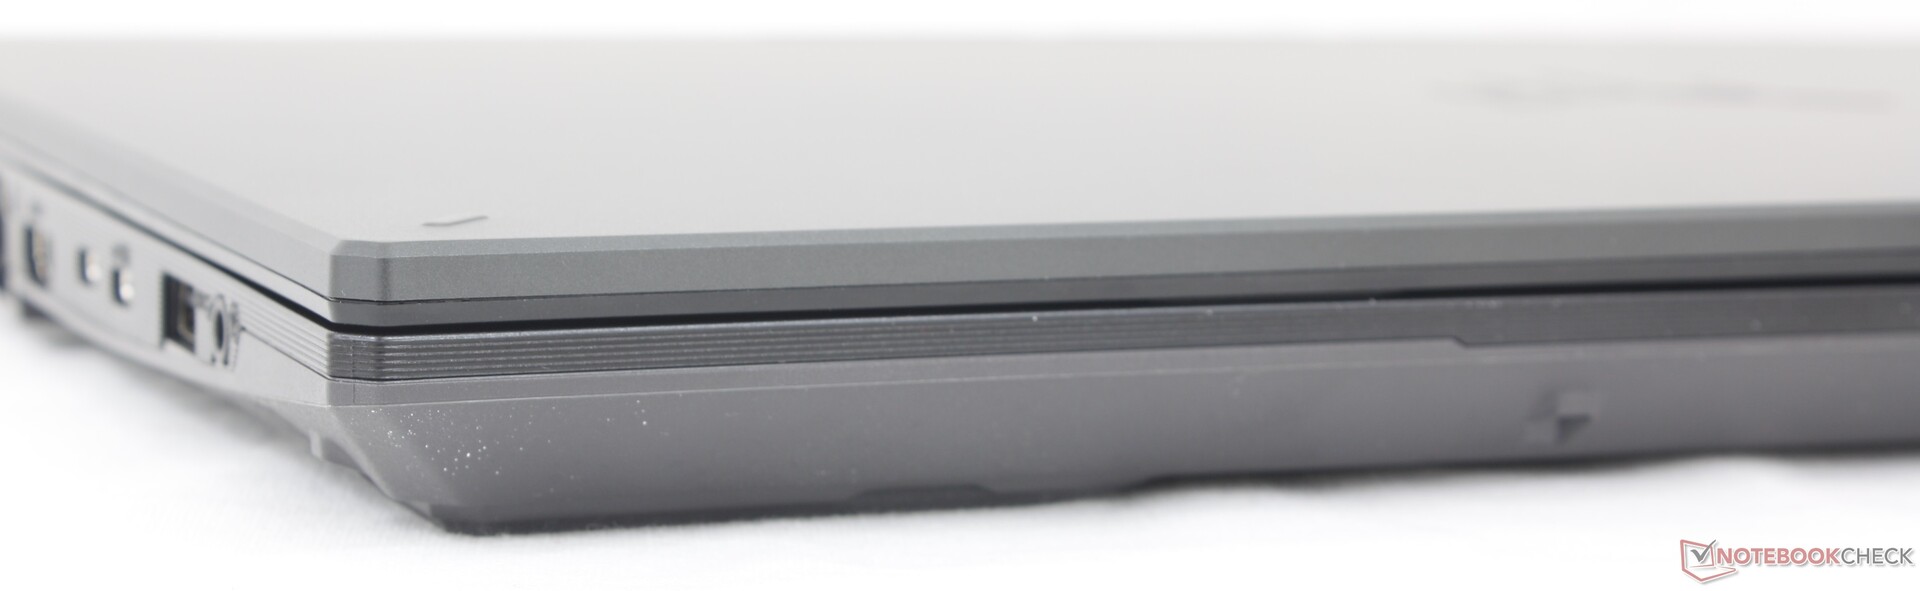
Le châssis est en grande partie identique à celui du TUF Gaming F17 FX707 y compris le positionnement des ports et les matériaux métalliques et plastiques du couvercle extérieur et de la base, respectivement. Néanmoins, il y a de petites différences superficielles sur le couvercle extérieur pour aider à distinguer visuellement le TUF Gaming A17 du TUF Gaming F17. Les cercles d'angle du F17, par exemple, sont désormais des lignes diagonales. Il y a également des marques supplémentaires le long du bord inférieur du couvercle, alors qu'elles sont totalement absentes sur le F17. Si vous le retournez, le triangle en caoutchouc situé sous le châssis est orange et non plus rouge.
Nos impressions sur la qualité de fabrication du F17 basé sur Intel s'appliquent ici à l'A17 d'AMD.
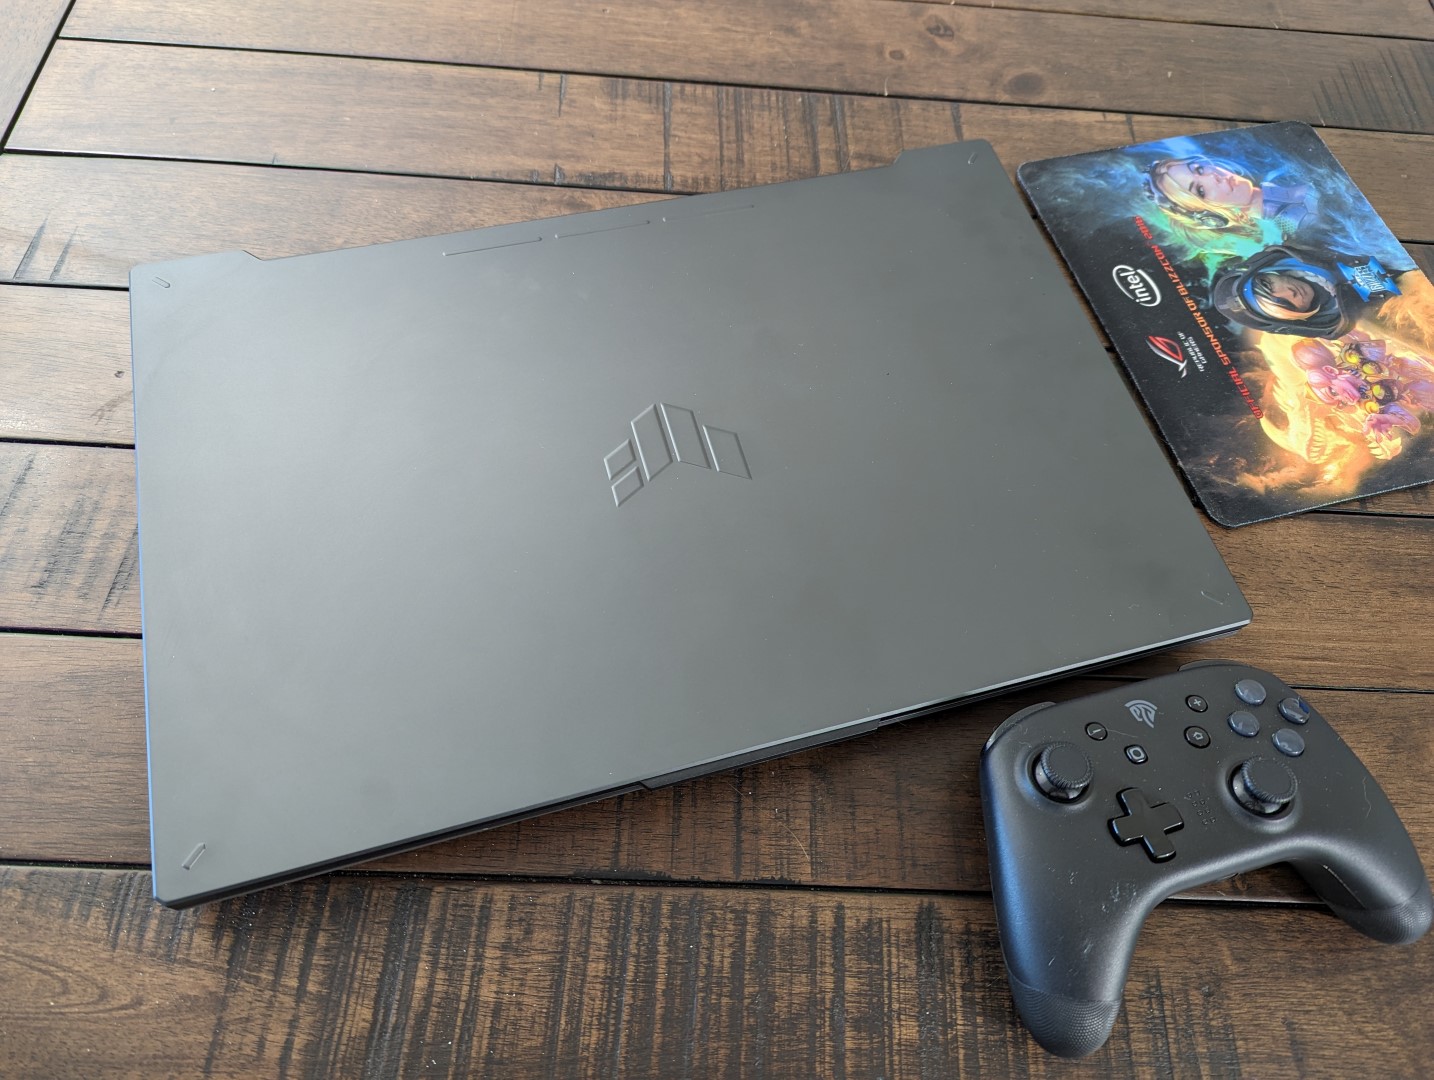
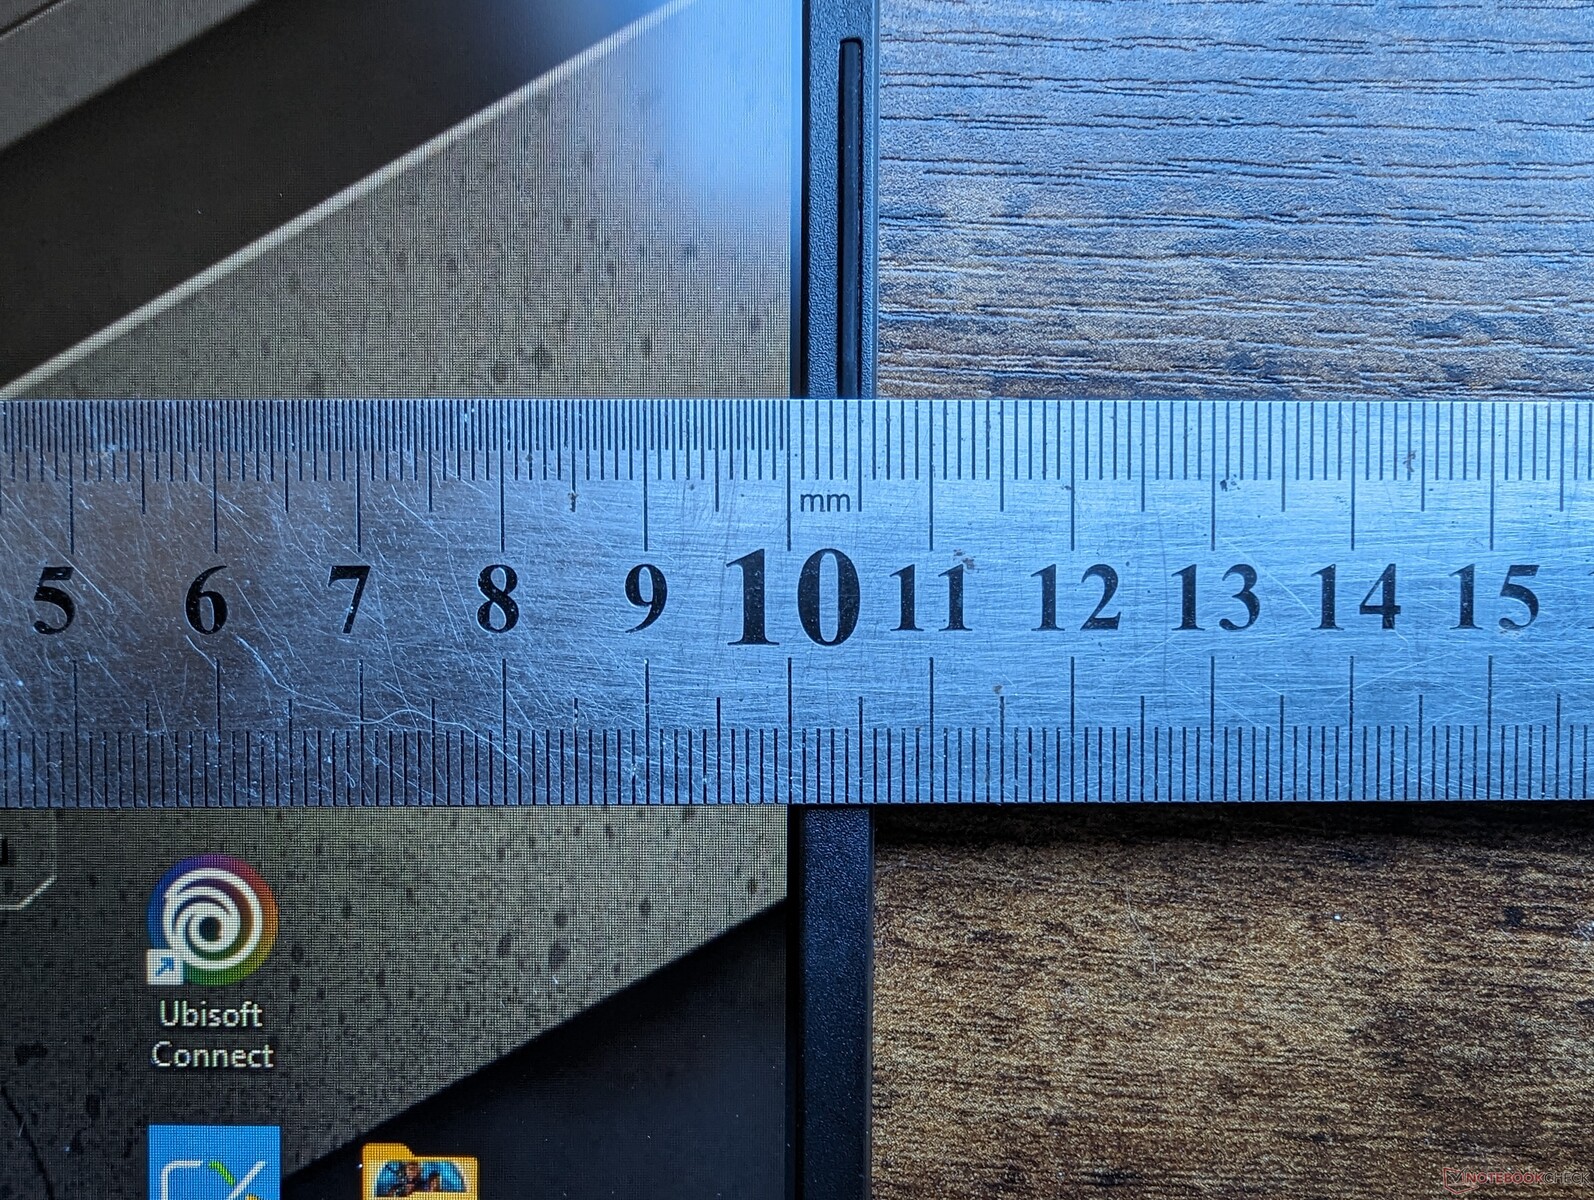
Malgré son design peu attrayant, le TUF Gaming A17 est plus fin et plus léger que beaucoup d'autres ordinateurs portables de jeu de 17,3 pouces de milieu de gamme, comme le HP Pavilion Gaming 17acer Nitro 17, ou MSI Pulse 17 de 200 à 500 grammes chacun selon le modèle. Les différences sont suffisamment importantes pour être perceptibles en voyage et la taille relativement petite de l'Asus peut être un avantage certain.
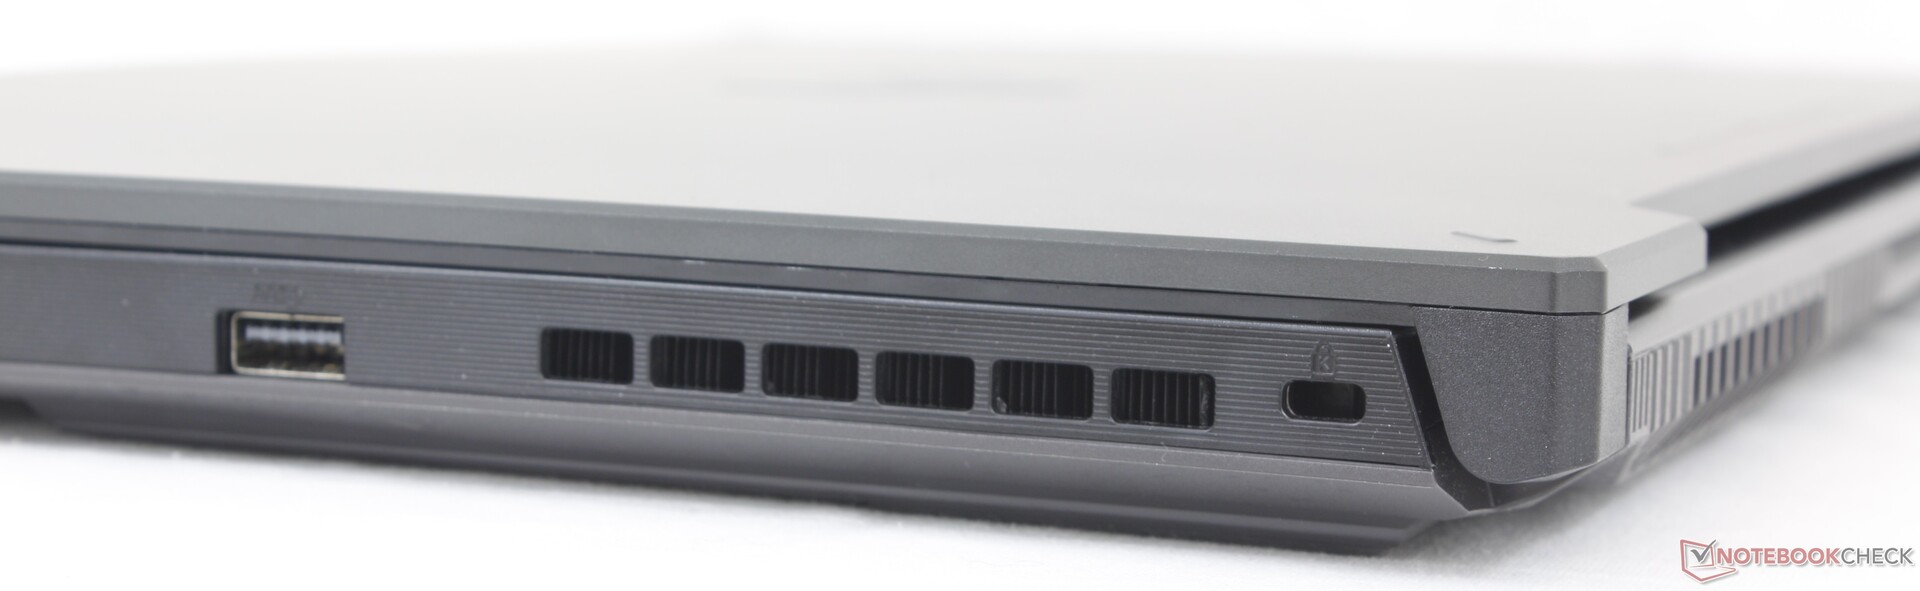
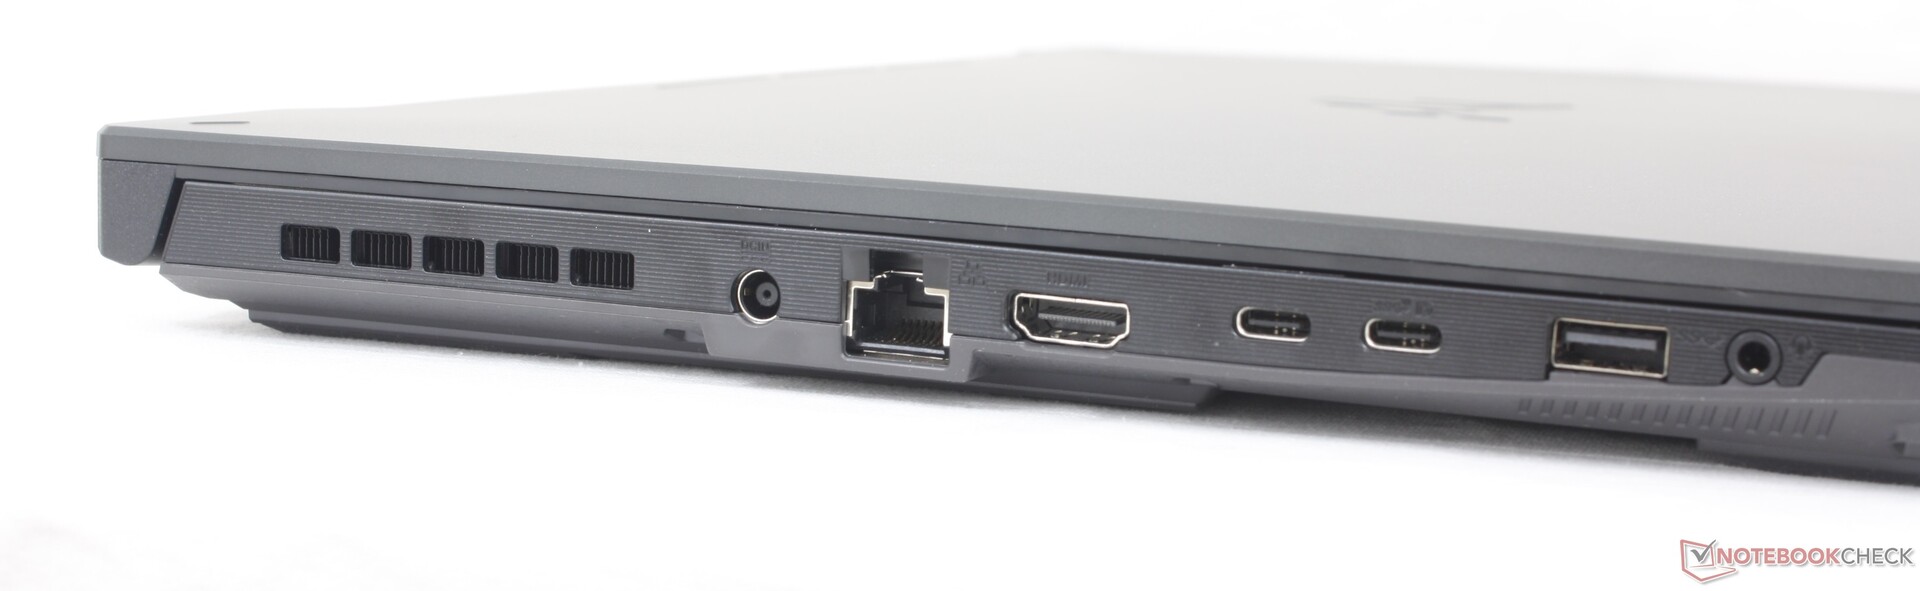
Connectivité
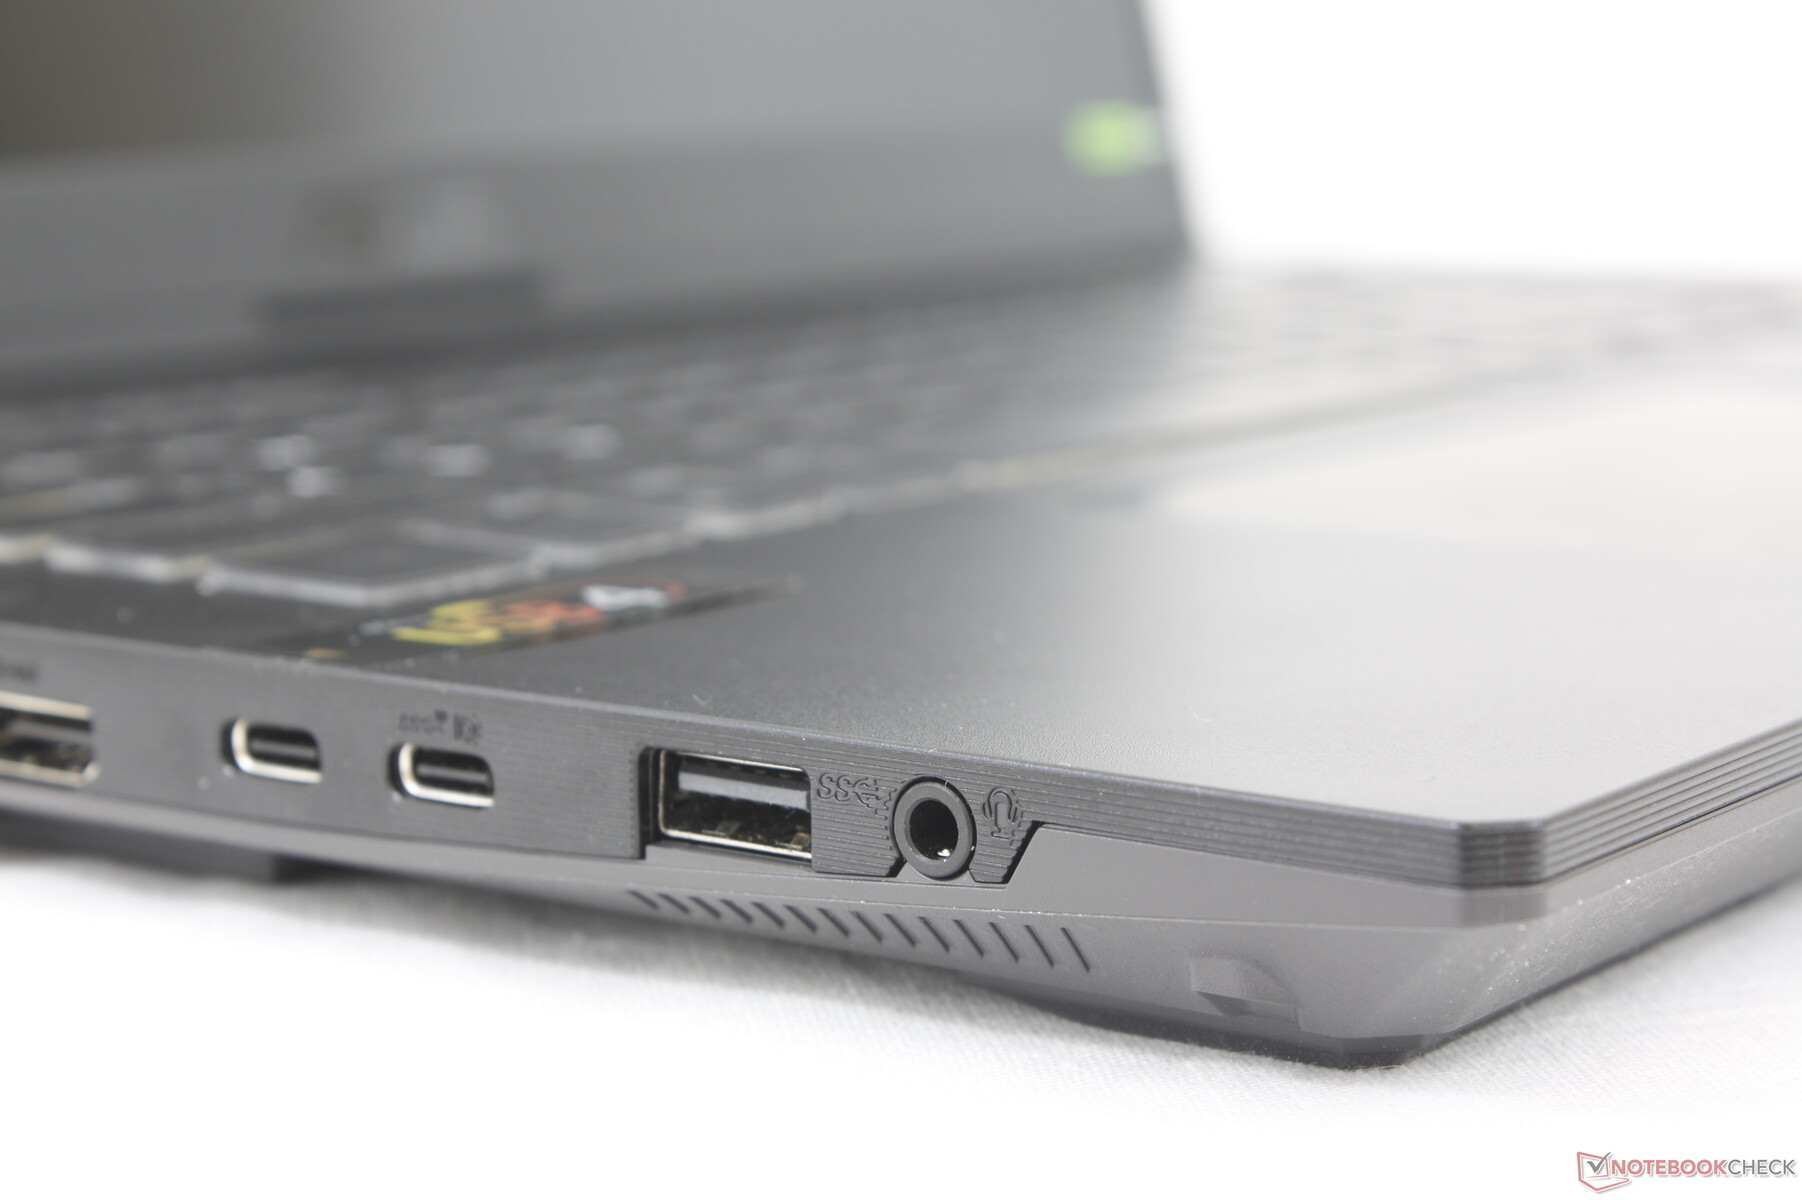
Notre modèle conserve tous les ports présents sur le F17 FX707 à une petite exception près : le port Thunderbolt 4 a été remplacé par l'USB-C 4. La plupart des appareils Thunderbolt sont néanmoins compatibles avec l'USB4 et cette petite différence ne devrait donc pas avoir d'impact sur la grande majorité des utilisateurs.
Notez que bien qu'il y ait deux ports USB-C sur le système, seul celui qui est le plus proche du bord avant est compatible avec les adaptateurs CA USB-C. Par exemple, notre adaptateur Lenovo USB-C de 135 W pouvait recharger l'Asus via un port USB-C, mais pas l'autre. Le système doit également être en mode dGPU pour prendre en charge les moniteurs USB-C externes.
Il est intéressant de noter que notre moniteur externe ne fonctionnait qu'avec l'un des deux ports USB-C, même si Asus affirme que les deux ports devraient être compatibles.
Communication
Un Realtek RTL8852BE est livré en standard pour la connectivité Wi-Fi 6 et Bluetooth 5.3. Il n'y a pas de configuration avec le Wi-Fi 6E ou la série AX d'Intel, probablement pour réduire les coûts. Nous n'avons cependant rencontré aucun problème de connectivité lorsque nous avons été couplés à notre réseau Wi-Fi 6, même si le débit est plus lent que prévu.
| Networking | |
| iperf3 transmit AX12 | |
| Asus TUF Gaming F17 FX707Z-HX011W | |
| iperf3 receive AX12 | |
| Asus TUF Gaming F17 FX707Z-HX011W | |
| iperf3 transmit AXE11000 | |
| MSI Katana 17 B13VFK | |
| MSI Pulse 17 B13VGK | |
| Asus TUF Gaming A17 FA707XI-NS94 | |
| iperf3 receive AXE11000 | |
| MSI Katana 17 B13VFK | |
| MSI Pulse 17 B13VGK | |
| HP Pavilion Gaming 17-cd2146ng | |
| Asus TUF Gaming A17 FA707XI-NS94 | |
| iperf3 transmit AXE11000 6GHz | |
| Razer Blade 17 (i7-12800H, RTX 3070 Ti) | |
| iperf3 receive AXE11000 6GHz | |
| Razer Blade 17 (i7-12800H, RTX 3070 Ti) | |
Webcam
Le modèle intègre une webcam de 1 MP ou 720p alors que la plupart des autres ordinateurs portables de jeu sont déjà passés à 2 MP ou 1080p. C'est mieux que rien, mais il est clair que le TUF Gaming A17 n'a pas été conçu pour les appels Zoom.


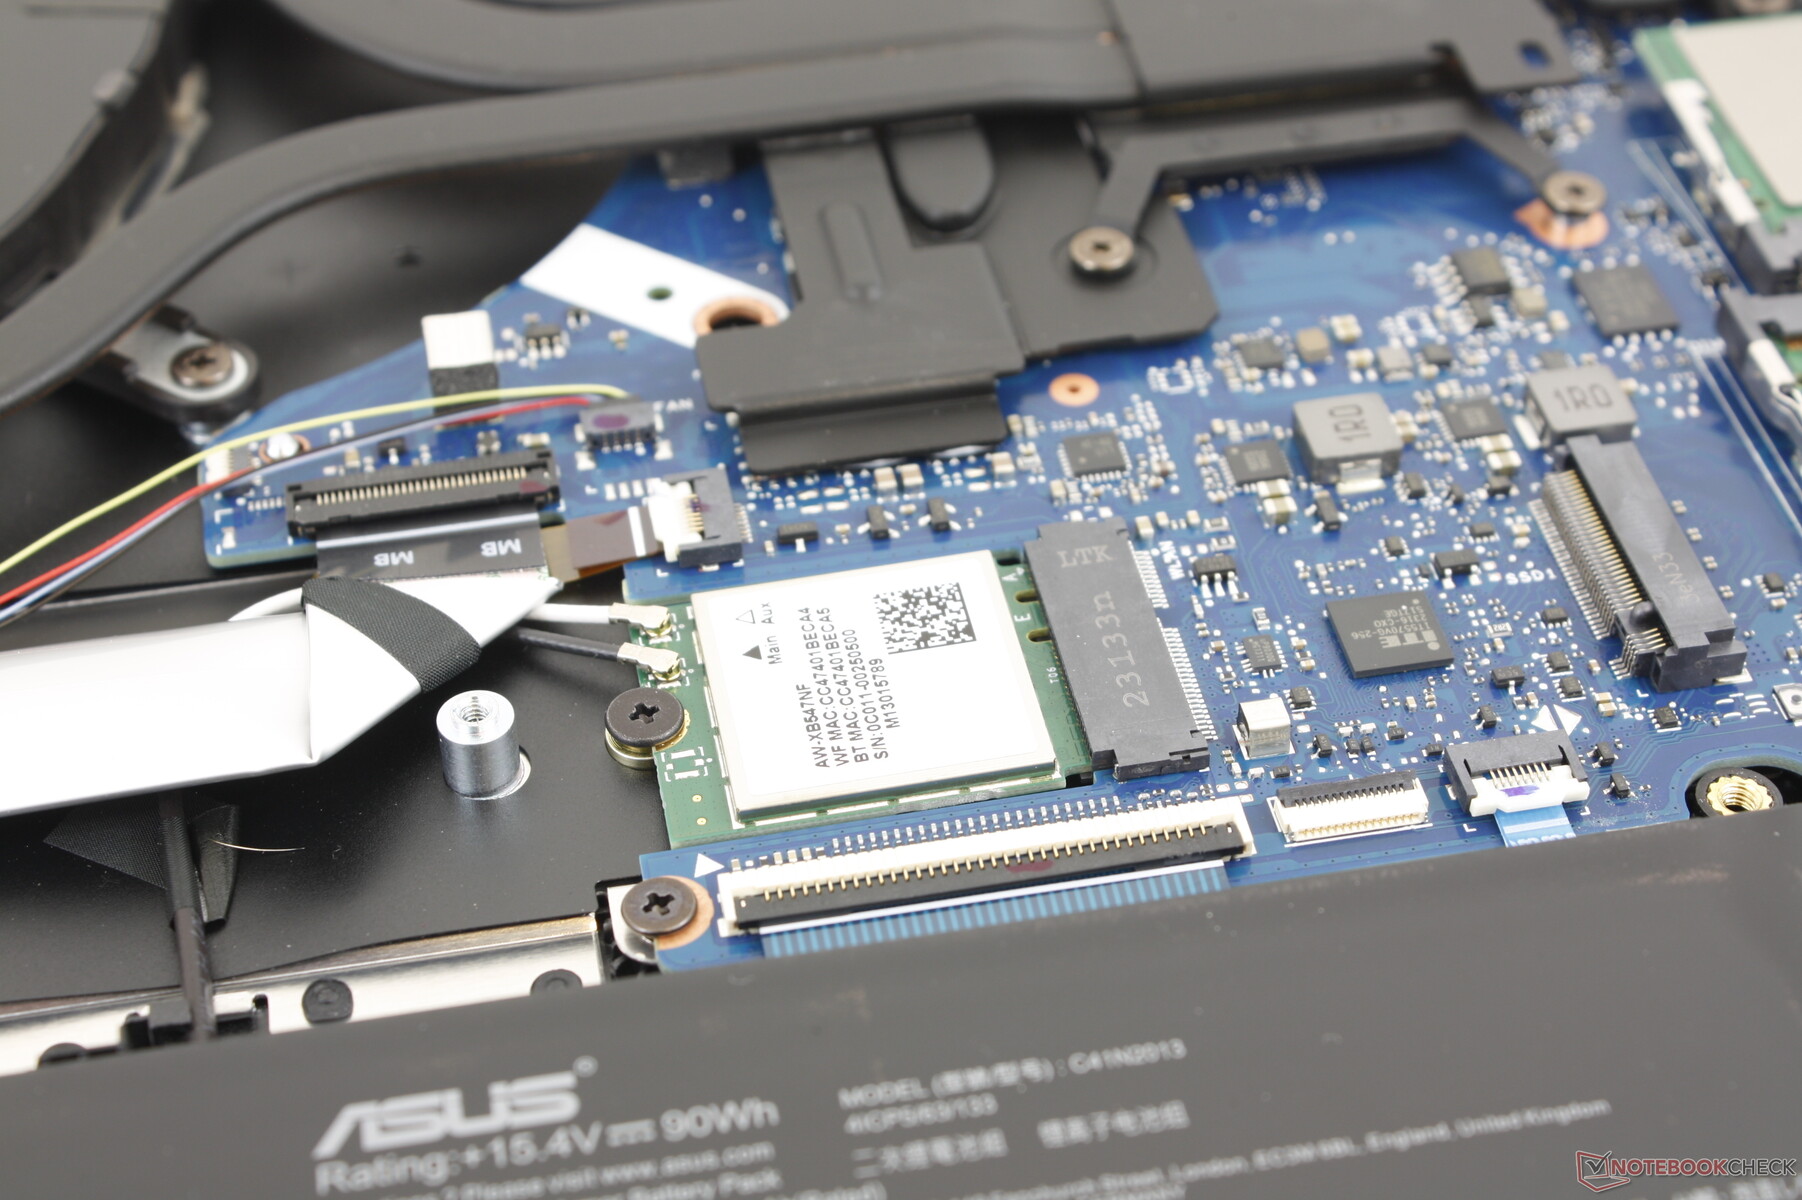
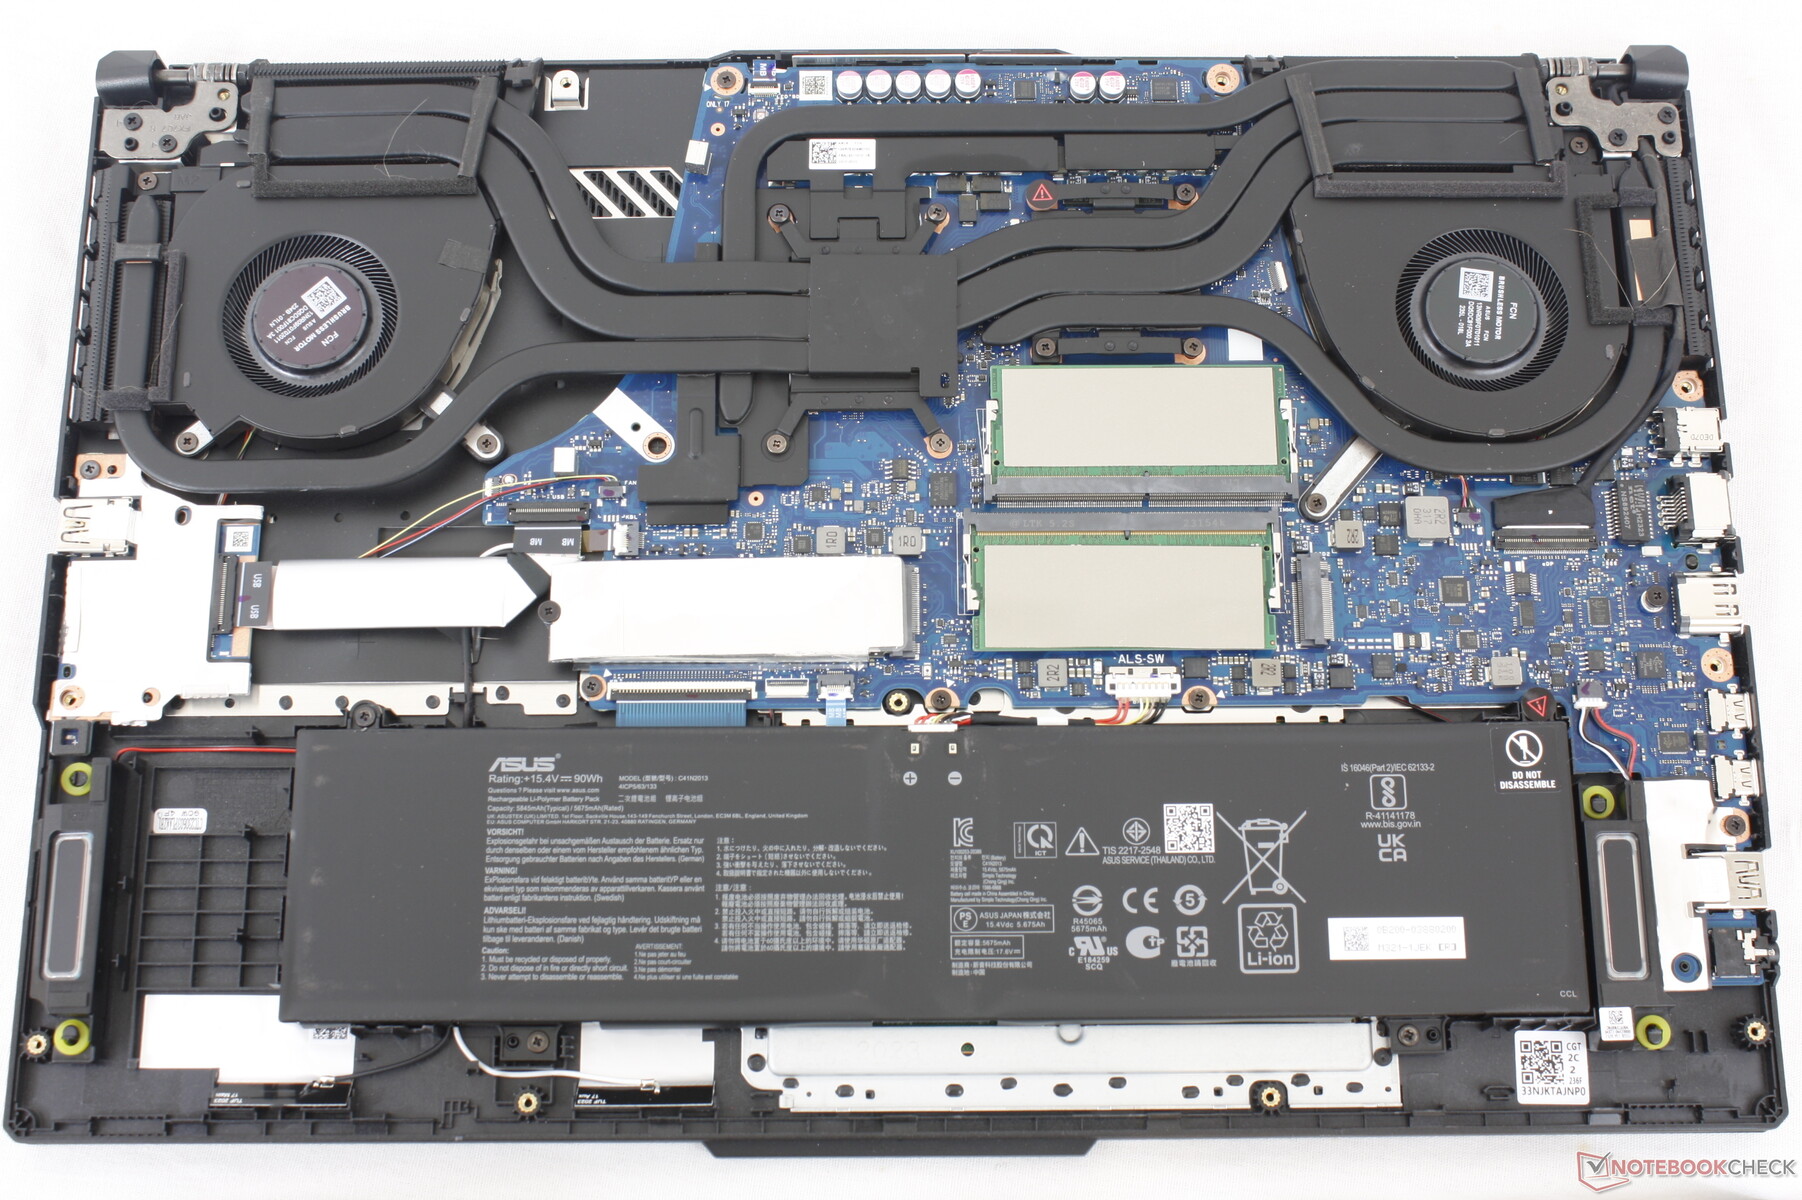
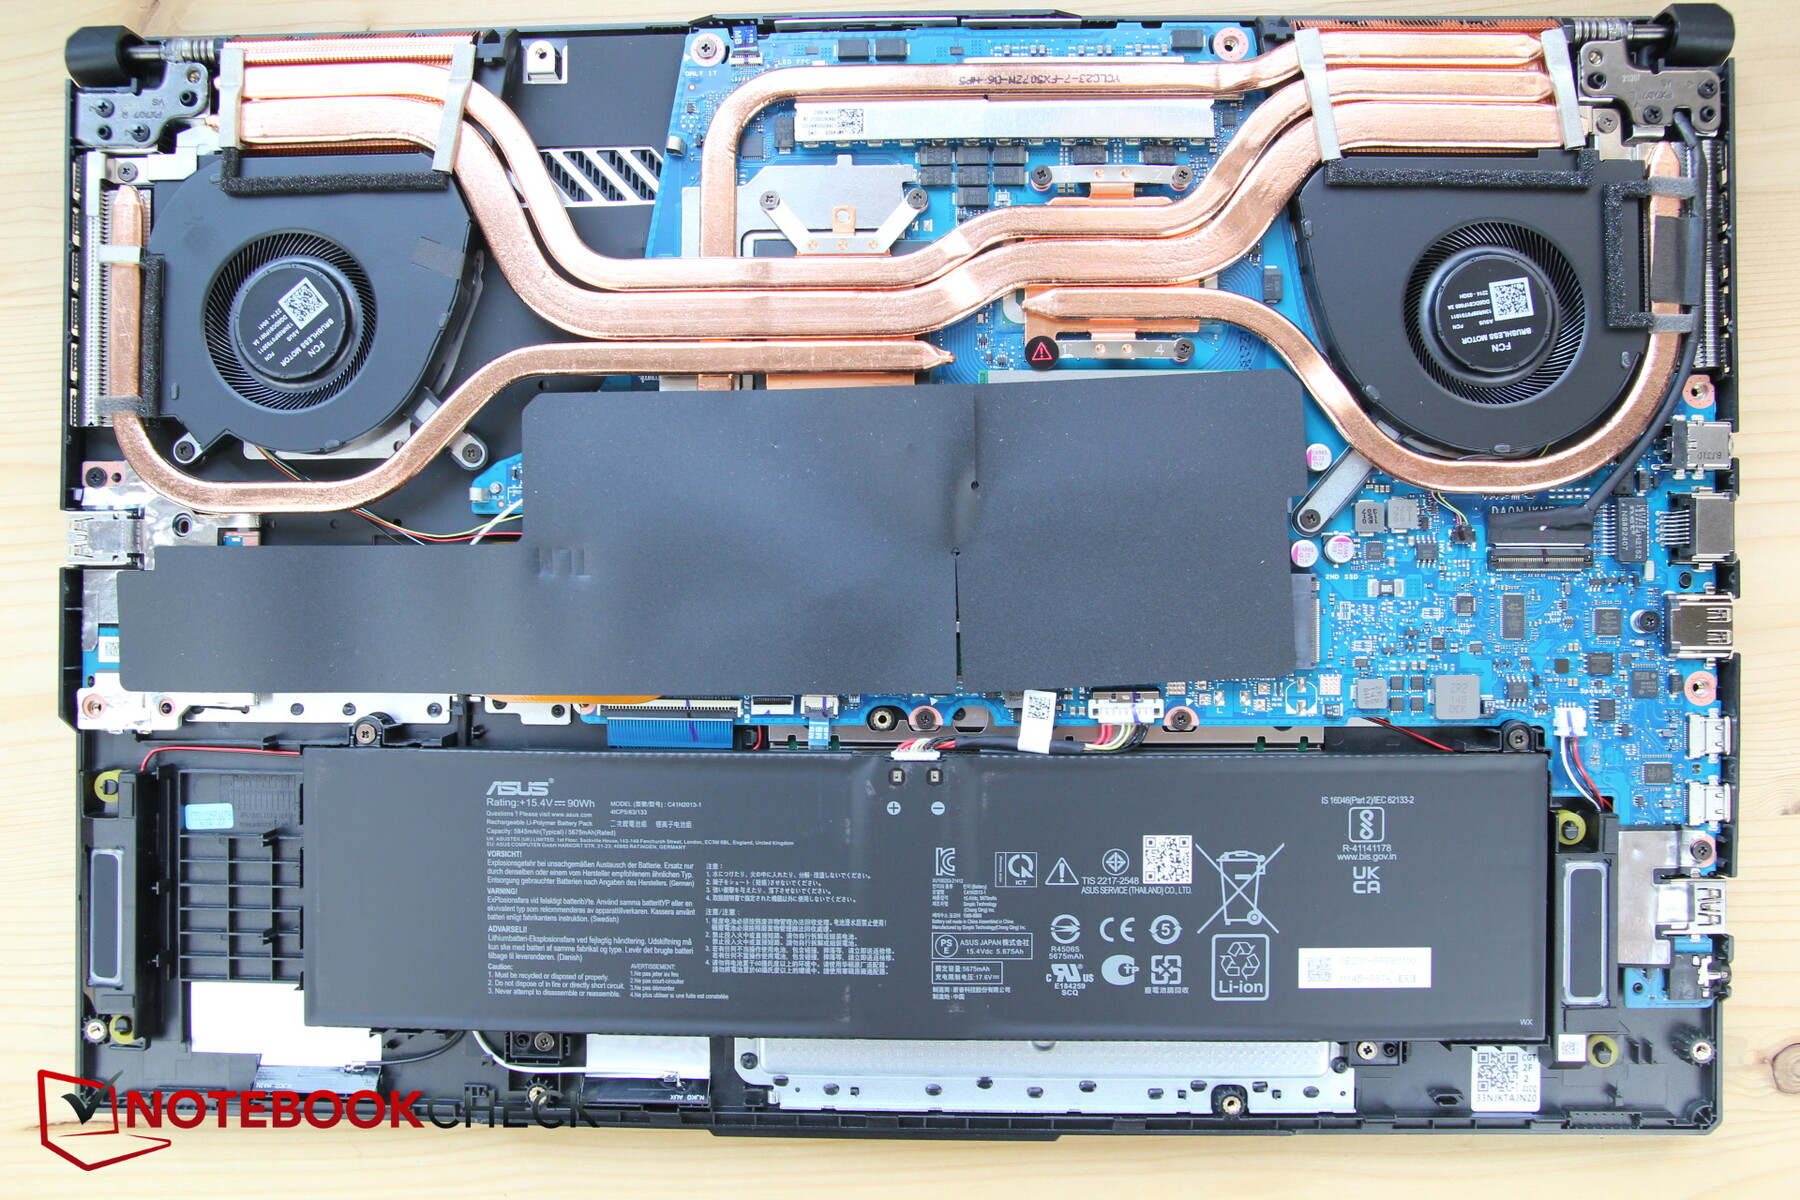
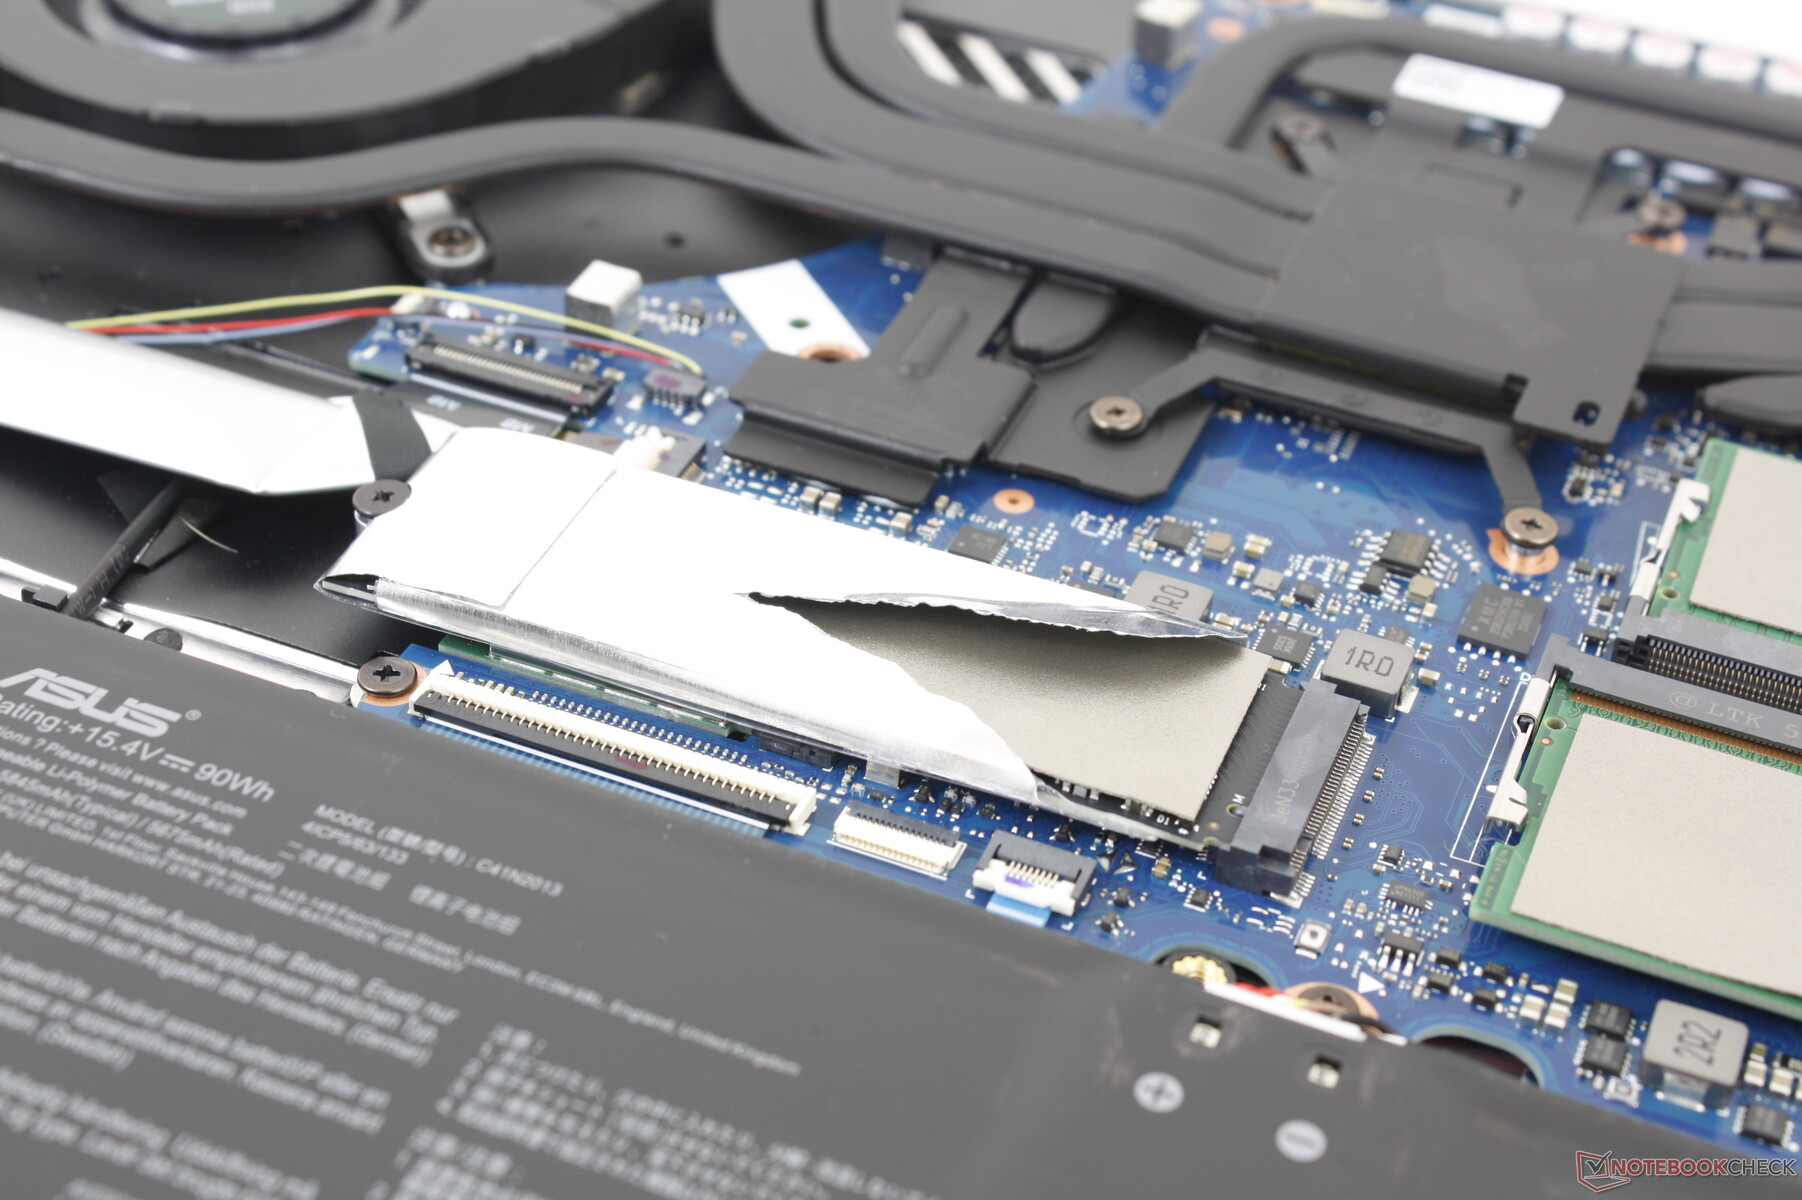
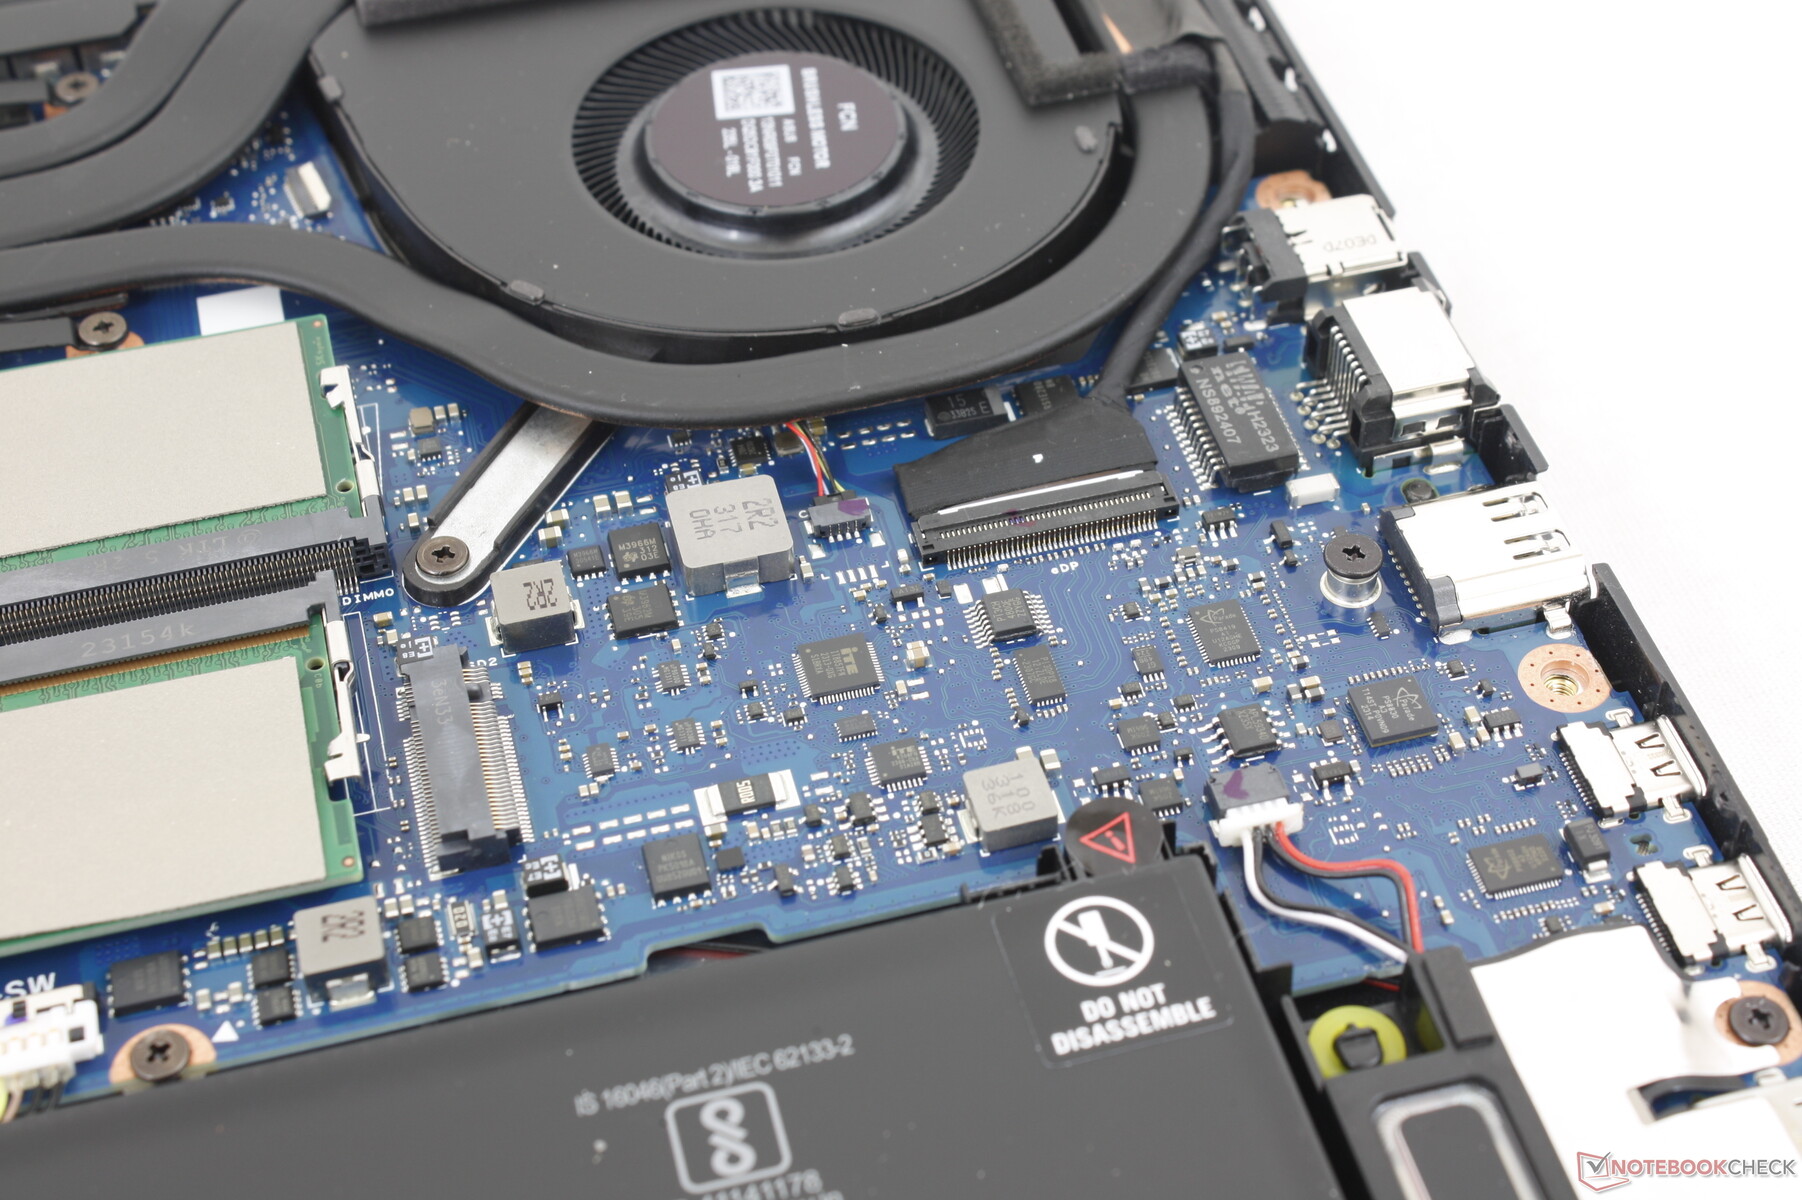
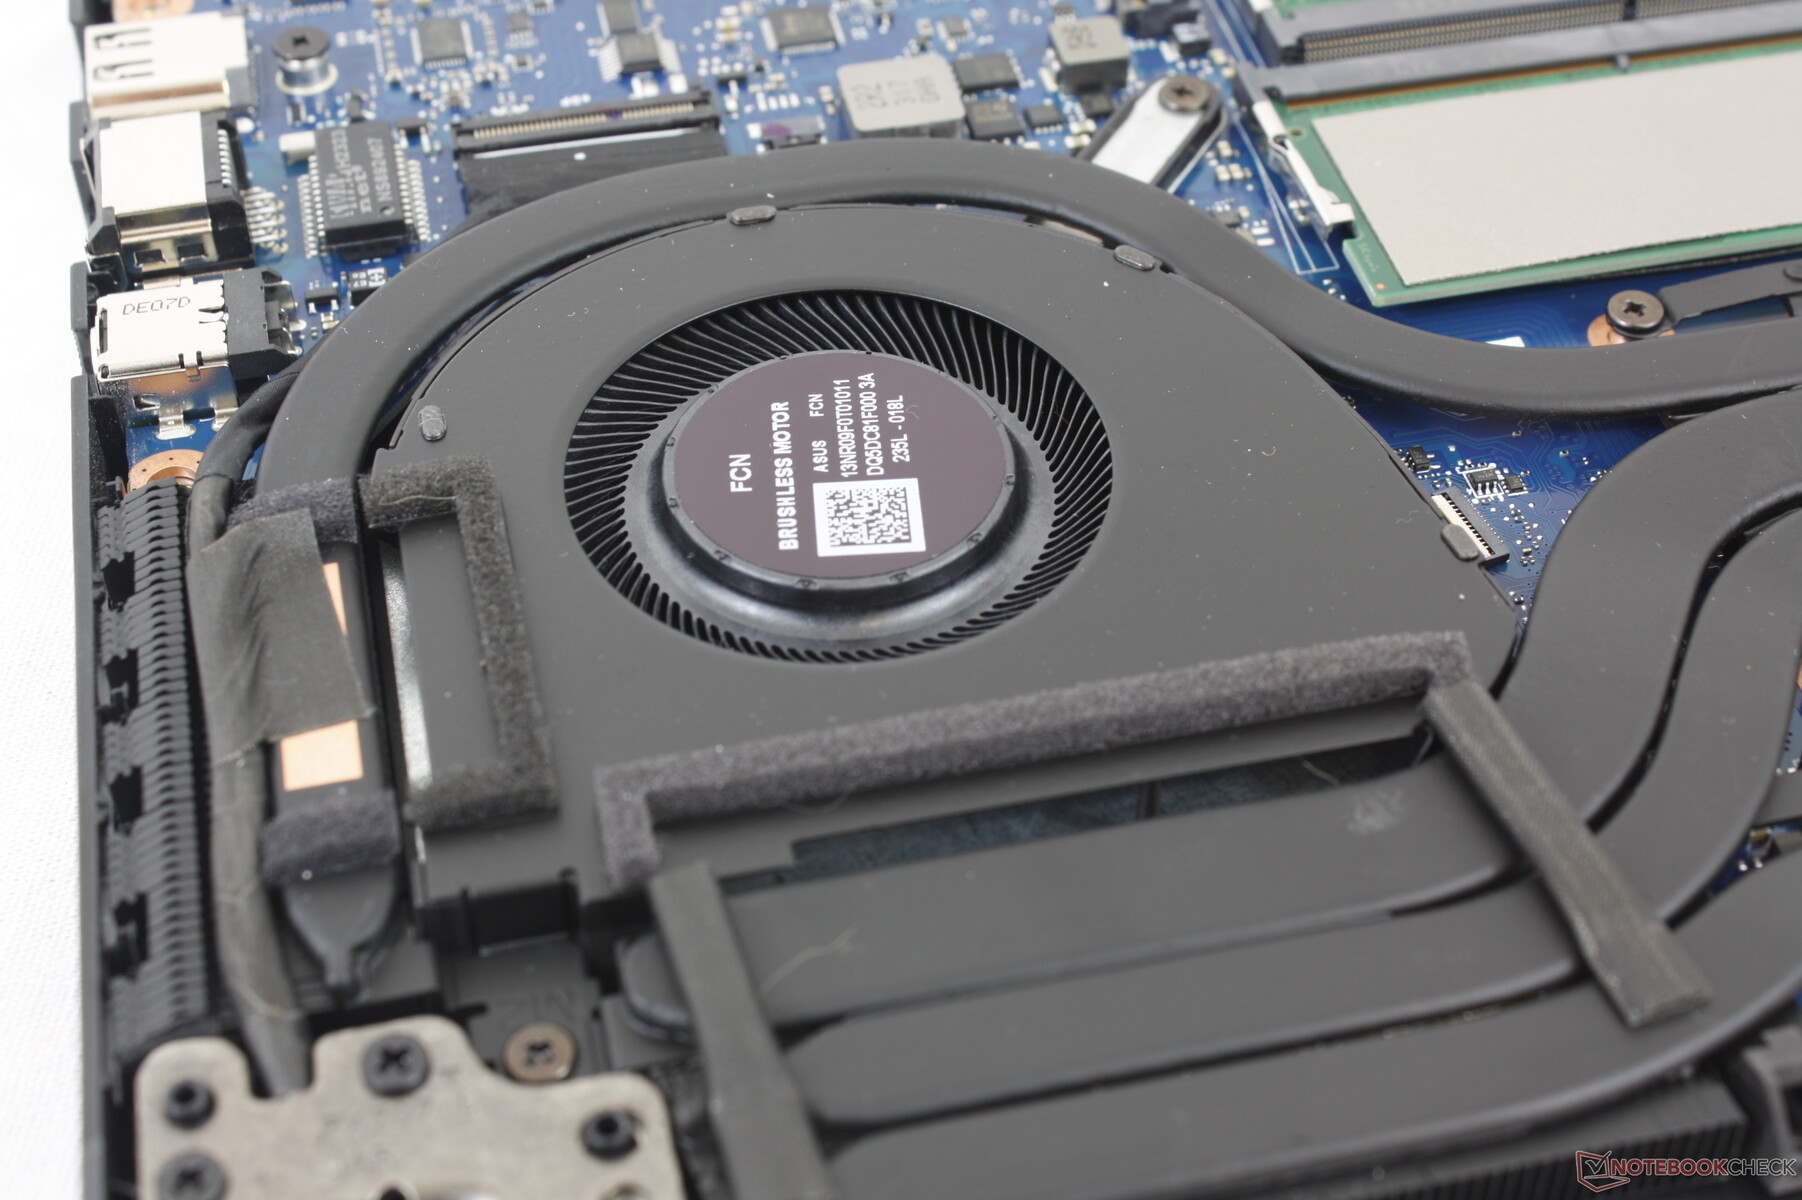
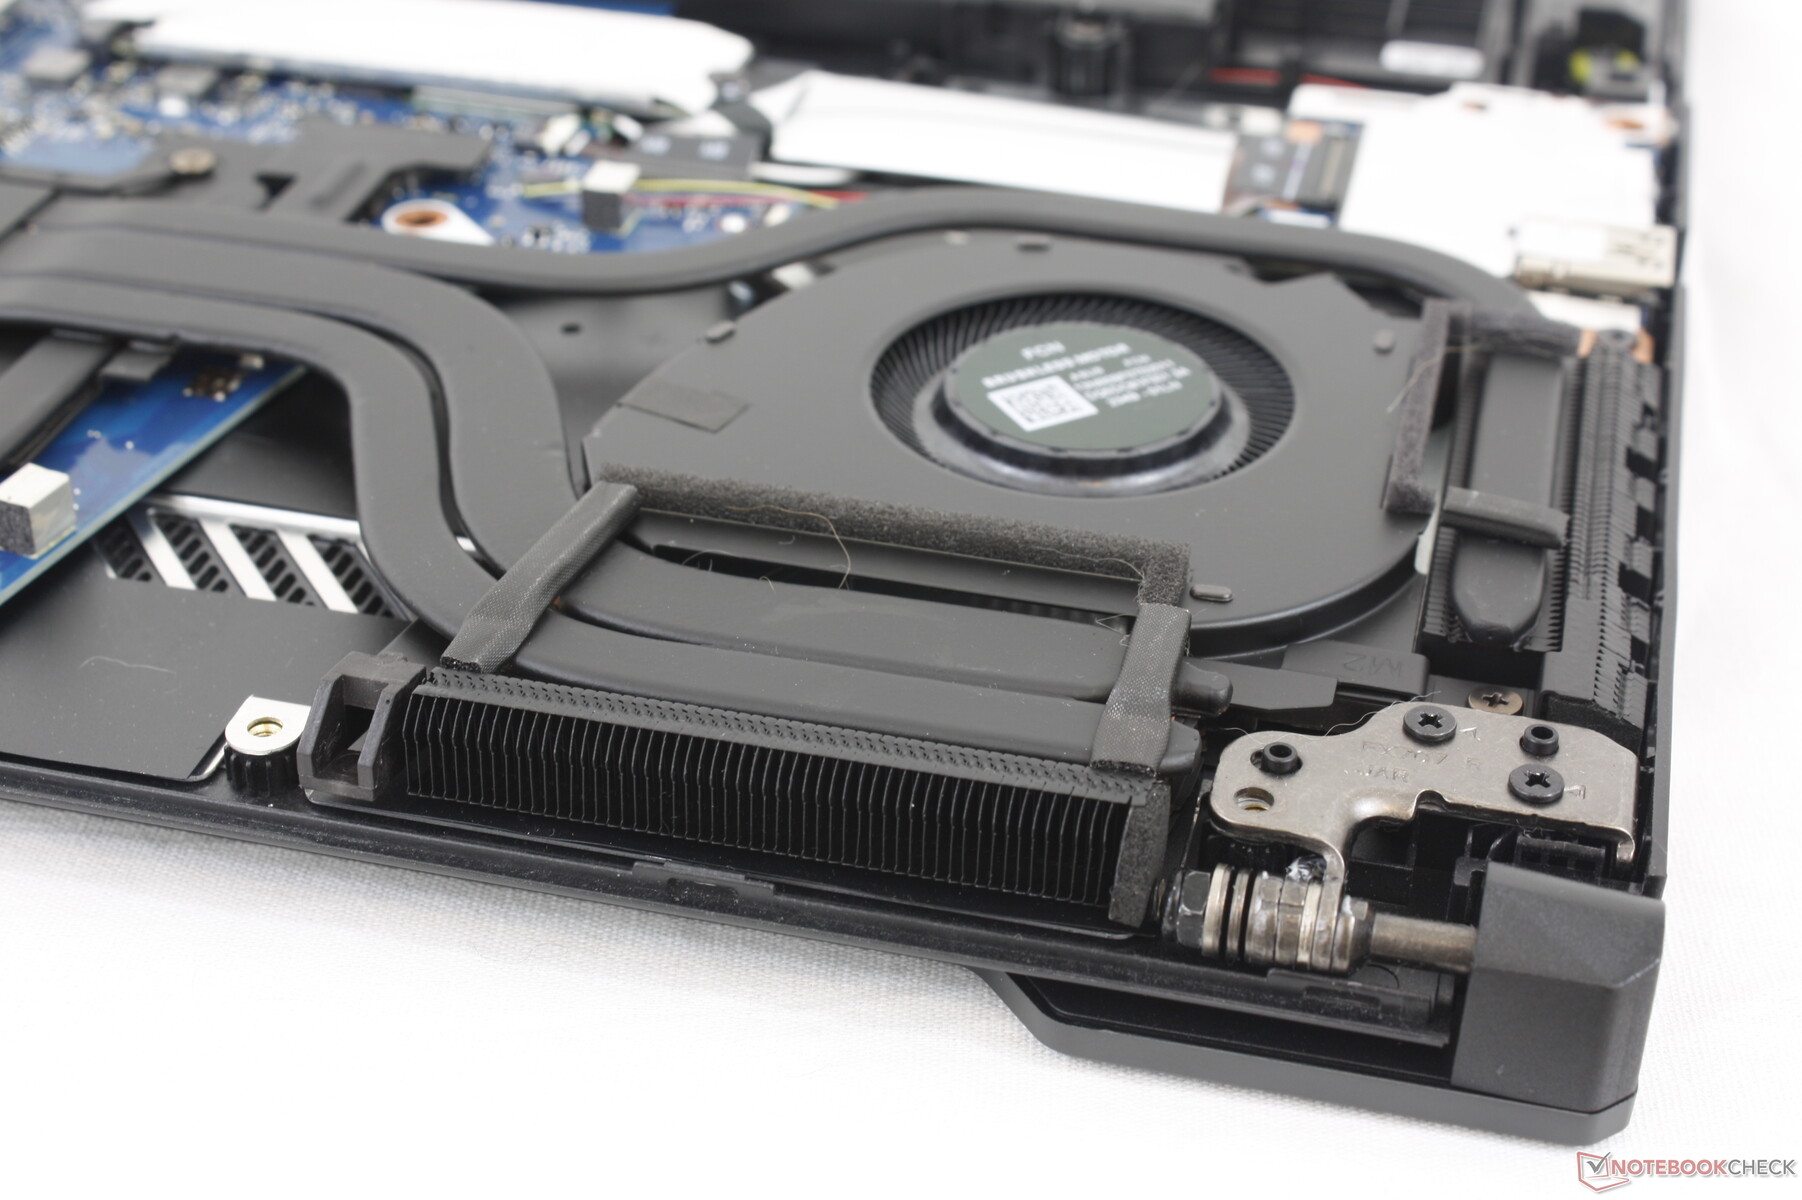
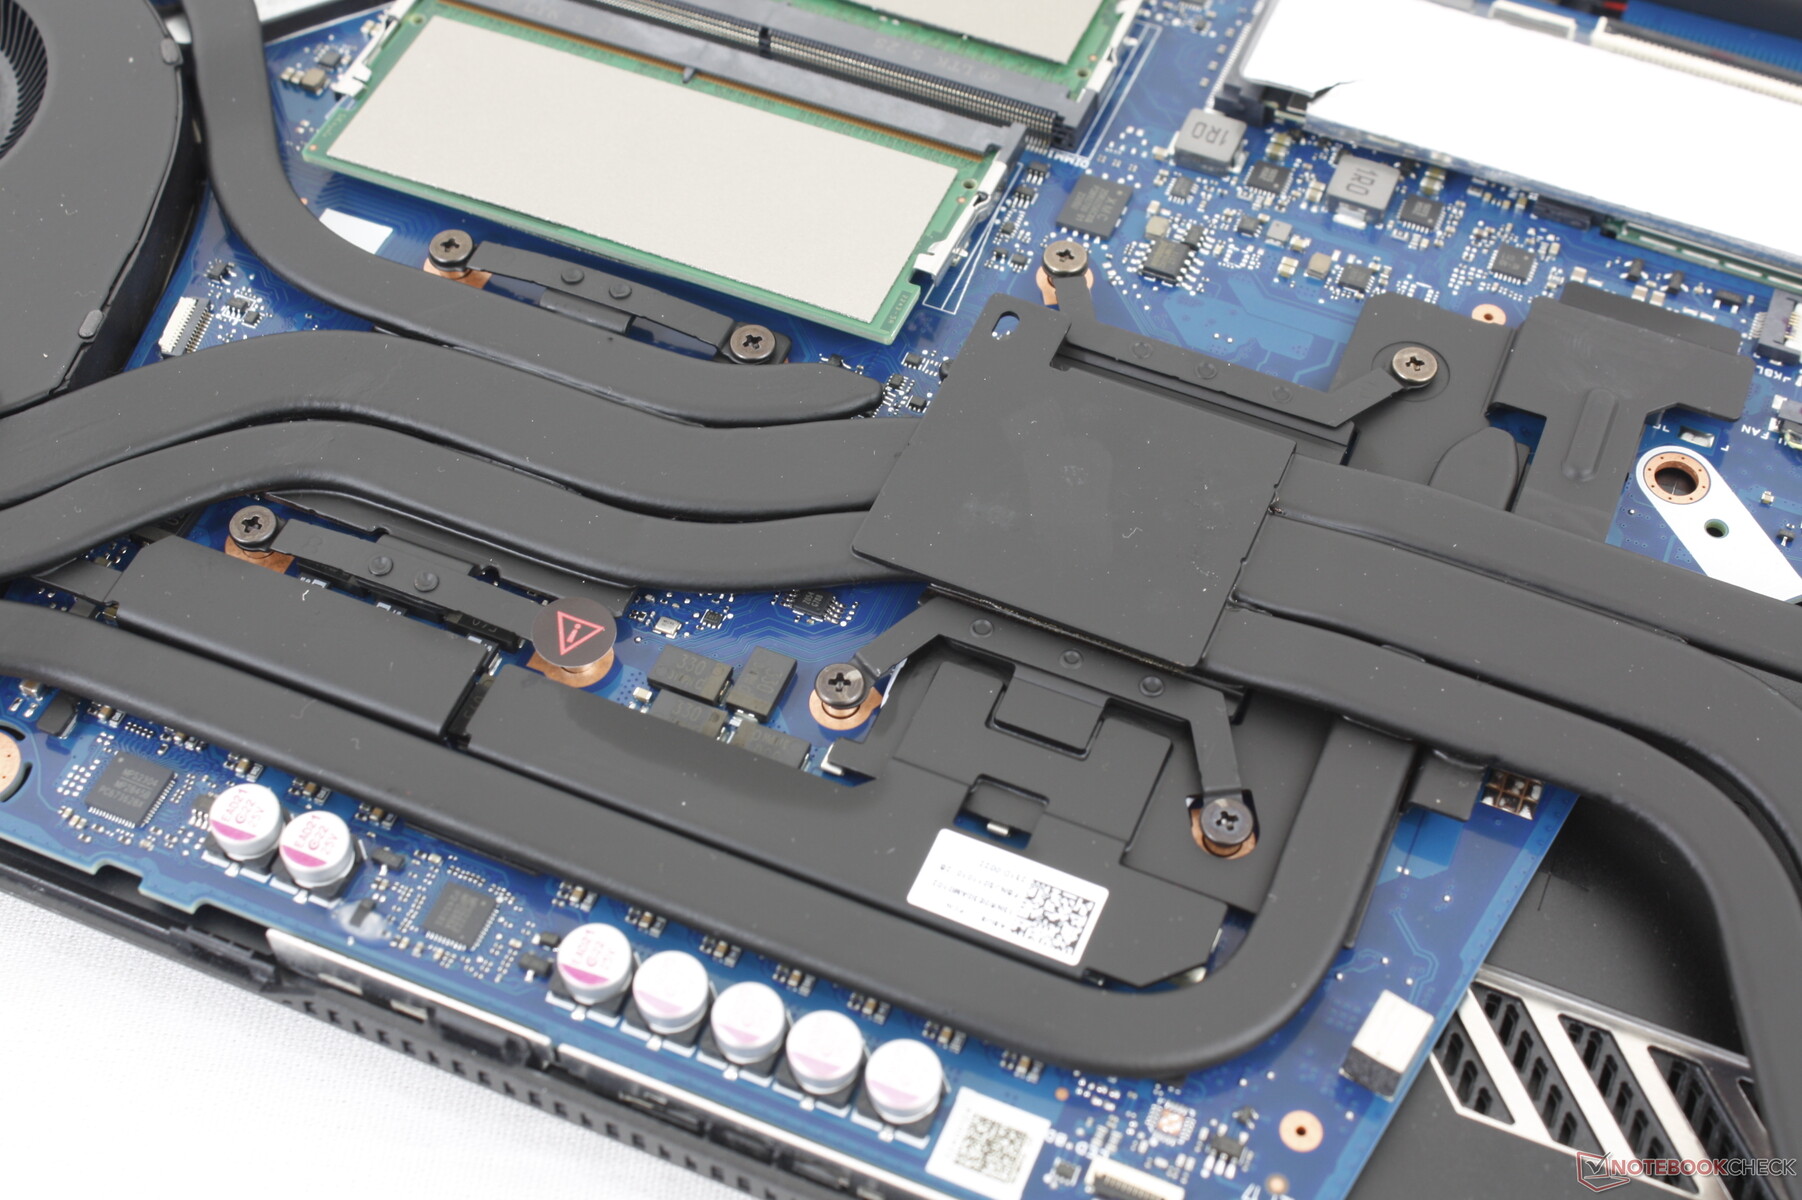
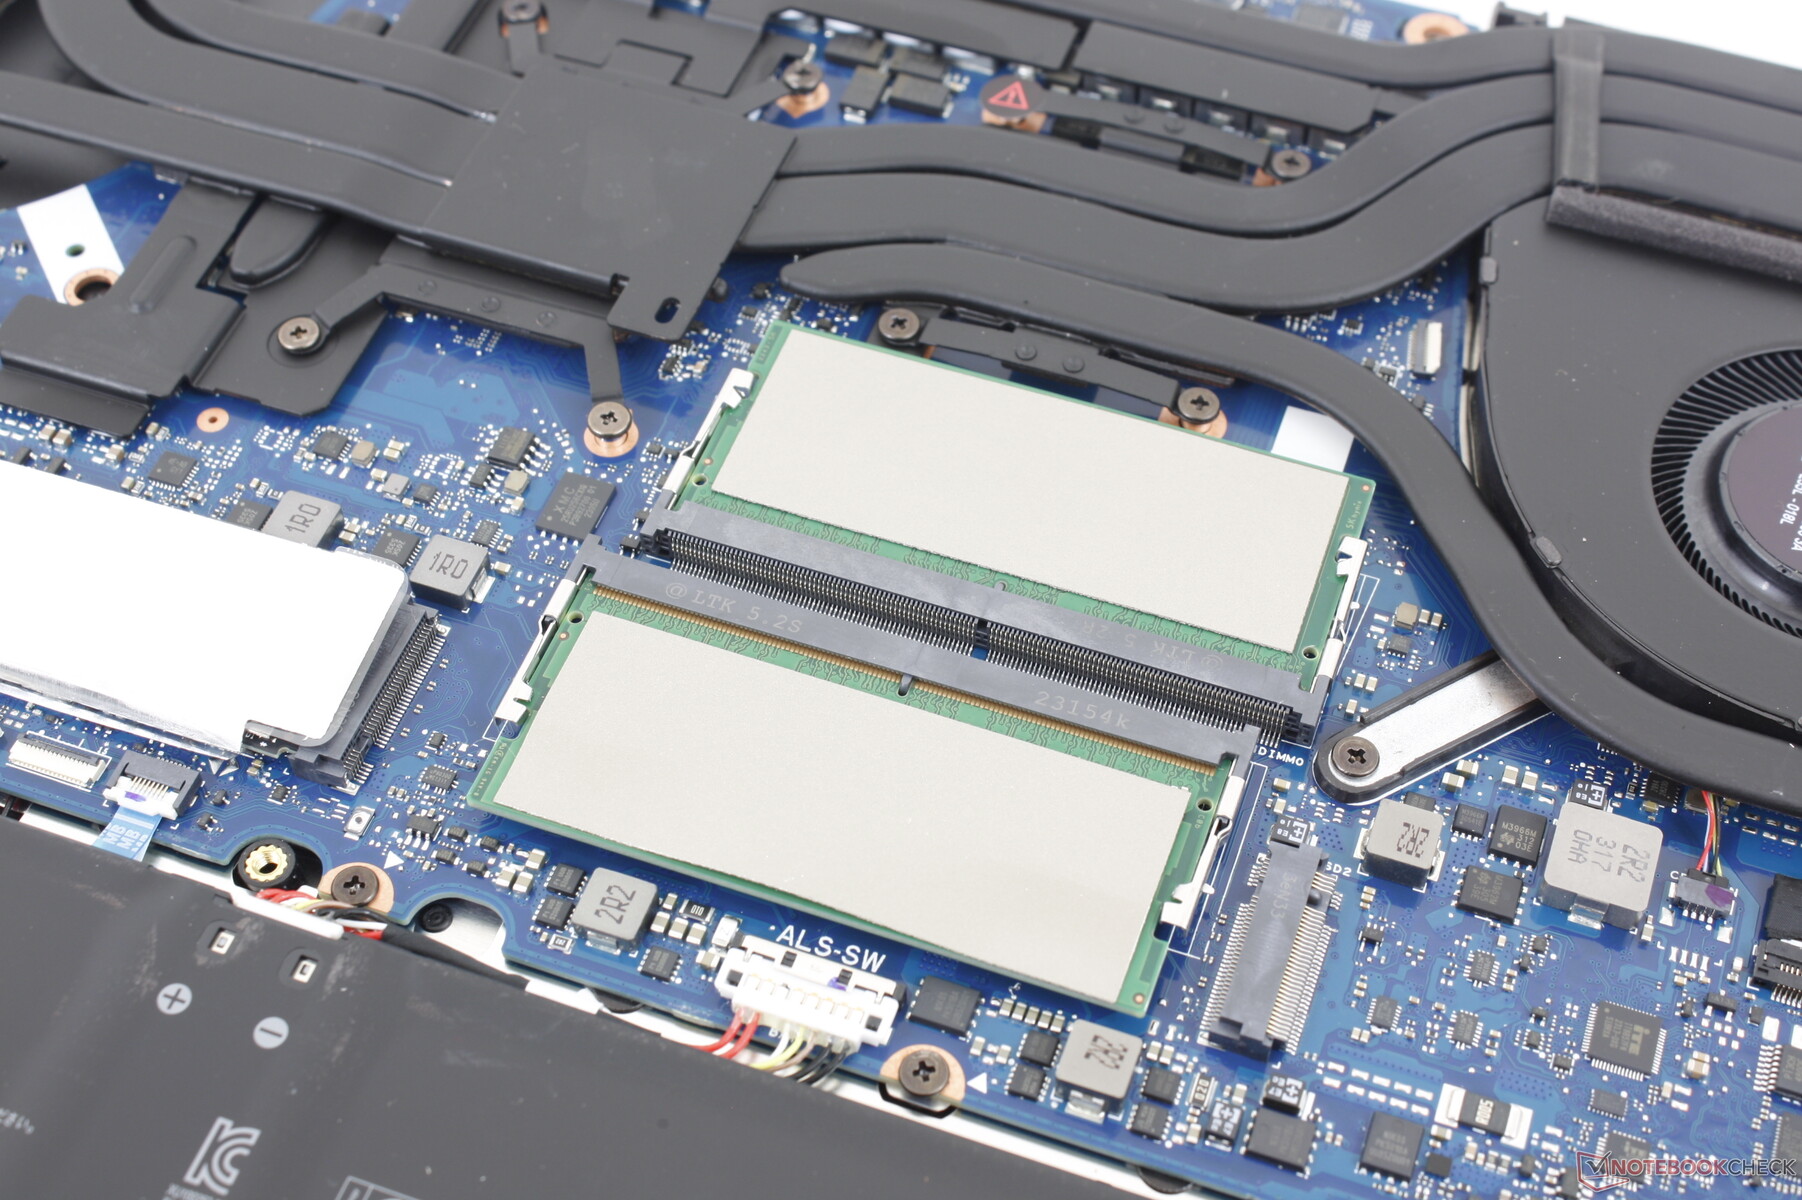
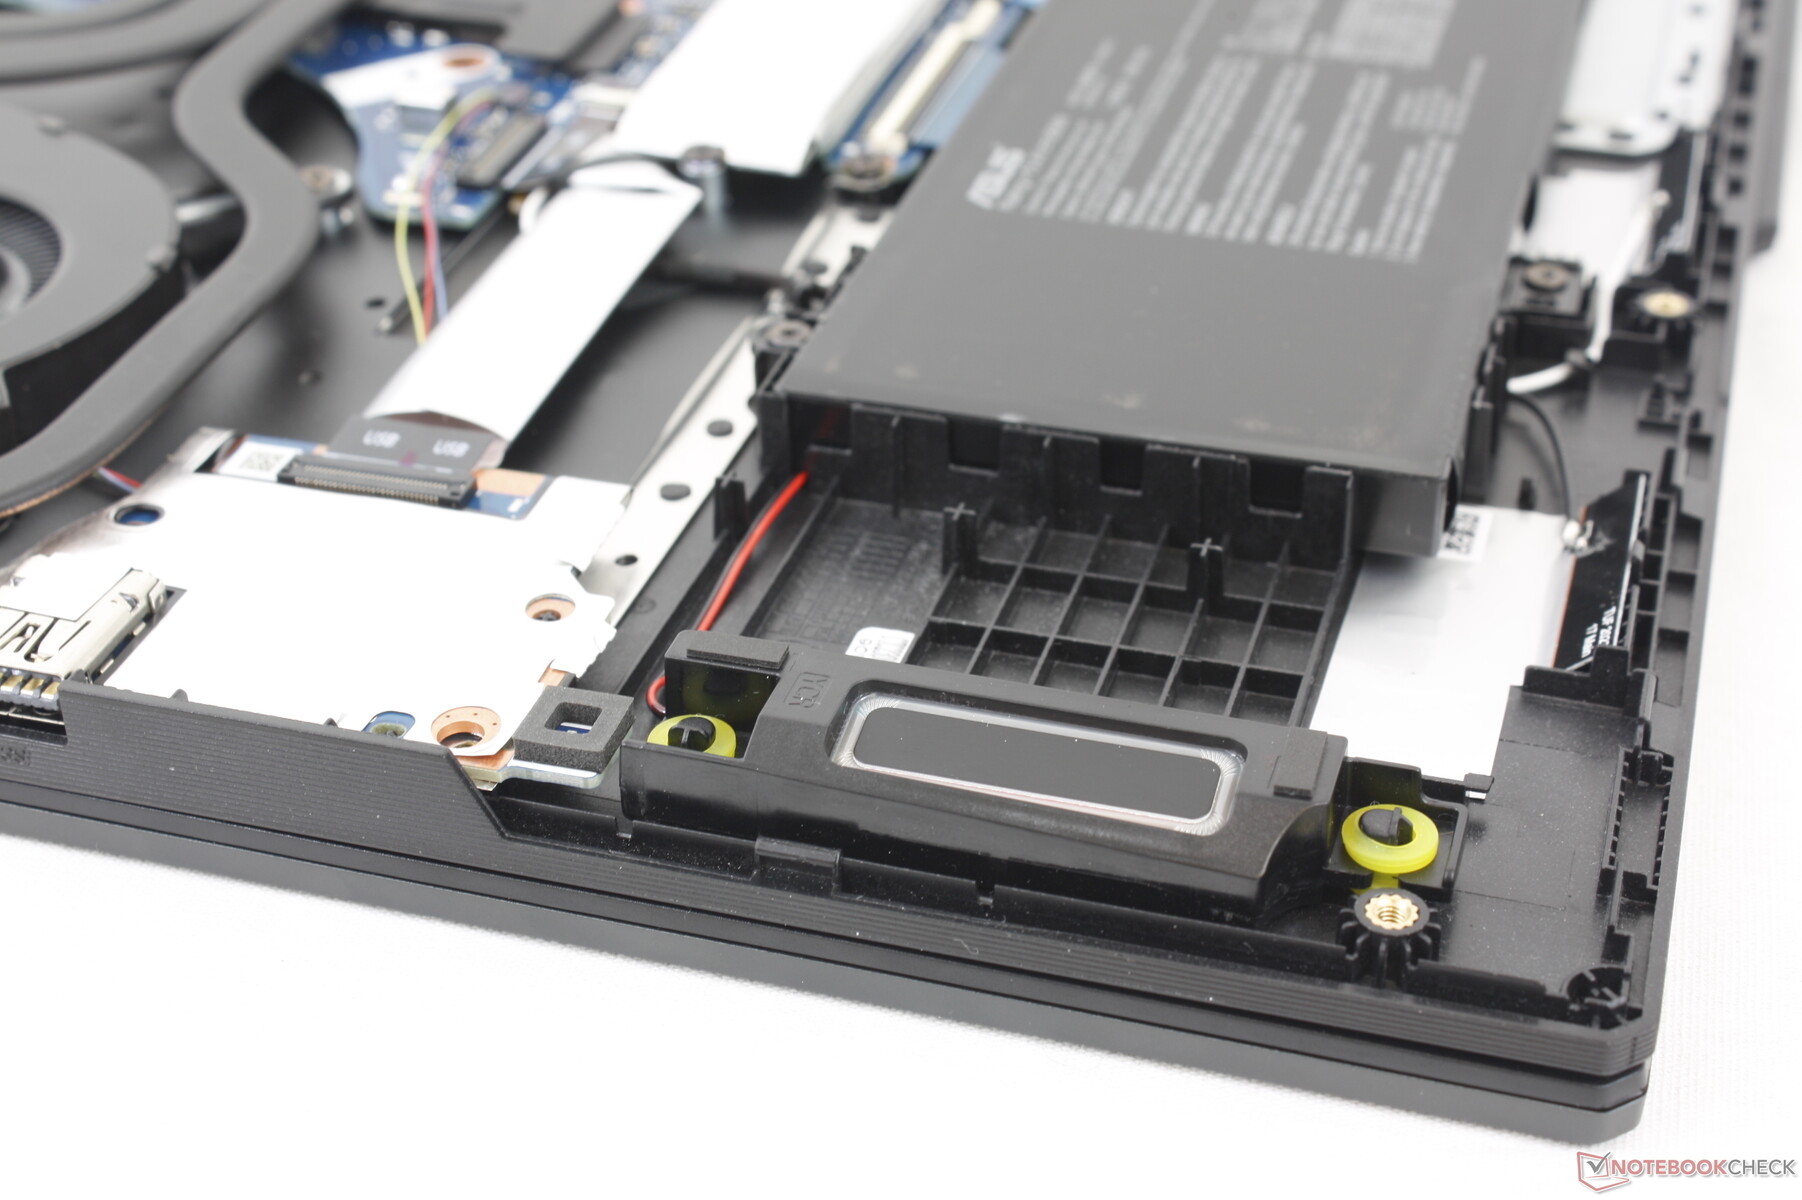
Maintenance
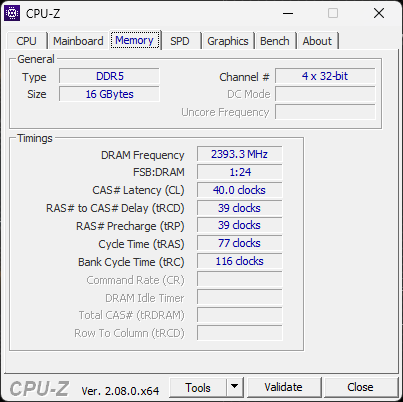
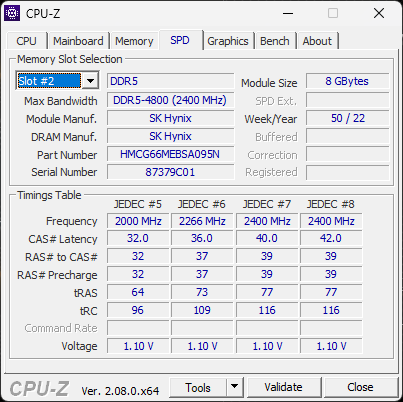
Le panneau inférieur se détache relativement facilement après avoir retiré ses 12 vis Phillips. Il n'y a pas de différences internes majeures entre les versions Intel et AMD et les utilisateurs disposent toujours de deux emplacements SSD M.2 et de deux emplacements SODIMM. La RAM est limitée à 4800 MHz.
Accessoires et garantie
La boîte ne contient pas d'autres éléments que l'adaptateur secteur et la documentation. La garantie limitée habituelle d'un an s'applique si l'appareil est acheté aux États-Unis.
Périphériques d'entrée
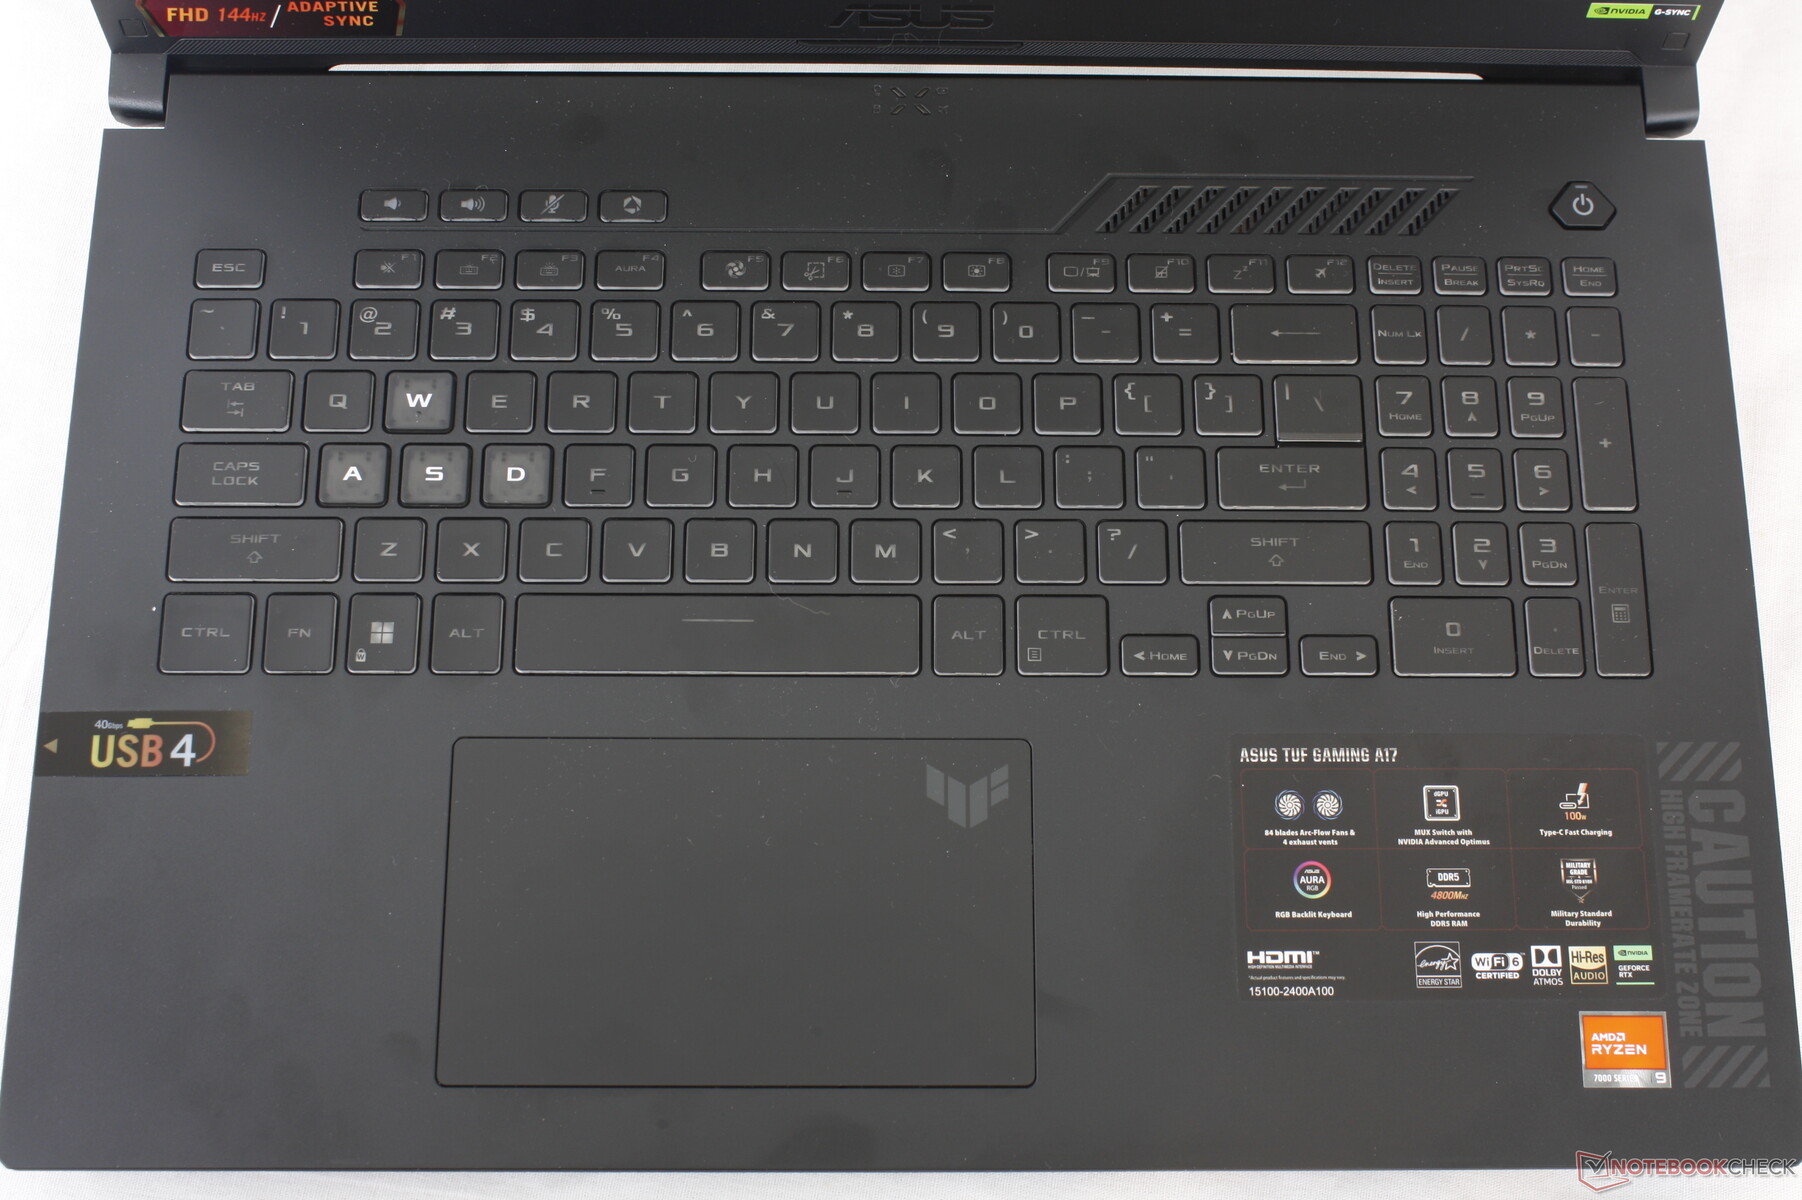
Clavier
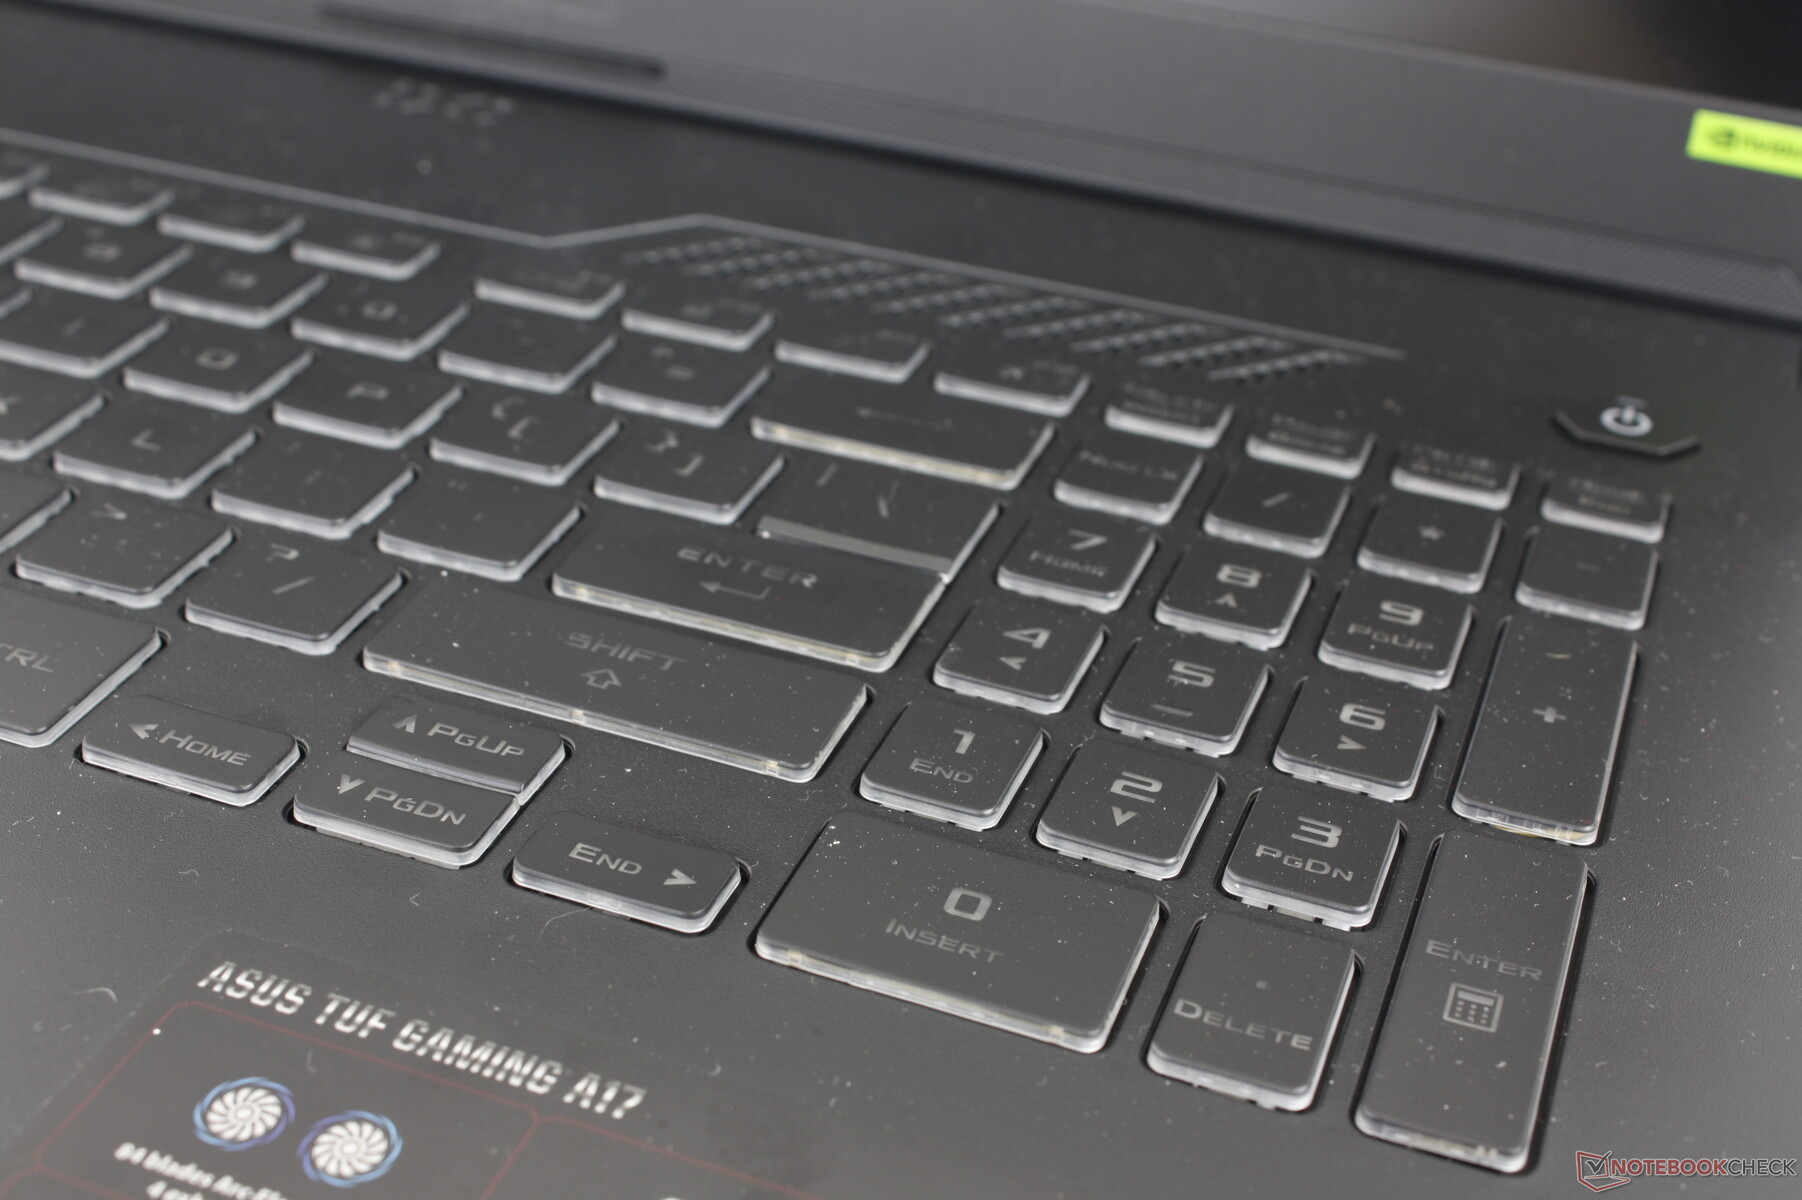
Le clavier RGB à trois zones offre une course de touche de 1,7 mm, ce qui est légèrement plus profond que les touches de la plupart des ultrabooks. L'expérience de frappe est agréable pour un ordinateur portable de jeu, à condition que vous puissiez pardonner l'exiguïté des touches fléchées et du pavé numérique.
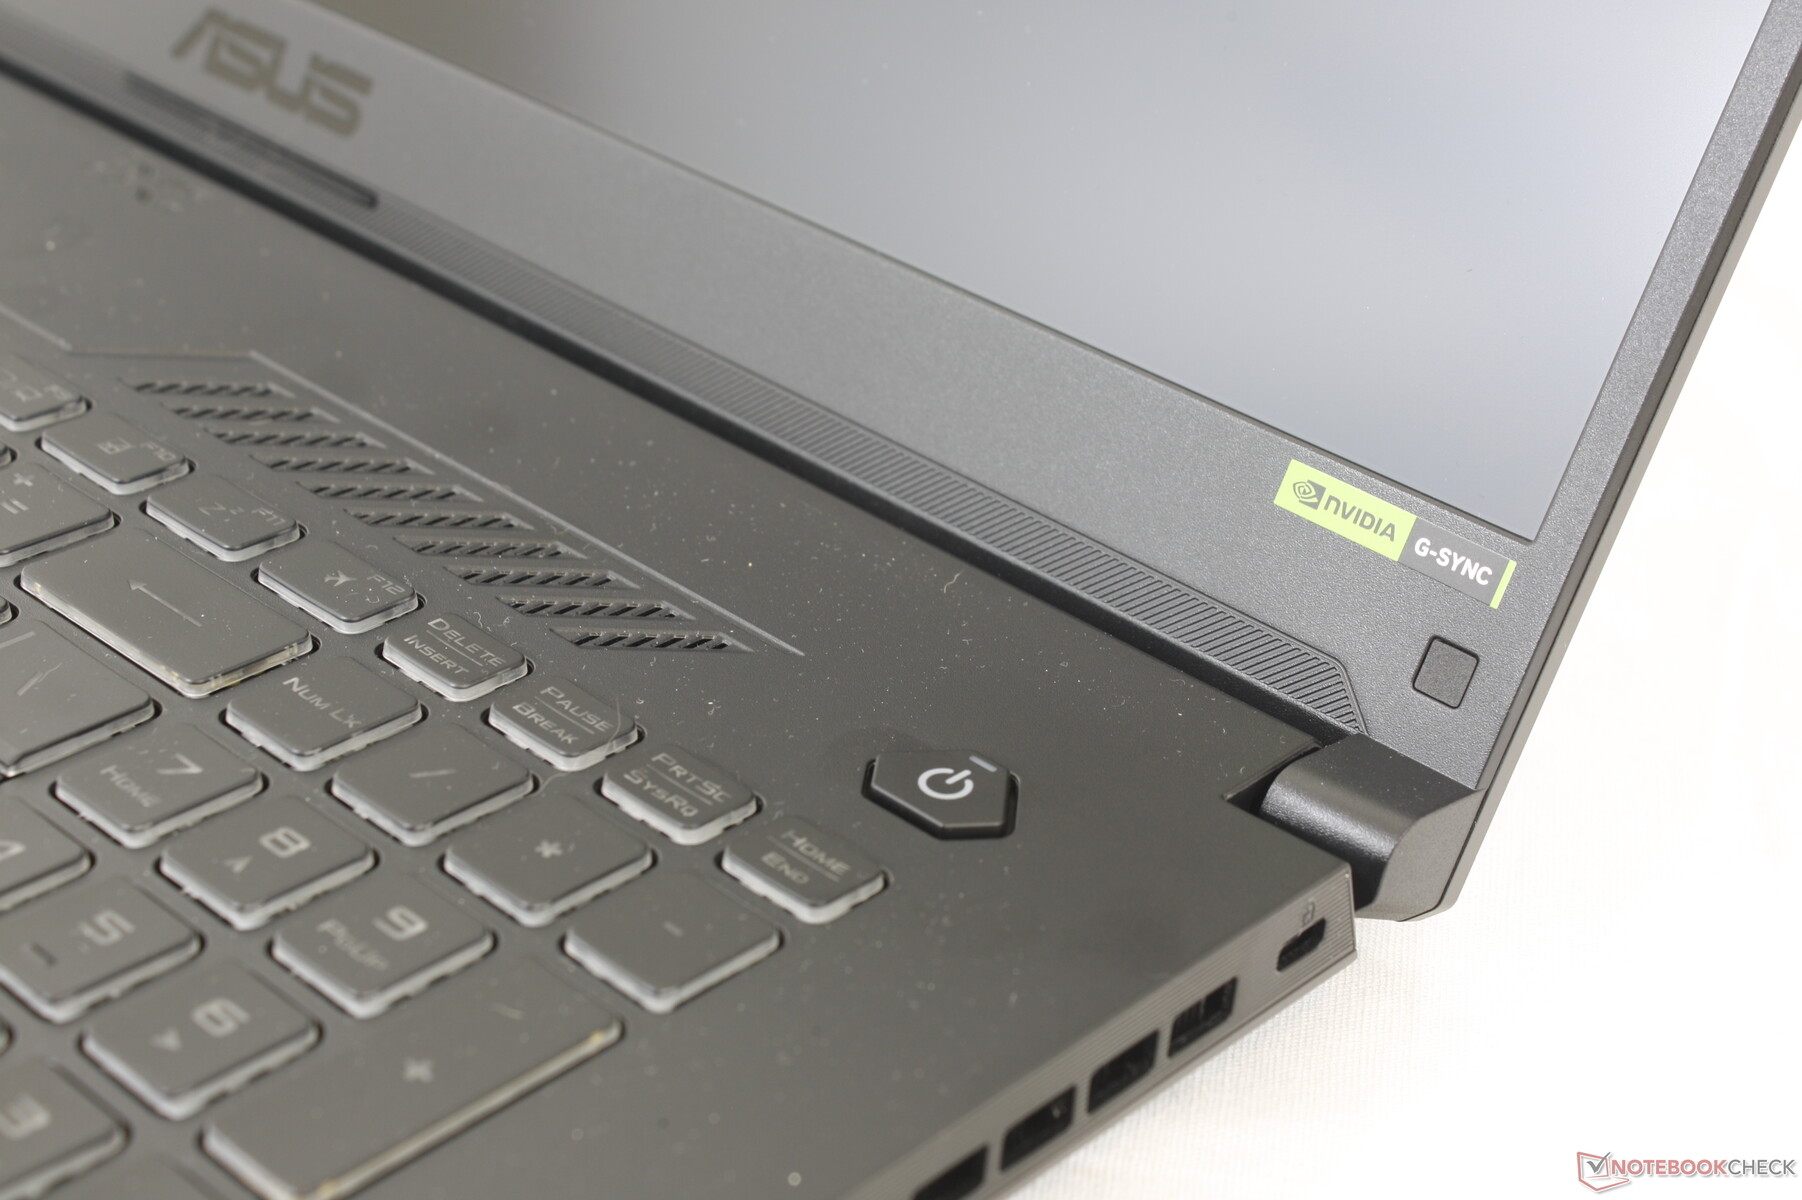
La visibilité des touches n'est pas très bonne car la police gris foncé contraste mal avec les capuchons noirs. Asus a pris la décision bizarre de ne mettre en évidence que les lettres WASD en blanc alors que tous les autres symboles sont beaucoup plus sombres. Cela oblige l'utilisateur à activer le rétroéclairage du clavier pour une meilleure lisibilité, même dans des conditions lumineuses ou si l'autonomie de la batterie est un problème.
Pavé tactile
Avec ses 13 x 7,7 cm, le clickpad reste le même que sur le TUF Gaming F17. Cependant, nous n'avons pas remarqué de problèmes sur notre clickpad ici, alors que celui de notre version Intel avait un "point mort" près du coin inférieur droit. Le retour d'information est décent, voire un peu mou lorsqu'on appuie sur le bouton.

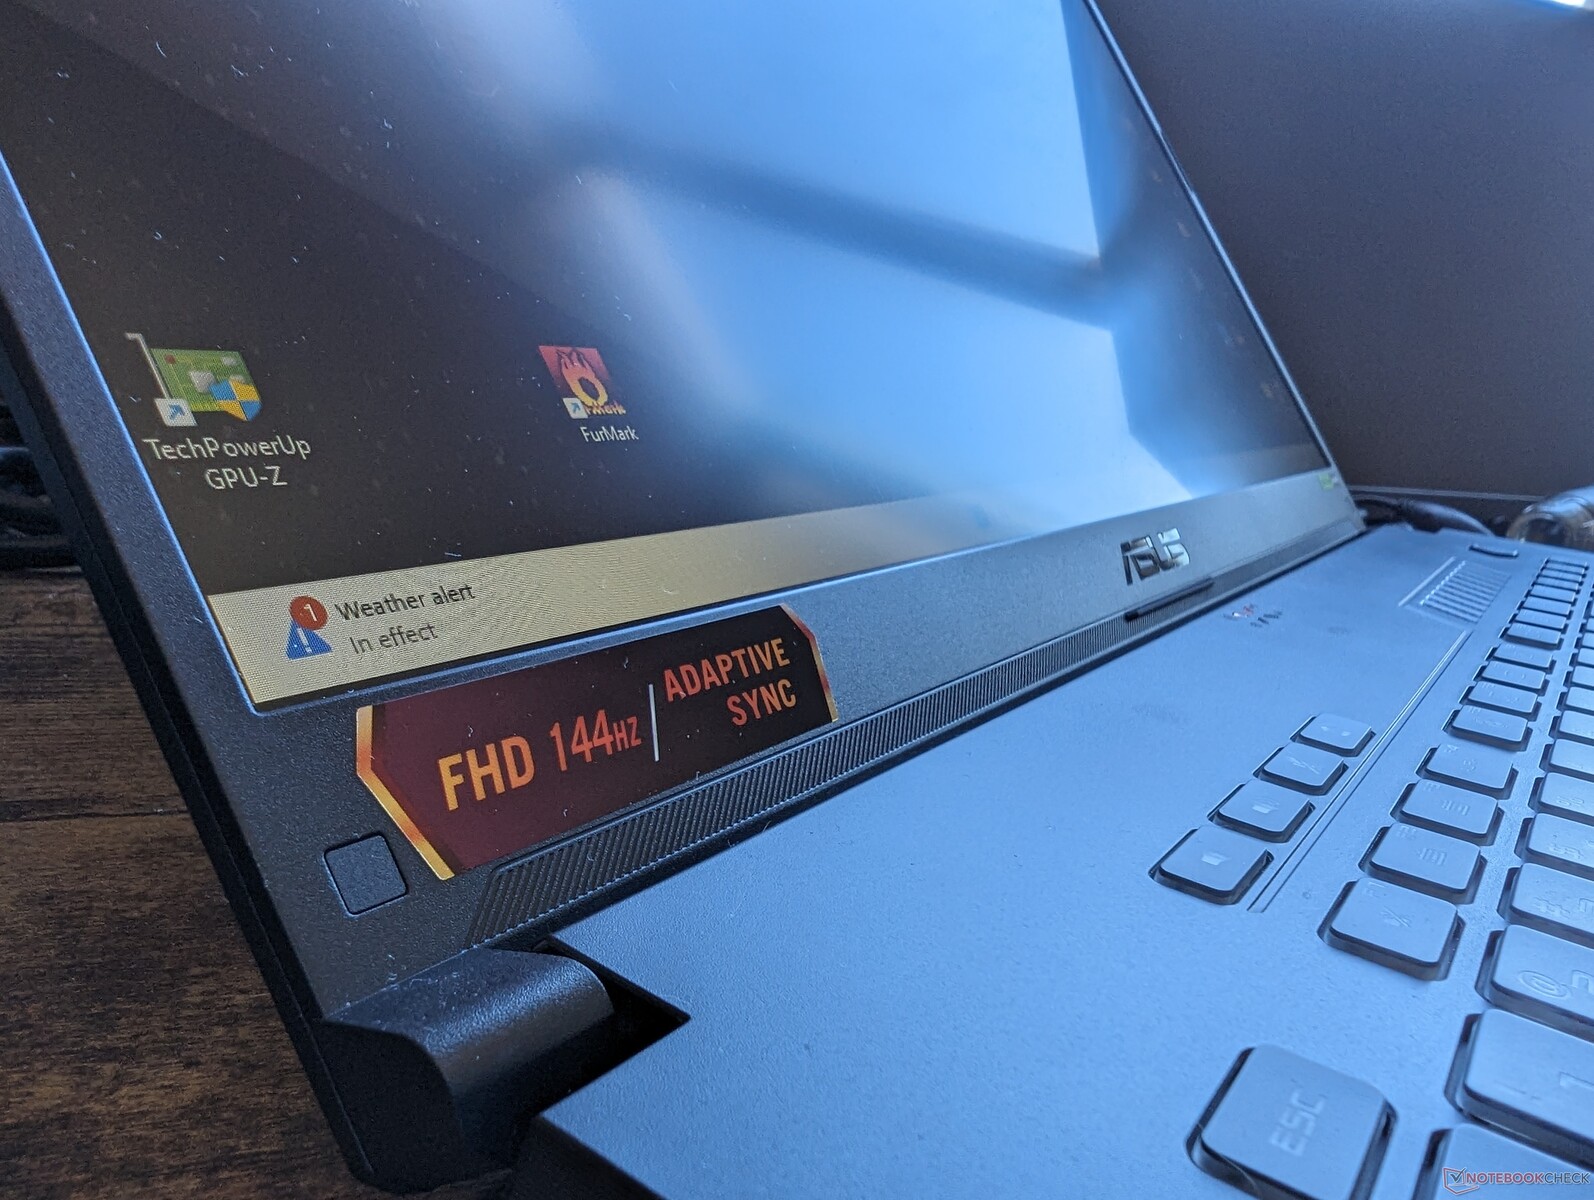
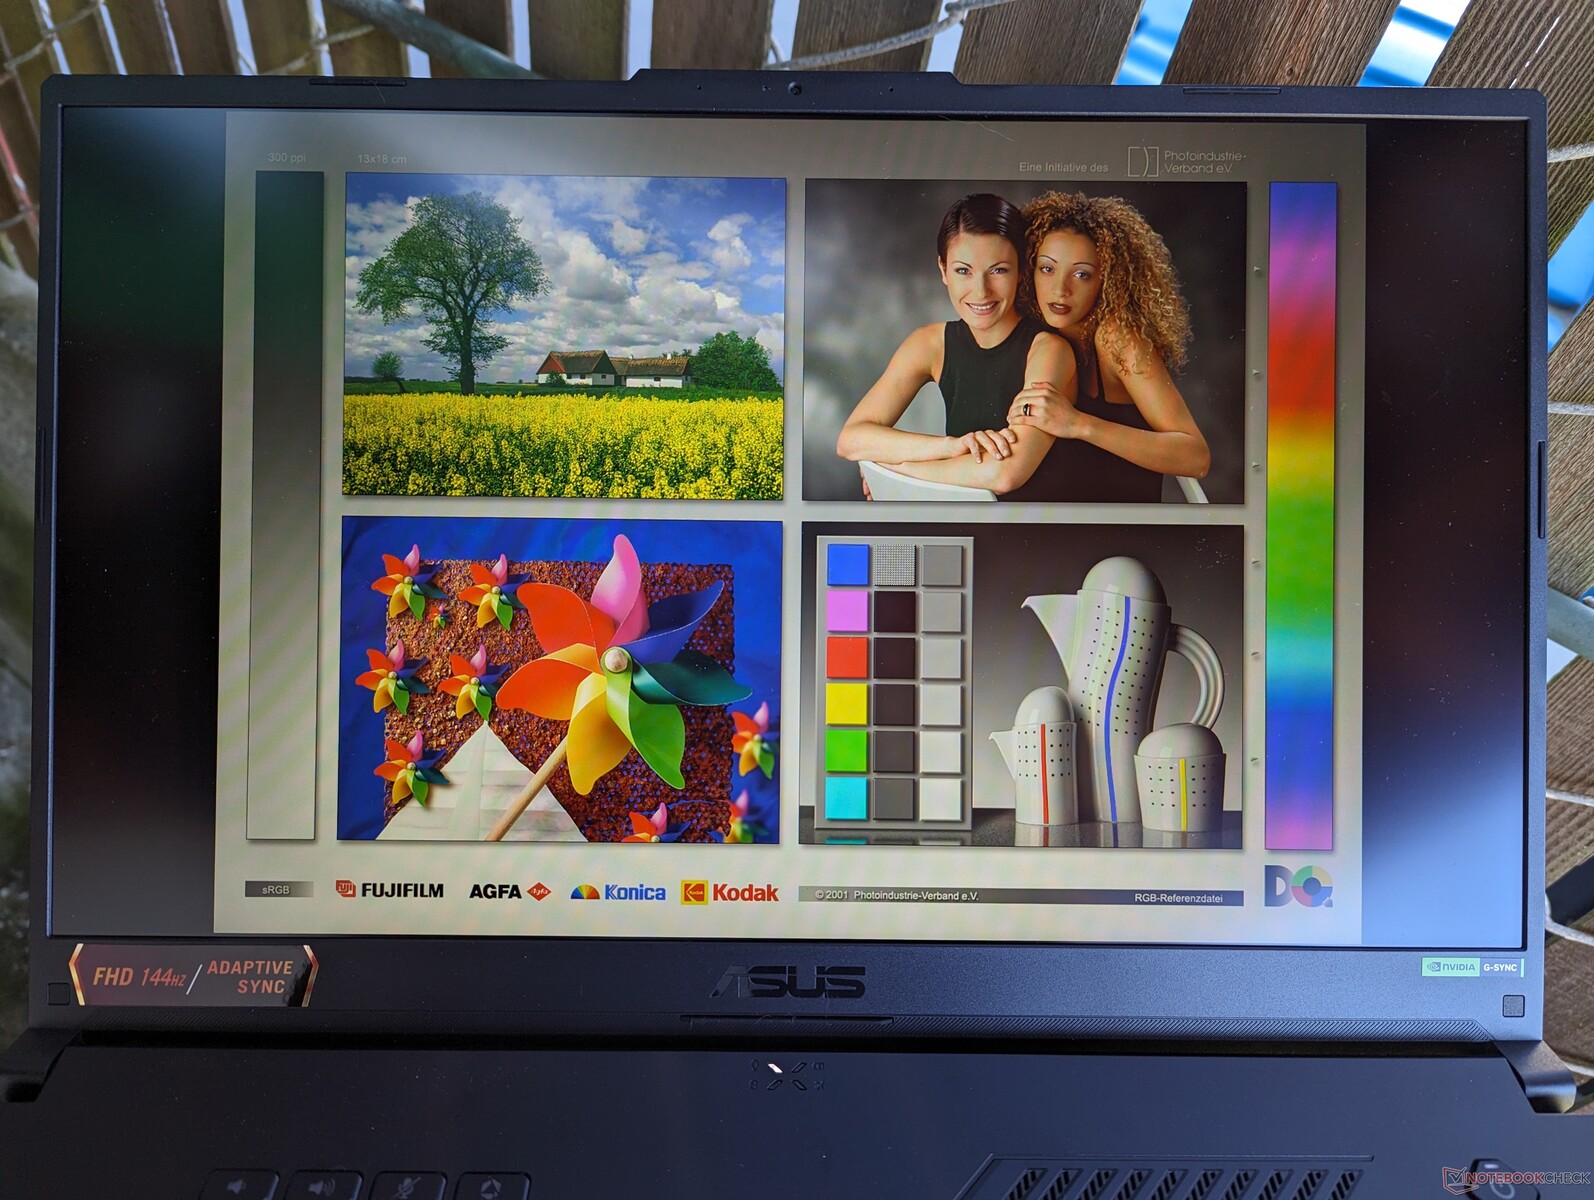
Affichage
Notre écran IPS 1080p AU Optronics B173HAN04.9 est un écran d'entrée de gamme que l'on retrouve sur de nombreux autres ordinateurs portables de jeu, y compris le MSI Pulse 17 ou le Katana 17. Il s'agit généralement de l'option la moins chère et la plus bas de gamme, qui se distingue par une mauvaise reproduction des couleurs (~60% sRGB) et des temps de réponse noir-blanc lents. Heureusement, Asus propose un total de trois écrans pour sa série FA707 :
- 1920 x 1080, IPS, ~60% sRGB, 144 Hz
- 2560 x 1440, IPS, 100% DCI-P3, 240 Hz
- 2560 x 1440, IPS, 100% sRGB, 360 Hz
Bien qu'il n'y ait pas d'options OLED ou mini-LED, nous vous recommandons vivement l'une des deux dalles 1440p, car elles offrent des couleurs nettement meilleures que la dalle 1080p de base, tout en conservant la synchronisation adaptative et l'Optimus avancé.

| |||||||||||||||||||||||||
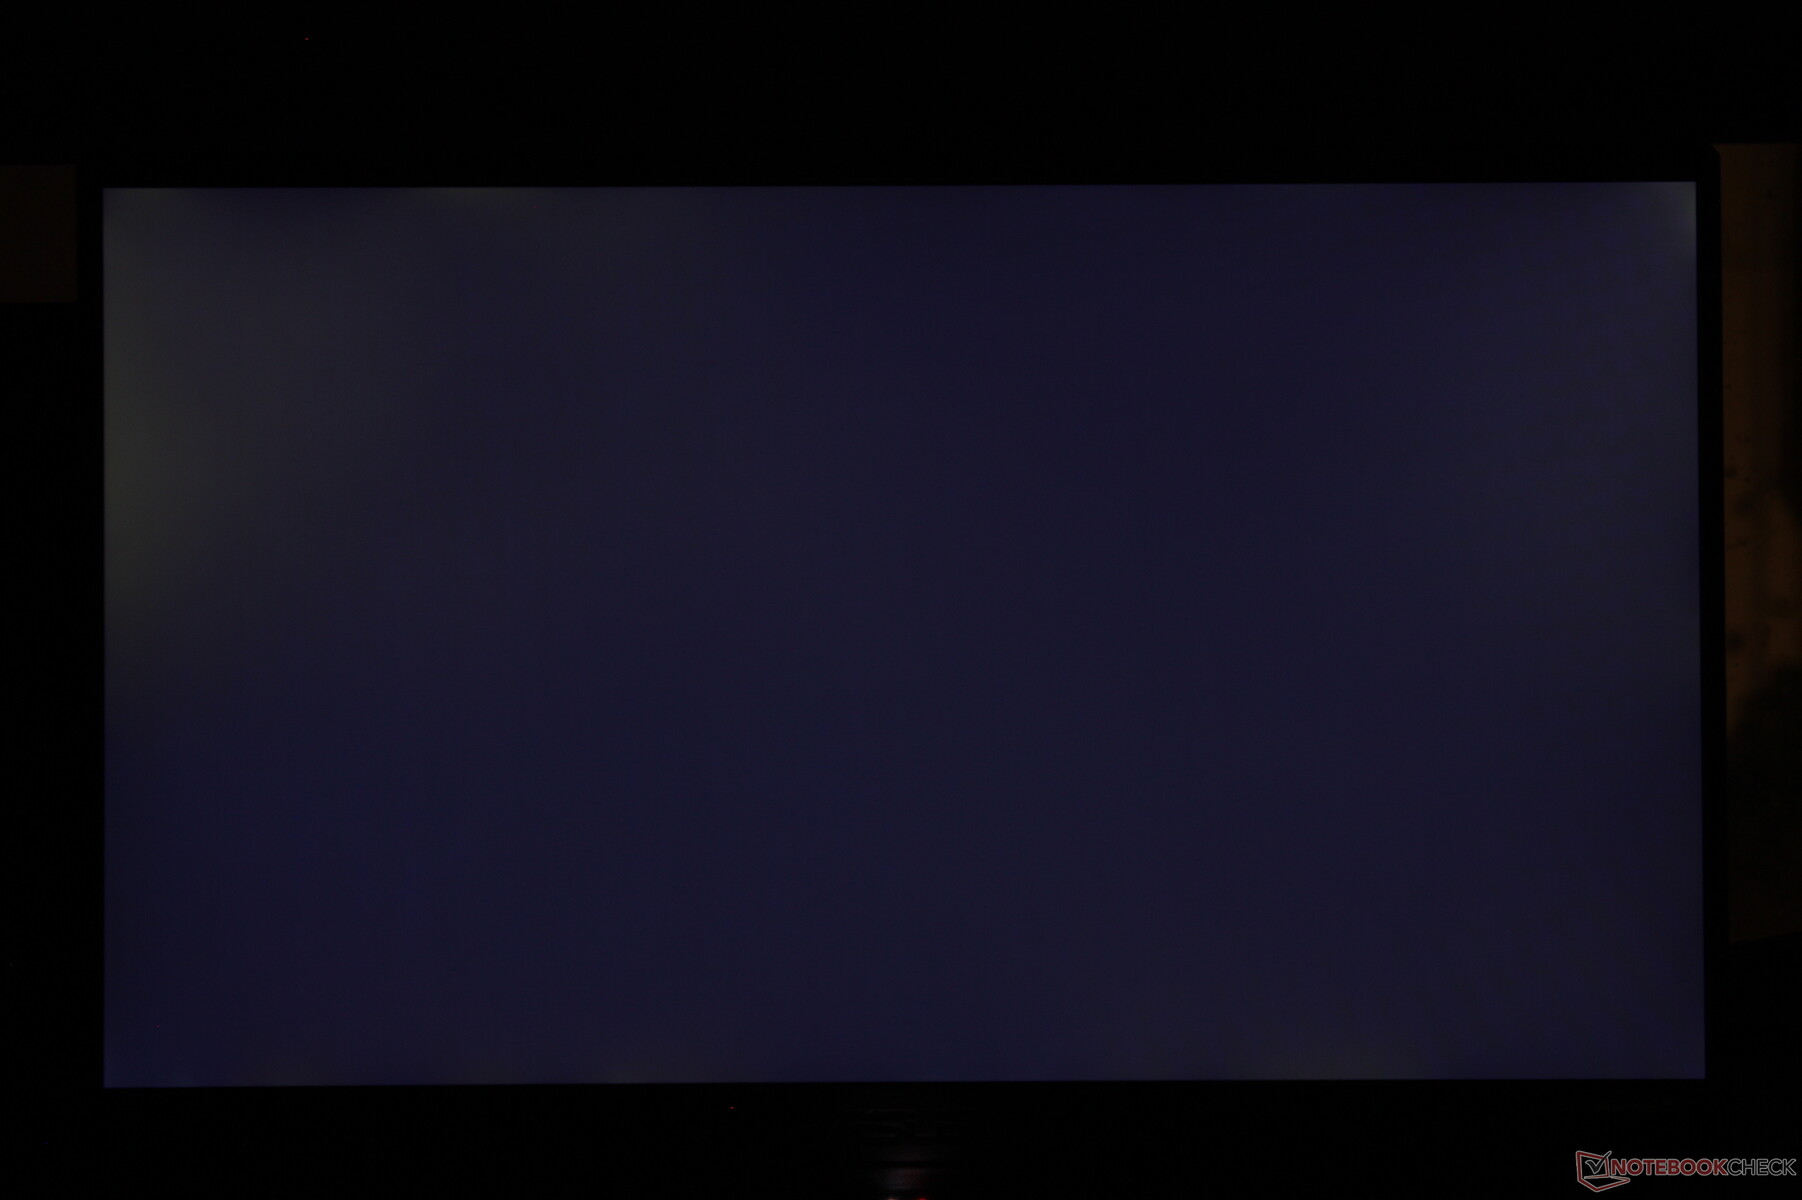
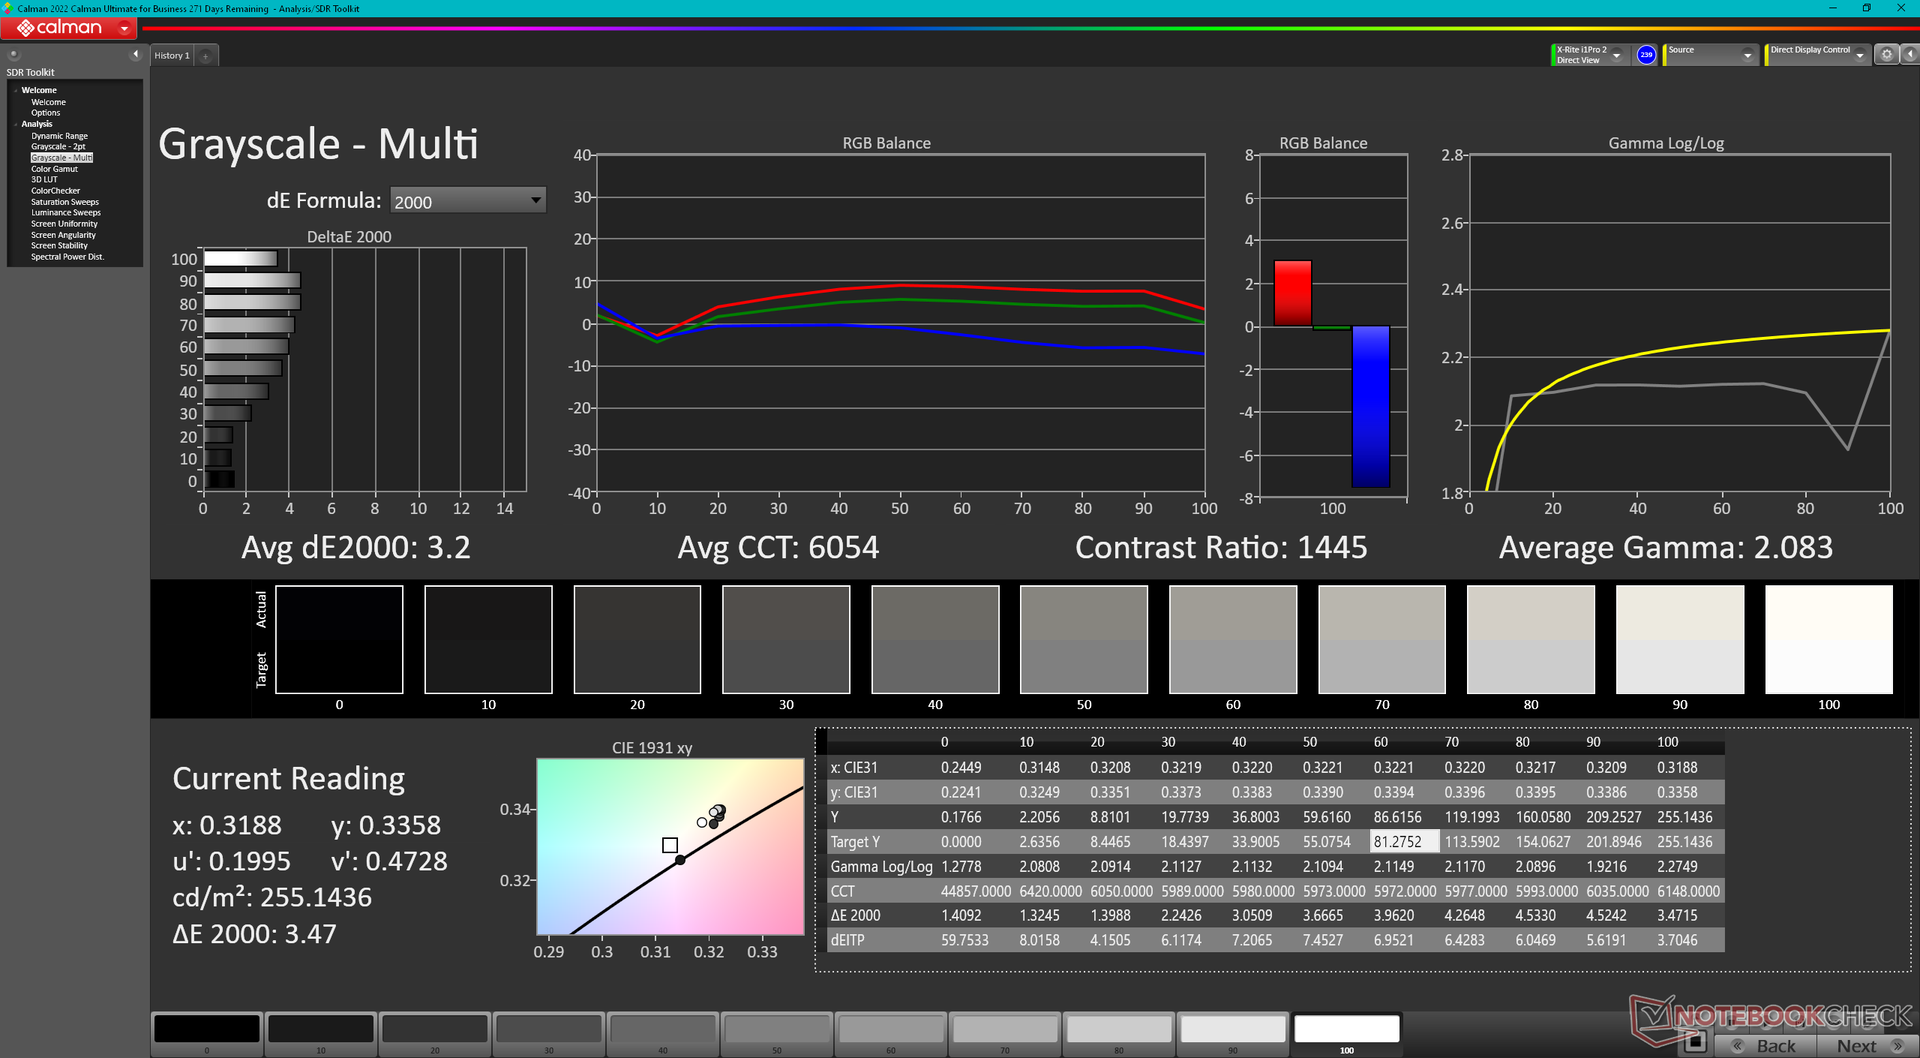
Homogénéité de la luminosité: 91 %
Valeur mesurée au centre, sur batterie: 255.9 cd/m²
Contraste: 1219:1 (Valeurs des noirs: 0.21 cd/m²)
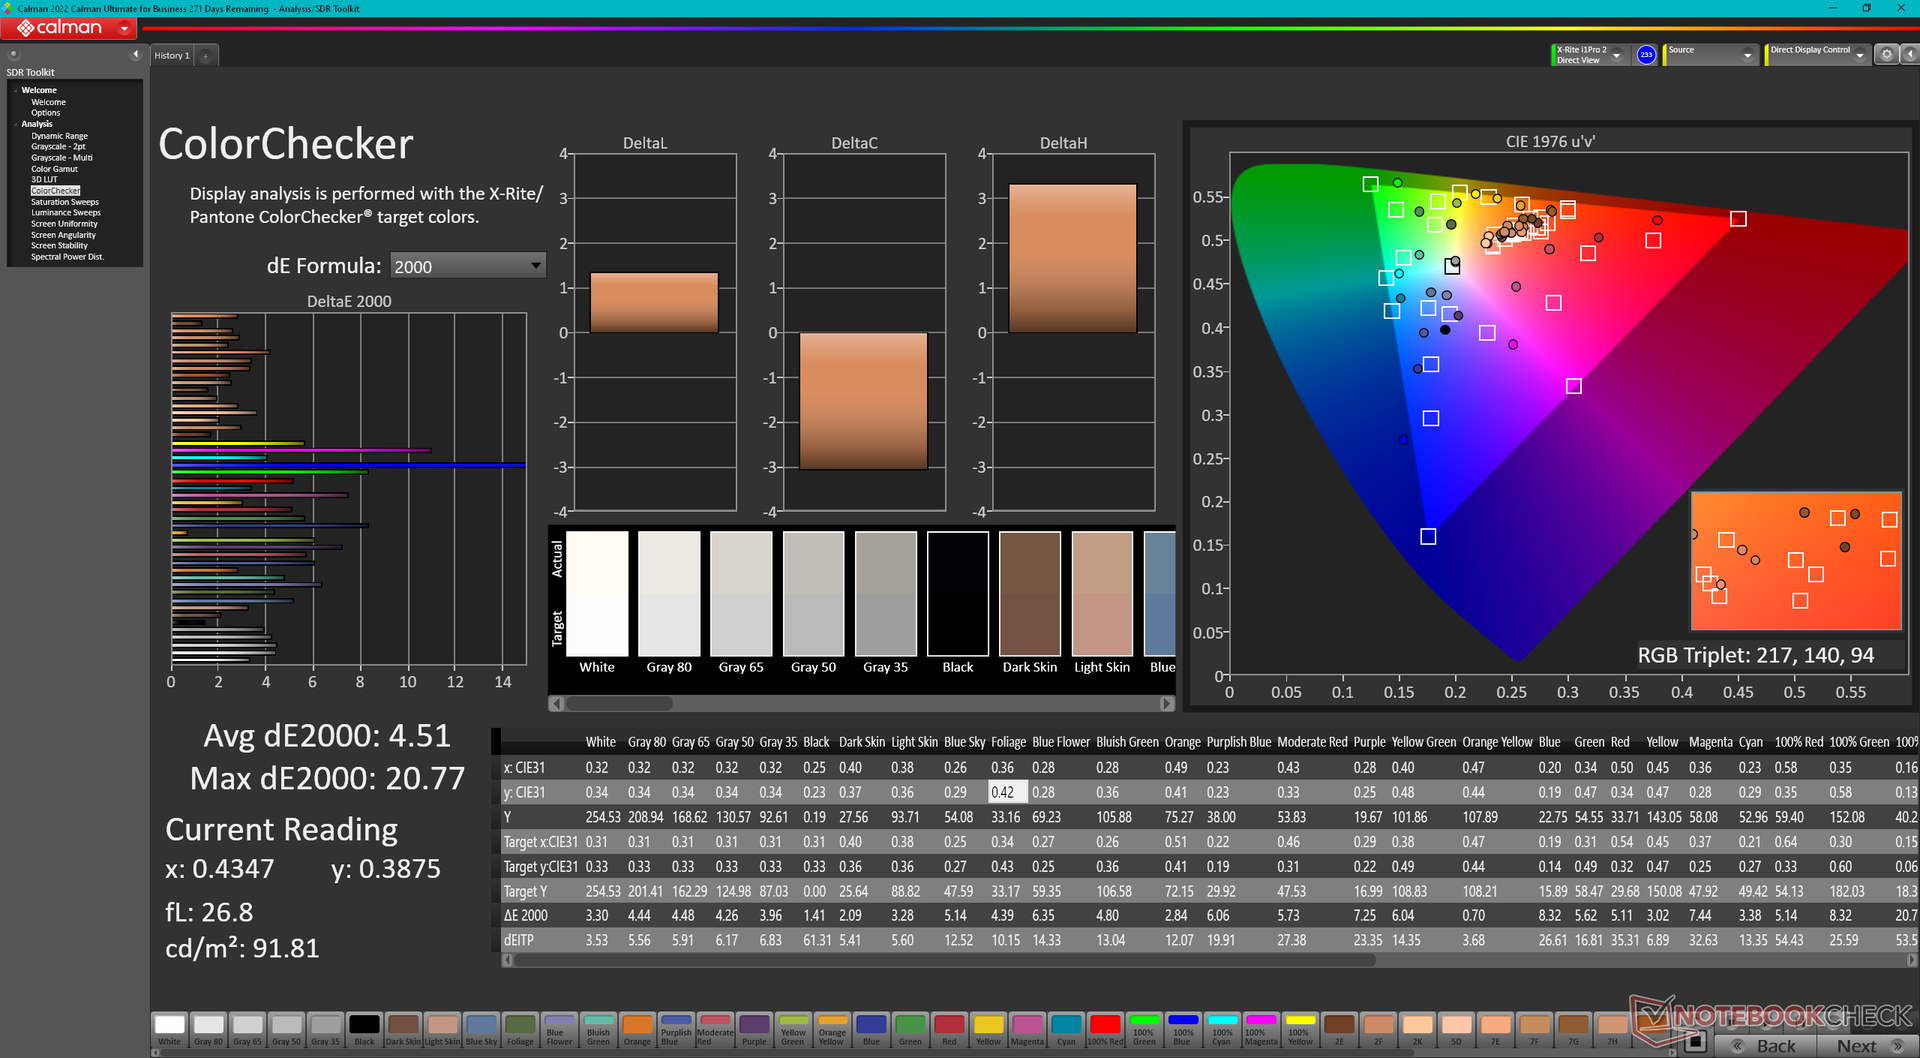
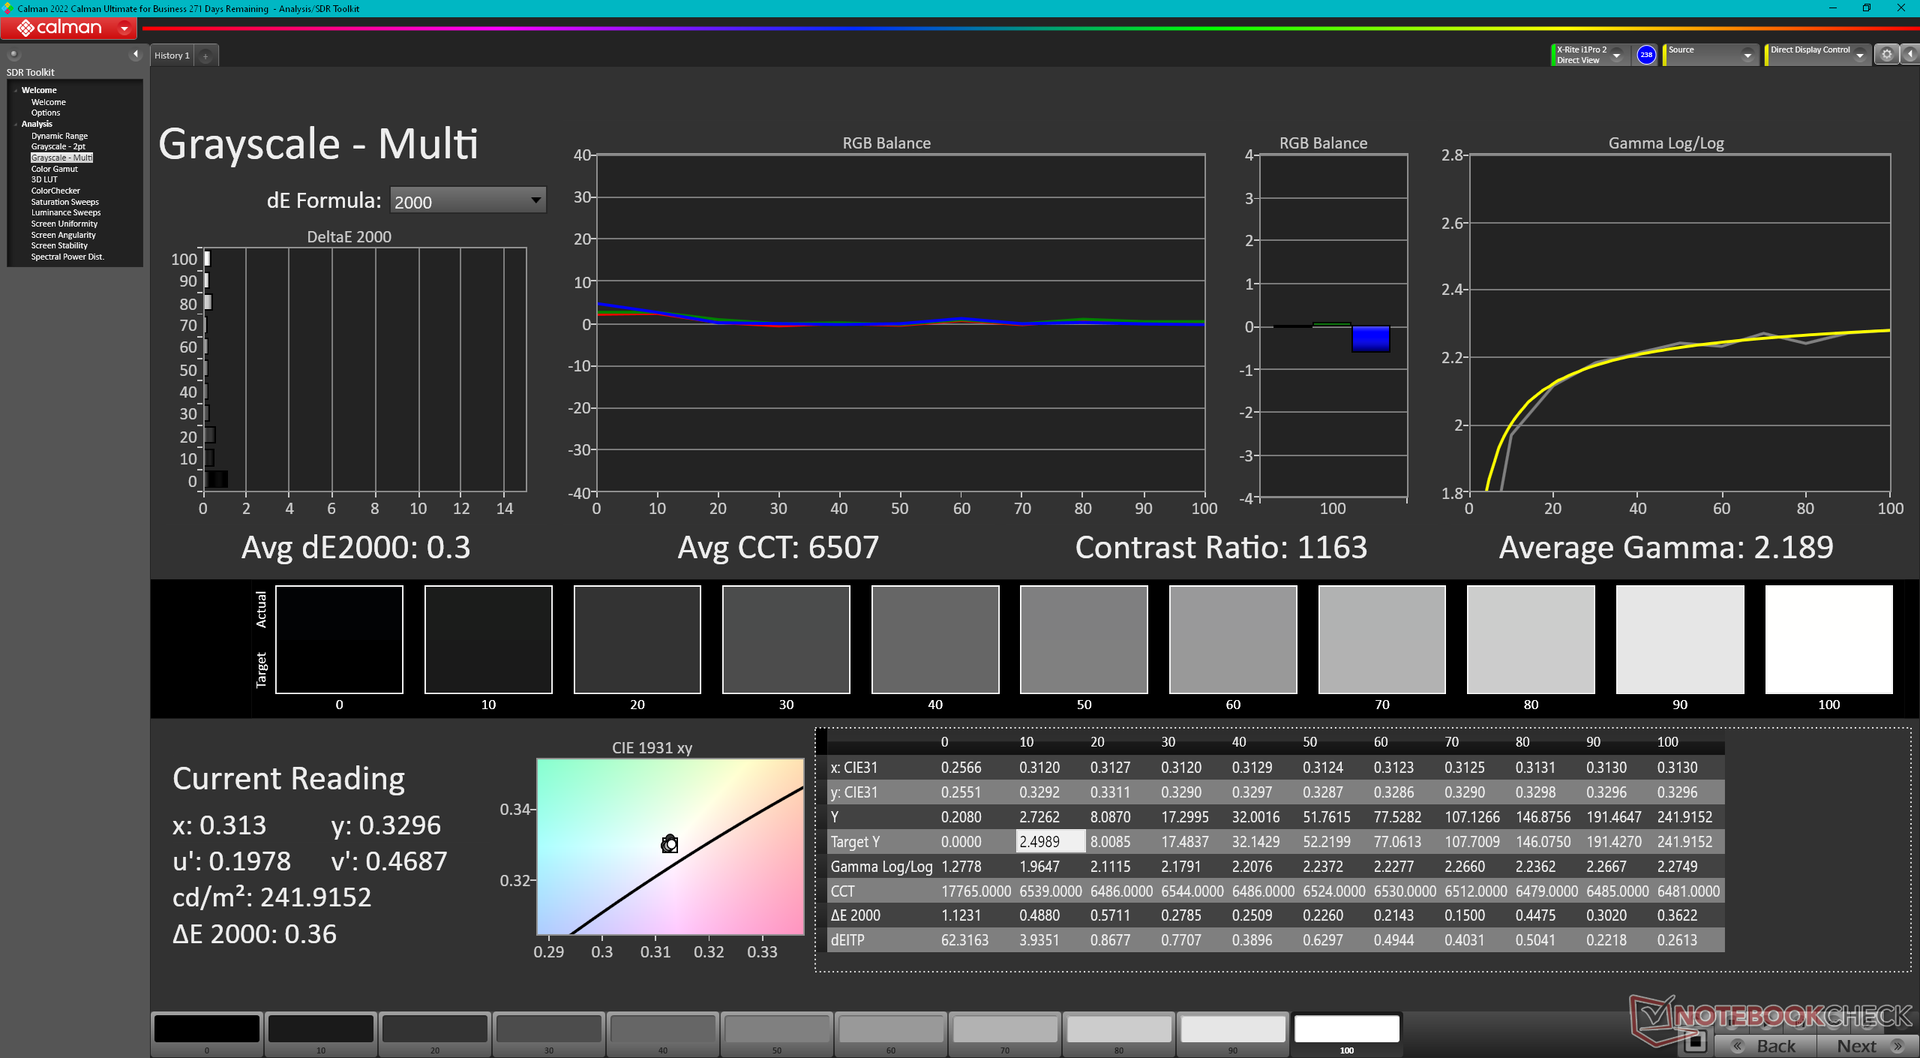
ΔE ColorChecker Calman: 4.51 | ∀{0.5-29.43 Ø4.71}
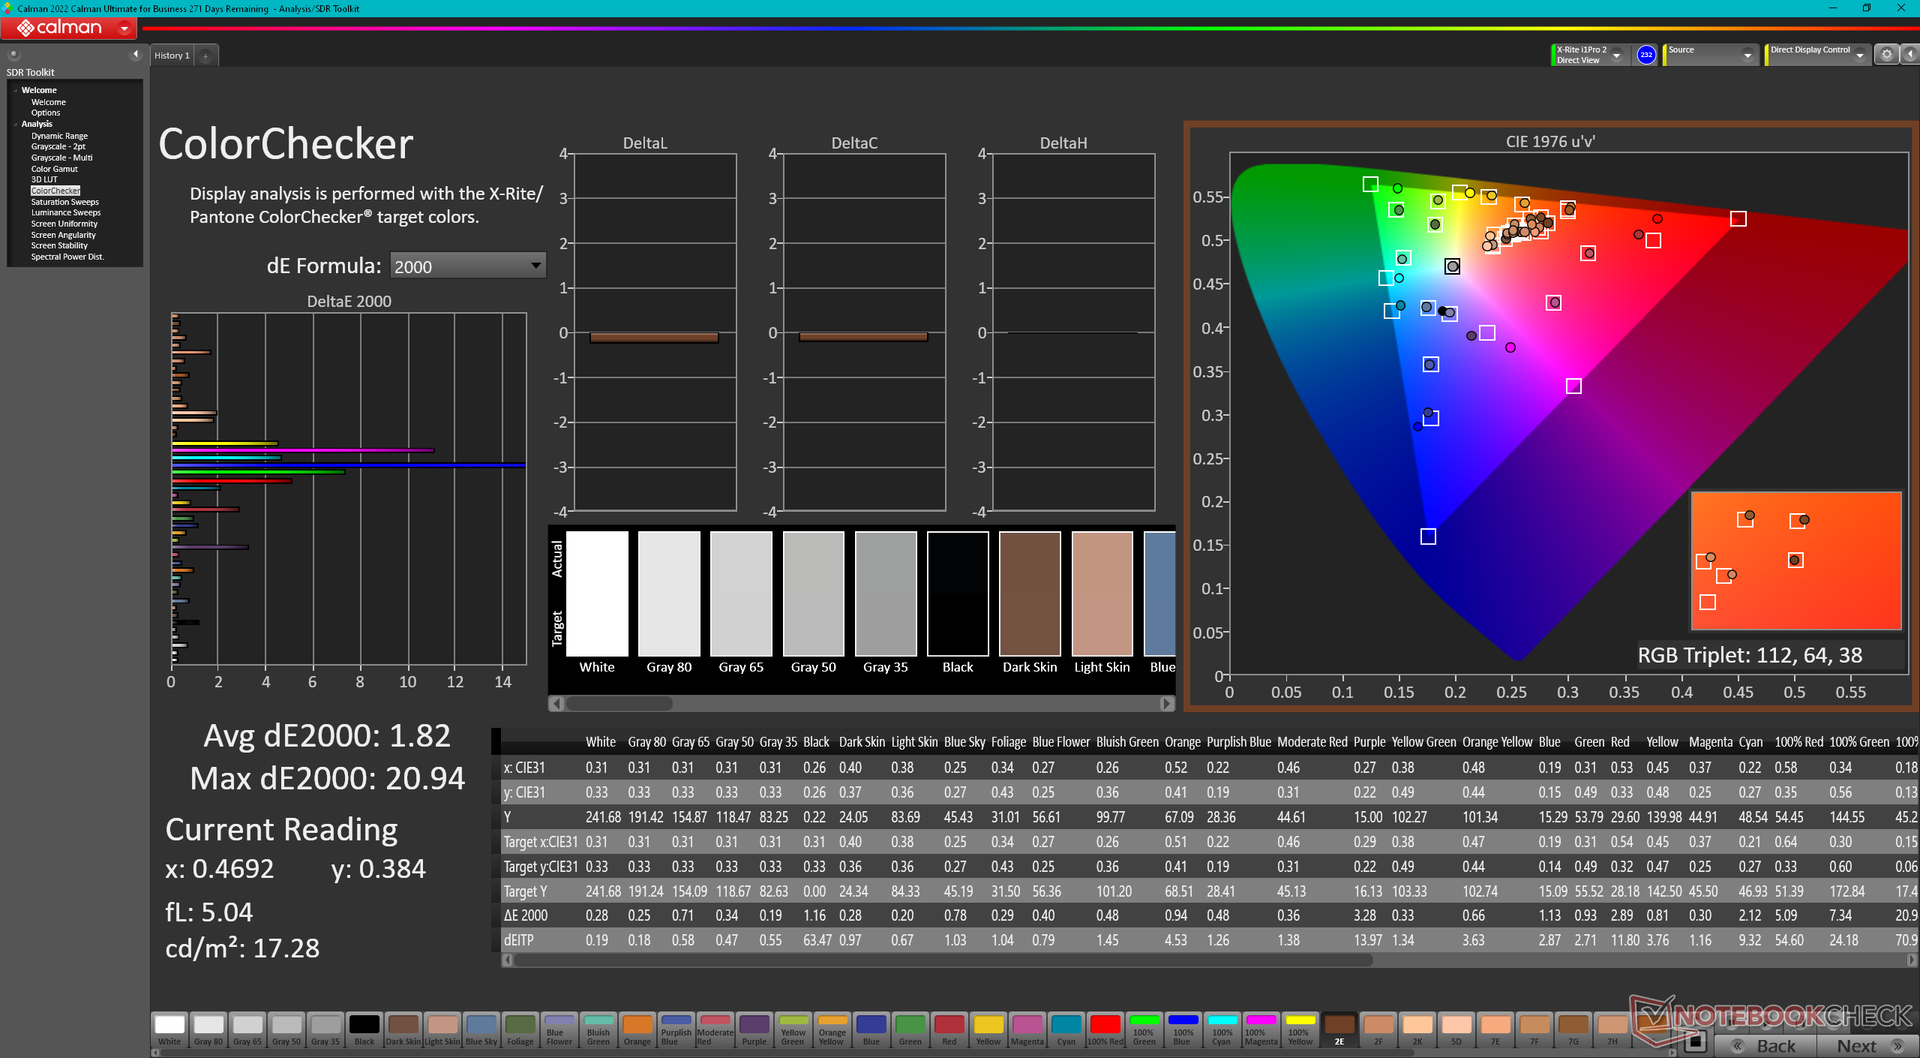
calibrated: 1.82
ΔE Greyscale Calman: 3.2 | ∀{0.09-98 Ø4.96}
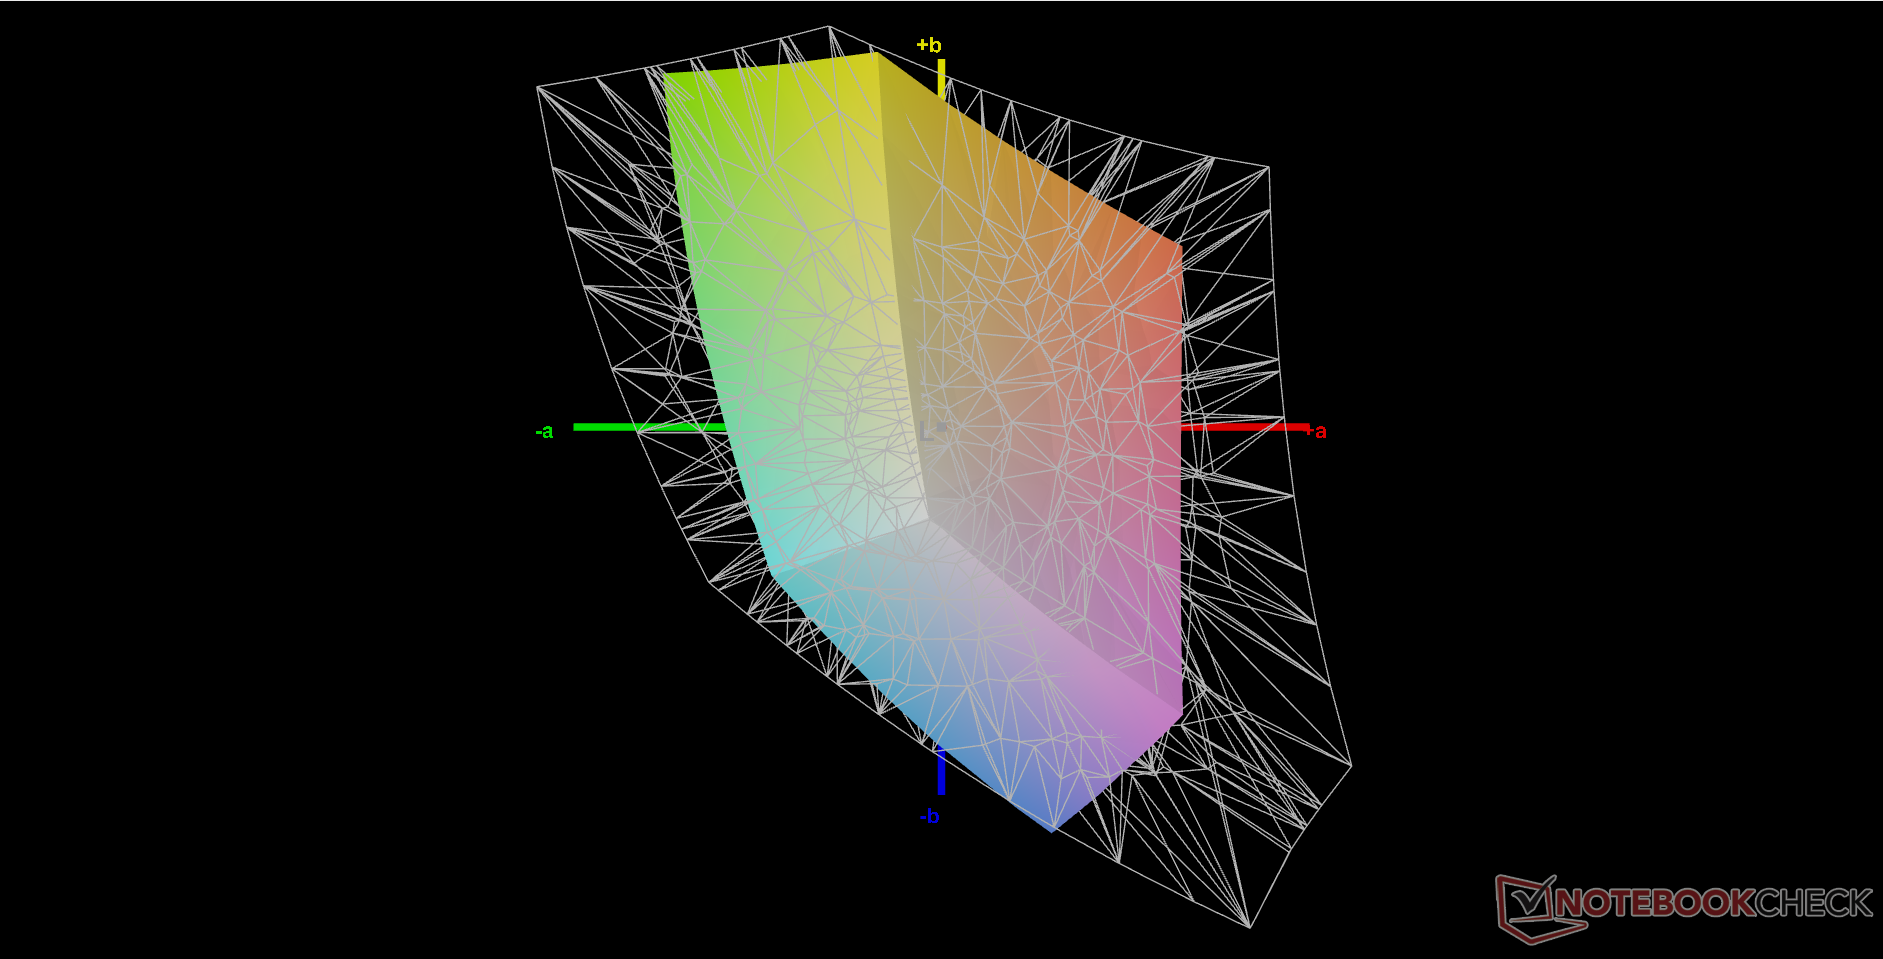
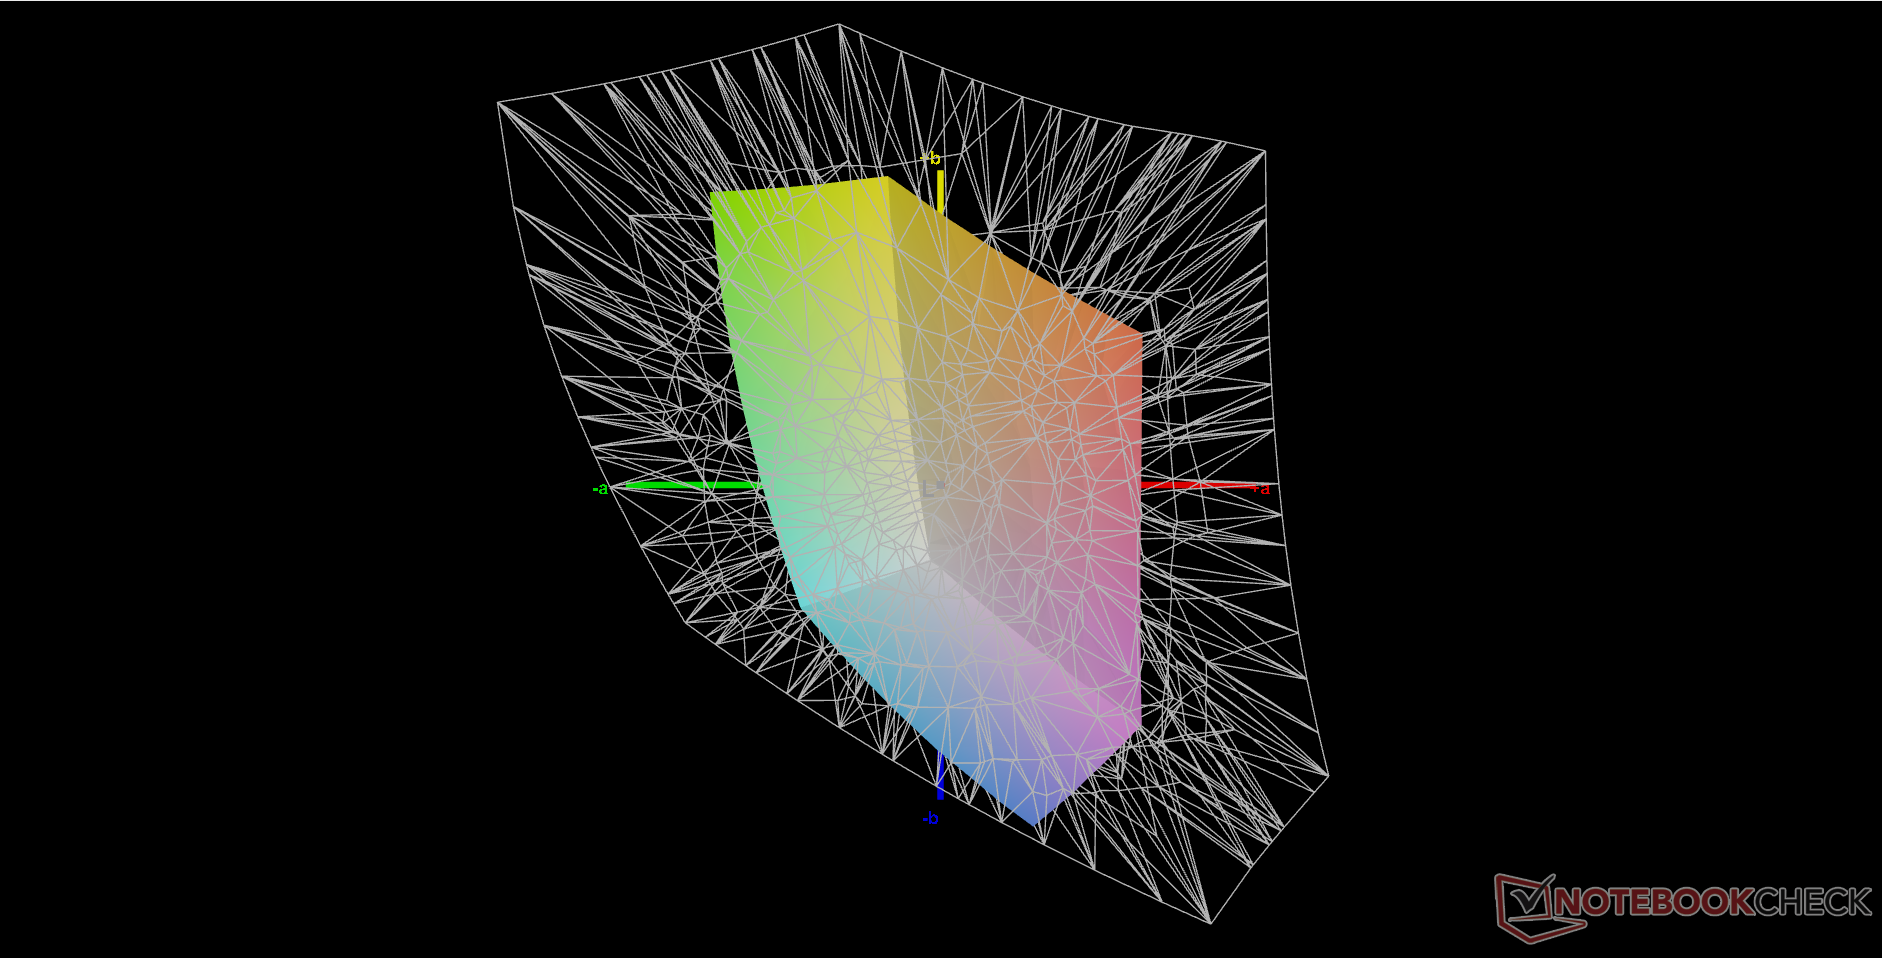
41% AdobeRGB 1998 (Argyll 3D)
59.1% sRGB (Argyll 3D)
39.7% Display P3 (Argyll 3D)
Gamma: 2.08
CCT: 6054 K
| Asus TUF Gaming A17 FA707XI-NS94 AU Optronics B173HAN04.9, IPS, 1920x1080, 17.3" | Asus TUF Gaming F17 FX707Z-HX011W AU Optronics B173HAN04.9 (AUO4B9D), IPS, 1920x1080, 17.3" | MSI Pulse 17 B13VGK AU Optronics B173HAN04.9, IPS, 1920x1080, 17.3" | MSI Katana 17 B13VFK B173HAN04.9, IPS LED, 1920x1080, 17.3" | Razer Blade 17 (i7-12800H, RTX 3070 Ti) BOE CQ NE173QHM-NZ1 (BOE09F9), IPS, 2560x1440, 17.3" | HP Pavilion Gaming 17-cd2146ng LGD0611, IPS, 1920x1080, 17.3" | |
|---|---|---|---|---|---|---|
| Display | 1% | -3% | 3% | 108% | 63% | |
| Display P3 Coverage (%) | 39.7 | 40.2 1% | 38.4 -3% | 40.8 3% | 97.9 147% | 64.8 63% |
| sRGB Coverage (%) | 59.1 | 59.7 1% | 57.5 -3% | 61 3% | 99.9 69% | 96.8 64% |
| AdobeRGB 1998 Coverage (%) | 41 | 41.5 1% | 39.7 -3% | 42.2 3% | 85.5 109% | 66.5 62% |
| Response Times | -6% | 16% | 9% | 60% | 68% | |
| Response Time Grey 50% / Grey 80% * (ms) | 39 ? | 39.2 ? -1% | 31.2 ? 20% | 33 ? 15% | 15.2 ? 61% | 12.7 ? 67% |
| Response Time Black / White * (ms) | 26.9 ? | 29.6 ? -10% | 23.6 ? 12% | 26 ? 3% | 11.2 ? 58% | 8.7 ? 68% |
| PWM Frequency (Hz) | ||||||
| Screen | -10% | 0% | -9% | -18% | 16% | |
| Brightness middle (cd/m²) | 255.9 | 287 12% | 254 -1% | 267 4% | 341 33% | 328 28% |
| Brightness (cd/m²) | 248 | 268 8% | 250 1% | 256 3% | 308 24% | 317 28% |
| Brightness Distribution (%) | 91 | 89 -2% | 91 0% | 93 2% | 82 -10% | 94 3% |
| Black Level * (cd/m²) | 0.21 | 0.17 19% | 0.14 33% | 0.21 -0% | 0.45 -114% | 0.23 -10% |
| Contrast (:1) | 1219 | 1688 38% | 1814 49% | 1271 4% | 758 -38% | 1426 17% |
| Colorchecker dE 2000 * | 4.51 | 5.1 -13% | 4.52 -0% | 4.7 -4% | 4.16 8% | 3.83 15% |
| Colorchecker dE 2000 max. * | 20.77 | 8.72 58% | 21.22 -2% | 20.4 2% | 8.14 61% | 8.51 59% |
| Colorchecker dE 2000 calibrated * | 1.82 | 5.1 -180% | 4.52 -148% | 4.5 -147% | 3 -65% | 0.83 54% |
| Greyscale dE 2000 * | 3.2 | 4.24 -33% | 1 69% | 1.5 53% | 5.09 -59% | 4.9 -53% |
| Gamma | 2.08 106% | 2.44 90% | 2.44 90% | 2.12 104% | 2.48 89% | 2.177 101% |
| CCT | 6054 107% | 6008 108% | 6502 100% | 6552 99% | 6884 94% | 7881 82% |
| Moyenne finale (programmes/paramètres) | -5% /
-7% | 4% /
2% | 1% /
-4% | 50% /
20% | 49% /
33% |
* ... Moindre est la valeur, meilleures sont les performances
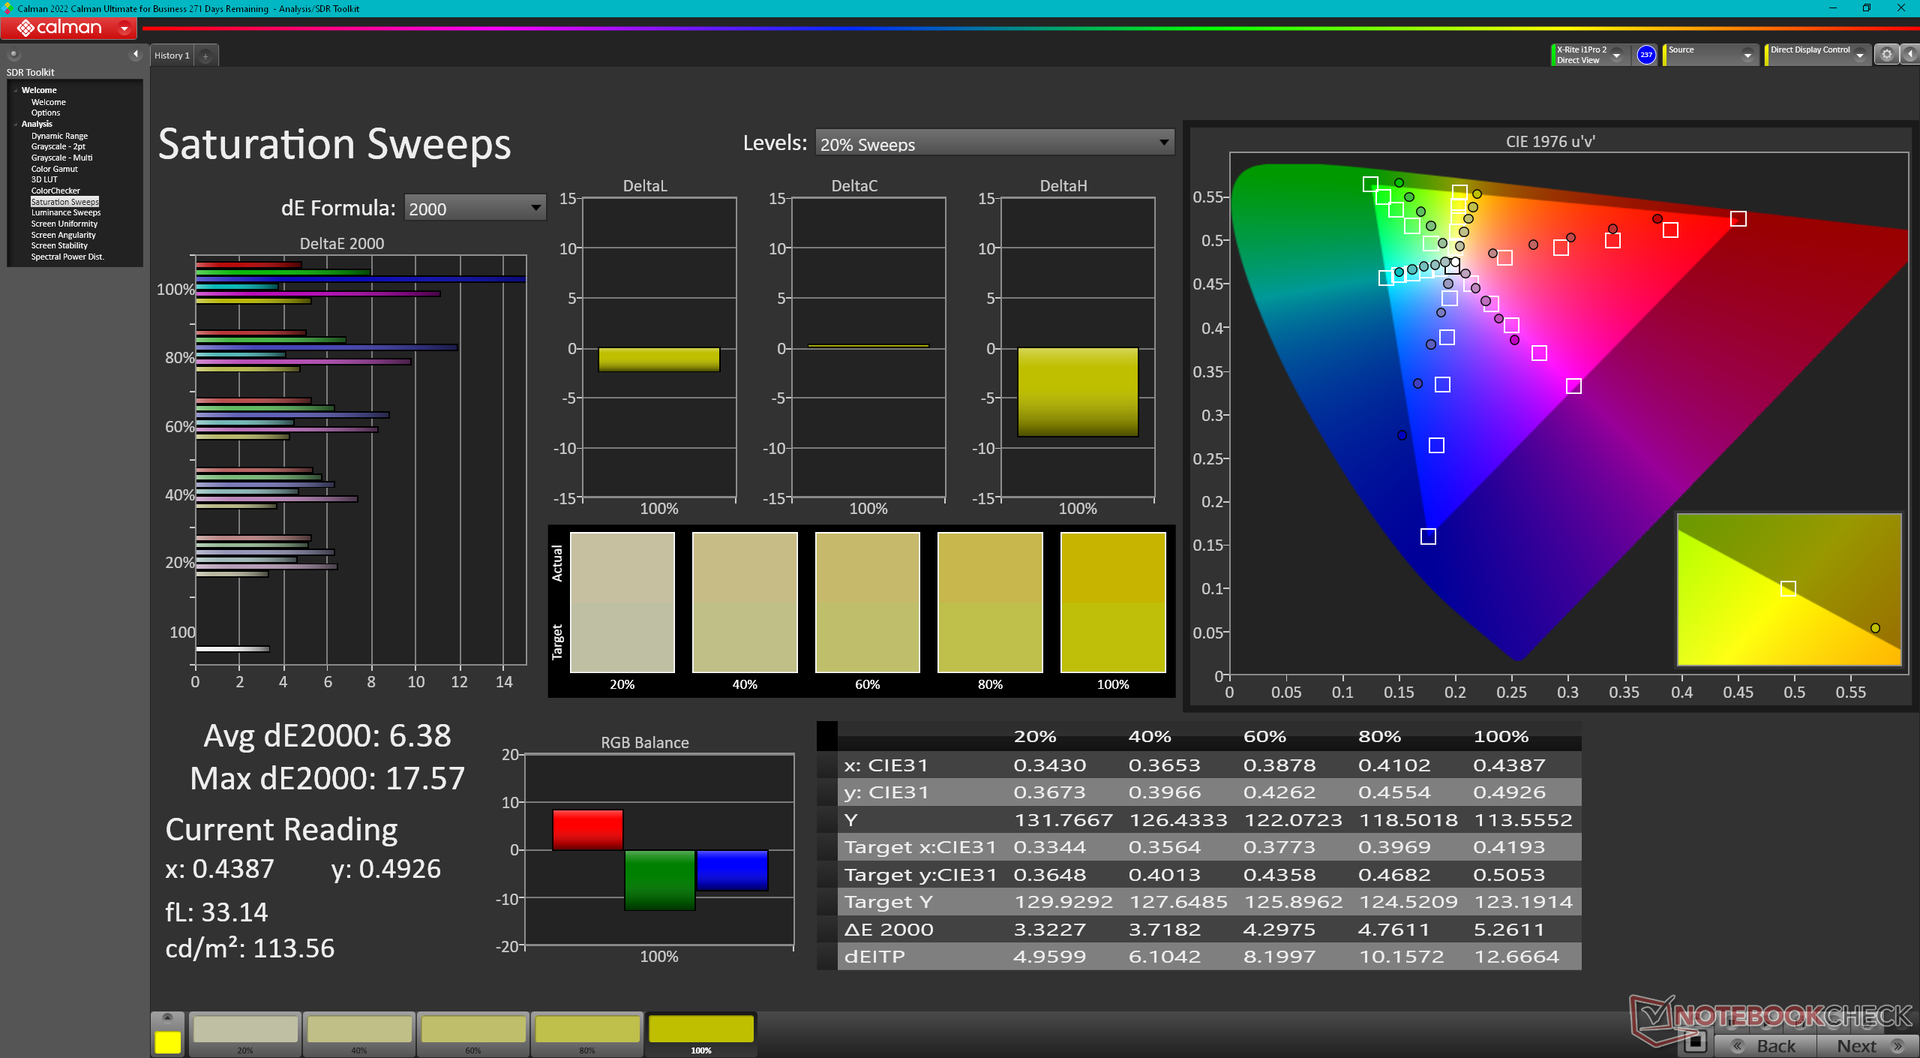
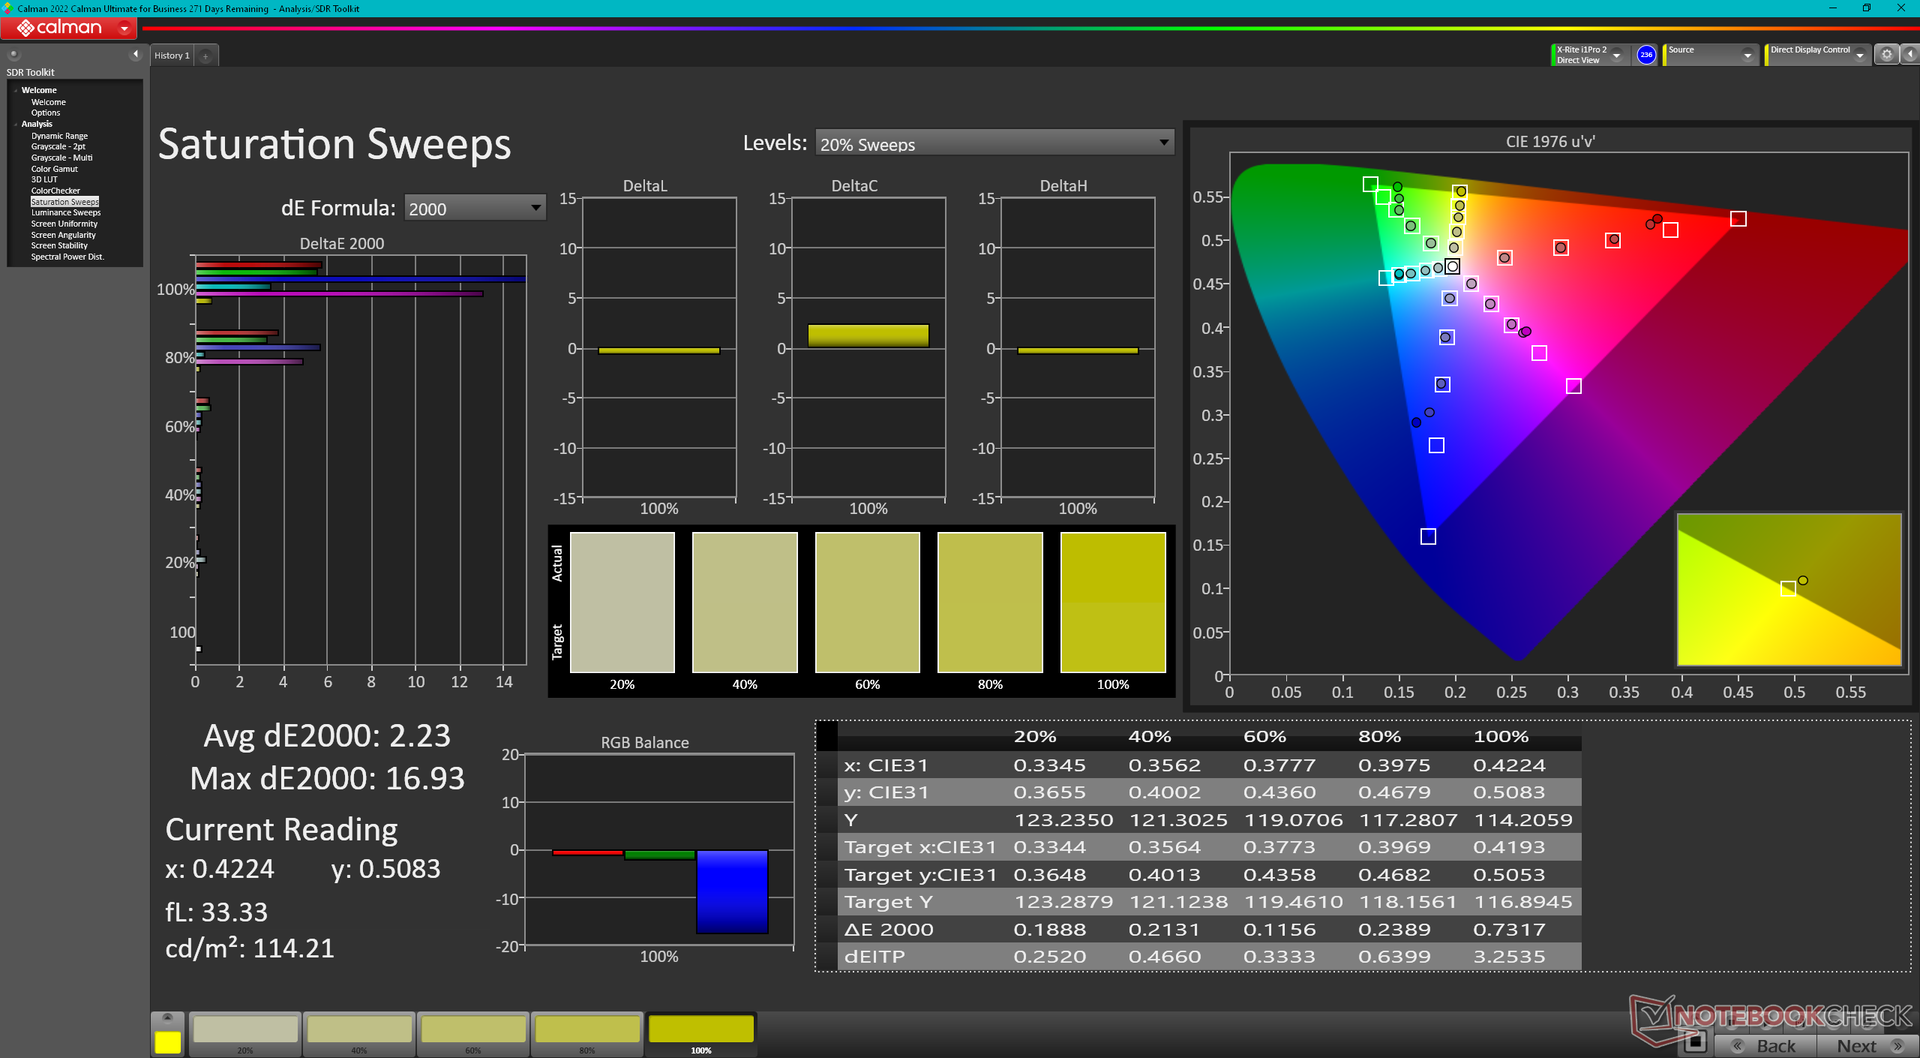
L'écran n'est pas calibré avec ses valeurs moyennes d'échelle de gris et de couleur deltaE de 3,2 et 4,51, respectivement. En calibrant nous-mêmes l'écran avec un colorimètre X-Rite, ces moyennes seraient ramenées à 0,3 et 1,82. Cependant, les couleurs deviennent de plus en plus imprécises à des niveaux de saturation plus élevés en raison de l'espace colorimétrique limité mentionné ci-dessus. Le bleu, par exemple, souffre d'un deltaE très élevé de 20,94, même après étalonnage.
Notre profil ICM calibré peut être téléchargé gratuitement ci-dessus.
Temps de réponse de l'écran
| ↔ Temps de réponse noir à blanc | ||
|---|---|---|
| 26.9 ms ... hausse ↗ et chute ↘ combinées | ↗ 13.8 ms hausse | 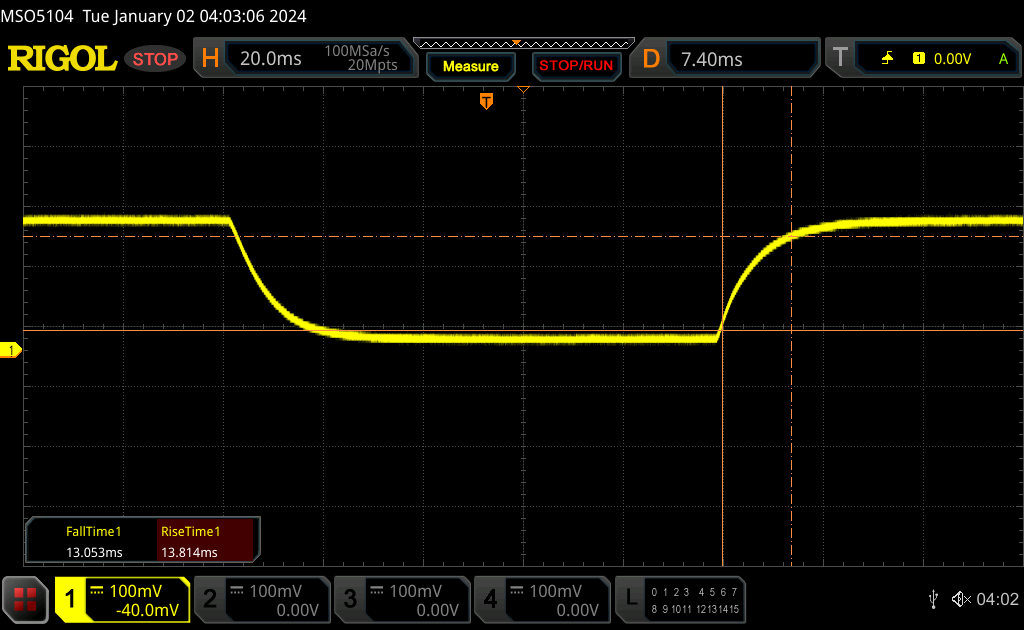 |
| ↘ 13.1 ms chute | ||
| L'écran souffre de latences relativement élevées, insuffisant pour le jeu. En comparaison, tous les appareils testés affichent entre 0.1 (minimum) et 240 (maximum) ms. » 67 % des appareils testés affichent de meilleures performances. Cela signifie que les latences relevées sont moins bonnes que la moyenne (19.8 ms) de tous les appareils testés. | ||
| ↔ Temps de réponse gris 50% à gris 80% | ||
| 39 ms ... hausse ↗ et chute ↘ combinées | ↗ 18 ms hausse | 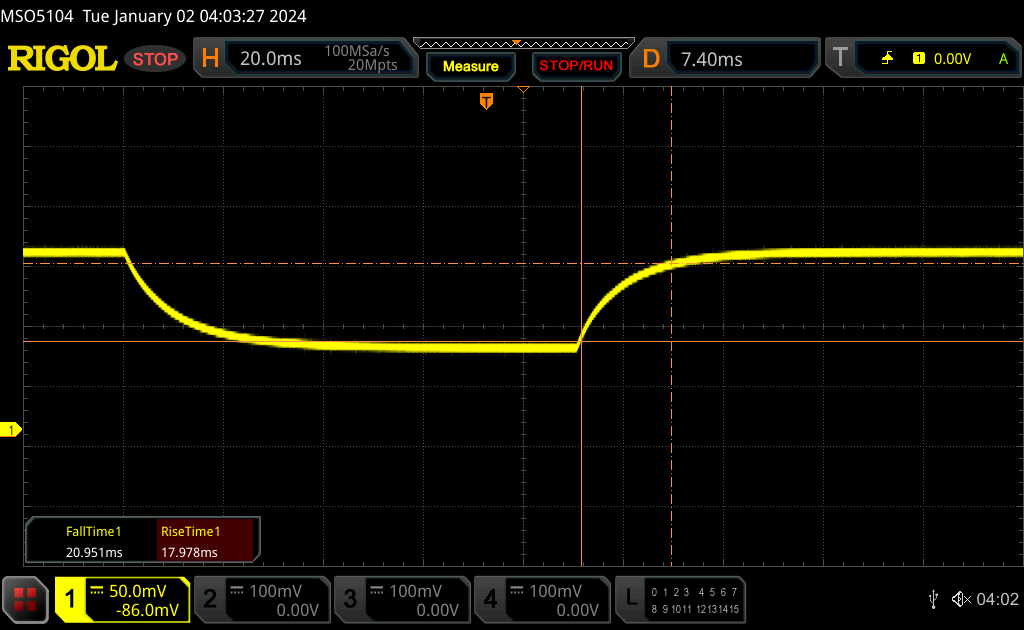 |
| ↘ 21 ms chute | ||
| L'écran souffre de latences très élevées, à éviter pour le jeu. En comparaison, tous les appareils testés affichent entre 0.165 (minimum) et 636 (maximum) ms. » 59 % des appareils testés affichent de meilleures performances. Cela signifie que les latences relevées sont moins bonnes que la moyenne (31 ms) de tous les appareils testés. | ||
Scintillement / MLI (Modulation de largeur d'impulsion)
| Scintillement / MLI (Modulation de largeur d'impulsion) non décelé | 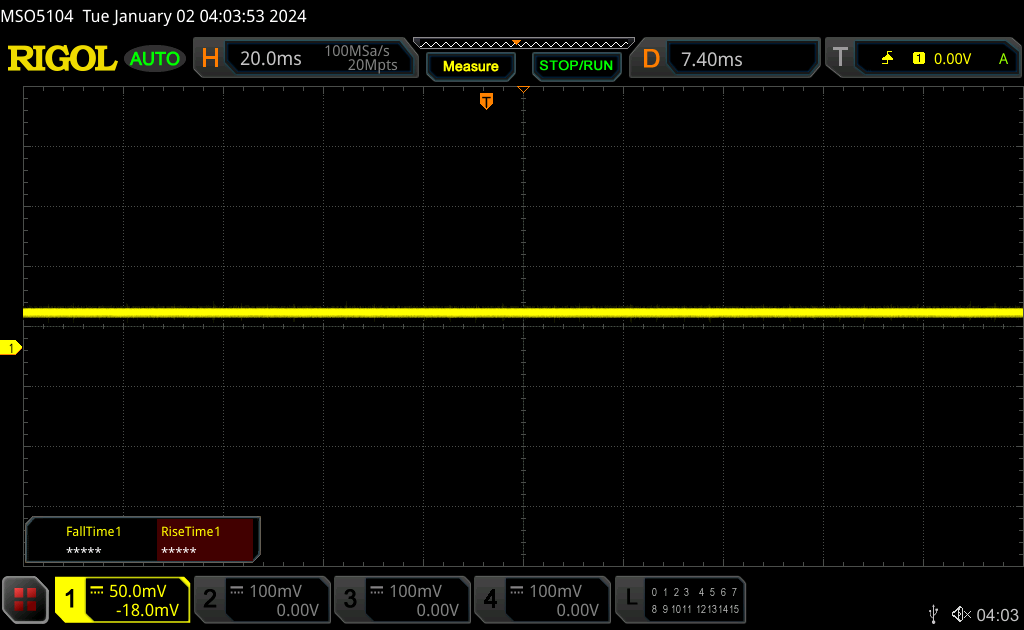 | ||
En comparaison, 52 % des appareils testés n'emploient pas MDI pour assombrir leur écran. Nous avons relevé une moyenne à 7757 (minimum : 5 - maximum : 343500) Hz dans le cas où une MDI était active. | |||
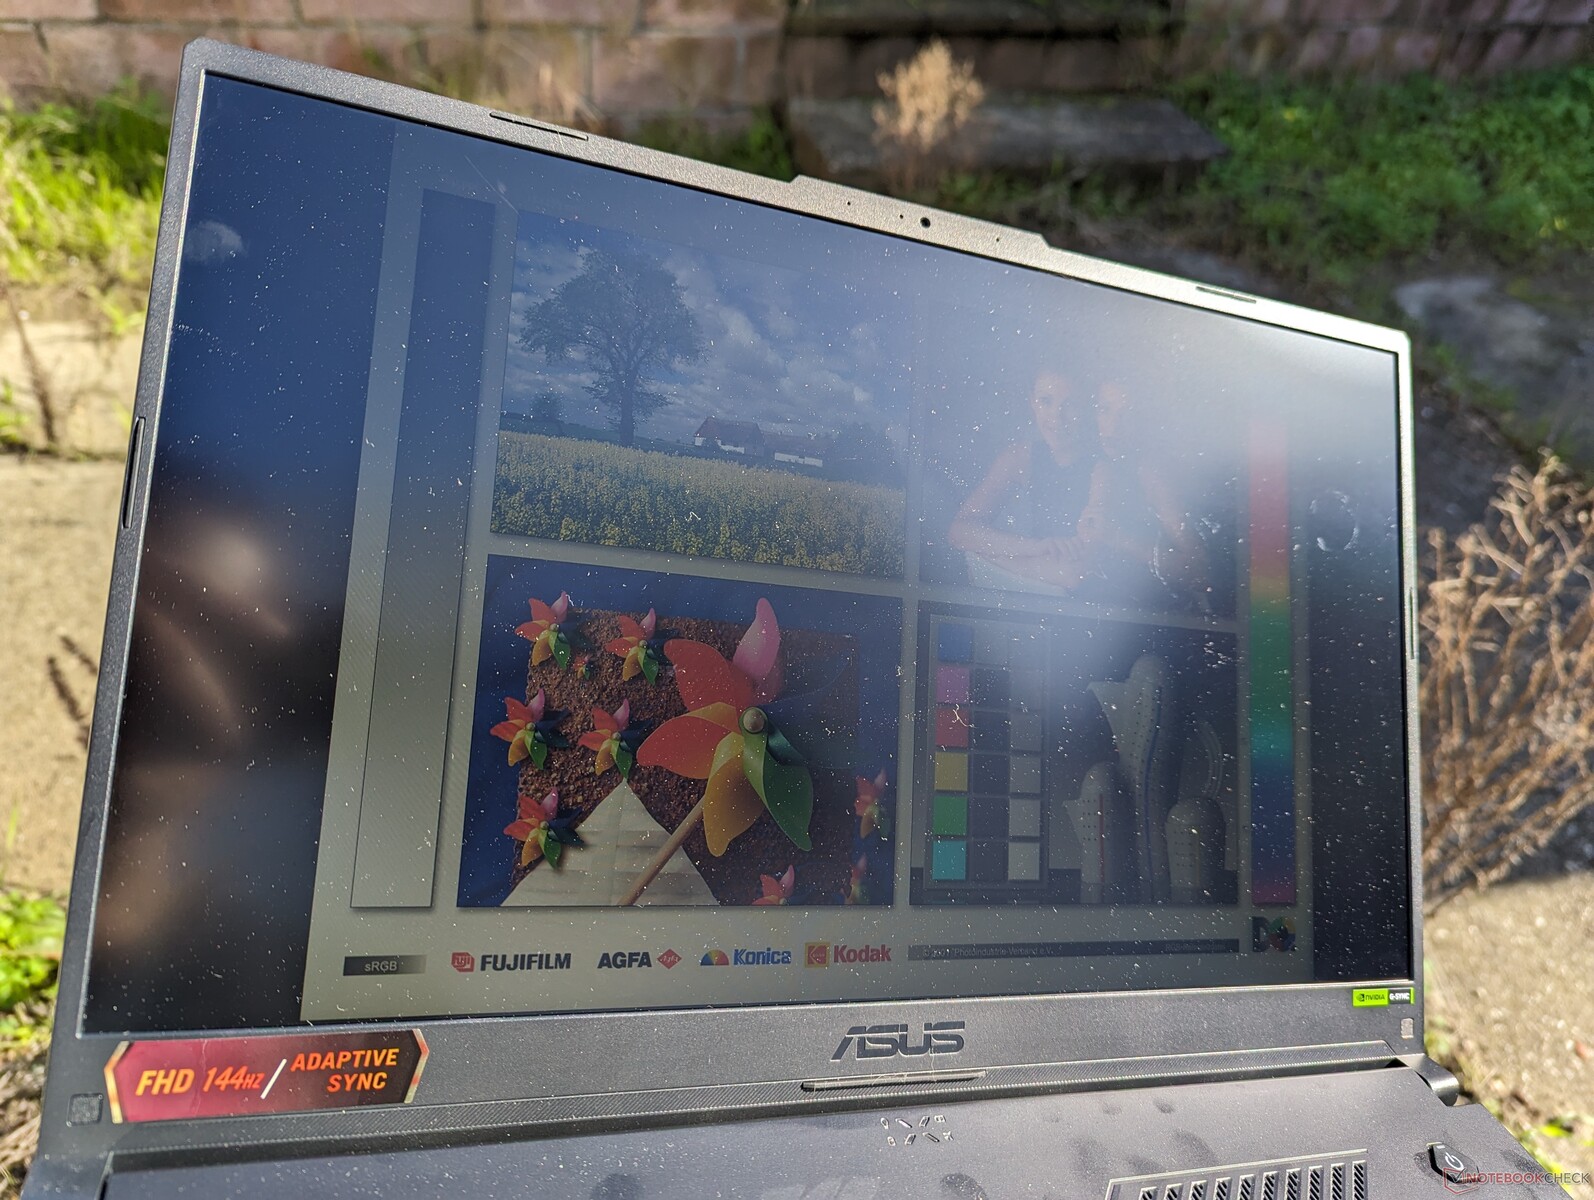
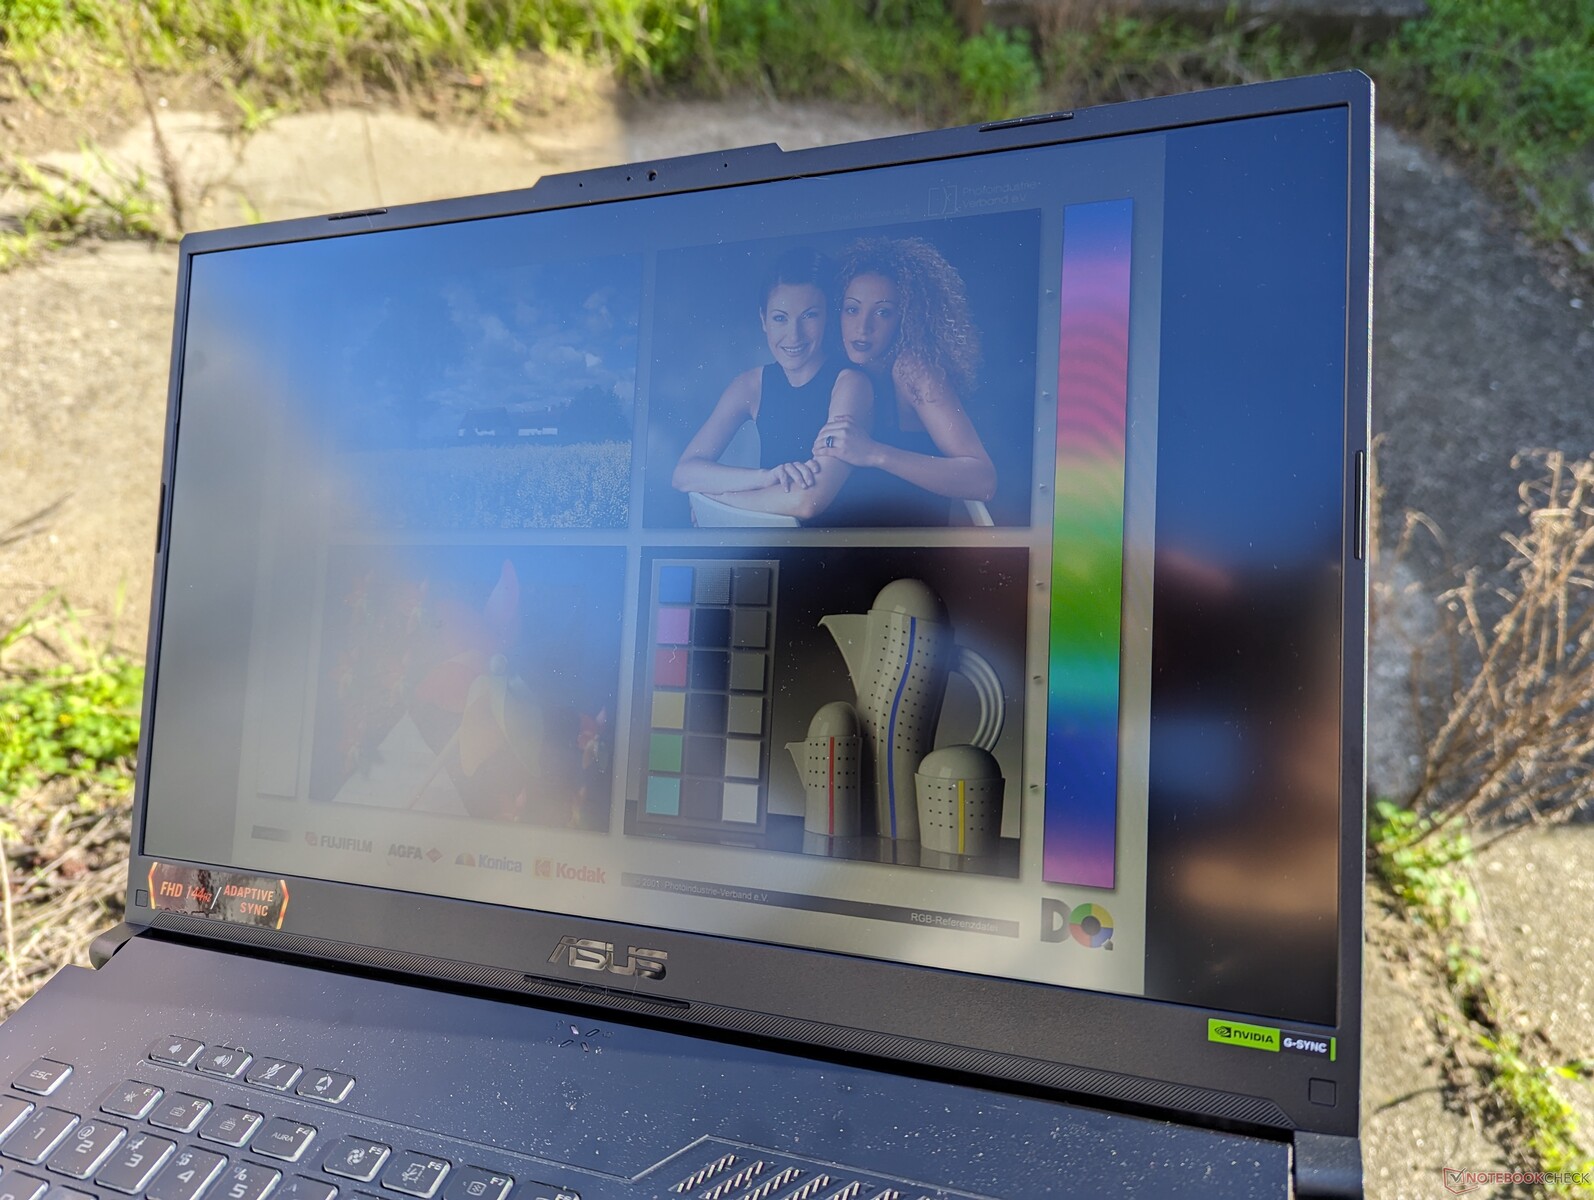
La visibilité en extérieur est relativement faible malgré le panneau mat qui réduit les reflets. La luminosité maximale n'est que de 250 à 300 nits, alors qu'elle est presque deux fois plus élevée sur des ordinateurs portables comme le MacBook Pro 16 ou le Lenovo Legion Slim 7 16.
Performance
Conditions d'essai
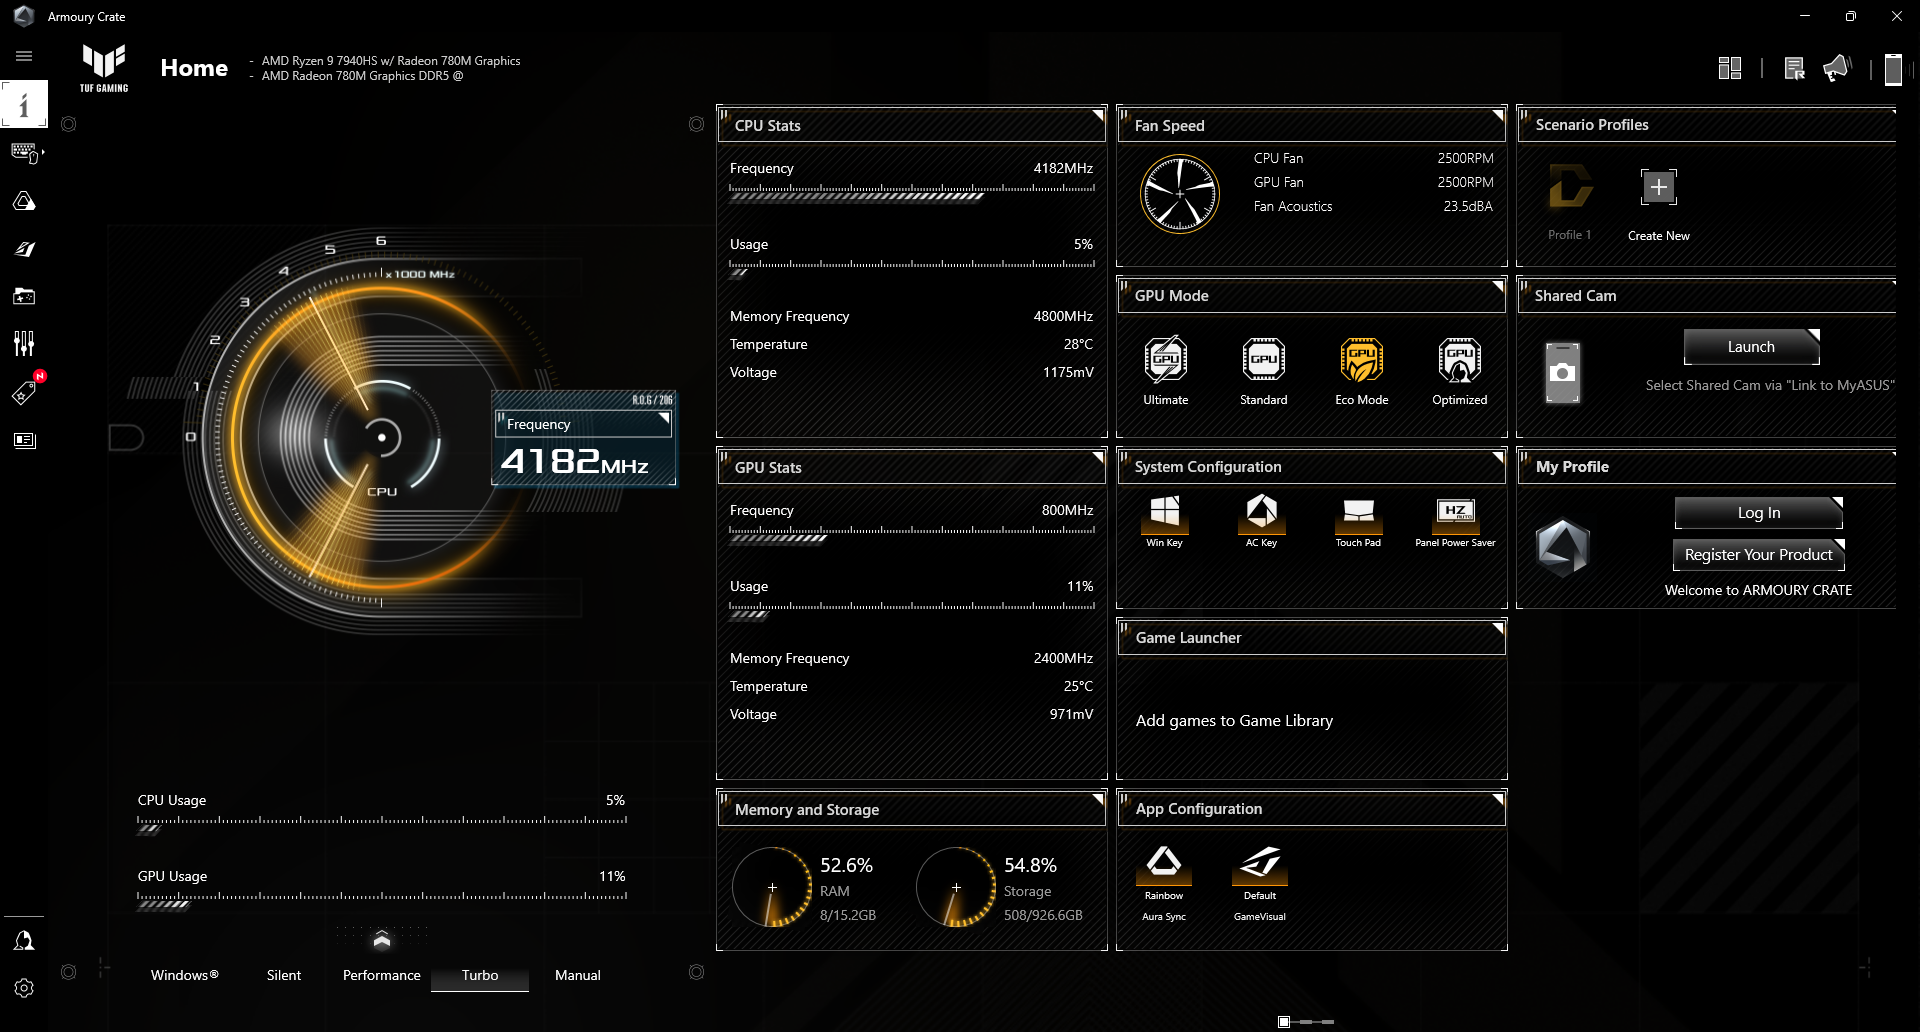
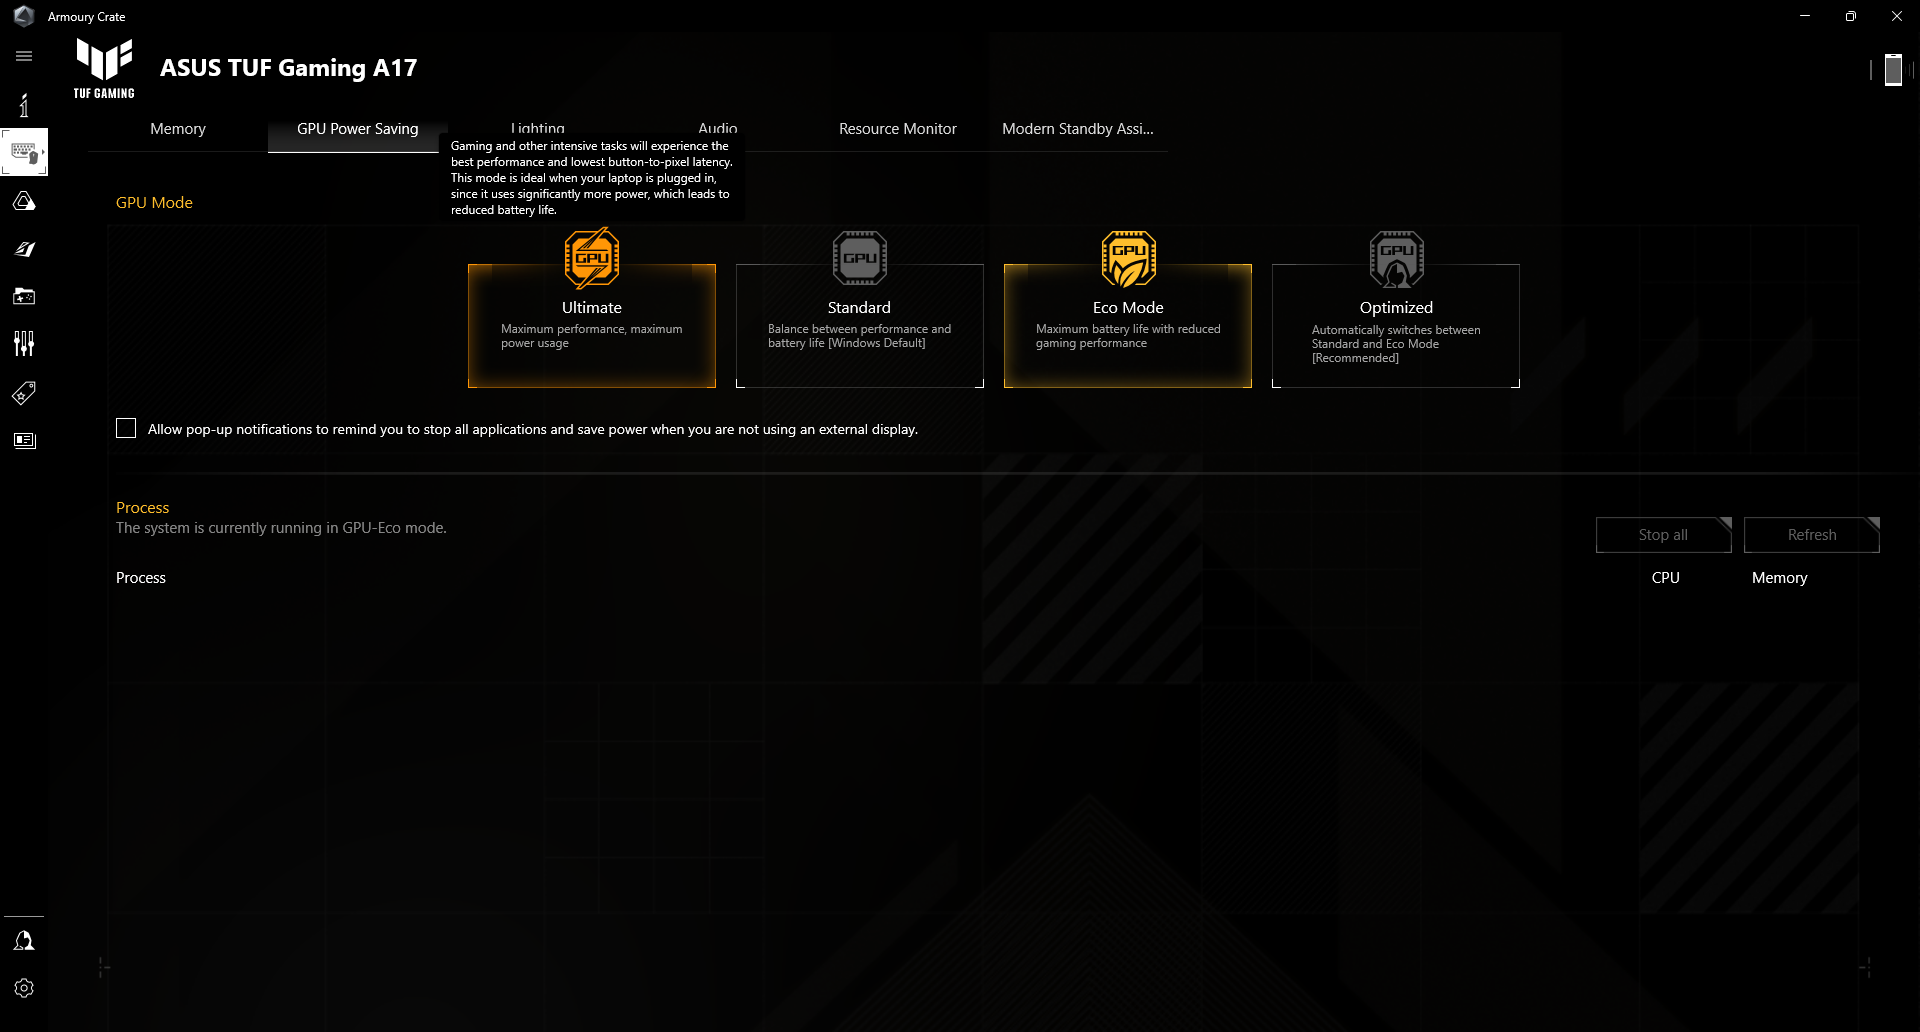
Nous avons réglé Asus Armoury Crate en mode Turbo et en mode Ultimate GPU avant d'effectuer les tests ci-dessous. La modification des profils d'alimentation d'Armoury Crate entraîne automatiquement la modification des profils d'alimentation de Windows. Notez que le mode Performance n'est pas le profil d'alimentation le plus rapide disponible ; ce titre revient au mode Turbo.
Entre-temps, les quatre modes GPU sont liés au MUX et à Advanced Optimus de la manière suivante :
- Mode Ultime: Le GPU discret est actif pour toutes les tâches. Un redémarrage en douceur est nécessaire. Il est également nécessaire pour activer G-Sync sur le moniteur interne.
- Mode standard: Également connu sous le nom de Microsoft MSHybrid. Commutation automatique entre le dGPU pour les applications exigeantes et l'iGPU pour les autres tâches.
- Mode éco: Le GPU discret est désactivé et toutes les applications s'exécutent sur l'iGPU.
- Mode optimisé: Commutation automatique entre le dGPU pour les applications exigeantes et l'iGPU pour les autres tâches lorsque l'appareil est alimenté par le secteur. En cas d'alimentation par batterie, le dGPU est automatiquement désactivé.
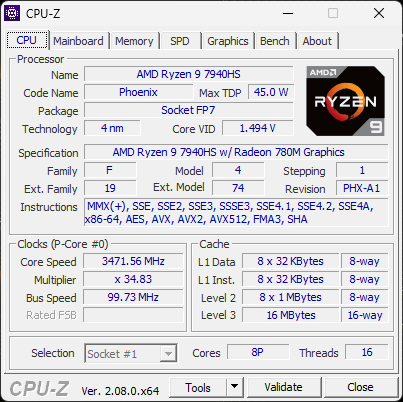
Processeur
Le Ryzen 9 7940HS est en concurrence directe avec le Core i7-13700H. Les performances brutes se situent à quelques points de pourcentage de son homologue d'Intel dans les charges mono et multithread. Nous n'observons pas de problèmes majeurs d'étranglement, contrairement au TUF Gaming F17 FX707Z avec l'ancien Core i7-12700H de 12ème génération.
En rétrogradant vers le Ryzen 7 7735HS de notre Ryzen 9 7940HS aura un impact sur les performances du processeur d'environ 15 à 20 %. L'option Ryzen 7 est encore assez rapide pour les jeux, surtout en milieu de gamme où le GPU est presque toujours le goulot d'étranglement, mais les joueurs qui cherchent à exploiter jusqu'à la dernière image de la dalle à haute fréquence de rafraîchissement devraient envisager le Ryzen 9.
Cinebench R15 Multi Loop
Cinebench R23: Multi Core | Single Core
Cinebench R20: CPU (Multi Core) | CPU (Single Core)
Cinebench R15: CPU Multi 64Bit | CPU Single 64Bit
Blender: v2.79 BMW27 CPU
7-Zip 18.03: 7z b 4 | 7z b 4 -mmt1
Geekbench 5.5: Multi-Core | Single-Core
HWBOT x265 Benchmark v2.2: 4k Preset
LibreOffice : 20 Documents To PDF
R Benchmark 2.5: Overall mean
| CPU Performance rating | |
| MSI Raider GE78 HX 13VI | |
| Asus ROG Strix G17 G713PI | |
| Eurocom Raptor X17 | |
| MSI Stealth 17 Studio A13VH-014 | |
| Asus TUF Gaming A17 FA707XI-NS94 | |
| Moyenne AMD Ryzen 9 7940HS | |
| MSI Pulse 17 B13VGK | |
| Razer Blade 17 (i7-12800H, RTX 3070 Ti) | |
| MSI Katana 17 B13VFK | |
| Asus TUF Gaming F17 FX707Z-HX011W | |
| Acer Nitro 17 AN17-41-R9LN | |
| Asus ROG Strix G17 G713QE-RB74 -2! | |
| HP Pavilion Gaming 17-cd2146ng | |
| Cinebench R23 / Single Core | |
| MSI Raider GE78 HX 13VI | |
| Eurocom Raptor X17 | |
| Asus ROG Strix G17 G713PI | |
| Asus TUF Gaming A17 FA707XI-NS94 | |
| Razer Blade 17 (i7-12800H, RTX 3070 Ti) | |
| MSI Katana 17 B13VFK | |
| Asus TUF Gaming F17 FX707Z-HX011W | |
| Moyenne AMD Ryzen 9 7940HS (1733 - 1832, n=12) | |
| MSI Stealth 17 Studio A13VH-014 | |
| MSI Pulse 17 B13VGK | |
| Acer Nitro 17 AN17-41-R9LN | |
| Asus ROG Strix G17 G713QE-RB74 | |
| HP Pavilion Gaming 17-cd2146ng | |
| Cinebench R20 / CPU (Multi Core) | |
| MSI Raider GE78 HX 13VI | |
| Eurocom Raptor X17 | |
| Asus ROG Strix G17 G713PI | |
| MSI Stealth 17 Studio A13VH-014 | |
| MSI Pulse 17 B13VGK | |
| Asus TUF Gaming A17 FA707XI-NS94 | |
| Moyenne AMD Ryzen 9 7940HS (6277 - 7111, n=12) | |
| MSI Katana 17 B13VFK | |
| Acer Nitro 17 AN17-41-R9LN | |
| Razer Blade 17 (i7-12800H, RTX 3070 Ti) | |
| Asus ROG Strix G17 G713QE-RB74 | |
| Asus TUF Gaming F17 FX707Z-HX011W | |
| HP Pavilion Gaming 17-cd2146ng | |
| Cinebench R20 / CPU (Single Core) | |
| MSI Raider GE78 HX 13VI | |
| Eurocom Raptor X17 | |
| Asus TUF Gaming A17 FA707XI-NS94 | |
| Asus ROG Strix G17 G713PI | |
| Razer Blade 17 (i7-12800H, RTX 3070 Ti) | |
| Moyenne AMD Ryzen 9 7940HS (679 - 714, n=12) | |
| MSI Katana 17 B13VFK | |
| Asus TUF Gaming F17 FX707Z-HX011W | |
| MSI Pulse 17 B13VGK | |
| MSI Stealth 17 Studio A13VH-014 | |
| Acer Nitro 17 AN17-41-R9LN | |
| Asus ROG Strix G17 G713QE-RB74 | |
| HP Pavilion Gaming 17-cd2146ng | |
| Cinebench R15 / CPU Multi 64Bit | |
| Asus ROG Strix G17 G713PI | |
| MSI Raider GE78 HX 13VI | |
| Eurocom Raptor X17 | |
| MSI Stealth 17 Studio A13VH-014 | |
| MSI Pulse 17 B13VGK | |
| Asus TUF Gaming F17 FX707Z-HX011W | |
| Asus TUF Gaming A17 FA707XI-NS94 | |
| Razer Blade 17 (i7-12800H, RTX 3070 Ti) | |
| Moyenne AMD Ryzen 9 7940HS (2470 - 2848, n=12) | |
| MSI Katana 17 B13VFK | |
| Acer Nitro 17 AN17-41-R9LN | |
| Asus ROG Strix G17 G713QE-RB74 | |
| HP Pavilion Gaming 17-cd2146ng | |
| Cinebench R15 / CPU Single 64Bit | |
| MSI Raider GE78 HX 13VI | |
| Asus ROG Strix G17 G713PI | |
| Eurocom Raptor X17 | |
| Asus TUF Gaming A17 FA707XI-NS94 | |
| MSI Stealth 17 Studio A13VH-014 | |
| Moyenne AMD Ryzen 9 7940HS (258 - 288, n=12) | |
| Razer Blade 17 (i7-12800H, RTX 3070 Ti) | |
| MSI Katana 17 B13VFK | |
| Asus TUF Gaming F17 FX707Z-HX011W | |
| Acer Nitro 17 AN17-41-R9LN | |
| MSI Pulse 17 B13VGK | |
| Asus ROG Strix G17 G713QE-RB74 | |
| HP Pavilion Gaming 17-cd2146ng | |
| Geekbench 5.5 / Multi-Core | |
| MSI Raider GE78 HX 13VI | |
| Eurocom Raptor X17 | |
| Asus ROG Strix G17 G713PI | |
| MSI Stealth 17 Studio A13VH-014 | |
| MSI Pulse 17 B13VGK | |
| Asus TUF Gaming F17 FX707Z-HX011W | |
| Razer Blade 17 (i7-12800H, RTX 3070 Ti) | |
| Moyenne AMD Ryzen 9 7940HS (10089 - 12500, n=13) | |
| Asus TUF Gaming A17 FA707XI-NS94 | |
| MSI Katana 17 B13VFK | |
| Acer Nitro 17 AN17-41-R9LN | |
| HP Pavilion Gaming 17-cd2146ng | |
| Geekbench 5.5 / Single-Core | |
| Asus ROG Strix G17 G713PI | |
| MSI Stealth 17 Studio A13VH-014 | |
| Asus TUF Gaming A17 FA707XI-NS94 | |
| MSI Raider GE78 HX 13VI | |
| Moyenne AMD Ryzen 9 7940HS (1823 - 2032, n=13) | |
| Eurocom Raptor X17 | |
| MSI Katana 17 B13VFK | |
| Razer Blade 17 (i7-12800H, RTX 3070 Ti) | |
| Asus TUF Gaming F17 FX707Z-HX011W | |
| MSI Pulse 17 B13VGK | |
| Acer Nitro 17 AN17-41-R9LN | |
| HP Pavilion Gaming 17-cd2146ng | |
| HWBOT x265 Benchmark v2.2 / 4k Preset | |
| Asus ROG Strix G17 G713PI | |
| MSI Raider GE78 HX 13VI | |
| Eurocom Raptor X17 | |
| MSI Stealth 17 Studio A13VH-014 | |
| Asus TUF Gaming A17 FA707XI-NS94 | |
| MSI Pulse 17 B13VGK | |
| Moyenne AMD Ryzen 9 7940HS (18.5 - 22.6, n=11) | |
| MSI Katana 17 B13VFK | |
| Acer Nitro 17 AN17-41-R9LN | |
| Razer Blade 17 (i7-12800H, RTX 3070 Ti) | |
| Asus ROG Strix G17 G713QE-RB74 | |
| Asus TUF Gaming F17 FX707Z-HX011W | |
| HP Pavilion Gaming 17-cd2146ng | |
| LibreOffice / 20 Documents To PDF | |
| Asus TUF Gaming F17 FX707Z-HX011W | |
| Acer Nitro 17 AN17-41-R9LN | |
| MSI Pulse 17 B13VGK | |
| HP Pavilion Gaming 17-cd2146ng | |
| MSI Katana 17 B13VFK | |
| Asus ROG Strix G17 G713QE-RB74 | |
| MSI Stealth 17 Studio A13VH-014 | |
| Asus TUF Gaming A17 FA707XI-NS94 | |
| Moyenne AMD Ryzen 9 7940HS (36.9 - 54.8, n=12) | |
| Asus ROG Strix G17 G713PI | |
| MSI Raider GE78 HX 13VI | |
| Razer Blade 17 (i7-12800H, RTX 3070 Ti) | |
| Eurocom Raptor X17 | |
| R Benchmark 2.5 / Overall mean | |
| HP Pavilion Gaming 17-cd2146ng | |
| Asus ROG Strix G17 G713QE-RB74 | |
| Acer Nitro 17 AN17-41-R9LN | |
| MSI Pulse 17 B13VGK | |
| Asus TUF Gaming F17 FX707Z-HX011W | |
| Razer Blade 17 (i7-12800H, RTX 3070 Ti) | |
| MSI Katana 17 B13VFK | |
| Moyenne AMD Ryzen 9 7940HS (0.4159 - 0.4467, n=12) | |
| MSI Stealth 17 Studio A13VH-014 | |
| Asus TUF Gaming A17 FA707XI-NS94 | |
| Asus ROG Strix G17 G713PI | |
| Eurocom Raptor X17 | |
| MSI Raider GE78 HX 13VI | |
Cinebench R23: Multi Core | Single Core
Cinebench R20: CPU (Multi Core) | CPU (Single Core)
Cinebench R15: CPU Multi 64Bit | CPU Single 64Bit
Blender: v2.79 BMW27 CPU
7-Zip 18.03: 7z b 4 | 7z b 4 -mmt1
Geekbench 5.5: Multi-Core | Single-Core
HWBOT x265 Benchmark v2.2: 4k Preset
LibreOffice : 20 Documents To PDF
R Benchmark 2.5: Overall mean
* ... Moindre est la valeur, meilleures sont les performances
AIDA64: FP32 Ray-Trace | FPU Julia | CPU SHA3 | CPU Queen | FPU SinJulia | FPU Mandel | CPU AES | CPU ZLib | FP64 Ray-Trace | CPU PhotoWorxx
| Performance rating | |
| Asus TUF Gaming A17 FA707XI-NS94 | |
| Moyenne AMD Ryzen 9 7940HS | |
| MSI Pulse 17 B13VGK | |
| MSI Katana 17 B13VFK | |
| Razer Blade 17 (i7-12800H, RTX 3070 Ti) | |
| Asus TUF Gaming F17 FX707Z-HX011W | |
| HP Pavilion Gaming 17-cd2146ng | |
| AIDA64 / FP32 Ray-Trace | |
| Asus TUF Gaming A17 FA707XI-NS94 | |
| Moyenne AMD Ryzen 9 7940HS (25226 - 29109, n=10) | |
| MSI Pulse 17 B13VGK | |
| MSI Katana 17 B13VFK | |
| Razer Blade 17 (i7-12800H, RTX 3070 Ti) | |
| HP Pavilion Gaming 17-cd2146ng | |
| Asus TUF Gaming F17 FX707Z-HX011W | |
| AIDA64 / FPU SinJulia | |
| Asus TUF Gaming A17 FA707XI-NS94 | |
| Moyenne AMD Ryzen 9 7940HS (14663 - 15551, n=10) | |
| MSI Pulse 17 B13VGK | |
| Razer Blade 17 (i7-12800H, RTX 3070 Ti) | |
| MSI Katana 17 B13VFK | |
| Asus TUF Gaming F17 FX707Z-HX011W | |
| HP Pavilion Gaming 17-cd2146ng | |
| AIDA64 / FPU Mandel | |
| Asus TUF Gaming A17 FA707XI-NS94 | |
| Moyenne AMD Ryzen 9 7940HS (56839 - 66238, n=10) | |
| MSI Pulse 17 B13VGK | |
| MSI Katana 17 B13VFK | |
| Razer Blade 17 (i7-12800H, RTX 3070 Ti) | |
| Asus TUF Gaming F17 FX707Z-HX011W | |
| HP Pavilion Gaming 17-cd2146ng | |
| AIDA64 / FP64 Ray-Trace | |
| Asus TUF Gaming A17 FA707XI-NS94 | |
| Moyenne AMD Ryzen 9 7940HS (13175 - 15675, n=10) | |
| MSI Pulse 17 B13VGK | |
| MSI Katana 17 B13VFK | |
| Razer Blade 17 (i7-12800H, RTX 3070 Ti) | |
| Asus TUF Gaming F17 FX707Z-HX011W | |
| HP Pavilion Gaming 17-cd2146ng | |
| AIDA64 / CPU PhotoWorxx | |
| MSI Pulse 17 B13VGK | |
| Moyenne AMD Ryzen 9 7940HS (22477 - 41567, n=10) | |
| MSI Katana 17 B13VFK | |
| Asus TUF Gaming A17 FA707XI-NS94 | |
| Asus TUF Gaming F17 FX707Z-HX011W | |
| Razer Blade 17 (i7-12800H, RTX 3070 Ti) | |
| HP Pavilion Gaming 17-cd2146ng | |
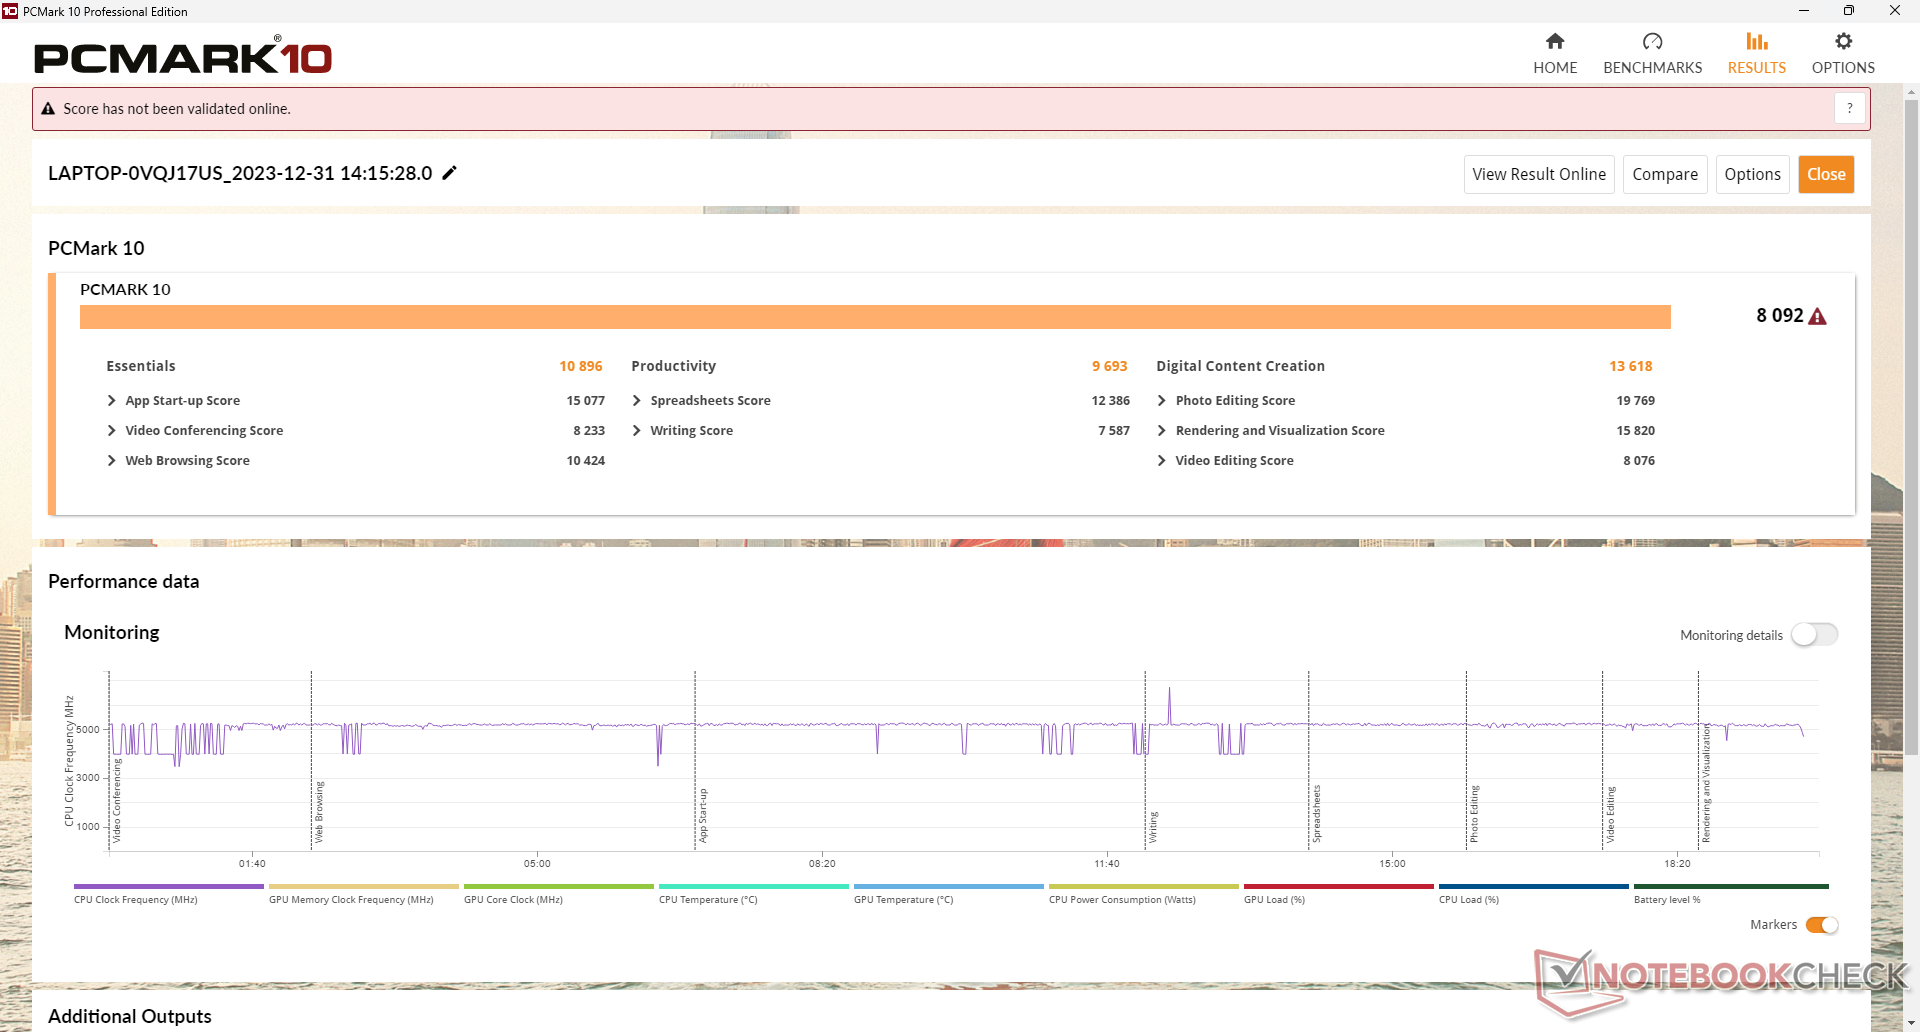
Performance du système
Les scores PCMark sont parmi les plus élevés de tous les ordinateurs portables de jeu équipés d'un Core i7 de 13ème génération, grâce au CPU Ryzen 7 Zen 4 et au GPU RTX 4070 de GeForce. Nous n'avons pas eu de plantage pendant les tests, mais l'écran avait parfois des problèmes de réveil, peut-être à cause de la commutation automatique du GPU.
CrossMark: Overall | Productivity | Creativity | Responsiveness
WebXPRT 3: Overall
WebXPRT 4: Overall
Mozilla Kraken 1.1: Total
| PCMark 10 / Score | |
| Moyenne AMD Ryzen 9 7940HS, NVIDIA GeForce RTX 4070 Laptop GPU (8092 - 8205, n=2) | |
| Asus TUF Gaming A17 FA707XI-NS94 | |
| MSI Pulse 17 B13VGK | |
| Razer Blade 17 (i7-12800H, RTX 3070 Ti) | |
| MSI Katana 17 B13VFK | |
| Asus TUF Gaming F17 FX707Z-HX011W | |
| HP Pavilion Gaming 17-cd2146ng | |
| PCMark 10 / Essentials | |
| Moyenne AMD Ryzen 9 7940HS, NVIDIA GeForce RTX 4070 Laptop GPU (10896 - 10952, n=2) | |
| Asus TUF Gaming A17 FA707XI-NS94 | |
| MSI Katana 17 B13VFK | |
| MSI Pulse 17 B13VGK | |
| Razer Blade 17 (i7-12800H, RTX 3070 Ti) | |
| Asus TUF Gaming F17 FX707Z-HX011W | |
| HP Pavilion Gaming 17-cd2146ng | |
| PCMark 10 / Productivity | |
| MSI Pulse 17 B13VGK | |
| Moyenne AMD Ryzen 9 7940HS, NVIDIA GeForce RTX 4070 Laptop GPU (9693 - 10805, n=2) | |
| Asus TUF Gaming A17 FA707XI-NS94 | |
| MSI Katana 17 B13VFK | |
| Razer Blade 17 (i7-12800H, RTX 3070 Ti) | |
| HP Pavilion Gaming 17-cd2146ng | |
| Asus TUF Gaming F17 FX707Z-HX011W | |
| PCMark 10 / Digital Content Creation | |
| Asus TUF Gaming A17 FA707XI-NS94 | |
| Moyenne AMD Ryzen 9 7940HS, NVIDIA GeForce RTX 4070 Laptop GPU (12666 - 13618, n=2) | |
| MSI Pulse 17 B13VGK | |
| Razer Blade 17 (i7-12800H, RTX 3070 Ti) | |
| Asus TUF Gaming F17 FX707Z-HX011W | |
| MSI Katana 17 B13VFK | |
| HP Pavilion Gaming 17-cd2146ng | |
| CrossMark / Overall | |
| MSI Pulse 17 B13VGK | |
| MSI Katana 17 B13VFK | |
| Moyenne AMD Ryzen 9 7940HS, NVIDIA GeForce RTX 4070 Laptop GPU (1797 - 1812, n=2) | |
| Asus TUF Gaming A17 FA707XI-NS94 | |
| Razer Blade 17 (i7-12800H, RTX 3070 Ti) | |
| Asus TUF Gaming F17 FX707Z-HX011W | |
| CrossMark / Productivity | |
| MSI Pulse 17 B13VGK | |
| MSI Katana 17 B13VFK | |
| Moyenne AMD Ryzen 9 7940HS, NVIDIA GeForce RTX 4070 Laptop GPU (1740 - 1762, n=2) | |
| Asus TUF Gaming A17 FA707XI-NS94 | |
| Razer Blade 17 (i7-12800H, RTX 3070 Ti) | |
| Asus TUF Gaming F17 FX707Z-HX011W | |
| CrossMark / Creativity | |
| MSI Pulse 17 B13VGK | |
| MSI Katana 17 B13VFK | |
| Asus TUF Gaming A17 FA707XI-NS94 | |
| Moyenne AMD Ryzen 9 7940HS, NVIDIA GeForce RTX 4070 Laptop GPU (1952 - 1979, n=2) | |
| Asus TUF Gaming F17 FX707Z-HX011W | |
| Razer Blade 17 (i7-12800H, RTX 3070 Ti) | |
| CrossMark / Responsiveness | |
| MSI Pulse 17 B13VGK | |
| MSI Katana 17 B13VFK | |
| Razer Blade 17 (i7-12800H, RTX 3070 Ti) | |
| Moyenne AMD Ryzen 9 7940HS, NVIDIA GeForce RTX 4070 Laptop GPU (1478 - 1575, n=2) | |
| Asus TUF Gaming A17 FA707XI-NS94 | |
| Asus TUF Gaming F17 FX707Z-HX011W | |
| WebXPRT 3 / Overall | |
| Asus TUF Gaming A17 FA707XI-NS94 | |
| Moyenne AMD Ryzen 9 7940HS, NVIDIA GeForce RTX 4070 Laptop GPU (317 - 319, n=2) | |
| MSI Katana 17 B13VFK | |
| MSI Pulse 17 B13VGK | |
| HP Pavilion Gaming 17-cd2146ng | |
| WebXPRT 4 / Overall | |
| Asus TUF Gaming A17 FA707XI-NS94 | |
| MSI Katana 17 B13VFK | |
| Moyenne AMD Ryzen 9 7940HS, NVIDIA GeForce RTX 4070 Laptop GPU (260 - 271, n=2) | |
| MSI Pulse 17 B13VGK | |
| Mozilla Kraken 1.1 / Total | |
| HP Pavilion Gaming 17-cd2146ng | |
| MSI Pulse 17 B13VGK | |
| MSI Katana 17 B13VFK | |
| Moyenne AMD Ryzen 9 7940HS, NVIDIA GeForce RTX 4070 Laptop GPU (481 - 499, n=2) | |
| Asus TUF Gaming A17 FA707XI-NS94 | |
* ... Moindre est la valeur, meilleures sont les performances
| PCMark 10 Score | 8092 points | |
Aide | ||
| AIDA64 / Memory Copy | |
| Moyenne AMD Ryzen 9 7940HS (35327 - 78739, n=10) | |
| MSI Pulse 17 B13VGK | |
| Asus TUF Gaming A17 FA707XI-NS94 | |
| MSI Katana 17 B13VFK | |
| Asus TUF Gaming F17 FX707Z-HX011W | |
| Razer Blade 17 (i7-12800H, RTX 3070 Ti) | |
| HP Pavilion Gaming 17-cd2146ng | |
| AIDA64 / Memory Read | |
| MSI Pulse 17 B13VGK | |
| Asus TUF Gaming F17 FX707Z-HX011W | |
| MSI Katana 17 B13VFK | |
| Asus TUF Gaming A17 FA707XI-NS94 | |
| Moyenne AMD Ryzen 9 7940HS (30769 - 61836, n=10) | |
| Razer Blade 17 (i7-12800H, RTX 3070 Ti) | |
| HP Pavilion Gaming 17-cd2146ng | |
| AIDA64 / Memory Write | |
| Moyenne AMD Ryzen 9 7940HS (42217 - 91567, n=10) | |
| Asus TUF Gaming A17 FA707XI-NS94 | |
| MSI Pulse 17 B13VGK | |
| Asus TUF Gaming F17 FX707Z-HX011W | |
| Razer Blade 17 (i7-12800H, RTX 3070 Ti) | |
| MSI Katana 17 B13VFK | |
| HP Pavilion Gaming 17-cd2146ng | |
| AIDA64 / Memory Latency | |
| MSI Katana 17 B13VFK | |
| MSI Pulse 17 B13VGK | |
| Moyenne AMD Ryzen 9 7940HS (87.6 - 111.1, n=10) | |
| Asus TUF Gaming A17 FA707XI-NS94 | |
| HP Pavilion Gaming 17-cd2146ng | |
| Asus TUF Gaming F17 FX707Z-HX011W | |
| Razer Blade 17 (i7-12800H, RTX 3070 Ti) | |
* ... Moindre est la valeur, meilleures sont les performances
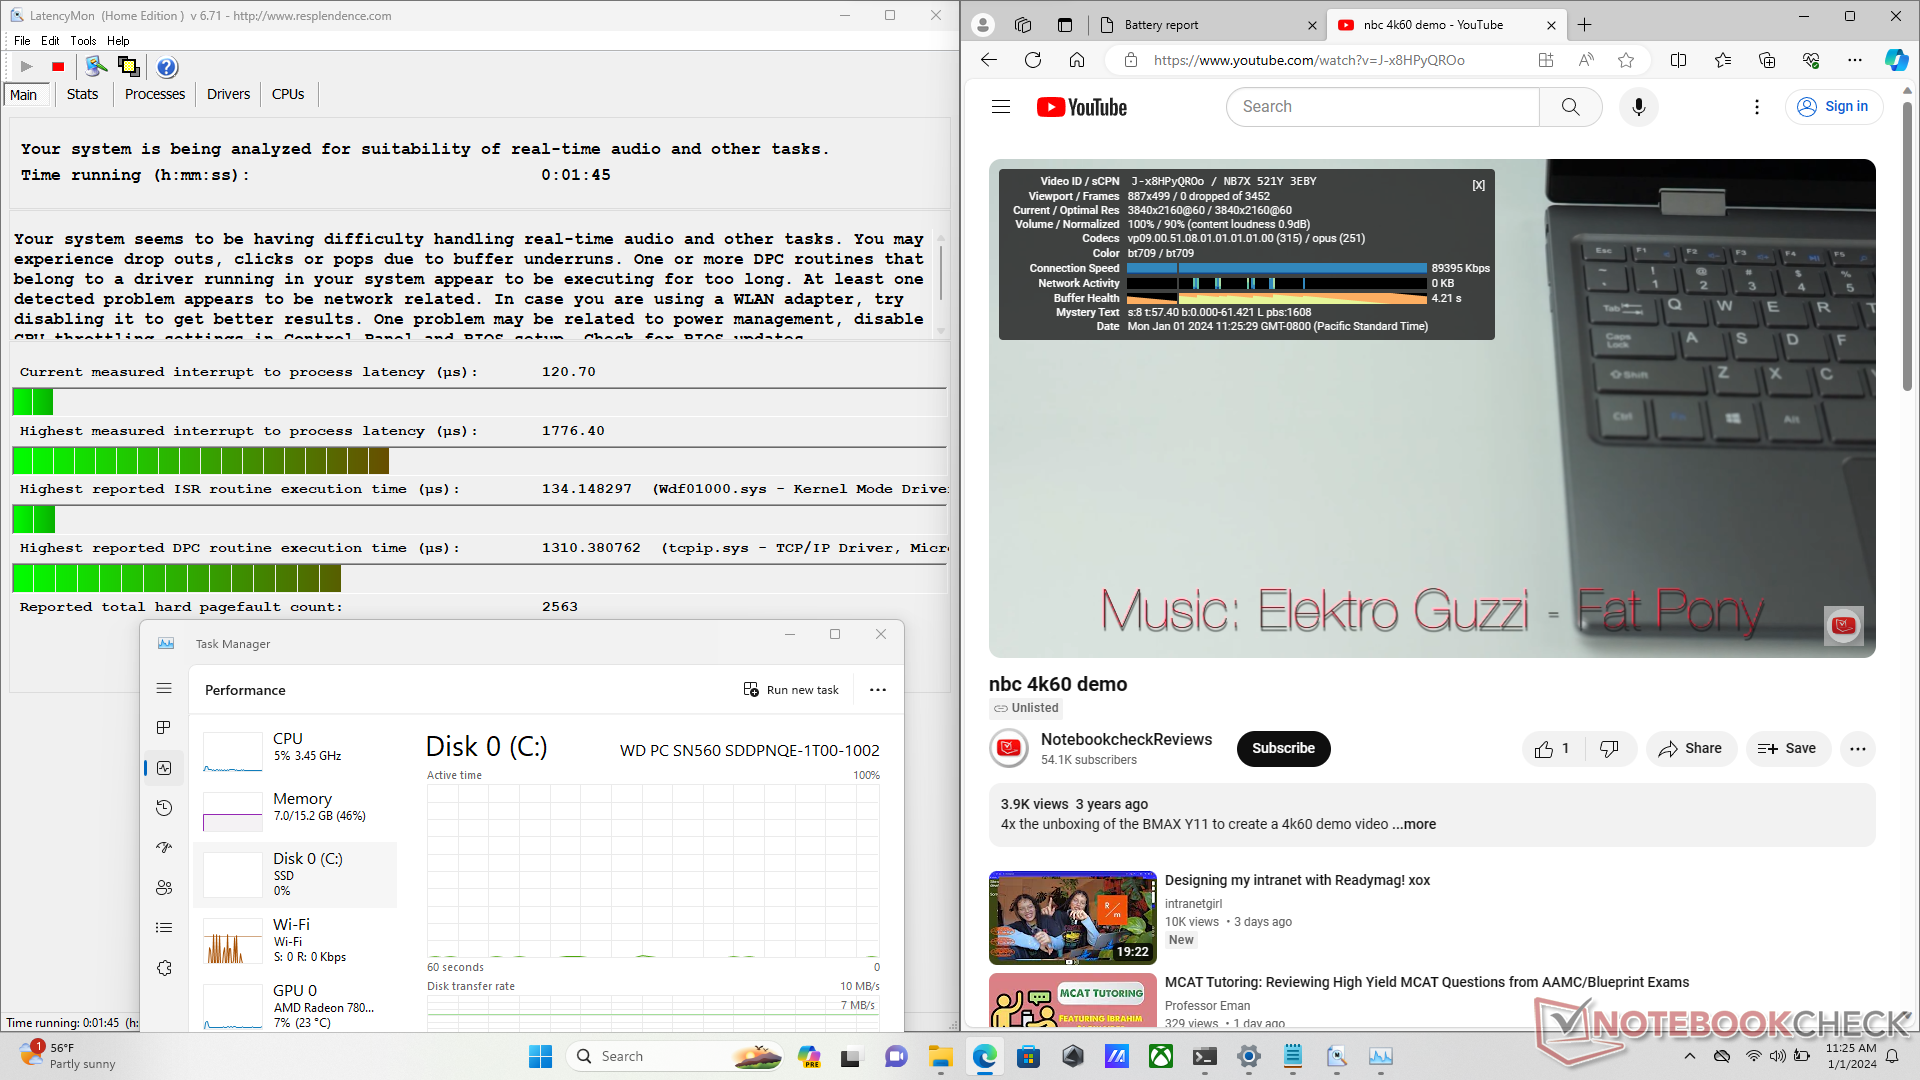
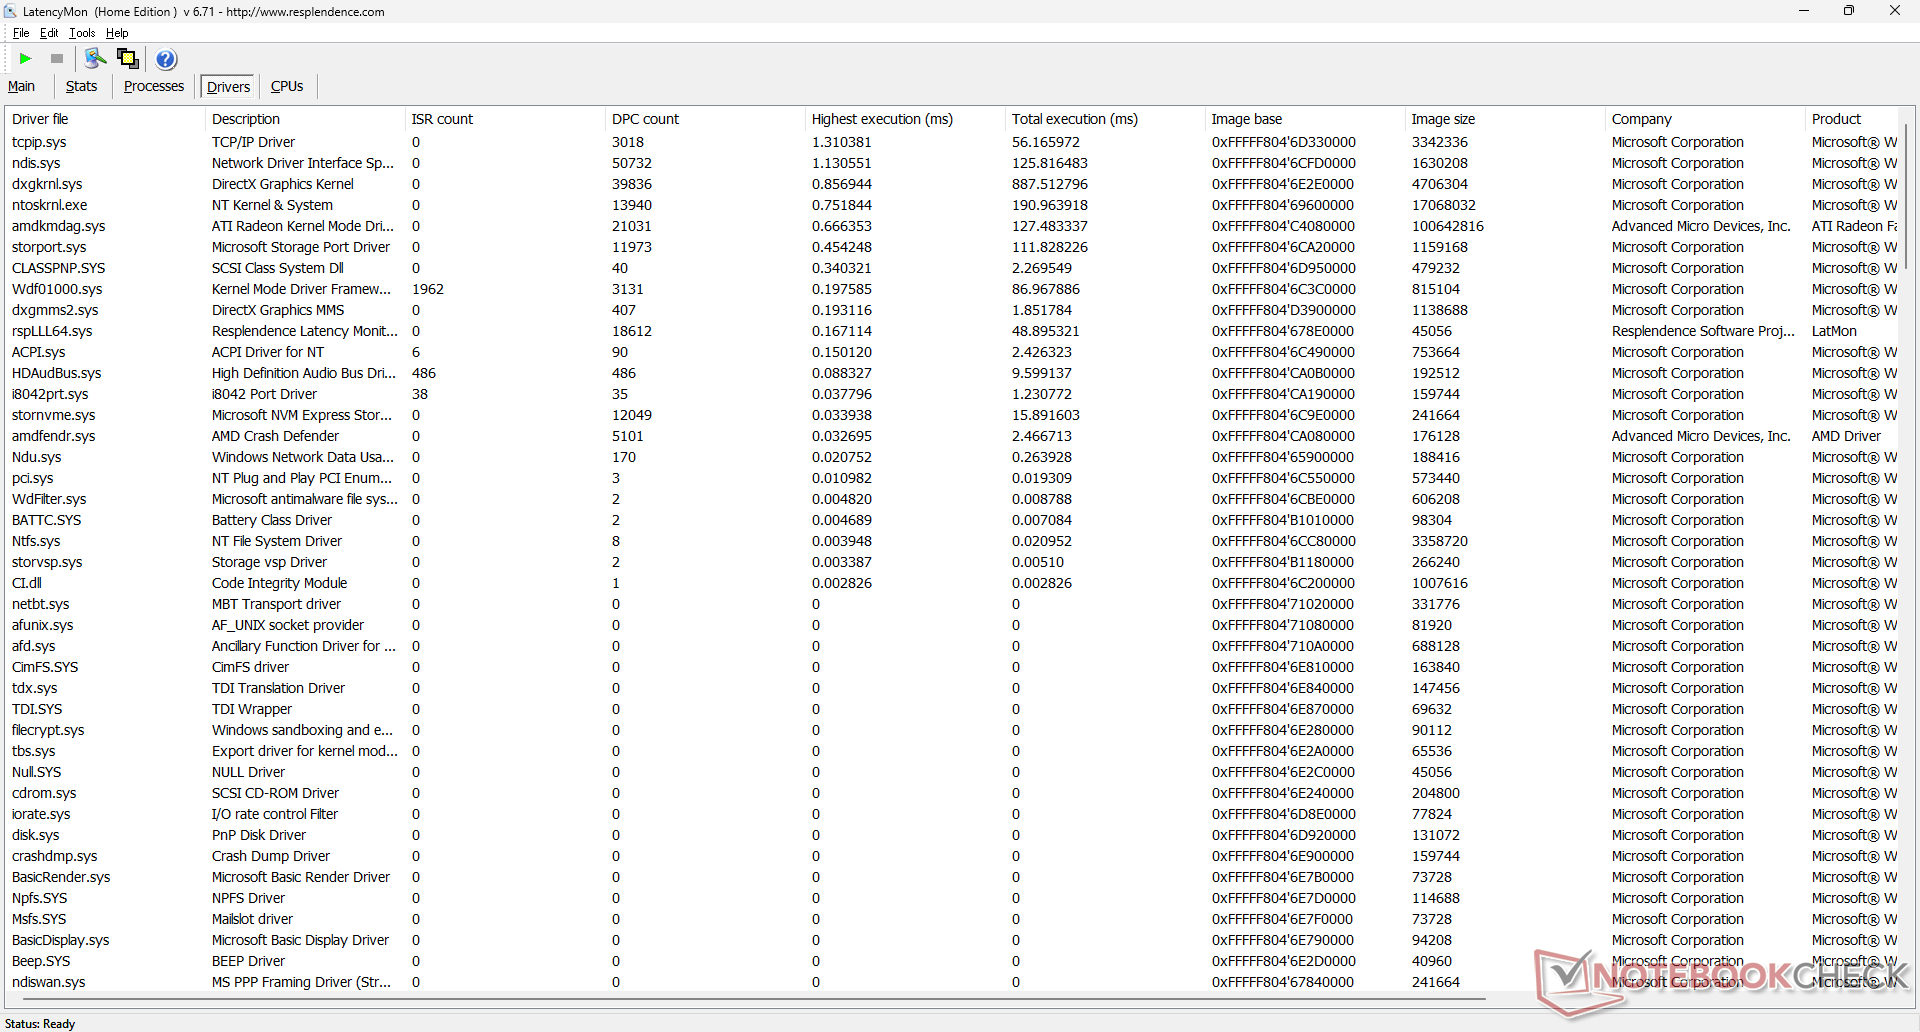
Latence DPC
LatencyMon révèle des problèmes de DPC lors de l'ouverture de plusieurs onglets de notre page d'accueil. la lecture de vidéos 4K à 60 FPS est par ailleurs parfaite, sans aucune perte d'images.
| DPC Latencies / LatencyMon - interrupt to process latency (max), Web, Youtube, Prime95 | |
| MSI Katana 17 B13VFK | |
| Asus TUF Gaming F17 FX707Z-HX011W | |
| Asus TUF Gaming A17 FA707XI-NS94 | |
| HP Pavilion Gaming 17-cd2146ng | |
| MSI Pulse 17 B13VGK | |
| Razer Blade 17 (i7-12800H, RTX 3070 Ti) | |
* ... Moindre est la valeur, meilleures sont les performances
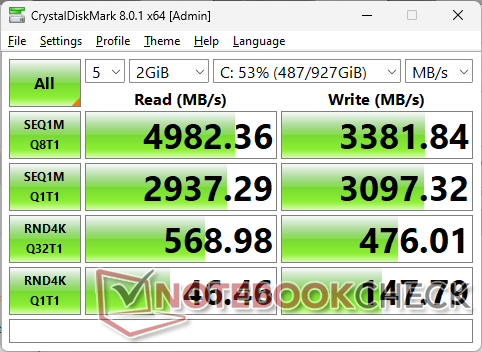
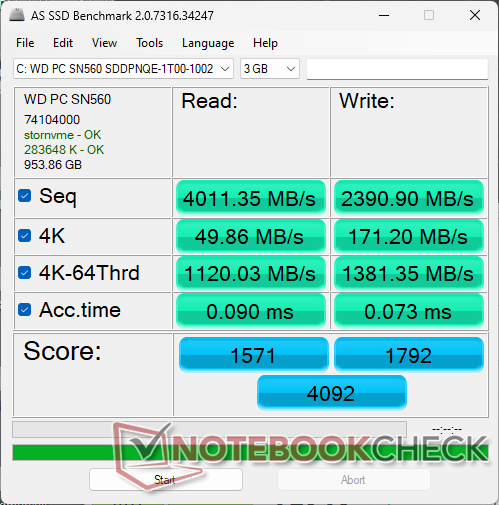
Dispositifs de stockage
Notre unité de test est livrée avec le WD SN560 qui est un SSD NVMe PCIe4 x4 de milieu de gamme, contrairement à la série WDC SN850X plus haut de gamme. Les taux de transfert plafonnent à environ 5000 Mo/s au lieu de 7000+ Mo/s sur le SN850X susmentionné. Cependant, pour un ordinateur portable de jeu de milieu de gamme, le WD SN560 est plus que suffisant. Nous n'avons constaté aucun problème d'étranglement des performances sur notre disque, comme le montrent les résultats de notre test de stress DiskSpd ci-dessous.

* ... Moindre est la valeur, meilleures sont les performances
Disk Throttling: DiskSpd Read Loop, Queue Depth 8
Performance du GPU
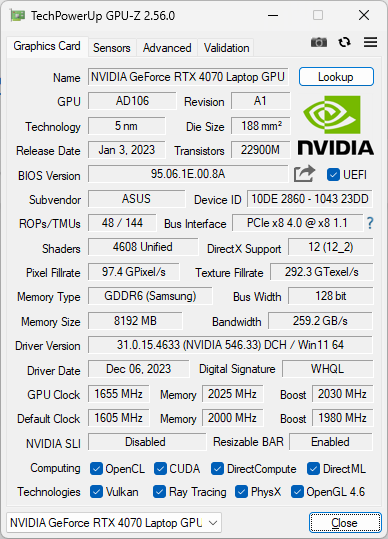
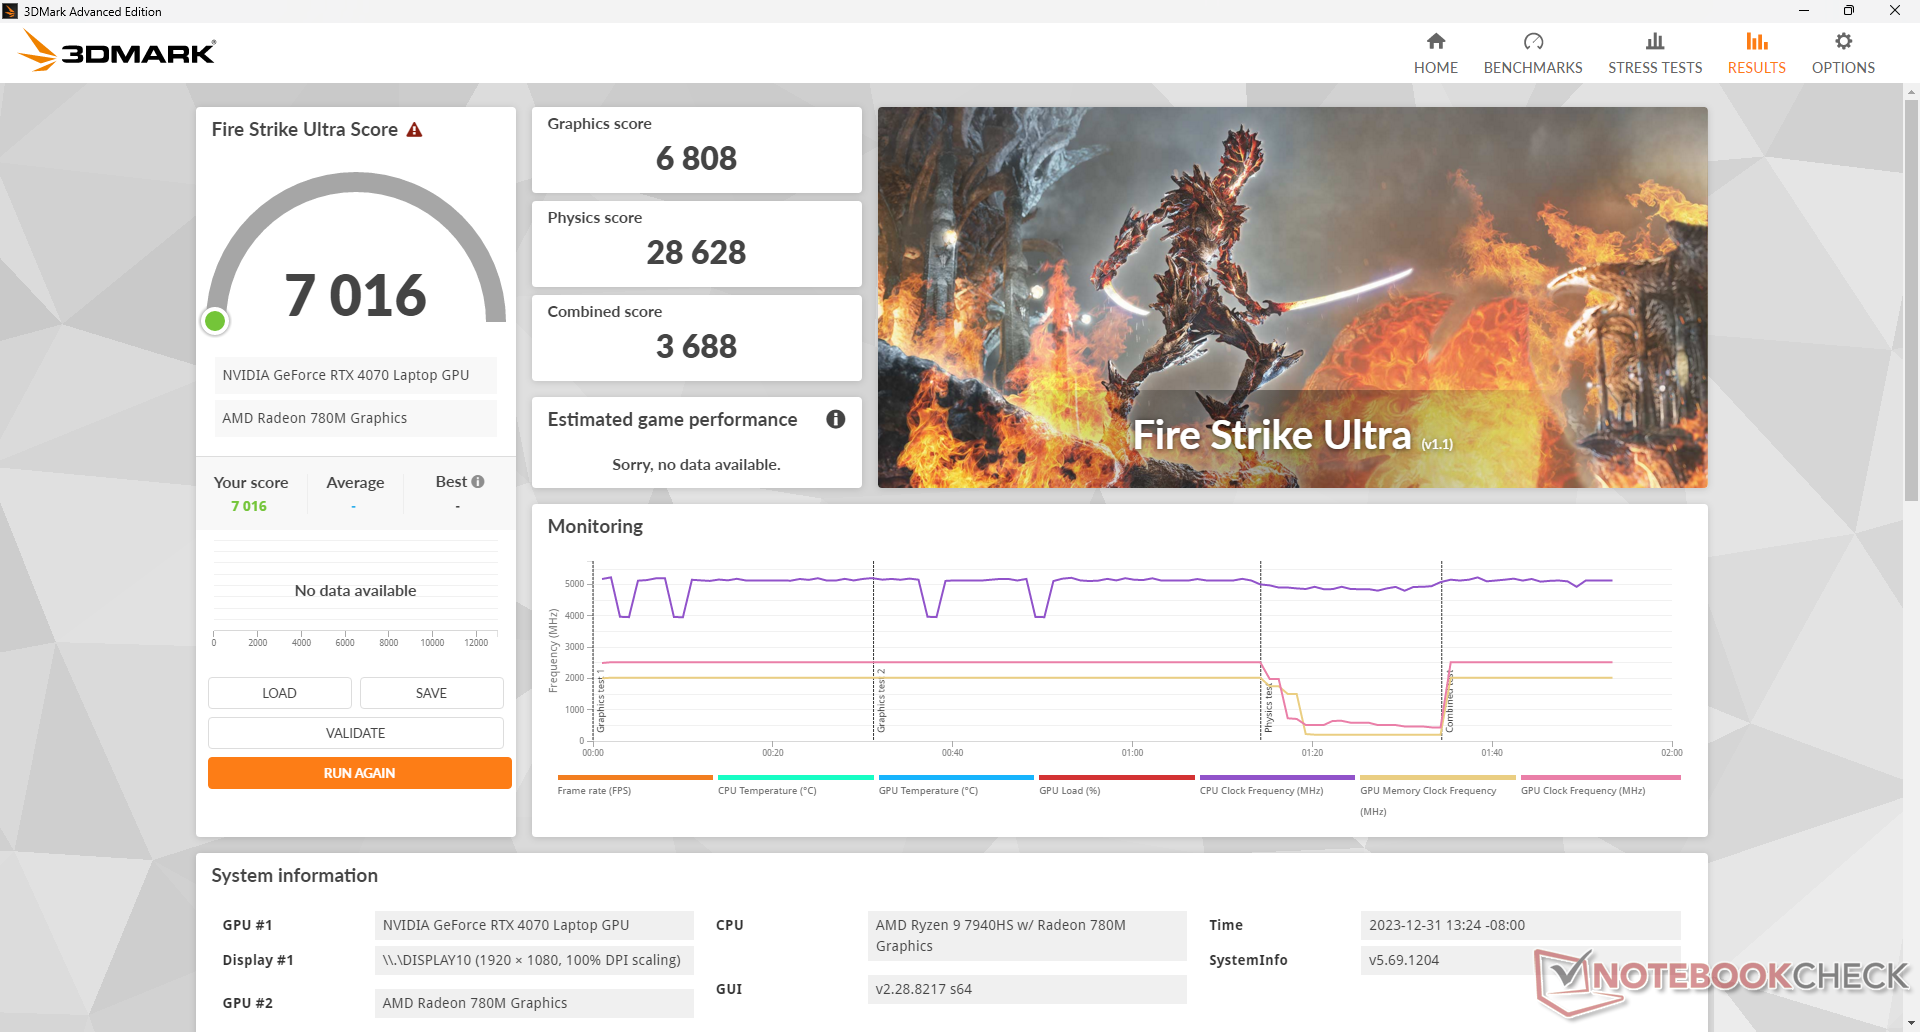
Les performances graphiques globales sont environ 25 à 30 % plus lentes que celles de la version de bureau de la GeForce RTX 4070. Les utilisateurs qui passent d'un ordinateur portable RTX 3060 plus ancien à verront encore des augmentations notables des performances allant jusqu'à 50 % avant de prendre en compte les fonctions activées par DLSS. L'objectif TGP relativement élevé de 140 W permet à notre TUF Gaming A17 de surpasser d'environ 5 à 15 % l'ordinateur portable moyen de notre base de données équipé du même GPU RTX 4070.
La rétrogradation vers la
RTX 4060 ou RTX 4050 aura un impact sur les performances d'environ 20 % et 35 %, respectivement. Le delta de performance est plus ou moins linéaire entre les options RTX 4050, RTX 4060 et RTX 4070. Les RTX 4080 ou 4090, plus rapides, ne sont disponibles que sur les modèles ROG haut de gamme d'Asus.| Profil de puissance | Score graphique | Score physique | Score combiné |
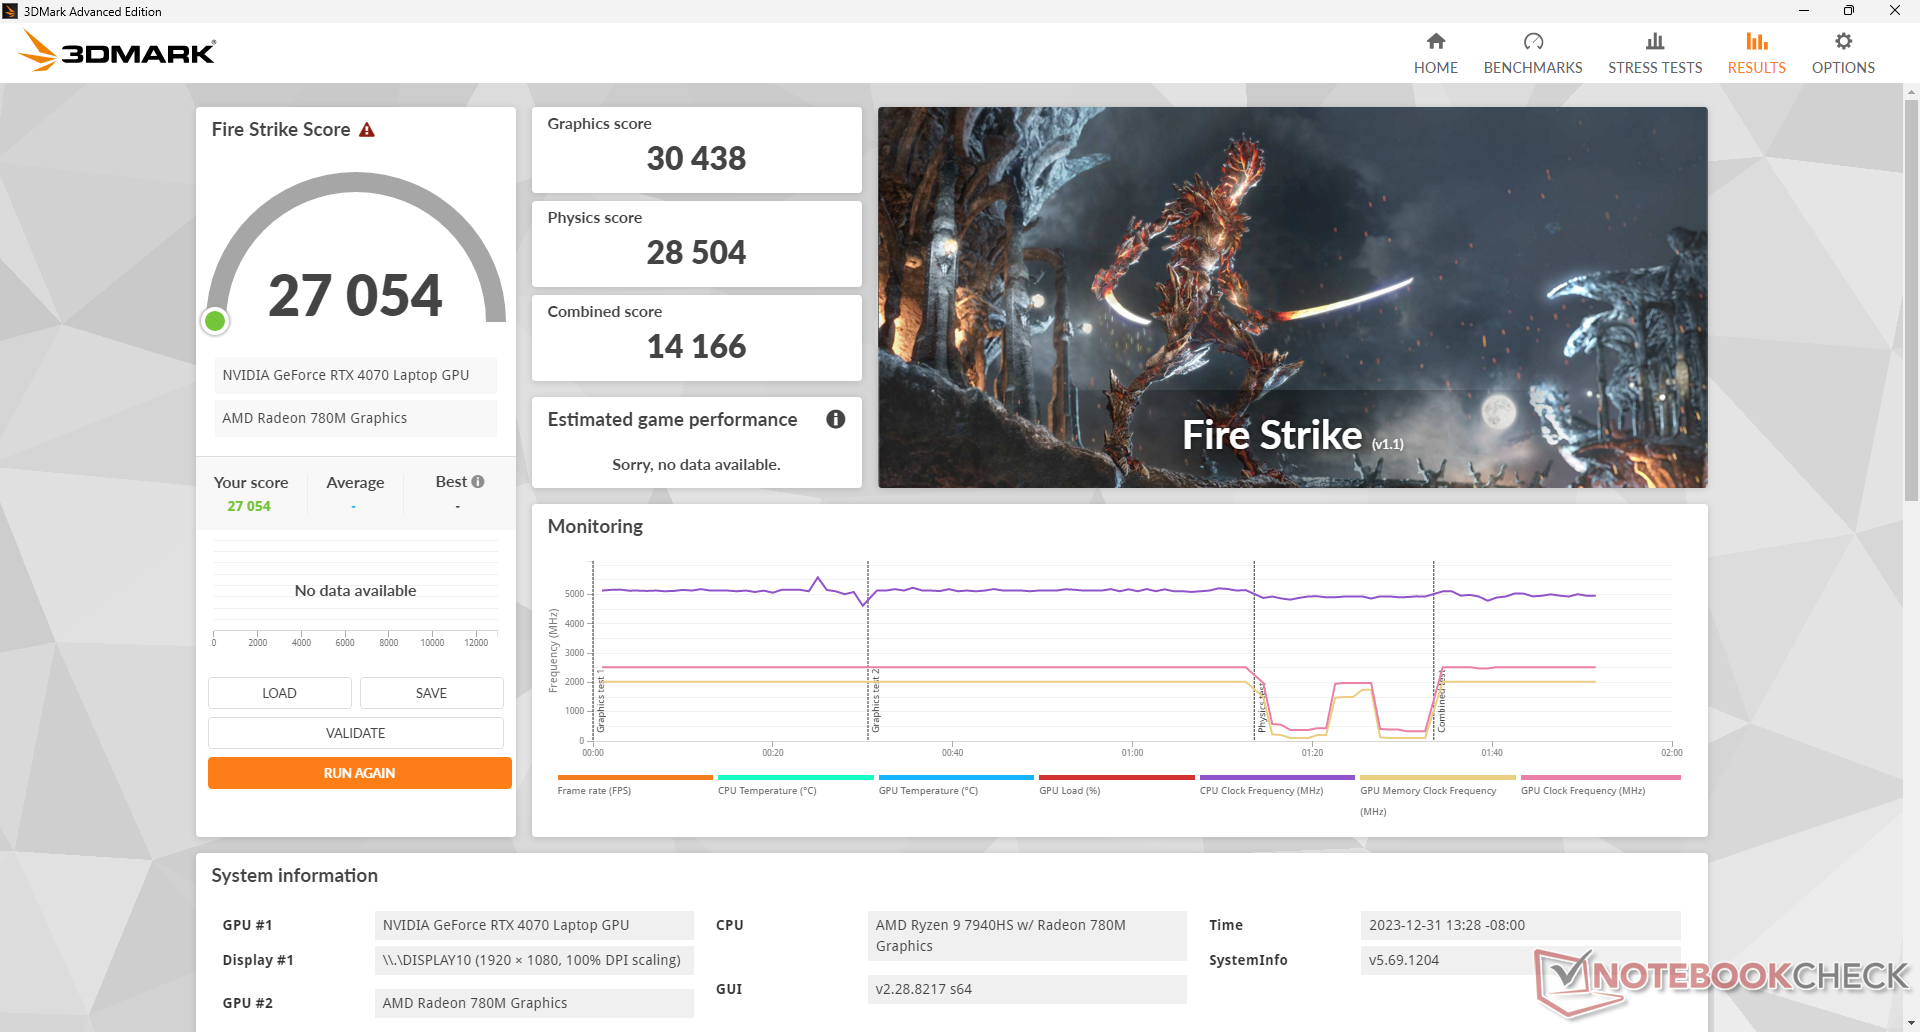
| Mode Turbo | 30438 | 28504 | 14166 |
| Mode Performance | 29222 (-4%) | 28345 (-1%) | 13129 (-7%) |
| Mode équilibré | 29472 (-3%) | 27605 (-3%) | 12947 (-9%) |
| Alimentation par batterie | 23884 (-22%) | 26213 (-8%) | 11027 (-22%) |
L'utilisation des profils d'alimentation Performance ou Équilibré, plus lents, n'a qu'un léger impact sur les performances du système, comme le montre notre tableau de résultats Fire Strike ci-dessus. L'impact le plus important provient de l'utilisation de la batterie, comme on pouvait s'y attendre.
| 3DMark Performance rating - Percent | |
| MSI Raider GE78 HX 13VI -1! | |
| Alienware m18 R1 AMD -1! | |
| Alienware m16 R1 AMD | |
| KFA2 GeForce RTX 4070 EX Gamer | |
| Asus TUF Gaming A17 FA707XI-NS94 | |
| Lenovo Legion 7 16ARHA7 -1! | |
| Moyenne NVIDIA GeForce RTX 4070 Laptop GPU | |
| Razer Blade 17 (i7-12800H, RTX 3070 Ti) -1! | |
| MSI Katana 17 B13VFK -1! | |
| Asus TUF Gaming F17 FX707Z-HX011W -1! | |
| Medion Erazer Scout E20 | |
| Asus ROG Strix G17 G713QE-RB74 -1! | |
| Lenovo ThinkPad Z16 Gen 2 -1! | |
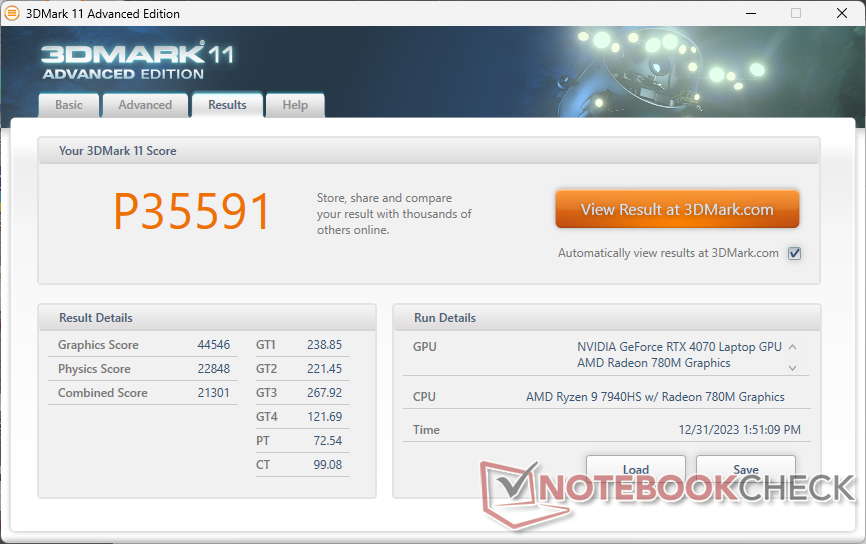
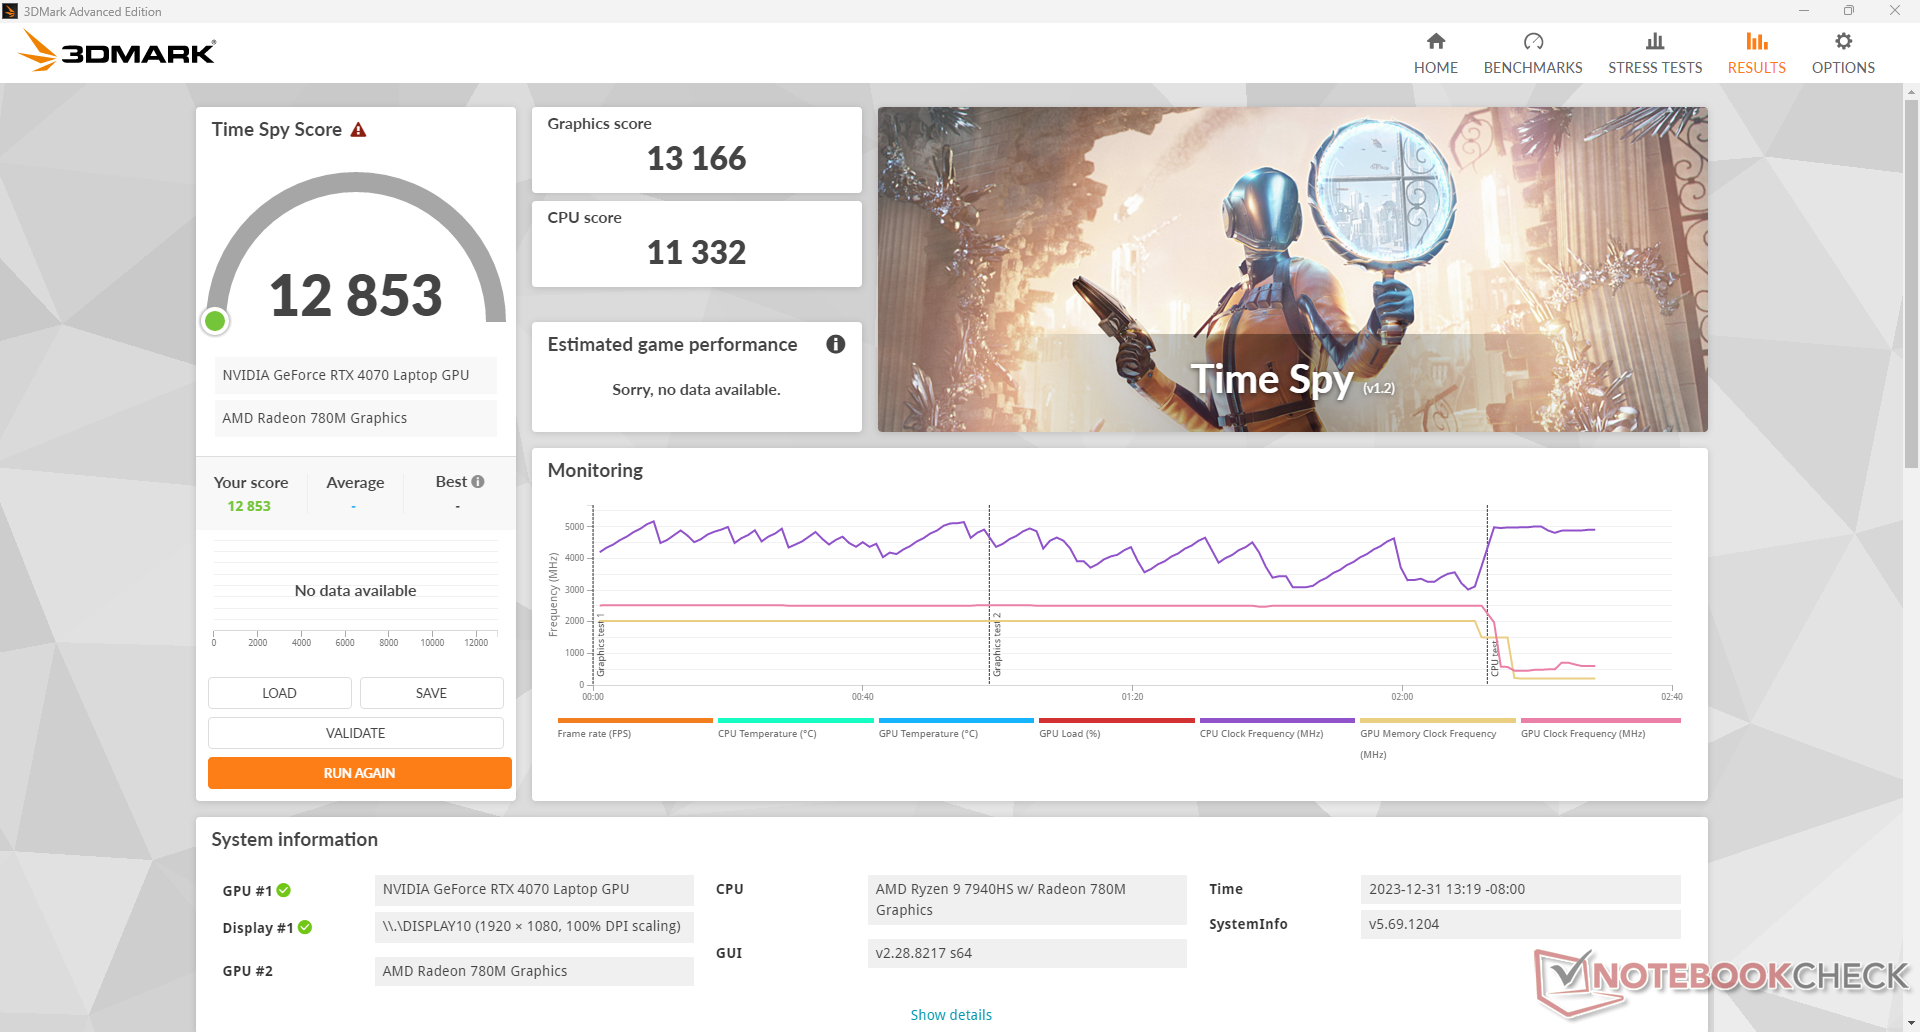
| 3DMark 11 Performance | 35591 points | |
| 3DMark Fire Strike Score | 27054 points | |
| 3DMark Time Spy Score | 12853 points | |
Aide | ||
* ... Moindre est la valeur, meilleures sont les performances
| Performance rating - Percent | |
| MSI Raider GE78 HX 13VI | |
| Alienware m16 R1 AMD -1! | |
| Alienware m18 R1 AMD | |
| MSI Katana 17 B13VFK | |
| Razer Blade 17 (i7-12800H, RTX 3070 Ti) | |
| Asus TUF Gaming A17 FA707XI-NS94 -1! | |
| Asus TUF Gaming F17 FX707Z-HX011W | |
| Lenovo Legion 7 16ARHA7 | |
| Asus ROG Strix G17 G713QE-RB74 | |
| Lenovo ThinkPad Z16 Gen 2 -1! | |
| The Witcher 3 - 1920x1080 Ultra Graphics & Postprocessing (HBAO+) | |
| MSI Raider GE78 HX 13VI | |
| Alienware m16 R1 AMD | |
| Alienware m18 R1 AMD | |
| Asus TUF Gaming A17 FA707XI-NS94 | |
| Lenovo Legion 7 16ARHA7 | |
| Razer Blade 17 (i7-12800H, RTX 3070 Ti) | |
| MSI Katana 17 B13VFK | |
| Asus TUF Gaming F17 FX707Z-HX011W | |
| Asus ROG Strix G17 G713QE-RB74 | |
| Lenovo ThinkPad Z16 Gen 2 | |
| GTA V - 1920x1080 Highest AA:4xMSAA + FX AF:16x | |
| MSI Raider GE78 HX 13VI | |
| MSI Katana 17 B13VFK | |
| Alienware m18 R1 AMD | |
| Razer Blade 17 (i7-12800H, RTX 3070 Ti) | |
| Asus TUF Gaming F17 FX707Z-HX011W | |
| Lenovo Legion 7 16ARHA7 | |
| Asus ROG Strix G17 G713QE-RB74 | |
| Final Fantasy XV Benchmark - 1920x1080 High Quality | |
| MSI Raider GE78 HX 13VI | |
| Alienware m16 R1 AMD | |
| Alienware m18 R1 AMD | |
| Asus TUF Gaming A17 FA707XI-NS94 | |
| Lenovo Legion 7 16ARHA7 | |
| Razer Blade 17 (i7-12800H, RTX 3070 Ti) | |
| MSI Katana 17 B13VFK | |
| Asus TUF Gaming F17 FX707Z-HX011W | |
| Asus ROG Strix G17 G713QE-RB74 | |
| Lenovo ThinkPad Z16 Gen 2 | |
| Strange Brigade - 1920x1080 ultra AA:ultra AF:16 | |
| MSI Raider GE78 HX 13VI | |
| Alienware m16 R1 AMD | |
| Alienware m18 R1 AMD | |
| Lenovo Legion 7 16ARHA7 | |
| Asus TUF Gaming A17 FA707XI-NS94 | |
| Razer Blade 17 (i7-12800H, RTX 3070 Ti) | |
| MSI Katana 17 B13VFK | |
| Asus TUF Gaming F17 FX707Z-HX011W | |
| Asus ROG Strix G17 G713QE-RB74 | |
| Lenovo ThinkPad Z16 Gen 2 | |
| Dota 2 Reborn - 1920x1080 ultra (3/3) best looking | |
| MSI Raider GE78 HX 13VI | |
| Alienware m16 R1 AMD | |
| MSI Katana 17 B13VFK | |
| Alienware m18 R1 AMD | |
| Razer Blade 17 (i7-12800H, RTX 3070 Ti) | |
| Asus TUF Gaming F17 FX707Z-HX011W | |
| Asus TUF Gaming A17 FA707XI-NS94 | |
| Asus ROG Strix G17 G713QE-RB74 | |
| Lenovo ThinkPad Z16 Gen 2 | |
| Lenovo Legion 7 16ARHA7 | |
| X-Plane 11.11 - 1920x1080 high (fps_test=3) | |
| MSI Raider GE78 HX 13VI | |
| MSI Katana 17 B13VFK | |
| Alienware m16 R1 AMD | |
| Razer Blade 17 (i7-12800H, RTX 3070 Ti) | |
| Asus TUF Gaming F17 FX707Z-HX011W | |
| Alienware m18 R1 AMD | |
| Asus TUF Gaming A17 FA707XI-NS94 | |
| Asus ROG Strix G17 G713QE-RB74 | |
| Lenovo Legion 7 16ARHA7 | |
| Lenovo ThinkPad Z16 Gen 2 | |
| Tiny Tina's Wonderlands | |
| 1920x1080 Badass Preset (DX12) | |
| Alienware m16 R1 AMD | |
| Alienware m18 R1 AMD | |
| Asus TUF Gaming A17 FA707XI-NS94 | |
| Moyenne NVIDIA GeForce RTX 4070 Laptop GPU (58.6 - 115.9, n=18) | |
| MSI Katana 17 B13VFK | |
| Lenovo ThinkPad Z16 Gen 2 | |
| 2560x1440 Badass Preset (DX12) | |
| Alienware m16 R1 AMD | |
| Alienware m18 R1 AMD | |
| Asus TUF Gaming A17 FA707XI-NS94 | |
| Moyenne NVIDIA GeForce RTX 4070 Laptop GPU (49.8 - 79.5, n=17) | |
| Lenovo ThinkPad Z16 Gen 2 | |
| 3840x2160 Badass Preset (DX12) | |
| Alienware m16 R1 AMD | |
| Alienware m18 R1 AMD | |
| Asus TUF Gaming A17 FA707XI-NS94 | |
| Moyenne NVIDIA GeForce RTX 4070 Laptop GPU (28.3 - 39.7, n=13) | |
| Baldur's Gate 3 | |
| 1920x1080 Ultra Preset AA:T | |
| Alienware m18 R1 AMD | |
| Asus TUF Gaming A17 FA707XI-NS94 | |
| Moyenne NVIDIA GeForce RTX 4070 Laptop GPU (66.7 - 128.5, n=30) | |
| Lenovo ThinkPad Z16 Gen 2 | |
| 2560x1440 Ultra Preset AA:T | |
| Alienware m18 R1 AMD | |
| Asus TUF Gaming A17 FA707XI-NS94 | |
| Moyenne NVIDIA GeForce RTX 4070 Laptop GPU (54.4 - 89.6, n=25) | |
| Lenovo ThinkPad Z16 Gen 2 | |
| 3840x2160 Ultra Preset AA:T | |
| Alienware m18 R1 AMD | |
| Asus TUF Gaming A17 FA707XI-NS94 | |
| Moyenne NVIDIA GeForce RTX 4070 Laptop GPU (33.4 - 45.2, n=12) | |
| Cyberpunk 2077 | |
| 1920x1080 High Preset (FSR off) | |
| Alienware m18 R1 AMD | |
| Asus TUF Gaming A17 FA707XI-NS94 | |
| Moyenne NVIDIA GeForce RTX 4070 Laptop GPU (74.7 - 103.6, n=32) | |
| Lenovo ThinkPad Z16 Gen 2 | |
| 1920x1080 Ultra Preset (FSR off) | |
| Alienware m18 R1 AMD | |
| MSI Raider GE78 HX 13VI | |
| Asus TUF Gaming A17 FA707XI-NS94 | |
| Moyenne NVIDIA GeForce RTX 4070 Laptop GPU (30.7 - 90.7, n=40) | |
| Lenovo ThinkPad Z16 Gen 2 | |
| 2560x1440 Ultra Preset (FSR off) | |
| MSI Raider GE78 HX 13VI | |
| Alienware m18 R1 AMD | |
| Asus TUF Gaming A17 FA707XI-NS94 | |
| Moyenne NVIDIA GeForce RTX 4070 Laptop GPU (24.8 - 57.1, n=37) | |
| Lenovo ThinkPad Z16 Gen 2 | |
| 3840x2160 Ultra Preset (FSR off) | |
| MSI Raider GE78 HX 13VI | |
| Alienware m18 R1 AMD | |
| Asus TUF Gaming A17 FA707XI-NS94 | |
| Moyenne NVIDIA GeForce RTX 4070 Laptop GPU (20.2 - 24, n=13) | |
| 1920x1080 Ray Tracing Ultra Preset (DLSS off) | |
| MSI Raider GE78 HX 13VI | |
| Asus TUF Gaming A17 FA707XI-NS94 | |
| Alienware m18 R1 AMD | |
| Moyenne NVIDIA GeForce RTX 4070 Laptop GPU (19.1 - 46.8, n=23) | |
| Lenovo ThinkPad Z16 Gen 2 | |
| The Witcher 3 | |
| 1920x1080 Ultra Graphics & Postprocessing (HBAO+) | |
| MSI Raider GE78 HX 13VI | |
| Alienware m16 R1 AMD | |
| Alienware m18 R1 AMD | |
| Asus TUF Gaming A17 FA707XI-NS94 | |
| Lenovo Legion 7 16ARHA7 | |
| Moyenne NVIDIA GeForce RTX 4070 Laptop GPU (69.8 - 133.7, n=57) | |
| Razer Blade 17 (i7-12800H, RTX 3070 Ti) | |
| MSI Katana 17 B13VFK | |
| Asus TUF Gaming F17 FX707Z-HX011W | |
| Asus ROG Strix G17 G713QE-RB74 | |
| Lenovo ThinkPad Z16 Gen 2 | |
| 3840x2160 High Graphics & Postprocessing (Nvidia HairWorks Off) | |
| MSI Raider GE78 HX 13VI | |
| Alienware m16 R1 AMD | |
| Alienware m18 R1 AMD | |
| Asus TUF Gaming A17 FA707XI-NS94 | |
| Moyenne NVIDIA GeForce RTX 4070 Laptop GPU (26.5 - 83.5, n=16) | |
| MSI Katana 17 B13VFK | |
| Strange Brigade | |
| 1920x1080 ultra AA:ultra AF:16 | |
| MSI Raider GE78 HX 13VI | |
| Alienware m16 R1 AMD | |
| Alienware m18 R1 AMD | |
| Lenovo Legion 7 16ARHA7 | |
| Asus TUF Gaming A17 FA707XI-NS94 | |
| Moyenne NVIDIA GeForce RTX 4070 Laptop GPU (76.3 - 234, n=63) | |
| Razer Blade 17 (i7-12800H, RTX 3070 Ti) | |
| MSI Katana 17 B13VFK | |
| Asus TUF Gaming F17 FX707Z-HX011W | |
| Asus ROG Strix G17 G713QE-RB74 | |
| Lenovo ThinkPad Z16 Gen 2 | |
| 2560x1440 ultra AA:ultra AF:16 | |
| MSI Raider GE78 HX 13VI | |
| Alienware m18 R1 AMD | |
| Alienware m16 R1 AMD | |
| Lenovo Legion 7 16ARHA7 | |
| Asus TUF Gaming A17 FA707XI-NS94 | |
| Moyenne NVIDIA GeForce RTX 4070 Laptop GPU (52.8 - 150.9, n=55) | |
| MSI Katana 17 B13VFK | |
| 3840x2160 ultra AA:ultra AF:16 | |
| MSI Raider GE78 HX 13VI | |
| Alienware m18 R1 AMD | |
| Alienware m16 R1 AMD | |
| Asus TUF Gaming A17 FA707XI-NS94 | |
| Moyenne NVIDIA GeForce RTX 4070 Laptop GPU (42.7 - 77.9, n=18) | |
| MSI Katana 17 B13VFK | |
| X-Plane 11.11 | |
| 1920x1080 high (fps_test=3) | |
| MSI Raider GE78 HX 13VI | |
| MSI Katana 17 B13VFK | |
| Alienware m16 R1 AMD | |
| Moyenne NVIDIA GeForce RTX 4070 Laptop GPU (52.1 - 147.9, n=69) | |
| Razer Blade 17 (i7-12800H, RTX 3070 Ti) | |
| Asus TUF Gaming F17 FX707Z-HX011W | |
| Alienware m18 R1 AMD | |
| Asus TUF Gaming A17 FA707XI-NS94 | |
| Asus ROG Strix G17 G713QE-RB74 | |
| Lenovo Legion 7 16ARHA7 | |
| Lenovo ThinkPad Z16 Gen 2 | |
| 3840x2160 high (fps_test=3) | |
| MSI Raider GE78 HX 13VI | |
| MSI Katana 17 B13VFK | |
| Alienware m16 R1 AMD | |
| Moyenne NVIDIA GeForce RTX 4070 Laptop GPU (63.4 - 125.8, n=26) | |
| Asus TUF Gaming A17 FA707XI-NS94 | |
| Alienware m18 R1 AMD | |
| Dota 2 Reborn | |
| 1920x1080 ultra (3/3) best looking | |
| MSI Raider GE78 HX 13VI | |
| Alienware m16 R1 AMD | |
| MSI Katana 17 B13VFK | |
| Moyenne NVIDIA GeForce RTX 4070 Laptop GPU (89.7 - 191.2, n=67) | |
| Alienware m18 R1 AMD | |
| Razer Blade 17 (i7-12800H, RTX 3070 Ti) | |
| Asus TUF Gaming F17 FX707Z-HX011W | |
| Asus TUF Gaming A17 FA707XI-NS94 | |
| Asus ROG Strix G17 G713QE-RB74 | |
| Lenovo ThinkPad Z16 Gen 2 | |
| Lenovo Legion 7 16ARHA7 | |
| 3840x2160 ultra (3/3) best looking | |
| MSI Raider GE78 HX 13VI | |
| Alienware m16 R1 AMD | |
| Moyenne NVIDIA GeForce RTX 4070 Laptop GPU (88.4 - 153.3, n=26) | |
| MSI Katana 17 B13VFK | |
| Alienware m18 R1 AMD | |
| Asus TUF Gaming A17 FA707XI-NS94 | |
Witcher 3 FPS Chart
| Bas | Moyen | Élevé | Ultra | QHD | 4K | |
|---|---|---|---|---|---|---|
| The Witcher 3 (2015) | 120.7 | 75.2 | ||||
| Dota 2 Reborn (2015) | 161.6 | 146.4 | 138.1 | 130 | 112.2 | |
| Final Fantasy XV Benchmark (2018) | 121.9 | 88.9 | 49.4 | |||
| X-Plane 11.11 (2018) | 114.7 | 101.7 | 80.7 | 68.6 | ||
| Far Cry 5 (2018) | 121 | 114 | 62 | |||
| Strange Brigade (2018) | 214 | 139.3 | 72.6 | |||
| Tiny Tina's Wonderlands (2022) | 109.4 | 75.6 | 35.5 | |||
| F1 22 (2022) | 210 | 83.8 | 54.7 | 26.5 | ||
| Baldur's Gate 3 (2023) | 114.7 | 81.1 | 41.1 | |||
| Cyberpunk 2077 (2023) | 135.8 | 118.1 | 99.4 | 86.3 | 51.8 | 22.3 |
Émissions
Bruit du système
Non seulement le bruit du ventilateur est généralement plus fort que celui que nous avons enregistré sur le modèle Intel, mais il est également beaucoup plus fort en mode Turbo. En mode Performance, le bruit du ventilateur Witcher 3 en mode Performance se traduit par un bruit de ventilateur de seulement 41 dB(A), contre 57 dB(A) en mode Turbo. Le mode Turbo n'étant que légèrement plus rapide que le mode Performance, les utilisateurs peuvent envisager de jouer en mode Performance plutôt qu'en mode Turbo, car les ventilateurs sont beaucoup plus silencieux. Par ailleurs, nous recommandons généralement le port d'un casque lorsque les ordinateurs portables de jeu atteignent un niveau sonore de 50 dB(A) ou plus.
Degré de la nuisance sonore
| Au repos |
| 28.5 / 29.8 / 29.8 dB(A) |
| Fortement sollicité |
| 34.8 / 57.3 dB(A) |
 | ||
30 dB silencieux 40 dB(A) audible 50 dB(A) bruyant |
||
min: | ||
| Asus TUF Gaming A17 FA707XI-NS94 GeForce RTX 4070 Laptop GPU, R9 7940HS, WD PC SN560 SDDPNQE-1T00 | Asus TUF Gaming F17 FX707Z-HX011W GeForce RTX 3060 Laptop GPU, i7-12700H, SK Hynix HFM001TD3JX013N | MSI Pulse 17 B13VGK GeForce RTX 4070 Laptop GPU, i7-13700H, Micron 2400 MTFDKBA1T0QFM | MSI Katana 17 B13VFK GeForce RTX 4060 Laptop GPU, i7-13620H, Micron 2400 MTFDKBA1T0QFM | Razer Blade 17 (i7-12800H, RTX 3070 Ti) GeForce RTX 3070 Ti Laptop GPU, i7-12800H, Samsung PM9A1 MZVL21T0HCLR | HP Pavilion Gaming 17-cd2146ng GeForce RTX 3050 Ti Laptop GPU, i5-11300H, SK Hynix BC711 512GB HFM512GD3GX013N | |
|---|---|---|---|---|---|---|
| Noise | 12% | 16% | -4% | 15% | 7% | |
| arrêt / environnement * (dB) | 27.9 | 24 14% | 24 14% | 24.5 12% | 23 18% | 25 10% |
| Idle Minimum * (dB) | 28.5 | 24 16% | 24 16% | 24.5 14% | 23 19% | 27 5% |
| Idle Average * (dB) | 29.8 | 24 19% | 24 19% | 24.5 18% | 23 23% | 28 6% |
| Idle Maximum * (dB) | 29.8 | 24 19% | 24 19% | 40 -34% | 23 23% | 30 -1% |
| Load Average * (dB) | 34.8 | 42.6 -22% | 32.49 7% | 48.3 -39% | 36.92 -6% | 39 -12% |
| Witcher 3 ultra * (dB) | 57.1 | 46.84 18% | 46.51 19% | 56 2% | 50 12% | 44 23% |
| Load Maximum * (dB) | 57.3 | 46.84 18% | 46.51 19% | 59.1 -3% | 50 13% | 46 20% |
* ... Moindre est la valeur, meilleures sont les performances
Température
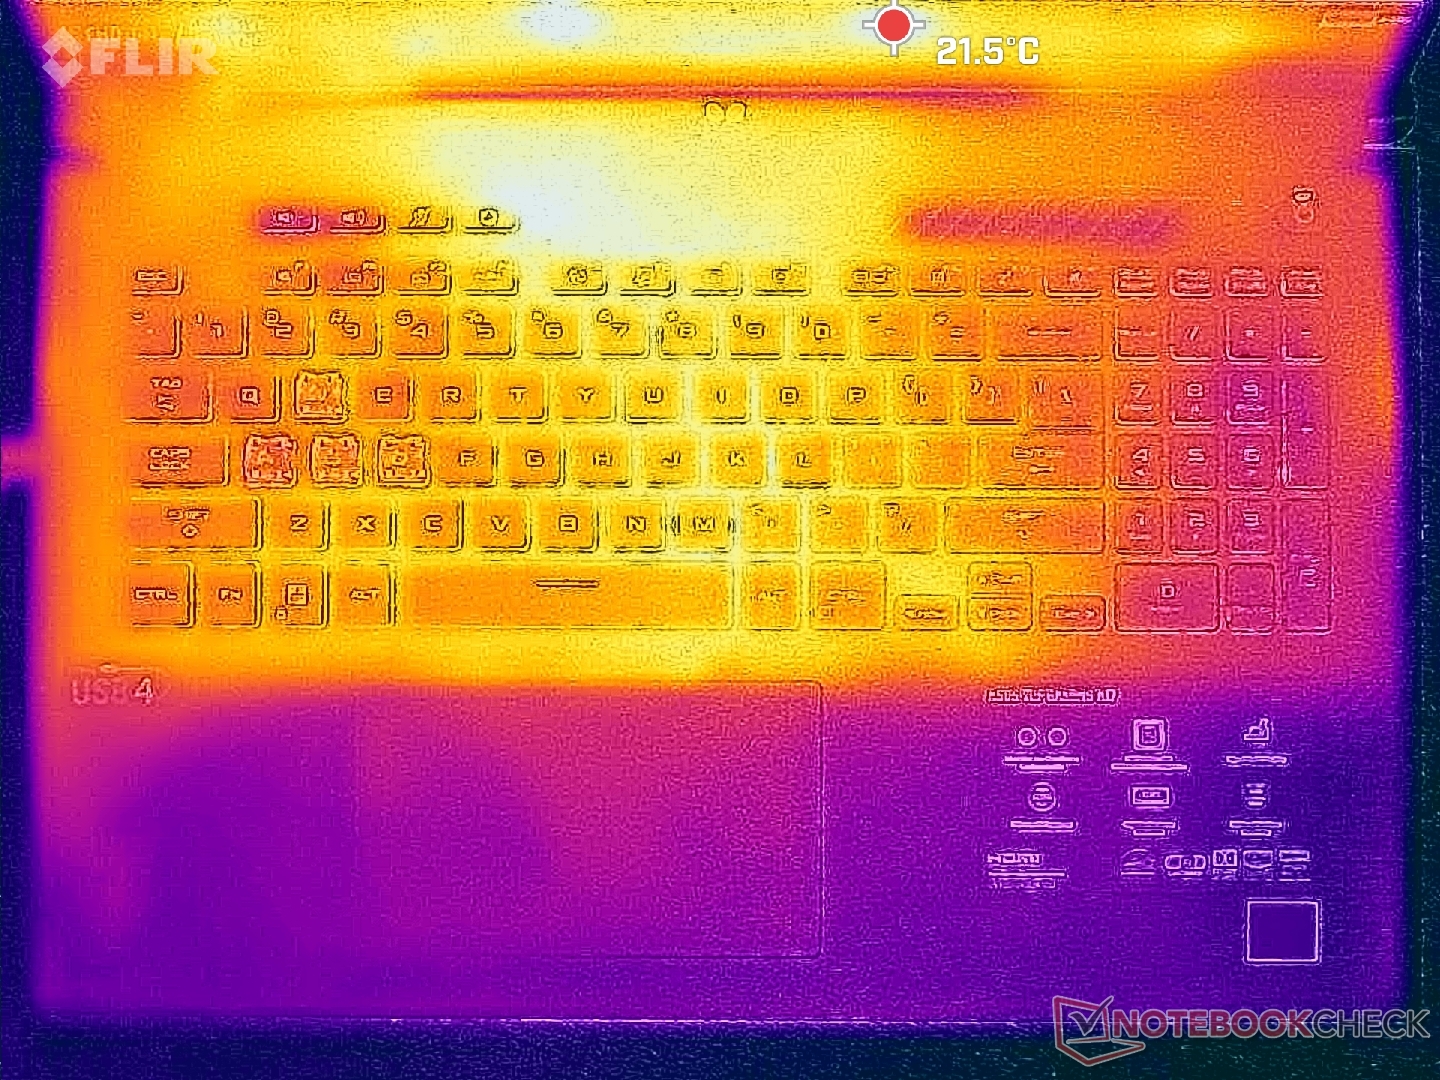
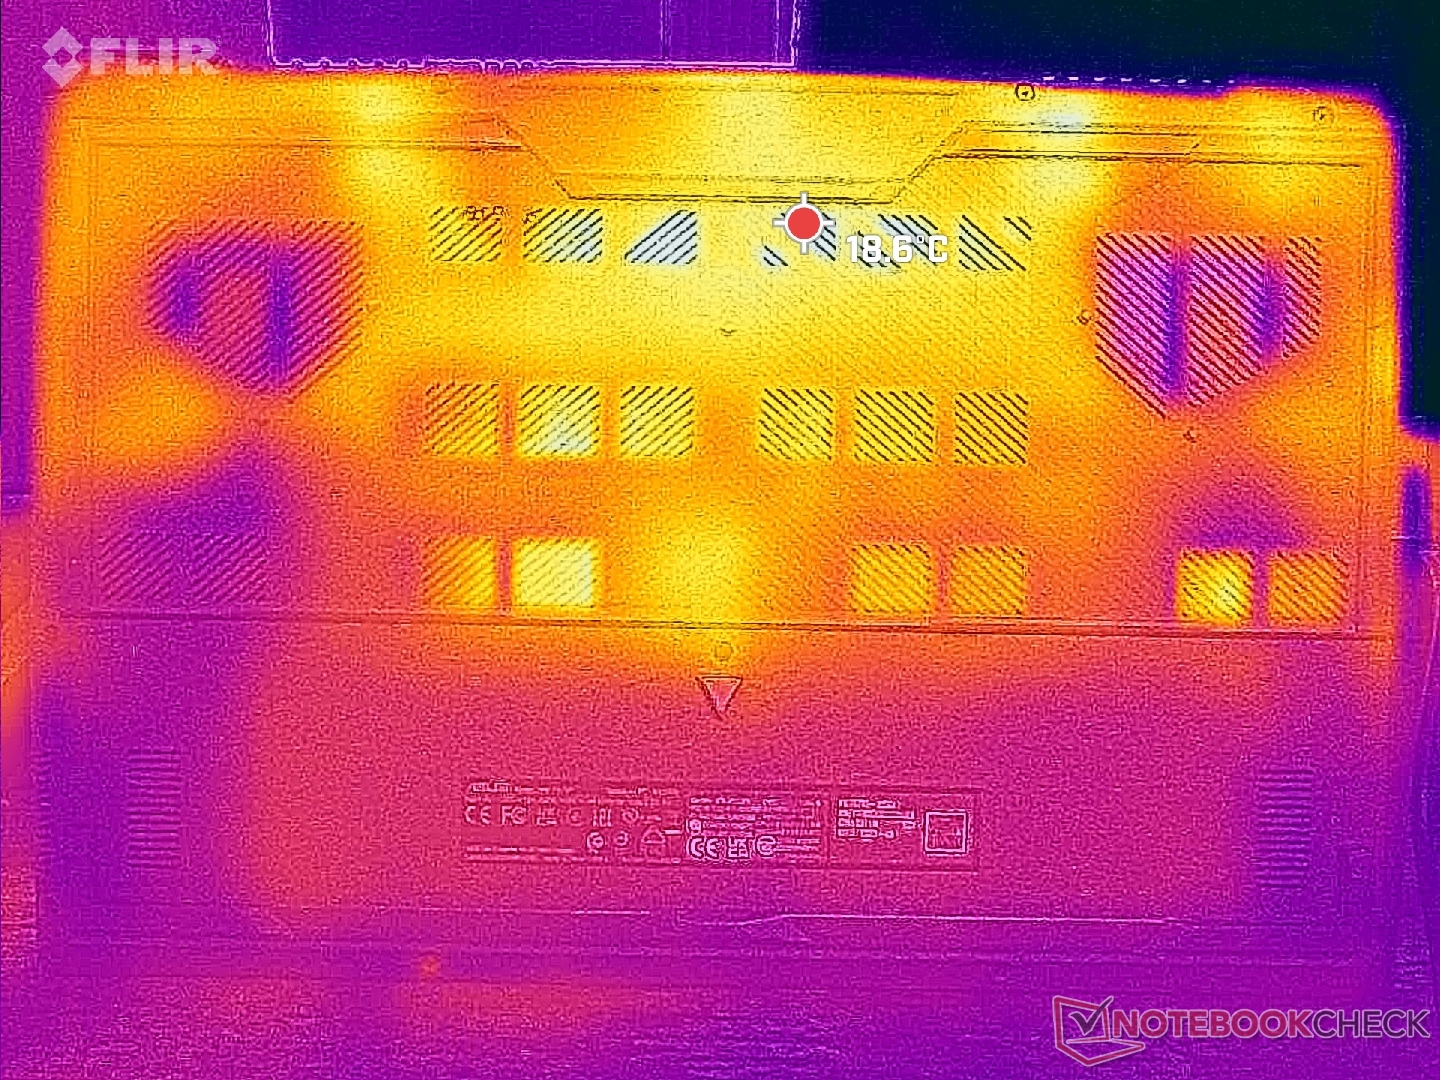
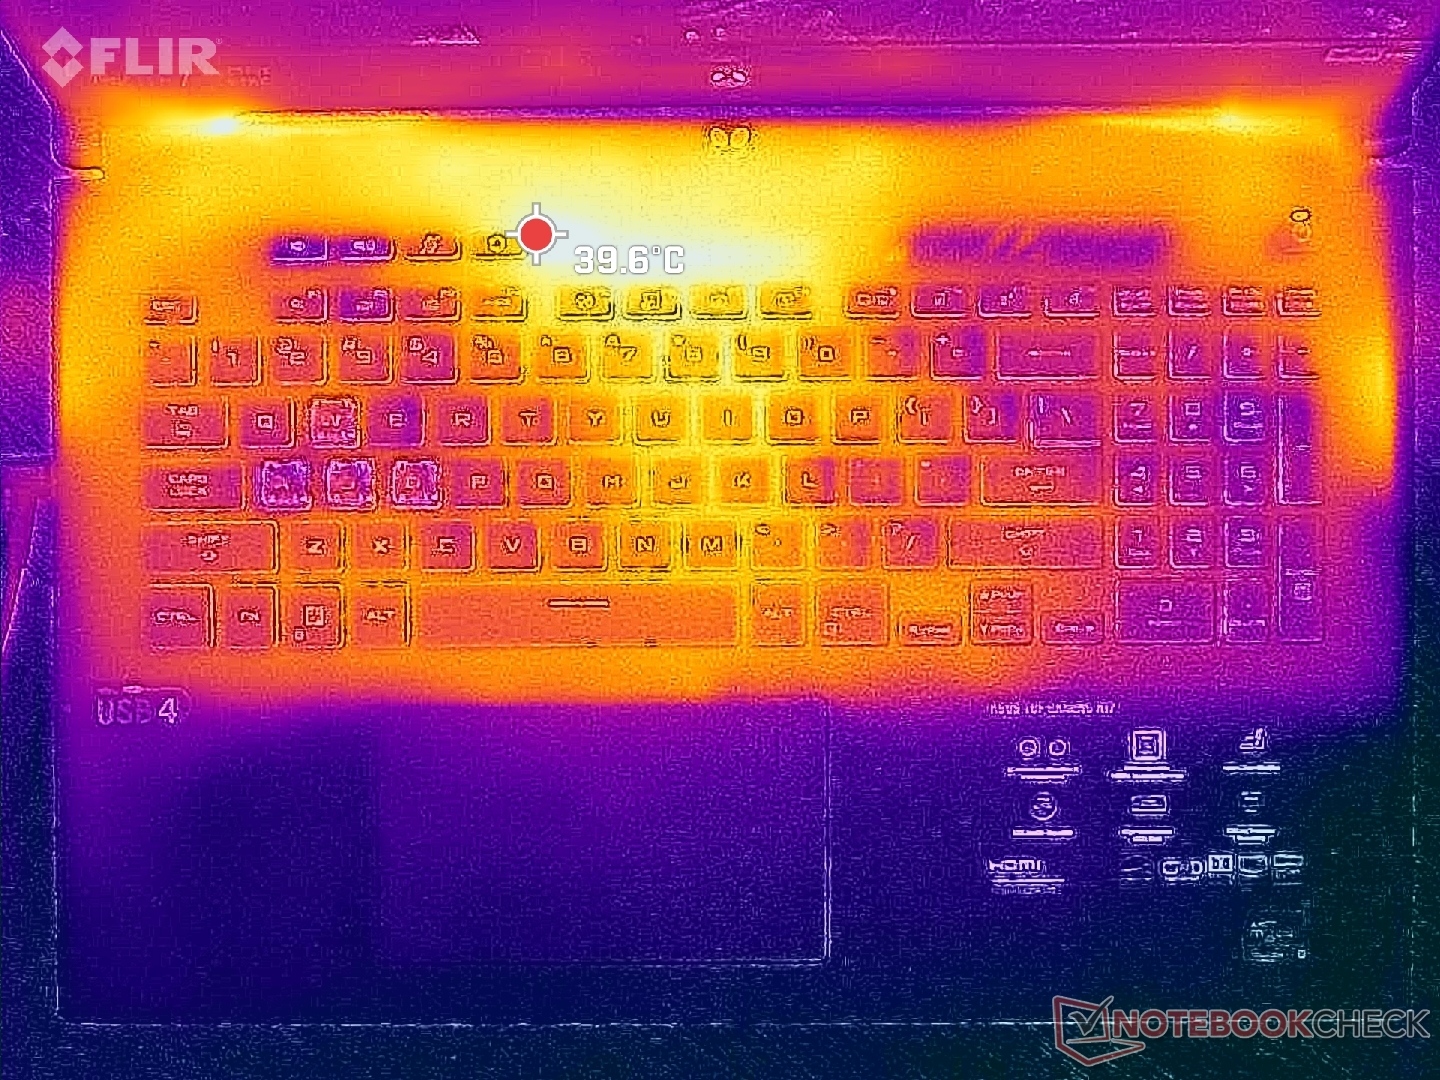
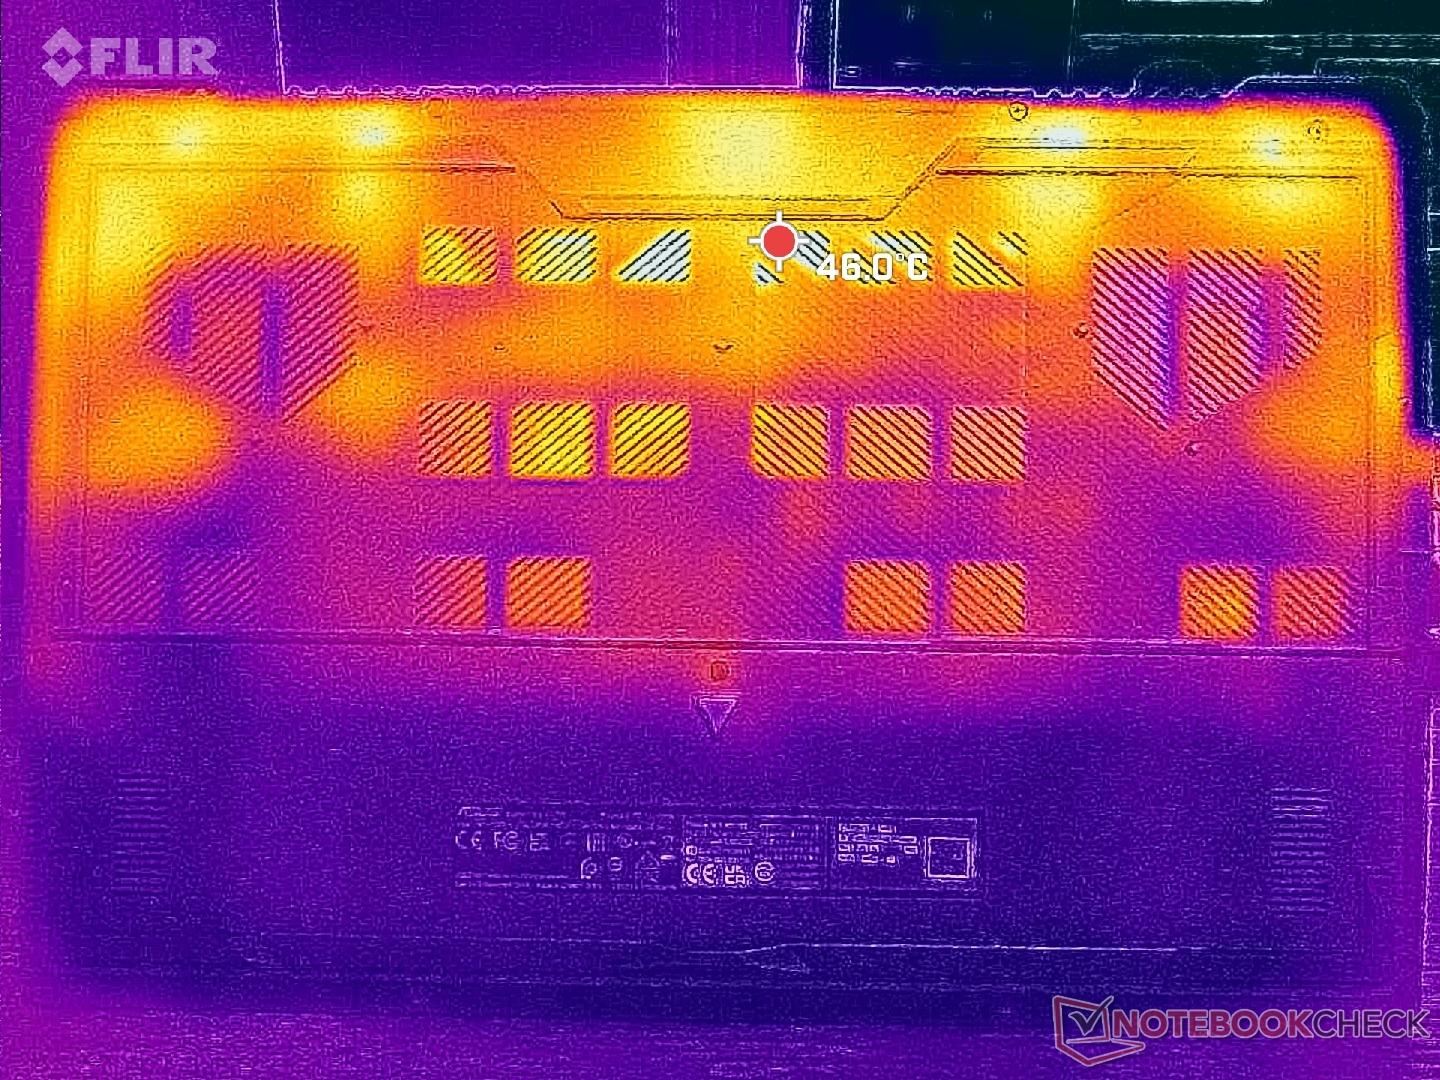
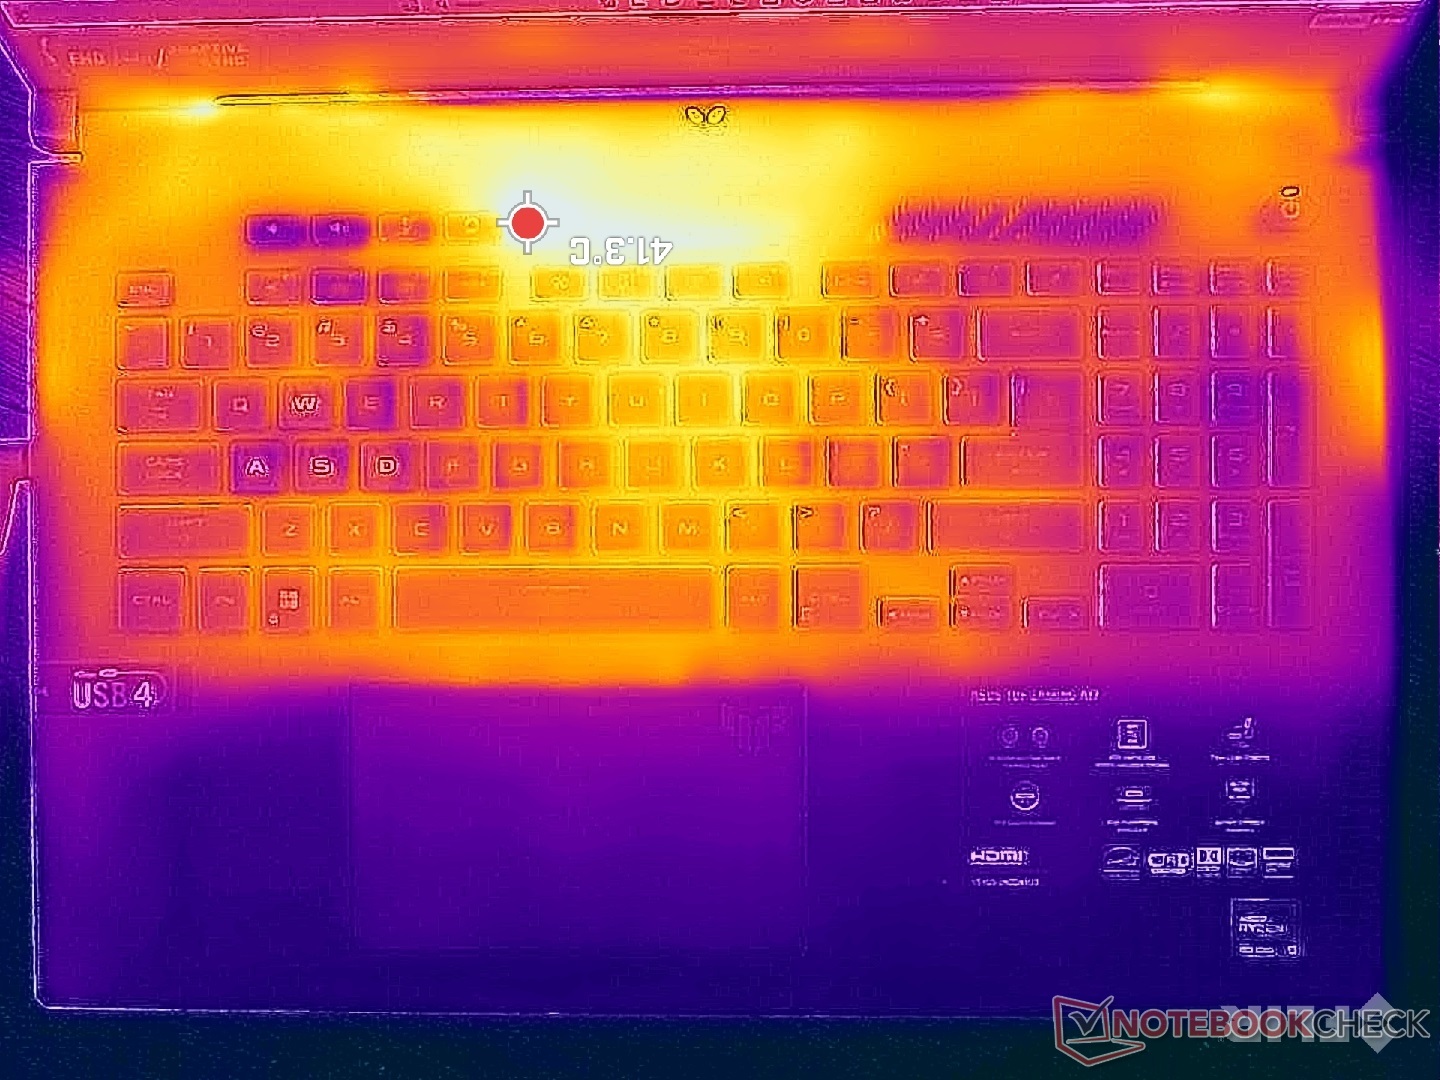
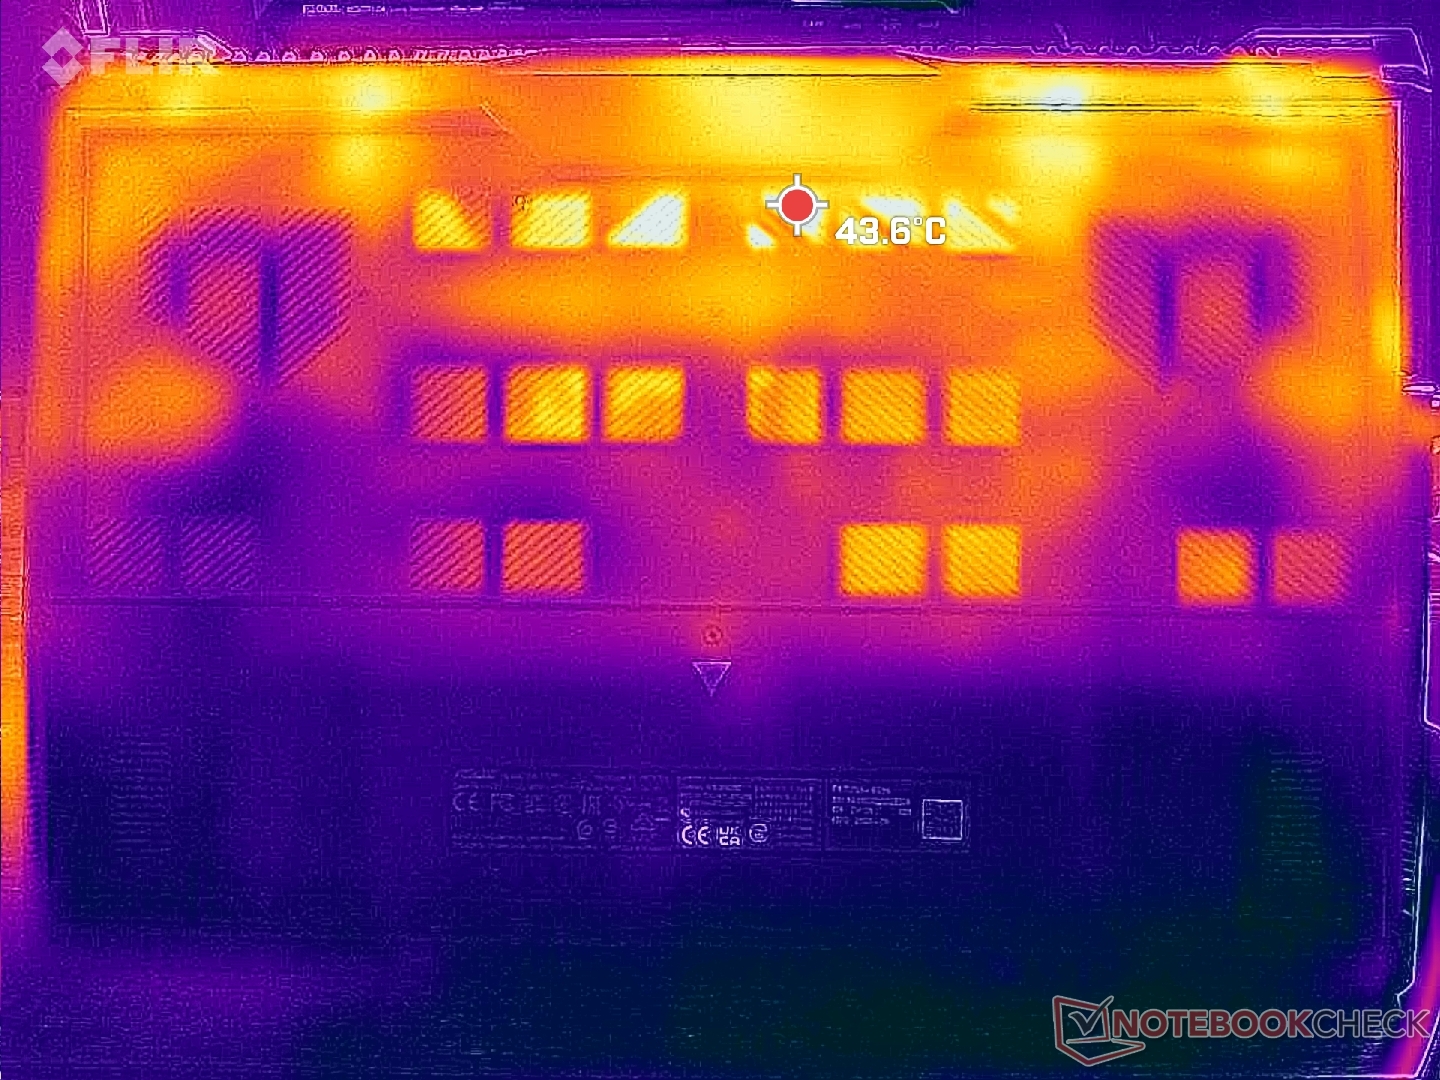
Les températures de surface sont moins élevées que sur la plupart des autres ordinateurs portables de jeu, en grande partie grâce aux matériaux plastiques de la base et aux nombreuses grilles d'aération. Par exemple, la température moyenne de la surface de notre Asus lors d'un jeu n'atteignait que 29°C, contre 39°C sur le Razer Blade 17 qui est comparativement plus fin, intègre moins de grilles d'aération et est principalement constitué d'un alliage métallique. Les points chauds de notre Asus sont également situés plus à l'arrière, là où les doigts sont moins susceptibles d'entrer en contact.
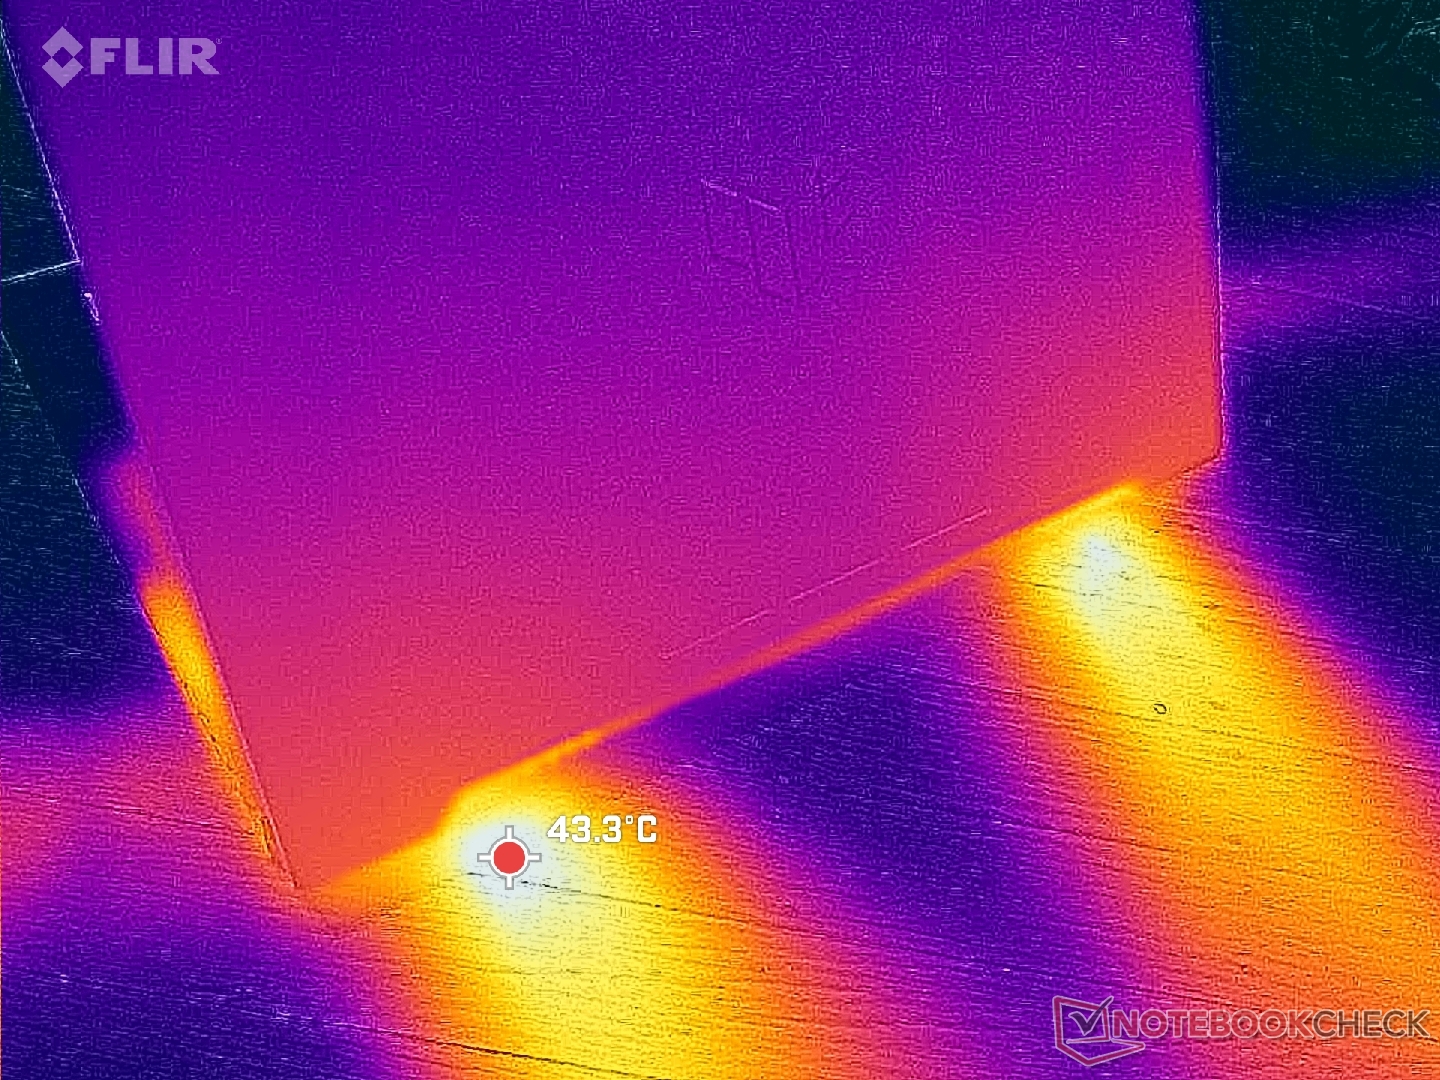

(±) La température maximale du côté supérieur est de 40 °C / 104 F, par rapport à la moyenne de 40.4 °C / 105 F, allant de 21.2 à 68.8 °C pour la classe Gaming.
(+) Le fond chauffe jusqu'à un maximum de 33.6 °C / 92 F, contre une moyenne de 43.2 °C / 110 F
(+) En utilisation inactive, la température moyenne du côté supérieur est de 23 °C / 73 F, par rapport à la moyenne du dispositif de 33.9 °C / 93 F.
(+) En jouant à The Witcher 3, la température moyenne du côté supérieur est de 29.6 °C / 85 F, alors que la moyenne de l'appareil est de 33.9 °C / 93 F.
(+) Les repose-poignets et le pavé tactile sont plus froids que la température de la peau avec un maximum de 22 °C / 71.6 F et sont donc froids au toucher.
(+) La température moyenne de la zone de l'appui-paume de dispositifs similaires était de 28.8 °C / 83.8 F (+6.8 °C / #12.2 F).
| Asus TUF Gaming A17 FA707XI-NS94 AMD Ryzen 9 7940HS, NVIDIA GeForce RTX 4070 Laptop GPU | Asus TUF Gaming F17 FX707Z-HX011W Intel Core i7-12700H, NVIDIA GeForce RTX 3060 Laptop GPU | MSI Pulse 17 B13VGK Intel Core i7-13700H, NVIDIA GeForce RTX 4070 Laptop GPU | MSI Katana 17 B13VFK Intel Core i7-13620H, NVIDIA GeForce RTX 4060 Laptop GPU | Razer Blade 17 (i7-12800H, RTX 3070 Ti) Intel Core i7-12800H, NVIDIA GeForce RTX 3070 Ti Laptop GPU | HP Pavilion Gaming 17-cd2146ng Intel Core i5-11300H, NVIDIA GeForce RTX 3050 Ti Laptop GPU | |
|---|---|---|---|---|---|---|
| Heat | -29% | -29% | -25% | -25% | -17% | |
| Maximum Upper Side * (°C) | 40 | 52 -30% | 48 -20% | 41.6 -4% | 43 -8% | 44 -10% |
| Maximum Bottom * (°C) | 33.6 | 47 -40% | 50 -49% | 43.1 -28% | 44 -31% | 48 -43% |
| Idle Upper Side * (°C) | 26.6 | 31 -17% | 30 -13% | 32 -20% | 32 -20% | 27 -2% |
| Idle Bottom * (°C) | 24.4 | 31 -27% | 33 -35% | 35.8 -47% | 34 -39% | 27 -11% |
* ... Moindre est la valeur, meilleures sont les performances
Test de stress
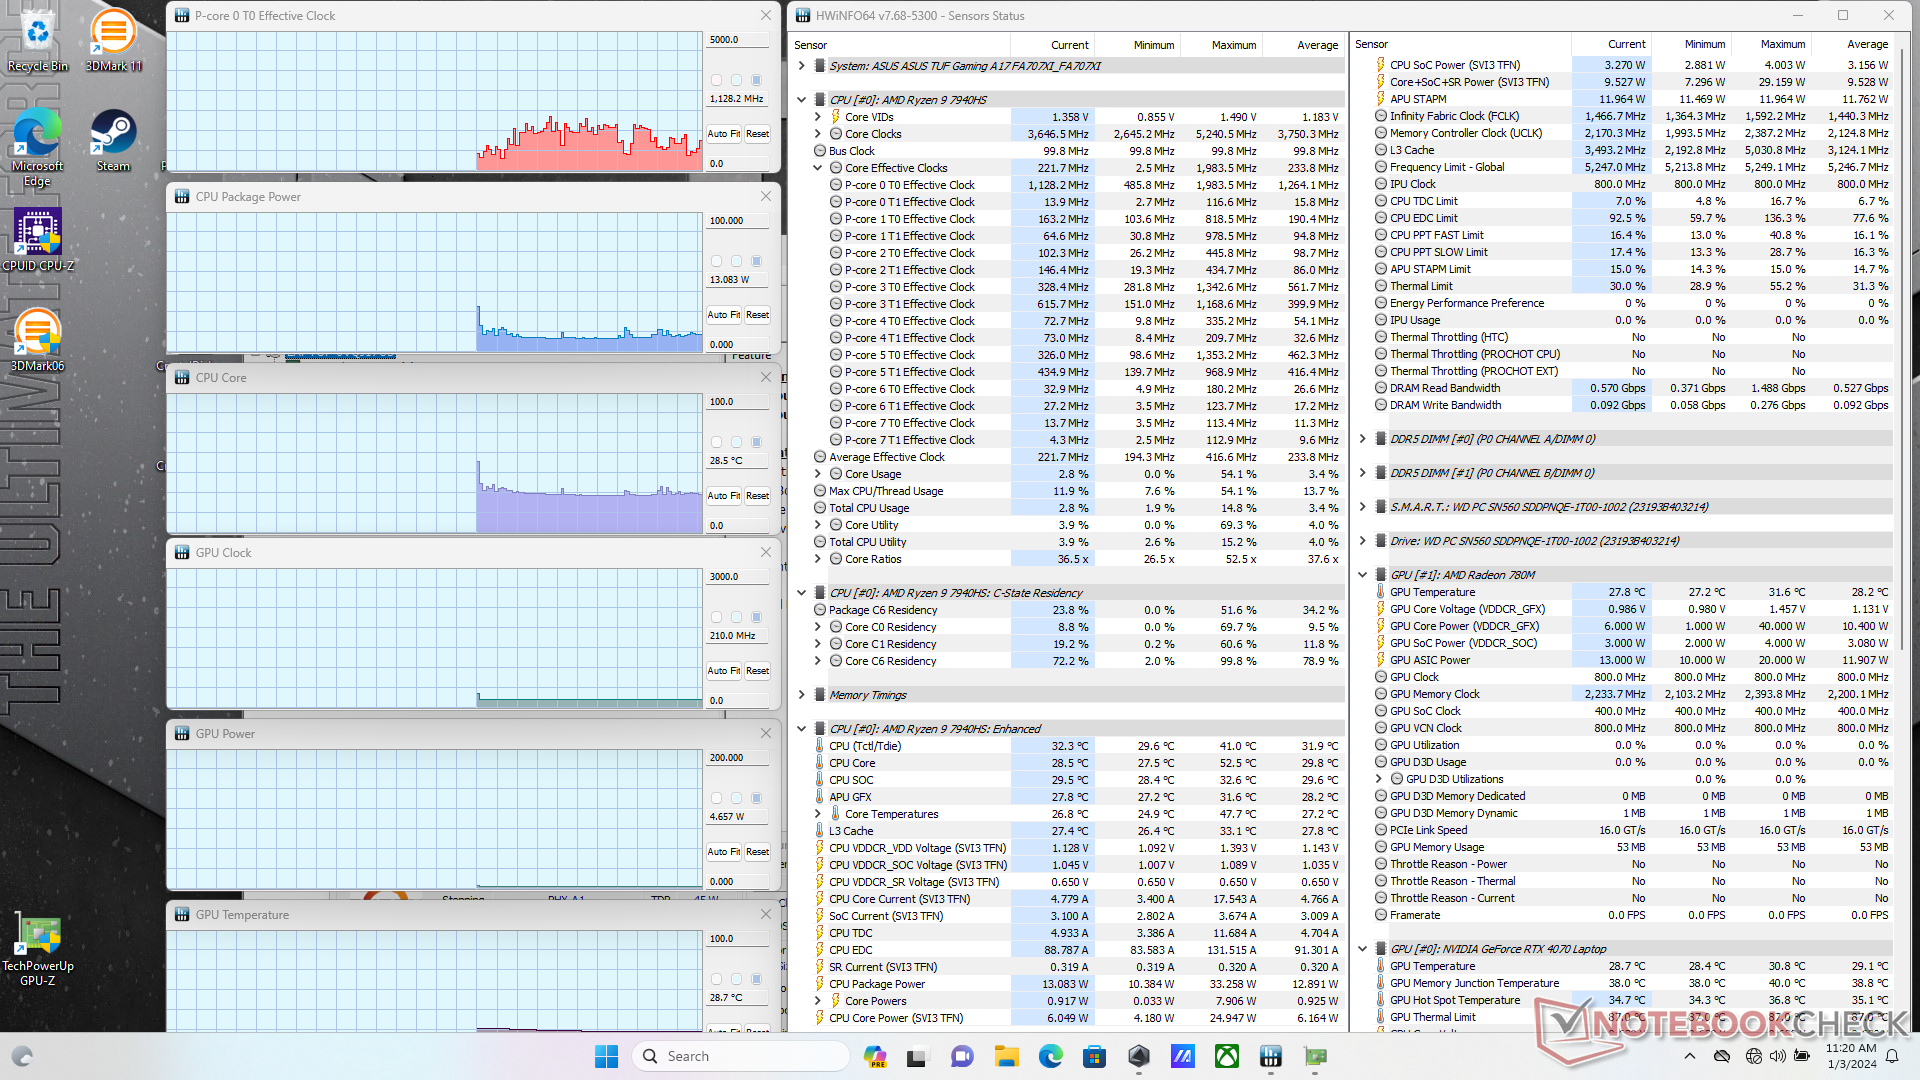
Lorsqu'il est sollicité sous Prime95, le CPU atteint 4,8 GHz avant de redescendre légèrement et de se stabiliser à 4,5 GHz, 80 W et 82 C.
Le GPU se stabilise à 2505 MHz pour le cœur, 2025 MHz pour la RAM et 106 W en mode Turbo Witcher 3 le GPU se stabilise à 2505 MHz pour le cœur, 2025 MHz pour la RAM et 106 W en mode Turbo, alors qu'en mode Performance, ces valeurs sont ramenées à 2325 MHz, 2000 MHz et 95 W, respectivement. Le mode Performance entraîne donc une légère baisse des performances graphiques, comme indiqué dans la section "Performances du GPU" ci-dessus. Notez que le GPU et surtout le CPU sont nettement plus chauds en mode Turbo, malgré un plafond de ventilation plus élevé en mode Turbo.
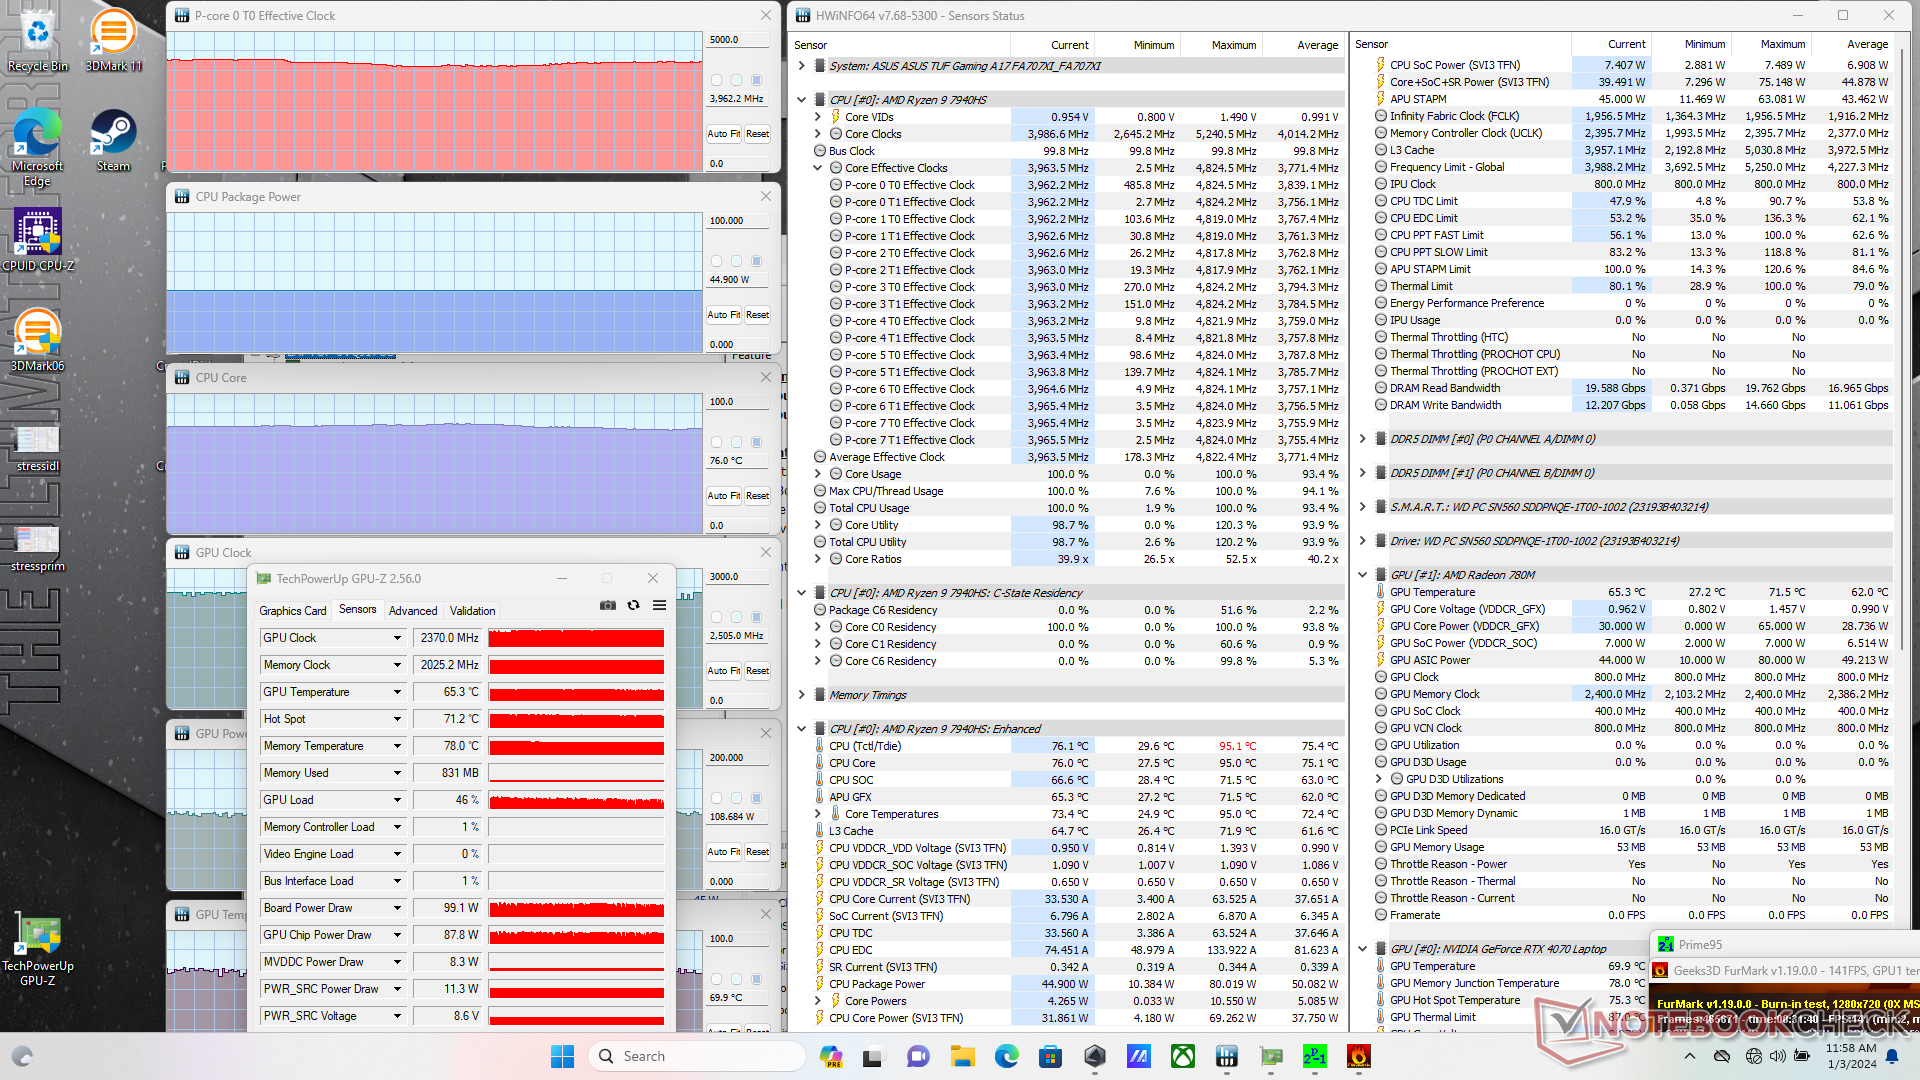
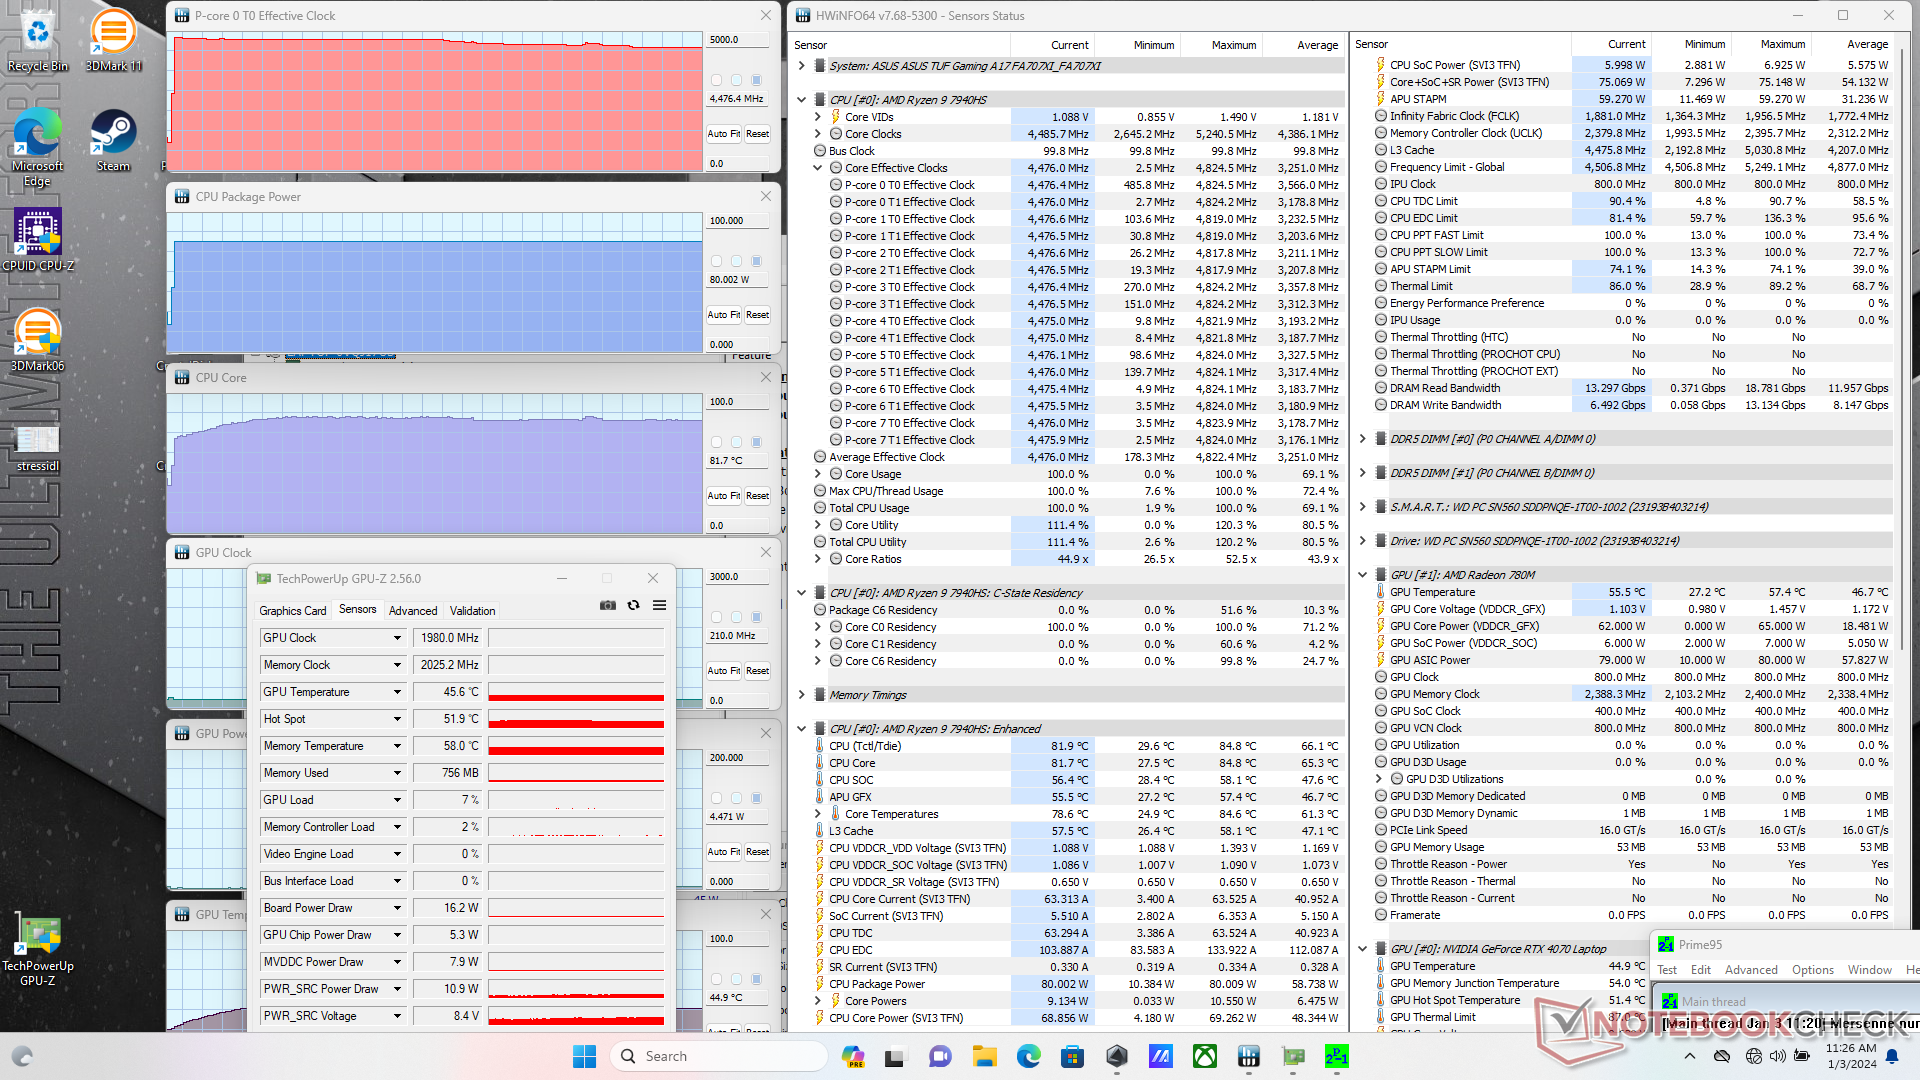
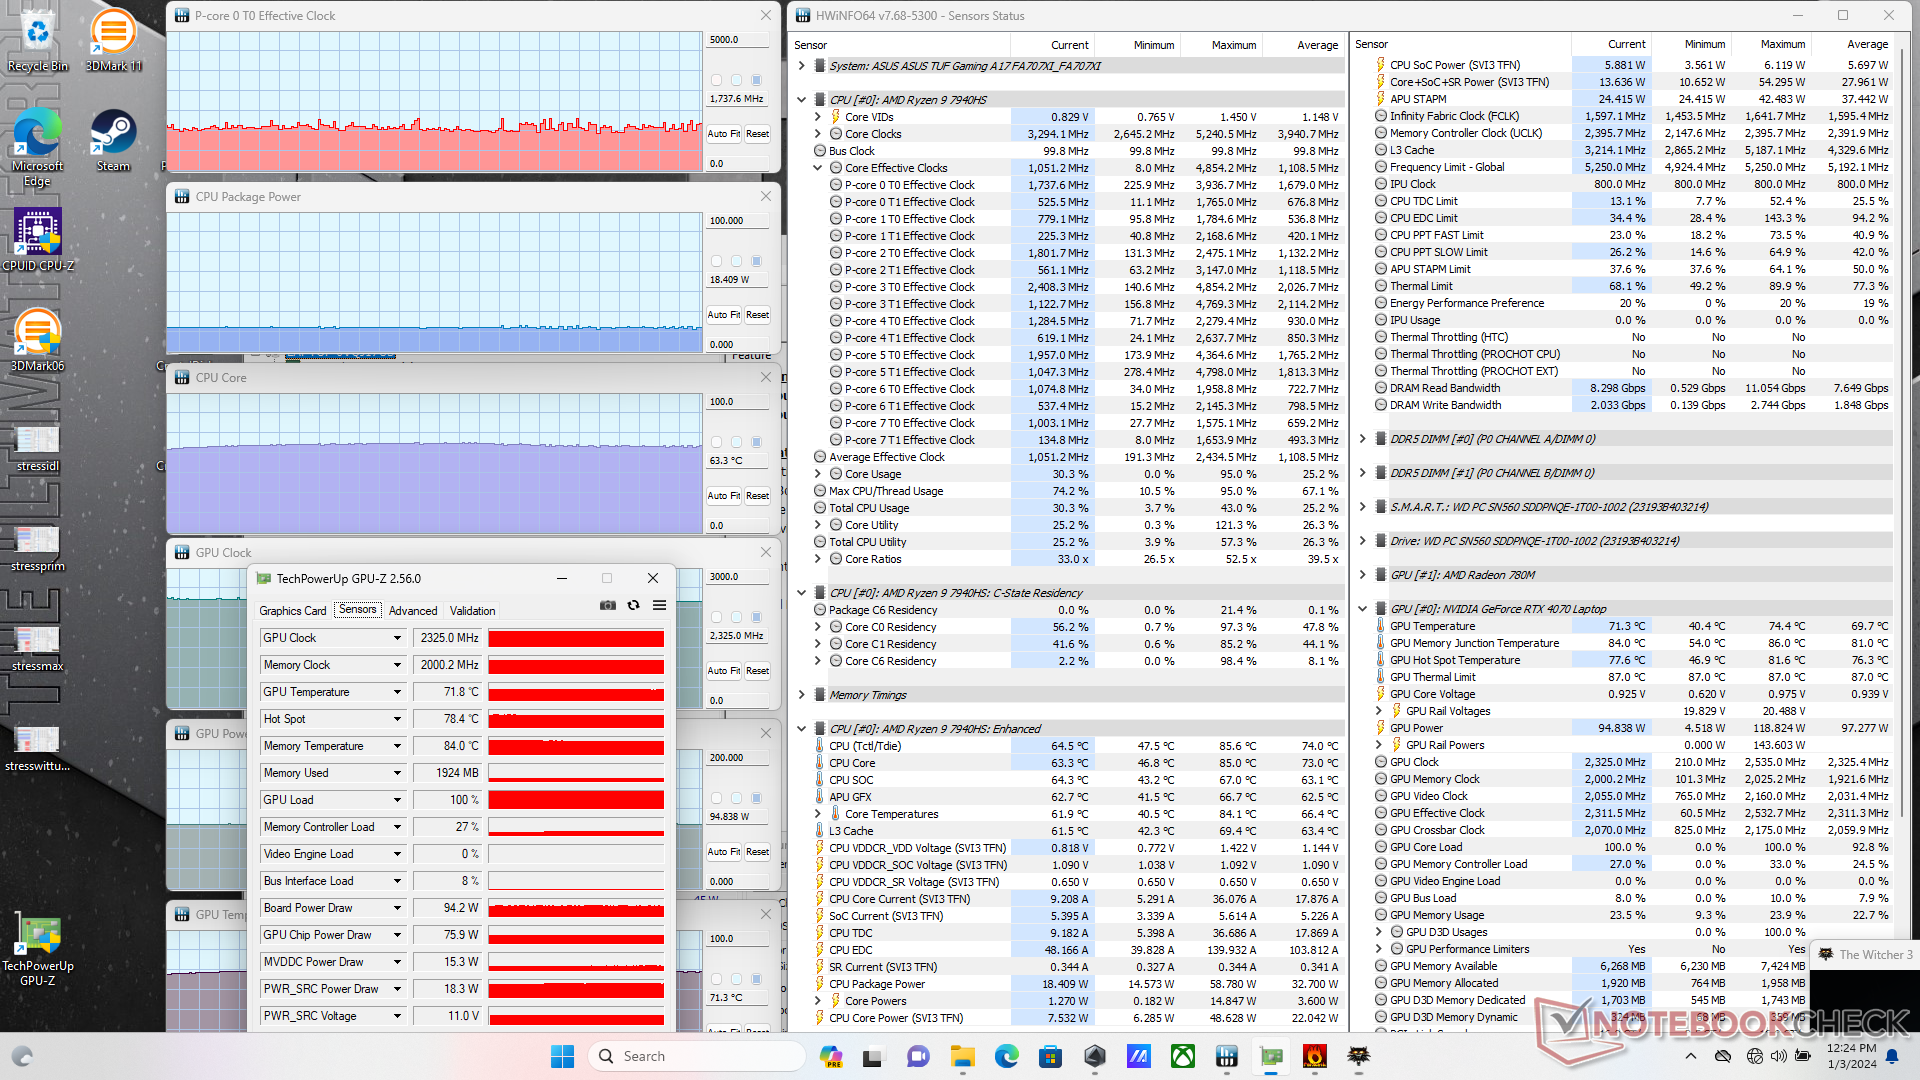
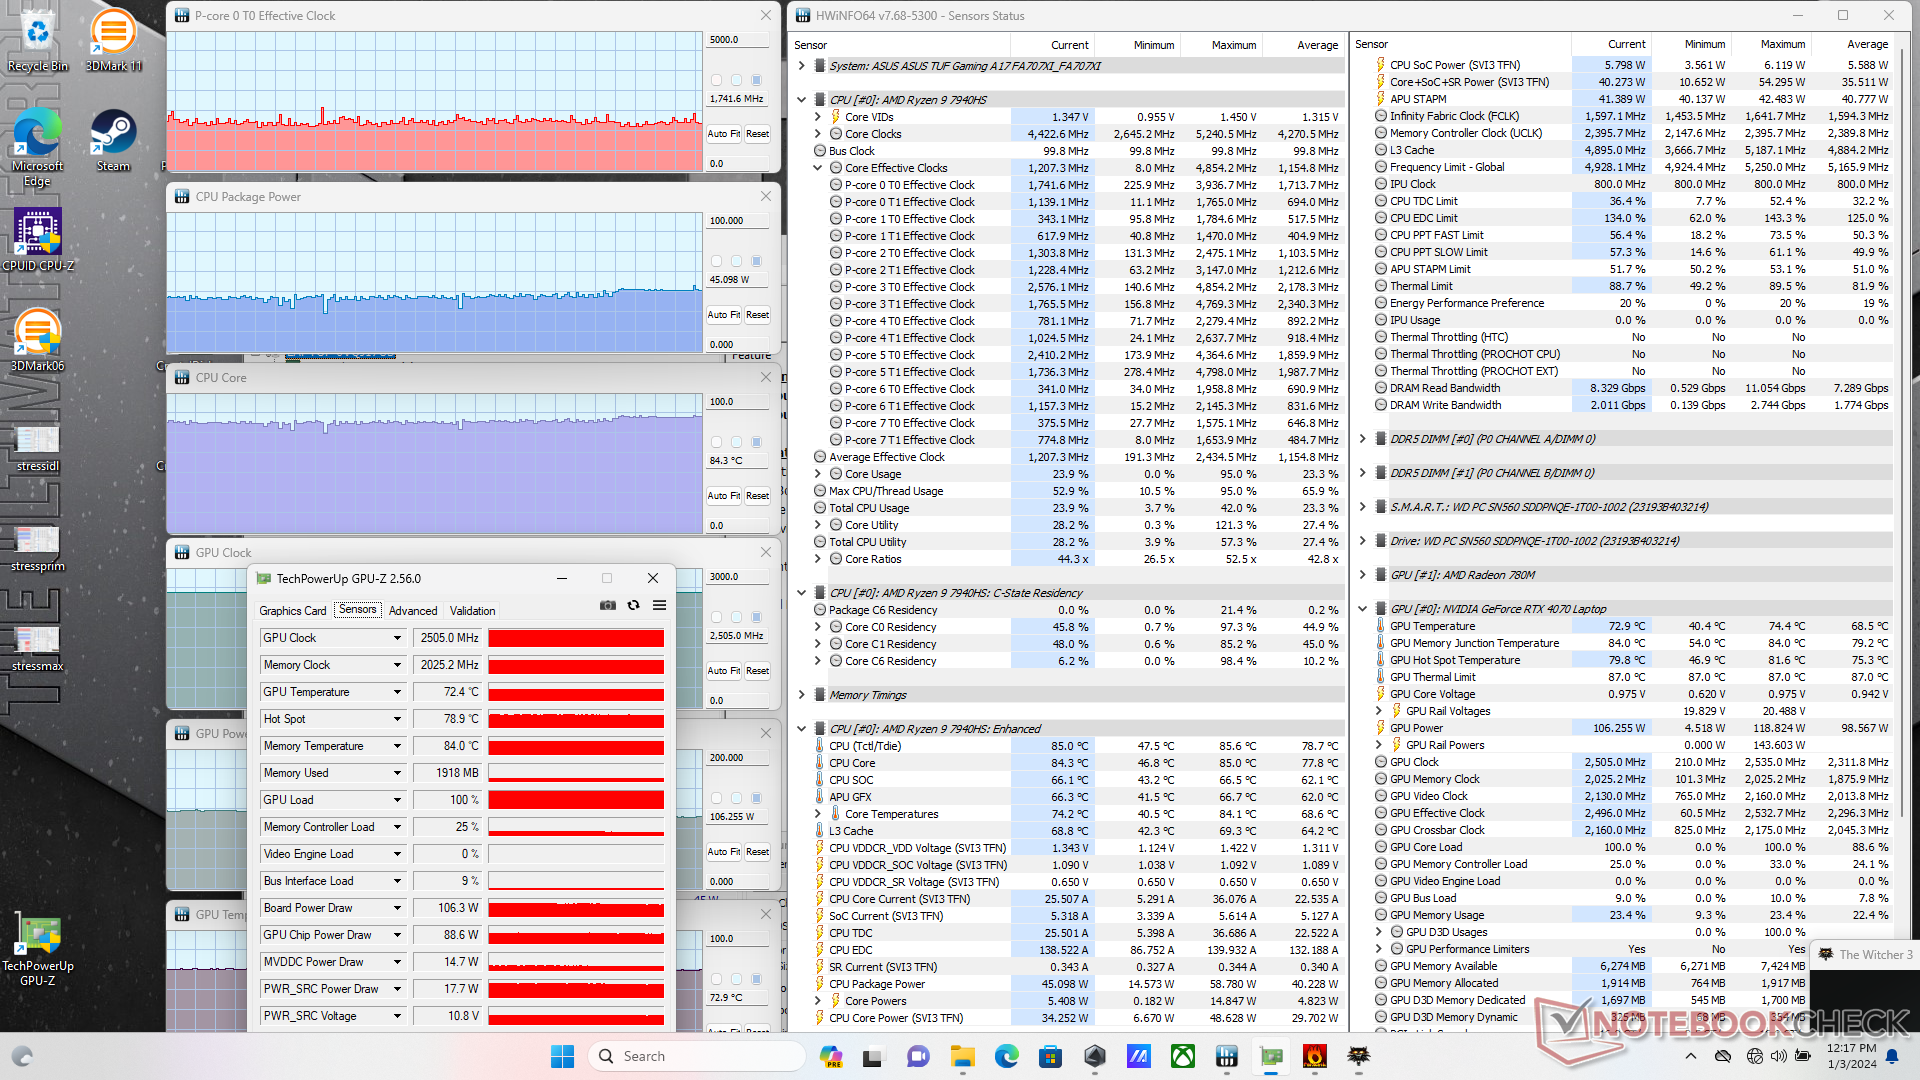
| Horloge du CPU (GHz) | Horloge du GPU (MHz) | Température moyenne du CPU (°C) | Température moyenne du GPU (°C) | |
| Système au repos | -- | -- | 29 | 29 |
| Prime95 Stress | 4.5 | -- | 82 | 45 |
| Prime95 + FurMark Stress | 4.0 | 2370 | 76 | 70 |
| Witcher 3 Stress (mode Performance) | ~1.7 | 2325 | 63 | 71 |
| Witcher 3 Stress (modeTurbo) | ~1.7 | 2505 | 84 | 73 |
Intervenants
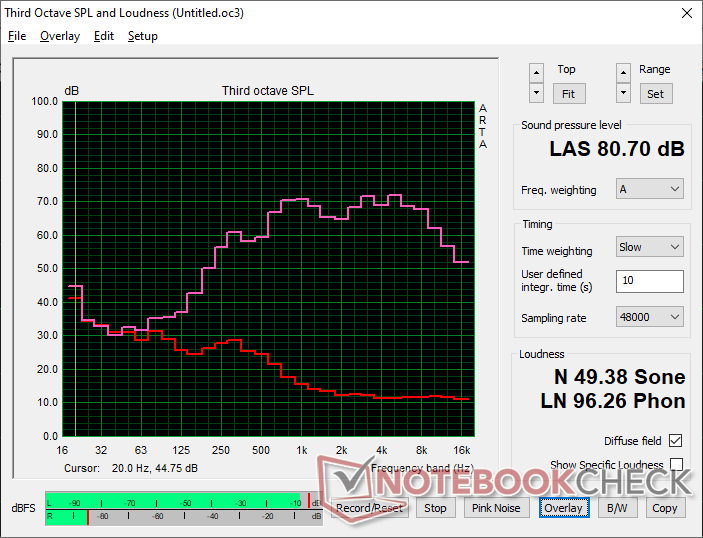
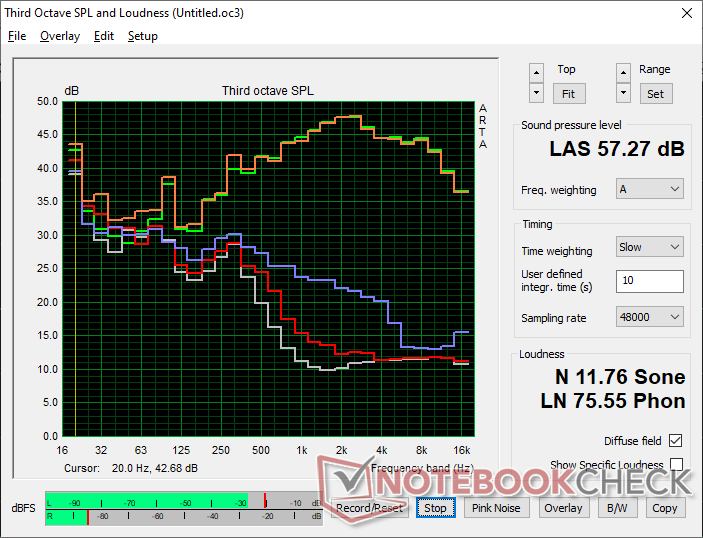
Asus TUF Gaming A17 FA707XI-NS94 analyse audio
(±) | le niveau sonore du haut-parleur est moyen mais bon (80.7# dB)
Basses 100 - 315 Hz
(-) | presque aucune basse - en moyenne 17.7% plus bas que la médiane
(±) | la linéarité des basses est moyenne (8.4% delta à la fréquence précédente)
Médiums 400 - 2000 Hz
(+) | médiane équilibrée - seulement 3.7% de la médiane
(+) | les médiums sont linéaires (5.1% delta à la fréquence précédente)
Aiguës 2 - 16 kHz
(+) | des sommets équilibrés - à seulement 4.4% de la médiane
(+) | les aigus sont linéaires (6.2% delta à la fréquence précédente)
Globalement 100 - 16 000 Hz
(±) | la linéarité du son global est moyenne (17.3% de différence avec la médiane)
Par rapport à la même classe
» 47% de tous les appareils testés de cette catégorie étaient meilleurs, 12% similaires, 41% pires
» Le meilleur avait un delta de 6%, la moyenne était de 18%, le pire était de 132%.
Par rapport à tous les appareils testés
» 32% de tous les appareils testés étaient meilleurs, 8% similaires, 59% pires
» Le meilleur avait un delta de 4%, la moyenne était de 23%, le pire était de 134%.
Apple MacBook Pro 16 2021 M1 Pro analyse audio
(+) | les haut-parleurs peuvent jouer relativement fort (84.7# dB)
Basses 100 - 315 Hz
(+) | bonne basse - seulement 3.8% loin de la médiane
(+) | les basses sont linéaires (5.2% delta à la fréquence précédente)
Médiums 400 - 2000 Hz
(+) | médiane équilibrée - seulement 1.3% de la médiane
(+) | les médiums sont linéaires (2.1% delta à la fréquence précédente)
Aiguës 2 - 16 kHz
(+) | des sommets équilibrés - à seulement 1.9% de la médiane
(+) | les aigus sont linéaires (2.7% delta à la fréquence précédente)
Globalement 100 - 16 000 Hz
(+) | le son global est linéaire (4.6% différence à la médiane)
Par rapport à la même classe
» 0% de tous les appareils testés de cette catégorie étaient meilleurs, 0% similaires, 100% pires
» Le meilleur avait un delta de 5%, la moyenne était de 17%, le pire était de 45%.
Par rapport à tous les appareils testés
» 0% de tous les appareils testés étaient meilleurs, 0% similaires, 100% pires
» Le meilleur avait un delta de 4%, la moyenne était de 23%, le pire était de 134%.
Gestion de l'énergie
Consommation électrique
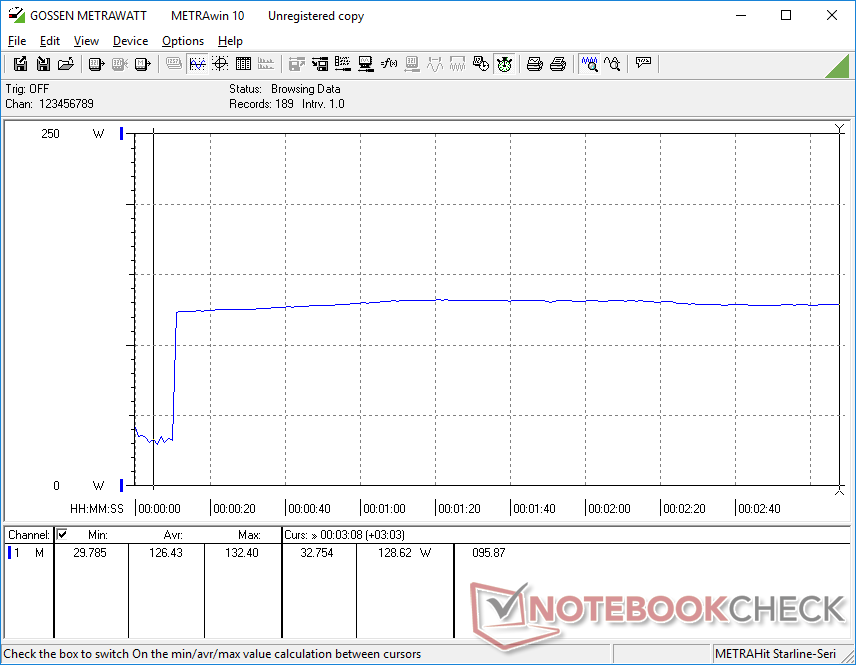
La consommation d'énergie peut descendre jusqu'à 6 W en mode économie d'énergie avec le dGPU désactivé. Si la luminosité est maximale et que le dGPU est activé, la consommation peut atteindre 22 W, soit deux fois plus que le TUF Gaming F17 ou le Pulse 17 dans des conditions similaires. Il est donc important de mettre le système en mode iGPU si la durée de vie de la batterie est primordiale.
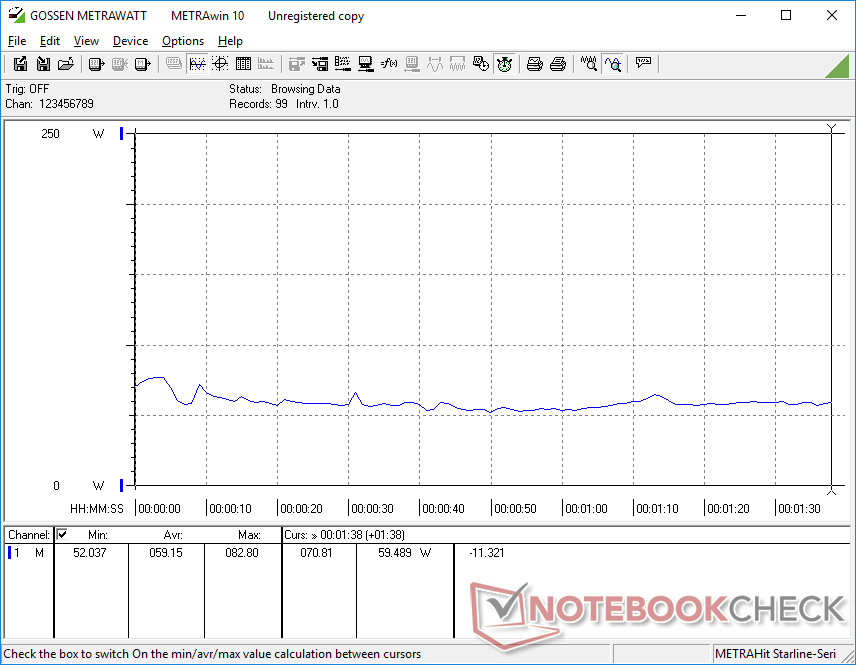
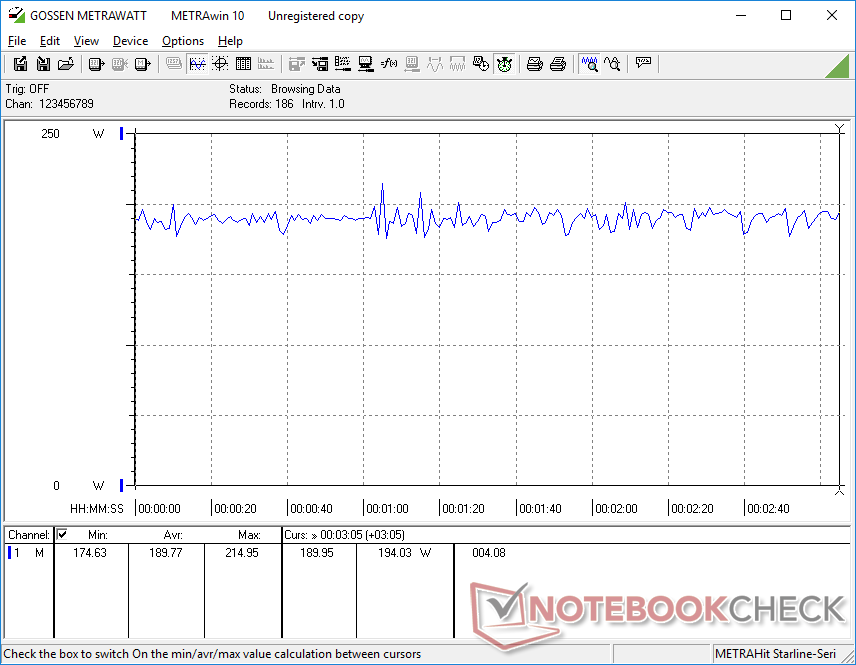
Faire tourner Witcher 3 en mode Turbo consommerait jusqu'à 190 W, soit près de 60 W de plus que la MSI Pulse 17 avec le même GPU GeForce RTX 4070. La consommation tomberait à 150 W en mode Performance. Bien que généralement plus exigeant que les ordinateurs portables de jeu avec l'ancienne RTX 3060, les gains de performance compensent largement.
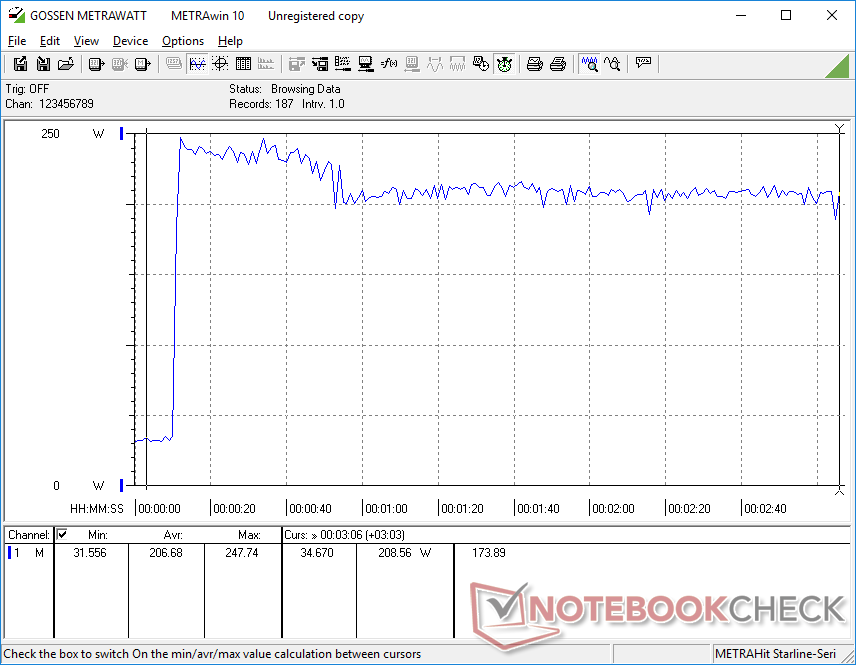
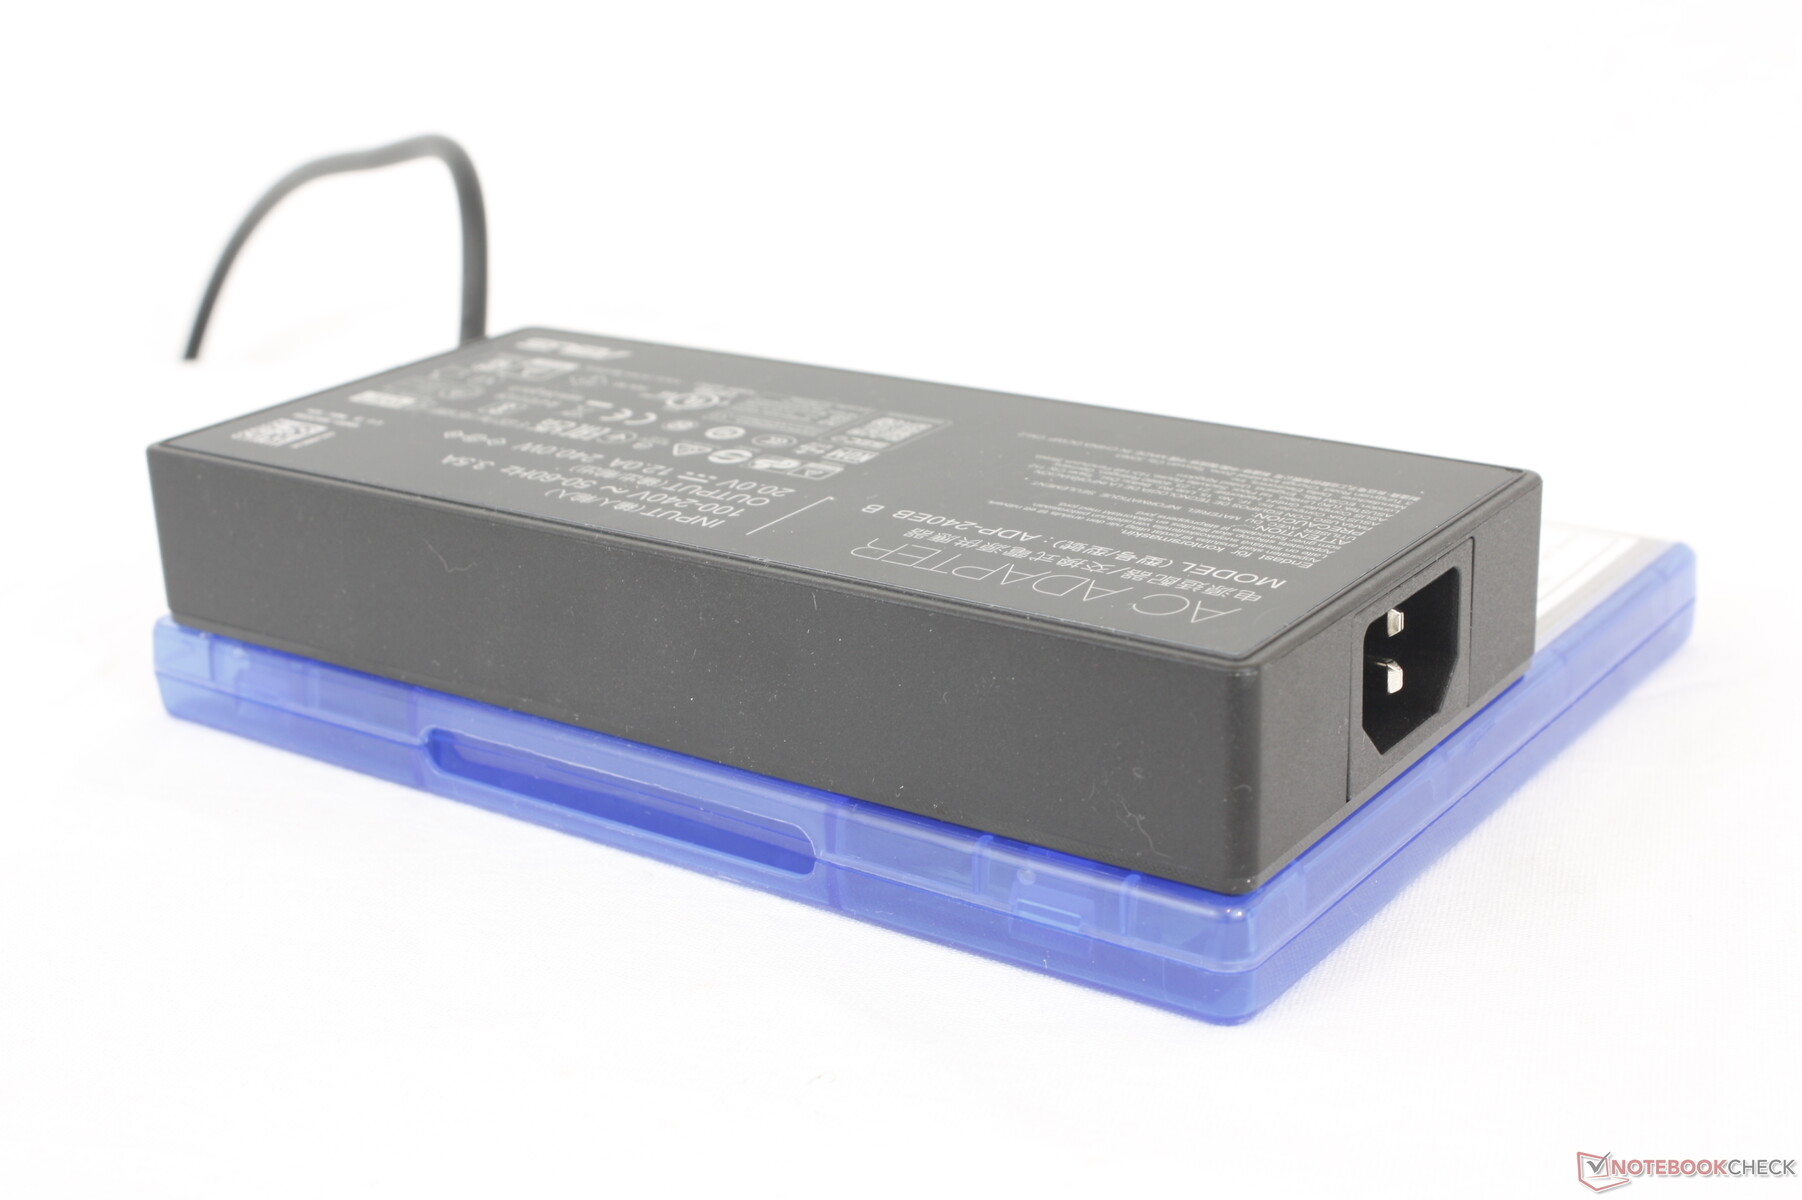
Nous avons pu mesurer une consommation maximale de 248 W sur l'adaptateur secteur 240 W de taille moyenne (~16,5 x 7,6 x 2,5 cm) lorsque le CPU et le GPU sont tous deux utilisés à 100 %. Ce taux ne dure qu'environ 30 secondes, comme le montre la capture d'écran ci-dessous, en raison des limitations thermiques.
| Éteint/en veille | |
| Au repos | |
| Fortement sollicité |
|
Légende:
min: | |
| Asus TUF Gaming A17 FA707XI-NS94 R9 7940HS, GeForce RTX 4070 Laptop GPU, WD PC SN560 SDDPNQE-1T00, IPS, 1920x1080, 17.3" | Asus TUF Gaming F17 FX707Z-HX011W i7-12700H, GeForce RTX 3060 Laptop GPU, SK Hynix HFM001TD3JX013N, IPS, 1920x1080, 17.3" | MSI Pulse 17 B13VGK i7-13700H, GeForce RTX 4070 Laptop GPU, Micron 2400 MTFDKBA1T0QFM, IPS, 1920x1080, 17.3" | MSI Katana 17 B13VFK i7-13620H, GeForce RTX 4060 Laptop GPU, Micron 2400 MTFDKBA1T0QFM, IPS LED, 1920x1080, 17.3" | Razer Blade 17 (i7-12800H, RTX 3070 Ti) i7-12800H, GeForce RTX 3070 Ti Laptop GPU, Samsung PM9A1 MZVL21T0HCLR, IPS, 2560x1440, 17.3" | HP Pavilion Gaming 17-cd2146ng i5-11300H, GeForce RTX 3050 Ti Laptop GPU, SK Hynix BC711 512GB HFM512GD3GX013N, IPS, 1920x1080, 17.3" | |
|---|---|---|---|---|---|---|
| Power Consumption | 4% | 13% | -8% | -40% | 21% | |
| Idle Minimum * (Watt) | 6.2 | 6.6 -6% | 9 -45% | 12.2 -97% | 14.4 -132% | 3 52% |
| Idle Average * (Watt) | 21.8 | 8.3 62% | 10.2 53% | 14.9 32% | 20 8% | 8 63% |
| Idle Maximum * (Watt) | 22 | 11.8 46% | 10.8 51% | 15.8 28% | 21.5 2% | 28 -27% |
| Load Average * (Watt) | 59.2 | 119 -101% | 72 -22% | 85.22 -44% | 119 -101% | 88 -49% |
| Witcher 3 ultra * (Watt) | 189.7 | 169 11% | 130 31% | 151.1 20% | 218 -15% | 98.2 48% |
| Load Maximum * (Watt) | 247.8 | 222 10% | 221 11% | 212.8 14% | 248 -0% | 152 39% |
* ... Moindre est la valeur, meilleures sont les performances
Power Consumption Witcher 3 / Stresstest
Power Consumption external Monitor
Autonomie de la batterie
Les durées d'exécution sont essentiellement identiques à celles du TUF Gaming F17, malgré un processeur et un GPU plus rapides. La navigation WLAN en particulier peut durer un peu plus de 9 heures, ce qui est très impressionnant pour un grand ordinateur portable de jeu de 17,3 pouces. Bien sûr, les utilisateurs doivent se rappeler de fonctionner en mode iGPU afin d'atteindre de telles durées d'utilisation.
Le chargement de la batterie vide à la pleine capacité prend un peu moins de 90 minutes avec l'adaptateur secteur propriétaire inclus. Le chargement avec des adaptateurs USB-C tiers est plus lent, mais néanmoins pris en charge.
| Asus TUF Gaming A17 FA707XI-NS94 R9 7940HS, GeForce RTX 4070 Laptop GPU, 90 Wh | Asus TUF Gaming F17 FX707Z-HX011W i7-12700H, GeForce RTX 3060 Laptop GPU, 90 Wh | MSI Pulse 17 B13VGK i7-13700H, GeForce RTX 4070 Laptop GPU, 90 Wh | MSI Katana 17 B13VFK i7-13620H, GeForce RTX 4060 Laptop GPU, 53.5 Wh | Razer Blade 17 (i7-12800H, RTX 3070 Ti) i7-12800H, GeForce RTX 3070 Ti Laptop GPU, 82 Wh | HP Pavilion Gaming 17-cd2146ng i5-11300H, GeForce RTX 3050 Ti Laptop GPU, 52.5 Wh | |
|---|---|---|---|---|---|---|
| Autonomie de la batterie | 16% | 14% | -55% | -15% | -45% | |
| Reader / Idle (h) | 19.7 | |||||
| WiFi v1.3 (h) | 9.1 | 8.7 -4% | 9 -1% | 2.9 -68% | 5.9 -35% | 5 -45% |
| Load (h) | 1.7 | 2.3 35% | 2.2 29% | 1 -41% | 1.8 6% | |
| H.264 (h) | 7.7 | 4.9 |
Points positifs
Points négatifs
Verdict - De grandes performances pour un affichage médiocre
Le TUF Gaming A17 FA707 est l'un des ordinateurs portables de jeu de 17,3 pouces les moins chers, équipé de la carte RTX 4070 ( GeForce ). Il est d'autant plus impressionnant que le système est livré avec un CPU Zen 4 Ryzen 9, ce qui signifie que vous n'avez pas à sacrifier la performance du processeur pour le prix bas. La forte combinaison du CPU et du GPU rend ce modèle facile à recommander pour les joueurs qui veulent maximiser la performance par dollar.
Le reste de l'ordinateur portable, c'est-à-dire les processeurs, n'est pas à la hauteur des attentes. Plus précisément, la gamme de couleurs étroite et les temps de réponse moyens de l'écran pâlissent en comparaison avec les écrans des ordinateurs portables de jeu plus haut de gamme comme ceux de la série ROG. Heureusement, Asus propose plusieurs options d'affichage pour le TUF Gaming A17 avec des couleurs et des caractéristiques bien meilleures que celles de notre configuration de test. Si possible, nous vous recommandons d'échanger le CPU Ryzen 9 et l'écran 1080p médiocre de notre configuration de test pour une unité avec le CPU Ryzen 7 et l'écran 1440p. Le CPU sera peut-être un peu plus lent, mais les améliorations de la qualité d'affichage seront bien plus visibles et valent bien le coup.
L'Asus TUF Gaming A17 équilibre très bien le prix, les performances et le facteur de forme tant que vous trouvez la bonne configuration. Les SKUs avec la dalle 1080p ont des couleurs nettement moins bonnes que les options 1440p.
Parmi les autres inconvénients, citons la connectivité Wi-Fi 6 au lieu de Wi-Fi 6E, une webcam 720p basse résolution et l'absence d'éclairage RVB par touche. Toutefois, ces inconvénients n'ont pas d'impact direct sur l'expérience de jeu. Le système conserve la plupart des caractéristiques essentielles qui sont sans doute plus désirables, comme le profil fin, la longue durée de vie de la batterie et l'accessibilité des composants internes pour les mises à niveau.
Prix et disponibilité
Asus TUF Gaming A17 FA707XI-NS94
- 01/06/2024 v7 (old)
Allen Ngo
Transparency
La sélection des appareils à examiner est effectuée par notre équipe éditoriale. L'échantillon de test a été acheté gratuitement par l'auteur, à ses propres frais. Le prêteur n'a eu aucune influence sur cette évaluation et le fabricant n'a pas reçu de copie de cette évaluation avant sa publication. Il n'y avait aucune obligation de publier cet article. En tant que média indépendant, Notebookcheck n'est pas soumis à l'autorité des fabricants, des détaillants ou des éditeurs.
Voici comment Notebookcheck teste
Chaque année, Notebookcheck examine de manière indépendante des centaines d'ordinateurs portables et de smartphones en utilisant des procédures standardisées afin de garantir que tous les résultats sont comparables. Nous avons continuellement développé nos méthodes de test depuis environ 20 ans et avons établi des normes industrielles dans le processus. Dans nos laboratoires de test, des équipements de mesure de haute qualité sont utilisés par des techniciens et des rédacteurs expérimentés. Ces tests impliquent un processus de validation en plusieurs étapes. Notre système d'évaluation complexe repose sur des centaines de mesures et de points de référence bien fondés, ce qui garantit l'objectivité.Price comparison

