Notebookcheck Logo

Intel Arc B390 12 Xe3 Panther Lake iGPU

Intel Arc B390 Panther Lake iGPU

L'iGPU Intel Arc B390 (ou Arc Pro B390) Panther Lake avec 12 Xe3 est l'unité graphique intégrée la plus puissante de la série de SoC Intel Panther Lake avec 12 cœurs Xe3. Les 12 cœurs Xe3 donnent 96 CUs et 1.536 ALUs.

Jusqu'à présent, les informations ne sont basées que sur des rumeurs et des fuites. Cependant, les premiers benchmarks montrent une performance nettement accrue par rapport à la Intel Arc 140T dans Arrow Lake.

Intel lui-même indique que l'iGPU Panther Lake offre une performance >50% par rapport à Lunar Lake (Intel Arc 140V) et >40% de performance / watt par rapport à Arrow Lake H (Intel Arc 140T). Cela devrait permettre au RDNA 3.5 iGPU actuel d'AMD (AMD Radeon 890M dans les APU Strix Point) sera nettement distancé. Cependant, ils resteront probablement derrière Strix Halo (AMD Radeon 8050S).

En outre, la performance dépendra fortement du refroidissement et du TDP garanti. Cependant, la performance devrait être suffisante pour des jeux exigeants comme Anno 117 ou The Outer Worlds 2 pour des taux de rafraîchissement jouables dans des paramètres bas.

Le nouveau moteur média supporte désormais l'encodage et le décodage AV1, le décodage VVC, l'AVC 10 bits et l'eDP 1.5.

La puce est fabriquée par TSMC selon le processus moderne N3E.

Nom de codePanther Lake iGPU
iGPUIntegrated Graphics
Pipelines96 - unifiés
Raytracing Cores12
Fréquence du noyau interne2500 (Boost) MHz
AI GPU122 TOPS INT8
CacheL2: 16 Mo
Mémoire partagéeoui
APIDirectX 12_2, OpenGL 4.6, OpenCL 3.0
technologie3 nm
Displays4 Displays (max.), HDMI 2.1 FRL, DisplayPort 2.1 UHBR20
Date de présentation05.01.2026
CPU in Arc B390 Panther Lake iGPUGPU Base SpeedGPU Boost / Turbo
Intel Core Ultra X9 388H16 x 1600 MHz, 25 W? MHz2500 MHz
Intel Core Ultra X7 368H16 x 1600 MHz, 25 W? MHz2500 MHz
Intel Core Ultra X7 358H16 x 1500 MHz, 25 W? MHz2500 MHz
min. - max.? MHz2500 MHz

Benchmarks

Performance Rating - 3DMark 11 + Fire Strike + Time Spy
6.4 pt (19%)
Restrict / Search: Model: Max. age: years
3DMark - 3DMark Speed Way Score
min: 924     moyenne: 985     médian: 987 (7%)     maximum: 1040 Points
3DMark - 3DMark Steel Nomad
min: 1460     moyenne: 1595     médian: 1627 (11%)     maximum: 1667 Points
3DMark - 3DMark Steel Nomad Light
min: 6000     moyenne: 6147     médian: 6102 (14%)     maximum: 6338 Points
3DMark - 3DMark Wild Life Unlimited
45597 Points (23%)
3DMark - 3DMark Solar Bay
min: 27638     moyenne: 28679     médian: 27822 (13%)     maximum: 30578 Points
3DMark - 3DMark Fire Strike Standard Score
min: 13997     moyenne: 14231     médian: 14189 (21%)     maximum: 14605 Points
3DMark - 3DMark Fire Strike Standard Graphics
min: 16560     moyenne: 17057     médian: 17036 (16%)     maximum: 17498 Points
3DMark - 3DMark Ice Storm Graphics
341014 Points (38%)
3DMark - 3DMark Time Spy Score
min: 7270     moyenne: 7509     médian: 7497 (19%)     maximum: 7807 Points
3DMark - 3DMark Time Spy Graphics
min: 4567     moyenne: 6512     médian: 6830 (14%)     maximum: 7190 Points
107.5 -98%
...
5702 -12%
5830 -10%
5851 -10%
5869 -10%
5934 -9%
6050 -7%
6121 -6%
6206 -5%
6422 -1%
Intel Arc B390 12 Xe3 Panther Lake iGPU
6512
6745 4%
6764 4%
6867 5%
7129 9%
7284 12%
7432 14%
NVIDIA GeForce RTX 2070 Super Max-Q
7445 14%
7494 15%
7651 17%
...
NVIDIA RTX PRO 5000 Blackwell Generation Laptop
23277 257%
max:
NVIDIA GeForce RTX 5090
44789 588%
0%
100%
Restrict / Search: Model: Max. age: years
3DMark - 3DMark Ice Storm Unlimited Graphics
632405 Points (64%)
3DMark - 3DMark Ice Storm Extreme Graphics
296292 Points (35%)
3DMark - 3DMark Cloud Gate Score
min: 39015     moyenne: 43973     médian: 44418.5 (42%)     maximum: 48038 Points
3DMark - 3DMark Cloud Gate Graphics
min: 71453     moyenne: 76156     médian: 75181 (18%)     maximum: 82808 Points
3DMark - 3DMark Night Raid
47672 Points (45%)
3DMark - 3DMark Night Raid Graphics Score
73840 Points (28%)
3DMark 11 - 3DM11 Performance Score
min: 18263     moyenne: 18623     médian: 18615.5 (23%)     maximum: 19256 Points
3DMark 11 - 3DM11 Performance GPU
min: 18261     moyenne: 18469     médian: 18340 (14%)     maximum: 18819 Points
Restrict / Search: Model: Max. age: years
3DMark Vantage
3DM Vant. Perf. total +
3DMark Vantage - 3DM Vant. Perf. total
66984 Points (19%)
3DM Vant. Perf. GPU no PhysX +
3DMark Vantage - 3DM Vant. Perf. GPU no PhysX
60674 Points (33%)
Restrict / Search: Model: Max. age: years
3DMark 05 - 3DMark 05 - Standard
44482 Points (49%)
Restrict / Search: Model: Max. age: years
3DMark 06 3DMark 06 - Standard 1280x1024 +
3DMark 06
46797 Points (61%)
Unigine Valley 1.0 - Unigine Valley 1.0 DX
min: 47.9     moyenne: 50.7     médian: 50.7 (15%)     maximum: 53.5 fps
SPECviewperf 12
specvp12 sw-03 +
SPECviewperf 12 - specvp12 sw-03
76.9 fps (19%)
specvp12 snx-02 +
SPECviewperf 12 - specvp12 snx-02
3.8 fps (1%)
specvp12 showcase-01 +
SPECviewperf 12 - specvp12 showcase-01
50.3 fps (9%)
specvp12 mediacal-01 +
SPECviewperf 12 - specvp12 mediacal-01
37.3 fps (10%)
specvp12 energy-01 +
SPECviewperf 12 - specvp12 energy-01
0.7 fps (1%)
specvp12 creo-01 +
SPECviewperf 12 - specvp12 creo-01
45.5 fps (18%)
specvp12 catia-04 +
SPECviewperf 12 - specvp12 catia-04
87.2 fps (14%)
specvp12 3dsmax-05 +
SPECviewperf 12 - specvp12 3dsmax-05
103 fps (16%)
SPECviewperf 13 specvp13 sw-04 +
SPECviewperf 13 - specvp13 sw-04
86.5 fps (23%)
specvp13 snx-03 +
SPECviewperf 13 - specvp13 snx-03
6.9 fps (1%)
specvp13 showcase-02 +
SPECviewperf 13 - specvp13 showcase-02
49.6 fps (8%)
specvp13 medical-02 +
SPECviewperf 13 - specvp13 medical-02
48.8 fps (8%)
specvp13 maya-05 +
SPECviewperf 13 - specvp13 maya-05
132 fps (15%)
specvp13 energy-02 +
SPECviewperf 13 - specvp13 energy-02
11.6 fps (4%)
specvp13 creo-02 +
SPECviewperf 13 - specvp13 creo-02
78.9 fps (11%)
specvp13 catia-05 +
SPECviewperf 13 - specvp13 catia-05
129 fps (14%)
specvp13 3dsmax-06 +
SPECviewperf 13 - specvp13 3dsmax-06
101 fps (16%)
SPECviewperf 2020 specvp2020 snx-04 1080p +
SPECviewperf 2020 - specvp2020 snx-04 1080p
7.2 fps (1%)
specvp2020 medical-03 1080p +
SPECviewperf 2020 - specvp2020 medical-03 1080p
23.6 fps (7%)
specvp2020 maya-06 1080p +
SPECviewperf 2020 - specvp2020 maya-06 1080p
179 fps (19%)
specvp2020 energy-03 1080p +
SPECviewperf 2020 - specvp2020 energy-03 1080p
11.6 fps (2%)
specvp2020 creo-03 1080p +
SPECviewperf 2020 - specvp2020 creo-03 1080p
48.8 fps (17%)
specvp2020 catia-06 1080p +
SPECviewperf 2020 - specvp2020 catia-06 1080p
30.2 fps (15%)
specvp2020 3dsmax-07 1080p +
SPECviewperf 2020 - specvp2020 3dsmax-07 1080p
38.6 fps (10%)
specvp2020 snx-04 4k +
SPECviewperf 2020 - specvp2020 snx-04 4k
7.1 fps (1%)
specvp2020 medical-03 4k +
SPECviewperf 2020 - specvp2020 medical-03 4k
9.5 fps (6%)
specvp2020 maya-06 4k +
SPECviewperf 2020 - specvp2020 maya-06 4k
69.4 fps (10%)
specvp2020 energy-03 4k +
SPECviewperf 2020 - specvp2020 energy-03 4k
7.7 fps (2%)
specvp2020 creo-03 4k +
SPECviewperf 2020 - specvp2020 creo-03 4k
28.9 fps (13%)
specvp2020 catia-06 4k +
SPECviewperf 2020 - specvp2020 catia-06 4k
19.5 fps (13%)
specvp2020 3dsmax-07 4k +
SPECviewperf 2020 - specvp2020 3dsmax-07 4k
26.9 fps (9%)
Cinebench R10 Cinebench R10 Shading (32bit) +
Cinebench R10 - Cinebench R10 Shading (32bit)
11538 points (8%)
Cinebench R11.5 Cinebench R11.5 OpenGL 64 Bit +
Cinebench R11.5 - Cinebench R11.5 OpenGL 64 Bit
131.4 fps (43%)
Cinebench R15
Cinebench R15 OpenGL 64 Bit +
Cinebench R15 - Cinebench R15 OpenGL 64 Bit
min: 201     moyenne: 237.6     médian: 240 (14%)     maximum: 264.54 fps
Cinebench R15 OpenGL Ref. Match 64 Bit +
Cinebench R15 - Cinebench R15 OpenGL Ref. Match 64 Bit
97.8 % (98%)
Basemark GPU 1.2 - Basemark GPU 1.2 Vulkan Official Medium Offscreen 1080
min: 104.6     moyenne: 250.4     médian: 104.6 (3%)     maximum: 623 fps
Basemark GPU 1.2 - Basemark GPU 1.2 Vulkan Official High Offscreen 2160
3.6 fps (1%)
Geekbench 6.6 - Geekbench 6.6 GPU OpenCL
min: 55780     moyenne: 56524     médian: 56524.5 (14%)     maximum: 57288 points
Geekbench 6.6 - Geekbench 6.6 GPU Vulkan
min: 49510     moyenne: 58097     médian: 59512 (15%)     maximum: 62177 points
LuxMark v2.0 64Bit - LuxMark v2.0 Room GPU
1449 Samples/s (5%)
LuxMark v2.0 64Bit - LuxMark v2.0 Sala GPU
3930 Samples/s (7%)
ComputeMark v2.1 - ComputeMark v2.1 Result
10533 points (9%)
Power Consumption - Furmark Stress Test Power Consumption - external Monitor *
min: 56     moyenne: 60.6     médian: 61 (8%)     maximum: 63.7 Watt
0510152025303540455055606570Tooltip
Power Consumption - Cyberpunk 2077 Power Consumption 150cd *
min: 51.4     moyenne: 62.3     médian: 61.3 (17%)     maximum: 76.3 Watt
05101520253035404550556065707580Tooltip
Power Consumption - Cyberpunk 2077 Power Consumption - external Monitor *
min: 34     moyenne: 57.6     médian: 60 (8%)     maximum: 75.3 Watt
05101520253035404550556065707580Tooltip
Power Consumption - Power Efficiency - Cyberpunk 2077 ultra
min: 0.533     moyenne: 0.7     médian: 0.7 (3%)     maximum: 0.793 fps per Watt
Emissions Witcher 3 Fan Noise +
Emissions - Witcher 3 Fan Noise
36.2 dB(A) (52%)
- Amplitude des valeurs obtenues dans le benchmark avec cette carte graphique
red legend - Valeur moyenne obtenue dans le benchmark avec cette carte graphique
* Plus les chiffres sont petits, plus les performances sont élevées

Benchmarks de jeux

Les benchmarks qui suivent sont tirés de tests effectués dans nos critiques des ordinateurs portables. Les performances dépendent du type et de la quantité de mémoire graphique embaquée, mais aussi de sa fréquence, du processeur, des paramètres système, des pilotes et du système d'exploitation. Les résultats ne sont donc pas représentatifs de tous les appareils intégrant cette carte graphique. Pour plus de détails sur les résultats, cliquez sur le nombre d'images par seconde.

Anno 117: Pax Romana

Anno 117: Pax Romana

2025
Bas 1920x1080
58  fps    + Comparer
Moyen 1920x1080
42.9  fps    + Comparer
Élevé 1920x1080
30.4  fps    + Comparer
Ultra 1920x1080
17.7  fps    + Comparer
QHD 2560x1440
12.3  fps    + Comparer
» Jouable avec tous les ordinateurs portables testés avec les détails paramétrés sur Moyen.
Bas 1920x1080
104.3 111.2 176.7 ~ 131 fps    + Comparer
Moyen 1920x1080
57 57.5 58.1 ~ 58 fps    + Comparer
Élevé 1920x1080
42.4 42.5 43.8 ~ 43 fps    + Comparer
Ultra 1920x1080
28 29.4 30.4 ~ 29 fps    + Comparer
QHD 2560x1440
19.2 20.1 20.9 ~ 20 fps    + Comparer
» Jouable avec tous les ordinateurs portables testés avec les détails paramétrés sur Élevé.
Bas 1920x1080
52  fps    + Comparer
Moyen 1920x1080
43.6  fps    + Comparer
Élevé 1920x1080
33.4  fps    + Comparer
Ultra 1920x1080
17.9  fps    + Comparer
» Jouable avec tous les ordinateurs portables testés avec les détails paramétrés sur Moyen.
Bas 1920x1080
62  fps    + Comparer
Moyen 1920x1080
54.4  fps    + Comparer
Élevé 1920x1080
46.9  fps    + Comparer
Ultra 1920x1080
34.8  fps    + Comparer
QHD 2560x1440
25  fps    + Comparer
» Jouable avec tous les ordinateurs portables testés avec les détails paramétrés sur Élevé.
F1 25

F1 25

2025
Bas 1920x1080
147.8 149.8 ~ 149 fps    + Comparer
Moyen 1920x1080
121 124.1 ~ 123 fps    + Comparer
Élevé 1920x1080
92 92.8 94.8 ~ 93 fps    + Comparer
» Jouable avec tous les ordinateurs portables testés avec les détails paramétrés sur Élevé.
Additional Benchmarks
Ultra High Preset 16xAF TAA 1920x1080
28
29.6
29.9
Bas 1920x1080
34  fps    + Comparer
Moyen 1920x1080
33  fps    + Comparer
Élevé 1920x1080
29  fps    + Comparer
Ultra 1920x1080
21  fps    + Comparer
QHD 2560x1440
18  fps    + Comparer
» Les benchmarks indiquent que le jeu est injouable avec les paramètres testés.
Bas 1920x1080
267  fps    + Comparer + 📈 Graph
Moyen 1920x1080
154.2  fps    + Comparer + 📈 Graph
Élevé 1920x1080
98.8  fps    + Comparer + 📈 Graph
QHD 2560x1440
69.8  fps    + Comparer + 📈 Graph
» Jouable avec tous les ordinateurs portables testés avec les détails paramétrés sur Élevé.
Bas 1920x1080
40.1  fps    + Comparer
Moyen 1920x1080
33.1  fps    + Comparer
Élevé 1920x1080
31  fps    + Comparer
Ultra 1920x1080
25.4  fps    + Comparer
» Jouable avec tous les ordinateurs portables testés avec les détails paramétrés sur Bas.
Bas 1920x1080
42.6  fps    + Comparer
Moyen 1920x1080
34.2  fps    + Comparer
Élevé 1920x1080
33.2  fps    + Comparer
Ultra 1920x1080
29.6  fps    + Comparer
QHD 2560x1440
21.1  fps    + Comparer
» Jouable avec tous les ordinateurs portables testés avec les détails paramétrés sur Bas.
Bas 1920x1080
43 45 47 ~ 45 fps    + Comparer
Moyen 1920x1080
34 35 37 ~ 35 fps    + Comparer
Élevé 1920x1080
26 28 29 ~ 28 fps    + Comparer
Ultra 1920x1080
14 15 16 ~ 15 fps    + Comparer
QHD 2560x1440
11 11 ~ 11 fps    + Comparer
» Jouable avec tous les ordinateurs portables testés avec les détails paramétrés sur Bas.
Additional Benchmarks
low TSR 100 1280x720
51
69
71
F1 24

F1 24

2024
Bas 1920x1080
136.5 142.7 145.2 145.9 146.3 160.3 ~ 146 fps    + Comparer
Moyen 1920x1080
130.3 132.2 134.3 135 135.3 147.7 ~ 136 fps    + Comparer
Élevé 1920x1080
100 100.7 103.4 104.3 104.7 109.6 ~ 104 fps    + Comparer
Ultra 1920x1080
36.2 36.2 36.8 38 38.4 38.6 ~ 37 fps    + Comparer
QHD 2560x1440
23.8 25.2 25.4 ~ 25 fps    + Comparer
» Jouable avec tous les ordinateurs portables testés avec les détails paramétrés sur Ultra.
Bas 1920x1080
225  fps    + Comparer
Moyen 1920x1080
150.3  fps    + Comparer
Élevé 1920x1080
108.9  fps    + Comparer
Ultra 1920x1080
91.9  fps    + Comparer
QHD 2560x1440
62  fps    + Comparer
» Jouable avec tous les ordinateurs portables testés avec les détails paramétrés sur Ultra.
Bas 1920x1080
68.6 75 77.7 78.7 80.4 85.6 ~ 78 fps    + Comparer
Moyen 1920x1080
56.2 59.7 63.1 63.2 63.9 65.4 68.6 ~ 63 fps    + Comparer
Élevé 1920x1080
46.9 49.7 53.8 54 56 57.8 ~ 53 fps    + Comparer
Ultra 1920x1080
27.2 33.2 36.5 40.9 41.2 44.8 45.5 47.2 47.7 48.7 50.6 ~ 42 fps    + Comparer
QHD 2560x1440
24.7 28.3 28.9 ~ 27 fps    + Comparer
» Jouable avec la plupart des ordinateurs portables testés avec les détails paramétrés sur Ultra.
Additional Benchmarks
Low Preset (FSR off) 1280x720
110.6
94.4
121.4
116.2
Ray Tracing Ultra Preset (DLSS off) 1920x1080
20.2
16.1
21
30min Start Ultra Preset (FSR off) 1920x1080
40.1
39.1
34.2
31.4
26.1
46.3
40.6
43.9
46.3
46
Bas 1920x1080
63.8 64.3 68.2 69.2 71.4 72.3 ~ 68 fps    + Comparer + 📈 Graph
Moyen 1920x1080
47.5 52.2 52.3 55.4 60.8 62.3 ~ 55 fps    + Comparer + 📈 Graph
Élevé 1920x1080
42.7 45.7 47 49 54.3 55.6 ~ 49 fps    + Comparer + 📈 Graph
Ultra 1920x1080
42.3 44.6 44.6 48.7 50.1 53.4 54.3 ~ 48 fps    + Comparer + 📈 Graph
QHD 2560x1440
31.4 34.9 37.8 ~ 35 fps    + Comparer + 📈 Graph
» Jouable avec tous les ordinateurs portables testés avec les détails paramétrés sur Ultra.
Additional Benchmarks
Low Preset SMAA 1280x720
93.8
87
84.3
97.2
Bas 1280x720
180  fps    + Comparer
Moyen 1920x1080
87  fps    + Comparer
Élevé 1920x1080
81  fps    + Comparer
Ultra 1920x1080
66 70 ~ 68 fps    + Comparer
QHD 2560x1440
48  fps    + Comparer
» Jouable avec tous les ordinateurs portables testés avec les détails paramétrés sur Ultra.
Strange Brigade

Strange Brigade

2018
Bas 1280x720
334 359 374 384 388 400 ~ 373 fps    + Comparer
Moyen 1920x1080
121.9 130.5 132.7 136.6 138.6 141.2 ~ 134 fps    + Comparer
Élevé 1920x1080
103.3 103.3 103.4 104 107.6 116.7 ~ 106 fps    + Comparer
Ultra 1920x1080
80 90.6 95.1 99.4 99.5 101.4 ~ 94 fps    + Comparer
QHD 2560x1440
68 71.7 72.3 ~ 71 fps    + Comparer
» Jouable avec tous les ordinateurs portables testés avec les détails paramétrés sur Ultra.
Far Cry 5

Far Cry 5

2018
Bas 1280x720
142  fps    + Comparer
Moyen 1920x1080
87  fps    + Comparer
Élevé 1920x1080
79  fps    + Comparer
Ultra 1920x1080
73  fps    + Comparer
QHD 2560x1440
53  fps    + Comparer
» Jouable avec tous les ordinateurs portables testés avec les détails paramétrés sur Ultra.
Bas 1280x720
51.8 55.9 58.4 58.5 59.7 62.3 ~ 58 fps    + Comparer
Moyen 1920x1080
45.5 46.4 47.1 47.5 47.6 50.3 ~ 47 fps    + Comparer
Élevé 1920x1080
38.8 39.7 40.3 41.2 41.7 41.8 ~ 41 fps    + Comparer
» Jouable avec tous les ordinateurs portables testés avec les détails paramétrés sur Élevé.
Bas 1280x720
107.2 123.5 131.1 134.5 134.8 ~ 126 fps    + Comparer
Moyen 1920x1080
60.7 73.7 76.1 79.7 83 ~ 75 fps    + Comparer
Élevé 1920x1080
37.8 52.8 54.1 55.4 56.2 ~ 51 fps    + Comparer
QHD 2560x1440
33.8 39 41 43.1 ~ 39 fps    + Comparer
» Jouable avec tous les ordinateurs portables testés avec les détails paramétrés sur Élevé.
Bas 1280x720
108.3 112.9 119.8 129.5 135 154.5 ~ 127 fps    + Comparer
Moyen 1366x768
79.5 88 91.6 92.6 95.4 102.3 ~ 92 fps    + Comparer
Élevé 1920x1080
100.2 100.3 103.5 104 107.6 109.8 ~ 104 fps    + Comparer
Ultra 1920x1080
86.8 96.9 101.5 102.5 105.4 111.8 ~ 101 fps    + Comparer
» Jouable avec tous les ordinateurs portables testés avec les détails paramétrés sur Ultra.
Bas 1024x768
294  fps    + Comparer + 📈 Graph
Moyen 1366x768
198.8  fps    + Comparer + 📈 Graph
Élevé 1920x1080
106.5  fps    + Comparer + 📈 Graph
Ultra 1920x1080
46.6  fps    + Comparer + 📈 Graph
» Jouable avec tous les ordinateurs portables testés avec les détails paramétrés sur Ultra.
Additional Benchmarks
Medium Graphics & Postprocessing 1920x1080
123.4
GTA V

GTA V

2015
Bas 1024x768
175.9 176.7 179.4 182 ~ 179 fps    + Comparer
Moyen 1366x768
169.3 171 173 176.1 ~ 172 fps    + Comparer
Élevé 1920x1080
98.2 99.7 103.3 108.8 111.9 113.8 ~ 106 fps    + Comparer
Ultra 1920x1080
43.3 43.4 44.2 45.1 45.2 45.3 ~ 44 fps    + Comparer
QHD 2560x1440
30.6 30.9 31.5 ~ 31 fps    + Comparer
» Jouable avec tous les ordinateurs portables testés avec les détails paramétrés sur Ultra.
Additional Benchmarks
Normal/Off 4xAF 1920x1080
171.3
168.2
165.2
172.7
Lowest Settings possible 1920x1080
175.2
172
170.7
180
BasMoyenÉlevéUltraQHD4K
Anno 117: Pax Romana5842.930.417.712.3
ARC Raiders13158432920
The Outer Worlds 25243.633.417.9
Battlefield 66254.446.934.825
F1 2514912393
Assassin's Creed Shadows3433292118
Civilization 7267154.298.869.8
Monster Hunter Wilds40.133.13125.4
Indiana Jones and the Great Circle42.634.233.229.621.1
Black Myth: Wukong4535281511
F1 241461361043725
Total War Pharaoh225150.3108.991.962
Cyberpunk 20777863534227
Baldur's Gate 36855494835
Shadow of the Tomb Raider18087816848
Strange Brigade3731341069471
Far Cry 514287797353
X-Plane 11.11584741
Final Fantasy XV Benchmark126755139
Dota 2 Reborn12792104101
The Witcher 3294198.8106.546.6
GTA V1791721064431
BasMoyenÉlevéUltraQHD4K
< 30 fps
< 60 fps
< 120 fps
≥ 120 fps

7
3
12

10
5
7
2
10
10
7
6
5
8
5
3


Pour plus de jeux susceptibles d'être fluides avec cette carte graphique et obtenir une liste exhaustive de tous les jeux et cartes graphiques testés, consultez notre liste des jeux.

v1.35
log 11. 20:06:44

#0 ran 1s before starting gpusingle class +0s ... 0s

#1 no ids found in url (should be separated by "_") +0s ... 0s

#2 not redirecting to Ajax server +0s ... 0s

#3 did not recreate cache, as it is less than 5 days old! Created at Fri, 10 Apr 2026 05:31:15 +0200 +0.004s ... 0.004s

#4 composed specs +0.021s ... 0.025s

#5 did output specs +0s ... 0.025s

#6 start showIntegratedCPUs +0s ... 0.025s

#7 getting avg benchmarks for device 13268 +0.065s ... 0.091s

#8 got single benchmarks 13268 +0.028s ... 0.119s

#9 got avg benchmarks for devices +0s ... 0.119s

#10 min, max, avg, median took s +5.197s ... 5.316s

#11 before gaming benchmark output +0.001s ... 5.316s

#12 Got 465 rows for game benchmarks. +0.142s ... 5.458s

#13 composed SQL query for gamebenchmarks +0s ... 5.458s

#14 got data and put it in $dataArray +0.02s ... 5.478s

#15 benchmarks composed for output. +0.469s ... 5.947s

#16 no comparison url found in template nbc.compare_page_1 needed +0.134s ... 6.081s

#17 return log +0s ... 6.081s

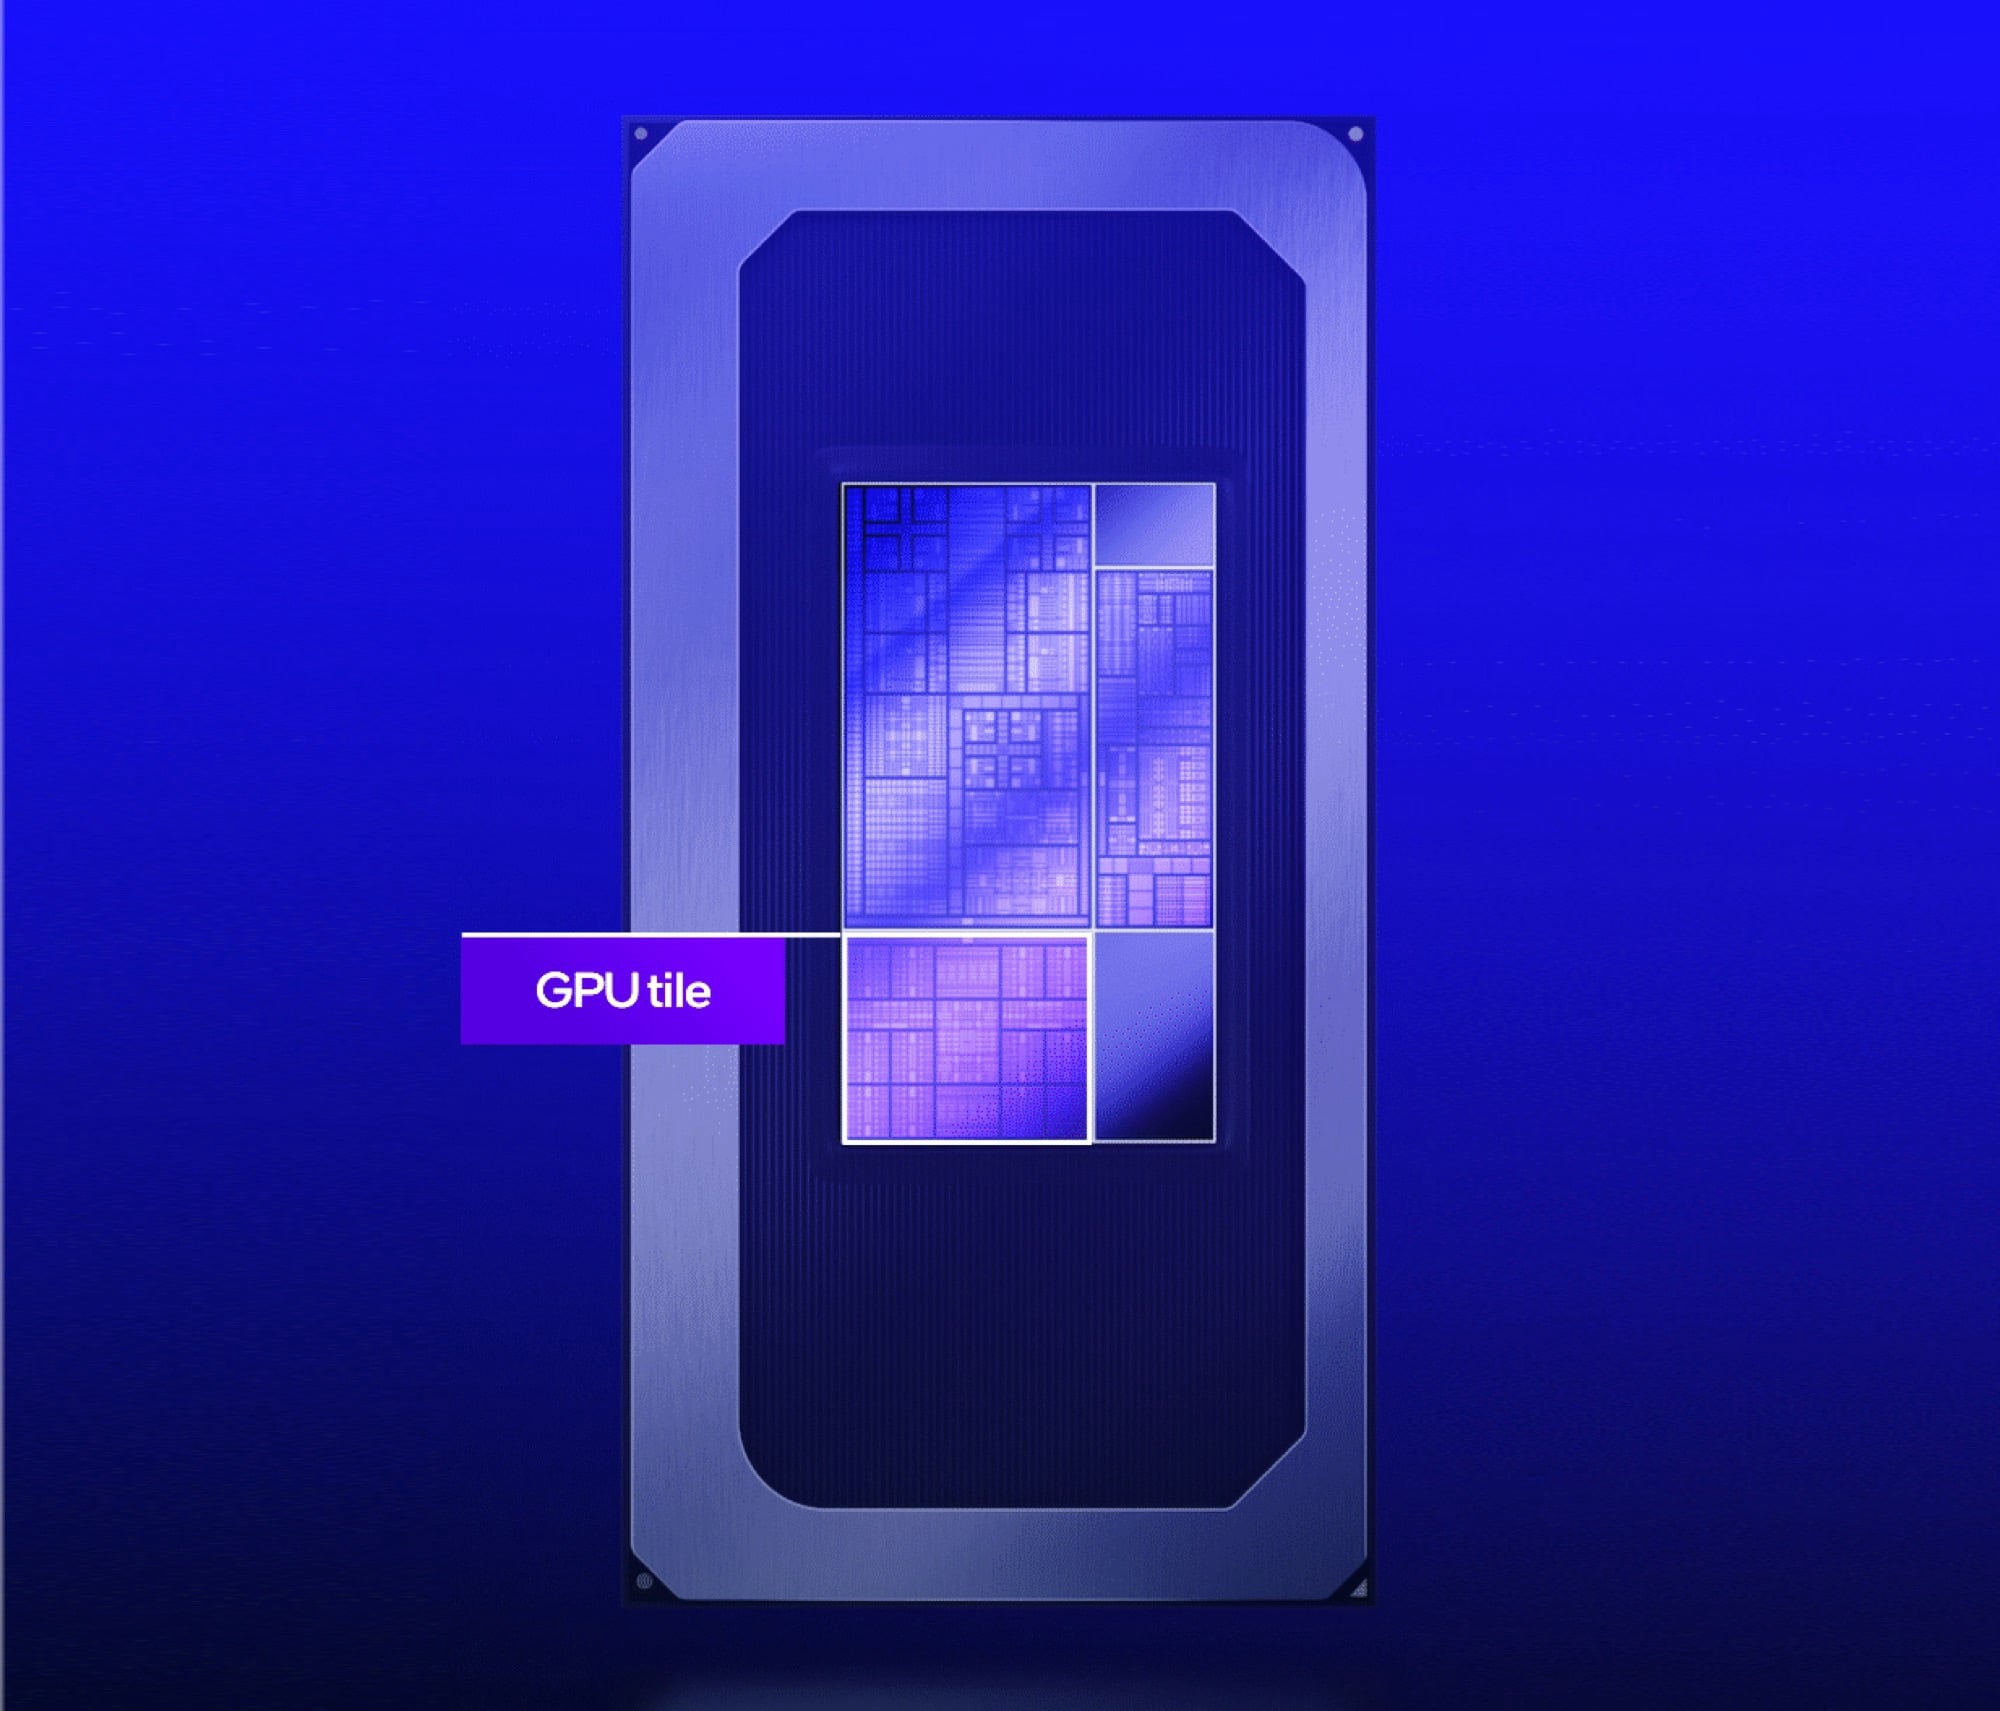
Testés dans les ordinateurs portables : Intel Arc B390 12 Xe3 Panther Lake iGPU carte graphique

Khadas Mind Pro

Test du Khadas Mind Pro : Mini PC haut de gamme avec Core Ultra X7 et Arc graphics parfait pour l'écosystème Khadas

Khadas élargit la série Mind avec le Mind Pro et s'appuie sur la dernière génération de processeurs Intel. Dans notre test, nous examinons de plus près la variante avec Intel Core Ultra X7 358H, analysons les performances à l'aide de benchmarks complets, et examinons également les performances en combinaison avec Mind Graphics 2.
Intel Core Ultra X7 358H, Arc B390 Panther Lake iGPU, 566 g
Test du MSI Prestige 14 Flip AI+ : près de 20h d'autonomie pour ce convertible Panther Lake

Test du MSI Prestige 14 Flip AI+ : près de 20h d'autonomie pour ce convertible Panther Lake

Avec la Prestige 14 Flip AI+, MSI présente un convertible compact de 14 pouces doté d'un processeur Panther Lake rapide et d'un stylet intégré. Cependant, l'écran OLED 60 Hz intégré est très sombre et ne prend pas en charge le HDR.
Intel Core Ultra X7 358H, Arc B390 Panther Lake iGPU, 14", 1.4 kg
Test du Dell XPS 14 2026 : une renaissance totale avec Intel Panther Lake X7

Test du Dell XPS 14 2026 : une renaissance totale avec Intel Panther Lake X7

La série XPS a connu quelques difficultés, mais le dernier XPS 14 Panther Lake remet la famille sur les rails pour être beaucoup plus facile à recommander que n'importe quel prédécesseur récent.
Intel Core Ultra X7 358H, Arc B390 Panther Lake iGPU, 14", 1.4 kg
Test de l'Asus ExpertBook Ultra : entrée fracassante du Panther Lake X7 d'Intel dans la cour des grands

Test de l'Asus ExpertBook Ultra : entrée fracassante du Panther Lake X7 d'Intel dans la cour des grands

Asus et Intel commencent l'année en force avec le lancement du Core Ultra X7 358H. Bien qu'il s'agisse techniquement d'un ordinateur portable destiné aux entreprises, les performances graphiques et les performances par watt sont incroyables pour un ordinateur de 14 pouces.
Intel Core Ultra X7 358H, Arc B390 Panther Lake iGPU, 14", 1.1 kg
Analyse des performances et de l'efficacité de l'Intel Arc B390 (image : Intel)

Test de performances de l'Intel Panther Lake Arc B390 : le nouvel iGPU Intel contre la GeForce RTX 4050

Les nouveaux processeurs Panther Lake d'Intel n'offrent pas seulement plus de performances au niveau du CPU, mais utilisent surtout une carte graphique intégrée très rapide. L'Arc B390 est environ 70 % plus rapide que les précédents iGPU et peut même suivre le GPU pour ordinateur portable GeForce RTX 4050.
Intel Core Ultra X9 388H, Arc B390 Panther Lake iGPU, 14", 1.7 kg

Asus ZenBook Duo UX8407AA: Intel Core Ultra X9 388H, 14.00", 1.7 kg
  Critique » Test de performances de l'Intel Panther Lake Core Ultra X9 388H : surpasse Arrow Lake et dépasse Zen 5 en efficacité

  Critique » Test de l'Asus ZenBook Duo UX8407 : Intel Panther Lake change la donne

HP OmniBook X 16 (2026): Intel Core Ultra X7 358H, 16.00", 2.1 kg
  Autres tests » HP OmniBook X 16 (2026)

Acer Swift Go 16 AI SFG16-171: Intel Core Ultra X9 388H, 16.00", 1.3 kg
  Autres tests » Acer Swift Go 16 AI SFG16-171

HP EliteBook X G2i 14 NG AI: Intel Core Ultra X7 358H, 14.00", 1 kg
  Autres tests » HP EliteBook X G2i 14 NG AI

Asus ZenBook Duo UX8407AA: Intel Core Ultra X9 388H, 14.00", 1.7 kg
  Autres tests » Asus ZenBook Duo UX8407AA

Acer Swift 16 AI SF16-71T: Intel Core Ultra X9 388H, 16.00", 1.6 kg
  Autres tests » Acer Swift 16 AI SF16-71T

Asus ExpertBook Ultra B9406CAA: Intel Core Ultra X7 358H, 14.00", 1.1 kg
  Autres tests » Asus ExpertBook Ultra B9406CAA

MSI Prestige 14 Flip AI+ 2026: Intel Core Ultra X7 358H, 14.00", 1.4 kg
  Autres tests » MSI Prestige 14 Flip AI+ 2026

Samsung Galaxy Book6 Pro NP960XJG-KG6DE: Intel Core Ultra X7 358H, 16.00", 1.6 kg
  Autres tests » Samsung Galaxy Book6 Pro NP960XJG-KG6DE

Khadas Mind Pro: Intel Core Ultra X7 358H, 0.6 kg
   » Le mini PC Khadas Mind Pro devient plus cher : le prix de précommande n'est valable que jusqu'au 27 mars

   » Revue du mini-PC Khadas Mind Pro : Du PC de bureau à la console de jeu avec le GPU RTX de GeForce

Asus ZenBook Duo UX8407AA: Intel Core Ultra X9 388H, 14.00", 1.7 kg
   » Le nouveau Zenbook Duo UX8407 d'Asus est sans conteste le meilleur convertible à double écran

Dell XPS 14 Core Ultra X7 358H: Intel Core Ultra X7 358H, 14.00", 1.4 kg
   » Dell XPS 14 Arc B390 vs. GeForce RTX 4050 : les comparaisons 3DMark ne disent pas tout

   » Veillez à lire le manuel d'entretien du Dell XPS 14 avant d'ouvrir le modèle 2026

   » 2026 Le Dell XPS 14 corrige certains des plus grands reproches faits à la série

Samsung Galaxy Book6 Pro NP960XJG-KG6DE: Intel Core Ultra X7 358H, 16.00", 1.6 kg
   » Samsung Galaxy Book6 Series Hands-On : tous les modèles, les prix et la date de lancement

Asus ExpertBook Ultra B9406CAA: Intel Core Ultra X7 358H, 14.00", 1.1 kg
   » Core Ultra X7 358H vs. Core Ultra 7 255H : Panther Lake ralentit moins et offre des performances plus constantes

   » Arc B390 vs Radeon 8060S : Deux GPU très différents pour un même écran de 14 pouces

Asus ZenBook Duo UX8407AA: Intel Core Ultra X9 388H, 14.00", 1.7 kg
   » Pas de chance pour AMD : Intel Panther Lake Core Ultra X9 388H bat AMD Strix Halo à faible consommation signalant la domination des jeux portables en 2026

Asus ExpertBook Ultra B9406CAA: Intel Core Ultra X7 358H, 14.00", 1.1 kg
   » L'Asus ExpertBook Ultra est aussi rapide que de nombreux ordinateurs portables de jeu d'entrée de gamme tout en étant deux fois plus petit

Please share our article, every link counts!
Mail Logo

Rang 1

Rang 2

GeForce RTX 2080 Super Mobile
RTX PRO 2000 Blackwell Generation Laptop
M5 Max 32-Core GPU *
M1 Max 32-Core GPU *
M1 Max 24-Core GPU *
GeForce RTX 2070 Super Mobile
Radeon 8050S
Radeon RX 5700M *
M1 Pro 16-Core GPU *
Radeon PRO W6600M *
GeForce RTX 2070 Super Max-Q
RTX PRO 1000 Blackwell Generation Laptop *
M1 Pro 14-Core GPU *
GeForce GTX 1070 Mobile
Radeon 8040S *
Pro A60M *

Rang 3

Arc 140T
Radeon RX 580X (Laptop) *
Radeon RX 580 (Laptop)
Pro A30M
Radeon Pro 5300M
Radeon RX 5300M
Radeon RX 570X (Laptop) *
Radeon RX 570 (Laptop) *
GeForce GTX 1050 Ti Mobile
GeForce GTX 1050 Ti Max-Q
Radeon 680M
Quadro P2000 Max-Q
Arc 130T
GeForce GTX 1050 Max-Q
Radeon 660M
Radeon RX 560X (Laptop)
Radeon RX 560 (Laptop)
Radeon Pro 560X
Radeon Pro 560
Quadro P620
Radeon RX 550X (Laptop)
Radeon Pro 555X
Radeon Pro 555
Quadro P600
Graphics 3-Core iGPU (Arrow Lake) *
Radeon Pro WX 2100 *
Graphics 2-Core iGPU (Arrow Lake) *
Radeon 630
Quadro P520
Radeon RX 540X *
Radeon 540X *
Quadro P500 *
Vega 10
Vega 9
Iris Plus Graphics G7 (Ice Lake 64 EU) *
UHD Graphics 32EUs
UHD Graphics 750
Vega 7
UHD Graphics Xe 32EUs (Tiger Lake-H)
UHD Graphics Xe G4 48EUs
Vega 8
UHD Graphics 730
Iris Plus Graphics G4 (Ice Lake 48 EU)
UHD Graphics 24EUs (Alder Lake-N) *
Radeon 610M *
UHD Graphics Xe 16EUs (Tiger Lake-H) *
UHD Graphics G1 (Ice Lake 32 EU)
Adreno 690 *
Adreno 685 *
Adreno 680 *

Rang 4

* Position approximative de la carte graphique

Klaus Hinum, 2026-01-12 (Update: 2026-01-12)