Critiques du Intel Core Ultra 9 285H processeur
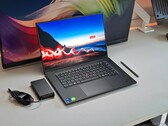
Test du Lenovo ThinkPad T1g Gen 8 : un digne successeur du ThinkPad X1 Extreme
Le ThinkPad T1g Gen 8 de Lenovo succède au très apprécié ThinkPad X1 Extreme. Il s'agit d'un ordinateur portable multimédia très performant, doté d'un matériel puissant, d'un écran tactile OLED tandem mat et de ce qui pourrait bien être le meilleur clavier que Lenovo ait jamais intégré dans un ThinkPad.
Intel Core Ultra 9 285H, NVIDIA GeForce RTX 5070 Laptop, 16", 1.9 kgTest du Lenovo Yoga Pro 9 16IAH10 RTX 5050 : une configuration qui n'est pas la meilleure
Le Yoga Pro 9 16 avec GeForce RTX 5050 est moins cher, plus frais et généralement plus silencieux que ses options RTX 5060 ou 5070 plus chères. Malheureusement, à près de 1800 € au détail, le système n'est pas beaucoup moins cher que les configurations plus haut de gamme.
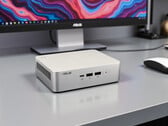
Intel Core Ultra 9 285H, NVIDIA GeForce RTX 5050 Laptop, 16", 2 kgTest du NUC 15 Pro+ d'Asus : performances haut de gamme d'un mini-PC avec Core Ultra 9 285H
Avec l'Asus NUC 15 Pro+, Asus veut montrer à quel point il est possible d'intégrer des performances dans un boîtier de taille mini aujourd'hui. Les dimensions compactes et la technologie moderne rendent le mini-PC particulièrement intéressant. Mais ce petit concentré de puissance tient-il ses promesses en termes de performances dans une utilisation quotidienne ? Dans notre test, nous découvrons si le NUC 15 Pro+ est vraiment une alternative sérieuse à l'ordinateur de bureau classique.
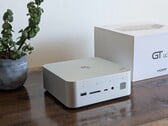
Intel Core Ultra 9 285H, Arc 140T, 690 gTest du Beelink GTI15 Ultra : l'un des mini-PC les plus complets pour sa taille
Le GTI15 Ultra est encore plus rapide qu'auparavant avec Arrow Lake-H et des ports LAN RJ-45 à 10 Gbps. Cependant, les haut-parleurs ne se sont pas améliorés depuis l'époque du GTI13 Ultra.
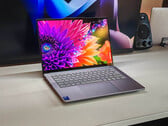
Intel Core Ultra 9 285H, Arc 140T, 1.3 kgTest du Lenovo Yoga Pro 7i Gen 10 Aura Edition : PC portable multimédia au superbe écran tactile OLED
Avec l'Intel Core Ultra 9 285H, le Yoga Pro 14 G10 offre un processeur rapide et le nouvel écran tactile OLED 3K avec 120 Hz offre une excellente qualité d'image. Cependant, la limite de puissance élevée entraîne également des problèmes.
Intel Core Ultra 9 285H, Arc 140T, 14.5", 1.6 kgLenovo Yoga Pro 9i 16 RTX 5070: NVIDIA GeForce RTX 5070 Laptop, 16.00", 1.9 kg
Critique » Test du Lenovo Yoga Pro 9i 16 G10 Aura Edition : écran tandem OLED exceptionnel à 1 600 cd/m²
GMK EVO-T1: Intel Arc Graphics 140T, 0.9 kg
Critique » Test du GMKtec EVO-T1 : mini PC haut de gamme avec Core Ultra 9 285H, TDP 80 W, RAM 64 Go et option eGPU
Geekom Mini IT15, Ultra 9 285H: Intel Arc Graphics 140T, 0.6 kg
Critique » Test du Geekom Mini IT15 : mini-station de travail Intel Core Ultra pour professionnels et créatifs
Asus ROG Zephyrus G16 2025 5070 Ti: NVIDIA GeForce RTX 5070 Ti Laptop, 16.00", 1.9 kg
Critique » Test de l'Asus ROG Zephyrus G16 2025 : le PC portable de jeu fin avec RTX 5070 Ti impressionne
Asus ROG Zephyrus G16 GU605CX: NVIDIA GeForce RTX 5090 Laptop, 16.00", 1.9 kg
Critique » Asus ROG Zephyrus G16 contre Razer Blade 16 : PC portables de jeu les plus fins avec RTX 5090
Critique » Test de l'Asus ROG Zephyrus G16 2025 : PC portable de jeu fin avec RTX 5090 et 64 Go de RAM
Asus ZenBook Duo OLED UX8406CA: Intel Arc Graphics 140T, 14.00", 1.8 kg
Critique » Test de l'Intel Arc Graphics 140T : l'iGPU Arrow Lake-H prend en charge la génération d'images
MSI Prestige 16 AI Evo B2HMG: Intel Arc Graphics 140T, 16.00", 1.6 kg
Critique » Test de l'Intel Arc Graphics 140T : l'iGPU Arrow Lake-H prend en charge la génération d'images
Asus ZenBook Duo OLED UX8406CA: Intel Arc Graphics 140T, 14.00", 1.8 kg
Critique » Analyse des CPU Intel Arrow Lake-H : Le Core Ultra 200H rend Lunar Lake presque redondant
MSI Prestige 16 AI Evo B2HMG: Intel Arc Graphics 140T, 16.00", 1.6 kg
Critique » Analyse des CPU Intel Arrow Lake-H : Le Core Ultra 200H rend Lunar Lake presque redondant
Critique » Test du MSI Prestige 16 AI Evo : PC multimédia avec Arrow Lake rapide et autonomie impressionnante
Asus ZenBook Duo OLED UX8406CA: Intel Arc Graphics 140T, 14.00", 1.8 kg
Critique » Test de l'Asus ZenBook Duo OLED : le convertible multi-écran désormais avec Intel Arrow Lake
Lenovo ThinkPad T1g Gen 8 21TD003GE: NVIDIA GeForce RTX 5070 Laptop, 16.00", 1.9 kg
Autres tests » Lenovo ThinkPad T1g Gen 8 21TD003GE
Lenovo Yoga Pro 9 16IAH10 RTX 5050: NVIDIA GeForce RTX 5050 Laptop, 16.00", 2 kg
Autres tests » Lenovo Yoga Pro 9 16IAH10 RTX 5050
Lenovo Yoga Pro 9 16IAH10, RTX 5070: NVIDIA GeForce RTX 5070 Laptop, 16.00", 2.1 kg
Autres tests » Lenovo Yoga Pro 9 16IAH10, RTX 5070
MSI Modern 15 H AI C2HMG: Intel Arc Graphics 140T, 15.60", 1.9 kg
Autres tests » MSI Modern 15 H AI C2HMG
Acer Predator Helios Neo 14 AI PHN14-71, RTX 5060: NVIDIA GeForce RTX 5060 Laptop, 14.50", 1.9 kg
Autres tests » Acer Predator Helios Neo 14 AI PHN14-71, RTX 5060
HP Omen Transcend 14-fb1000: NVIDIA GeForce RTX 5070 Laptop, 14.00", 1.6 kg
Autres tests » HP Omen Transcend 14-fb1000
Dell 16 Premium: NVIDIA GeForce RTX 5070 Laptop, 16.30", 2.3 kg
Autres tests » Dell 16 Premium
Dell Pro Max 14 Premium: NVIDIA RTX PRO 2000 Blackwell Generation Laptop, 14.00", 1.6 kg
Autres tests » Dell Pro Max 14 Premium
Asus ROG Zephyrus G16 GU605CP: NVIDIA GeForce RTX 5070 Laptop, 16.00", 1.9 kg
Autres tests » Asus ROG Zephyrus G16 GU605CP
Lenovo Yoga Pro 9 16IAH10, Ultra 9 285H: NVIDIA GeForce RTX 5060 Laptop, 16.00", 2.1 kg
Autres tests » Lenovo Yoga Pro 9 16IAH10, Ultra 9 285H
LG gram Pro AI 17 17Z90TR: NVIDIA GeForce RTX 5050 Laptop, 17.00", 1.5 kg
Autres tests » LG gram Pro AI 17 17Z90TR
Honor MagicBook Pro 16 Hunter 2025: NVIDIA GeForce RTX 5060 Laptop, 16.00", 1.9 kg
Autres tests » Honor MagicBook Pro 16 Hunter 2025
Asus ROG Zephyrus G16 2025 5070 Ti: NVIDIA GeForce RTX 5070 Ti Laptop, 16.00", 1.9 kg
Autres tests » Asus ROG Zephyrus G16 2025 5070 Ti
Asus ROG Zephyrus G16 GU605CR: NVIDIA GeForce RTX 5070 Ti Laptop, 16.00", 2 kg
Autres tests » Asus ROG Zephyrus G16 GU605CR
Acer Swift Go 16 OLED SFG16-73: Intel Arc Graphics 140T, 16.00", 1.5 kg
Autres tests » Acer Swift Go 16 OLED SFG16-73
Lenovo Yoga Pro 7 14IAH10: Intel Arc Graphics 140T, 14.50", 1.6 kg
Autres tests » Lenovo Yoga Pro 7 14IAH10
Asus ROG Zephyrus G16 GU605CW: NVIDIA GeForce RTX 5080 Laptop, 16.00", 2 kg
Autres tests » Asus ROG Zephyrus G16 GU605CW
Asus ROG Zephyrus G16 GU605CX: NVIDIA GeForce RTX 5090 Laptop, 16.00", 1.9 kg
Autres tests » Asus ROG Zephyrus G16 GU605CX
Asus Vivobook Pro 15 N6506CU: NVIDIA GeForce RTX 4050 Laptop GPU, 15.60", 1.8 kg
Autres tests » Asus Vivobook Pro 15 N6506CU
Asus Zenbook 14 OLED UX3405CA, Ultra 9 285H: Intel Arc Graphics 140T, 14.00", 1.2 kg
Autres tests » Asus Zenbook 14 OLED UX3405CA, Ultra 9 285H
MSI Prestige 16 AI Evo B2HMG: Intel Arc Graphics 140T, 16.00", 1.6 kg
Autres tests » MSI Prestige 16 AI Evo B2HMG
Asus ZenBook Duo OLED UX8406CA: Intel Arc Graphics 140T, 14.00", 1.8 kg
Autres tests » Asus ZenBook Duo OLED UX8406CA
Lenovo ThinkPad T1g Gen 8 21TD003GE: NVIDIA GeForce RTX 5070 Laptop, 16.00", 1.9 kg
» Qualité supérieure, clavier exceptionnel, CAMM2-RAM, écran Tandem-OLED mat - Le ThinkPad T1g Gen 8 est l'ordinateur portable phare de Lenovo
» Le ThinkPad T1g Gen 8 de Lenovo est un excellent ordinateur portable multimédia dont personne ne connaît l'existence
Lenovo Yoga Pro 9 16IAH10 RTX 5050: NVIDIA GeForce RTX 5050 Laptop, 16.00", 2 kg
» Le Core Ultra 9 285H n'offre pratiquement aucun avantage par rapport au Core Ultra 7 255H
» Comparaison des trois principales configurations du Lenovo Yoga Pro 9 16
Beelink GTI15 Ultra: Intel Arc Graphics 140T, 1.3 kg
» Les micros quadruples Beelink GTI15 Ultra sont parfaits pour l'activation vocale, mais les haut-parleurs sont moyens
» Le PC Beellnk GTI15 Ultra est lancé à un prix presque deux fois supérieur à celui du GTI13 Ultra
Lenovo Yoga Pro 7 14IAH10: Intel Arc Graphics 140T, 14.50", 1.6 kg
» Le Yoga Pro 7 de Lenovo, équipé d'un Core Ultra 9 d'Intel, montre le problème des limites de puissance élevées
» Lenovo favorise Intel avec un meilleur écran et un lecteur de carte SD sur le Yoga Pro 7 14
Lenovo Yoga Pro 9i 16 RTX 5070: NVIDIA GeForce RTX 5070 Laptop, 16.00", 1.9 kg
» Le Yoga Pro 9i 16 G10 de Lenovo est-il le meilleur ordinateur portable multimédia sous Windows ?
» La nouvelle dalle Tandem-OLED du Yoga Pro 9i de Lenovo est actuellement le meilleur écran d'ordinateur portable
GMK EVO-T1: Intel Arc Graphics 140T, 0.9 kg
» GMKtec EVO-T1 - Revue de presse : Mini PC avec Intel Core Ultra 9 pour les modèles d'IA, les LLM et les jeux via OCuLink
Asus ROG Zephyrus G16 2025 5070 Ti: NVIDIA GeForce RTX 5070 Ti Laptop, 16.00", 1.9 kg
» Verdict sur le Asus ROG Zephyrus G16 : puissant, mais toujours plus lent que son petit frère G14