Verdict - Repousser les limites des performances
En l'absence de nouveaux GPU GeForce cette année, les GPU Arrow Lake Core Ultra 9 290HX Plus et l'écran OLED 1600p sont les deux seules nouveautés de l'Alienware 16 Area-51 2026. Le nouveau processeur est en effet jusqu'à 25 % plus rapide que l'option haut de gamme Core Ultra 9 275HX, mais la consommation d'énergie est également jusqu'à 25 % plus exigeante en conséquence].
En ce qui concerne l'écran, le passage de l'IPS à l'OLED est sans doute beaucoup plus visible que le passage du Core Ultra 9 au Core Ultra 9 Plus. Le panneau OLED offre un contraste nettement plus élevé, des temps de réponse plus rapides et un HDR supérieur, tout en conservant la prise en charge d'Advanced Optimus, la résolution native QHD+ et un taux de rafraîchissement rapide de 240 Hz. Les jeux et le multimédia bénéficieront tout particulièrement de ces avantages. Malheureusement, les nouvelles options OLED et CPU Core Ultra 9 Plus sont regroupées et ne peuvent être séparées, ce qui entraîne des prix très élevés pour cette configuration.
Comme le châssis n'a pas changé, la plupart de nos plaintes concernant le modèle 2025 ne sont pas fondées plaintes concernant le modèle 2025 restent les mêmes pour le modèle 2026. Les températures déjà élevées du cœur sont encore pires cette fois-ci, jusqu'à 100°C si l'on utilise le Core Ultra 9 Plus. De plus, l'autonomie de la batterie reste assez faible, même pour un ordinateur portable de jeu. La mentalité "performance à tout prix" est plus forte que jamais pour être en ligne avec ce que la marque Alienware est connue.
Points positifs
Points négatifs
Prix et disponibilité
Dell livre maintenant l' Alienware 16 Area-51 2026 à partir de $1950 pour la configuration de base Core Ultra 7 et RTX 5060 jusqu'à $3900 ou plus pour notre configuration Core Ultra 9 Plus et RTX 5080.
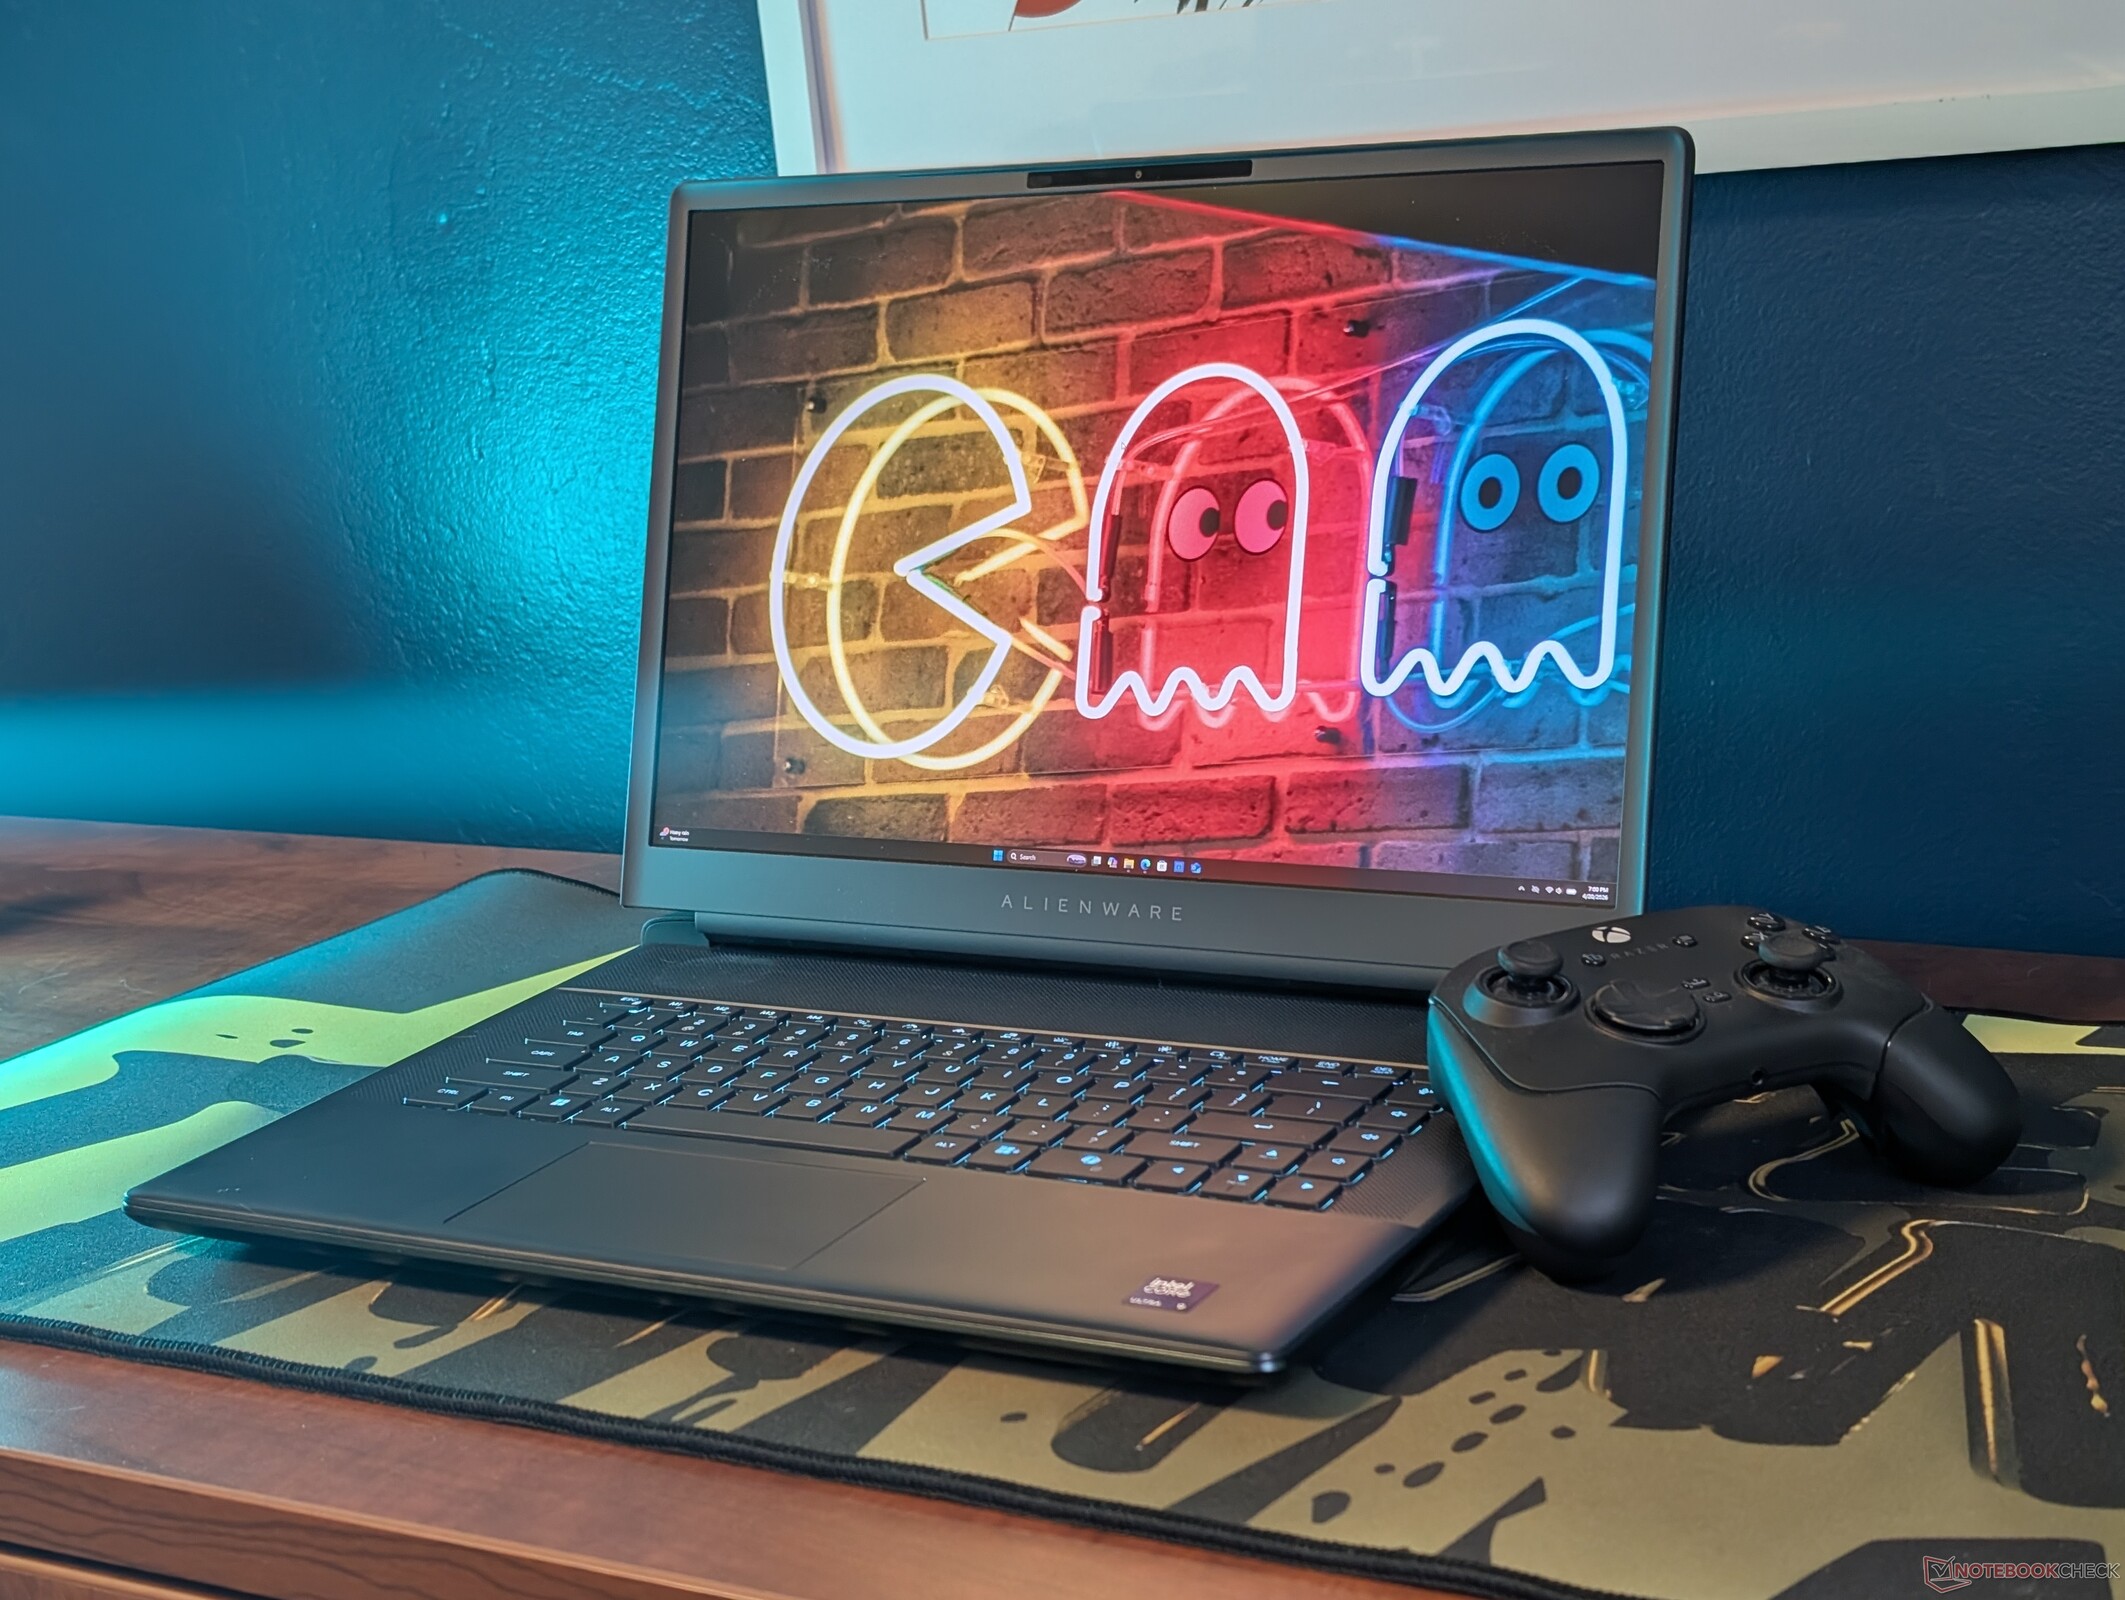
L'Alienware 16 Area-51 a fait ses débuts l'année dernière et est devenu l'un des meilleurs ordinateurs portables d'Alienware. Pour 2026, le modèle ne reçoit que des rafraîchissements mineurs liés à son processeur et à son écran puisque la série RTX 50 de GeForce n'a pas encore été remplacée.
Notre unité de test est équipée de nouvelles options non disponibles sur la version 2025, notamment le CPU Core Ultra 9 290HX Plus et un écran OLED 1600p 240 Hz mat avec G-Sync pour un peu moins de 4000$. Ces changements améliorent-ils l'expérience utilisateur ou justifient-ils le nouveau prix ?
Nous vous recommandons de consulter notre avis sur l'Alienware 16 Area-51 de 2025 pour en savoir plus sur les caractéristiques physiques de l'ordinateur portable. Les alternatives au modèle Dell incluent d'autres ordinateurs portables de jeu 16 pouces haut de gamme comme le Asus ROG Zephyrus G16 ou le Lenovo Legion Pro 7i 16 Gen 10.
Plus d'avis sur Alienware :
Spécifications
Cas

Connectivité


Lecteur de carte SD
| SD Card Reader | |
| average JPG Copy Test (av. of 3 runs) | |
| Alienware 16 Area-51 Core Ultra 9 290HX Plus (Toshiba Exceria Pro SDXC 64 GB UHS-II) | |
| Alienware 16 Area-51 (Toshiba Exceria Pro SDXC 64 GB UHS-II) | |
| Asus ROG Zephyrus G16 GU605CW (AV Pro SD microSD 128 GB V60) | |
| MSI Vector 16 HX AI A2XWHG (AV PRO microSD 128 GB V60) | |
| maximum AS SSD Seq Read Test (1GB) | |
| Alienware 16 Area-51 Core Ultra 9 290HX Plus (Toshiba Exceria Pro SDXC 64 GB UHS-II) | |
| Alienware 16 Area-51 (Toshiba Exceria Pro SDXC 64 GB UHS-II) | |
| MSI Vector 16 HX AI A2XWHG (AV PRO microSD 128 GB V60) | |
| Asus ROG Zephyrus G16 GU605CW (AV Pro SD microSD 128 GB V60) | |
Communication
Webcam


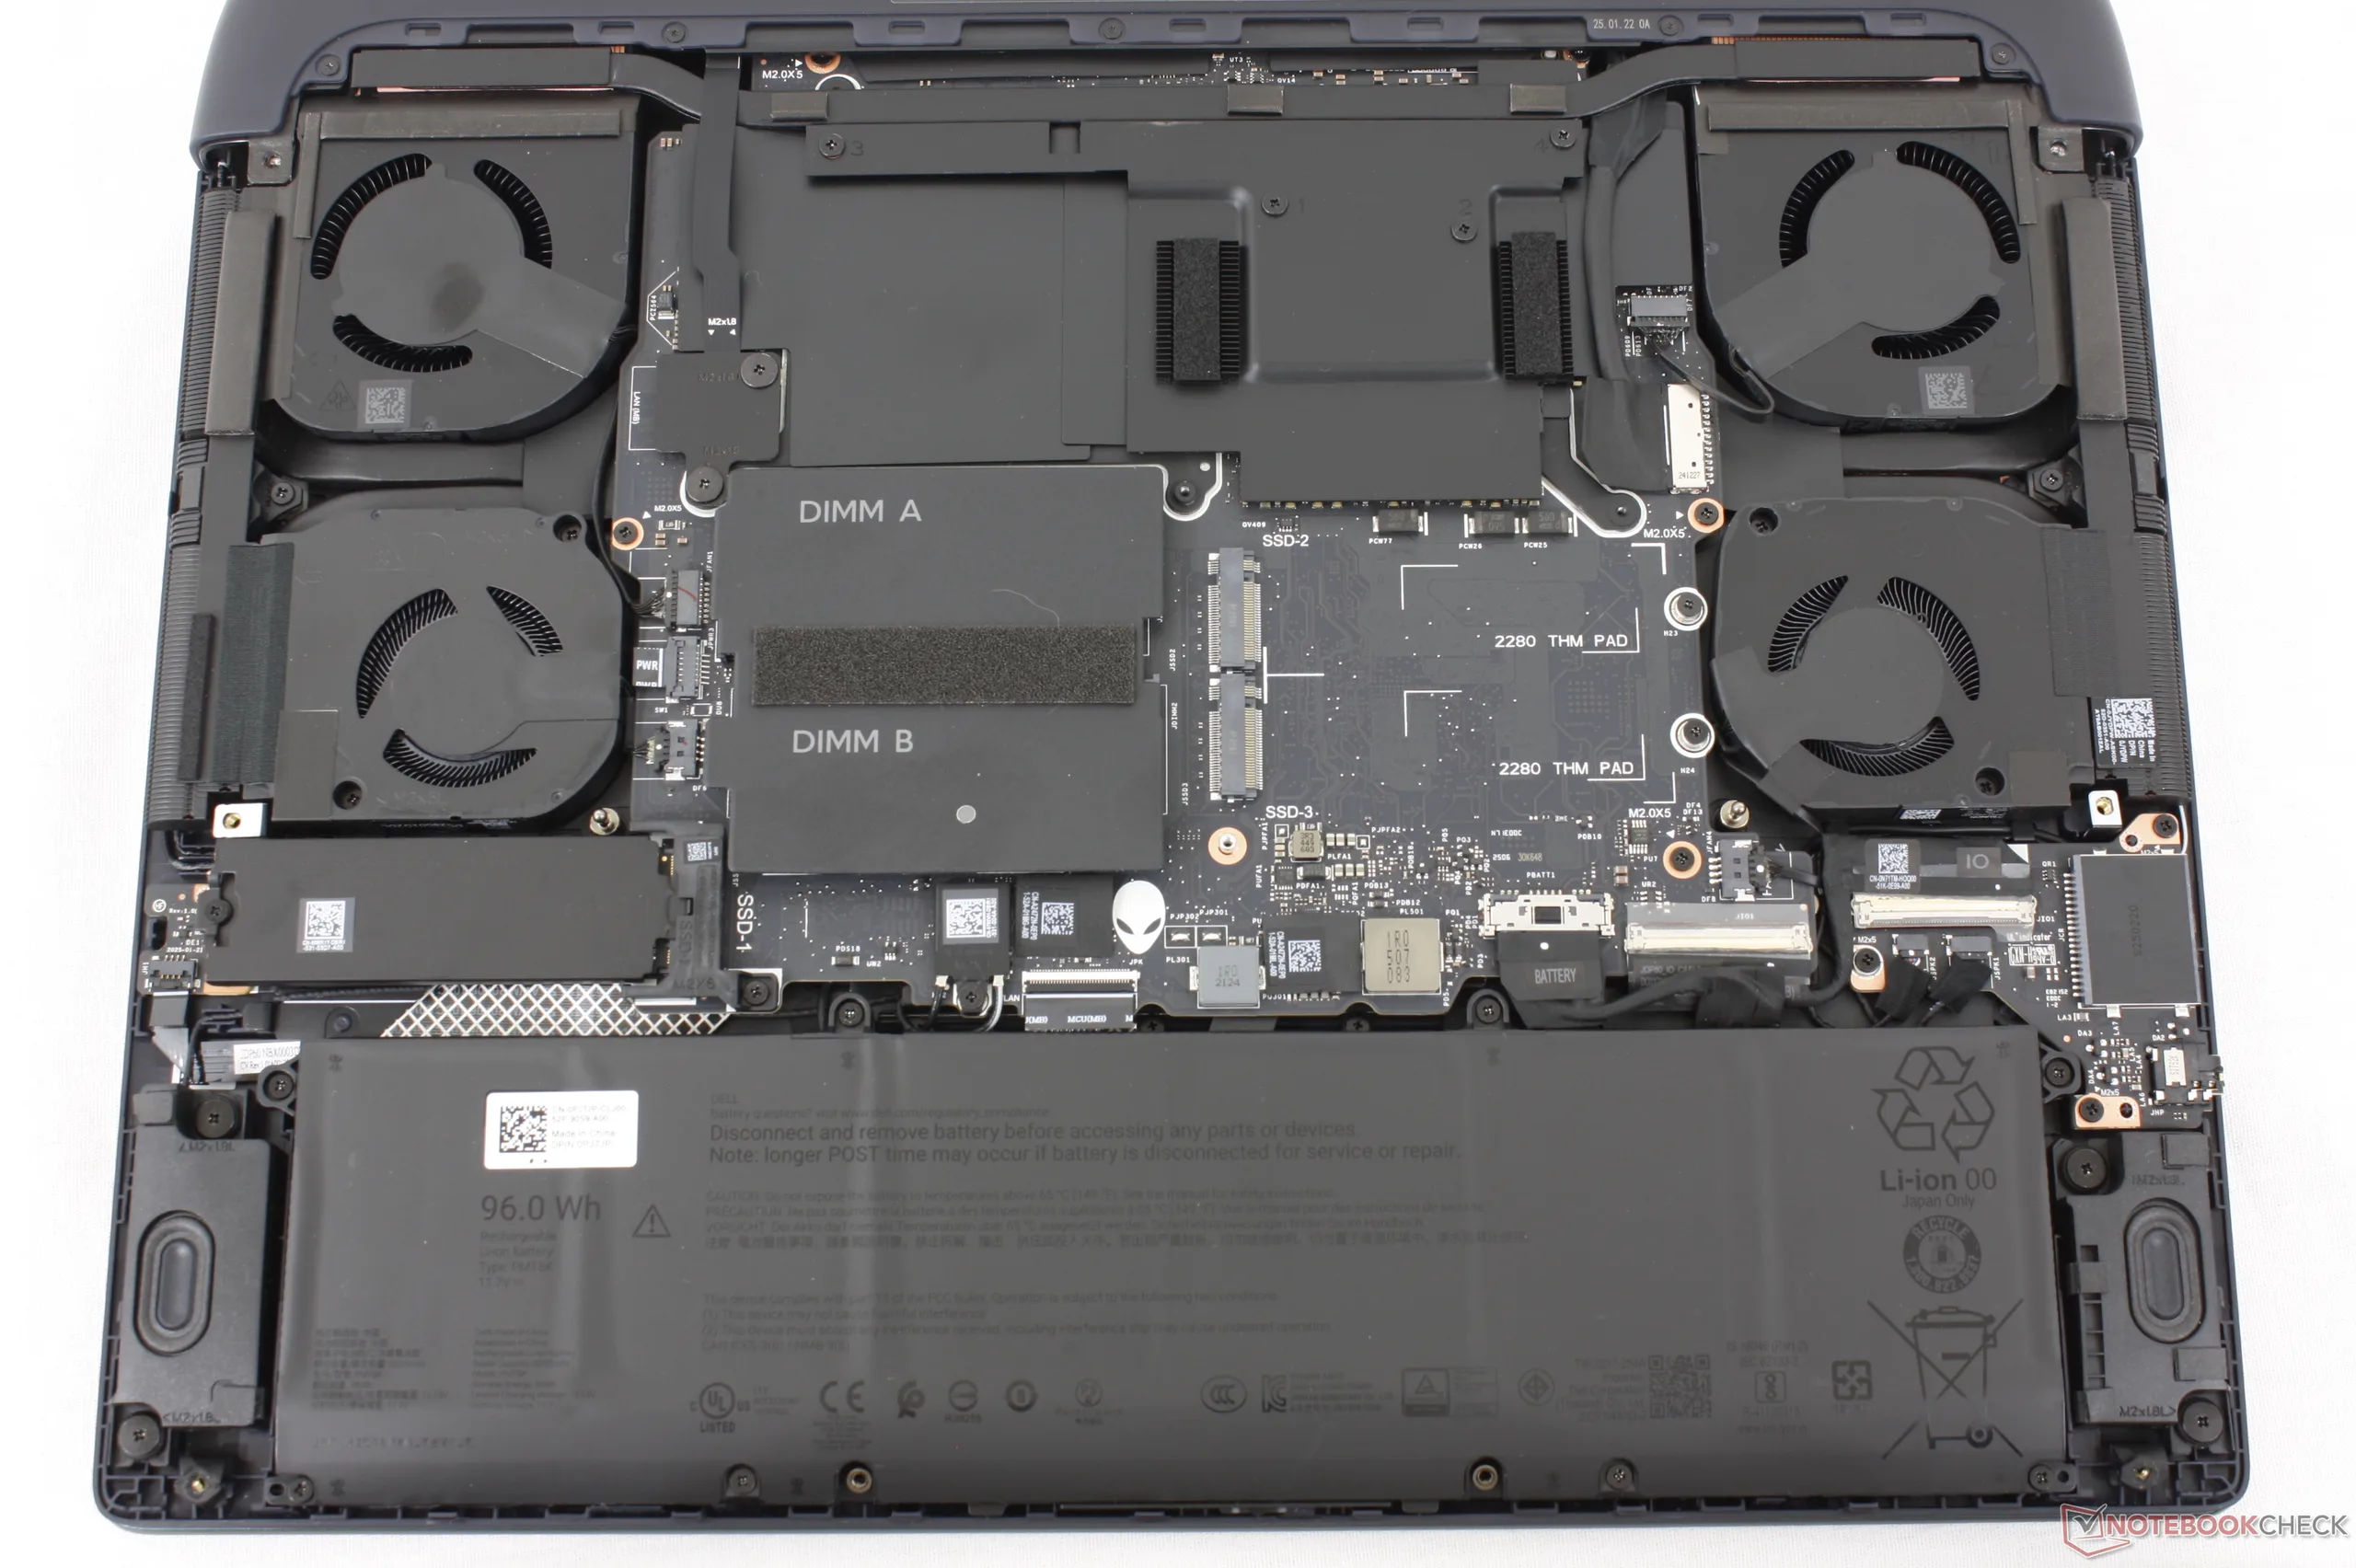
Maintenance

Périphériques d'entrée

Affichage
Deux options d'affichage sont désormais disponibles, chacune avec G-sync et un taux de rafraîchissement natif de 240 Hz :
- 2560 x 1600, 100% DCI-P3, IPS, 500 nits, mat
- 2560 x 1600, 120% DCI-P3, OLED, 620 nits (sur HDR), mat
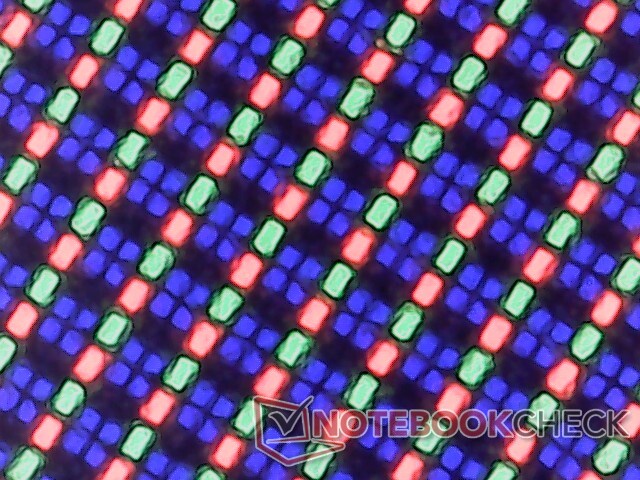
La dalle IPS de base est la même que sur le modèle 2025, tandis que l'OLED est une nouvelle option. Contrairement à la plupart des autres ordinateurs portables OLED, la dalle OLED de l'Alienware est mate avec support G-Sync au lieu d'être brillante. Cependant, la surcouche mate entraîne des textes et des images légèrement plus granuleux.
| |||||||||||||||||||||||||
Homogénéité de la luminosité: 97 %
Valeur mesurée au centre, sur batterie: 383.3 cd/m²
Contraste: ∞:1 (Valeurs des noirs: 0 cd/m²)
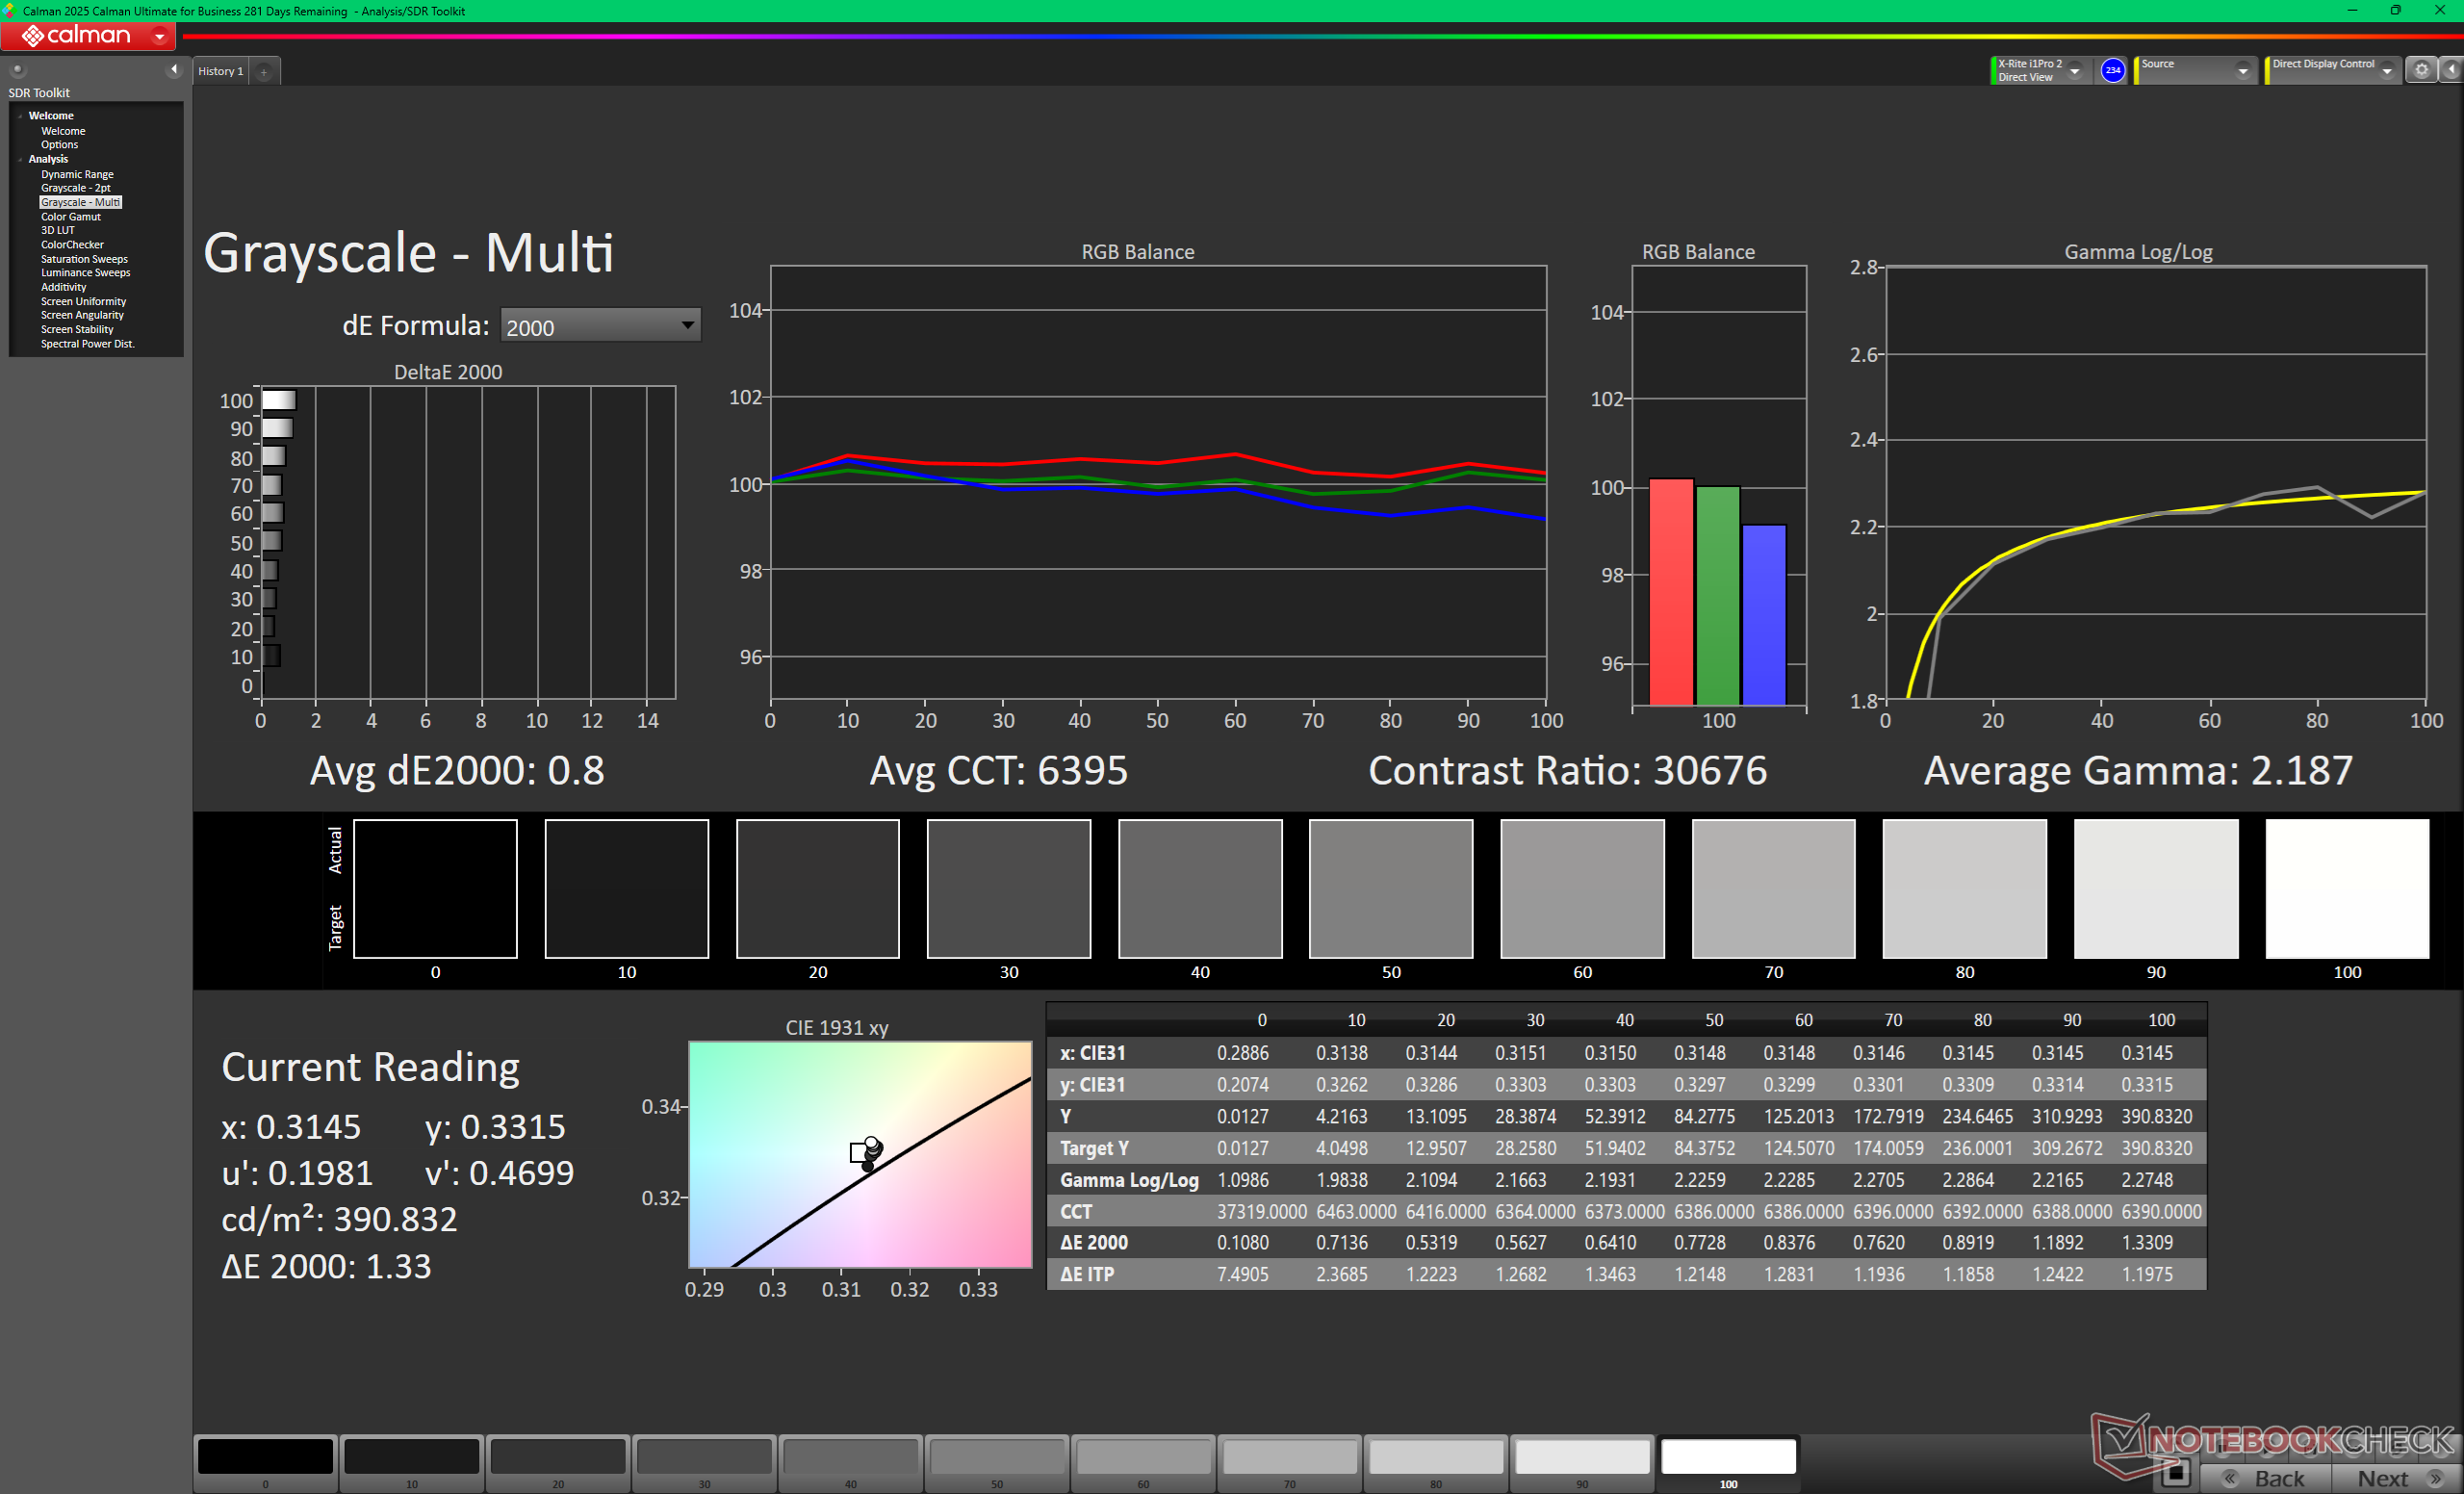
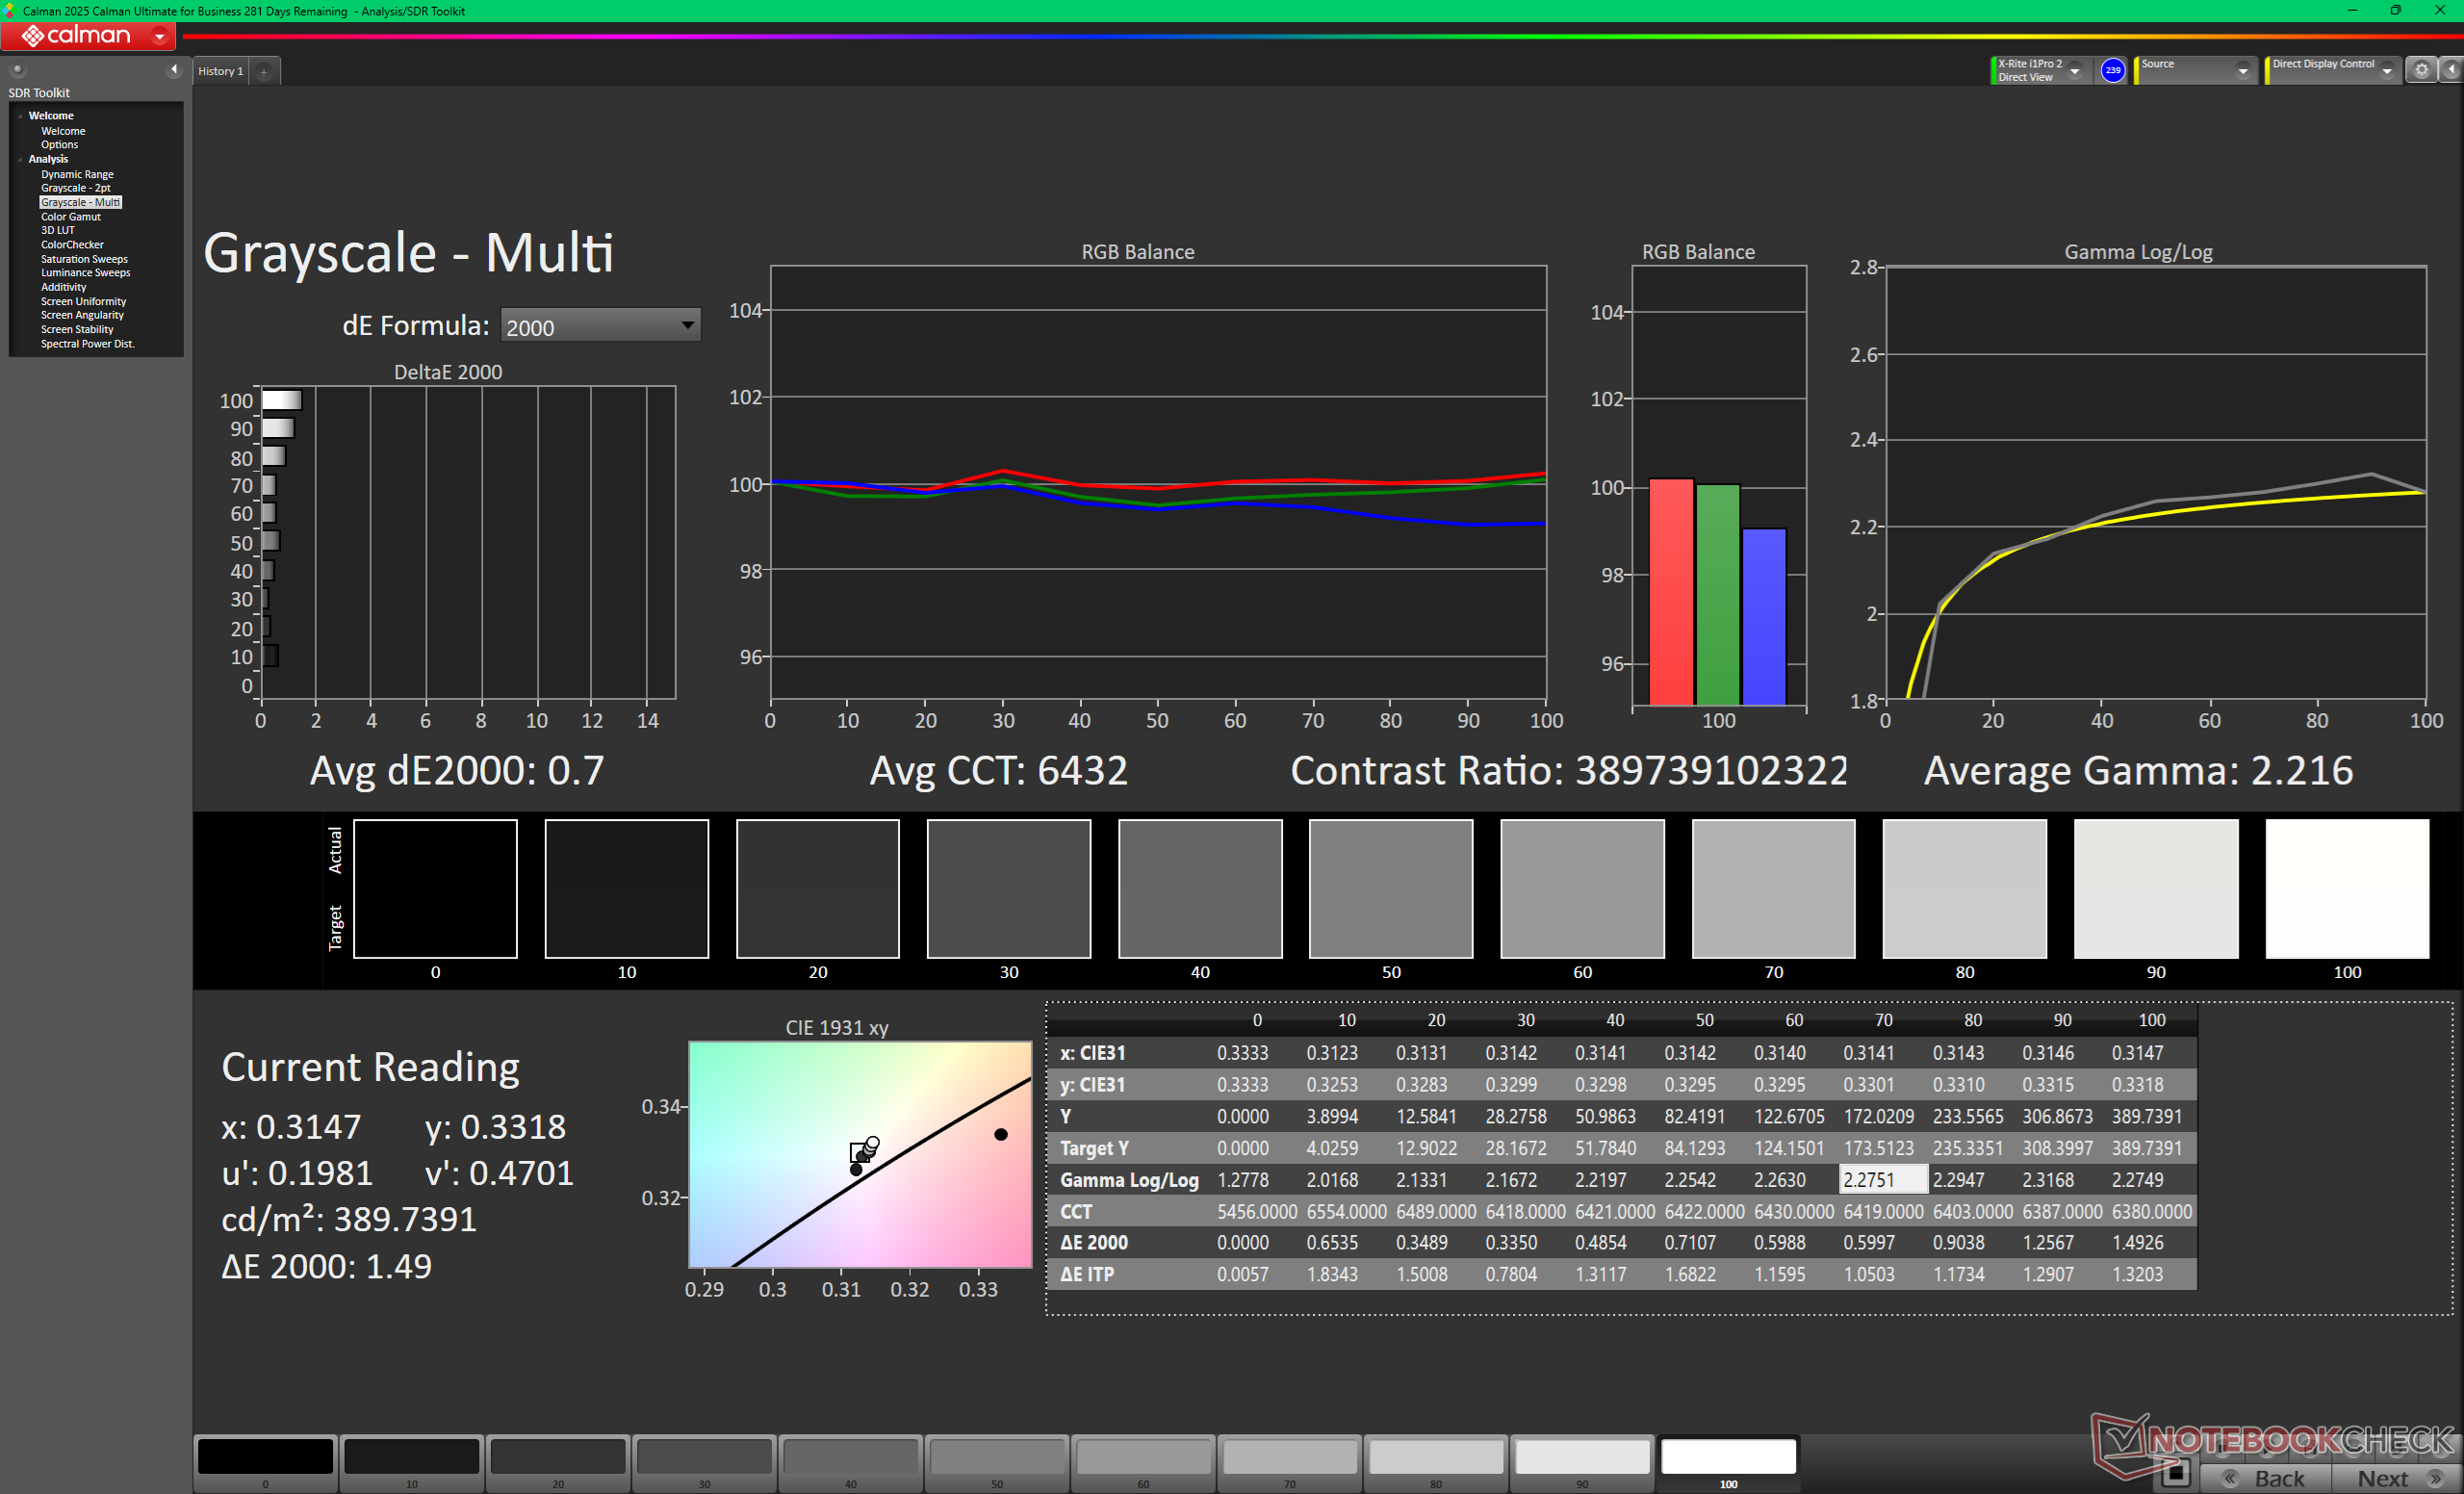
ΔE ColorChecker Calman: 0.87 | ∀{0.5-29.43 Ø4.72}
calibrated: 0.61
ΔE Greyscale Calman: 0.8 | ∀{0.09-98 Ø4.97}
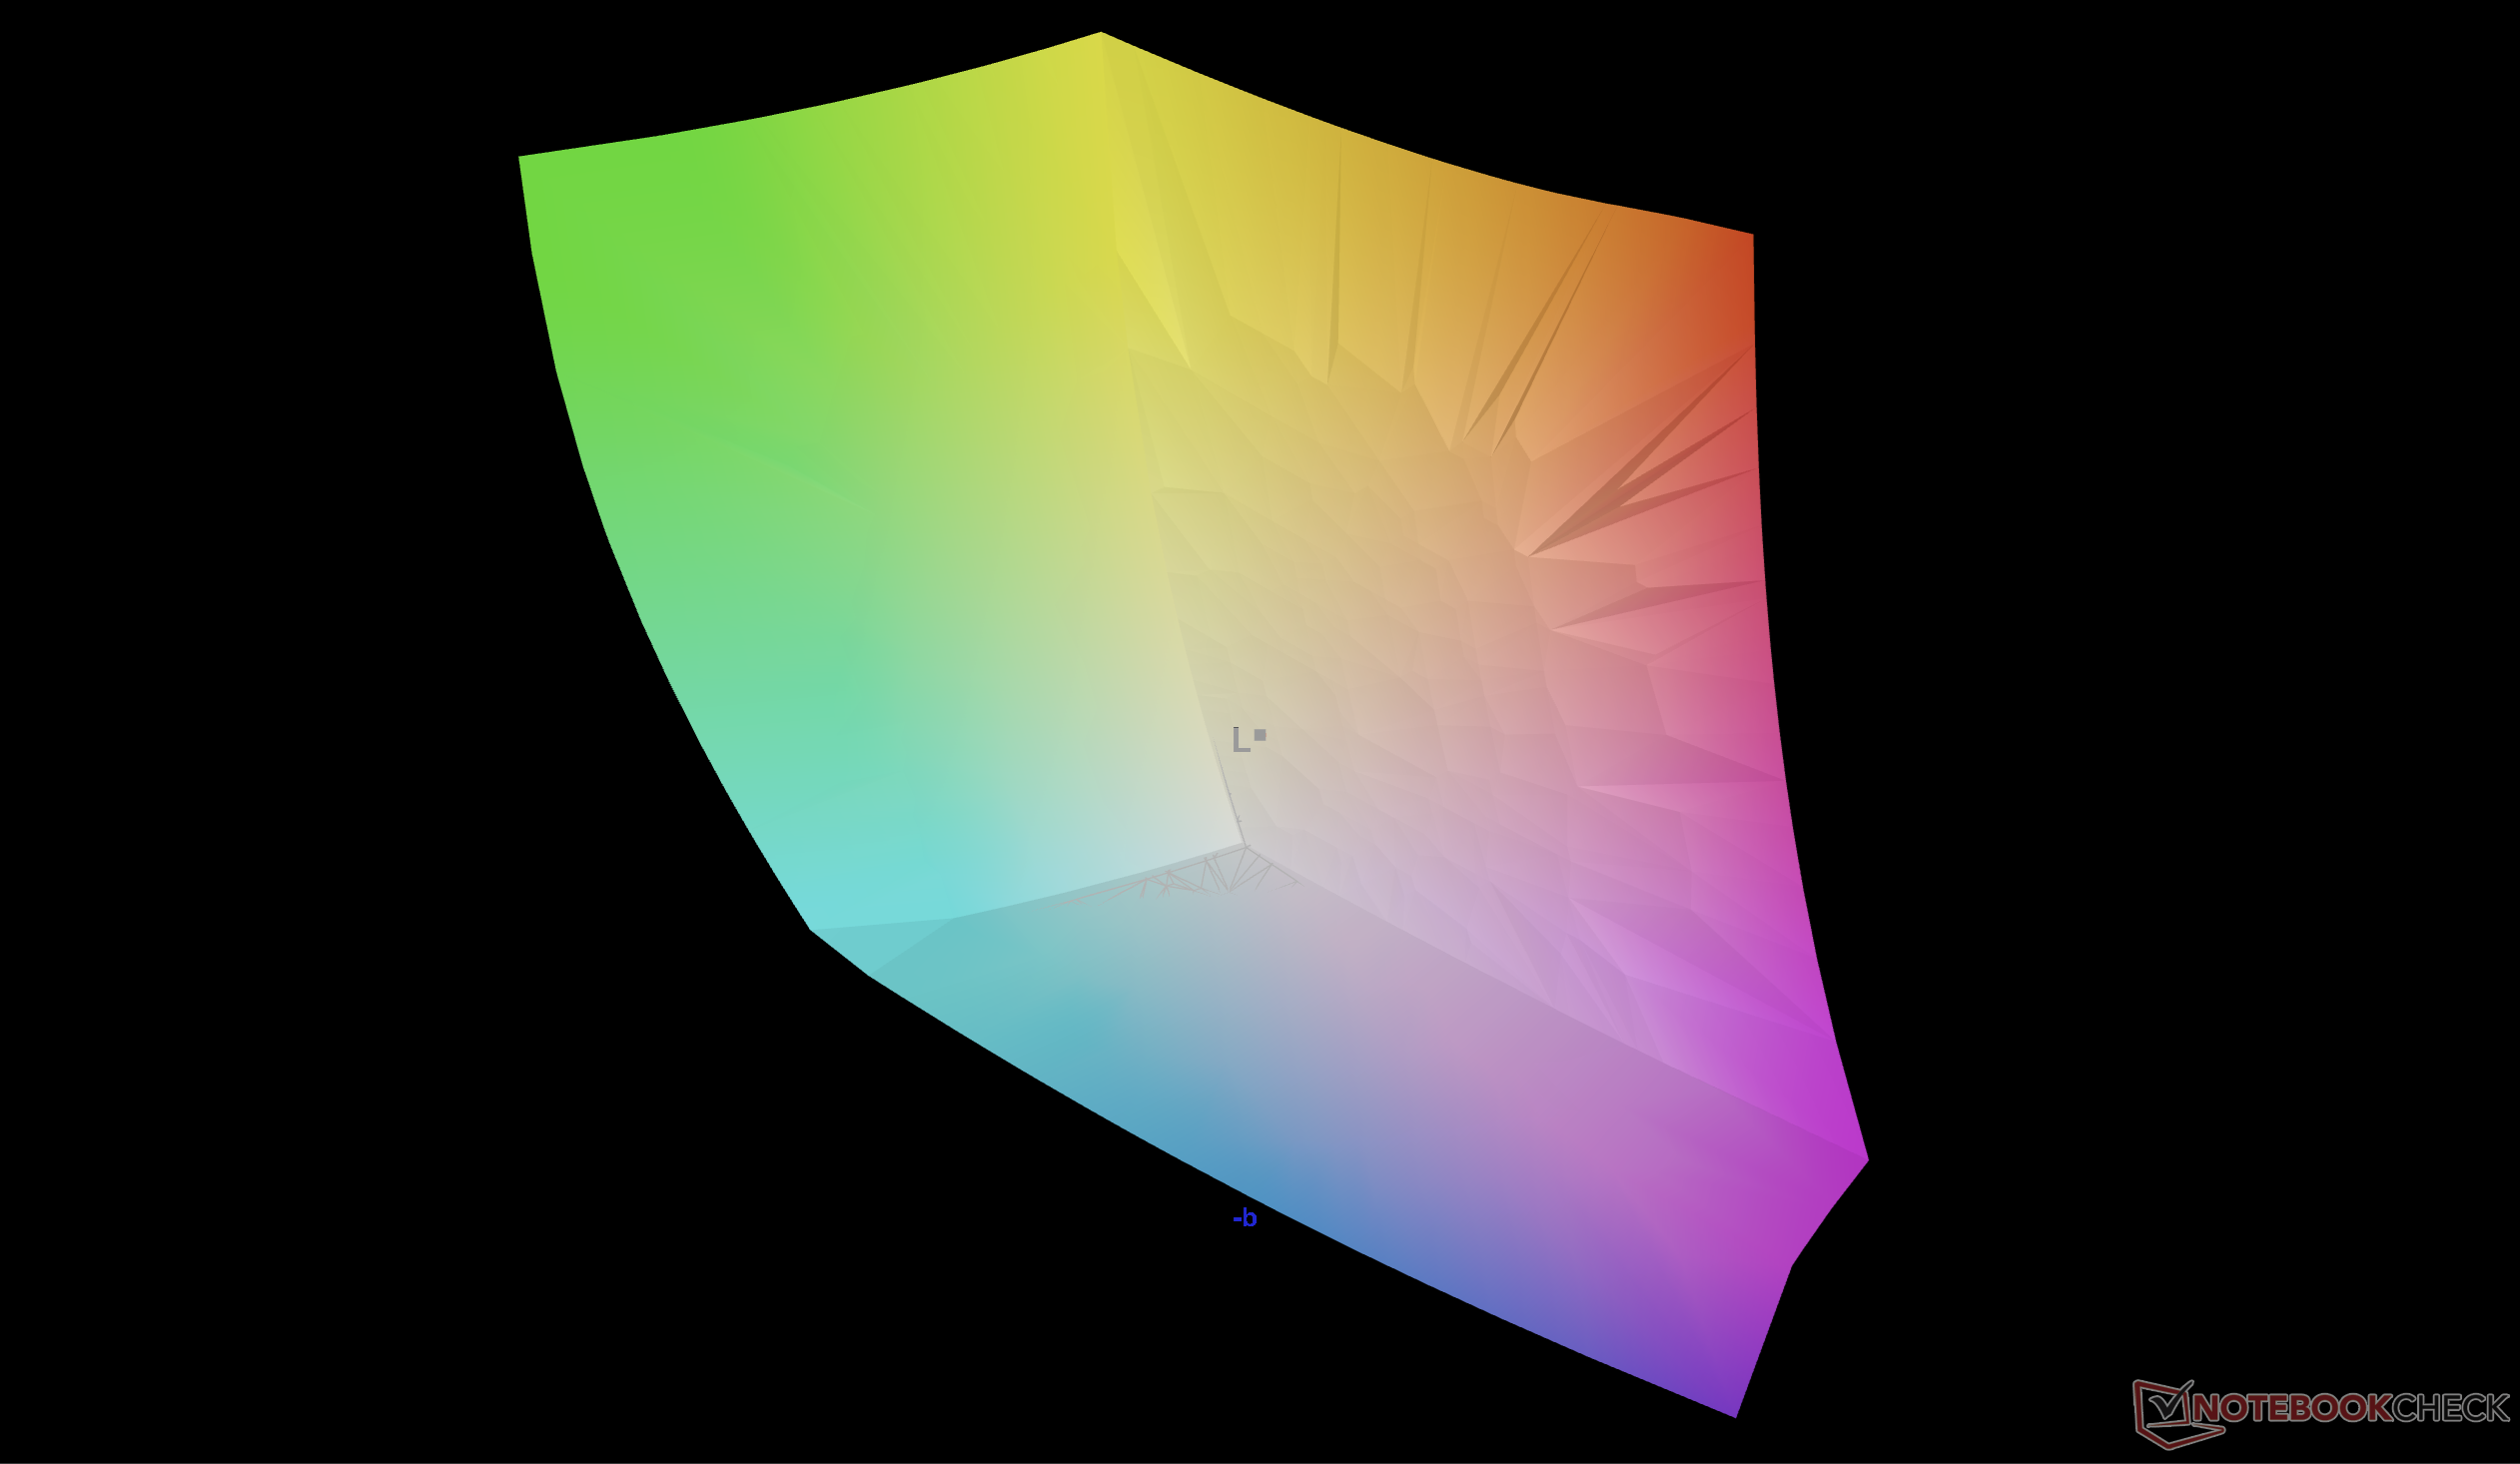
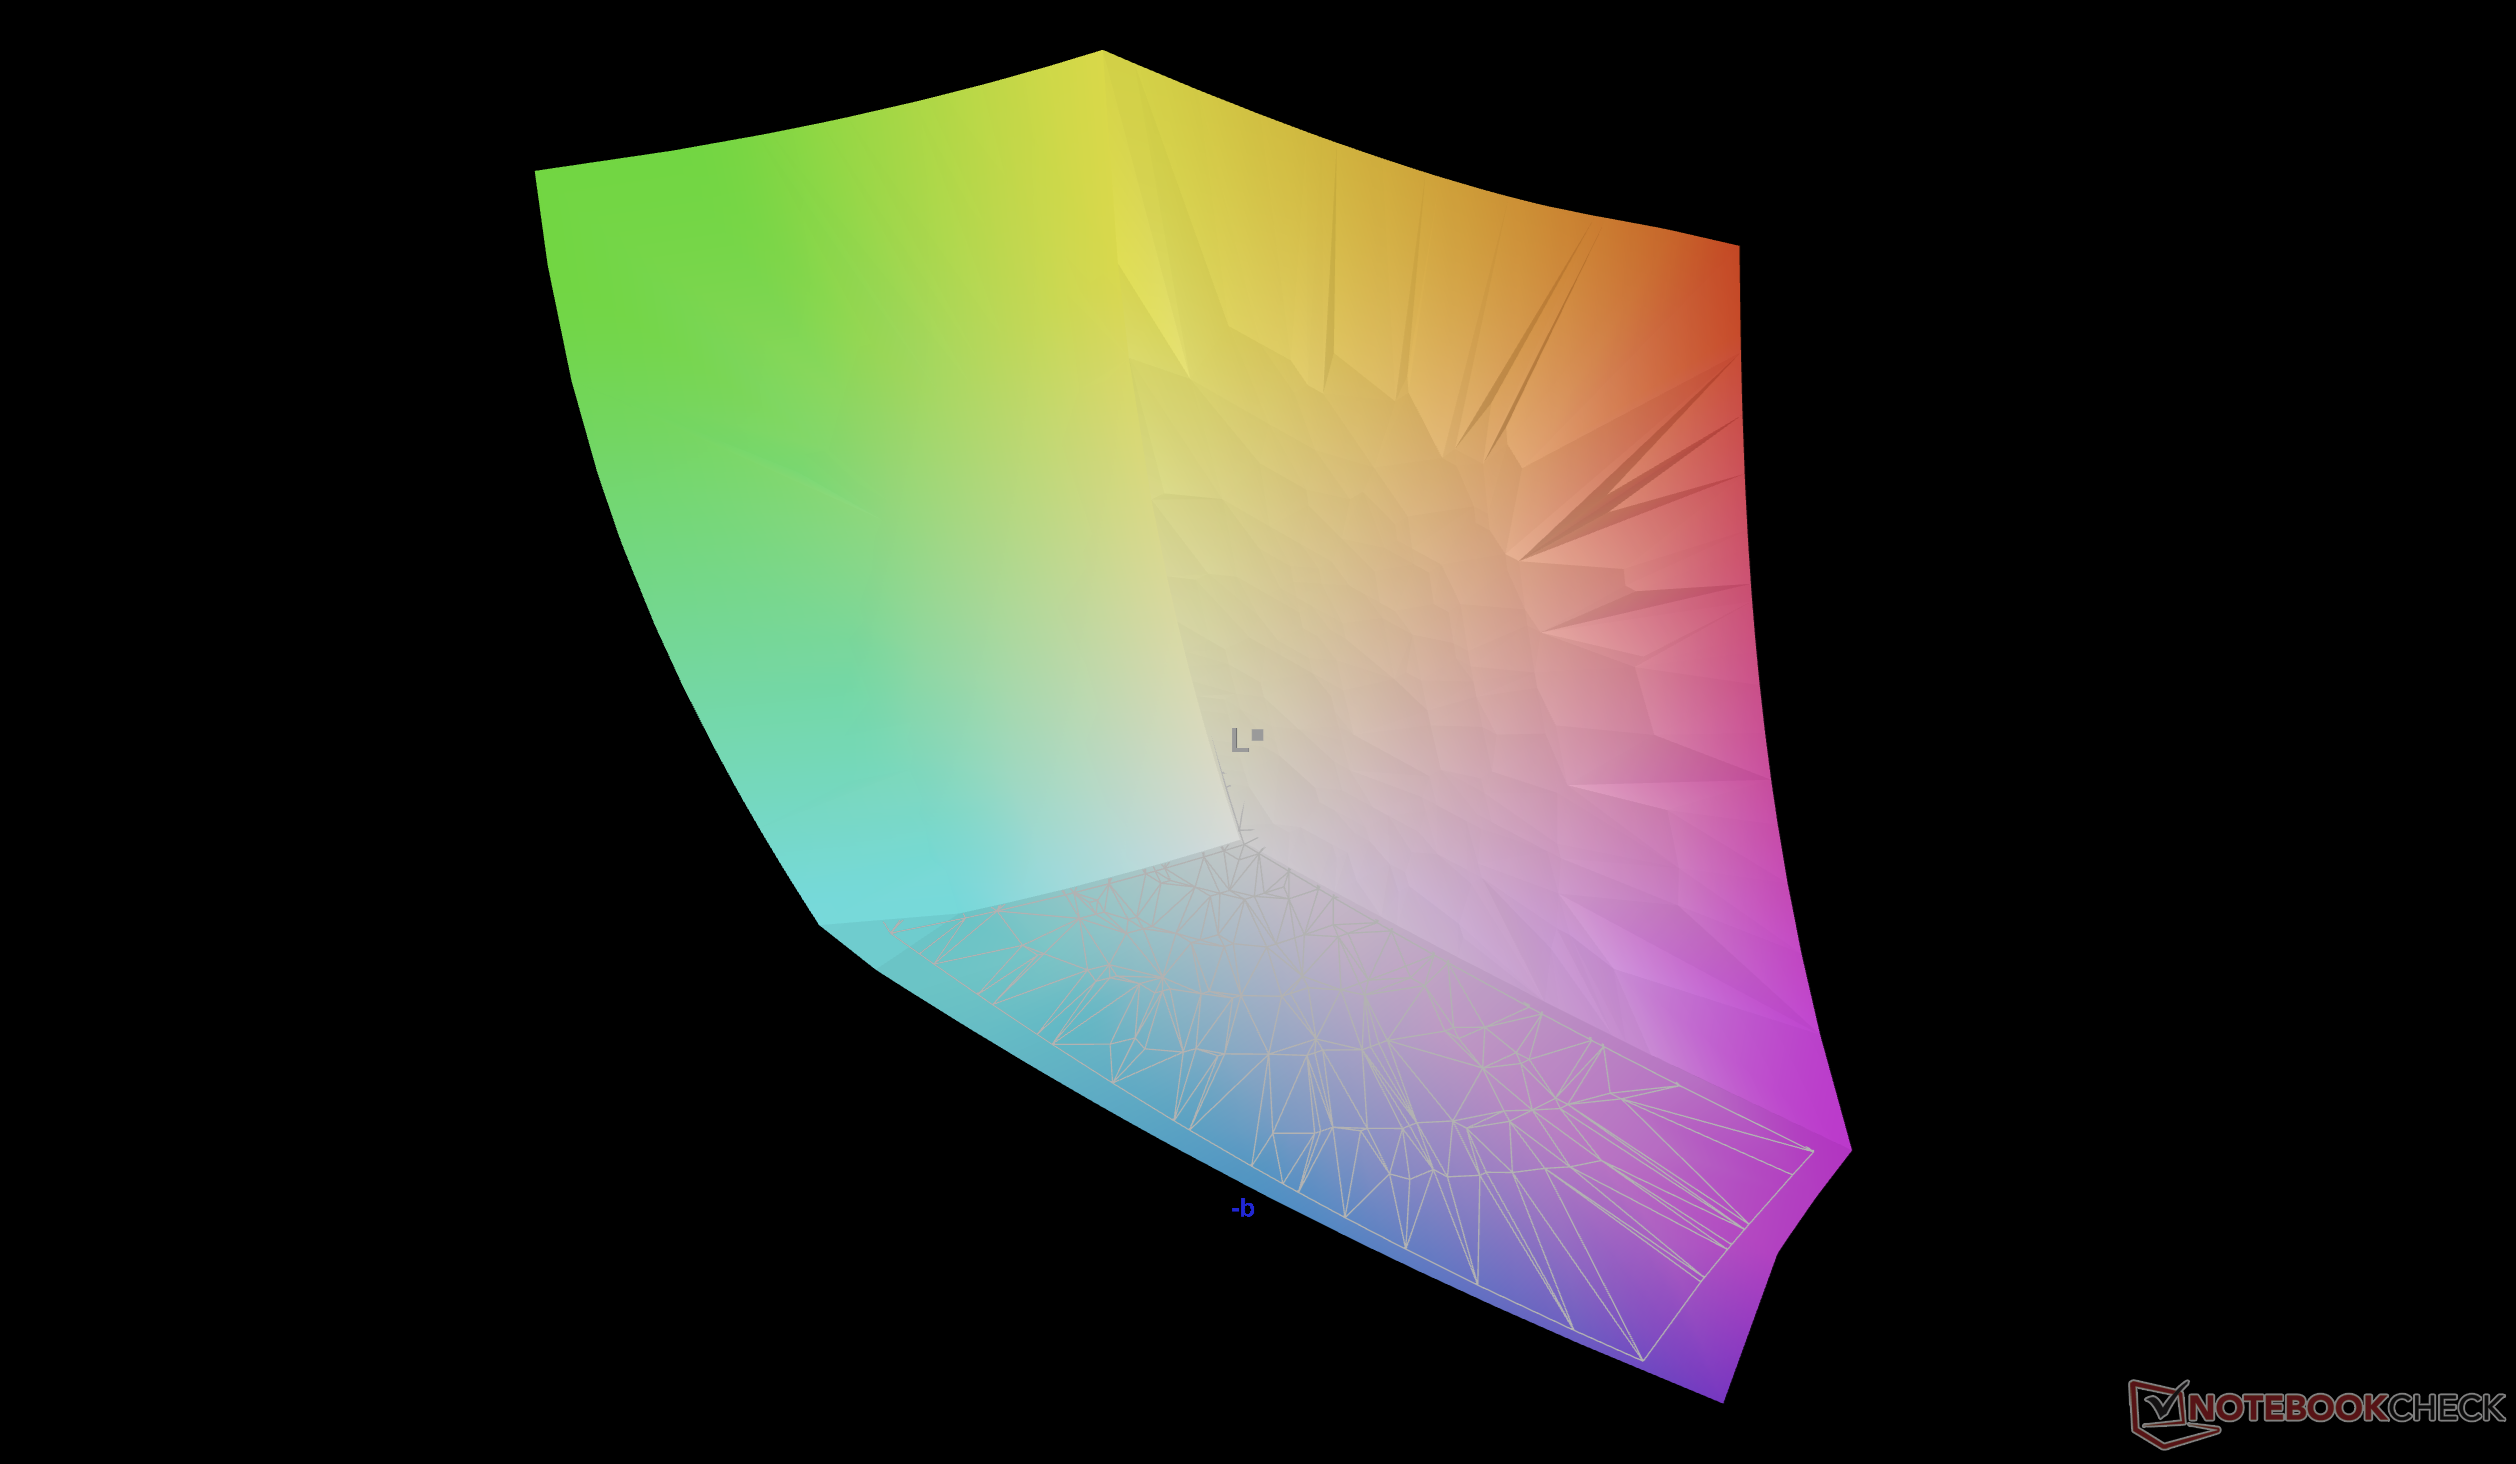
95.6% AdobeRGB 1998 (Argyll 3D)
100% sRGB (Argyll 3D)
99.6% Display P3 (Argyll 3D)
Gamma: 2.19
CCT: 6395 K
| Alienware 16 Area-51 Core Ultra 9 290HX Plus Samsung 160HU05, OLED, 2560x1600, 16", 240 Hz | Alienware 16 Area-51 AU Optronics B160QAN, IPS, 2560x1600, 16", 240 Hz | Lenovo Legion Pro 7i 16 Gen 10 Samsung ATNA60HU01-0, OLED, 2560x1600, 16", 240 Hz | HP Omen Max 16 ah000 Samsung ATNA60DL02-0, OLED, 2560x1600, 16", 240 Hz | MSI Vector 16 HX AI A2XWHG B160QAN02.3 (AUO7DB2), IPS, 2560x1600, 16", 240 Hz | Asus ROG Zephyrus G16 GU605CW Samsung ATNA60DL01-0, OLED, 2560x1600, 16", 240 Hz | |
|---|---|---|---|---|---|---|
| Display | -4% | -0% | 1% | -5% | -2% | |
| APL18 Peak Brightness (cd/m²) | 609 | |||||
| HDR Peak Brightness (cd/m²) | 609 | |||||
| Display P3 Coverage (%) | 99.6 | 96 -4% | 99.5 0% | 99.7 0% | 96.6 -3% | 96.5 -3% |
| sRGB Coverage (%) | 100 | 100 0% | 100 0% | 100 0% | 99.8 0% | 99.2 -1% |
| AdobeRGB 1998 Coverage (%) | 95.6 | 89.2 -7% | 94.4 -1% | 98.2 3% | 84.4 -12% | 94.5 -1% |
| Response Times | -1606% | 0% | -6% | -1373% | -447% | |
| Response Time Grey 50% / Grey 80% * (ms) | 0.29 ? | 4.8 ? -1555% | 0.28 ? 3% | 0.29 ? -0% | 4.3 ? -1383% | 0.32 ? -10% |
| Response Time Black / White * (ms) | 0.41 ? | 7.2 ? -1656% | 0.43 ? -5% | 0.47 ? -15% | 6 ? -1363% | 6 ? -1363% |
| PWM Frequency (Hz) | 1440 ? | 1438 ? | 960 ? | 960 | ||
| PWM Amplitude * (%) | 30 | 29 3% | 31 -3% | 20 33% | ||
| Screen | -131% | -64% | -92% | -131% | -82% | |
| Brightness middle (cd/m²) | 383.3 | 554 45% | 490.4 28% | 376.5 -2% | 473 23% | 394 3% |
| Brightness (cd/m²) | 387 | 532 37% | 498 29% | 382 -1% | 426 10% | 398 3% |
| Brightness Distribution (%) | 97 | 88 -9% | 97 0% | 96 -1% | 85 -12% | 98 1% |
| Black Level * (cd/m²) | 0.52 | 0.42 | 0.0084 | |||
| Colorchecker dE 2000 * | 0.87 | 2.81 -223% | 3.2 -268% | 3.67 -322% | 3.47 -299% | 2.41 -177% |
| Colorchecker dE 2000 max. * | 2.23 | 8.32 -273% | 6.04 -171% | 7.24 -225% | 7.24 -225% | 3.82 -71% |
| Colorchecker dE 2000 calibrated * | 0.61 | 0.65 -7% | 0.84 -38% | 0.94 -54% | 1.36 -123% | 1.41 -131% |
| Greyscale dE 2000 * | 0.8 | 4.7 -488% | 1 -25% | 1.1 -38% | 3.1 -288% | 2.4 -200% |
| Gamma | 2.19 100% | 2.3 96% | 2.24 98% | 2.25 98% | 2.486 88% | 2.16 102% |
| CCT | 6395 102% | 6476 100% | 6373 102% | 6319 103% | 6832 95% | 6544 99% |
| Contrast (:1) | 1065 | 1126 | 46905 | |||
| Moyenne finale (programmes/paramètres) | -580% /
-345% | -21% /
-34% | -32% /
-51% | -503% /
-306% | -177% /
-147% |
* ... Moindre est la valeur, meilleures sont les performances
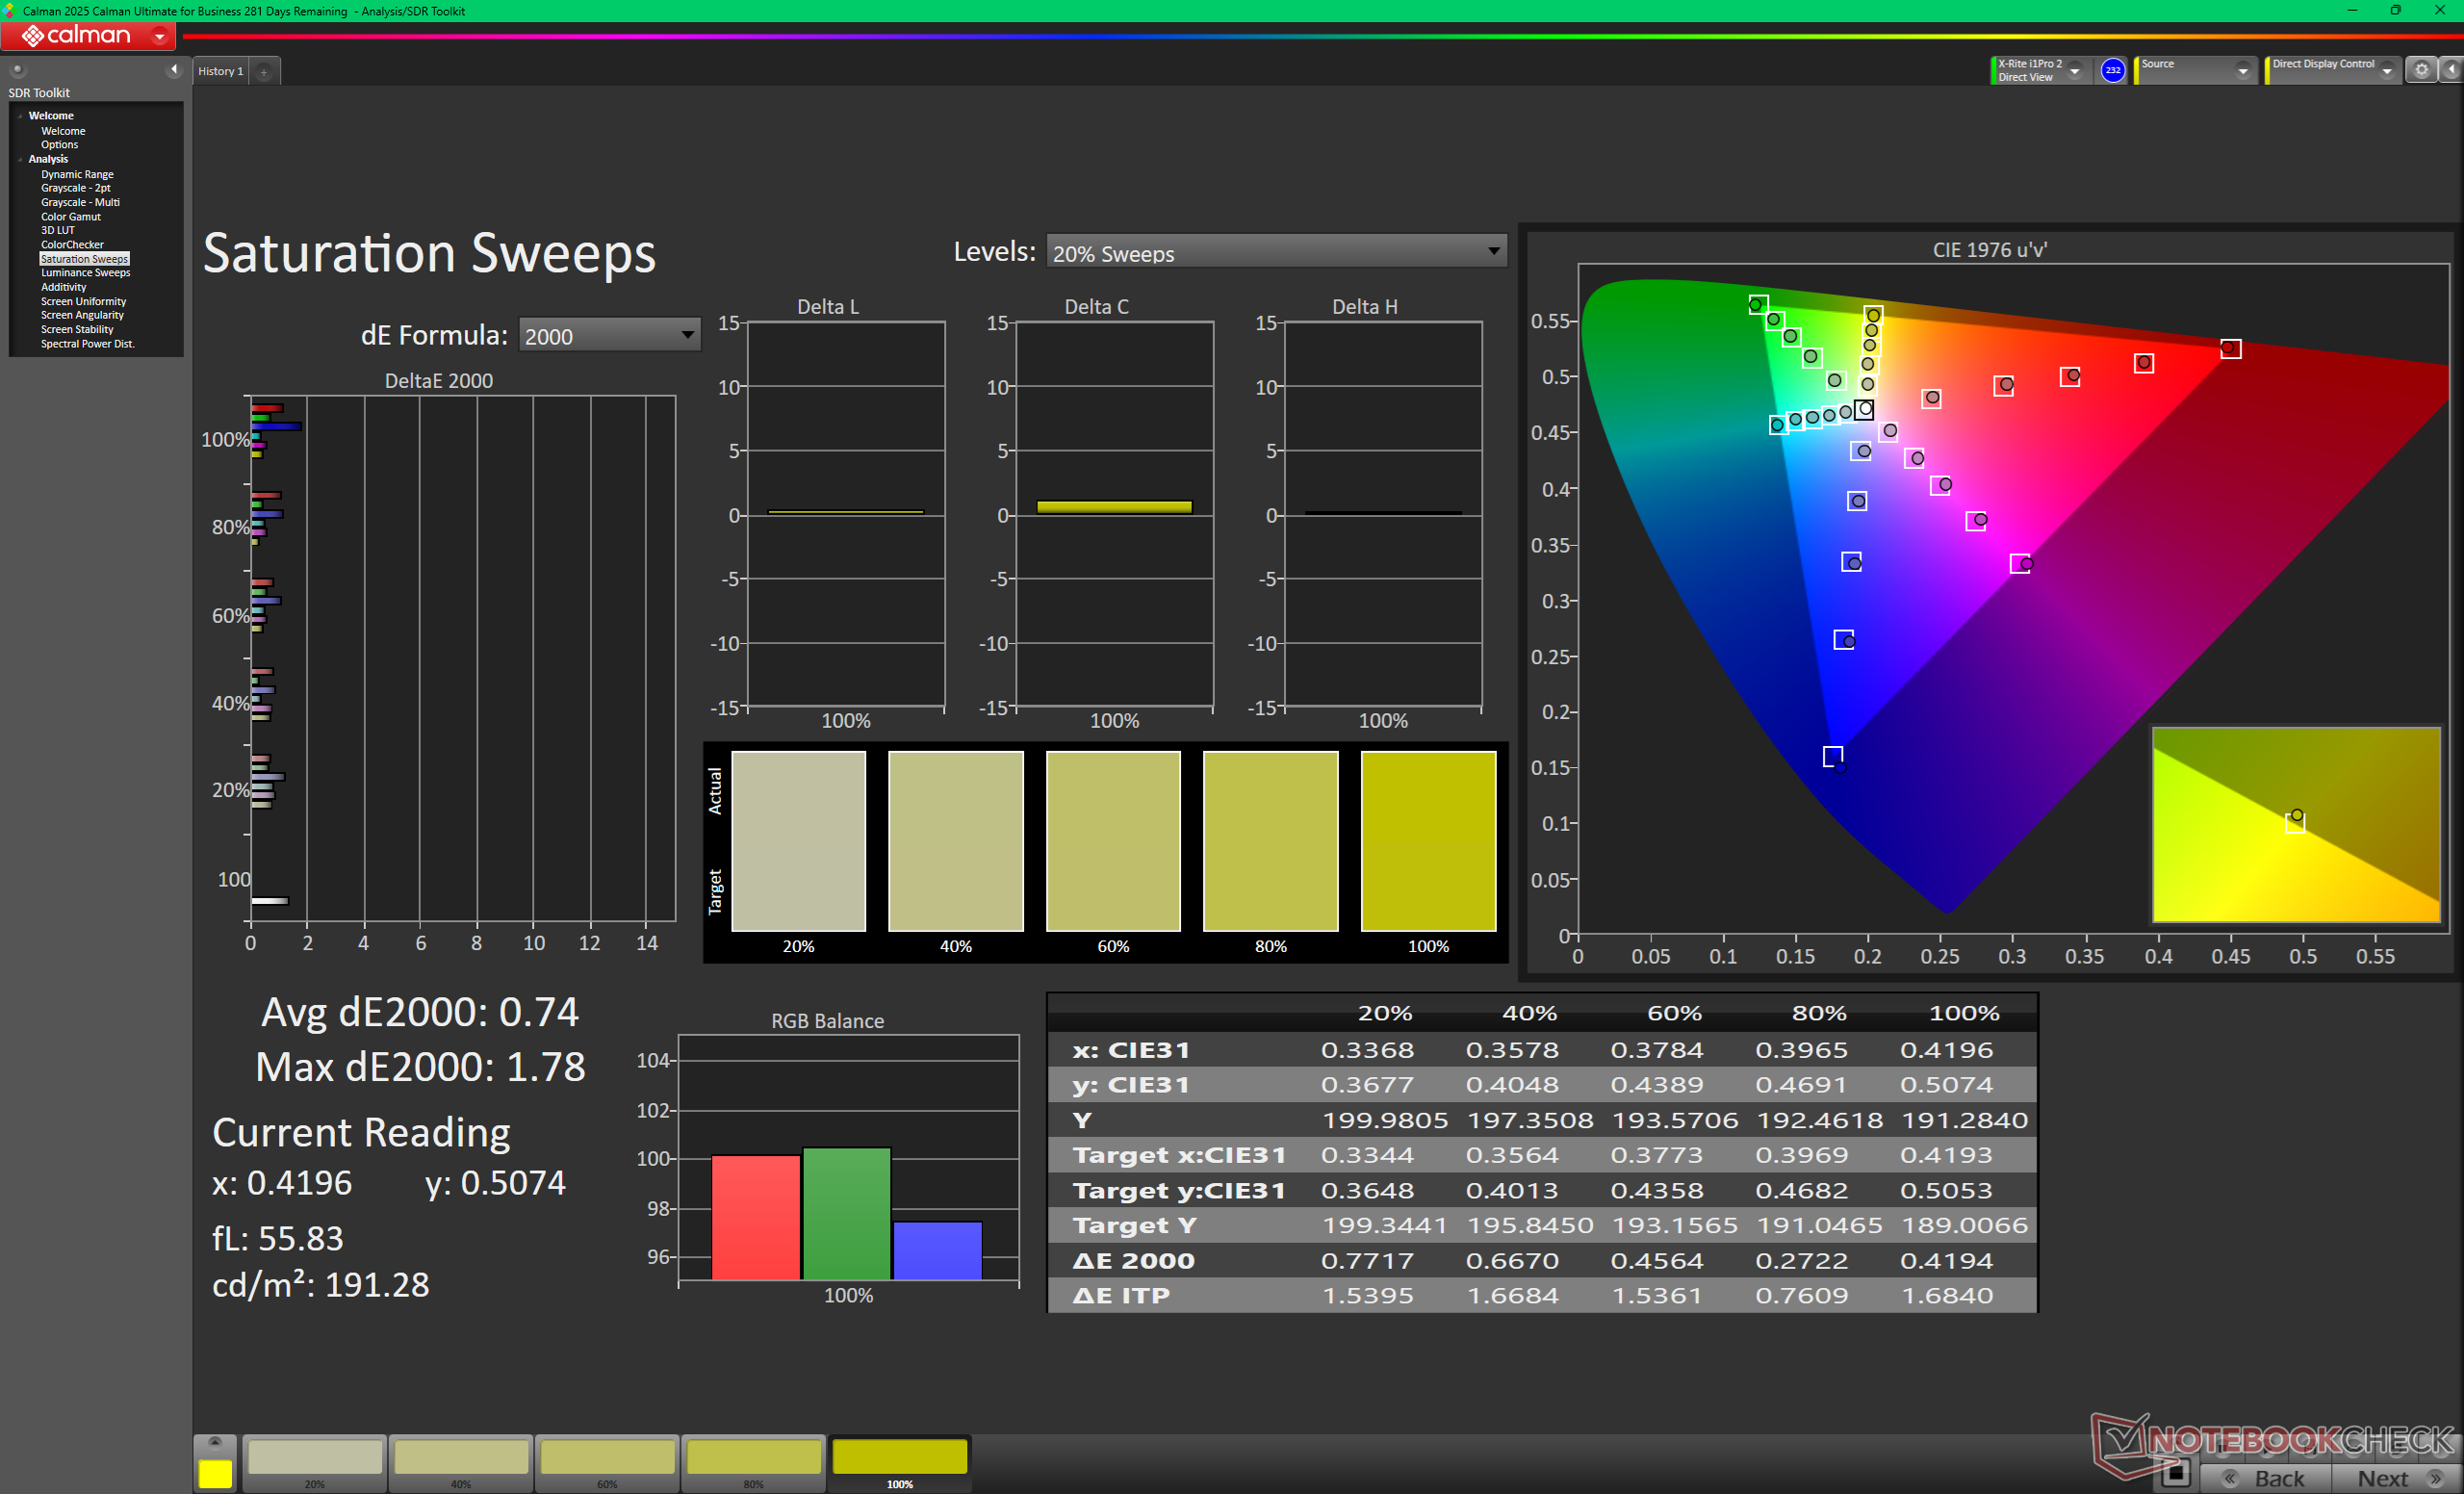
L'écran est bien calibré dès sa sortie de l'emballage, avec des valeurs moyennes de deltaE bien inférieures à 2. Un étalonnage par l'utilisateur final ne devrait pas être nécessaire dans la plupart des cas.


Temps de réponse de l'écran
| ↔ Temps de réponse noir à blanc | ||
|---|---|---|
| 0.41 ms ... hausse ↗ et chute ↘ combinées | ↗ 0.2 ms hausse | 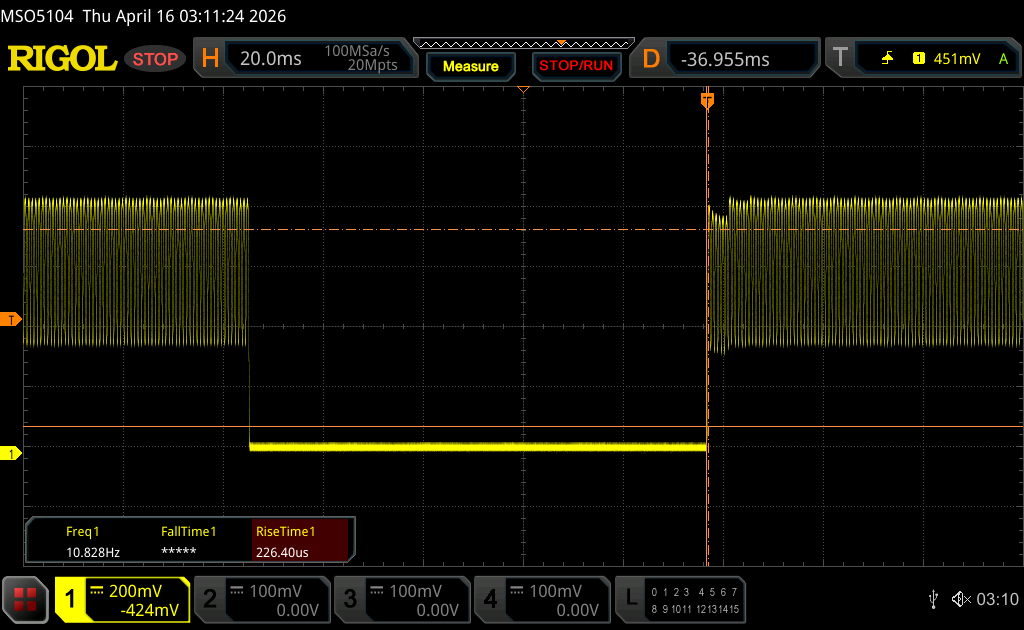 |
| ↘ 0.21 ms chute | ||
| L'écran montre de très faibles temps de réponse, parfait pour le jeu. En comparaison, tous les appareils testés affichent entre 0.1 (minimum) et 240 (maximum) ms. » 0 % des appareils testés affichent de meilleures performances. Cela signifie que les latences relevées sont meilleures que la moyenne (19.8 ms) de tous les appareils testés. | ||
| ↔ Temps de réponse gris 50% à gris 80% | ||
| 0.29 ms ... hausse ↗ et chute ↘ combinées | ↗ 0.15 ms hausse | 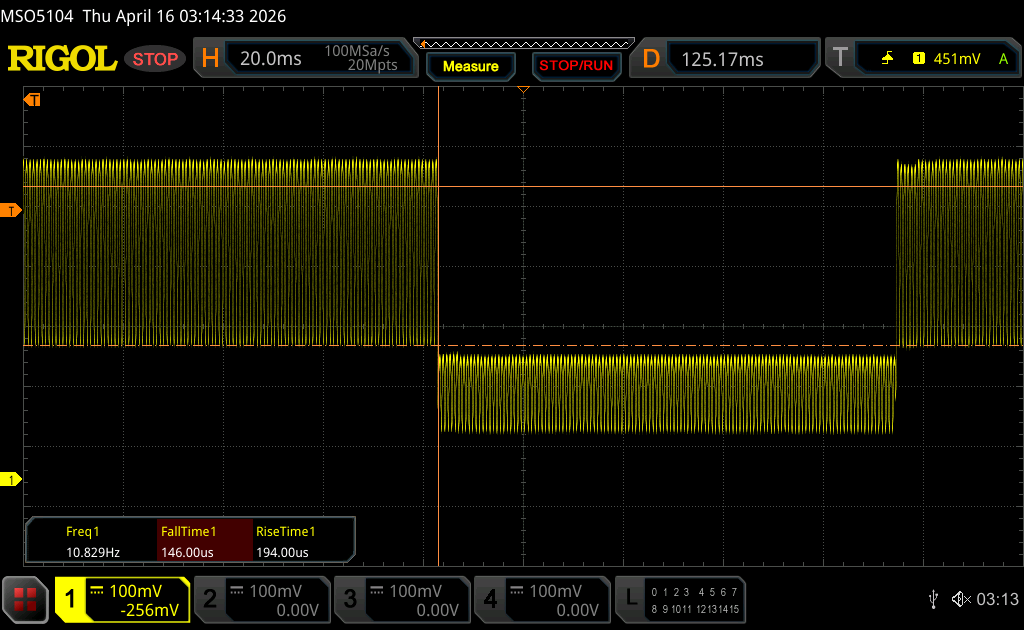 |
| ↘ 0.14 ms chute | ||
| L'écran montre de très faibles temps de réponse, parfait pour le jeu. En comparaison, tous les appareils testés affichent entre 0.165 (minimum) et 636 (maximum) ms. » 0 % des appareils testés affichent de meilleures performances. Cela signifie que les latences relevées sont meilleures que la moyenne (31 ms) de tous les appareils testés. | ||
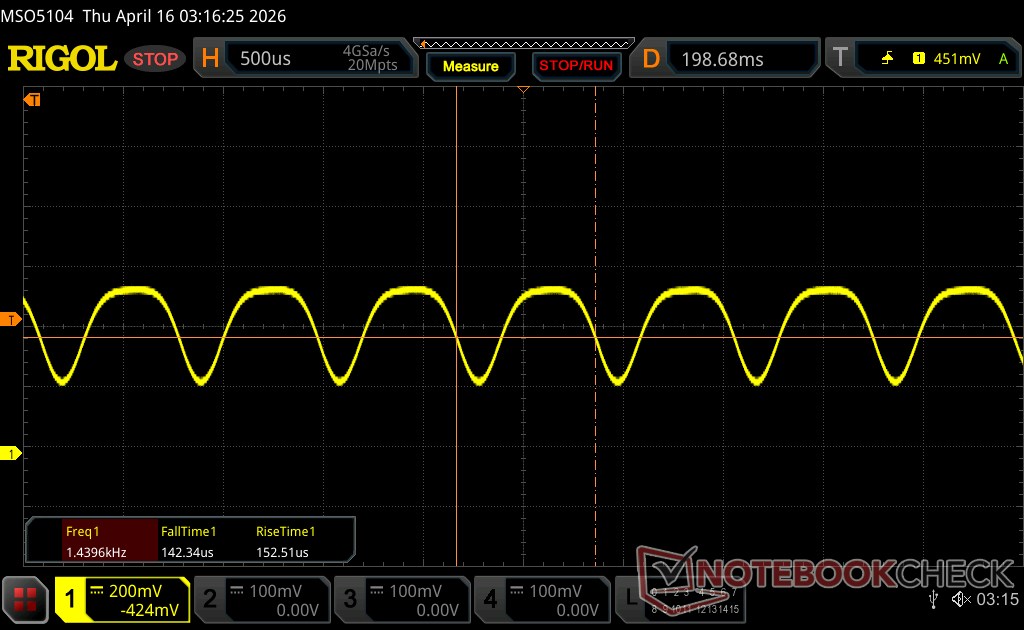
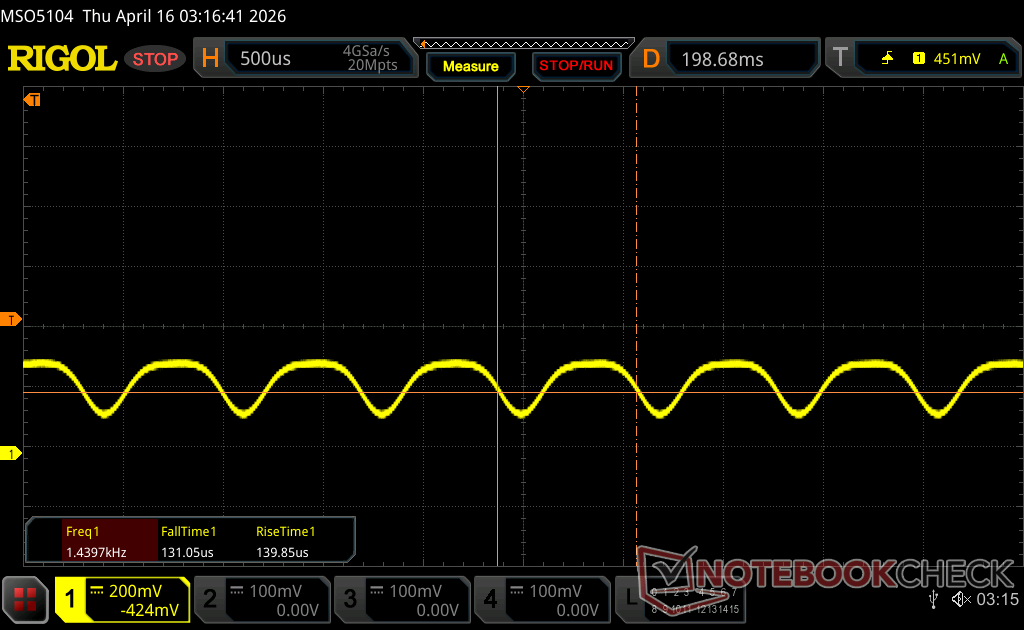
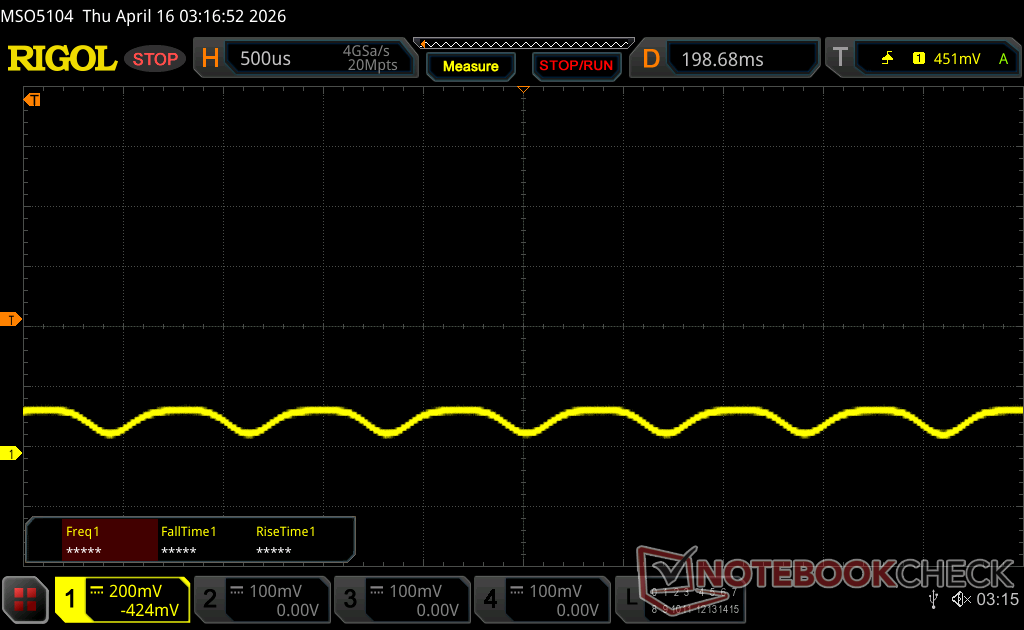
Scintillement / MLI (Modulation de largeur d'impulsion)
| Scintillement / MLI (Modulation de largeur d'impulsion) décelé | 1440 Hz Amplitude: 30 % | ≤ 100 Niveau de luminosité | 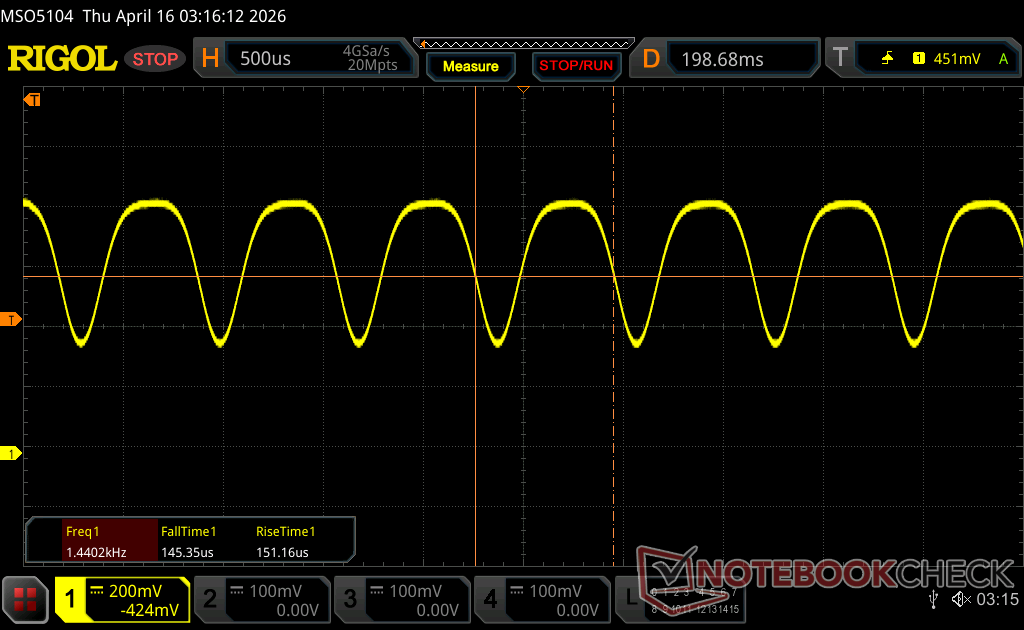 |
Le rétroéclairage de l'écran scintille à la fréquence de 1440 Hz (certainement du fait de l'utilisation d'une MDI - Modulation de largeur d'impulsion) à un niveau de luminosité inférieur ou égal à 100 % . Aucun scintillement ne devrait être perceptible au-dessus de cette valeur. La fréquence de rafraîchissement de 1440 Hz est élevée, la grande majorité des utilisateurs ne devrait pas percevoir de scintillements et être sujette à une fatigue oculaire accrue. En comparaison, 52 % des appareils testés n'emploient pas MDI pour assombrir leur écran. Nous avons relevé une moyenne à 7747 (minimum : 5 - maximum : 343500) Hz dans le cas où une MDI était active. | |||


Performance
Conditions d'essai
Nous avons réglé Windows en mode Performance et Alienware Command Center en mode Overdrive avant d'exécuter les tests de référence ci-dessous. Le mode Overdrive est nécessaire pour obtenir des performances graphiques maximales.
Processeur
Le Core Ultra 9 290HX Plus offre des performances mono et multithread jusqu'à 15 % et 25 % plus rapides, respectivement, par rapport au Core Ultra 9 275HX de l'Alienware 16 Area-51 de l'année dernière. Cette amélioration place le processeur Arrow Lake au coude à coude avec le processeur concurrent Ryzen 9 9955HX3D.
Cinebench R15 Multi Loop
Cinebench R23: Multi Core | Single Core
Cinebench R20: CPU (Multi Core) | CPU (Single Core)
Cinebench R15: CPU Multi 64Bit | CPU Single 64Bit
Blender: v2.79 BMW27 CPU
7-Zip 18.03: 7z b 4 | 7z b 4 -mmt1
Geekbench 6.7: Multi-Core | Single-Core
Geekbench 5.5: Multi-Core | Single-Core
HWBOT x265 Benchmark v2.2: 4k Preset
LibreOffice : 20 Documents To PDF
R Benchmark 2.5: Overall mean
* ... Moindre est la valeur, meilleures sont les performances
AIDA64: FP32 Ray-Trace | FPU Julia | CPU SHA3 | CPU Queen | FPU SinJulia | FPU Mandel | CPU AES | CPU ZLib | FP64 Ray-Trace | CPU PhotoWorxx | CPU CheckMate
| Performance rating | |
| Alienware 16 Area-51 Core Ultra 9 290HX Plus -1! | |
| Moyenne Intel Core Ultra 9 290HX Plus -1! | |
| Lenovo Legion Pro 7i 16 Gen 10 -1! | |
| Alienware 16 Area-51 -1! | |
| HP Omen Max 16 ah000 -1! | |
| MSI Vector 16 HX AI A2XWHG -1! | |
| Asus ROG Zephyrus G16 GU605CW -1! | |
| AIDA64 / FP32 Ray-Trace | |
| Alienware 16 Area-51 Core Ultra 9 290HX Plus (v8.20.8100) | |
| Moyenne Intel Core Ultra 9 290HX Plus (34761 - 40761, n=4) | |
| Lenovo Legion Pro 7i 16 Gen 10 (v6.92.6600) | |
| Alienware 16 Area-51 (v6.92.6600) | |
| HP Omen Max 16 ah000 (v6.92.6600) | |
| MSI Vector 16 HX AI A2XWHG (v6.92.6600) | |
| Asus ROG Zephyrus G16 GU605CW (v6.92.6600) | |
| AIDA64 / FPU Julia | |
| Alienware 16 Area-51 Core Ultra 9 290HX Plus (v8.20.8100) | |
| Moyenne Intel Core Ultra 9 290HX Plus (174665 - 208083, n=4) | |
| Lenovo Legion Pro 7i 16 Gen 10 (v6.92.6600) | |
| HP Omen Max 16 ah000 (v6.92.6600) | |
| Alienware 16 Area-51 (v6.92.6600) | |
| MSI Vector 16 HX AI A2XWHG (v6.92.6600) | |
| Asus ROG Zephyrus G16 GU605CW (v6.92.6600) | |
| AIDA64 / CPU SHA3 | |
| Alienware 16 Area-51 Core Ultra 9 290HX Plus (v8.20.8100) | |
| Moyenne Intel Core Ultra 9 290HX Plus (8352 - 9784, n=4) | |
| Lenovo Legion Pro 7i 16 Gen 10 (v6.92.6600) | |
| Alienware 16 Area-51 (v6.92.6600) | |
| HP Omen Max 16 ah000 (v6.92.6600) | |
| MSI Vector 16 HX AI A2XWHG (v6.92.6600) | |
| Asus ROG Zephyrus G16 GU605CW (v6.92.6600) | |
| AIDA64 / CPU Queen | |
| Lenovo Legion Pro 7i 16 Gen 10 (v6.92.6600) | |
| Alienware 16 Area-51 (v6.92.6600) | |
| HP Omen Max 16 ah000 (v6.92.6600) | |
| MSI Vector 16 HX AI A2XWHG (v6.92.6600) | |
| Asus ROG Zephyrus G16 GU605CW (v6.92.6600) | |
| AIDA64 / FPU SinJulia | |
| Lenovo Legion Pro 7i 16 Gen 10 (v6.92.6600) | |
| Moyenne Intel Core Ultra 9 290HX Plus (13612 - 14461, n=4) | |
| Alienware 16 Area-51 Core Ultra 9 290HX Plus (v8.20.8100) | |
| Alienware 16 Area-51 (v6.92.6600) | |
| HP Omen Max 16 ah000 (v6.92.6600) | |
| MSI Vector 16 HX AI A2XWHG (v6.92.6600) | |
| Asus ROG Zephyrus G16 GU605CW (v6.92.6600) | |
| AIDA64 / FPU Mandel | |
| Alienware 16 Area-51 Core Ultra 9 290HX Plus (v8.20.8100) | |
| Moyenne Intel Core Ultra 9 290HX Plus (91215 - 108275, n=4) | |
| Lenovo Legion Pro 7i 16 Gen 10 (v6.92.6600) | |
| HP Omen Max 16 ah000 (v6.92.6600) | |
| Alienware 16 Area-51 (v6.92.6600) | |
| MSI Vector 16 HX AI A2XWHG (v6.92.6600) | |
| Asus ROG Zephyrus G16 GU605CW (v6.92.6600) | |
| AIDA64 / CPU AES | |
| Lenovo Legion Pro 7i 16 Gen 10 (v6.92.6600) | |
| Moyenne Intel Core Ultra 9 290HX Plus (127585 - 136781, n=4) | |
| Alienware 16 Area-51 Core Ultra 9 290HX Plus (v8.20.8100) | |
| Alienware 16 Area-51 (v6.92.6600) | |
| HP Omen Max 16 ah000 (v6.92.6600) | |
| MSI Vector 16 HX AI A2XWHG (v6.92.6600) | |
| Asus ROG Zephyrus G16 GU605CW (v6.92.6600) | |
| AIDA64 / CPU ZLib | |
| Alienware 16 Area-51 Core Ultra 9 290HX Plus (v8.20.8100) | |
| Moyenne Intel Core Ultra 9 290HX Plus (1967 - 2206, n=4) | |
| Lenovo Legion Pro 7i 16 Gen 10 (v6.92.6600) | |
| Alienware 16 Area-51 (v6.92.6600) | |
| HP Omen Max 16 ah000 (v6.92.6600) | |
| MSI Vector 16 HX AI A2XWHG (v6.92.6600) | |
| Asus ROG Zephyrus G16 GU605CW (v6.92.6600) | |
| AIDA64 / FP64 Ray-Trace | |
| Alienware 16 Area-51 Core Ultra 9 290HX Plus (v8.20.8100) | |
| Moyenne Intel Core Ultra 9 290HX Plus (18611 - 21949, n=4) | |
| Lenovo Legion Pro 7i 16 Gen 10 (v6.92.6600) | |
| Alienware 16 Area-51 (v6.92.6600) | |
| HP Omen Max 16 ah000 (v6.92.6600) | |
| MSI Vector 16 HX AI A2XWHG (v6.92.6600) | |
| Asus ROG Zephyrus G16 GU605CW (v6.92.6600) | |
| AIDA64 / CPU PhotoWorxx | |
| Asus ROG Zephyrus G16 GU605CW (v6.92.6600) | |
| Alienware 16 Area-51 Core Ultra 9 290HX Plus (v8.20.8100) | |
| Lenovo Legion Pro 7i 16 Gen 10 (v6.92.6600) | |
| Alienware 16 Area-51 (v6.92.6600) | |
| Moyenne Intel Core Ultra 9 290HX Plus (51134 - 55731, n=4) | |
| HP Omen Max 16 ah000 (v6.92.6600) | |
| MSI Vector 16 HX AI A2XWHG (v6.92.6600) | |
| AIDA64 / CPU CheckMate | |
| Alienware 16 Area-51 Core Ultra 9 290HX Plus (v8.20.8100) | |
| Moyenne Intel Core Ultra 9 290HX Plus (7624 - 8322, n=4) | |
Performance du système
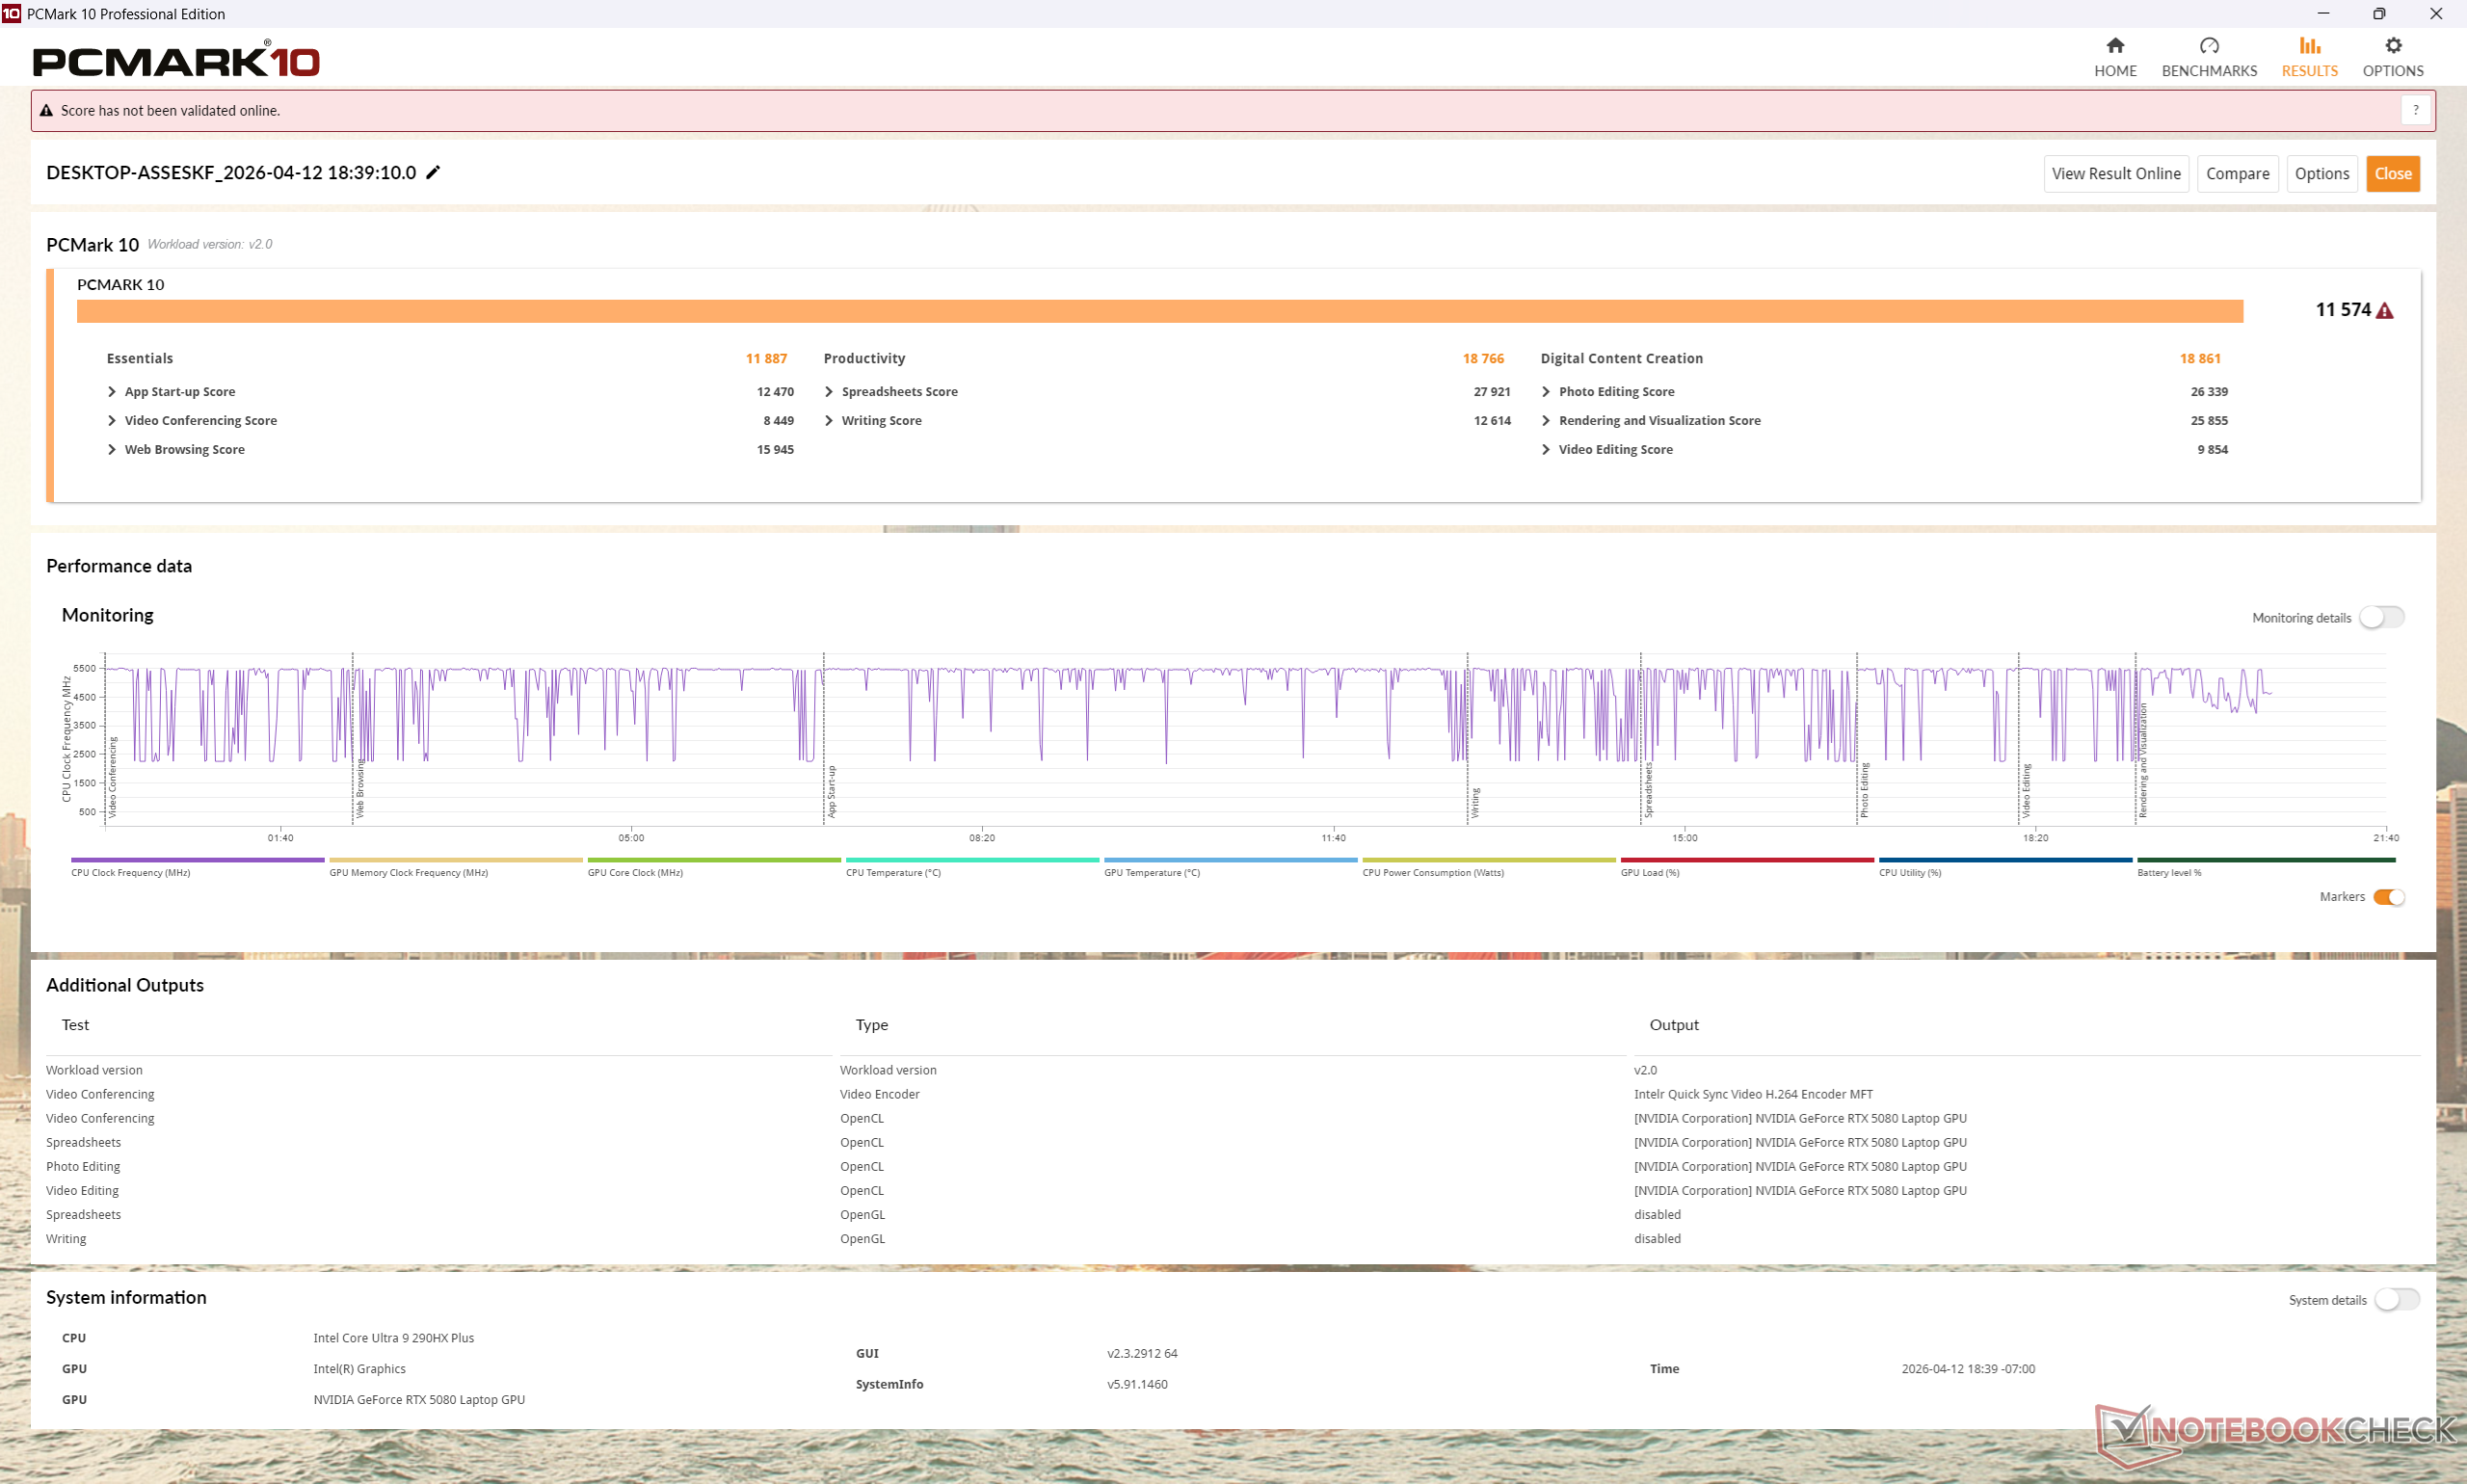
PCMark 10: Score | Essentials | Productivity | Digital Content Creation
CrossMark: Overall | Productivity | Creativity | Responsiveness
WebXPRT 3: Overall
WebXPRT 4: Overall
Mozilla Kraken 1.1: Total
| Performance rating | |
| Alienware 16 Area-51 Core Ultra 9 290HX Plus | |
| Moyenne Intel Core Ultra 9 290HX Plus, NVIDIA GeForce RTX 5080 Laptop | |
| Alienware 16 Area-51 | |
| Lenovo Legion Pro 7i 16 Gen 10 | |
| HP Omen Max 16 ah000 -1! | |
| MSI Vector 16 HX AI A2XWHG | |
| Asus ROG Zephyrus G16 GU605CW | |
| PCMark 10 / Score | |
| Alienware 16 Area-51 Core Ultra 9 290HX Plus | |
| Moyenne Intel Core Ultra 9 290HX Plus, NVIDIA GeForce RTX 5080 Laptop (n=1) | |
| Lenovo Legion Pro 7i 16 Gen 10 | |
| HP Omen Max 16 ah000 | |
| Alienware 16 Area-51 | |
| MSI Vector 16 HX AI A2XWHG | |
| Asus ROG Zephyrus G16 GU605CW | |
| PCMark 10 / Essentials | |
| Alienware 16 Area-51 Core Ultra 9 290HX Plus | |
| Moyenne Intel Core Ultra 9 290HX Plus, NVIDIA GeForce RTX 5080 Laptop (n=1) | |
| Lenovo Legion Pro 7i 16 Gen 10 | |
| Alienware 16 Area-51 | |
| HP Omen Max 16 ah000 | |
| MSI Vector 16 HX AI A2XWHG | |
| Asus ROG Zephyrus G16 GU605CW | |
| PCMark 10 / Productivity | |
| Alienware 16 Area-51 Core Ultra 9 290HX Plus | |
| Moyenne Intel Core Ultra 9 290HX Plus, NVIDIA GeForce RTX 5080 Laptop (n=1) | |
| Lenovo Legion Pro 7i 16 Gen 10 | |
| MSI Vector 16 HX AI A2XWHG | |
| Alienware 16 Area-51 | |
| HP Omen Max 16 ah000 | |
| Asus ROG Zephyrus G16 GU605CW | |
| PCMark 10 / Digital Content Creation | |
| Lenovo Legion Pro 7i 16 Gen 10 | |
| Alienware 16 Area-51 Core Ultra 9 290HX Plus | |
| Moyenne Intel Core Ultra 9 290HX Plus, NVIDIA GeForce RTX 5080 Laptop (n=1) | |
| HP Omen Max 16 ah000 | |
| Alienware 16 Area-51 | |
| Asus ROG Zephyrus G16 GU605CW | |
| MSI Vector 16 HX AI A2XWHG | |
| CrossMark / Overall | |
| Alienware 16 Area-51 Core Ultra 9 290HX Plus | |
| Moyenne Intel Core Ultra 9 290HX Plus, NVIDIA GeForce RTX 5080 Laptop (n=1) | |
| Alienware 16 Area-51 | |
| Lenovo Legion Pro 7i 16 Gen 10 | |
| HP Omen Max 16 ah000 | |
| MSI Vector 16 HX AI A2XWHG | |
| Asus ROG Zephyrus G16 GU605CW | |
| CrossMark / Productivity | |
| Alienware 16 Area-51 Core Ultra 9 290HX Plus | |
| Moyenne Intel Core Ultra 9 290HX Plus, NVIDIA GeForce RTX 5080 Laptop (n=1) | |
| Alienware 16 Area-51 | |
| Lenovo Legion Pro 7i 16 Gen 10 | |
| HP Omen Max 16 ah000 | |
| MSI Vector 16 HX AI A2XWHG | |
| Asus ROG Zephyrus G16 GU605CW | |
| CrossMark / Creativity | |
| Alienware 16 Area-51 Core Ultra 9 290HX Plus | |
| Moyenne Intel Core Ultra 9 290HX Plus, NVIDIA GeForce RTX 5080 Laptop (n=1) | |
| Alienware 16 Area-51 | |
| Lenovo Legion Pro 7i 16 Gen 10 | |
| HP Omen Max 16 ah000 | |
| MSI Vector 16 HX AI A2XWHG | |
| Asus ROG Zephyrus G16 GU605CW | |
| CrossMark / Responsiveness | |
| Alienware 16 Area-51 Core Ultra 9 290HX Plus | |
| Moyenne Intel Core Ultra 9 290HX Plus, NVIDIA GeForce RTX 5080 Laptop (n=1) | |
| Alienware 16 Area-51 | |
| HP Omen Max 16 ah000 | |
| Lenovo Legion Pro 7i 16 Gen 10 | |
| MSI Vector 16 HX AI A2XWHG | |
| Asus ROG Zephyrus G16 GU605CW | |
| WebXPRT 3 / Overall | |
| Alienware 16 Area-51 Core Ultra 9 290HX Plus | |
| Moyenne Intel Core Ultra 9 290HX Plus, NVIDIA GeForce RTX 5080 Laptop (n=1) | |
| HP Omen Max 16 ah000 | |
| Lenovo Legion Pro 7i 16 Gen 10 | |
| Alienware 16 Area-51 | |
| MSI Vector 16 HX AI A2XWHG | |
| Asus ROG Zephyrus G16 GU605CW | |
| WebXPRT 4 / Overall | |
| Alienware 16 Area-51 Core Ultra 9 290HX Plus | |
| Moyenne Intel Core Ultra 9 290HX Plus, NVIDIA GeForce RTX 5080 Laptop (n=1) | |
| Lenovo Legion Pro 7i 16 Gen 10 | |
| Alienware 16 Area-51 | |
| MSI Vector 16 HX AI A2XWHG | |
| Asus ROG Zephyrus G16 GU605CW | |
| Mozilla Kraken 1.1 / Total | |
| Asus ROG Zephyrus G16 GU605CW | |
| MSI Vector 16 HX AI A2XWHG | |
| HP Omen Max 16 ah000 | |
| Alienware 16 Area-51 | |
| Lenovo Legion Pro 7i 16 Gen 10 | |
| Alienware 16 Area-51 Core Ultra 9 290HX Plus | |
| Moyenne Intel Core Ultra 9 290HX Plus, NVIDIA GeForce RTX 5080 Laptop (n=1) | |
* ... Moindre est la valeur, meilleures sont les performances
| PCMark 10 Score | 11574 points | |
Aide | ||
| AIDA64 / Memory Copy | |
| Asus ROG Zephyrus G16 GU605CW | |
| Alienware 16 Area-51 Core Ultra 9 290HX Plus | |
| Alienware 16 Area-51 | |
| Lenovo Legion Pro 7i 16 Gen 10 | |
| Moyenne Intel Core Ultra 9 290HX Plus (76912 - 86055, n=4) | |
| HP Omen Max 16 ah000 | |
| MSI Vector 16 HX AI A2XWHG | |
| AIDA64 / Memory Read | |
| Lenovo Legion Pro 7i 16 Gen 10 | |
| Alienware 16 Area-51 Core Ultra 9 290HX Plus | |
| Alienware 16 Area-51 | |
| Moyenne Intel Core Ultra 9 290HX Plus (84638 - 96309, n=4) | |
| HP Omen Max 16 ah000 | |
| MSI Vector 16 HX AI A2XWHG | |
| Asus ROG Zephyrus G16 GU605CW | |
| AIDA64 / Memory Write | |
| Lenovo Legion Pro 7i 16 Gen 10 | |
| Alienware 16 Area-51 | |
| Alienware 16 Area-51 Core Ultra 9 290HX Plus | |
| Moyenne Intel Core Ultra 9 290HX Plus (76094 - 85001, n=4) | |
| HP Omen Max 16 ah000 | |
| Asus ROG Zephyrus G16 GU605CW | |
| MSI Vector 16 HX AI A2XWHG | |
| AIDA64 / Memory Latency | |
| Asus ROG Zephyrus G16 GU605CW | |
| Alienware 16 Area-51 | |
| HP Omen Max 16 ah000 | |
| Lenovo Legion Pro 7i 16 Gen 10 | |
| MSI Vector 16 HX AI A2XWHG | |
| Alienware 16 Area-51 Core Ultra 9 290HX Plus | |
| Moyenne Intel Core Ultra 9 290HX Plus (100.7 - 108.4, n=4) | |
* ... Moindre est la valeur, meilleures sont les performances
Latence DPC
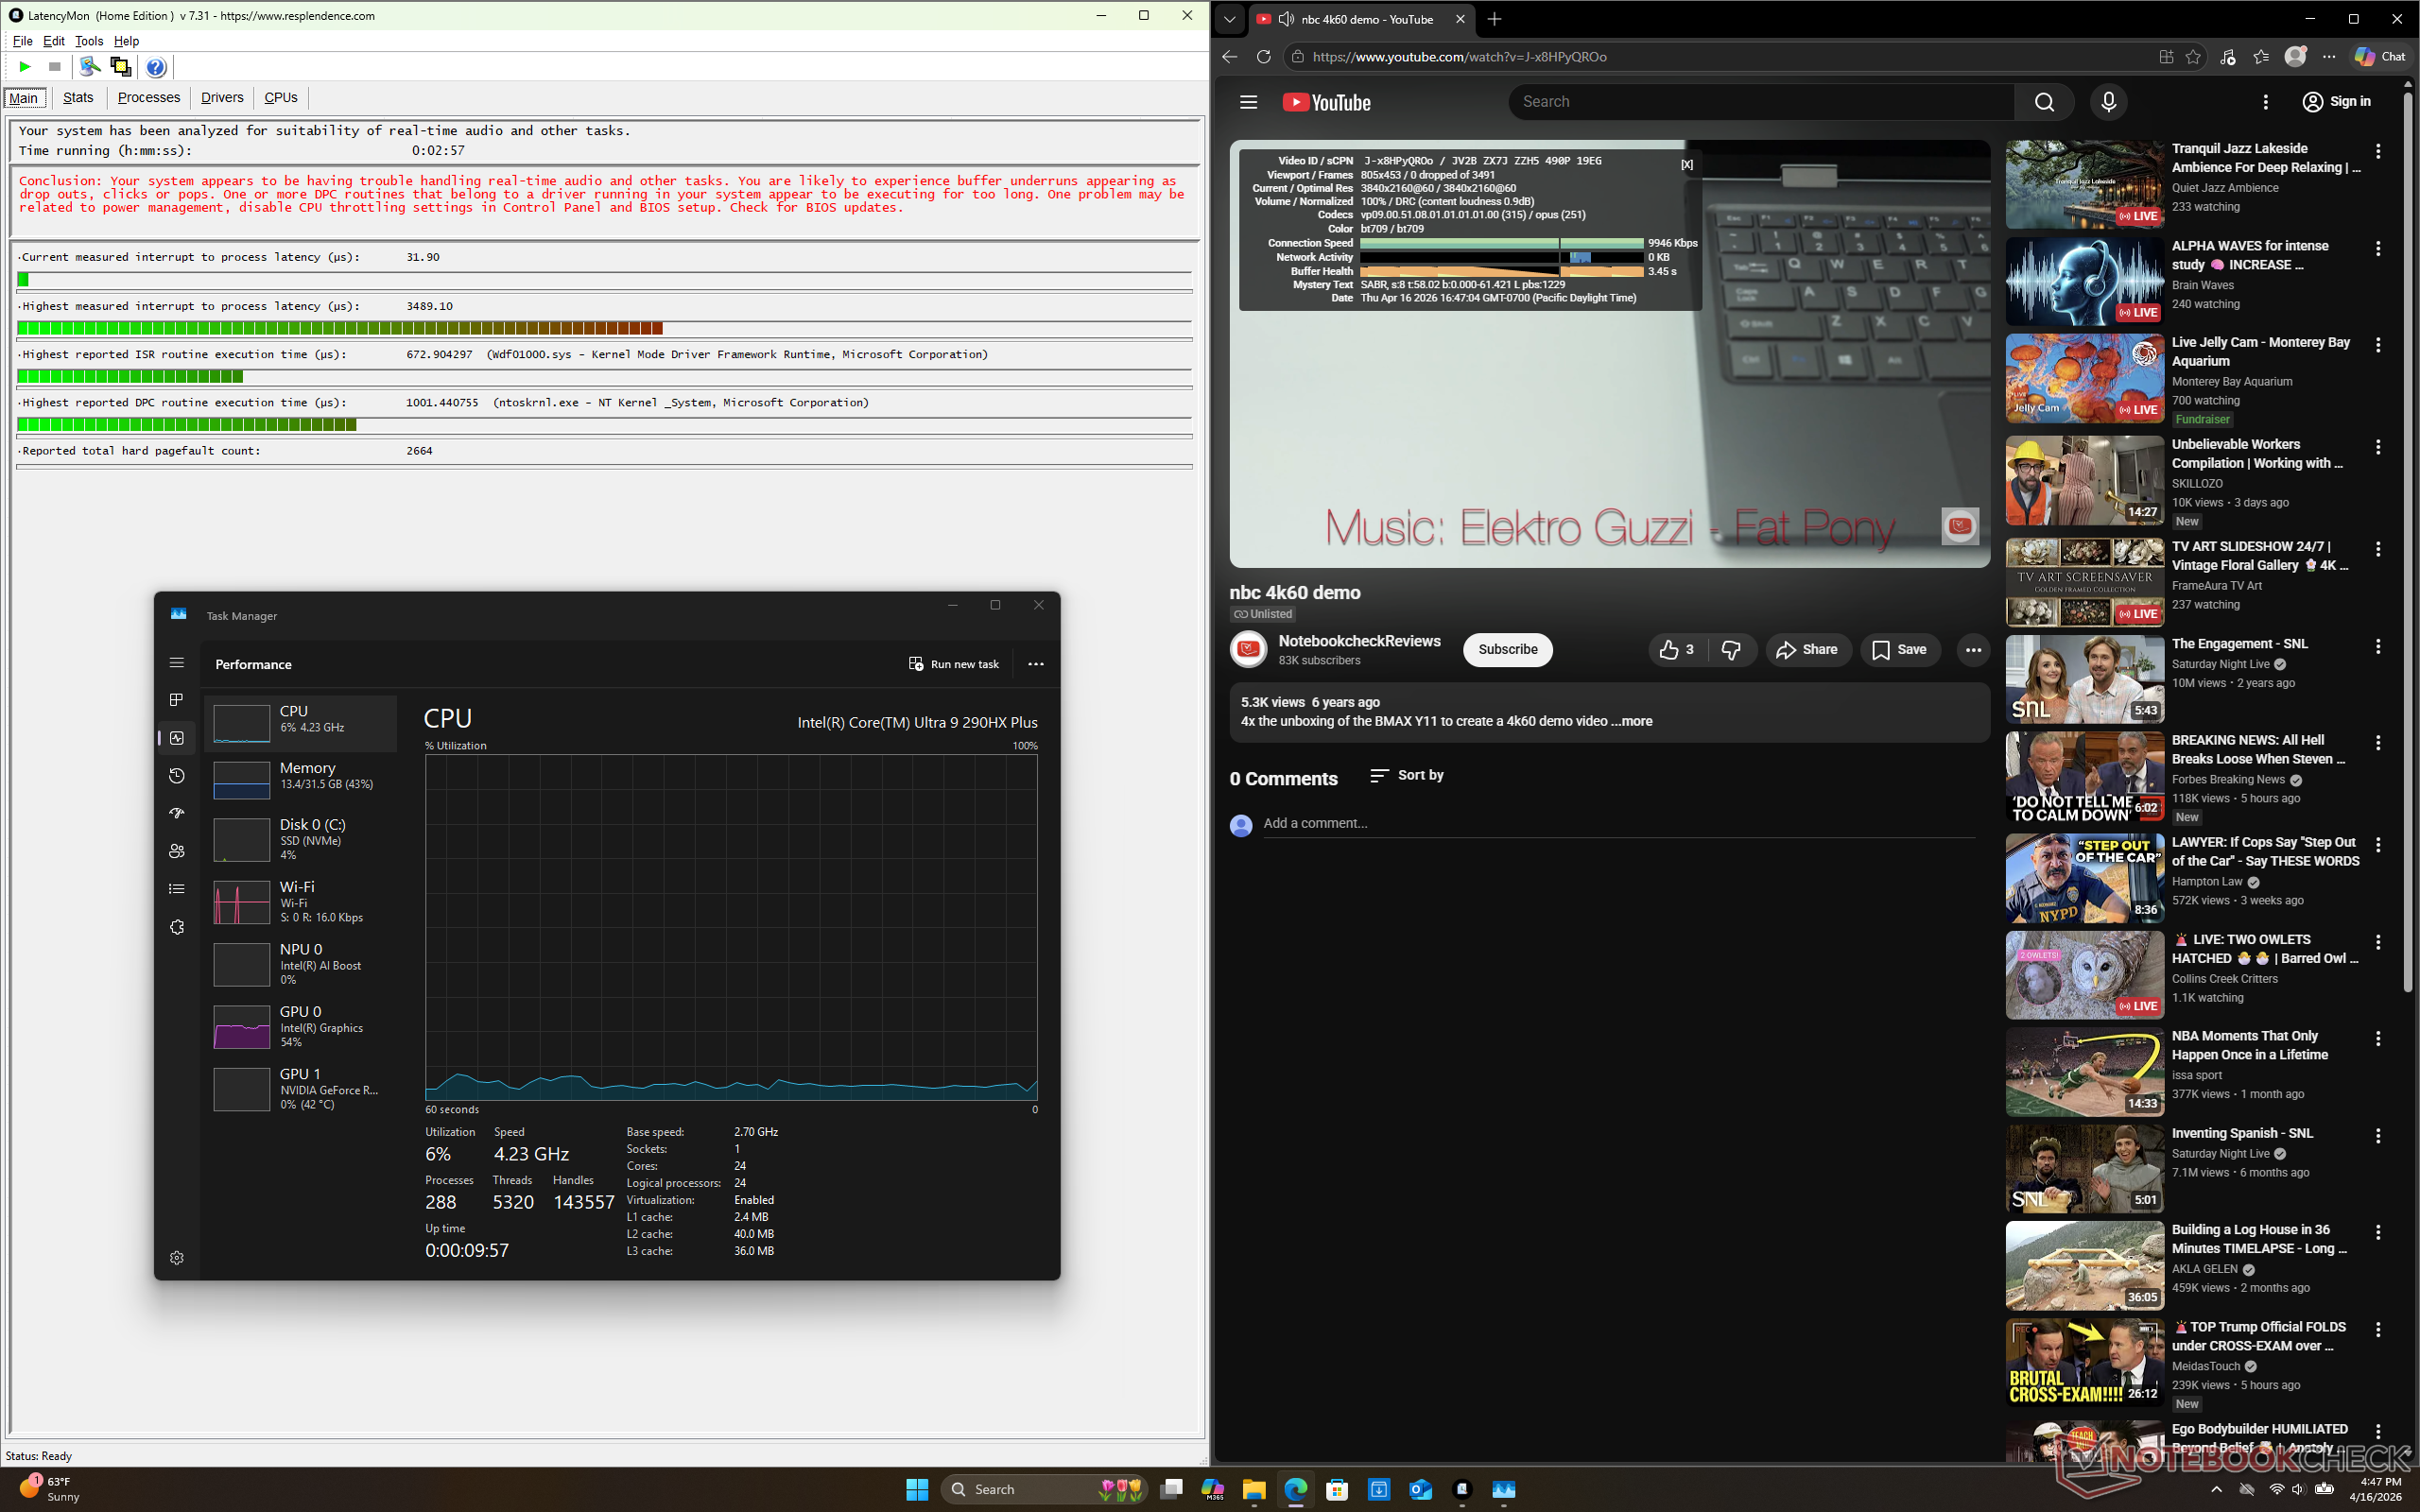
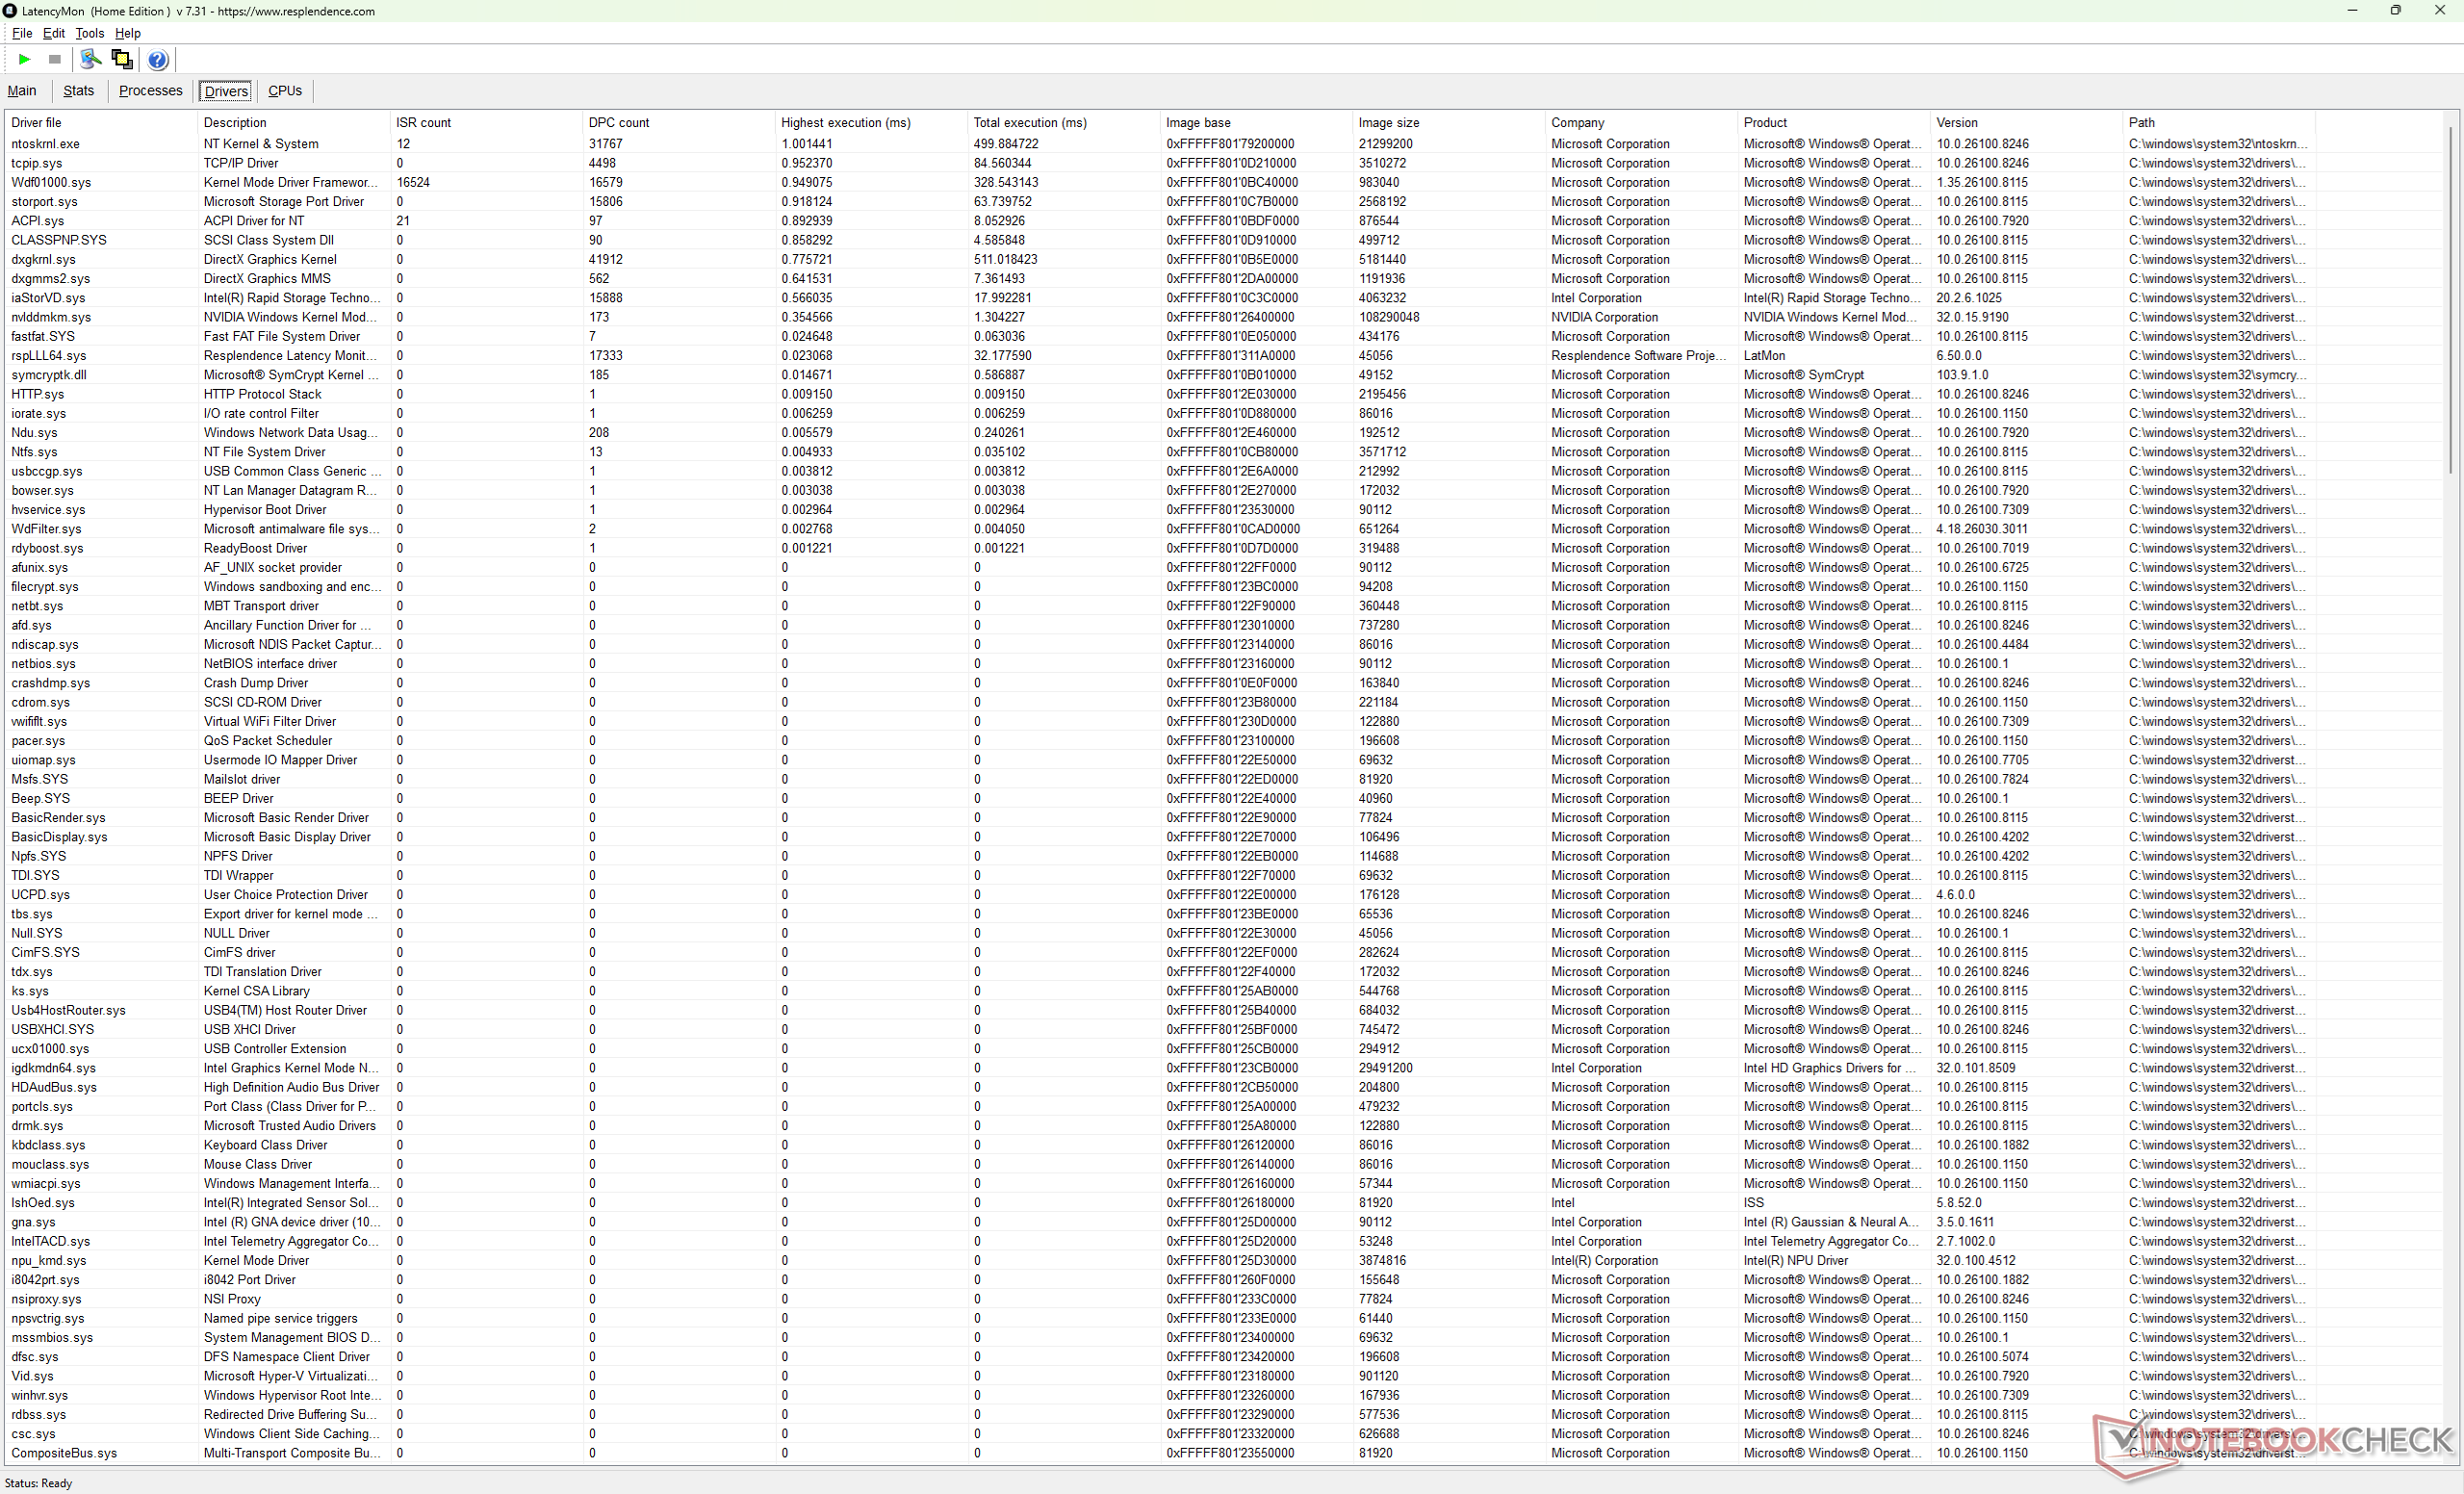
| DPC Latencies / LatencyMon - interrupt to process latency (max), Web, Youtube, Prime95 | |
| MSI Vector 16 HX AI A2XWHG | |
| Alienware 16 Area-51 Core Ultra 9 290HX Plus | |
| Alienware 16 Area-51 | |
| HP Omen Max 16 ah000 | |
| Asus ROG Zephyrus G16 GU605CW | |
| Lenovo Legion Pro 7i 16 Gen 10 | |
* ... Moindre est la valeur, meilleures sont les performances
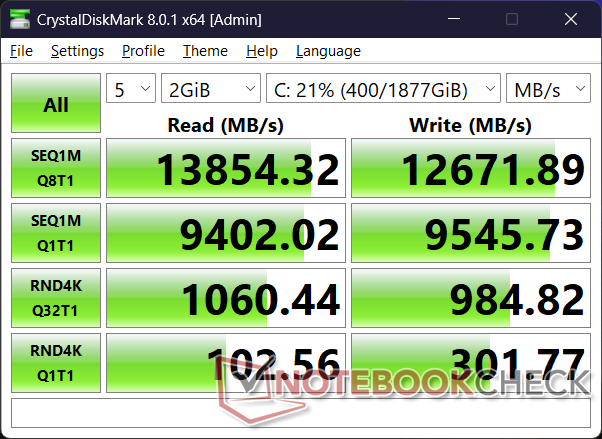
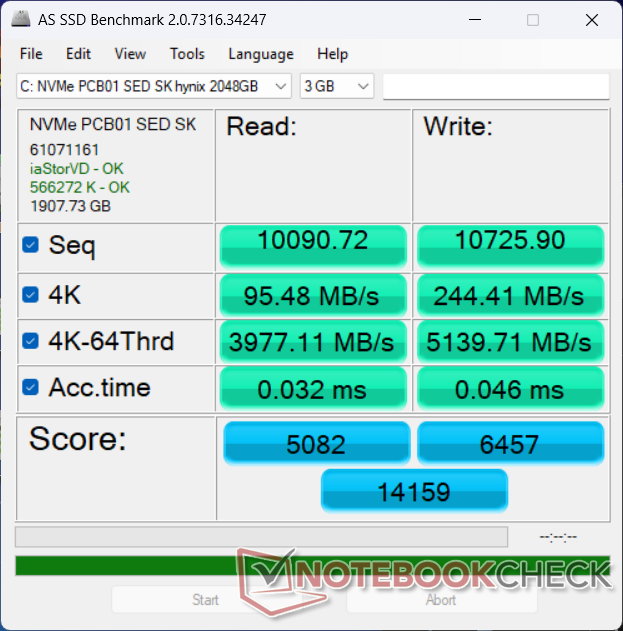
Dispositifs de stockage
De manière impressionnante, le SK Hynix PCB01 PCIe5 x4 NVMe SSD est capable de soutenir des taux de transfert de près de 14 000 Mo/s sans aucun ralentissement.

* ... Moindre est la valeur, meilleures sont les performances
Throttoir de disque : Boucle de lecture DiskSpd, profondeur de la file d'attente 8
Performance du GPU
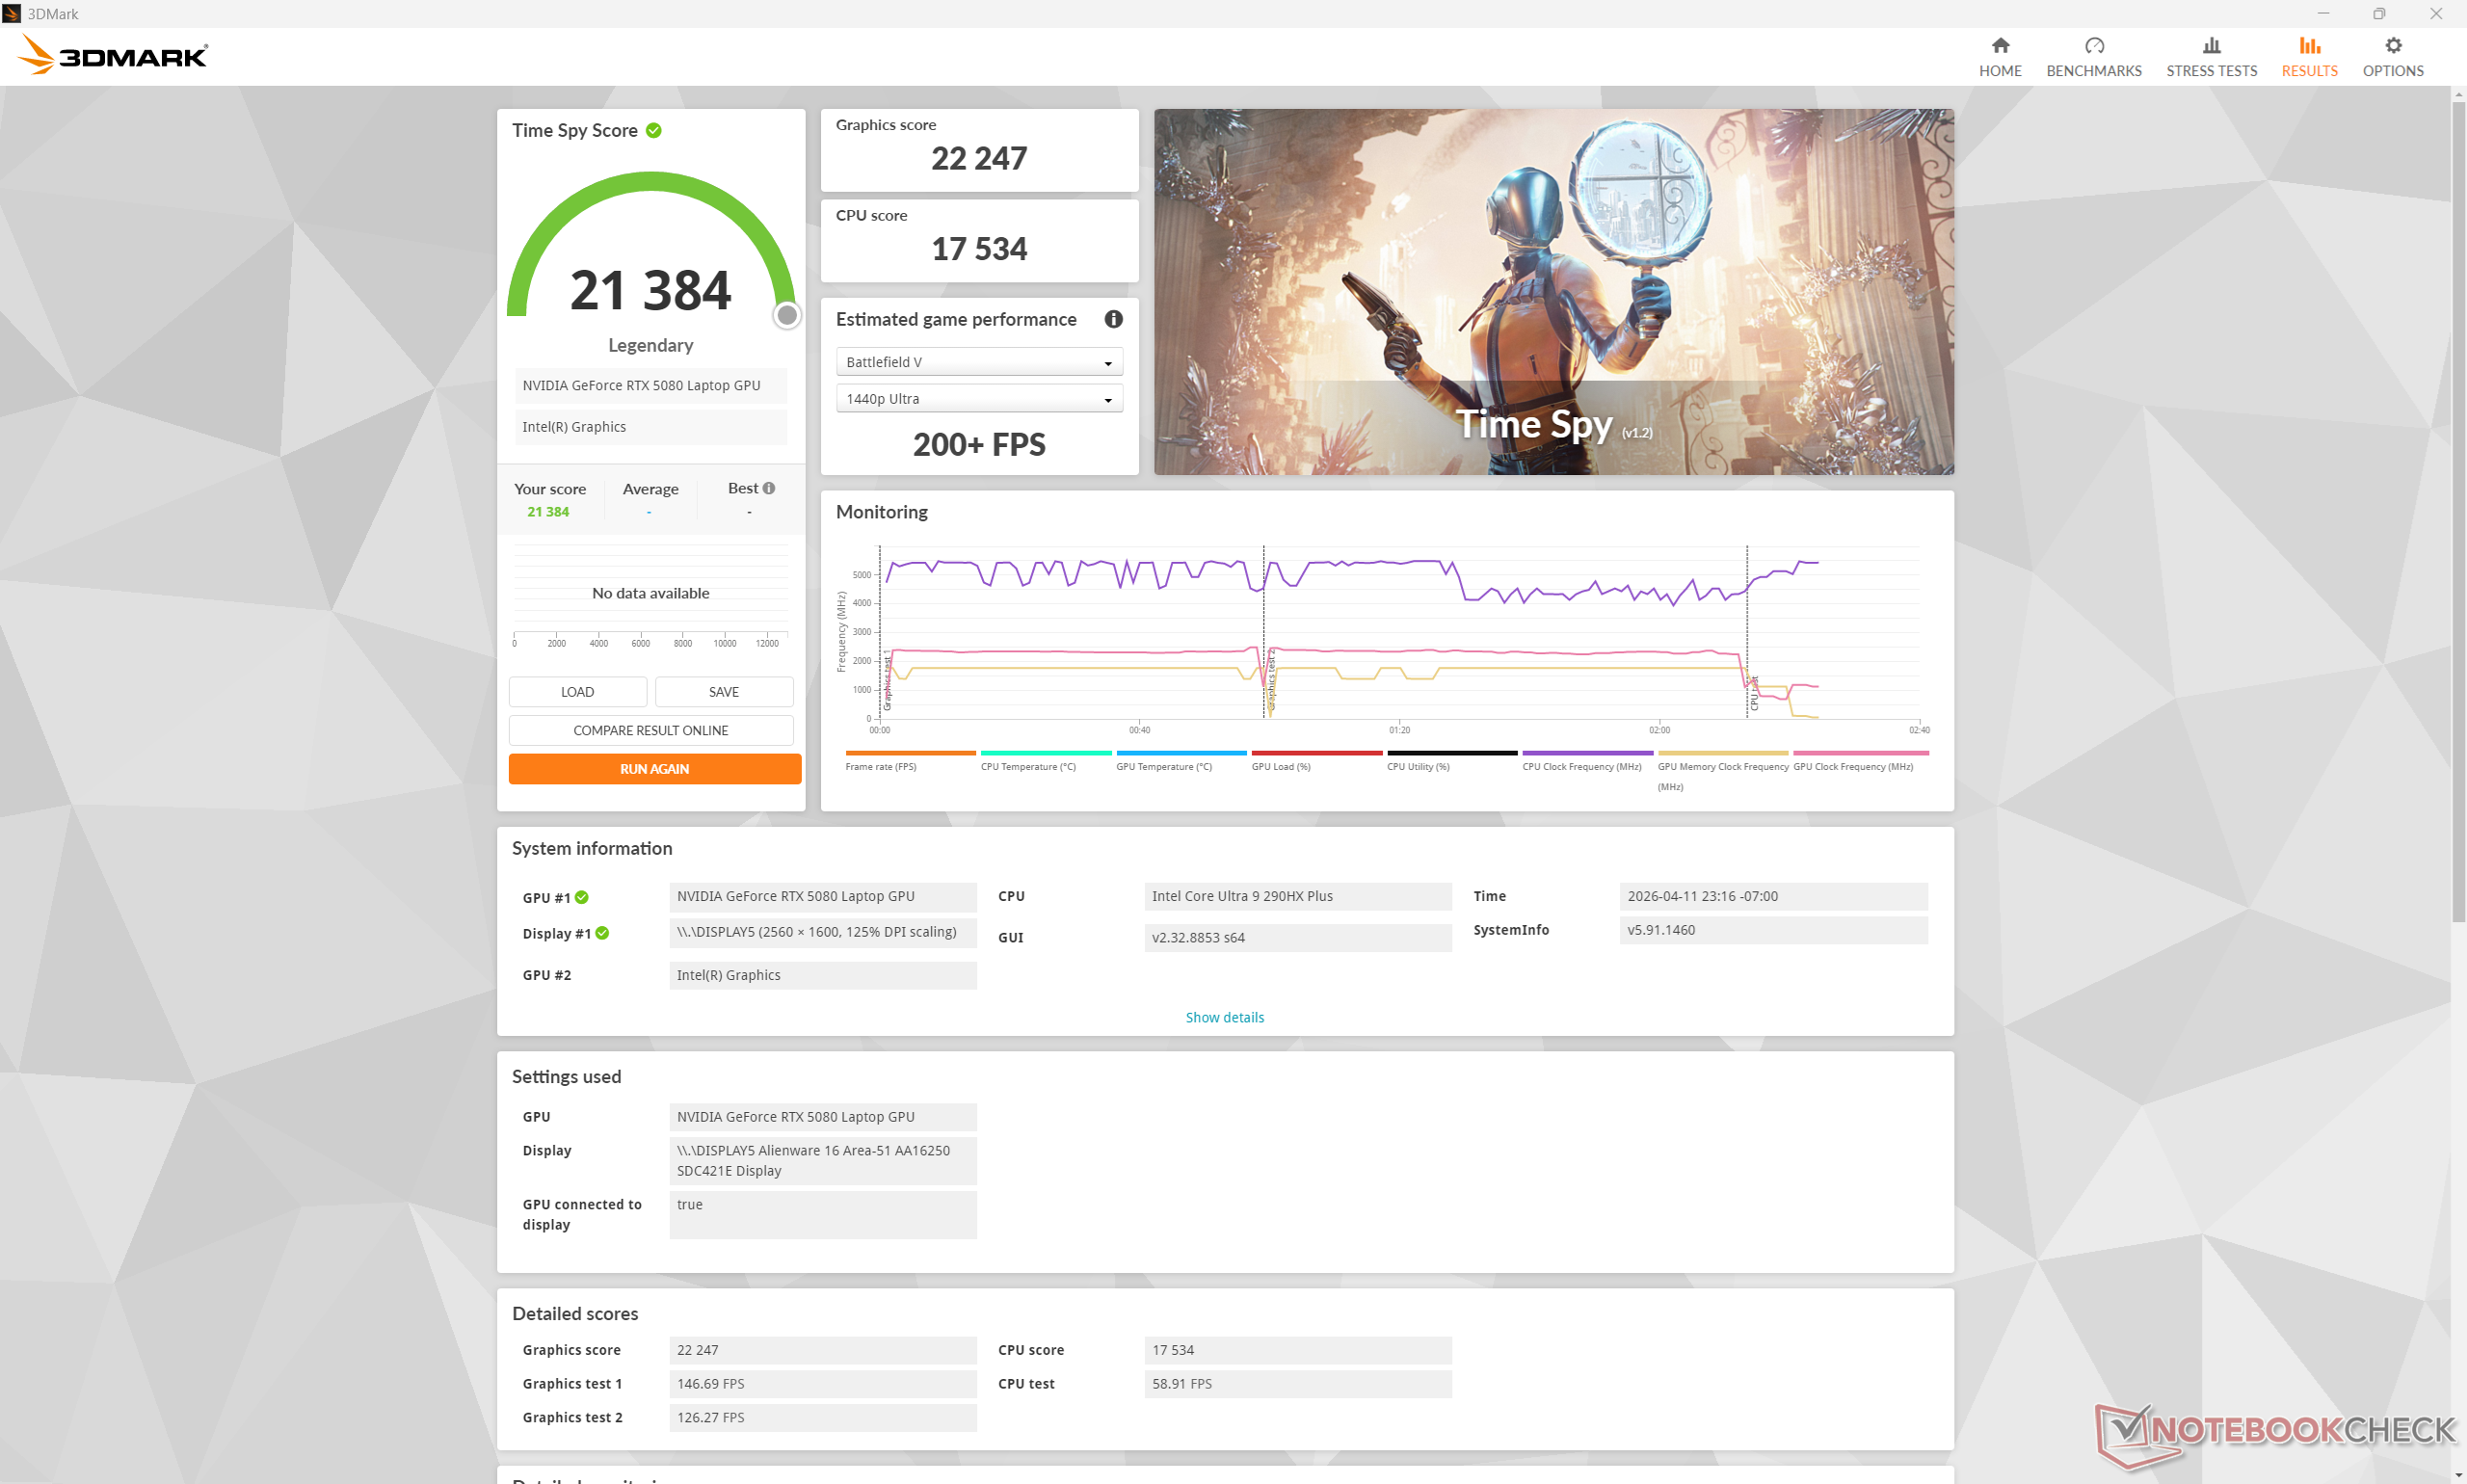
GeForce RTX 5080 et 5090 Les options du GPU restent les mêmes qu'auparavant, sans modification de l'objectif de 175 W TGP. Néanmoins, les résultats 3DMark sont quelques points de pourcentage plus élevés sur notre modèle 2026 plus récent. Le passage de la RTX 5080 à la RTX 5090 ne devrait augmenter les performances de jeu que de 10 à 15 %.
Plus particulièrement, l'utilisation du mode Performance ou du mode Équilibré au lieu du mode Overdrive ne diminuerait les performances graphiques que de 3 % et 6 %, respectivement, selon notre tableau de résultats Time Spy ci-dessous. Les déficits de performance sont moins importants que prévu par rapport à la plupart des autres ordinateurs portables de jeu.
| Profil de puissance | Score graphique | Score physique | Score combiné |
| Mode Overdrive | 22247 | 17534 | 21384 |
| Mode Performance | 21478 (-3%) | 17530 (-0%) | 20776 (-3%) |
| Mode équilibré | 20815 (-6%) | 17251 (-2%) | 20189 (-6%) |
| Alimentation par batterie | 13861 (-38%) | 13580 (-23%) | 13818 (-35%) |
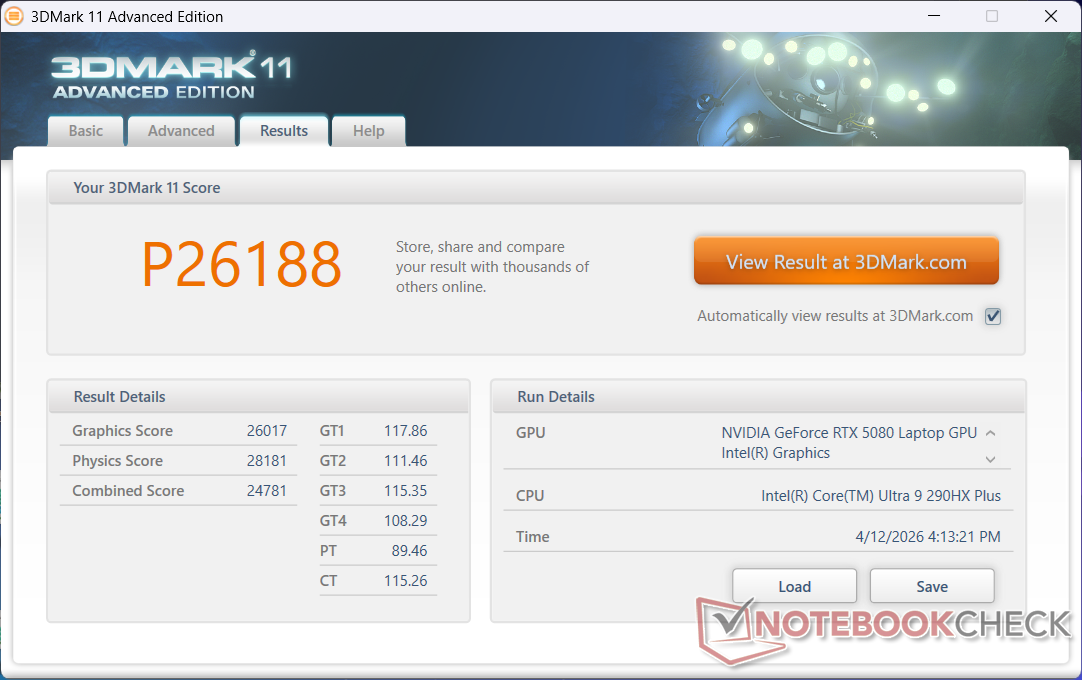

| 3DMark 11 Performance | 26188 points | |
| 3DMark Cloud Gate Standard Score | 74132 points | |
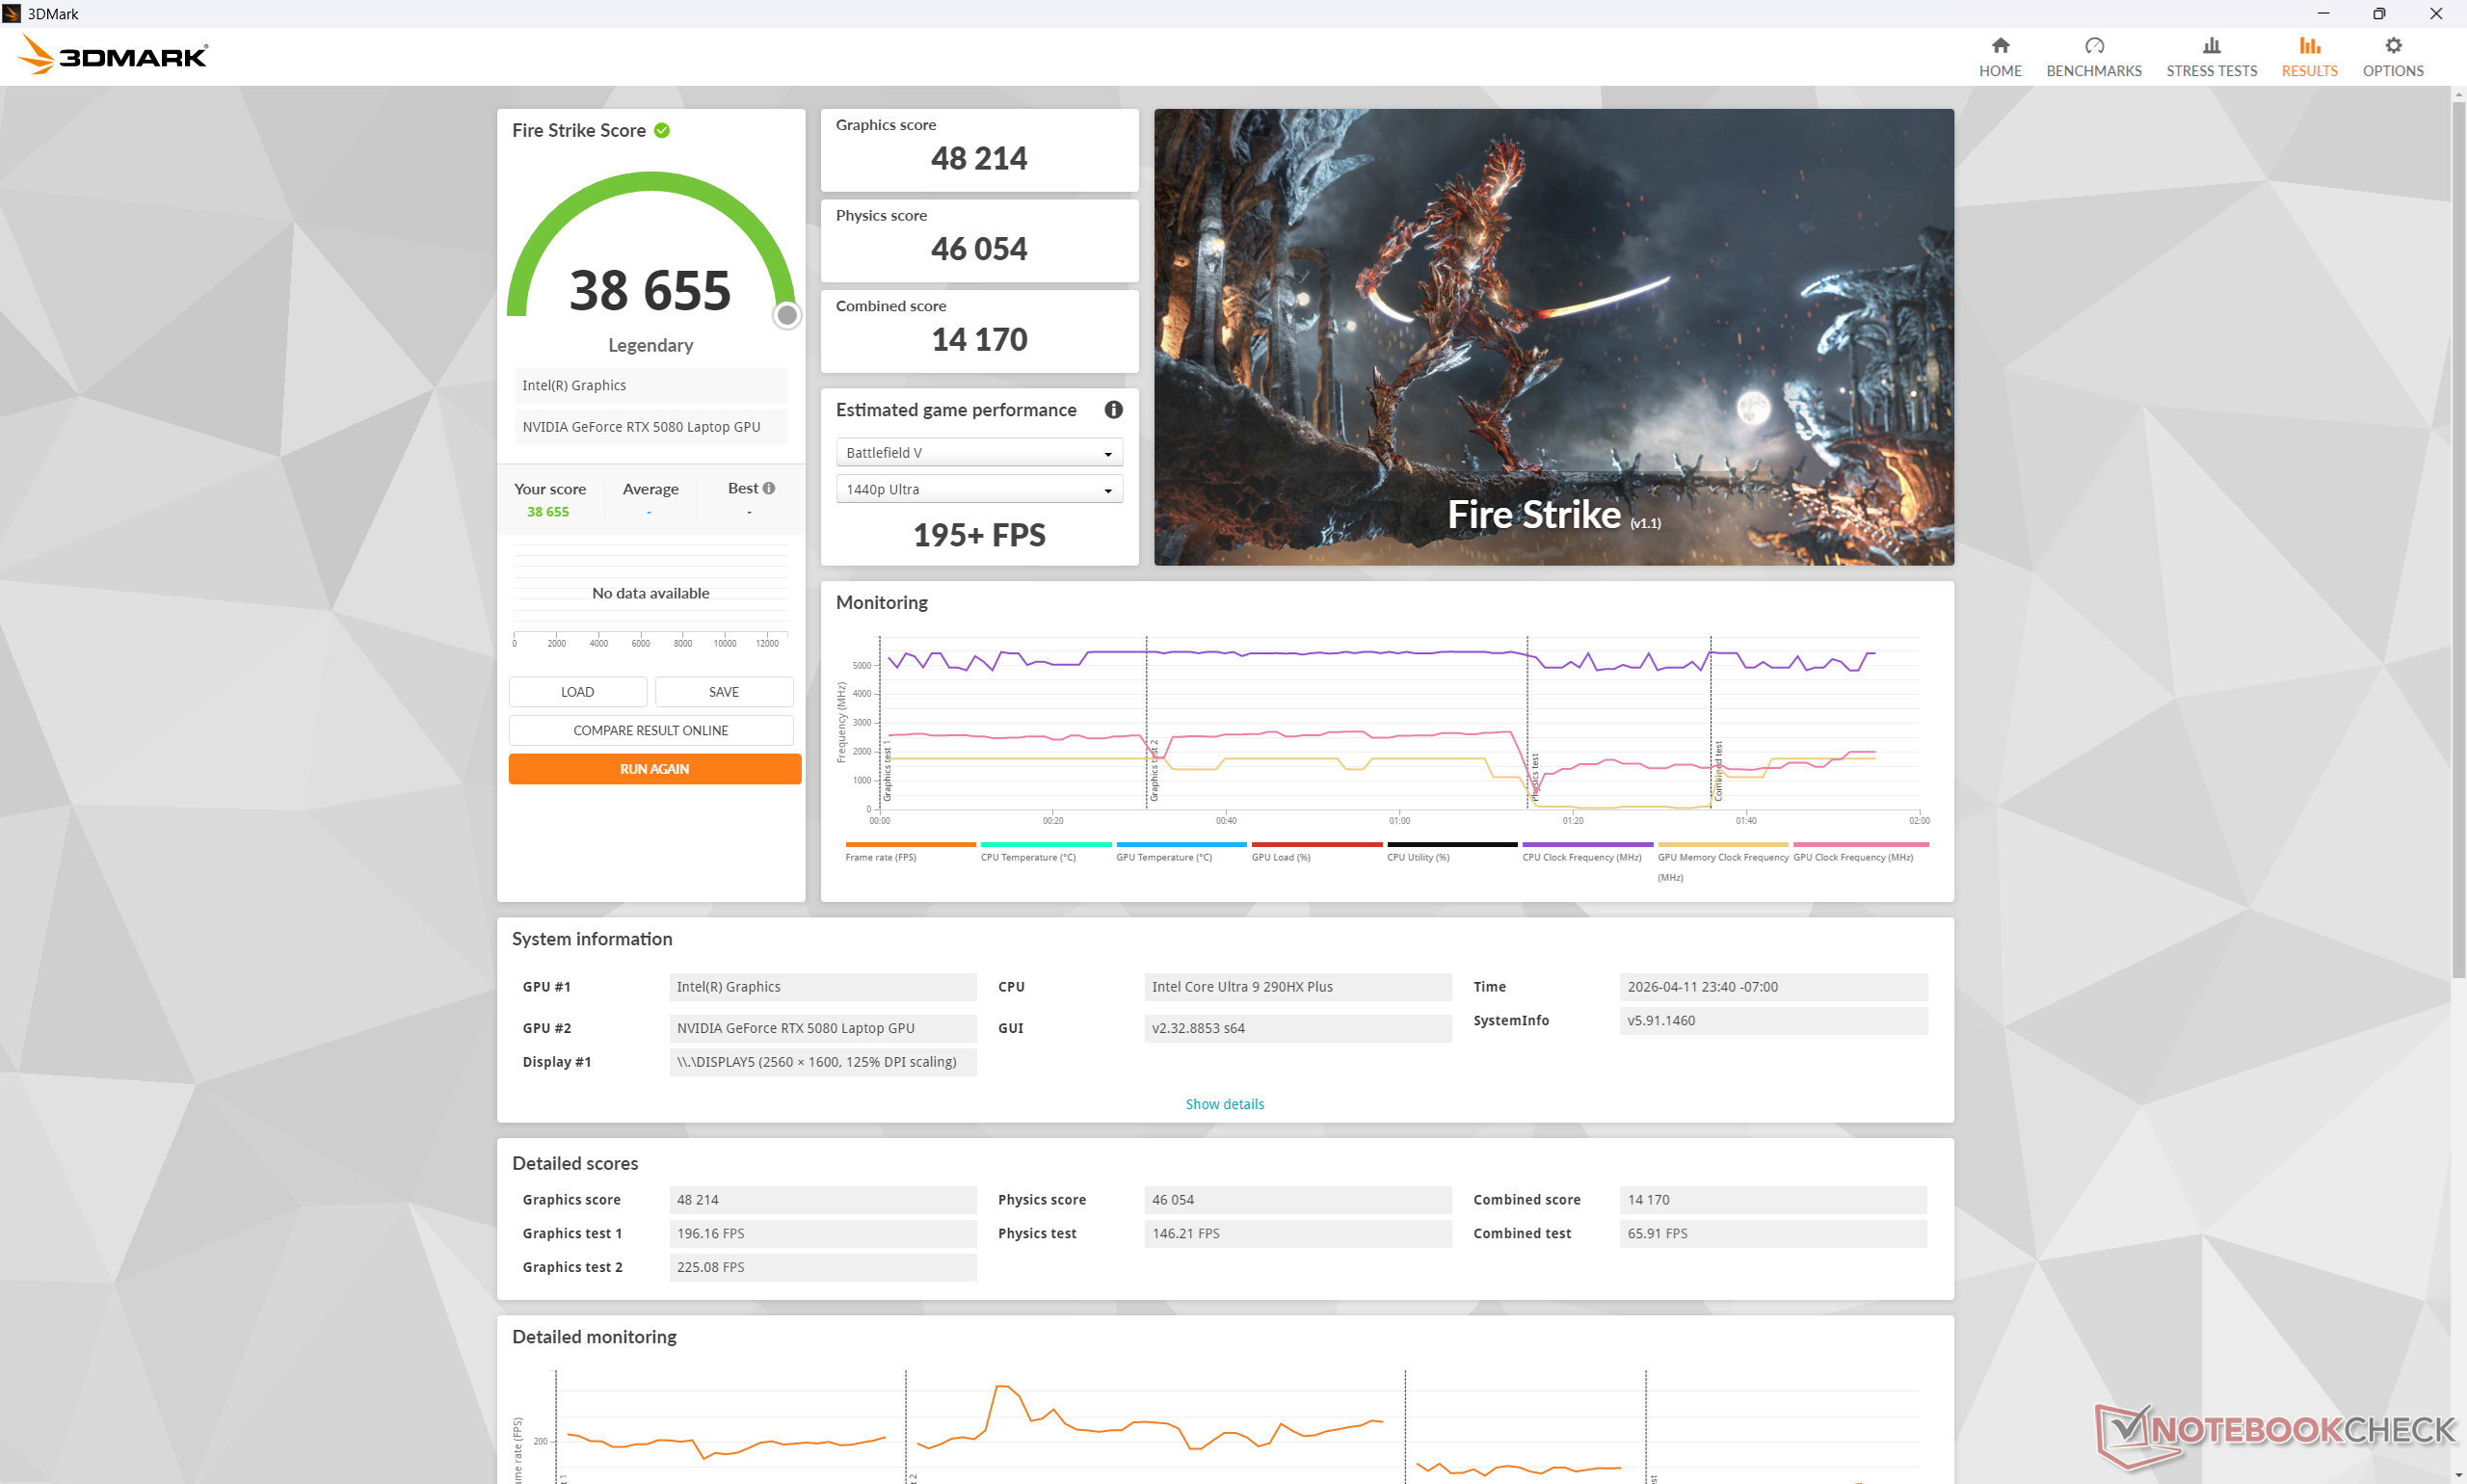
| 3DMark Fire Strike Score | 38655 points | |
| 3DMark Time Spy Score | 21384 points | |
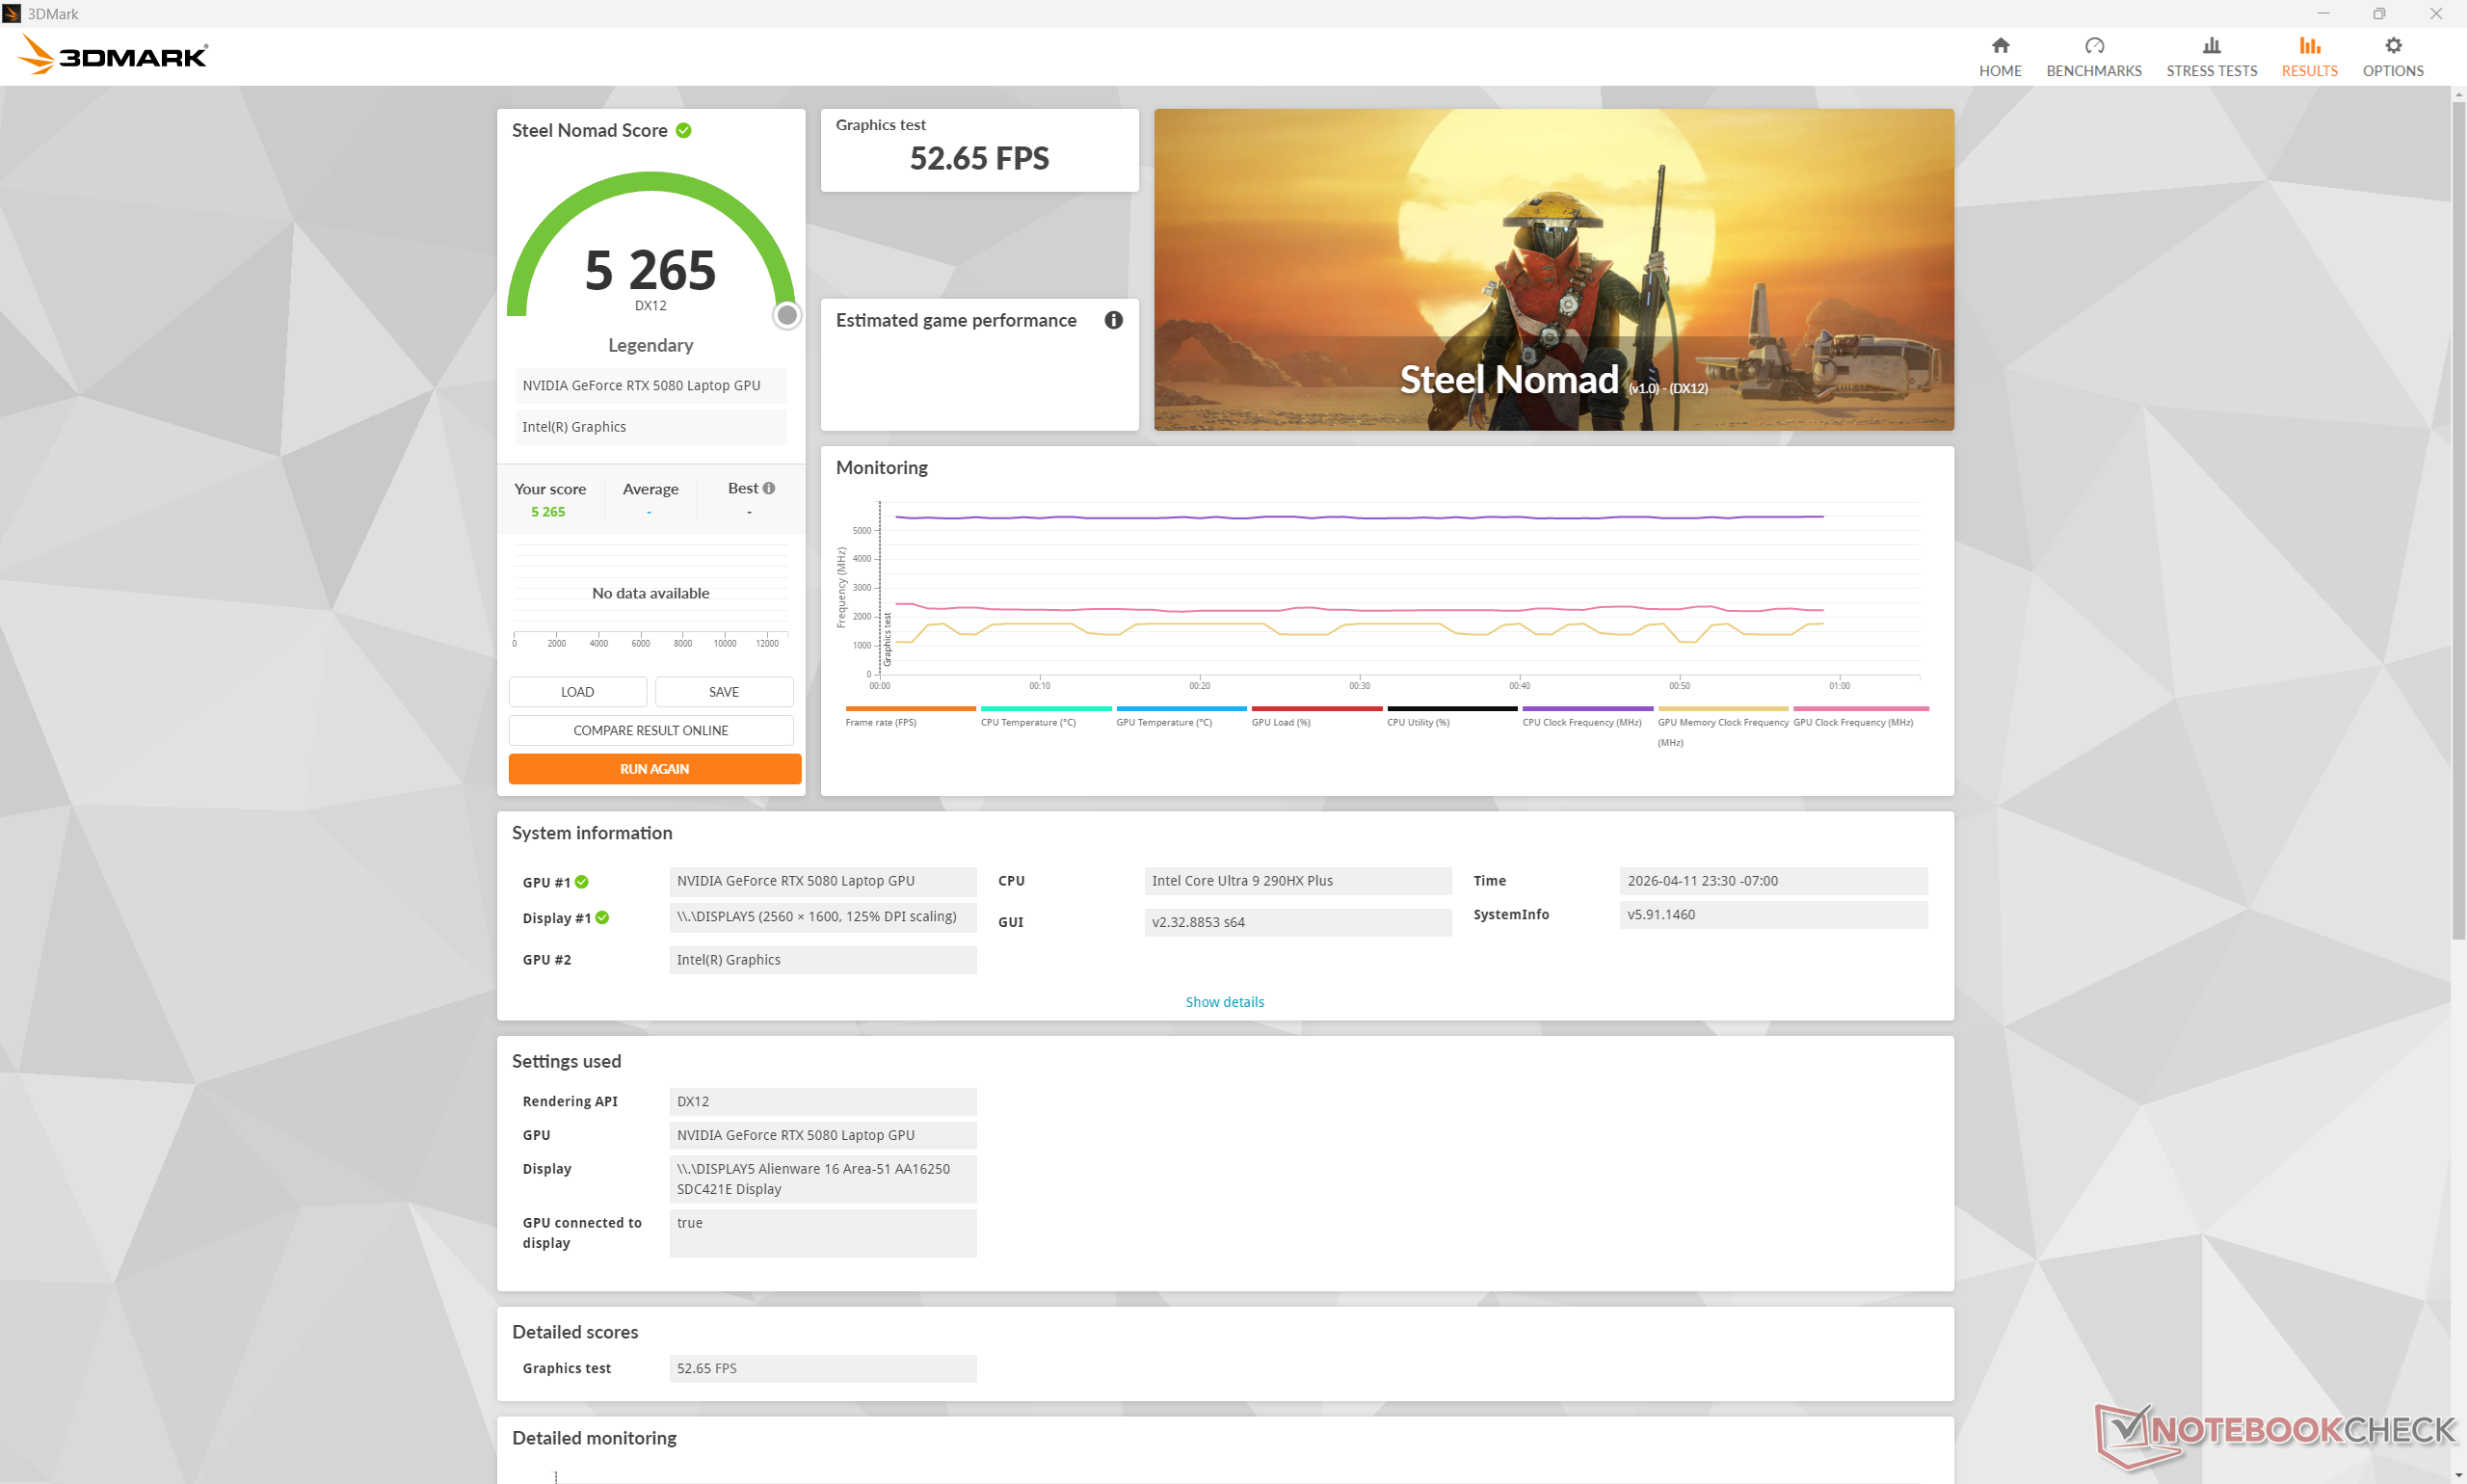
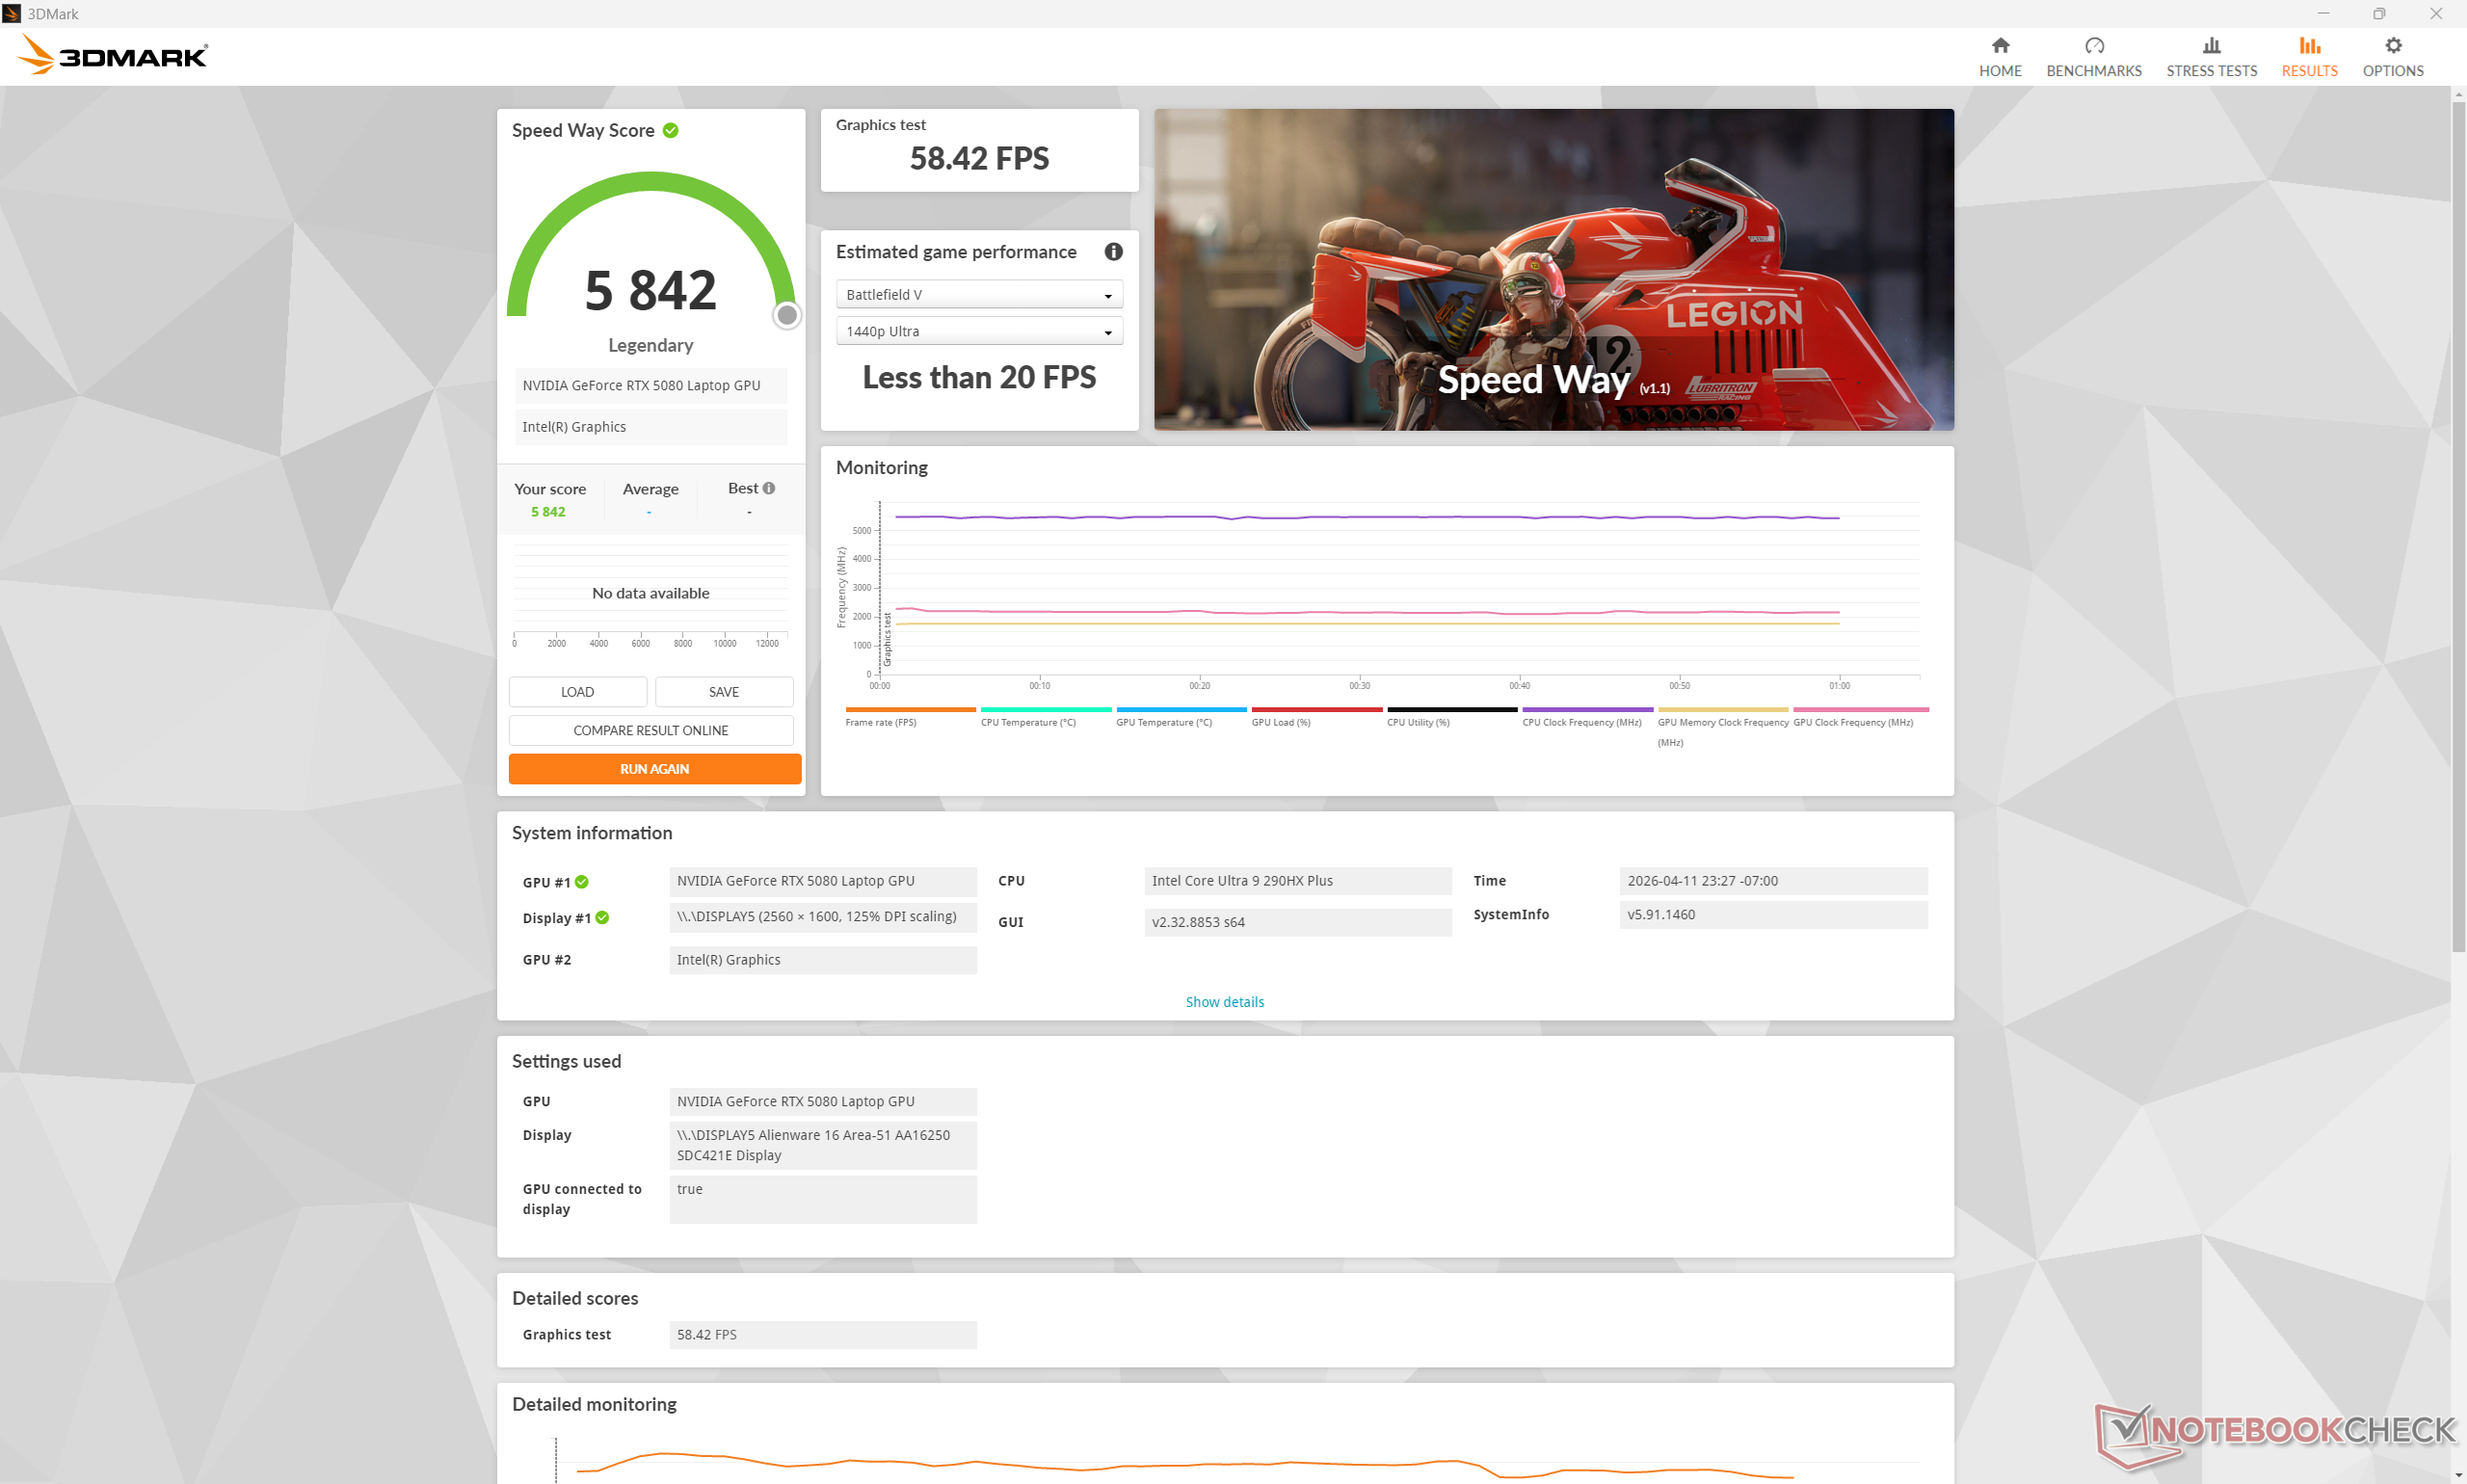
| 3DMark Steel Nomad Score | 5265 points | |
Aide | ||
* ... Moindre est la valeur, meilleures sont les performances
| Performance rating - Percent | |
| Lenovo Legion Pro 7i 16 Gen 10 -1! | |
| Alienware 16 Area-51 Core Ultra 9 290HX Plus -1! | |
| HP Omen Max 16 ah000 -2! | |
| Alienware 16 Area-51 -1! | |
| MSI Vector 16 HX AI A2XWHG -1! | |
| Asus ROG Zephyrus G16 GU605CW | |
| Cyberpunk 2077 - 1920x1080 Ultra Preset (FSR off) | |
| Lenovo Legion Pro 7i 16 Gen 10 | |
| Alienware 16 Area-51 Core Ultra 9 290HX Plus | |
| HP Omen Max 16 ah000 | |
| Alienware 16 Area-51 | |
| MSI Vector 16 HX AI A2XWHG | |
| Asus ROG Zephyrus G16 GU605CW | |
| Baldur's Gate 3 - 1920x1080 Ultra Preset AA:T | |
| Lenovo Legion Pro 7i 16 Gen 10 | |
| Alienware 16 Area-51 | |
| MSI Vector 16 HX AI A2XWHG | |
| Asus ROG Zephyrus G16 GU605CW | |
| GTA V - 1920x1080 Highest AA:4xMSAA + FX AF:16x | |
| Alienware 16 Area-51 Core Ultra 9 290HX Plus | |
| MSI Vector 16 HX AI A2XWHG | |
| Asus ROG Zephyrus G16 GU605CW | |
| Final Fantasy XV Benchmark - 1920x1080 High Quality | |
| Lenovo Legion Pro 7i 16 Gen 10 | |
| HP Omen Max 16 ah000 | |
| Alienware 16 Area-51 Core Ultra 9 290HX Plus | |
| Alienware 16 Area-51 | |
| MSI Vector 16 HX AI A2XWHG | |
| Asus ROG Zephyrus G16 GU605CW | |
| Strange Brigade - 1920x1080 ultra AA:ultra AF:16 | |
| Lenovo Legion Pro 7i 16 Gen 10 | |
| Alienware 16 Area-51 Core Ultra 9 290HX Plus | |
| Alienware 16 Area-51 | |
| HP Omen Max 16 ah000 | |
| Asus ROG Zephyrus G16 GU605CW | |
| Dota 2 Reborn - 1920x1080 ultra (3/3) best looking | |
| Lenovo Legion Pro 7i 16 Gen 10 | |
| Alienware 16 Area-51 Core Ultra 9 290HX Plus | |
| MSI Vector 16 HX AI A2XWHG | |
| HP Omen Max 16 ah000 | |
| Alienware 16 Area-51 | |
| Asus ROG Zephyrus G16 GU605CW | |
Cyberpunk 2077 ultra FPS Chart
| Bas | Moyen | Élevé | Ultra | QHD DLSS | QHD FSR | QHD | 4K DLSS | 4K | |
|---|---|---|---|---|---|---|---|---|---|
| GTA V (2015) | 187.9 | 187.6 | 186.2 | 168.1 | 167.2 | 183.9 | |||
| Dota 2 Reborn (2015) | 216 | 191 | 184.3 | 170.9 | 165.9 | ||||
| Final Fantasy XV Benchmark (2018) | 234 | 232 | 201 | 157.5 | 93.6 | ||||
| X-Plane 11.11 (2018) | 171.5 | 154.6 | 129.5 | 101.3 | |||||
| Strange Brigade (2018) | 624 | 489 | 448 | 413 | 300 | 161.1 | |||
| Cyberpunk 2077 (2023) | 195.9 | 191.5 | 171.9 | 153.3 | 119.1 | 101.7 | 57.8 | 46.4 | |
| F1 24 (2024) | 341 | 375 | 351 | 136.9 | 141.2 | 136.2 | 89.2 | 76.5 | 44.8 |
| Black Myth: Wukong (2024) | 55 | 61 | 42 | 42 | 24 | ||||
| Monster Hunter Wilds (2025) | 85.5 | 82.5 | 69 | 58.7 | 43 | ||||
| Assassin's Creed Shadows (2025) | 59 | 59 | 51 | 49 | 37 |
Émissions
Bruit du système
Les niveaux de bruit et le comportement du ventilateur sont presque identiques à ceux que nous avons enregistrés sur l'Alienware 16 de 2025, malgré l'amélioration des performances sur cette dernière itération. Notez que le bruit du ventilateur se stabilise à 48 dB(A), 49 dB(A) et 57 dB(A) lorsque vous exécutez Cyberpunk 2077 en mode équilibré, en mode performance et en mode overdrive, respectivement. Le bruit est considérablement réduit lorsque l'on passe du mode Overdrive au mode Performance pour une perte graphique de seulement 5 %.
Degré de la nuisance sonore
| Au repos |
| 23.2 / 28.2 / 28.3 dB(A) |
| Fortement sollicité |
| 28.8 / 57.1 dB(A) |
 | ||
30 dB silencieux 40 dB(A) audible 50 dB(A) bruyant |
||
min: | ||
| Alienware 16 Area-51 Core Ultra 9 290HX Plus Ultra 9 290HX Plus, GeForce RTX 5080 Laptop | Alienware 16 Area-51 Ultra 9 275HX, GeForce RTX 5080 Laptop | Lenovo Legion Pro 7i 16 Gen 10 Ultra 9 275HX, GeForce RTX 5080 Laptop | HP Omen Max 16 ah000 Ultra 9 275HX, GeForce RTX 5090 Laptop | MSI Vector 16 HX AI A2XWHG Ultra 7 255HX, GeForce RTX 5070 Ti Laptop | Asus ROG Zephyrus G16 GU605CW Ultra 9 285H, GeForce RTX 5080 Laptop | |
|---|---|---|---|---|---|---|
| Noise | -2% | 4% | -16% | -21% | -20% | |
| arrêt / environnement * (dB) | 23.1 | 23.6 -2% | 22.9 1% | 22.8 1% | 25 -8% | 25.56 -11% |
| Idle Minimum * (dB) | 23.2 | 25.4 -9% | 22.9 1% | 29 -25% | 33 -42% | 30 -29% |
| Idle Average * (dB) | 28.2 | 27.8 1% | 22.9 19% | 29 -3% | 34 -21% | 30 -6% |
| Idle Maximum * (dB) | 28.3 | 28.1 1% | 26.3 7% | 29 -2% | 38 -34% | 30 -6% |
| Load Average * (dB) | 28.8 | 28.8 -0% | 27.8 3% | 47.7 -66% | 46 -60% | 53.55 -86% |
| Cyberpunk 2077 ultra * (dB) | 49 | 50.4 -3% | 54.2 -11% | 54.8 -12% | 47 4% | 53.5 -9% |
| Load Maximum * (dB) | 57.1 | 56.4 1% | 53.9 6% | 61.1 -7% | 49 14% | 54.02 5% |
* ... Moindre est la valeur, meilleures sont les performances
Température
Les points chauds lors des jeux atteignent les 40°C, ce qui est similaire à ce que nous avons observé sur l'Alienware 16 Area-51 de 2025. La température moyenne est légèrement plus élevée que sur les ordinateurs concurrents Lenovo Legion Pro 7i 16 Gen 10 car les repose-poignets de l'Alienware ne restent pas aussi froids.


(-) La température maximale du côté supérieur est de 45.2 °C / 113 F, par rapport à la moyenne de 40.4 °C / 105 F, allant de 21.2 à 68.8 °C pour la classe Gaming.
(+) Le fond chauffe jusqu'à un maximum de 37.4 °C / 99 F, contre une moyenne de 43.2 °C / 110 F
(+) En utilisation inactive, la température moyenne du côté supérieur est de 27.6 °C / 82 F, par rapport à la moyenne du dispositif de 33.9 °C / 93 F.
(±) 3: The average temperature for the upper side is 36.4 °C / 98 F, compared to the average of 33.9 °C / 93 F for the class Gaming.
(+) Les repose-poignets et le pavé tactile sont plus froids que la température de la peau avec un maximum de 29.8 °C / 85.6 F et sont donc froids au toucher.
(±) La température moyenne de la zone de l'appui-paume de dispositifs similaires était de 28.8 °C / 83.8 F (-1 °C / #-1.8 F).


| Alienware 16 Area-51 Core Ultra 9 290HX Plus Ultra 9 290HX Plus, GeForce RTX 5080 Laptop | Alienware 16 Area-51 Ultra 9 275HX, GeForce RTX 5080 Laptop | Lenovo Legion Pro 7i 16 Gen 10 Ultra 9 275HX, GeForce RTX 5080 Laptop | HP Omen Max 16 ah000 Ultra 9 275HX, GeForce RTX 5090 Laptop | MSI Vector 16 HX AI A2XWHG Ultra 7 255HX, GeForce RTX 5070 Ti Laptop | Asus ROG Zephyrus G16 GU605CW Ultra 9 285H, GeForce RTX 5080 Laptop | |
|---|---|---|---|---|---|---|
| Heat | -9% | -4% | -1% | -14% | -21% | |
| Maximum Upper Side * (°C) | 45.2 | 43.8 3% | 42.6 6% | 42.8 5% | 53 -17% | 49.2 -9% |
| Maximum Bottom * (°C) | 37.4 | 40 -7% | 41.2 -10% | 50.2 -34% | 52 -39% | 50.2 -34% |
| Idle Upper Side * (°C) | 31.6 | 35.8 -13% | 32.6 -3% | 27.6 13% | 33 -4% | 37.2 -18% |
| Idle Bottom * (°C) | 30.2 | 35.2 -17% | 32.4 -7% | 26.2 13% | 29 4% | 37.4 -24% |
* ... Moindre est la valeur, meilleures sont les performances
Test de stress
Lors de l'exécution du stress Prime95 en mode Overdrive (c'est-à-dire en mode de ventilation maximale), le CPU atteignait 4,3 GHz, 182 W et 105 C ( !) avant de redescendre légèrement entre 3,9 et 4,1 GHz afin de maintenir une température de cœur légèrement plus froide de 95 C à 100 C. En comparaison, l'exécution de ce même test sur l'Alienware 16 2025 se traduirait par une fréquence d'horloge et une température moyennes du CPU plus basses de 3,6 GHz et 92 C, respectivement. Il est clair que le Core Ultra 9 290HX Plus pousse la solution de refroidissement existante de l'Alienware 16 à ses limites absolues.
La température du GPU reste à peu près la même que sur le modèle 2025 lors de l'exécution de Cyberpunk 2077. La température du CPU, cependant, serait plus chaude de quelques degrés C, jusqu'à 82 C.
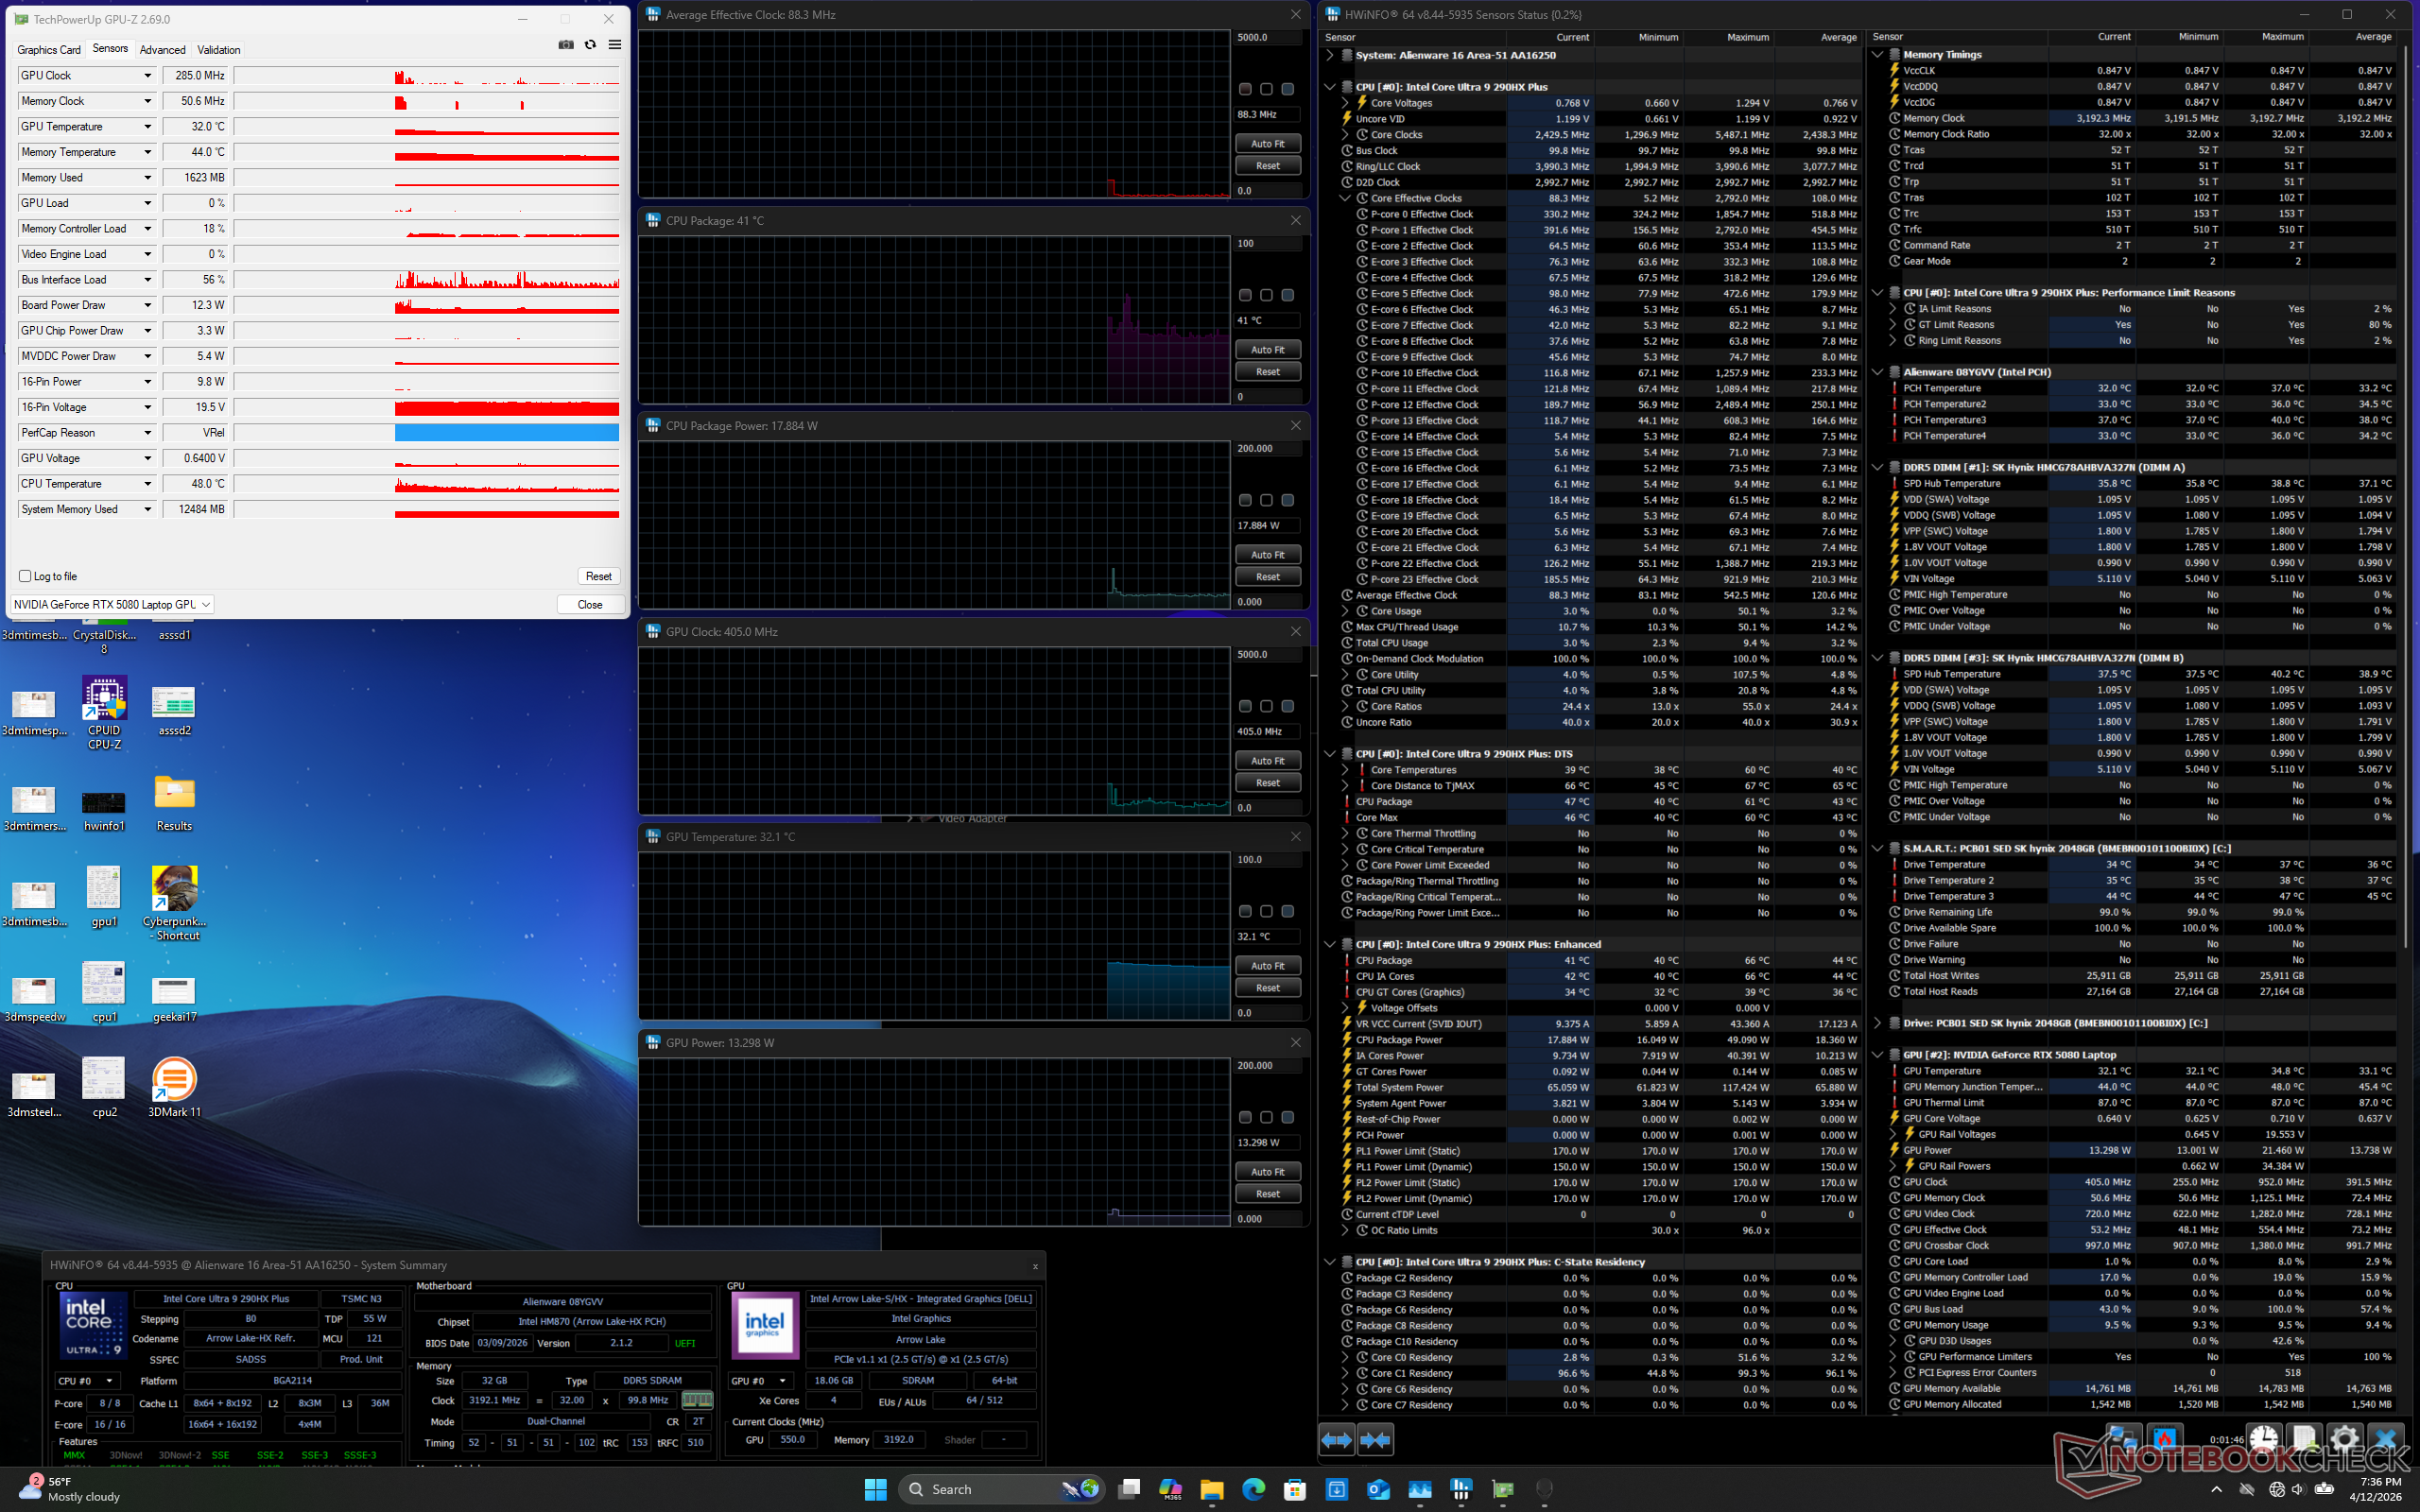
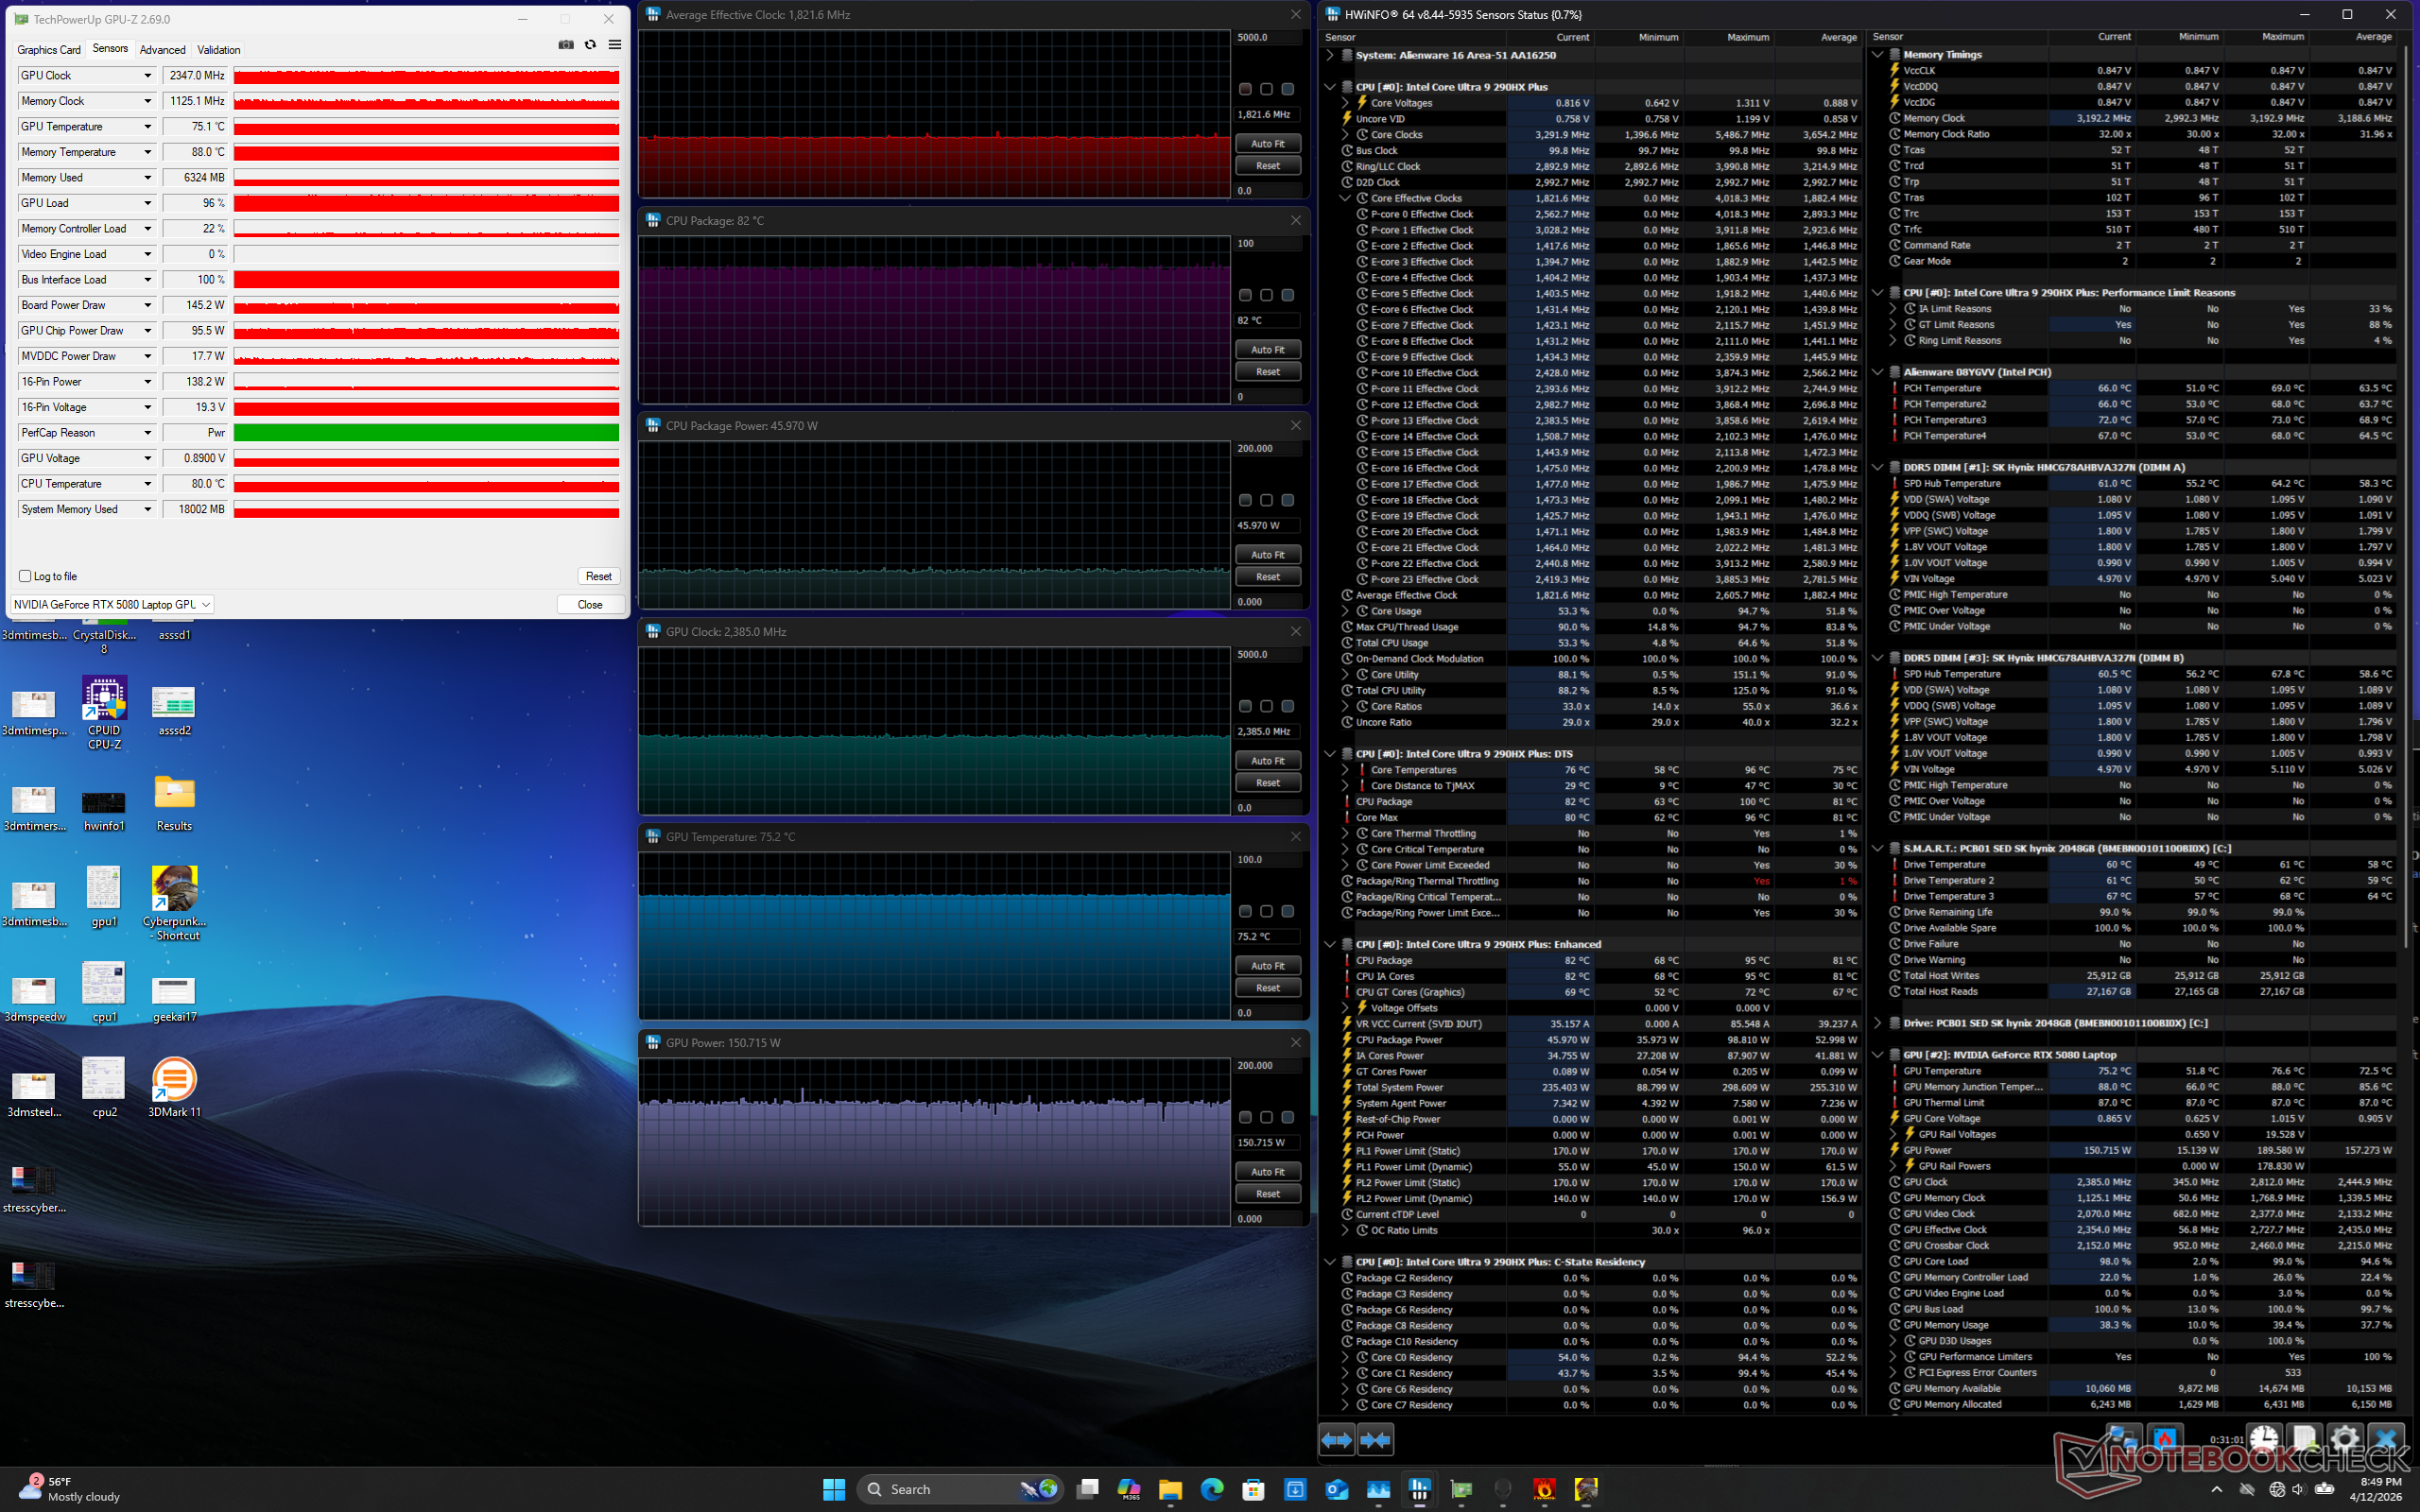
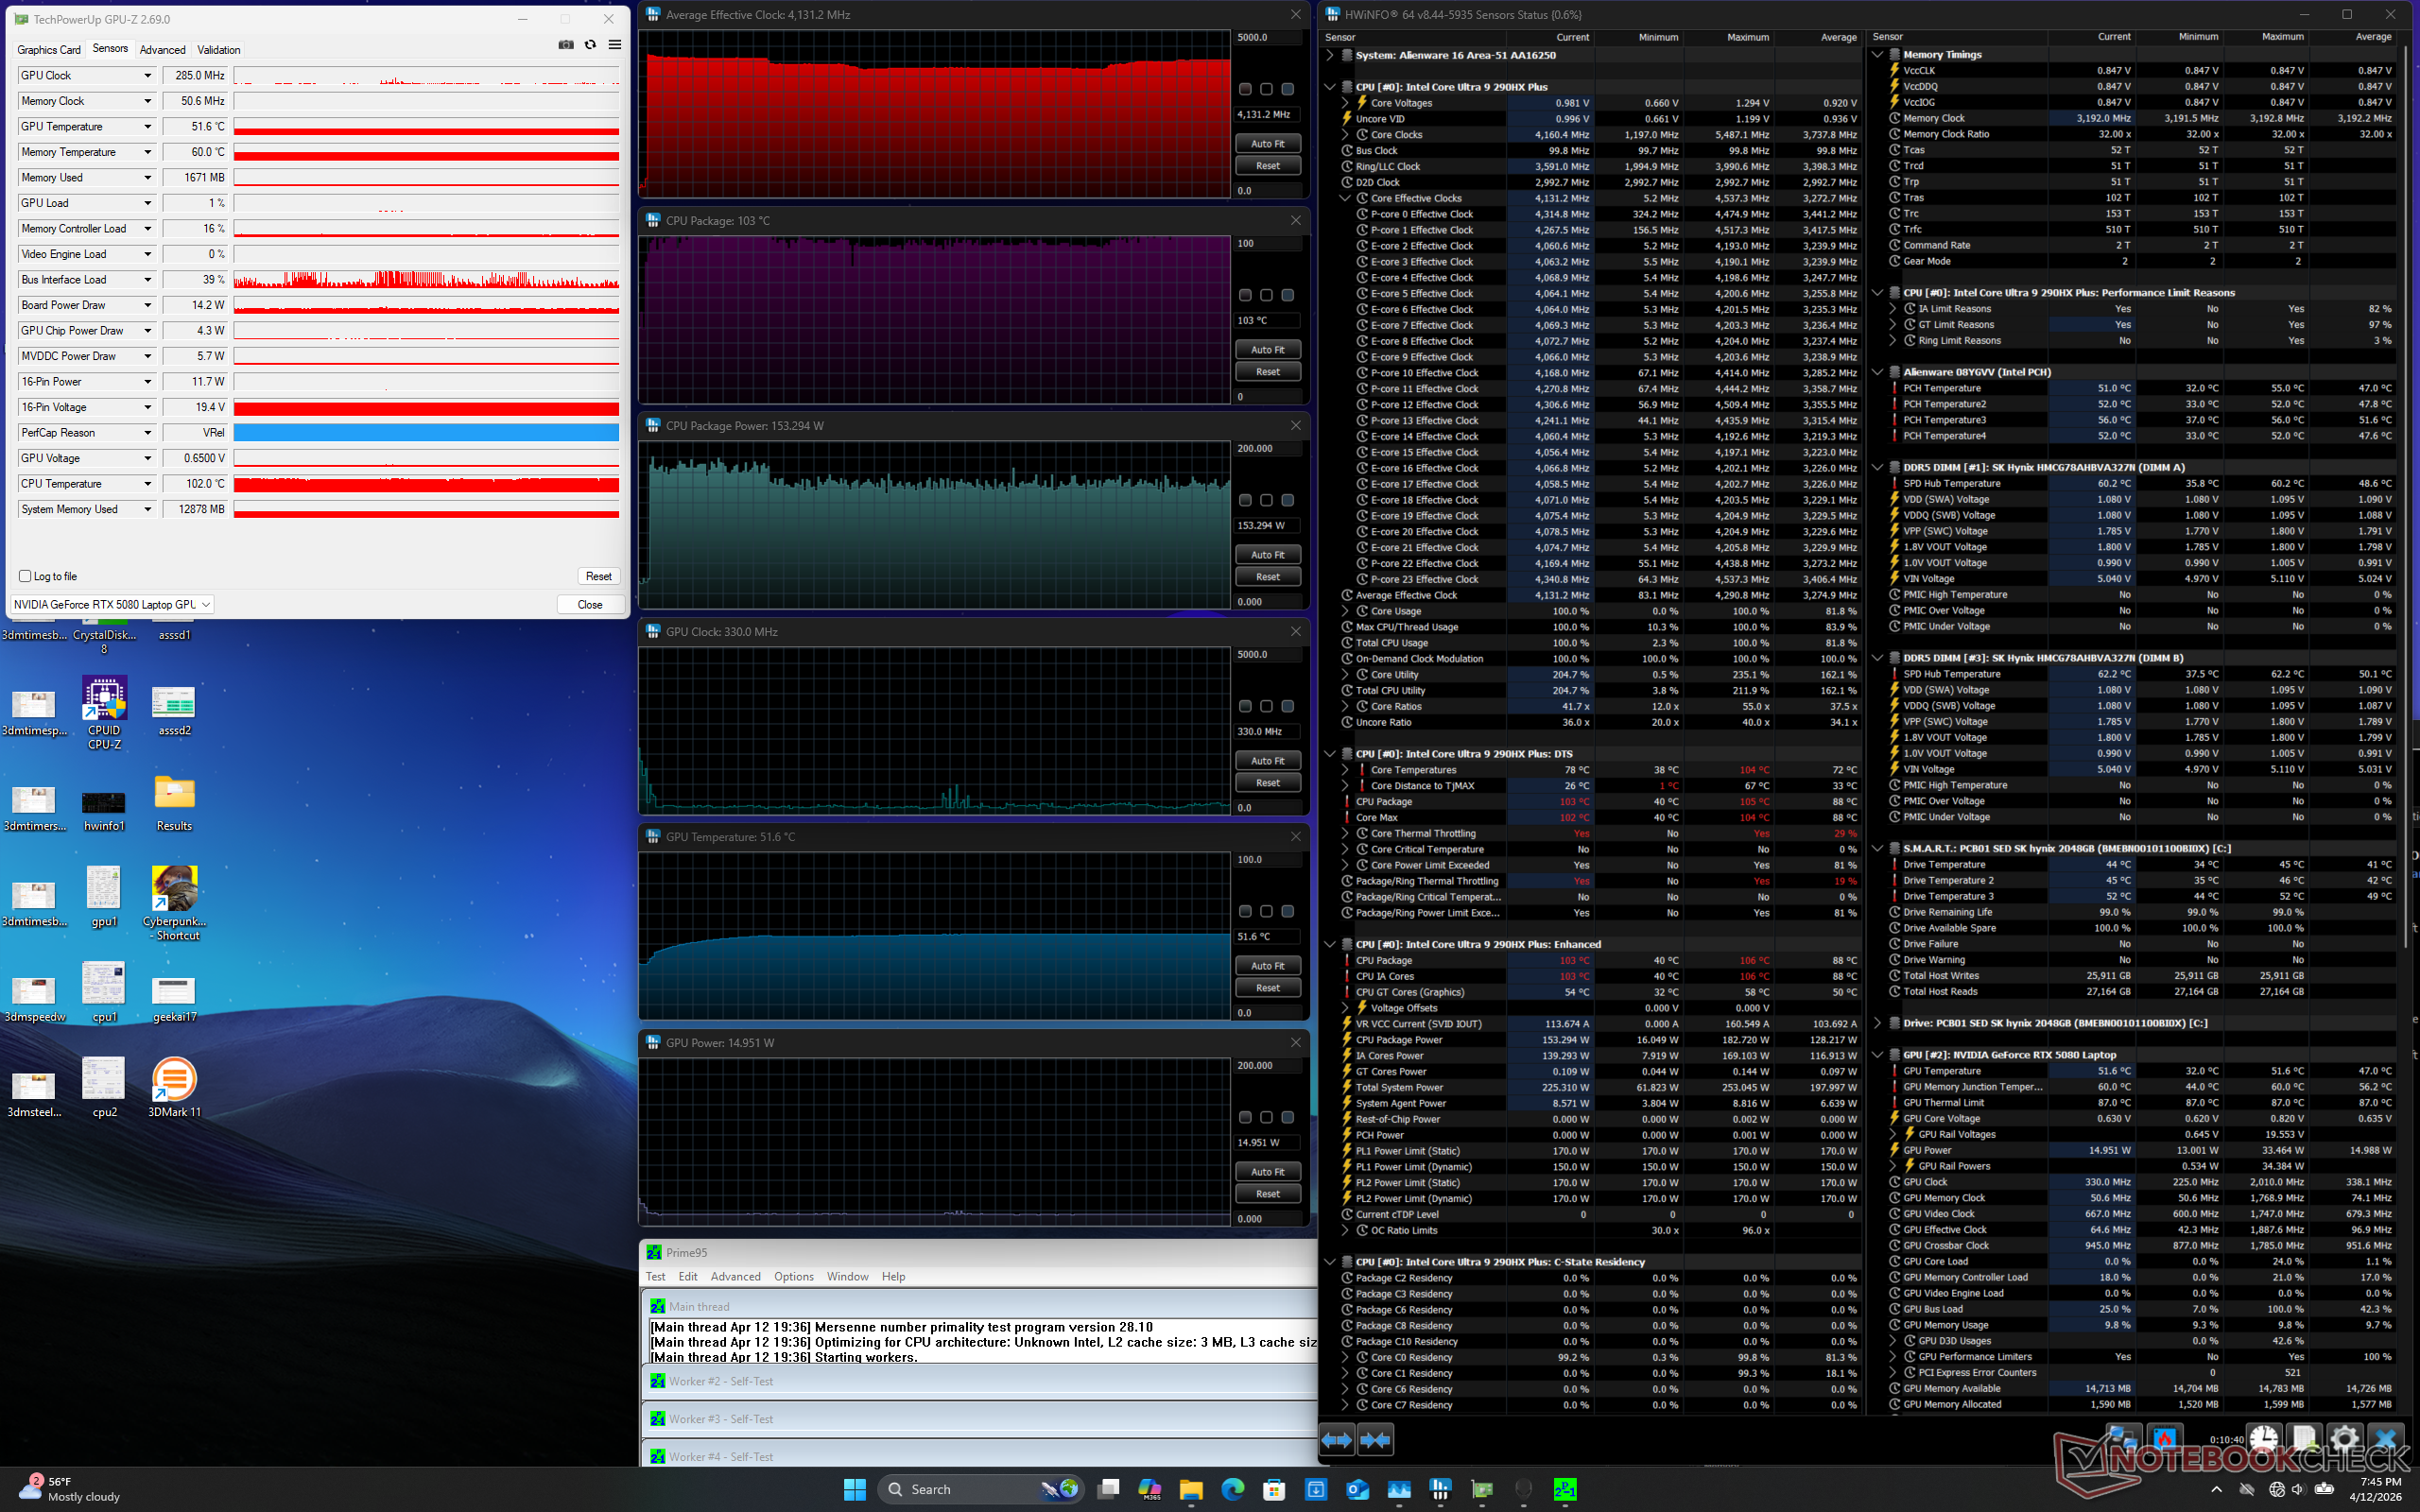
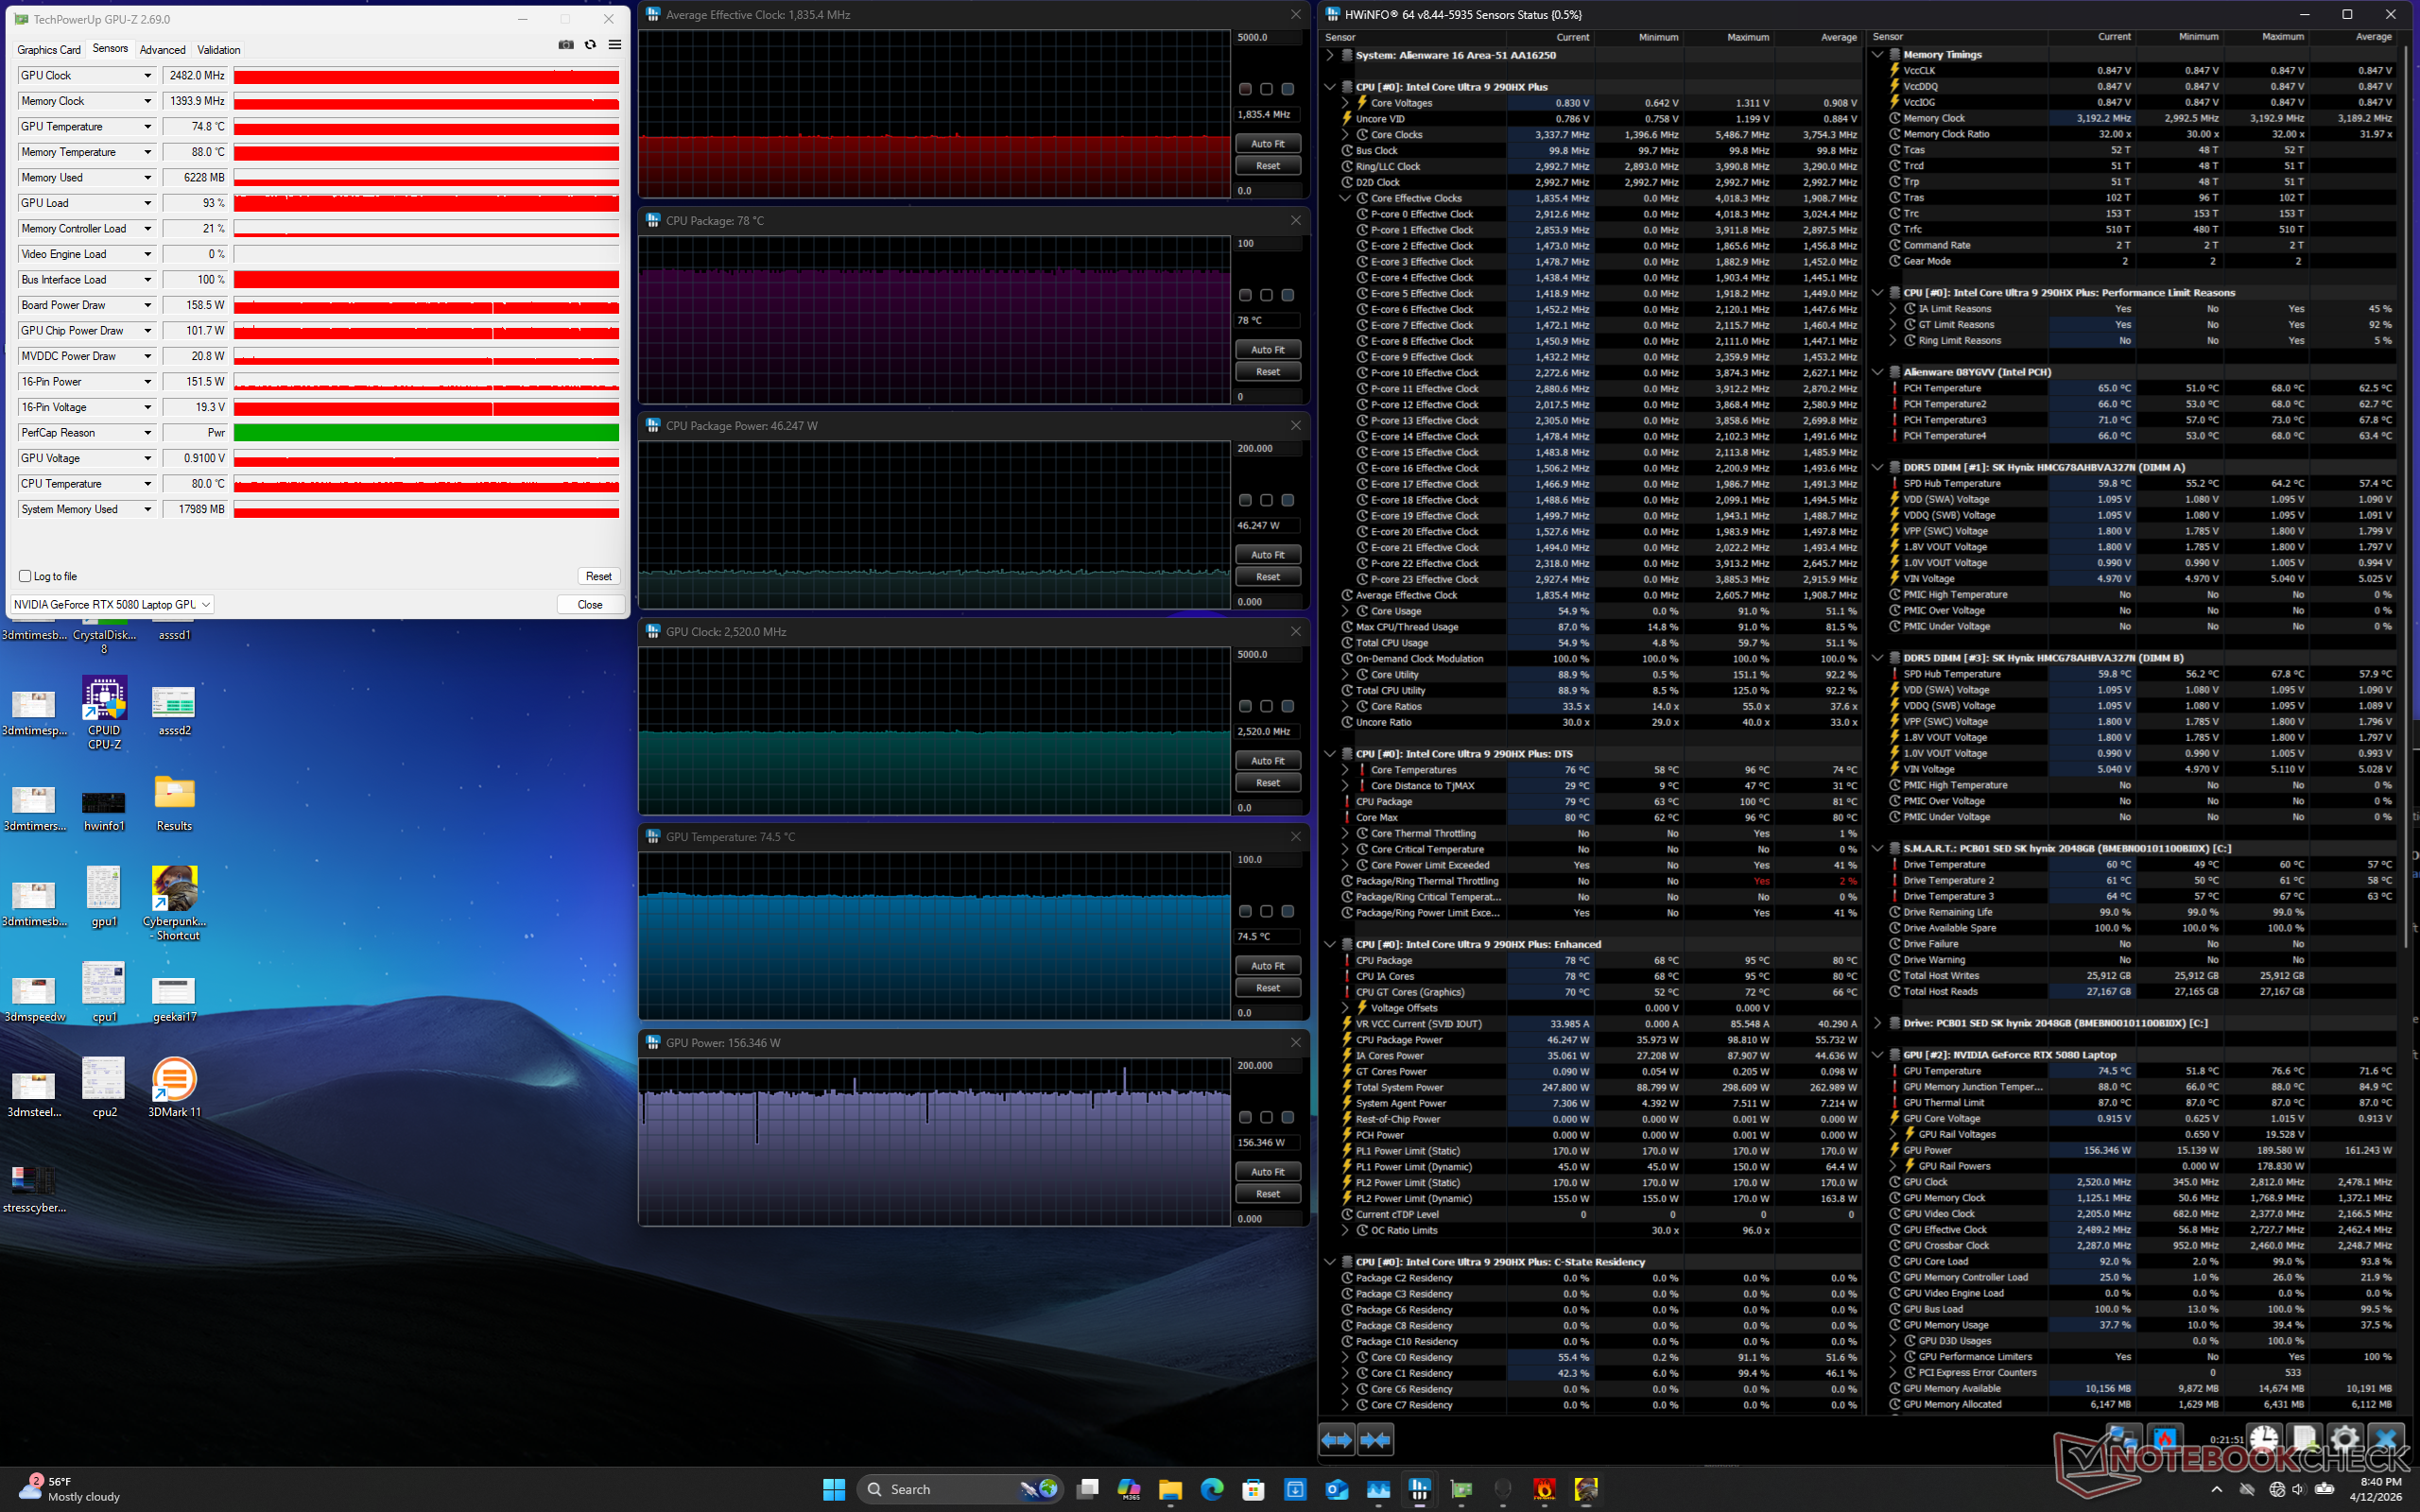
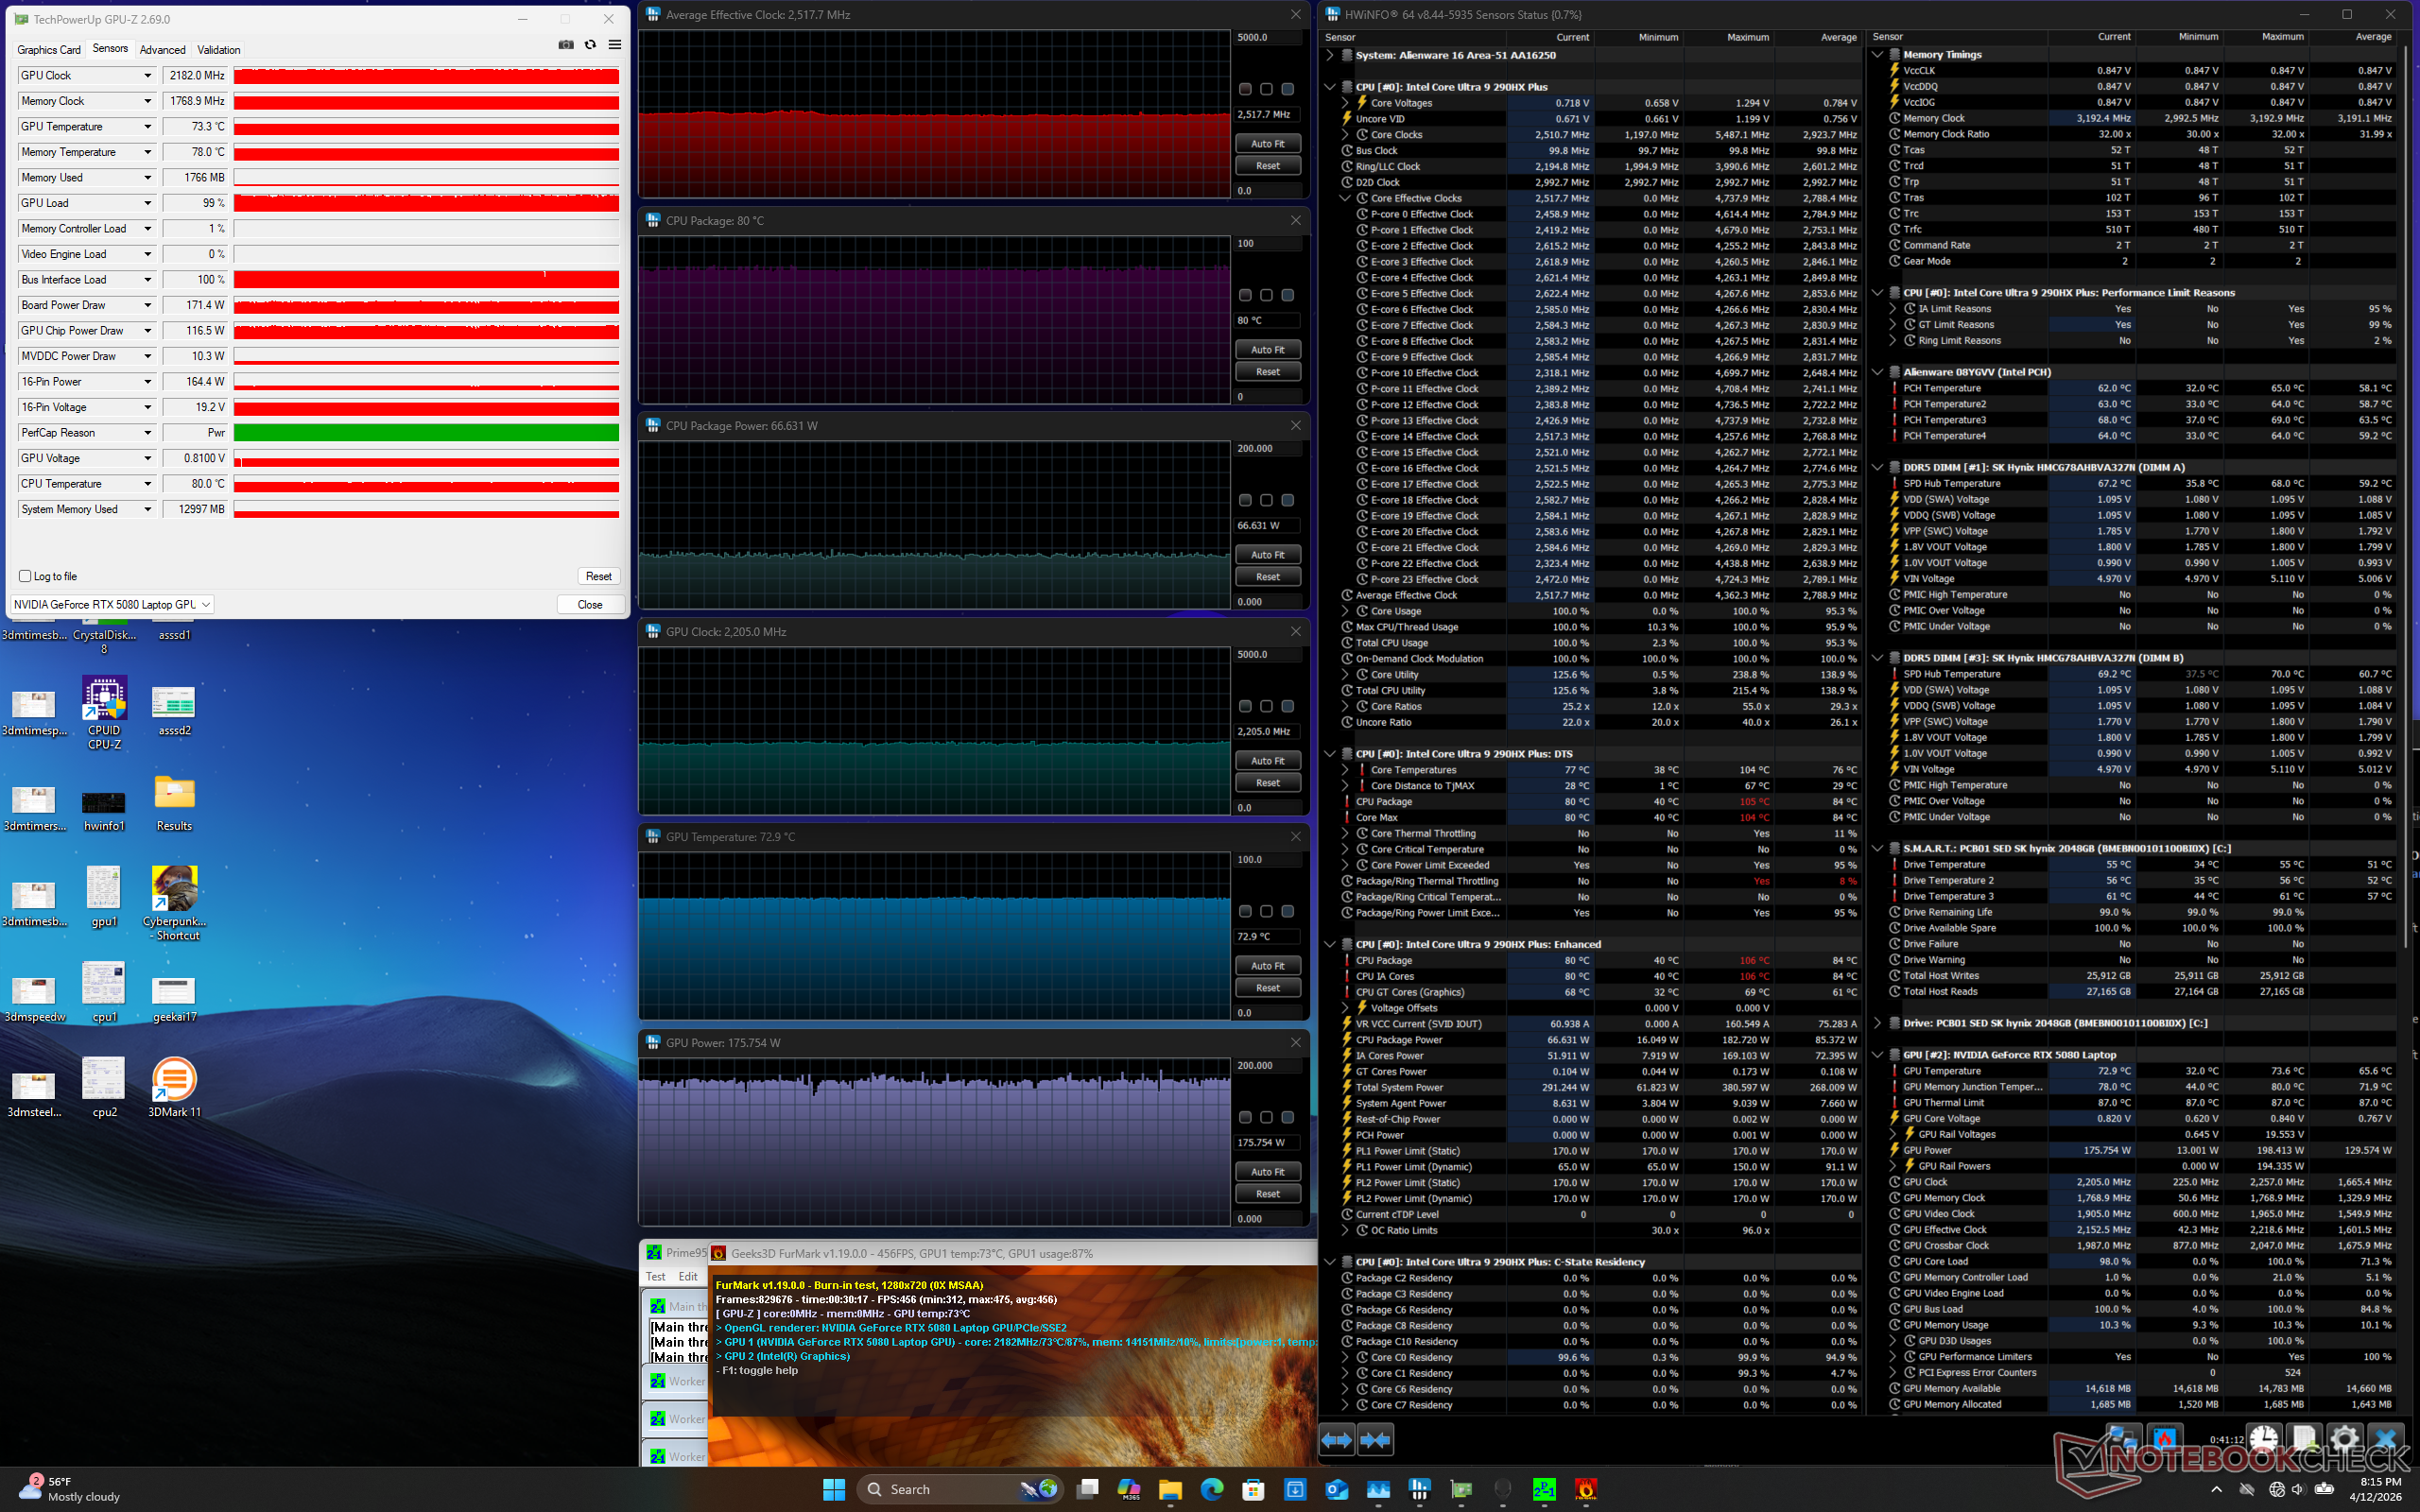
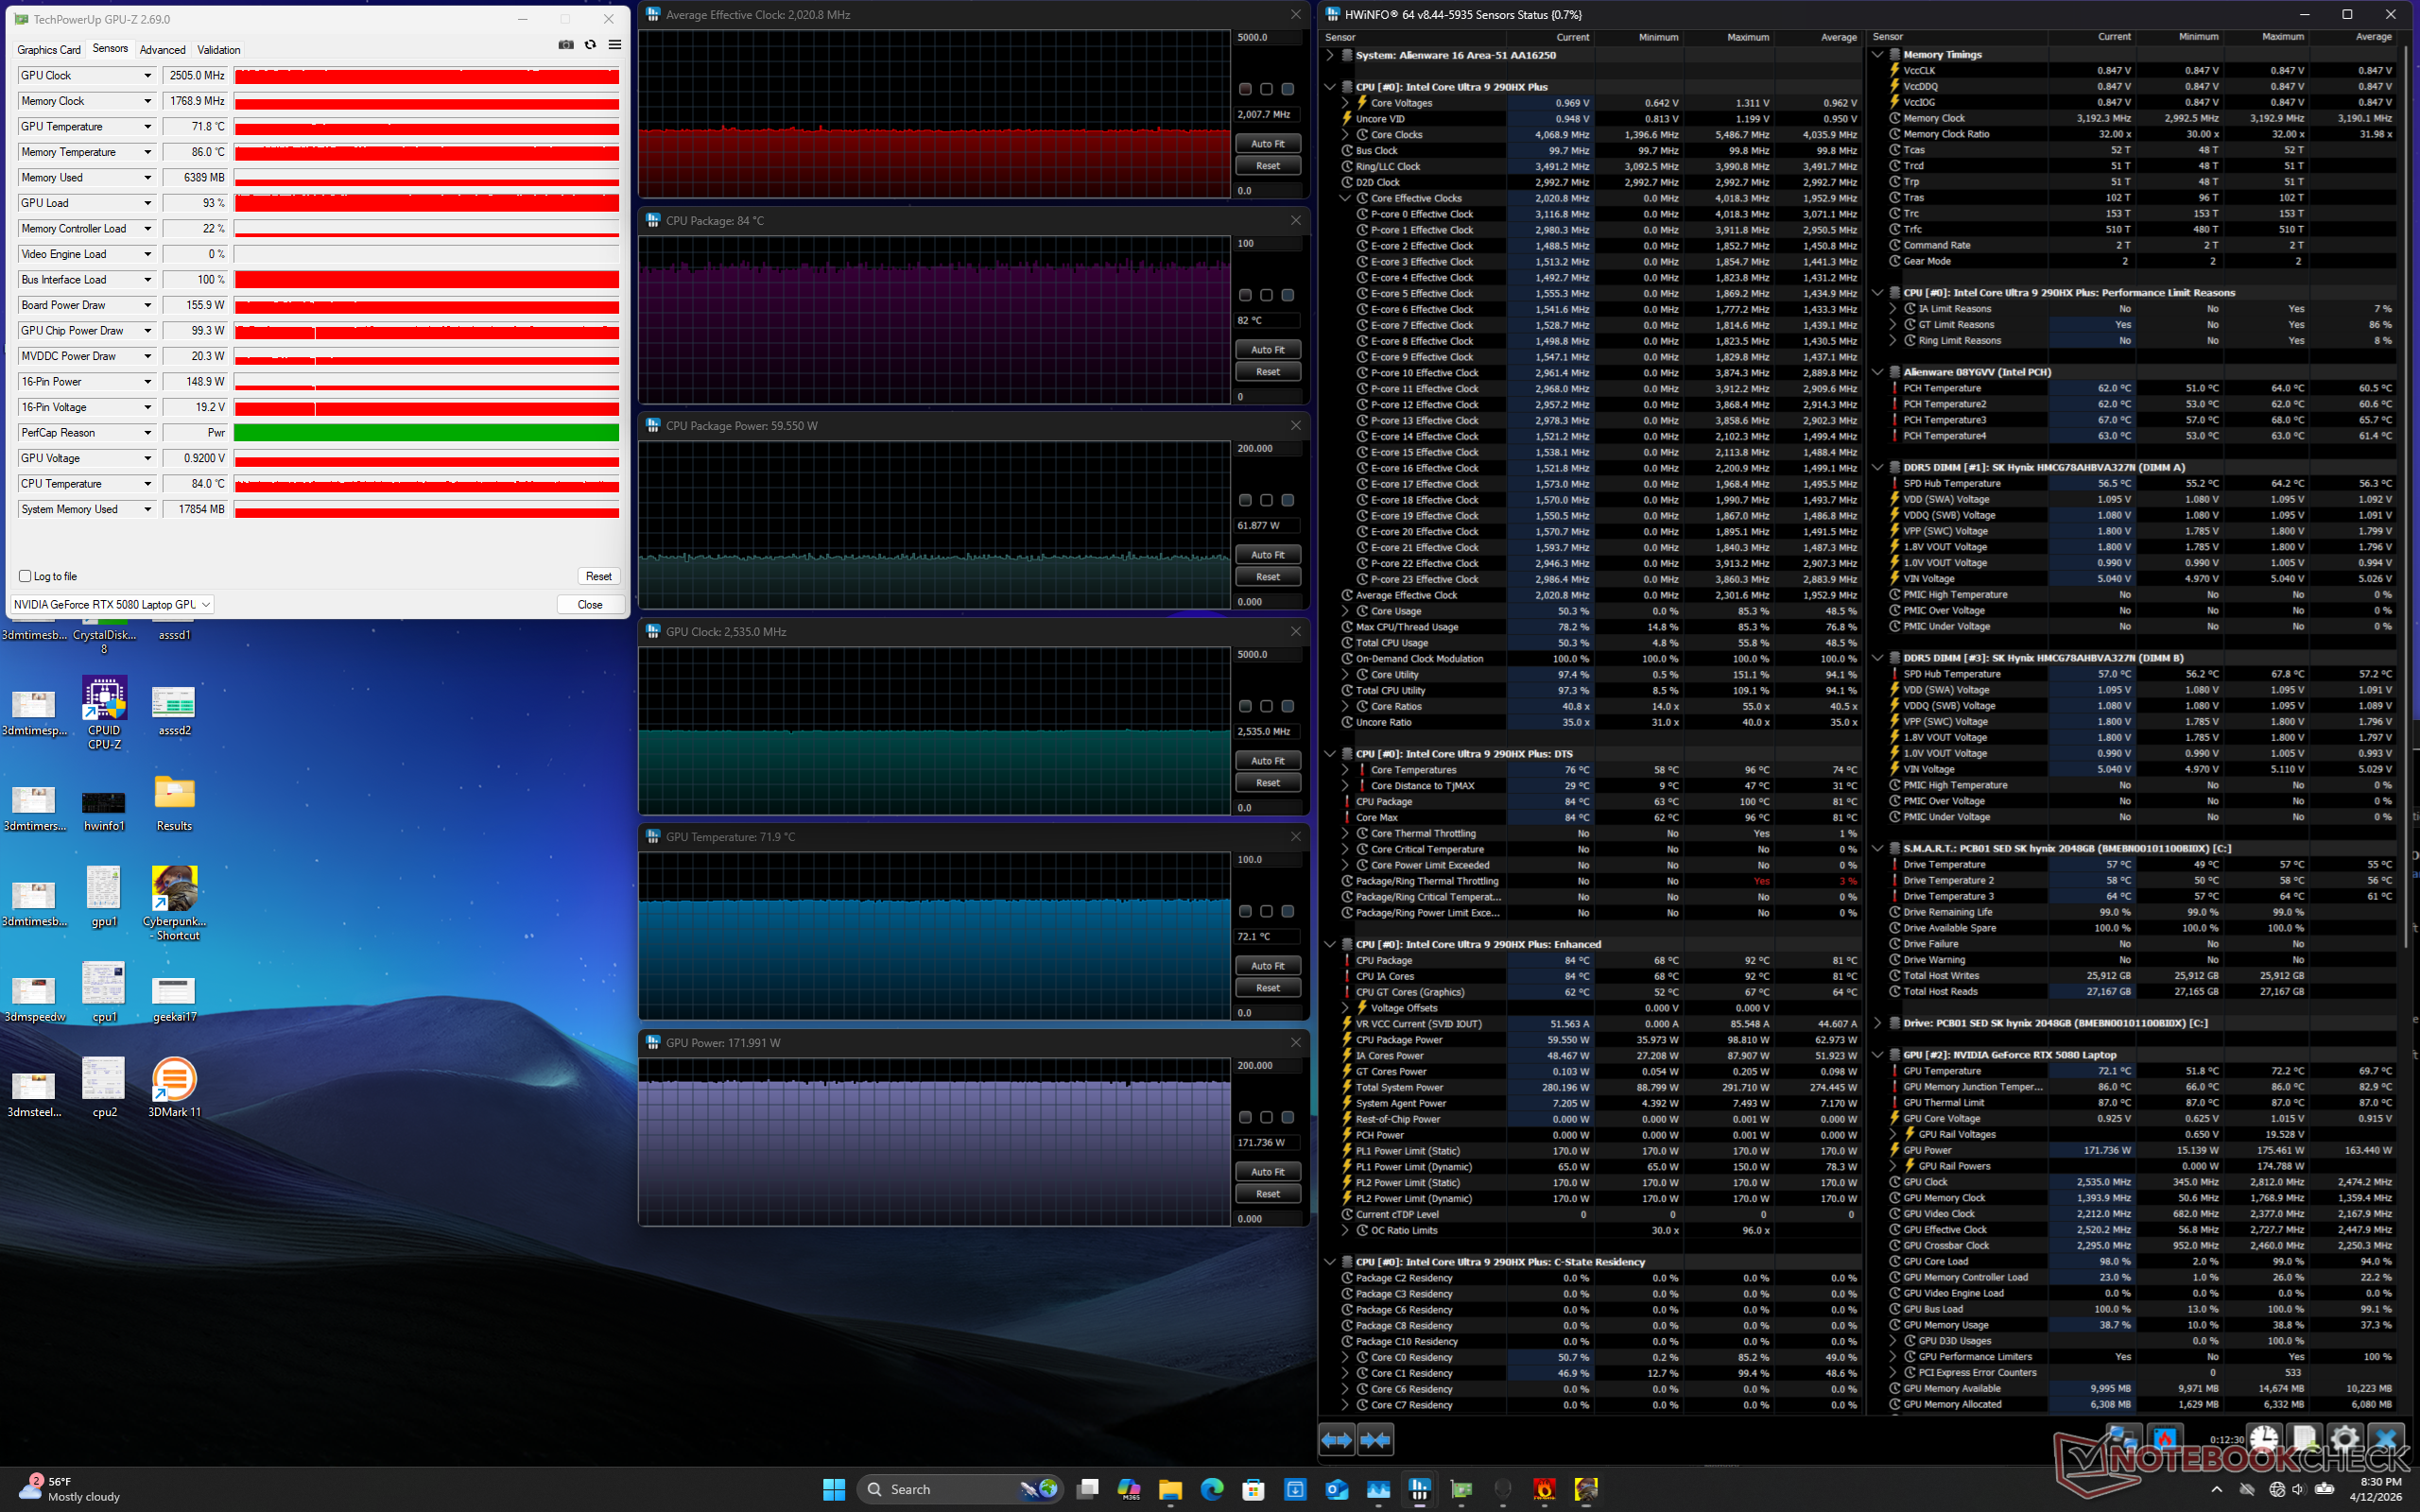
| Horloge moyenne du CPU (GHz) | Horloge du GPU (MHz) | Température moyenne du CPU (°C) | Température moyenne du GPU (°C) | |
| Système en veille | -- | -- | 41 | 32 |
| Prime95 Stress | 4.1 | -- | 103 | 52 |
| Prime95 + FurMark Stress | 2.5 | 2182 | 80 | 73 |
| Cyberpunk 2077 Stress (mode équilibré) | 1.8 | 2347 | 82 | 75 |
| Cyberpunk 2077 Stress (mode Performance) | 1.8 | 2482 | 78 | 75 |
| Cyberpunk 2077 Stress (mode Overdrive) | 2.1 | 2505 | 82 | 72 |
Intervenants
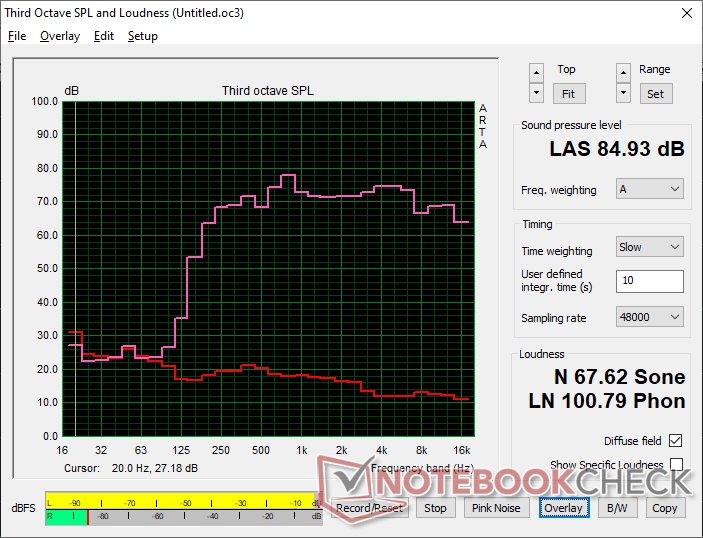
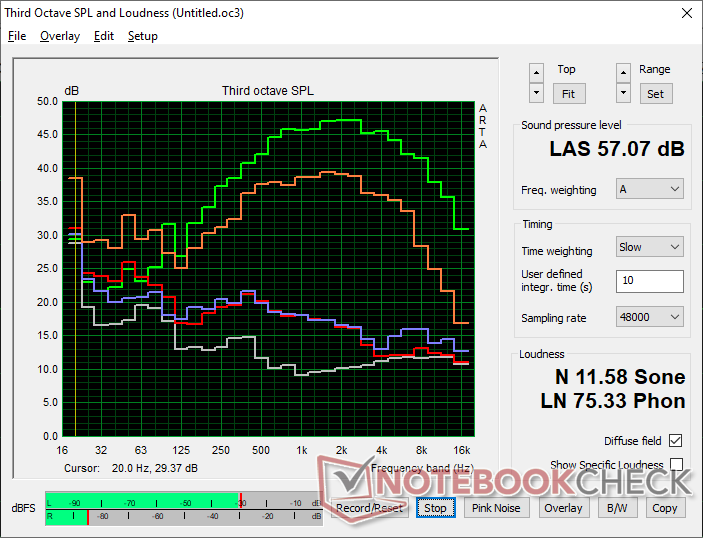
Alienware 16 Area-51 Core Ultra 9 290HX Plus analyse audio
(+) | les haut-parleurs peuvent jouer relativement fort (84.9# dB)
Basses 100 - 315 Hz
(-) | presque aucune basse - en moyenne 18.7% plus bas que la médiane
(±) | la linéarité des basses est moyenne (13.9% delta à la fréquence précédente)
Médiums 400 - 2000 Hz
(+) | médiane équilibrée - seulement 1.8% de la médiane
(+) | les médiums sont linéaires (5.1% delta à la fréquence précédente)
Aiguës 2 - 16 kHz
(+) | des sommets équilibrés - à seulement 2.5% de la médiane
(+) | les aigus sont linéaires (3.4% delta à la fréquence précédente)
Globalement 100 - 16 000 Hz
(+) | le son global est linéaire (12.6% différence à la médiane)
Par rapport à la même classe
» 16% de tous les appareils testés de cette catégorie étaient meilleurs, 4% similaires, 81% pires
» Le meilleur avait un delta de 6%, la moyenne était de 18%, le pire était de 132%.
Par rapport à tous les appareils testés
» 11% de tous les appareils testés étaient meilleurs, 3% similaires, 86% pires
» Le meilleur avait un delta de 4%, la moyenne était de 23%, le pire était de 134%.
Apple MacBook Pro 16 2021 M1 Pro analyse audio
(+) | les haut-parleurs peuvent jouer relativement fort (84.7# dB)
Basses 100 - 315 Hz
(+) | bonne basse - seulement 3.8% loin de la médiane
(+) | les basses sont linéaires (5.2% delta à la fréquence précédente)
Médiums 400 - 2000 Hz
(+) | médiane équilibrée - seulement 1.3% de la médiane
(+) | les médiums sont linéaires (2.1% delta à la fréquence précédente)
Aiguës 2 - 16 kHz
(+) | des sommets équilibrés - à seulement 1.9% de la médiane
(+) | les aigus sont linéaires (2.7% delta à la fréquence précédente)
Globalement 100 - 16 000 Hz
(+) | le son global est linéaire (4.6% différence à la médiane)
Par rapport à la même classe
» 0% de tous les appareils testés de cette catégorie étaient meilleurs, 0% similaires, 100% pires
» Le meilleur avait un delta de 5%, la moyenne était de 17%, le pire était de 45%.
Par rapport à tous les appareils testés
» 0% de tous les appareils testés étaient meilleurs, 0% similaires, 100% pires
» Le meilleur avait un delta de 4%, la moyenne était de 23%, le pire était de 134%.
Gestion de l'énergie
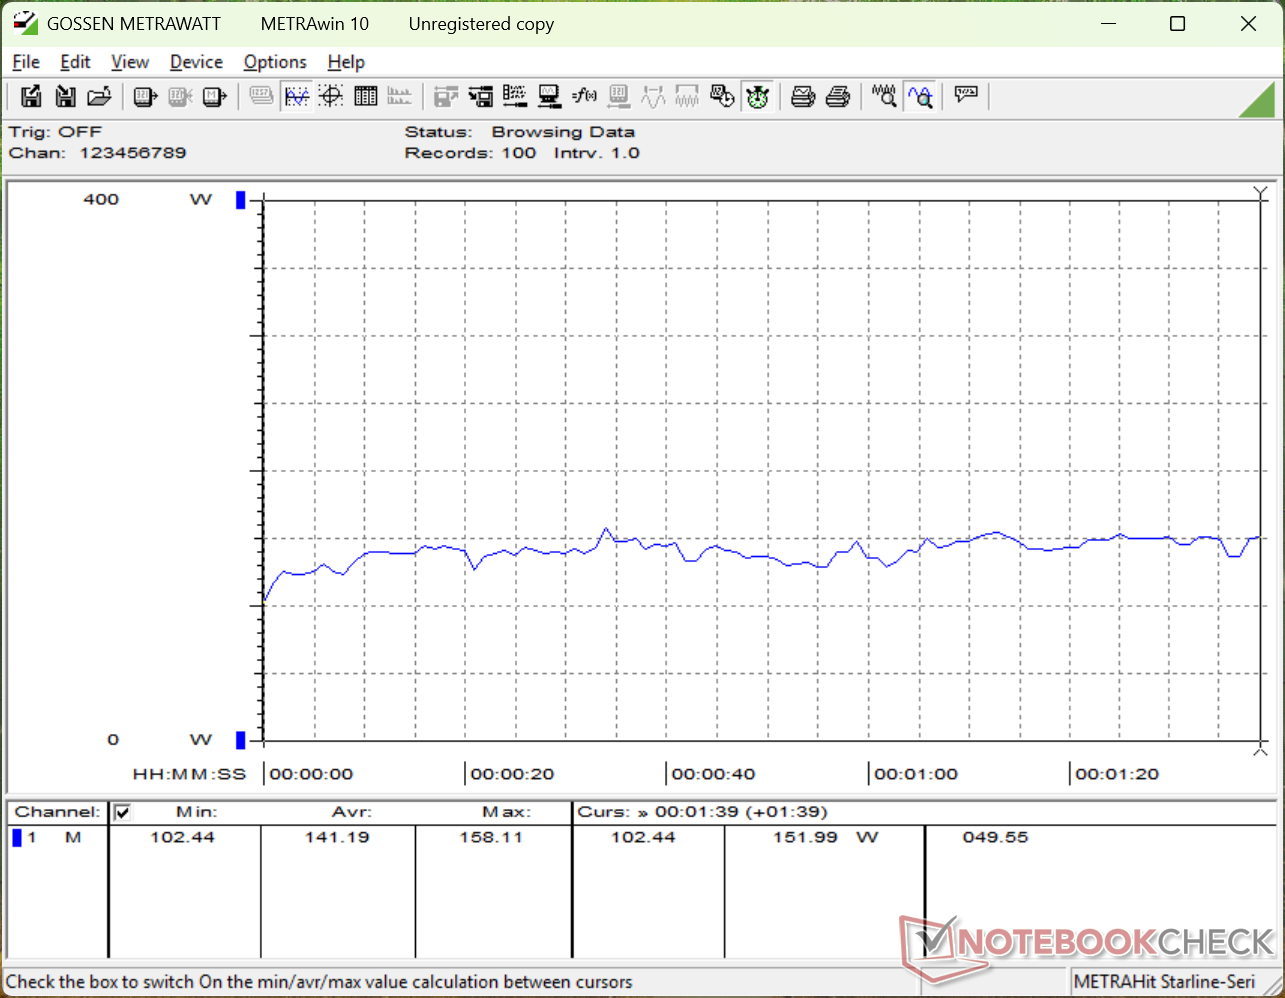
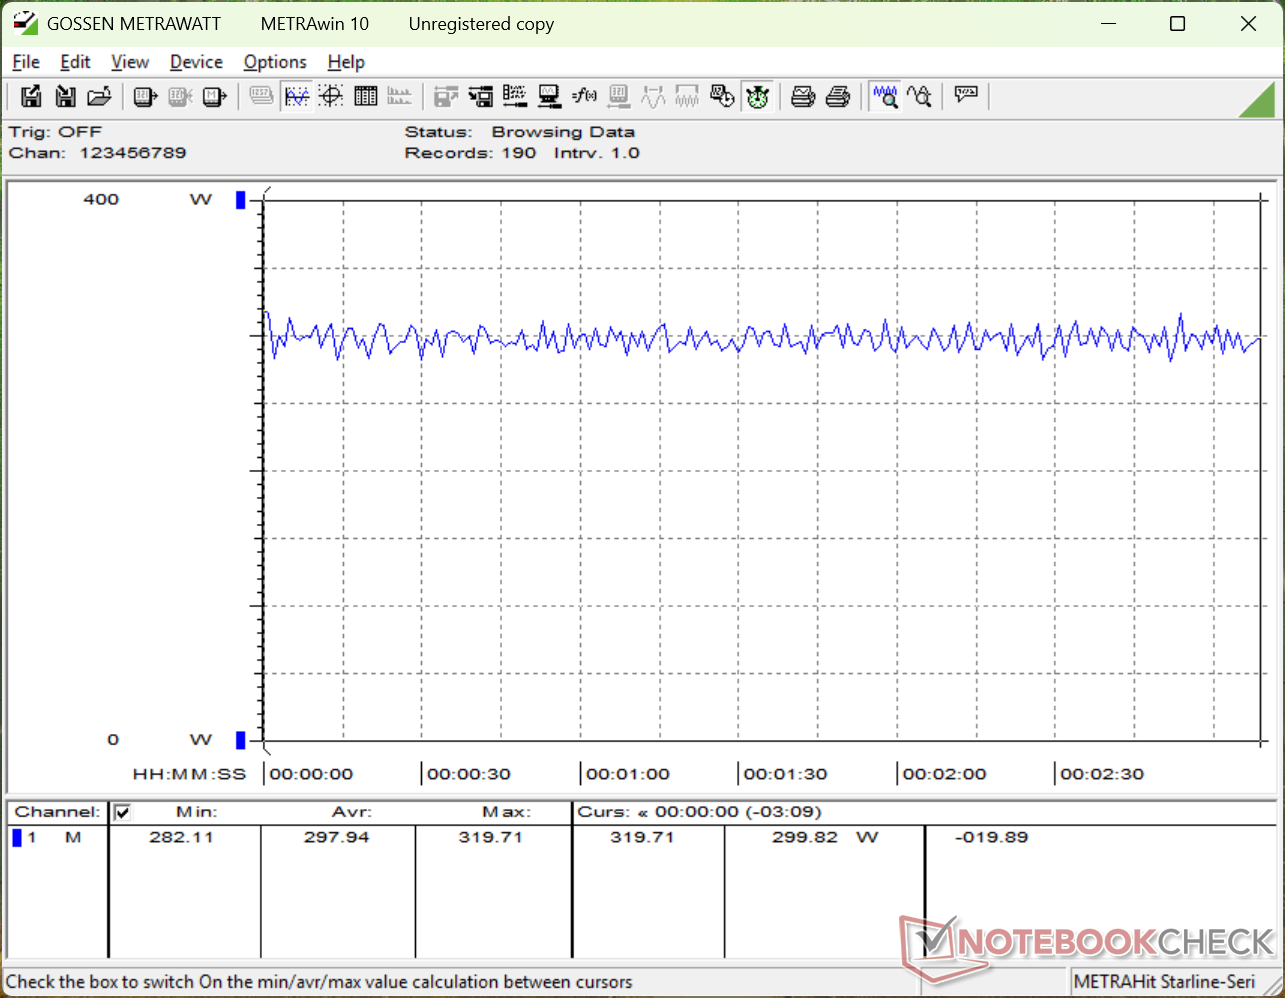
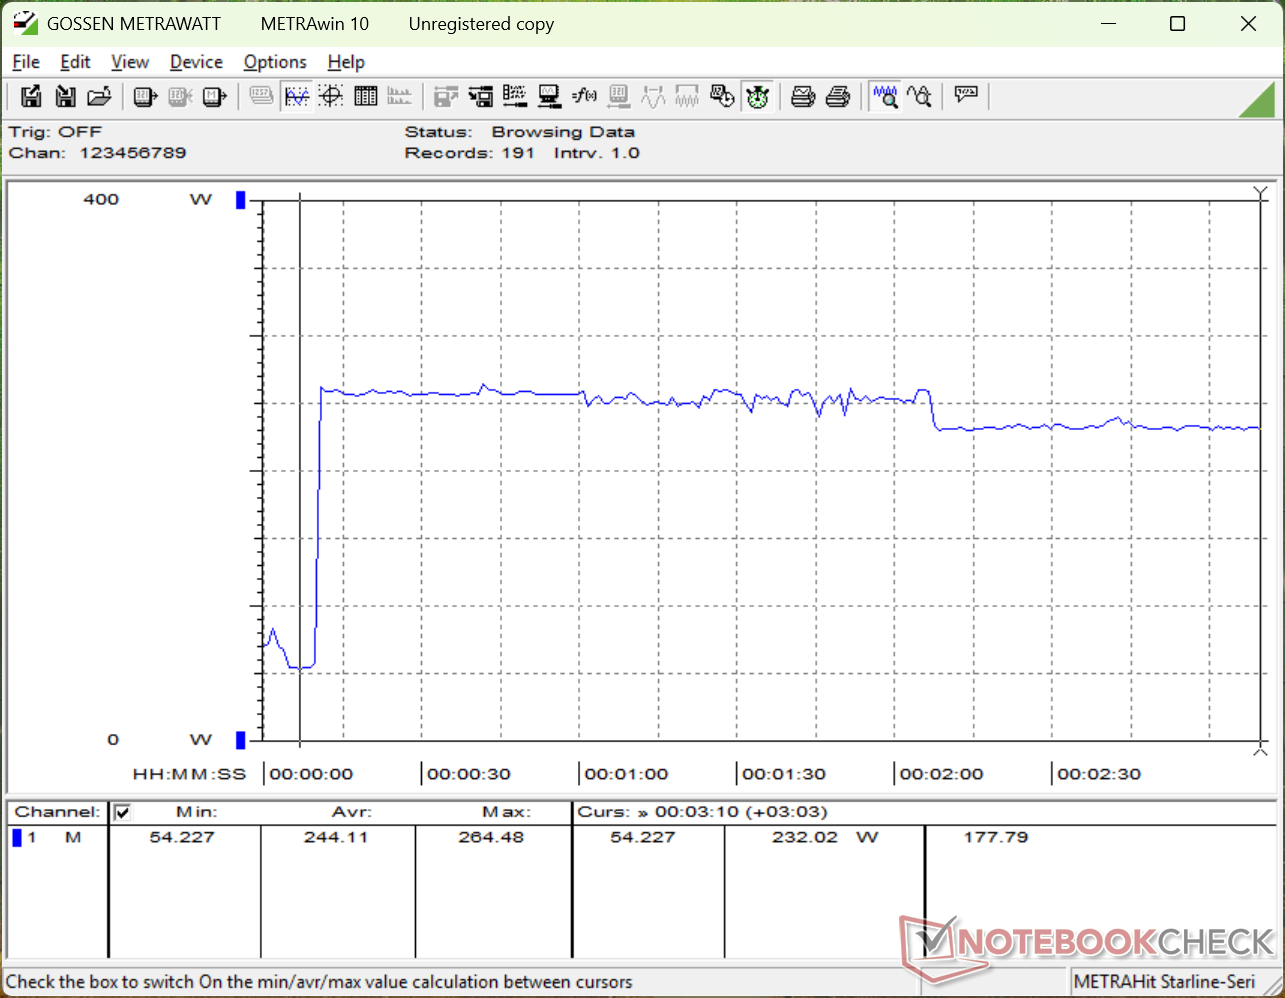
Consommation électrique
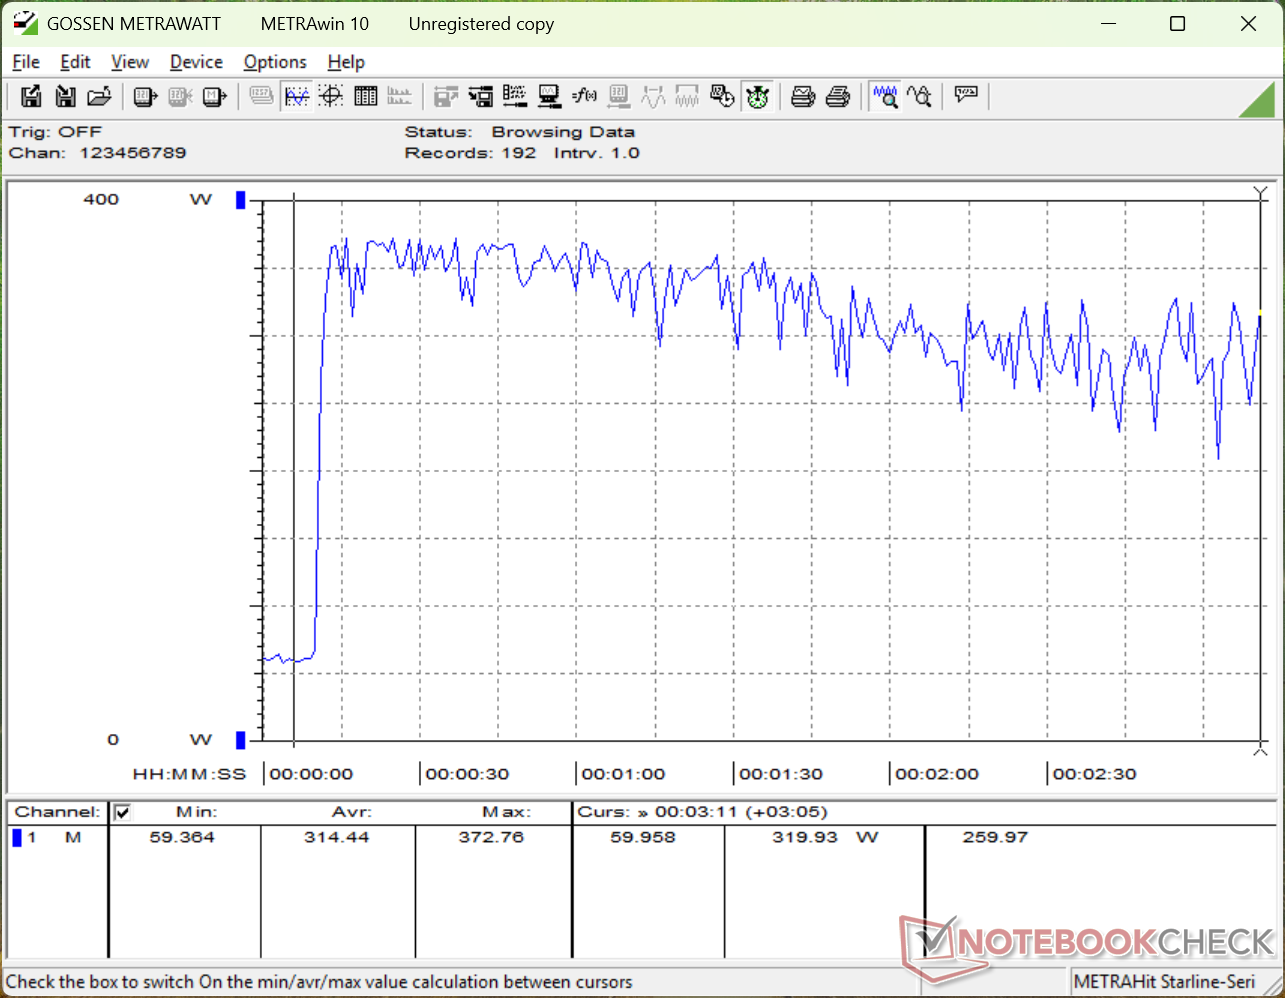
Le Core Ultra 9 290HX Plus est 15 à 25 % plus rapide que le Core Ultra 9 275HX précédent, comme mentionné ci-dessus. Comme par hasard, notre Alienware 16 2026 est 15 à 25 % plus exigeant que l'Alienware 16 2025 lorsque le CPU est sollicité. L'exécution de Prime95 sur le dernier modèle Alienware consomme environ 255 W lorsque Turbo Boost est le plus efficace ou 230 W lorsque Turbo Boost a atteint un plateau, contre seulement 200 W sur le modèle de l'année dernière. Même lorsque vous ne jouez pas, le nouveau modèle est généralement plus exigeant, avec au moins quelques watts de plus.
L'adaptateur AC GaN de 360 W n'a pas changé par rapport au modèle 2025.
| Éteint/en veille | |
| Au repos | |
| Fortement sollicité |
|
Légende:
min: | |
| Alienware 16 Area-51 Core Ultra 9 290HX Plus Ultra 9 290HX Plus, GeForce RTX 5080 Laptop, SK hynix PCB01 HFS001TFM9X186N, OLED, 2560x1600, 16" | Alienware 16 Area-51 Ultra 9 275HX, GeForce RTX 5080 Laptop, Samsung PM9C1a MZ9L81T0HDLB, IPS, 2560x1600, 16" | Lenovo Legion Pro 7i 16 Gen 10 Ultra 9 275HX, GeForce RTX 5080 Laptop, SK Hynix HFS001TEJ9X115N, OLED, 2560x1600, 16" | HP Omen Max 16 ah000 Ultra 9 275HX, GeForce RTX 5090 Laptop, WDC PC SN810 2TB, OLED, 2560x1600, 16" | MSI Vector 16 HX AI A2XWHG Ultra 7 255HX, GeForce RTX 5070 Ti Laptop, Micron 2400 MTFDKBA512QFM, IPS, 2560x1600, 16" | Asus ROG Zephyrus G16 GU605CW Ultra 9 285H, GeForce RTX 5080 Laptop, Micron 2500 2TB MTFDKBA2T0QGN-1BN1AABGA, OLED, 2560x1600, 16" | |
|---|---|---|---|---|---|---|
| Power Consumption | 2% | -11% | 18% | 32% | 46% | |
| Idle Minimum * (Watt) | 23.9 | 27 -13% | 28.5 -19% | 9.9 59% | 7.1 70% | 12.6 47% |
| Idle Average * (Watt) | 25.2 | 33.5 -33% | 38.8 -54% | 28.6 -13% | 15.9 37% | 13.4 47% |
| Idle Maximum * (Watt) | 49.6 | 41.4 17% | 45.6 8% | 47.1 5% | 29.5 41% | 15.1 70% |
| Load Average * (Watt) | 141.2 | 124.7 12% | 132.2 6% | 141.8 -0% | 124 12% | 116.3 18% |
| Cyberpunk 2077 ultra external monitor * (Watt) | 297 | 249 16% | 319 -7% | 230 23% | 217 27% | 157.9 47% |
| Cyberpunk 2077 ultra * (Watt) | 298 | 256 14% | 318 -7% | 253 15% | 222 26% | 156.4 48% |
| Load Maximum * (Watt) | 372.8 | 367.2 2% | 384 -3% | 233 37% | 336 10% | 199 47% |
* ... Moindre est la valeur, meilleures sont les performances
Consommation électrique Cyberpunk / Stress Test
Consommation électrique du moniteur externe
Autonomie de la batterie
La durée de fonctionnement du réseau local sans fil est à peu près la même qu'auparavant, voire légèrement plus longue d'une demi-heure, même si le VRR et l'Optimus sont activés et que les LED sont désactivées. Néanmoins, 3 heures, ce n'est pas très long, quel que soit le point de vue que l'on adopte.
| Alienware 16 Area-51 Core Ultra 9 290HX Plus Ultra 9 290HX Plus, GeForce RTX 5080 Laptop, 96 Wh | Alienware 16 Area-51 Ultra 9 275HX, GeForce RTX 5080 Laptop, 96 Wh | Lenovo Legion Pro 7i 16 Gen 10 Ultra 9 275HX, GeForce RTX 5080 Laptop, 99 Wh | HP Omen Max 16 ah000 Ultra 9 275HX, GeForce RTX 5090 Laptop, 83 Wh | MSI Vector 16 HX AI A2XWHG Ultra 7 255HX, GeForce RTX 5070 Ti Laptop, 90 Wh | Asus ROG Zephyrus G16 GU605CW Ultra 9 285H, GeForce RTX 5080 Laptop, 90 Wh | |
|---|---|---|---|---|---|---|
| Autonomie de la batterie | -13% | 69% | 81% | 119% | ||
| WiFi v1.3 (h) | 3.2 | 2.8 -13% | 5.4 69% | 5.8 81% | 7 119% | |
| Reader / Idle (h) | 3.1 | 8.7 | ||||
| Load (h) | 0.8 | 1.2 |
Notebookcheck Rating
L'Alienware 16 Area-51 avec Core Ultra 9 290HX Plus est la version la plus rapide du modèle disponible. Pour la grande majorité des joueurs, cependant, la puissance supplémentaire du processeur ne fera au mieux qu'une différence mineure.
Alienware 16 Area-51 Core Ultra 9 290HX Plus
- 04/22/2026 v8
Allen Ngo
 Total Sustainability Score:
 Comparaison avec des concurrents potentiels
Image | Modèle | Prix | Poids | Épaisseur | Écran |
|---|---|---|---|---|---|
1. 88.1%  | Alienware 16 Area-51 Core Ultra 9 290HX Plus Intel Core Ultra 9 290HX Plus ⎘ NVIDIA GeForce RTX 5080 Laptop ⎘ 32 Go Mémoire, SSD | Amazon: Prix de liste: 4000 USD | 3.3 kg | 28.5 mm | 16.00" 2560x1600 189 PPI OLED |
2. 85.7%  | Alienware 16 Area-51 Intel Core Ultra 9 275HX ⎘ NVIDIA GeForce RTX 5080 Laptop ⎘ 32 Go Mémoire, 1024 Go SSD | Amazon: 1. $2,463.19 Alienware 16 Area-51 Gaming ... 2. $3,899.99 Alienware 16 Area-51 Gaming ... 3. $3,799.99 Alienware 16 Area-51 Gaming ... Prix de liste: 3500 USD | 3.3 kg | 28.5 mm | 16.00" 2560x1600 189 PPI IPS |
3. 87.5%  | Lenovo Legion Pro 7i 16 Gen 10 Intel Core Ultra 9 275HX ⎘ NVIDIA GeForce RTX 5080 Laptop ⎘ 32 Go Mémoire, 1024 Go SSD | Amazon: Prix de liste: 4200 USD | 2.6 kg | 26.65 mm | 16.00" 2560x1600 189 PPI OLED |
4. 81.9%  | HP Omen Max 16 ah000 Intel Core Ultra 9 275HX ⎘ NVIDIA GeForce RTX 5090 Laptop ⎘ 32 Go Mémoire, 2048 Go SSD | Amazon: Prix de liste: 3800 USD | 2.8 kg | 24.9 mm | 16.00" 2560x1600 189 PPI OLED |
5. 84%  | MSI Vector 16 HX AI A2XWHG Intel Core Ultra 7 255HX ⎘ NVIDIA GeForce RTX 5070 Ti Laptop ⎘ 16 Go Mémoire, 512 Go SSD | Amazon: Prix de liste: 2000 EUR | 2.6 kg | 28.6 mm | 16.00" 2560x1600 189 PPI IPS |
6.  | Asus ROG Zephyrus G16 GU605CW Intel Core Ultra 9 285H ⎘ NVIDIA GeForce RTX 5080 Laptop ⎘ 32 Go Mémoire, 2048 Go SSD | Amazon: Prix de liste: 3800€ | 2 kg | 14.9 mm | 16.00" 2560x1600 189 PPI OLED |
Transparency
La sélection des appareils à examiner est effectuée par notre équipe éditoriale. L'échantillon de test a été prêté à l'auteur par le fabricant ou le détaillant pour les besoins de cet examen. Le prêteur n'a pas eu d'influence sur cette évaluation et le fabricant n'a pas reçu de copie de cette évaluation avant sa publication. Il n'y avait aucune obligation de publier cet article. En tant que média indépendant, Notebookcheck n'est pas soumis à l'autorité des fabricants, des détaillants ou des éditeurs.
Voici comment Notebookcheck teste
Chaque année, Notebookcheck examine de manière indépendante des centaines d'ordinateurs portables et de smartphones en utilisant des procédures standardisées afin de garantir que tous les résultats sont comparables. Nous avons continuellement développé nos méthodes de test depuis environ 20 ans et avons établi des normes industrielles dans le processus. Dans nos laboratoires de test, des équipements de mesure de haute qualité sont utilisés par des techniciens et des rédacteurs expérimentés. Ces tests impliquent un processus de validation en plusieurs étapes. Notre système d'évaluation complexe repose sur des centaines de mesures et de points de référence bien fondés, ce qui garantit l'objectivité.
