


Verdict - Le XMG Pro 16 E25 est une grande amélioration
Le nouveau XMPG Pro 16 est une amélioration significative par rapport à l'ancien modèle et l'écart avec le XMG Neo 16 s'est considérablement réduit. Les performances du nouvel ordinateur portable RTX 5070 Ti sont impressionnantes et cette version utilise la variante la plus rapide avec un TGP de 140 watts. Avec le nouveau Core Ultra 9 275HX, les performances de jeu de l'ordinateur portable sont également bonnes, bien que nous aimerions également voir un modèle avec l'AMD Ryzen 9 9955HX. Bien que le refroidissement soit très bruyant en charge, les températures sont nettement inférieures à celles de l'ancien modèle, malgré l'augmentation des performances.
Son écran IPS fait du bon travail et bien que sa connectivité comprenne PCIe 5.0, vous devrez vous passer de Thunderbolt 5, d'Advanced Optimus et de Wi-Fi 7. Le rapport prix/performances du nouveau Pro 16 reste bon avec un prix de départ d'environ 2 270 $, et à caractéristiques comparables, il est environ 400 $ moins cher que le Neo 16.
Points positifs
Points négatifs
Prix et disponibilité
Le nouveau XMG Pro 16 (E25) est disponible chez Bestware, à partir de 2 270 $ environ.
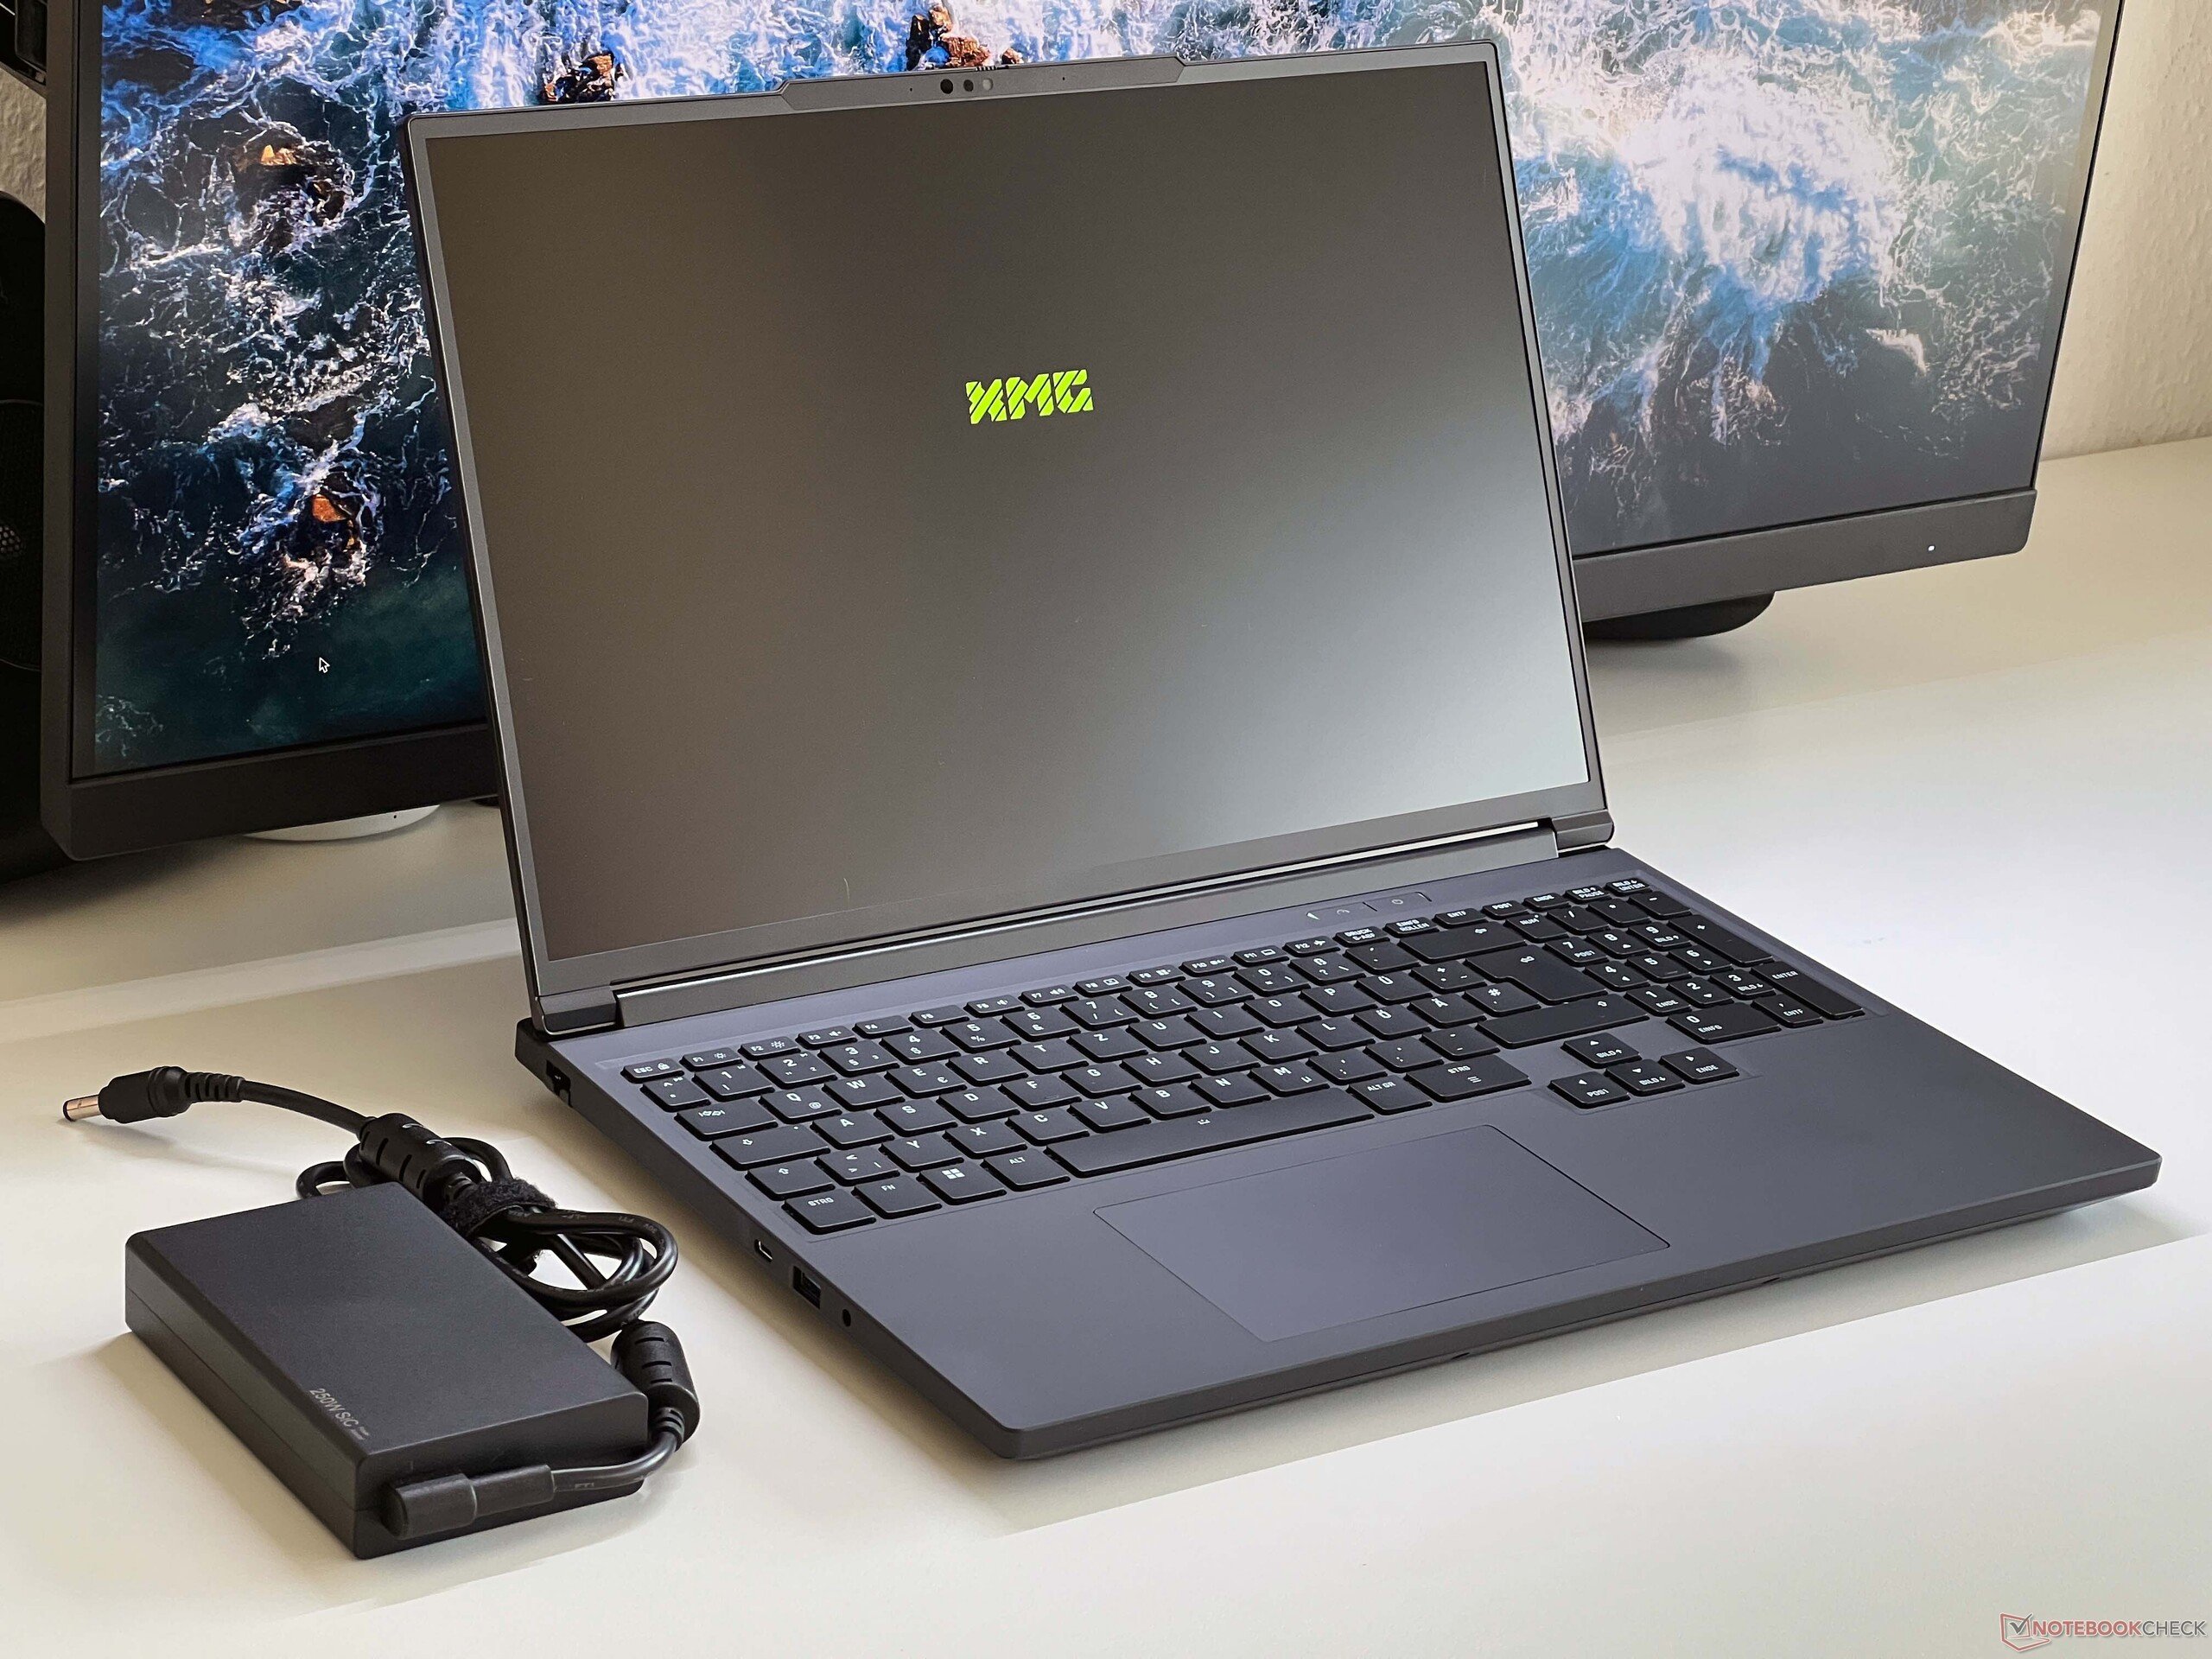
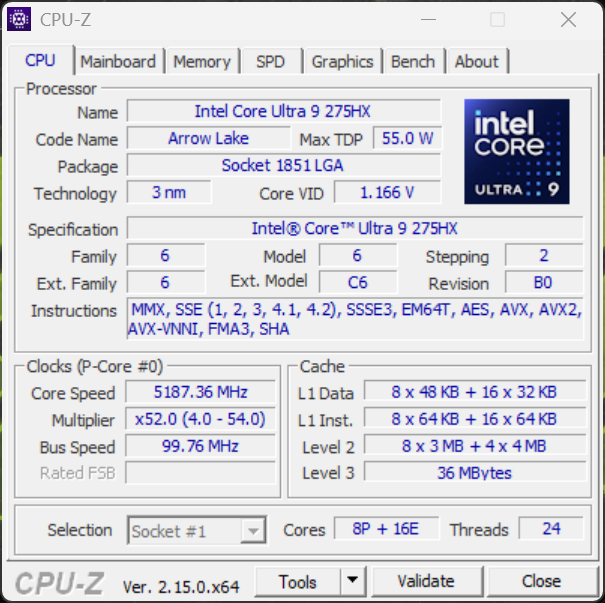
Le Pro 16 de XMG est un ordinateur portable rapide de 16 pouces destiné aux joueurs et aux stations de travail. Le modèle 2025 a été doté d'un tout nouveau boîtier ainsi que de l'ordinateur portable GeForce RTX 5070 Ti. Les acheteurs peuvent choisir entre deux processeurs, à savoir l'ancien Core i9-13900HX et le nouveau Core Ultra 9 275HX. Il est équipé d'un écran WQHD IPS mat (500 nits, 300 Hz). Notre appareil de test équipé du Core Ultra 9, de 32 Go de RAM et d'un disque SSD rapide de 1 To (PCIe 5.0) coûte environ 2 800 dollars.
Spécifications
Boîtier et connectivité
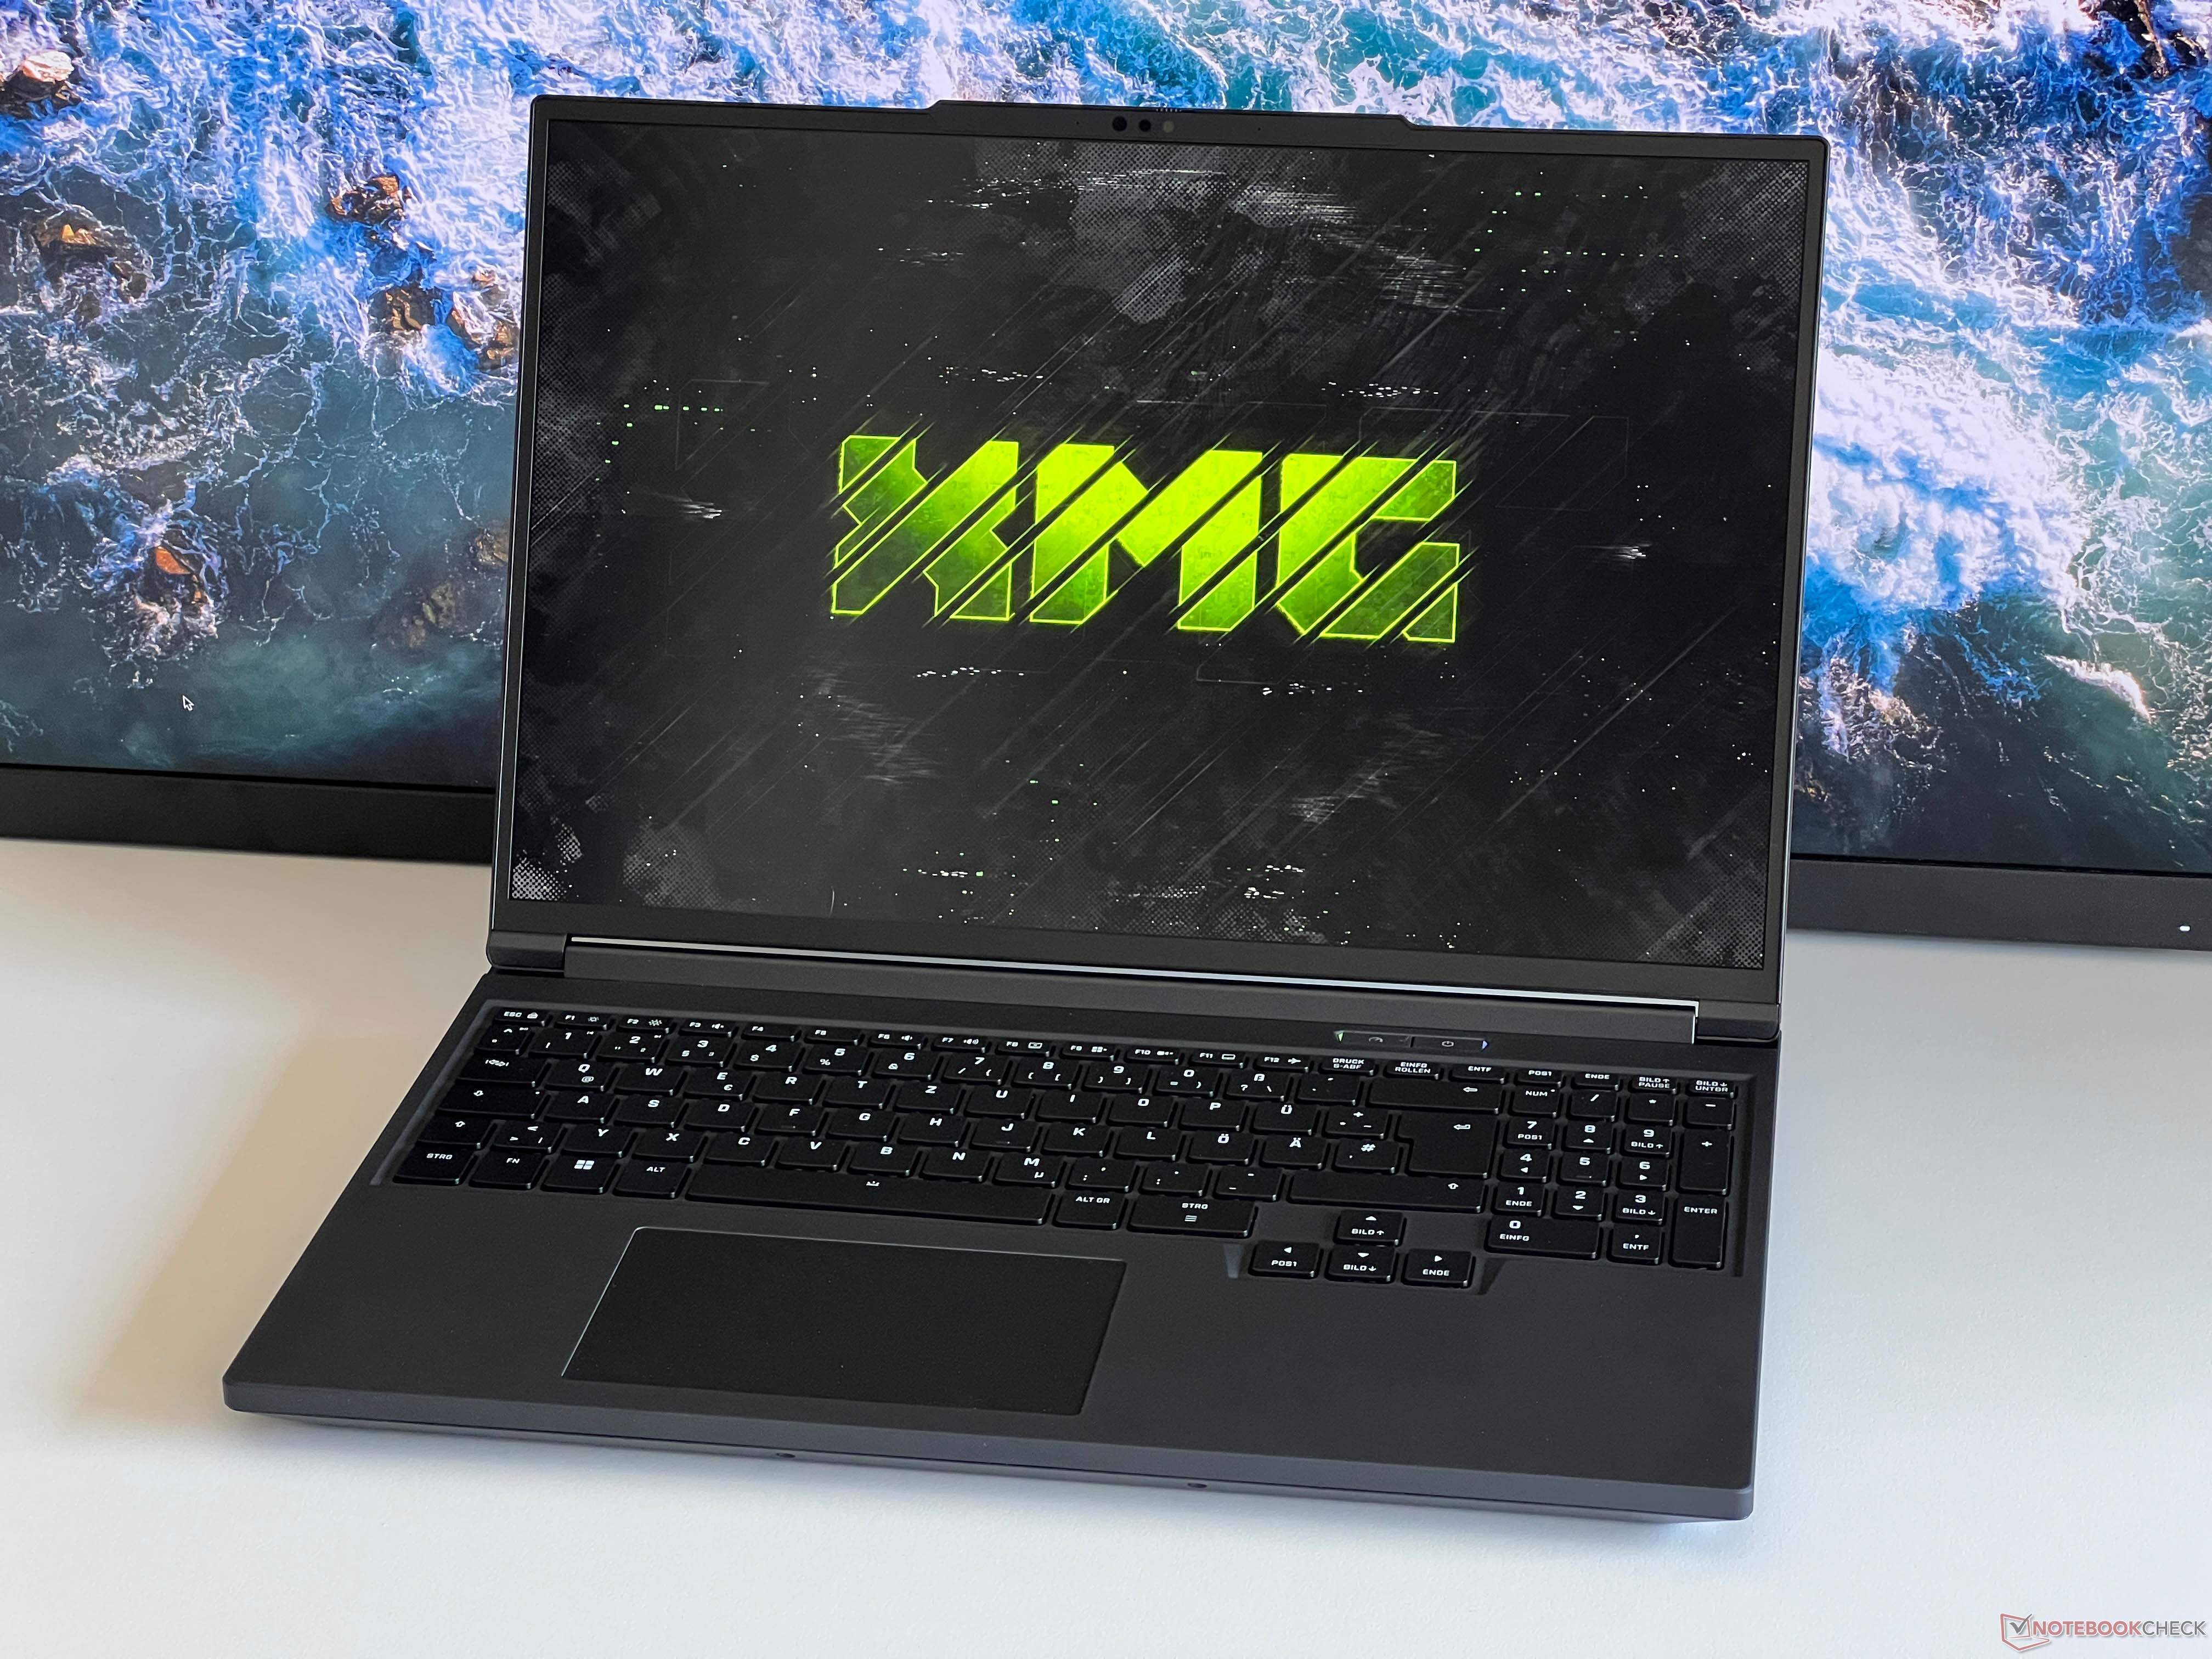
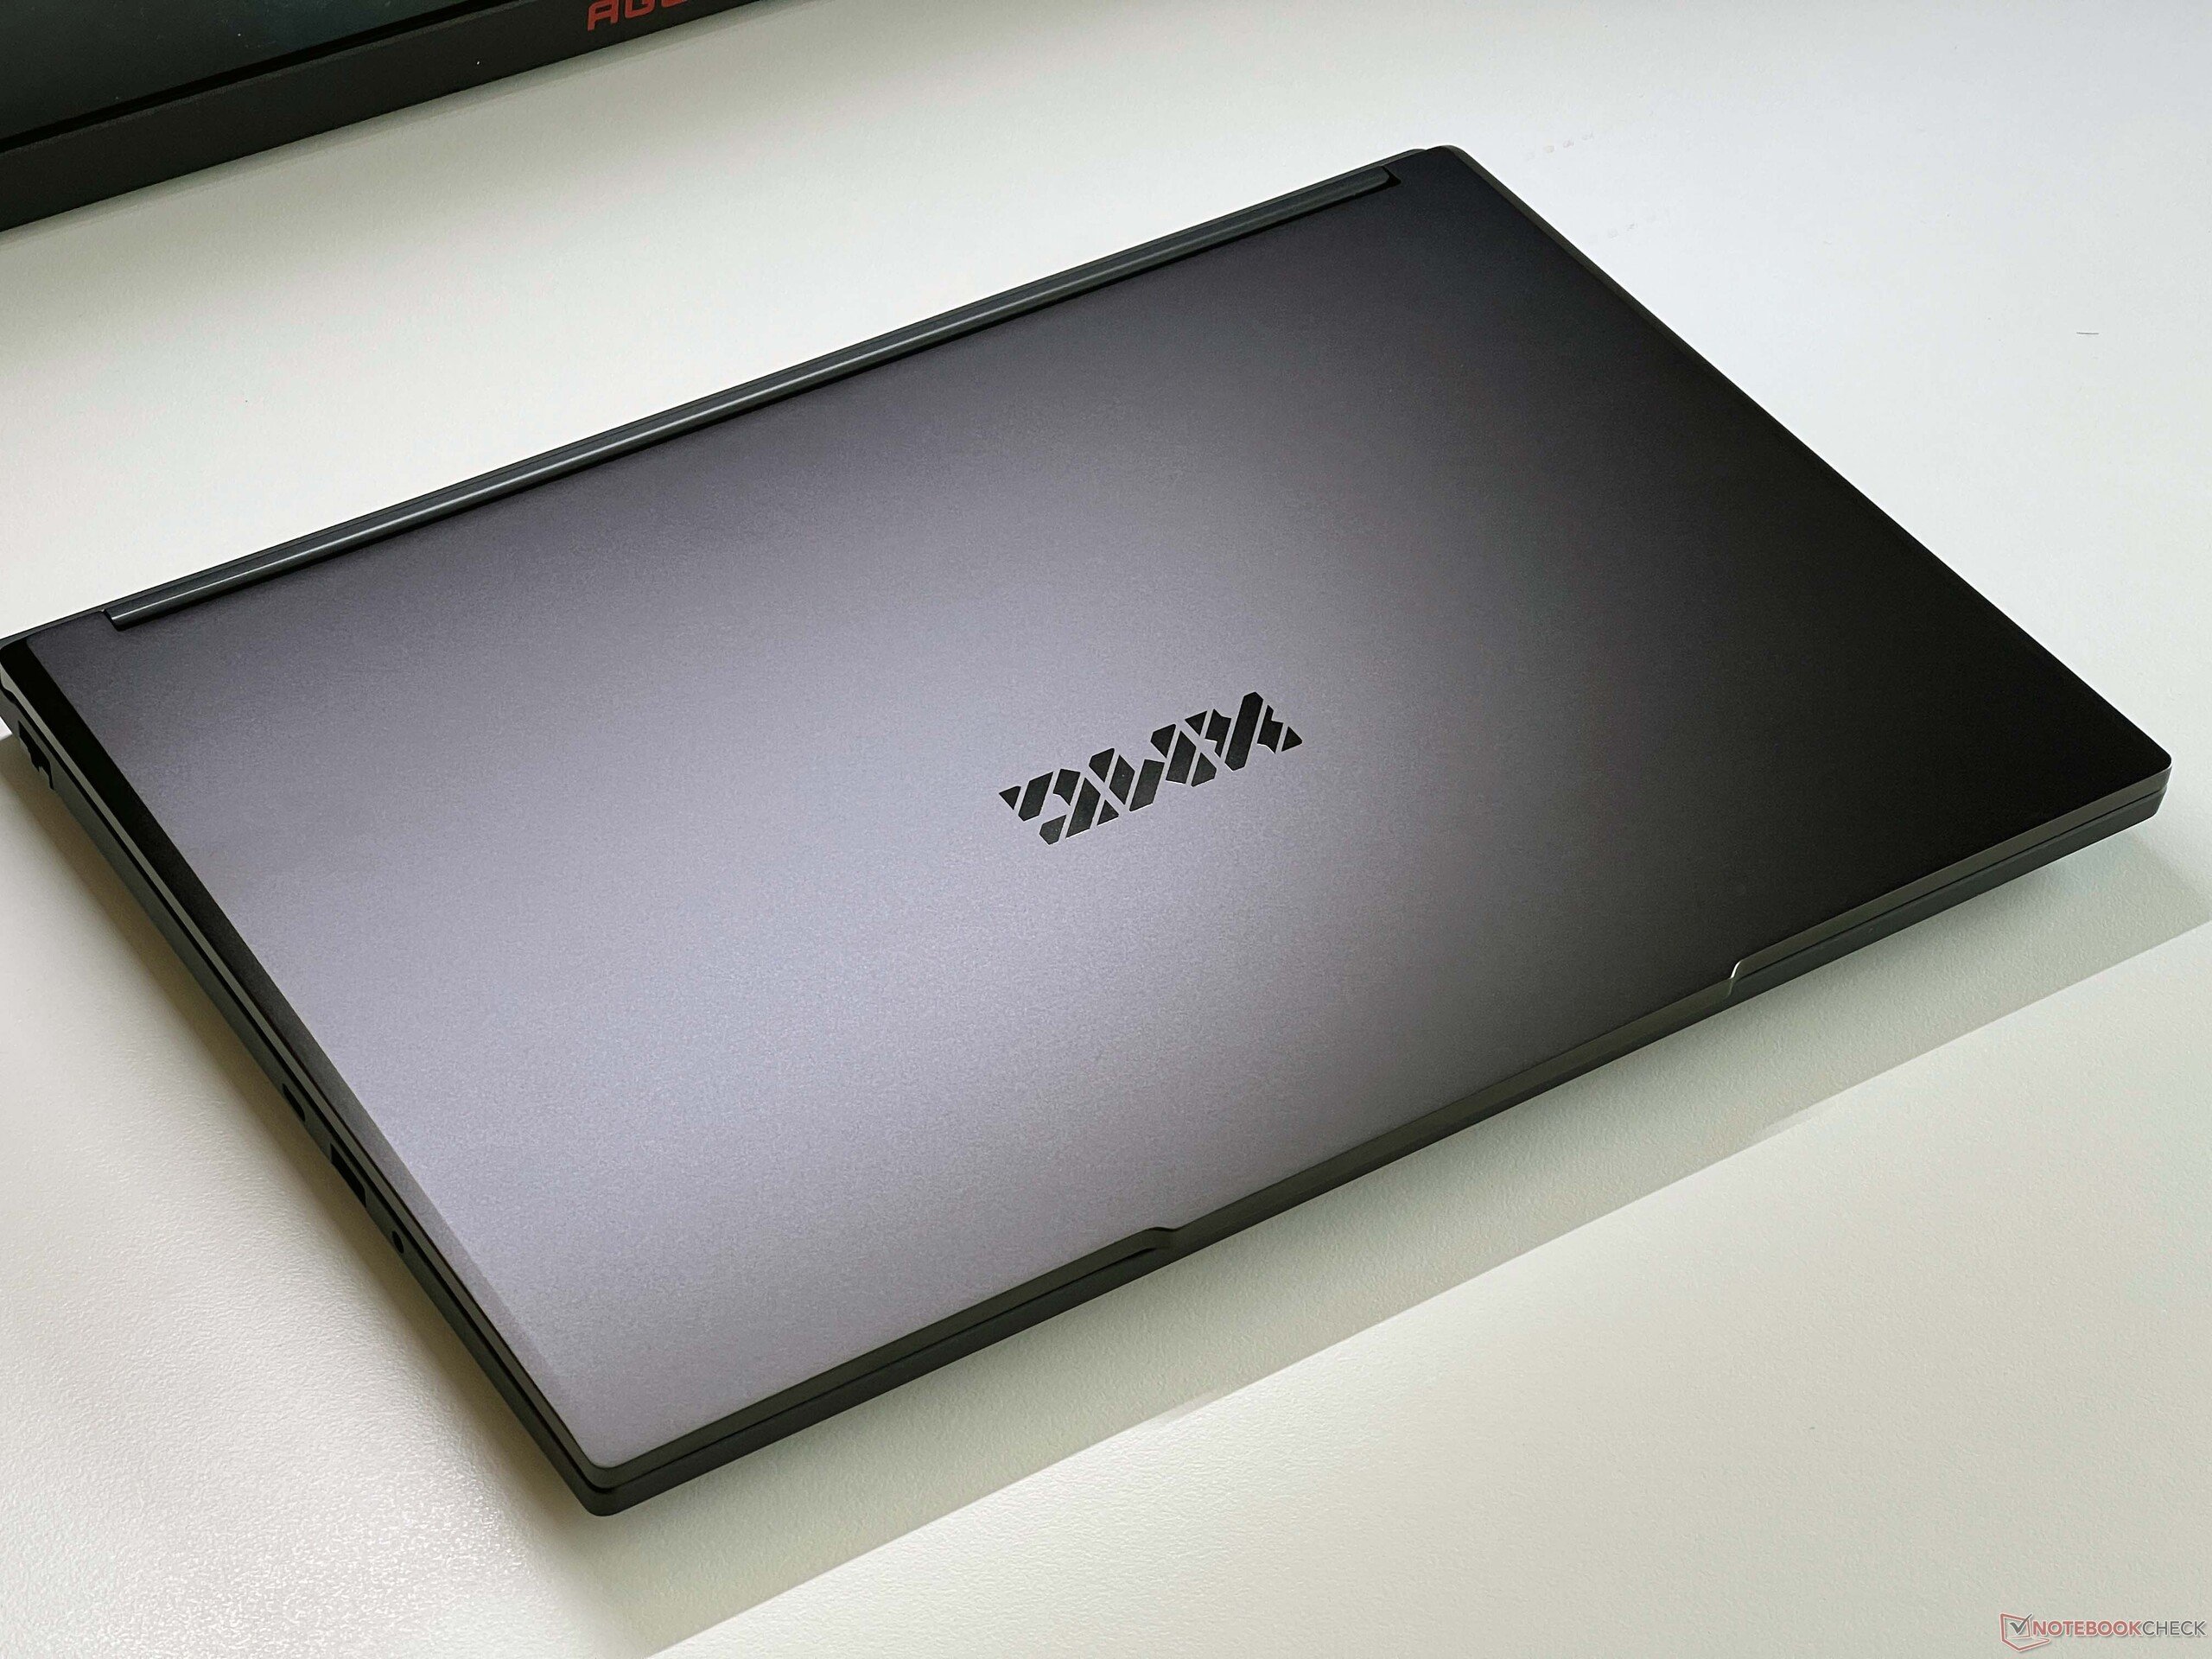
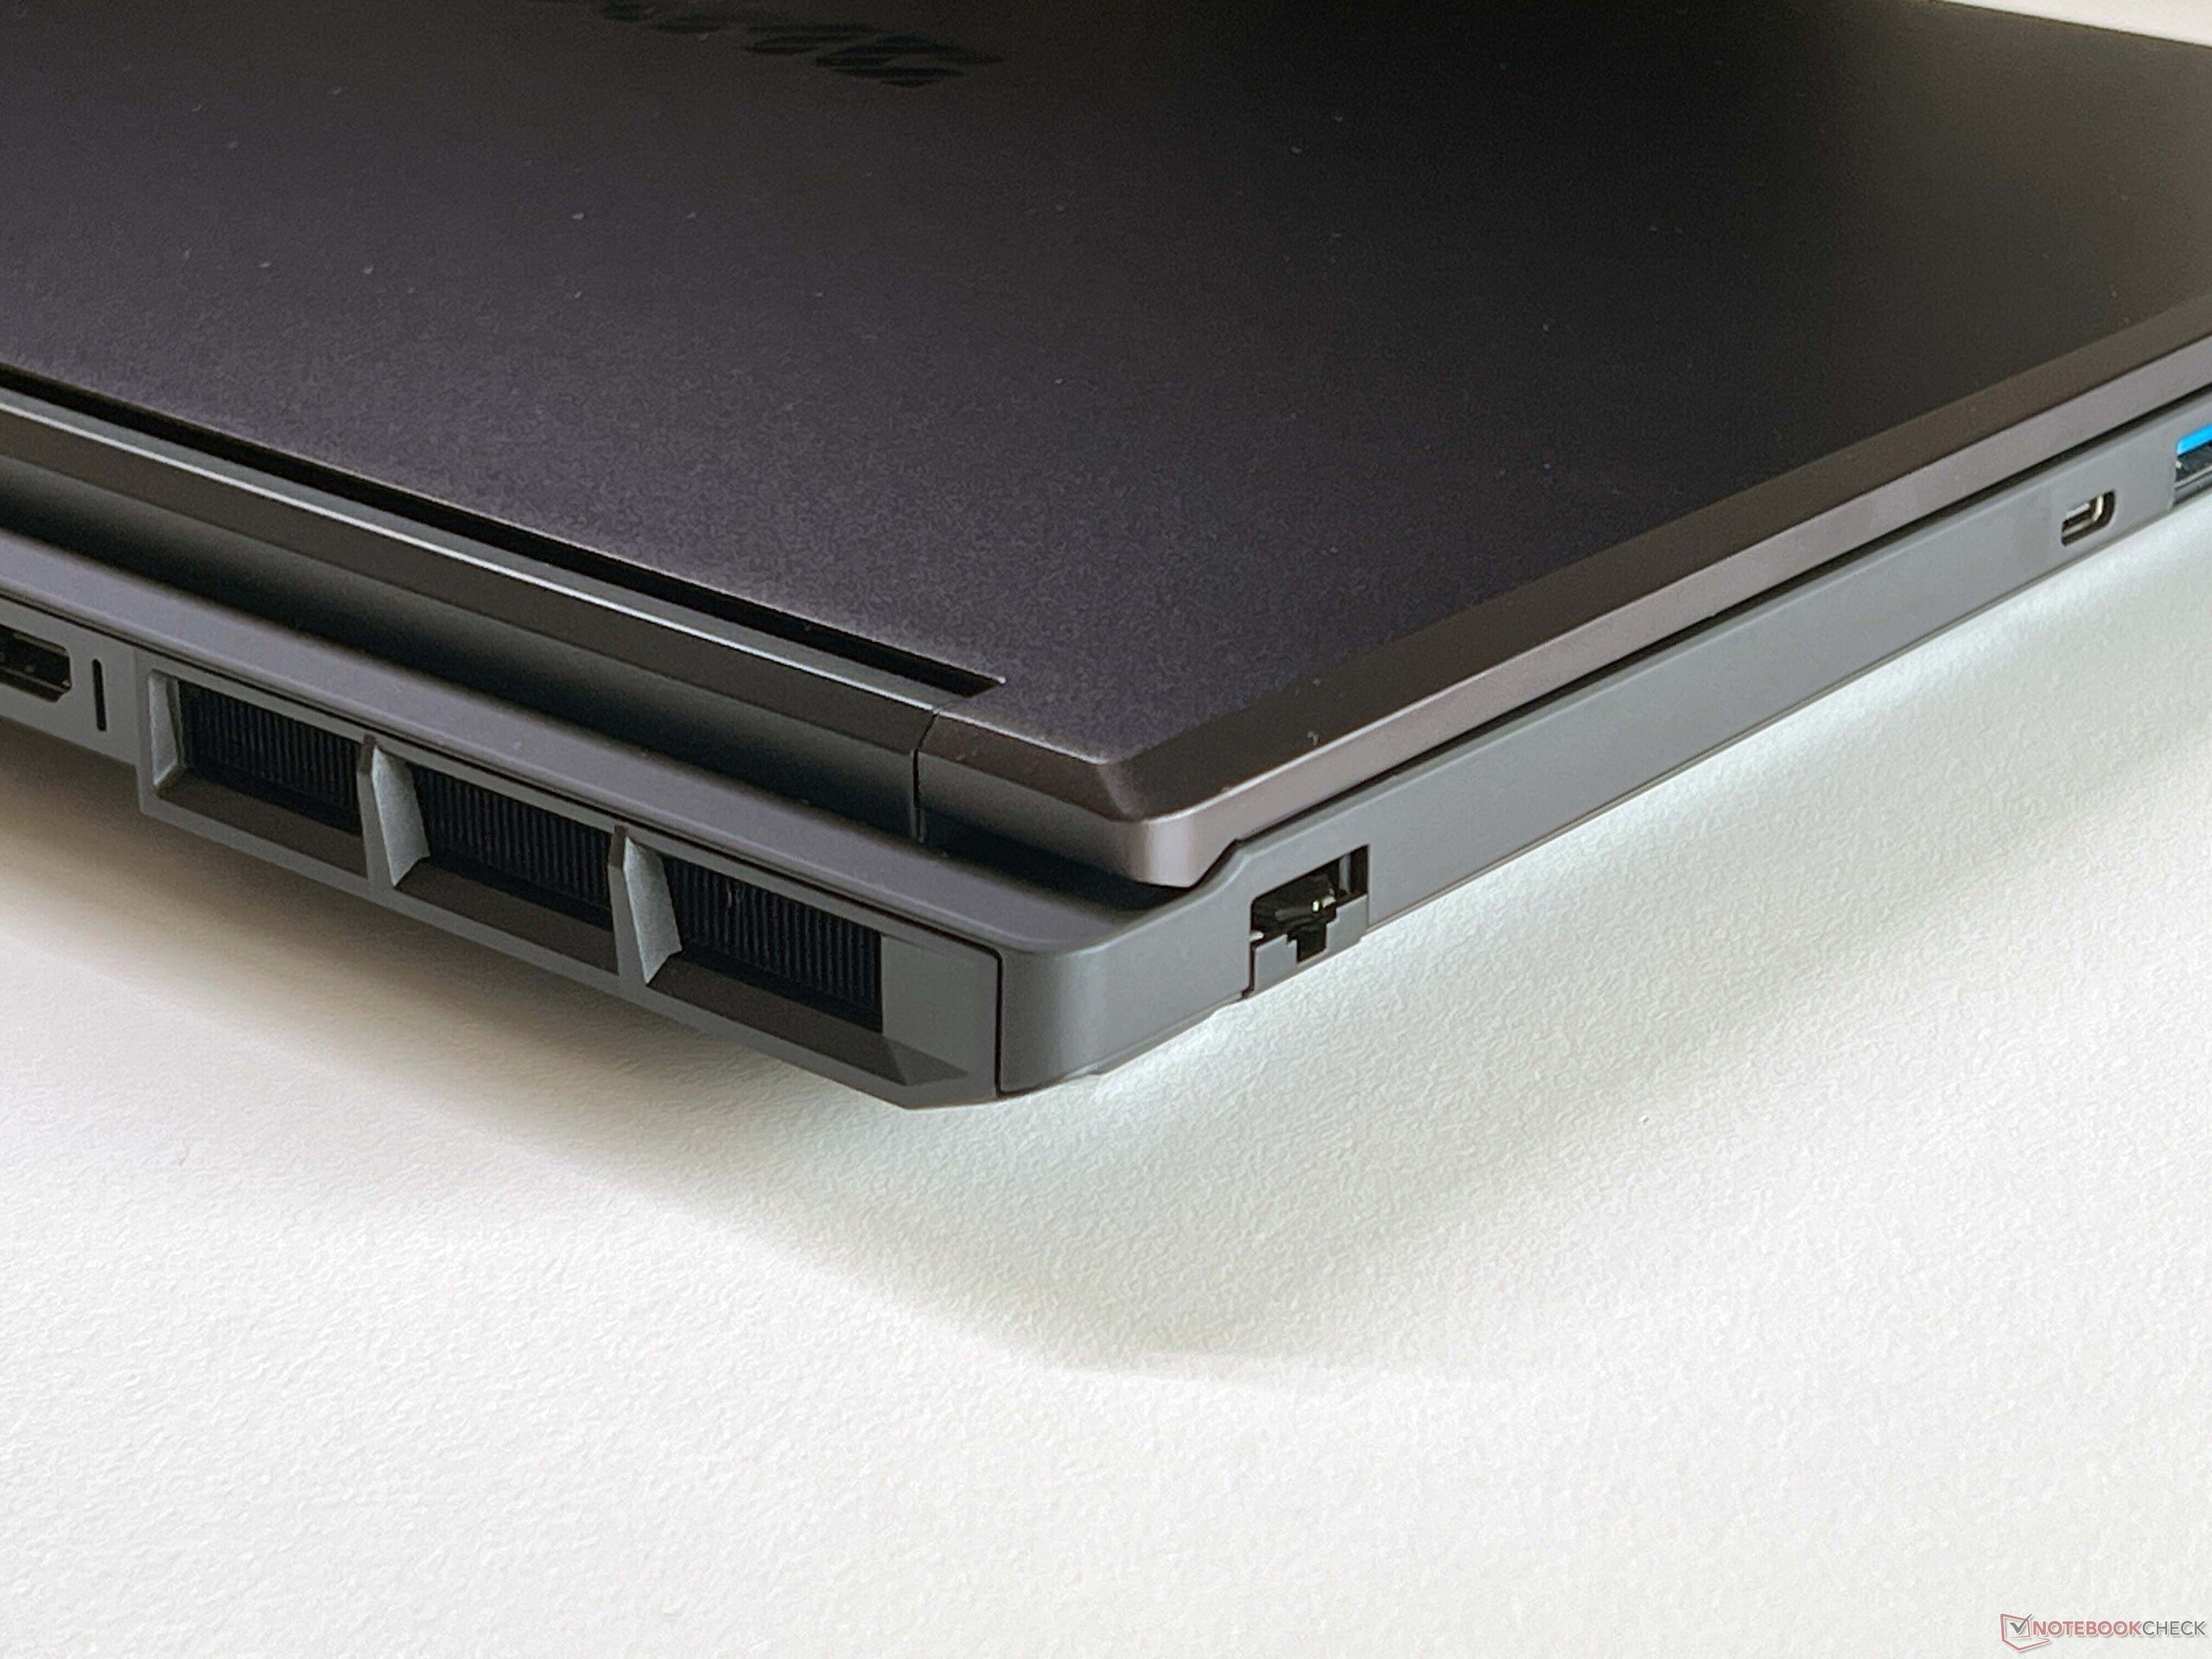
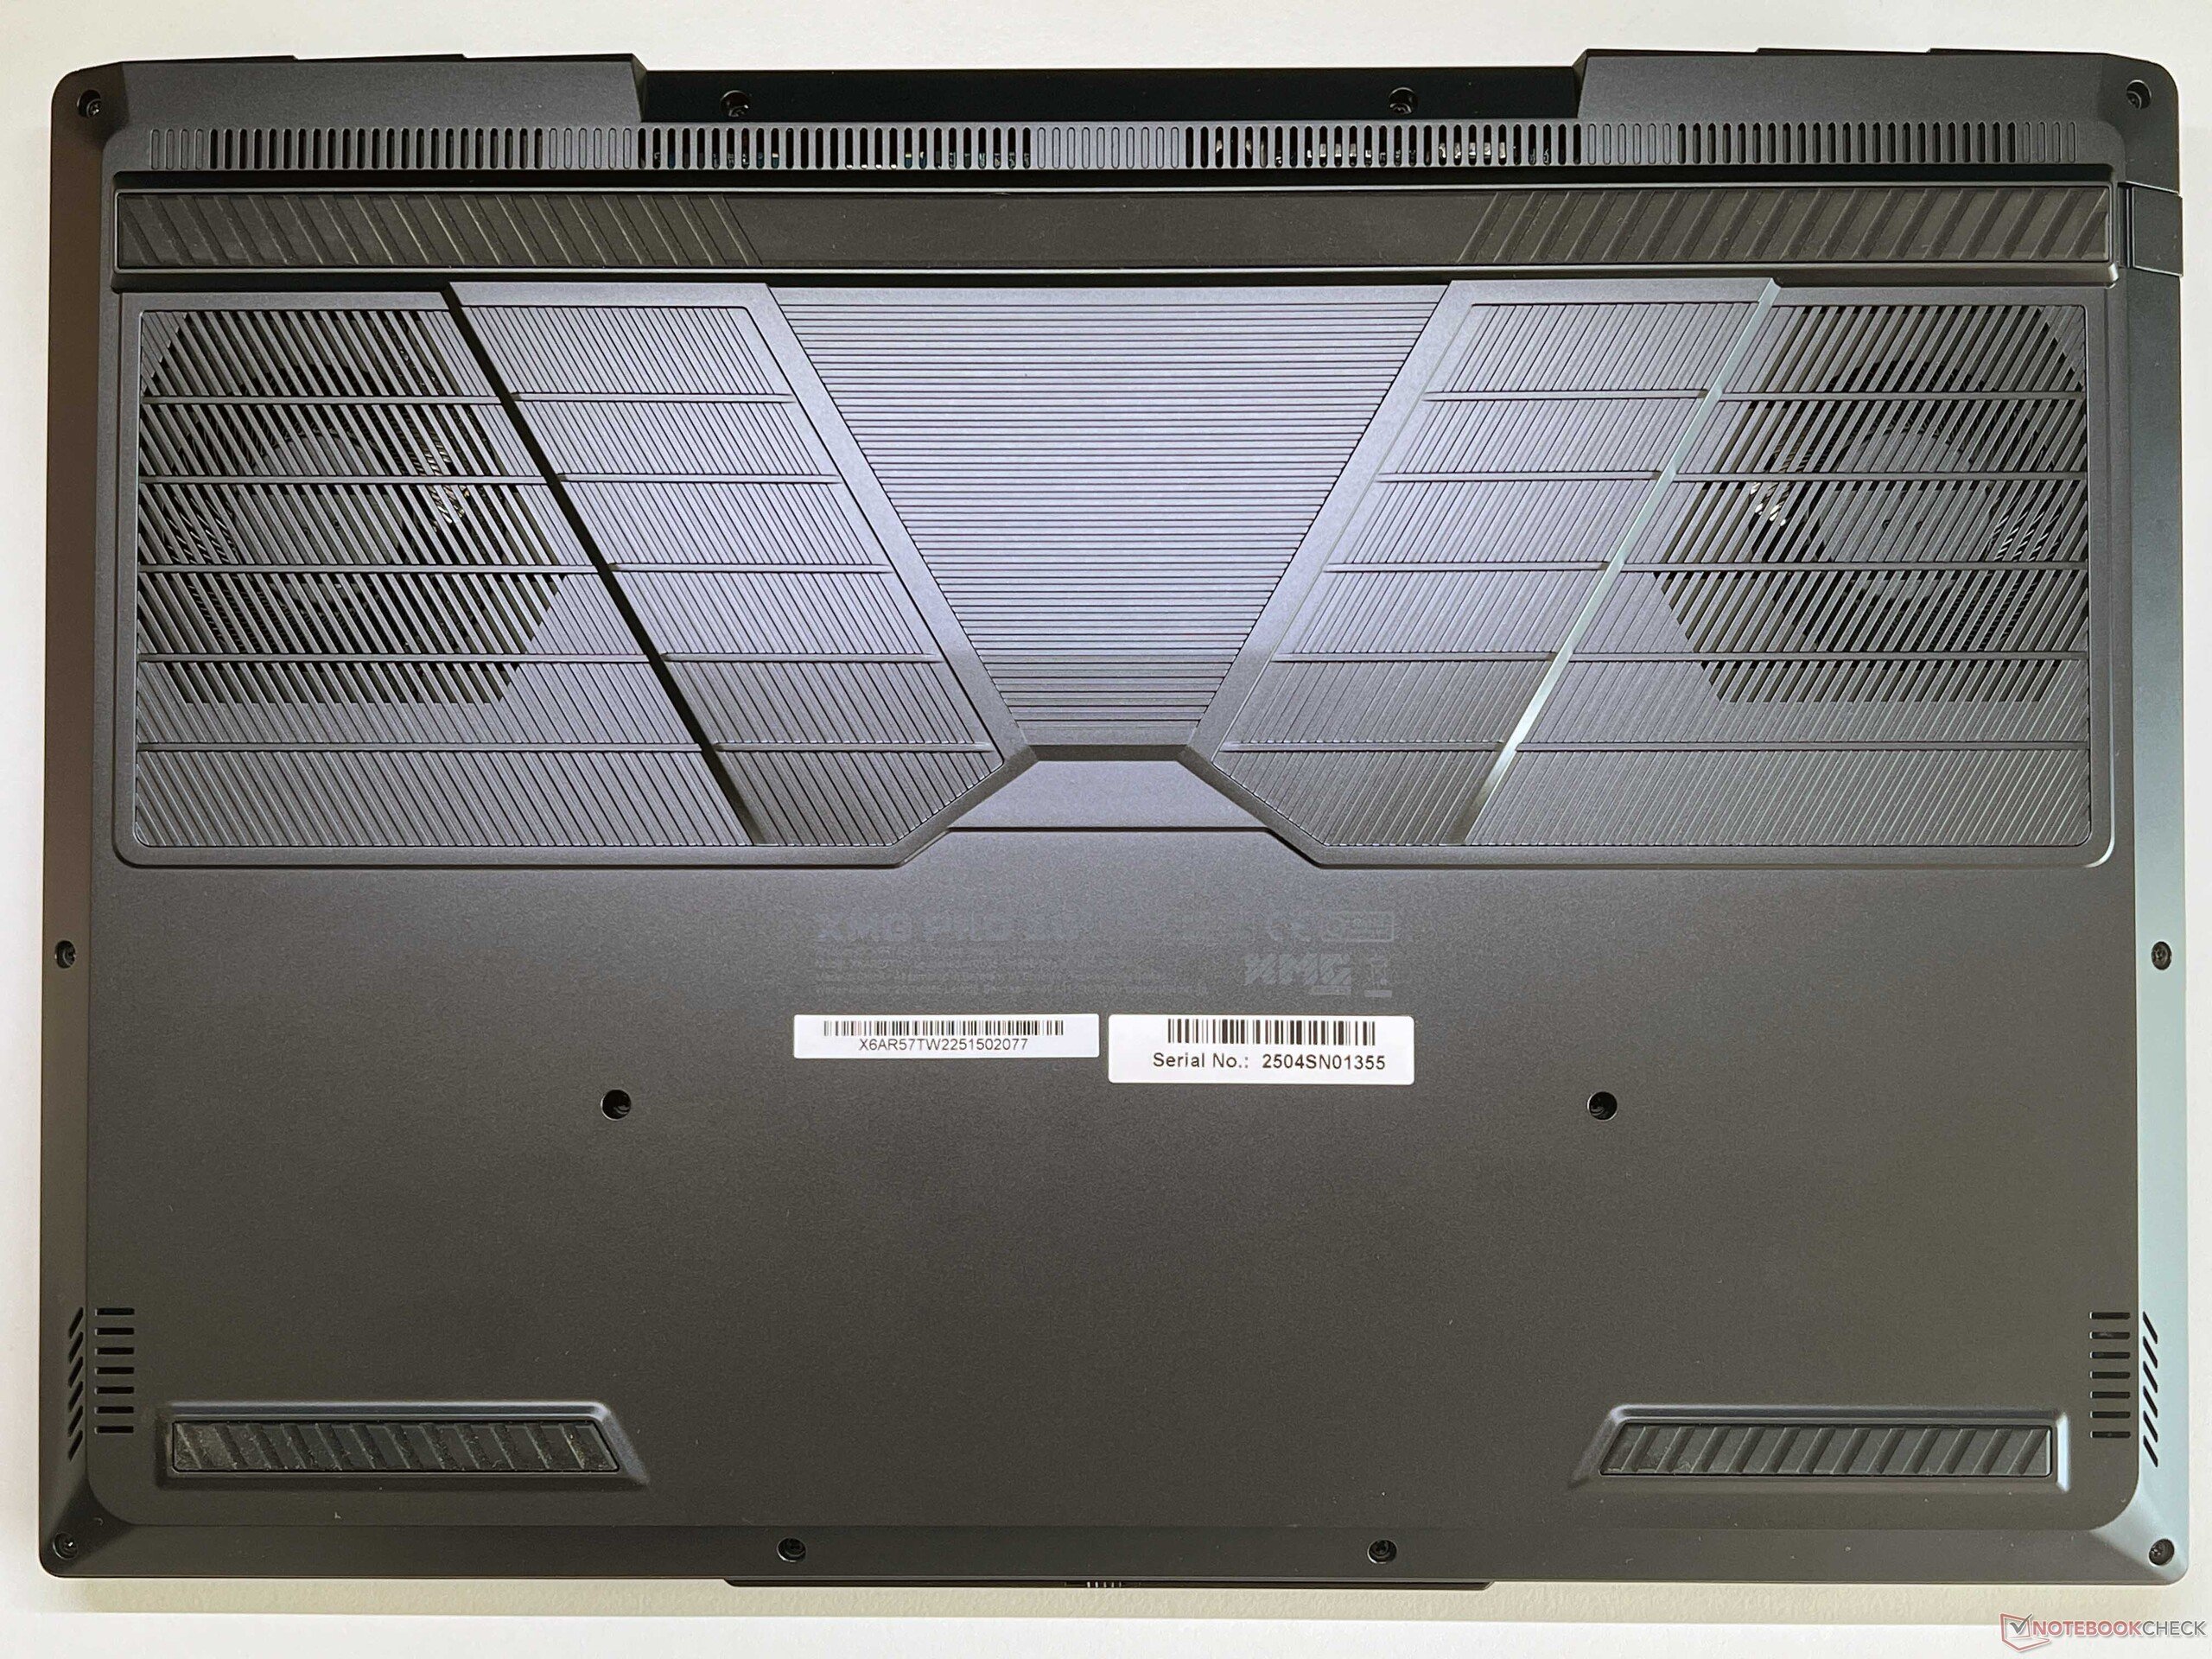
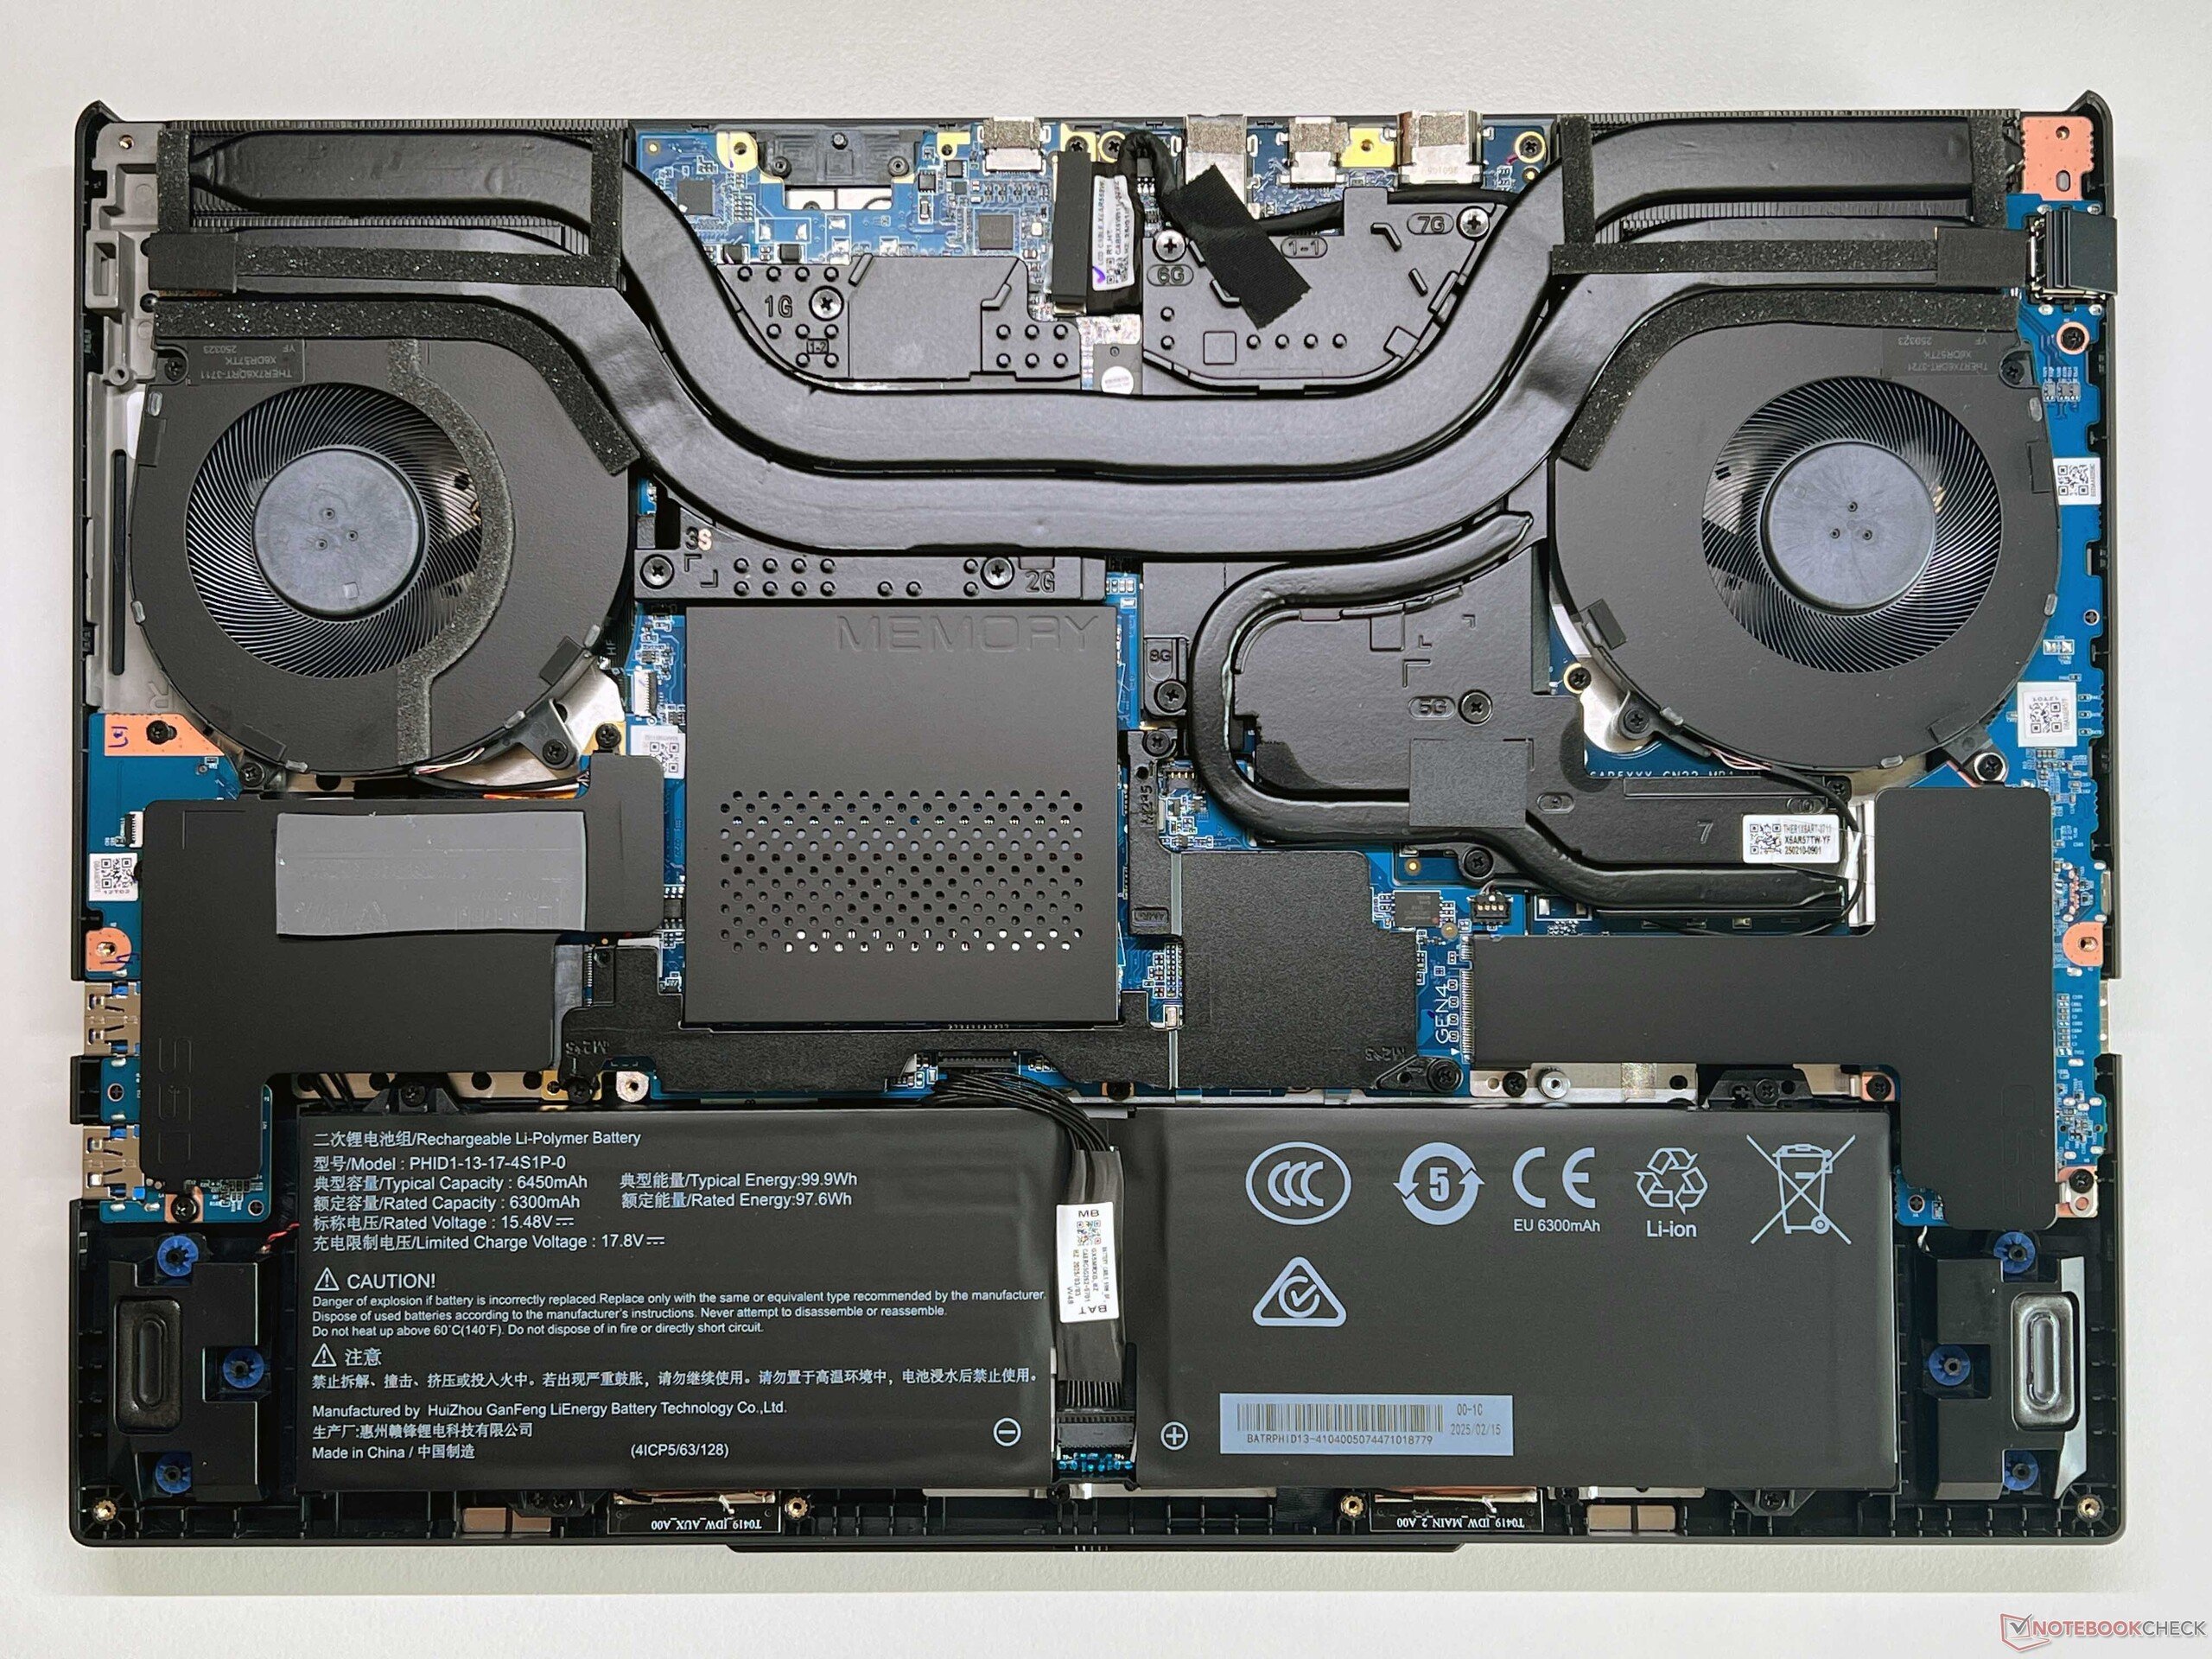
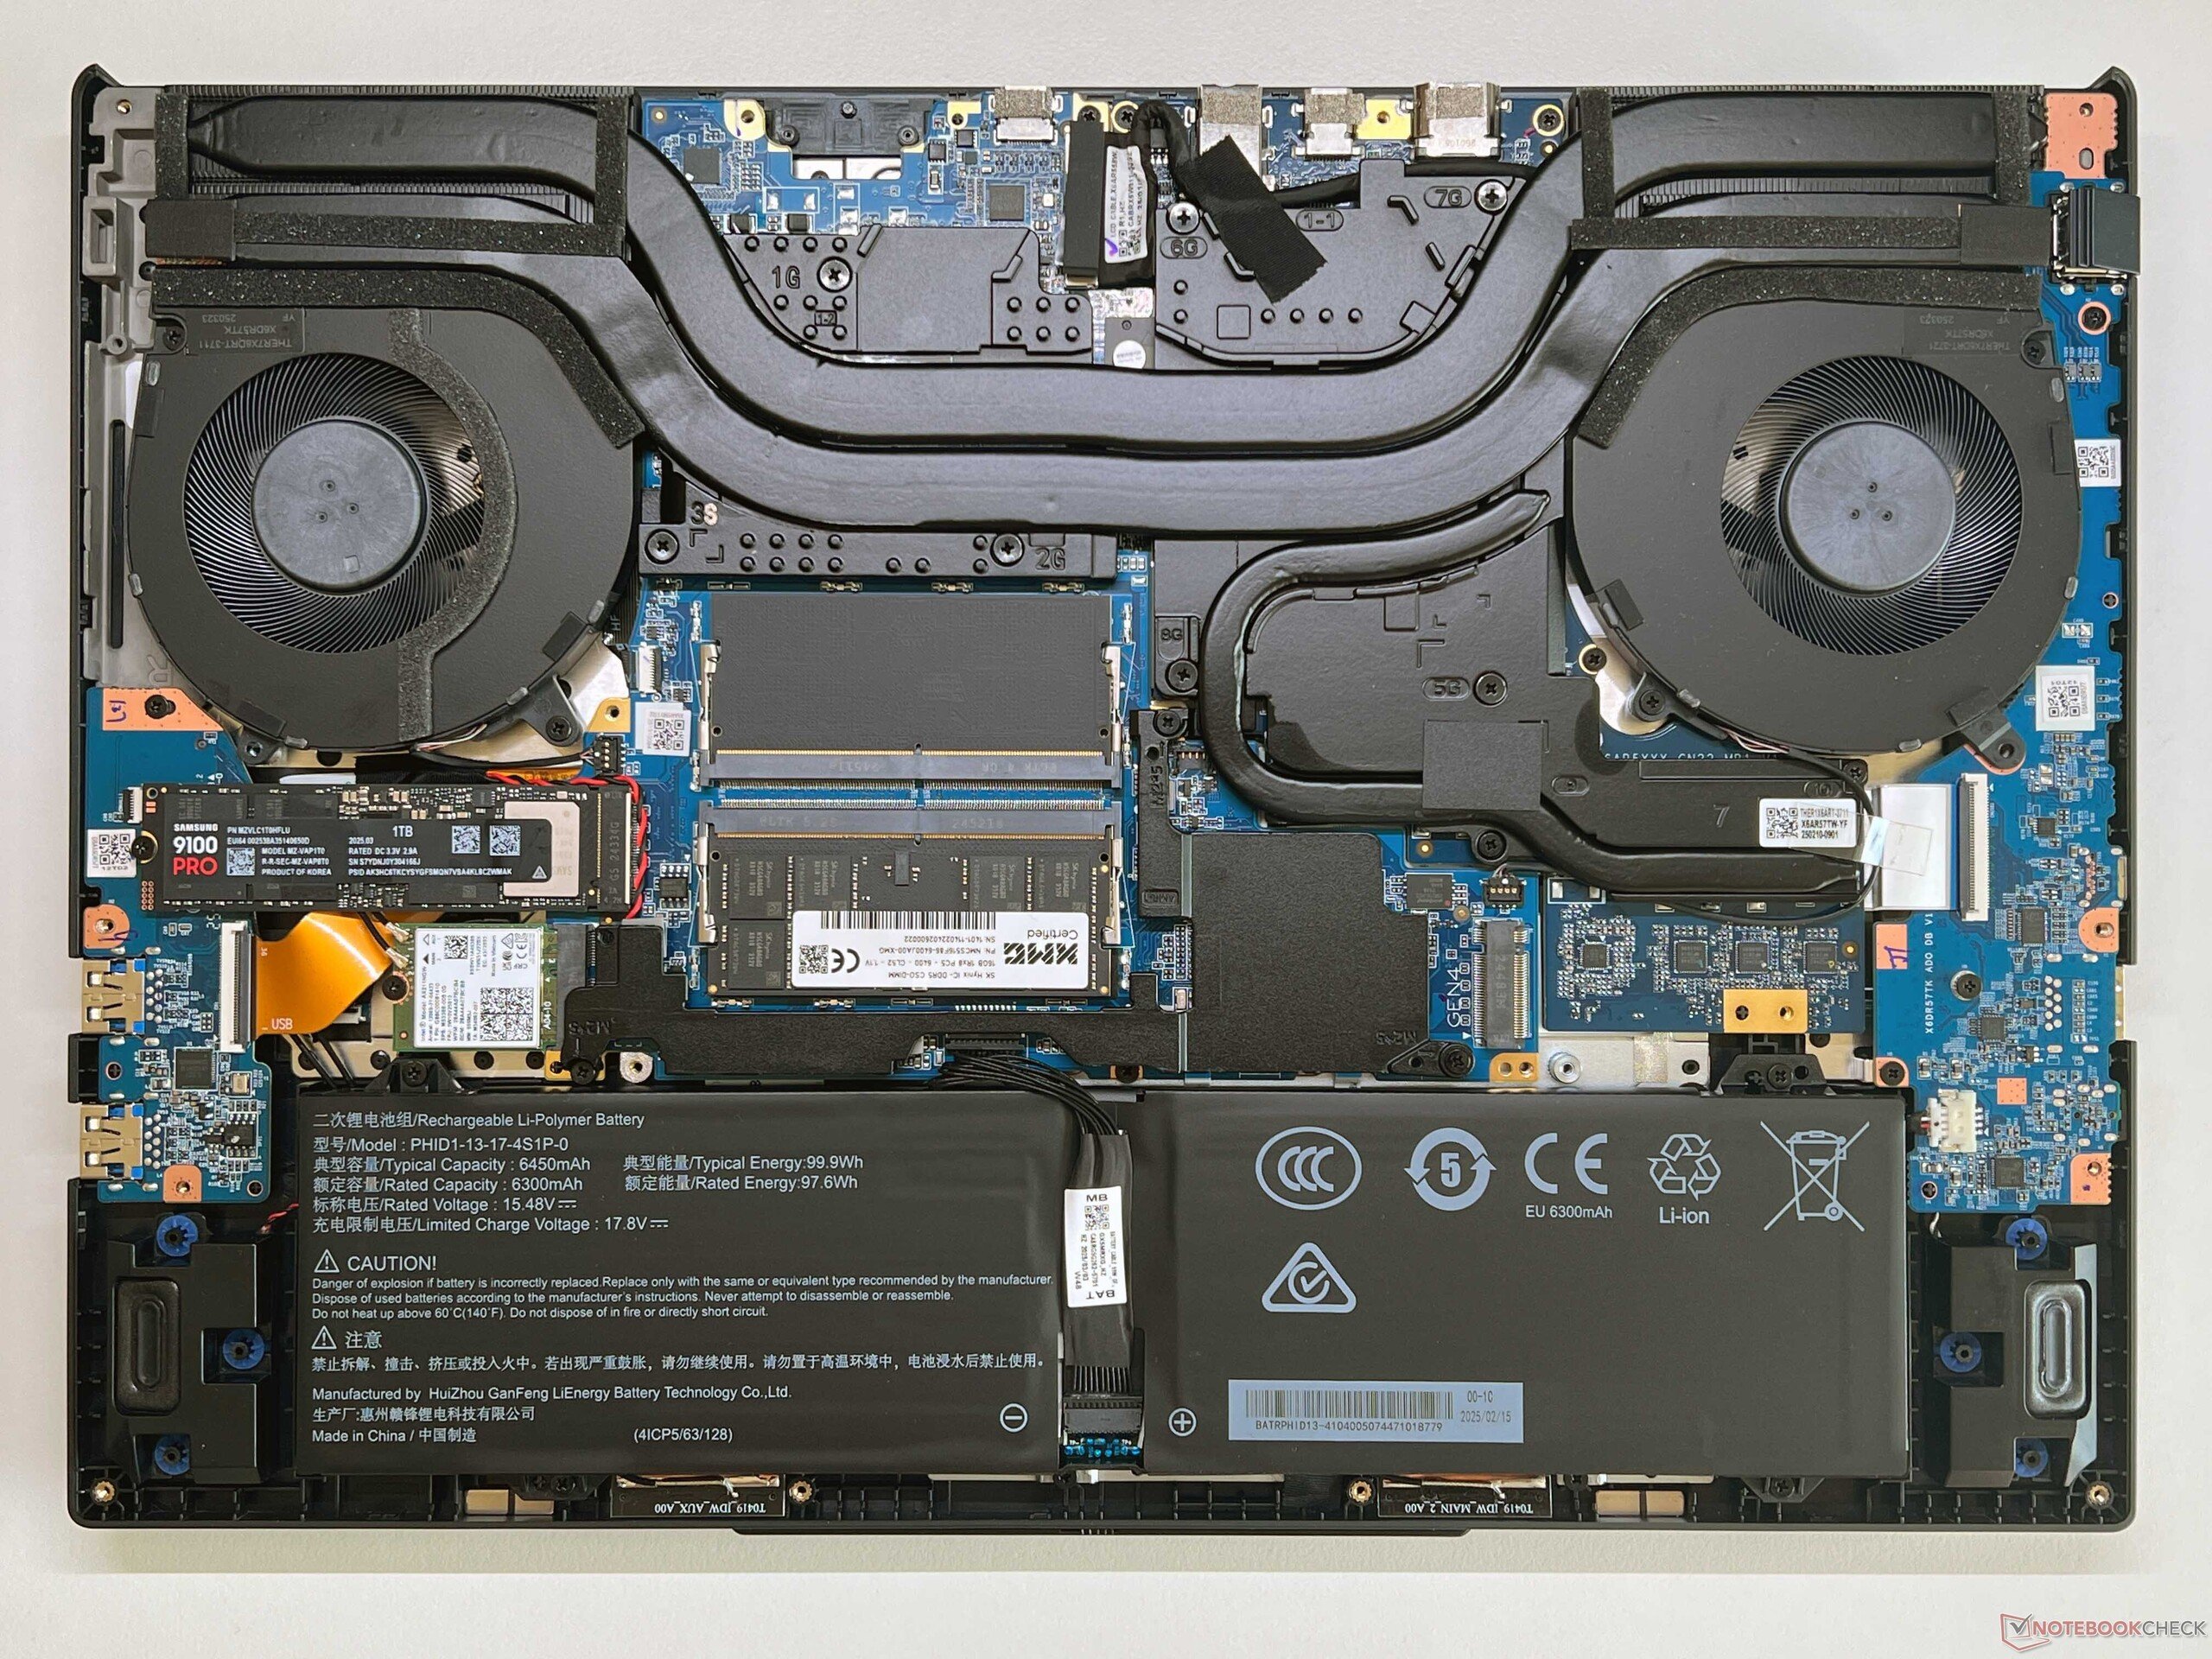
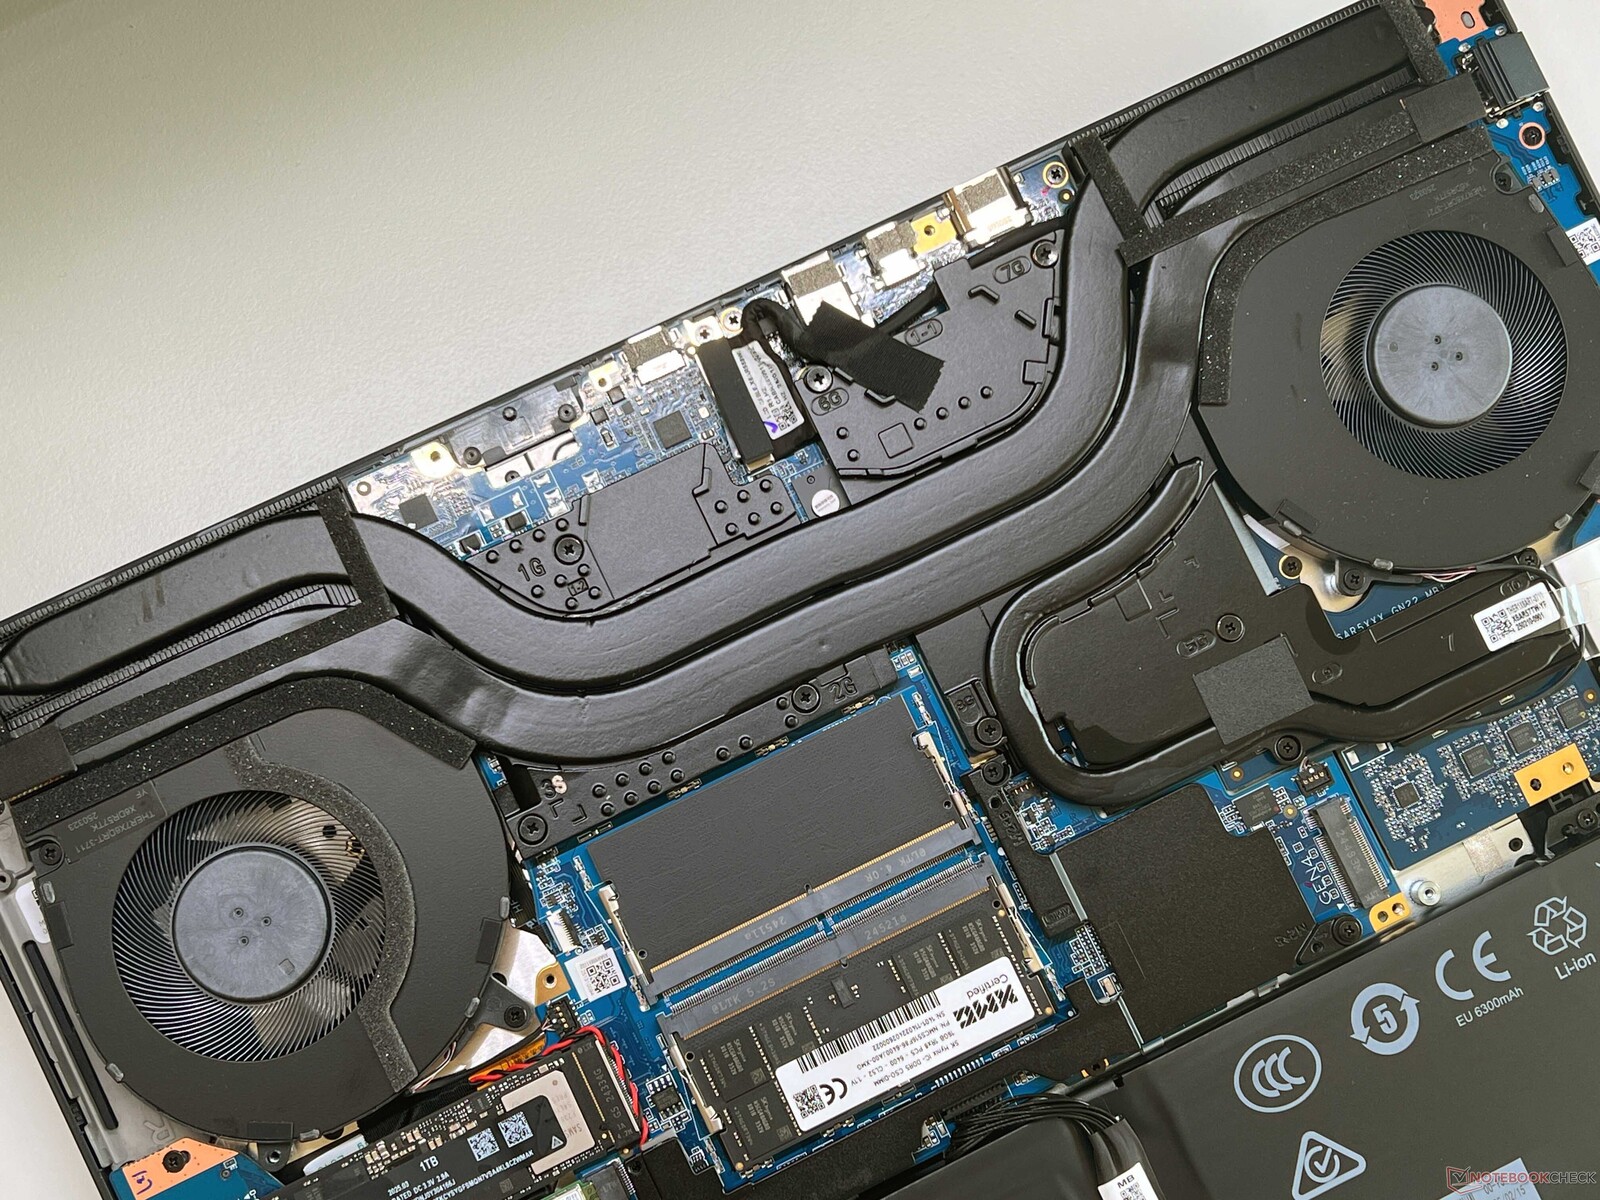
Le XMG Pro 16 est assez sobre avec son boîtier de couleur anthracite et ne comporte aucun élément d'éclairage. Son couvercle est en aluminium, tandis que l'unité de base et le cadre d'affichage sont en plastique. Du point de vue de la qualité, nous n'avons rien à redire sur sa stabilité ou sa finition, mais ses surfaces accumulent beaucoup de saletés. Les charnières sont bien réglées (angle d'ouverture maximal de près de 180 degrés) et nous n'avons constaté qu'un balancement minime pendant notre test. Le couvercle inférieur est fixé à l'aide de 12 vis Phillips et peut être facilement retiré. À l'intérieur, vous avez accès aux ventilateurs, à la batterie, au module WLAN, à deux emplacements SSD et à deux emplacements RAM. Cependant, certains composants se trouvent sous des couvercles vissés supplémentaires (y compris les coussinets thermiques), ce qui augmente un peu l'effort nécessaire pour le démontage.
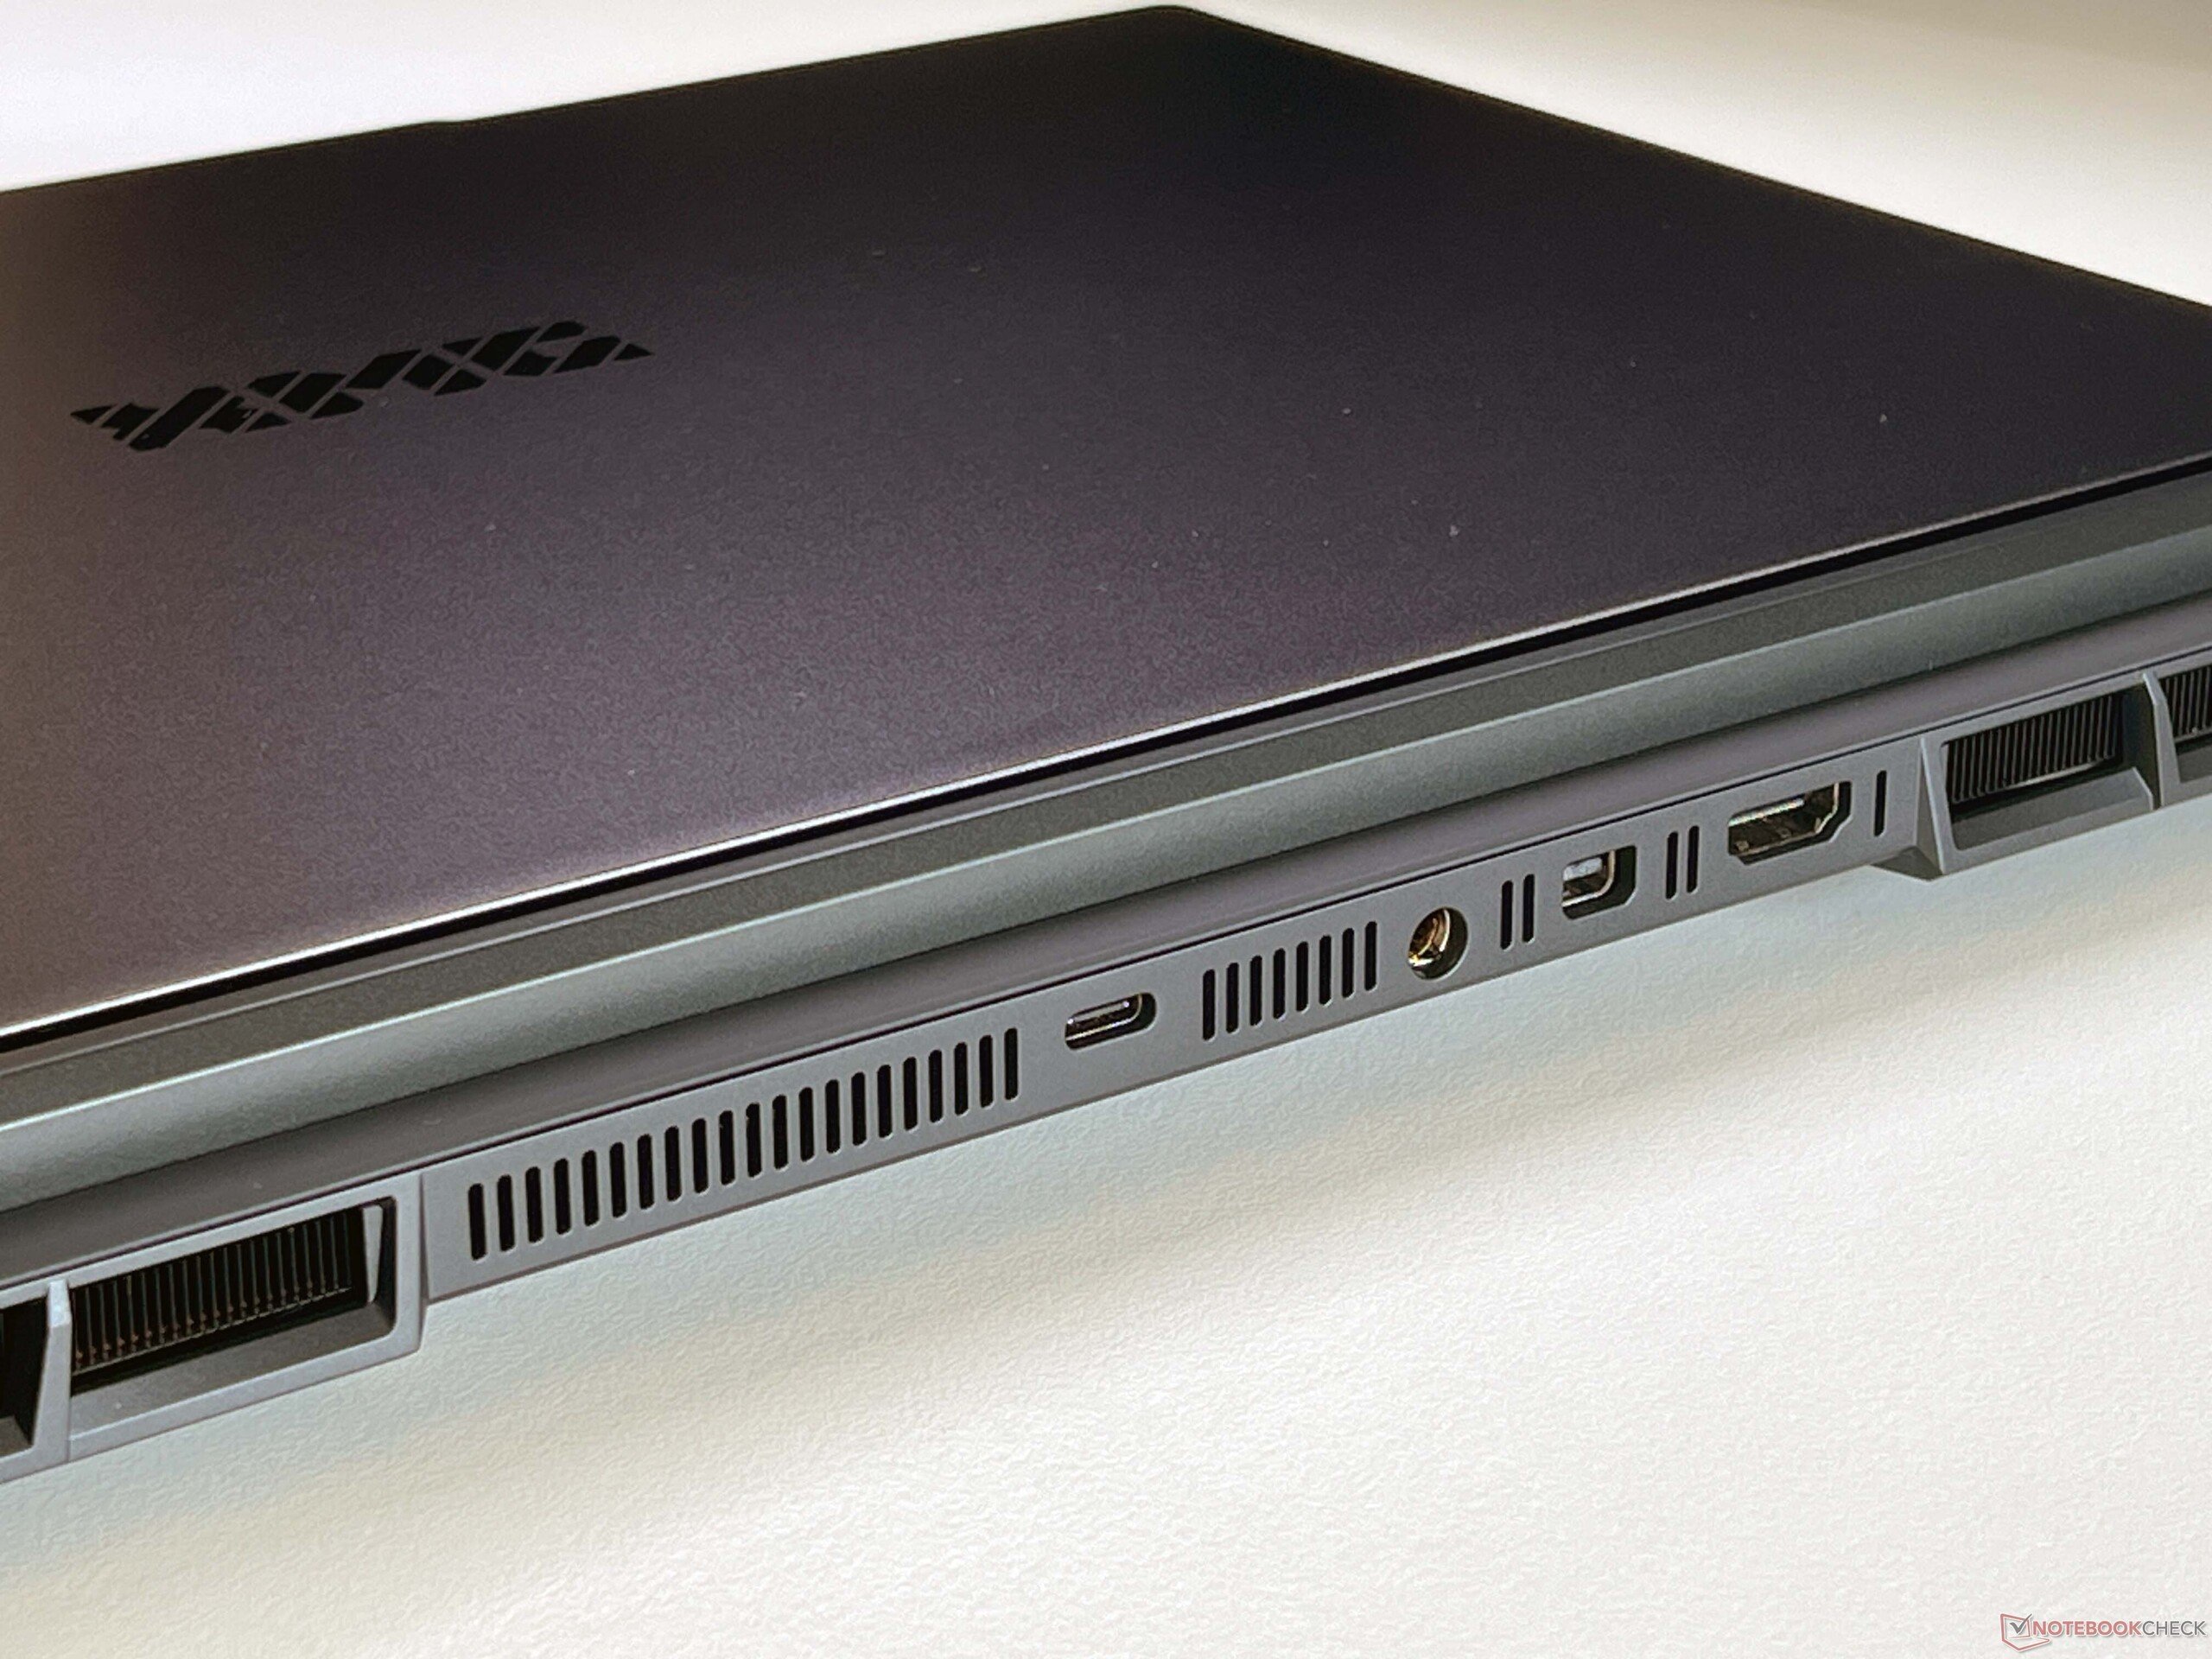
Les clients du Pro 16 devront se passer du Thunderbolt 5, mais pour le reste, la connectivité est satisfaisante. La répartition des ports est pratique pour une utilisation quotidienne et, contrairement à de nombreux concurrents actuels, il dispose également de connexions à l'arrière. Son lecteur de cartes complet est très rapide et son module Wi-Fi fonctionne de manière fiable, mais il ne prend pas encore en charge la norme Wi-Fi 7. La webcam 1080p à obturateur mécanique de l'appareil prend des photos moyennes. Il ne s'agit pas d'un ordinateur portable Copilot+, mais il prend en charge les effets Studio de la webcam et le sous-titrage en direct.


| SD Card Reader | |
| average JPG Copy Test (av. of 3 runs) | |
| SCHENKER XMG Pro 16 (E25) (Angelbird AV Pro V60) | |
| Moyenne de la classe Gaming (19 - 204, n=66, 2 dernières années) | |
| SCHENKER XMG Pro 16 Studio (Mid 24) (AV PRO microSD 128 GB V60) | |
| maximum AS SSD Seq Read Test (1GB) | |
| SCHENKER XMG Pro 16 (E25) (Angelbird AV Pro V60) | |
| Moyenne de la classe Gaming (25.8 - 261, n=65, 2 dernières années) | |
| SCHENKER XMG Pro 16 Studio (Mid 24) (AV PRO microSD 128 GB V60) | |
| Networking | |
| SCHENKER XMG Pro 16 (E25) | |
| iperf3 transmit AXE11000 | |
| iperf3 receive AXE11000 | |
| SCHENKER XMG Pro 16 Studio (Mid 24) | |
| iperf3 transmit AXE11000 | |
| iperf3 receive AXE11000 | |
| Asus ROG Strix G16 G615 | |
| iperf3 transmit AXE11000 | |
| iperf3 receive AXE11000 | |
| Tuxedo Sirius 16 Gen 1 | |
| iperf3 transmit AXE11000 | |
| iperf3 receive AXE11000 | |
| iperf3 transmit AXE11000 6GHz | |
| iperf3 receive AXE11000 6GHz | |
| Lenovo Legion Pro 5 16IRX9 | |
| iperf3 transmit AXE11000 | |
| iperf3 receive AXE11000 | |
| iperf3 transmit AXE11000 6GHz | |
| iperf3 receive AXE11000 6GHz | |
| Lenovo Legion Pro 7i 16 Gen 10 | |
| iperf3 transmit AXE11000 | |
| iperf3 receive AXE11000 | |
| iperf3 transmit AXE11000 6GHz | |
| iperf3 receive AXE11000 6GHz | |

 GeForce RTX 5070 Ti Laptop, Ultra 9 275HX, Samsung 9100 Pro 1 TB")
 GeForce RTX 5070 Ti Laptop, Ultra 9 275HX, Samsung 9100 Pro 1 TB")
Durabilité
Schenker n'a fourni aucune information sur l'empreinteCO2 ou les certifications environnementales de l'ordinateur portable. Son emballage est presque entièrement constitué de papier/carton.
Dispositifs d'entrée
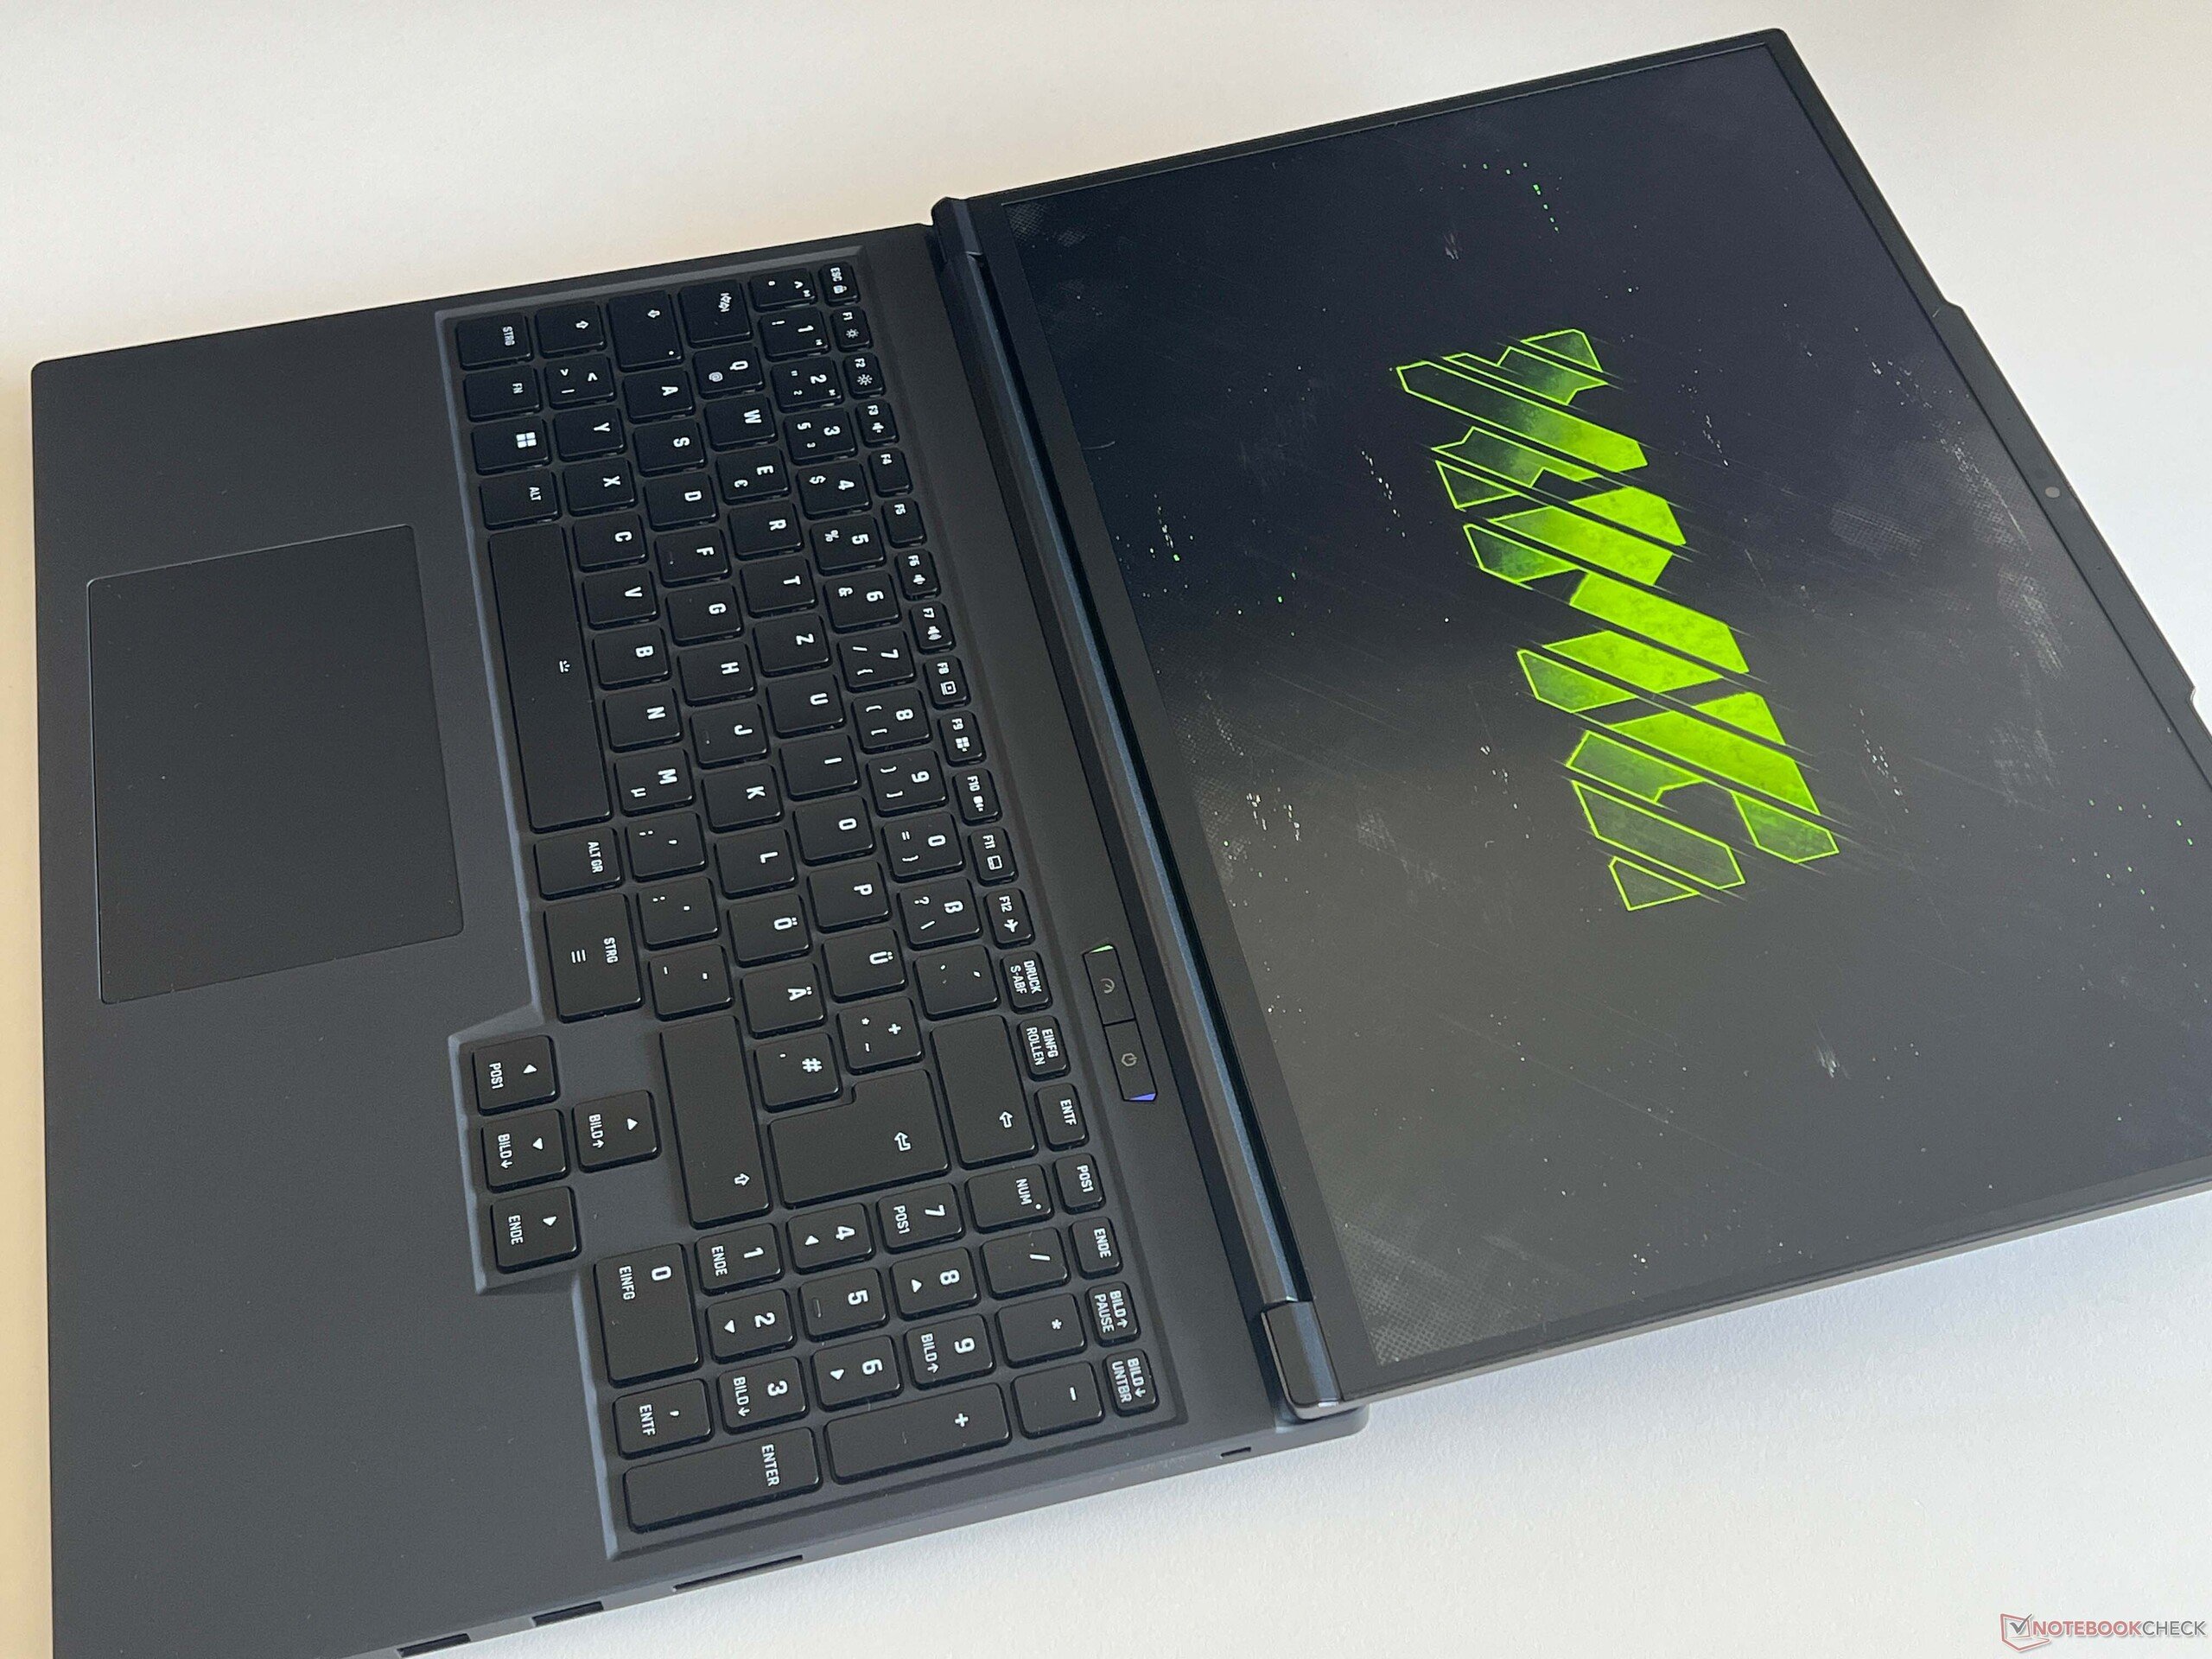
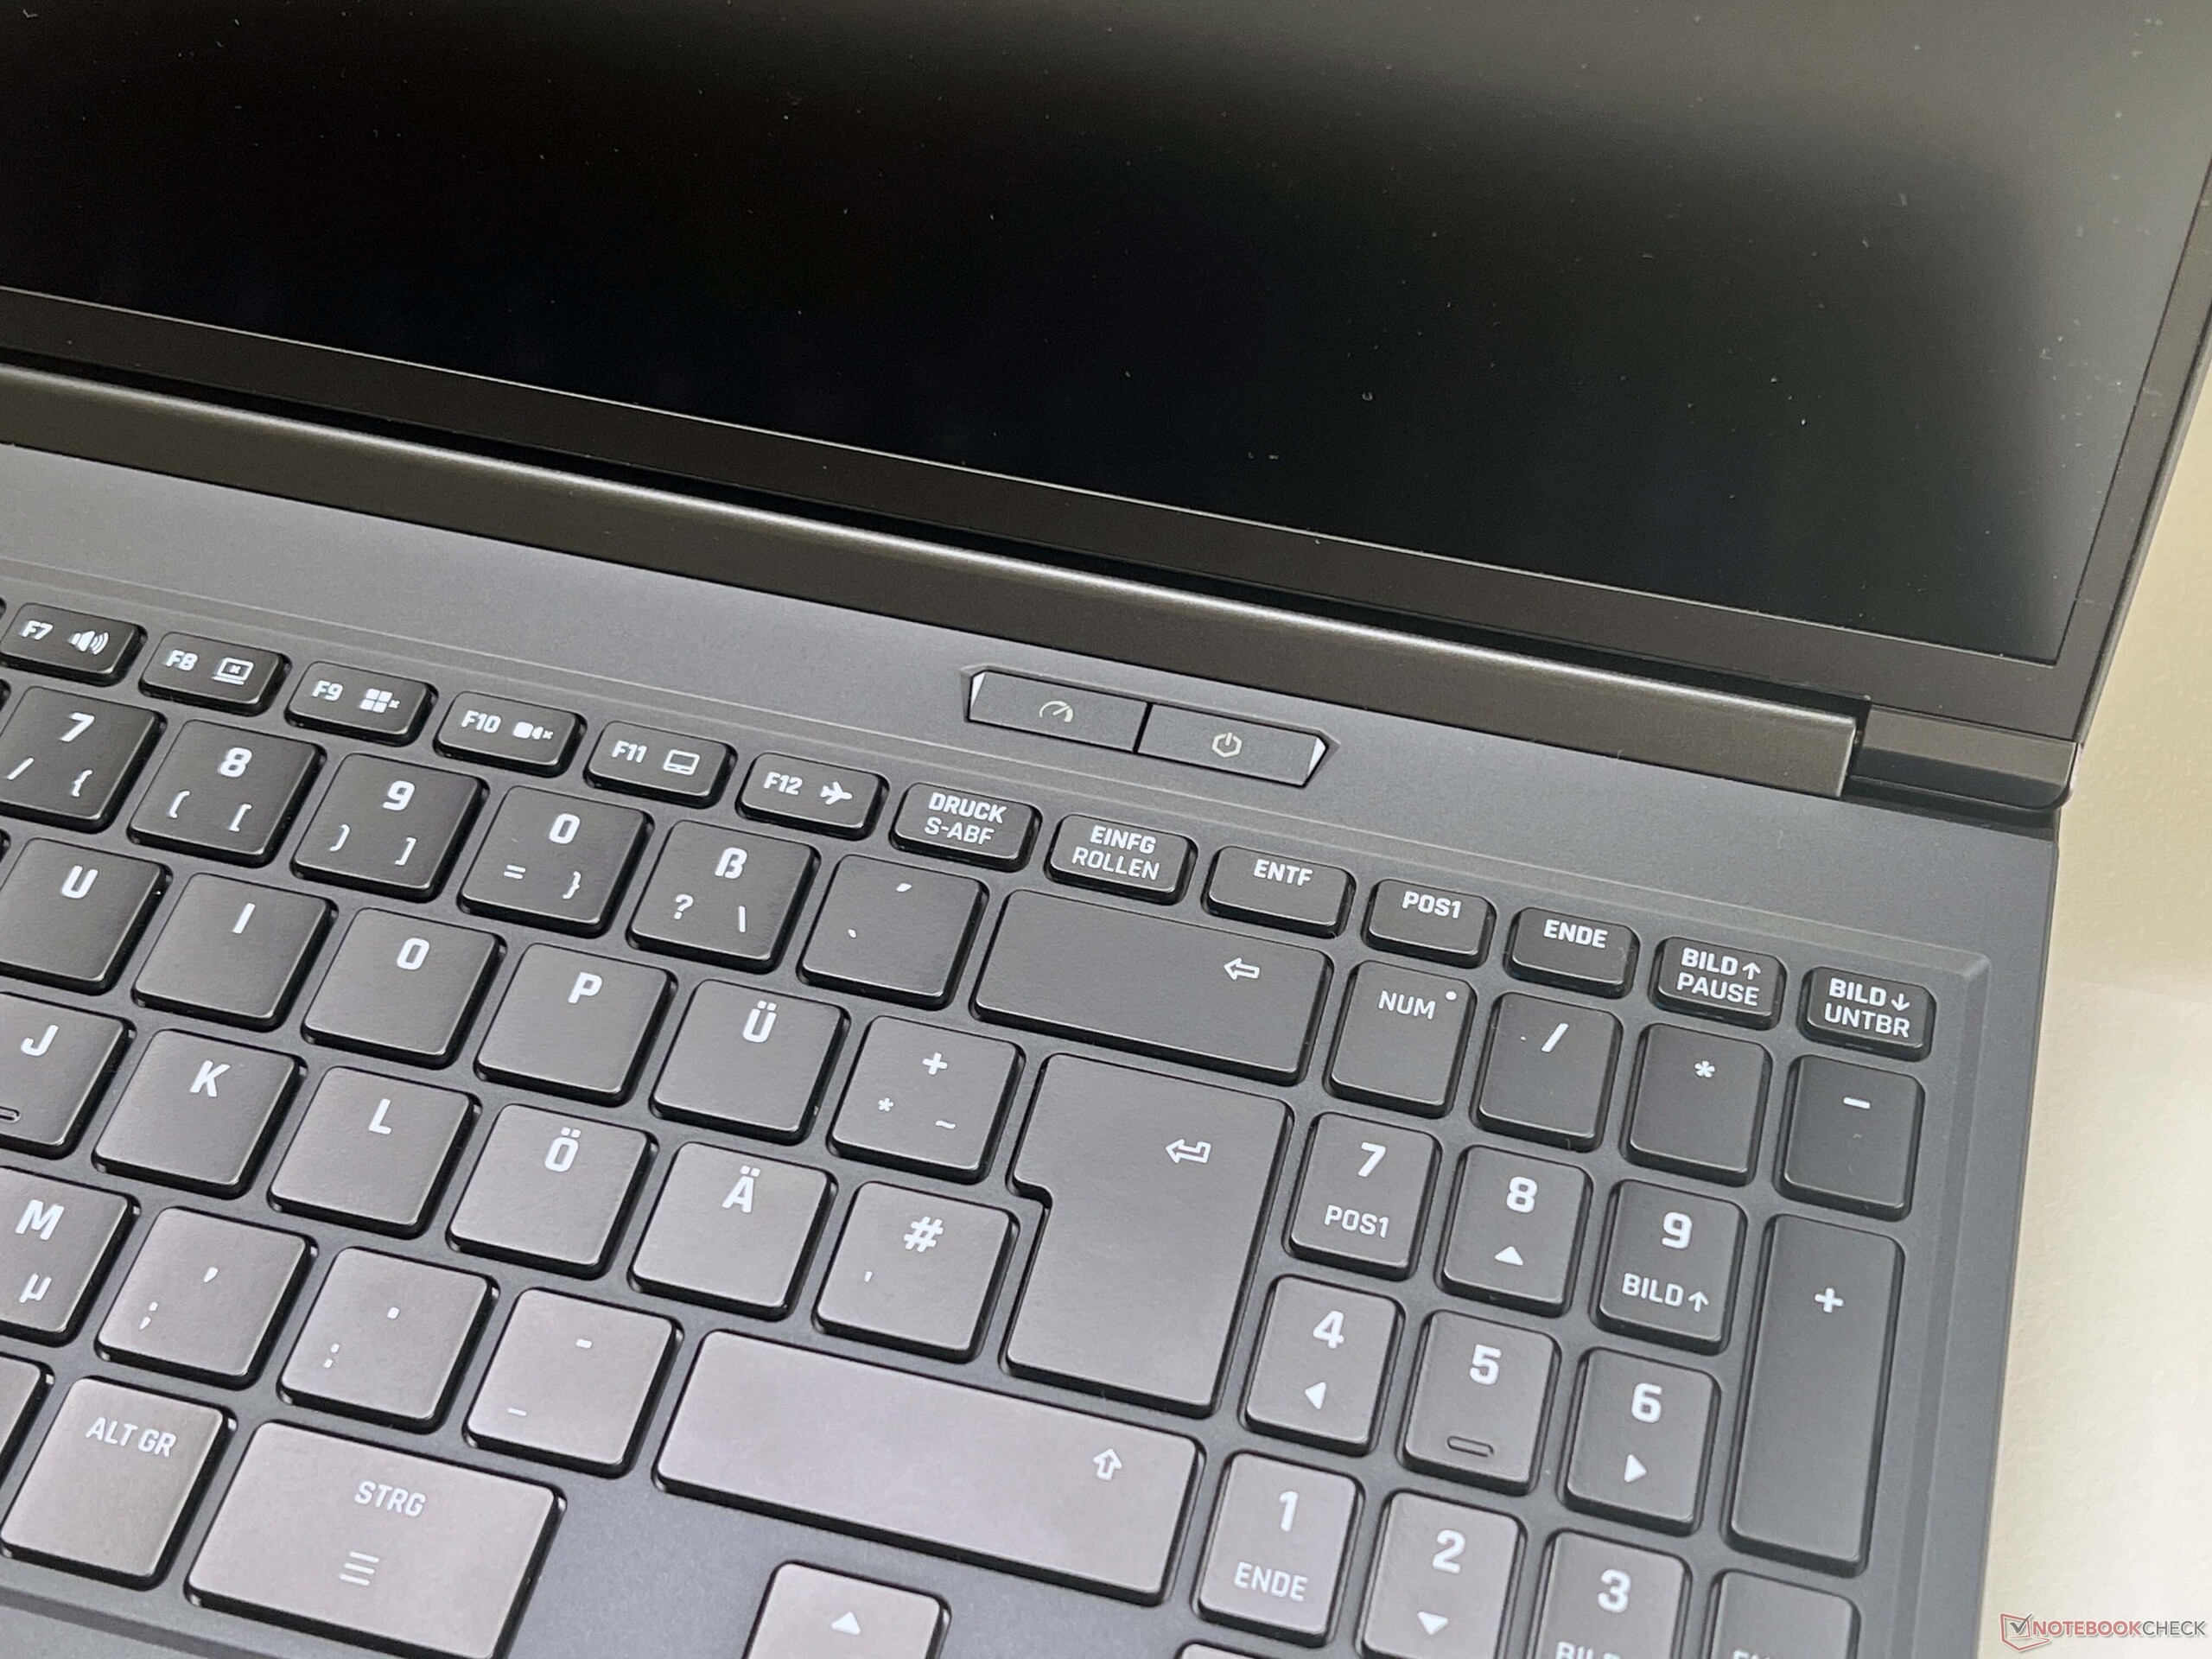
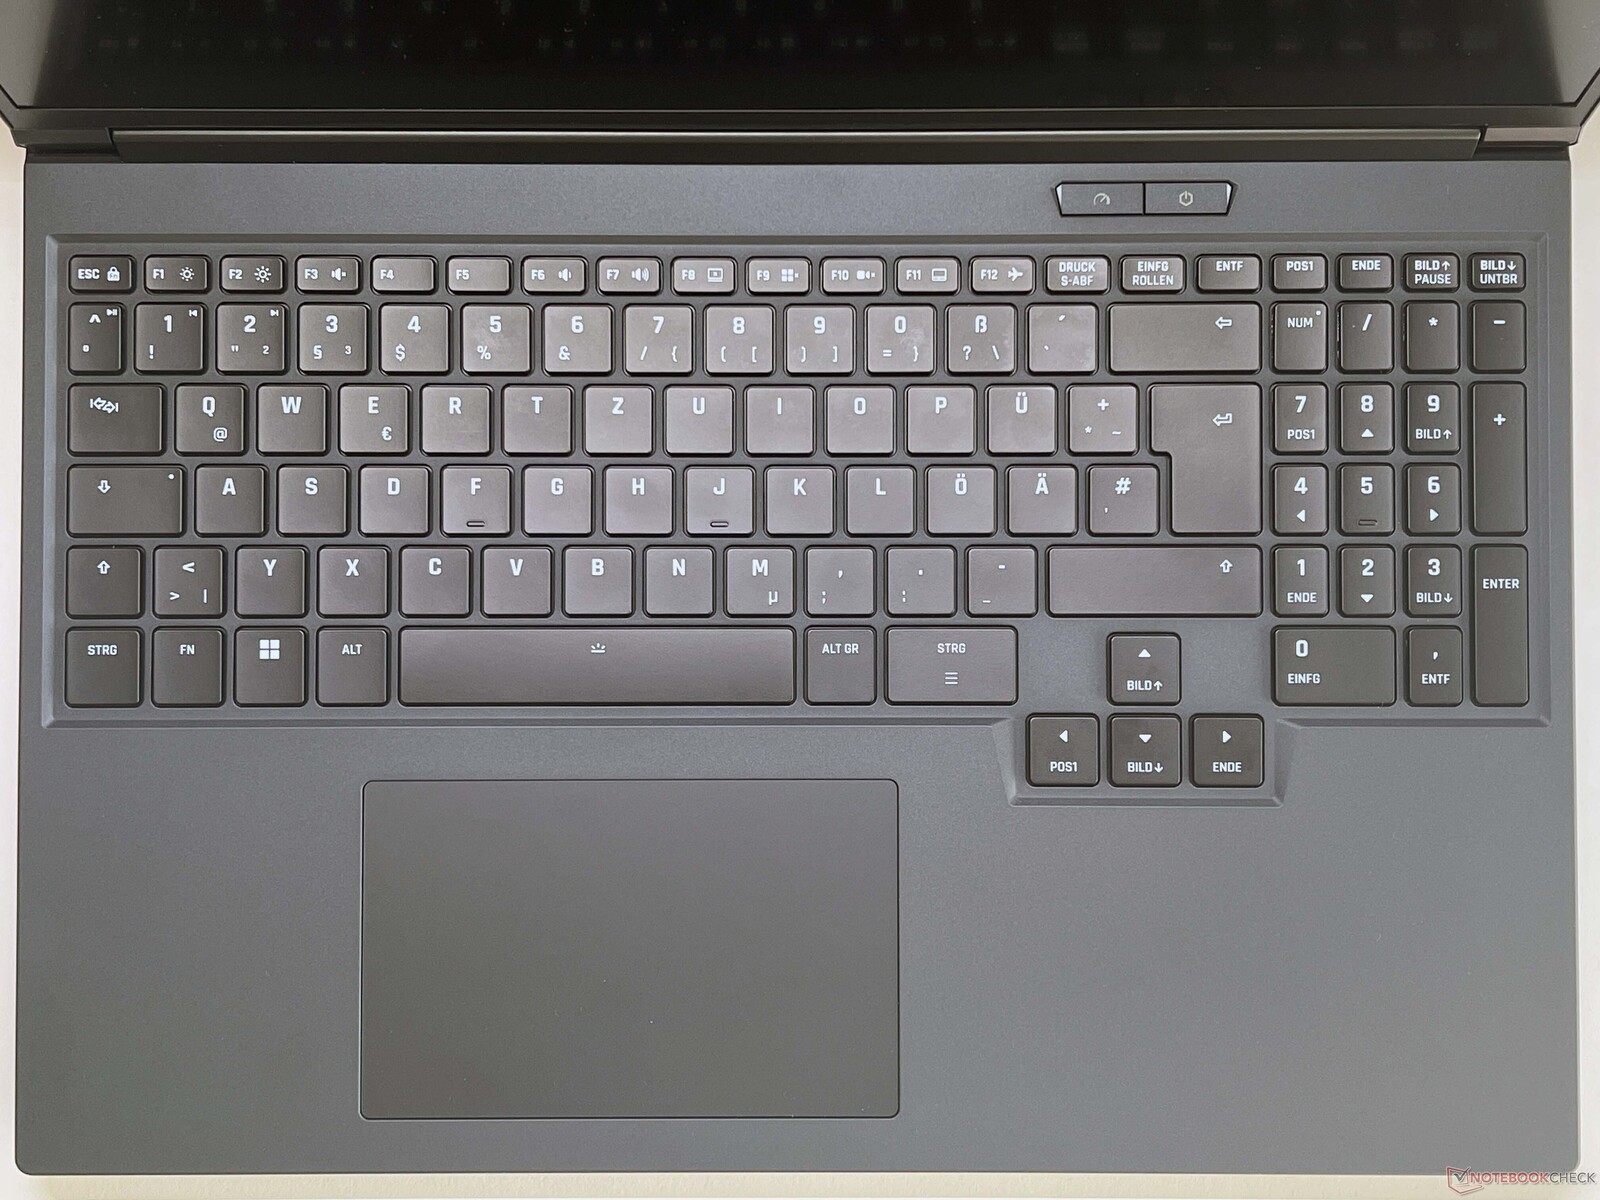
La disposition du clavier est désormais la même que sur le Neo 16 y compris les touches fléchées décalées, et il est agréable à utiliser, même s'il n'est pas aussi performant que son frère plus cher. Néanmoins, vous pouvez même écrire de longs textes sans problème. Il dispose d'un rétroéclairage individuel des touches (quatre niveaux d'intensité) et vous pouvez vraiment être créatif avec les couleurs. Son ClickPad est devenu un peu plus petit (12,2 x 7,8 cm), mais reste suffisamment grand. Les clics mécaniques qu'il produit sont assez bruyants, mais ils sont agréables et doux au toucher.

Affichage - IPS à 300 Hz

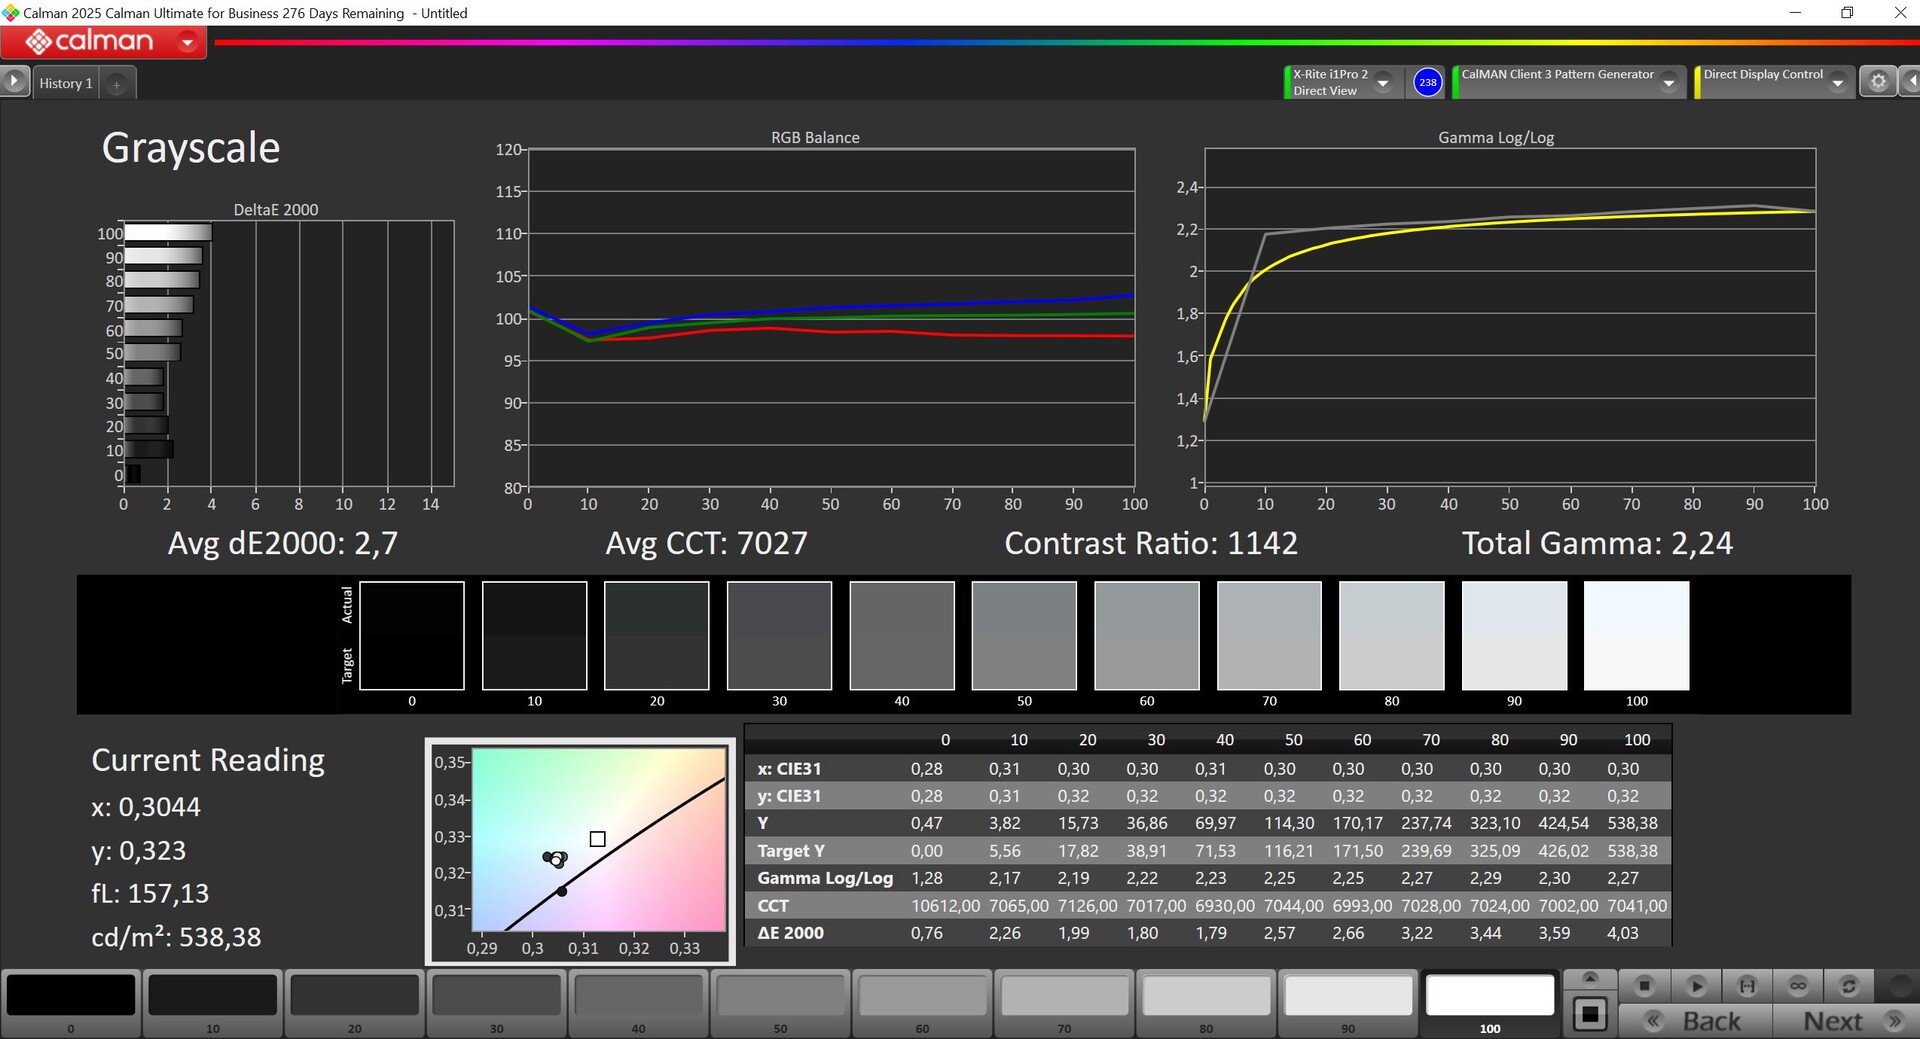
Le Pro 16 est équipé d'une dalle WQHD IPS (2 560 x 1 600). Subjectivement, la qualité d'image de la dalle mate est très bonne, et les mouvements semblent très fluides grâce à son taux de rafraîchissement de 300 Hz. Les temps de réponse sont également rapides, et nous n'avons constaté aucun scintillement PWM.
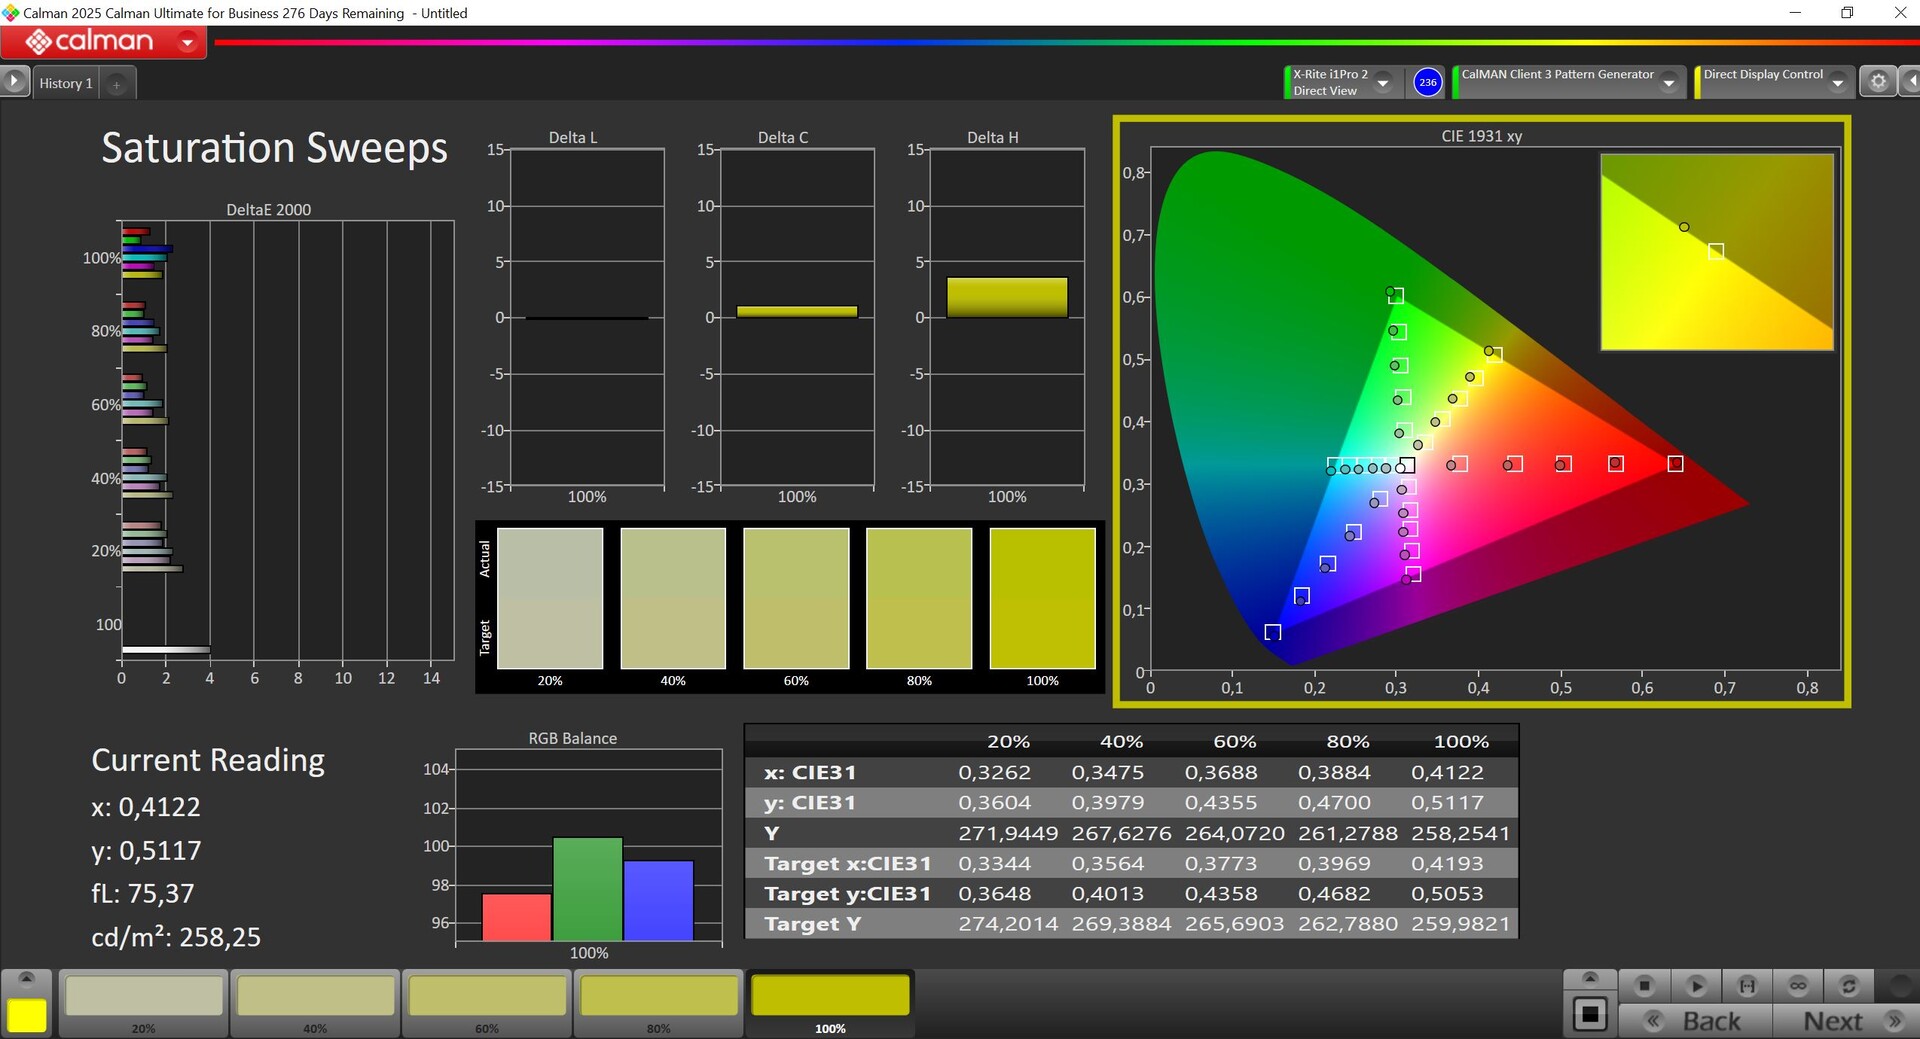
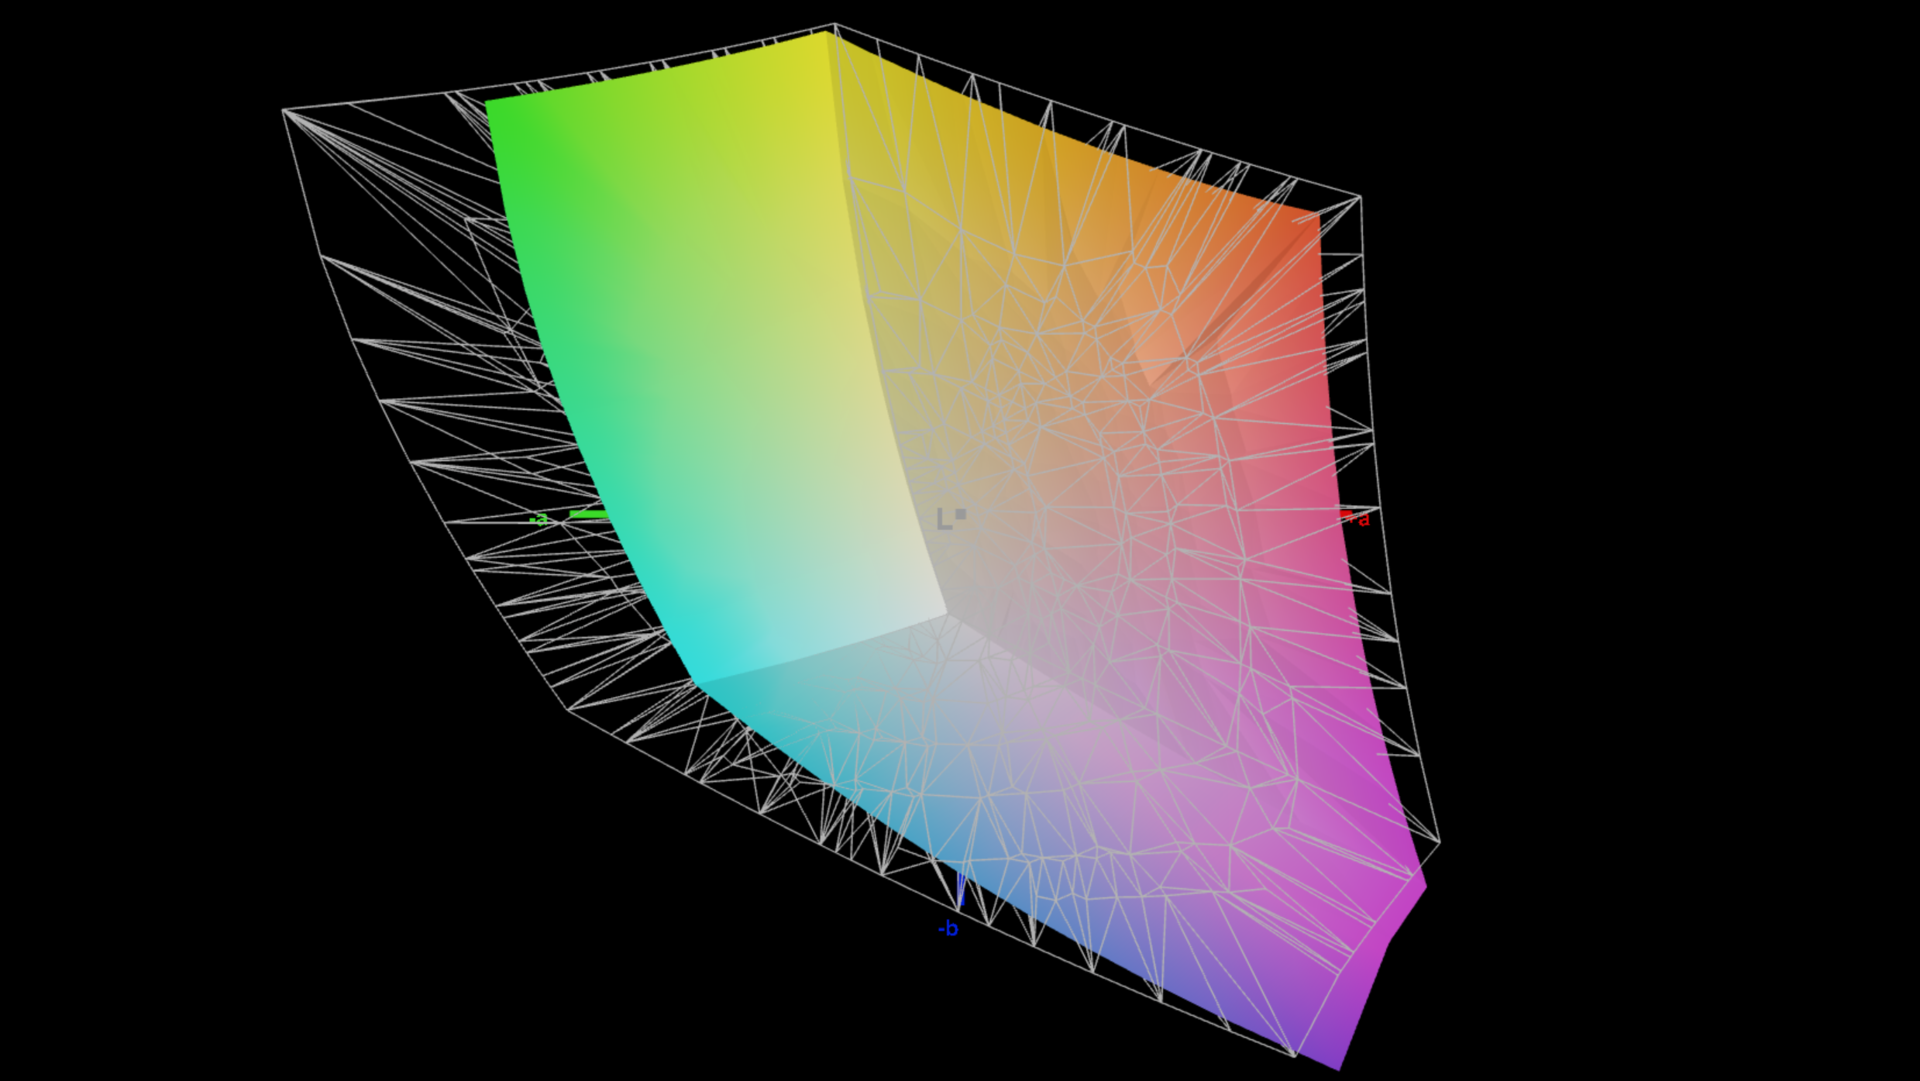
La luminosité de l'écran est légèrement supérieure à 500 cd/m², mais son contraste maximal souffre quelque peu de son niveau de noir élevé, les panneaux OLED ou MiniLED étant plus performants dans ce cas. Le profil sRGB installé en usine représente les couleurs de manière très précise, mais présente une légère dominante bleue. Nous avons pu corriger cela avec notre propre étalonnage, mais la précision des couleurs s'est ensuite détériorée. L'espace colorimétrique sRGB est entièrement couvert par le panneau.
| |||||||||||||||||||||||||
Homogénéité de la luminosité: 88 %
Valeur mesurée au centre, sur batterie: 538 cd/m²
Contraste: 1145:1 (Valeurs des noirs: 0.47 cd/m²)
ΔE Color 1.9 | 0.5-29.43 Ø4.86
ΔE Greyscale 2.7 | 0.5-98 Ø5.1
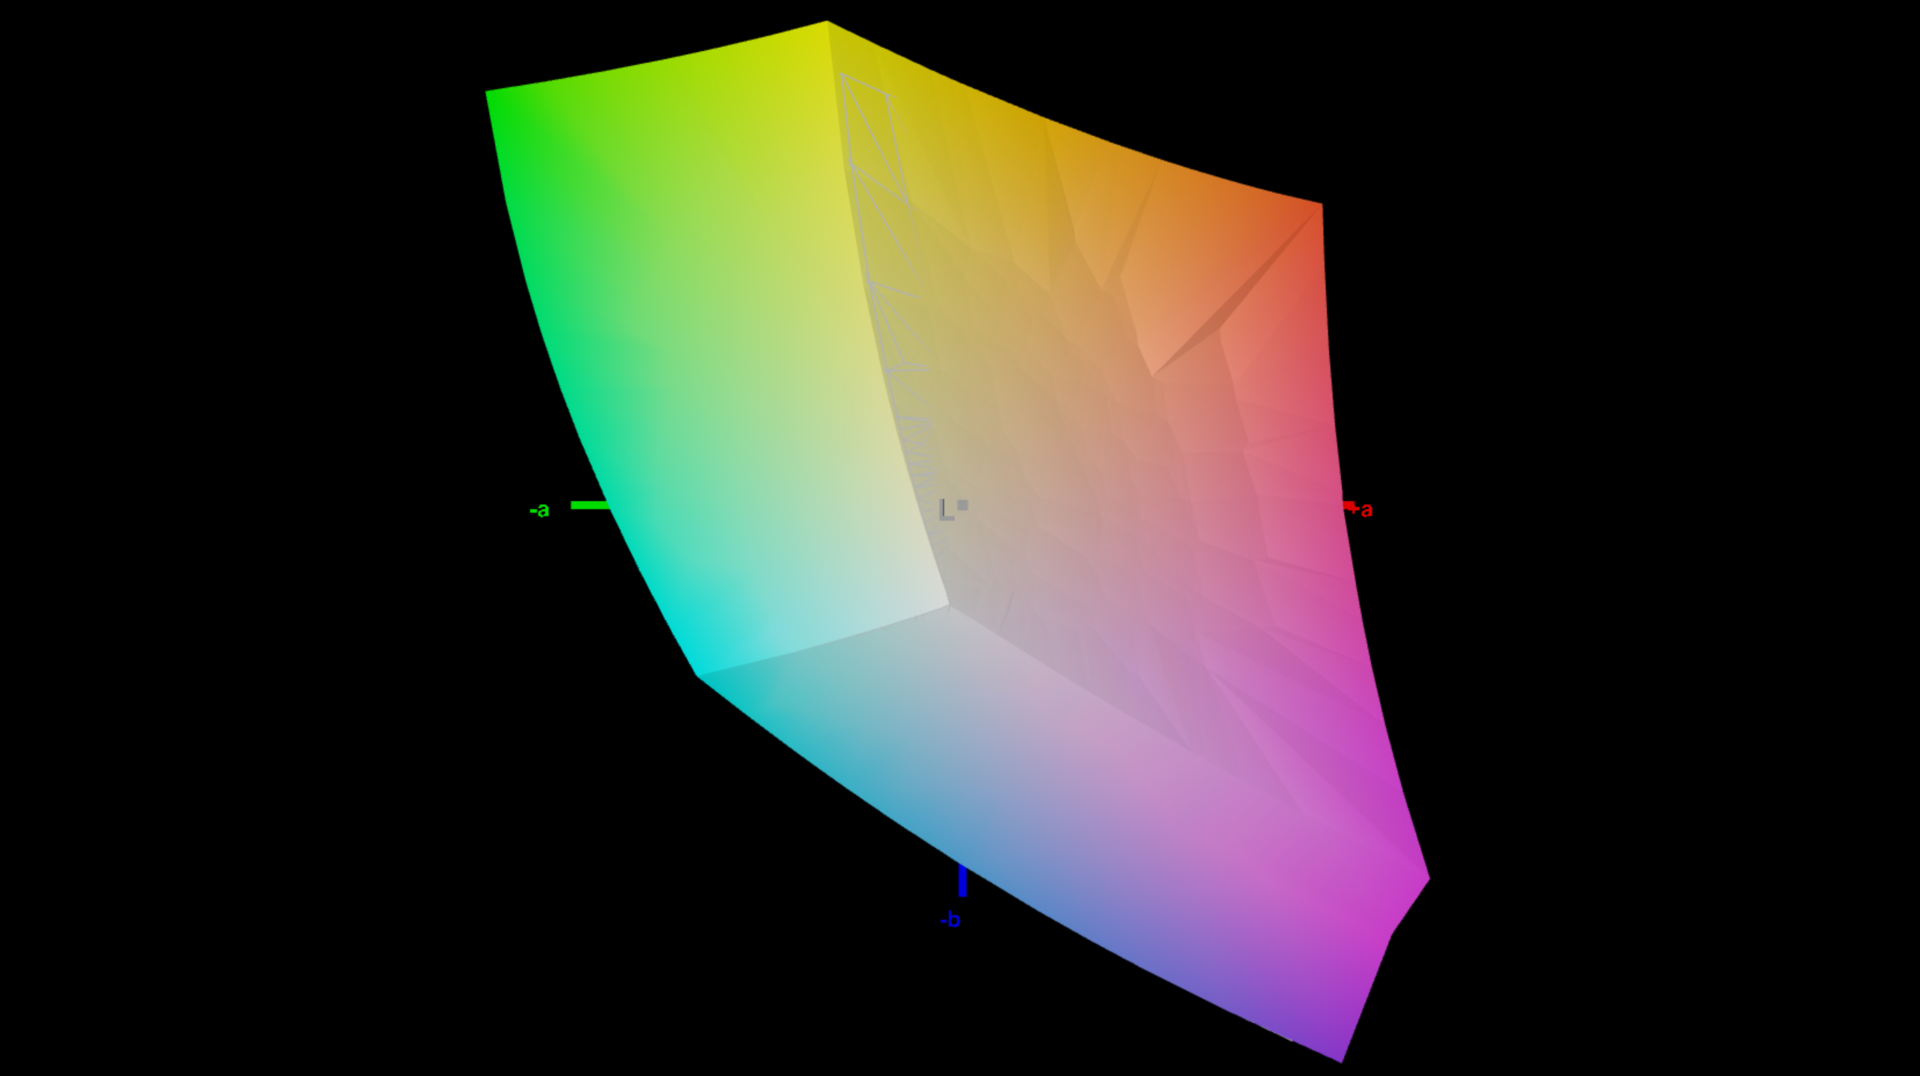
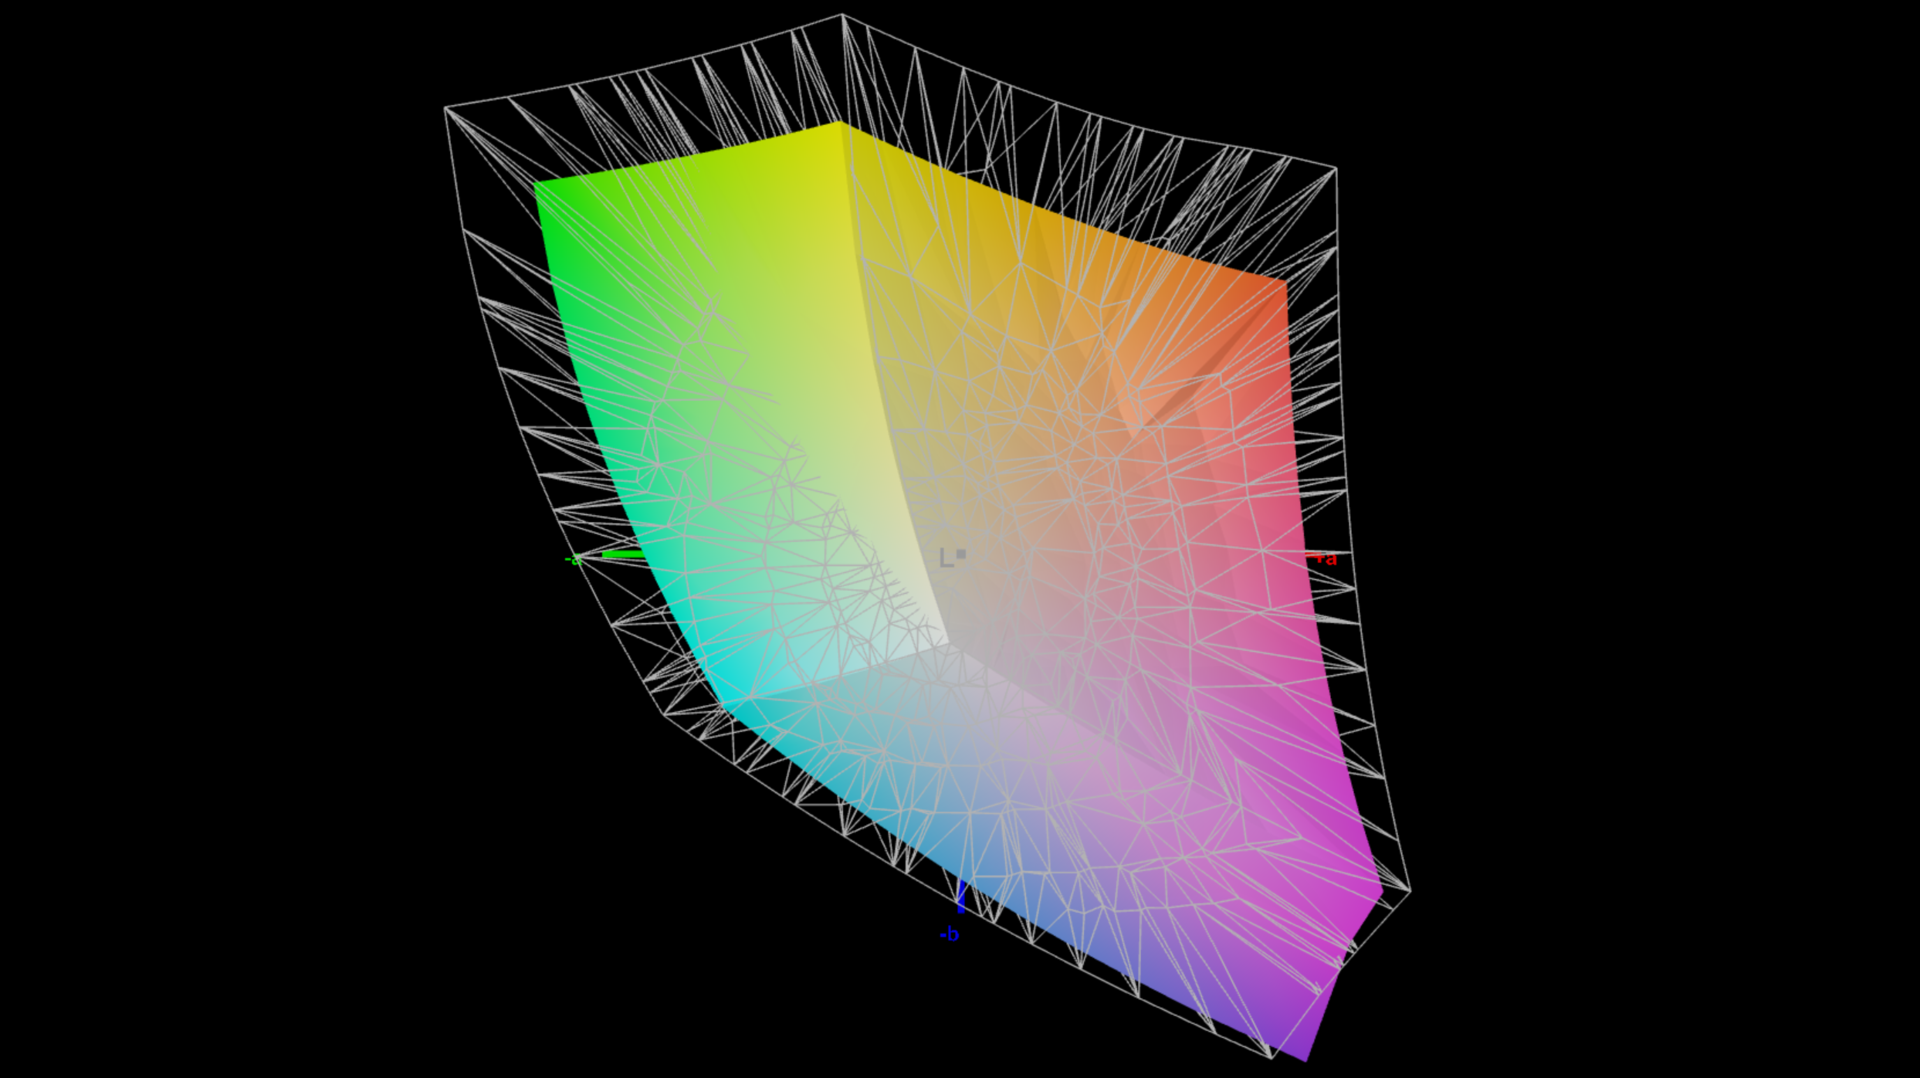
75.4% AdobeRGB 1998 (Argyll 2.2.0 3D)
99.8% sRGB (Argyll 2.2.0 3D)
74.7% Display P3 (Argyll 2.2.0 3D)
Gamma: 2.24
| SCHENKER XMG Pro 16 (E25) NE160QDM-NZL, IPS, 2560x1600, 16", 300 Hz | SCHENKER XMG Pro 16 Studio (Mid 24) BOE CQ NE160QDM-NZ1, IPS, 2560x1600, 16", 240 Hz | Asus ROG Strix G16 G615 NE160QDM-NZC, IPS, 2560x1600, 16", 240 Hz | Tuxedo Sirius 16 Gen 1 NE161QHM-NY1, IPS, 2560x1440, 16.1", 165 Hz | Lenovo Legion Pro 5 16IRX9 BOE NE160QDM-NYC, IPS, 2560x1600, 16", 165 Hz | Lenovo Legion Pro 7i 16 Gen 10 Samsung ATNA60HU01-0, OLED, 2560x1600, 16", 240 Hz | |
|---|---|---|---|---|---|---|
| Display | -5% | 17% | -7% | -5% | 19% | |
| Display P3 Coverage | 74.7 | 68.8 -8% | 99.1 33% | 67.4 -10% | 69.3 -7% | 99.5 33% |
| sRGB Coverage | 99.8 | 99.5 0% | 99.9 0% | 97.2 -3% | 99.4 0% | 100 0% |
| AdobeRGB 1998 Coverage | 75.4 | 70.8 -6% | 89.1 18% | 69.3 -8% | 70.1 -7% | 94.4 25% |
| Response Times | -19% | 22% | -50% | -39% | 95% | |
| Response Time Grey 50% / Grey 80% * | 10.5 ? | 12.7 ? -21% | 4.6 ? 56% | 12 ? -14% | 11.9 ? -13% | 0.28 ? 97% |
| Response Time Black / White * | 5.4 ? | 6.3 ? -17% | 6.1 ? -13% | 10 ? -85% | 8.9 ? -65% | 0.43 ? 92% |
| PWM Frequency | 1438 ? | |||||
| Screen | -18% | 8% | -37% | 9% | -10% | |
| Brightness middle | 538 | 416 -23% | 545 1% | 302 -44% | 384 -29% | 490.4 -9% |
| Brightness | 508 | 392 -23% | 536 6% | 314 -38% | 366 -28% | 498 -2% |
| Brightness Distribution | 88 | 86 -2% | 89 1% | 86 -2% | 91 3% | 97 10% |
| Black Level * | 0.47 | 0.38 19% | 0.41 13% | 0.38 19% | 0.35 26% | |
| Contrast | 1145 | 1095 -4% | 1329 16% | 795 -31% | 1097 -4% | |
| Colorchecker dE 2000 * | 1.9 | 2.33 -23% | 1.6 16% | 2.97 -56% | 0.97 49% | 3.2 -68% |
| Colorchecker dE 2000 max. * | 4 | 6.07 -52% | 4 -0% | 5.63 -41% | 3.57 11% | 6.04 -51% |
| Greyscale dE 2000 * | 2.7 | 3.7 -37% | 2.4 11% | 5.45 -102% | 1.5 44% | 1 63% |
| Gamma | 2.24 98% | 2.161 102% | 2.25 98% | 1.994 110% | 2.24 98% | 2.24 98% |
| CCT | 7027 93% | 7102 92% | 6737 96% | 6520 100% | 6709 97% | 6373 102% |
| Colorchecker dE 2000 calibrated * | 1.02 | 0.8 | 2.24 | 0.77 | 0.84 | |
| Moyenne finale (programmes/paramètres) | -14% /
-15% | 16% /
12% | -31% /
-32% | -12% /
-2% | 35% /
17% |
* ... Moindre est la valeur, meilleures sont les performances

Temps de réponse de l'écran
| ↔ Temps de réponse noir à blanc | ||
|---|---|---|
| 5.4 ms ... hausse ↗ et chute ↘ combinées | ↗ 1.4 ms hausse | 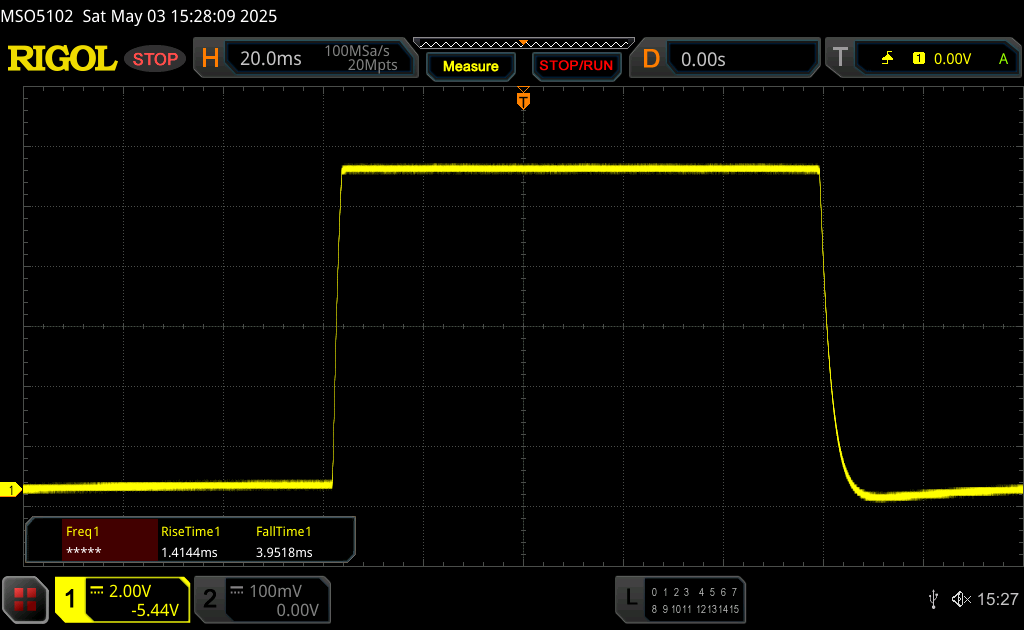 |
| ↘ 4 ms chute | ||
| L'écran montre de très faibles temps de réponse, parfait pour le jeu. En comparaison, tous les appareils testés affichent entre 0.1 (minimum) et 240 (maximum) ms. » 15 % des appareils testés affichent de meilleures performances. Cela signifie que les latences relevées sont meilleures que la moyenne (20.7 ms) de tous les appareils testés. | ||
| ↔ Temps de réponse gris 50% à gris 80% | ||
| 10.5 ms ... hausse ↗ et chute ↘ combinées | ↗ 3.4 ms hausse | 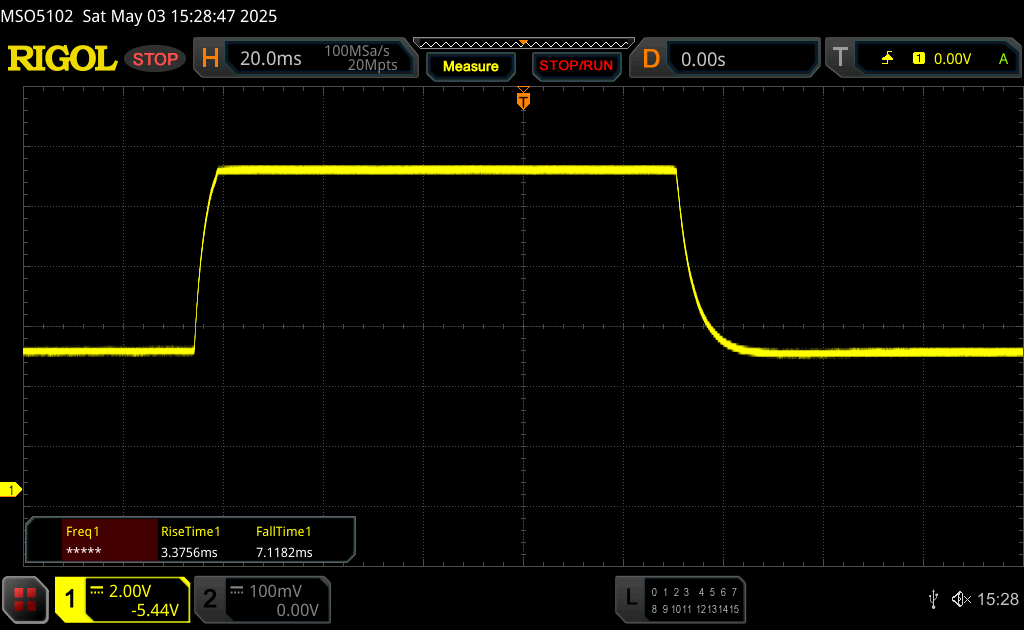 |
| ↘ 7.1 ms chute | ||
| L'écran montre de bons temps de réponse, mais insuffisant pour du jeu compétitif. En comparaison, tous les appareils testés affichent entre 0.165 (minimum) et 636 (maximum) ms. » 22 % des appareils testés affichent de meilleures performances. Cela signifie que les latences relevées sont meilleures que la moyenne (32.4 ms) de tous les appareils testés. | ||
Scintillement / MLI (Modulation de largeur d'impulsion)
| Scintillement / MLI (Modulation de largeur d'impulsion) non décelé | 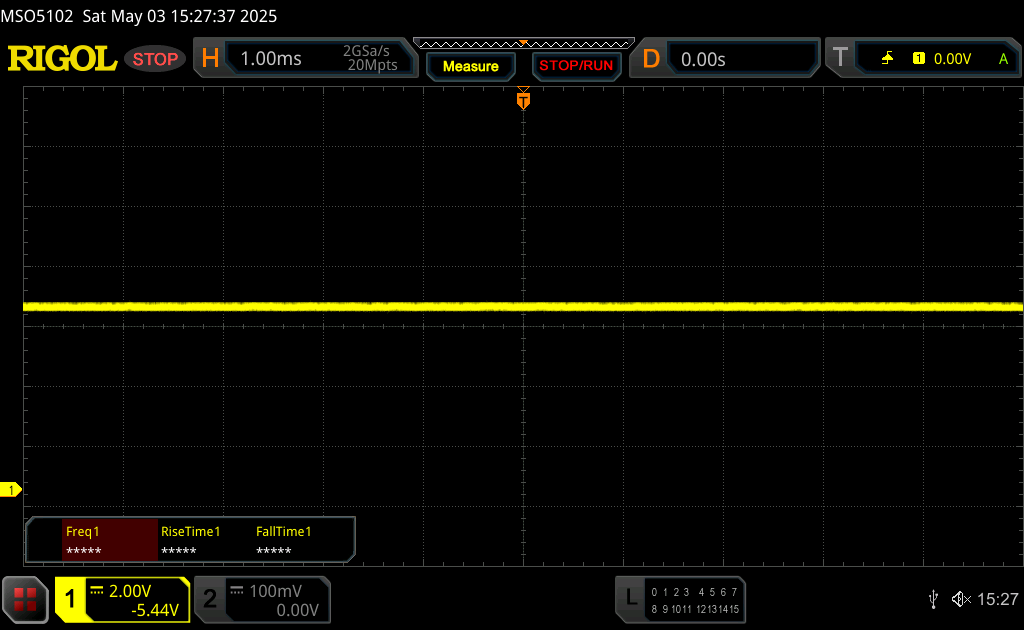 | ||
En comparaison, 53 % des appareils testés n'emploient pas MDI pour assombrir leur écran. Nous avons relevé une moyenne à 8458 (minimum : 5 - maximum : 343500) Hz dans le cas où une MDI était active. | |||


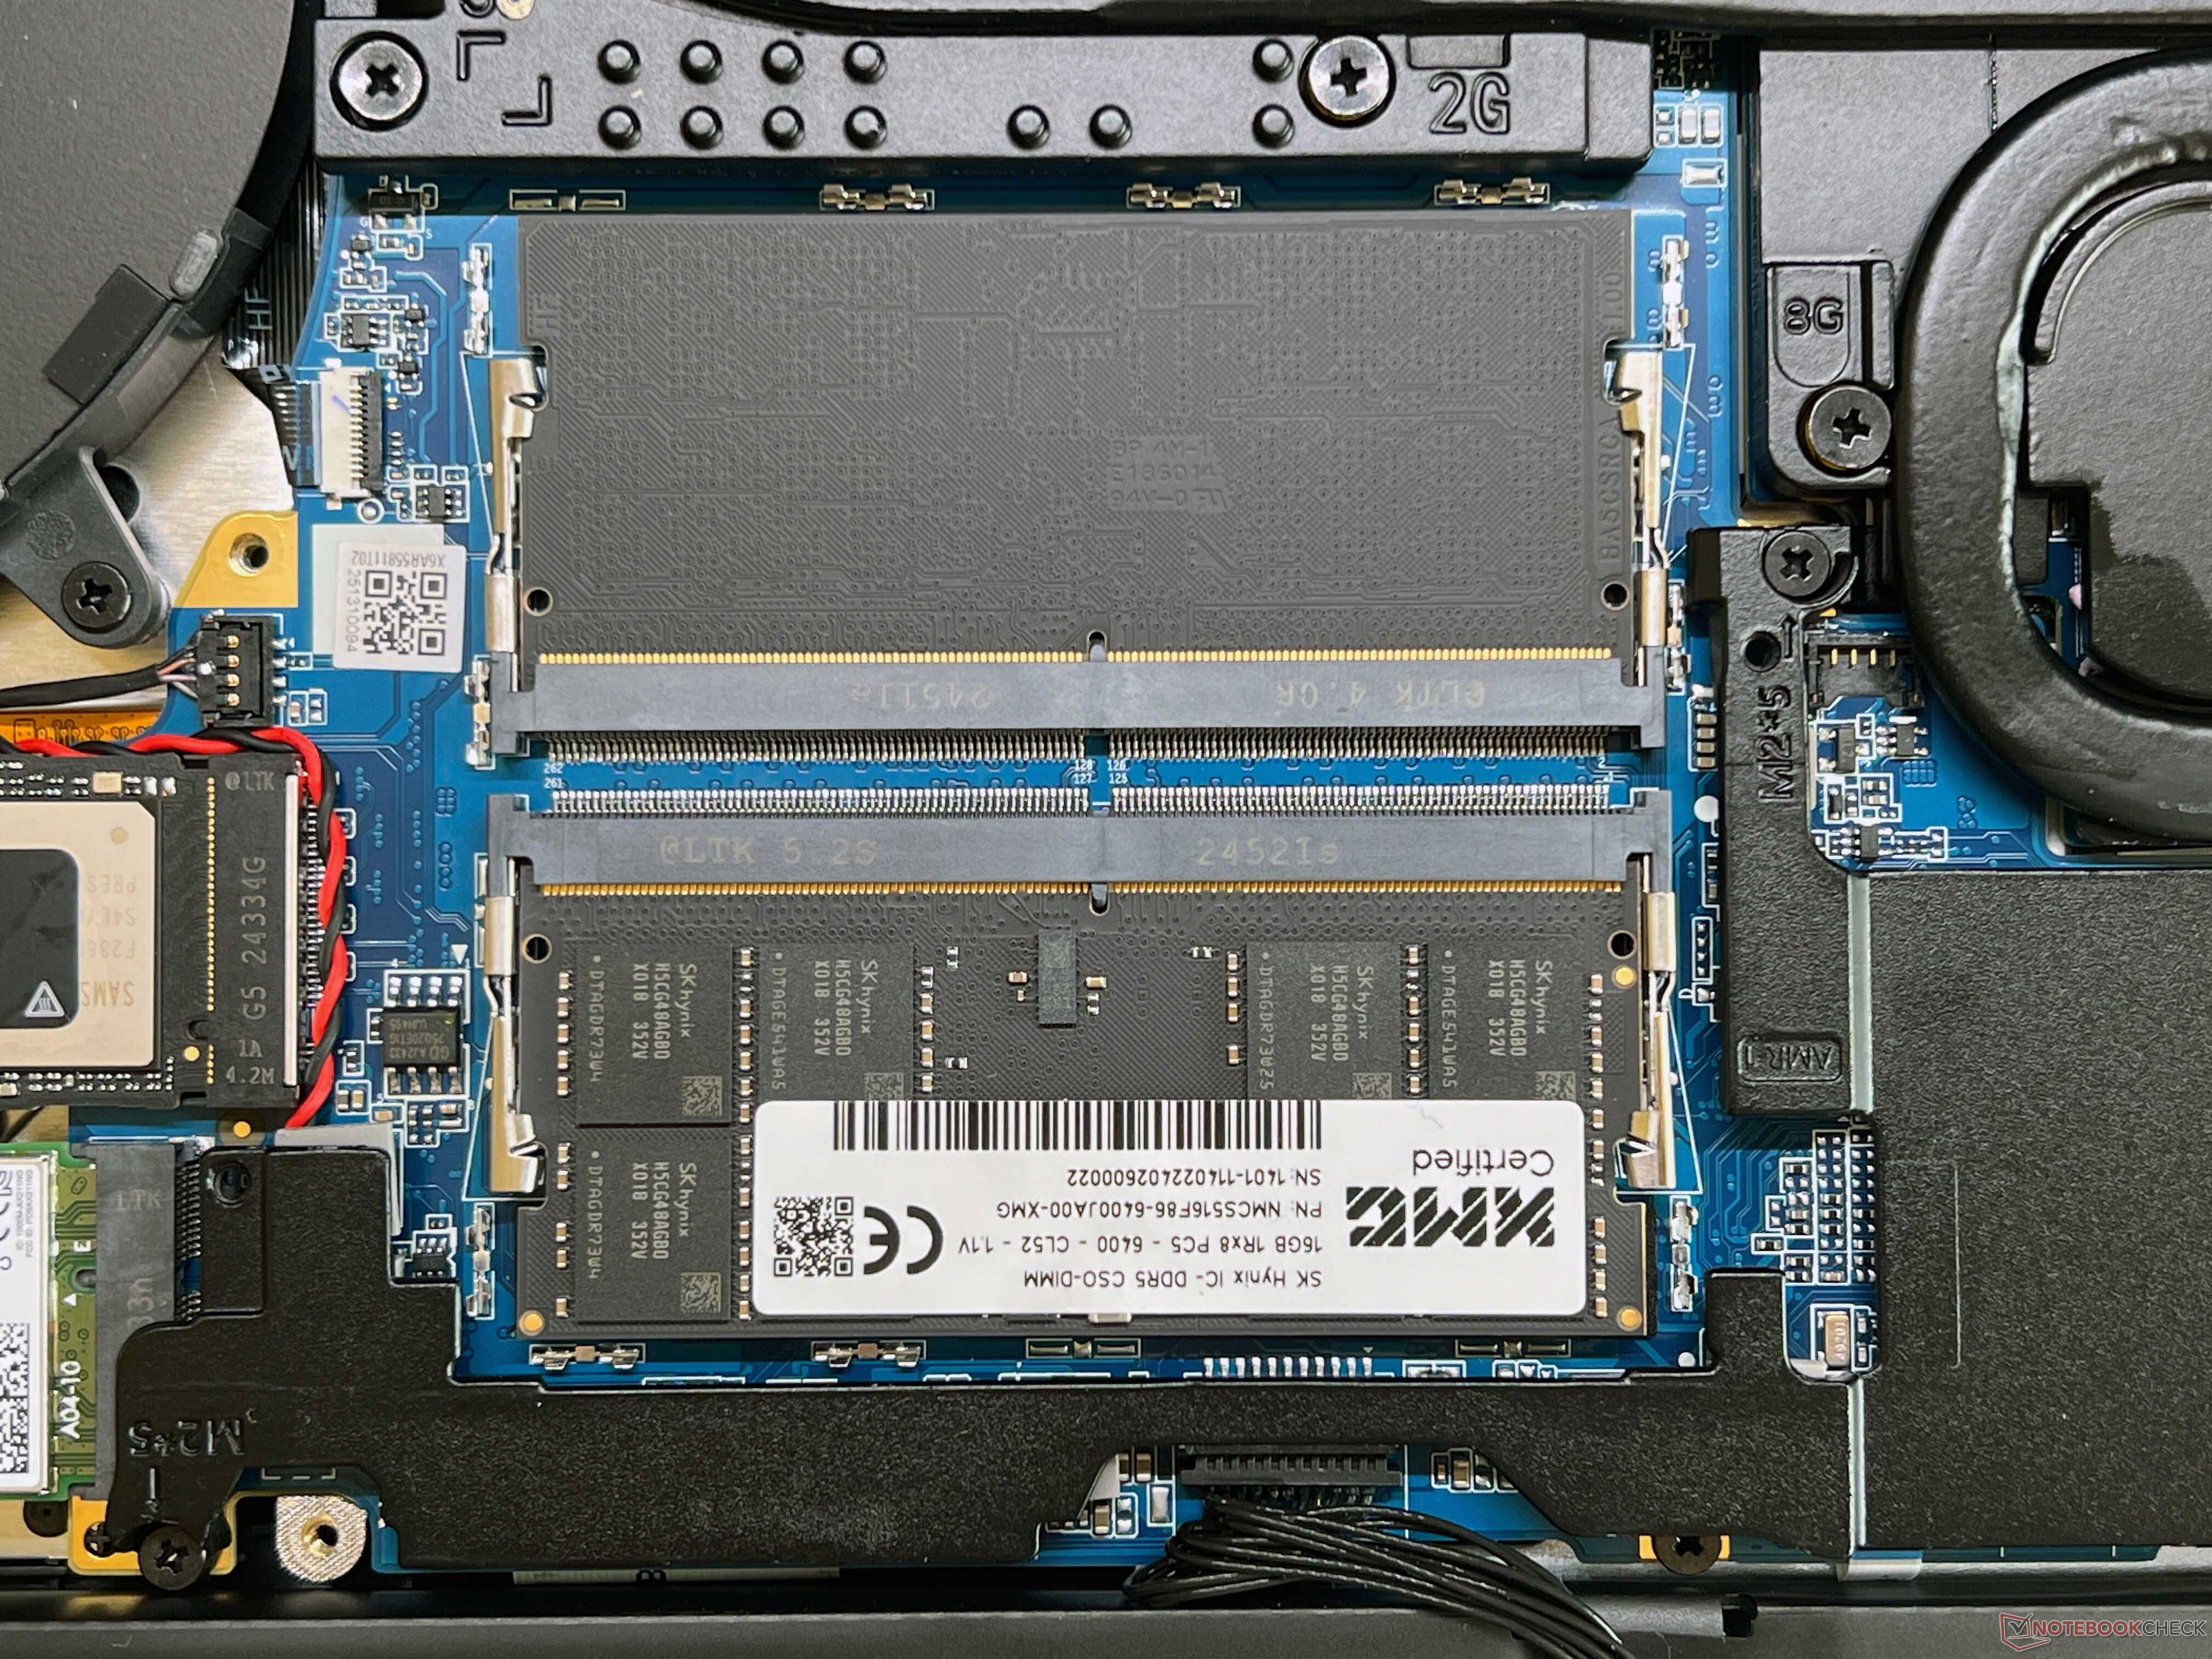
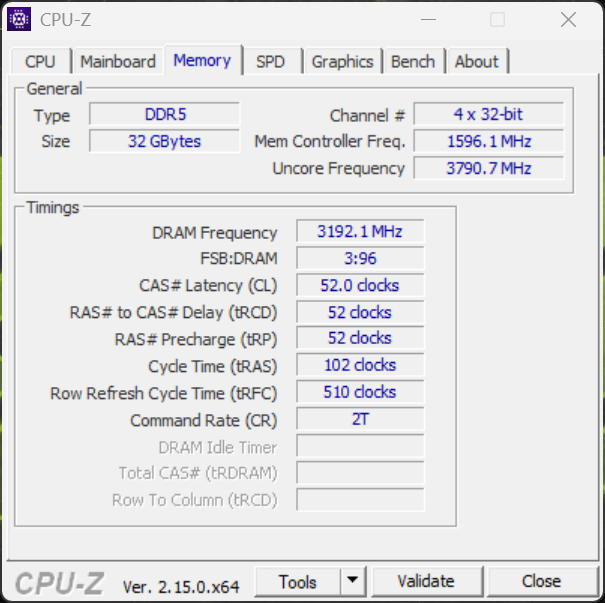
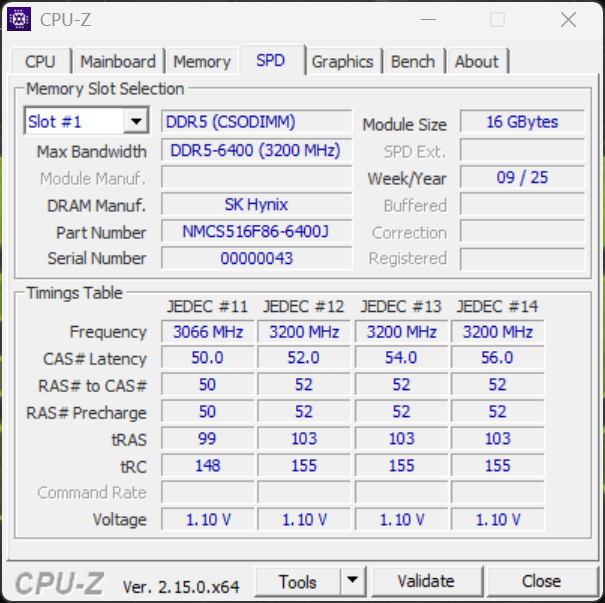
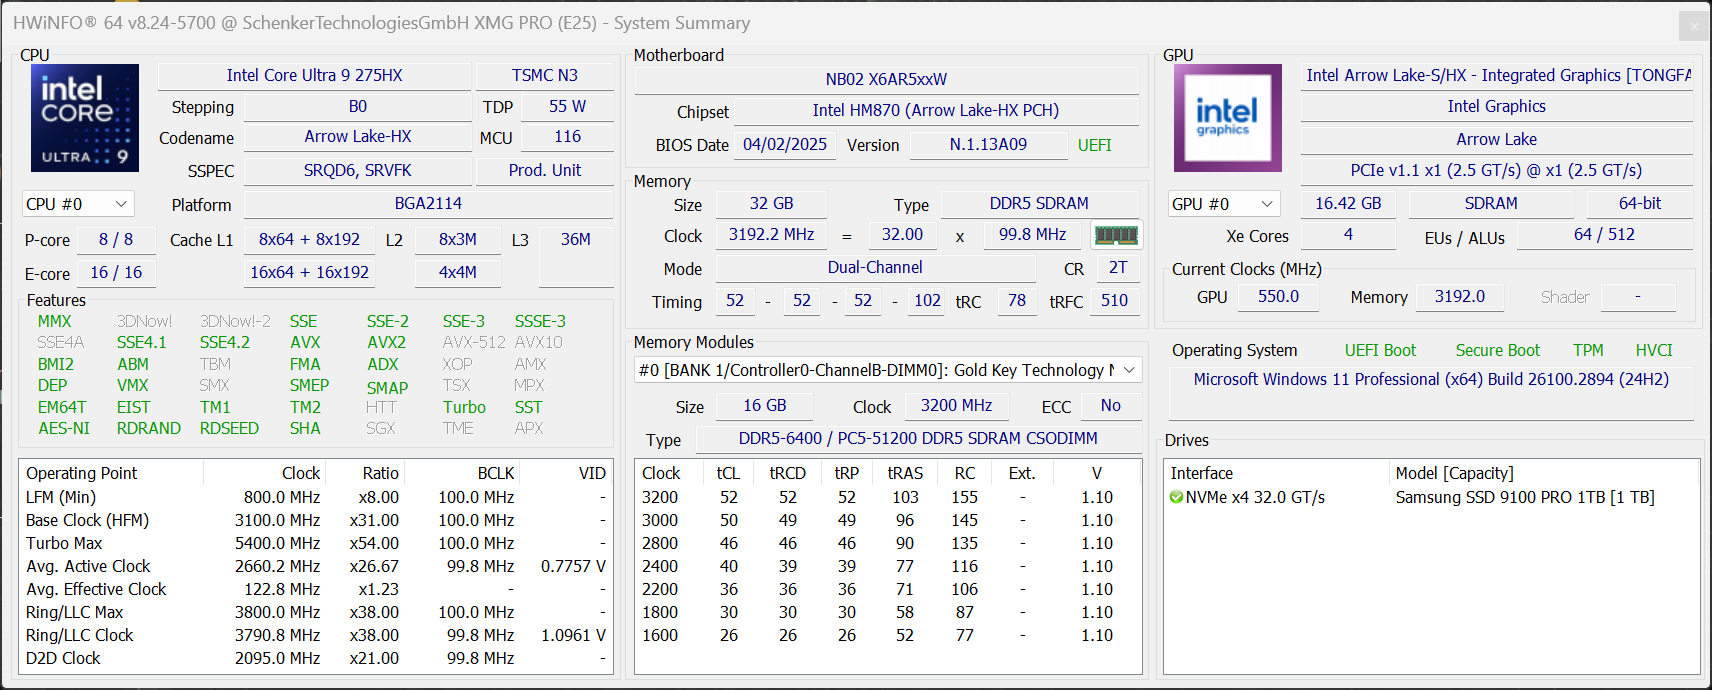
Performance - Jusqu'à 128 Go de RAM
La capacité maximale de mémoire vive de l'ordinateur portable est influencée par le choix du processeur de l'acheteur. Avec le Core Ultra 9 275HXvous pouvez choisir jusqu'à 128 Go (DDR5-6400).
Conditions d'essai
Schenker permet aux utilisateurs de choisir entre différents profils énergétiques ainsi qu'un mode manuel, qui peuvent tous être facilement basculés via un raccourci clavier. Nous avons utilisé le mode Overboost pour nos benchmarks et nos mesures. Le mode Enthusiast est le maximum disponible en mode batterie.
| Profil énergétique | TDP | CB24 Multi | TGP | Time Spy Graphiques | CP2077 QHD | émissions sonores du ventilateur max |
|---|---|---|---|---|---|---|
| Équilibré | 45 watts | 1 348 points | 125 watts | 16 186 points | 78,9fps | 44,9 dB(A) |
| Enthusiast | 90/75 watts | 1,833 points | 130 watts | 16,835 points | 80.7fps | 49.4 dB(A) |
| Overboost | 150/135 watts | 2 072 points | 140 watts | 17 239 points | 81,6fps | 53,3 dB(A) |
| Batterie (Enthusiast) | 40 watts | 1,234 points | 60 watts | 11,262 points | 22fps | 37 dB(A) |
Processeur - Core Ultra 9 275HX
En raison de son TDP maximal de 150 watts, l'ordinateur portable ne peut pas tirer parti du processeur Core Ultra 9 275HXà son plein potentiel. Par conséquent, certains ordinateurs portables de jeu offrent des performances multicœurs légèrement supérieures. Néanmoins, ses performances globales sont excellentes et le Core i9-14900HX dans l'ancien XMG Pro 16 Studio a été surpassé de 21 % dans tous les benchmarks CPU. En outre, ses performances restent généralement très stables sous charge continue.
Cinebench R15 Multi continuous test
Cinebench 2024: CPU Multi Core | CPU Single Core
Cinebench R23: Multi Core | Single Core
Cinebench R20: CPU (Multi Core) | CPU (Single Core)
Cinebench R15: CPU Multi 64Bit | CPU Single 64Bit
Blender: v2.79 BMW27 CPU
7-Zip 18.03: 7z b 4 | 7z b 4 -mmt1
Geekbench 6.4: Multi-Core | Single-Core
Geekbench 5.5: Multi-Core | Single-Core
HWBOT x265 Benchmark v2.2: 4k Preset
LibreOffice : 20 Documents To PDF
R Benchmark 2.5: Overall mean
| CPU Performance Rating | |
| Asus ROG Strix G16 G615 | |
| SCHENKER XMG Pro 16 (E25) | |
| Lenovo Legion Pro 7i 16 Gen 10 | |
| Moyenne Intel Core Ultra 9 275HX | |
| Lenovo Legion Pro 5 16IRX9 -2! | |
| SCHENKER XMG Pro 16 Studio (Mid 24) | |
| Tuxedo Sirius 16 Gen 1 -10! | |
| Moyenne de la classe Gaming | |
| Cinebench 2024 / CPU Multi Core | |
| Asus ROG Strix G16 G615 | |
| Moyenne Intel Core Ultra 9 275HX (1913 - 2223, n=6) | |
| Lenovo Legion Pro 7i 16 Gen 10 | |
| SCHENKER XMG Pro 16 (E25) | |
| SCHENKER XMG Pro 16 Studio (Mid 24) | |
| Moyenne de la classe Gaming (331 - 2298, n=63, 2 dernières années) | |
| Cinebench 2024 / CPU Single Core | |
| SCHENKER XMG Pro 16 (E25) | |
| Asus ROG Strix G16 G615 | |
| Moyenne Intel Core Ultra 9 275HX (130.5 - 138, n=6) | |
| Lenovo Legion Pro 7i 16 Gen 10 | |
| SCHENKER XMG Pro 16 Studio (Mid 24) | |
| Moyenne de la classe Gaming (68.2 - 138, n=64, 2 dernières années) | |
| Cinebench R23 / Multi Core | |
| Lenovo Legion Pro 7i 16 Gen 10 | |
| SCHENKER XMG Pro 16 (E25) | |
| Moyenne Intel Core Ultra 9 275HX (33449 - 39001, n=8) | |
| Asus ROG Strix G16 G615 | |
| Lenovo Legion Pro 5 16IRX9 | |
| SCHENKER XMG Pro 16 Studio (Mid 24) | |
| Moyenne de la classe Gaming (5668 - 40117, n=145, 2 dernières années) | |
| Tuxedo Sirius 16 Gen 1 | |
| Cinebench R23 / Single Core | |
| SCHENKER XMG Pro 16 (E25) | |
| Lenovo Legion Pro 7i 16 Gen 10 | |
| Asus ROG Strix G16 G615 | |
| Moyenne Intel Core Ultra 9 275HX (2126 - 2252, n=8) | |
| Lenovo Legion Pro 5 16IRX9 | |
| SCHENKER XMG Pro 16 Studio (Mid 24) | |
| Moyenne de la classe Gaming (1136 - 2252, n=145, 2 dernières années) | |
| Tuxedo Sirius 16 Gen 1 | |
| Cinebench R20 / CPU (Multi Core) | |
| SCHENKER XMG Pro 16 (E25) | |
| Moyenne Intel Core Ultra 9 275HX (13178 - 15517, n=8) | |
| Lenovo Legion Pro 7i 16 Gen 10 | |
| Asus ROG Strix G16 G615 | |
| Lenovo Legion Pro 5 16IRX9 | |
| SCHENKER XMG Pro 16 Studio (Mid 24) | |
| Moyenne de la classe Gaming (2179 - 15751, n=145, 2 dernières années) | |
| Tuxedo Sirius 16 Gen 1 | |
| Cinebench R20 / CPU (Single Core) | |
| SCHENKER XMG Pro 16 (E25) | |
| Asus ROG Strix G16 G615 | |
| Moyenne Intel Core Ultra 9 275HX (811 - 866, n=8) | |
| Lenovo Legion Pro 7i 16 Gen 10 | |
| Lenovo Legion Pro 5 16IRX9 | |
| SCHENKER XMG Pro 16 Studio (Mid 24) | |
| Moyenne de la classe Gaming (439 - 866, n=145, 2 dernières années) | |
| Tuxedo Sirius 16 Gen 1 | |
| Cinebench R15 / CPU Multi 64Bit | |
| Asus ROG Strix G16 G615 | |
| Lenovo Legion Pro 7i 16 Gen 10 | |
| Moyenne Intel Core Ultra 9 275HX (5044 - 6060, n=8) | |
| SCHENKER XMG Pro 16 (E25) | |
| Lenovo Legion Pro 5 16IRX9 | |
| SCHENKER XMG Pro 16 Studio (Mid 24) | |
| Moyenne de la classe Gaming (1537 - 6232, n=148, 2 dernières années) | |
| Tuxedo Sirius 16 Gen 1 | |
| Cinebench R15 / CPU Single 64Bit | |
| Asus ROG Strix G16 G615 | |
| Lenovo Legion Pro 7i 16 Gen 10 | |
| SCHENKER XMG Pro 16 (E25) | |
| Moyenne Intel Core Ultra 9 275HX (317 - 343, n=8) | |
| Lenovo Legion Pro 5 16IRX9 | |
| Tuxedo Sirius 16 Gen 1 | |
| Moyenne de la classe Gaming (191.9 - 343, n=145, 2 dernières années) | |
| SCHENKER XMG Pro 16 Studio (Mid 24) | |
| Blender / v2.79 BMW27 CPU | |
| Moyenne de la classe Gaming (80 - 517, n=139, 2 dernières années) | |
| SCHENKER XMG Pro 16 Studio (Mid 24) | |
| Lenovo Legion Pro 5 16IRX9 | |
| Moyenne Intel Core Ultra 9 275HX (86 - 102, n=8) | |
| SCHENKER XMG Pro 16 (E25) | |
| Lenovo Legion Pro 7i 16 Gen 10 | |
| Asus ROG Strix G16 G615 | |
| 7-Zip 18.03 / 7z b 4 | |
| Asus ROG Strix G16 G615 | |
| Lenovo Legion Pro 7i 16 Gen 10 | |
| SCHENKER XMG Pro 16 (E25) | |
| Moyenne Intel Core Ultra 9 275HX (104686 - 122818, n=8) | |
| Lenovo Legion Pro 5 16IRX9 | |
| SCHENKER XMG Pro 16 Studio (Mid 24) | |
| Moyenne de la classe Gaming (23795 - 144064, n=143, 2 dernières années) | |
| 7-Zip 18.03 / 7z b 4 -mmt1 | |
| SCHENKER XMG Pro 16 (E25) | |
| Asus ROG Strix G16 G615 | |
| SCHENKER XMG Pro 16 Studio (Mid 24) | |
| Lenovo Legion Pro 5 16IRX9 | |
| Moyenne Intel Core Ultra 9 275HX (6186 - 7039, n=8) | |
| Lenovo Legion Pro 7i 16 Gen 10 | |
| Moyenne de la classe Gaming (4199 - 7573, n=143, 2 dernières années) | |
| Geekbench 6.4 / Multi-Core | |
| SCHENKER XMG Pro 16 (E25) | |
| Asus ROG Strix G16 G615 | |
| Moyenne Intel Core Ultra 9 275HX (16033 - 21668, n=9) | |
| Lenovo Legion Pro 7i 16 Gen 10 | |
| Lenovo Legion Pro 5 16IRX9 | |
| SCHENKER XMG Pro 16 Studio (Mid 24) | |
| Moyenne de la classe Gaming (5340 - 22104, n=126, 2 dernières années) | |
| Tuxedo Sirius 16 Gen 1 | |
| Geekbench 6.4 / Single-Core | |
| SCHENKER XMG Pro 16 (E25) | |
| Lenovo Legion Pro 7i 16 Gen 10 | |
| Moyenne Intel Core Ultra 9 275HX (2917 - 3158, n=9) | |
| Asus ROG Strix G16 G615 | |
| Lenovo Legion Pro 5 16IRX9 | |
| SCHENKER XMG Pro 16 Studio (Mid 24) | |
| Moyenne de la classe Gaming (1490 - 3219, n=126, 2 dernières années) | |
| Tuxedo Sirius 16 Gen 1 | |
| Geekbench 5.5 / Multi-Core | |
| SCHENKER XMG Pro 16 (E25) | |
| Asus ROG Strix G16 G615 | |
| Moyenne Intel Core Ultra 9 275HX (21195 - 25855, n=8) | |
| Lenovo Legion Pro 7i 16 Gen 10 | |
| Lenovo Legion Pro 5 16IRX9 | |
| SCHENKER XMG Pro 16 Studio (Mid 24) | |
| Moyenne de la classe Gaming (4557 - 27010, n=142, 2 dernières années) | |
| Geekbench 5.5 / Single-Core | |
| SCHENKER XMG Pro 16 (E25) | |
| Lenovo Legion Pro 7i 16 Gen 10 | |
| Moyenne Intel Core Ultra 9 275HX (2034 - 2292, n=8) | |
| Asus ROG Strix G16 G615 | |
| Lenovo Legion Pro 5 16IRX9 | |
| SCHENKER XMG Pro 16 Studio (Mid 24) | |
| Moyenne de la classe Gaming (986 - 2423, n=142, 2 dernières années) | |
| HWBOT x265 Benchmark v2.2 / 4k Preset | |
| Asus ROG Strix G16 G615 | |
| SCHENKER XMG Pro 16 (E25) | |
| Lenovo Legion Pro 7i 16 Gen 10 | |
| Moyenne Intel Core Ultra 9 275HX (35 - 41.2, n=8) | |
| Lenovo Legion Pro 5 16IRX9 | |
| SCHENKER XMG Pro 16 Studio (Mid 24) | |
| Moyenne de la classe Gaming (7.7 - 44.3, n=143, 2 dernières années) | |
| LibreOffice / 20 Documents To PDF | |
| Moyenne Intel Core Ultra 9 275HX (36.9 - 88, n=8) | |
| SCHENKER XMG Pro 16 (E25) | |
| Moyenne de la classe Gaming (19 - 96.6, n=141, 2 dernières années) | |
| SCHENKER XMG Pro 16 Studio (Mid 24) | |
| Lenovo Legion Pro 5 16IRX9 | |
| Asus ROG Strix G16 G615 | |
| Lenovo Legion Pro 7i 16 Gen 10 | |
| R Benchmark 2.5 / Overall mean | |
| Moyenne de la classe Gaming (0.3551 - 0.759, n=144, 2 dernières années) | |
| Moyenne Intel Core Ultra 9 275HX (0.3943 - 0.4568, n=8) | |
| Lenovo Legion Pro 7i 16 Gen 10 | |
| SCHENKER XMG Pro 16 Studio (Mid 24) | |
| SCHENKER XMG Pro 16 (E25) | |
| Asus ROG Strix G16 G615 | |
| Lenovo Legion Pro 5 16IRX9 | |
* ... Moindre est la valeur, meilleures sont les performances
AIDA64: FP32 Ray-Trace | FPU Julia | CPU SHA3 | CPU Queen | FPU SinJulia | FPU Mandel | CPU AES | CPU ZLib | FP64 Ray-Trace | CPU PhotoWorxx
| Performance Rating | |
| Asus ROG Strix G16 G615 | |
| Lenovo Legion Pro 7i 16 Gen 10 | |
| Moyenne Intel Core Ultra 9 275HX | |
| SCHENKER XMG Pro 16 (E25) | |
| Lenovo Legion Pro 5 16IRX9 | |
| Tuxedo Sirius 16 Gen 1 | |
| SCHENKER XMG Pro 16 Studio (Mid 24) | |
| Moyenne de la classe Gaming | |
| AIDA64 / FP32 Ray-Trace | |
| Asus ROG Strix G16 G615 | |
| Moyenne Intel Core Ultra 9 275HX (32615 - 39551, n=8) | |
| Lenovo Legion Pro 7i 16 Gen 10 | |
| SCHENKER XMG Pro 16 (E25) | |
| Tuxedo Sirius 16 Gen 1 | |
| Lenovo Legion Pro 5 16IRX9 | |
| Moyenne de la classe Gaming (7192 - 85542, n=143, 2 dernières années) | |
| SCHENKER XMG Pro 16 Studio (Mid 24) | |
| AIDA64 / FPU Julia | |
| Asus ROG Strix G16 G615 | |
| Lenovo Legion Pro 7i 16 Gen 10 | |
| Moyenne Intel Core Ultra 9 275HX (166245 - 194867, n=8) | |
| SCHENKER XMG Pro 16 (E25) | |
| Lenovo Legion Pro 5 16IRX9 | |
| Tuxedo Sirius 16 Gen 1 | |
| Moyenne de la classe Gaming (35040 - 252486, n=143, 2 dernières années) | |
| SCHENKER XMG Pro 16 Studio (Mid 24) | |
| AIDA64 / CPU SHA3 | |
| Asus ROG Strix G16 G615 | |
| Moyenne Intel Core Ultra 9 275HX (7829 - 9482, n=8) | |
| Lenovo Legion Pro 7i 16 Gen 10 | |
| SCHENKER XMG Pro 16 (E25) | |
| Lenovo Legion Pro 5 16IRX9 | |
| SCHENKER XMG Pro 16 Studio (Mid 24) | |
| Moyenne de la classe Gaming (1728 - 10389, n=143, 2 dernières années) | |
| Tuxedo Sirius 16 Gen 1 | |
| AIDA64 / CPU Queen | |
| Lenovo Legion Pro 5 16IRX9 | |
| Asus ROG Strix G16 G615 | |
| Lenovo Legion Pro 7i 16 Gen 10 | |
| SCHENKER XMG Pro 16 Studio (Mid 24) | |
| Moyenne Intel Core Ultra 9 275HX (125013 - 139608, n=8) | |
| SCHENKER XMG Pro 16 (E25) | |
| Tuxedo Sirius 16 Gen 1 | |
| Moyenne de la classe Gaming (50699 - 200651, n=143, 2 dernières années) | |
| AIDA64 / FPU SinJulia | |
| Lenovo Legion Pro 5 16IRX9 | |
| SCHENKER XMG Pro 16 (E25) | |
| Lenovo Legion Pro 7i 16 Gen 10 | |
| Asus ROG Strix G16 G615 | |
| Tuxedo Sirius 16 Gen 1 | |
| SCHENKER XMG Pro 16 Studio (Mid 24) | |
| Moyenne Intel Core Ultra 9 275HX (12272 - 14115, n=8) | |
| Moyenne de la classe Gaming (5020 - 32988, n=143, 2 dernières années) | |
| AIDA64 / FPU Mandel | |
| Asus ROG Strix G16 G615 | |
| Moyenne Intel Core Ultra 9 275HX (87156 - 104057, n=8) | |
| Lenovo Legion Pro 7i 16 Gen 10 | |
| SCHENKER XMG Pro 16 (E25) | |
| Tuxedo Sirius 16 Gen 1 | |
| Lenovo Legion Pro 5 16IRX9 | |
| Moyenne de la classe Gaming (17585 - 134044, n=143, 2 dernières années) | |
| SCHENKER XMG Pro 16 Studio (Mid 24) | |
| AIDA64 / CPU AES | |
| Tuxedo Sirius 16 Gen 1 | |
| Asus ROG Strix G16 G615 | |
| Lenovo Legion Pro 7i 16 Gen 10 | |
| SCHENKER XMG Pro 16 (E25) | |
| Moyenne Intel Core Ultra 9 275HX (118108 - 134920, n=8) | |
| Lenovo Legion Pro 5 16IRX9 | |
| Moyenne de la classe Gaming (19065 - 328679, n=143, 2 dernières années) | |
| SCHENKER XMG Pro 16 Studio (Mid 24) | |
| AIDA64 / CPU ZLib | |
| Asus ROG Strix G16 G615 | |
| Moyenne Intel Core Ultra 9 275HX (1896 - 2220, n=8) | |
| Lenovo Legion Pro 7i 16 Gen 10 | |
| SCHENKER XMG Pro 16 (E25) | |
| Lenovo Legion Pro 5 16IRX9 | |
| SCHENKER XMG Pro 16 Studio (Mid 24) | |
| Moyenne de la classe Gaming (373 - 2531, n=143, 2 dernières années) | |
| Tuxedo Sirius 16 Gen 1 | |
| AIDA64 / FP64 Ray-Trace | |
| Asus ROG Strix G16 G615 | |
| Moyenne Intel Core Ultra 9 275HX (17631 - 21372, n=8) | |
| Lenovo Legion Pro 7i 16 Gen 10 | |
| SCHENKER XMG Pro 16 (E25) | |
| Tuxedo Sirius 16 Gen 1 | |
| Lenovo Legion Pro 5 16IRX9 | |
| Moyenne de la classe Gaming (3856 - 45446, n=143, 2 dernières années) | |
| SCHENKER XMG Pro 16 Studio (Mid 24) | |
| AIDA64 / CPU PhotoWorxx | |
| Lenovo Legion Pro 7i 16 Gen 10 | |
| SCHENKER XMG Pro 16 (E25) | |
| Moyenne Intel Core Ultra 9 275HX (47726 - 56613, n=8) | |
| Lenovo Legion Pro 5 16IRX9 | |
| SCHENKER XMG Pro 16 Studio (Mid 24) | |
| Asus ROG Strix G16 G615 | |
| Tuxedo Sirius 16 Gen 1 | |
| Moyenne de la classe Gaming (10805 - 62274, n=143, 2 dernières années) | |
Performance du système
Le Pro 16 est un système super rapide, aussi bien subjectivement lors de l'utilisation quotidienne que dans les benchmarks. Nous n'avons rencontré aucun problème de stabilité du système au cours de notre test.
PCMark 10: Score | Essentials | Productivity | Digital Content Creation
CrossMark: Overall | Productivity | Creativity | Responsiveness
WebXPRT 3: Overall
WebXPRT 4: Overall
Mozilla Kraken 1.1: Total
| Performance Rating | |
| Asus ROG Strix G16 G615 | |
| SCHENKER XMG Pro 16 (E25) | |
| Moyenne Intel Core Ultra 9 275HX, Nvidia GeForce RTX 5070 Ti Laptop | |
| Lenovo Legion Pro 7i 16 Gen 10 | |
| Lenovo Legion Pro 5 16IRX9 | |
| SCHENKER XMG Pro 16 Studio (Mid 24) | |
| Moyenne de la classe Gaming | |
| Tuxedo Sirius 16 Gen 1 -5! | |
| PCMark 10 / Score | |
| Lenovo Legion Pro 7i 16 Gen 10 | |
| Asus ROG Strix G16 G615 | |
| Lenovo Legion Pro 5 16IRX9 | |
| SCHENKER XMG Pro 16 (E25) | |
| Moyenne Intel Core Ultra 9 275HX, Nvidia GeForce RTX 5070 Ti Laptop (n=1) | |
| SCHENKER XMG Pro 16 Studio (Mid 24) | |
| Moyenne de la classe Gaming (5776 - 9852, n=130, 2 dernières années) | |
| PCMark 10 / Essentials | |
| SCHENKER XMG Pro 16 (E25) | |
| Moyenne Intel Core Ultra 9 275HX, Nvidia GeForce RTX 5070 Ti Laptop (n=1) | |
| Lenovo Legion Pro 5 16IRX9 | |
| Lenovo Legion Pro 7i 16 Gen 10 | |
| Asus ROG Strix G16 G615 | |
| Moyenne de la classe Gaming (9057 - 12600, n=130, 2 dernières années) | |
| SCHENKER XMG Pro 16 Studio (Mid 24) | |
| PCMark 10 / Productivity | |
| SCHENKER XMG Pro 16 Studio (Mid 24) | |
| Lenovo Legion Pro 5 16IRX9 | |
| Moyenne de la classe Gaming (6662 - 14612, n=130, 2 dernières années) | |
| SCHENKER XMG Pro 16 (E25) | |
| Moyenne Intel Core Ultra 9 275HX, Nvidia GeForce RTX 5070 Ti Laptop (n=1) | |
| Lenovo Legion Pro 7i 16 Gen 10 | |
| Asus ROG Strix G16 G615 | |
| PCMark 10 / Digital Content Creation | |
| Lenovo Legion Pro 7i 16 Gen 10 | |
| Asus ROG Strix G16 G615 | |
| SCHENKER XMG Pro 16 (E25) | |
| Moyenne Intel Core Ultra 9 275HX, Nvidia GeForce RTX 5070 Ti Laptop (n=1) | |
| Lenovo Legion Pro 5 16IRX9 | |
| Moyenne de la classe Gaming (7440 - 19351, n=130, 2 dernières années) | |
| SCHENKER XMG Pro 16 Studio (Mid 24) | |
| CrossMark / Overall | |
| SCHENKER XMG Pro 16 (E25) | |
| Moyenne Intel Core Ultra 9 275HX, Nvidia GeForce RTX 5070 Ti Laptop (n=1) | |
| Asus ROG Strix G16 G615 | |
| SCHENKER XMG Pro 16 Studio (Mid 24) | |
| Lenovo Legion Pro 7i 16 Gen 10 | |
| Lenovo Legion Pro 5 16IRX9 | |
| Tuxedo Sirius 16 Gen 1 | |
| Moyenne de la classe Gaming (1247 - 2344, n=110, 2 dernières années) | |
| CrossMark / Productivity | |
| SCHENKER XMG Pro 16 (E25) | |
| Moyenne Intel Core Ultra 9 275HX, Nvidia GeForce RTX 5070 Ti Laptop (n=1) | |
| Asus ROG Strix G16 G615 | |
| Tuxedo Sirius 16 Gen 1 | |
| Lenovo Legion Pro 7i 16 Gen 10 | |
| SCHENKER XMG Pro 16 Studio (Mid 24) | |
| Lenovo Legion Pro 5 16IRX9 | |
| Moyenne de la classe Gaming (1299 - 2204, n=110, 2 dernières années) | |
| CrossMark / Creativity | |
| SCHENKER XMG Pro 16 (E25) | |
| Moyenne Intel Core Ultra 9 275HX, Nvidia GeForce RTX 5070 Ti Laptop (n=1) | |
| Asus ROG Strix G16 G615 | |
| SCHENKER XMG Pro 16 Studio (Mid 24) | |
| Lenovo Legion Pro 7i 16 Gen 10 | |
| Lenovo Legion Pro 5 16IRX9 | |
| Tuxedo Sirius 16 Gen 1 | |
| Moyenne de la classe Gaming (1275 - 2660, n=110, 2 dernières années) | |
| CrossMark / Responsiveness | |
| Asus ROG Strix G16 G615 | |
| Tuxedo Sirius 16 Gen 1 | |
| SCHENKER XMG Pro 16 (E25) | |
| Moyenne Intel Core Ultra 9 275HX, Nvidia GeForce RTX 5070 Ti Laptop (n=1) | |
| Lenovo Legion Pro 5 16IRX9 | |
| SCHENKER XMG Pro 16 Studio (Mid 24) | |
| Moyenne de la classe Gaming (1030 - 2330, n=110, 2 dernières années) | |
| Lenovo Legion Pro 7i 16 Gen 10 | |
| WebXPRT 3 / Overall | |
| SCHENKER XMG Pro 16 (E25) | |
| Moyenne Intel Core Ultra 9 275HX, Nvidia GeForce RTX 5070 Ti Laptop (n=1) | |
| Lenovo Legion Pro 7i 16 Gen 10 | |
| Asus ROG Strix G16 G615 | |
| Lenovo Legion Pro 5 16IRX9 | |
| SCHENKER XMG Pro 16 Studio (Mid 24) | |
| Moyenne de la classe Gaming (215 - 480, n=123, 2 dernières années) | |
| WebXPRT 4 / Overall | |
| SCHENKER XMG Pro 16 (E25) | |
| Moyenne Intel Core Ultra 9 275HX, Nvidia GeForce RTX 5070 Ti Laptop (n=1) | |
| Asus ROG Strix G16 G615 | |
| Lenovo Legion Pro 7i 16 Gen 10 | |
| SCHENKER XMG Pro 16 Studio (Mid 24) | |
| Lenovo Legion Pro 5 16IRX9 | |
| Moyenne de la classe Gaming (176.4 - 341, n=109, 2 dernières années) | |
| Tuxedo Sirius 16 Gen 1 | |
| Mozilla Kraken 1.1 / Total | |
| Moyenne de la classe Gaming (404 - 674, n=134, 2 dernières années) | |
| Tuxedo Sirius 16 Gen 1 | |
| SCHENKER XMG Pro 16 Studio (Mid 24) | |
| Lenovo Legion Pro 5 16IRX9 | |
| Lenovo Legion Pro 7i 16 Gen 10 | |
| Asus ROG Strix G16 G615 | |
| SCHENKER XMG Pro 16 (E25) | |
| Moyenne Intel Core Ultra 9 275HX, Nvidia GeForce RTX 5070 Ti Laptop (n=1) | |
* ... Moindre est la valeur, meilleures sont les performances
| PCMark 10 Score | 8550 points | |
Aide | ||
| AIDA64 / Memory Copy | |
| Asus ROG Strix G16 G615 | |
| SCHENKER XMG Pro 16 (E25) | |
| Lenovo Legion Pro 7i 16 Gen 10 | |
| Moyenne Intel Core Ultra 9 275HX (74558 - 86549, n=8) | |
| Lenovo Legion Pro 5 16IRX9 | |
| SCHENKER XMG Pro 16 Studio (Mid 24) | |
| Tuxedo Sirius 16 Gen 1 | |
| Moyenne de la classe Gaming (21750 - 97515, n=143, 2 dernières années) | |
| AIDA64 / Memory Read | |
| SCHENKER XMG Pro 16 (E25) | |
| Lenovo Legion Pro 7i 16 Gen 10 | |
| Moyenne Intel Core Ultra 9 275HX (74094 - 97040, n=8) | |
| Lenovo Legion Pro 5 16IRX9 | |
| SCHENKER XMG Pro 16 Studio (Mid 24) | |
| Asus ROG Strix G16 G615 | |
| Moyenne de la classe Gaming (22956 - 102937, n=143, 2 dernières années) | |
| Tuxedo Sirius 16 Gen 1 | |
| AIDA64 / Memory Write | |
| Tuxedo Sirius 16 Gen 1 | |
| Lenovo Legion Pro 7i 16 Gen 10 | |
| SCHENKER XMG Pro 16 (E25) | |
| Moyenne Intel Core Ultra 9 275HX (72929 - 84581, n=8) | |
| Lenovo Legion Pro 5 16IRX9 | |
| Asus ROG Strix G16 G615 | |
| SCHENKER XMG Pro 16 Studio (Mid 24) | |
| Moyenne de la classe Gaming (22297 - 108954, n=143, 2 dernières années) | |
| AIDA64 / Memory Latency | |
| Moyenne Intel Core Ultra 9 275HX (105.8 - 125.1, n=8) | |
| Asus ROG Strix G16 G615 | |
| Lenovo Legion Pro 7i 16 Gen 10 | |
| SCHENKER XMG Pro 16 (E25) | |
| Moyenne de la classe Gaming (59.5 - 259, n=143, 2 dernières années) | |
| Tuxedo Sirius 16 Gen 1 | |
| SCHENKER XMG Pro 16 Studio (Mid 24) | |
| Lenovo Legion Pro 5 16IRX9 | |
* ... Moindre est la valeur, meilleures sont les performances
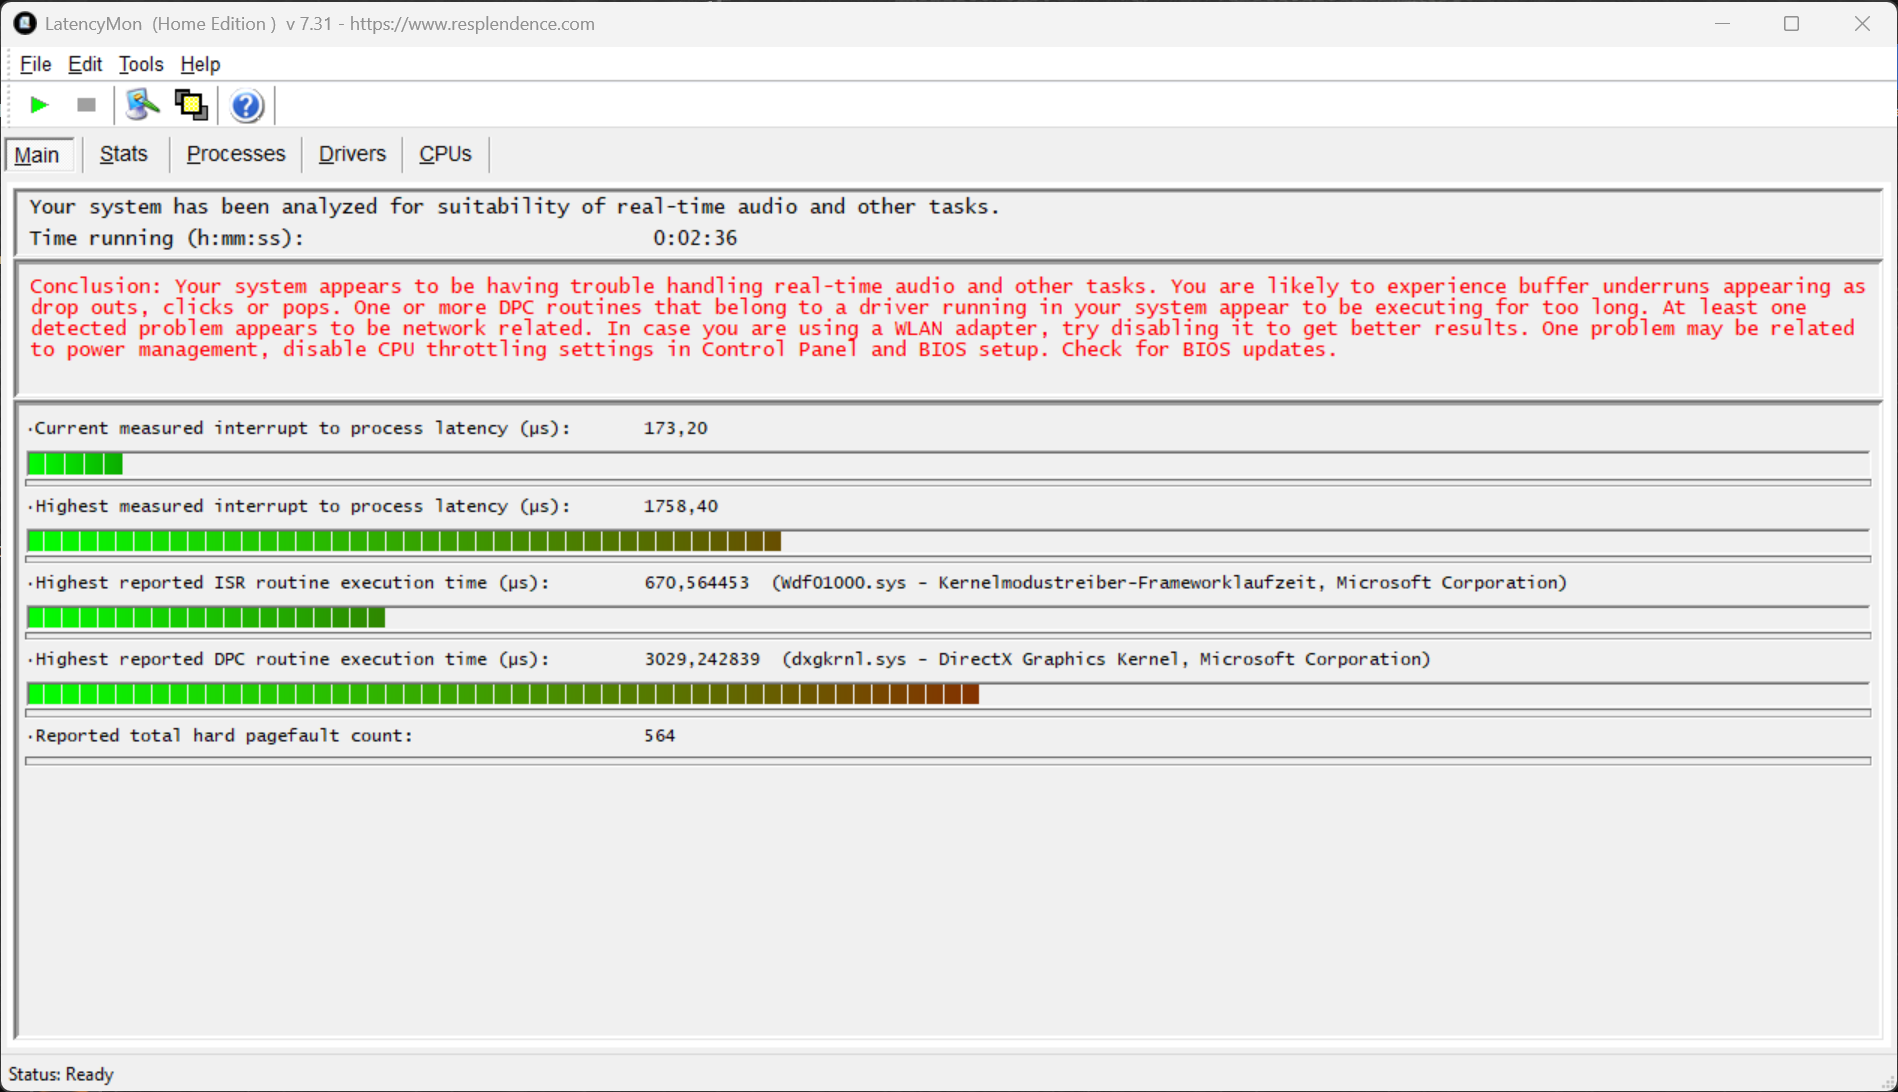
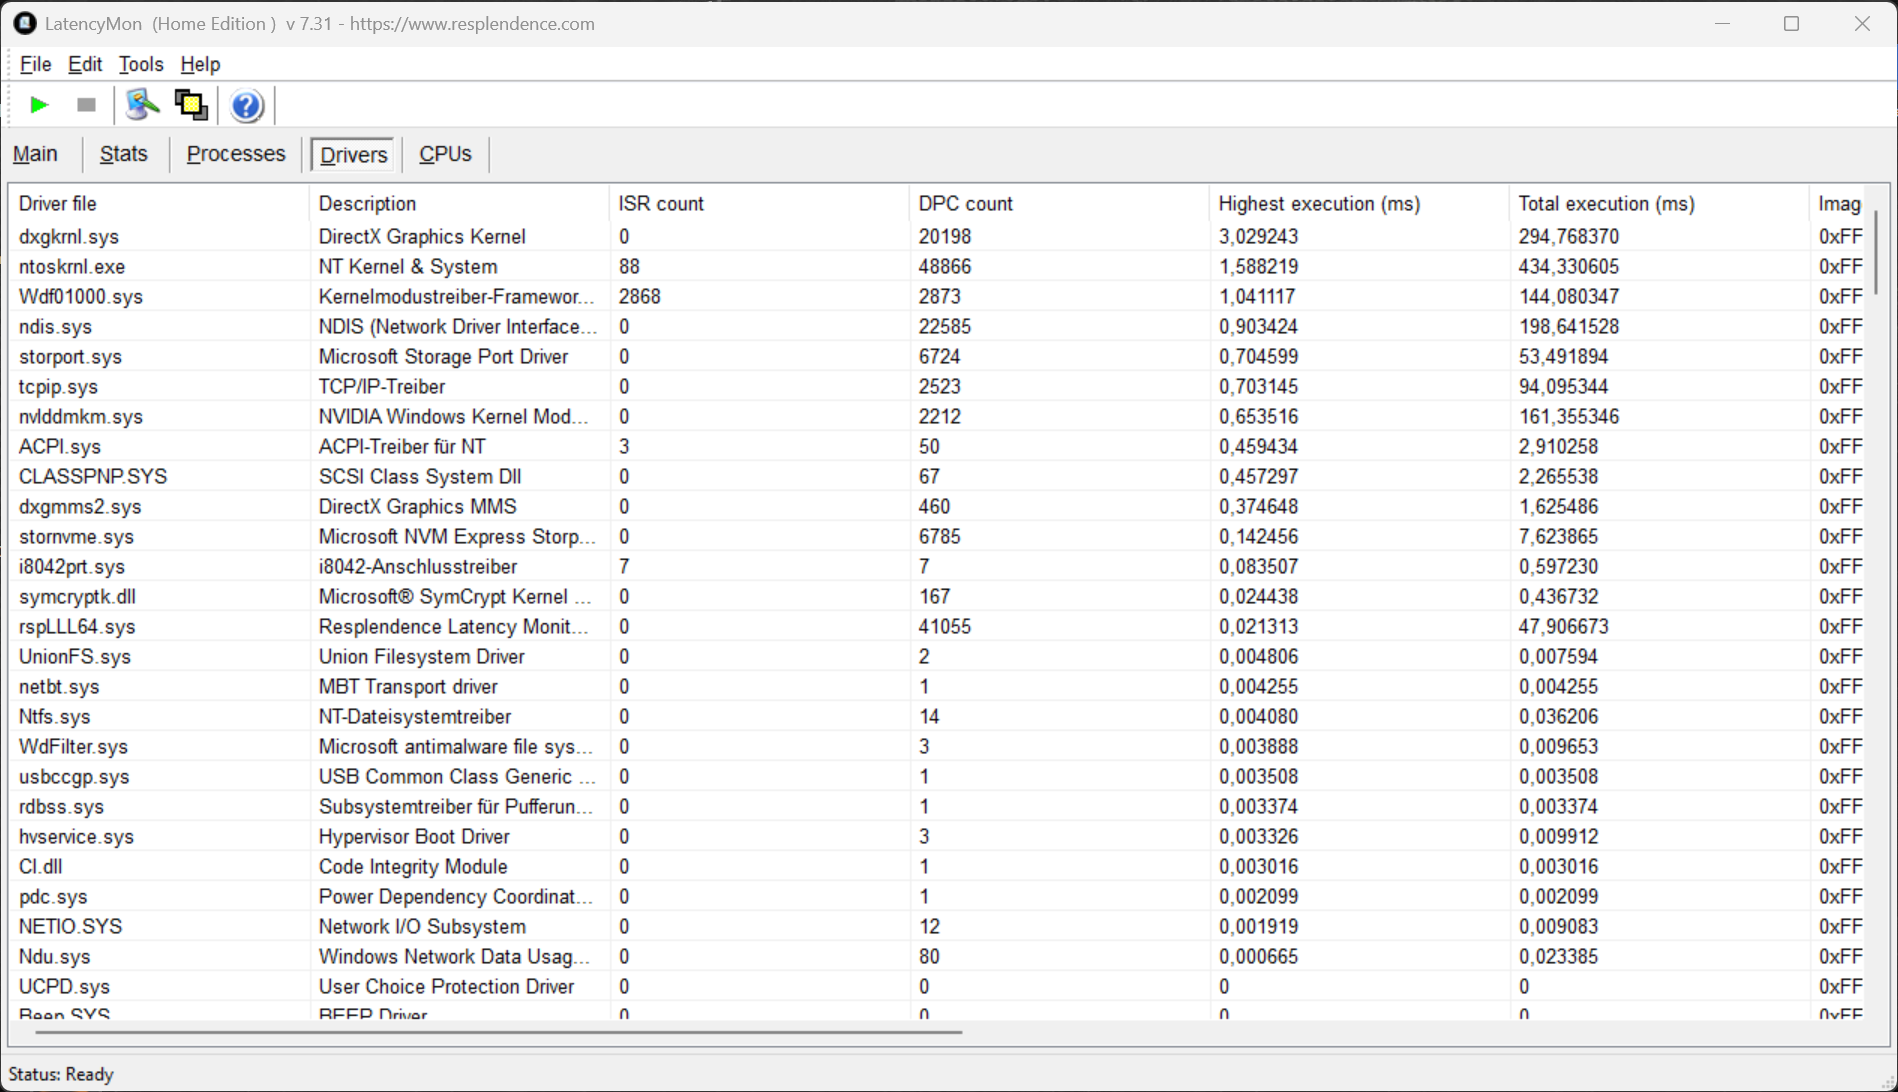
Latences DPC
Lors de notre test de latence (surf sur le web, lecture YouTube 4K, charge CPU), l'appareil de test avec la version actuelle du BIOS a montré de légères limitations lors de l'utilisation d'applications audio en temps réel.
| DPC Latencies / LatencyMon - interrupt to process latency (max), Web, Youtube, Prime95 | |
| SCHENKER XMG Pro 16 Studio (Mid 24) | |
| SCHENKER XMG Pro 16 (E25) | |
| Asus ROG Strix G16 G615 | |
| Lenovo Legion Pro 5 16IRX9 | |
| Lenovo Legion Pro 7i 16 Gen 10 | |
* ... Moindre est la valeur, meilleures sont les performances
Dispositif de stockage
Si vous configurez le XMG Pro 16 avec le Core Ultra 9 275HX, l'un de ses deux emplacements M.2 prend déjà en charge la connexion rapide PCIe 5.0. Notre appareil de test est équipé d'un SSD 9100 de Samsung (1 TB, 868 GB disponibles pour l'utilisateur). Ses taux de transfert ont été excellents lors de notre test avec un pic de plus de 10 GB/s et, surtout, ses performances sont restées globalement stables même en cas de charge prolongée (~10-12 GB/s).

* ... Moindre est la valeur, meilleures sont les performances
Reading continuous performance: DiskSpd Read Loop, Queue Depth 8
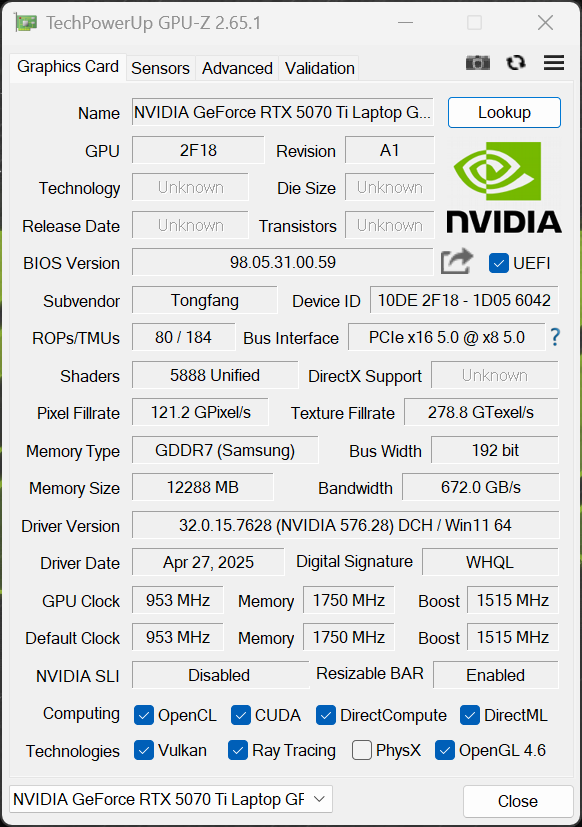
Carte graphique
Le XMG Pro 16 (E25) utilise exclusivement la nouvelle technologie Nvidia GeForce RTX 5070 Ti Laptop avec 12 Go de VRAM. Il s'agit de la variante la plus rapide avec un TGP de 140 watts (115 watts + 25 watts Dynamic Boost). Comme nous l'avons déjà vu dans notre analyse du nouveau GPU Blackwellblackwell, la RTX 5070 Ti Laptop bénéficie également de cette limite de puissance élevée dans les jeux, contrairement à l'ancienne RTX 4070 Laptop. La commutation graphique s'effectue via la technologie Optimus normale, c'est-à-dire sans Advanced Optimus. Bien qu'un commutateur MUX soit installé, le système doit être redémarré pour désactiver l'iGPU.
Nous avons déjà présenté des benchmarks complets dans notre analyse et en résumé, la nouvelle RTX 5070 Ti Laptop est à peu près au même niveau que l'ancienne Ordinateur portable RTX 4080. Le nouveau Pro 16 avait une avance d'environ 40% sur son prédécesseur dans les tests synthétiques et d'environ 20% dans nos tests de jeu standard 1080p. Dans sa résolution native, cependant, son avance est encore plus grande. Dans l'ensemble, vous pouvez vous attendre à jouer à tous les jeux modernes de manière fluide avec des détails élevés ; vous n'aurez qu'à recourir à l'upscaling avec le ray tracing/path tracing complet, que nous avons également montré ci-dessous.
| 3DMark Performance Rating - Percent | |
| Lenovo Legion Pro 7i 16 Gen 10 -1! | |
| Asus ROG Strix G16 G615 | |
| SCHENKER XMG Pro 16 (E25) | |
| Moyenne Nvidia GeForce RTX 5070 Ti Laptop | |
| Moyenne de la classe Gaming | |
| Lenovo Legion Pro 5 16IRX9 -1! | |
| SCHENKER XMG Pro 16 Studio (Mid 24) -1! | |
| Tuxedo Sirius 16 Gen 1 -3! | |
| 3DMark 11 Performance | 45656 points | |
| 3DMark Fire Strike Score | 35805 points | |
| 3DMark Time Spy Score | 17078 points | |
| 3DMark Steel Nomad Score | 4064 points | |
| 3DMark Steel Nomad Light Score | 17745 points | |
| 3DMark Steel Nomad Light Unlimited Score | 18056 points | |
Aide | ||
| Blender / v3.3 Classroom OPTIX/RTX | |
| SCHENKER XMG Pro 16 Studio (Mid 24) | |
| Moyenne de la classe Gaming (9.9 - 95, n=136, 2 dernières années) | |
| Lenovo Legion Pro 5 16IRX9 | |
| Moyenne Nvidia GeForce RTX 5070 Ti Laptop (14.1 - 15, n=2) | |
| SCHENKER XMG Pro 16 (E25) | |
| Lenovo Legion Pro 7i 16 Gen 10 | |
| Asus ROG Strix G16 G615 | |
| Blender / v3.3 Classroom CUDA | |
| Moyenne de la classe Gaming (15 - 110, n=137, 2 dernières années) | |
| SCHENKER XMG Pro 16 Studio (Mid 24) | |
| Lenovo Legion Pro 5 16IRX9 | |
| SCHENKER XMG Pro 16 (E25) | |
| Moyenne Nvidia GeForce RTX 5070 Ti Laptop (24 - 25.3, n=2) | |
| Asus ROG Strix G16 G615 | |
| Lenovo Legion Pro 7i 16 Gen 10 | |
| Blender / v3.3 Classroom CPU | |
| Moyenne de la classe Gaming (122 - 962, n=143, 2 dernières années) | |
| SCHENKER XMG Pro 16 Studio (Mid 24) | |
| Lenovo Legion Pro 5 16IRX9 | |
| Lenovo Legion Pro 7i 16 Gen 10 | |
| SCHENKER XMG Pro 16 (E25) | |
| Asus ROG Strix G16 G615 | |
| Moyenne Nvidia GeForce RTX 5070 Ti Laptop (122 - 147, n=2) | |
* ... Moindre est la valeur, meilleures sont les performances
| Setting | Alan Wake 2 (High/Ultra + PT) | Cyberpunk 2077 Phantom Liberty (RT Overdrive) |
|---|---|---|
| Qualité native | 23.5fps | 18fps |
| Qualité DLSS | 35.2fps | 35.2fps |
| DLSS Performance | 45.7fps | 52.1fps |
| DLSS Quality MFG x2 | 75.3fps | 62.8fps |
| DLSS Quality MFG x4 | 124.3fps | 111.1fps |
| Performance Rating - Percent | |
| Lenovo Legion Pro 7i 16 Gen 10 -1! | |
| Asus ROG Strix G16 G615 | |
| SCHENKER XMG Pro 16 (E25) | |
| Lenovo Legion Pro 5 16IRX9 | |
| SCHENKER XMG Pro 16 Studio (Mid 24) | |
| Moyenne de la classe Gaming | |
| Tuxedo Sirius 16 Gen 1 -3! | |
| Cyberpunk 2077 2.2 Phantom Liberty - 1920x1080 Ultra Preset (FSR off) | |
| Lenovo Legion Pro 7i 16 Gen 10 | |
| Asus ROG Strix G16 G615 | |
| SCHENKER XMG Pro 16 (E25) | |
| Moyenne de la classe Gaming (6.76 - 158, n=99, 2 dernières années) | |
| Lenovo Legion Pro 5 16IRX9 | |
| SCHENKER XMG Pro 16 Studio (Mid 24) | |
| Tuxedo Sirius 16 Gen 1 | |
| Baldur's Gate 3 - 1920x1080 Ultra Preset AA:T | |
| Lenovo Legion Pro 7i 16 Gen 10 | |
| Asus ROG Strix G16 G615 | |
| SCHENKER XMG Pro 16 (E25) | |
| Lenovo Legion Pro 5 16IRX9 | |
| Moyenne de la classe Gaming (34.5 - 246, n=65, 2 dernières années) | |
| SCHENKER XMG Pro 16 Studio (Mid 24) | |
| Tuxedo Sirius 16 Gen 1 | |
| GTA V - 1920x1080 Highest Settings possible AA:4xMSAA + FX AF:16x | |
| Asus ROG Strix G16 G615 | |
| SCHENKER XMG Pro 16 (E25) | |
| Lenovo Legion Pro 5 16IRX9 | |
| SCHENKER XMG Pro 16 Studio (Mid 24) | |
| Moyenne de la classe Gaming (12.1 - 168.2, n=123, 2 dernières années) | |
| Final Fantasy XV Benchmark - 1920x1080 High Quality | |
| Lenovo Legion Pro 7i 16 Gen 10 | |
| Asus ROG Strix G16 G615 | |
| SCHENKER XMG Pro 16 (E25) | |
| Lenovo Legion Pro 5 16IRX9 | |
| Moyenne de la classe Gaming (19.2 - 210, n=139, 2 dernières années) | |
| SCHENKER XMG Pro 16 Studio (Mid 24) | |
| Tuxedo Sirius 16 Gen 1 | |
| Strange Brigade - 1920x1080 ultra AA:ultra AF:16 | |
| Lenovo Legion Pro 7i 16 Gen 10 | |
| Asus ROG Strix G16 G615 | |
| Moyenne de la classe Gaming (38.9 - 434, n=135, 2 dernières années) | |
| Lenovo Legion Pro 5 16IRX9 | |
| SCHENKER XMG Pro 16 Studio (Mid 24) | |
| Tuxedo Sirius 16 Gen 1 | |
| SCHENKER XMG Pro 16 (E25) | |
| Dota 2 Reborn - 1920x1080 ultra (3/3) best looking | |
| Lenovo Legion Pro 7i 16 Gen 10 | |
| Lenovo Legion Pro 5 16IRX9 | |
| Asus ROG Strix G16 G615 | |
| SCHENKER XMG Pro 16 (E25) | |
| SCHENKER XMG Pro 16 Studio (Mid 24) | |
| Moyenne de la classe Gaming (65.1 - 220, n=142, 2 dernières années) | |
Cyberpunk 2077 ultra FPS diagram
| Bas | Moyen | Élevé | Ultra | QHD DLSS | QHD | |
|---|---|---|---|---|---|---|
| GTA V (2015) | 161 | 147.3 | ||||
| Dota 2 Reborn (2015) | 223 | 199.7 | 189.3 | 174.8 | ||
| Final Fantasy XV Benchmark (2018) | 217 | 183.4 | 147.8 | 125.2 | ||
| X-Plane 11.11 (2018) | 156.9 | 144.1 | 117.5 | |||
| Strange Brigade (2018) | 392 | 201 | 156.5 | 136.4 | 103.8 | |
| Baldur's Gate 3 (2023) | 157 | 109.2 | ||||
| Cyberpunk 2077 2.2 Phantom Liberty (2023) | 188.6 | 169.2 | 144.6 | 129.9 | 91.6 | 81.6 |
| Alan Wake 2 (2023) | 108.9 | 103.5 | 96 | 64.5 | ||
| F1 24 (2024) | 250 | 108 | 71.2 | |||
| Call of Duty Black Ops 6 (2024) | 152 | 142 | 100 | 94 | 65 |
Émissions et énergie
Émissions sonores
Les ventilateurs du XMG Pro 16 sont toujours actifs, mais le bruit qu'ils produisent est à peine audible au ralenti et sous faible charge (25 dB(A)). Vous pouvez également activer un mode passif dans le BIOS, mais dans ce cas, les ventilateurs se mettent souvent en marche par à-coups, ce qui est plus bruyant. L'appareil reste très silencieux au quotidien, surtout en mode équilibré, mais ses limites de puissance élevées font des ravages dans les jeux et à pleine charge. Selon le mode, les valeurs ont varié entre 45 et 53 dB(A) lors de notre test, c'est pourquoi nous vous recommandons d'utiliser un casque lorsque vous jouez. Aucun autre bruit électronique n'a été perçu sur notre appareil de test.
Degré de la nuisance sonore
| Au repos |
| 25 / 25 / 25 dB(A) |
| Fortement sollicité |
| 45.5 / 53.3 dB(A) |
 | ||
30 dB silencieux 40 dB(A) audible 50 dB(A) bruyant |
||
min: | ||
| SCHENKER XMG Pro 16 (E25) GeForce RTX 5070 Ti Laptop, Ultra 9 275HX, Samsung 9100 Pro 1 TB | SCHENKER XMG Pro 16 Studio (Mid 24) NVIDIA GeForce RTX 4070 Laptop GPU, i9-14900HX, Samsung 990 Pro 1 TB | Asus ROG Strix G16 G615 GeForce RTX 5080 Laptop, Ultra 9 275HX, Micron 2500 1TB MTFDKBA1T0QGN | Tuxedo Sirius 16 Gen 1 Radeon RX 7600M XT, R7 7840HS, Samsung SSD 980 Pro 1TB MZ-V8P1T0BW | Lenovo Legion Pro 5 16IRX9 NVIDIA GeForce RTX 4070 Laptop GPU, i9-14900HX, Samsung PM9A1 MZVL21T0HCLR | Lenovo Legion Pro 7i 16 Gen 10 GeForce RTX 5080 Laptop, Ultra 9 275HX, SK Hynix HFS001TEJ9X115N | |
|---|---|---|---|---|---|---|
| Noise | -13% | -5% | -5% | -3% | 7% | |
| arrêt / environnement * | 23.3 | 25 -7% | 24 -3% | 25.1 -8% | 23.9 -3% | 22.9 2% |
| Idle Minimum * | 25 | 28 -12% | 24 4% | 25.1 -0% | 24.3 3% | 22.9 8% |
| Idle Average * | 25 | 31 -24% | 30.1 -20% | 30.4 -22% | 24.3 3% | 22.9 8% |
| Idle Maximum * | 25 | 35 -40% | 30.1 -20% | 30.4 -22% | 28.9 -16% | 26.3 -5% |
| Load Average * | 45.5 | 52 -14% | 41.1 10% | 35.2 23% | 45.8 -1% | 27.8 39% |
| Cyberpunk 2077 ultra * | 53.3 | 53 1% | 54.2 -2% | 54.2 -2% | ||
| Load Maximum * | 53.3 | 52 2% | 54.2 -2% | 54.2 -2% | 56.6 -6% | 53.9 -1% |
| Witcher 3 ultra * | 51 |
* ... Moindre est la valeur, meilleures sont les performances
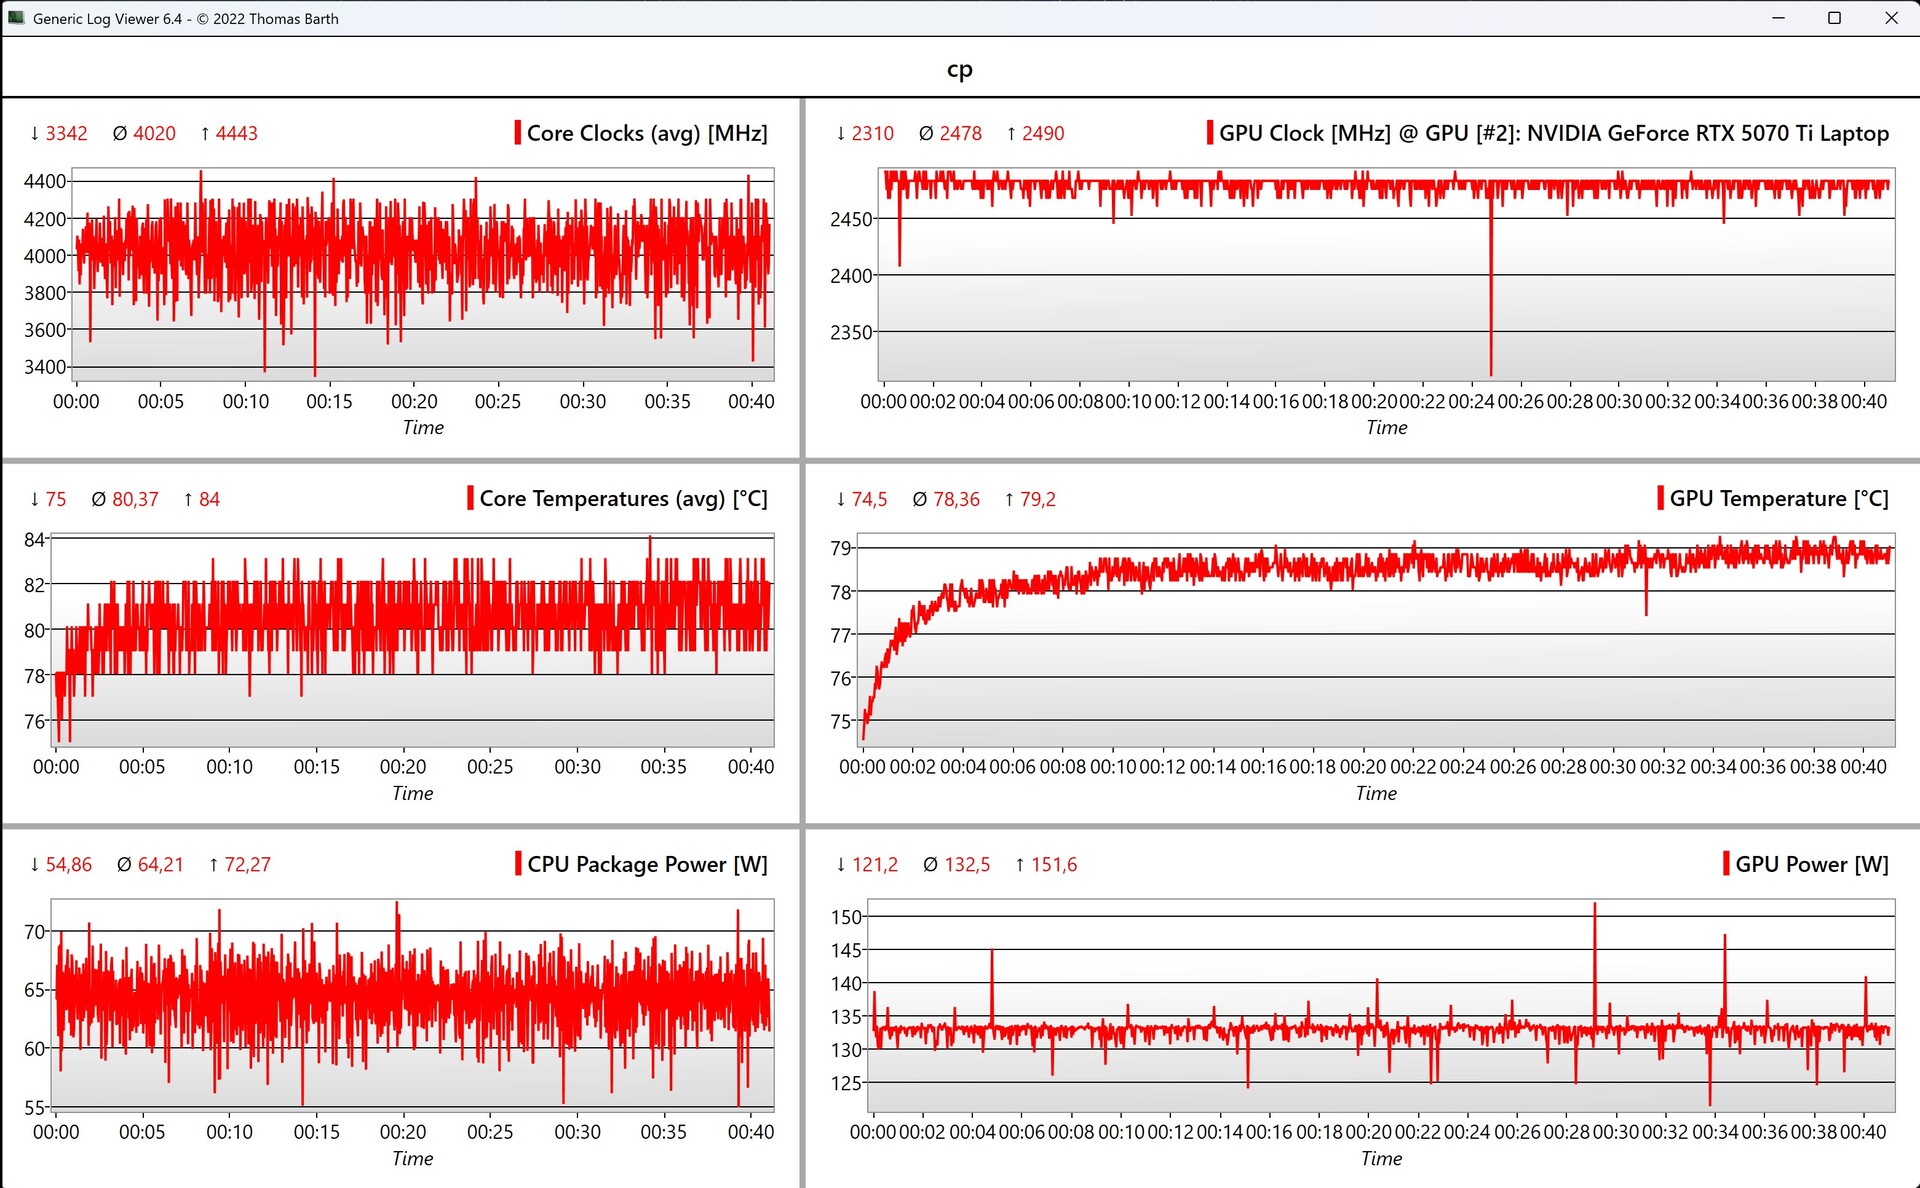
Température
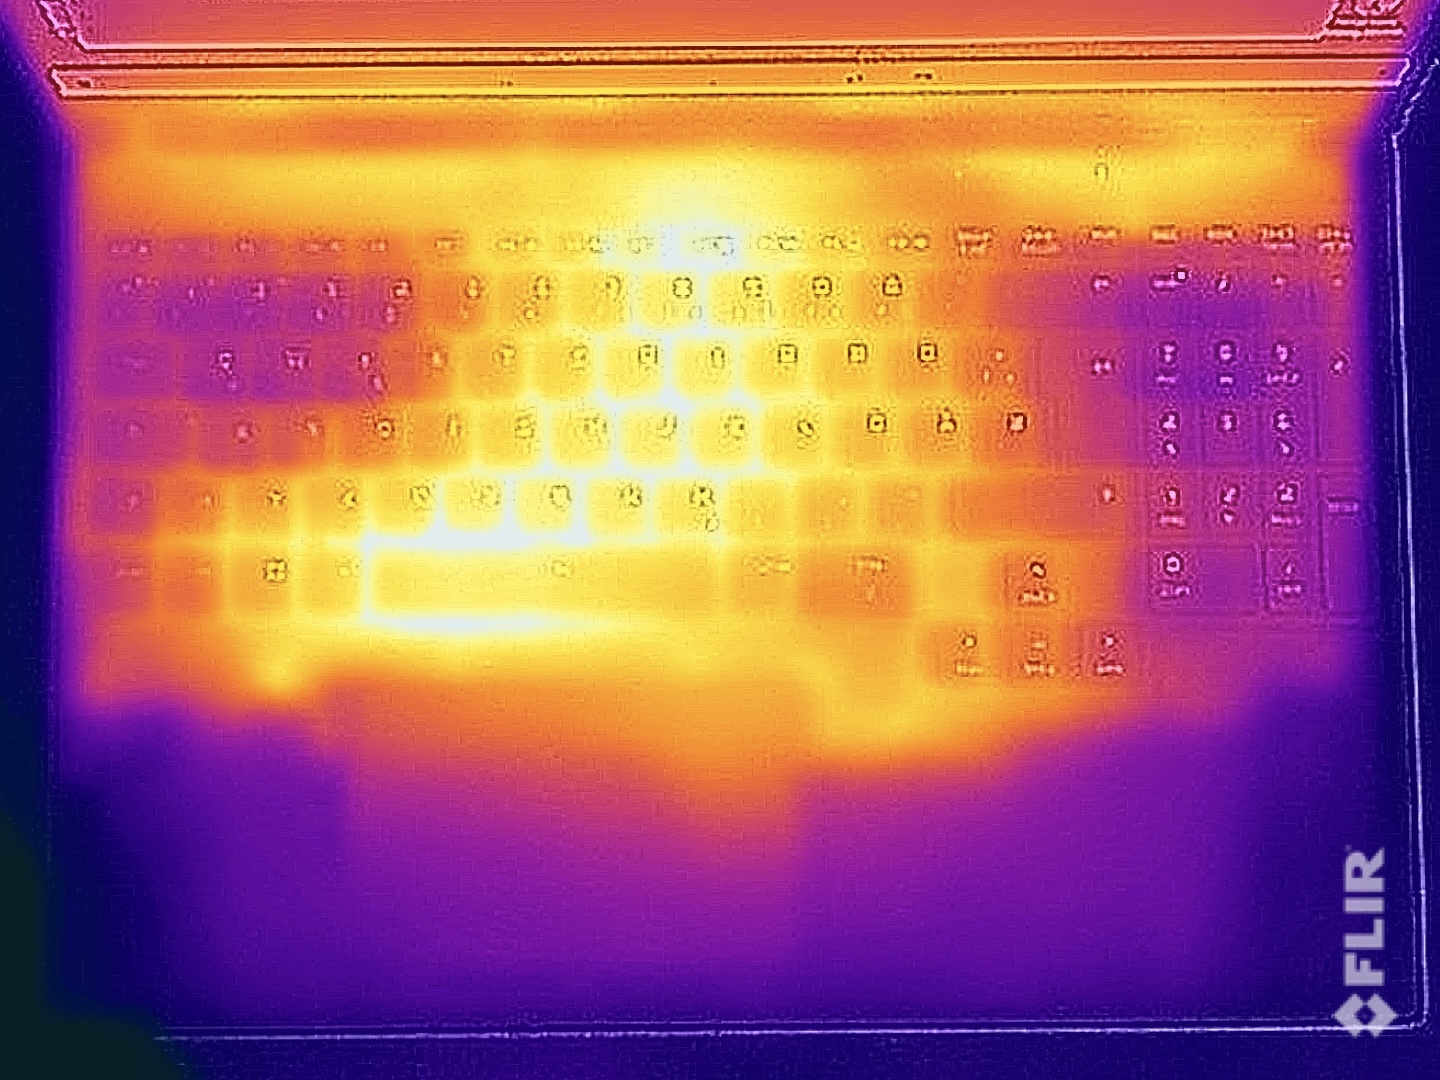
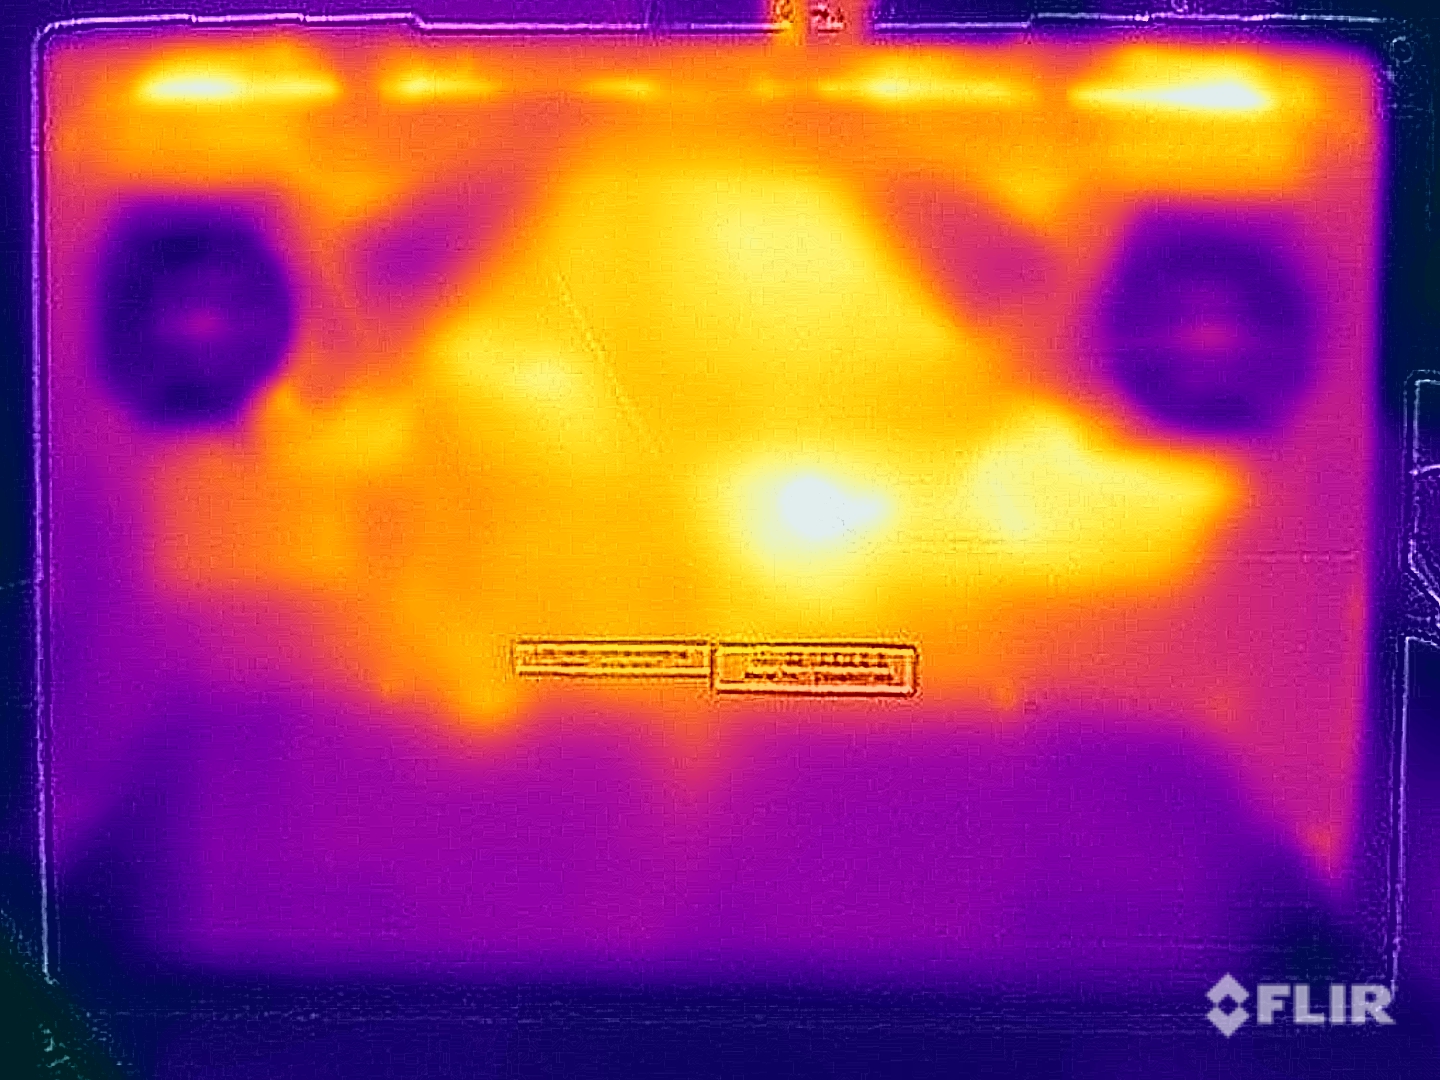
Les surfaces de l'ordinateur portable restent très froides en mode veille et lors de tâches simples, mais on remarque une augmentation de la température en cas de charge élevée. Bien qu'il n'y ait pas eu de points critiques pendant notre test, plusieurs points de mesure ont dépassé la barre des 40 °C. Hormis des doigts légèrement chauds, nous n'avons constaté aucun problème lors de la frappe. Pendant le test de stress, le CPU/GPU s'est stabilisé à 60 et 140 watts respectivement, et le Pro 16 a pu refroidir en permanence ~200 watts au total.

(±) La température maximale du côté supérieur est de 43.2 °C / 110 F, par rapport à la moyenne de 40.4 °C / 105 F, allant de 21.2 à 68.8 °C pour la classe Gaming.
(-) Le fond chauffe jusqu'à un maximum de 46 °C / 115 F, contre une moyenne de 43.3 °C / 110 F
(+) En utilisation inactive, la température moyenne du côté supérieur est de 27 °C / 81 F, par rapport à la moyenne du dispositif de 33.9 °C / 93 F.
(-) 3: The average temperature for the upper side is 38.7 °C / 102 F, compared to the average of 33.9 °C / 93 F for the class Gaming.
(±) Les repose-poignets et le pavé tactile peuvent devenir très chauds au toucher, avec un maximum de 38.9 °C / 102# F.
(-) La température moyenne de la zone de l'appui-paume de dispositifs similaires était de 28.9 °C / 84 F (-10 °C / #-18 F).
| SCHENKER XMG Pro 16 (E25) Intel Core Ultra 9 275HX, Nvidia GeForce RTX 5070 Ti Laptop | SCHENKER XMG Pro 16 Studio (Mid 24) Intel Core i9-14900HX, NVIDIA GeForce RTX 4070 Laptop GPU | Asus ROG Strix G16 G615 Intel Core Ultra 9 275HX, Nvidia GeForce RTX 5080 Laptop | Tuxedo Sirius 16 Gen 1 AMD Ryzen 7 7840HS, AMD Radeon RX 7600M XT | Lenovo Legion Pro 5 16IRX9 Intel Core i9-14900HX, NVIDIA GeForce RTX 4070 Laptop GPU | Lenovo Legion Pro 7i 16 Gen 10 Intel Core Ultra 9 275HX, Nvidia GeForce RTX 5080 Laptop | |
|---|---|---|---|---|---|---|
| Heat | -1% | 24% | 11% | 12% | 20% | |
| Maximum Upper Side * | 43.2 | 51 -18% | 39.6 8% | 54.7 -27% | 43.8 -1% | 42.6 1% |
| Maximum Bottom * | 46 | 66 -43% | 49.7 -8% | 57.1 -24% | 55.4 -20% | 41.2 10% |
| Idle Upper Side * | 27.7 | 35 -26% | 26.3 5% | 25.8 7% | 32.8 -18% | 32.6 -18% |
| Idle Bottom * | 264 | 39 85% | 27.3 90% | 32 88% | 36 86% | 32.4 88% |
* ... Moindre est la valeur, meilleures sont les performances
Intervenants
Les deux haut-parleurs stéréo ne sont pas les meilleurs, car le son est relativement faible, tout comme celui de son prédécesseur prédécesseur.
SCHENKER XMG Pro 16 (E25) analyse audio
(±) | le niveau sonore du haut-parleur est moyen mais bon (79.2# dB)
Basses 100 - 315 Hz
(±) | basse réduite - en moyenne 14.2% inférieure à la médiane
(±) | la linéarité des basses est moyenne (10.6% delta à la fréquence précédente)
Médiums 400 - 2000 Hz
(±) | médiane supérieure - en moyenne 8.2% supérieure à la médiane
(±) | la linéarité des médiums est moyenne (9.9% delta à la fréquence précédente)
Aiguës 2 - 16 kHz
(+) | des sommets équilibrés - à seulement 3.8% de la médiane
(+) | les aigus sont linéaires (5.9% delta à la fréquence précédente)
Globalement 100 - 16 000 Hz
(±) | la linéarité du son global est moyenne (18.5% de différence avec la médiane)
Par rapport à la même classe
» 58% de tous les appareils testés de cette catégorie étaient meilleurs, 9% similaires, 33% pires
» Le meilleur avait un delta de 6%, la moyenne était de 18%, le pire était de 132%.
Par rapport à tous les appareils testés
» 39% de tous les appareils testés étaient meilleurs, 8% similaires, 53% pires
» Le meilleur avait un delta de 4%, la moyenne était de 24%, le pire était de 134%.
SCHENKER XMG Pro 16 Studio (Mid 24) analyse audio
(±) | le niveau sonore du haut-parleur est moyen mais bon (79# dB)
Basses 100 - 315 Hz
(-) | presque aucune basse - en moyenne 15.1% plus bas que la médiane
(±) | la linéarité des basses est moyenne (13.6% delta à la fréquence précédente)
Médiums 400 - 2000 Hz
(±) | médiane supérieure - en moyenne 5.3% supérieure à la médiane
(+) | les médiums sont linéaires (4.4% delta à la fréquence précédente)
Aiguës 2 - 16 kHz
(+) | des sommets équilibrés - à seulement 4.4% de la médiane
(+) | les aigus sont linéaires (4.9% delta à la fréquence précédente)
Globalement 100 - 16 000 Hz
(±) | la linéarité du son global est moyenne (17.7% de différence avec la médiane)
Par rapport à la même classe
» 50% de tous les appareils testés de cette catégorie étaient meilleurs, 10% similaires, 40% pires
» Le meilleur avait un delta de 6%, la moyenne était de 18%, le pire était de 132%.
Par rapport à tous les appareils testés
» 33% de tous les appareils testés étaient meilleurs, 8% similaires, 59% pires
» Le meilleur avait un delta de 4%, la moyenne était de 24%, le pire était de 134%.
Asus ROG Strix G16 G615 analyse audio
(+) | les haut-parleurs peuvent jouer relativement fort (82.2# dB)
Basses 100 - 315 Hz
(±) | basse réduite - en moyenne 7.5% inférieure à la médiane
(±) | la linéarité des basses est moyenne (7.4% delta à la fréquence précédente)
Médiums 400 - 2000 Hz
(+) | médiane équilibrée - seulement 2.9% de la médiane
(+) | les médiums sont linéaires (3.6% delta à la fréquence précédente)
Aiguës 2 - 16 kHz
(+) | des sommets équilibrés - à seulement 2.8% de la médiane
(±) | la linéarité des aigus est moyenne (8.3% delta à la fréquence précédente)
Globalement 100 - 16 000 Hz
(+) | le son global est linéaire (9.4% différence à la médiane)
Par rapport à la même classe
» 3% de tous les appareils testés de cette catégorie étaient meilleurs, 2% similaires, 95% pires
» Le meilleur avait un delta de 6%, la moyenne était de 18%, le pire était de 132%.
Par rapport à tous les appareils testés
» 3% de tous les appareils testés étaient meilleurs, 1% similaires, 96% pires
» Le meilleur avait un delta de 4%, la moyenne était de 24%, le pire était de 134%.
Tuxedo Sirius 16 Gen 1 analyse audio
(+) | les haut-parleurs peuvent jouer relativement fort (85# dB)
Basses 100 - 315 Hz
(±) | basse réduite - en moyenne 14.1% inférieure à la médiane
(±) | la linéarité des basses est moyenne (7.7% delta à la fréquence précédente)
Médiums 400 - 2000 Hz
(±) | médiane supérieure - en moyenne 6.8% supérieure à la médiane
(±) | la linéarité des médiums est moyenne (9.7% delta à la fréquence précédente)
Aiguës 2 - 16 kHz
(+) | des sommets équilibrés - à seulement 3.7% de la médiane
(±) | la linéarité des aigus est moyenne (7% delta à la fréquence précédente)
Globalement 100 - 16 000 Hz
(±) | la linéarité du son global est moyenne (16.4% de différence avec la médiane)
Par rapport à la même classe
» 40% de tous les appareils testés de cette catégorie étaient meilleurs, 6% similaires, 54% pires
» Le meilleur avait un delta de 6%, la moyenne était de 18%, le pire était de 132%.
Par rapport à tous les appareils testés
» 25% de tous les appareils testés étaient meilleurs, 6% similaires, 69% pires
» Le meilleur avait un delta de 4%, la moyenne était de 24%, le pire était de 134%.
Lenovo Legion Pro 5 16IRX9 analyse audio
(±) | le niveau sonore du haut-parleur est moyen mais bon (80.7# dB)
Basses 100 - 315 Hz
(-) | presque aucune basse - en moyenne 19% plus bas que la médiane
(±) | la linéarité des basses est moyenne (10.1% delta à la fréquence précédente)
Médiums 400 - 2000 Hz
(+) | médiane équilibrée - seulement 4.7% de la médiane
(+) | les médiums sont linéaires (5.7% delta à la fréquence précédente)
Aiguës 2 - 16 kHz
(+) | des sommets équilibrés - à seulement 3.3% de la médiane
(+) | les aigus sont linéaires (5.6% delta à la fréquence précédente)
Globalement 100 - 16 000 Hz
(±) | la linéarité du son global est moyenne (17.2% de différence avec la médiane)
Par rapport à la même classe
» 45% de tous les appareils testés de cette catégorie étaient meilleurs, 11% similaires, 43% pires
» Le meilleur avait un delta de 6%, la moyenne était de 18%, le pire était de 132%.
Par rapport à tous les appareils testés
» 29% de tous les appareils testés étaient meilleurs, 8% similaires, 63% pires
» Le meilleur avait un delta de 4%, la moyenne était de 24%, le pire était de 134%.
Lenovo Legion Pro 7i 16 Gen 10 analyse audio
(±) | le niveau sonore du haut-parleur est moyen mais bon (81.4# dB)
Basses 100 - 315 Hz
(±) | basse réduite - en moyenne 7.6% inférieure à la médiane
(±) | la linéarité des basses est moyenne (9.4% delta à la fréquence précédente)
Médiums 400 - 2000 Hz
(+) | médiane équilibrée - seulement 4.1% de la médiane
(+) | les médiums sont linéaires (4.8% delta à la fréquence précédente)
Aiguës 2 - 16 kHz
(+) | des sommets équilibrés - à seulement 1.9% de la médiane
(+) | les aigus sont linéaires (4.8% delta à la fréquence précédente)
Globalement 100 - 16 000 Hz
(+) | le son global est linéaire (9.4% différence à la médiane)
Par rapport à la même classe
» 3% de tous les appareils testés de cette catégorie étaient meilleurs, 2% similaires, 95% pires
» Le meilleur avait un delta de 6%, la moyenne était de 18%, le pire était de 132%.
Par rapport à tous les appareils testés
» 3% de tous les appareils testés étaient meilleurs, 1% similaires, 96% pires
» Le meilleur avait un delta de 4%, la moyenne était de 24%, le pire était de 134%.
Consommation électrique
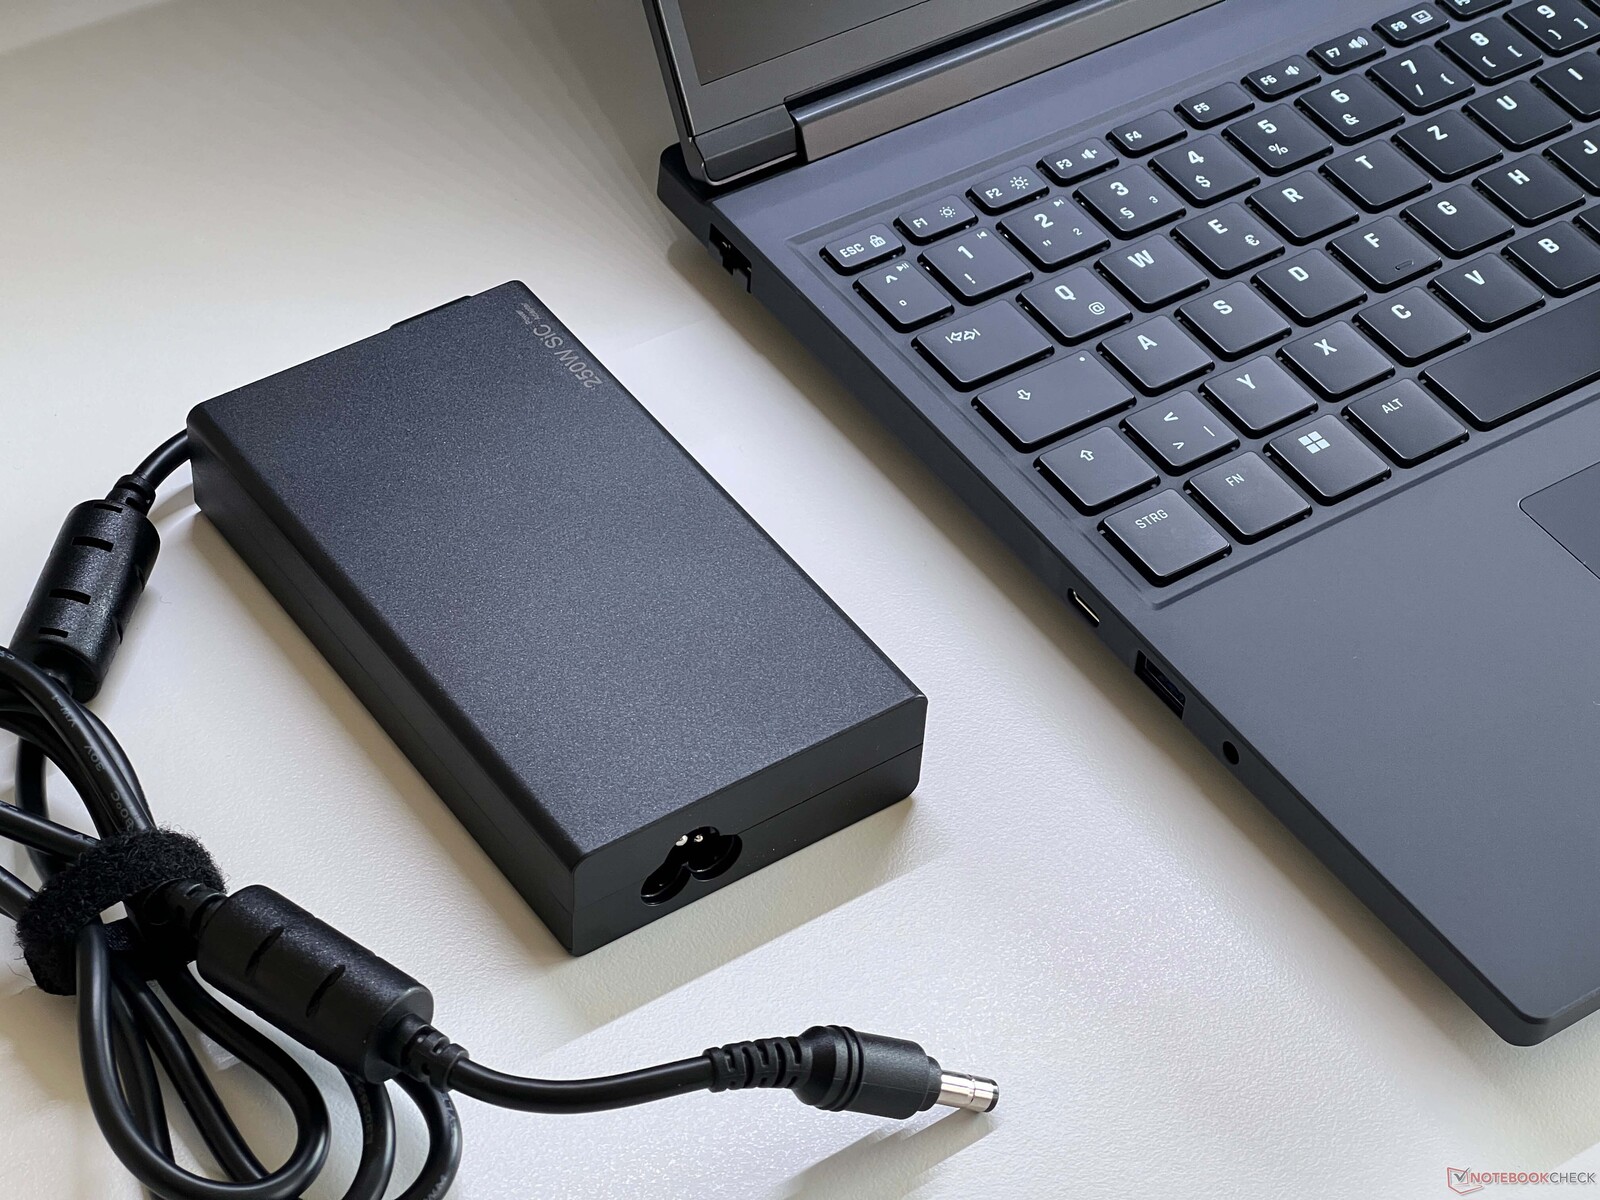
Le Pro 16 est relativement efficace en mode veille, mais ses valeurs sont conformes aux attentes en charge. Lors des jeux, vous pouvez compter sur une puissance de 240 à 250 watts et pendant le test de stress, nous avons brièvement vu jusqu'à 290 watts avant que cette valeur ne se stabilise rapidement autour de 240 watts. Comme le bloc d'alimentation de 250 watts fourni (qui est très compact) peut fournir les 290 watts, il est tout à fait suffisant en termes de taille. Cependant, nous avons mesuré une consommation en veille de 2,1 watts, ce qui est trop élevé.
| Éteint/en veille | |
| Au repos | |
| Fortement sollicité |
|
Légende:
min: | |
| SCHENKER XMG Pro 16 (E25) Ultra 9 275HX, GeForce RTX 5070 Ti Laptop, Samsung 9100 Pro 1 TB, IPS, 2560x1600, 16" | SCHENKER XMG Pro 16 Studio (Mid 24) i9-14900HX, NVIDIA GeForce RTX 4070 Laptop GPU, Samsung 990 Pro 1 TB, IPS, 2560x1600, 16" | Asus ROG Strix G16 G615 Ultra 9 275HX, GeForce RTX 5080 Laptop, Micron 2500 1TB MTFDKBA1T0QGN, IPS, 2560x1600, 16" | Tuxedo Sirius 16 Gen 1 R7 7840HS, Radeon RX 7600M XT, Samsung SSD 980 Pro 1TB MZ-V8P1T0BW, IPS, 2560x1440, 16.1" | Lenovo Legion Pro 5 16IRX9 i9-14900HX, NVIDIA GeForce RTX 4070 Laptop GPU, Samsung PM9A1 MZVL21T0HCLR, IPS, 2560x1600, 16" | Lenovo Legion Pro 7i 16 Gen 10 Ultra 9 275HX, GeForce RTX 5080 Laptop, SK Hynix HFS001TEJ9X115N, OLED, 2560x1600, 16" | |
|---|---|---|---|---|---|---|
| Power Consumption | -51% | -12% | -13% | -18% | -78% | |
| Idle Minimum * | 11.7 | 31 -165% | 10.8 8% | 15.9 -36% | 12.5 -7% | 28.5 -144% |
| Idle Average * | 16.6 | 33 -99% | 17.7 -7% | 20.1 -21% | 24.6 -48% | 38.8 -134% |
| Idle Maximum * | 17.1 | 41 -140% | 18.8 -10% | 23.5 -37% | 24.8 -45% | 45.6 -167% |
| Load Average * | 122.4 | 114 7% | 139.4 -14% | 111.7 9% | 109.6 10% | 132.2 -8% |
| Cyberpunk 2077 ultra * | 245 | 218 11% | 295 -20% | 318 -30% | ||
| Cyberpunk 2077 ultra external monitor * | 241 | 196.8 18% | 291 -21% | 319 -32% | ||
| Load Maximum * | 291.5 | 250 14% | 359.3 -23% | 240 18% | 284.9 2% | 384 -32% |
| Witcher 3 ultra * | 228 | 218 |
* ... Moindre est la valeur, meilleures sont les performances
Power consumption Cyberpunk / stress test
Power consumption with external monitor
Délais d'exécution
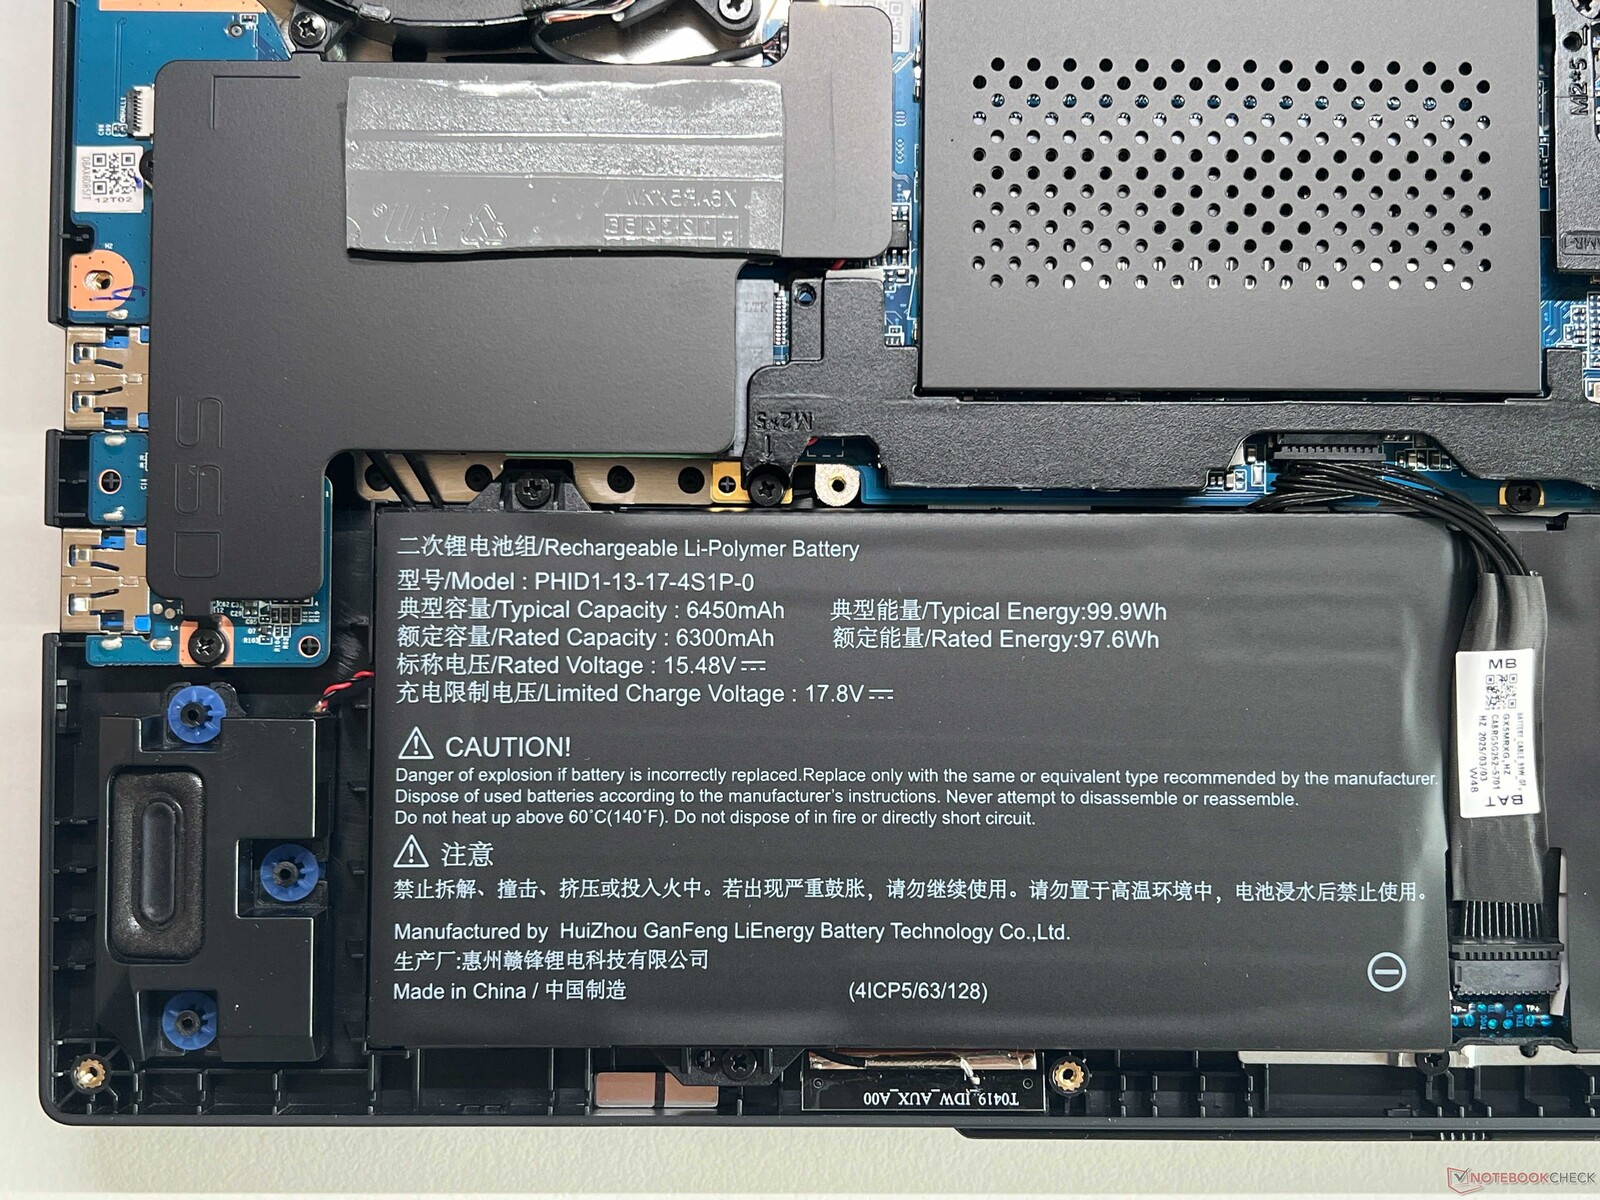
À une luminosité de 150 cd/m² (57 % de la luminosité maximale de notre appareil de test), la batterie de 99,8 Wh de l'ordinateur portable a tenu un peu plus de 9 heures lors de notre test WLAN à 60 Hz, et un peu plus de 6 heures à pleine luminosité. Ces valeurs sont nettement supérieures à celles du modèle précédent (73 Wh). Un processus de charge complet avec l'appareil allumé prend 116 minutes (80 % après une heure).
| Battery Runtime | |
| WiFi Websurfing | |
| SCHENKER XMG Pro 16 (E25) | |
| Asus ROG Strix G16 G615 | |
| Tuxedo Sirius 16 Gen 1 | |
| Moyenne de la classe Gaming (85 - 889, n=120, 2 dernières années) | |
| SCHENKER XMG Pro 16 Studio (Mid 24) | |
| Lenovo Legion Pro 7i 16 Gen 10 | |
| Lenovo Legion Pro 5 16IRX9 | |
| WiFi Websurfing max. Brightness | |
| Asus ROG Strix G16 G615 | |
| SCHENKER XMG Pro 16 (E25) | |
| Moyenne de la classe Gaming (164 - 534, n=33, 2 dernières années) | |
Notebookcheck évaluation totale
SCHENKER XMG Pro 16 (E25)
- 05/05/2025 v8
Andreas Osthoff
 Total Sustainability Score:
 Comparaison des alternatives possibles
Transparency
La sélection des appareils à examiner est effectuée par notre équipe éditoriale. L'échantillon de test a été prêté à l'auteur par le fabricant ou le détaillant pour les besoins de cet examen. Le prêteur n'a pas eu d'influence sur cette évaluation et le fabricant n'a pas reçu de copie de cette évaluation avant sa publication. Il n'y avait aucune obligation de publier cet article. Nous n'acceptons jamais de compensation ou de paiement en échange de nos commentaires. En tant que média indépendant, Notebookcheck n'est pas soumis à l'autorité des fabricants, des détaillants ou des éditeurs.
Voici comment Notebookcheck teste
Chaque année, Notebookcheck examine de manière indépendante des centaines d'ordinateurs portables et de smartphones en utilisant des procédures standardisées afin de garantir que tous les résultats sont comparables. Nous avons continuellement développé nos méthodes de test depuis environ 20 ans et avons établi des normes industrielles dans le processus. Dans nos laboratoires de test, des équipements de mesure de haute qualité sont utilisés par des techniciens et des rédacteurs expérimentés. Ces tests impliquent un processus de validation en plusieurs étapes. Notre système d'évaluation complexe repose sur des centaines de mesures et de points de référence bien fondés, ce qui garantit l'objectivité.
