Test de l'Intel Core i7-14700K : proche du Core i9-13900K et du Ryzen 9 7950X3D pour 200 $ de moins

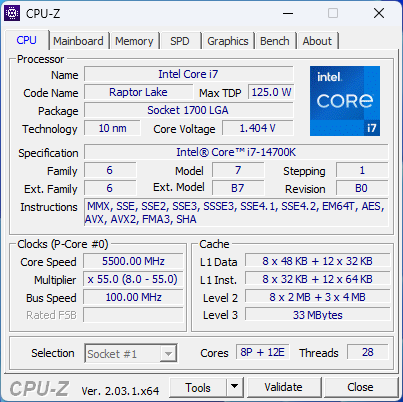
Intel 14e génération Raptor Lake-S Refresh d'Intel concerne principalement l'augmentation des horloges de boost, la prise en charge de profils XMP plus rapides et quelques améliorations en matière d'overclocking. L'architecture reste toutefois identique à celle des CPU Raptor Lake-S de 13e génération.
Nous avons déjà examiné les processeurs Core i5-14600K et Core i9-14900K mais l'une des séries qui sort du lot est celle des nouveaux Core i7.
La série Core i7 a traditionnellement connu une augmentation du nombre de cœurs E à chaque génération depuis Alder Lake. Avec 20 cœurs (8P + 12E) et 28 threads, les Core i7-14700K et Core i7-14700KF sont les seuls CPU de la 14e génération à bénéficier d'une augmentation du nombre de cœurs E par rapport aux SKU correspondants de la 13e génération.
Dans cet article, nous verrons comment le Core i7-14700K se comporte par rapport à la concurrence et si l'augmentation du nombre de E-core s'avère être une conséquence pratique pour la productivité et les jeux.
Aperçu des processeurs de bureau Intel Raptor Lake-S Refresh de 14e génération
| SKU | Cœurs / Threads | P-CoreClock / Turbo | E-CoreClock / Turbo | CacheL2 + L3 | Integrated Graphics | PBP (PL1) | MTB (PL2) | MSRP (US$) |
| Core i9-14900K | 24 (8P + 16E) / 32 | 3,2 GHz / 6,0 GHz | 2,4 GHz / 4,4 GHz | 32 + 36 Mo | UHD Graphics 770 | 125 W | 253 W | 589 |
| Core i9-14900KF | 24 (8P + 16E) / 32 | 3,2 GHz / 6,0 GHz | 2,4 GHz / 4,4 GHz | 32 + 36 Mo | N/A | 125 W | 253 W | 564 |
| Core i9-13900K | 24 (8P + 16E) / 32 | 3,0 GHz / 5,8 GHz | 2,2 GHz / 4,3 GHz | 32 + 36 Mo | UHD Graphics 770 | 125 W | 253 W | 589 |
| Core i9-12900K | 16 (8P + 8E) / 24 | 3,2 GHz / 5,1 GHz | 2,4 GHz / 3,9 GHz | 14 + 30 Mo | UHD Graphics 770 | 125 W | 241 W | 589 |
| Core i7-14700K | 20 (8P + 12E) / 28 | 3,4 GHz / 5,6 GHz | 2,5 GHz / 4,3 GHz | 28 + 33 Mo | UHD Graphics 770 | 125 W | 253 W | 409 |
| Core i7-14700KF | 20 (8P + 12E) / 28 | 3,4 GHz / 5,6 GHz | 2,5 GHz / 4,3 GHz | 28 + 33 Mo | N/A | 125 W | 253 W | 384 |
| Core i7-13700K | 16 (8P + 8E) / 24 | 3,4 GHz / 5,4 GHz | 2,5 GHz / 4,2 GHz | 24 + 30 Mo | UHD Graphics 770 | 125 W | 253 W | 409 |
| Core i7-12700K | 12 (8P + 4E) / 20 | 3,6 GHz / 4,9 GHz | 2,7 GHz / 3,8 GHz | 12 + 25 Mo | UHD Graphics 770 | 125 W | 190 W | 409 |
| Core i5-14600K | 14 (6P + 8E) / 20 | 3,5 GHz / 5,3 GHz | 2,6 GHz / 4,0 GHz | 20 + 24 Mo | UHD Graphics 770 | 125 W | 181 W | 319 |
| Core i5-14600KF | 14 (6P + 8E) / 20 | 3,5 GHz / 5,3 GHz | 2,6 GHz / 4,0 GHz | 20 + 24 Mo | N/A | 125 W | 181 W | 294 |
| Core i5-13600K | 14 (6P + 8E) / 20 | 3,5 GHz / 5,1 GHz | 2,6 GHz / 3,9 GHz | 20 + 24 Mo | UHD Graphics 770 | 125 W | 181 W | 319 |
| Core i5-12600K | 10 (6P + 4E) / 16 | 3,7 GHz / 4,9 GHz | 2,8 GHz / 3,6 GHz | 9,5 + 20 MB | UHD Graphics 770 | 125 W | 150 W | 289 |
En raison de l'augmentation du nombre de cœurs E, les caches L2 et L3 combinés sont désormais de 61 Mo, contre 54 Mo pour le Core i7-13700K. De plus, le Core i7-14700K voit également une légère augmentation des boosts des cœurs P et E, qui sont maintenant spécifiés à 5,6 GHz et 4,3 GHz, respectivement.
Intel continue d'utiliser une puissance de base du processeur (PBP) ou PL1 de 125 W et un Turbo Boost maximal (MTB) ou PL2 de 253 W.
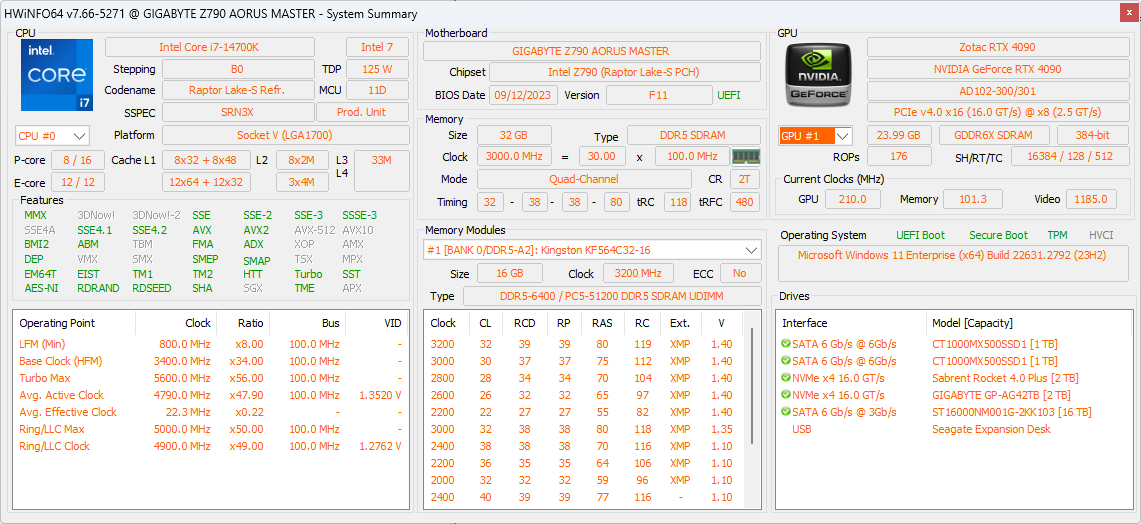
Le banc d'essai : Intel Core i7-14700K se sent à l'aise avec la RTX 4090
Notre banc d'essai Core i7-14700K est composé des éléments suivants :
- Banc d'essai ouvert Cooler Master MasterFrame 700
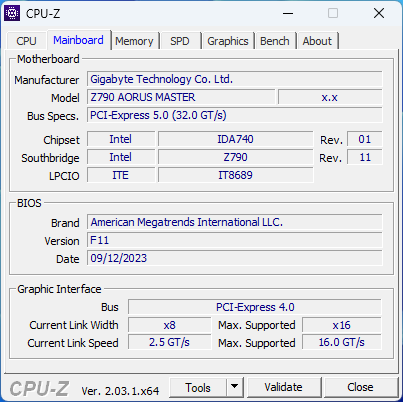
- Carte mère Gigabyte Z790 Aorus Master avec BIOS version F11
- GPU Zotac Gaming GeForce RTX 4090 AMP Extreme Airo
- Gigabyte Aorus Gen 4 2 TB NVMe SSD pour les benchmarks et les jeux
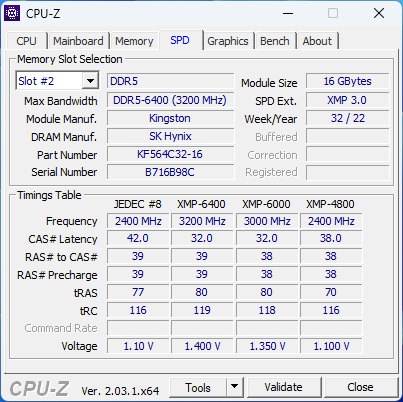
- 2x 16 GB Kingston Fury Beast DDR5-6400 RAM fonctionnant à DDR5-6000 avec timings 32-38-38-80 à 1.35 V
- Moniteur Gigabyte M28U 4K 144 Hz
- Refroidisseur AIO Cooler MasterLiquid ML360L V2 ARGB
- Cooler Master MVE Gold V2 1250 ATX 3.0 PSU entièrement modulaire
Windows 11 23H2 avec les derniers patchs et le pilote Nvidia Game Ready v546.26 ont été utilisés au moment du test.
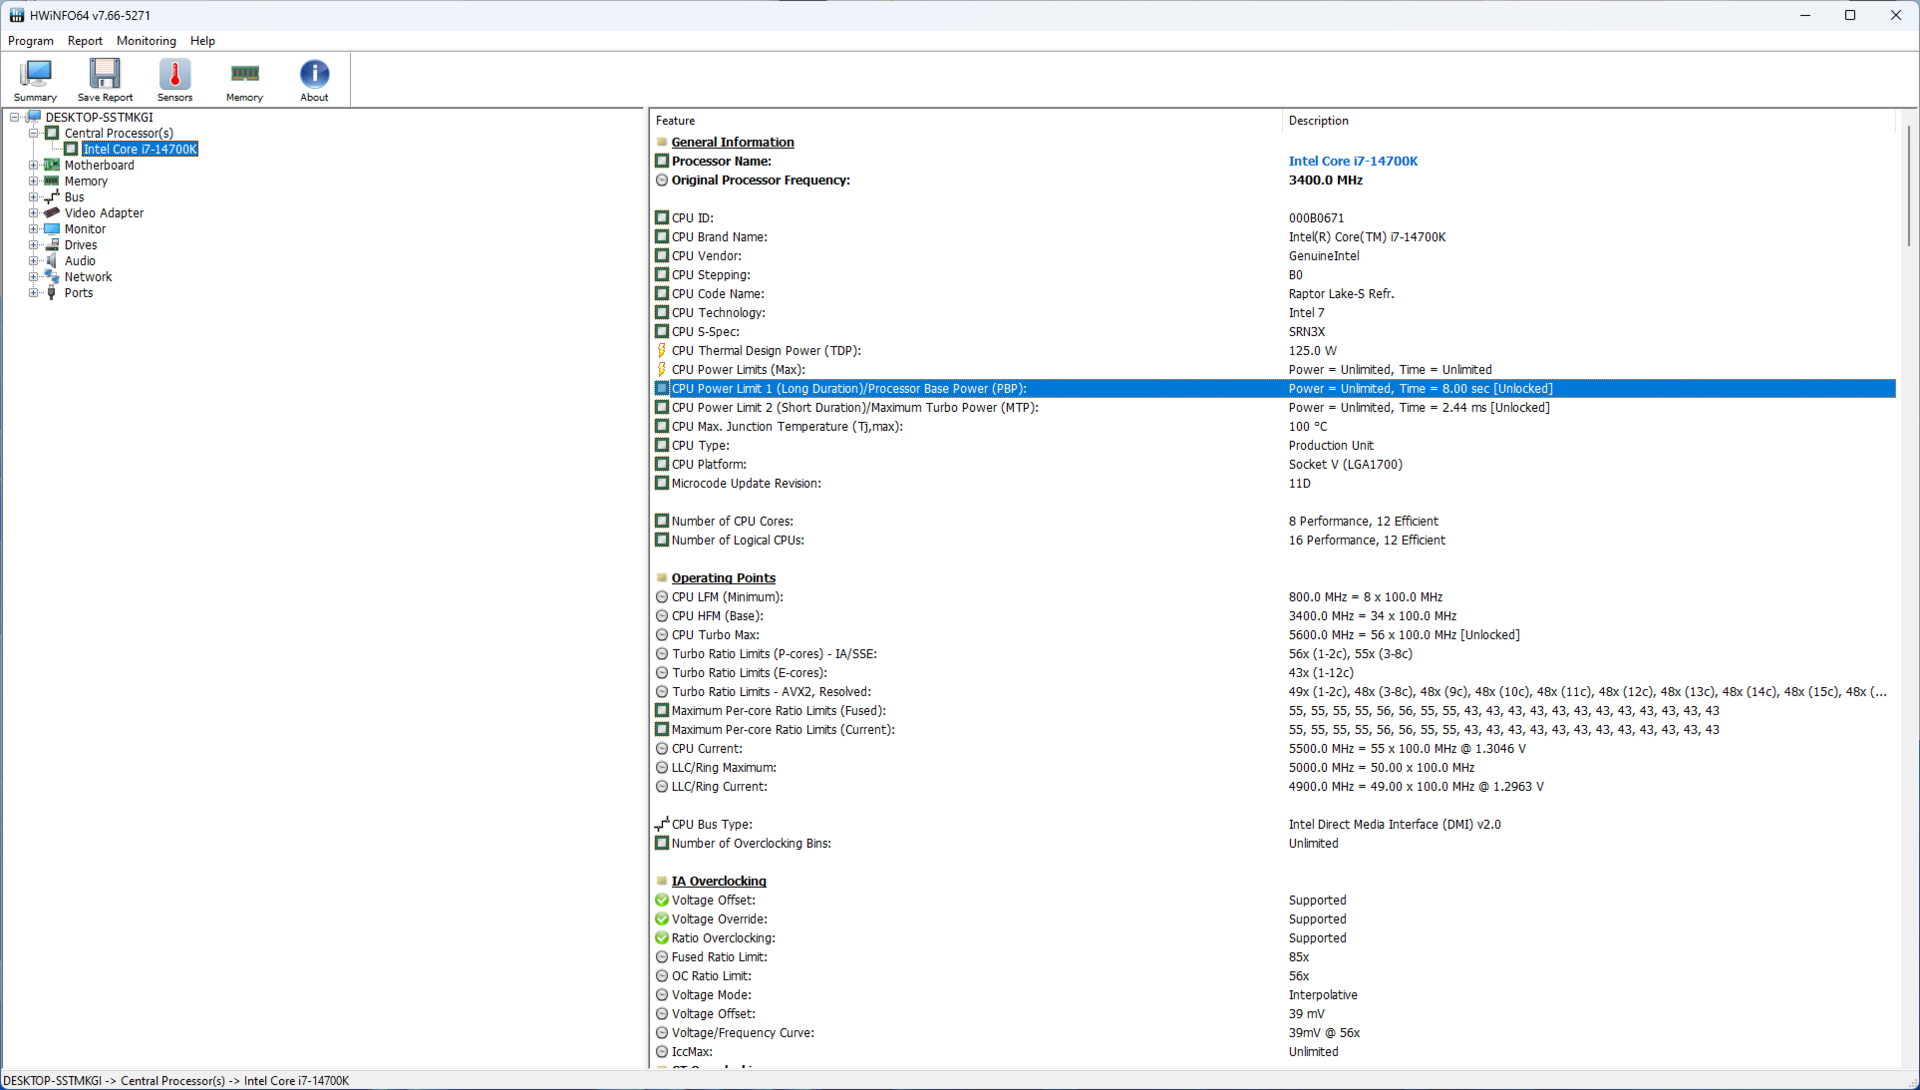
Pendant les tests, nous avons réglé PL1=PL2 illimité et activé Thermal Velocity Boost via Intel XTU pour s'assurer que le Core i7-14700K puisse pleinement déployer ses muscles.
Nous tenons à remercier Intel pour avoir fourni l'échantillon de test du Core i7-14700K, Zotac pour le GPU RTX 4090 AMP Extreme Airo, Gigabyte pour la carte mère Z790 Aorus Master, l'écran M28U et le SSD Aorus NVMe, Kingston pour le kit mémoire DDR5, et enfin Cooler Master pour le banc de test, le refroidisseur AIO et l'alimentation.
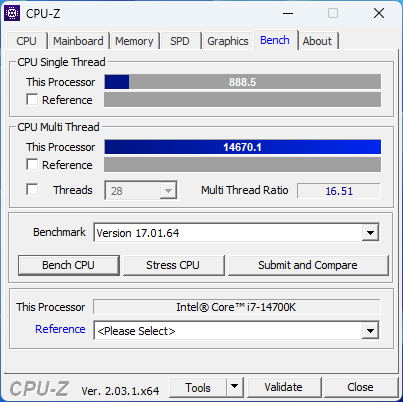
Benchmarks CPU : Avantage en single-core par rapport à AMD Zen 4
Les performances cumulées du processeur sont à la hauteur de celles de la AMD Ryzen 9 7950X3D et du Ryzen 9 7950X tout en restant derrière le Core i9-14900K de seulement 7 %.
En single-core, le Core i7-14700K est nettement plus performant que les modèles Zen 4 d'AMD dans les tests Cinebench R20 et R23, alors que ces derniers sont plus performants dans les tests single-core Geekbench.
Les Ryzen 9 7950XD et Ryzen 9 7950X ont un avantage décent en multi-core sur le Core i7-14700K étant donné leur nombre de threads plus élevé. Cela se reflète également dans les tests CPU V-Ray, qui montrent que le Core i7-14700K est 20% moins performant que le Ryzen 9 7950X.
Le Core i7-14700K est à la traîne par rapport au modèle phare Core i9-14900K jusqu'à 8 % dans les tests Cinebench à cœur unique et jusqu'à 13 % en multicœur, ce qui est raisonnable si l'on considère la différence de prix de 180 dollars entre ces deux CPU Raptor Lake-S Refresh.
| Performance rating - Percent | |
| Intel Core i9-14900K | |
| Intel Core i9-13900K | |
| AMD Ryzen 9 7950X | |
| AMD Ryzen 9 7950X3D | |
| Intel Core i7-14700K | |
| AMD Ryzen 9 7900X | |
| AMD Ryzen 9 5950X -1! | |
| Intel Core i5-14600K | |
| Intel Core i9-12900K | |
| Intel Core i5-13600K | |
| AMD Ryzen 7 7800X3D -1! | |
| AMD Ryzen 5 7600X | |
| Intel Core i5-12600K | |
| Intel Core i5-13400 | |
| Intel Core i5-12400F | |
| Cinebench R15 | |
| CPU Single 64Bit | |
| Intel Core i9-14900K | |
| AMD Ryzen 9 7950X | |
| Intel Core i9-13900K | |
| AMD Ryzen 9 7950X3D | |
| AMD Ryzen 9 7900X | |
| AMD Ryzen 5 7600X | |
| Intel Core i7-14700K | |
| Intel Core i5-14600K | |
| AMD Ryzen 7 7800X3D | |
| Intel Core i5-13600K | |
| Intel Core i9-12900K | |
| Intel Core i5-12600K | |
| AMD Ryzen 9 5950X | |
| Intel Core i5-13400 | |
| Intel Core i5-12400F | |
| CPU Multi 64Bit | |
| Intel Core i9-14900K | |
| AMD Ryzen 9 7950X | |
| Intel Core i9-13900K | |
| AMD Ryzen 9 7950X3D | |
| Intel Core i7-14700K | |
| AMD Ryzen 9 7900X | |
| AMD Ryzen 9 5950X | |
| Intel Core i9-12900K | |
| Intel Core i5-13600K | |
| Intel Core i5-14600K | |
| AMD Ryzen 7 7800X3D | |
| Intel Core i5-12600K | |
| AMD Ryzen 5 7600X | |
| Intel Core i5-13400 | |
| Intel Core i5-12400F | |
| Cinebench R20 | |
| CPU (Single Core) | |
| Intel Core i9-14900K | |
| Intel Core i7-14700K | |
| Intel Core i9-13900K | |
| AMD Ryzen 9 7950X | |
| AMD Ryzen 9 7950X3D | |
| Intel Core i5-14600K | |
| AMD Ryzen 9 7900X | |
| Intel Core i5-13600K | |
| Intel Core i9-12900K | |
| AMD Ryzen 5 7600X | |
| Intel Core i5-12600K | |
| AMD Ryzen 7 7800X3D | |
| Intel Core i5-13400 | |
| Intel Core i5-12400F | |
| AMD Ryzen 9 5950X | |
| CPU (Multi Core) | |
| Intel Core i9-14900K | |
| Intel Core i9-13900K | |
| AMD Ryzen 9 7950X | |
| AMD Ryzen 9 7950X3D | |
| Intel Core i7-14700K | |
| AMD Ryzen 9 7900X | |
| AMD Ryzen 9 5950X | |
| Intel Core i9-12900K | |
| Intel Core i5-14600K | |
| Intel Core i5-13600K | |
| AMD Ryzen 7 7800X3D | |
| Intel Core i5-12600K | |
| Intel Core i5-13400 | |
| AMD Ryzen 5 7600X | |
| Intel Core i5-12400F | |
| Cinebench R23 | |
| Single Core | |
| Intel Core i9-14900K | |
| Intel Core i9-13900K | |
| Intel Core i7-14700K | |
| Intel Core i5-14600K | |
| AMD Ryzen 9 7950X3D | |
| AMD Ryzen 9 7950X | |
| AMD Ryzen 9 7900X | |
| Intel Core i5-13600K | |
| Intel Core i9-12900K | |
| AMD Ryzen 5 7600X | |
| Intel Core i5-12600K | |
| AMD Ryzen 7 7800X3D | |
| Intel Core i5-13400 | |
| Intel Core i5-12400F | |
| AMD Ryzen 9 5950X | |
| Multi Core | |
| Intel Core i9-14900K | |
| Intel Core i9-13900K | |
| AMD Ryzen 9 7950X | |
| AMD Ryzen 9 7950X3D | |
| Intel Core i7-14700K | |
| AMD Ryzen 9 7900X | |
| AMD Ryzen 9 5950X | |
| Intel Core i9-12900K | |
| Intel Core i5-14600K | |
| Intel Core i5-13600K | |
| AMD Ryzen 7 7800X3D | |
| Intel Core i5-12600K | |
| Intel Core i5-13400 | |
| AMD Ryzen 5 7600X | |
| Intel Core i5-12400F | |
| Cinebench R11.5 | |
| CPU Single 64Bit | |
| Intel Core i9-14900K | |
| Intel Core i9-13900K | |
| AMD Ryzen 9 7950X | |
| AMD Ryzen 9 7950X3D | |
| AMD Ryzen 9 7900X | |
| AMD Ryzen 5 7600X | |
| Intel Core i7-14700K | |
| Intel Core i5-14600K | |
| Intel Core i9-12900K | |
| Intel Core i5-13600K | |
| AMD Ryzen 7 7800X3D | |
| Intel Core i5-12600K | |
| AMD Ryzen 9 5950X | |
| Intel Core i5-13400 | |
| Intel Core i5-12400F | |
| CPU Multi 64Bit | |
| Intel Core i9-14900K | |
| Intel Core i9-13900K | |
| AMD Ryzen 9 7950X | |
| AMD Ryzen 9 7950X3D | |
| Intel Core i7-14700K | |
| AMD Ryzen 9 7900X | |
| AMD Ryzen 9 5950X | |
| Intel Core i9-12900K | |
| Intel Core i5-13600K | |
| Intel Core i5-14600K | |
| AMD Ryzen 7 7800X3D | |
| Intel Core i5-12600K | |
| AMD Ryzen 5 7600X | |
| Intel Core i5-13400 | |
| Intel Core i5-12400F | |
| Cinebench R10 | |
| Rendering Single CPUs 64Bit | |
| Intel Core i9-14900K | |
| Intel Core i9-13900K | |
| Intel Core i7-14700K | |
| Intel Core i5-14600K | |
| AMD Ryzen 9 7900X | |
| AMD Ryzen 9 7950X | |
| Intel Core i5-13600K | |
| Intel Core i9-12900K | |
| AMD Ryzen 5 7600X | |
| Intel Core i5-12600K | |
| AMD Ryzen 7 7800X3D | |
| Intel Core i5-13400 | |
| Intel Core i5-12400F | |
| AMD Ryzen 9 5950X | |
| AMD Ryzen 9 7950X3D | |
| Rendering Multiple CPUs 64Bit | |
| Intel Core i9-14900K | |
| Intel Core i7-14700K | |
| Intel Core i9-13900K | |
| AMD Ryzen 9 7950X | |
| AMD Ryzen 9 7900X | |
| Intel Core i5-14600K | |
| Intel Core i9-12900K | |
| Intel Core i5-13600K | |
| AMD Ryzen 9 5950X | |
| AMD Ryzen 7 7800X3D | |
| AMD Ryzen 5 7600X | |
| Intel Core i5-12600K | |
| Intel Core i5-13400 | |
| AMD Ryzen 9 7950X3D | |
| Intel Core i5-12400F | |
| Blender - v2.79 BMW27 CPU | |
| Intel Core i5-12400F | |
| Intel Core i5-13400 | |
| AMD Ryzen 5 7600X | |
| Intel Core i5-12600K | |
| AMD Ryzen 7 7800X3D | |
| Intel Core i5-13600K | |
| Intel Core i5-14600K | |
| Intel Core i9-12900K | |
| AMD Ryzen 9 5950X | |
| AMD Ryzen 9 7900X | |
| Intel Core i7-14700K | |
| AMD Ryzen 9 7950X3D | |
| AMD Ryzen 9 7950X | |
| Intel Core i9-13900K | |
| Intel Core i9-14900K | |
| wPrime 2.10 | |
| 32m | |
| Intel Core i9-12900K | |
| Intel Core i5-12600K | |
| Intel Core i5-12400F | |
| Intel Core i5-13400 | |
| AMD Ryzen 5 7600X | |
| AMD Ryzen 9 5950X | |
| Intel Core i5-13600K | |
| AMD Ryzen 7 7800X3D | |
| Intel Core i5-14600K | |
| Intel Core i7-14700K | |
| Intel Core i9-14900K | |
| AMD Ryzen 9 7950X3D | |
| Intel Core i9-13900K | |
| AMD Ryzen 9 7900X | |
| AMD Ryzen 9 7950X | |
| 1024m | |
| Intel Core i5-13400 | |
| Intel Core i5-12600K | |
| Intel Core i9-12900K | |
| Intel Core i5-13600K | |
| Intel Core i5-14600K | |
| Intel Core i5-12400F | |
| Intel Core i7-14700K | |
| Intel Core i9-13900K | |
| AMD Ryzen 5 7600X | |
| Intel Core i9-14900K | |
| AMD Ryzen 9 5950X | |
| AMD Ryzen 7 7800X3D | |
| AMD Ryzen 9 7900X | |
| AMD Ryzen 9 7950X3D | |
| AMD Ryzen 9 7950X | |
| X264 HD Benchmark 4.0 | |
| Pass 1 | |
| Intel Core i9-14900K | |
| Intel Core i7-14700K | |
| Intel Core i9-13900K | |
| Intel Core i5-14600K | |
| AMD Ryzen 9 7950X3D | |
| Intel Core i5-13600K | |
| AMD Ryzen 9 7950X | |
| AMD Ryzen 9 7900X | |
| Intel Core i9-12900K | |
| AMD Ryzen 5 7600X | |
| AMD Ryzen 7 7800X3D | |
| AMD Ryzen 9 5950X | |
| Intel Core i5-12600K | |
| Intel Core i5-13400 | |
| Intel Core i5-12400F | |
| Pass 2 | |
| Intel Core i9-14900K | |
| Intel Core i9-13900K | |
| AMD Ryzen 9 7950X | |
| AMD Ryzen 9 7950X3D | |
| Intel Core i7-14700K | |
| AMD Ryzen 9 7900X | |
| AMD Ryzen 9 5950X | |
| Intel Core i5-14600K | |
| Intel Core i9-12900K | |
| Intel Core i5-13600K | |
| AMD Ryzen 7 7800X3D | |
| Intel Core i5-12600K | |
| AMD Ryzen 5 7600X | |
| Intel Core i5-13400 | |
| Intel Core i5-12400F | |
| WinRAR - Result | |
| AMD Ryzen 9 7900X | |
| AMD Ryzen 7 7800X3D | |
| AMD Ryzen 9 7950X | |
| AMD Ryzen 5 7600X | |
| Intel Core i9-14900K | |
| AMD Ryzen 9 7950X3D | |
| Intel Core i9-13900K | |
| Intel Core i7-14700K | |
| AMD Ryzen 9 5950X | |
| Intel Core i5-14600K | |
| Intel Core i5-13600K | |
| Intel Core i9-12900K | |
| Intel Core i5-13400 | |
| Intel Core i5-12400F | |
| Intel Core i5-12600K | |
| TrueCrypt | |
| AES Mean 100MB | |
| AMD Ryzen 9 7950X | |
| Intel Core i9-13900K | |
| AMD Ryzen 9 5950X | |
| AMD Ryzen 9 7950X3D | |
| Intel Core i9-14900K | |
| Intel Core i7-14700K | |
| Intel Core i5-14600K | |
| Intel Core i5-13600K | |
| Intel Core i9-12900K | |
| AMD Ryzen 7 7800X3D | |
| AMD Ryzen 9 7900X | |
| AMD Ryzen 5 7600X | |
| Intel Core i5-12600K | |
| Intel Core i5-13400 | |
| Intel Core i5-12400F | |
| Twofish Mean 100MB | |
| Intel Core i9-14900K | |
| Intel Core i9-13900K | |
| Intel Core i7-14700K | |
| AMD Ryzen 9 7950X | |
| AMD Ryzen 9 7950X3D | |
| AMD Ryzen 9 5950X | |
| Intel Core i9-12900K | |
| Intel Core i5-14600K | |
| Intel Core i5-13600K | |
| AMD Ryzen 9 7900X | |
| Intel Core i5-12600K | |
| AMD Ryzen 7 7800X3D | |
| Intel Core i5-13400 | |
| AMD Ryzen 5 7600X | |
| Intel Core i5-12400F | |
| Serpent Mean 100MB | |
| Intel Core i9-13900K | |
| AMD Ryzen 9 7950X | |
| AMD Ryzen 9 7950X3D | |
| Intel Core i9-14900K | |
| Intel Core i7-14700K | |
| AMD Ryzen 9 5950X | |
| Intel Core i9-12900K | |
| Intel Core i5-14600K | |
| Intel Core i5-13600K | |
| AMD Ryzen 9 7900X | |
| Intel Core i5-12600K | |
| AMD Ryzen 7 7800X3D | |
| Intel Core i5-13400 | |
| AMD Ryzen 5 7600X | |
| Intel Core i5-12400F | |
| Geekbench 5.5 | |
| Multi-Core | |
| Intel Core i9-14900K | |
| AMD Ryzen 9 7950X | |
| AMD Ryzen 9 7950X3D | |
| Intel Core i9-13900K | |
| Intel Core i7-14700K | |
| AMD Ryzen 9 7900X | |
| Intel Core i9-12900K | |
| Intel Core i5-14600K | |
| AMD Ryzen 9 5950X | |
| Intel Core i5-13600K | |
| AMD Ryzen 7 7800X3D | |
| Intel Core i5-12600K | |
| Intel Core i5-13400 | |
| AMD Ryzen 5 7600X | |
| Intel Core i5-12400F | |
| Single-Core | |
| AMD Ryzen 9 7950X | |
| AMD Ryzen 9 7950X3D | |
| Intel Core i9-13900K | |
| AMD Ryzen 9 7900X | |
| Intel Core i9-14900K | |
| AMD Ryzen 5 7600X | |
| Intel Core i7-14700K | |
| Intel Core i9-12900K | |
| AMD Ryzen 7 7800X3D | |
| Intel Core i5-14600K | |
| Intel Core i5-13600K | |
| Intel Core i5-12600K | |
| Intel Core i5-13400 | |
| Intel Core i5-12400F | |
| AMD Ryzen 9 5950X | |
| Geekbench 5.0 | |
| 5.0 Multi-Core | |
| Intel Core i9-14900K | |
| AMD Ryzen 9 7950X | |
| Intel Core i9-13900K | |
| AMD Ryzen 9 7950X3D | |
| Intel Core i7-14700K | |
| AMD Ryzen 9 7900X | |
| Intel Core i9-12900K | |
| Intel Core i5-14600K | |
| Intel Core i5-13600K | |
| AMD Ryzen 9 5950X | |
| AMD Ryzen 7 7800X3D | |
| Intel Core i5-12600K | |
| AMD Ryzen 5 7600X | |
| Intel Core i5-13400 | |
| Intel Core i5-12400F | |
| 5.0 Single-Core | |
| Intel Core i9-14900K | |
| AMD Ryzen 9 7950X | |
| Intel Core i9-13900K | |
| AMD Ryzen 9 7900X | |
| AMD Ryzen 9 7950X3D | |
| AMD Ryzen 5 7600X | |
| Intel Core i7-14700K | |
| Intel Core i5-14600K | |
| Intel Core i9-12900K | |
| AMD Ryzen 7 7800X3D | |
| Intel Core i5-13600K | |
| Intel Core i5-12600K | |
| Intel Core i5-13400 | |
| AMD Ryzen 9 5950X | |
| Intel Core i5-12400F | |
| Geekbench 4.4 | |
| 64 Bit Single-Core Score | |
| Intel Core i9-14900K | |
| Intel Core i9-13900K | |
| AMD Ryzen 9 7950X | |
| Intel Core i7-14700K | |
| AMD Ryzen 9 7950X3D | |
| AMD Ryzen 9 7900X | |
| AMD Ryzen 7 7800X3D | |
| AMD Ryzen 5 7600X | |
| Intel Core i5-14600K | |
| Intel Core i9-12900K | |
| Intel Core i5-13600K | |
| Intel Core i5-12600K | |
| Intel Core i5-13400 | |
| Intel Core i5-12400F | |
| AMD Ryzen 9 5950X | |
| 64 Bit Multi-Core Score | |
| AMD Ryzen 9 7950X | |
| Intel Core i9-14900K | |
| AMD Ryzen 9 7950X3D | |
| Intel Core i9-13900K | |
| Intel Core i7-14700K | |
| AMD Ryzen 9 7900X | |
| Intel Core i5-14600K | |
| Intel Core i9-12900K | |
| AMD Ryzen 9 5950X | |
| Intel Core i5-13600K | |
| AMD Ryzen 7 7800X3D | |
| AMD Ryzen 5 7600X | |
| Intel Core i5-12600K | |
| Intel Core i5-13400 | |
| Intel Core i5-12400F | |
| 3DMark 11 - 1280x720 Performance Physics | |
| AMD Ryzen 9 7950X3D | |
| AMD Ryzen 7 7800X3D | |
| Intel Core i7-14700K | |
| Intel Core i9-13900K | |
| Intel Core i9-14900K | |
| Intel Core i5-14600K | |
| Intel Core i5-13600K | |
| AMD Ryzen 9 7900X | |
| AMD Ryzen 9 7950X | |
| Intel Core i9-12900K | |
| AMD Ryzen 5 7600X | |
| AMD Ryzen 9 5950X | |
| Intel Core i5-12600K | |
| Intel Core i5-13400 | |
| Intel Core i5-12400F | |
| 7-Zip 18.03 | |
| 7z b 4 | |
| AMD Ryzen 9 7950X | |
| AMD Ryzen 9 7950X3D | |
| Intel Core i9-14900K | |
| Intel Core i9-13900K | |
| Intel Core i7-14700K | |
| AMD Ryzen 9 5950X | |
| AMD Ryzen 9 7900X | |
| Intel Core i9-12900K | |
| Intel Core i5-14600K | |
| Intel Core i5-13600K | |
| AMD Ryzen 7 7800X3D | |
| AMD Ryzen 5 7600X | |
| Intel Core i5-12600K | |
| Intel Core i5-13400 | |
| Intel Core i5-12400F | |
| 7z b 4 -mmt1 | |
| AMD Ryzen 9 7950X | |
| AMD Ryzen 9 7950X3D | |
| AMD Ryzen 9 7900X | |
| AMD Ryzen 7 7800X3D | |
| AMD Ryzen 5 7600X | |
| Intel Core i9-14900K | |
| Intel Core i7-14700K | |
| Intel Core i9-13900K | |
| AMD Ryzen 9 5950X | |
| Intel Core i5-14600K | |
| Intel Core i9-12900K | |
| Intel Core i5-13600K | |
| Intel Core i5-12600K | |
| Intel Core i5-13400 | |
| Intel Core i5-12400F | |
| HWBOT x265 Benchmark v2.2 - 4k Preset | |
| AMD Ryzen 9 7950X | |
| Intel Core i9-14900K | |
| Intel Core i9-13900K | |
| AMD Ryzen 9 7950X3D | |
| Intel Core i7-14700K | |
| AMD Ryzen 9 7900X | |
| AMD Ryzen 9 5950X | |
| Intel Core i5-12600K | |
| Intel Core i9-12900K | |
| Intel Core i5-14600K | |
| Intel Core i5-13600K | |
| AMD Ryzen 7 7800X3D | |
| AMD Ryzen 5 7600X | |
| Intel Core i5-13400 | |
| Intel Core i5-12400F | |
| R Benchmark 2.5 - Overall mean | |
| Intel Core i5-12400F | |
| Intel Core i5-13400 | |
| AMD Ryzen 9 5950X | |
| Intel Core i5-12600K | |
| Intel Core i9-12900K | |
| AMD Ryzen 7 7800X3D | |
| Intel Core i5-13600K | |
| Intel Core i5-14600K | |
| Intel Core i7-14700K | |
| AMD Ryzen 5 7600X | |
| AMD Ryzen 9 7900X | |
| AMD Ryzen 9 7950X3D | |
| AMD Ryzen 9 7950X | |
| Intel Core i9-13900K | |
| Intel Core i9-14900K | |
| LibreOffice - 20 Documents To PDF | |
| Intel Core i5-12600K | |
| Intel Core i5-12400F | |
| AMD Ryzen 9 5950X | |
| AMD Ryzen 7 7800X3D | |
| Intel Core i9-12900K | |
| Intel Core i7-14700K | |
| Intel Core i5-13400 | |
| AMD Ryzen 9 7950X3D | |
| AMD Ryzen 5 7600X | |
| Intel Core i9-13900K | |
| AMD Ryzen 9 7950X | |
| Intel Core i5-13600K | |
| AMD Ryzen 9 7900X | |
| Intel Core i9-14900K | |
| Intel Core i5-14600K | |
| WebXPRT 3 - Overall | |
| AMD Ryzen 9 7950X3D | |
| Intel Core i9-14900K | |
| AMD Ryzen 9 7900X | |
| AMD Ryzen 9 7950X | |
| AMD Ryzen 5 7600X | |
| Intel Core i9-13900K | |
| Intel Core i5-14600K | |
| AMD Ryzen 7 7800X3D | |
| Intel Core i7-14700K | |
| Intel Core i5-13600K | |
| Intel Core i9-12900K | |
| Intel Core i5-13400 | |
| Intel Core i5-12600K | |
| AMD Ryzen 9 5950X | |
| Intel Core i5-12400F | |
| Mozilla Kraken 1.1 - Total | |
| Intel Core i5-12400F | |
| AMD Ryzen 9 5950X | |
| Intel Core i5-13400 | |
| Intel Core i5-12600K | |
| AMD Ryzen 7 7800X3D | |
| Intel Core i9-12900K | |
| Intel Core i5-13600K | |
| Intel Core i5-14600K | |
| AMD Ryzen 5 7600X | |
| Intel Core i7-14700K | |
| AMD Ryzen 9 7950X3D | |
| AMD Ryzen 9 7950X | |
| Intel Core i9-13900K | |
| AMD Ryzen 9 7900X | |
| Intel Core i9-14900K | |
| V-Ray Benchmark Next 4.10 - CPU | |
| AMD Ryzen 9 7950X | |
| AMD Ryzen 9 7950X3D | |
| Intel Core i9-14900K | |
| Intel Core i9-13900K | |
| Intel Core i7-14700K | |
| AMD Ryzen 9 7900X | |
| AMD Ryzen 9 5950X | |
| Intel Core i9-12900K | |
| Intel Core i5-14600K | |
| Intel Core i5-13600K | |
| Intel Core i5-12600K | |
| AMD Ryzen 5 7600X | |
| Intel Core i5-13400 | |
| Intel Core i5-12400F | |
| V-Ray 5 Benchmark - CPU | |
| AMD Ryzen 9 7950X | |
| AMD Ryzen 9 7950X3D | |
| Intel Core i9-13900K | |
| Intel Core i9-14900K | |
| Intel Core i7-14700K | |
| AMD Ryzen 9 7900X | |
| Intel Core i9-12900K | |
| Intel Core i5-14600K | |
| Intel Core i5-13600K | |
| AMD Ryzen 7 7800X3D | |
| Intel Core i5-12600K | |
| AMD Ryzen 5 7600X | |
| Intel Core i5-13400 | |
| Intel Core i5-12400F | |
* ... Moindre est la valeur, meilleures sont les performances
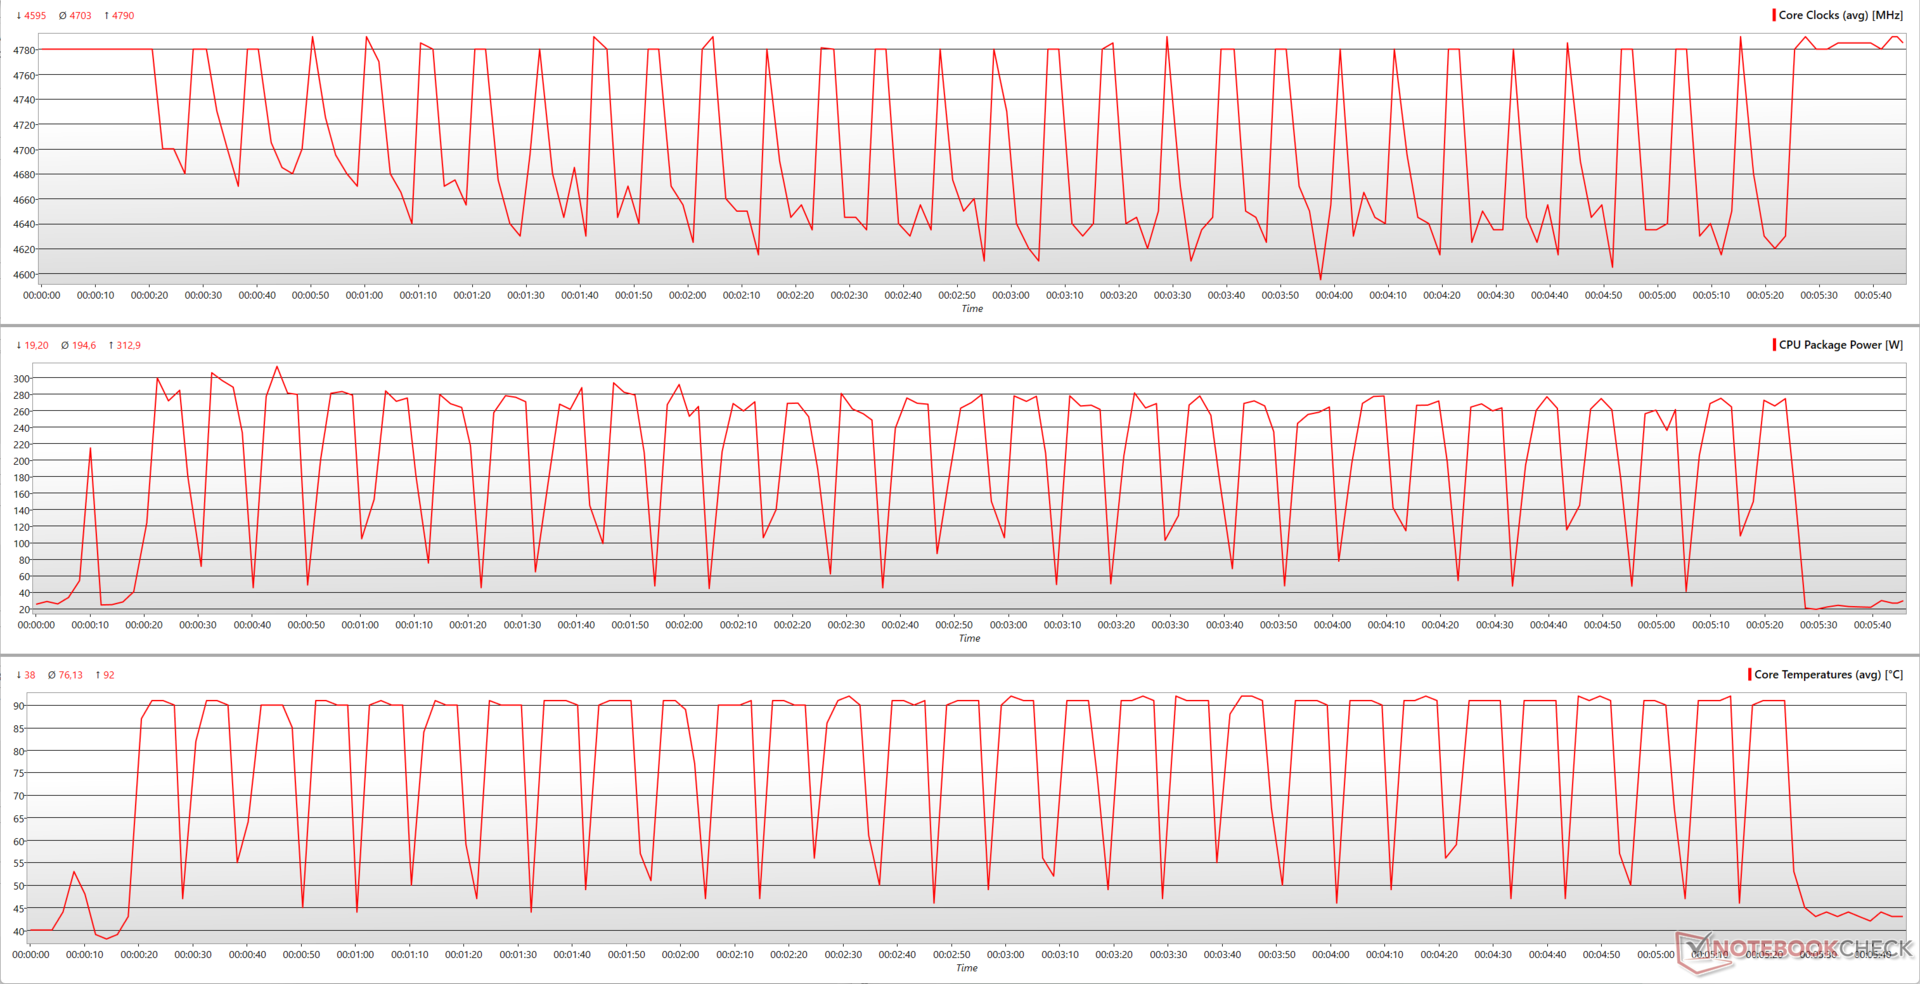
Cinebench R15 Multi Loop
Intel ne fournit pas de refroidisseur dans la boîte, vous devrez donc compter sur une solution tierce capable, de préférence un refroidisseur liquide tout-en-un (AiO). Nous n'avons constaté aucun ralentissement des performances lors d'un test en boucle multicœur Cinebench R15 avec le Cooler MasterLiquid ML360L AiO.
Pendant la boucle multicœur Cinebench R15, le Core i7-14700K peut atteindre 4,79 GHz, mais au prix d'une consommation de près de 313 W et d'une température de 92 °C au cœur du processeur.
Cependant, la puissance moyenne de l'ensemble pendant la boucle n'est que d'environ 195 W, ce qui permet d'obtenir des cadences moyennes de 4,7 GHz, tandis que la température du cœur se stabilise à environ 76 °C.
Performances du système : Au même niveau qu'une Ryzen 9 7950X3D
Le Core i7-14700K n'a pas à rougir des tâches de productivité courantes. Ses performances globales sont comparables à celles d'un Ryzen 9 7900X et un Ryzen 9 7950X3D, tout en restant 9 % derrière le Core i9-14900K.
Pris individuellement, le Core i7-14700K comble presque l'écart avec le Core i9-14900K ainsi qu'avec le Core i9-13900K dans 3DMark 11 Performance Physics et dans PCMark 10.
3DMark Time Spy CPU montre de manière intéressante que le Core i7-14700K gère une avance de 11 % sur le Core i9-13900K, bien qu'il soit derrière ce CPU de 9 % dans Fire Strike Physics.
Le nouveau CPU Raptor Lake-S Refresh subit un recul dans les tests AIDA64 FPU mais s'en sort bien dans les sous-tests tels que PhotoWorxx et CPU ZLib.
3DMark 11: 1280x720 Performance Physics
3DMark: 1920x1080 Fire Strike Physics | 2560x1440 Time Spy CPU
CrossMark: Overall | Responsiveness | Creativity | Productivity
PCMark 10: Score | Essentials | Productivity | Digital Content Creation
AIDA64: FP32 Ray-Trace | FPU Julia | CPU SHA3 | CPU Queen | FPU SinJulia | FPU Mandel | CPU AES | CPU ZLib | FP64 Ray-Trace | CPU PhotoWorxx
| Performance rating | |
| Intel Core i9-14900K | |
| AMD Ryzen 9 7950X | |
| Intel Core i9-13900K | |
| AMD Ryzen 9 7950X3D -2! | |
| Intel Core i7-14700K | |
| AMD Ryzen 9 7900X | |
| Intel Core i5-14600K | |
| AMD Ryzen 7 7800X3D | |
| Intel Core i5-13600K | |
| AMD Ryzen 5 7600X | |
| AMD Ryzen 9 5950X | |
| Intel Core i9-12900K -4! | |
| Intel Core i5-13400 | |
| Intel Core i5-12400F | |
| Intel Core i5-12600K -4! | |
| 3DMark 11 / Performance Physics | |
| AMD Ryzen 9 7950X3D | |
| AMD Ryzen 7 7800X3D | |
| Intel Core i7-14700K | |
| Intel Core i9-13900K | |
| Intel Core i9-14900K | |
| Intel Core i5-14600K | |
| Intel Core i5-13600K | |
| AMD Ryzen 9 7900X | |
| AMD Ryzen 9 7950X | |
| Intel Core i9-12900K | |
| AMD Ryzen 5 7600X | |
| AMD Ryzen 9 5950X | |
| Intel Core i5-12600K | |
| Intel Core i5-13400 | |
| Intel Core i5-12400F | |
| 3DMark / Fire Strike Physics | |
| Intel Core i9-14900K | |
| Intel Core i9-13900K | |
| Intel Core i7-14700K | |
| AMD Ryzen 9 7950X3D | |
| AMD Ryzen 9 7900X | |
| AMD Ryzen 9 7950X | |
| Intel Core i5-14600K | |
| AMD Ryzen 9 5950X | |
| Intel Core i9-12900K | |
| Intel Core i5-13600K | |
| AMD Ryzen 7 7800X3D | |
| AMD Ryzen 5 7600X | |
| Intel Core i5-12600K | |
| Intel Core i5-13400 | |
| Intel Core i5-12400F | |
| 3DMark / Time Spy CPU | |
| Intel Core i9-14900K | |
| Intel Core i7-14700K | |
| Intel Core i9-13900K | |
| Intel Core i5-14600K | |
| Intel Core i9-12900K | |
| AMD Ryzen 9 7950X3D | |
| Intel Core i5-13600K | |
| AMD Ryzen 9 7900X | |
| AMD Ryzen 9 7950X | |
| AMD Ryzen 7 7800X3D | |
| Intel Core i5-12600K | |
| AMD Ryzen 9 5950X | |
| Intel Core i5-13400 | |
| AMD Ryzen 5 7600X | |
| Intel Core i5-12400F | |
| CrossMark / Overall | |
| Intel Core i9-14900K | |
| Intel Core i9-13900K | |
| AMD Ryzen 9 7950X | |
| AMD Ryzen 9 7900X | |
| Intel Core i5-14600K | |
| Intel Core i7-14700K | |
| Intel Core i5-13600K | |
| AMD Ryzen 5 7600X | |
| AMD Ryzen 7 7800X3D | |
| AMD Ryzen 9 7950X3D | |
| Intel Core i5-13400 | |
| Intel Core i5-12400F | |
| AMD Ryzen 9 5950X | |
| CrossMark / Responsiveness | |
| Intel Core i9-13900K | |
| Intel Core i9-14900K | |
| Intel Core i5-13600K | |
| AMD Ryzen 9 7950X | |
| AMD Ryzen 9 7900X | |
| AMD Ryzen 5 7600X | |
| Intel Core i5-14600K | |
| AMD Ryzen 7 7800X3D | |
| Intel Core i7-14700K | |
| Intel Core i5-13400 | |
| Intel Core i5-12400F | |
| AMD Ryzen 9 7950X3D | |
| AMD Ryzen 9 5950X | |
| CrossMark / Creativity | |
| Intel Core i9-14900K | |
| AMD Ryzen 9 7950X | |
| Intel Core i9-13900K | |
| AMD Ryzen 9 7900X | |
| Intel Core i7-14700K | |
| Intel Core i5-14600K | |
| AMD Ryzen 9 7950X3D | |
| AMD Ryzen 7 7800X3D | |
| AMD Ryzen 5 7600X | |
| Intel Core i5-13600K | |
| Intel Core i5-13400 | |
| Intel Core i5-12400F | |
| AMD Ryzen 9 5950X | |
| CrossMark / Productivity | |
| Intel Core i9-14900K | |
| Intel Core i9-13900K | |
| AMD Ryzen 9 7950X | |
| AMD Ryzen 9 7900X | |
| Intel Core i5-14600K | |
| Intel Core i5-13600K | |
| AMD Ryzen 5 7600X | |
| Intel Core i7-14700K | |
| AMD Ryzen 7 7800X3D | |
| AMD Ryzen 9 7950X3D | |
| Intel Core i5-13400 | |
| Intel Core i5-12400F | |
| AMD Ryzen 9 5950X | |
| PCMark 10 / Score | |
| Intel Core i9-14900K | |
| AMD Ryzen 9 7900X | |
| AMD Ryzen 9 7950X | |
| Intel Core i9-13900K | |
| Intel Core i7-14700K | |
| Intel Core i5-14600K | |
| AMD Ryzen 7 7800X3D | |
| AMD Ryzen 5 7600X | |
| Intel Core i5-13600K | |
| AMD Ryzen 9 5950X | |
| Intel Core i5-13400 | |
| Intel Core i9-12900K | |
| Intel Core i5-12600K | |
| Intel Core i5-12400F | |
| PCMark 10 / Essentials | |
| Intel Core i9-13900K | |
| AMD Ryzen 9 7900X | |
| AMD Ryzen 9 7950X | |
| Intel Core i9-14900K | |
| Intel Core i5-13600K | |
| AMD Ryzen 5 7600X | |
| AMD Ryzen 9 7950X3D | |
| Intel Core i7-14700K | |
| Intel Core i5-14600K | |
| AMD Ryzen 7 7800X3D | |
| AMD Ryzen 9 5950X | |
| Intel Core i9-12900K | |
| Intel Core i5-12600K | |
| Intel Core i5-13400 | |
| Intel Core i5-12400F | |
| PCMark 10 / Productivity | |
| AMD Ryzen 5 7600X | |
| AMD Ryzen 9 7950X3D | |
| AMD Ryzen 7 7800X3D | |
| Intel Core i5-14600K | |
| Intel Core i7-14700K | |
| AMD Ryzen 9 7900X | |
| AMD Ryzen 9 7950X | |
| Intel Core i9-14900K | |
| Intel Core i5-13600K | |
| Intel Core i9-13900K | |
| AMD Ryzen 9 5950X | |
| Intel Core i5-12600K | |
| Intel Core i5-13400 | |
| Intel Core i9-12900K | |
| Intel Core i5-12400F | |
| PCMark 10 / Digital Content Creation | |
| Intel Core i9-14900K | |
| Intel Core i7-14700K | |
| AMD Ryzen 9 7900X | |
| AMD Ryzen 9 7950X | |
| Intel Core i9-13900K | |
| Intel Core i5-14600K | |
| AMD Ryzen 7 7800X3D | |
| Intel Core i5-13600K | |
| Intel Core i5-13400 | |
| AMD Ryzen 5 7600X | |
| AMD Ryzen 9 5950X | |
| Intel Core i9-12900K | |
| Intel Core i5-12400F | |
| Intel Core i5-12600K | |
| AIDA64 / FP32 Ray-Trace | |
| AMD Ryzen 9 7950X | |
| AMD Ryzen 9 7950X3D | |
| Intel Core i9-14900K | |
| Intel Core i9-14900K | |
| Intel Core i9-13900K | |
| AMD Ryzen 9 7900X | |
| Intel Core i7-14700K | |
| AMD Ryzen 7 7800X3D | |
| AMD Ryzen 9 5950X | |
| Intel Core i5-14600K | |
| Intel Core i5-13600K | |
| AMD Ryzen 5 7600X | |
| Intel Core i5-13400 | |
| Intel Core i5-12400F | |
| Intel Core i9-12900K | |
| Intel Core i5-12600K | |
| AIDA64 / FPU Julia | |
| AMD Ryzen 9 7950X3D | |
| AMD Ryzen 9 7950X | |
| AMD Ryzen 9 7900X | |
| Intel Core i9-14900K | |
| Intel Core i9-14900K | |
| Intel Core i9-13900K | |
| Intel Core i7-14700K | |
| AMD Ryzen 9 5950X | |
| AMD Ryzen 7 7800X3D | |
| Intel Core i5-14600K | |
| Intel Core i5-13600K | |
| AMD Ryzen 5 7600X | |
| Intel Core i5-13400 | |
| Intel Core i5-12400F | |
| Intel Core i9-12900K | |
| Intel Core i5-12600K | |
| AIDA64 / CPU SHA3 | |
| AMD Ryzen 9 7950X3D | |
| AMD Ryzen 9 7950X | |
| Intel Core i9-13900K | |
| Intel Core i9-14900K | |
| Intel Core i9-14900K | |
| Intel Core i7-14700K | |
| AMD Ryzen 9 7900X | |
| Intel Core i5-14600K | |
| AMD Ryzen 7 7800X3D | |
| Intel Core i5-13600K | |
| Intel Core i9-12900K | |
| AMD Ryzen 9 5950X | |
| AMD Ryzen 5 7600X | |
| Intel Core i5-13400 | |
| Intel Core i5-12600K | |
| Intel Core i5-12400F | |
| AIDA64 / CPU Queen | |
| AMD Ryzen 9 7950X | |
| AMD Ryzen 9 7950X3D | |
| AMD Ryzen 9 7900X | |
| Intel Core i7-14700K | |
| AMD Ryzen 9 5950X | |
| Intel Core i9-14900K | |
| Intel Core i9-13900K | |
| Intel Core i5-14600K | |
| AMD Ryzen 7 7800X3D | |
| Intel Core i5-13600K | |
| Intel Core i9-12900K | |
| AMD Ryzen 5 7600X | |
| Intel Core i5-12600K | |
| Intel Core i5-13400 | |
| Intel Core i5-12400F | |
| AIDA64 / FPU SinJulia | |
| AMD Ryzen 9 7950X | |
| AMD Ryzen 9 7950X3D | |
| AMD Ryzen 9 5950X | |
| AMD Ryzen 9 7900X | |
| Intel Core i9-14900K | |
| Intel Core i9-14900K | |
| Intel Core i9-13900K | |
| Intel Core i7-14700K | |
| AMD Ryzen 7 7800X3D | |
| Intel Core i9-12900K | |
| AMD Ryzen 5 7600X | |
| Intel Core i5-14600K | |
| Intel Core i5-13600K | |
| Intel Core i5-12600K | |
| Intel Core i5-13400 | |
| Intel Core i5-12400F | |
| AIDA64 / FPU Mandel | |
| AMD Ryzen 9 7950X3D | |
| AMD Ryzen 9 7950X | |
| AMD Ryzen 9 7900X | |
| Intel Core i9-14900K | |
| Intel Core i9-14900K | |
| Intel Core i9-13900K | |
| AMD Ryzen 9 5950X | |
| Intel Core i7-14700K | |
| AMD Ryzen 7 7800X3D | |
| Intel Core i5-14600K | |
| Intel Core i5-13600K | |
| AMD Ryzen 5 7600X | |
| Intel Core i5-13400 | |
| Intel Core i9-12900K | |
| Intel Core i5-12400F | |
| Intel Core i5-12600K | |
| AIDA64 / CPU AES | |
| AMD Ryzen 9 7950X | |
| AMD Ryzen 9 7950X3D | |
| Intel Core i9-14900K | |
| Intel Core i9-14900K | |
| Intel Core i9-13900K | |
| AMD Ryzen 9 7900X | |
| Intel Core i5-14600K | |
| AMD Ryzen 7 7800X3D | |
| Intel Core i5-13600K | |
| AMD Ryzen 9 5950X | |
| AMD Ryzen 5 7600X | |
| Intel Core i7-14700K | |
| Intel Core i9-12900K | |
| Intel Core i5-13400 | |
| Intel Core i5-12600K | |
| Intel Core i5-12400F | |
| AIDA64 / CPU ZLib | |
| Intel Core i9-14900K | |
| Intel Core i9-14900K | |
| Intel Core i9-13900K | |
| AMD Ryzen 9 7950X | |
| AMD Ryzen 9 7950X3D | |
| Intel Core i7-14700K | |
| AMD Ryzen 9 7900X | |
| AMD Ryzen 9 5950X | |
| Intel Core i9-12900K | |
| Intel Core i5-14600K | |
| Intel Core i5-13600K | |
| AMD Ryzen 7 7800X3D | |
| Intel Core i5-12600K | |
| AMD Ryzen 5 7600X | |
| Intel Core i5-13400 | |
| Intel Core i5-12400F | |
| AIDA64 / FP64 Ray-Trace | |
| AMD Ryzen 9 7950X | |
| AMD Ryzen 9 7950X3D | |
| Intel Core i9-14900K | |
| Intel Core i9-14900K | |
| Intel Core i9-13900K | |
| AMD Ryzen 9 7900X | |
| Intel Core i7-14700K | |
| AMD Ryzen 7 7800X3D | |
| AMD Ryzen 9 5950X | |
| Intel Core i5-14600K | |
| Intel Core i5-13600K | |
| AMD Ryzen 5 7600X | |
| Intel Core i5-13400 | |
| Intel Core i9-12900K | |
| Intel Core i5-12400F | |
| Intel Core i5-12600K | |
| AIDA64 / CPU PhotoWorxx | |
| Intel Core i9-14900K | |
| Intel Core i9-14900K | |
| Intel Core i5-14600K | |
| Intel Core i7-14700K | |
| AMD Ryzen 9 7950X3D | |
| Intel Core i9-13900K | |
| Intel Core i5-13400 | |
| Intel Core i5-12600K | |
| Intel Core i5-13600K | |
| Intel Core i9-12900K | |
| AMD Ryzen 7 7800X3D | |
| Intel Core i5-12400F | |
| AMD Ryzen 9 7950X | |
| AMD Ryzen 9 7900X | |
| AMD Ryzen 5 7600X | |
| AMD Ryzen 9 5950X | |
3DMark 11: 1280x720 Performance Physics
3DMark: 1920x1080 Fire Strike Physics | 2560x1440 Time Spy CPU
CrossMark: Overall | Responsiveness | Creativity | Productivity
PCMark 10: Score | Essentials | Productivity | Digital Content Creation
AIDA64: FP32 Ray-Trace | FPU Julia | CPU SHA3 | CPU Queen | FPU SinJulia | FPU Mandel | CPU AES | CPU ZLib | FP64 Ray-Trace | CPU PhotoWorxx
| Performance rating - Percent | |
| Intel Core i9-12900K -1! | |
| Intel Core i5-12600K -1! | |
| Intel Core i9-14900K | |
| Intel Core i7-14700K | |
| Intel Core i5-14600K | |
| AMD Ryzen 9 7950X3D | |
| AMD Ryzen 9 7950X | |
| AMD Ryzen 9 7900X | |
| Intel Core i9-13900K | |
| AMD Ryzen 7 7800X3D | |
| Intel Core i5-13400 | |
| Intel Core i5-12400F | |
| Intel Core i5-13600K | |
| AMD Ryzen 5 7600X | |
| AMD Ryzen 9 5950X | |
* ... Moindre est la valeur, meilleures sont les performances
| PCMark 10 Score | 9741 points | |
Aide | ||
performances en 3D et dans les jeux : Core i5-14600K et Ryzen Zen 4 ont toujours l'avantage
Associé à la Nvidia GeForce RTX 4090 Les performances du Core i7-14700K étaient identiques à celles des Ryzen 9 7950X3D, Ryzen 9 7950X et même du Core i9-14900K dans les tests 3DMark cumulés.
Le 14C/20T Core i5-14600K affiche une avance de 9 % dans les tests 3DMark.
| Performance rating - Percent | |
| Intel Core i5-14600K | |
| AMD Ryzen 7 7800X3D | |
| AMD Ryzen 9 7950X | |
| AMD Ryzen 9 7950X3D | |
| Intel Core i9-14900K | |
| Intel Core i7-14700K | |
| Intel Core i5-13400 | |
| Intel Core i5-12400F | |
| Intel Core i9-13900K | |
| 3DMark 11 - 1280x720 Performance GPU | |
| AMD Ryzen 7 7800X3D | |
| Intel Core i5-14600K | |
| AMD Ryzen 9 7950X | |
| AMD Ryzen 9 7950X3D | |
| Intel Core i9-14900K | |
| Intel Core i5-13400 | |
| Intel Core i7-14700K | |
| Intel Core i5-12400F | |
| Intel Core i9-13900K | |
| 3DMark | |
| 2560x1440 Time Spy Graphics | |
| Intel Core i5-14600K | |
| Intel Core i9-14900K | |
| AMD Ryzen 7 7800X3D | |
| Intel Core i7-14700K | |
| AMD Ryzen 9 7950X | |
| AMD Ryzen 9 7950X3D | |
| Intel Core i9-13900K | |
| Intel Core i5-13400 | |
| Intel Core i5-12400F | |
| 1920x1080 Fire Strike Graphics | |
| Intel Core i5-14600K | |
| Intel Core i5-12400F | |
| Intel Core i5-13400 | |
| AMD Ryzen 7 7800X3D | |
| AMD Ryzen 9 7950X3D | |
| AMD Ryzen 9 7950X | |
| Intel Core i9-14900K | |
| Intel Core i7-14700K | |
| Intel Core i9-13900K | |
| 3DMark 11 Performance | 64680 points | |
| 3DMark Fire Strike Score | 52237 points | |
| 3DMark Time Spy Score | 33810 points | |
Aide | ||
Les performances de jeu cumulées en 720p low et 1080p Ultra montrent également que le Core i5-14600K prend une légère avance de 6% sur le Core i7-14700K.
Contrairement à 3DMark, les jeux semblent favoriser les Core i9-14900K (+16%) et les flagships AMD (jusqu'à +28%).
| Performance rating - Percent | |
| AMD Ryzen 7 7800X3D | |
| AMD Ryzen 9 7950X3D | |
| Intel Core i9-14900K | |
| AMD Ryzen 9 7950X | |
| Intel Core i9-13900K | |
| Intel Core i5-14600K | |
| Intel Core i7-14700K | |
| Intel Core i5-13400 | |
| Intel Core i5-12400F | |
| F1 22 | |
| 1920x1080 Low Preset AA:T AF:16x | |
| AMD Ryzen 7 7800X3D | |
| AMD Ryzen 9 7950X3D | |
| Intel Core i9-14900K | |
| AMD Ryzen 9 7950X | |
| Intel Core i9-13900K | |
| Intel Core i5-14600K | |
| Intel Core i7-14700K | |
| Intel Core i5-12400F | |
| Intel Core i5-13400 | |
| 1920x1080 Ultra High Preset AA:T AF:16x | |
| AMD Ryzen 7 7800X3D | |
| Intel Core i9-14900K | |
| Intel Core i5-14600K | |
| AMD Ryzen 9 7950X3D | |
| Intel Core i9-13900K | |
| AMD Ryzen 9 7950X | |
| Intel Core i7-14700K | |
| Intel Core i5-12400F | |
| Intel Core i5-13400 | |
| Far Cry 5 | |
| 1920x1080 Ultra Preset AA:T | |
| AMD Ryzen 7 7800X3D | |
| AMD Ryzen 9 7950X3D | |
| Intel Core i9-14900K | |
| Intel Core i9-13900K | |
| Intel Core i5-14600K | |
| AMD Ryzen 9 7950X | |
| Intel Core i7-14700K | |
| Intel Core i5-13400 | |
| Intel Core i5-12400F | |
| 1280x720 Low Preset AA:T | |
| AMD Ryzen 7 7800X3D | |
| AMD Ryzen 9 7950X3D | |
| Intel Core i9-14900K | |
| Intel Core i5-14600K | |
| Intel Core i9-13900K | |
| AMD Ryzen 9 7950X | |
| Intel Core i5-13400 | |
| Intel Core i7-14700K | |
| Intel Core i5-12400F | |
| X-Plane 11.11 | |
| 1920x1080 high (fps_test=3) | |
| AMD Ryzen 7 7800X3D | |
| AMD Ryzen 9 7950X3D | |
| Intel Core i9-13900K | |
| Intel Core i9-14900K | |
| Intel Core i7-14700K | |
| AMD Ryzen 9 7950X | |
| Intel Core i5-14600K | |
| Intel Core i5-13400 | |
| Intel Core i5-12400F | |
| 1280x720 low (fps_test=1) | |
| Intel Core i9-13900K | |
| Intel Core i9-14900K | |
| Intel Core i5-14600K | |
| Intel Core i7-14700K | |
| AMD Ryzen 9 7950X3D | |
| AMD Ryzen 9 7950X | |
| AMD Ryzen 7 7800X3D | |
| Intel Core i5-13400 | |
| Intel Core i5-12400F | |
| Final Fantasy XV Benchmark | |
| 1920x1080 High Quality | |
| Intel Core i9-14900K | |
| AMD Ryzen 9 7950X | |
| AMD Ryzen 7 7800X3D | |
| Intel Core i5-14600K | |
| AMD Ryzen 9 7950X3D | |
| Intel Core i9-13900K | |
| Intel Core i7-14700K | |
| Intel Core i5-13400 | |
| Intel Core i5-12400F | |
| 1280x720 Lite Quality | |
| AMD Ryzen 9 7950X | |
| Intel Core i9-13900K | |
| AMD Ryzen 7 7800X3D | |
| Intel Core i5-14600K | |
| Intel Core i9-14900K | |
| Intel Core i7-14700K | |
| AMD Ryzen 9 7950X3D | |
| Intel Core i5-12400F | |
| Intel Core i5-13400 | |
| Dota 2 Reborn | |
| 1920x1080 ultra (3/3) best looking | |
| AMD Ryzen 7 7800X3D | |
| AMD Ryzen 9 7950X3D | |
| Intel Core i9-13900K | |
| AMD Ryzen 9 7950X | |
| Intel Core i9-14900K | |
| Intel Core i5-14600K | |
| Intel Core i7-14700K | |
| Intel Core i5-13400 | |
| Intel Core i5-12400F | |
| 1280x720 min (0/3) fastest | |
| AMD Ryzen 7 7800X3D | |
| AMD Ryzen 9 7950X3D | |
| AMD Ryzen 9 7950X | |
| Intel Core i9-14900K | |
| Intel Core i9-13900K | |
| Intel Core i5-14600K | |
| Intel Core i7-14700K | |
| Intel Core i5-12400F | |
| Intel Core i5-13400 | |
| The Witcher 3 | |
| 1920x1080 Ultra Graphics & Postprocessing (HBAO+) | |
| AMD Ryzen 9 7950X | |
| Intel Core i5-14600K | |
| AMD Ryzen 7 7800X3D | |
| Intel Core i9-14900K | |
| AMD Ryzen 9 7950X3D | |
| Intel Core i9-13900K | |
| Intel Core i7-14700K | |
| Intel Core i5-13400 | |
| Intel Core i5-12400F | |
| 1024x768 Low Graphics & Postprocessing | |
| AMD Ryzen 9 7950X3D | |
| AMD Ryzen 7 7800X3D | |
| Intel Core i9-14900K | |
| AMD Ryzen 9 7950X | |
| Intel Core i9-13900K | |
| Intel Core i7-14700K | |
| Intel Core i5-14600K | |
| Intel Core i5-13400 | |
| Intel Core i5-12400F | |
| GTA V | |
| 1920x1080 Highest AA:4xMSAA + FX AF:16x | |
| AMD Ryzen 7 7800X3D | |
| Intel Core i9-14900K | |
| Intel Core i9-13900K | |
| Intel Core i5-14600K | |
| AMD Ryzen 9 7950X | |
| AMD Ryzen 9 7950X3D | |
| Intel Core i7-14700K | |
| Intel Core i5-13400 | |
| Intel Core i5-12400F | |
| 1024x768 Lowest Settings possible | |
| AMD Ryzen 7 7800X3D | |
| AMD Ryzen 9 7950X | |
| Intel Core i9-13900K | |
| AMD Ryzen 9 7950X3D | |
| Intel Core i9-14900K | |
| Intel Core i5-14600K | |
| Intel Core i7-14700K | |
| Intel Core i5-13400 | |
| Intel Core i5-12400F | |
| Borderlands 3 | |
| 1280x720 Very Low Overall Quality (DX11) | |
| AMD Ryzen 7 7800X3D | |
| AMD Ryzen 9 7950X3D | |
| Intel Core i9-14900K | |
| AMD Ryzen 9 7950X | |
| Intel Core i9-13900K | |
| Intel Core i5-14600K | |
| Intel Core i7-14700K | |
| Intel Core i5-13400 | |
| Intel Core i5-12400F | |
| 1920x1080 Badass Overall Quality (DX11) | |
| AMD Ryzen 9 7950X3D | |
| AMD Ryzen 7 7800X3D | |
| Intel Core i9-14900K | |
| Intel Core i9-13900K | |
| AMD Ryzen 9 7950X | |
| Intel Core i5-14600K | |
| Intel Core i7-14700K | |
| Intel Core i5-13400 | |
| Intel Core i5-12400F | |
| Shadow of the Tomb Raider | |
| 1280x720 Lowest Preset | |
| AMD Ryzen 7 7800X3D | |
| AMD Ryzen 9 7950X3D | |
| AMD Ryzen 9 7950X | |
| Intel Core i9-14900K | |
| Intel Core i9-13900K | |
| Intel Core i5-14600K | |
| Intel Core i7-14700K | |
| Intel Core i5-13400 | |
| Intel Core i5-12400F | |
| 1920x1080 Highest Preset AA:T | |
| AMD Ryzen 7 7800X3D | |
| AMD Ryzen 9 7950X3D | |
| Intel Core i9-14900K | |
| Intel Core i9-13900K | |
| AMD Ryzen 9 7950X | |
| Intel Core i5-14600K | |
| Intel Core i7-14700K | |
| Intel Core i5-13400 | |
| Intel Core i5-12400F | |
| Metro Exodus | |
| 1280x720 Low Quality AF:4x | |
| AMD Ryzen 7 7800X3D | |
| Intel Core i9-14900K | |
| AMD Ryzen 9 7950X | |
| Intel Core i5-14600K | |
| AMD Ryzen 9 7950X3D | |
| Intel Core i7-14700K | |
| Intel Core i9-13900K | |
| Intel Core i5-12400F | |
| Intel Core i5-13400 | |
| 1920x1080 Ultra Quality AF:16x | |
| AMD Ryzen 7 7800X3D | |
| Intel Core i9-14900K | |
| Intel Core i5-14600K | |
| AMD Ryzen 9 7950X | |
| Intel Core i7-14700K | |
| AMD Ryzen 9 7950X3D | |
| Intel Core i9-13900K | |
| Intel Core i5-13400 | |
| Intel Core i5-12400F | |
| F1 2021 | |
| 1280x720 Ultra Low Preset | |
| AMD Ryzen 7 7800X3D | |
| Intel Core i9-14900K | |
| AMD Ryzen 9 7950X3D | |
| AMD Ryzen 9 7950X | |
| Intel Core i9-13900K | |
| Intel Core i5-14600K | |
| Intel Core i7-14700K | |
| Intel Core i5-12400F | |
| Intel Core i5-13400 | |
| 1920x1080 Ultra High Preset + Raytracing AA:T AF:16x | |
| AMD Ryzen 7 7800X3D | |
| Intel Core i9-14900K | |
| Intel Core i9-13900K | |
| Intel Core i5-14600K | |
| AMD Ryzen 9 7950X | |
| AMD Ryzen 9 7950X3D | |
| Intel Core i7-14700K | |
| Intel Core i5-12400F | |
| Intel Core i5-13400 | |
Les écarts de performance par rapport au Core i9-14900K et au Ryzen 9 7950X3D existent mais sont comparativement réduits dans les jeux QHD Ultra et 4K Ultra cumulés, car les charges de travail deviennent plus intensives en GPU.
Dans ce scénario, le Core i7-14700K accuse un retard de 9 % par rapport au Core i9-14900K et au Ryzen 9 7950X3D, contre 14 % et 16 %, respectivement, en 720p Low et 1080p Ultra.
| Performance rating - Percent | |
| AMD Ryzen 7 7800X3D | |
| AMD Ryzen 9 7950X3D | |
| Intel Core i9-14900K | |
| Intel Core i5-14600K | |
| AMD Ryzen 9 7950X | |
| Intel Core i9-13900K | |
| Intel Core i7-14700K | |
| Intel Core i5-13400 | |
| Intel Core i5-12400F -1! | |
| F1 22 | |
| 2560x1440 Ultra High Preset AA:T AF:16x | |
| AMD Ryzen 7 7800X3D | |
| Intel Core i9-14900K | |
| Intel Core i5-14600K | |
| AMD Ryzen 9 7950X3D | |
| AMD Ryzen 9 7950X | |
| Intel Core i7-14700K | |
| Intel Core i9-13900K | |
| Intel Core i5-12400F | |
| Intel Core i5-13400 | |
| 3840x2160 Ultra High Preset AA:T AF:16x | |
| AMD Ryzen 7 7800X3D | |
| Intel Core i5-14600K | |
| Intel Core i9-14900K | |
| AMD Ryzen 9 7950X | |
| AMD Ryzen 9 7950X3D | |
| Intel Core i7-14700K | |
| Intel Core i5-12400F | |
| Intel Core i5-13400 | |
| Intel Core i9-13900K | |
| Far Cry 5 | |
| 2560x1440 Ultra Preset AA:T | |
| AMD Ryzen 7 7800X3D | |
| AMD Ryzen 9 7950X3D | |
| Intel Core i9-14900K | |
| Intel Core i9-13900K | |
| Intel Core i5-14600K | |
| AMD Ryzen 9 7950X | |
| Intel Core i7-14700K | |
| Intel Core i5-13400 | |
| Intel Core i5-12400F | |
| 3840x2160 Ultra Preset AA:T | |
| AMD Ryzen 7 7800X3D | |
| Intel Core i9-14900K | |
| AMD Ryzen 9 7950X3D | |
| Intel Core i5-14600K | |
| Intel Core i9-13900K | |
| AMD Ryzen 9 7950X | |
| Intel Core i7-14700K | |
| Intel Core i5-13400 | |
| Intel Core i5-12400F | |
| X-Plane 11.11 - 3840x2160 high (fps_test=3) | |
| AMD Ryzen 7 7800X3D | |
| AMD Ryzen 9 7950X3D | |
| Intel Core i9-13900K | |
| Intel Core i9-14900K | |
| Intel Core i7-14700K | |
| Intel Core i5-14600K | |
| AMD Ryzen 9 7950X | |
| Intel Core i5-13400 | |
| Intel Core i5-12400F | |
| Final Fantasy XV Benchmark | |
| 2560x1440 High Quality | |
| AMD Ryzen 7 7800X3D | |
| Intel Core i9-14900K | |
| Intel Core i5-14600K | |
| AMD Ryzen 9 7950X | |
| AMD Ryzen 9 7950X3D | |
| Intel Core i9-13900K | |
| Intel Core i7-14700K | |
| Intel Core i5-13400 | |
| Intel Core i5-12400F | |
| 3840x2160 High Quality | |
| Intel Core i9-14900K | |
| Intel Core i5-14600K | |
| AMD Ryzen 9 7950X | |
| Intel Core i7-14700K | |
| AMD Ryzen 7 7800X3D | |
| AMD Ryzen 9 7950X3D | |
| Intel Core i5-12400F | |
| Intel Core i9-13900K | |
| Intel Core i5-13400 | |
| Dota 2 Reborn - 3840x2160 ultra (3/3) best looking | |
| AMD Ryzen 7 7800X3D | |
| AMD Ryzen 9 7950X3D | |
| AMD Ryzen 9 7950X | |
| Intel Core i9-13900K | |
| Intel Core i9-14900K | |
| Intel Core i5-14600K | |
| Intel Core i7-14700K | |
| Intel Core i5-12400F | |
| Intel Core i5-13400 | |
| The Witcher 3 - 3840x2160 Ultra Graphics & Postprocessing (HBAO+) | |
| AMD Ryzen 9 7950X | |
| Intel Core i9-14900K | |
| AMD Ryzen 7 7800X3D | |
| Intel Core i5-12400F | |
| Intel Core i5-13400 | |
| Intel Core i5-14600K | |
| AMD Ryzen 9 7950X3D | |
| Intel Core i9-13900K | |
| Intel Core i7-14700K | |
| GTA V | |
| 2560x1440 Highest AA:4xMSAA + FX AF:16x | |
| AMD Ryzen 7 7800X3D | |
| Intel Core i9-14900K | |
| Intel Core i9-13900K | |
| AMD Ryzen 9 7950X | |
| Intel Core i5-14600K | |
| AMD Ryzen 9 7950X3D | |
| Intel Core i7-14700K | |
| Intel Core i5-13400 | |
| Intel Core i5-12400F | |
| 3840x2160 Highest AA:4xMSAA + FX AF:16x | |
| AMD Ryzen 7 7800X3D | |
| Intel Core i9-14900K | |
| Intel Core i5-14600K | |
| AMD Ryzen 9 7950X | |
| Intel Core i9-13900K | |
| AMD Ryzen 9 7950X3D | |
| Intel Core i7-14700K | |
| Intel Core i5-13400 | |
| Borderlands 3 | |
| 2560x1440 Badass Overall Quality (DX11) | |
| AMD Ryzen 7 7800X3D | |
| AMD Ryzen 9 7950X3D | |
| Intel Core i9-14900K | |
| Intel Core i9-13900K | |
| AMD Ryzen 9 7950X | |
| Intel Core i5-14600K | |
| Intel Core i7-14700K | |
| Intel Core i5-13400 | |
| Intel Core i5-12400F | |
| 3840x2160 Badass Overall Quality (DX11) | |
| Intel Core i9-14900K | |
| AMD Ryzen 7 7800X3D | |
| AMD Ryzen 9 7950X3D | |
| Intel Core i5-14600K | |
| AMD Ryzen 9 7950X | |
| Intel Core i9-13900K | |
| Intel Core i7-14700K | |
| Intel Core i5-13400 | |
| Intel Core i5-12400F | |
| Shadow of the Tomb Raider | |
| 2560x1440 Highest Preset AA:T | |
| AMD Ryzen 7 7800X3D | |
| AMD Ryzen 9 7950X3D | |
| Intel Core i9-14900K | |
| Intel Core i9-13900K | |
| AMD Ryzen 9 7950X | |
| Intel Core i5-14600K | |
| Intel Core i7-14700K | |
| Intel Core i5-13400 | |
| Intel Core i5-12400F | |
| 3840x2160 Highest Preset AA:T | |
| Intel Core i9-14900K | |
| Intel Core i5-14600K | |
| AMD Ryzen 7 7800X3D | |
| AMD Ryzen 9 7950X3D | |
| AMD Ryzen 9 7950X | |
| Intel Core i9-13900K | |
| Intel Core i7-14700K | |
| Intel Core i5-13400 | |
| Intel Core i5-12400F | |
| Metro Exodus | |
| 2560x1440 Ultra Quality AF:16x | |
| AMD Ryzen 7 7800X3D | |
| Intel Core i9-14900K | |
| Intel Core i5-14600K | |
| AMD Ryzen 9 7950X | |
| Intel Core i7-14700K | |
| AMD Ryzen 9 7950X3D | |
| Intel Core i9-13900K | |
| Intel Core i5-13400 | |
| Intel Core i5-12400F | |
| 3840x2160 Ultra Quality AF:16x | |
| Intel Core i9-14900K | |
| Intel Core i5-14600K | |
| AMD Ryzen 7 7800X3D | |
| AMD Ryzen 9 7950X | |
| AMD Ryzen 9 7950X3D | |
| Intel Core i7-14700K | |
| Intel Core i9-13900K | |
| Intel Core i5-13400 | |
| Intel Core i5-12400F | |
| F1 2021 | |
| 2560x1440 Ultra High Preset + Raytracing AA:T AF:16x | |
| AMD Ryzen 7 7800X3D | |
| Intel Core i9-14900K | |
| Intel Core i9-13900K | |
| AMD Ryzen 9 7950X3D | |
| Intel Core i5-14600K | |
| AMD Ryzen 9 7950X | |
| Intel Core i7-14700K | |
| Intel Core i5-12400F | |
| Intel Core i5-13400 | |
| 3840x2160 Ultra High Preset + Raytracing AA:T AF:16x | |
| AMD Ryzen 7 7800X3D | |
| AMD Ryzen 9 7950X3D | |
| Intel Core i9-14900K | |
| Intel Core i5-14600K | |
| AMD Ryzen 9 7950X | |
| Intel Core i7-14700K | |
| Intel Core i9-13900K | |
| Intel Core i5-12400F | |
| Intel Core i5-13400 | |
La désactivation des cœurs E supplémentaires permet-elle d'améliorer les jeux ?
Depuis qu'Intel a introduit le multithreading simultané (SMT), alias HyperThreading, sur les processeurs Pentium 4 NetBurst grand public en 2002, les passionnés se sont souvent moqués de la possibilité de désactiver cette fonction pour améliorer les performances dans les jeux de désactiver cette fonction pour améliorer les FPS dans les jeux.
Avec l'introduction d'une architecture de cœur hybride dans Alder Lake, les discussions sur la possibilité de gagner encore plus de fps dans les jeux en désactivant les E-cores à faible IPC ont refait surface.
Certains jeux comme Atlas Fallen ont été connus pour souffrir de des performances lorsque les E-cores sont activés sur les CPU Raptor Lake. Cyberpunk 2077 a récemment reçu une mise à jour Patch 2.11 qui fournit une option permettant d'ignorer le Thread Director d'Intel et l'ordonnancement du système d'exploitation afin de donner la priorité aux P-cores.
Selon Intel, il n'est pas possible de désactiver complètement tous les E-cores du processeur. Par ailleurs, le Core i5-14600K est plus performant que le Core i7-14700K dans les jeux en 1080p et constitue le choix le plus probable pour la grande majorité des joueurs.
Dans cette optique, nous avons testé les performances de jeu du Core i7-14700K avec quatre de ses 12 cœurs E désactivés pour reproduire le nombre de cœurs E du Core i5-14600K.
Au final, le Core i7-14700K avec seulement huit cœurs E fonctionnels est légèrement plus performant dans les jeux. L'avantage exact, s'il y en a un, dépend du jeu lui-même.
Par exemple, Far Cry 5 affiche les gains les plus importants en 1080p Ultra (+19 %) et 720p Low (+31 %) par rapport à la configuration Core i7-14700K par défaut, tandis que Borderlands 3 ne montre aucun avantage à désactiver les E-cores.
D'autres titres tels que Metro Exodus montrent des variations minuscules tandis que les gains dans The Witcher 3 ne représentent pas grand-chose.
| Performance rating - Percent | |
| AMD Ryzen 7 7800X3D | |
| AMD Ryzen 9 7950X3D | |
| Intel Core i9-14900K | |
| AMD Ryzen 9 7950X | |
| Intel Core i9-13900K | |
| Intel Core i5-14600K | |
| Intel Core i7-14700K (8 E-cores) | |
| Intel Core i7-14700K | |
| Intel Core i5-13400 | |
| Intel Core i5-12400F | |
| Far Cry 5 | |
| 1920x1080 Ultra Preset AA:T | |
| AMD Ryzen 7 7800X3D | |
| AMD Ryzen 9 7950X3D | |
| Intel Core i9-14900K | |
| Intel Core i9-13900K | |
| Intel Core i5-14600K | |
| AMD Ryzen 9 7950X | |
| Intel Core i7-14700K (8 E-cores) | |
| Intel Core i7-14700K | |
| Intel Core i5-13400 | |
| Intel Core i5-12400F | |
| 1280x720 Low Preset AA:T | |
| AMD Ryzen 7 7800X3D | |
| AMD Ryzen 9 7950X3D | |
| Intel Core i9-14900K | |
| Intel Core i5-14600K | |
| Intel Core i9-13900K | |
| AMD Ryzen 9 7950X | |
| Intel Core i7-14700K (8 E-cores) | |
| Intel Core i5-13400 | |
| Intel Core i7-14700K | |
| Intel Core i5-12400F | |
| X-Plane 11.11 | |
| 1920x1080 high (fps_test=3) | |
| AMD Ryzen 7 7800X3D | |
| AMD Ryzen 9 7950X3D | |
| Intel Core i9-13900K | |
| Intel Core i9-14900K | |
| Intel Core i7-14700K | |
| AMD Ryzen 9 7950X | |
| Intel Core i5-14600K | |
| Intel Core i7-14700K (8 E-cores) | |
| Intel Core i5-13400 | |
| Intel Core i5-12400F | |
| 1280x720 low (fps_test=1) | |
| Intel Core i9-13900K | |
| Intel Core i9-14900K | |
| Intel Core i7-14700K (8 E-cores) | |
| Intel Core i5-14600K | |
| Intel Core i7-14700K | |
| AMD Ryzen 9 7950X3D | |
| AMD Ryzen 9 7950X | |
| AMD Ryzen 7 7800X3D | |
| Intel Core i5-13400 | |
| Intel Core i5-12400F | |
| Final Fantasy XV Benchmark | |
| 1920x1080 High Quality | |
| Intel Core i9-14900K | |
| AMD Ryzen 9 7950X | |
| AMD Ryzen 7 7800X3D | |
| Intel Core i5-14600K | |
| Intel Core i7-14700K (8 E-cores) | |
| AMD Ryzen 9 7950X3D | |
| Intel Core i9-13900K | |
| Intel Core i7-14700K | |
| Intel Core i5-13400 | |
| Intel Core i5-12400F | |
| 1280x720 Lite Quality | |
| AMD Ryzen 9 7950X | |
| Intel Core i9-13900K | |
| AMD Ryzen 7 7800X3D | |
| Intel Core i5-14600K | |
| Intel Core i7-14700K (8 E-cores) | |
| Intel Core i9-14900K | |
| Intel Core i7-14700K | |
| AMD Ryzen 9 7950X3D | |
| Intel Core i5-12400F | |
| Intel Core i5-13400 | |
| Dota 2 Reborn | |
| 1920x1080 ultra (3/3) best looking | |
| AMD Ryzen 7 7800X3D | |
| AMD Ryzen 9 7950X3D | |
| Intel Core i9-13900K | |
| AMD Ryzen 9 7950X | |
| Intel Core i9-14900K | |
| Intel Core i5-14600K | |
| Intel Core i7-14700K (8 E-cores) | |
| Intel Core i7-14700K | |
| Intel Core i5-13400 | |
| Intel Core i5-12400F | |
| 1280x720 min (0/3) fastest | |
| AMD Ryzen 7 7800X3D | |
| AMD Ryzen 9 7950X3D | |
| AMD Ryzen 9 7950X | |
| Intel Core i9-14900K | |
| Intel Core i9-13900K | |
| Intel Core i5-14600K | |
| Intel Core i7-14700K (8 E-cores) | |
| Intel Core i7-14700K | |
| Intel Core i5-12400F | |
| Intel Core i5-13400 | |
| The Witcher 3 | |
| 1920x1080 Ultra Graphics & Postprocessing (HBAO+) | |
| AMD Ryzen 9 7950X | |
| Intel Core i5-14600K | |
| AMD Ryzen 7 7800X3D | |
| Intel Core i9-14900K | |
| AMD Ryzen 9 7950X3D | |
| Intel Core i7-14700K (8 E-cores) | |
| Intel Core i9-13900K | |
| Intel Core i7-14700K | |
| Intel Core i5-13400 | |
| Intel Core i5-12400F | |
| 1024x768 Low Graphics & Postprocessing | |
| AMD Ryzen 9 7950X3D | |
| AMD Ryzen 7 7800X3D | |
| Intel Core i9-14900K | |
| AMD Ryzen 9 7950X | |
| Intel Core i9-13900K | |
| Intel Core i7-14700K (8 E-cores) | |
| Intel Core i7-14700K | |
| Intel Core i5-14600K | |
| Intel Core i5-13400 | |
| Intel Core i5-12400F | |
| Borderlands 3 | |
| 1280x720 Very Low Overall Quality (DX11) | |
| AMD Ryzen 7 7800X3D | |
| AMD Ryzen 9 7950X3D | |
| Intel Core i9-14900K | |
| AMD Ryzen 9 7950X | |
| Intel Core i9-13900K | |
| Intel Core i5-14600K | |
| Intel Core i7-14700K | |
| Intel Core i7-14700K (8 E-cores) | |
| Intel Core i5-13400 | |
| Intel Core i5-12400F | |
| 1920x1080 Badass Overall Quality (DX11) | |
| AMD Ryzen 9 7950X3D | |
| AMD Ryzen 7 7800X3D | |
| Intel Core i9-14900K | |
| Intel Core i9-13900K | |
| AMD Ryzen 9 7950X | |
| Intel Core i5-14600K | |
| Intel Core i7-14700K | |
| Intel Core i7-14700K (8 E-cores) | |
| Intel Core i5-13400 | |
| Intel Core i5-12400F | |
| Metro Exodus | |
| 1280x720 Low Quality AF:4x | |
| AMD Ryzen 7 7800X3D | |
| Intel Core i9-14900K | |
| AMD Ryzen 9 7950X | |
| Intel Core i5-14600K | |
| AMD Ryzen 9 7950X3D | |
| Intel Core i7-14700K (8 E-cores) | |
| Intel Core i7-14700K | |
| Intel Core i9-13900K | |
| Intel Core i5-12400F | |
| Intel Core i5-13400 | |
| 1920x1080 Ultra Quality AF:16x | |
| AMD Ryzen 7 7800X3D | |
| Intel Core i9-14900K | |
| Intel Core i5-14600K | |
| AMD Ryzen 9 7950X | |
| Intel Core i7-14700K (8 E-cores) | |
| Intel Core i7-14700K | |
| AMD Ryzen 9 7950X3D | |
| Intel Core i9-13900K | |
| Intel Core i5-13400 | |
| Intel Core i5-12400F | |
Intel Core i7-14700K with Nvidia GeForce RTX 4090
| Bas | Moyen | Élevé | Ultra | QHD | 4K DLSS | 4K | |
|---|---|---|---|---|---|---|---|
| GTA V (2015) | 187.6 | 187.4 | 185.6 | 151.2 | 151.2 | 185.9 | |
| The Witcher 3 (2015) | 634 | 572 | 531 | 287 | 250 | 274 | |
| Dota 2 Reborn (2015) | 239.4 | 226.7 | 213.4 | 200 | 198.1 | ||
| Final Fantasy XV Benchmark (2018) | 235 | 236 | 228 | 219 | 159.2 | ||
| X-Plane 11.11 (2018) | 227 | 199.8 | 151.7 | 128.2 | |||
| Far Cry 5 (2018) | 180 | 165 | 163 | 154 | 155 | 152 | |
| Strange Brigade (2018) | 577 | 512 | 468 | 463 | 454 | 273 | |
| Shadow of the Tomb Raider (2018) | 278 | 270 | 268 | 266 | 258 | 180.4 | |
| Metro Exodus (2019) | 289 | 261 | 227 | 194.7 | 181.3 | 138.5 | |
| Borderlands 3 (2019) | 220 | 191.9 | 178.1 | 170.4 | 171.6 | 132.6 | |
| F1 2021 (2021) | 547 | 517 | 476 | 260 | 257 | 194.9 | |
| Far Cry 6 (2021) | 222 | 205 | 187 | 175 | 168 | 135 | |
| Tiny Tina's Wonderlands (2022) | 402 | 349 | 300 | 277 | 223 | 127.9 | |
| F1 22 (2022) | 359 | 372 | 351 | 187 | 151.1 | 82.3 | |
| The Witcher 3 v4 (2023) | 354 | 297 | 269 | 230 | 172.9 | 85.4 | |
| F1 23 (2023) | 345 | 364 | 346 | 190.7 | 152.5 | 131 | 79.7 |
| Cyberpunk 2077 (2023) | 183.2 | 182.2 | 171.7 | 166.3 | 144.8 | 71.8 | |
| Assassin's Creed Mirage (2023) | 259 | 247 | 241 | 185 | 176 | 154 | 125 |
| Call of Duty Modern Warfare 3 2023 (2023) | 277 | 272 | 258 | 251 | 216 | 167 | 156 |
Consommation d'énergie : Zen 4 continue d'éclipser Intel en matière d'efficacité énergétique
Comme pour les ordinateurs portables, les modèles Zen 4 d'AMD continuent d'afficher une excellente efficacité énergétique par rapport à la concurrence Raptor Lake-S d'Intel.
Bien que le Core i7-14700K affiche une efficacité énergétique supérieure de 17 % par rapport au Core i5-14600K dans le Cinebench R23 multicore, le Ryzen 9 7950X3D parvient à une avance impressionnante de 45 % malgré les scores similaires des deux CPU dans le benchmark.
Le système basé sur le Core i9-14900K tire 537 W du mur lors d'un stress Prime95 in-place large FFTs, ce qui est 26% plus élevé que la consommation totale du Core i7-14700K de 400 W. Ce chiffre est à son tour 45% plus élevé que la consommation totale du Core i7-14700K dans Cinebench R23 multicœur. Cette consommation est à son tour supérieure de 45 % à celle d'un PC Ryzen 9 7950X3D.
Power Consumption: External monitor
| Power Consumption / Cinebench R23 Multi Power Efficiency - external Monitor | |
| AMD Ryzen 9 7950X3D, NVIDIA GeForce RTX 4090 | |
| AMD Ryzen 7 7800X3D, NVIDIA GeForce RTX 4090 | |
| Intel Core i7-14700K, NVIDIA GeForce RTX 4090 | |
| Intel Core i9-14900K, NVIDIA GeForce RTX 4090 | |
| Intel Core i5-14600K, NVIDIA GeForce RTX 4090 | |
| Power Consumption / Witcher 3 ultra Efficiency (external Monitor) | |
| AMD Ryzen 7 7800X3D, NVIDIA GeForce RTX 4090 | |
| Intel Core i5-12400F, NVIDIA GeForce RTX 4090 | |
| AMD Ryzen 9 7950X3D, NVIDIA GeForce RTX 4090 | |
| Intel Core i9-14900K, NVIDIA GeForce RTX 4090 | |
| Intel Core i5-14600K, NVIDIA GeForce RTX 4090 | |
| Intel Core i5-13400, NVIDIA GeForce RTX 4090 | |
| Intel Core i7-14700K, NVIDIA GeForce RTX 4090 | |
| Intel Core i5-13600K, NVIDIA GeForce RTX 3090 | |
| AMD Ryzen 5 7600X, NVIDIA GeForce RTX 3090 | |
| AMD Ryzen 9 7950X, NVIDIA GeForce RTX 3090 | |
| Intel Core i5-12600K, NVIDIA Titan RTX | |
| AMD Ryzen 9 7900X, NVIDIA GeForce RTX 3090 | |
| Intel Core i9-13900K, NVIDIA GeForce RTX 3090 | |
| AMD Ryzen 9 5950X, NVIDIA Titan RTX | |
| Intel Core i9-12900K, NVIDIA Titan RTX | |
| Power Consumption / Cinebench R15 Multi (external Monitor) | |
| Intel Core i9-14900K, NVIDIA GeForce RTX 4090 | |
| Intel Core i9-13900K, NVIDIA GeForce RTX 3090 | |
| Intel Core i7-14700K, NVIDIA GeForce RTX 4090 | |
| Intel Core i5-14600K, NVIDIA GeForce RTX 4090 | |
| Intel Core i9-12900K, NVIDIA Titan RTX (Idle: 70.5 W) | |
| AMD Ryzen 9 7950X, NVIDIA GeForce RTX 3090 | |
| AMD Ryzen 9 7900X, NVIDIA GeForce RTX 3090 | |
| Intel Core i5-13600K, NVIDIA GeForce RTX 3090 | |
| AMD Ryzen 9 7950X3D, NVIDIA GeForce RTX 4090 | |
| AMD Ryzen 9 5950X, NVIDIA Titan RTX (Idle: 78 W) | |
| AMD Ryzen 5 7600X, NVIDIA GeForce RTX 3090 | |
| AMD Ryzen 7 7800X3D, NVIDIA GeForce RTX 4090 | |
| Intel Core i5-12600K, NVIDIA Titan RTX (Idle: 70.45 W) | |
| Intel Core i5-13400, NVIDIA GeForce RTX 4090 | |
| Intel Core i5-12400F, NVIDIA GeForce RTX 4090 | |
| Power Consumption / Cinebench R23 Single (external Monitor) | |
| AMD Ryzen 7 7800X3D, NVIDIA GeForce RTX 4090 | |
| Intel Core i7-14700K, NVIDIA GeForce RTX 4090 | |
| Intel Core i9-14900K, NVIDIA GeForce RTX 4090 | |
| Intel Core i5-14600K, NVIDIA GeForce RTX 4090 | |
| Power Consumption / Cinebench R23 Multi (external Monitor) | |
| Intel Core i9-14900K, NVIDIA GeForce RTX 4090 | |
| Intel Core i7-14700K, NVIDIA GeForce RTX 4090 | |
| Intel Core i5-14600K, NVIDIA GeForce RTX 4090 | |
| AMD Ryzen 9 7950X3D, NVIDIA GeForce RTX 4090 | |
| AMD Ryzen 7 7800X3D, NVIDIA GeForce RTX 4090 | |
| Power Consumption / The Witcher 3 ultra (external Monitor) | |
| Intel Core i5-14600K, NVIDIA GeForce RTX 4090 | |
| Intel Core i9-14900K, NVIDIA GeForce RTX 4090 | |
| AMD Ryzen 9 7900X, NVIDIA GeForce RTX 3090 | |
| AMD Ryzen 9 7950X, NVIDIA GeForce RTX 3090 | |
| Intel Core i9-13900K, NVIDIA GeForce RTX 3090 | |
| Intel Core i7-14700K, NVIDIA GeForce RTX 4090 | |
| AMD Ryzen 5 7600X, NVIDIA GeForce RTX 3090 | |
| AMD Ryzen 9 7950X3D, NVIDIA GeForce RTX 4090 | |
| Intel Core i5-13600K, NVIDIA GeForce RTX 3090 | |
| Intel Core i5-13400, NVIDIA GeForce RTX 4090 | |
| AMD Ryzen 7 7800X3D, NVIDIA GeForce RTX 4090 | |
| Intel Core i9-12900K, NVIDIA Titan RTX (Idle: 70.5 W) | |
| AMD Ryzen 9 5950X, NVIDIA Titan RTX (Idle: 78 W) | |
| Intel Core i5-12400F, NVIDIA GeForce RTX 4090 | |
| Intel Core i5-12600K, NVIDIA Titan RTX (Idle: 70.45 W) | |
| Power Consumption / Prime95 V2810 Stress (external Monitor) | |
| Intel Core i9-14900K, NVIDIA GeForce RTX 4090 | |
| Intel Core i9-13900K, NVIDIA GeForce RTX 3090 | |
| Intel Core i7-14700K, NVIDIA GeForce RTX 4090 | |
| Intel Core i5-14600K, NVIDIA GeForce RTX 4090 | |
| Intel Core i5-13600K, NVIDIA GeForce RTX 3090 | |
| AMD Ryzen 9 7950X, NVIDIA GeForce RTX 3090 | |
| AMD Ryzen 9 7900X, NVIDIA GeForce RTX 3090 | |
| Intel Core i9-12900K, NVIDIA Titan RTX (Idle: 70.5 W) | |
| AMD Ryzen 9 7950X3D, NVIDIA GeForce RTX 4090 | |
| Intel Core i5-12600K, NVIDIA Titan RTX (Idle: 70.45 W) | |
| AMD Ryzen 9 5950X, NVIDIA Titan RTX (Idle: 78 W) | |
| Intel Core i5-12400F, NVIDIA GeForce RTX 4090 | |
| Intel Core i5-13400, NVIDIA GeForce RTX 4090 | |
| AMD Ryzen 5 7600X, NVIDIA GeForce RTX 3090 | |
| AMD Ryzen 7 7800X3D, NVIDIA GeForce RTX 4090 | |
* ... Moindre est la valeur, meilleures sont les performances
Points positifs
Points négatifs
Verdict : Pratiquement indiscernable des Core i9-13900K et Ryzen 9 7950X3D pour la productivité

Avec la décision d'Intel de faire de Meteor Lake uniquement pour les ordinateurs portables, les utilisateurs d'ordinateurs de bureau doivent faire face à des pièces Raptor Lake-S rafraîchies. Le Core i7-14700K et son homologue KF sont des SKU uniques dans la gamme Intel 14th gen Raptor Lake-S Refresh, étant les seuls à avoir reçu une augmentation du nombre de cœurs et de threads avec leur configuration 20C/28T.
Cette augmentation du nombre de cœurs et de threads permet au Core i7-14700K de se rapprocher de mastodontes tels que l'AMD Ryzen 9 7950X3D (+2%) et le Core i9-13900K (+4%) dans les benchmarks CPU cumulés, tout en restant à portée de main de l'AMD Ryzen 9 7950X (+5%) et du Core i9-14900K (+9%).
L'Intel Core i7-14700K est une étoile solitaire dans la gamme de la 14e génération qui offre des niveaux de performance Core i9-13900K grâce à sa configuration unique 20C/28T. Cependant, il n'y a guère de raison de passer à la version supérieure à la 13e génération, en particulier pour les joueurs
La situation est quelque peu différente pour les joueurs. Le Core i7-14700K constitue à lui seul un bon processeur de jeu, mais le Core i5-14600K (US$300 sur Amazon) et le Ryzen 7 7800X3D (US$369 sur Amazon) ont plus de sens si le jeu est votre priorité. Bien que les huit cœurs P du Core i7-14700K soient certainement les bienvenus, les cœurs E supplémentaires semblent provoquer une régression dans les charges de travail liées aux jeux. Les gains perceptibles à la suite de la désactivation de quatre des 12 cœurs E corroborent ce fait.
Bien entendu, cela dépend fortement du jeu et de l'efficacité avec laquelle il peut utiliser les threads disponibles. Les Core i9 peuvent contourner ce problème grâce à leurs boosts accrus sur les cœurs P et E, ainsi qu'à des caches plus importants. C'est d'ailleurs la raison pour laquelle les Ryzen 7 7800X3D et Ryzen 9 7950X3D (599 € sur Amazon) sont les meilleurs CPU pour les jeux.
Le Core i7-14700K se vend actuellement à environ 400 dollars. À ce prix, il est certainement moins cher que le Core i9-13900K (525 USD sur Amazon) et le Core i9-14900K (545 USD sur Amazon) tout en offrant des performances comparables dans les tâches spécifiques au processeur. L'AMD Ryzen 9 7900X
(<a href="https://www.amazon.com/AMD-7900X-24-Thread-Unlocked-Processor/dp/B0BBJ59WJ4?tag=nbcnewsnet-20" target="_blank" rel="sponsored">383,55 $ sur Amazon</a>) est l'équivalent le plus proche de Team Red en termes de prix. Cependant, le Core i7-14700K présente de nets avantages dans les tests simples et multicœurs.</p> <p style>Franchement, il n'y a pas grand-chose qui sépare les 13e et 14e générations de CPU Raptor Lake-S, vous devriez donc pouvoir vous contenter de processeurs de l'une ou l'autre génération pour toutes les questions pratiques. L'opportunité de passer à un Core i7-14700K dépend uniquement du prix et de votre configuration actuelle.<br> </p>Vous passez d'un processeur Alder Lake-S ou inférieur ? Probablement oui. Vous venez d'un Core i7-13700K ? Pas du tout. Vous recherchez une puce de jeu plus économe en énergie ? Optez pour le Zen 4.<br>
Prix et disponibilité
L'Intel Core i7-14700K est actuellement disponible au prix de 400 dollars sur Amazon US et Best Buy, tandis que le Core i7-14700KF sans iGPU est disponible au prix d'environ 393 dollars.
En Inde, le Core i7-14700K et le Core i7-14700KF se vendent actuellement ₹45,899 et ₹44,999, respectivement, sur Amazon IN, bien que vous puissiez les obtenir pour beaucoup moins cher chez d'autres détaillants locaux.
Transparency
La sélection des appareils à examiner est effectuée par notre équipe éditoriale. L'échantillon de test a été prêté à l'auteur par le fabricant ou le détaillant pour les besoins de cet examen. Le prêteur n'a pas eu d'influence sur cette évaluation et le fabricant n'a pas reçu de copie de cette évaluation avant sa publication. Il n'y avait aucune obligation de publier cet article. En tant que média indépendant, Notebookcheck n'est pas soumis à l'autorité des fabricants, des détaillants ou des éditeurs.
Voici comment Notebookcheck teste
Chaque année, Notebookcheck examine de manière indépendante des centaines d'ordinateurs portables et de smartphones en utilisant des procédures standardisées afin de garantir que tous les résultats sont comparables. Nous avons continuellement développé nos méthodes de test depuis environ 20 ans et avons établi des normes industrielles dans le processus. Dans nos laboratoires de test, des équipements de mesure de haute qualité sont utilisés par des techniciens et des rédacteurs expérimentés. Ces tests impliquent un processus de validation en plusieurs étapes. Notre système d'évaluation complexe repose sur des centaines de mesures et de points de référence bien fondés, ce qui garantit l'objectivité.Price comparison

