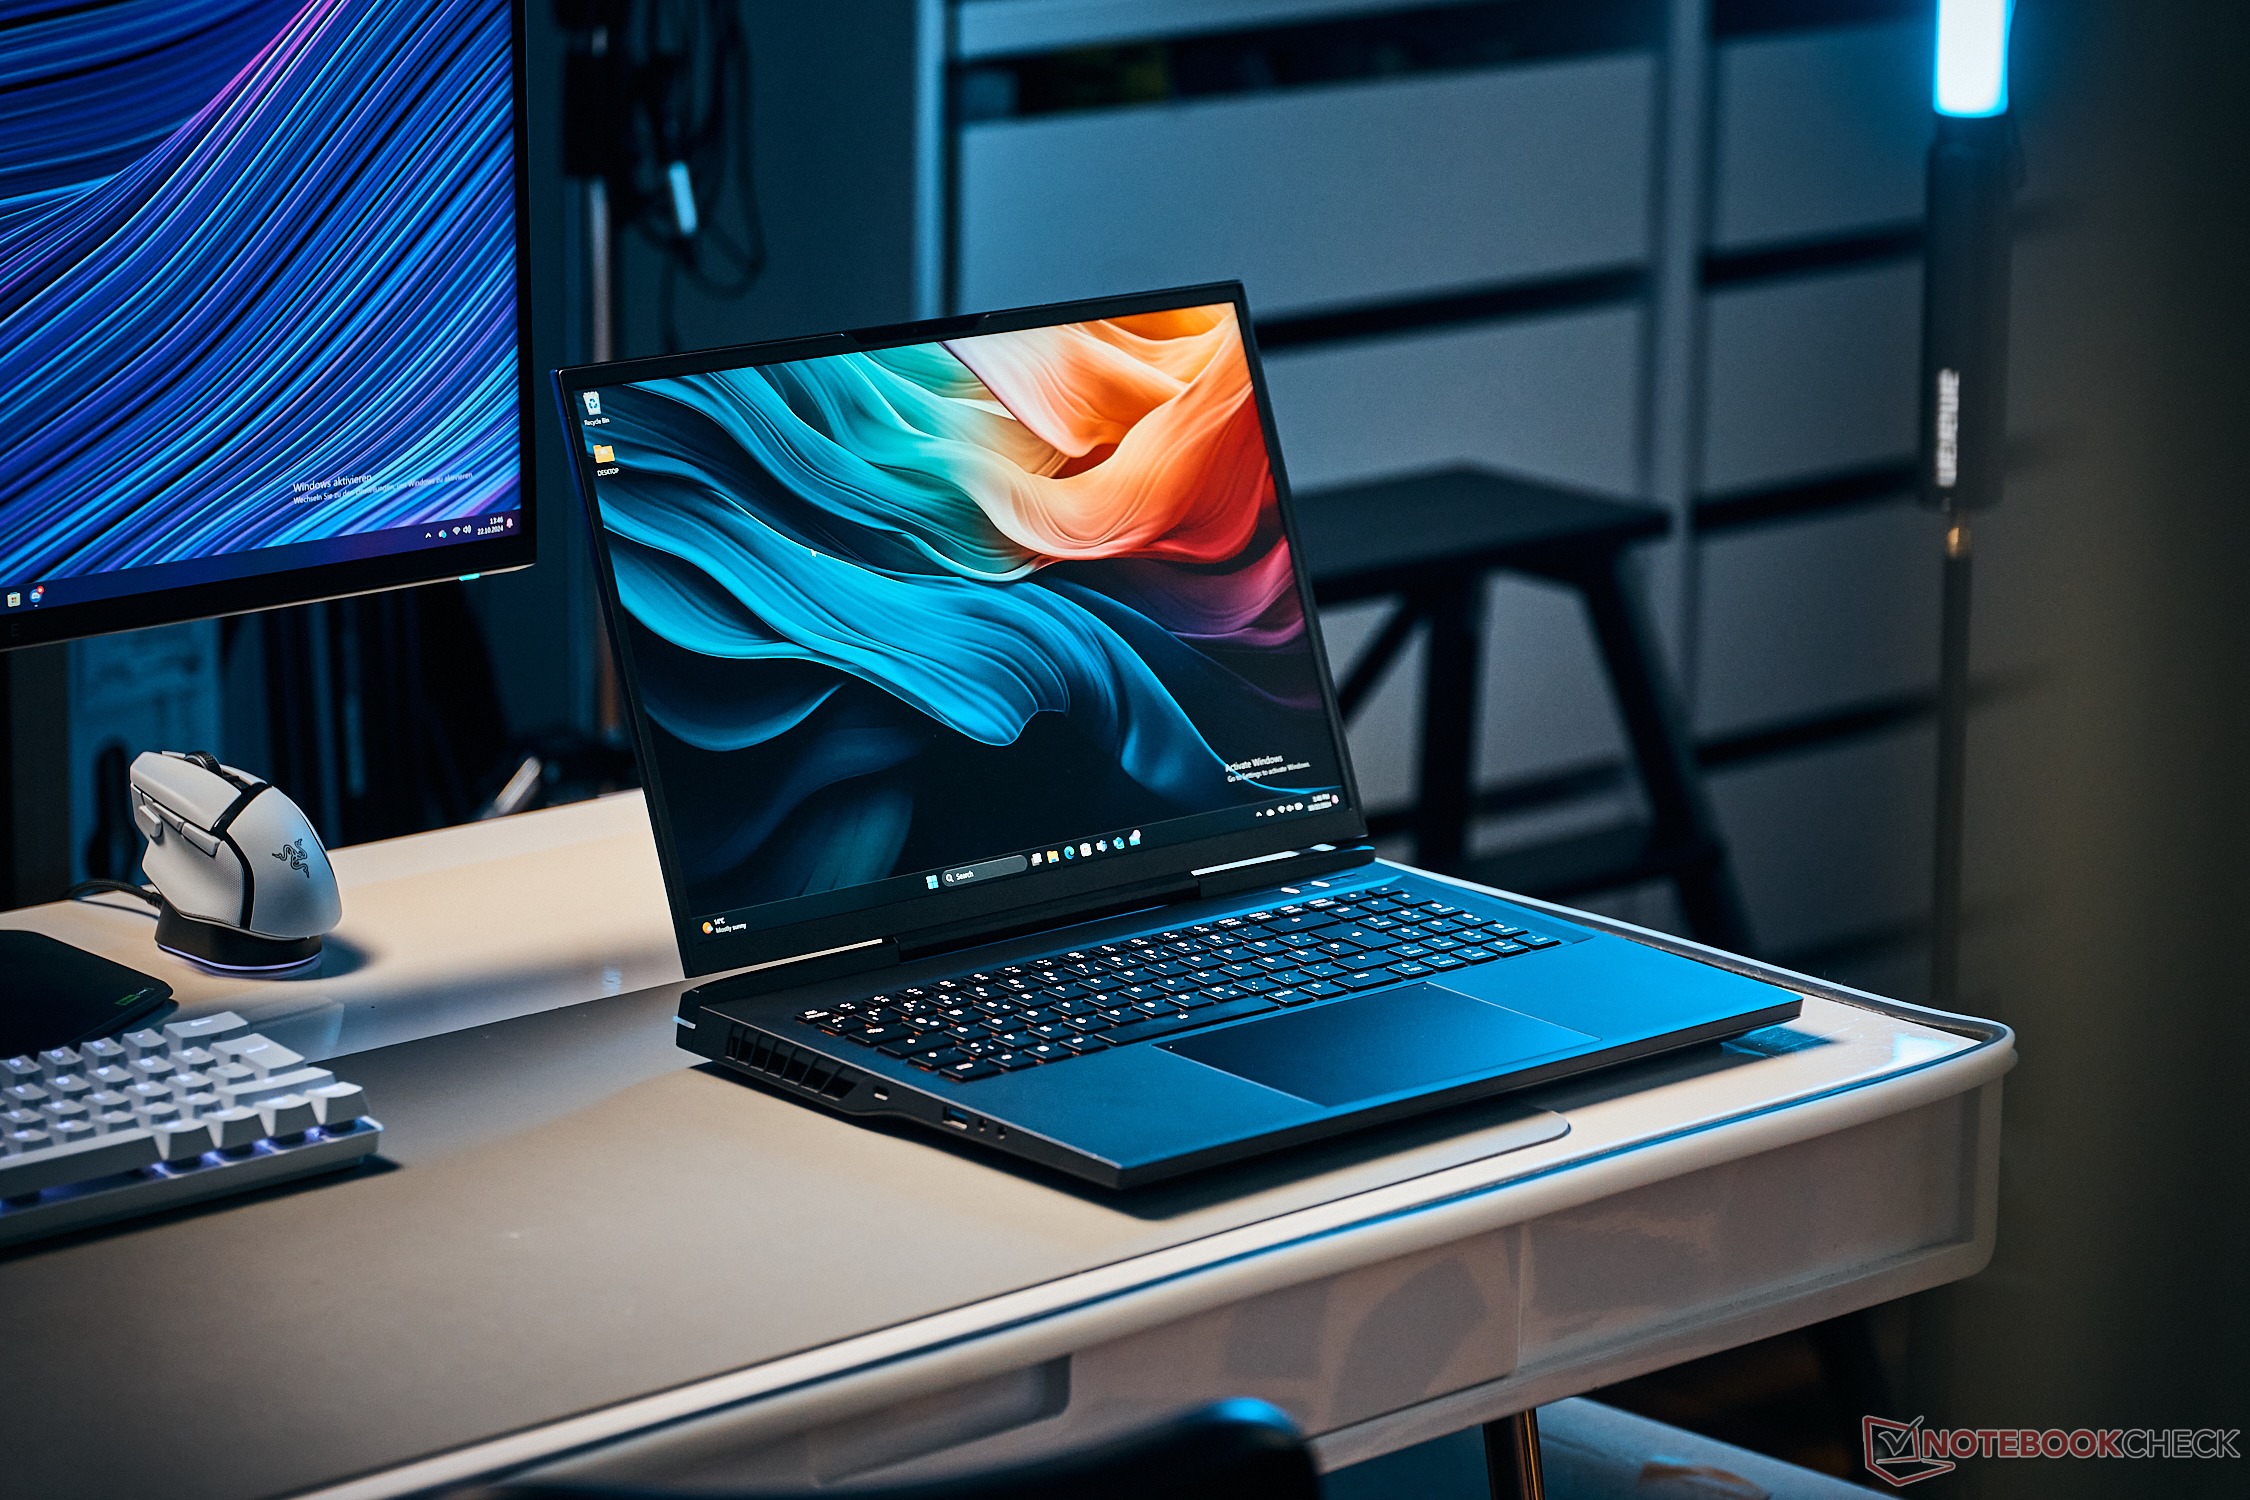
Test du XMG Neo 17 E24 : PC portable de jeu rapide avec refroidissement à eau en option
Ordinateur portable RTX 4080 et clavier mécanique.
Avec le XMG Neo 17, vous obtenez un gamer pur-sang qui peut être équipé des composants les plus rapides du marché. Un clavier mécanique Cherry et un système de refroidissement externe à l'eau sont également disponibles en option, ce qui réduit non seulement les températures mais aussi le bruit de fond.Andreas Osthoff, 👁 Andreas Osthoff (traduit par DeepL / Ninh Duy) Publié 🇺🇸 🇩🇪 ...
Verdict - Le XMG Neo 17 se concentre sur les performances de jeu
Le XMG Neo 17 se présente dans le test comme un ordinateur portable de jeu puissant avec un accent évident sur la performance maximale des composants. Le processeur Intel Core i9-14900HX est utilisé dans toutes les configurations, tandis que les GPU Nvidia dédiés peuvent être overclockés. Le résultat est l'un des ordinateurs portables RTX 4080 les plus rapides que nous ayons testés à ce jour. Les performances sont suffisantes pour l'écran QHD de 240 Hz, qui est également très adapté aux jeux. Le circuit pour le refroidissement à l'eau Oasis externe optionnel a été amélioré et couvre maintenant aussi le processeur. Il en résulte des températures nettement plus basses et, par conséquent, un niveau de bruit plus faible lors des jeux.
Le gamer fait également bonne figure dans d'autres domaines : il y a suffisamment de ports disponibles, le boîtier est de bonne qualité et le clavier mécanique Cherry en option est très bon, mais aussi très bruyant. La capacité de la mémoire vive et des disques durs peut également être configurée et une mise à niveau ultérieure ne pose aucun problème. L'ordinateur portable de 17 pouces est relativement grand et n'est pas léger, puisqu'il pèse un peu moins de 3 kg. L'unité de refroidissement fait du bon travail même sans le refroidissement à l'eau Oasis, mais les ventilateurs sont très bruyants lorsque vous jouez et vous devriez utiliser des écouteurs.
En termes de prix, plus de 3 000 euros n'est évidemment pas une bonne affaire, mais cela est principalement dû au GPU GeForce. Si vous êtes à la recherche d'un gamer pur-sang et que vous souhaitez profiter du refroidissement par eau, le XMG Neo 17 est sans aucun doute un bon choix.
Points positifs
Points négatifs
Prix et disponibilité
Le Schenker Neo 17 E24 peut être configuré et commandé directement auprès de Bestware. Le prix de départ est de 1 949 euros pour la configuration avec l'ordinateur portable RTX 4060 et de 2 924 euros pour l'ordinateur portable RTX 4080.
Comparaison des alternatives possibles
Image | Modèle | Geizhals | Poids | Épaisseur | Écran |
|---|---|---|---|---|---|
| Schenker XMG Neo 17 E24 Intel Core i9-14900HX ⎘ NVIDIA GeForce RTX 4080 Laptop GPU ⎘ 32 Go Mémoire, 1024 Go SSD | Listenpreis 3189€ | 2.9 kg | 27 mm | 17.00" 2560x1600 178 PPI IPS | |
| Medion Erazer Beast X40 2024 Intel Core i9-14900HX ⎘ NVIDIA GeForce RTX 4090 Laptop GPU ⎘ 32 Go Mémoire, 1024 Go SSD | Listenpreis 4000 Euro | 2.9 kg | 36 mm | 17.00" 2560x1600 178 PPI IPS | |
| HP Omen 17-db0079ng AMD Ryzen 7 8845HS ⎘ NVIDIA GeForce RTX 4070 Laptop GPU ⎘ 32 Go Mémoire, 1024 Go SSD | Listenpreis 1900€ | 2.8 kg | 30.1 mm | 17.30" 2560x1440 170 PPI IPS | |
| Eurocom Raptor X17 Core i9-14900HX Intel Core i9-14900HX ⎘ NVIDIA GeForce RTX 4090 Laptop GPU ⎘ 32 Go Mémoire, 2048 Go SSD | Listenpreis 4500 USD | 3.4 kg | 24.9 mm | 17.30" 3840x2160 255 PPI IPS | |
| MSI GE78HX 13VH-070US Intel Core i9-13950HX ⎘ NVIDIA GeForce RTX 4080 Laptop GPU ⎘ 32 Go Mémoire, 2048 Go SSD | Listenpreis 3600 USD | 3 kg | 23 mm | 17.00" 2560x1600 178 PPI IPS |
Top 10
» Le Top 10 des PC portables multimédia
» Le Top 10 des PC portables de jeu
» Le Top 10 des PC portables de jeu légers
» Le Top 10 des ordinateurs portables bureautiques
» Le Top 10 des PC portables bureautiques premium/professionnels
» Le Top 10 des Stations de travail mobiles
» Le Top 10 des Ultraportables
» Le Top 10 des Ultrabooks
» Le Top 10 des Convertibles
» Le Top 10 des Tablettes
» Le Top 10 des Tablettes Windows
» Le Top 10 des Smartphones
» Le Top 10 des PC Portables á moins de 300 euros
» Le Top 10 des PC Portables á moins de 500 euros
» Le Top 25 des meilleurs écrans d'ordinateurs
Avec le XMG Neo 17 E24, Schenker propose un puissant ordinateur portable de jeu de 17 pouces doté d'un écran QHD de 240 Hz (G-Sync). Le processeur est toujours le Core i9-14900HX d'Intel et pour la carte graphique, vous avez le choix entre le Ordinateur portable Nvidia GeForce RTX 4060 et tous les autres modèles jusqu'à la GeForce Ordinateur portable RTX 4090. La mémoire RAM/SSD peut être configurée de manière extensive et, en plus d'un clavier mécanique, le système externe de refroidissement à l'eau Oasis est également disponible en option, ce qui peut augmenter de manière significative la capacité de refroidissement de l'ordinateur portable.
Notre appareil de test est équipé d'un ordinateur portable dédié à la GeForce RTX 4080 laptop De 32 Go de RAM et d'un disque dur SSD de 1 To de Samsung, ce qui porte le prix, avec le clavier mécanique Cherry, à 3 182 euros (prix de base : 1 948 euros). Nous avons également jeté un coup d'œil à quelques benchmarks du Neo 17 avec l'ordinateur portable RTX 4090 en combinaison avec le système de refroidissement à l'eau Oasis (199 €).
Spécifications
Mallette et équipement
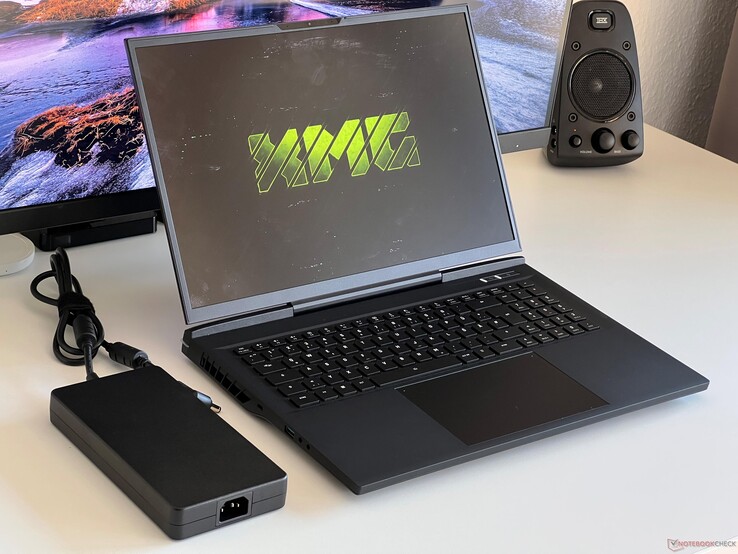
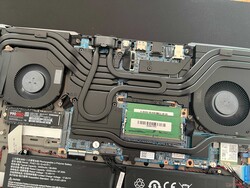
Nous connaissons déjà le châssis en métal noir et l'unité de base caoutchoutée du Medion Erazer Beastqui est basé sur le même barebone. Il y a une bande LED à l'arrière et un logo XMG sur le couvercle, mais sinon, il n'y a pas d'autocollants gênants du fabricant. La stabilité générale est très bonne, mais avec un poids d'un peu moins de 2,9 kg et une hauteur de 2,7 cm, le Neo 17 n'est pas léger non plus. Le couvercle du boîtier inférieur peut être retiré relativement facilement (les deux vis de la connexion de refroidissement par eau doivent également être desserrées) et vous pouvez accéder à tous les composants importants, y compris la RAM, 2x M.2-2280 SSD, ou le module WLAN.
La gamme de connexions est très étendue puisque, en plus des ports USB suffisants, Thunderbolt 4 et HDMI sont également disponibles. Le lecteur de cartes atteint des taux de transfert moyens avec notre carte de référence (Angelbird AV Pro V60) et la webcam 1080p prend des photos suffisamment nettes. Le module Wi-Fi 6E d'Intel (AX211) atteint de très bons taux de transfert avec notre routeur de référence, mais la dernière norme Wi-Fi 7 n'est pas encore prise en charge.
| SD Card Reader | |
| average JPG Copy Test (av. of 3 runs) | |
| Moyenne de la classe Gaming (20 - 210, n=65, 2 dernières années) | |
| Schenker XMG Neo 17 E24 (Angelbird AV Pro V60) | |
| Medion Erazer Beast X40 2024 (AV PRO microSD 128 GB V60) | |
| MSI GE78HX 13VH-070US (Angelibird AV Pro V60) | |
| maximum AS SSD Seq Read Test (1GB) | |
| Moyenne de la classe Gaming (25.5 - 261, n=62, 2 dernières années) | |
| Medion Erazer Beast X40 2024 (AV PRO microSD 128 GB V60) | |
| MSI GE78HX 13VH-070US (Angelibird AV Pro V60) | |
| Schenker XMG Neo 17 E24 (Angelbird AV Pro V60) | |
| Networking | |
| Schenker XMG Neo 17 E24 | |
| iperf3 transmit AXE11000 | |
| iperf3 receive AXE11000 | |
| Medion Erazer Beast X40 2024 | |
| iperf3 transmit AXE11000 | |
| iperf3 receive AXE11000 | |
| HP Omen 17-db0079ng | |
| iperf3 transmit AXE11000 | |
| iperf3 receive AXE11000 | |
| Eurocom Raptor X17 Core i9-14900HX | |
| iperf3 transmit AXE11000 | |
| iperf3 receive AXE11000 | |
| iperf3 transmit AXE11000 6GHz | |
| iperf3 receive AXE11000 6GHz | |
| MSI GE78HX 13VH-070US | |
| iperf3 transmit AXE11000 | |
| iperf3 receive AXE11000 | |
| iperf3 transmit AXE11000 6GHz | |
| iperf3 receive AXE11000 6GHz | |

Périphériques d'entrée - Clavier mécanique Cherry
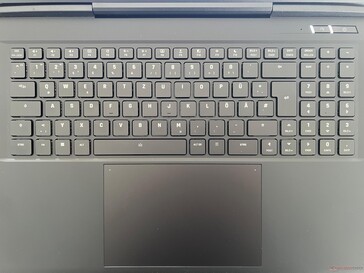
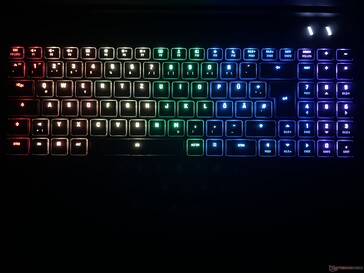
Le Neo 17 est disponible avec un clavier à membrane conventionnel avec 4 zones d'éclairage ou un clavier mécanique avec éclairage individuel des touches (supplément de 95 euros). Ce dernier est également installé sur notre appareil de test, avec des commutateurs tactiles de Cherry (MX ULP). Ceux-ci sont à la hauteur de leur nom et offrent une sensation de frappe très tactile et précise, mais les touches sont également très bruyantes. Il faut donc en tenir compte au moment de faire votre choix. Le grand ClickPad en verre (15 x 9,5 cm) fonctionne sans problème.
Écran - QHD avec 240 Hz
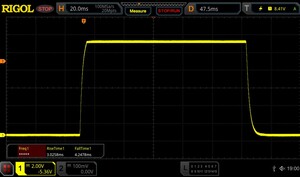
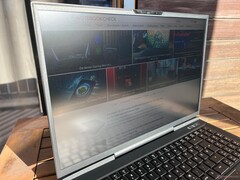
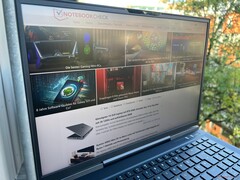
L'écran IPS de 17 pouces à surface mate offre une résolution de 2 560 x 1 600 pixels (16:10) et convient parfaitement aux jeux grâce aux temps de réponse rapides et à la fréquence de 240 Hz. La qualité subjective de l'image est également très bonne. Le PWM n'est pas utilisé et il n'y a pas de problèmes majeurs de halos.
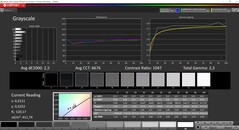
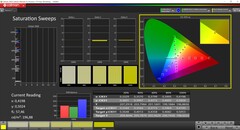
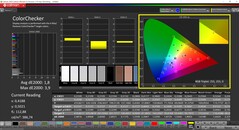
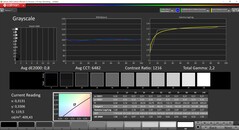
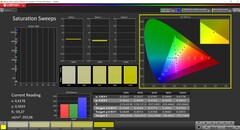
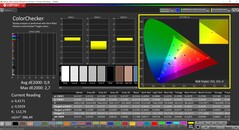
La luminosité moyenne est d'environ 400 cd/m², bien que le niveau de noir soit légèrement plus élevé (0,39). Il en résulte un rapport de contraste maximal d'un peu plus de 1 000:1, ce qui est satisfaisant. Le panneau devrait être encore plus lumineux à l'extérieur. Le calibrage d'usine est déjà très bon, mais nous pouvons optimiser l'écran encore plus avec notre calibrage. Le profil correspondant peut être téléchargé gratuitement dans l'encadré de droite. Avec la couverture sRGB complète, l'écran est également adapté à l'édition d'images/vidéos.
| |||||||||||||||||||||||||
Homogénéité de la luminosité: 88 %
Valeur mesurée au centre, sur batterie: 412 cd/m²
Contraste: 1056:1 (Valeurs des noirs: 0.39 cd/m²)
ΔE ColorChecker Calman: 1.8 | ∀{0.5-29.43 Ø4.77}
calibrated: 0.9
ΔE Greyscale Calman: 2.5 | ∀{0.09-98 Ø5}
69.6% AdobeRGB 1998 (Argyll 3D)
98.4% sRGB (Argyll 3D)
69% Display P3 (Argyll 3D)
Gamma: 2.3
CCT: 6676 K
| Schenker XMG Neo 17 E24 NE170QDM-NZ1, IPS, 2560x1600, 17", 240 Hz | Medion Erazer Beast X40 2024 BOE NE170QDM-NZ1, IPS, 2560x1600, 17", 240 Hz | HP Omen 17-db0079ng BOE0B67, IPS, 2560x1440, 17.3", 240 Hz | Eurocom Raptor X17 Core i9-14900HX BOE CQ NE173QUM-NY1, IPS, 3840x2160, 17.3", 144 Hz | MSI GE78HX 13VH-070US AU Optronics B170QAN01.2, IPS, 2560x1600, 17", 240 Hz | |
|---|---|---|---|---|---|
| Display | -0% | -3% | 20% | 22% | |
| Display P3 Coverage (%) | 69 | 68.1 -1% | 66.2 -4% | 95.9 39% | 97.6 41% |
| sRGB Coverage (%) | 98.4 | 99.5 1% | 95.5 -3% | 99.8 1% | 99.9 2% |
| AdobeRGB 1998 Coverage (%) | 69.6 | 69 -1% | 68.1 -2% | 84.2 21% | 86.5 24% |
| Response Times | 4% | -17% | -40% | 38% | |
| Response Time Grey 50% / Grey 80% * (ms) | 12.1 ? | 11.7 ? 3% | 14.4 ? -19% | 14.8 ? -22% | 4.2 ? 65% |
| Response Time Black / White * (ms) | 7.2 ? | 6.9 ? 4% | 8.3 ? -15% | 11.4 ? -58% | 6.4 ? 11% |
| PWM Frequency (Hz) | |||||
| Screen | 14% | -9% | -25% | -51% | |
| Brightness middle (cd/m²) | 412 | 422 2% | 363 -12% | 544.6 32% | 398.6 -3% |
| Brightness (cd/m²) | 401 | 388 -3% | 341 -15% | 507 26% | 384 -4% |
| Brightness Distribution (%) | 88 | 87 -1% | 84 -5% | 77 -12% | 89 1% |
| Black Level * (cd/m²) | 0.39 | 0.42 -8% | 0.38 3% | 0.48 -23% | 0.46 -18% |
| Contrast (:1) | 1056 | 1005 -5% | 955 -10% | 1135 7% | 867 -18% |
| Colorchecker dE 2000 * | 1.8 | 1.42 21% | 1.74 3% | 3.38 -88% | 4.05 -125% |
| Colorchecker dE 2000 max. * | 3.9 | 1.97 49% | 5.39 -38% | 7.13 -83% | 8.68 -123% |
| Colorchecker dE 2000 calibrated * | 0.9 | 0.7 22% | 1.43 -59% | 1.03 -14% | 1.02 -13% |
| Greyscale dE 2000 * | 2.5 | 1.2 52% | 1.3 48% | 4.3 -72% | 6.5 -160% |
| Gamma | 2.3 96% | 2.078 106% | 2.235 98% | 2.42 91% | 2.11 104% |
| CCT | 6676 97% | 6581 99% | 6346 102% | 7356 88% | 7518 86% |
| Moyenne finale (programmes/paramètres) | 6% /
10% | -10% /
-9% | -15% /
-18% | 3% /
-23% |
* ... Moindre est la valeur, meilleures sont les performances
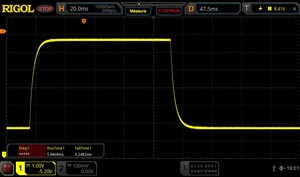
Temps de réponse de l'écran
| ↔ Temps de réponse noir à blanc | ||
|---|---|---|
| 7.2 ms ... hausse ↗ et chute ↘ combinées | ↗ 3 ms hausse | |
| ↘ 4.2 ms chute | ||
| L'écran montre de très faibles temps de réponse, parfait pour le jeu. En comparaison, tous les appareils testés affichent entre 0.1 (minimum) et 240 (maximum) ms. » 20 % des appareils testés affichent de meilleures performances. Cela signifie que les latences relevées sont meilleures que la moyenne (20.1 ms) de tous les appareils testés. | ||
| ↔ Temps de réponse gris 50% à gris 80% | ||
| 12.1 ms ... hausse ↗ et chute ↘ combinées | ↗ 5.9 ms hausse | |
| ↘ 6.2 ms chute | ||
| L'écran montre de bons temps de réponse, mais insuffisant pour du jeu compétitif. En comparaison, tous les appareils testés affichent entre 0.165 (minimum) et 636 (maximum) ms. » 25 % des appareils testés affichent de meilleures performances. Cela signifie que les latences relevées sont meilleures que la moyenne (31.5 ms) de tous les appareils testés. | ||
Scintillement / MLI (Modulation de largeur d'impulsion)
| Scintillement / MLI (Modulation de largeur d'impulsion) non décelé | |||
En comparaison, 53 % des appareils testés n'emploient pas MDI pour assombrir leur écran. Nous avons relevé une moyenne à 8042 (minimum : 5 - maximum : 343500) Hz dans le cas où une MDI était active. | |||
Performance - Raptor Lake-HX
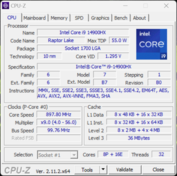
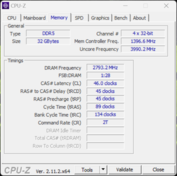
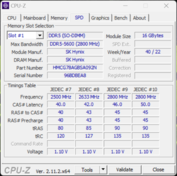
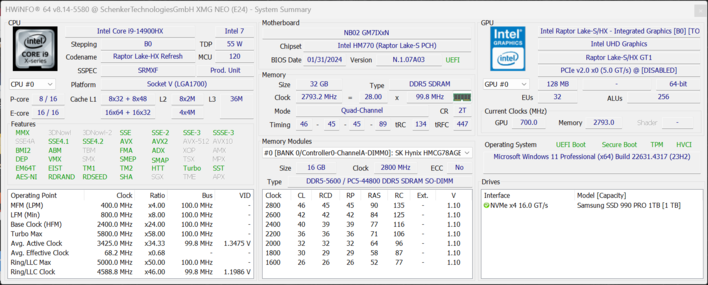
Le Neo 17 est exclusivement équipé du Intel Core i9-14900HX. 16 Go de RAM sont installés en standard, mais il est possible d'aller jusqu'à 96 Go grâce à deux slots SO-DIMM (supplément de 260 euros).
Conditions d'essai
Le XMG Neo 17 offre différents profils énergétiques, que nous avons résumés dans le tableau suivant. Nous avons utilisé le mode Overboost pour nos benchmarks et nos mesures, car la différence de bruit par rapport au mode Enthusiast est faible. Le fabricant propose également un site Deep Dive pour plus d'informations techniques sur le Neo 17 et les profils énergétiques.
| Profil énergétique | TDP du CPU | CB R23 Multi | TDP du GPU | Time Spy Graphique | CP 2077 Ultra QHD | Volume max. du ventilateur |
|---|---|---|---|---|---|---|
| Équilibré | 45 W | 14 899 points | 130 W | 10 778 points | 73,9 FPS | 43,1 dB(A) |
| Enthusiast | 75 W | 22 027 points | 150 W | 18 021 points | 78,6 FPS | 49,9 dB(A) |
| Overboost | 160/140 W | 31,740 points | 175 W | 19,155 points | 80.7 FPS | 51.9 dB(A) |
Processeur - Core i9-14900HX
Le processeur Intel Core i9-14900HX est toujours l'un des processeurs mobiles les plus rapides et il est peu probable que cela change avec les prochaines puces Arrow Lake. La puissance délivrée par le processeur est excellente, puisqu'il peut consommer 160 watts sur de courtes périodes et 140 watts en continu. Pour l'utilisateur, cela signifie des performances très élevées et constantes. Il faut toutefois s'attendre à des pertes importantes en mode batterie, car le processeur est autorisé à consommer un maximum de 35 watts, ce qui correspond à une réduction de 65 % des performances dans les tests multicœurs. Vous trouverez d'autres tests de référence pour l'unité centrale dans notre section technologie.
Cinebench R15 Multi loop
Cinebench R23: Multi Core | Single Core
Cinebench R20: CPU (Multi Core) | CPU (Single Core)
Cinebench R15: CPU Multi 64Bit | CPU Single 64Bit
Blender: v2.79 BMW27 CPU
7-Zip 18.03: 7z b 4 | 7z b 4 -mmt1
Geekbench 6.5: Multi-Core | Single-Core
Geekbench 5.5: Multi-Core | Single-Core
HWBOT x265 Benchmark v2.2: 4k Preset
LibreOffice : 20 Documents To PDF
R Benchmark 2.5: Overall mean
| CPU Performance rating | |
| Schenker XMG Neo 17 E24 | |
| MSI GE78HX 13VH-070US -2! | |
| Moyenne Intel Core i9-14900HX | |
| Eurocom Raptor X17 Core i9-14900HX | |
| Medion Erazer Beast X40 2024 | |
| Moyenne de la classe Gaming | |
| HP Omen 17-db0079ng | |
| Cinebench R23 / Multi Core | |
| MSI GE78HX 13VH-070US | |
| Schenker XMG Neo 17 E24 | |
| Eurocom Raptor X17 Core i9-14900HX | |
| Moyenne Intel Core i9-14900HX (17078 - 36249, n=37) | |
| Moyenne de la classe Gaming (5668 - 40970, n=139, 2 dernières années) | |
| Medion Erazer Beast X40 2024 | |
| HP Omen 17-db0079ng | |
| Cinebench R23 / Single Core | |
| Schenker XMG Neo 17 E24 | |
| Medion Erazer Beast X40 2024 | |
| Moyenne Intel Core i9-14900HX (1720 - 2245, n=37) | |
| MSI GE78HX 13VH-070US | |
| Eurocom Raptor X17 Core i9-14900HX | |
| Moyenne de la classe Gaming (1136 - 2267, n=139, 2 dernières années) | |
| HP Omen 17-db0079ng | |
| Cinebench R20 / CPU (Multi Core) | |
| MSI GE78HX 13VH-070US | |
| Schenker XMG Neo 17 E24 | |
| Eurocom Raptor X17 Core i9-14900HX | |
| Moyenne Intel Core i9-14900HX (6579 - 13832, n=37) | |
| Moyenne de la classe Gaming (2179 - 16108, n=138, 2 dernières années) | |
| Medion Erazer Beast X40 2024 | |
| HP Omen 17-db0079ng | |
| Cinebench R20 / CPU (Single Core) | |
| Schenker XMG Neo 17 E24 | |
| Medion Erazer Beast X40 2024 | |
| Moyenne Intel Core i9-14900HX (657 - 859, n=37) | |
| Eurocom Raptor X17 Core i9-14900HX | |
| MSI GE78HX 13VH-070US | |
| Moyenne de la classe Gaming (439 - 870, n=138, 2 dernières années) | |
| HP Omen 17-db0079ng | |
| Cinebench R15 / CPU Multi 64Bit | |
| MSI GE78HX 13VH-070US | |
| Schenker XMG Neo 17 E24 | |
| Eurocom Raptor X17 Core i9-14900HX | |
| Moyenne Intel Core i9-14900HX (3263 - 5589, n=38) | |
| Moyenne de la classe Gaming (1537 - 6271, n=138, 2 dernières années) | |
| Medion Erazer Beast X40 2024 | |
| HP Omen 17-db0079ng | |
| Cinebench R15 / CPU Single 64Bit | |
| Schenker XMG Neo 17 E24 | |
| Medion Erazer Beast X40 2024 | |
| Moyenne Intel Core i9-14900HX (247 - 323, n=37) | |
| MSI GE78HX 13VH-070US | |
| Eurocom Raptor X17 Core i9-14900HX | |
| Moyenne de la classe Gaming (188.8 - 343, n=137, 2 dernières années) | |
| HP Omen 17-db0079ng | |
| Blender / v2.79 BMW27 CPU | |
| HP Omen 17-db0079ng | |
| Moyenne de la classe Gaming (80 - 517, n=134, 2 dernières années) | |
| Medion Erazer Beast X40 2024 | |
| Moyenne Intel Core i9-14900HX (91 - 206, n=37) | |
| Eurocom Raptor X17 Core i9-14900HX | |
| Schenker XMG Neo 17 E24 | |
| MSI GE78HX 13VH-070US | |
| 7-Zip 18.03 / 7z b 4 | |
| MSI GE78HX 13VH-070US | |
| Schenker XMG Neo 17 E24 | |
| Eurocom Raptor X17 Core i9-14900HX | |
| Moyenne Intel Core i9-14900HX (66769 - 136645, n=37) | |
| Medion Erazer Beast X40 2024 | |
| Moyenne de la classe Gaming (23795 - 148086, n=136, 2 dernières années) | |
| HP Omen 17-db0079ng | |
| 7-Zip 18.03 / 7z b 4 -mmt1 | |
| Medion Erazer Beast X40 2024 | |
| Schenker XMG Neo 17 E24 | |
| MSI GE78HX 13VH-070US | |
| Moyenne Intel Core i9-14900HX (5452 - 7545, n=37) | |
| Eurocom Raptor X17 Core i9-14900HX | |
| Moyenne de la classe Gaming (4199 - 7508, n=136, 2 dernières années) | |
| HP Omen 17-db0079ng | |
| Geekbench 6.5 / Multi-Core | |
| Schenker XMG Neo 17 E24 | |
| Eurocom Raptor X17 Core i9-14900HX | |
| Moyenne Intel Core i9-14900HX (13158 - 19665, n=37) | |
| Medion Erazer Beast X40 2024 | |
| Moyenne de la classe Gaming (5340 - 22104, n=137, 2 dernières années) | |
| HP Omen 17-db0079ng | |
| Geekbench 6.5 / Single-Core | |
| Medion Erazer Beast X40 2024 | |
| Schenker XMG Neo 17 E24 | |
| Moyenne Intel Core i9-14900HX (2419 - 3129, n=37) | |
| Eurocom Raptor X17 Core i9-14900HX | |
| Moyenne de la classe Gaming (1490 - 3259, n=137, 2 dernières années) | |
| HP Omen 17-db0079ng | |
| Geekbench 5.5 / Multi-Core | |
| MSI GE78HX 13VH-070US | |
| Schenker XMG Neo 17 E24 | |
| Moyenne Intel Core i9-14900HX (8618 - 23194, n=37) | |
| Medion Erazer Beast X40 2024 | |
| Moyenne de la classe Gaming (4557 - 27010, n=136, 2 dernières années) | |
| HP Omen 17-db0079ng | |
| Eurocom Raptor X17 Core i9-14900HX | |
| Geekbench 5.5 / Single-Core | |
| Medion Erazer Beast X40 2024 | |
| Schenker XMG Neo 17 E24 | |
| MSI GE78HX 13VH-070US | |
| Moyenne Intel Core i9-14900HX (1669 - 2210, n=37) | |
| Moyenne de la classe Gaming (986 - 2474, n=136, 2 dernières années) | |
| HP Omen 17-db0079ng | |
| Eurocom Raptor X17 Core i9-14900HX | |
| HWBOT x265 Benchmark v2.2 / 4k Preset | |
| MSI GE78HX 13VH-070US | |
| Eurocom Raptor X17 Core i9-14900HX | |
| Schenker XMG Neo 17 E24 | |
| Moyenne Intel Core i9-14900HX (16.8 - 38.9, n=37) | |
| Moyenne de la classe Gaming (7.7 - 44.3, n=136, 2 dernières années) | |
| Medion Erazer Beast X40 2024 | |
| HP Omen 17-db0079ng | |
| LibreOffice / 20 Documents To PDF | |
| HP Omen 17-db0079ng | |
| Moyenne de la classe Gaming (19 - 88.8, n=135, 2 dernières années) | |
| MSI GE78HX 13VH-070US | |
| Medion Erazer Beast X40 2024 | |
| Moyenne Intel Core i9-14900HX (19 - 85.1, n=37) | |
| Schenker XMG Neo 17 E24 | |
| Eurocom Raptor X17 Core i9-14900HX | |
| R Benchmark 2.5 / Overall mean | |
| HP Omen 17-db0079ng | |
| Moyenne de la classe Gaming (0.3439 - 0.759, n=136, 2 dernières années) | |
| Moyenne Intel Core i9-14900HX (0.3604 - 0.4859, n=37) | |
| Eurocom Raptor X17 Core i9-14900HX | |
| MSI GE78HX 13VH-070US | |
| Schenker XMG Neo 17 E24 | |
| Medion Erazer Beast X40 2024 | |
* ... Moindre est la valeur, meilleures sont les performances
AIDA64: FP32 Ray-Trace | FPU Julia | CPU SHA3 | CPU Queen | FPU SinJulia | FPU Mandel | CPU AES | CPU ZLib | FP64 Ray-Trace | CPU PhotoWorxx
| Performance rating | |
| Eurocom Raptor X17 Core i9-14900HX | |
| Schenker XMG Neo 17 E24 | |
| MSI GE78HX 13VH-070US | |
| Moyenne Intel Core i9-14900HX | |
| Moyenne de la classe Gaming | |
| HP Omen 17-db0079ng | |
| Medion Erazer Beast X40 2024 | |
| AIDA64 / FP32 Ray-Trace | |
| Moyenne de la classe Gaming (7192 - 85542, n=135, 2 dernières années) | |
| Schenker XMG Neo 17 E24 | |
| MSI GE78HX 13VH-070US | |
| Eurocom Raptor X17 Core i9-14900HX | |
| HP Omen 17-db0079ng | |
| Moyenne Intel Core i9-14900HX (13098 - 33474, n=36) | |
| Medion Erazer Beast X40 2024 | |
| AIDA64 / FPU Julia | |
| Schenker XMG Neo 17 E24 | |
| MSI GE78HX 13VH-070US | |
| Eurocom Raptor X17 Core i9-14900HX | |
| Moyenne de la classe Gaming (35040 - 238426, n=135, 2 dernières années) | |
| Moyenne Intel Core i9-14900HX (67573 - 166040, n=36) | |
| HP Omen 17-db0079ng | |
| Medion Erazer Beast X40 2024 | |
| AIDA64 / CPU SHA3 | |
| Eurocom Raptor X17 Core i9-14900HX | |
| Schenker XMG Neo 17 E24 | |
| MSI GE78HX 13VH-070US | |
| Moyenne Intel Core i9-14900HX (3589 - 7979, n=36) | |
| Moyenne de la classe Gaming (1728 - 9817, n=135, 2 dernières années) | |
| Medion Erazer Beast X40 2024 | |
| HP Omen 17-db0079ng | |
| AIDA64 / CPU Queen | |
| Eurocom Raptor X17 Core i9-14900HX | |
| Schenker XMG Neo 17 E24 | |
| MSI GE78HX 13VH-070US | |
| Moyenne Intel Core i9-14900HX (118405 - 148966, n=36) | |
| Medion Erazer Beast X40 2024 | |
| Moyenne de la classe Gaming (49785 - 173351, n=135, 2 dernières années) | |
| HP Omen 17-db0079ng | |
| AIDA64 / FPU SinJulia | |
| MSI GE78HX 13VH-070US | |
| Schenker XMG Neo 17 E24 | |
| Eurocom Raptor X17 Core i9-14900HX | |
| Moyenne Intel Core i9-14900HX (10475 - 18517, n=36) | |
| HP Omen 17-db0079ng | |
| Moyenne de la classe Gaming (4424 - 33636, n=135, 2 dernières années) | |
| Medion Erazer Beast X40 2024 | |
| AIDA64 / FPU Mandel | |
| Schenker XMG Neo 17 E24 | |
| MSI GE78HX 13VH-070US | |
| Eurocom Raptor X17 Core i9-14900HX | |
| Moyenne de la classe Gaming (17585 - 128721, n=135, 2 dernières années) | |
| Moyenne Intel Core i9-14900HX (32543 - 83662, n=36) | |
| HP Omen 17-db0079ng | |
| Medion Erazer Beast X40 2024 | |
| AIDA64 / CPU AES | |
| Eurocom Raptor X17 Core i9-14900HX | |
| Moyenne Intel Core i9-14900HX (86964 - 241777, n=36) | |
| Schenker XMG Neo 17 E24 | |
| MSI GE78HX 13VH-070US | |
| Moyenne de la classe Gaming (19065 - 247074, n=135, 2 dernières années) | |
| Medion Erazer Beast X40 2024 | |
| HP Omen 17-db0079ng | |
| AIDA64 / CPU ZLib | |
| MSI GE78HX 13VH-070US | |
| Eurocom Raptor X17 Core i9-14900HX | |
| Schenker XMG Neo 17 E24 | |
| Moyenne Intel Core i9-14900HX (1054 - 2292, n=36) | |
| Moyenne de la classe Gaming (373 - 2531, n=135, 2 dernières années) | |
| Medion Erazer Beast X40 2024 | |
| HP Omen 17-db0079ng | |
| AIDA64 / FP64 Ray-Trace | |
| Moyenne de la classe Gaming (3856 - 45446, n=135, 2 dernières années) | |
| MSI GE78HX 13VH-070US | |
| Schenker XMG Neo 17 E24 | |
| Eurocom Raptor X17 Core i9-14900HX | |
| HP Omen 17-db0079ng | |
| Moyenne Intel Core i9-14900HX (6809 - 18349, n=36) | |
| Medion Erazer Beast X40 2024 | |
| AIDA64 / CPU PhotoWorxx | |
| Eurocom Raptor X17 Core i9-14900HX | |
| MSI GE78HX 13VH-070US | |
| Schenker XMG Neo 17 E24 | |
| Medion Erazer Beast X40 2024 | |
| Moyenne Intel Core i9-14900HX (23903 - 54702, n=36) | |
| Moyenne de la classe Gaming (10805 - 62916, n=135, 2 dernières années) | |
| HP Omen 17-db0079ng | |
Performance du système
Le Neo 17 impressionne également dans les benchmarks synthétiques du système, bien que la concurrence soit généralement très proche. Dans l'utilisation quotidienne, cela signifie un système extrêmement réactif, bien qu'il y ait un bref accrochage lors de la commutation de la carte graphique. Ce phénomène est tout à fait normal et peut être évité en désactivant complètement l'iGPU.
CrossMark: Overall | Productivity | Creativity | Responsiveness
WebXPRT 3: Overall
WebXPRT 4: Overall
Mozilla Kraken 1.1: Total
| PCMark 10 / Score | |
| Medion Erazer Beast X40 2024 | |
| MSI GE78HX 13VH-070US | |
| Moyenne Intel Core i9-14900HX, NVIDIA GeForce RTX 4080 Laptop GPU (7703 - 9223, n=7) | |
| Schenker XMG Neo 17 E24 | |
| Moyenne de la classe Gaming (5776 - 10060, n=114, 2 dernières années) | |
| HP Omen 17-db0079ng | |
| PCMark 10 / Essentials | |
| Moyenne Intel Core i9-14900HX, NVIDIA GeForce RTX 4080 Laptop GPU (11255 - 12600, n=7) | |
| MSI GE78HX 13VH-070US | |
| Schenker XMG Neo 17 E24 | |
| Medion Erazer Beast X40 2024 | |
| Moyenne de la classe Gaming (8810 - 12600, n=118, 2 dernières années) | |
| HP Omen 17-db0079ng | |
| PCMark 10 / Productivity | |
| Medion Erazer Beast X40 2024 | |
| Schenker XMG Neo 17 E24 | |
| MSI GE78HX 13VH-070US | |
| Moyenne Intel Core i9-14900HX, NVIDIA GeForce RTX 4080 Laptop GPU (6662 - 11410, n=7) | |
| HP Omen 17-db0079ng | |
| Moyenne de la classe Gaming (6662 - 16716, n=116, 2 dernières années) | |
| PCMark 10 / Digital Content Creation | |
| Medion Erazer Beast X40 2024 | |
| MSI GE78HX 13VH-070US | |
| Moyenne Intel Core i9-14900HX, NVIDIA GeForce RTX 4080 Laptop GPU (14211 - 16246, n=7) | |
| Schenker XMG Neo 17 E24 | |
| Moyenne de la classe Gaming (7440 - 19351, n=116, 2 dernières années) | |
| HP Omen 17-db0079ng | |
| CrossMark / Overall | |
| Eurocom Raptor X17 Core i9-14900HX | |
| Moyenne Intel Core i9-14900HX, NVIDIA GeForce RTX 4080 Laptop GPU (1992 - 2334, n=7) | |
| Medion Erazer Beast X40 2024 | |
| Schenker XMG Neo 17 E24 | |
| Moyenne de la classe Gaming (1247 - 2344, n=114, 2 dernières années) | |
| MSI GE78HX 13VH-070US | |
| HP Omen 17-db0079ng | |
| CrossMark / Productivity | |
| Eurocom Raptor X17 Core i9-14900HX | |
| Medion Erazer Beast X40 2024 | |
| Moyenne Intel Core i9-14900HX, NVIDIA GeForce RTX 4080 Laptop GPU (1812 - 2204, n=7) | |
| Moyenne de la classe Gaming (1299 - 2211, n=114, 2 dernières années) | |
| MSI GE78HX 13VH-070US | |
| Schenker XMG Neo 17 E24 | |
| HP Omen 17-db0079ng | |
| CrossMark / Creativity | |
| Moyenne Intel Core i9-14900HX, NVIDIA GeForce RTX 4080 Laptop GPU (2327 - 2500, n=7) | |
| Schenker XMG Neo 17 E24 | |
| Eurocom Raptor X17 Core i9-14900HX | |
| Medion Erazer Beast X40 2024 | |
| Moyenne de la classe Gaming (1275 - 2729, n=114, 2 dernières années) | |
| MSI GE78HX 13VH-070US | |
| HP Omen 17-db0079ng | |
| CrossMark / Responsiveness | |
| Eurocom Raptor X17 Core i9-14900HX | |
| Moyenne Intel Core i9-14900HX, NVIDIA GeForce RTX 4080 Laptop GPU (1520 - 2254, n=7) | |
| Medion Erazer Beast X40 2024 | |
| Moyenne de la classe Gaming (1030 - 2330, n=114, 2 dernières années) | |
| MSI GE78HX 13VH-070US | |
| Schenker XMG Neo 17 E24 | |
| HP Omen 17-db0079ng | |
| WebXPRT 3 / Overall | |
| Eurocom Raptor X17 Core i9-14900HX | |
| Schenker XMG Neo 17 E24 | |
| Moyenne Intel Core i9-14900HX, NVIDIA GeForce RTX 4080 Laptop GPU (310 - 345, n=7) | |
| Medion Erazer Beast X40 2024 | |
| MSI GE78HX 13VH-070US | |
| Moyenne de la classe Gaming (237 - 532, n=117, 2 dernières années) | |
| HP Omen 17-db0079ng | |
| WebXPRT 4 / Overall | |
| Schenker XMG Neo 17 E24 | |
| Moyenne Intel Core i9-14900HX, NVIDIA GeForce RTX 4080 Laptop GPU (300 - 321, n=7) | |
| Eurocom Raptor X17 Core i9-14900HX | |
| Medion Erazer Beast X40 2024 | |
| MSI GE78HX 13VH-070US | |
| Moyenne de la classe Gaming (176.4 - 345, n=114, 2 dernières années) | |
| Mozilla Kraken 1.1 / Total | |
| HP Omen 17-db0079ng | |
| MSI GE78HX 13VH-070US | |
| Moyenne de la classe Gaming (397 - 674, n=126, 2 dernières années) | |
| Eurocom Raptor X17 Core i9-14900HX | |
| Moyenne Intel Core i9-14900HX, NVIDIA GeForce RTX 4080 Laptop GPU (437 - 446, n=7) | |
| Schenker XMG Neo 17 E24 | |
| Medion Erazer Beast X40 2024 | |
* ... Moindre est la valeur, meilleures sont les performances
| PCMark 10 Score | 8694 points | |
Aide | ||
| AIDA64 / Memory Copy | |
| Medion Erazer Beast X40 2024 | |
| Schenker XMG Neo 17 E24 | |
| MSI GE78HX 13VH-070US | |
| Eurocom Raptor X17 Core i9-14900HX | |
| Moyenne Intel Core i9-14900HX (38028 - 83392, n=36) | |
| Moyenne de la classe Gaming (21750 - 108104, n=135, 2 dernières années) | |
| HP Omen 17-db0079ng | |
| AIDA64 / Memory Read | |
| Schenker XMG Neo 17 E24 | |
| MSI GE78HX 13VH-070US | |
| Medion Erazer Beast X40 2024 | |
| Moyenne Intel Core i9-14900HX (43306 - 87568, n=36) | |
| Eurocom Raptor X17 Core i9-14900HX | |
| Moyenne de la classe Gaming (22956 - 104349, n=135, 2 dernières années) | |
| HP Omen 17-db0079ng | |
| AIDA64 / Memory Write | |
| HP Omen 17-db0079ng | |
| Medion Erazer Beast X40 2024 | |
| Schenker XMG Neo 17 E24 | |
| MSI GE78HX 13VH-070US | |
| Eurocom Raptor X17 Core i9-14900HX | |
| Moyenne de la classe Gaming (22297 - 133486, n=135, 2 dernières années) | |
| Moyenne Intel Core i9-14900HX (37146 - 80589, n=36) | |
| AIDA64 / Memory Latency | |
| Moyenne de la classe Gaming (59.5 - 259, n=135, 2 dernières années) | |
| HP Omen 17-db0079ng | |
| Eurocom Raptor X17 Core i9-14900HX | |
| Moyenne Intel Core i9-14900HX (76.1 - 105, n=36) | |
| MSI GE78HX 13VH-070US | |
| Schenker XMG Neo 17 E24 | |
| Medion Erazer Beast X40 2024 | |
* ... Moindre est la valeur, meilleures sont les performances
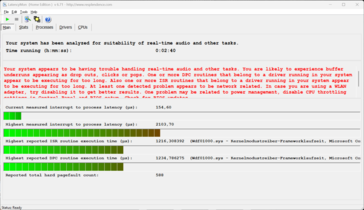
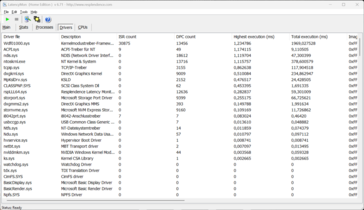
Latences DPC
| DPC Latencies / LatencyMon - interrupt to process latency (max), Web, Youtube, Prime95 | |
| MSI GE78HX 13VH-070US | |
| Schenker XMG Neo 17 E24 | |
| HP Omen 17-db0079ng | |
| Medion Erazer Beast X40 2024 | |
| Eurocom Raptor X17 Core i9-14900HX | |
* ... Moindre est la valeur, meilleures sont les performances
Mémoire de masse
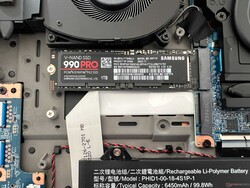
Le Neo 17 offre deux emplacements M.2-2280 rapides qui sont connectés via PCIe 4.0 x4. La version 1 TB du Samsung 990 Pro est installée dans l'appareil de test, qui atteint des taux de transfert rapides et est l'un des disques SSD les plus rapides du marché. En outre, les performances restent parfaitement stables, même en cas de charge constante. Après le démarrage initial, l'utilisateur dispose de 864 Go. Vous trouverez d'autres tests de performance des disques SSD ici.
* ... Moindre est la valeur, meilleures sont les performances
Continuous read: DiskSpd Read Loop, Queue Depth 8
Carte graphique
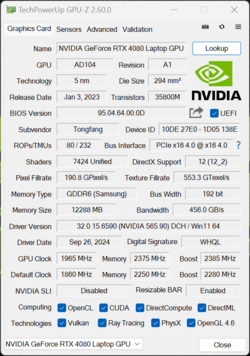
Dans notre appareil de test, l'écran dédié à la Ordinateur portable Nvidia GeForce RTX 4080 avec 12 Go de VRAM est installé. La carte graphique peut consommer un maximum de 175 watts (150 watts TGP + 25 watts Dynamic Boost), de sorte que le Neo 17 peut utiliser pleinement le GPU. Grâce à la commutation graphique Advanced Optimus, les performances de jeu sont exceptionnelles et l'ordinateur portable RTX 4080 est tout à fait suffisant pour la résolution native QHD. En outre, les performances restent parfaitement stables, même en cas de charge constante.
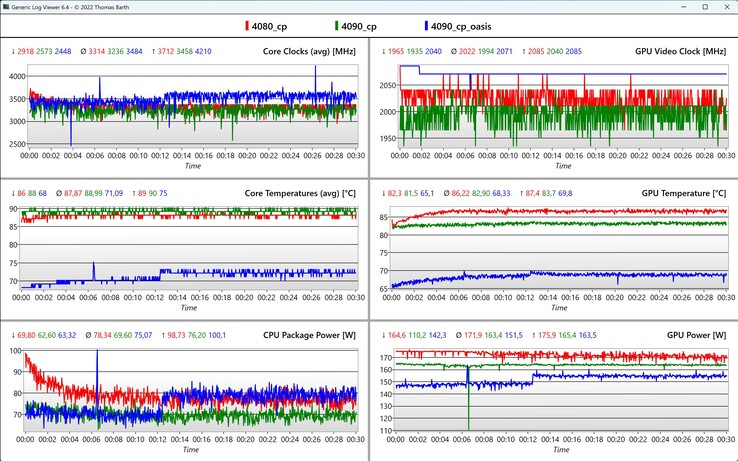
En comparant les données CPU/GPU dans notre boucle Cyberpunk 2077, l'avantage du refroidissement externe par eau devient très clair, car les températures CPU/GPU sont inférieures d'environ 20 °C, ce qui explique pourquoi les ventilateurs doivent également travailler moins.
En mode batterie, la consommation d'énergie du GPU est limitée à 52 watts, ce qui explique que les performances du GPU soient inférieures d'environ 53 %. D'autres tests de performance du GPU sont disponibles ici.
| 3DMark Performance rating - Percent | |
| Eurocom Raptor X17 Core i9-14900HX | |
| Schenker Neo 17 2024 Engineering Sample -1! | |
| Medion Erazer Beast X40 2024 | |
| Schenker XMG Neo 17 E24 | |
| MSI GE78HX 13VH-070US | |
| Moyenne NVIDIA GeForce RTX 4080 Laptop GPU | |
| Moyenne de la classe Gaming | |
| HP Omen 17-db0079ng | |
| 3DMark 11 - 1280x720 Performance GPU | |
| Schenker Neo 17 2024 Engineering Sample | |
| Medion Erazer Beast X40 2024 | |
| Eurocom Raptor X17 Core i9-14900HX | |
| Schenker XMG Neo 17 E24 | |
| MSI GE78HX 13VH-070US | |
| Moyenne NVIDIA GeForce RTX 4080 Laptop GPU (45199 - 63128, n=24) | |
| Moyenne de la classe Gaming (13523 - 80022, n=131, 2 dernières années) | |
| HP Omen 17-db0079ng | |
| 3DMark 11 Performance | 45722 points | |
| 3DMark Fire Strike Score | 34851 points | |
| 3DMark Time Spy Score | 18980 points | |
Aide | ||
| Blender / v3.3 Classroom OPTIX/RTX | |
| HP Omen 17-db0079ng | |
| Moyenne de la classe Gaming (9 - 95, n=132, 2 dernières années) | |
| Moyenne NVIDIA GeForce RTX 4080 Laptop GPU (13 - 20, n=22) | |
| MSI GE78HX 13VH-070US | |
| Schenker XMG Neo 17 E24 | |
| Eurocom Raptor X17 Core i9-14900HX | |
| Medion Erazer Beast X40 2024 | |
| Blender / v3.3 Classroom CUDA | |
| Moyenne de la classe Gaming (15 - 228, n=137, 2 dernières années) | |
| HP Omen 17-db0079ng | |
| Moyenne NVIDIA GeForce RTX 4080 Laptop GPU (21 - 28, n=23) | |
| MSI GE78HX 13VH-070US | |
| Schenker XMG Neo 17 E24 | |
| Eurocom Raptor X17 Core i9-14900HX | |
| Medion Erazer Beast X40 2024 | |
| Blender / v3.3 Classroom CPU | |
| HP Omen 17-db0079ng | |
| Moyenne de la classe Gaming (122 - 962, n=133, 2 dernières années) | |
| Medion Erazer Beast X40 2024 | |
| Moyenne NVIDIA GeForce RTX 4080 Laptop GPU (177 - 337, n=23) | |
| Eurocom Raptor X17 Core i9-14900HX | |
| Schenker XMG Neo 17 E24 | |
| MSI GE78HX 13VH-070US | |
* ... Moindre est la valeur, meilleures sont les performances
| Performance rating - Percent | |
| Eurocom Raptor X17 Core i9-14900HX -1! | |
| Schenker Neo 17 2024 Engineering Sample -2! | |
| Medion Erazer Beast X40 2024 -1! | |
| Schenker XMG Neo 17 E24 | |
| MSI GE78HX 13VH-070US -2! | |
| Moyenne de la classe Gaming | |
| HP Omen 17-db0079ng -1! | |
| Cyberpunk 2077 - 1920x1080 Ultra Preset (FSR off) | |
| Eurocom Raptor X17 Core i9-14900HX | |
| Schenker XMG Neo 17 E24 | |
| Medion Erazer Beast X40 2024 | |
| Moyenne de la classe Gaming (17.7 - 169.9, n=140, 2 dernières années) | |
| HP Omen 17-db0079ng | |
| Baldur's Gate 3 - 1920x1080 Ultra Preset AA:T | |
| Eurocom Raptor X17 Core i9-14900HX | |
| Moyenne de la classe Gaming (37.2 - 246, n=115, 2 dernières années) | |
| Schenker XMG Neo 17 E24 | |
| GTA V - 1920x1080 Highest AA:4xMSAA + FX AF:16x | |
| Eurocom Raptor X17 Core i9-14900HX | |
| Schenker XMG Neo 17 E24 | |
| Schenker Neo 17 2024 Engineering Sample | |
| Medion Erazer Beast X40 2024 | |
| Moyenne de la classe Gaming (26.8 - 186.9, n=121, 2 dernières années) | |
| HP Omen 17-db0079ng | |
| MSI GE78HX 13VH-070US | |
| Final Fantasy XV Benchmark - 1920x1080 High Quality | |
| Schenker Neo 17 2024 Engineering Sample | |
| Medion Erazer Beast X40 2024 | |
| Schenker XMG Neo 17 E24 | |
| MSI GE78HX 13VH-070US | |
| Moyenne de la classe Gaming (28.2 - 215, n=130, 2 dernières années) | |
| HP Omen 17-db0079ng | |
| Strange Brigade - 1920x1080 ultra AA:ultra AF:16 | |
| Eurocom Raptor X17 Core i9-14900HX | |
| Schenker Neo 17 2024 Engineering Sample | |
| Medion Erazer Beast X40 2024 | |
| Schenker XMG Neo 17 E24 | |
| Moyenne de la classe Gaming (46.6 - 456, n=119, 2 dernières années) | |
| MSI GE78HX 13VH-070US | |
| HP Omen 17-db0079ng | |
| Dota 2 Reborn - 1920x1080 ultra (3/3) best looking | |
| Eurocom Raptor X17 Core i9-14900HX | |
| Medion Erazer Beast X40 2024 | |
| Schenker Neo 17 2024 Engineering Sample | |
| Schenker XMG Neo 17 E24 | |
| Moyenne de la classe Gaming (65.1 - 248, n=136, 2 dernières années) | |
| MSI GE78HX 13VH-070US | |
| HP Omen 17-db0079ng | |
| X-Plane 11.11 - 1920x1080 high (fps_test=3) | |
| Eurocom Raptor X17 Core i9-14900HX | |
| Medion Erazer Beast X40 2024 | |
| Schenker XMG Neo 17 E24 | |
| MSI GE78HX 13VH-070US | |
| Schenker Neo 17 2024 Engineering Sample | |
| Moyenne de la classe Gaming (33.4 - 150.2, n=139, 2 dernières années) | |
| HP Omen 17-db0079ng | |
Cyberpunk 2077 Ultra FPS chart
| Bas | Moyen | Élevé | Ultra | QHD DLSS | QHD | 4K | |
|---|---|---|---|---|---|---|---|
| GTA V (2015) | 181.7 | 143.4 | 135.1 | 163.7 | |||
| Dota 2 Reborn (2015) | 220 | 197.1 | 194 | 179.7 | |||
| Final Fantasy XV Benchmark (2018) | 226 | 215 | 173.9 | 134.4 | |||
| X-Plane 11.11 (2018) | 202 | 176.8 | 138.9 | ||||
| Far Cry 5 (2018) | 179 | 162 | 157 | ||||
| Strange Brigade (2018) | 381 | 347 | 239 | 122 | |||
| Shadow of the Tomb Raider (2018) | 212 | 176 | |||||
| Far Cry 6 (2021) | 156 | 141 | |||||
| F1 23 (2023) | 321 | 111.6 | 70.7 | 35.5 | |||
| Baldur's Gate 3 (2023) | 231 | 143 | 122.2 | 111.8 | 88.3 | ||
| Cyberpunk 2077 (2023) | 101.1 | 146.9 | 133.8 | 121.3 | 110.1 | 80.7 | |
| Assassin's Creed Mirage (2023) | 197 | 153 | 129 | ||||
| Call of Duty Modern Warfare 3 2023 (2023) | 180 | 171 | 123 | ||||
| Avatar Frontiers of Pandora (2023) | 125 | 97 | 66 | ||||
| F1 24 (2024) | 304 | 323 | 289 | 112.2 | 71.2 |
Émissions et énergie
Émissions sonores
Le refroidissement avec deux ventilateurs est essentiellement le même que le modèle de l'année dernière, mais les configurations du Neo 17 avec l'ordinateur portable RTX 4080/4090 offrent un canal modifié pour le refroidissement à l'eau, qui passe maintenant directement au-dessus du processeur. Les ventilateurs tournent en permanence, mais lors de tâches très simples (surf sur internet, emails, vidéos), vous n'entendez qu'un bruit très faible. En revanche, dans les jeux, le bruit est nettement plus fort (52 dB(A)). Bien qu'il y ait des concurrents plus bruyants, vous devriez quand même utiliser des écouteurs pour jouer. Pendant les tests et les jeux, on a également entendu un léger bruit de bobine.
Degré de la nuisance sonore
| Au repos |
| 28.1 / 28.1 / 28.1 dB(A) |
| Disque dur |
| 0 dB(A) |
| Fortement sollicité |
| 43.1 / 51.9 dB(A) |
 | ||
30 dB silencieux 40 dB(A) audible 50 dB(A) bruyant |
||
min: | ||
| Schenker XMG Neo 17 E24 GeForce RTX 4080 Laptop GPU, i9-14900HX, Samsung 990 Pro 1 TB | Medion Erazer Beast X40 2024 GeForce RTX 4090 Laptop GPU, i9-14900HX, Phison E18-1TB-PHISON-SSD-BICS5 | HP Omen 17-db0079ng GeForce RTX 4070 Laptop GPU, R7 8845HS, WD PC SN560 SDDPNQE-1T00 | Eurocom Raptor X17 Core i9-14900HX GeForce RTX 4090 Laptop GPU, i9-14900HX, Corsair MP700 Pro 2TB | MSI GE78HX 13VH-070US GeForce RTX 4080 Laptop GPU, i9-13950HX, Samsung PM9A1 MZVL22T0HBLB | |
|---|---|---|---|---|---|
| Noise | -6% | -2% | -7% | -0% | |
| arrêt / environnement * (dB) | 23.3 | 25 -7% | 25 -7% | 23.7 -2% | 23.4 -0% |
| Idle Minimum * (dB) | 28.1 | 28 -0% | 25 11% | 31.7 -13% | 24.2 14% |
| Idle Average * (dB) | 28.1 | 29 -3% | 29 -3% | 31.7 -13% | 25.6 9% |
| Idle Maximum * (dB) | 28.1 | 32 -14% | 33 -17% | 32.9 -17% | 31 -10% |
| Load Average * (dB) | 43.1 | 48 -11% | 45 -4% | 34 21% | 43.3 -0% |
| Cyberpunk 2077 ultra * (dB) | 51.9 | 48 8% | |||
| Load Maximum * (dB) | 51.9 | 52 -0% | 52 -0% | 61.6 -19% | 59.1 -14% |
| Witcher 3 ultra * (dB) | 50 | 61.6 | 56.3 |
* ... Moindre est la valeur, meilleures sont les performances
Température
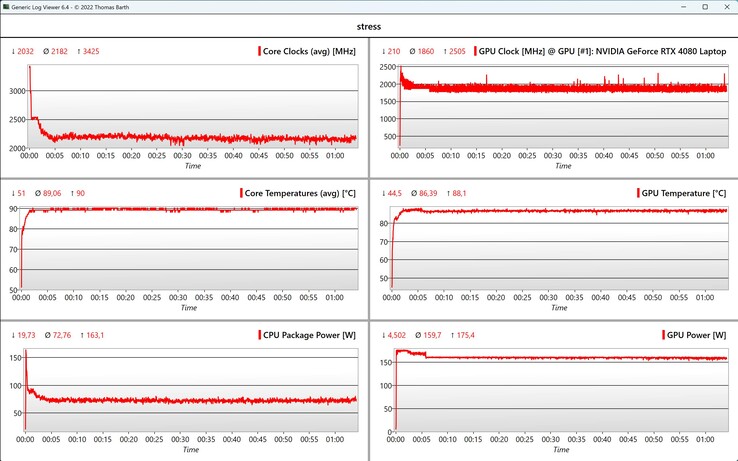
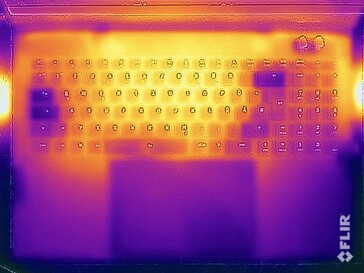
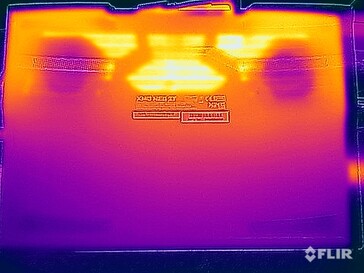
Schenker utilise une interface thermique en métal liquide pour le CPU et le GPU dans les configurations à partir de l'ordinateur portable RTX 4080. Les températures du boîtier restent fraîches lors de tâches simples, mais nous avons mesuré plus de 50 °C sur la face inférieure à certains endroits sous charge. Cependant, en raison de sa taille, le Neo 17 ne sera pas placé sur vos cuisses, donc ces valeurs ne sont pas problématiques. La zone du clavier chauffe également de façon notable, mais il n'y a pas de limites ici. Lors du test de stress, la carte graphique s'est stabilisée à 160 watts et le processeur à environ 70 watts.
(-) La température maximale du côté supérieur est de 46.2 °C / 115 F, par rapport à la moyenne de 40.4 °C / 105 F, allant de 21.2 à 68.8 °C pour la classe Gaming.
(-) Le fond chauffe jusqu'à un maximum de 56.7 °C / 134 F, contre une moyenne de 43.3 °C / 110 F
(+) En utilisation inactive, la température moyenne du côté supérieur est de 28.2 °C / 83 F, par rapport à la moyenne du dispositif de 33.9 °C / 93 F.
(-) 3: The average temperature for the upper side is 39.8 °C / 104 F, compared to the average of 33.9 °C / 93 F for the class Gaming.
(+) Les repose-poignets et le pavé tactile atteignent la température maximale de la peau (33.5 °C / 92.3 F) et ne sont donc pas chauds.
(-) La température moyenne de la zone de l'appui-paume de dispositifs similaires était de 28.8 °C / 83.8 F (-4.7 °C / #-8.5 F).
| Schenker XMG Neo 17 E24 Intel Core i9-14900HX, NVIDIA GeForce RTX 4080 Laptop GPU | Medion Erazer Beast X40 2024 Intel Core i9-14900HX, NVIDIA GeForce RTX 4090 Laptop GPU | HP Omen 17-db0079ng AMD Ryzen 7 8845HS, NVIDIA GeForce RTX 4070 Laptop GPU | Eurocom Raptor X17 Core i9-14900HX Intel Core i9-14900HX, NVIDIA GeForce RTX 4090 Laptop GPU | MSI GE78HX 13VH-070US Intel Core i9-13950HX, NVIDIA GeForce RTX 4080 Laptop GPU | |
|---|---|---|---|---|---|
| Heat | 1% | 14% | 1% | 10% | |
| Maximum Upper Side * (°C) | 46.2 | 47 -2% | 44 5% | 52.2 -13% | 37.4 19% |
| Maximum Bottom * (°C) | 56.7 | 54 5% | 45 21% | 53.2 6% | 45 21% |
| Idle Upper Side * (°C) | 29.8 | 30 -1% | 26 13% | 28.6 4% | 29.8 -0% |
| Idle Bottom * (°C) | 32 | 32 -0% | 27 16% | 29.8 7% | 32.4 -1% |
* ... Moindre est la valeur, meilleures sont les performances
Intervenants
Les haut-parleurs stéréo ne sont pas particulièrement bons mais suffisent pour une vidéo YouTube occasionnelle. Cependant, les haut-parleurs ne sont pas vraiment utiles pour les jeux vidéo en raison des ventilateurs bruyants.
Schenker XMG Neo 17 E24 analyse audio
(+) | les haut-parleurs peuvent jouer relativement fort (83.7# dB)
Basses 100 - 315 Hz
(-) | presque aucune basse - en moyenne 19% plus bas que la médiane
(+) | les basses sont linéaires (6% delta à la fréquence précédente)
Médiums 400 - 2000 Hz
(±) | médiane supérieure - en moyenne 6.6% supérieure à la médiane
(±) | la linéarité des médiums est moyenne (9.4% delta à la fréquence précédente)
Aiguës 2 - 16 kHz
(+) | des sommets équilibrés - à seulement 3.6% de la médiane
(±) | la linéarité des aigus est moyenne (7.1% delta à la fréquence précédente)
Globalement 100 - 16 000 Hz
(±) | la linéarité du son global est moyenne (18.3% de différence avec la médiane)
Par rapport à la même classe
» 58% de tous les appareils testés de cette catégorie étaient meilleurs, 9% similaires, 34% pires
» Le meilleur avait un delta de 6%, la moyenne était de 18%, le pire était de 132%.
Par rapport à tous les appareils testés
» 39% de tous les appareils testés étaient meilleurs, 8% similaires, 53% pires
» Le meilleur avait un delta de 4%, la moyenne était de 24%, le pire était de 134%.
Medion Erazer Beast X40 2024 analyse audio
(+) | les haut-parleurs peuvent jouer relativement fort (88# dB)
Basses 100 - 315 Hz
(±) | basse réduite - en moyenne 14.7% inférieure à la médiane
(±) | la linéarité des basses est moyenne (7.2% delta à la fréquence précédente)
Médiums 400 - 2000 Hz
(+) | médiane équilibrée - seulement 3.7% de la médiane
(+) | les médiums sont linéaires (5.8% delta à la fréquence précédente)
Aiguës 2 - 16 kHz
(+) | des sommets équilibrés - à seulement 2.8% de la médiane
(+) | les aigus sont linéaires (6.4% delta à la fréquence précédente)
Globalement 100 - 16 000 Hz
(+) | le son global est linéaire (12.1% différence à la médiane)
Par rapport à la même classe
» 12% de tous les appareils testés de cette catégorie étaient meilleurs, 4% similaires, 84% pires
» Le meilleur avait un delta de 6%, la moyenne était de 18%, le pire était de 132%.
Par rapport à tous les appareils testés
» 9% de tous les appareils testés étaient meilleurs, 2% similaires, 89% pires
» Le meilleur avait un delta de 4%, la moyenne était de 24%, le pire était de 134%.
HP Omen 17-db0079ng analyse audio
(±) | le niveau sonore du haut-parleur est moyen mais bon (80# dB)
Basses 100 - 315 Hz
(-) | presque aucune basse - en moyenne 19.1% plus bas que la médiane
(±) | la linéarité des basses est moyenne (10.3% delta à la fréquence précédente)
Médiums 400 - 2000 Hz
(+) | médiane équilibrée - seulement 1.9% de la médiane
(+) | les médiums sont linéaires (4.4% delta à la fréquence précédente)
Aiguës 2 - 16 kHz
(+) | des sommets équilibrés - à seulement 3.8% de la médiane
(±) | la linéarité des aigus est moyenne (7.8% delta à la fréquence précédente)
Globalement 100 - 16 000 Hz
(+) | le son global est linéaire (14.3% différence à la médiane)
Par rapport à la même classe
» 26% de tous les appareils testés de cette catégorie étaient meilleurs, 7% similaires, 67% pires
» Le meilleur avait un delta de 6%, la moyenne était de 18%, le pire était de 132%.
Par rapport à tous les appareils testés
» 17% de tous les appareils testés étaient meilleurs, 4% similaires, 79% pires
» Le meilleur avait un delta de 4%, la moyenne était de 24%, le pire était de 134%.
Eurocom Raptor X17 Core i9-14900HX analyse audio
(±) | le niveau sonore du haut-parleur est moyen mais bon (74.2# dB)
Basses 100 - 315 Hz
(±) | basse réduite - en moyenne 13.4% inférieure à la médiane
(±) | la linéarité des basses est moyenne (10.1% delta à la fréquence précédente)
Médiums 400 - 2000 Hz
(±) | médiane supérieure - en moyenne 6.6% supérieure à la médiane
(±) | la linéarité des médiums est moyenne (8.6% delta à la fréquence précédente)
Aiguës 2 - 16 kHz
(+) | des sommets équilibrés - à seulement 2% de la médiane
(±) | la linéarité des aigus est moyenne (8.5% delta à la fréquence précédente)
Globalement 100 - 16 000 Hz
(±) | la linéarité du son global est moyenne (24% de différence avec la médiane)
Par rapport à la même classe
» 86% de tous les appareils testés de cette catégorie étaient meilleurs, 4% similaires, 9% pires
» Le meilleur avait un delta de 6%, la moyenne était de 18%, le pire était de 132%.
Par rapport à tous les appareils testés
» 72% de tous les appareils testés étaient meilleurs, 6% similaires, 22% pires
» Le meilleur avait un delta de 4%, la moyenne était de 24%, le pire était de 134%.
MSI GE78HX 13VH-070US analyse audio
(+) | les haut-parleurs peuvent jouer relativement fort (84.4# dB)
Basses 100 - 315 Hz
(±) | basse réduite - en moyenne 8.3% inférieure à la médiane
(±) | la linéarité des basses est moyenne (9.3% delta à la fréquence précédente)
Médiums 400 - 2000 Hz
(±) | médiane supérieure - en moyenne 6.8% supérieure à la médiane
(+) | les médiums sont linéaires (3.4% delta à la fréquence précédente)
Aiguës 2 - 16 kHz
(+) | des sommets équilibrés - à seulement 2% de la médiane
(+) | les aigus sont linéaires (2.6% delta à la fréquence précédente)
Globalement 100 - 16 000 Hz
(+) | le son global est linéaire (12% différence à la médiane)
Par rapport à la même classe
» 12% de tous les appareils testés de cette catégorie étaient meilleurs, 4% similaires, 84% pires
» Le meilleur avait un delta de 6%, la moyenne était de 18%, le pire était de 132%.
Par rapport à tous les appareils testés
» 9% de tous les appareils testés étaient meilleurs, 2% similaires, 89% pires
» Le meilleur avait un delta de 4%, la moyenne était de 24%, le pire était de 134%.
Consommation électrique
La consommation maximale de 13 watts en mode veille est très faible pour un ordinateur portable de 17 pouces. En revanche, en jeu, elle avoisine les 300 watts, ce qui n'est pas surprenant compte tenu des valeurs TDP/TGP élevées. Le bloc d'alimentation de 330 watts fourni est bien dimensionné. Cependant, la consommation en veille de 2,1 watts est trop élevée.
| Éteint/en veille | |
| Au repos | |
| Fortement sollicité |
|
Légende:
min: | |
Power consumption Cyberpunk / Stresstest
Power consumption with external monitor
Durée de vie de la batterie
Le Neo 17 est équipé d'une batterie de 99 Wh, qui permet d'atteindre une autonomie décente d'environ 6 heures en mode WLAN à 150 cd/m² (58% de la luminosité maximale de l'appareil de test). Ce qui place le grand joueur en milieu de peloton par rapport à la concurrence. Une charge complète avec l'appareil allumé prend 107 minutes, tandis que 80% de la batterie est disponible après environ 45 minutes.
Notebookcheck note globale
Le XMG Neo 17 se concentre clairement sur les performances de jeu et celles-ci sont très bonnes. Grâce au refroidissement par eau optionnel, les températures et donc le bruit des ventilateurs peuvent être réduits de manière significative. L'écran QHD mat avec 240 Hz et des temps de réponse rapides est également très adapté aux jeux.
Schenker XMG Neo 17 E24
- 11/27/2024 v8
Andreas Osthoff
Transparency
La sélection des appareils à examiner est effectuée par notre équipe éditoriale. L'échantillon de test a été prêté à l'auteur par le fabricant ou le détaillant pour les besoins de cet examen. Le prêteur n'a pas eu d'influence sur cette évaluation et le fabricant n'a pas reçu de copie de cette évaluation avant sa publication. Il n'y avait aucune obligation de publier cet article. En tant que média indépendant, Notebookcheck n'est pas soumis à l'autorité des fabricants, des détaillants ou des éditeurs.
Voici comment Notebookcheck teste
Chaque année, Notebookcheck examine de manière indépendante des centaines d'ordinateurs portables et de smartphones en utilisant des procédures standardisées afin de garantir que tous les résultats sont comparables. Nous avons continuellement développé nos méthodes de test depuis environ 20 ans et avons établi des normes industrielles dans le processus. Dans nos laboratoires de test, des équipements de mesure de haute qualité sont utilisés par des techniciens et des rédacteurs expérimentés. Ces tests impliquent un processus de validation en plusieurs étapes. Notre système d'évaluation complexe repose sur des centaines de mesures et de points de référence bien fondés, ce qui garantit l'objectivité.
















 Total Sustainability Score: