
Notebookcheck Logo
Teaser

Ordinateur portable professionnel phare offrant près de 24 heures d'autonomie : test du Lenovo ThinkPad X1 Carbon Gen 14

Qui a besoin de Windows sur ARM ?

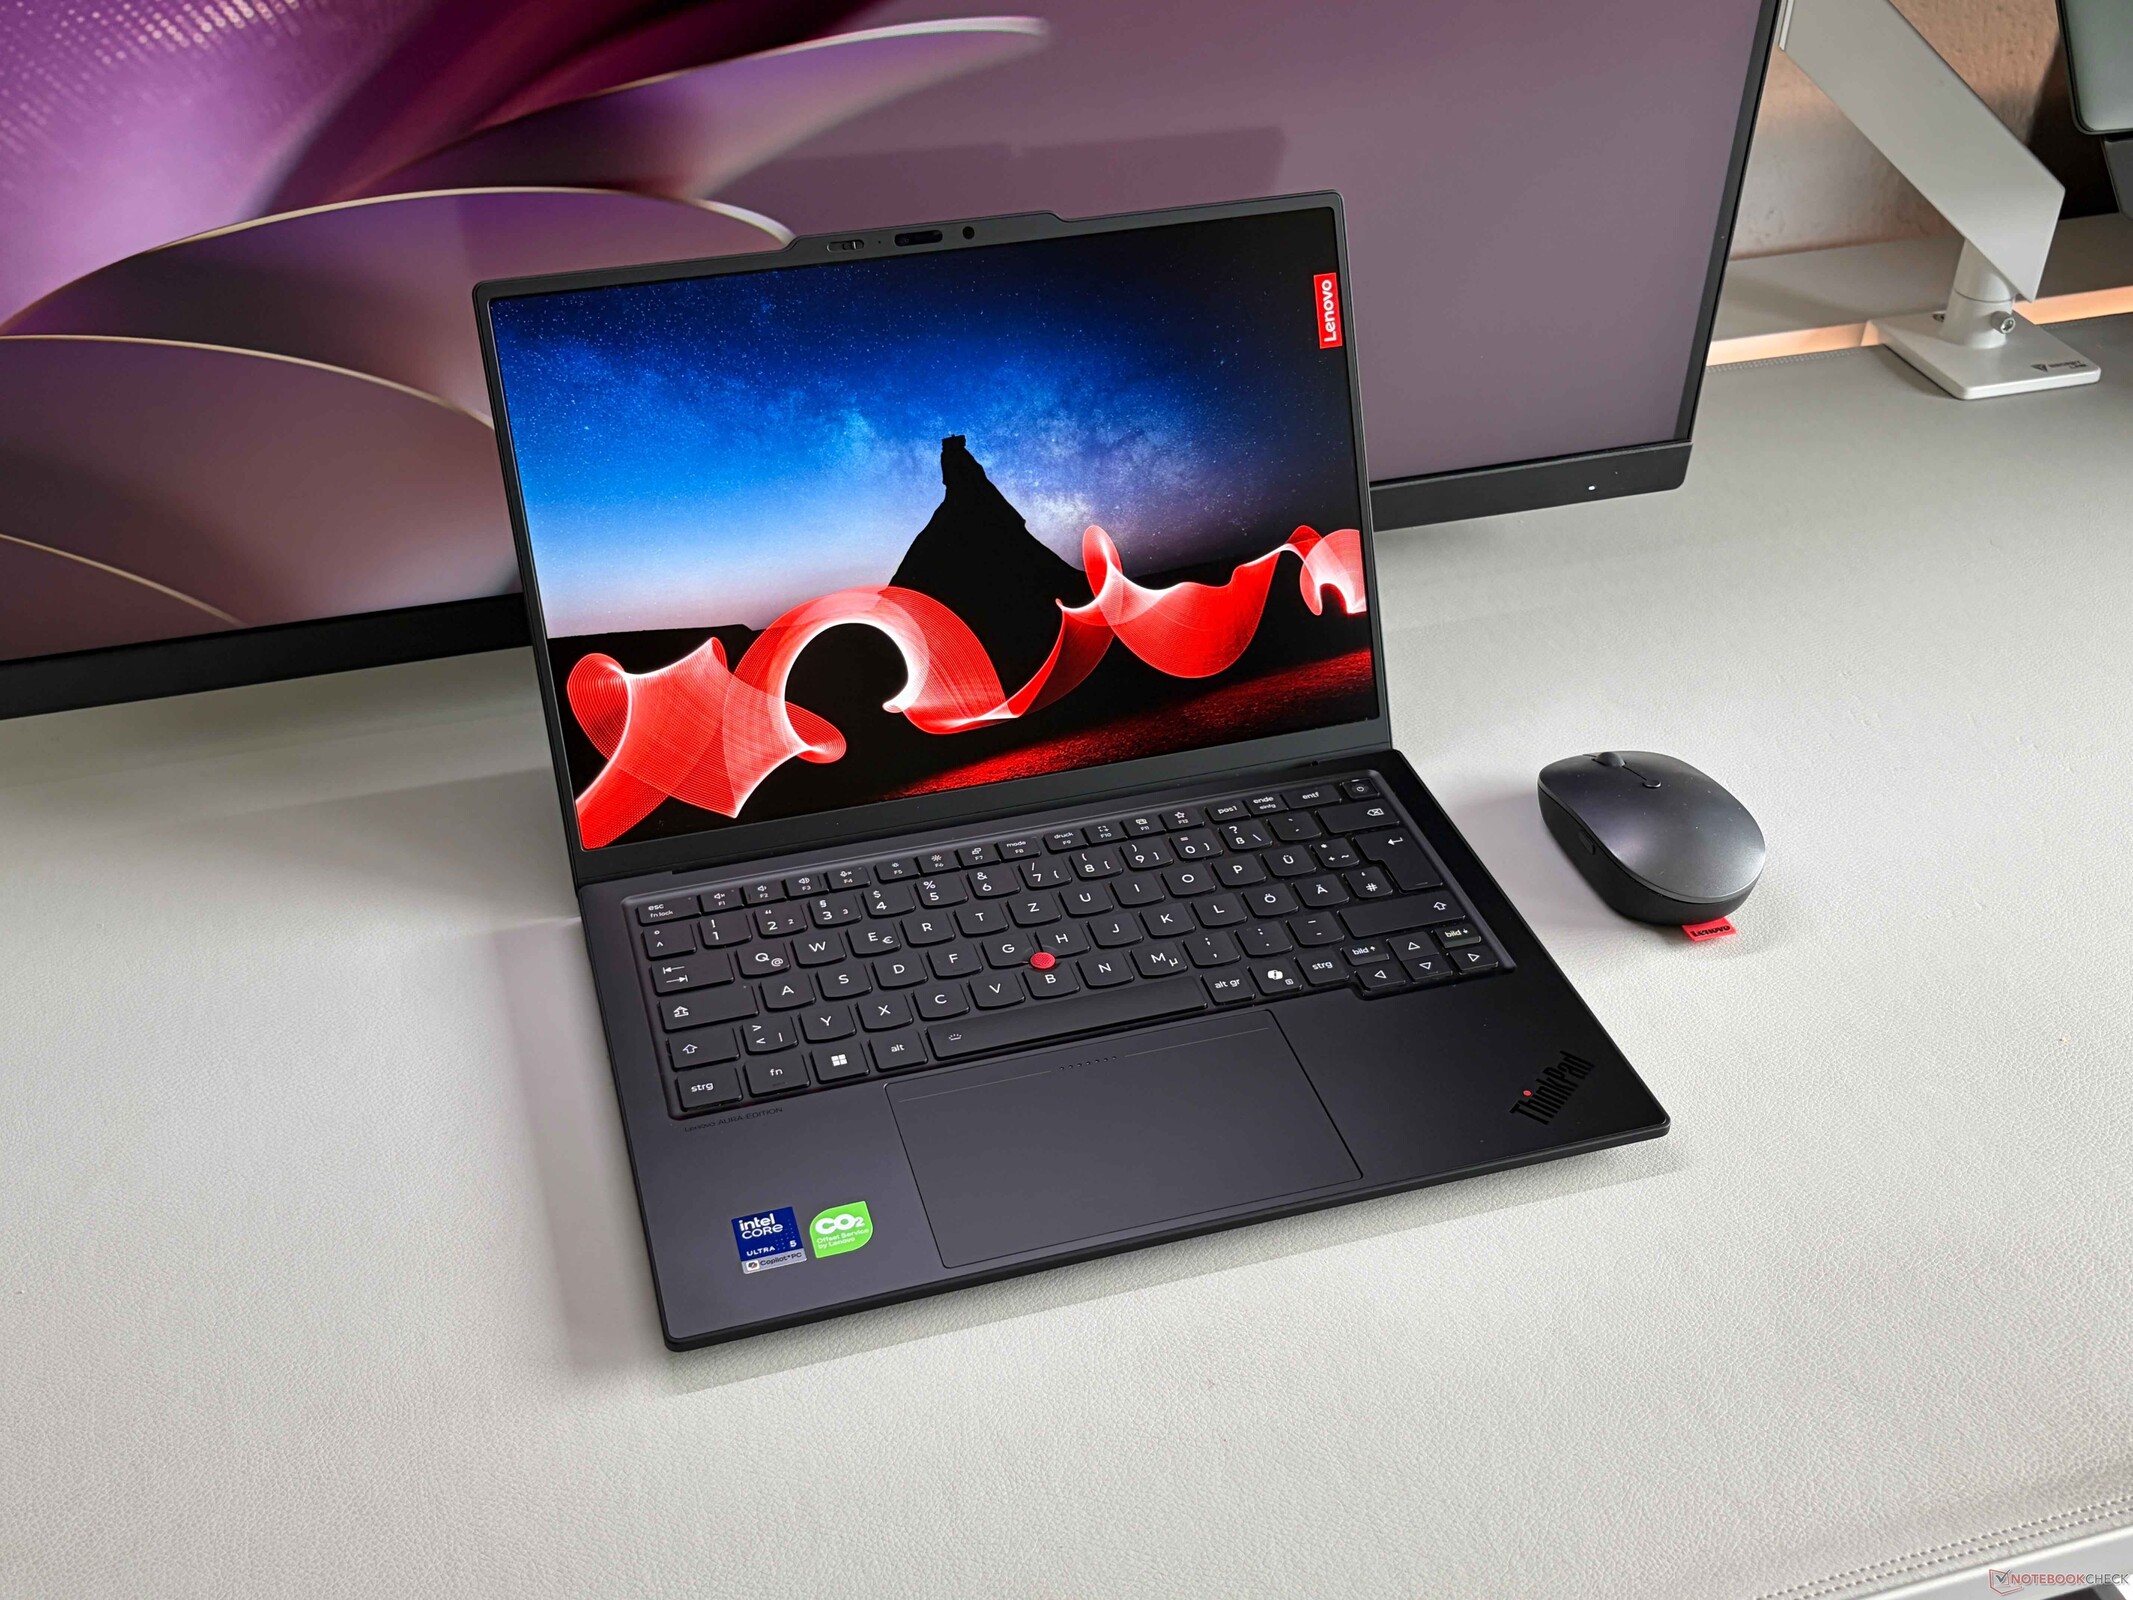
Le ThinkPad X1 Carbon est le fleuron de la gamme professionnelle de Lenovo et le nouveau modèle de 14e génération bénéficie d’un nouveau châssis ainsi que des nouveaux processeurs mobiles Panther Lake d’Intel. L’écran tactile IPS à faible consommation offre une autonomie exceptionnelle et, grâce à d’excellents périphériques de saisie ainsi qu’à une connectivité 5G en option, il s’agit d’un excellent ordinateur portable professionnel.
Andreas Osthoff, 👁 Andreas Osthoff (traduit par DeepL / Ninh Duy) Publié 🇺🇸 🇳🇱 ...

Verdict : le ThinkPad X1 Carbon Gen 14 est l'un des meilleurs ordinateurs portables professionnels

Le nouveau Lenovo ThinkPad X1 Carbon Gen 14 est une fois de plus un très bon ordinateur portable professionnel, et le passage aux nouveaux processeurs mobiles Panther Lake d'Intel offre des performances CPU accrues ainsi qu'une plus grande autonomie de la batterie. Vous pouvez même opter pour les puces haut de gamme Core Ultra X afin de bénéficier de performances maximales du processeur et de la carte graphique, mais le processeur graphique intégré standard devrait suffire pour la plupart des tâches professionnelles. L'écran tactile IPS de série offre une qualité d'image correcte, mais ne fonctionne qu'à 60 Hz. Il s'agit toutefois d'une version à faible consommation d'énergie qui contribue à l'autonomie de la batterie, laquelle est excellente : près de 24 heures lors de notre test en Wi-Fi et encore 14 heures avec la luminosité de l'écran réglée au maximum. Le calibrage d’usine est toutefois médiocre et nous vous recommandons de le calibrer (ou d’utiliser notre profil), même si cela réduira sensiblement la luminosité maximale. Vous pouvez également opter pour une dalle OLED à 120 Hz, mais cela affecte l’autonomie de la batterie et l’image est en réalité même un peu plus granuleuse par rapport à la version IPS.

Download your licensed rating image as SVG / PNG

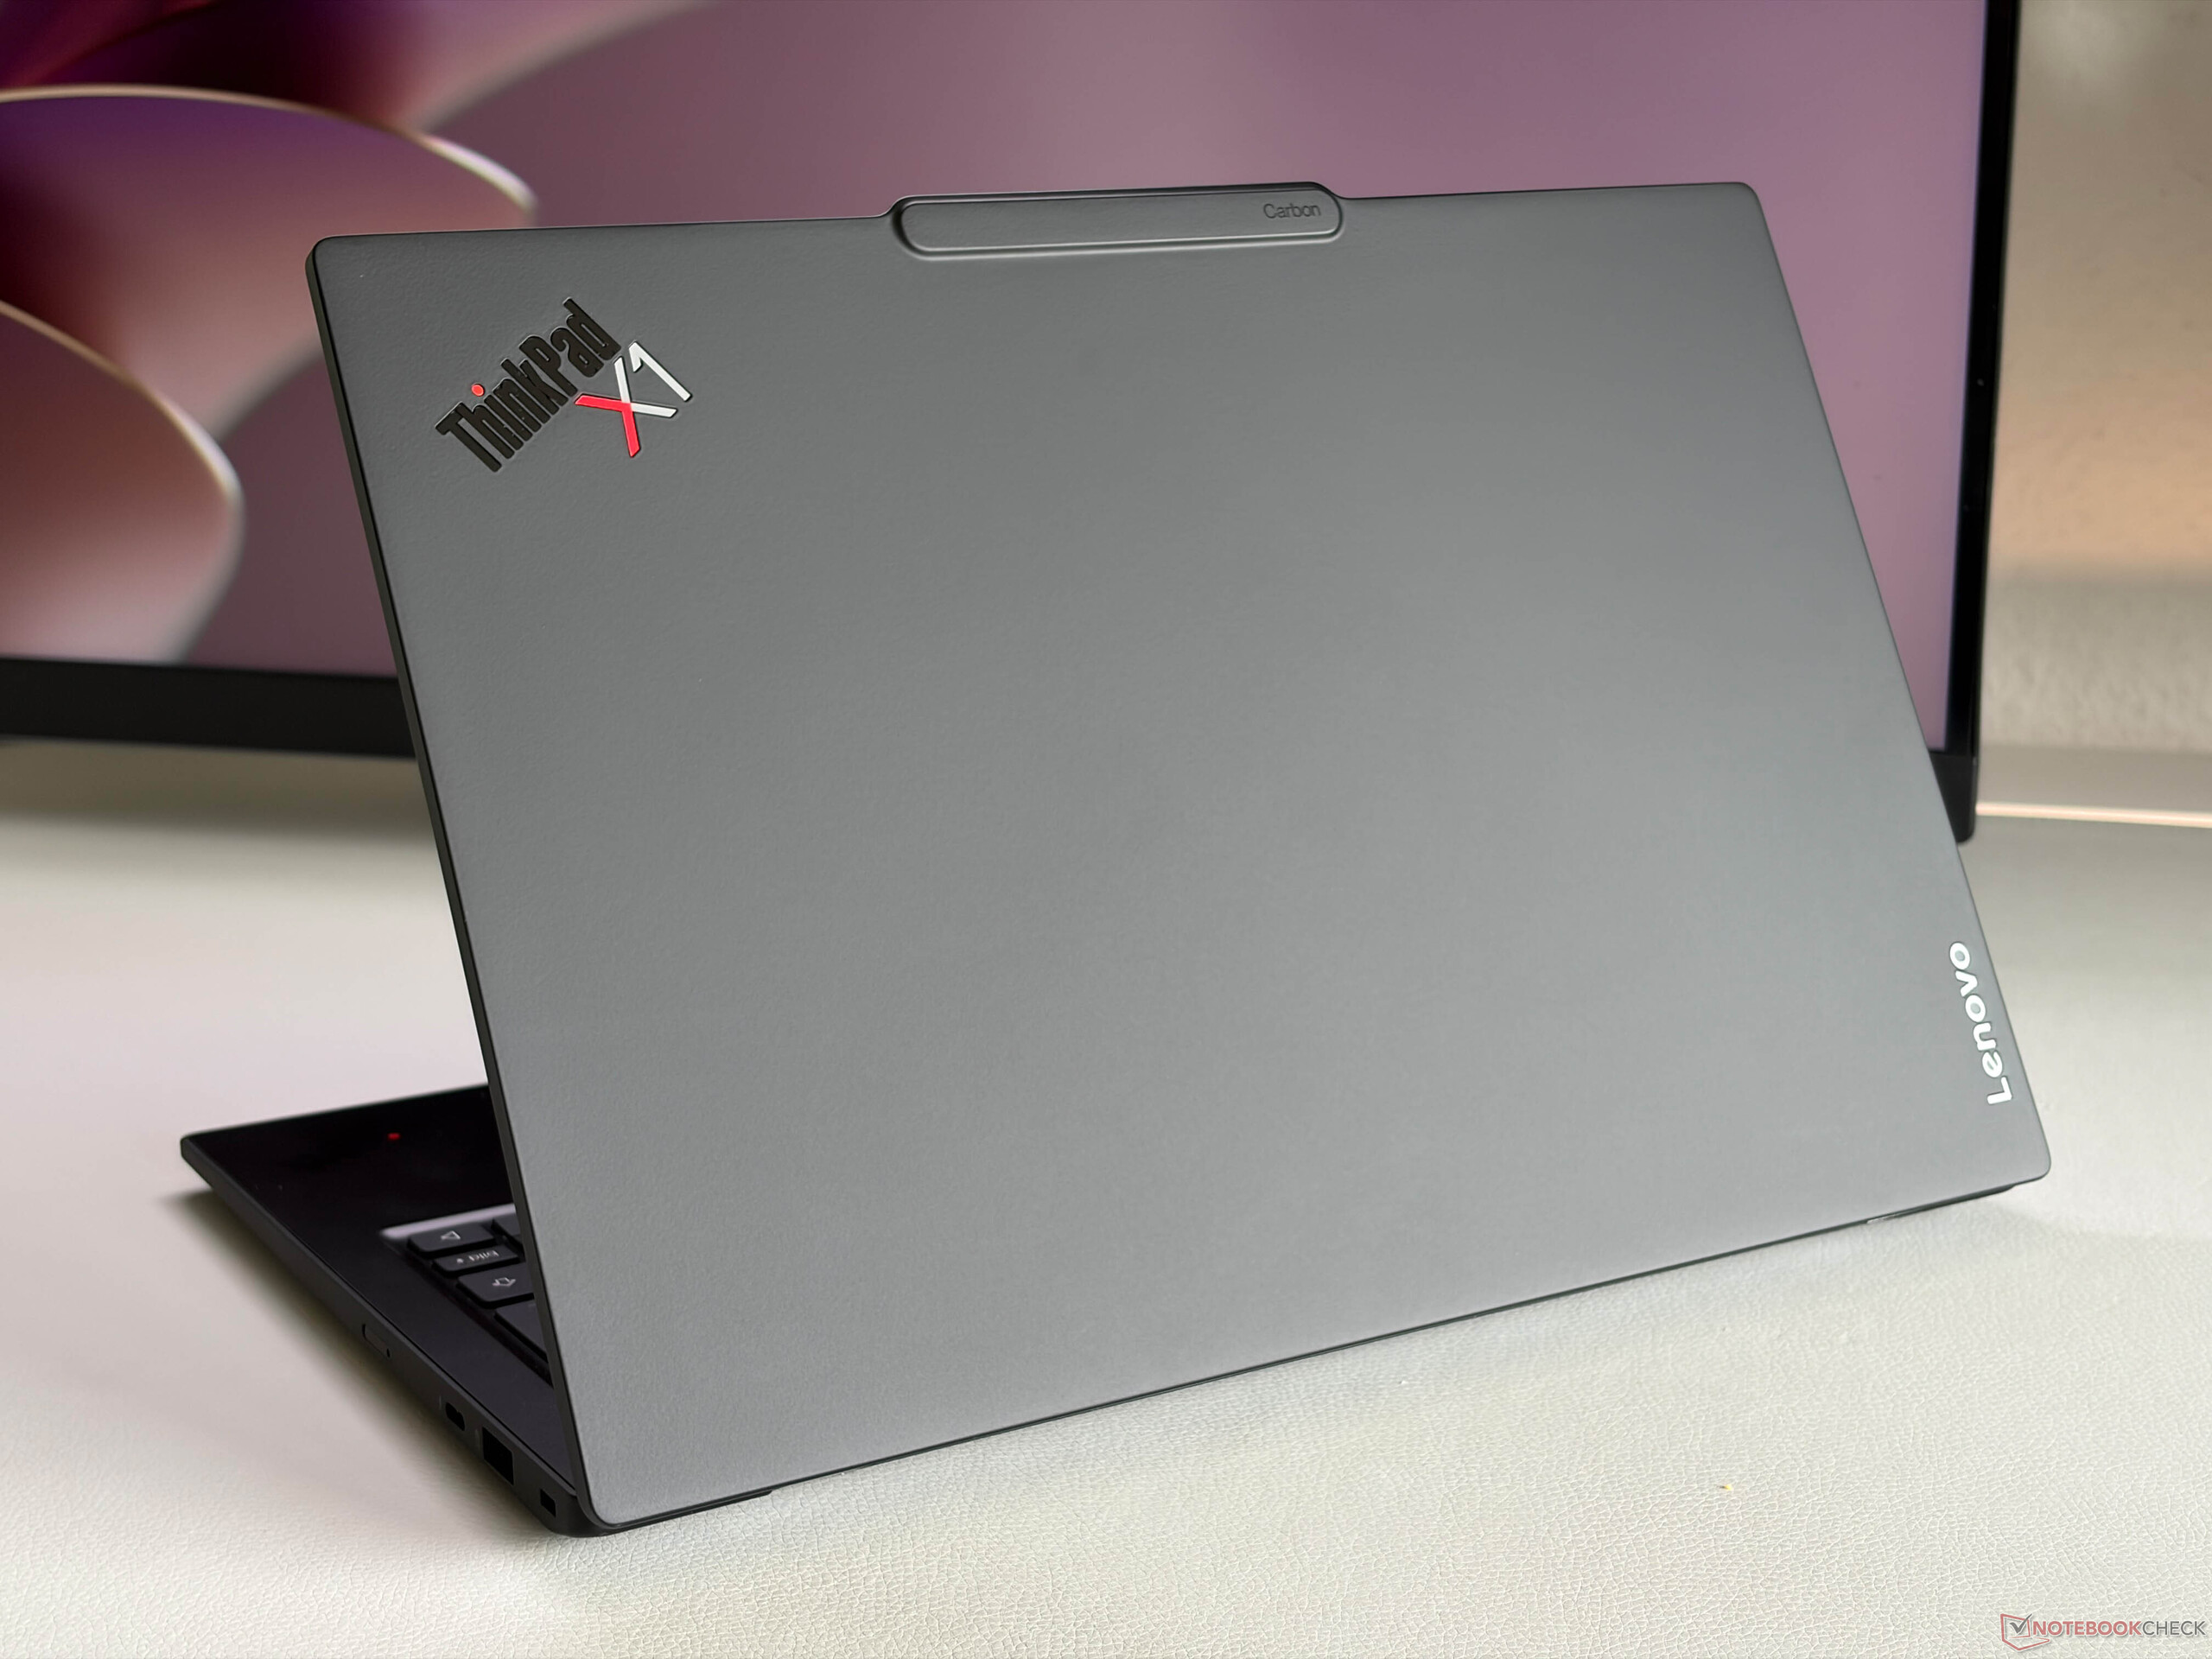
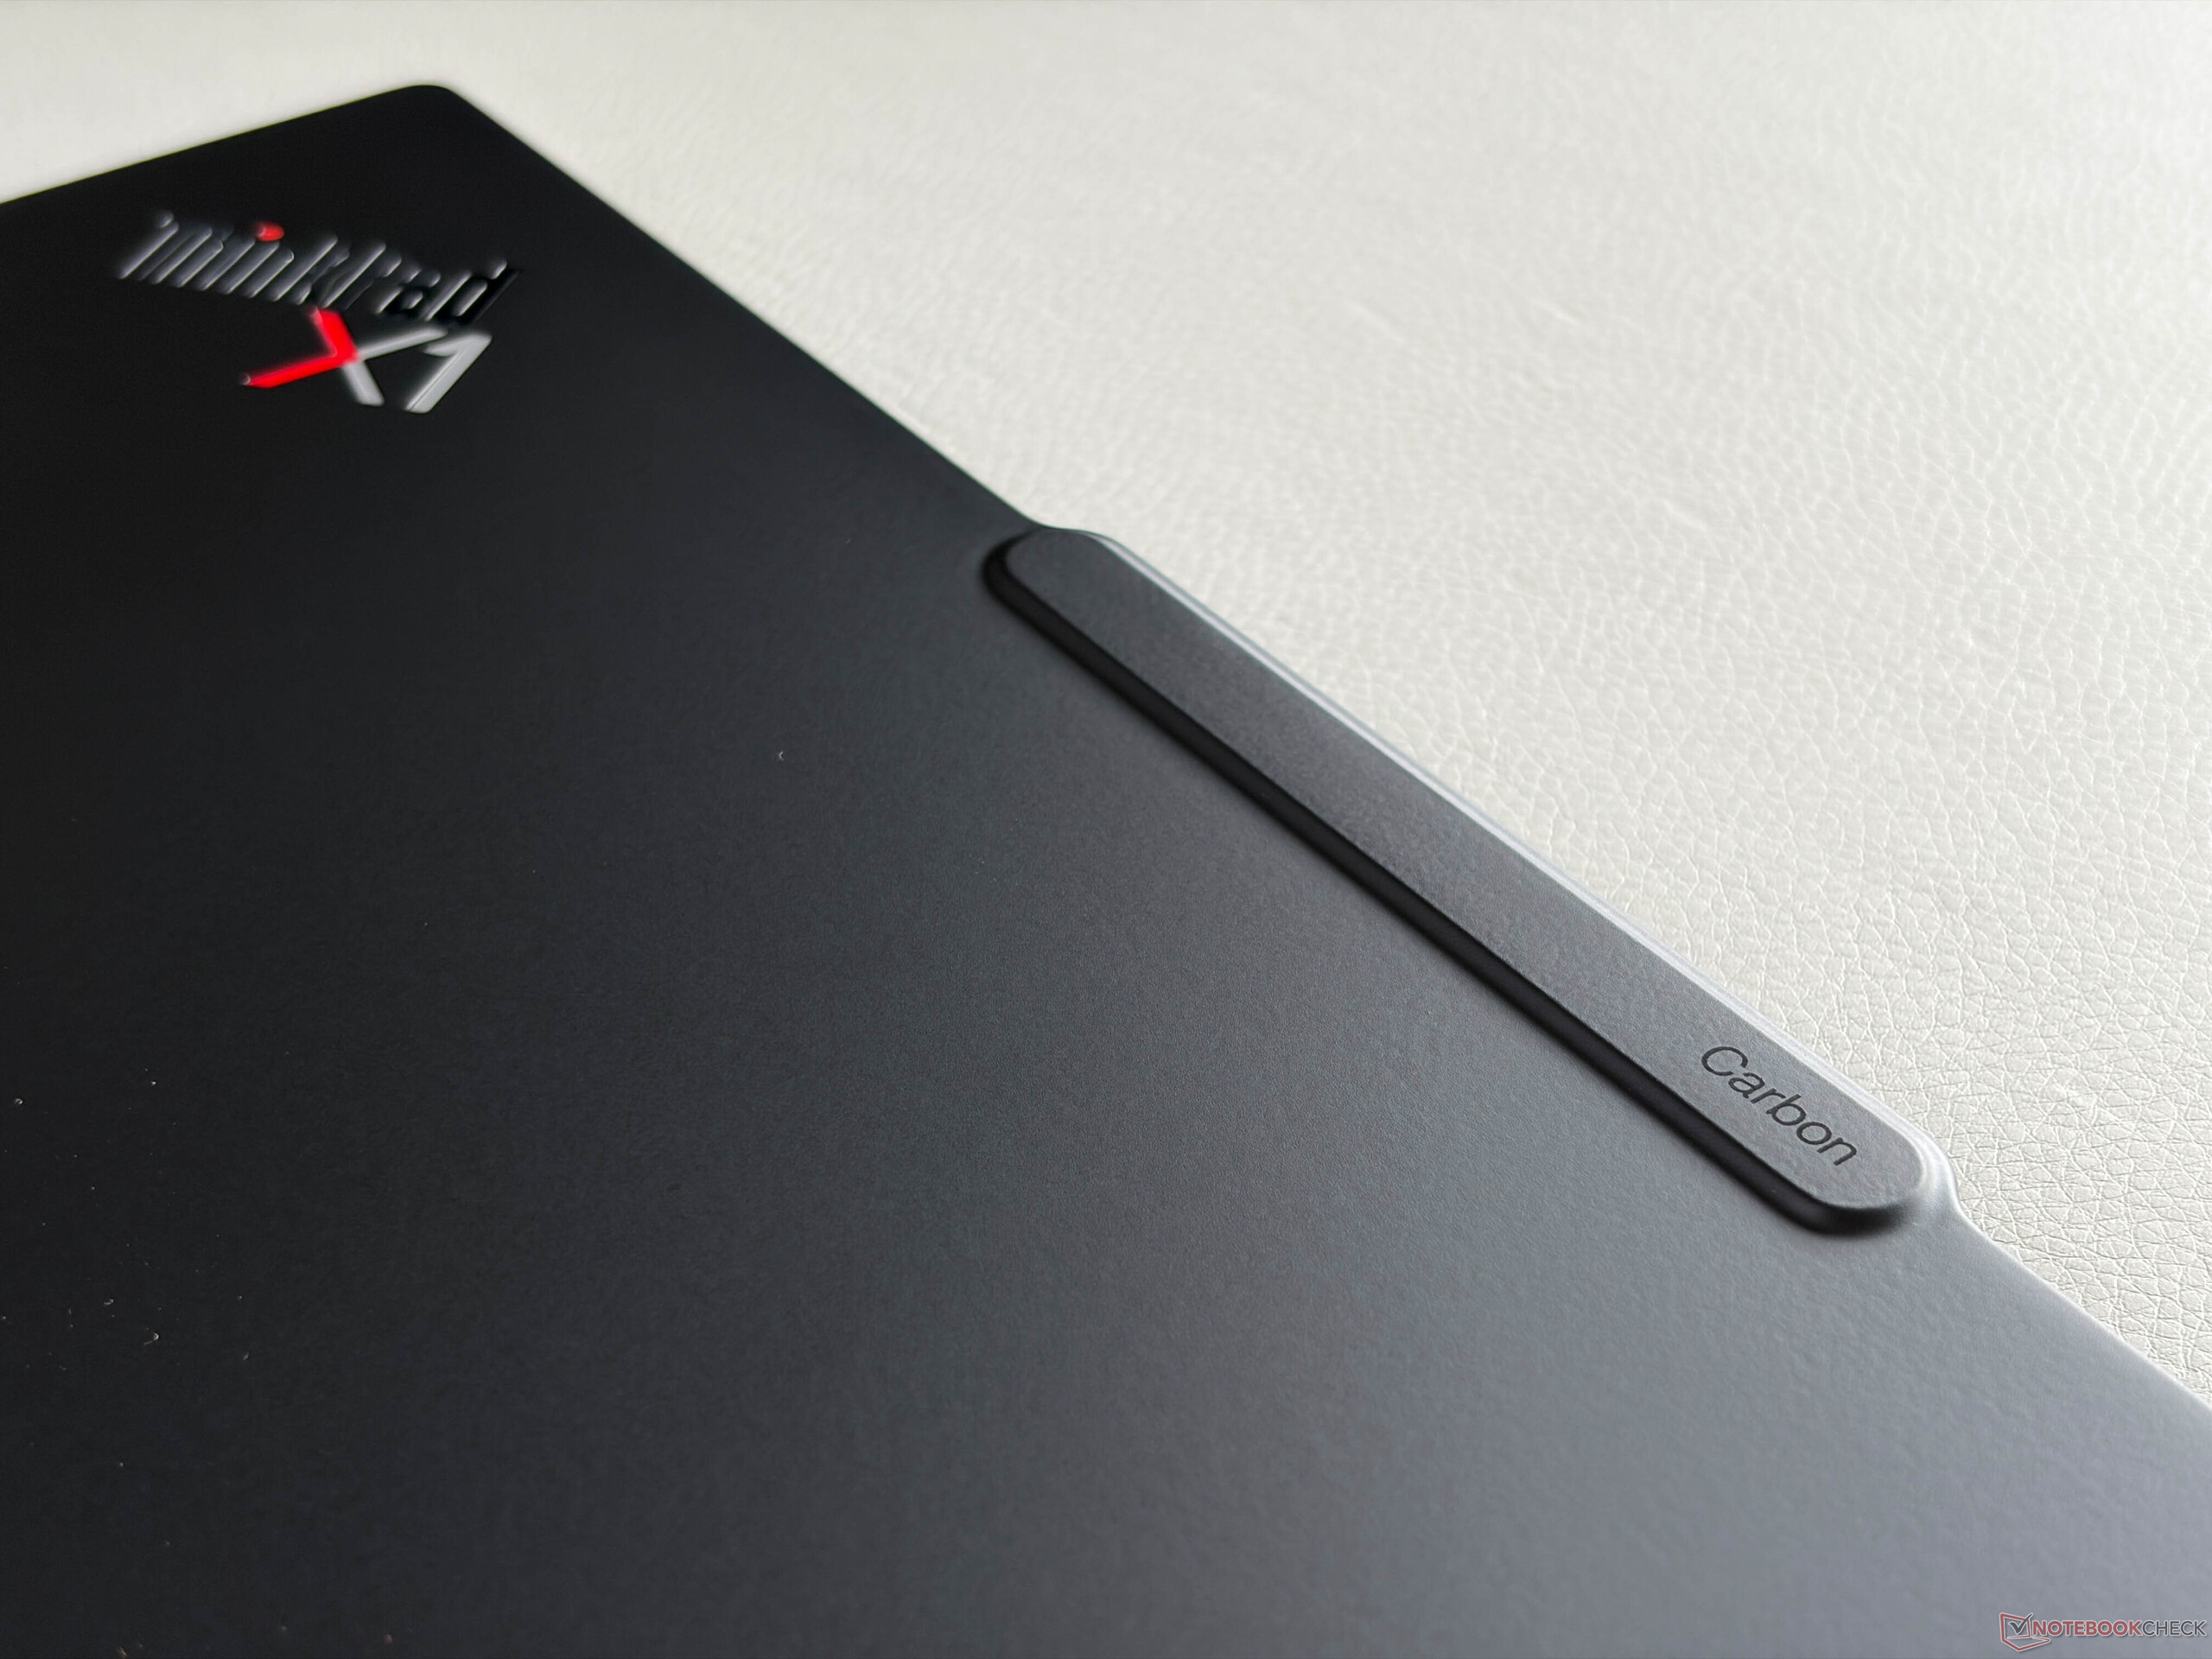
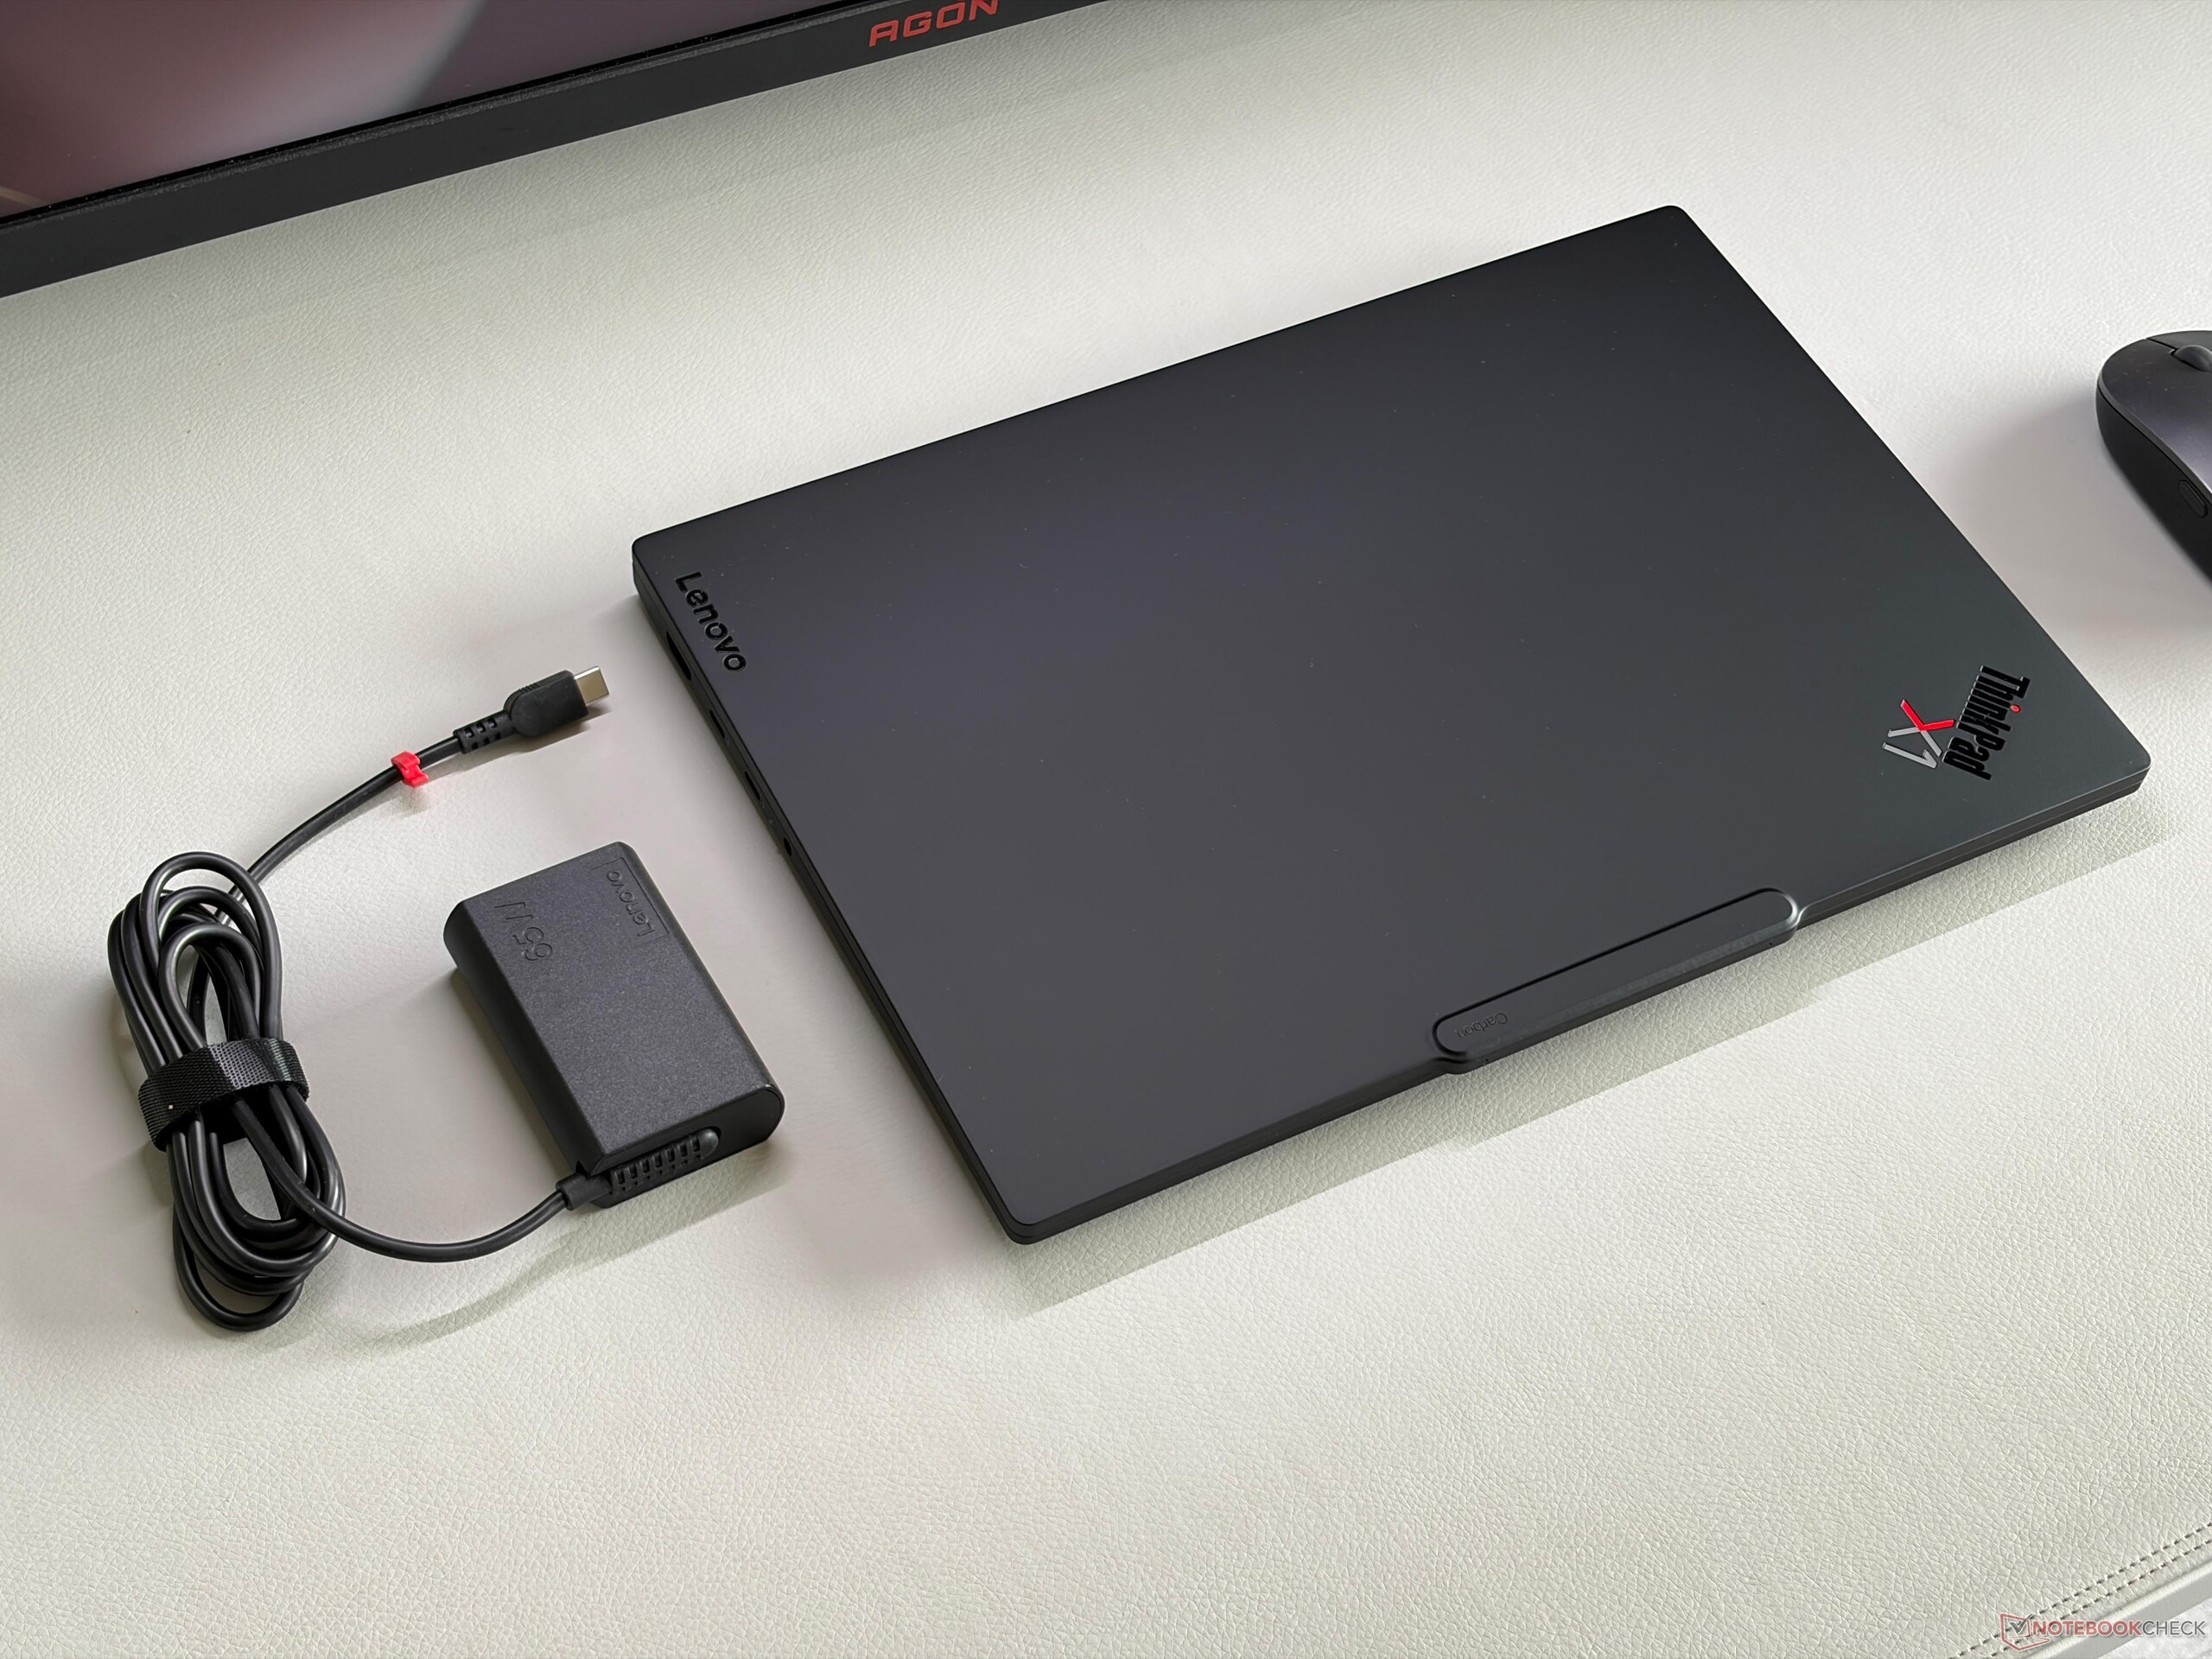
Cela nous amène également aux différentes versions de châssis, car l’épaisseur du couvercle varie en fonction de l’écran (les modèles à écran tactile sont légèrement plus épais) et les modèles OLED sont également dotés d’une base en magnésium au lieu de l’aluminium (IPS), ce qui a un impact considérable sur le poids. Notre modèle à écran tactile IPS pèse 1,14 kg et est donc environ 150 grammes plus lourd que la version OLED (989 grammes), ce qui constitue une différence très perceptible. Vous devrez ici choisir entre un châssis plus léger (OLED) et une plus grande autonomie de batterie (IPS). Il convient également de mentionner le renflement massif au niveau de la caméra, qui est vraiment inesthétique.

La connectivité s’est améliorée grâce à un port Thunderbolt 4 supplémentaire sur le côté droit, et vous bénéficiez de toutes les fonctionnalités modernes souhaitées, y compris la possibilité d’ajouter un modem 5G. Lenovo a également amélioré les haut-parleurs, et le résultat est excellent, même au-delà du cadre d’un ordinateur portable professionnel. La mémoire est soudée, mais toutes les versions offrent au moins 32 Go et vous pouvez obtenir jusqu’à 64 Go en combinaison avec les puissants processeurs Core Ultra X. Dans l’ensemble, le ThinkPad X1 Carbon Gen 14 est une fois de plus un très bon ordinateur portable professionnel, mais soyez conscient des différences selon l’option d’écran choisie. Nous ajouterons prochainement davantage d’informations et les résultats des tests concernant la dalle OLED mate.

Points positifs

+ châssis robuste
+ excellente autonomie de la batterie
+ bonnes performances du système
+ périphériques de saisie confortables
+ très bons haut-parleurs
+ 3 ports Thunderbolt 4, Wi-Fi 7 et PCIe 5.0
+ compatible WWAN

Points négatifs

- mémoire vive soudée
- différences de châssis en fonction du choix de l'écran
- mauvais étalonnage de l'écran à la sortie d'usine

Prix et disponibilité

Vous pouvez vous procurer le ThinkPad X1 Carbon Gen 14 équipé du processeur Core Ultra 7 355, plus rapide, au prix de 2 749 $ sur Amazon ou le configurer directement sur le site Web de Lenovo à partir de 2 249$.

Amazon Logo
$2,737.14
Lenovo ThinkPad X1 Carbon Gen 14 Aura Edition 21V700AQUS 14" Touchscreen Copilot+ PC Notebook - WUXGA - 60 Hz - Intel Core Ultra 7 Series 3 355 - Intel Evo Platform - 32 GB - 512 GB SSD
Bestpreis 2356 € notebookstore
Lenovo ThinkPad X1 Carbon G14 Aura Edition, Black, Core Ultra 5 325, 32GB RAM, 512GB SSD, DE (21V70075GE)
2. 2362.85 € minaxum.it
3. 2369 € MetaComp
4. 2372 € lapstars

Spécifications

Lenovo ThinkPad X1 Carbon Gen 14 21V70075GE
Processeur
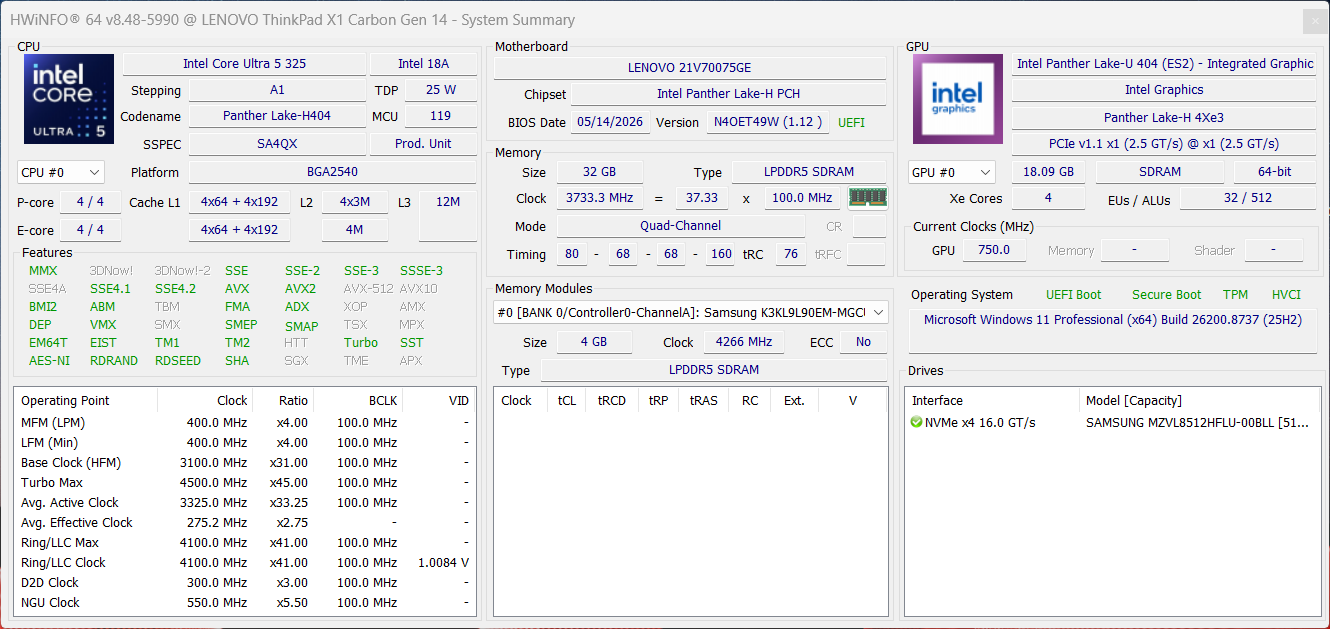
Intel Core Ultra 5 325 8c/8t, 4 x 4.5 GHz Intel Cougar Cove P-Core, 4 x 3.4 GHz Intel Darkmont LP E-Core, 35 W PL2 / Short Burst, 35 W PL1 / Sustained, Panther Lake
Carte graphique
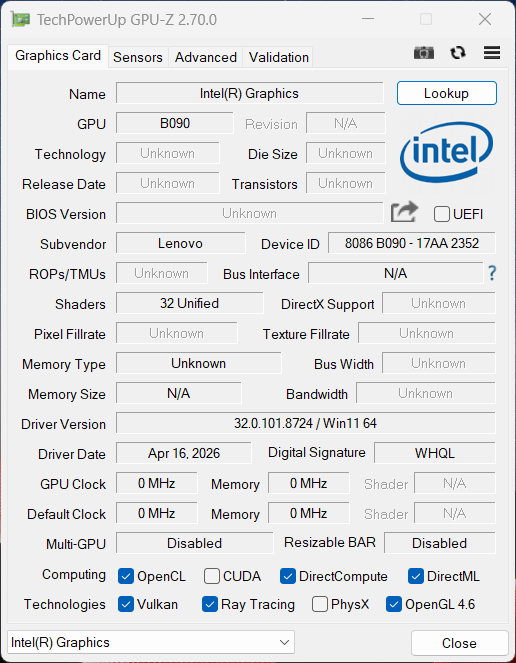
Intel Graphics 4 Xe3 Panther Lake iGPU, Processeur: 2450 MHz, 32.0.101.8724
Mémoire
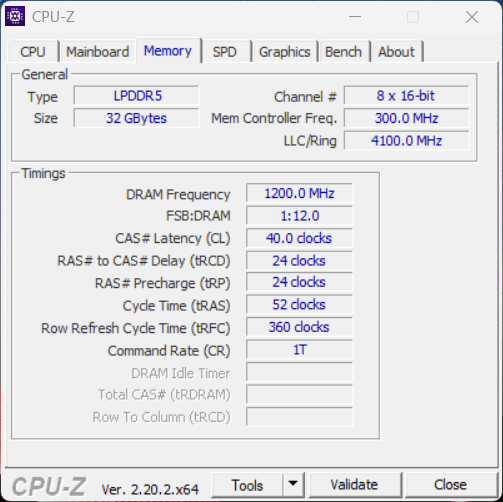
32 Go 
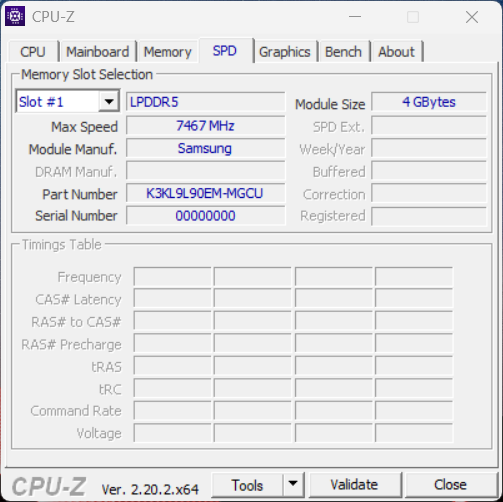
, LPDDR5x-7467, Dual-Channel, onboard
Écran
14.00 pouces 16:10, 1920 x 1200 pixel 162 PPP, capacitive, B140UAX01.1, IPS, brillant: non, 60 Hz
Carte mère
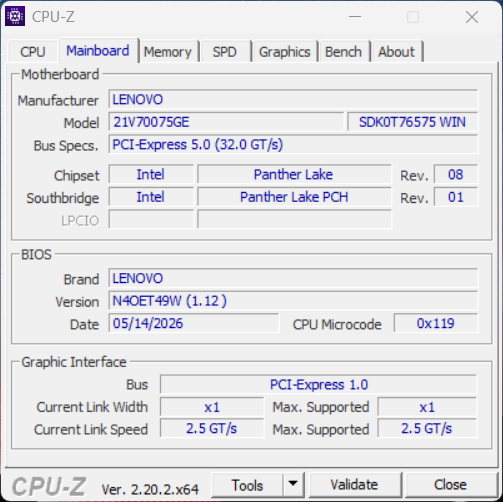
Intel Panther Lake-H PCH
Disque dur
Samsung PM9C1b MZVL8512HFLU-00BLL, 512 Go 
, 387 Go libres
Carte son
Intel Panther Lake-H PCH - High Definition Audio - AVS (Audio, Voice, Speech)
Connexions
1 USB 3.0 / 3.1 Gen1, 3 Thunderbolt 4, USB-C Power Delivery (PD), 1 HDMI, 3 DisplayPort, 1 Encoche de Sécurité Kensington, 1 Port pour Station d'accueil, Connectique audio: 3.5 mm stereo, 1 Lecteur d'empreintes digitales
Réseau
Intel Wi-Fi 7 BE211 320MHz (a/b/g/n = Wi-Fi 4/ac = Wi-Fi 5/ax = Wi-Fi 6/ Wi-Fi 6E 6 GHz be = Wi-Fi 7), Bluetooth 5.4
Taille
Hauteur x Largeur x Profondeur (en mm): 16.8 x 313.5 x 219.3
Batterie
58 Wh, 4960 mAh Lithium-Polymère
Système d'exploitation
Microsoft Windows 11 Pro
Appareil photo
Webcam: 5 MP + IR
Appareil photo primaire: 5 MPix
Fonctionnalités additionnelles
Haut-parleurs: Stereo 2x 2W, Clavier: Chiclet, Rétroéclairage du clavier: oui, 65W PSU, 36 Mois Garantie
Poids
1.139 kg, Alimentation: 275 g
Prix
2469 euros
Amazon
Remarque : le fabricant peut utiliser des composants provenant de différents fournisseurs, notamment des panneaux d'affichage, des lecteurs ou des clés USB ayant des spécifications similaires.


Boîtier, connectivité et périphériques d'entrée

Les modèles à écran tactile sont légèrement plus épais.

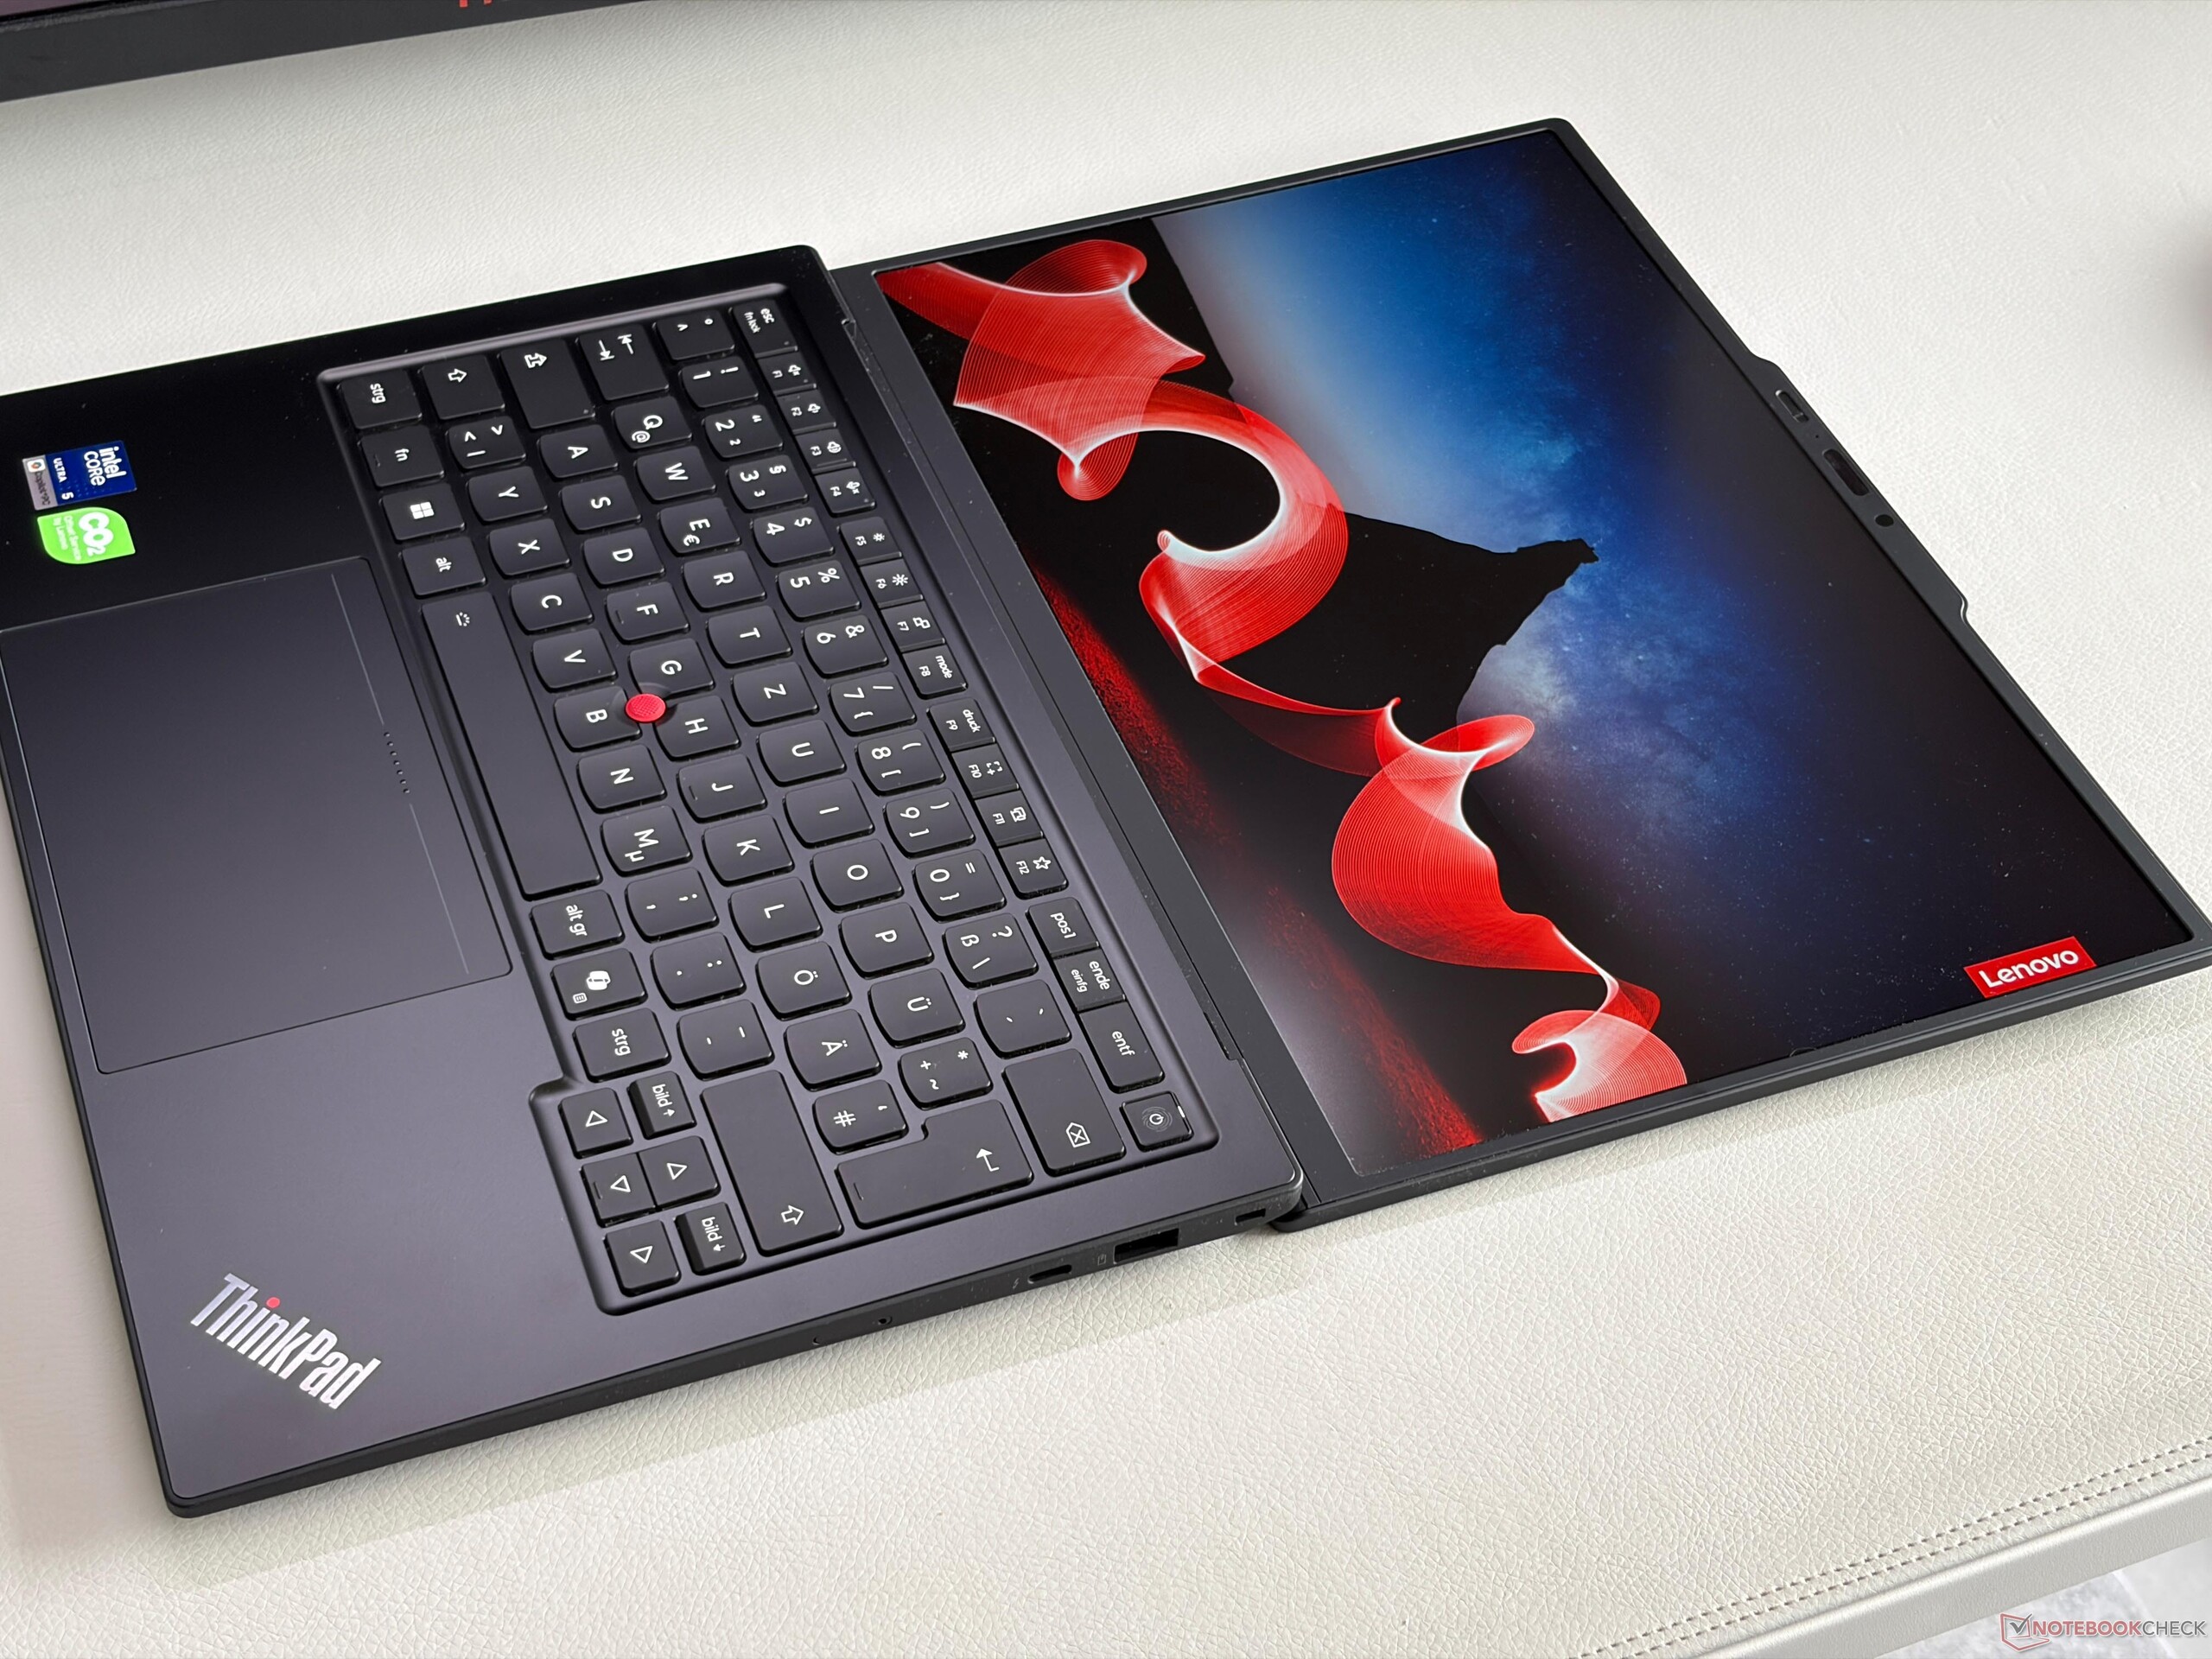
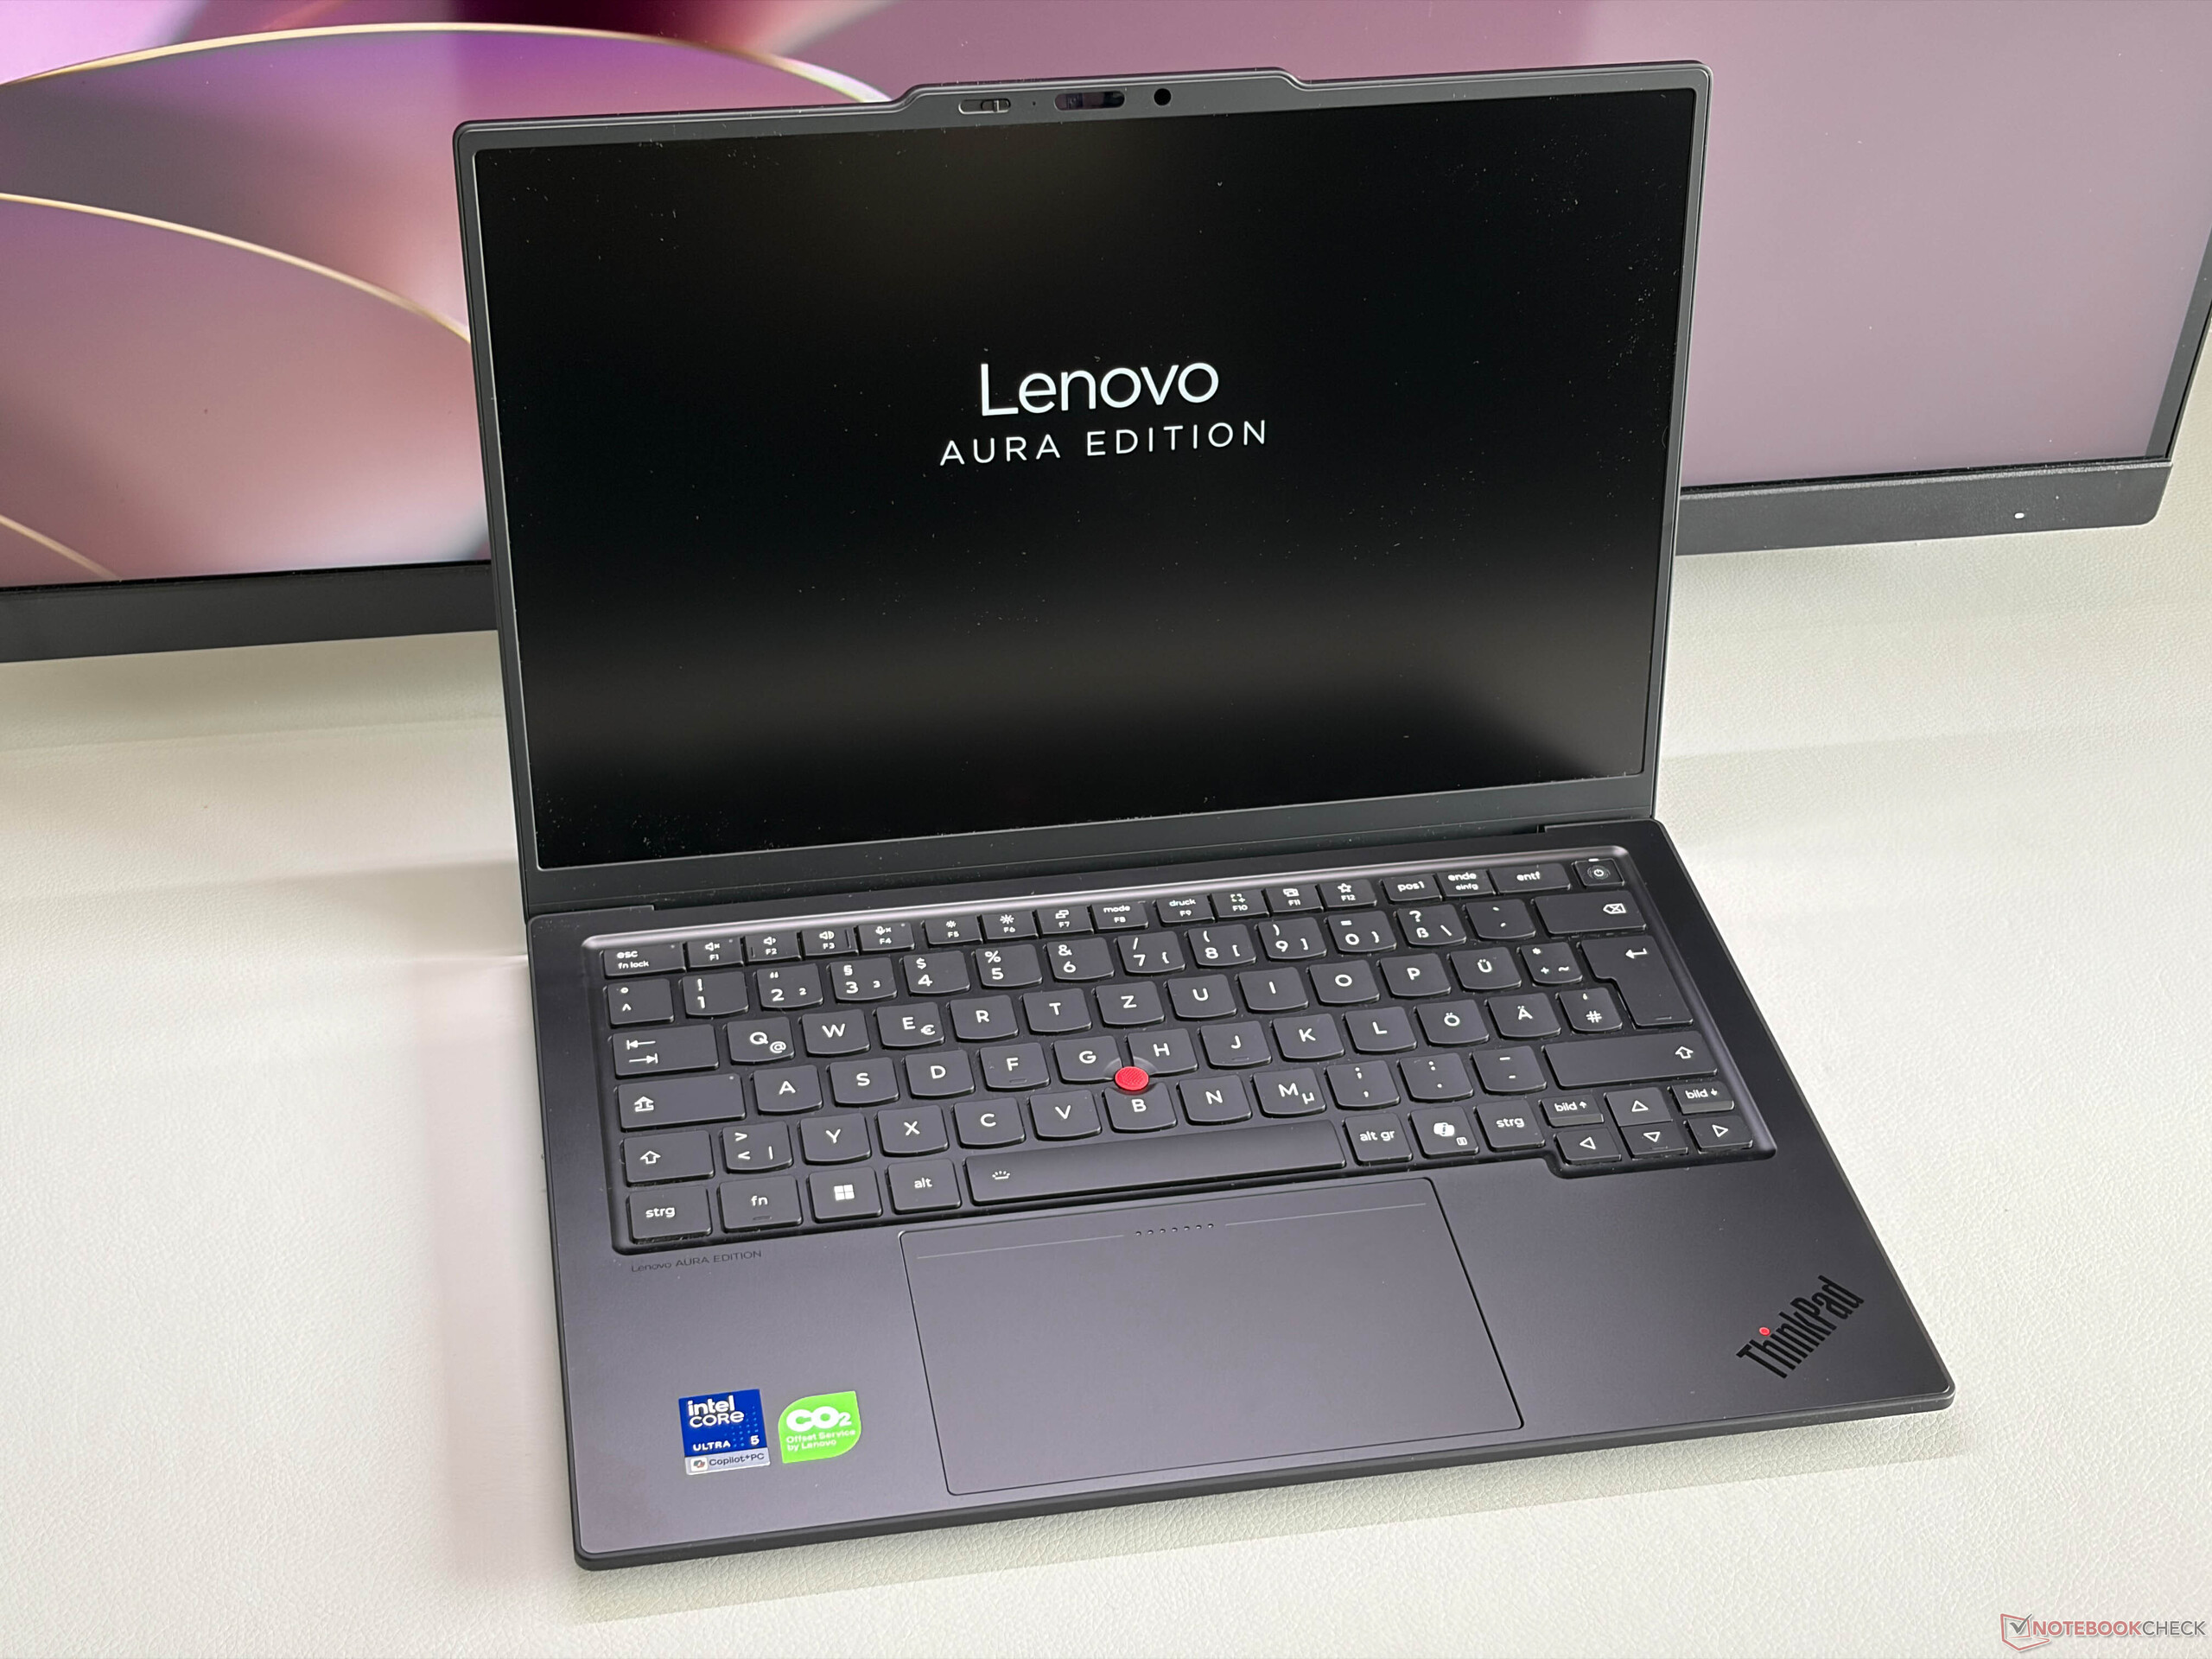
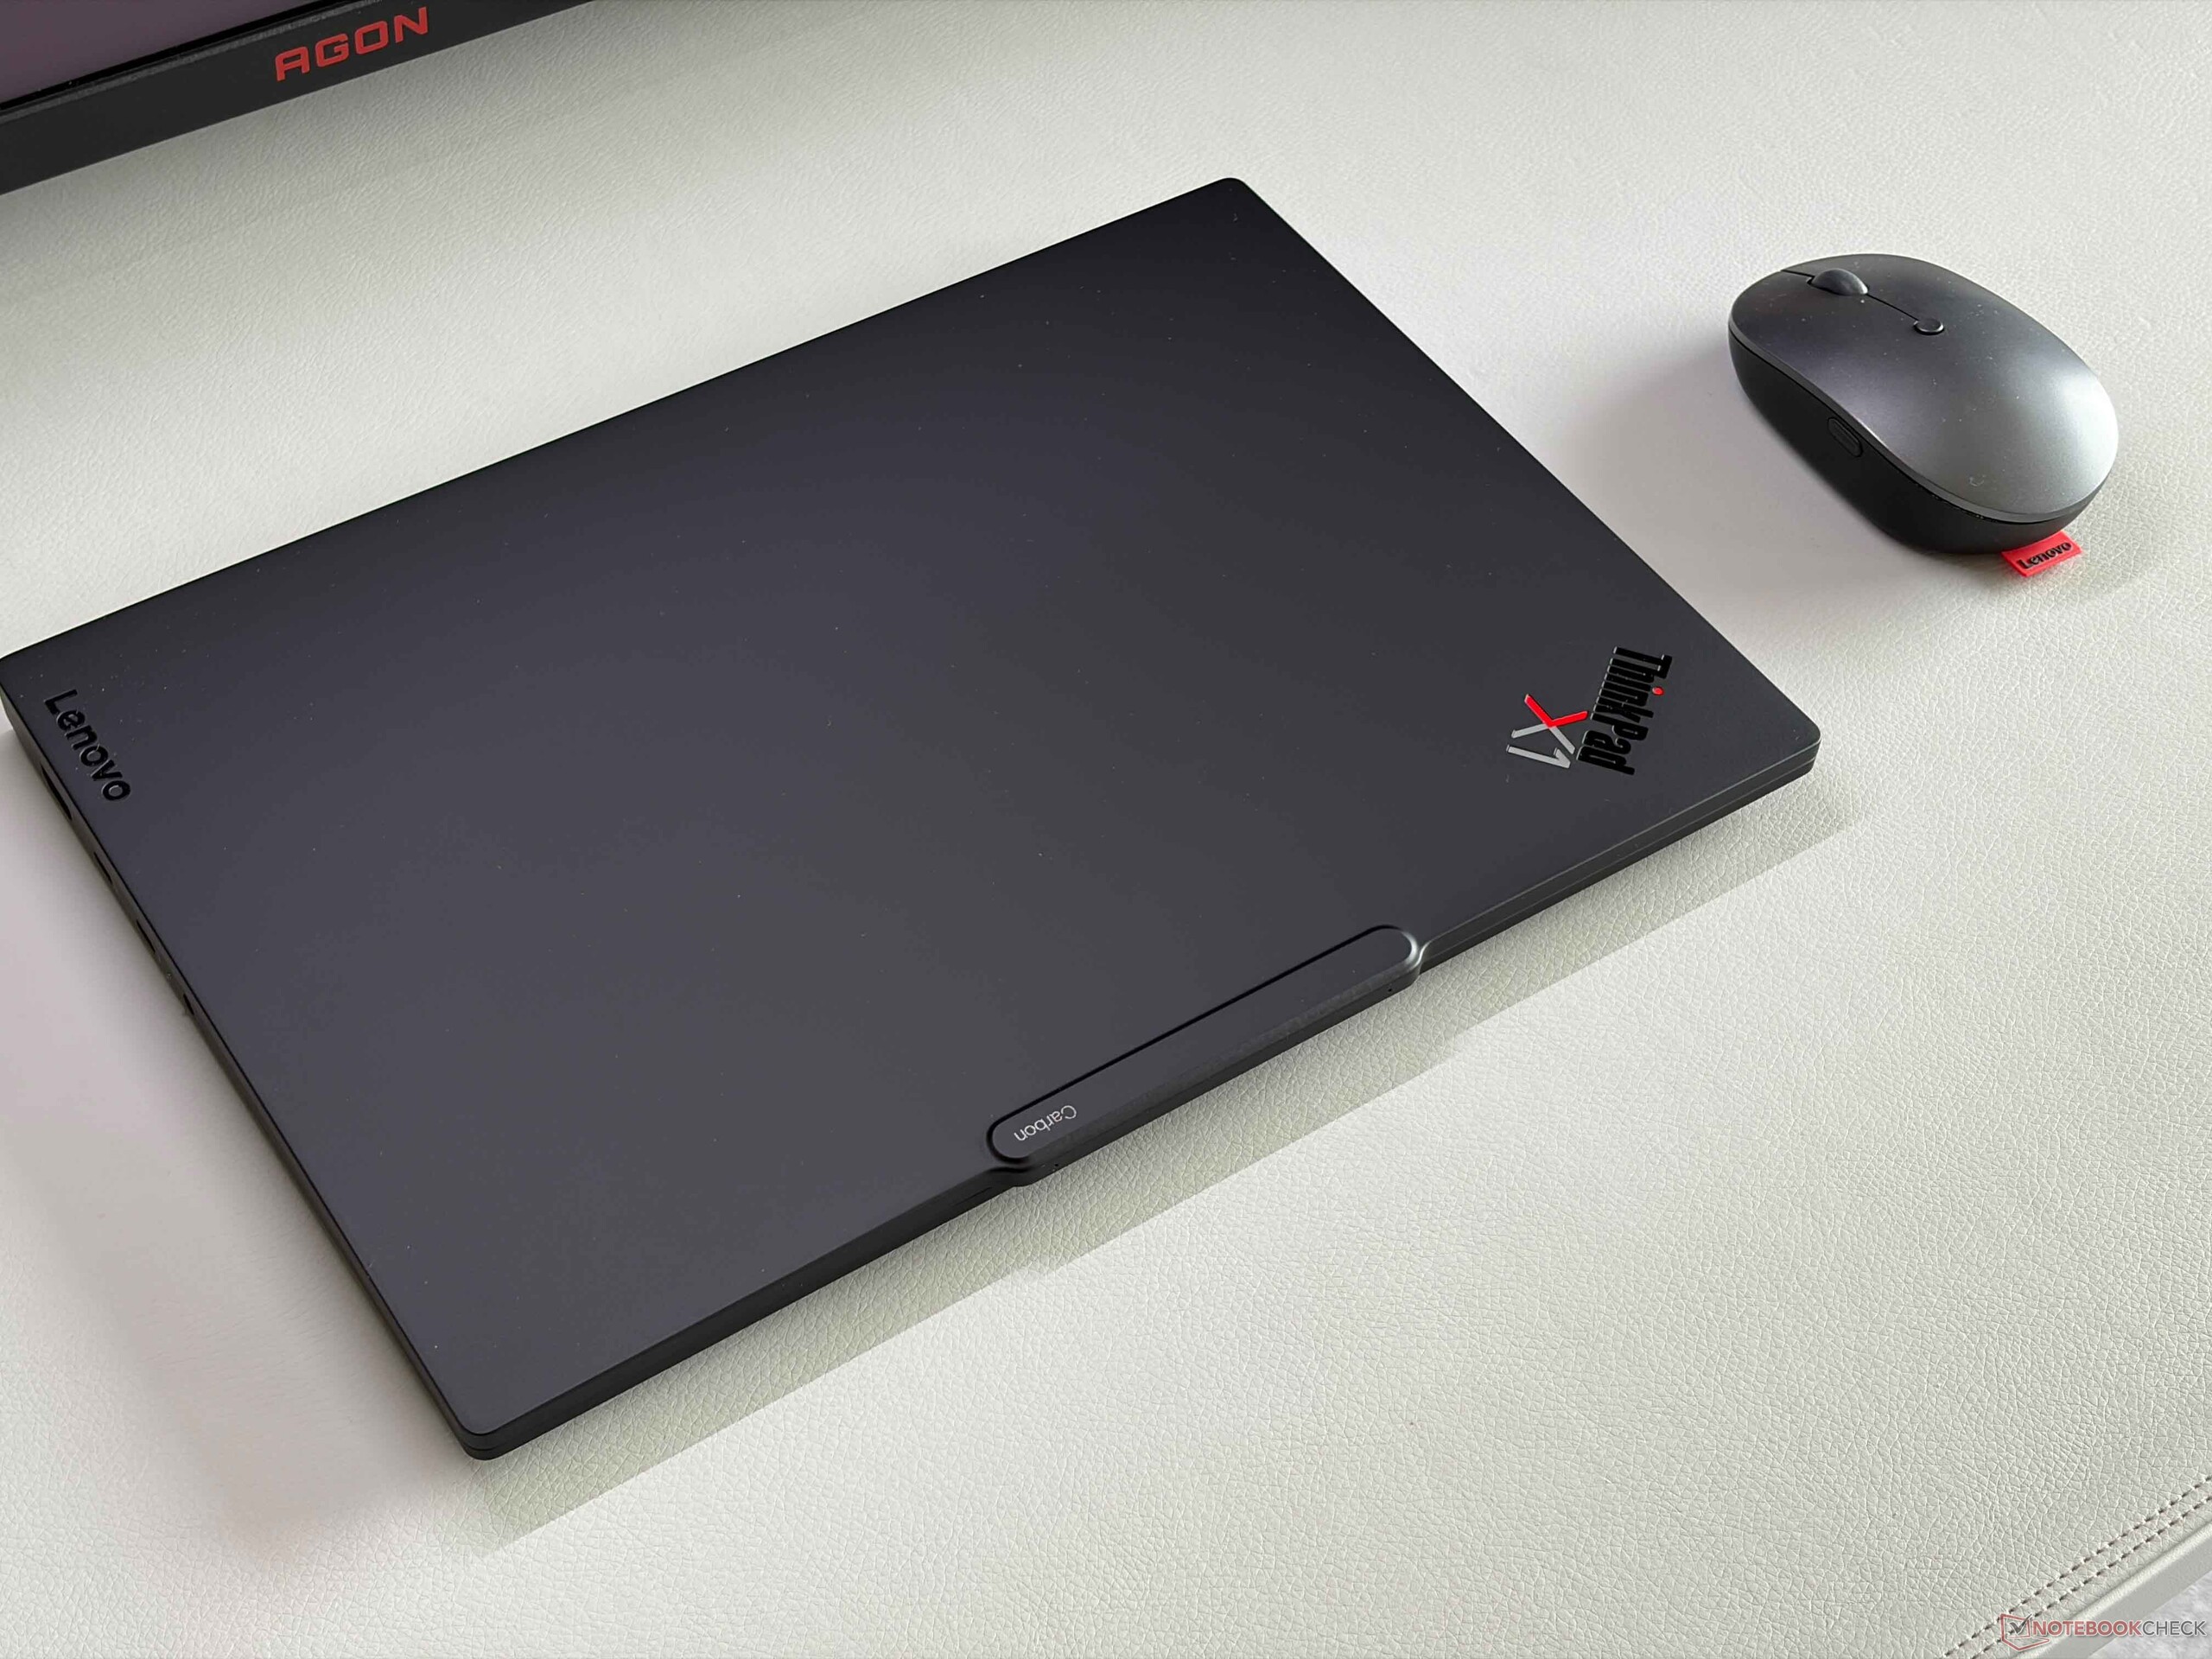
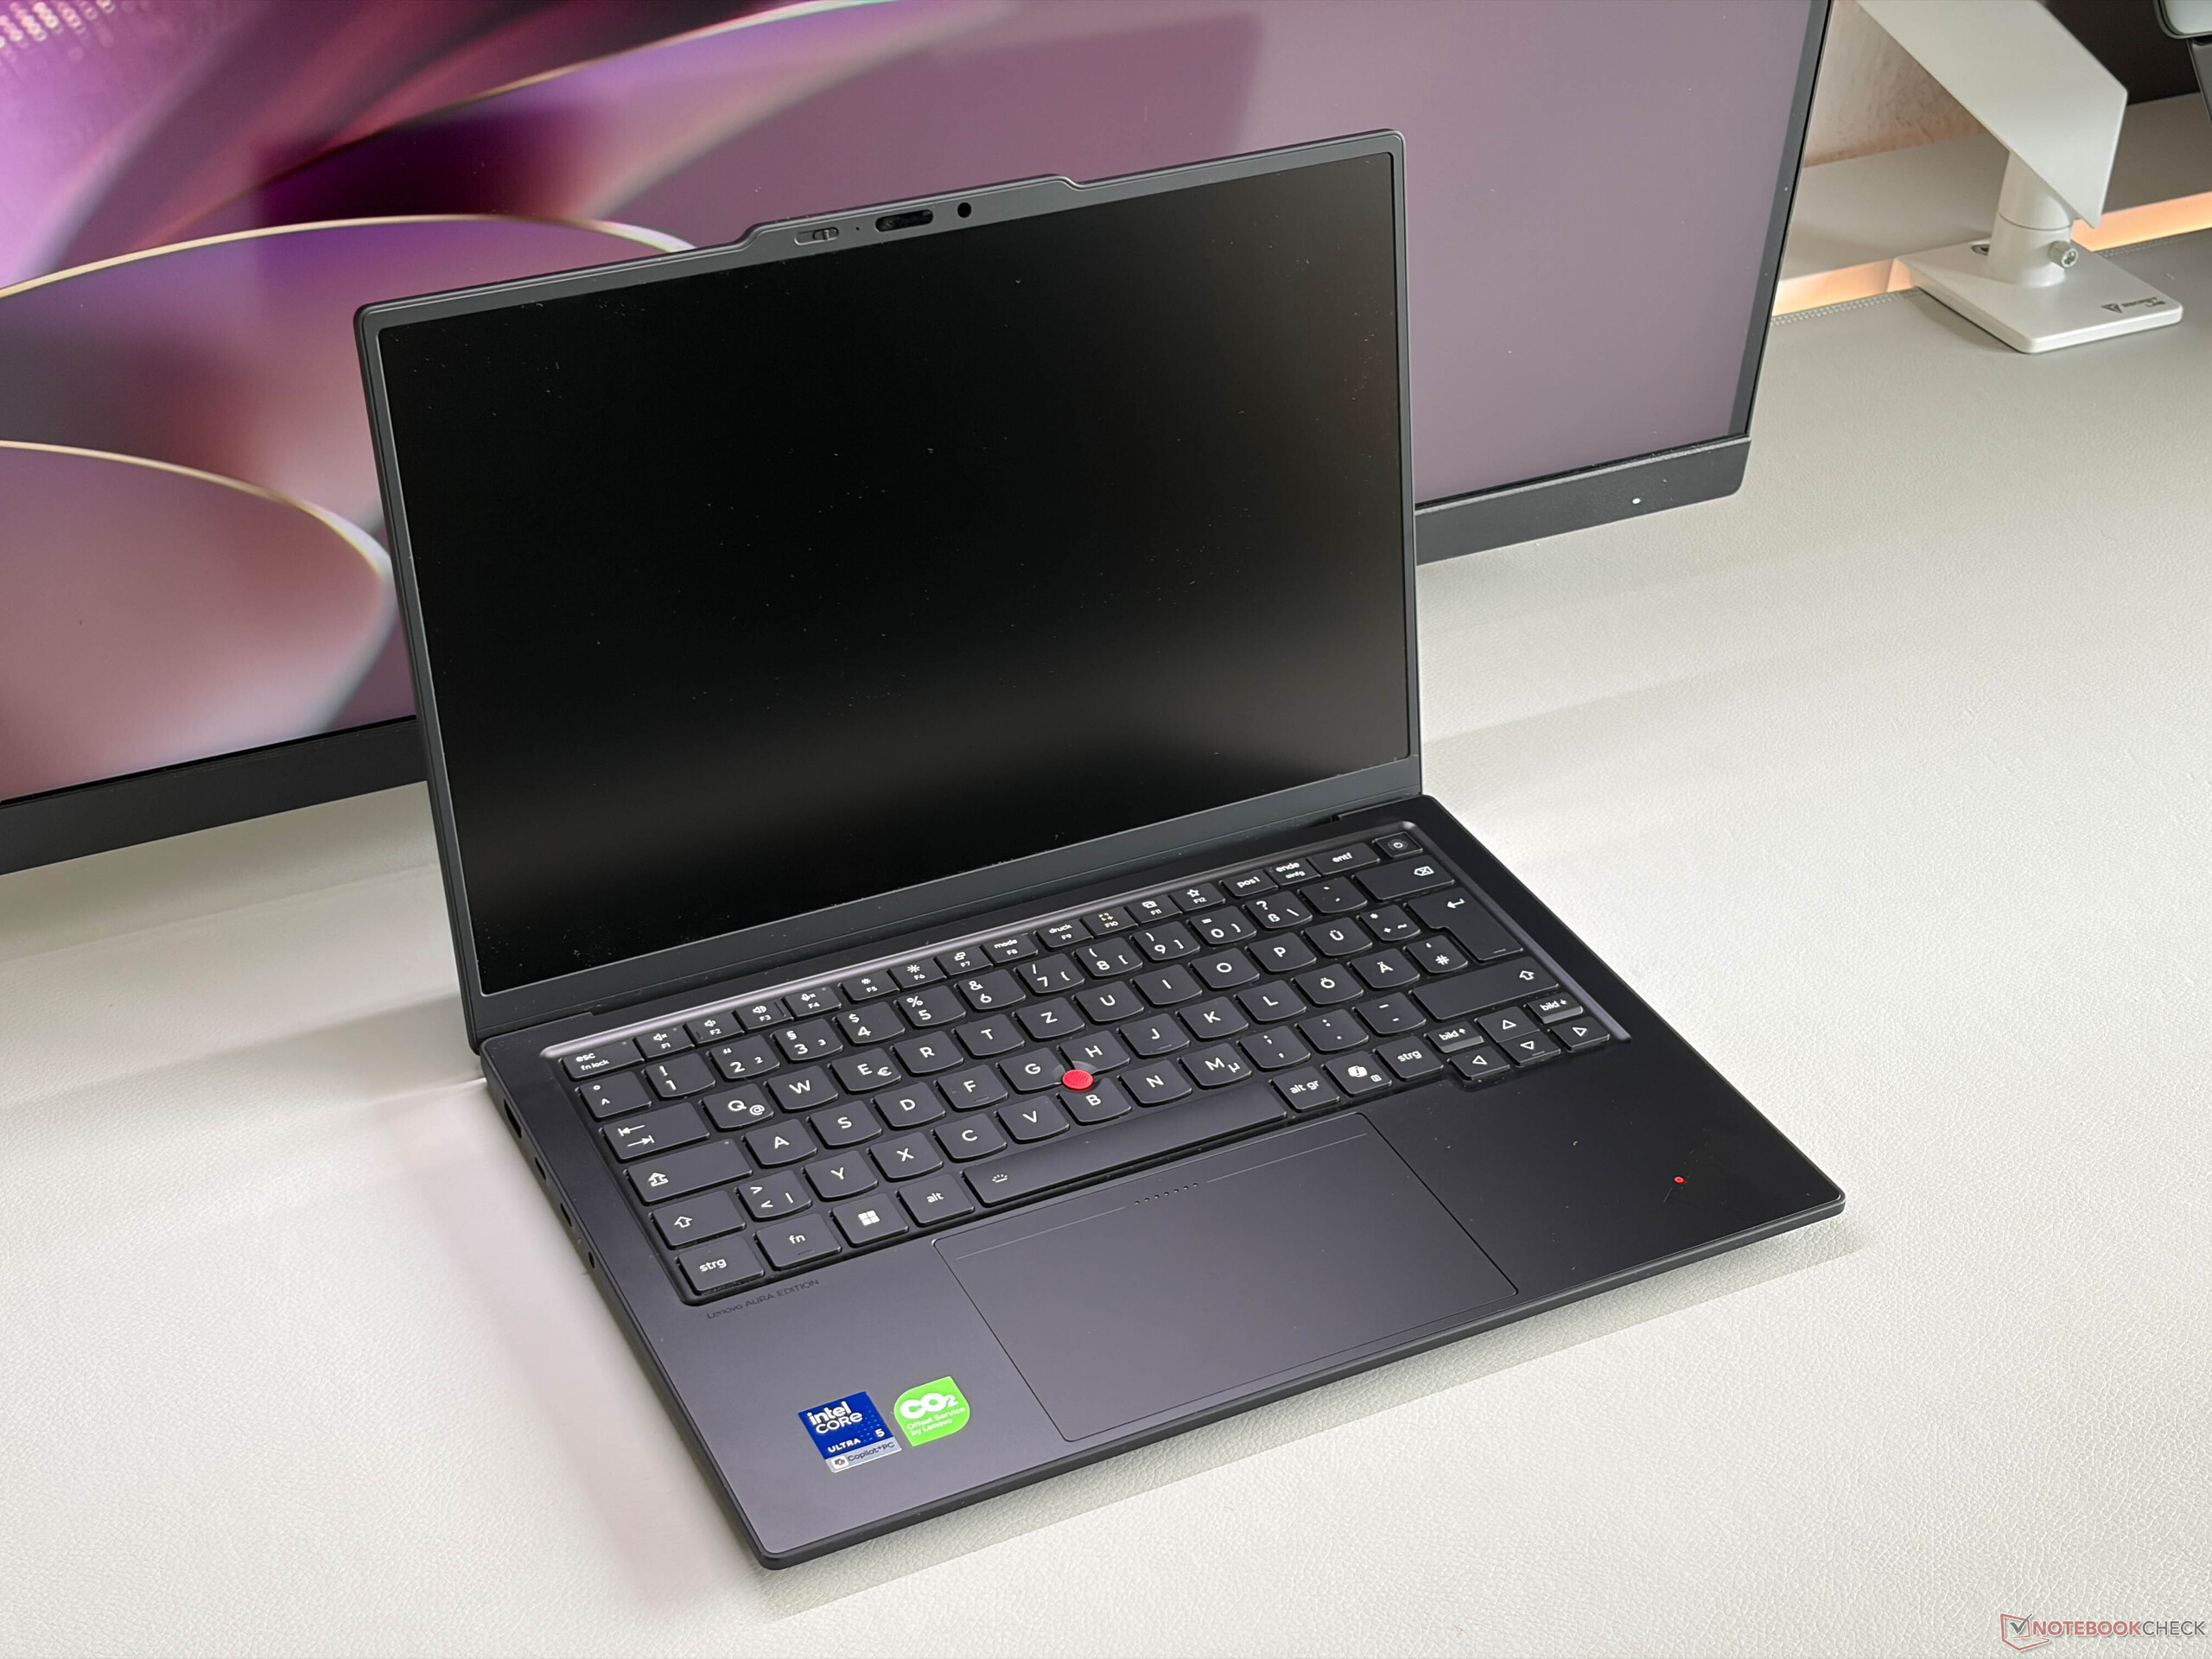
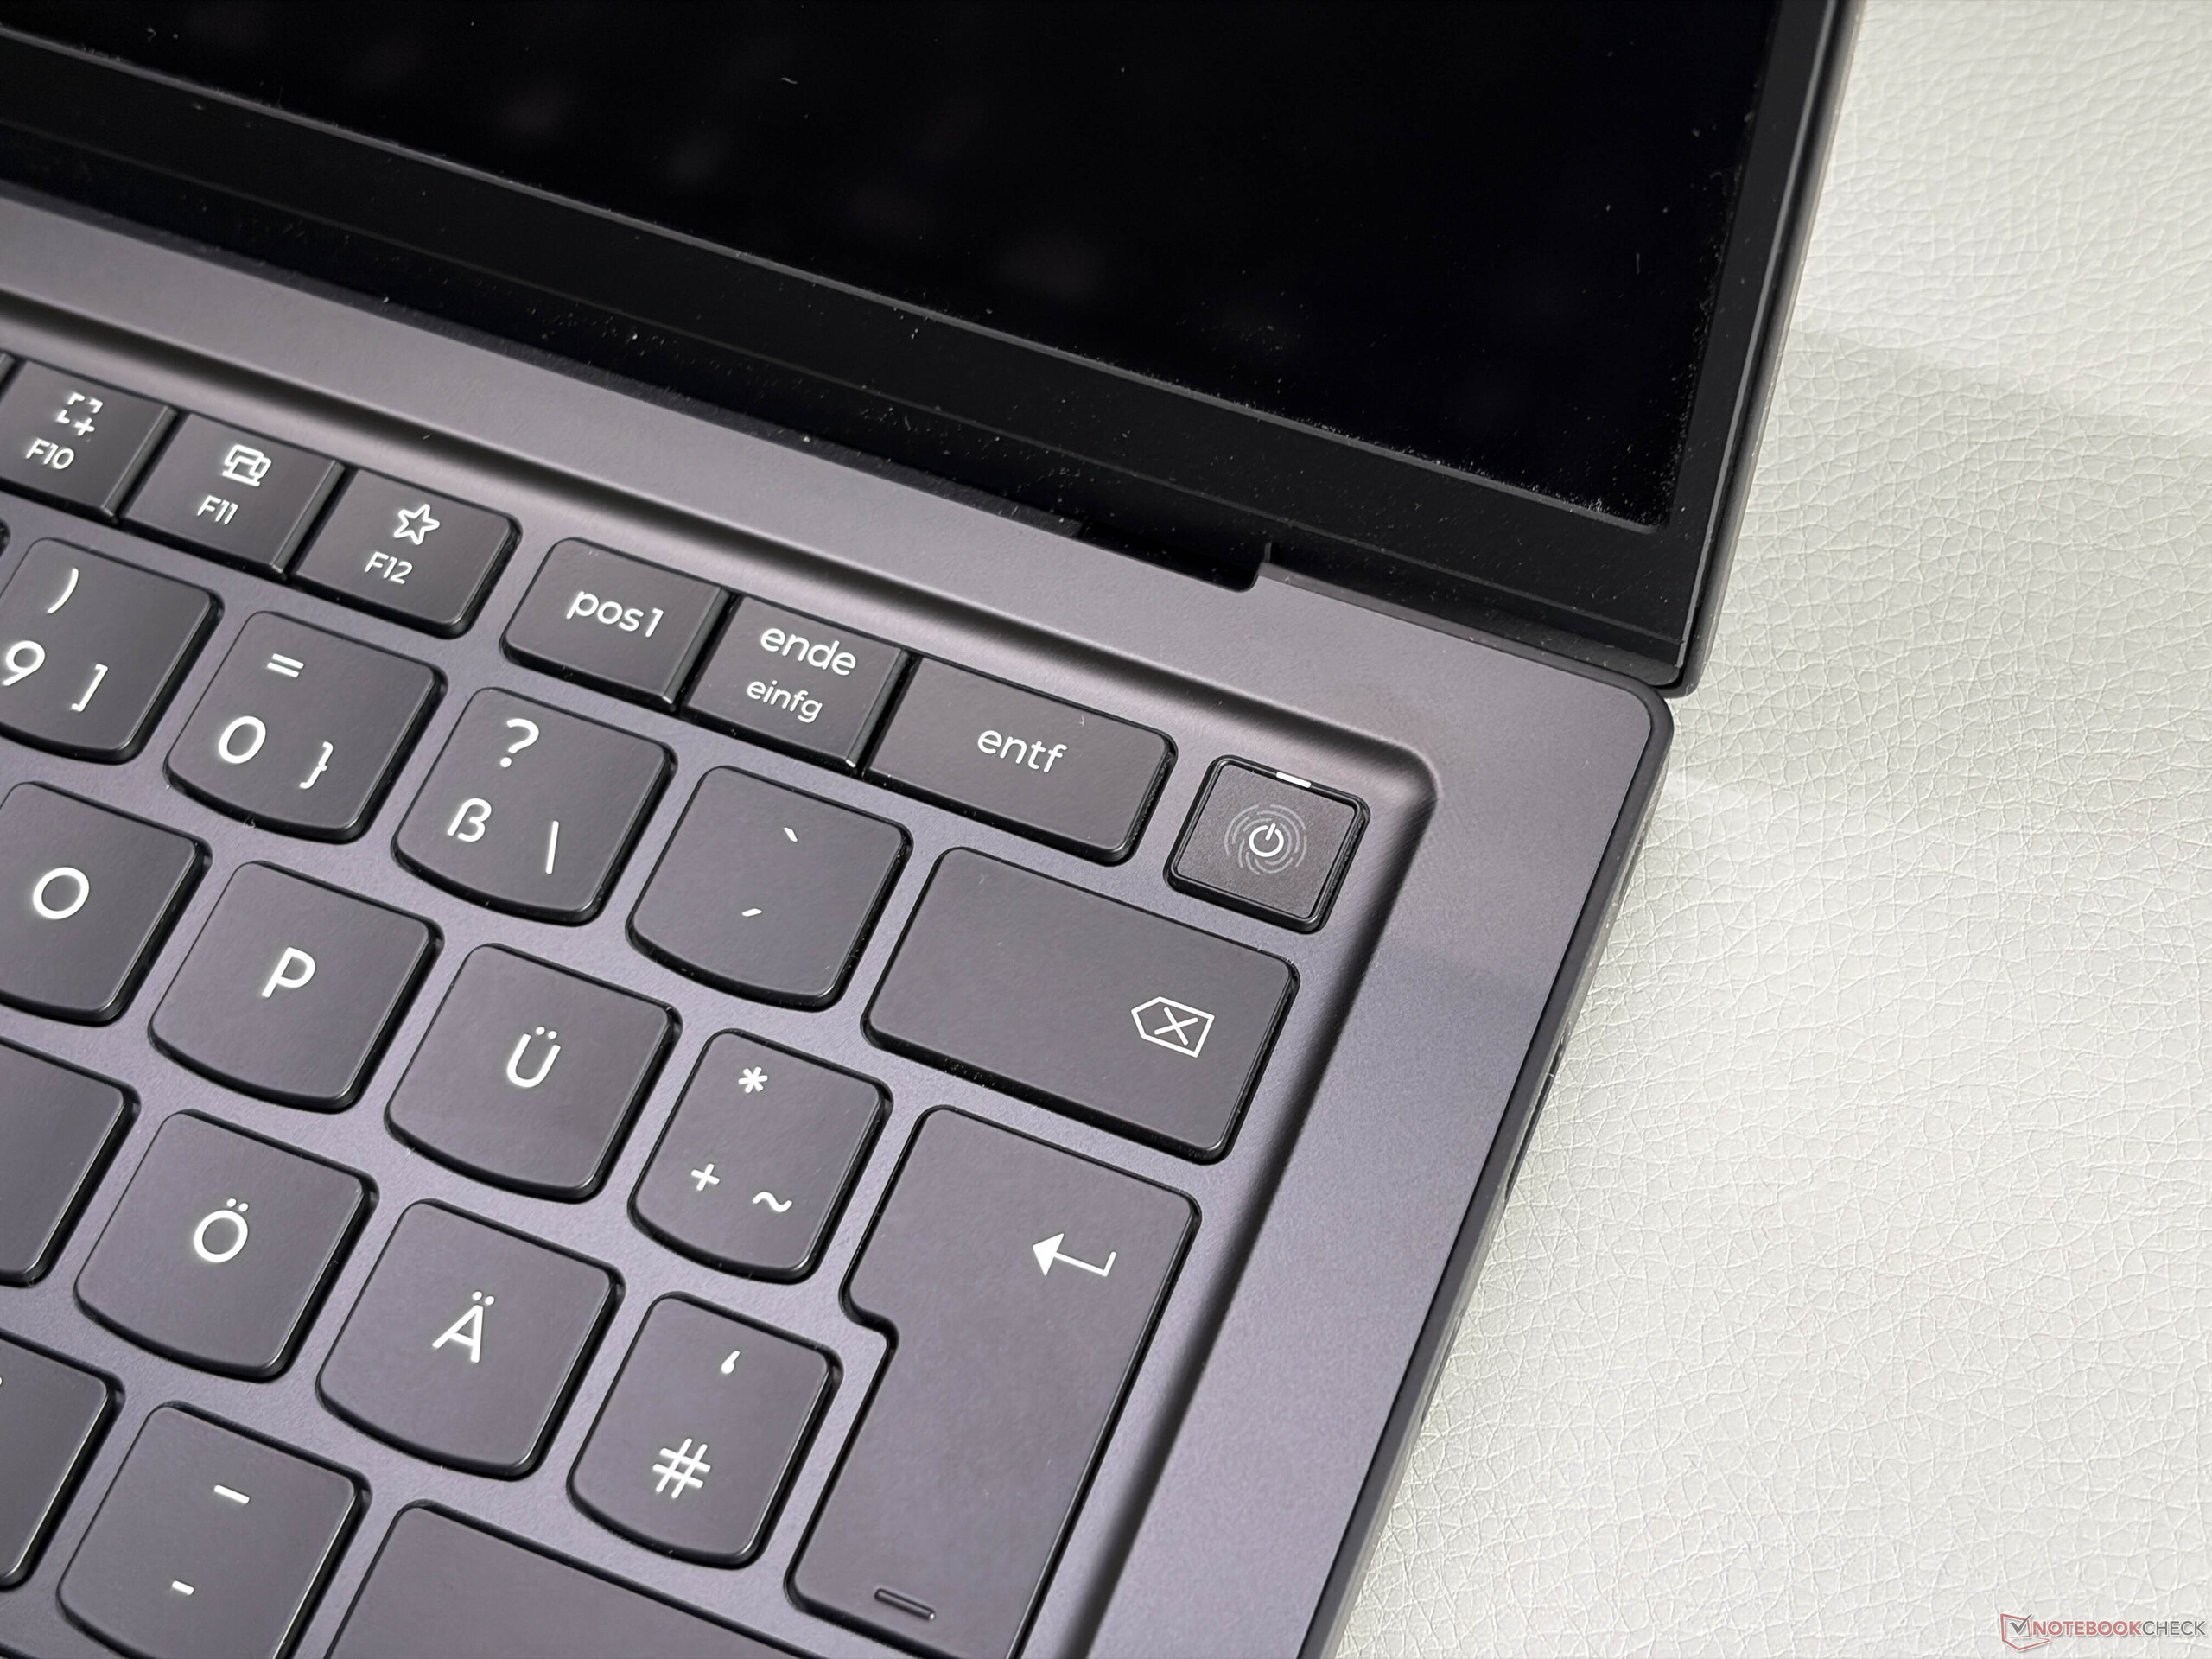
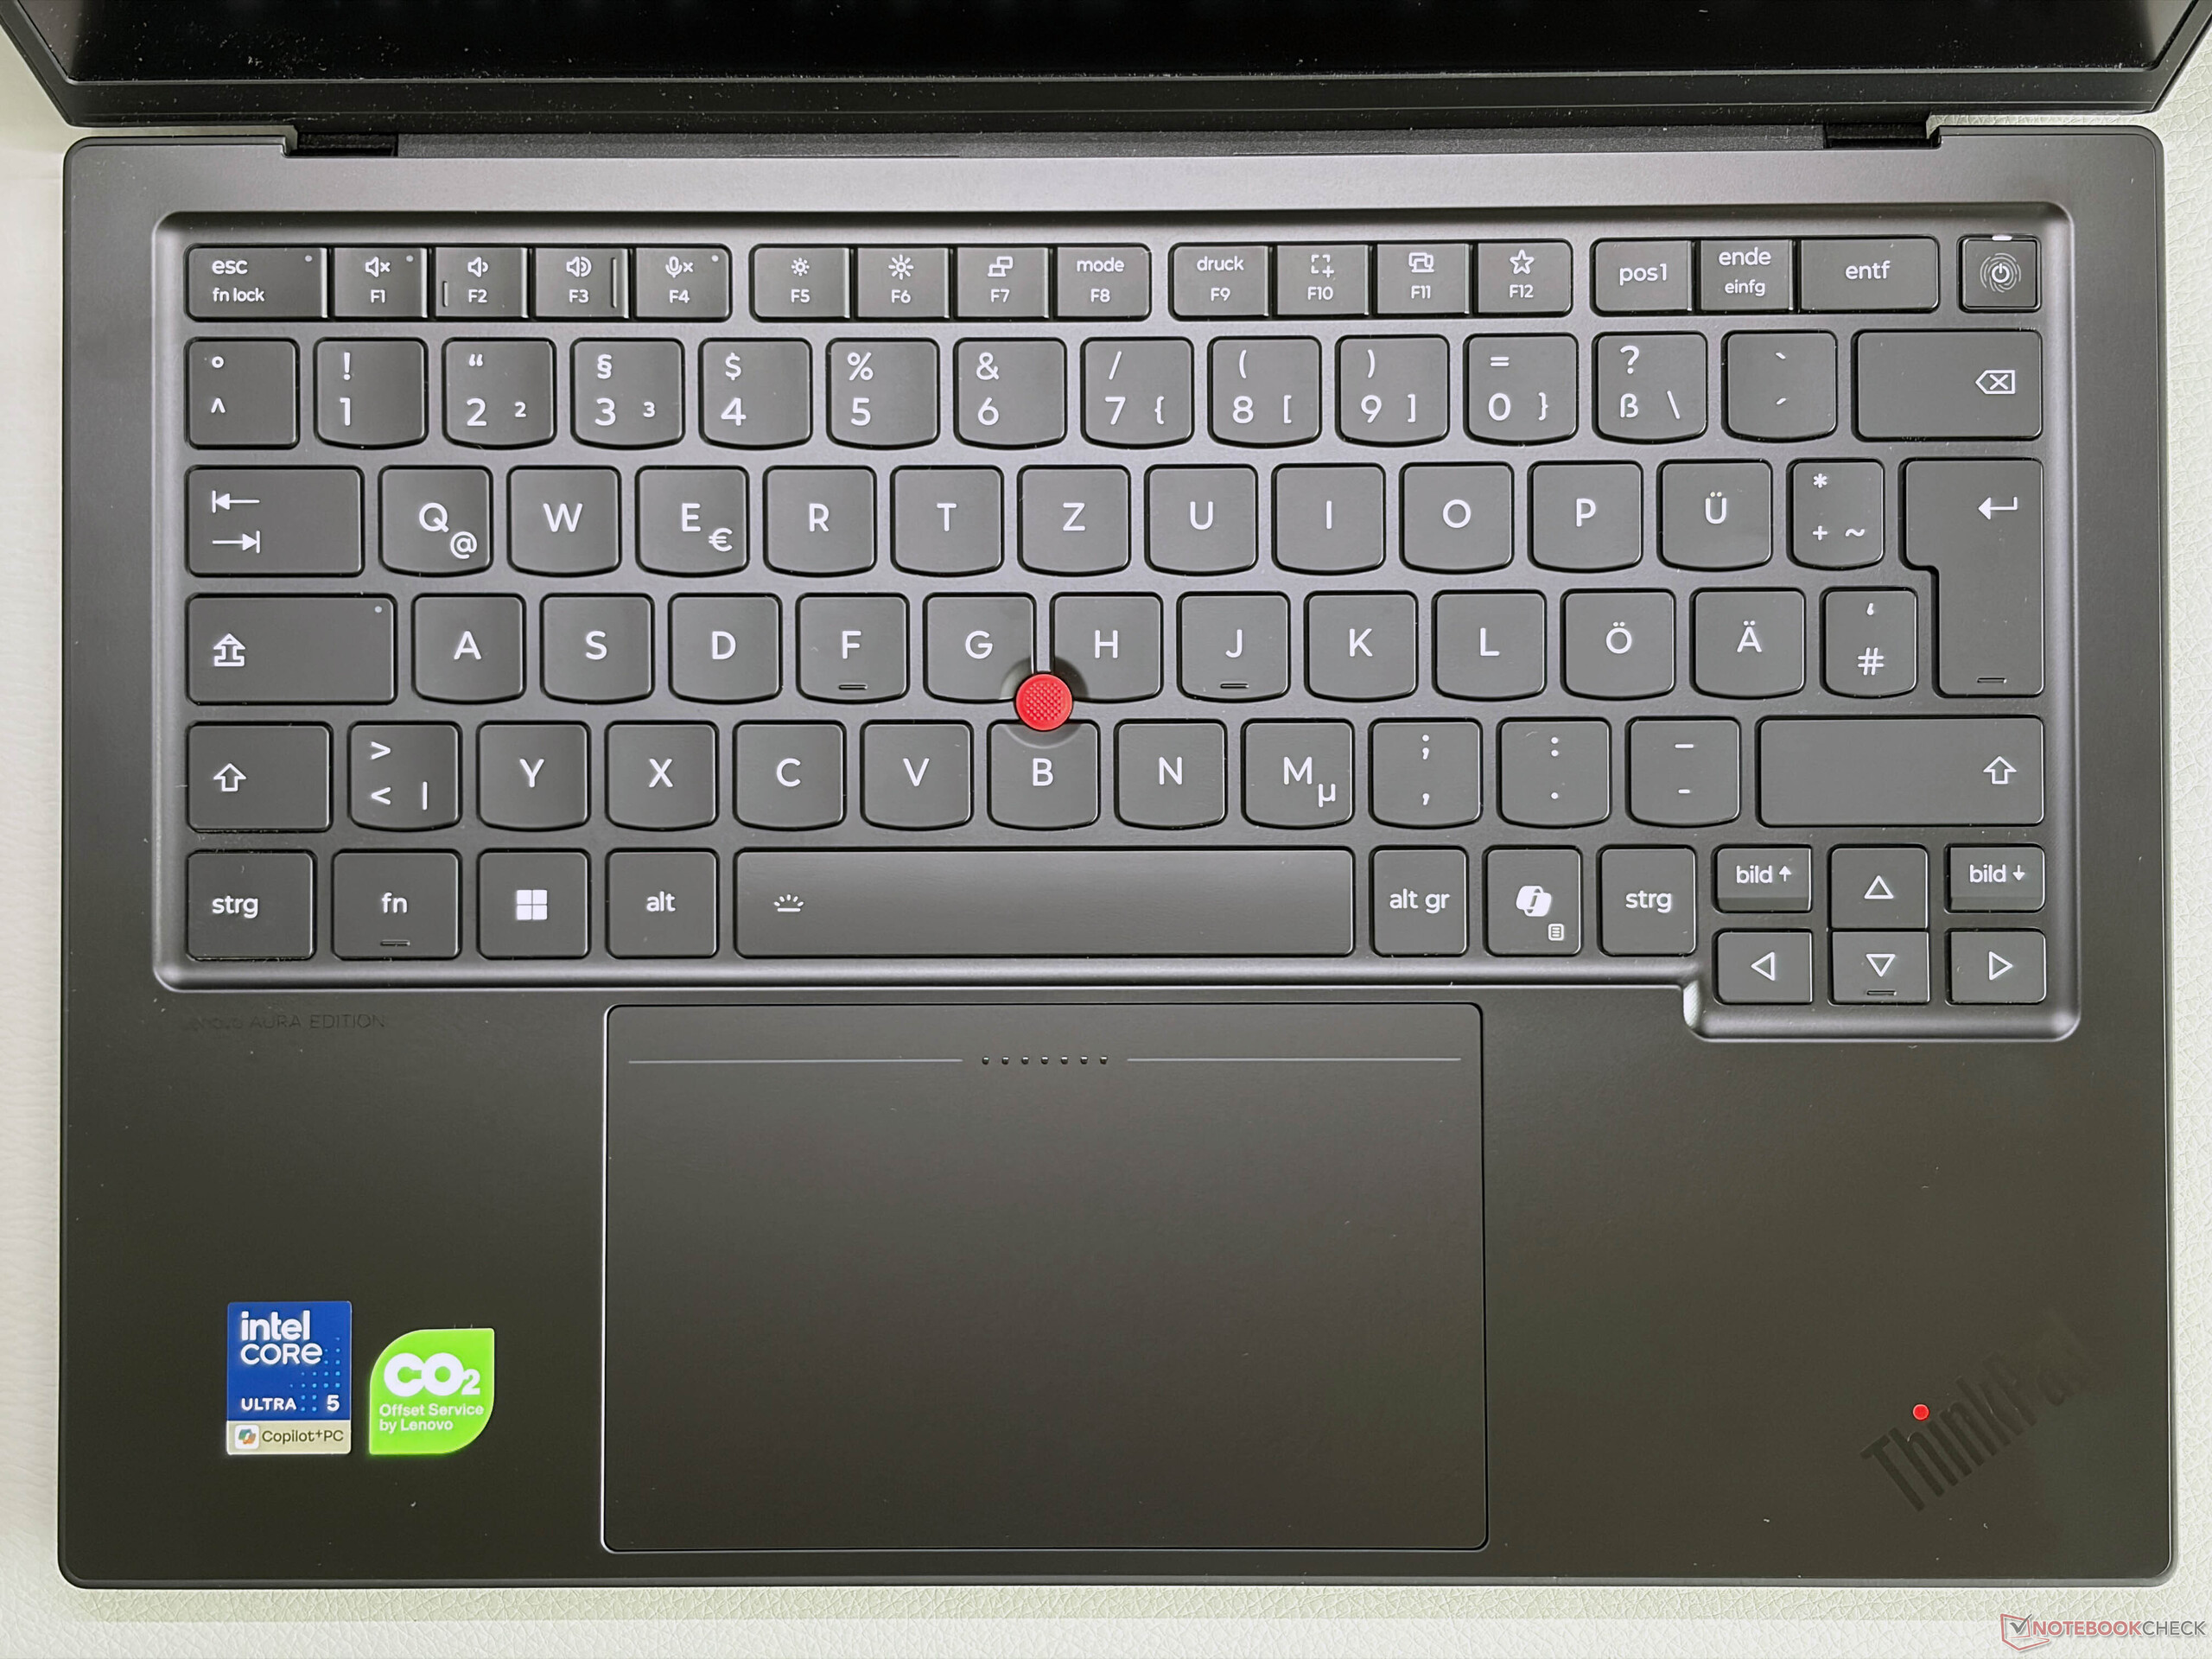
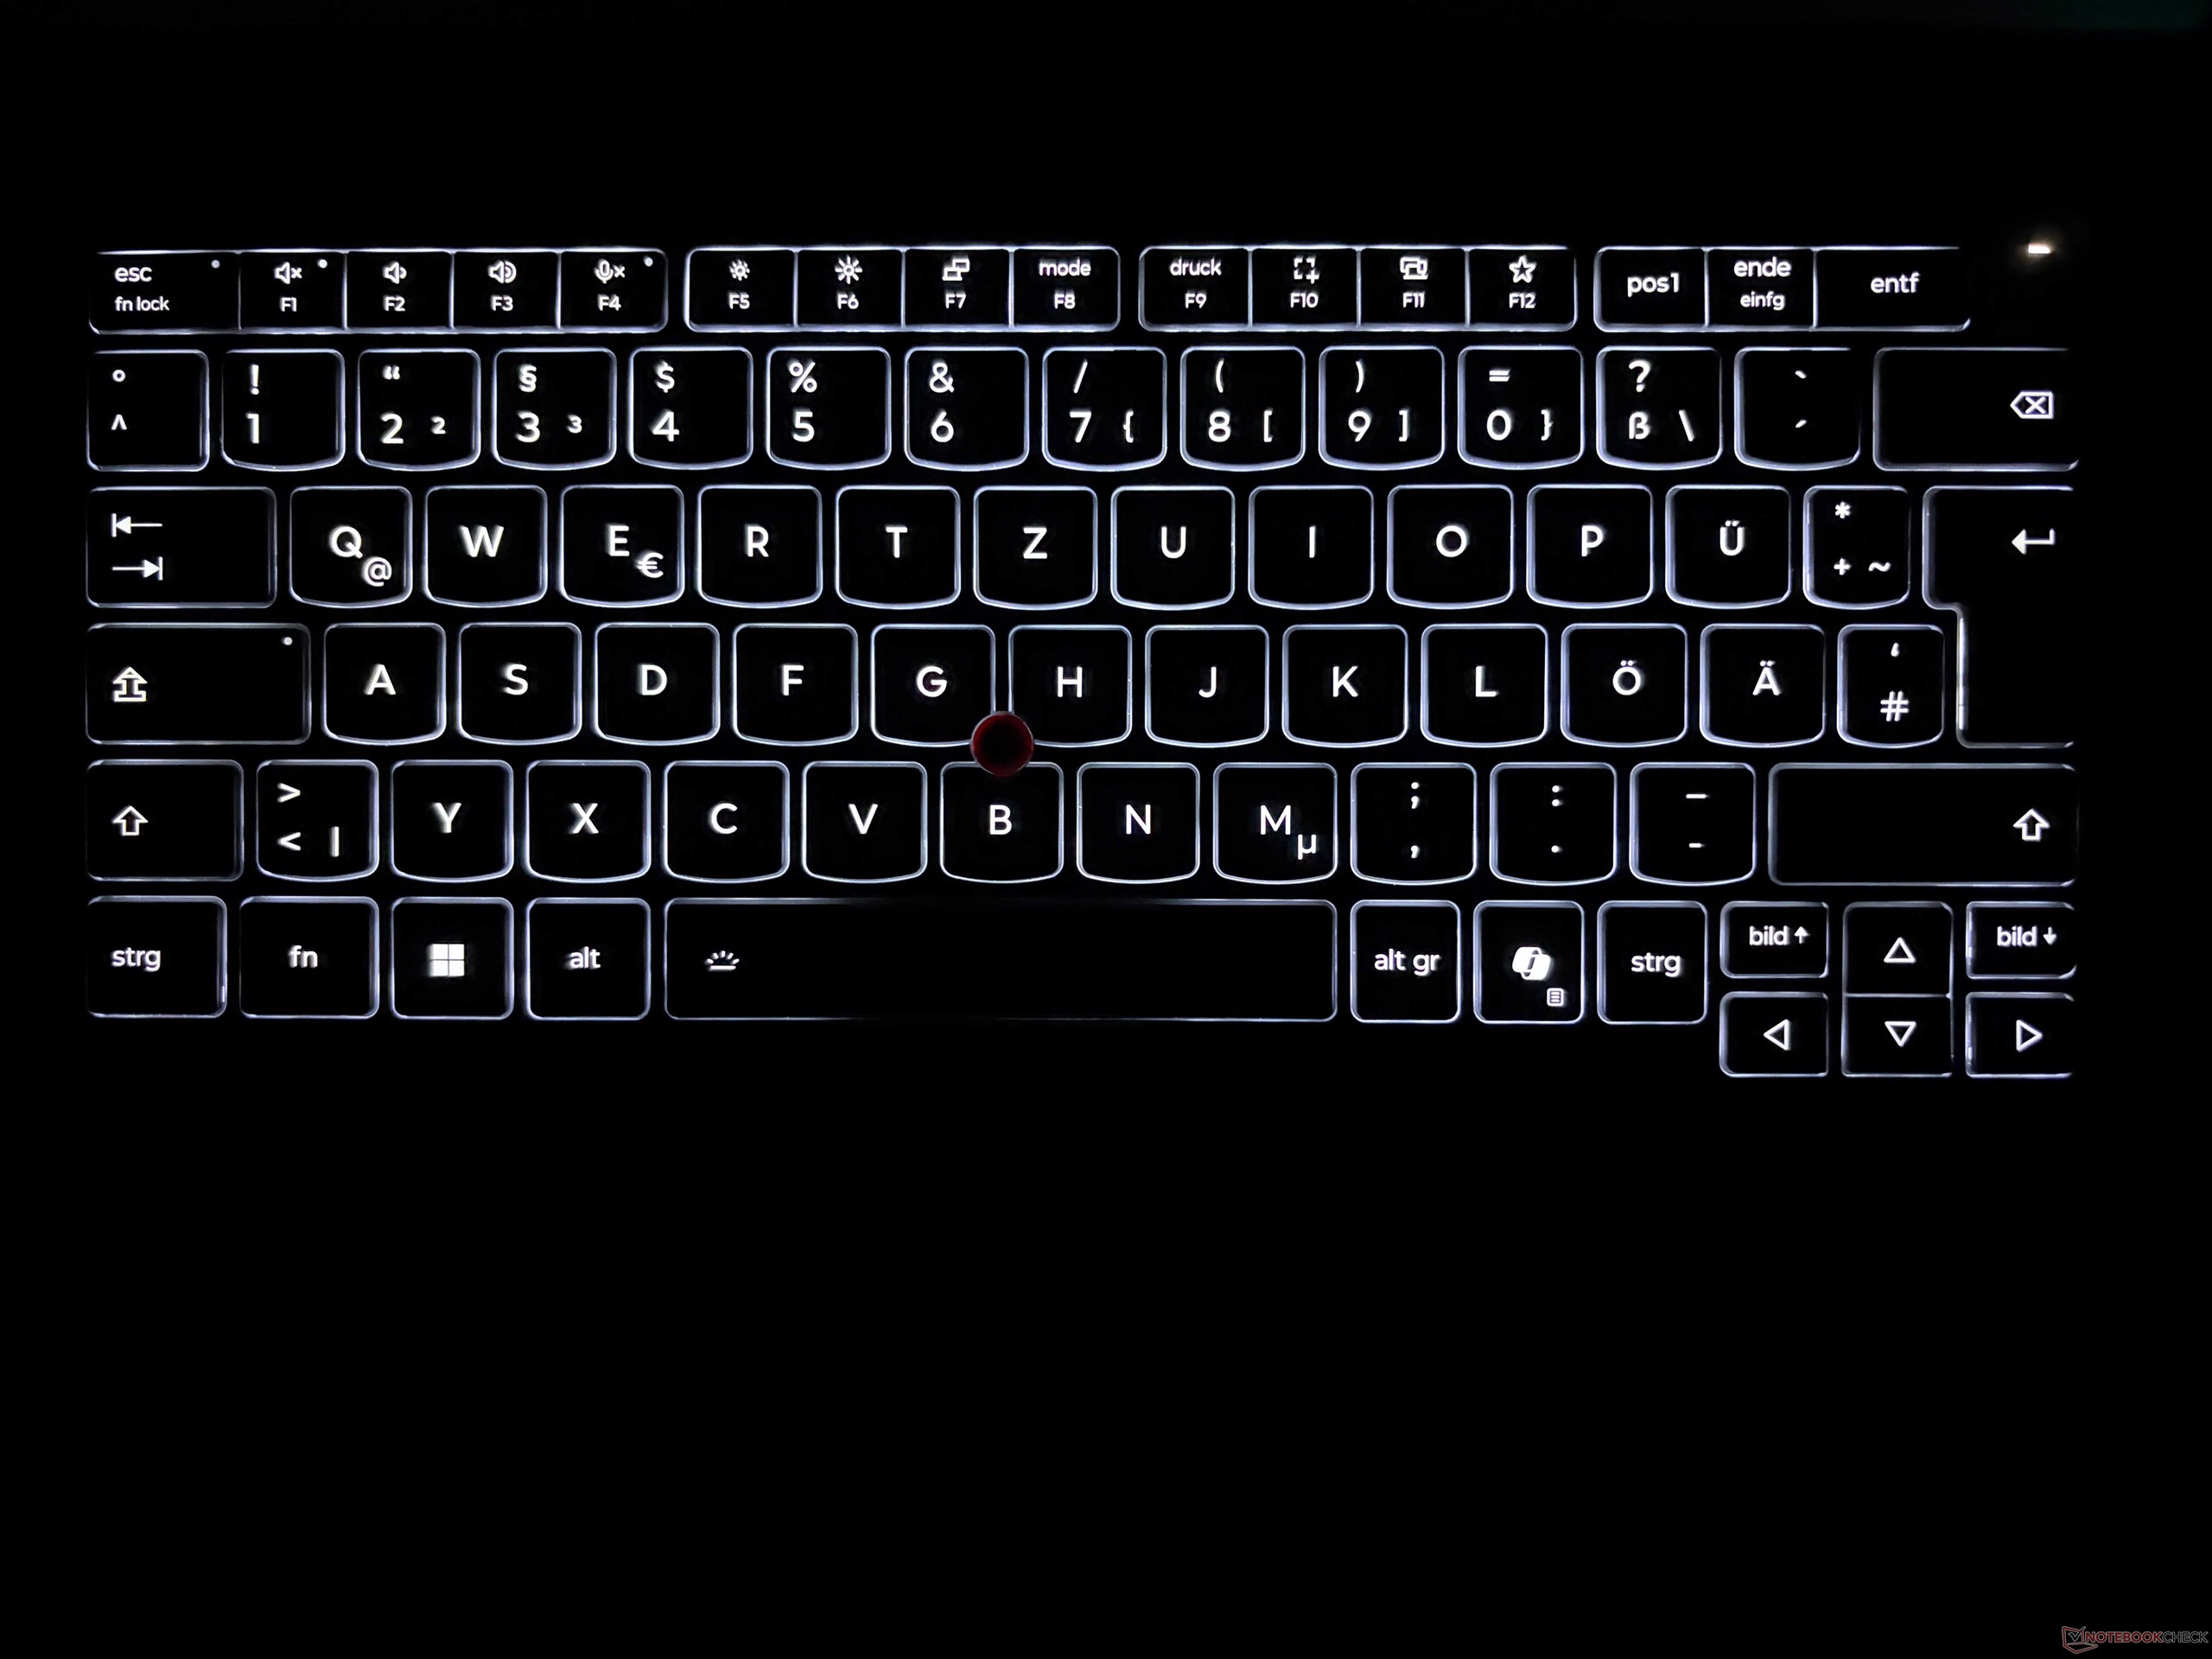
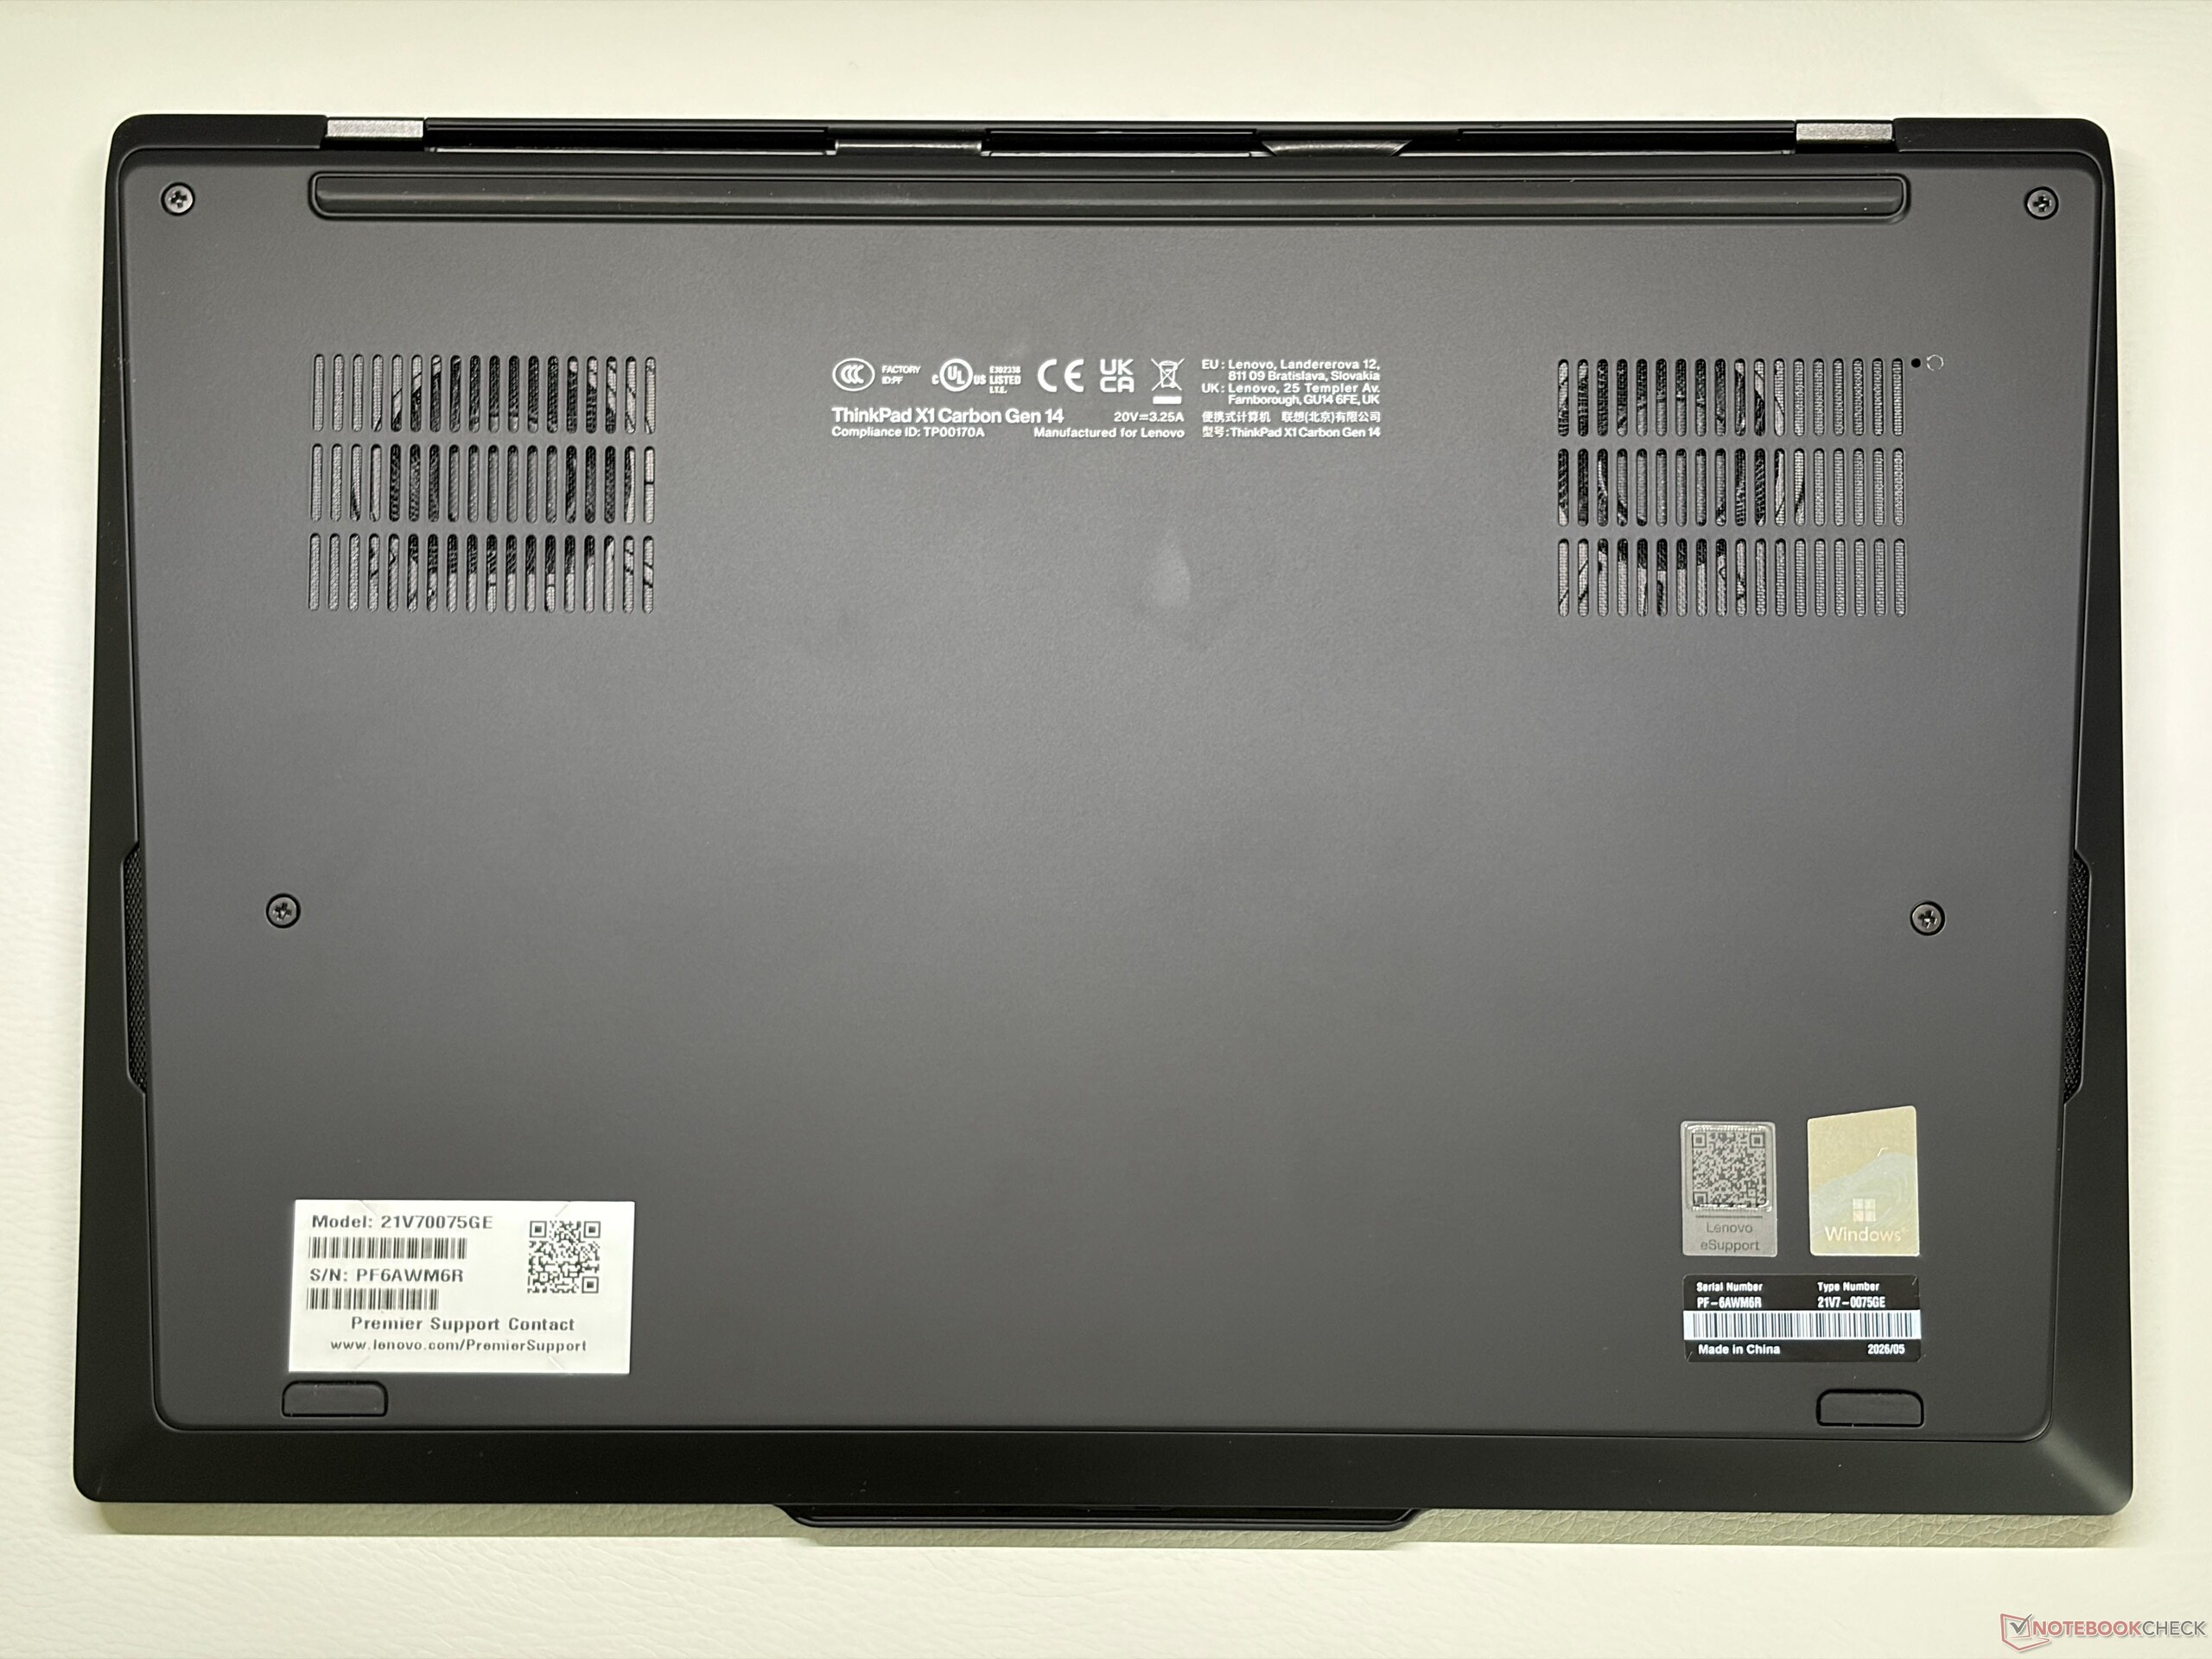
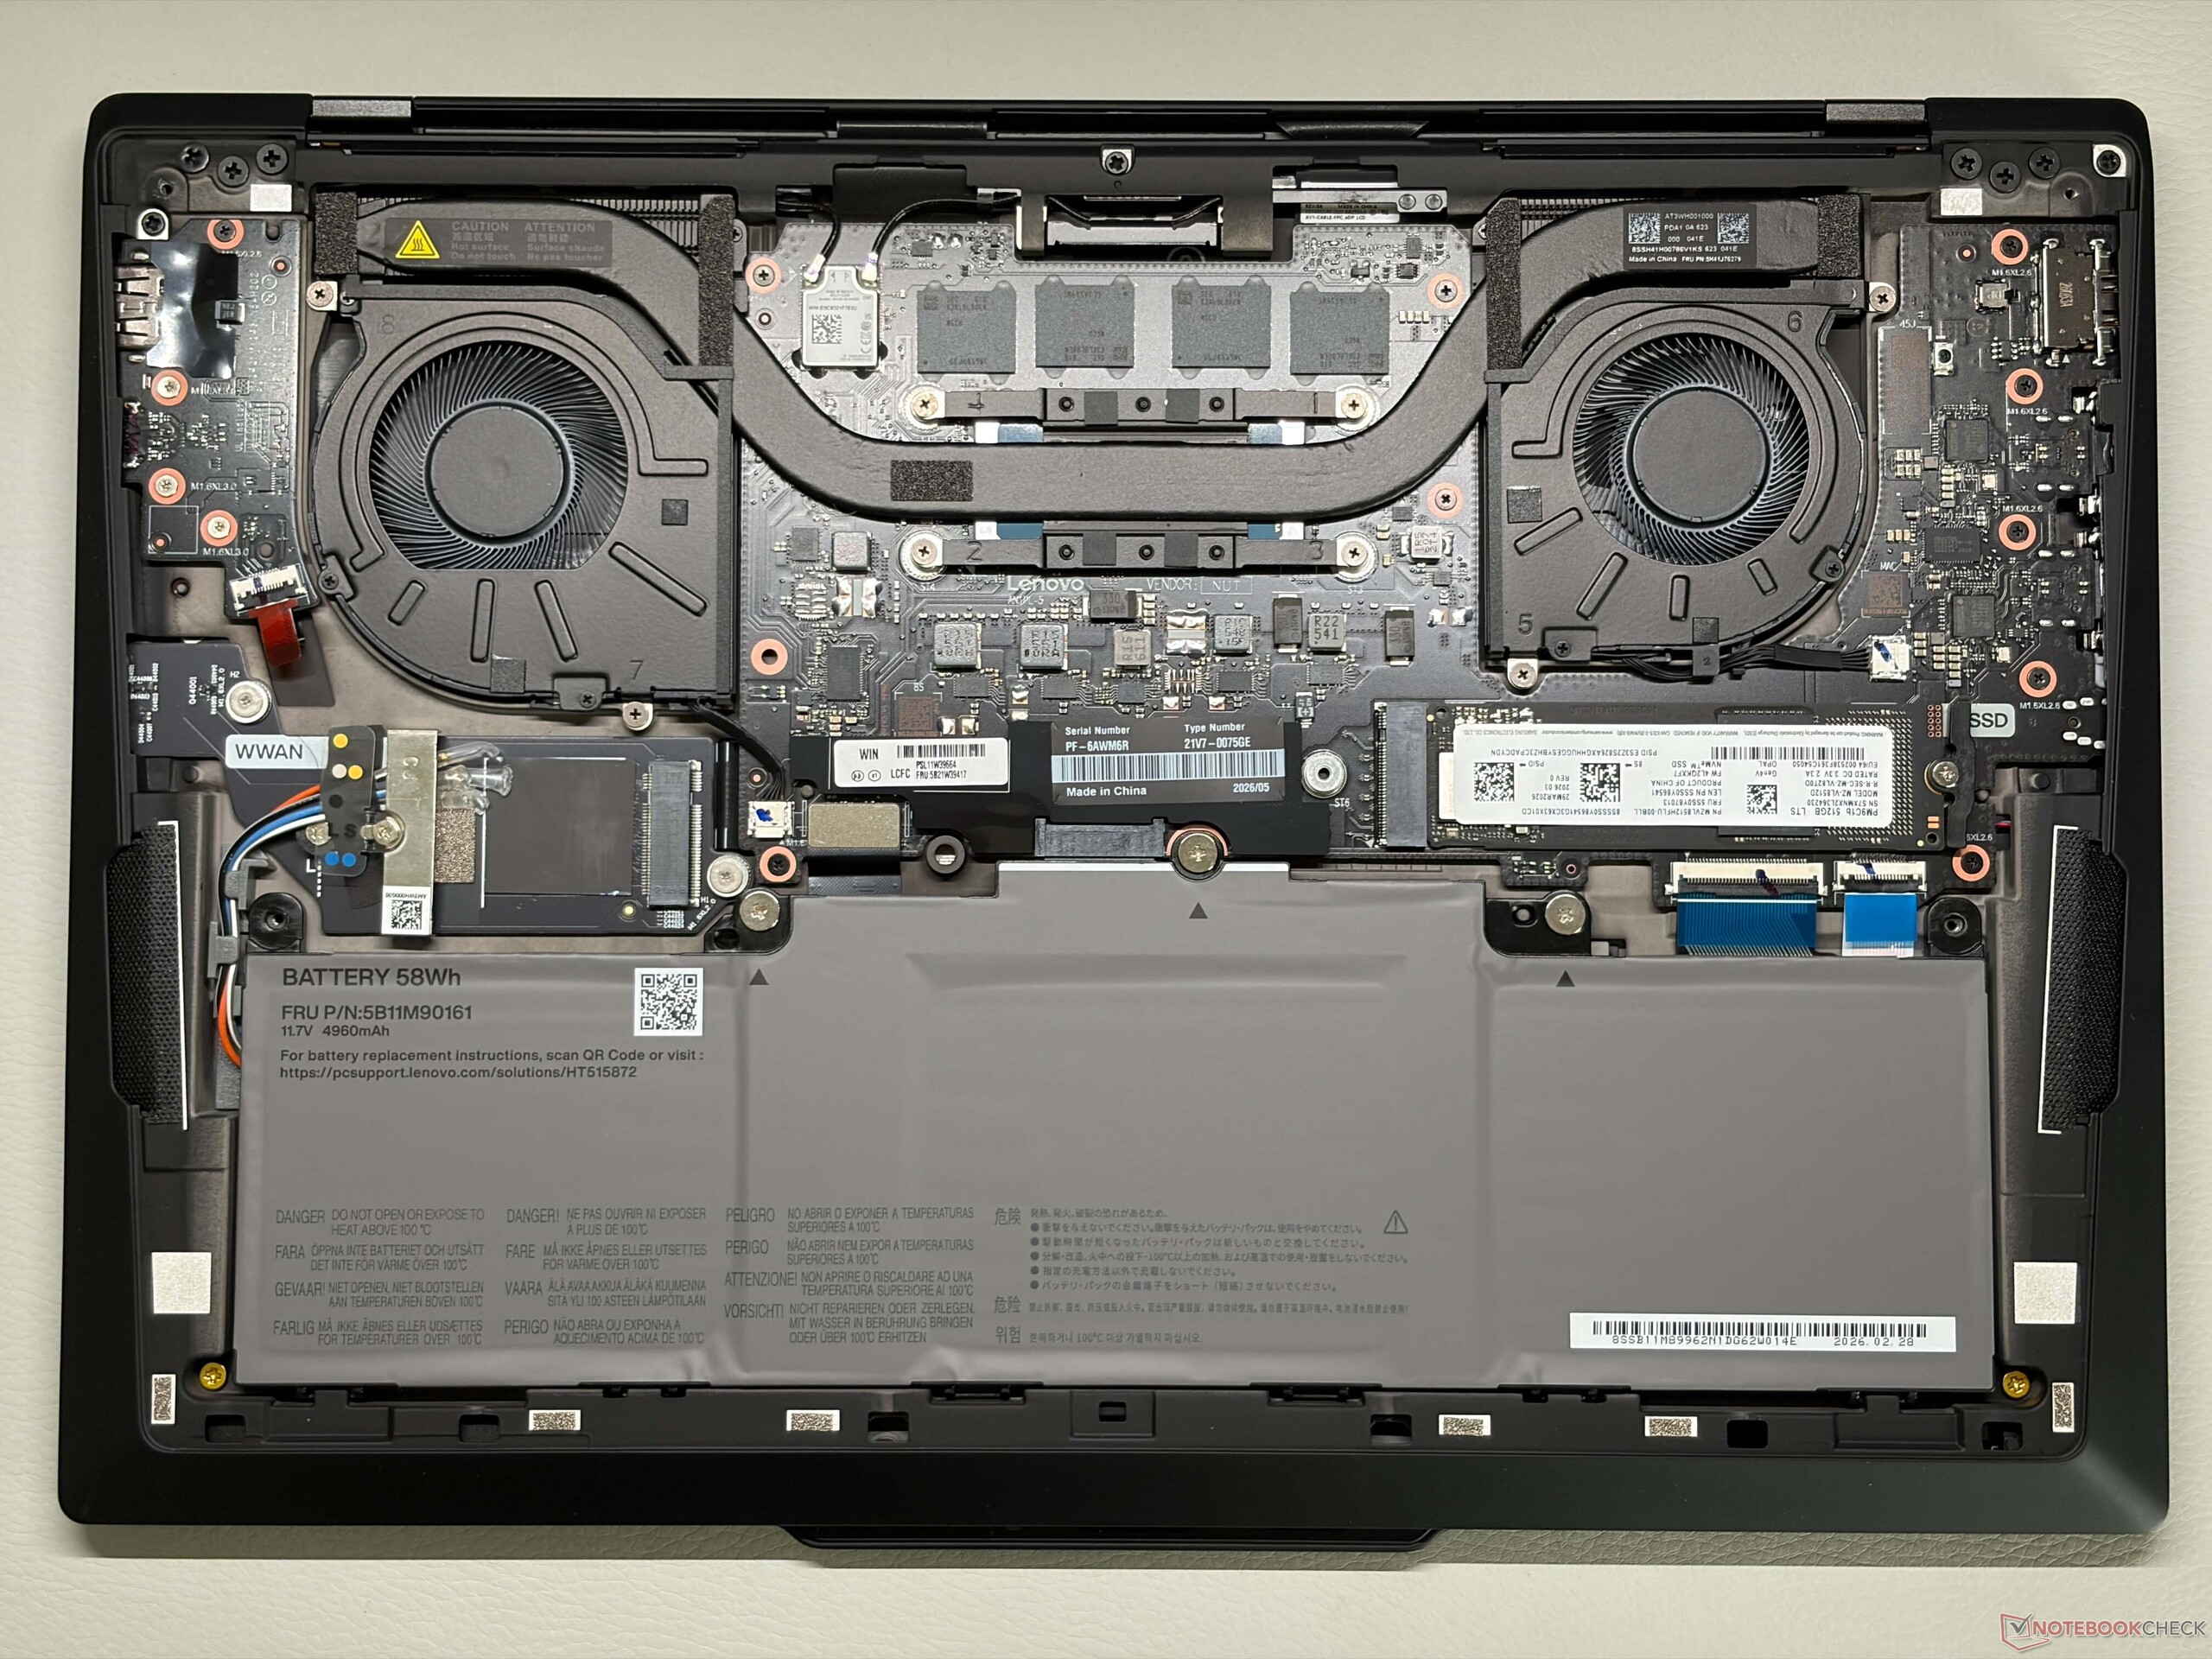
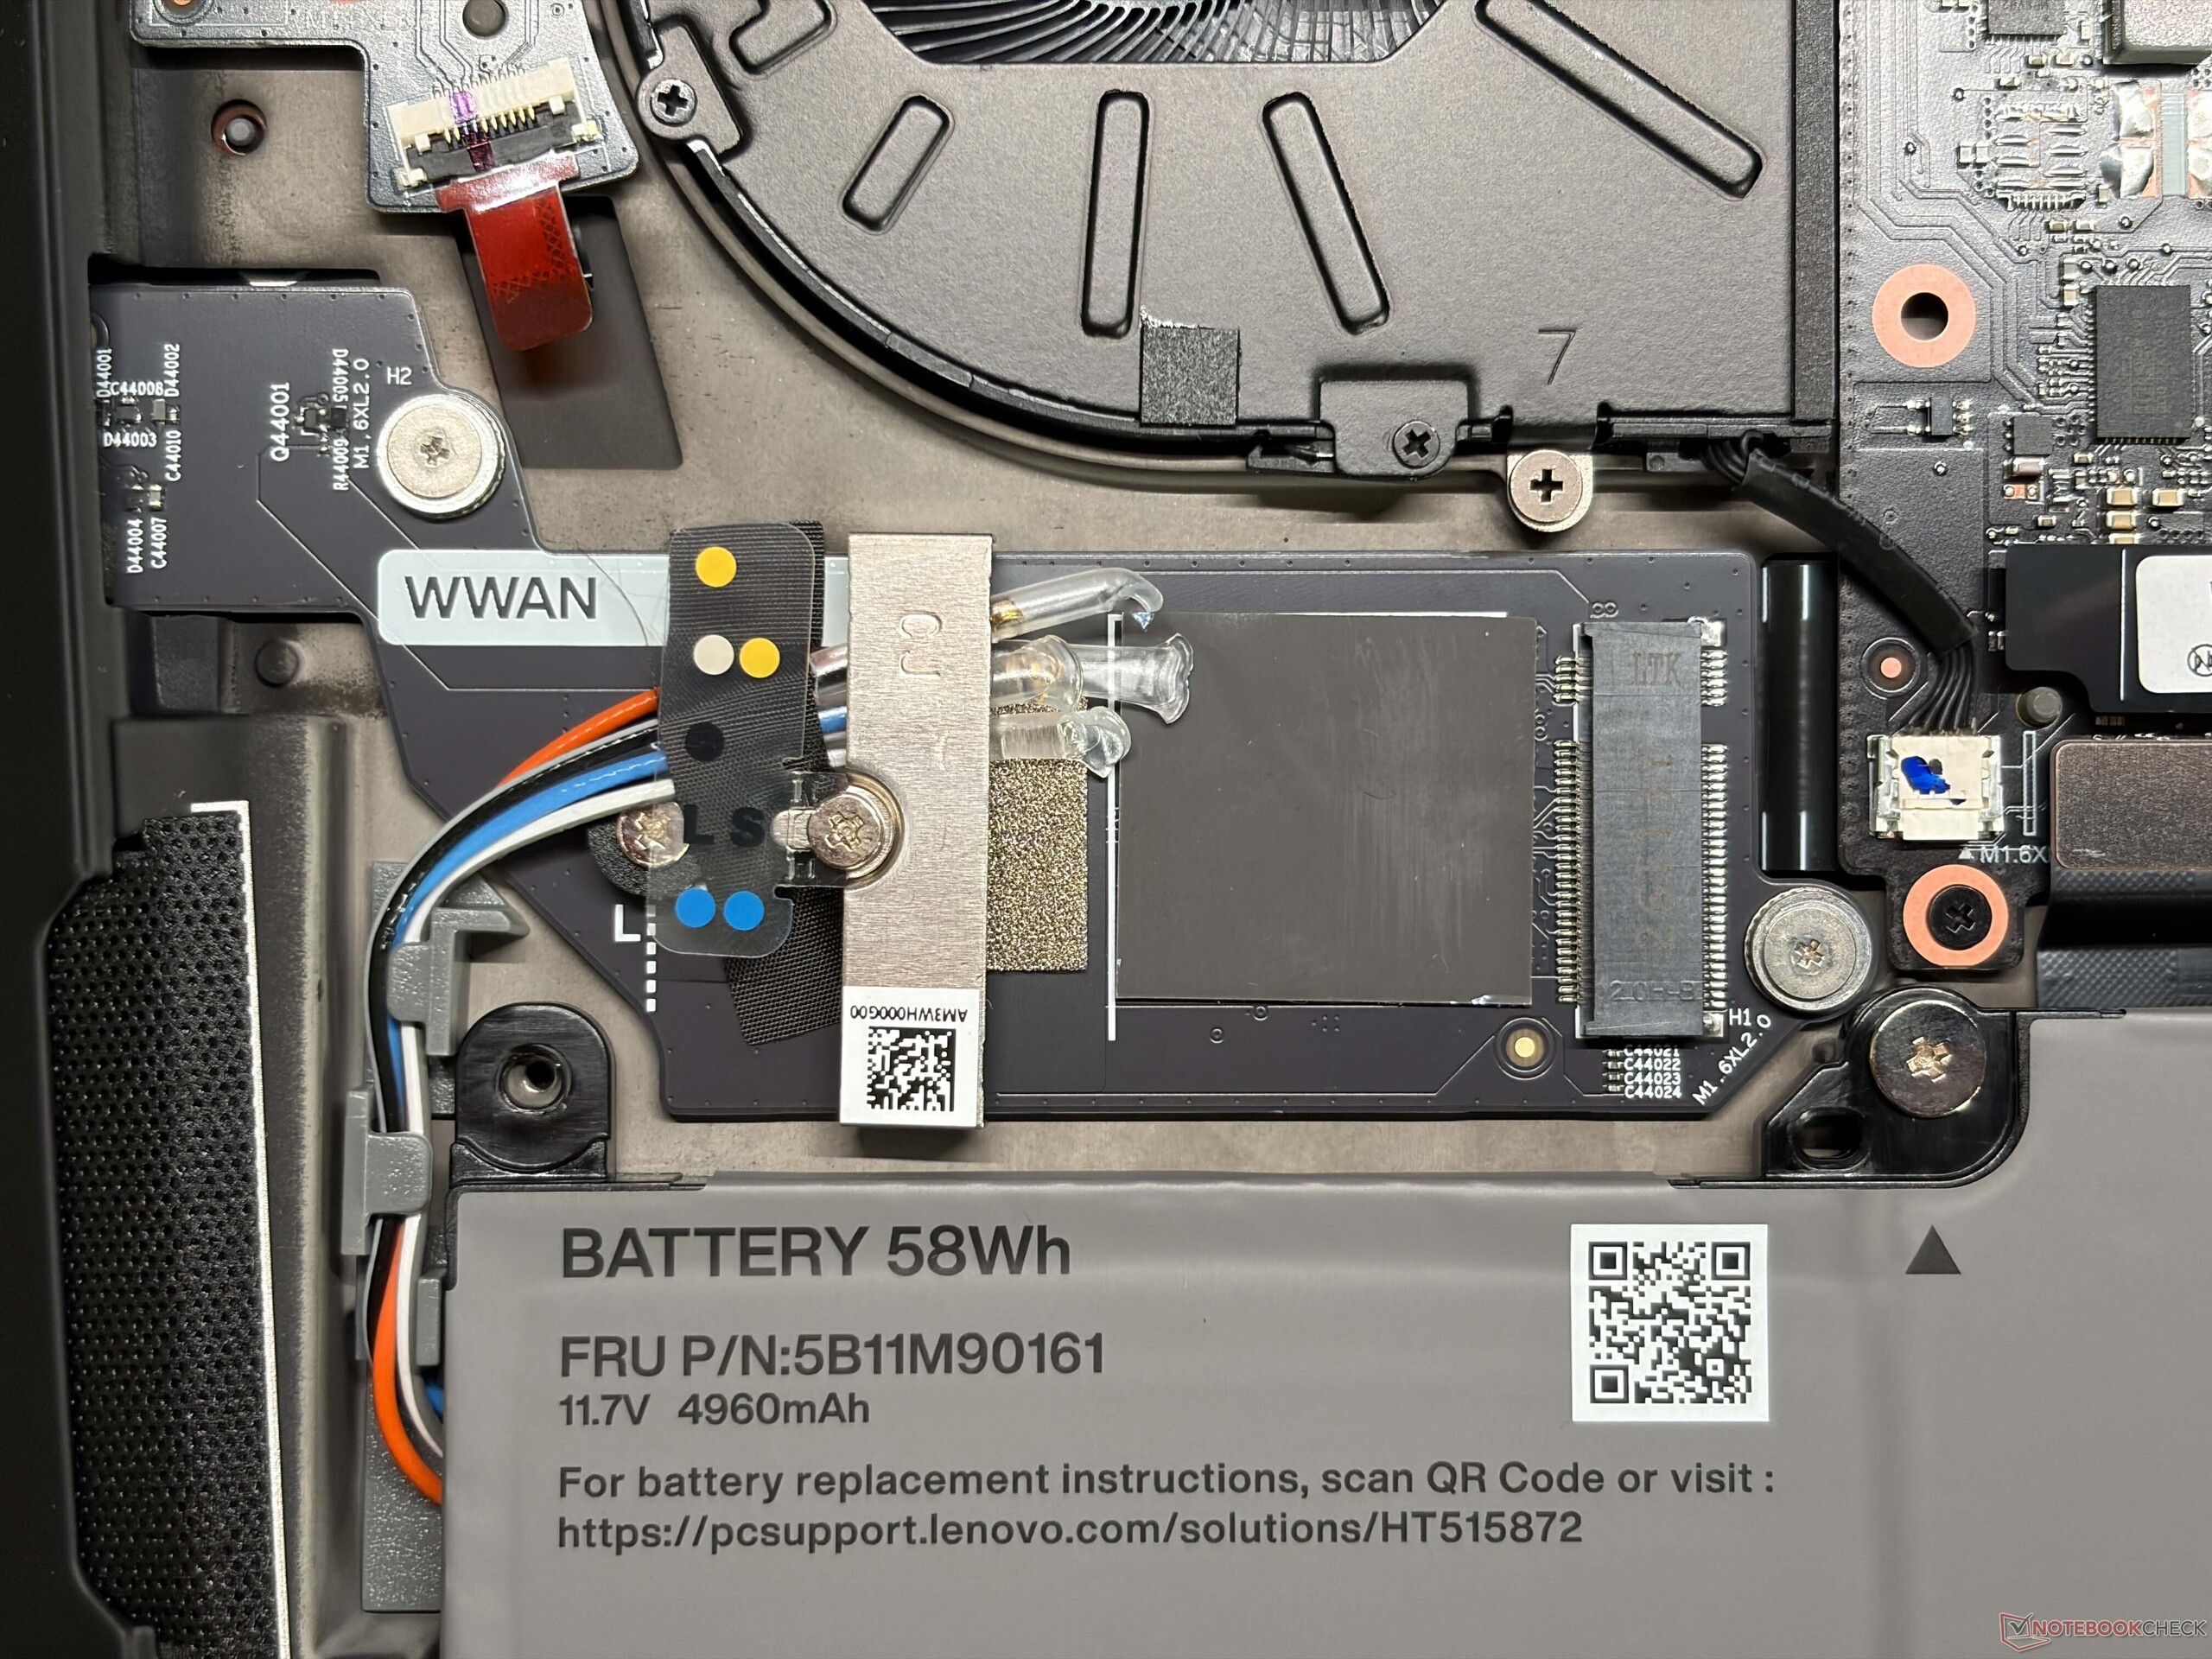
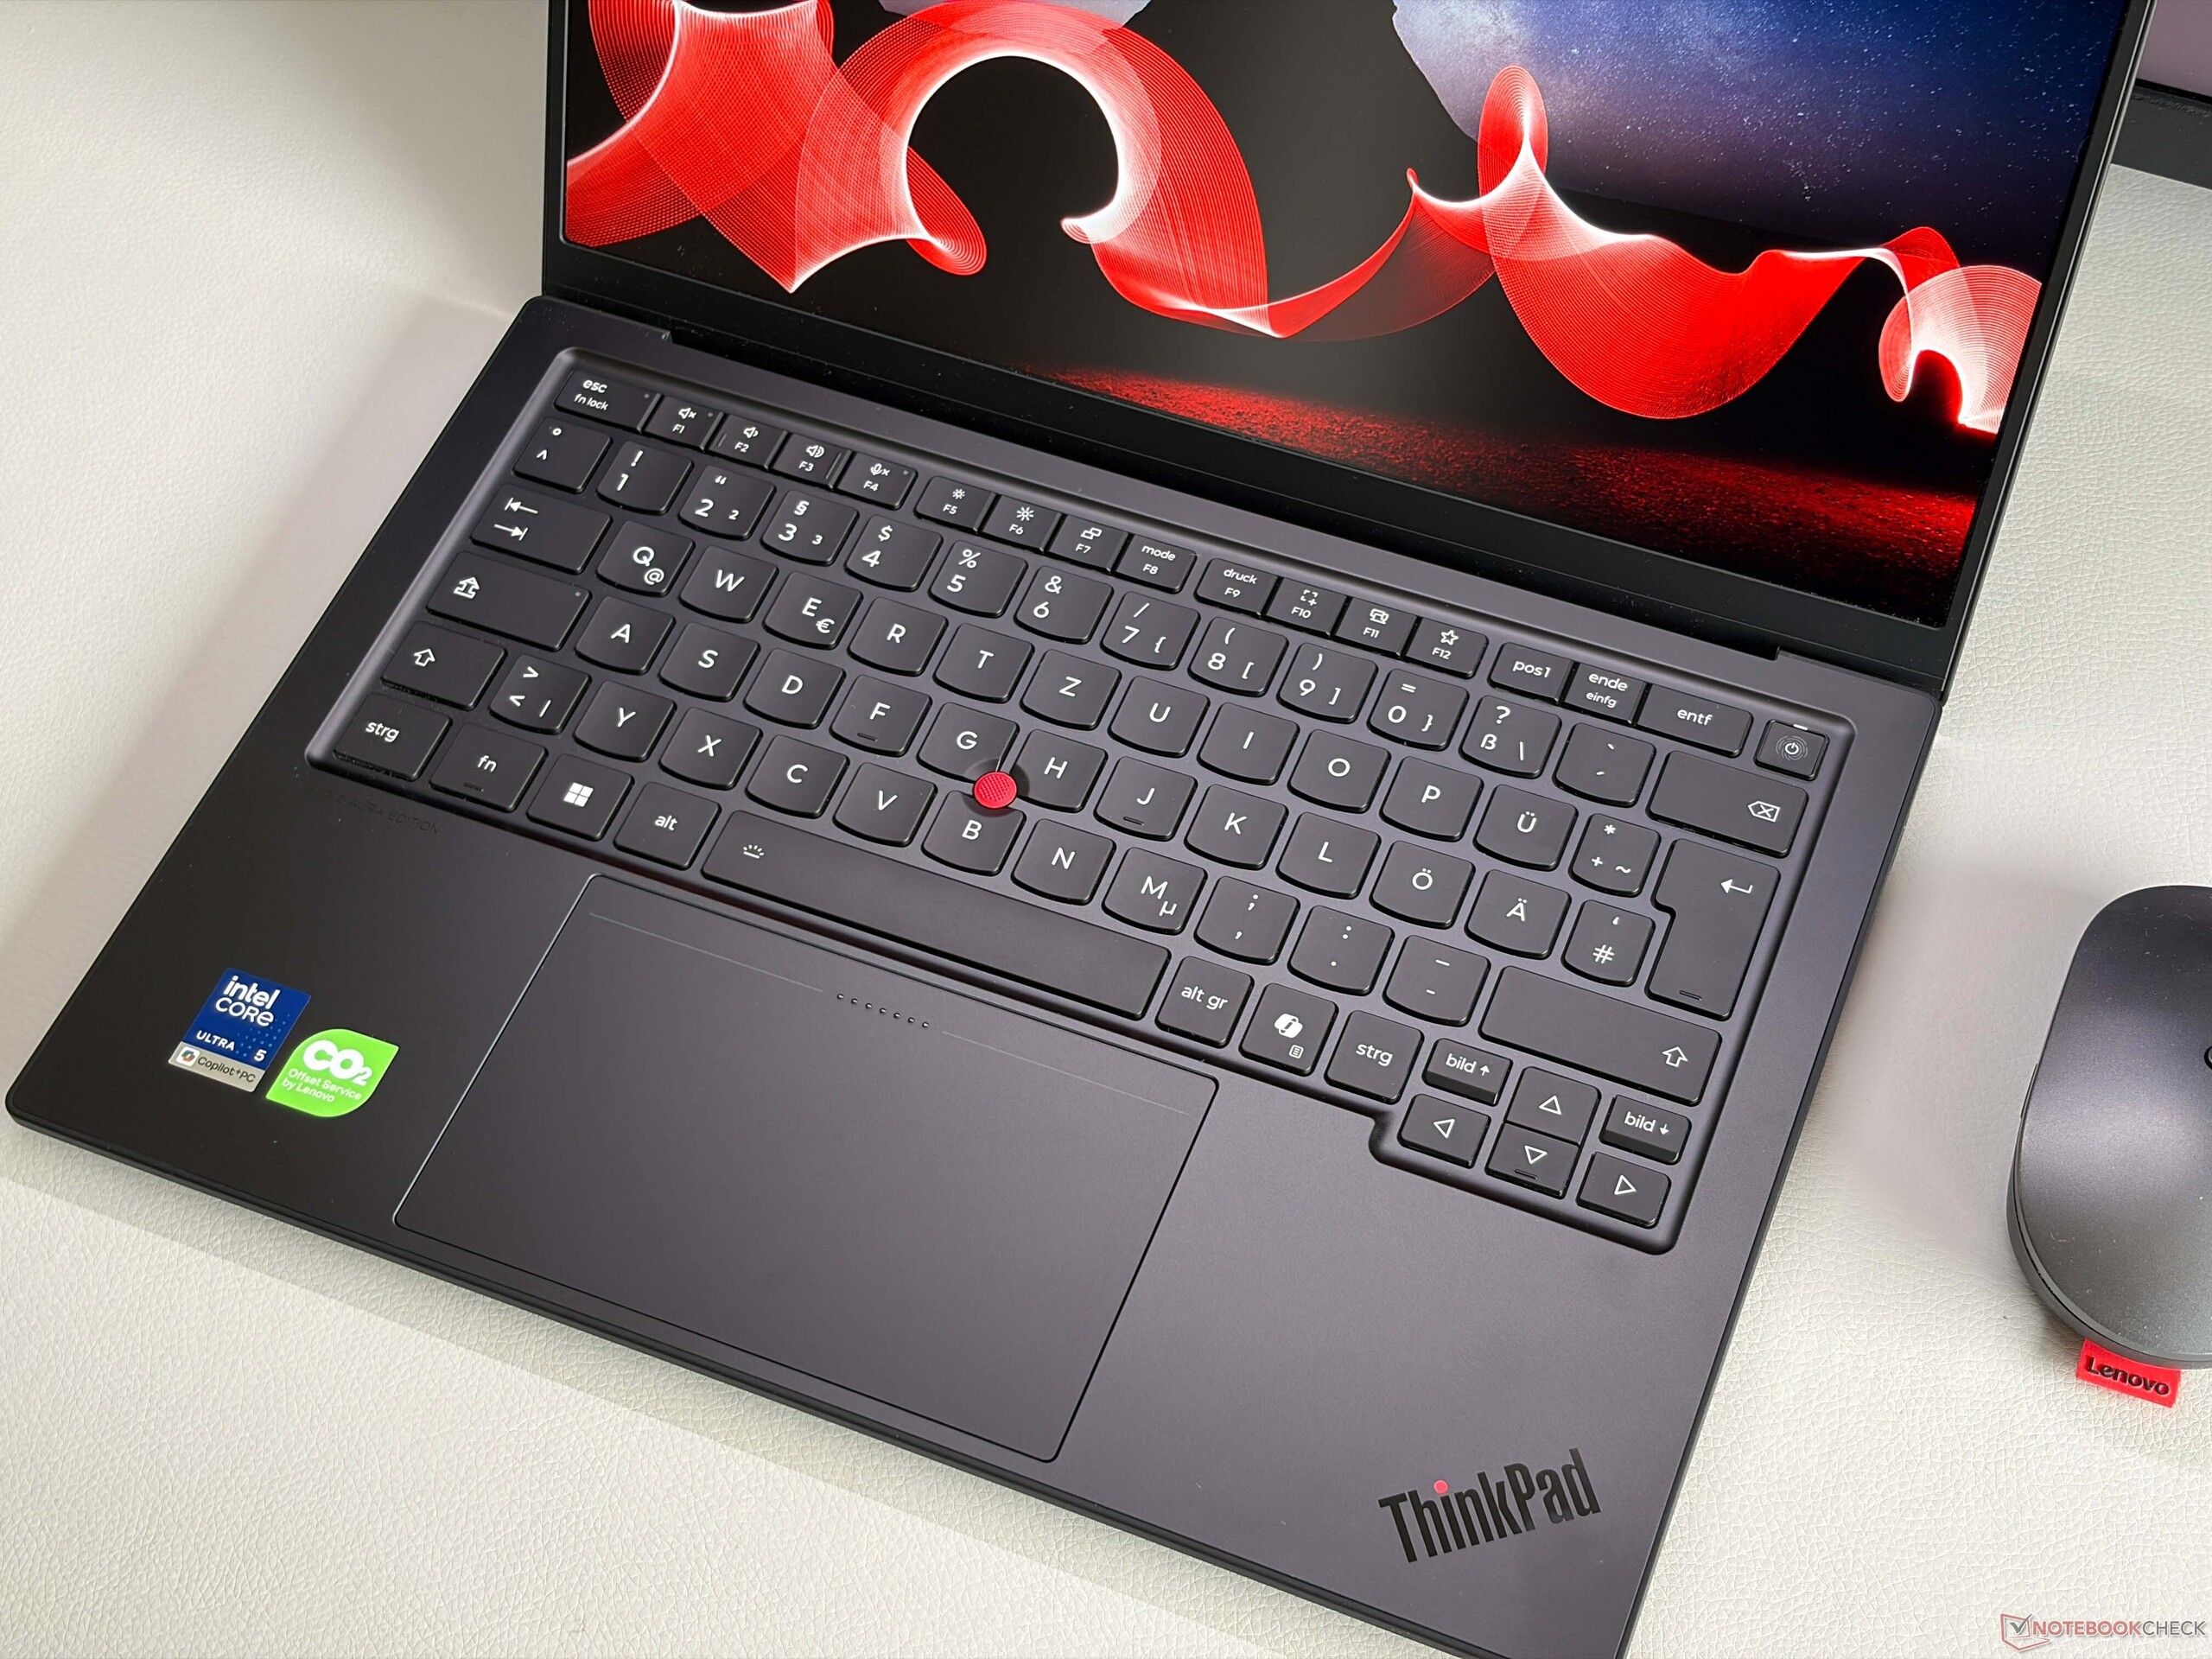
Lenovo utilise un châssis entièrement nouveau pour la 14e génération du ThinkPad X1 Carbon. Le langage de conception général est très similaire à celui de la version précédente, mais nous n’apprécions pas le renflement volumineux au niveau de la caméra. Il existe également des différences selon l’écran que vous choisissez. Les références sans écran tactile sont légèrement plus fines et également plus légères en raison du matériau utilisé. Mais les différences ne s’arrêtent pas là, car le modèle IPS est doté d’une base en aluminium, tandis que les modèles OLED sont équipés d’une base en magnésium (le couvercle étant toujours en fibre de carbone). Il existe donc trois variantes de châssis différentes qui ont également une incidence sur le poids. Notre modèle IPS pèse 1,14 kg, tandis que le modèle OLED pèse en réalité moins d’un kg. La stabilité est très bonne sur les deux versions, mais le modèle OLED semble un peu plus rigide, ce qui se traduit également par une expérience de frappe légèrement meilleure. La nouvelle disposition du clavier (avec les lettres au centre) intègre désormais un bouton d’alimentation avec lecteur d’empreintes digitales dans le coin supérieur droit ; la qualité du clavier est pratiquement identique à celle du modèle précédent, avec une course des touches de 1,5 mm (1,35 mm pour les touches G, H et B), et le rétroéclairage peut désormais être activé automatiquement. Le pavé tactile haptique reste un excellent choix, y compris pour les utilisateurs du TrackPoint. Les possibilités d’entretien (l’accès aux composants internes est très facile) se limitent au SSD M.2-2280 ainsi qu’à un module WWAN en option (4G ou 5G ; notre appareil est compatible WWAN avec des antennes préinstallées).

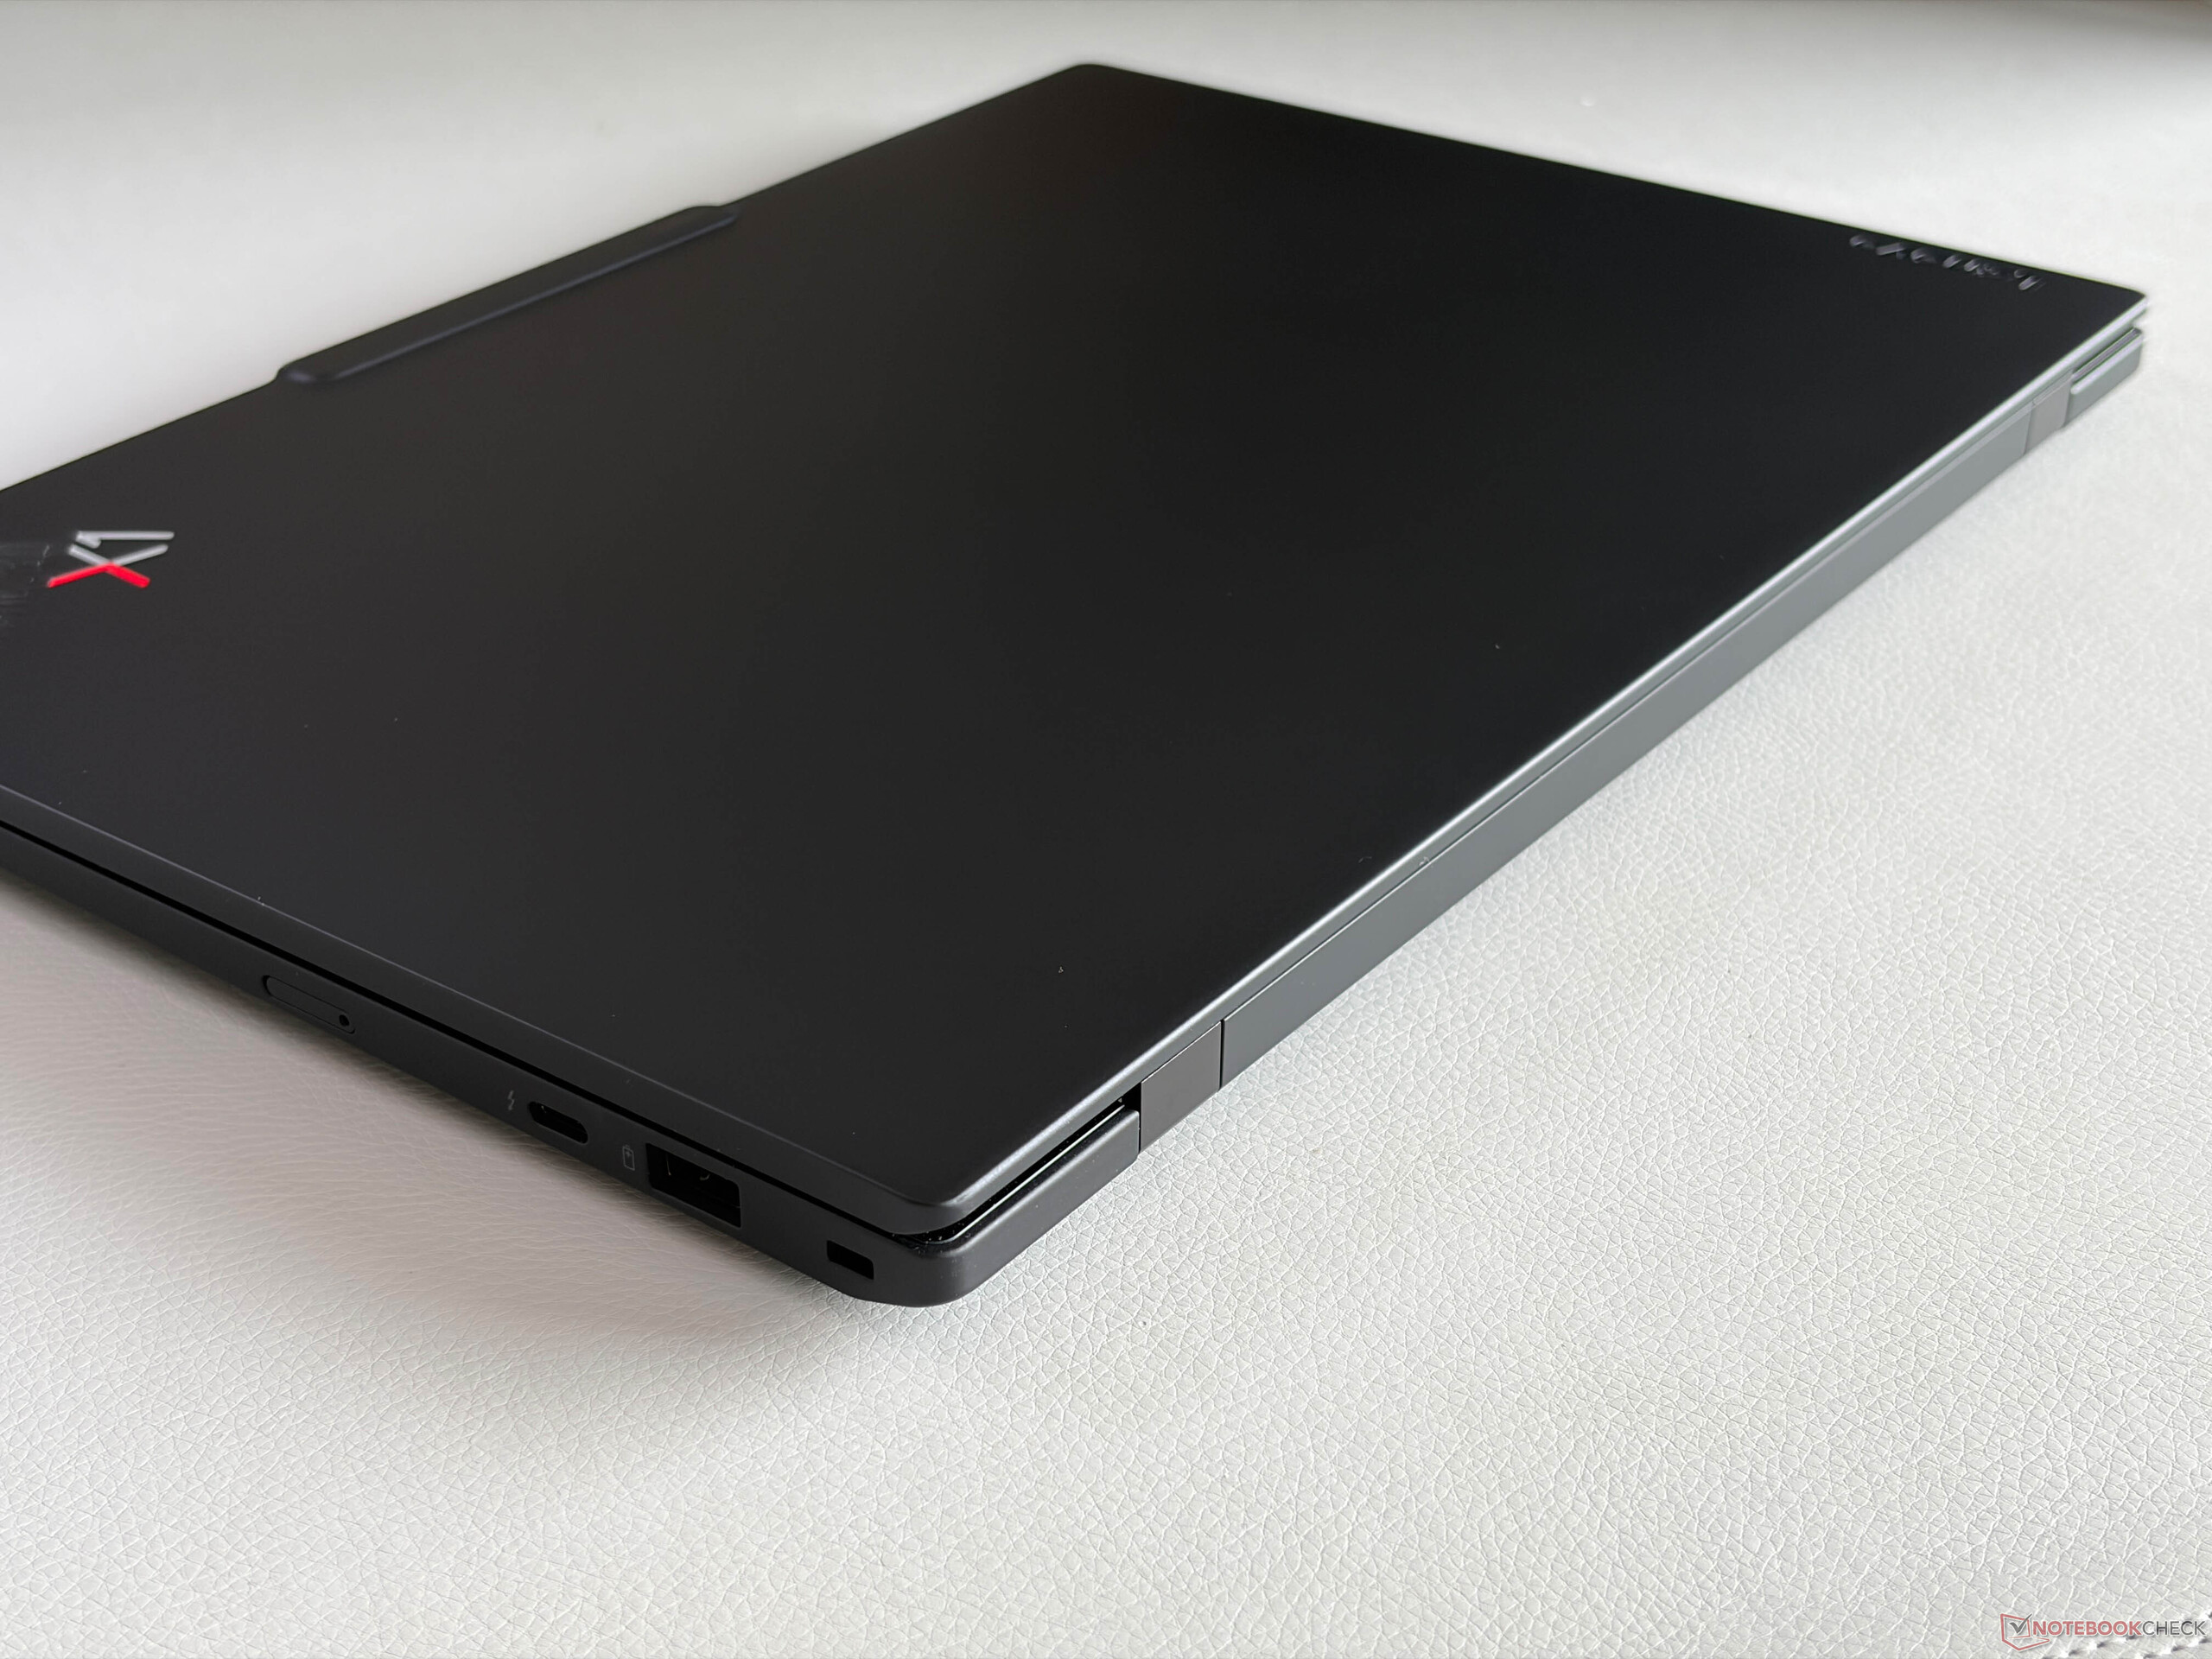
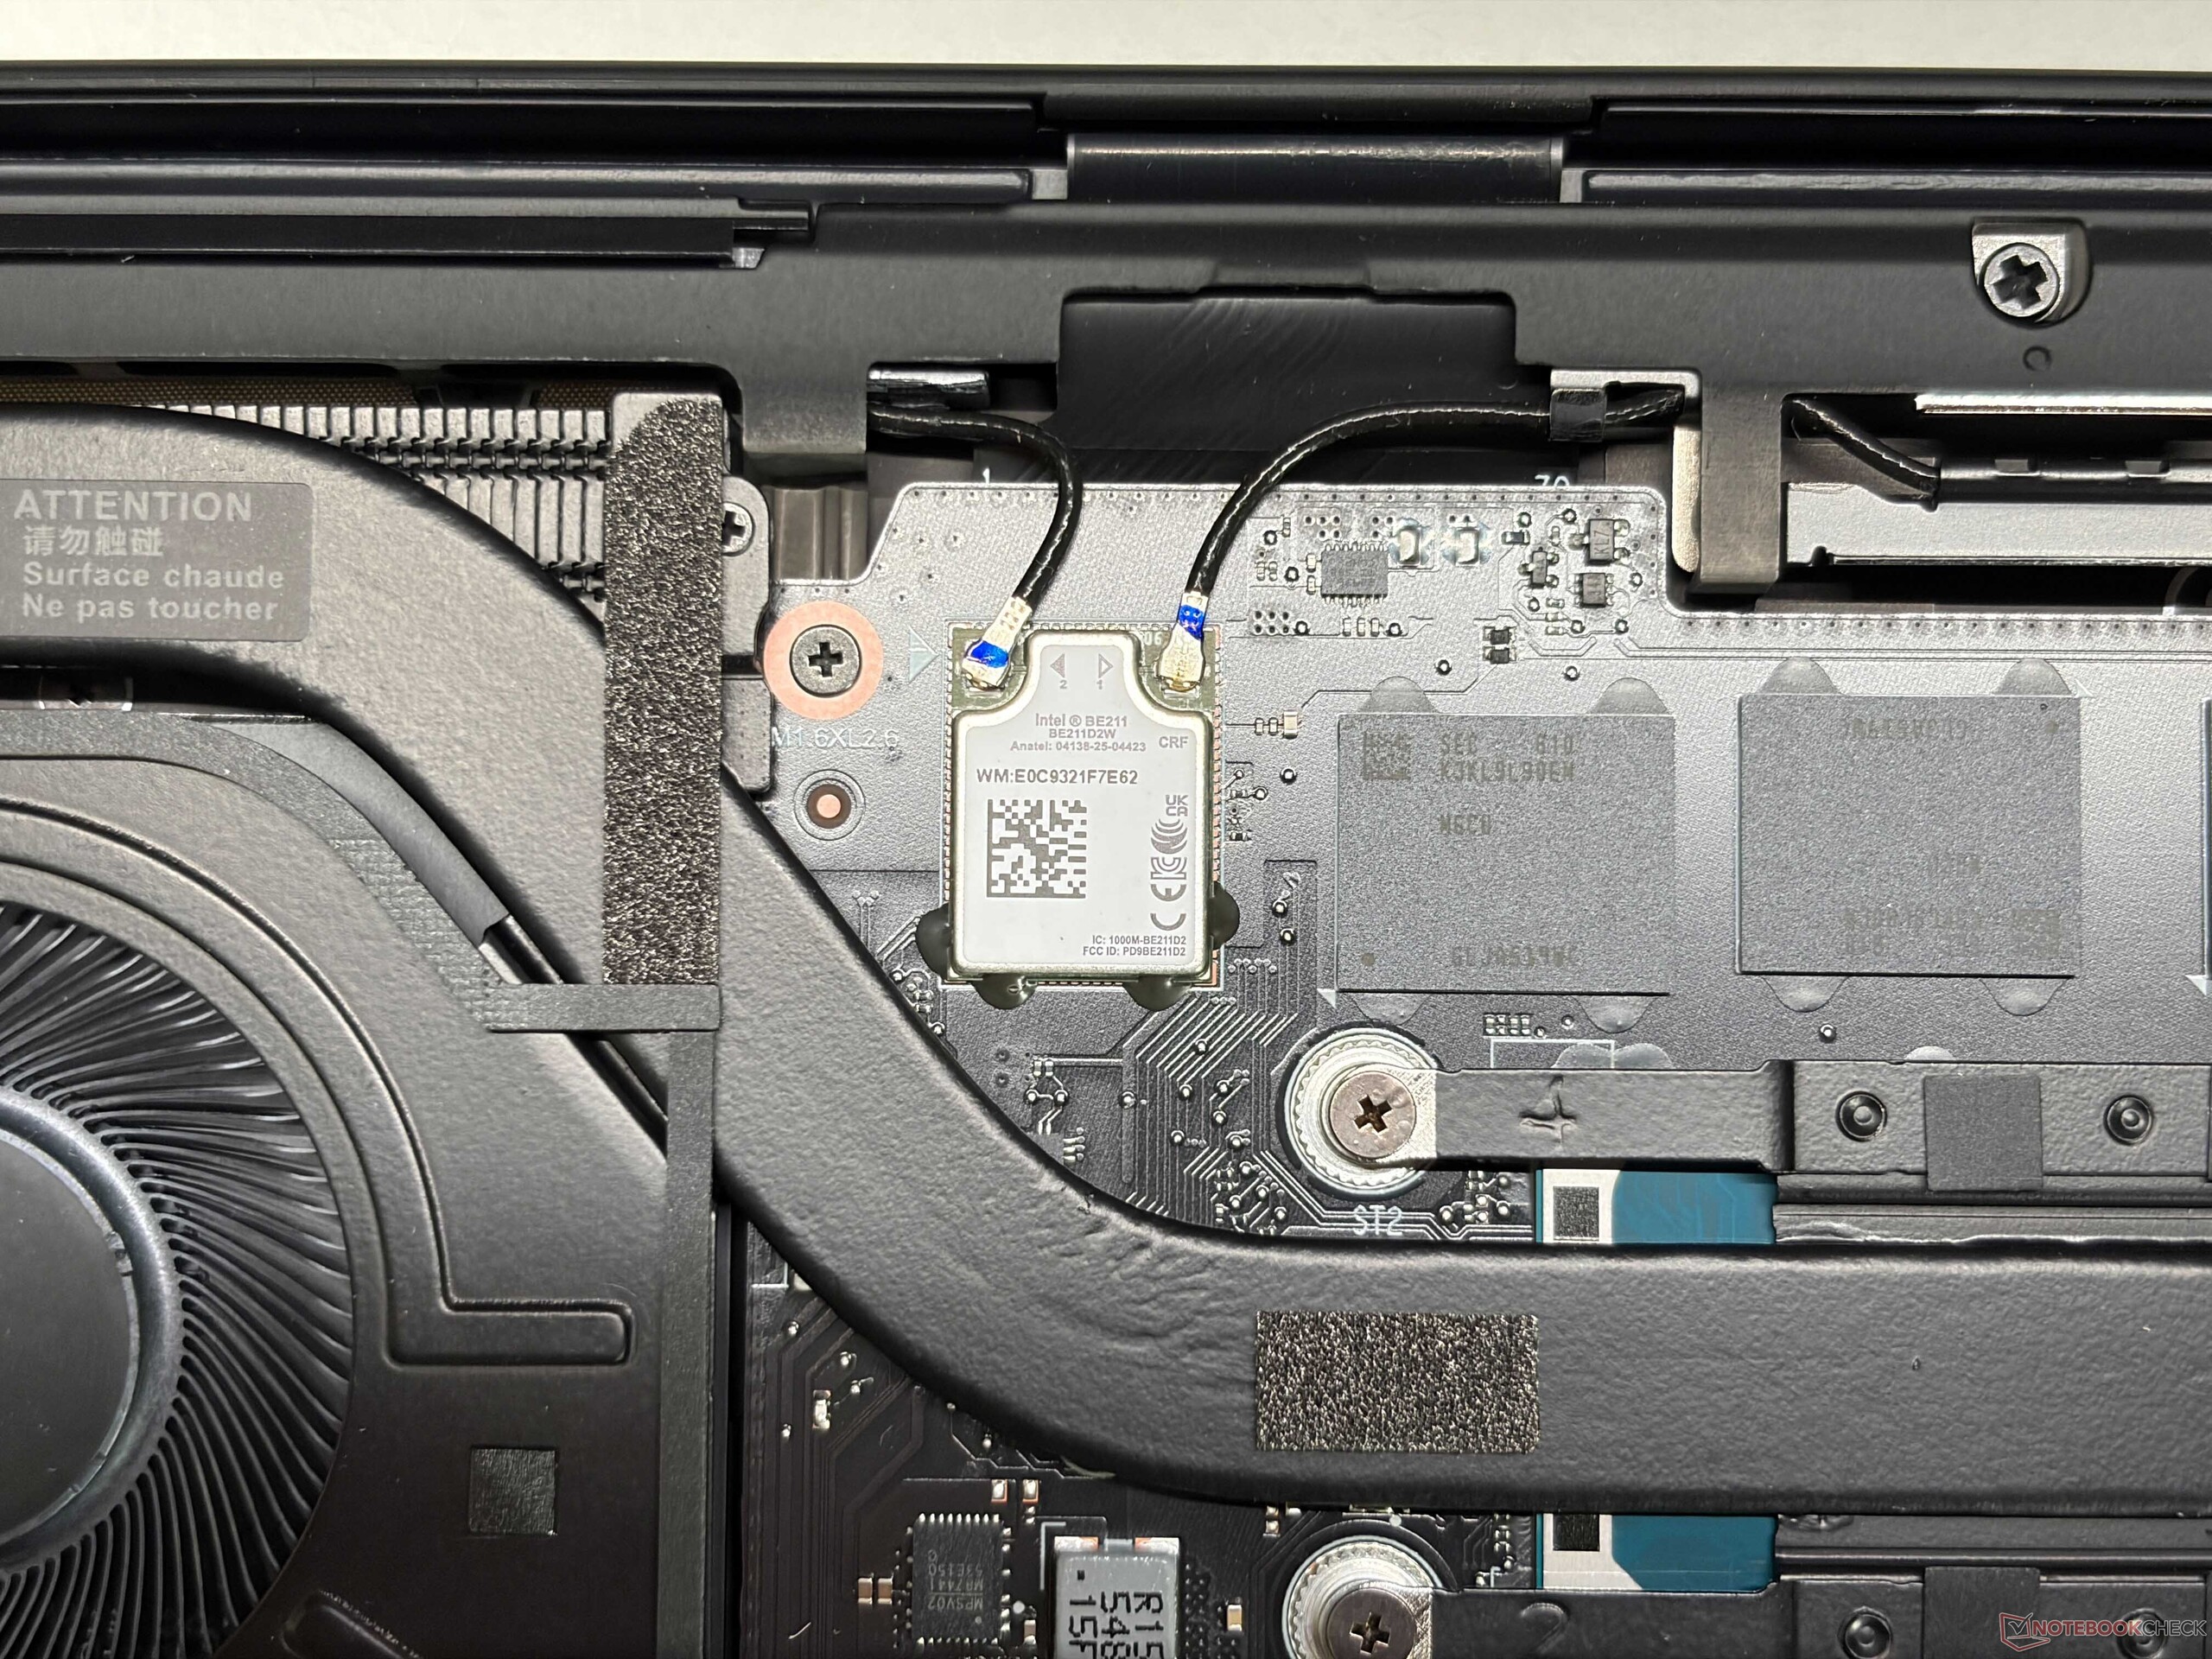
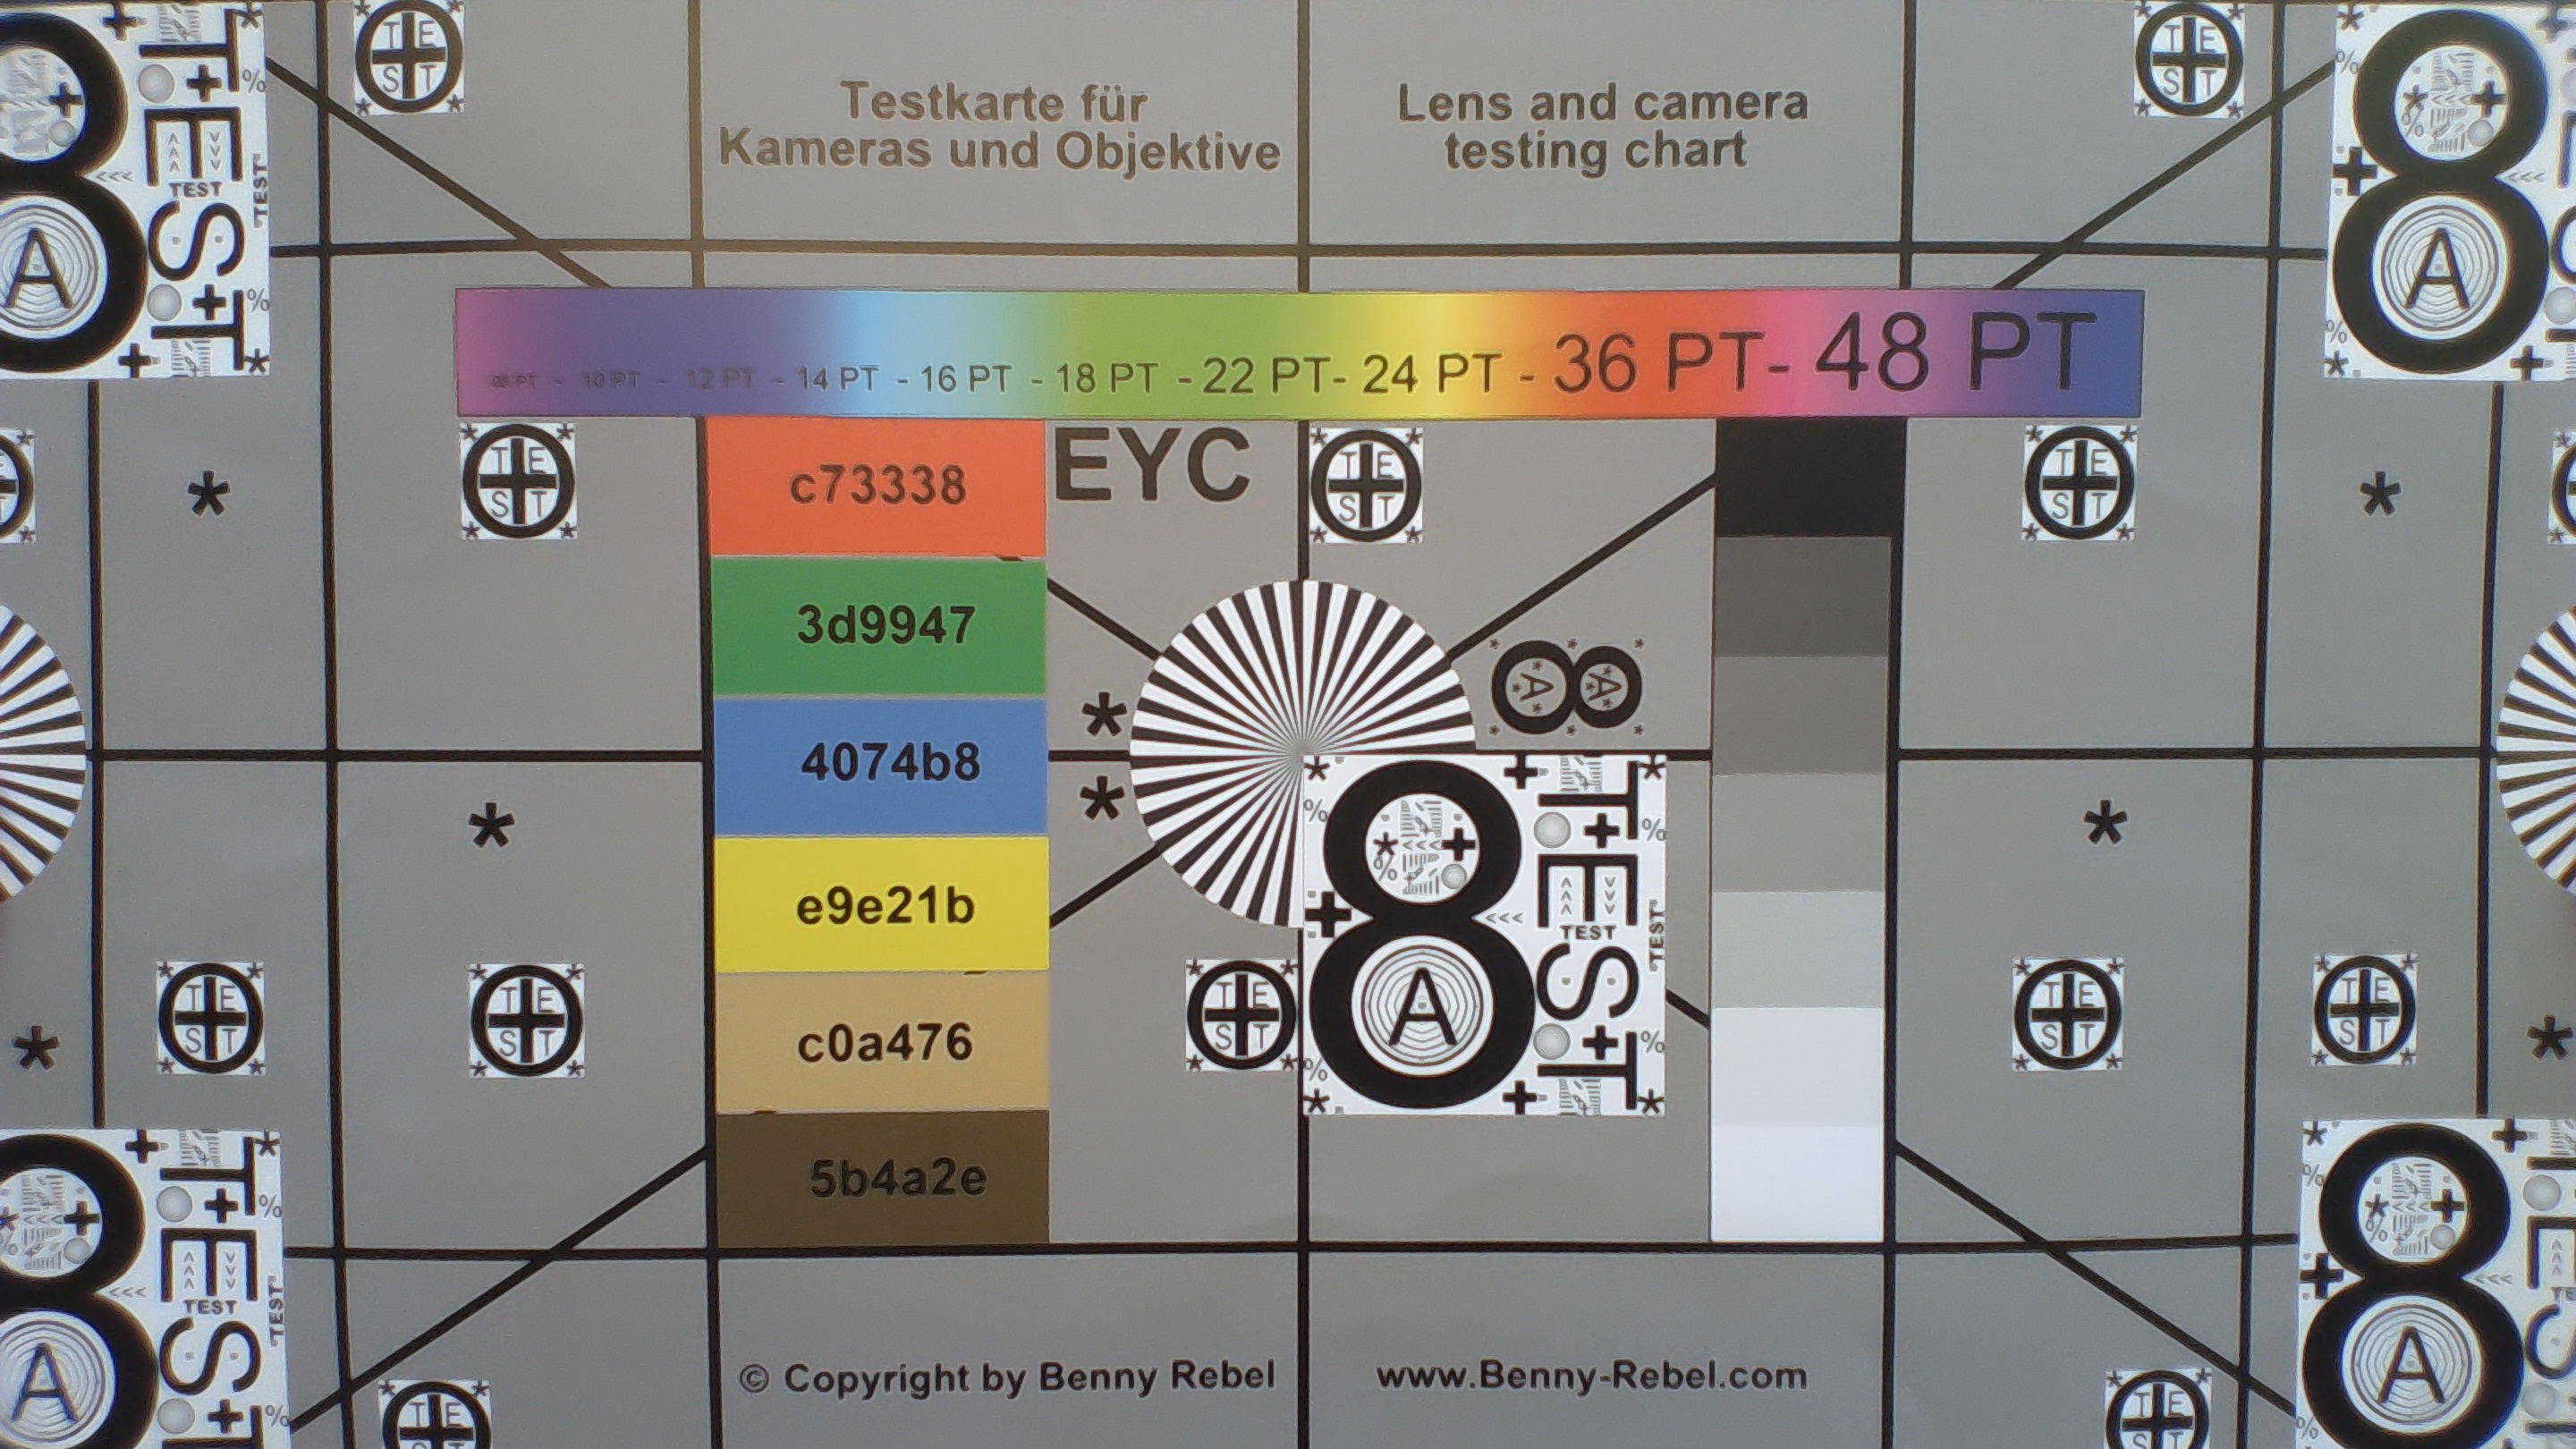
La connectivité est très bonne et Lenovo a ajouté un autre port Thunderbolt 4 sur le côté droit, ce qui vous permet de le recharger des deux côtés. Lenovo utilise un module Wi-Fi 7 moderne d’Intel et les débits de transfert, en combinaison avec un routeur Wi-Fi 7 compatible, sont excellents, dépassant les 3 à 4 Gbps. La webcam de 5 MP (avec infrarouge) remplit bien son rôle.

Comparaison de tailles

312.4 mm 222.5 mm 18.9 mm 961 g313.5 mm 219.3 mm 16.8 mm 1.1 kg312.8 mm 214.75 mm 17.5 mm 1.2 kg311.2 mm 216.7 mm 17.95 mm 1.3 kg313 mm 219.4 mm 15.9 mm 1.2 kg310.9 mm 212.8 mm 15.9 mm 1.1 kg312.2 mm 215 mm 13.2 mm 1.5 kg297 mm 210 mm 1 mm 5.7 g
À gauche : HDMI 2.1, 2 ports USB-C 4.0 avec Thunderbolt 4 (40 Gbps, DisplayPort 2.1, Power Delivery), prise stéréo 3,5 mm
À droite : emplacement pour carte Nano SIM, port USB-C 4.0 avec Thunderbolt 4 (40 Gbps, DisplayPort 2.1, Power Delivery), port USB-A 3.2 Gen. 1 (5 Gbps, toujours actif), emplacement de sécurité Kensington Nano
Networking
Lenovo ThinkPad X1 Carbon Gen 14 21V70075GE
Intel Wi-Fi 7 BE211 320MHz
iperf3 transmit Wi-Fi6/7 RT-BE96U
4557 (min: 4450) MBit/s ∼100%
iperf3 receive Wi-Fi6/7 RT-BE96U
3244 (min: 3047) MBit/s ∼100%
Lenovo ThinkPad X1 Carbon Gen 13 21NX008PGE
Intel Wi-Fi 6E AX211
iperf3 receive AXE11000 6GHz
1685 (min: 1550) MBit/s ∼97%
iperf3 transmit AXE11000 6GHz
708 (min: 217) MBit/s ∼44%
iperf3 receive AXE11000
1620 (min: 1588) MBit/s ∼100%
iperf3 transmit AXE11000
860 (min: 632) MBit/s ∼94%
Lenovo ThinkPad T14s Gen 7 21YW0022GE
Mediatek Wi-Fi 7 MT7925 Wireless LAN Card
iperf3 transmit Wi-Fi6/7 RT-BE96U
1723 (min: 1533) MBit/s ∼38%
iperf3 receive Wi-Fi6/7 RT-BE96U
1957 (min: 1880) MBit/s ∼60%
Asus ExpertBook Ultra B9406CAA
Intel Wi-Fi 7 BE211 320MHz
iperf3 receive AXE11000 6GHz
1621 (min: 1600) MBit/s ∼93%
iperf3 transmit AXE11000 6GHz
1625 (min: 848) MBit/s ∼100%
iperf3 receive AXE11000
837 (min: 608) MBit/s ∼52%
iperf3 transmit AXE11000
834 (min: 492) MBit/s ∼91%
Dynabook Portege Z40L-N
Intel BE201 320MHz
iperf3 receive AXE11000 6GHz
1205 (min: 1152) MBit/s ∼69%
iperf3 transmit AXE11000 6GHz
1003 (min: 936) MBit/s ∼62%
iperf3 receive AXE11000
806 (min: 723) MBit/s ∼50%
iperf3 transmit AXE11000
681 (min: 606) MBit/s ∼74%
Dell Pro 14 Premium
Intel BE201 320MHz
iperf3 receive AXE11000 6GHz
1449 (min: 1352) MBit/s ∼84%
iperf3 transmit AXE11000 6GHz
1279 (min: 1138) MBit/s ∼79%
iperf3 receive AXE11000
1172 (min: 997) MBit/s ∼72%
iperf3 transmit AXE11000
918 (min: 540) MBit/s ∼100%
HP EliteBook X G1a 14 AI
Mediatek Wi-Fi 7 MT7925 Wireless LAN Card
iperf3 receive AXE11000 6GHz
1735 (min: 1680) MBit/s ∼100%
iperf3 transmit AXE11000 6GHz
1159 (min: 1113) MBit/s ∼71%
iperf3 receive AXE11000
897 (min: 821) MBit/s ∼55%
iperf3 transmit AXE11000
865 (min: 808) MBit/s ∼94%
0400800120016002000240028003200360040004400Tooltip
Lenovo ThinkPad X1 Carbon Gen 14 21V70075GE; iperf3 transmit Wi-Fi6/7 RT-BE96U; iperf 3.1.3: Ø4557 (4450-4688) MBit/s
Lenovo ThinkPad X1 Carbon Gen 14 21V70075GE; iperf3 receive Wi-Fi6/7 RT-BE96U; iperf 3.1.3: Ø3244 (3047-3285) MBit/s
ColorChecker
12.4 ∆E
13.3 ∆E
16.6 ∆E
17.9 ∆E
15.7 ∆E
14.2 ∆E
13 ∆E
17.8 ∆E
16.9 ∆E
14.4 ∆E
13.8 ∆E
12.9 ∆E
9.6 ∆E
13 ∆E
21.9 ∆E
10.3 ∆E
18.3 ∆E
17.2 ∆E
2 ∆E
9.8 ∆E
10.5 ∆E
10.4 ∆E
9.2 ∆E
5.5 ∆E
ColorChecker Lenovo ThinkPad X1 Carbon Gen 14 21V70075GE: 13.19 ∆E min: 2.01 - max: 21.87 ∆E

Affichage

Matrice de sous-pixels
Fuite de lumière
Fuite de lumière

Notre modèle de test du ThinkPad x1 Carbon Gen 14 est équipé de l'écran de base, un écran tactile IPS Full HD (1 920 x 1 200 pixels, 16:10) à 60 Hz. La qualité d’image subjective est correcte, avec une couverture complète de l’espace colorimétrique sRGB ; tous les contenus sont suffisamment nets, mais les contenus clairs apparaissent légèrement granuleux (même si ce n’est pas aussi prononcé que sur la dalle OLED en option). Il n’y a pas de scintillement PWM et les temps de réponse restent acceptables.

Notre analyse à l’aide du logiciel professionnel CalMAN révèle une luminosité moyenne de 524 nits avec une valeur de noir de 0,3, ce qui se traduit par un très bon rapport de contraste maximal de 1 800:1. Cependant, le calibrage de l’image est assez médiocre, avec une dominante de couleur nette vers le vert/bleu et des écarts importants tant pour l’échelle de gris que pour les couleurs. Lenovo utilise ce réglage pour augmenter la luminosité. Notre propre calibrage améliore considérablement la qualité de l’image et vous permet même d’utiliser l’écran pour retoucher des images, mais la luminosité maximale diminue de près de 100 nits, ce qui est considérable. Nous vous recommandons tout de même notre calibrage ; le fichier correspondant peut être téléchargé gratuitement dans l’encadré ci-dessous.

546
cd/m²
533
cd/m²
528
cd/m²
517
cd/m²
540
cd/m²
506
cd/m²
507
cd/m²
518
cd/m²
524
cd/m²
Homogénéité de la luminosité
B140UAX01.1 testé avec X-Rite i1Pro 3
Maximum: 546 cd/m² (Nits) Moyenne: 524.3 cd/m² Minimum: 6 cd/m²
Homogénéité de la luminosité: 93 %
Valeur mesurée au centre, sur batterie: 540 cd/m²
Contraste: 1800:1 (Valeurs des noirs: 0.3 cd/m²)
ΔE ColorChecker Calman: 5 | ∀{0.5-29.43 Ø4.71}
calibrated: 1.1
ΔE Greyscale Calman: 8.3 | ∀{0.09-98 Ø4.96}
72% AdobeRGB 1998 (Argyll 3D)
99.1% sRGB (Argyll 3D)
69.8% Display P3 (Argyll 3D)
Gamma: 2.22
CCT: 7068 K
Lenovo ThinkPad X1 Carbon Gen 14 21V70075GE
B140UAX01.1, IPS, 1920x1200, 14", 60 Hz
Lenovo ThinkPad X1 Carbon Gen 13 21NX008PGE
N140JLG-GT3, IPS LED, 1920x1200, 14", 60 Hz
Lenovo ThinkPad X1 Carbon Gen 13 21NS0010GE
ATNA40YK20-0, OLED, 2880x1800, 14", 120 Hz
Lenovo ThinkPad T14s Gen 7 21YW0022GE
MNE007QB1-1, IPS, 1920x1200, 14", 60 Hz
Asus ExpertBook Ultra B9406CAA
Samsung ATNA40LE01-0, OLED, 2880x1800, 14", 120 Hz
Dynabook Portege Z40L-N
BOE NE140WUM-N6K, IPS, 1920x1200, 14", 60 Hz
Dell Pro 14 Premium
LG Phillips 140WT1, OLED, 2880x1800, 14", 60 Hz
HP EliteBook X G1a 14 AI
LG Philips LGD07A1, IPS, 1920x1200, 14", 60 Hz
Display
-2%
26%
-0%
20%
0%
25%
-9%
Display P3 Coverage (%)
69.8
67.8
-3%
99.5
43%
71.6
3%
96.2
38%
70.1
0%
99
42%
62.6
-10%
sRGB Coverage (%)
99.1
97.7
-1%
100
1%
97.4
-2%
100
1%
99
0%
100
1%
93.2
-6%
AdobeRGB 1998 Coverage (%)
72
69.8
-3%
97.1
35%
70.4
-2%
86.7
20%
71.8
0%
95.8
33%
64
-11%
Response Times
-33%
92%
28%
97%
-26%
91%
-53%
Response Time Grey 50% / Grey 80% * (ms)
42 ?(19.4, 22.6)
43.8 ?(16.6, 27.2)
-4%
2.4 ?(1.2, 1.2)
94%
27.8 ?(10.2, 17.6)
34%
0.71 ?(0.38, 0.33)
98%
42.1 ?(19.6, 22.5)
-0%
1.4 ?(0.7, 0.7)
97%
55.8 ?(25.3, 30.5)
-33%
Response Time Black / White * (ms)
17.7 ?(7.2, 10.5)
28.6 ?(13.9, 14.7)
-62%
1.9 ?(0.9, 1)
89%
14 ?(4.3, 9.7)
21%
0.94 ?(0.49, 0.45)
95%
26.7 ?(12, 14.7)
-51%
2.7 ?(1.6, 1.1)
85%
30.5 ?(15.3, 15.2)
-72%
PWM Frequency (Hz)
240 ?(100)
968.8 ?(100)
241.1 ?(100)
PWM Amplitude * (%)
33
20
100
32
Screen
26%
-38%
21%
43%
13%
18%
-2%
Brightness middle (cd/m²)
540
545
1%
407
-25%
574
6%
600.5
11%
445.4
-18%
392.3
-27%
442.8
-18%
Brightness (cd/m²)
524
491
-6%
410
-22%
530
1%
612
17%
424
-19%
392
-25%
412
-21%
Brightness Distribution (%)
93
86
-8%
99
6%
87
-6%
96
3%
91
-2%
95
2%
87
-6%
Black Level * (cd/m²)
0.3
0.25
17%
0.32
-7%
0.23
23%
0.22
27%
Contrast (:1)
1800
2180
21%
1794
0%
1937
8%
2013
12%
Colorchecker dE 2000 *
5
1.8
64%
4.9
2%
2
60%
1.18
76%
2.85
43%
3.39
32%
5.92
-18%
Colorchecker dE 2000 max. *
12.2
3.9
68%
9.1
25%
3.7
70%
3.4
72%
4.57
63%
6.53
46%
10.46
14%
Colorchecker dE 2000 calibrated *
1.1
1
9%
4.7
-327%
1.1
-0%
0.73
34%
1.54
-40%
0.99
10%
1.31
-19%
Greyscale dE 2000 *
8.3
2.7
67%
2.3
72%
2.6
69%
1
88%
3.3
60%
1.1
87%
7.6
8%
Gamma
2.22 99%
2.2 100%
2.26 97%
2.27 97%
2.27 97%
2.03 108%
2.23 99%
2.22 99%
CCT
7068 92%
6466 101%
6310 103%
6910 94%
6567 99%
6497 100%
6502 100%
6728 97%
Moyenne finale (programmes/paramètres)
-3% / 11%
27% / -1%
16% / 18%
53% / 46%
-4% / 5%
45% / 32%
-21% / -11%

* ... Moindre est la valeur, meilleures sont les performances

Échelle de gris CalMAN
Saturation CalMAN
Saturation CalMAN
CalMAN ColorChecker
CalMAN ColorChecker
Échelle de gris CalMAN calibrée
Calibrage de la saturation CalMAN
Calibré avec le ColorChecker de CalMAN
vs. sRGB
vs. sRGB
vs. P3
vs. P3
vs. AdobeRGB
vs. AdobeRGB

Temps de réponse de l'écran

Le temps de réponse d'un écran mesure la rapidité à laquelle l'écran est capable de changer une couleur pour une autre. Un temps de réponse élevé se traduit par une image floutée pour les objets en mouvement. Les joueurs bénéficieront de faibles latences d'affichage en jeu.
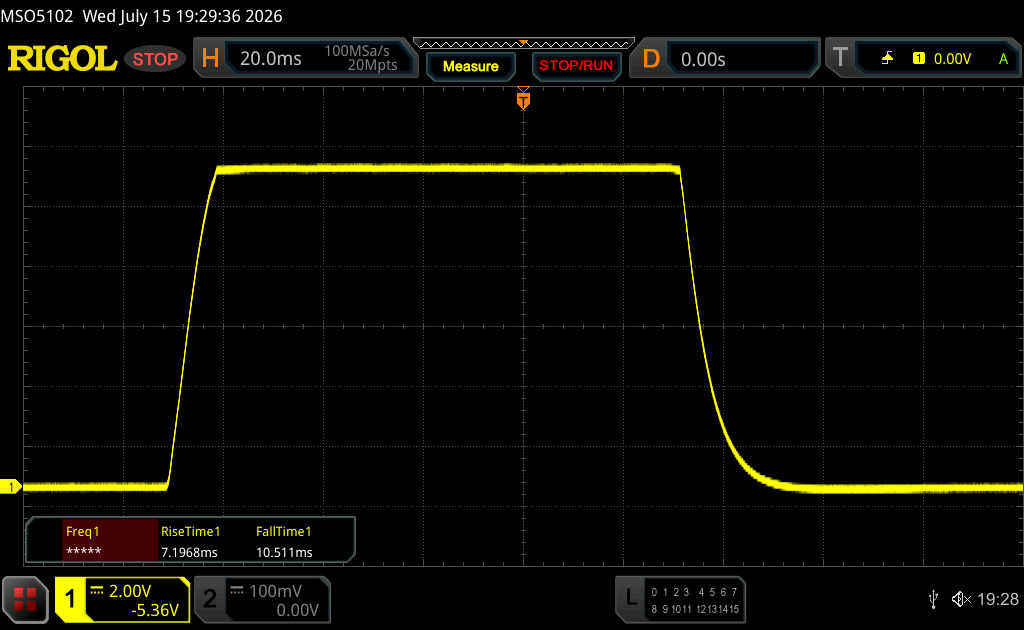
       Temps de réponse noir à blanc
17.7 ms ... hausse ↗ et chute ↘ combinées↗ 7.2 ms hausse
↘ 10.5 ms chute
L'écran montre de bons temps de réponse, mais insuffisant pour du jeu compétitif.
En comparaison, tous les appareils testés affichent entre 0.1 (minimum) et 240 (maximum) ms. » 40 % des appareils testés affichent de meilleures performances.
Cela signifie que les latences relevées sont meilleures que la moyenne (19.8 ms) de tous les appareils testés.
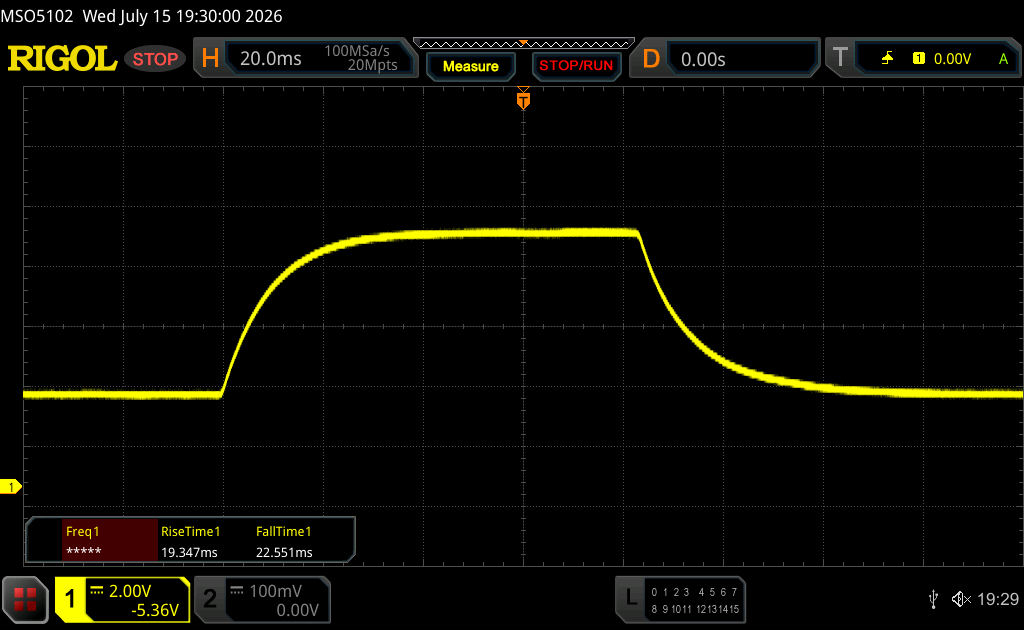
       Temps de réponse gris 50% à gris 80%
42 ms ... hausse ↗ et chute ↘ combinées↗ 19.4 ms hausse
↘ 22.6 ms chute
L'écran souffre de latences très élevées, à éviter pour le jeu.
En comparaison, tous les appareils testés affichent entre 0.165 (minimum) et 636 (maximum) ms. » 67 % des appareils testés affichent de meilleures performances.
Cela signifie que les latences relevées sont moins bonnes que la moyenne (31 ms) de tous les appareils testés.

Scintillement / MLI (Modulation de largeur d'impulsion)

Afin d'abaisser la luminosité de l'écran, certains ordinateurs portables font varier très rapidement le rétroéclairage entre éteint et allumé. La fréquence à laquelle le rétroéclairage s'éteint et se rallume est normalement fixée à une valeur qui permet de rendre la variation indétectable à l'œil nu? Si la fréquence est trop basse, certaines personnes peuvent être sujettes à une fatigue oculaire, des maux de tête ou même percevoir les variations.
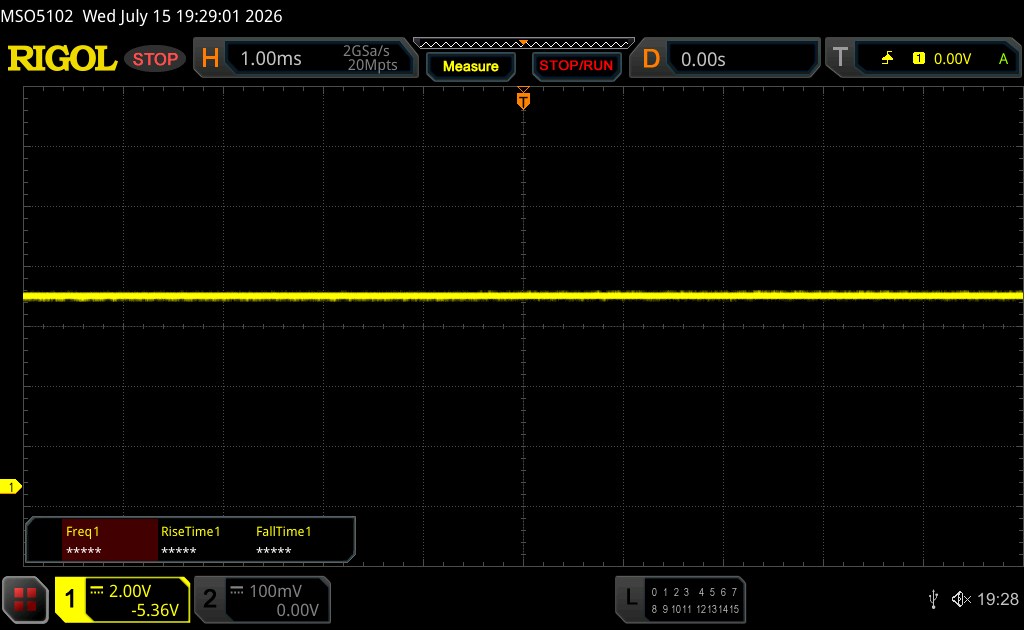
Scintillement / MLI (Modulation de largeur d'impulsion) non décelé

En comparaison, 52 % des appareils testés n'emploient pas MDI pour assombrir leur écran. Nous avons relevé une moyenne à 7757 (minimum : 5 - maximum : 343500) Hz dans le cas où une MDI était active.

Au soleil
Au soleil
En extérieur (journée ensoleillée, sans exposition directe au soleil)
Angles de vue
Angles de vue

Performances

Lenovo propose le ThinkPad X1 Carbon Gen 14 équipé des nouveaux processeurs Panther Lake d'Intel, notamment les puissantes versions Core Ultra X (avec le processeur graphique intégré Arc B390) et jusqu'à 64 Go de RAM.

Conditions d'essai

Les profils d'alimentation propres à Lenovo sont synchronisés avec les paramètres Windows sur les modèles ThinkPad. Nous avons utilisé le paramètre « Meilleures performances » pour nos tests de performance et nos mesures.

Performances du processeur

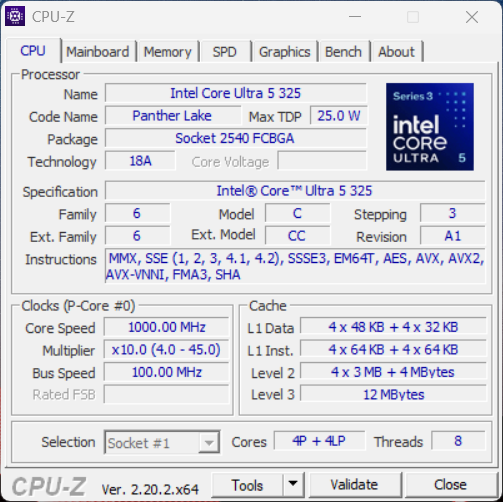
Le Core Ultra 5 325 (Panther Lake) dispose de 8 cœurs (4 cœurs de performance, 4 cœurs d'efficacité) avec une fréquence d'horloge maximale de 4,5 GHz. Il consomme 35 watts en charge et les performances du processeur, mesurées dans tous nos benchmarks, sont légèrement supérieures à celles du modèle de l’année dernière équipé du Core Ultra 7 258V (Lunar Lake), ainsi qu’à celles de la version Arrow Lake dotée du Core Ultra 5 225U. Il est suffisamment performant pour la plupart des tâches bureautiques et Lenovo propose également les modèles phares Panther Lake (tels que le Core Ultra X7 368H) si vous avez besoin de performances CPU supérieures. En fonctionnement sur batterie, la consommation maximale est limitée à 25 watts, ce qui réduit les performances multicœurs d’environ 16 %.

Cinebench R15 Multi Loop

065130195260325390455520585650715780845910975104011051170123513001365143014951560162516901755182018851950201520802145221022752340240524702535260026652730279528602925299030553120Tooltip
Lenovo ThinkPad X1 Carbon Gen 14 21V70075GE Intel Core Ultra 5 325: Ø1617 (1603.78-1670.43) Points
Lenovo ThinkPad X1 Carbon Gen 13 21NX008PGE Intel Core Ultra 5 225U: Ø1804 (1754.46-1909.13) Points
Lenovo ThinkPad T14s Gen 7 21YW0022GE AMD Ryzen AI 7 PRO 450: Ø2330 (2063.03-2456.7) Points
Asus ExpertBook Ultra B9406CAA Intel Core Ultra X7 358H: Ø2886 (2802.49-3038.82) Points
Dynabook Portege Z40L-N Intel Core Ultra 7 258V: Ø1101 (1084.28-1280.25) Points
Dell Pro 14 Premium Intel Core Ultra 7 268V: Ø1553 (1539.35-1573.81) Points
HP EliteBook X G1a 14 AI AMD Ryzen AI 9 HX PRO 375: Ø3077 (3043.45-3132.34) Points
Lenovo ThinkPad X1 Carbon Gen 13 21NS0010GE Intel Core Ultra 7 258V: Ø1317 (1177.47-1571.22) Points
CPU Performance rating: Percent
Cinebench 2024: CPU Multi Core | CPU Single Core
Cinebench R23: Multi Core | Single Core
Cinebench R20: CPU (Multi Core) | CPU (Single Core)
Cinebench R15: CPU Multi 64Bit | CPU Single 64Bit
Blender: v2.79 BMW27 CPU
7-Zip 18.03: 7z b 4 | 7z b 4 -mmt1
Geekbench 6.7: Multi-Core | Single-Core
Geekbench 5.5: Multi-Core | Single-Core
HWBOT x265 Benchmark v2.2: 4k Preset
LibreOffice : 20 Documents To PDF
R Benchmark 2.5: Overall mean
CPU Performance rating
Asus ExpertBook Ultra B9406CAA
Intel Core Ultra X7 358H
87.2 pt
HP EliteBook X G1a 14 AI
AMD Ryzen AI 9 HX PRO 375
81.1 pt
Lenovo ThinkPad T14s Gen 7 21YW0022GE
AMD Ryzen AI 7 PRO 450
75.8 pt
Dell Pro 14 Premium
Intel Core Ultra 7 268V
65.3 pt
Lenovo ThinkPad X1 Carbon Gen 14 21V70075GE
Intel Core Ultra 5 325
64.5 pt
Lenovo ThinkPad X1 Carbon Gen 13 21NS0010GE
Intel Core Ultra 7 258V
63.5 pt
Moyenne Intel Core Ultra 5 325
 
63.2 pt
Moyenne de la classe Office
 
60.6 pt
Lenovo ThinkPad X1 Carbon Gen 13 21NX008PGE -2!
Intel Core Ultra 5 225U
59.2 pt
Dynabook Portege Z40L-N
Intel Core Ultra 7 258V
57.4 pt
Cinebench 2024 / CPU Multi Core
Asus ExpertBook Ultra B9406CAA
Intel Core Ultra X7 358H
1125 Points +74%
HP EliteBook X G1a 14 AI
AMD Ryzen AI 9 HX PRO 375
994 Points +54%
Lenovo ThinkPad T14s Gen 7 21YW0022GE
AMD Ryzen AI 7 PRO 450
843 Points +31%
Moyenne de la classe Office
  (100 - 1168, n=46, 2 dernières années)
690 Points +7%
Lenovo ThinkPad X1 Carbon Gen 14 21V70075GE
Intel Core Ultra 5 325
645 Points
Moyenne Intel Core Ultra 5 325
  (629 - 645, n=2)
637 Points -1%
Dell Pro 14 Premium
Intel Core Ultra 7 268V
630 Points -2%
Lenovo ThinkPad X1 Carbon Gen 13 21NS0010GE
Intel Core Ultra 7 258V
524 Points -19%
Dynabook Portege Z40L-N
Intel Core Ultra 7 258V
452 Points -30%
Cinebench 2024 / CPU Single Core
Asus ExpertBook Ultra B9406CAA
Intel Core Ultra X7 358H
124.2 Points +10%
Dell Pro 14 Premium
Intel Core Ultra 7 268V
122.6 Points +8%
Moyenne de la classe Office
  (58 - 821, n=48, 2 dernières années)
120.5 Points +6%
Dynabook Portege Z40L-N
Intel Core Ultra 7 258V
119.1 Points +5%
Lenovo ThinkPad X1 Carbon Gen 13 21NS0010GE
Intel Core Ultra 7 258V
118.2 Points +4%
Lenovo ThinkPad T14s Gen 7 21YW0022GE
AMD Ryzen AI 7 PRO 450
114.8 Points +1%
Moyenne Intel Core Ultra 5 325
  (113.3 - 113.9, n=2)
113.6 Points 0%
Lenovo ThinkPad X1 Carbon Gen 14 21V70075GE
Intel Core Ultra 5 325
113.3 Points
HP EliteBook X G1a 14 AI
AMD Ryzen AI 9 HX PRO 375
106.7 Points -6%
Cinebench R23 / Multi Core
HP EliteBook X G1a 14 AI
AMD Ryzen AI 9 HX PRO 375
20399 (20203.5min - 20398.7max) Points +86%
Asus ExpertBook Ultra B9406CAA
Intel Core Ultra X7 358H
19841 (17837.1min - 19840.9max) Points +81%
Lenovo ThinkPad T14s Gen 7 21YW0022GE
AMD Ryzen AI 7 PRO 450
16054 Points +46%
Lenovo ThinkPad X1 Carbon Gen 13 21NX008PGE
Intel Core Ultra 5 225U
12075 Points +10%
Moyenne de la classe Office
  (1673 - 22808, n=76, 2 dernières années)
11538 Points +5%
Lenovo ThinkPad X1 Carbon Gen 14 21V70075GE
Intel Core Ultra 5 325
10980 Points
Moyenne Intel Core Ultra 5 325
  (10487 - 11015, n=4)
10868 Points -1%
Dell Pro 14 Premium
Intel Core Ultra 7 268V
10653 (10400min - 10653.5max) Points -3%
Lenovo ThinkPad X1 Carbon Gen 13 21NS0010GE
Intel Core Ultra 7 258V
10471 Points -5%
Dynabook Portege Z40L-N
Intel Core Ultra 7 258V
7920 (7320.74min - 7920.19max) Points -28%
Cinebench R23 / Single Core
Asus ExpertBook Ultra B9406CAA
Intel Core Ultra X7 358H
2079 Points +10%
Lenovo ThinkPad T14s Gen 7 21YW0022GE
AMD Ryzen AI 7 PRO 450
2010 Points +6%
Dell Pro 14 Premium
Intel Core Ultra 7 268V
1952 Points +3%
Lenovo ThinkPad X1 Carbon Gen 13 21NS0010GE
Intel Core Ultra 7 258V
1918 Points +1%
Lenovo ThinkPad X1 Carbon Gen 14 21V70075GE
Intel Core Ultra 5 325
1892 Points
HP EliteBook X G1a 14 AI
AMD Ryzen AI 9 HX PRO 375
1884 Points 0%
Moyenne Intel Core Ultra 5 325
  (1797 - 1911, n=4)
1874 Points -1%
Dynabook Portege Z40L-N
Intel Core Ultra 7 258V
1810 Points -4%
Lenovo ThinkPad X1 Carbon Gen 13 21NX008PGE
Intel Core Ultra 5 225U
1732 Points -8%
Moyenne de la classe Office
  (708 - 2130, n=76, 2 dernières années)
1697 Points -10%
Cinebench R20 / CPU (Multi Core)
HP EliteBook X G1a 14 AI
AMD Ryzen AI 9 HX PRO 375
8086 Points +90%
Asus ExpertBook Ultra B9406CAA
Intel Core Ultra X7 358H
7736 Points +82%
Lenovo ThinkPad T14s Gen 7 21YW0022GE
AMD Ryzen AI 7 PRO 450
6274 Points +48%
Lenovo ThinkPad X1 Carbon Gen 13 21NX008PGE
Intel Core Ultra 5 225U
4646 Points +9%
Moyenne de la classe Office
  (648 - 8840, n=75, 2 dernières années)
4533 Points +7%
Lenovo ThinkPad X1 Carbon Gen 14 21V70075GE
Intel Core Ultra 5 325
4250 Points
Moyenne Intel Core Ultra 5 325
  (4068 - 4254, n=4)
4203 Points -1%
Dell Pro 14 Premium
Intel Core Ultra 7 268V
4136 Points -3%
Lenovo ThinkPad X1 Carbon Gen 13 21NS0010GE
Intel Core Ultra 7 258V
4072 Points -4%
Dynabook Portege Z40L-N
Intel Core Ultra 7 258V
3130 Points -26%
Cinebench R20 / CPU (Single Core)
Lenovo ThinkPad T14s Gen 7 21YW0022GE
AMD Ryzen AI 7 PRO 450
793 Points +11%
Asus ExpertBook Ultra B9406CAA
Intel Core Ultra X7 358H
788 Points +11%
HP EliteBook X G1a 14 AI
AMD Ryzen AI 9 HX PRO 375
738 Points +4%
Dell Pro 14 Premium
Intel Core Ultra 7 268V
737 Points +3%
Lenovo ThinkPad X1 Carbon Gen 13 21NS0010GE
Intel Core Ultra 7 258V
734 Points +3%
Dynabook Portege Z40L-N
Intel Core Ultra 7 258V
717 Points +1%
Lenovo ThinkPad X1 Carbon Gen 14 21V70075GE
Intel Core Ultra 5 325
713 Points
Moyenne Intel Core Ultra 5 325
  (690 - 723, n=4)
710 Points 0%
Lenovo ThinkPad X1 Carbon Gen 13 21NX008PGE
Intel Core Ultra 5 225U
668 Points -6%
Moyenne de la classe Office
  (345 - 816, n=75, 2 dernières années)
661 Points -7%
Cinebench R15 / CPU Multi 64Bit
HP EliteBook X G1a 14 AI
AMD Ryzen AI 9 HX PRO 375
3132 (3043.45min - 3132.34max) Points +88%
Asus ExpertBook Ultra B9406CAA
Intel Core Ultra X7 358H
3039 (2802.49min - 3038.82max) Points +82%
Lenovo ThinkPad T14s Gen 7 21YW0022GE
AMD Ryzen AI 7 PRO 450
2457 (2063.03min - 2456.7max) Points +47%
Lenovo ThinkPad X1 Carbon Gen 13 21NX008PGE
Intel Core Ultra 5 225U
1909 (1754.46min - 1909.13max) Points +14%
Moyenne de la classe Office
  (250 - 3380, n=77, 2 dernières années)
1838 Points +10%
Lenovo ThinkPad X1 Carbon Gen 14 21V70075GE
Intel Core Ultra 5 325
1670 (1603.78min - 1670.43max) Points
Moyenne Intel Core Ultra 5 325
  (1567 - 1670, n=4)
1624 Points -3%
Dell Pro 14 Premium
Intel Core Ultra 7 268V
1574 (1539.35min - 1573.81max) Points -6%
Lenovo ThinkPad X1 Carbon Gen 13 21NS0010GE
Intel Core Ultra 7 258V
1571 (1177.47min - 1571.22max) Points -6%
Dynabook Portege Z40L-N
Intel Core Ultra 7 258V
1280 (1084.28min - 1280.25max) Points -23%
Cinebench R15 / CPU Single 64Bit
Asus ExpertBook Ultra B9406CAA
Intel Core Ultra X7 358H
309 Points +10%
Lenovo ThinkPad X1 Carbon Gen 13 21NS0010GE
Intel Core Ultra 7 258V
294 Points +4%
Dell Pro 14 Premium
Intel Core Ultra 7 268V
293 Points +4%
Lenovo ThinkPad X1 Carbon Gen 14 21V70075GE
Intel Core Ultra 5 325
282 Points
HP EliteBook X G1a 14 AI
AMD Ryzen AI 9 HX PRO 375
280 Points -1%
Dynabook Portege Z40L-N
Intel Core Ultra 7 258V
280 Points -1%
Moyenne Intel Core Ultra 5 325
  (264 - 282, n=4)
273 Points -3%
Moyenne de la classe Office
  (99.5 - 316, n=77, 2 dernières années)
250 Points -11%
Lenovo ThinkPad X1 Carbon Gen 13 21NX008PGE
Intel Core Ultra 5 225U
249 Points -12%
Lenovo ThinkPad T14s Gen 7 21YW0022GE
AMD Ryzen AI 7 PRO 450
220 Points -22%
Blender / v2.79 BMW27 CPU
Dynabook Portege Z40L-N
Intel Core Ultra 7 258V
448 Seconds * -45%
Lenovo ThinkPad X1 Carbon Gen 13 21NS0010GE
Intel Core Ultra 7 258V
366 Seconds * -18%
Moyenne de la classe Office
  (158 - 1940, n=76, 2 dernières années)
354 Seconds * -14%
Moyenne Intel Core Ultra 5 325
  (310 - 346, n=4)
324 Seconds * -5%
Dell Pro 14 Premium
Intel Core Ultra 7 268V
317 Seconds * -2%
Lenovo ThinkPad X1 Carbon Gen 14 21V70075GE
Intel Core Ultra 5 325
310 Seconds *
Lenovo ThinkPad X1 Carbon Gen 13 21NX008PGE
Intel Core Ultra 5 225U
284 Seconds * +8%
Lenovo ThinkPad T14s Gen 7 21YW0022GE
AMD Ryzen AI 7 PRO 450
205 Seconds * +34%
Asus ExpertBook Ultra B9406CAA
Intel Core Ultra X7 358H
175 Seconds * +44%
HP EliteBook X G1a 14 AI
AMD Ryzen AI 9 HX PRO 375
163 Seconds * +47%
7-Zip 18.03 / 7z b 4
HP EliteBook X G1a 14 AI
AMD Ryzen AI 9 HX PRO 375
76886 MIPS +112%
Asus ExpertBook Ultra B9406CAA
Intel Core Ultra X7 358H
68533 MIPS +89%
Lenovo ThinkPad T14s Gen 7 21YW0022GE
AMD Ryzen AI 7 PRO 450
57988 MIPS +60%
Lenovo ThinkPad X1 Carbon Gen 13 21NX008PGE
Intel Core Ultra 5 225U
45818 MIPS +26%
Moyenne de la classe Office
  (7098 - 76886, n=77, 2 dernières années)
43985 MIPS +21%
Dell Pro 14 Premium
Intel Core Ultra 7 268V
36654 MIPS +1%
Lenovo ThinkPad X1 Carbon Gen 13 21NS0010GE
Intel Core Ultra 7 258V
36422 MIPS +1%
Lenovo ThinkPad X1 Carbon Gen 14 21V70075GE
Intel Core Ultra 5 325
36228 MIPS
Moyenne Intel Core Ultra 5 325
  (34844 - 36228, n=4)
35631 MIPS -2%
Dynabook Portege Z40L-N
Intel Core Ultra 7 258V
28482 MIPS -21%
7-Zip 18.03 / 7z b 4 -mmt1
Asus ExpertBook Ultra B9406CAA
Intel Core Ultra X7 358H
6170 MIPS +7%
Lenovo ThinkPad T14s Gen 7 21YW0022GE
AMD Ryzen AI 7 PRO 450
5945 MIPS +4%
Lenovo ThinkPad X1 Carbon Gen 13 21NS0010GE
Intel Core Ultra 7 258V
5865 MIPS +2%
Lenovo ThinkPad X1 Carbon Gen 14 21V70075GE
Intel Core Ultra 5 325
5741 MIPS
Dell Pro 14 Premium
Intel Core Ultra 7 268V
5688 MIPS -1%
Dynabook Portege Z40L-N
Intel Core Ultra 7 258V
5668 MIPS -1%
HP EliteBook X G1a 14 AI
AMD Ryzen AI 9 HX PRO 375
5595 MIPS -3%
Moyenne Intel Core Ultra 5 325
  (5316 - 5741, n=4)
5529 MIPS -4%
Moyenne de la classe Office
  (3387 - 6469, n=77, 2 dernières années)
5423 MIPS -6%
Lenovo ThinkPad X1 Carbon Gen 13 21NX008PGE
Intel Core Ultra 5 225U
5031 MIPS -12%
Geekbench 6.7 / Multi-Core
Asus ExpertBook Ultra B9406CAA
Intel Core Ultra X7 358H
16674 Points +51%
HP EliteBook X G1a 14 AI
AMD Ryzen AI 9 HX PRO 375
14341 Points +30%
Lenovo ThinkPad T14s Gen 7 21YW0022GE
AMD Ryzen AI 7 PRO 450
13439 Points +22%
Lenovo ThinkPad X1 Carbon Gen 13 21NS0010GE
Intel Core Ultra 7 258V
11102 Points +1%
Dell Pro 14 Premium
Intel Core Ultra 7 268V
11087 Points 0%
Lenovo ThinkPad X1 Carbon Gen 14 21V70075GE
Intel Core Ultra 5 325
11038 Points
Moyenne Intel Core Ultra 5 325
  (10575 - 11088, n=5)
10928 Points -1%
Lenovo ThinkPad X1 Carbon Gen 13 21NX008PGE
Intel Core Ultra 5 225U
10497 Points -5%
Moyenne de la classe Office
  (757 - 17846, n=82, 2 dernières années)
10282 Points -7%
Dynabook Portege Z40L-N
Intel Core Ultra 7 258V
10047 Points -9%
Geekbench 6.7 / Single-Core
Lenovo ThinkPad T14s Gen 7 21YW0022GE
AMD Ryzen AI 7 PRO 450
2899 Points +11%
Asus ExpertBook Ultra B9406CAA
Intel Core Ultra X7 358H
2836 Points +8%
Dell Pro 14 Premium
Intel Core Ultra 7 268V
2822 Points +8%
Dynabook Portege Z40L-N
Intel Core Ultra 7 258V
2754 Points +5%
Lenovo ThinkPad X1 Carbon Gen 13 21NS0010GE
Intel Core Ultra 7 258V
2730 Points +4%
HP EliteBook X G1a 14 AI
AMD Ryzen AI 9 HX PRO 375
2647 Points +1%
Lenovo ThinkPad X1 Carbon Gen 14 21V70075GE
Intel Core Ultra 5 325
2620 Points
Moyenne Intel Core Ultra 5 325
  (2562 - 2622, n=5)
2590 Points -1%
Moyenne de la classe Office
  (462 - 2988, n=83, 2 dernières années)
2442 Points -7%
Lenovo ThinkPad X1 Carbon Gen 13 21NX008PGE
Intel Core Ultra 5 225U
2355 Points -10%
Geekbench 5.5 / Multi-Core
Asus ExpertBook Ultra B9406CAA
Intel Core Ultra X7 358H
16929 Points +69%
HP EliteBook X G1a 14 AI
AMD Ryzen AI 9 HX PRO 375
13557 Points +36%
Lenovo ThinkPad T14s Gen 7 21YW0022GE
AMD Ryzen AI 7 PRO 450
12037 Points +20%
Lenovo ThinkPad X1 Carbon Gen 14 21V70075GE
Intel Core Ultra 5 325
9990 Points
Lenovo ThinkPad X1 Carbon Gen 13 21NX008PGE
Intel Core Ultra 5 225U
9795 Points -2%
Lenovo ThinkPad X1 Carbon Gen 13 21NS0010GE
Intel Core Ultra 7 258V
9743 Points -2%
Dell Pro 14 Premium
Intel Core Ultra 7 268V
9634 Points -4%
Moyenne Intel Core Ultra 5 325
  (9275 - 9990, n=5)
9632 Points -4%
Moyenne de la classe Office
  (1483 - 16999, n=73, 2 dernières années)
9318 Points -7%
Dynabook Portege Z40L-N
Intel Core Ultra 7 258V
9029 Points -10%
Geekbench 5.5 / Single-Core
Lenovo ThinkPad T14s Gen 7 21YW0022GE
AMD Ryzen AI 7 PRO 450
2148 Points +10%
Asus ExpertBook Ultra B9406CAA
Intel Core Ultra X7 358H
2116 Points +8%
Lenovo ThinkPad X1 Carbon Gen 13 21NS0010GE
Intel Core Ultra 7 258V
2046 Points +4%
Dell Pro 14 Premium
Intel Core Ultra 7 268V
2023 Points +3%
Dynabook Portege Z40L-N
Intel Core Ultra 7 258V
2010 Points +3%
Lenovo ThinkPad X1 Carbon Gen 14 21V70075GE
Intel Core Ultra 5 325
1959 Points
Moyenne Intel Core Ultra 5 325
  (1859 - 1959, n=5)
1929 Points -2%
HP EliteBook X G1a 14 AI
AMD Ryzen AI 9 HX PRO 375
1919 Points -2%
Moyenne de la classe Office
  (811 - 2175, n=73, 2 dernières années)
1812 Points -8%
Lenovo ThinkPad X1 Carbon Gen 13 21NX008PGE
Intel Core Ultra 5 225U
1744 Points -11%
HWBOT x265 Benchmark v2.2 / 4k Preset
Asus ExpertBook Ultra B9406CAA
Intel Core Ultra X7 358H
23.1 fps +62%
HP EliteBook X G1a 14 AI
AMD Ryzen AI 9 HX PRO 375
20.8 fps +45%
Lenovo ThinkPad T14s Gen 7 21YW0022GE
AMD Ryzen AI 7 PRO 450
20.1 fps +41%
Lenovo ThinkPad X1 Carbon Gen 14 21V70075GE
Intel Core Ultra 5 325
14.3 fps
Moyenne Intel Core Ultra 5 325
  (13.5 - 14.3, n=4)
14 fps -2%
Dell Pro 14 Premium
Intel Core Ultra 7 268V
13.5 fps -6%
Moyenne de la classe Office
  (2.21 - 26, n=76, 2 dernières années)
13.4 fps -6%
Lenovo ThinkPad X1 Carbon Gen 13 21NX008PGE
Intel Core Ultra 5 225U
13.2 fps -8%
Lenovo ThinkPad X1 Carbon Gen 13 21NS0010GE
Intel Core Ultra 7 258V
12.6 fps -12%
Dynabook Portege Z40L-N
Intel Core Ultra 7 258V
9.72 fps -32%
LibreOffice / 20 Documents To PDF
Lenovo ThinkPad X1 Carbon Gen 13 21NX008PGE
Intel Core Ultra 5 225U
60.9 s * -40%
Moyenne de la classe Office
  (39.9 - 102.3, n=76, 2 dernières années)
57 s * -31%
HP EliteBook X G1a 14 AI
AMD Ryzen AI 9 HX PRO 375
56.4 s * -29%
Lenovo ThinkPad T14s Gen 7 21YW0022GE
AMD Ryzen AI 7 PRO 450
53.1 s * -22%
Asus ExpertBook Ultra B9406CAA
Intel Core Ultra X7 358H
51.9 s * -19%
Lenovo ThinkPad X1 Carbon Gen 13 21NS0010GE
Intel Core Ultra 7 258V
44.9 s * -3%
Dell Pro 14 Premium
Intel Core Ultra 7 268V
44.9 s * -3%
Moyenne Intel Core Ultra 5 325
  (39.9 - 48.4, n=4)
44.4 s * -2%
Lenovo ThinkPad X1 Carbon Gen 14 21V70075GE
Intel Core Ultra 5 325
43.6 s *
Dynabook Portege Z40L-N
Intel Core Ultra 7 258V
43.3 s * +1%
R Benchmark 2.5 / Overall mean
Moyenne de la classe Office
  (0.393 - 0.888, n=76, 2 dernières années)
0.521 sec * -15%
Lenovo ThinkPad X1 Carbon Gen 13 21NX008PGE
Intel Core Ultra 5 225U
0.507 sec * -12%
Dynabook Portege Z40L-N
Intel Core Ultra 7 258V
0.4795 sec * -6%
Moyenne Intel Core Ultra 5 325
  (0.4545 - 0.4657, n=4)
0.4588 sec * -1%
Lenovo ThinkPad X1 Carbon Gen 14 21V70075GE
Intel Core Ultra 5 325
0.4545 sec *
HP EliteBook X G1a 14 AI
AMD Ryzen AI 9 HX PRO 375
0.45 sec * +1%
Lenovo ThinkPad X1 Carbon Gen 13 21NS0010GE
Intel Core Ultra 7 258V
0.4457 sec * +2%
Dell Pro 14 Premium
Intel Core Ultra 7 268V
0.4349 sec * +4%
Lenovo ThinkPad T14s Gen 7 21YW0022GE
AMD Ryzen AI 7 PRO 450
0.4332 sec * +5%
Asus ExpertBook Ultra B9406CAA
Intel Core Ultra X7 358H
0.4247 sec * +7%

* ... Moindre est la valeur, meilleures sont les performances

Cinebench R15 CPU Multi 64Bit
1670 Points
Cinebench R15 OpenGL 64Bit
179.4 fps
Cinebench R15 Ref. Match 64Bit
97.8 %
Cinebench R15 CPU Single 64Bit
282 Points
Cinebench R20 CPU (Multi Core)
4250 Points
Cinebench R20 CPU (Single Core)
713 Points
Cinebench R23 Single Core
1892 Points
Cinebench R23 Multi Core
10980 Points
Cinebench 2024 CPU Single Core
113.3 Points
Cinebench 2024 CPU Multi Core
645 Points
Aide
Performance rating
HP EliteBook X G1a 14 AI -1!
AMD Ryzen AI 9 HX PRO 375, Radeon 890M
98.1 pt
Lenovo ThinkPad T14s Gen 7 21YW0022GE -1!
AMD Ryzen AI 7 PRO 450, Radeon 860M
80.9 pt
Moyenne de la classe Office
 
54.1 pt
Lenovo ThinkPad X1 Carbon Gen 13 21NX008PGE -1!
Intel Core Ultra 5 225U, Graphics 4-Core iGPU (Arrow Lake)
51.3 pt
Dell Pro 14 Premium -1!
Intel Core Ultra 7 268V, Arc 140V
48.9 pt
Lenovo ThinkPad X1 Carbon Gen 14 21V70075GE -1!
Intel Core Ultra 5 325, Intel Graphics 4 Xe3 PTL
48.7 pt
Moyenne Intel Core Ultra 5 325 -1!
 
47.5 pt
Asus ExpertBook Ultra B9406CAA -1!
Intel Core Ultra X7 358H, Arc B390 Panther Lake iGPU
44.1 pt
Dynabook Portege Z40L-N -1!
Intel Core Ultra 7 258V, Arc 140V
38.5 pt
AIDA64 / FP32 Ray-Trace
HP EliteBook X G1a 14 AI
AMD Ryzen AI 9 HX PRO 375, Radeon 890M (v6.92.6600)
31245 KRay/s +160%
Lenovo ThinkPad T14s Gen 7 21YW0022GE
AMD Ryzen AI 7 PRO 450, Radeon 860M (v8.20.8100)
24488 KRay/s +104%
Moyenne de la classe Office
  (2083 - 31245, n=83, 2 dernières années)
14033 KRay/s +17%
Dell Pro 14 Premium
Intel Core Ultra 7 268V, Arc 140V (v6.92.6600)
12549 KRay/s +4%
Asus ExpertBook Ultra B9406CAA
Intel Core Ultra X7 358H, Arc B390 Panther Lake iGPU (v6.92.6600)
12221 KRay/s +2%
Lenovo ThinkPad X1 Carbon Gen 14 21V70075GE
Intel Core Ultra 5 325, Intel Graphics 4 Xe3 PTL (v8.20.8100)
12020 KRay/s
Moyenne Intel Core Ultra 5 325
  (11016 - 12020, n=4)
11755 KRay/s -2%
Lenovo ThinkPad X1 Carbon Gen 13 21NX008PGE
Intel Core Ultra 5 225U, Graphics 4-Core iGPU (Arrow Lake) (v6.92.6600)
10317 KRay/s -14%
Dynabook Portege Z40L-N
Intel Core Ultra 7 258V, Arc 140V (v6.92.6600)
8892 KRay/s -26%
AIDA64 / FPU Julia
HP EliteBook X G1a 14 AI
AMD Ryzen AI 9 HX PRO 375, Radeon 890M (v6.92.6600)
125394 Points +104%
Lenovo ThinkPad T14s Gen 7 21YW0022GE
AMD Ryzen AI 7 PRO 450, Radeon 860M (v8.20.8100)
100434 Points +63%
Moyenne de la classe Office
  (8191 - 125394, n=83, 2 dernières années)
62705 Points +2%
Dell Pro 14 Premium
Intel Core Ultra 7 268V, Arc 140V (v6.92.6600)
61769 Points 0%
Lenovo ThinkPad X1 Carbon Gen 14 21V70075GE
Intel Core Ultra 5 325, Intel Graphics 4 Xe3 PTL (v8.20.8100)
61597 Points
Moyenne Intel Core Ultra 5 325
  (57164 - 62311, n=4)
60794 Points -1%
Lenovo ThinkPad X1 Carbon Gen 13 21NX008PGE
Intel Core Ultra 5 225U, Graphics 4-Core iGPU (Arrow Lake) (v6.92.6600)
53982 Points -12%
Dynabook Portege Z40L-N
Intel Core Ultra 7 258V, Arc 140V (v6.92.6600)
43577 Points -29%
Asus ExpertBook Ultra B9406CAA
Intel Core Ultra X7 358H, Arc B390 Panther Lake iGPU (v6.92.6600)
29930 Points -51%
AIDA64 / CPU SHA3
HP EliteBook X G1a 14 AI
AMD Ryzen AI 9 HX PRO 375, Radeon 890M (v6.92.6600)
5398 MB/s +100%
Asus ExpertBook Ultra B9406CAA
Intel Core Ultra X7 358H, Arc B390 Panther Lake iGPU (v6.92.6600)
4549 MB/s +69%
Lenovo ThinkPad T14s Gen 7 21YW0022GE
AMD Ryzen AI 7 PRO 450, Radeon 860M (v8.20.8100)
3934 MB/s +46%
Lenovo ThinkPad X1 Carbon Gen 13 21NX008PGE
Intel Core Ultra 5 225U, Graphics 4-Core iGPU (Arrow Lake) (v6.92.6600)
3068 MB/s +14%
Moyenne de la classe Office
  (433 - 5755, n=83, 2 dernières années)
2956 MB/s +10%
Dell Pro 14 Premium
Intel Core Ultra 7 268V, Arc 140V (v6.92.6600)
2737 MB/s +2%
Lenovo ThinkPad X1 Carbon Gen 14 21V70075GE
Intel Core Ultra 5 325, Intel Graphics 4 Xe3 PTL (v8.20.8100)
2694 MB/s
Moyenne Intel Core Ultra 5 325
  (2508 - 2720, n=4)
2660 MB/s -1%
Dynabook Portege Z40L-N
Intel Core Ultra 7 258V, Arc 140V (v6.92.6600)
1990 MB/s -26%
AIDA64 / CPU Queen
HP EliteBook X G1a 14 AI
AMD Ryzen AI 9 HX PRO 375, Radeon 890M (v6.92.6600)
95224 Points
Moyenne de la classe Office
  (22784 - 115197, n=67, 2 dernières années)
65943 Points
Asus ExpertBook Ultra B9406CAA
Intel Core Ultra X7 358H, Arc B390 Panther Lake iGPU (v6.92.6600)
63425 Points
Lenovo ThinkPad X1 Carbon Gen 13 21NX008PGE
Intel Core Ultra 5 225U, Graphics 4-Core iGPU (Arrow Lake) (v6.92.6600)
53793 Points
Dell Pro 14 Premium
Intel Core Ultra 7 268V, Arc 140V (v6.92.6600)
49702 Points
Dynabook Portege Z40L-N
Intel Core Ultra 7 258V, Arc 140V (v6.92.6600)
49084 Points
AIDA64 / FPU SinJulia
HP EliteBook X G1a 14 AI
AMD Ryzen AI 9 HX PRO 375, Radeon 890M (v6.92.6600)
18321 Points +316%
Lenovo ThinkPad T14s Gen 7 21YW0022GE
AMD Ryzen AI 7 PRO 450, Radeon 860M (v8.20.8100)
13684 Points +211%
Moyenne de la classe Office
  (1378 - 18321, n=83, 2 dernières années)
7847 Points +78%
Lenovo ThinkPad X1 Carbon Gen 13 21NX008PGE
Intel Core Ultra 5 225U, Graphics 4-Core iGPU (Arrow Lake) (v6.92.6600)
6157 Points +40%
Asus ExpertBook Ultra B9406CAA
Intel Core Ultra X7 358H, Arc B390 Panther Lake iGPU (v6.92.6600)
4735 Points +8%
Dell Pro 14 Premium
Intel Core Ultra 7 268V, Arc 140V (v6.92.6600)
4419 Points 0%
Moyenne Intel Core Ultra 5 325
  (4401 - 4414, n=4)
4408 Points 0%
Lenovo ThinkPad X1 Carbon Gen 14 21V70075GE
Intel Core Ultra 5 325, Intel Graphics 4 Xe3 PTL (v8.20.8100)
4401 Points
Dynabook Portege Z40L-N
Intel Core Ultra 7 258V, Arc 140V (v6.92.6600)
3822 Points -13%
AIDA64 / FPU Mandel
HP EliteBook X G1a 14 AI
AMD Ryzen AI 9 HX PRO 375, Radeon 890M (v6.92.6600)
66922 Points +105%
Lenovo ThinkPad T14s Gen 7 21YW0022GE
AMD Ryzen AI 7 PRO 450, Radeon 860M (v8.20.8100)
51669 Points +59%
Moyenne de la classe Office
  (4601 - 66922, n=83, 2 dernières années)
33043 Points +1%
Dell Pro 14 Premium
Intel Core Ultra 7 268V, Arc 140V (v6.92.6600)
32800 Points +1%
Lenovo ThinkPad X1 Carbon Gen 14 21V70075GE
Intel Core Ultra 5 325, Intel Graphics 4 Xe3 PTL (v8.20.8100)
32568 Points
Moyenne Intel Core Ultra 5 325
  (30237 - 33224, n=4)
32260 Points -1%
Lenovo ThinkPad X1 Carbon Gen 13 21NX008PGE
Intel Core Ultra 5 225U, Graphics 4-Core iGPU (Arrow Lake) (v6.92.6600)
26381 Points -19%
Dynabook Portege Z40L-N
Intel Core Ultra 7 258V, Arc 140V (v6.92.6600)
22961 Points -29%
Asus ExpertBook Ultra B9406CAA
Intel Core Ultra X7 358H, Arc B390 Panther Lake iGPU (v6.92.6600)
14716 Points -55%
AIDA64 / CPU AES
Lenovo ThinkPad T14s Gen 7 21YW0022GE
AMD Ryzen AI 7 PRO 450, Radeon 860M (v8.20.8100)
81704 MB/s +117%
HP EliteBook X G1a 14 AI
AMD Ryzen AI 9 HX PRO 375, Radeon 890M (v6.92.6600)
78226 MB/s +107%
Lenovo ThinkPad X1 Carbon Gen 13 21NX008PGE
Intel Core Ultra 5 225U, Graphics 4-Core iGPU (Arrow Lake) (v6.92.6600)
53639 MB/s +42%
Moyenne de la classe Office
  (4854 - 155900, n=83, 2 dernières années)
52868 MB/s +40%
Dell Pro 14 Premium
Intel Core Ultra 7 268V, Arc 140V (v6.92.6600)
39140 MB/s +4%
Lenovo ThinkPad X1 Carbon Gen 14 21V70075GE
Intel Core Ultra 5 325, Intel Graphics 4 Xe3 PTL (v8.20.8100)
37722 MB/s
Moyenne Intel Core Ultra 5 325
  (37348 - 37899, n=4)
37653 MB/s 0%
Dynabook Portege Z40L-N
Intel Core Ultra 7 258V, Arc 140V (v6.92.6600)
33106 MB/s -12%
Asus ExpertBook Ultra B9406CAA
Intel Core Ultra X7 358H, Arc B390 Panther Lake iGPU (v6.92.6600)
5127 MB/s -86%
AIDA64 / CPU ZLib
HP EliteBook X G1a 14 AI
AMD Ryzen AI 9 HX PRO 375, Radeon 890M (v6.92.6600)
1366 MB/s +122%
Asus ExpertBook Ultra B9406CAA
Intel Core Ultra X7 358H, Arc B390 Panther Lake iGPU (v6.92.6600)
1168 MB/s +90%
Lenovo ThinkPad T14s Gen 7 21YW0022GE
AMD Ryzen AI 7 PRO 450, Radeon 860M (v8.20.8100)
1014 MB/s +65%
Lenovo ThinkPad X1 Carbon Gen 13 21NX008PGE
Intel Core Ultra 5 225U, Graphics 4-Core iGPU (Arrow Lake) (v6.92.6600)
861 MB/s +40%
Moyenne de la classe Office
  (114.6 - 1366, n=83, 2 dernières années)
734 MB/s +20%
Dell Pro 14 Premium
Intel Core Ultra 7 268V, Arc 140V (v6.92.6600)
630 MB/s +3%
Moyenne Intel Core Ultra 5 325
  (596 - 627, n=4)
616 MB/s 0%
Lenovo ThinkPad X1 Carbon Gen 14 21V70075GE
Intel Core Ultra 5 325, Intel Graphics 4 Xe3 PTL (v8.20.8100)
614 MB/s
Dynabook Portege Z40L-N
Intel Core Ultra 7 258V, Arc 140V (v6.92.6600)
465 MB/s -24%
AIDA64 / FP64 Ray-Trace
HP EliteBook X G1a 14 AI
AMD Ryzen AI 9 HX PRO 375, Radeon 890M (v6.92.6600)
17834 KRay/s +179%
Lenovo ThinkPad T14s Gen 7 21YW0022GE
AMD Ryzen AI 7 PRO 450, Radeon 860M (v8.20.8100)
13274 KRay/s +107%
Moyenne de la classe Office
  (1109 - 17834, n=83, 2 dernières années)
7488 KRay/s +17%
Dell Pro 14 Premium
Intel Core Ultra 7 268V, Arc 140V (v6.92.6600)
6824 KRay/s +7%
Asus ExpertBook Ultra B9406CAA
Intel Core Ultra X7 358H, Arc B390 Panther Lake iGPU (v6.92.6600)
6506 KRay/s +2%
Lenovo ThinkPad X1 Carbon Gen 14 21V70075GE
Intel Core Ultra 5 325, Intel Graphics 4 Xe3 PTL (v8.20.8100)
6401 KRay/s
Moyenne Intel Core Ultra 5 325
  (5761 - 6452, n=4)
6235 KRay/s -3%
Lenovo ThinkPad X1 Carbon Gen 13 21NX008PGE
Intel Core Ultra 5 225U, Graphics 4-Core iGPU (Arrow Lake) (v6.92.6600)
5475 KRay/s -14%
Dynabook Portege Z40L-N
Intel Core Ultra 7 258V, Arc 140V (v6.92.6600)
4800 KRay/s -25%
AIDA64 / CPU PhotoWorxx
Lenovo ThinkPad X1 Carbon Gen 14 21V70075GE
Intel Core Ultra 5 325, Intel Graphics 4 Xe3 PTL (v8.20.8100)
59824 MPixel/s
Moyenne Intel Core Ultra 5 325
  (49816 - 59824, n=4)
55487 MPixel/s -7%
Dell Pro 14 Premium
Intel Core Ultra 7 268V, Arc 140V (v6.92.6600)
54608 MPixel/s -9%
Lenovo ThinkPad X1 Carbon Gen 13 21NX008PGE
Intel Core Ultra 5 225U, Graphics 4-Core iGPU (Arrow Lake) (v6.92.6600)
54368 MPixel/s -9%
HP EliteBook X G1a 14 AI
AMD Ryzen AI 9 HX PRO 375, Radeon 890M (v6.92.6600)
51197 MPixel/s -14%
Lenovo ThinkPad T14s Gen 7 21YW0022GE
AMD Ryzen AI 7 PRO 450, Radeon 860M (v8.20.8100)
46202 MPixel/s -23%
Dynabook Portege Z40L-N
Intel Core Ultra 7 258V, Arc 140V (v6.92.6600)
45635 MPixel/s -24%
Moyenne de la classe Office
  (11090 - 65229, n=83, 2 dernières années)
37815 MPixel/s -37%
Asus ExpertBook Ultra B9406CAA
Intel Core Ultra X7 358H, Arc B390 Panther Lake iGPU (v6.92.6600)
30538 MPixel/s -49%
AIDA64 / CPU CheckMate
Lenovo ThinkPad T14s Gen 7 21YW0022GE
AMD Ryzen AI 7 PRO 450, Radeon 860M (v8.20.8100)
5484 MP/s +102%
Moyenne de la classe Office
  (377 - 7017, n=15, 2 dernières années)
3300 MP/s +22%
Lenovo ThinkPad X1 Carbon Gen 14 21V70075GE
Intel Core Ultra 5 325, Intel Graphics 4 Xe3 PTL (v8.20.8100)
2716 MP/s
Moyenne Intel Core Ultra 5 325
  (2632 - 2730, n=4)
2680 MP/s -1%

Systèmes et périphériques de stockage

SSD M.2-2280
SSD M.2-2280

Le X1 Carbon Gen 14 est un système très réactif et les tests de performances ne révèlent aucun goulot d'étranglement. Notre modèle est livré uniquement avec un SSD Samsung de 512 Go (387 Go d'espace libre, PCIe 4.0), mais il offre des débits de transfert excellents et stables. L'emplacement prend également en charge les SSD PCIe 5.0 plus rapides, et Lenovo propose des disques plus performants lors de la configuration.

Performance rating: Percent
PCMark 10: Score | Essentials | Productivity | Digital Content Creation
CrossMark: Overall | Productivity | Creativity | Responsiveness
WebXPRT 3: Overall
WebXPRT 4: Overall
Mozilla Kraken 1.1: Total
Performance rating
Asus ExpertBook Ultra B9406CAA
Arc B390 Panther Lake iGPU, Ultra X7 358H, Samsung PM9E1 MZVLC2T0HBLD
89.8 pt
Lenovo ThinkPad T14s Gen 7 21YW0022GE
Radeon 860M, Ryzen AI 7 PRO 450, Micron 2650 MTFDKBA512TGW
85.8 pt
HP EliteBook X G1a 14 AI
Radeon 890M, Ryzen AI 9 HX PRO 375, Kioxia XG8 KXG80ZNV1T02
79.6 pt
Dell Pro 14 Premium
Arc 140V, Core Ultra 7 268V, Kioxia BG6 KBG6AZNV1T02
79.4 pt
Moyenne Intel Core Ultra 5 325, Intel Graphics 4 Xe3 Panther Lake iGPU
 
79.3 pt
Lenovo ThinkPad X1 Carbon Gen 14 21V70075GE
Intel Graphics 4 Xe3 PTL, Ultra 5 325, Samsung PM9C1b MZVL8512HFLU-00BLL
78.7 pt
Lenovo ThinkPad X1 Carbon Gen 13 21NS0010GE -1!
Arc 140V, Core Ultra 7 258V, SK hynix PCB01 HFS001TFM9X179N GL
76.9 pt
Dynabook Portege Z40L-N
Arc 140V, Core Ultra 7 258V, Phison C-E80T001T2-P03D54E27T
75.1 pt
Moyenne de la classe Office
 
69.3 pt
Lenovo ThinkPad X1 Carbon Gen 13 21NX008PGE
Graphics 4-Core iGPU (Arrow Lake), Ultra 5 225U, Samsung PM9E1 MZVLC512HFJD
68.2 pt
PCMark 10 / Score
Asus ExpertBook Ultra B9406CAA
Arc B390 Panther Lake iGPU, Ultra X7 358H, Samsung PM9E1 MZVLC2T0HBLD
9298 Points +21%
Lenovo ThinkPad T14s Gen 7 21YW0022GE
Radeon 860M, Ryzen AI 7 PRO 450, Micron 2650 MTFDKBA512TGW
8180 Points +6%
Lenovo ThinkPad X1 Carbon Gen 14 21V70075GE
Intel Graphics 4 Xe3 PTL, Ultra 5 325, Samsung PM9C1b MZVL8512HFLU-00BLL
7709 Points
Moyenne Intel Core Ultra 5 325, Intel Graphics 4 Xe3 Panther Lake iGPU
  (7532 - 7762, n=4)
7665 Points -1%
HP EliteBook X G1a 14 AI
Radeon 890M, Ryzen AI 9 HX PRO 375, Kioxia XG8 KXG80ZNV1T02
7578 Points -2%
Dell Pro 14 Premium
Arc 140V, Core Ultra 7 268V, Kioxia BG6 KBG6AZNV1T02
7166 Points -7%
Lenovo ThinkPad X1 Carbon Gen 13 21NS0010GE
Arc 140V, Core Ultra 7 258V, SK hynix PCB01 HFS001TFM9X179N GL
7066 Points -8%
Dynabook Portege Z40L-N
Arc 140V, Core Ultra 7 258V, Phison C-E80T001T2-P03D54E27T
6842 Points -11%
Moyenne de la classe Office
  (2601 - 9298, n=68, 2 dernières années)
6626 Points -14%
Lenovo ThinkPad X1 Carbon Gen 13 21NX008PGE
Graphics 4-Core iGPU (Arrow Lake), Ultra 5 225U, Samsung PM9E1 MZVLC512HFJD
6204 Points -20%
PCMark 10 / Essentials
Lenovo ThinkPad T14s Gen 7 21YW0022GE
Radeon 860M, Ryzen AI 7 PRO 450, Micron 2650 MTFDKBA512TGW
11208 Points +13%
HP EliteBook X G1a 14 AI
Radeon 890M, Ryzen AI 9 HX PRO 375, Kioxia XG8 KXG80ZNV1T02
10962 Points +10%
Asus ExpertBook Ultra B9406CAA
Arc B390 Panther Lake iGPU, Ultra X7 358H, Samsung PM9E1 MZVLC2T0HBLD
10811 Points +9%
Lenovo ThinkPad X1 Carbon Gen 13 21NS0010GE
Arc 140V, Core Ultra 7 258V, SK hynix PCB01 HFS001TFM9X179N GL
10538 Points +6%
Dell Pro 14 Premium
Arc 140V, Core Ultra 7 268V, Kioxia BG6 KBG6AZNV1T02
10465 Points +5%
Dynabook Portege Z40L-N
Arc 140V, Core Ultra 7 258V, Phison C-E80T001T2-P03D54E27T
10288 Points +4%
Moyenne Intel Core Ultra 5 325, Intel Graphics 4 Xe3 Panther Lake iGPU
  (9939 - 10402, n=4)
10206 Points +3%
Lenovo ThinkPad X1 Carbon Gen 13 21NX008PGE
Graphics 4-Core iGPU (Arrow Lake), Ultra 5 225U, Samsung PM9E1 MZVLC512HFJD
10061 Points +1%
Moyenne de la classe Office
  (3245 - 11594, n=68, 2 dernières années)
10034 Points +1%
Lenovo ThinkPad X1 Carbon Gen 14 21V70075GE
Intel Graphics 4 Xe3 PTL, Ultra 5 325, Samsung PM9C1b MZVL8512HFLU-00BLL
9939 Points
PCMark 10 / Productivity
Asus ExpertBook Ultra B9406CAA
Arc B390 Panther Lake iGPU, Ultra X7 358H, Samsung PM9E1 MZVLC2T0HBLD
14899 Points +7%
Lenovo ThinkPad T14s Gen 7 21YW0022GE
Radeon 860M, Ryzen AI 7 PRO 450, Micron 2650 MTFDKBA512TGW
14067 Points +1%
Lenovo ThinkPad X1 Carbon Gen 14 21V70075GE
Intel Graphics 4 Xe3 PTL, Ultra 5 325, Samsung PM9C1b MZVL8512HFLU-00BLL
13901 Points
Moyenne Intel Core Ultra 5 325, Intel Graphics 4 Xe3 Panther Lake iGPU
  (12413 - 13960, n=4)
13293 Points -4%
Moyenne de la classe Office
  (5336 - 17243, n=68, 2 dernières années)
9819 Points -29%
HP EliteBook X G1a 14 AI
Radeon 890M, Ryzen AI 9 HX PRO 375, Kioxia XG8 KXG80ZNV1T02
9701 Points -30%
Dynabook Portege Z40L-N
Arc 140V, Core Ultra 7 258V, Phison C-E80T001T2-P03D54E27T
9477 Points -32%
Dell Pro 14 Premium
Arc 140V, Core Ultra 7 268V, Kioxia BG6 KBG6AZNV1T02
9206 Points -34%
Lenovo ThinkPad X1 Carbon Gen 13 21NS0010GE
Arc 140V, Core Ultra 7 258V, SK hynix PCB01 HFS001TFM9X179N GL
9079 Points -35%
Lenovo ThinkPad X1 Carbon Gen 13 21NX008PGE
Graphics 4-Core iGPU (Arrow Lake), Ultra 5 225U, Samsung PM9E1 MZVLC512HFJD
8623 Points -38%
PCMark 10 / Digital Content Creation
Asus ExpertBook Ultra B9406CAA
Arc B390 Panther Lake iGPU, Ultra X7 358H, Samsung PM9E1 MZVLC2T0HBLD
13541 Points +50%
HP EliteBook X G1a 14 AI
Radeon 890M, Ryzen AI 9 HX PRO 375, Kioxia XG8 KXG80ZNV1T02
11108 Points +23%
Dell Pro 14 Premium
Arc 140V, Core Ultra 7 268V, Kioxia BG6 KBG6AZNV1T02
10366 Points +15%
Lenovo ThinkPad X1 Carbon Gen 13 21NS0010GE
Arc 140V, Core Ultra 7 258V, SK hynix PCB01 HFS001TFM9X179N GL
10008 Points +11%
Lenovo ThinkPad T14s Gen 7 21YW0022GE
Radeon 860M, Ryzen AI 7 PRO 450, Micron 2650 MTFDKBA512TGW
9424 Points +5%
Moyenne Intel Core Ultra 5 325, Intel Graphics 4 Xe3 Panther Lake iGPU
  (8963 - 9133, n=4)
9018 Points 0%
Lenovo ThinkPad X1 Carbon Gen 14 21V70075GE
Intel Graphics 4 Xe3 PTL, Ultra 5 325, Samsung PM9C1b MZVL8512HFLU-00BLL
8998 Points
Dynabook Portege Z40L-N
Arc 140V, Core Ultra 7 258V, Phison C-E80T001T2-P03D54E27T
8914 Points -1%
Moyenne de la classe Office
  (2049 - 13541, n=68, 2 dernières années)
8221 Points -9%
Lenovo ThinkPad X1 Carbon Gen 13 21NX008PGE
Graphics 4-Core iGPU (Arrow Lake), Ultra 5 225U, Samsung PM9E1 MZVLC512HFJD
7471 Points -17%
CrossMark / Overall
Asus ExpertBook Ultra B9406CAA
Arc B390 Panther Lake iGPU, Ultra X7 358H, Samsung PM9E1 MZVLC2T0HBLD
1884 Points +12%
Lenovo ThinkPad T14s Gen 7 21YW0022GE
Radeon 860M, Ryzen AI 7 PRO 450, Micron 2650 MTFDKBA512TGW
1803 Points +8%
Dell Pro 14 Premium
Arc 140V, Core Ultra 7 268V, Kioxia BG6 KBG6AZNV1T02
1746 Points +4%
Lenovo ThinkPad X1 Carbon Gen 13 21NS0010GE
Arc 140V, Core Ultra 7 258V, SK hynix PCB01 HFS001TFM9X179N GL
1737 Points +4%
Moyenne Intel Core Ultra 5 325, Intel Graphics 4 Xe3 Panther Lake iGPU
  (1666 - 1772, n=3)
1704 Points +2%
HP EliteBook X G1a 14 AI
Radeon 890M, Ryzen AI 9 HX PRO 375, Kioxia XG8 KXG80ZNV1T02
1685 Points +1%
Lenovo ThinkPad X1 Carbon Gen 14 21V70075GE
Intel Graphics 4 Xe3 PTL, Ultra 5 325, Samsung PM9C1b MZVL8512HFLU-00BLL
1675 Points
Dynabook Portege Z40L-N
Arc 140V, Core Ultra 7 258V, Phison C-E80T001T2-P03D54E27T
1634 Points -2%
Lenovo ThinkPad X1 Carbon Gen 13 21NX008PGE
Graphics 4-Core iGPU (Arrow Lake), Ultra 5 225U, Samsung PM9E1 MZVLC512HFJD
1584 Points -5%
Moyenne de la classe Office
  (381 - 2010, n=75, 2 dernières années)
1504 Points -10%
CrossMark / Productivity
Lenovo ThinkPad T14s Gen 7 21YW0022GE
Radeon 860M, Ryzen AI 7 PRO 450, Micron 2650 MTFDKBA512TGW
1760 Points +7%
Dell Pro 14 Premium
Arc 140V, Core Ultra 7 268V, Kioxia BG6 KBG6AZNV1T02
1684 Points +2%
Asus ExpertBook Ultra B9406CAA
Arc B390 Panther Lake iGPU, Ultra X7 358H, Samsung PM9E1 MZVLC2T0HBLD
1678 Points +2%
Lenovo ThinkPad X1 Carbon Gen 13 21NS0010GE
Arc 140V, Core Ultra 7 258V, SK hynix PCB01 HFS001TFM9X179N GL
1670 Points +1%
Lenovo ThinkPad X1 Carbon Gen 14 21V70075GE
Intel Graphics 4 Xe3 PTL, Ultra 5 325, Samsung PM9C1b MZVL8512HFLU-00BLL
1652 Points
Moyenne Intel Core Ultra 5 325, Intel Graphics 4 Xe3 Panther Lake iGPU
  (1581 - 1715, n=3)
1649 Points 0%
Dynabook Portege Z40L-N
Arc 140V, Core Ultra 7 258V, Phison C-E80T001T2-P03D54E27T
1594 Points -4%
HP EliteBook X G1a 14 AI
Radeon 890M, Ryzen AI 9 HX PRO 375, Kioxia XG8 KXG80ZNV1T02
1554 Points -6%
Lenovo ThinkPad X1 Carbon Gen 13 21NX008PGE
Graphics 4-Core iGPU (Arrow Lake), Ultra 5 225U, Samsung PM9E1 MZVLC512HFJD
1509 Points -9%
Moyenne de la classe Office
  (464 - 1880, n=75, 2 dernières années)
1452 Points -12%
CrossMark / Creativity
Asus ExpertBook Ultra B9406CAA
Arc B390 Panther Lake iGPU, Ultra X7 358H, Samsung PM9E1 MZVLC2T0HBLD
2241 Points +28%
Dell Pro 14 Premium
Arc 140V, Core Ultra 7 268V, Kioxia BG6 KBG6AZNV1T02
1992 Points +13%
Lenovo ThinkPad X1 Carbon Gen 13 21NS0010GE
Arc 140V, Core Ultra 7 258V, SK hynix PCB01 HFS001TFM9X179N GL
1971 Points +12%
HP EliteBook X G1a 14 AI
Radeon 890M, Ryzen AI 9 HX PRO 375, Kioxia XG8 KXG80ZNV1T02
1957 Points +11%
Moyenne Intel Core Ultra 5 325, Intel Graphics 4 Xe3 Panther Lake iGPU
  (1756 - 1917, n=3)
1854 Points +6%
Lenovo ThinkPad T14s Gen 7 21YW0022GE
Radeon 860M, Ryzen AI 7 PRO 450, Micron 2650 MTFDKBA512TGW
1841 Points +5%
Dynabook Portege Z40L-N
Arc 140V, Core Ultra 7 258V, Phison C-E80T001T2-P03D54E27T
1820 Points +4%
Lenovo ThinkPad X1 Carbon Gen 13 21NX008PGE
Graphics 4-Core iGPU (Arrow Lake), Ultra 5 225U, Samsung PM9E1 MZVLC512HFJD
1759 Points 0%
Lenovo ThinkPad X1 Carbon Gen 14 21V70075GE
Intel Graphics 4 Xe3 PTL, Ultra 5 325, Samsung PM9C1b MZVL8512HFLU-00BLL
1756 Points
Moyenne de la classe Office
  (319 - 2361, n=75, 2 dernières années)
1657 Points -6%
CrossMark / Responsiveness
Lenovo ThinkPad T14s Gen 7 21YW0022GE
Radeon 860M, Ryzen AI 7 PRO 450, Micron 2650 MTFDKBA512TGW
1820 Points +20%
Asus ExpertBook Ultra B9406CAA
Arc B390 Panther Lake iGPU, Ultra X7 358H, Samsung PM9E1 MZVLC2T0HBLD
1585 Points +5%
Lenovo ThinkPad X1 Carbon Gen 14 21V70075GE
Intel Graphics 4 Xe3 PTL, Ultra 5 325, Samsung PM9C1b MZVL8512HFLU-00BLL
1511 Points
Moyenne Intel Core Ultra 5 325, Intel Graphics 4 Xe3 Panther Lake iGPU
  (1338 - 1544, n=3)
1464 Points -3%
HP EliteBook X G1a 14 AI
Radeon 890M, Ryzen AI 9 HX PRO 375, Kioxia XG8 KXG80ZNV1T02
1371 Points -9%
Lenovo ThinkPad X1 Carbon Gen 13 21NX008PGE
Graphics 4-Core iGPU (Arrow Lake), Ultra 5 225U, Samsung PM9E1 MZVLC512HFJD
1339 Points -11%
Lenovo ThinkPad X1 Carbon Gen 13 21NS0010GE
Arc 140V, Core Ultra 7 258V, SK hynix PCB01 HFS001TFM9X179N GL
1338 Points -11%
Dell Pro 14 Premium
Arc 140V, Core Ultra 7 268V, Kioxia BG6 KBG6AZNV1T02
1309 Points -13%
Dynabook Portege Z40L-N
Arc 140V, Core Ultra 7 258V, Phison C-E80T001T2-P03D54E27T
1272 Points -16%
Moyenne de la classe Office
  (360 - 1820, n=75, 2 dernières années)
1265 Points -16%
WebXPRT 3 / Overall
Lenovo ThinkPad T14s Gen 7 21YW0022GE
Radeon 860M, Ryzen AI 7 PRO 450, Micron 2650 MTFDKBA512TGW
331 Points +12%
HP EliteBook X G1a 14 AI
Radeon 890M, Ryzen AI 9 HX PRO 375, Kioxia XG8 KXG80ZNV1T02
328 Points +11%
Dell Pro 14 Premium
Arc 140V, Core Ultra 7 268V, Kioxia BG6 KBG6AZNV1T02
317 Points +7%
Dynabook Portege Z40L-N
Arc 140V, Core Ultra 7 258V, Phison C-E80T001T2-P03D54E27T
304 Points +3%
Asus ExpertBook Ultra B9406CAA
Arc B390 Panther Lake iGPU, Ultra X7 358H, Samsung PM9E1 MZVLC2T0HBLD
304 Points +3%
Moyenne Intel Core Ultra 5 325, Intel Graphics 4 Xe3 Panther Lake iGPU
  (282 - 312, n=4)
299 Points +1%
Lenovo ThinkPad X1 Carbon Gen 14 21V70075GE
Intel Graphics 4 Xe3 PTL, Ultra 5 325, Samsung PM9C1b MZVL8512HFLU-00BLL
295 Points
Moyenne de la classe Office
  (129.9 - 444, n=77, 2 dernières années)
286 Points -3%
Lenovo ThinkPad X1 Carbon Gen 13 21NX008PGE
Graphics 4-Core iGPU (Arrow Lake), Ultra 5 225U, Samsung PM9E1 MZVLC512HFJD
262 Points -11%
WebXPRT 4 / Overall
Dell Pro 14 Premium
Arc 140V, Core Ultra 7 268V, Kioxia BG6 KBG6AZNV1T02
292 Points +9%
Lenovo ThinkPad X1 Carbon Gen 13 21NS0010GE
Arc 140V, Core Ultra 7 258V, SK hynix PCB01 HFS001TFM9X179N GL
286 Points +6%
Asus ExpertBook Ultra B9406CAA
Arc B390 Panther Lake iGPU, Ultra X7 358H, Samsung PM9E1 MZVLC2T0HBLD
279 Points +4%
Dynabook Portege Z40L-N
Arc 140V, Core Ultra 7 258V, Phison C-E80T001T2-P03D54E27T
277 Points +3%
Moyenne Intel Core Ultra 5 325, Intel Graphics 4 Xe3 Panther Lake iGPU
  (267 - 276, n=4)
271 Points +1%
Lenovo ThinkPad T14s Gen 7 21YW0022GE
Radeon 860M, Ryzen AI 7 PRO 450, Micron 2650 MTFDKBA512TGW
270 Points 0%
Lenovo ThinkPad X1 Carbon Gen 14 21V70075GE
Intel Graphics 4 Xe3 PTL, Ultra 5 325, Samsung PM9C1b MZVL8512HFLU-00BLL
269 Points
HP EliteBook X G1a 14 AI
Radeon 890M, Ryzen AI 9 HX PRO 375, Kioxia XG8 KXG80ZNV1T02
262 Points -3%
Moyenne de la classe Office
  (104.2 - 313, n=77, 2 dernières années)
240 Points -11%
Lenovo ThinkPad X1 Carbon Gen 13 21NX008PGE
Graphics 4-Core iGPU (Arrow Lake), Ultra 5 225U, Samsung PM9E1 MZVLC512HFJD
232 Points -14%
Mozilla Kraken 1.1 / Total
Lenovo ThinkPad X1 Carbon Gen 13 21NX008PGE
Graphics 4-Core iGPU (Arrow Lake), Ultra 5 225U, Samsung PM9E1 MZVLC512HFJD
571 ms * -10%
Moyenne de la classe Office
  (391 - 1297, n=78, 2 dernières années)
565 ms * -9%
Lenovo ThinkPad X1 Carbon Gen 14 21V70075GE
Intel Graphics 4 Xe3 PTL, Ultra 5 325, Samsung PM9C1b MZVL8512HFLU-00BLL
517 ms *
Moyenne Intel Core Ultra 5 325, Intel Graphics 4 Xe3 Panther Lake iGPU
  (492 - 517, n=4)
502 ms * +3%
Dynabook Portege Z40L-N
Arc 140V, Core Ultra 7 258V, Phison C-E80T001T2-P03D54E27T
481 ms * +7%
Lenovo ThinkPad X1 Carbon Gen 13 21NS0010GE
Arc 140V, Core Ultra 7 258V, SK hynix PCB01 HFS001TFM9X179N GL
468 ms * +9%
HP EliteBook X G1a 14 AI
Radeon 890M, Ryzen AI 9 HX PRO 375, Kioxia XG8 KXG80ZNV1T02
460 ms * +11%
Dell Pro 14 Premium
Arc 140V, Core Ultra 7 268V, Kioxia BG6 KBG6AZNV1T02
460 ms * +11%
Asus ExpertBook Ultra B9406CAA
Arc B390 Panther Lake iGPU, Ultra X7 358H, Samsung PM9E1 MZVLC2T0HBLD
449 ms * +13%
Lenovo ThinkPad T14s Gen 7 21YW0022GE
Radeon 860M, Ryzen AI 7 PRO 450, Micron 2650 MTFDKBA512TGW
446 ms * +14%

* ... Moindre est la valeur, meilleures sont les performances

PCMark 10 Score
7709 points
Aide
AIDA64 / Memory Copy
Dell Pro 14 Premium
Intel Core Ultra 7 268V, Arc 140V
108195 MB/s +3%
Dynabook Portege Z40L-N
Intel Core Ultra 7 258V, Arc 140V
105320 MB/s 0%
Lenovo ThinkPad X1 Carbon Gen 14 21V70075GE
Intel Core Ultra 5 325, Intel Graphics 4 Xe3 PTL
104952 MB/s
Moyenne Intel Core Ultra 5 325
  (77379 - 104952, n=4)
93010 MB/s -11%
HP EliteBook X G1a 14 AI
AMD Ryzen AI 9 HX PRO 375, Radeon 890M
90972 MB/s -13%
Lenovo ThinkPad X1 Carbon Gen 13 21NX008PGE
Intel Core Ultra 5 225U, Graphics 4-Core iGPU (Arrow Lake)
89955 MB/s -14%
Lenovo ThinkPad T14s Gen 7 21YW0022GE
AMD Ryzen AI 7 PRO 450, Radeon 860M
87261 MB/s -17%
Moyenne de la classe Office
  (20075 - 110930, n=80, 2 dernières années)
65501 MB/s -38%
AIDA64 / Memory Read
Asus ExpertBook Ultra B9406CAA
Intel Core Ultra X7 358H, Arc B390 Panther Lake iGPU
117245 MB/s +40%
HP EliteBook X G1a 14 AI
AMD Ryzen AI 9 HX PRO 375, Radeon 890M
99980 MB/s +19%
Dell Pro 14 Premium
Intel Core Ultra 7 268V, Arc 140V
87731 MB/s +5%
Dynabook Portege Z40L-N
Intel Core Ultra 7 258V, Arc 140V
86609 MB/s +3%
Lenovo ThinkPad X1 Carbon Gen 14 21V70075GE
Intel Core Ultra 5 325, Intel Graphics 4 Xe3 PTL
83896 MB/s
Moyenne Intel Core Ultra 5 325
  (68508 - 86178, n=4)
78332 MB/s -7%
Lenovo ThinkPad X1 Carbon Gen 13 21NX008PGE
Intel Core Ultra 5 225U, Graphics 4-Core iGPU (Arrow Lake)
75257 MB/s -10%
Moyenne de la classe Office
  (10084 - 128030, n=81, 2 dernières années)
66607 MB/s -21%
Lenovo ThinkPad T14s Gen 7 21YW0022GE
AMD Ryzen AI 7 PRO 450, Radeon 860M
66186 MB/s -21%
AIDA64 / Memory Write
Asus ExpertBook Ultra B9406CAA
Intel Core Ultra X7 358H, Arc B390 Panther Lake iGPU
119858 MB/s +11%
Dell Pro 14 Premium
Intel Core Ultra 7 268V, Arc 140V
117867 MB/s +9%
Lenovo ThinkPad T14s Gen 7 21YW0022GE
AMD Ryzen AI 7 PRO 450, Radeon 860M
109442 MB/s +1%
Dynabook Portege Z40L-N
Intel Core Ultra 7 258V, Arc 140V
108842 MB/s +1%
Lenovo ThinkPad X1 Carbon Gen 14 21V70075GE
Intel Core Ultra 5 325, Intel Graphics 4 Xe3 PTL
108023 MB/s
HP EliteBook X G1a 14 AI
AMD Ryzen AI 9 HX PRO 375, Radeon 890M
101681 MB/s -6%
Moyenne Intel Core Ultra 5 325
  (77837 - 108023, n=4)
96671 MB/s -11%
Moyenne de la classe Office
  (20073 - 119858, n=81, 2 dernières années)
69566 MB/s -36%
Lenovo ThinkPad X1 Carbon Gen 13 21NX008PGE
Intel Core Ultra 5 225U, Graphics 4-Core iGPU (Arrow Lake)
69271 MB/s -36%
AIDA64 / Memory Latency
Lenovo ThinkPad X1 Carbon Gen 13 21NX008PGE
Intel Core Ultra 5 225U, Graphics 4-Core iGPU (Arrow Lake)
134.2 ns * -36%
HP EliteBook X G1a 14 AI
AMD Ryzen AI 9 HX PRO 375, Radeon 890M
128.7 ns * -31%
Lenovo ThinkPad T14s Gen 7 21YW0022GE
AMD Ryzen AI 7 PRO 450, Radeon 860M
123.8 ns * -26%
Moyenne Intel Core Ultra 5 325
  (98.5 - 114.1, n=4)
105.8 ns * -7%
Moyenne de la classe Office
  (7.6 - 162.9, n=76, 2 dernières années)
104.7 ns * -6%
Dell Pro 14 Premium
Intel Core Ultra 7 268V, Arc 140V
101.5 ns * -3%
Dynabook Portege Z40L-N
Intel Core Ultra 7 258V, Arc 140V
101.1 ns * -3%
Lenovo ThinkPad X1 Carbon Gen 14 21V70075GE
Intel Core Ultra 5 325, Intel Graphics 4 Xe3 PTL
98.5 ns *

* ... Moindre est la valeur, meilleures sont les performances

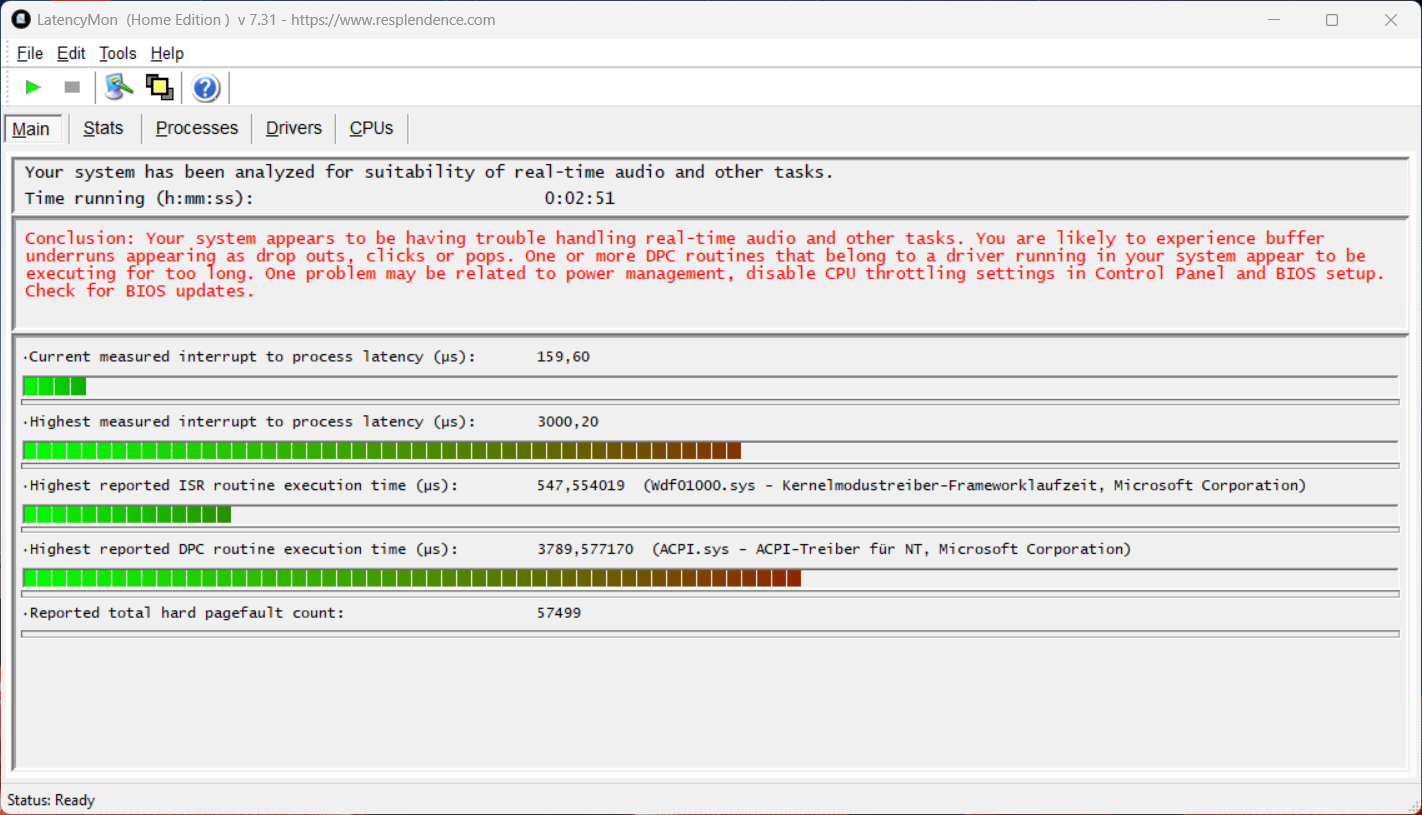
LatencyMon - Présentation générale
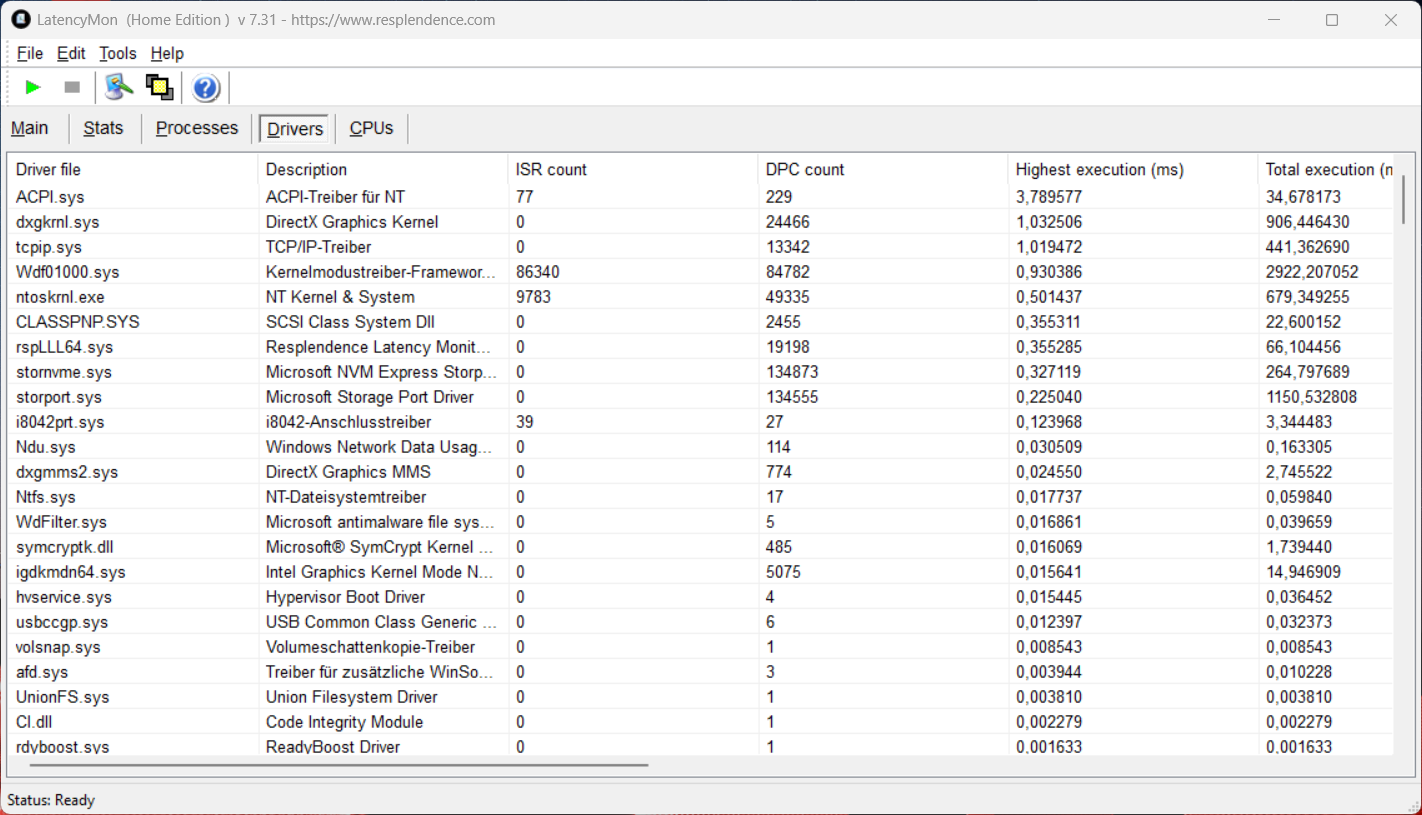
LatencyMon - Pilotes
DPC Latencies / LatencyMon - interrupt to process latency (max), Web, Youtube, Prime95
Dell Pro 14 Premium
Arc 140V, Core Ultra 7 268V, Kioxia BG6 KBG6AZNV1T02
5706.7 μs * -90%
Moyenne de la classe Office
  (365 - 98089, n=63, 2 dernières années)
4042 μs * -35%
Lenovo ThinkPad X1 Carbon Gen 14 21V70075GE
Intel Graphics 4 Xe3 PTL, Ultra 5 325, Samsung PM9C1b MZVL8512HFLU-00BLL
3000.2 μs *
Lenovo ThinkPad T14s Gen 7 21YW0022GE
Radeon 860M, Ryzen AI 7 PRO 450, Micron 2650 MTFDKBA512TGW
2926.1 μs * +2%
Lenovo ThinkPad X1 Carbon Gen 13 21NX008PGE
Graphics 4-Core iGPU (Arrow Lake), Ultra 5 225U, Samsung PM9E1 MZVLC512HFJD
1520.8 μs * +49%
Dynabook Portege Z40L-N
Arc 140V, Core Ultra 7 258V, Phison C-E80T001T2-P03D54E27T
1250 μs * +58%
HP EliteBook X G1a 14 AI
Radeon 890M, Ryzen AI 9 HX PRO 375, Kioxia XG8 KXG80ZNV1T02
526.3 μs * +82%
Asus ExpertBook Ultra B9406CAA
Arc B390 Panther Lake iGPU, Ultra X7 358H, Samsung PM9E1 MZVLC2T0HBLD
398 μs * +87%

* ... Moindre est la valeur, meilleures sont les performances

Samsung PM9C1b MZVL8512HFLU-00BLL
CDM 5/6 Read Seq Q32T1: 6900 MB/s
CDM 5/6 Write Seq Q32T1: 5762 MB/s
CDM 5/6 Read 4K Q32T1: 447 MB/s
CDM 5/6 Write 4K Q32T1: 445 MB/s
CDM 5/6 Read 4K: 66.6 MB/s
CDM 5/6 Write 4K: 136.8 MB/s
CDM 6 Write 4K Q8T8: 499 MB/s
CDM 6 Read 4K Q8T8: 748 MB/s
Drive Performance rating - Percent
Lenovo ThinkPad T14s Gen 7 21YW0022GE
Micron 2650 MTFDKBA512TGW
83.3 pt
Asus ExpertBook Ultra B9406CAA
Samsung PM9E1 MZVLC2T0HBLD
71.6 pt
Lenovo ThinkPad X1 Carbon Gen 13 21NX008PGE
Samsung PM9E1 MZVLC512HFJD
58.4 pt
Moyenne Samsung PM9C1b MZVL8512HFLU-00BLL
 
54.2 pt
Lenovo ThinkPad X1 Carbon Gen 14 21V70075GE
Samsung PM9C1b MZVL8512HFLU-00BLL
53.9 pt
HP EliteBook X G1a 14 AI
Kioxia XG8 KXG80ZNV1T02
52.7 pt
Moyenne de la classe Office
 
50.4 pt
Dynabook Portege Z40L-N
Phison C-E80T001T2-P03D54E27T
48.7 pt
Dell Pro 14 Premium
Kioxia BG6 KBG6AZNV1T02
40 pt
DiskSpd
seq read
Asus ExpertBook Ultra B9406CAA
Samsung PM9E1 MZVLC2T0HBLD
5202 (5000.31min - 5202.2max) MB/s +61%
Lenovo ThinkPad T14s Gen 7 21YW0022GE
Micron 2650 MTFDKBA512TGW
4665 (4580.04min - 4665.32max) MB/s +45%
Lenovo ThinkPad X1 Carbon Gen 13 21NX008PGE
Samsung PM9E1 MZVLC512HFJD
3959 (3874.28min - 3958.58max) MB/s +23%
HP EliteBook X G1a 14 AI
Kioxia XG8 KXG80ZNV1T02
3522 (3482.28min - 3522.04max) MB/s +9%
Dynabook Portege Z40L-N
Phison C-E80T001T2-P03D54E27T
3357 (3282.88min - 3356.7max) MB/s +4%
Lenovo ThinkPad X1 Carbon Gen 14 21V70075GE
Samsung PM9C1b MZVL8512HFLU-00BLL
3223 (3130.84min - 3223.17max) MB/s
Moyenne Samsung PM9C1b MZVL8512HFLU-00BLL
  (2568 - 3642, n=6)
3053 MB/s -5%
Moyenne de la classe Office
  (1148 - 5202, n=75, 2 dernières années)
2987 MB/s -7%
Dell Pro 14 Premium
Kioxia BG6 KBG6AZNV1T02
2842 (2812.74min - 2841.62max) MB/s -12%
seq write
Lenovo ThinkPad T14s Gen 7 21YW0022GE
Micron 2650 MTFDKBA512TGW
5223 (5088.01min - 5223.21max) MB/s +60%
HP EliteBook X G1a 14 AI
Kioxia XG8 KXG80ZNV1T02
3675 (3599.13min - 3675.04max) MB/s +13%
Lenovo ThinkPad X1 Carbon Gen 13 21NX008PGE
Samsung PM9E1 MZVLC512HFJD
3541 (3485.05min - 3541.25max) MB/s +8%
Moyenne Samsung PM9C1b MZVL8512HFLU-00BLL
  (2275 - 5037, n=6)
3308 MB/s +1%
Lenovo ThinkPad X1 Carbon Gen 14 21V70075GE
Samsung PM9C1b MZVL8512HFLU-00BLL
3265 (2792.78min - 3265.27max) MB/s
Moyenne de la classe Office
  (895 - 5223, n=75, 2 dernières années)
2988 MB/s -8%
Asus ExpertBook Ultra B9406CAA
Samsung PM9E1 MZVLC2T0HBLD
2975 (2363.07min - 2974.81max) MB/s -9%
Dynabook Portege Z40L-N
Phison C-E80T001T2-P03D54E27T
2665 (2352.49min - 2664.85max) MB/s -18%
Dell Pro 14 Premium
Kioxia BG6 KBG6AZNV1T02
2313 (2192.36min - 2312.74max) MB/s -29%
seq q8 t1 read
Asus ExpertBook Ultra B9406CAA
Samsung PM9E1 MZVLC2T0HBLD
14067 (11621.3min - 14067.1max) MB/s +102%
Lenovo ThinkPad X1 Carbon Gen 13 21NX008PGE
Samsung PM9E1 MZVLC512HFJD
7136 (6346.92min - 7136.18max) MB/s +3%
Dynabook Portege Z40L-N
Phison C-E80T001T2-P03D54E27T
7031 (6196.46min - 7030.69max) MB/s +1%
Lenovo ThinkPad T14s Gen 7 21YW0022GE
Micron 2650 MTFDKBA512TGW
6991 (6471.18min - 6991.07max) MB/s +1%
HP EliteBook X G1a 14 AI
Kioxia XG8 KXG80ZNV1T02
6964 (6466.85min - 6963.72max) MB/s 0%
Lenovo ThinkPad X1 Carbon Gen 14 21V70075GE
Samsung PM9C1b MZVL8512HFLU-00BLL
6949 (5380.03min - 6948.7max) MB/s
Moyenne Samsung PM9C1b MZVL8512HFLU-00BLL
  (5848 - 6973, n=6)
6593 MB/s -5%
Dell Pro 14 Premium
Kioxia BG6 KBG6AZNV1T02
6110 (5320.32min - 6110.05max) MB/s -12%
Moyenne de la classe Office
  (1781 - 14067, n=75, 2 dernières années)
5950 MB/s -14%
seq q8 t1 write
Asus ExpertBook Ultra B9406CAA
Samsung PM9E1 MZVLC2T0HBLD
9127 (8641.19min - 9127.43max) MB/s +56%
Dynabook Portege Z40L-N
Phison C-E80T001T2-P03D54E27T
6027 (5997.85min - 6026.59max) MB/s +3%
Lenovo ThinkPad X1 Carbon Gen 14 21V70075GE
Samsung PM9C1b MZVL8512HFLU-00BLL
5863 (5795.9min - 5862.8max) MB/s
Lenovo ThinkPad X1 Carbon Gen 13 21NX008PGE
Samsung PM9E1 MZVLC512HFJD
5570 (5437.94min - 5570.46max) MB/s -5%
HP EliteBook X G1a 14 AI
Kioxia XG8 KXG80ZNV1T02
5530 (5479.23min - 5530.4max) MB/s -6%
Lenovo ThinkPad T14s Gen 7 21YW0022GE
Micron 2650 MTFDKBA512TGW
5333 (5268.41min - 5333.48max) MB/s -9%
Dell Pro 14 Premium
Kioxia BG6 KBG6AZNV1T02
5279 (5231.58min - 5279.37max) MB/s -10%
Moyenne Samsung PM9C1b MZVL8512HFLU-00BLL
  (4178 - 5948, n=6)
5229 MB/s -11%
Moyenne de la classe Office
  (1369 - 9814, n=75, 2 dernières années)
4411 MB/s -25%
4k q1 t1 read
Lenovo ThinkPad T14s Gen 7 21YW0022GE
Micron 2650 MTFDKBA512TGW
87.5 (85.01min - 87.46max) MB/s +17%
Lenovo ThinkPad X1 Carbon Gen 14 21V70075GE
Samsung PM9C1b MZVL8512HFLU-00BLL
74.6 (69.99min - 74.6max) MB/s
Asus ExpertBook Ultra B9406CAA
Samsung PM9E1 MZVLC2T0HBLD
69.7 (68.02min - 69.67max) MB/s -7%
Lenovo ThinkPad X1 Carbon Gen 13 21NX008PGE
Samsung PM9E1 MZVLC512HFJD
68.2 (67.6min - 68.16max) MB/s -9%
Moyenne Samsung PM9C1b MZVL8512HFLU-00BLL
  (58.4 - 74.6, n=6)
67.3 MB/s -10%
Moyenne de la classe Office
  (6.27 - 93.1, n=75, 2 dernières années)
60.1 MB/s -19%
Dynabook Portege Z40L-N
Phison C-E80T001T2-P03D54E27T
55.1 (50.14min - 55.13max) MB/s -26%
HP EliteBook X G1a 14 AI
Kioxia XG8 KXG80ZNV1T02
51.2 (49.86min - 51.22max) MB/s -31%
Dell Pro 14 Premium
Kioxia BG6 KBG6AZNV1T02
44.1 (43.53min - 44.13max) MB/s -41%
4k q1 t1 write
Lenovo ThinkPad T14s Gen 7 21YW0022GE
Micron 2650 MTFDKBA512TGW
273 (265.84min - 273.13max) MB/s +60%
Lenovo ThinkPad X1 Carbon Gen 14 21V70075GE
Samsung PM9C1b MZVL8512HFLU-00BLL
171.1 (149.61min - 171.12max) MB/s
Moyenne Samsung PM9C1b MZVL8512HFLU-00BLL
  (121.8 - 172.6, n=6)
149.7 MB/s -13%
Moyenne de la classe Office
  (22.6 - 281, n=75, 2 dernières années)
145 MB/s -15%
Lenovo ThinkPad X1 Carbon Gen 13 21NX008PGE
Samsung PM9E1 MZVLC512HFJD
128.2 (127.5min - 128.16max) MB/s -25%
HP EliteBook X G1a 14 AI
Kioxia XG8 KXG80ZNV1T02
127.4 (124.41min - 127.43max) MB/s -26%
Asus ExpertBook Ultra B9406CAA
Samsung PM9E1 MZVLC2T0HBLD
125.3 (122.16min - 125.28max) MB/s -27%
Dynabook Portege Z40L-N
Phison C-E80T001T2-P03D54E27T
121.9 (114.98min - 121.88max) MB/s -29%
Dell Pro 14 Premium
Kioxia BG6 KBG6AZNV1T02
121.8 (119.08min - 121.81max) MB/s -29%
4k q32 t16 read
Lenovo ThinkPad T14s Gen 7 21YW0022GE
Micron 2650 MTFDKBA512TGW
3783 (3766.41min - 3783.27max) MB/s +459%
Moyenne de la classe Office
  (394 - 5684, n=75, 2 dernières années)
1186 MB/s +75%
Moyenne Samsung PM9C1b MZVL8512HFLU-00BLL
  (614 - 3510, n=6)
1158 MB/s +71%
Lenovo ThinkPad X1 Carbon Gen 13 21NX008PGE
Samsung PM9E1 MZVLC512HFJD
747 (705.56min - 747.07max) MB/s +10%
Dynabook Portege Z40L-N
Phison C-E80T001T2-P03D54E27T
745 (535.52min - 744.87max) MB/s +10%
Asus ExpertBook Ultra B9406CAA
Samsung PM9E1 MZVLC2T0HBLD
690 (639.86min - 689.58max) MB/s +2%
Lenovo ThinkPad X1 Carbon Gen 14 21V70075GE
Samsung PM9C1b MZVL8512HFLU-00BLL
677 (649.67min - 677.04max) MB/s
Dell Pro 14 Premium
Kioxia BG6 KBG6AZNV1T02
639 (624.64min - 639.07max) MB/s -6%
HP EliteBook X G1a 14 AI
Kioxia XG8 KXG80ZNV1T02
535 (525.83min - 535.33max) MB/s -21%
4k q32 t16 write
Lenovo ThinkPad T14s Gen 7 21YW0022GE
Micron 2650 MTFDKBA512TGW
3889 (3629.66min - 3889.46max) MB/s +726%
Moyenne Samsung PM9C1b MZVL8512HFLU-00BLL
  (375 - 3964, n=6)
1031 MB/s +119%
Moyenne de la classe Office
  (185.3 - 3964, n=75, 2 dernières années)
827 MB/s +76%
Lenovo ThinkPad X1 Carbon Gen 14 21V70075GE
Samsung PM9C1b MZVL8512HFLU-00BLL
471 (431.88min - 471.05max) MB/s
Dynabook Portege Z40L-N
Phison C-E80T001T2-P03D54E27T
426 (329.47min - 425.51max) MB/s -10%
Dell Pro 14 Premium
Kioxia BG6 KBG6AZNV1T02
403 (313.61min - 402.71max) MB/s -14%
Asus ExpertBook Ultra B9406CAA
Samsung PM9E1 MZVLC2T0HBLD
390 (355.81min - 389.58max) MB/s -17%
Lenovo ThinkPad X1 Carbon Gen 13 21NX008PGE
Samsung PM9E1 MZVLC512HFJD
377 (325.87min - 376.9max) MB/s -20%
HP EliteBook X G1a 14 AI
Kioxia XG8 KXG80ZNV1T02
292 (284.01min - 291.89max) MB/s -38%
AS SSD
Score Total
Lenovo ThinkPad T14s Gen 7 21YW0022GE
Micron 2650 MTFDKBA512TGW
6690 Points +83%
Asus ExpertBook Ultra B9406CAA
Samsung PM9E1 MZVLC2T0HBLD
6239 Points +71%
Lenovo ThinkPad X1 Carbon Gen 13 21NX008PGE
Samsung PM9E1 MZVLC512HFJD
4902 Points +34%
Moyenne Samsung PM9C1b MZVL8512HFLU-00BLL
  (3297 - 8479, n=6)
4708 Points +29%
HP EliteBook X G1a 14 AI
Kioxia XG8 KXG80ZNV1T02
4344 Points +19%
Moyenne de la classe Office
  (1085 - 10473, n=74, 2 dernières années)
4207 Points +15%
Lenovo ThinkPad X1 Carbon Gen 14 21V70075GE
Samsung PM9C1b MZVL8512HFLU-00BLL
3647 Points
Dynabook Portege Z40L-N
Phison C-E80T001T2-P03D54E27T
3390 Points -7%
Dell Pro 14 Premium
Kioxia BG6 KBG6AZNV1T02
3357 Points -8%
Score Read
Lenovo ThinkPad T14s Gen 7 21YW0022GE
Micron 2650 MTFDKBA512TGW
3406 Points +168%
Asus ExpertBook Ultra B9406CAA
Samsung PM9E1 MZVLC2T0HBLD
1804 Points +42%
Moyenne Samsung PM9C1b MZVL8512HFLU-00BLL
  (961 - 3047, n=6)
1500 Points +18%
Moyenne de la classe Office
  (438 - 3839, n=74, 2 dernières années)
1449 Points +14%
Lenovo ThinkPad X1 Carbon Gen 13 21NX008PGE
Samsung PM9E1 MZVLC512HFJD
1314 Points +3%
Lenovo ThinkPad X1 Carbon Gen 14 21V70075GE
Samsung PM9C1b MZVL8512HFLU-00BLL
1272 Points
Dynabook Portege Z40L-N
Phison C-E80T001T2-P03D54E27T
1169 Points -8%
Dell Pro 14 Premium
Kioxia BG6 KBG6AZNV1T02
1156 Points -9%
HP EliteBook X G1a 14 AI
Kioxia XG8 KXG80ZNV1T02
1089 Points -14%
Score Write
Asus ExpertBook Ultra B9406CAA
Samsung PM9E1 MZVLC2T0HBLD
3672 Points +104%
Lenovo ThinkPad X1 Carbon Gen 13 21NX008PGE
Samsung PM9E1 MZVLC512HFJD
2990 Points +66%
HP EliteBook X G1a 14 AI
Kioxia XG8 KXG80ZNV1T02
2774 Points +54%
Moyenne Samsung PM9C1b MZVL8512HFLU-00BLL
  (1798 - 3910, n=6)
2494 Points +39%
Moyenne de la classe Office
  (437 - 4689, n=74, 2 dernières années)
2083 Points +16%
Lenovo ThinkPad X1 Carbon Gen 14 21V70075GE
Samsung PM9C1b MZVL8512HFLU-00BLL
1798 Points
Dynabook Portege Z40L-N
Phison C-E80T001T2-P03D54E27T
1693 Points -6%
Dell Pro 14 Premium
Kioxia BG6 KBG6AZNV1T02
1669 Points -7%
Lenovo ThinkPad T14s Gen 7 21YW0022GE
Micron 2650 MTFDKBA512TGW
1575 Points -12%
Seq Read
Asus ExpertBook Ultra B9406CAA
Samsung PM9E1 MZVLC2T0HBLD
8710.83 MB/s +70%
Lenovo ThinkPad T14s Gen 7 21YW0022GE
Micron 2650 MTFDKBA512TGW
5374 MB/s +5%
Lenovo ThinkPad X1 Carbon Gen 13 21NX008PGE
Samsung PM9E1 MZVLC512HFJD
5322 MB/s +4%
HP EliteBook X G1a 14 AI
Kioxia XG8 KXG80ZNV1T02
5219.38 MB/s +2%
Dynabook Portege Z40L-N
Phison C-E80T001T2-P03D54E27T
5187.83 MB/s +1%
Lenovo ThinkPad X1 Carbon Gen 14 21V70075GE
Samsung PM9C1b MZVL8512HFLU-00BLL
5129 MB/s
Dell Pro 14 Premium
Kioxia BG6 KBG6AZNV1T02
4681.73 MB/s -9%
Moyenne Samsung PM9C1b MZVL8512HFLU-00BLL
  (3062 - 5182, n=6)
4525 MB/s -12%
Moyenne de la classe Office
  (781 - 8711, n=74, 2 dernières années)
4326 MB/s -16%
Seq Write
Asus ExpertBook Ultra B9406CAA
Samsung PM9E1 MZVLC2T0HBLD
5359.95 MB/s +63%
Lenovo ThinkPad T14s Gen 7 21YW0022GE
Micron 2650 MTFDKBA512TGW
4540 MB/s +38%
Dynabook Portege Z40L-N
Phison C-E80T001T2-P03D54E27T
3566.81 MB/s +9%
Lenovo ThinkPad X1 Carbon Gen 13 21NX008PGE
Samsung PM9E1 MZVLC512HFJD
3457 MB/s +5%
HP EliteBook X G1a 14 AI
Kioxia XG8 KXG80ZNV1T02
3440.17 MB/s +5%
Dell Pro 14 Premium
Kioxia BG6 KBG6AZNV1T02
3344.41 MB/s +2%
Lenovo ThinkPad X1 Carbon Gen 14 21V70075GE
Samsung PM9C1b MZVL8512HFLU-00BLL
3282 MB/s
Moyenne Samsung PM9C1b MZVL8512HFLU-00BLL
  (2097 - 4601, n=6)
3219 MB/s -2%
Moyenne de la classe Office
  (595 - 5704, n=74, 2 dernières années)
2771 MB/s -16%
4K Read
Lenovo ThinkPad T14s Gen 7 21YW0022GE
Micron 2650 MTFDKBA512TGW
96.3 MB/s +42%
Lenovo ThinkPad X1 Carbon Gen 13 21NX008PGE
Samsung PM9E1 MZVLC512HFJD
68.5 MB/s +1%
Lenovo ThinkPad X1 Carbon Gen 14 21V70075GE
Samsung PM9C1b MZVL8512HFLU-00BLL
67.7 MB/s
Moyenne de la classe Office
  (26.8 - 96.3, n=74, 2 dernières années)
58.1 MB/s -14%
Moyenne Samsung PM9C1b MZVL8512HFLU-00BLL
  (44.2 - 70, n=6)
57.9 MB/s -14%
Asus ExpertBook Ultra B9406CAA
Samsung PM9E1 MZVLC2T0HBLD
57.24 MB/s -15%
HP EliteBook X G1a 14 AI
Kioxia XG8 KXG80ZNV1T02
52.04 MB/s -23%
Dynabook Portege Z40L-N
Phison C-E80T001T2-P03D54E27T
49.09 MB/s -27%
Dell Pro 14 Premium
Kioxia BG6 KBG6AZNV1T02
41.94 MB/s -38%
4K Write
Lenovo ThinkPad T14s Gen 7 21YW0022GE
Micron 2650 MTFDKBA512TGW
228 MB/s +31%
Lenovo ThinkPad X1 Carbon Gen 14 21V70075GE
Samsung PM9C1b MZVL8512HFLU-00BLL
173.8 MB/s
HP EliteBook X G1a 14 AI
Kioxia XG8 KXG80ZNV1T02
167.51 MB/s -4%
Lenovo ThinkPad X1 Carbon Gen 13 21NX008PGE
Samsung PM9E1 MZVLC512HFJD
163.1 MB/s -6%
Moyenne de la classe Office
  (59.6 - 245, n=74, 2 dernières années)
162.6 MB/s -6%
Asus ExpertBook Ultra B9406CAA
Samsung PM9E1 MZVLC2T0HBLD
161.08 MB/s -7%
Moyenne Samsung PM9C1b MZVL8512HFLU-00BLL
  (94.9 - 188.8, n=6)
155.2 MB/s -11%
Dynabook Portege Z40L-N
Phison C-E80T001T2-P03D54E27T
142.34 MB/s -18%
Dell Pro 14 Premium
Kioxia BG6 KBG6AZNV1T02
123.27 MB/s -29%
4K-64 Read
Lenovo ThinkPad T14s Gen 7 21YW0022GE
Micron 2650 MTFDKBA512TGW
2772 MB/s +301%
Moyenne Samsung PM9C1b MZVL8512HFLU-00BLL
  (611 - 2475, n=6)
989 MB/s +43%
Moyenne de la classe Office
  (261 - 3209, n=74, 2 dernières années)
958 MB/s +39%
Asus ExpertBook Ultra B9406CAA
Samsung PM9E1 MZVLC2T0HBLD
875.94 MB/s +27%
Lenovo ThinkPad X1 Carbon Gen 13 21NX008PGE
Samsung PM9E1 MZVLC512HFJD
713 MB/s +3%
Lenovo ThinkPad X1 Carbon Gen 14 21V70075GE
Samsung PM9C1b MZVL8512HFLU-00BLL
691 MB/s
Dell Pro 14 Premium
Kioxia BG6 KBG6AZNV1T02
645.47 MB/s -7%
Dynabook Portege Z40L-N
Phison C-E80T001T2-P03D54E27T
600.82 MB/s -13%
HP EliteBook X G1a 14 AI
Kioxia XG8 KXG80ZNV1T02
514.65 MB/s -26%
4K-64 Write
Asus ExpertBook Ultra B9406CAA
Samsung PM9E1 MZVLC2T0HBLD
2974.88 MB/s +130%
Lenovo ThinkPad X1 Carbon Gen 13 21NX008PGE
Samsung PM9E1 MZVLC512HFJD
2481 MB/s +92%
HP EliteBook X G1a 14 AI
Kioxia XG8 KXG80ZNV1T02
2262.06 MB/s +75%
Moyenne Samsung PM9C1b MZVL8512HFLU-00BLL
  (1295 - 3355, n=6)
2017 MB/s +56%
Moyenne de la classe Office
  (147.4 - 3987, n=74, 2 dernières années)
1643 MB/s +27%
Lenovo ThinkPad X1 Carbon Gen 14 21V70075GE
Samsung PM9C1b MZVL8512HFLU-00BLL
1295 MB/s
Dell Pro 14 Premium
Kioxia BG6 KBG6AZNV1T02
1211.62 MB/s -6%
Dynabook Portege Z40L-N
Phison C-E80T001T2-P03D54E27T
1194.34 MB/s -8%
Lenovo ThinkPad T14s Gen 7 21YW0022GE
Micron 2650 MTFDKBA512TGW
893 MB/s -31%
Access Time Read
Moyenne Samsung PM9C1b MZVL8512HFLU-00BLL
  (0.038 - 0.211, n=6)
0.09867 ms * -70%
Moyenne de la classe Office
  (0.025 - 0.211, n=73, 2 dernières années)
0.08448 ms * -46%
Dell Pro 14 Premium
Kioxia BG6 KBG6AZNV1T02
0.068 ms * -17%
HP EliteBook X G1a 14 AI
Kioxia XG8 KXG80ZNV1T02
0.066 ms * -14%
Lenovo ThinkPad X1 Carbon Gen 13 21NX008PGE
Samsung PM9E1 MZVLC512HFJD
0.061 ms * -5%
Lenovo ThinkPad X1 Carbon Gen 14 21V70075GE
Samsung PM9C1b MZVL8512HFLU-00BLL
0.058 ms *
Dynabook Portege Z40L-N
Phison C-E80T001T2-P03D54E27T
0.053 ms * +9%
Asus ExpertBook Ultra B9406CAA
Samsung PM9E1 MZVLC2T0HBLD
0.033 ms * +43%
Lenovo ThinkPad T14s Gen 7 21YW0022GE
Micron 2650 MTFDKBA512TGW
0.028 ms * +52%
Access Time Write
Dell Pro 14 Premium
Kioxia BG6 KBG6AZNV1T02
0.276 ms * -962%
HP EliteBook X G1a 14 AI
Kioxia XG8 KXG80ZNV1T02
0.071 ms * -173%
Asus ExpertBook Ultra B9406CAA
Samsung PM9E1 MZVLC2T0HBLD
0.07 ms * -169%
Dynabook Portege Z40L-N
Phison C-E80T001T2-P03D54E27T
0.063 ms * -142%
Moyenne de la classe Office
  (0.016 - 0.307, n=74, 2 dernières années)
0.05931 ms * -128%
Moyenne Samsung PM9C1b MZVL8512HFLU-00BLL
  (0.024 - 0.064, n=6)
0.03333 ms * -28%
Lenovo ThinkPad X1 Carbon Gen 14 21V70075GE
Samsung PM9C1b MZVL8512HFLU-00BLL
0.026 ms *
Lenovo ThinkPad X1 Carbon Gen 13 21NX008PGE
Samsung PM9E1 MZVLC512HFJD
0.023 ms * +12%
Lenovo ThinkPad T14s Gen 7 21YW0022GE
Micron 2650 MTFDKBA512TGW
0.017 ms * +35%

* ... Moindre est la valeur, meilleures sont les performances

Limitation du disque : boucle de lecture DiskSpd, profondeur de file d'attente 8

0400800120016002000240028003200360040004400480052005600600064006800Tooltip
Lenovo ThinkPad X1 Carbon Gen 14 21V70075GE; diskspd 2.0.17 f: Ø6954 (5956.75-6988.97) MB/s

Performances du GPU et des jeux

Le Core Ultra 5 325 est équipé du processeur graphique intégré Intel Graphics doté de 4 cœurs Xe. Les performances graphiques sont correctes pour un ordinateur portable de bureau et environ 30 % plus rapides que celles du précédent processeur graphique intégré Arrow Lake, mais également environ 30 % plus lentes que celles de l’ancienne carte graphique Arc Graphics 140V de Lunar Lake. Les performances en matière de jeux sont très limitées, mais comme mentionné précédemment, Lenovo propose également des processeurs dotés du puissant iGPU Arc B390, qui est plus de deux fois plus performant.

3DMark Performance rating - Percent
Asus ExpertBook Ultra B9406CAA
Intel Arc B390 12 Xe3 Panther Lake iGPU, Intel Core Ultra X7 358H
100 pt
HP EliteBook X G1a 14 AI
AMD Radeon 890M, AMD Ryzen AI 9 HX PRO 375
67.1 pt
Lenovo ThinkPad X1 Carbon Gen 13 21NS0010GE
Intel Arc Graphics 140V, Intel Core Ultra 7 258V
60.1 pt
Dell Pro 14 Premium
Intel Arc Graphics 140V, Intel Core Ultra 7 268V
59 pt
Dynabook Portege Z40L-N
Intel Arc Graphics 140V, Intel Core Ultra 7 258V
50.9 pt
Lenovo ThinkPad T14s Gen 7 21YW0022GE
AMD Radeon 860M, AMD Ryzen AI 7 PRO 450
50.2 pt
Lenovo ThinkPad X1 Carbon Gen 14 21V70075GE
Intel Graphics 4 Xe3 Panther Lake iGPU, Intel Core Ultra 5 325
41.6 pt
Moyenne Intel Graphics 4 Xe3 Panther Lake iGPU
 
40.5 pt
Moyenne de la classe Office
 
39.2 pt
Lenovo ThinkPad X1 Carbon Gen 13 21NX008PGE
Intel Graphics 4-Core iGPU (Meteor / Arrow Lake), Intel Core Ultra 5 225U
31.4 pt
3DMark 11 - 1280x720 Performance GPU
Asus ExpertBook Ultra B9406CAA
Intel Arc B390 12 Xe3 Panther Lake iGPU, Intel Core Ultra X7 358H
18313 Points +151%
HP EliteBook X G1a 14 AI
AMD Radeon 890M, AMD Ryzen AI 9 HX PRO 375
16418 Points +125%
Dell Pro 14 Premium
Intel Arc Graphics 140V, Intel Core Ultra 7 268V
12580 Points +72%
Lenovo ThinkPad T14s Gen 7 21YW0022GE
AMD Radeon 860M, AMD Ryzen AI 7 PRO 450
11833 Points +62%
Lenovo ThinkPad X1 Carbon Gen 13 21NS0010GE
Intel Arc Graphics 140V, Intel Core Ultra 7 258V
11335 Points +55%
Dynabook Portege Z40L-N
Intel Arc Graphics 140V, Intel Core Ultra 7 258V
10647 Points +46%
Moyenne de la classe Office
  (2551 - 18313, n=72, 2 dernières années)
8487 Points +16%
Lenovo ThinkPad X1 Carbon Gen 14 21V70075GE
Intel Graphics 4 Xe3 Panther Lake iGPU, Intel Core Ultra 5 325
7301 Points
Moyenne Intel Graphics 4 Xe3 Panther Lake iGPU
  (6268 - 7678, n=11)
7044 Points -4%
Lenovo ThinkPad X1 Carbon Gen 13 21NX008PGE
Intel Graphics 4-Core iGPU (Meteor / Arrow Lake), Intel Core Ultra 5 225U
5982 Points -18%
3DMark
1920x1080 Fire Strike Graphics
Asus ExpertBook Ultra B9406CAA
Intel Arc B390 12 Xe3 Panther Lake iGPU, Intel Core Ultra X7 358H
17054 Points +141%
Lenovo ThinkPad X1 Carbon Gen 13 21NS0010GE
Intel Arc Graphics 140V, Intel Core Ultra 7 258V
9930 Points +40%
HP EliteBook X G1a 14 AI
AMD Radeon 890M, AMD Ryzen AI 9 HX PRO 375
9810 Points +38%
Dell Pro 14 Premium
Intel Arc Graphics 140V, Intel Core Ultra 7 268V
8941 Points +26%
Dynabook Portege Z40L-N
Intel Arc Graphics 140V, Intel Core Ultra 7 258V
7713 Points +9%
Lenovo ThinkPad T14s Gen 7 21YW0022GE
AMD Radeon 860M, AMD Ryzen AI 7 PRO 450
7459 Points +5%
Lenovo ThinkPad X1 Carbon Gen 14 21V70075GE
Intel Graphics 4 Xe3 Panther Lake iGPU, Intel Core Ultra 5 325
7090 Points
Moyenne Intel Graphics 4 Xe3 Panther Lake iGPU
  (5688 - 7227, n=11)
6810 Points -4%
Moyenne de la classe Office
  (736 - 21871, n=75, 2 dernières années)
6273 Points -12%
Lenovo ThinkPad X1 Carbon Gen 13 21NX008PGE
Intel Graphics 4-Core iGPU (Meteor / Arrow Lake), Intel Core Ultra 5 225U
5166 Points -27%
2560x1440 Time Spy Graphics
Asus ExpertBook Ultra B9406CAA
Intel Arc B390 12 Xe3 Panther Lake iGPU, Intel Core Ultra X7 358H
6679 Points +130%
Lenovo ThinkPad X1 Carbon Gen 13 21NS0010GE
Intel Arc Graphics 140V, Intel Core Ultra 7 258V
4028 Points +39%
Dell Pro 14 Premium
Intel Arc Graphics 140V, Intel Core Ultra 7 268V
3730 Points +28%
HP EliteBook X G1a 14 AI
AMD Radeon 890M, AMD Ryzen AI 9 HX PRO 375
3614 Points +24%
Dynabook Portege Z40L-N
Intel Arc Graphics 140V, Intel Core Ultra 7 258V
3290 Points +13%
Lenovo ThinkPad X1 Carbon Gen 14 21V70075GE
Intel Graphics 4 Xe3 Panther Lake iGPU, Intel Core Ultra 5 325
2905 Points
Moyenne Intel Graphics 4 Xe3 Panther Lake iGPU
  (2391 - 3044, n=11)
2870 Points -1%
Lenovo ThinkPad T14s Gen 7 21YW0022GE
AMD Radeon 860M, AMD Ryzen AI 7 PRO 450
2812 Points -3%
Moyenne de la classe Office
  (493 - 6679, n=70, 2 dernières années)
2309 Points -21%
Lenovo ThinkPad X1 Carbon Gen 13 21NX008PGE
Intel Graphics 4-Core iGPU (Meteor / Arrow Lake), Intel Core Ultra 5 225U
2078 Points -28%
3DMark 11 Performance
7948 points
3DMark Fire Strike Score
6384 points
3DMark Time Spy Score
3208 points
3DMark Steel Nomad Score
519 points
3DMark Steel Nomad Light Score
2220 points
Aide
Blender / v3.3 Classroom CPU
Dynabook Portege Z40L-N
Intel Arc Graphics 140V, Intel Core Ultra 7 258V
772 Seconds * -55%
Lenovo ThinkPad X1 Carbon Gen 13 21NS0010GE
Intel Arc Graphics 140V, Intel Core Ultra 7 258V
630 Seconds * -26%
Moyenne de la classe Office
  (245 - 3219, n=75, 2 dernières années)
574 Seconds * -15%
Dell Pro 14 Premium
Intel Arc Graphics 140V, Intel Core Ultra 7 268V
520 Seconds * -4%
Lenovo ThinkPad X1 Carbon Gen 13 21NX008PGE
Intel Graphics 4-Core iGPU (Meteor / Arrow Lake), Intel Core Ultra 5 225U
512 Seconds * -3%
Lenovo ThinkPad X1 Carbon Gen 14 21V70075GE
Intel Graphics 4 Xe3 Panther Lake iGPU, Intel Core Ultra 5 325
499 Seconds *
Moyenne Intel Graphics 4 Xe3 Panther Lake iGPU
  (332 - 569, n=11)
467 Seconds * +6%
Lenovo ThinkPad T14s Gen 7 21YW0022GE
AMD Radeon 860M, AMD Ryzen AI 7 PRO 450
337 Seconds * +32%
Asus ExpertBook Ultra B9406CAA
Intel Arc B390 12 Xe3 Panther Lake iGPU, Intel Core Ultra X7 358H
288 Seconds * +42%
HP EliteBook X G1a 14 AI
AMD Radeon 890M, AMD Ryzen AI 9 HX PRO 375
245 Seconds * +51%
Blender / v3.3 Classroom oneAPI/Intel
Moyenne de la classe Office
  (110 - 416, n=9, 2 dernières années)
268 Seconds *
Moyenne Intel Graphics 4 Xe3 Panther Lake iGPU
  (235 - 257, n=5)
245 Seconds *
Dynabook Portege Z40L-N
Intel Arc Graphics 140V, Intel Core Ultra 7 258V
229 Seconds *
Lenovo ThinkPad X1 Carbon Gen 13 21NS0010GE
Intel Arc Graphics 140V, Intel Core Ultra 7 258V
217 Seconds *
Dell Pro 14 Premium
Intel Arc Graphics 140V, Intel Core Ultra 7 268V
204 Seconds *
Asus ExpertBook Ultra B9406CAA
Intel Arc B390 12 Xe3 Panther Lake iGPU, Intel Core Ultra X7 358H
110 Seconds *

* ... Moindre est la valeur, meilleures sont les performances
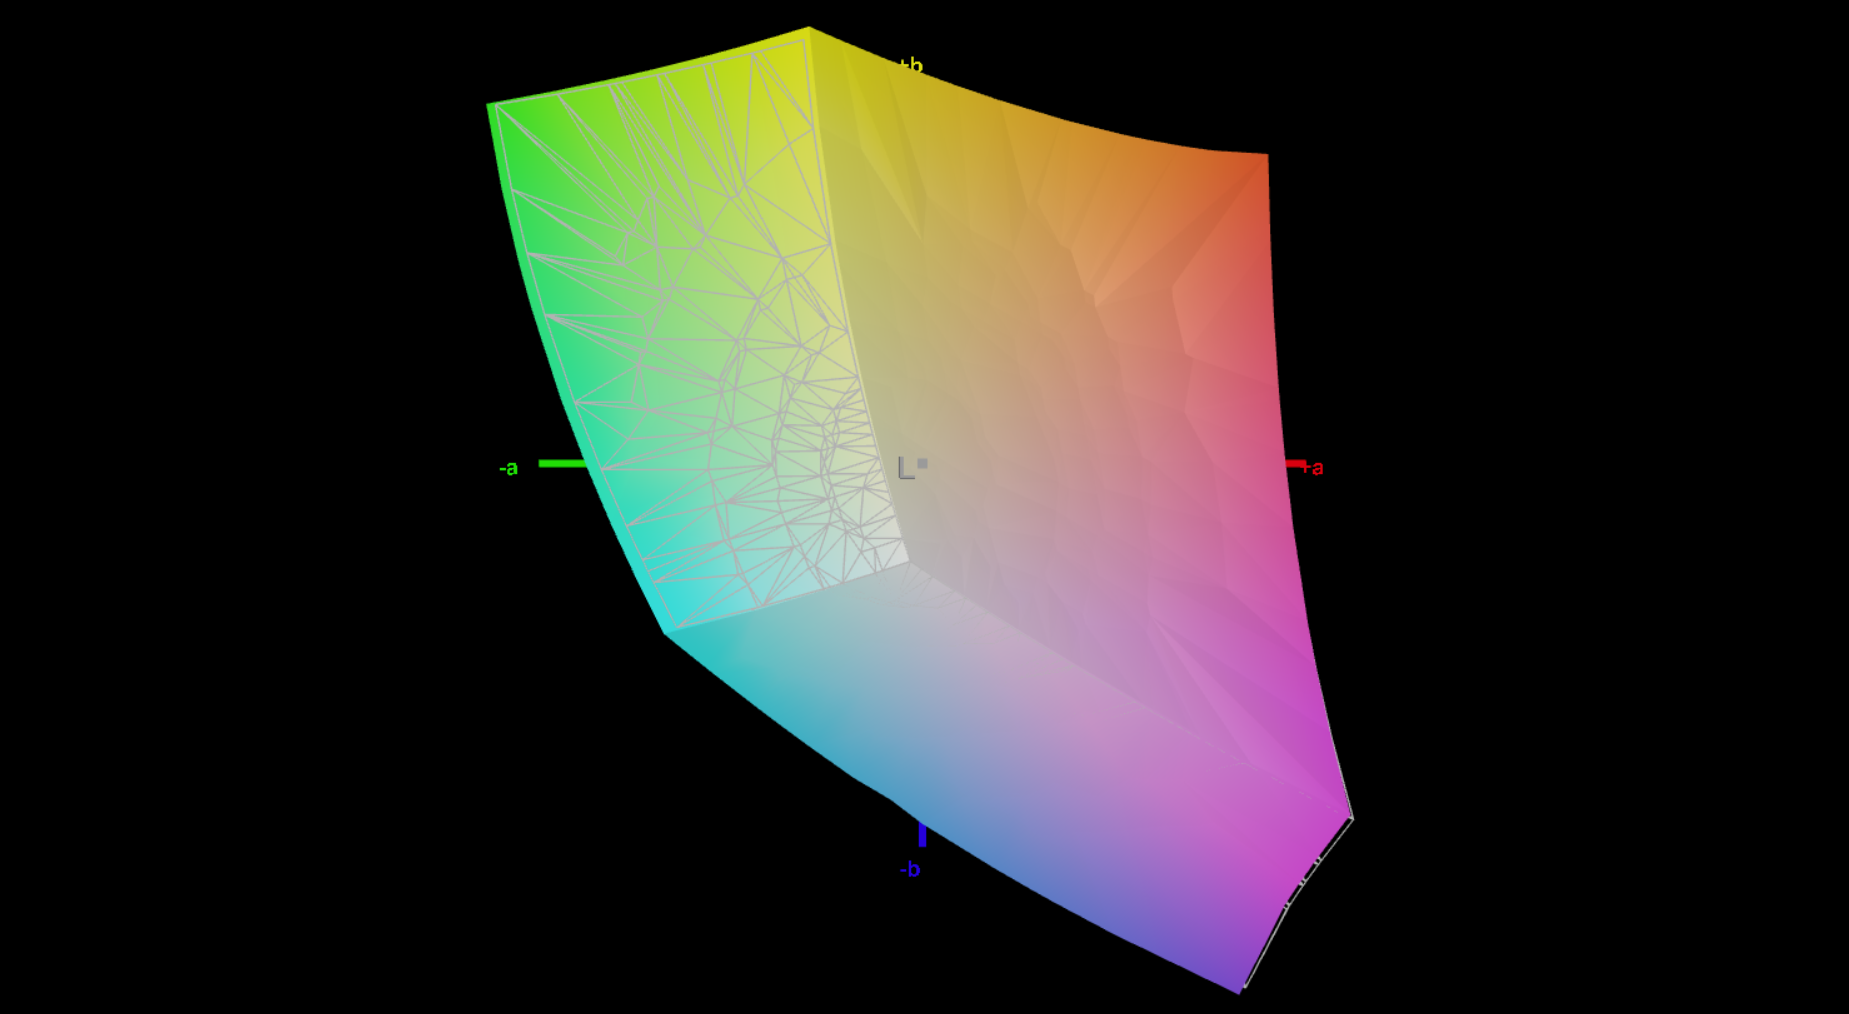
Performance rating - Percent
Asus ExpertBook Ultra B9406CAA
Intel Core Ultra X7 358H, Intel Arc B390 12 Xe3 Panther Lake iGPU
99.2 pt
Dell Pro 14 Premium -1!
Intel Core Ultra 7 268V, Intel Arc Graphics 140V
68.7 pt
HP EliteBook X G1a 14 AI
AMD Ryzen AI 9 HX PRO 375, AMD Radeon 890M
63.2 pt
Lenovo ThinkPad T14s Gen 7 21YW0022GE
AMD Ryzen AI 7 PRO 450, AMD Radeon 860M
56.6 pt
Lenovo ThinkPad X1 Carbon Gen 14 21V70075GE
Intel Core Ultra 5 325, Intel Graphics 4 Xe3 Panther Lake iGPU
53.8 pt
Dynabook Portege Z40L-N
Intel Core Ultra 7 258V, Intel Arc Graphics 140V
53 pt
Moyenne de la classe Office
 
46.3 pt
Lenovo ThinkPad X1 Carbon Gen 13 21NX008PGE -1!
Intel Core Ultra 5 225U, Intel Graphics 4-Core iGPU (Meteor / Arrow Lake)
37 pt
Cyberpunk 2077 - 1920x1080 Ultra Preset (FSR off)
Asus ExpertBook Ultra B9406CAA
Intel Core Ultra X7 358H, Intel Arc B390 12 Xe3 Panther Lake iGPU
47.2 (39.1min, 36.3P1) fps +127%
Dell Pro 14 Premium
Intel Core Ultra 7 268V, Intel Arc Graphics 140V
29 (24.3min, 23.4P1) fps +39%
HP EliteBook X G1a 14 AI
AMD Ryzen AI 9 HX PRO 375, AMD Radeon 890M
26.8 (22.8min, 19.6P1) fps +29%
Dynabook Portege Z40L-N
Intel Core Ultra 7 258V, Intel Arc Graphics 140V
21 (17.2min, 16.2P1) fps +1%
Lenovo ThinkPad X1 Carbon Gen 14 21V70075GE
Intel Core Ultra 5 325, Intel Graphics 4 Xe3 Panther Lake iGPU
20.8 (17.4min) fps
Lenovo ThinkPad T14s Gen 7 21YW0022GE
AMD Ryzen AI 7 PRO 450, AMD Radeon 860M
17.7 (14.1min) fps -15%
Moyenne de la classe Office
  (3.1 - 61.5, n=70, 2 dernières années)
17.4 fps -16%
Lenovo ThinkPad X1 Carbon Gen 13 21NX008PGE
Intel Core Ultra 5 225U, Intel Graphics 4-Core iGPU (Meteor / Arrow Lake)
13.4 (11.4min, 11.1P1) fps -36%
Baldur's Gate 3 - 1920x1080 Ultra Preset AA:T
Asus ExpertBook Ultra B9406CAA
Intel Core Ultra X7 358H, Intel Arc B390 12 Xe3 Panther Lake iGPU
53.4 (45.4min, 46.4P0.1, 49.5P1) fps +138%
Dell Pro 14 Premium
Intel Core Ultra 7 268V, Intel Arc Graphics 140V
31.6 fps +41%
HP EliteBook X G1a 14 AI
AMD Ryzen AI 9 HX PRO 375, AMD Radeon 890M
27.9 fps +25%
Dynabook Portege Z40L-N
Intel Core Ultra 7 258V, Intel Arc Graphics 140V
25 fps +12%
Lenovo ThinkPad X1 Carbon Gen 14 21V70075GE
Intel Core Ultra 5 325, Intel Graphics 4 Xe3 Panther Lake iGPU
22.4 (20.3min, 20.4P0.1, 20.6P1) fps
Moyenne de la classe Office
  (3.5 - 65.2, n=66, 2 dernières années)
19.1 fps -15%
Lenovo ThinkPad T14s Gen 7 21YW0022GE
AMD Ryzen AI 7 PRO 450, AMD Radeon 860M
17.9 (14.8min, 15.2P0.1, 16.1P1) fps -20%
Lenovo ThinkPad X1 Carbon Gen 13 21NX008PGE
Intel Core Ultra 5 225U, Intel Graphics 4-Core iGPU (Meteor / Arrow Lake)
10.7 (8.57min, 8.57P0.1, 9.99P1) fps -52%
GTA V - 1920x1080 Highest AA:4xMSAA + FX AF:16x
Asus ExpertBook Ultra B9406CAA
Intel Core Ultra X7 358H, Intel Arc B390 12 Xe3 Panther Lake iGPU
45.3 (11.1min, 34.5P1) fps +107%
HP EliteBook X G1a 14 AI
AMD Ryzen AI 9 HX PRO 375, AMD Radeon 890M
33.3 (3.55min, 23.8P1) fps +52%
Lenovo ThinkPad T14s Gen 7 21YW0022GE
AMD Ryzen AI 7 PRO 450, AMD Radeon 860M
25.4 (4.78min, 18.2P1) fps +16%
Lenovo ThinkPad X1 Carbon Gen 14 21V70075GE
Intel Core Ultra 5 325, Intel Graphics 4 Xe3 Panther Lake iGPU
21.9 (6.72min, 17.2P1) fps
Dynabook Portege Z40L-N
Intel Core Ultra 7 258V, Intel Arc Graphics 140V
21.8 (5.01min, 15.9P1) fps 0%
Moyenne de la classe Office
  (5.77 - 45.3, n=69, 2 dernières années)
17.7 fps -19%
Lenovo ThinkPad X1 Carbon Gen 13 21NX008PGE
Intel Core Ultra 5 225U, Intel Graphics 4-Core iGPU (Meteor / Arrow Lake)
10.7 (5.07min, 8.77P1) fps -51%
Final Fantasy XV Benchmark - 1920x1080 High Quality
Asus ExpertBook Ultra B9406CAA
Intel Core Ultra X7 358H, Intel Arc B390 12 Xe3 Panther Lake iGPU
55.4 fps +107%
Dell Pro 14 Premium
Intel Core Ultra 7 268V, Intel Arc Graphics 140V
36.5 fps +36%
HP EliteBook X G1a 14 AI
AMD Ryzen AI 9 HX PRO 375, AMD Radeon 890M
32.9 fps +23%
Dynabook Portege Z40L-N
Intel Core Ultra 7 258V, Intel Arc Graphics 140V
28.2 fps +5%
Lenovo ThinkPad T14s Gen 7 21YW0022GE
AMD Ryzen AI 7 PRO 450, AMD Radeon 860M
26.8 fps 0%
Lenovo ThinkPad X1 Carbon Gen 14 21V70075GE
Intel Core Ultra 5 325, Intel Graphics 4 Xe3 Panther Lake iGPU
26.8 fps
Moyenne de la classe Office
  (8.09 - 79.5, n=71, 2 dernières années)
22.8 fps -15%
Lenovo ThinkPad X1 Carbon Gen 13 21NX008PGE
Intel Core Ultra 5 225U, Intel Graphics 4-Core iGPU (Meteor / Arrow Lake)
18.3 fps -32%
Strange Brigade - 1920x1080 ultra AA:ultra AF:16
Asus ExpertBook Ultra B9406CAA
Intel Core Ultra X7 358H, Intel Arc B390 12 Xe3 Panther Lake iGPU
99.5 (24.8min, 76.1P1) fps +91%
Dell Pro 14 Premium
Intel Core Ultra 7 268V, Intel Arc Graphics 140V
57.6 (15.1min, 29.8P1) fps +10%
HP EliteBook X G1a 14 AI
AMD Ryzen AI 9 HX PRO 375, AMD Radeon 890M
56.5 (17.6min, 30.5P1) fps +8%
Lenovo ThinkPad X1 Carbon Gen 14 21V70075GE
Intel Core Ultra 5 325, Intel Graphics 4 Xe3 Panther Lake iGPU
52.2 (38.1min, 40P1) fps
Dynabook Portege Z40L-N
Intel Core Ultra 7 258V, Intel Arc Graphics 140V
46.3 (26min, 32.9P1) fps -11%
Lenovo ThinkPad T14s Gen 7 21YW0022GE
AMD Ryzen AI 7 PRO 450, AMD Radeon 860M
44.4 (33min, 34.8P1) fps -15%
Moyenne de la classe Office
  (12.9 - 142.1, n=53, 2 dernières années)
38.9 fps -25%
Dota 2 Reborn - 1920x1080 ultra (3/3) best looking
Asus ExpertBook Ultra B9406CAA
Intel Core Ultra X7 358H, Intel Arc B390 12 Xe3 Panther Lake iGPU
102.5 (67.7min) fps +23%
Dell Pro 14 Premium
Intel Core Ultra 7 268V, Intel Arc Graphics 140V
87.4 (56.9min) fps +5%
Lenovo ThinkPad X1 Carbon Gen 14 21V70075GE
Intel Core Ultra 5 325, Intel Graphics 4 Xe3 Panther Lake iGPU
83.3 (54.4min) fps
Lenovo ThinkPad T14s Gen 7 21YW0022GE
AMD Ryzen AI 7 PRO 450, AMD Radeon 860M
81.3 (71.8min) fps -2%
Lenovo ThinkPad X1 Carbon Gen 13 21NX008PGE
Intel Core Ultra 5 225U, Intel Graphics 4-Core iGPU (Meteor / Arrow Lake)
60.8 (36.3min) fps -27%
Moyenne de la classe Office
  (14.6 - 135, n=77, 2 dernières années)
58.4 fps -30%
Dynabook Portege Z40L-N
Intel Core Ultra 7 258V, Intel Arc Graphics 140V
58.2 (34min) fps -30%
HP EliteBook X G1a 14 AI
AMD Ryzen AI 9 HX PRO 375, AMD Radeon 890M
44.8 (33.2min) fps -46%
X-Plane 11.11 - 1920x1080 high (fps_test=3)
HP EliteBook X G1a 14 AI
AMD Ryzen AI 9 HX PRO 375, AMD Radeon 890M
42.2 fps +65%
Lenovo ThinkPad T14s Gen 7 21YW0022GE
AMD Ryzen AI 7 PRO 450, AMD Radeon 860M
40.7 fps +60%
Asus ExpertBook Ultra B9406CAA
Intel Core Ultra X7 358H, Intel Arc B390 12 Xe3 Panther Lake iGPU
39.7 fps +56%
Dell Pro 14 Premium
Intel Core Ultra 7 268V, Intel Arc Graphics 140V
34.9 fps +37%
Dynabook Portege Z40L-N
Intel Core Ultra 7 258V, Intel Arc Graphics 140V
32.6 fps +28%
Moyenne de la classe Office
  (12 - 82.4, n=69, 2 dernières années)
31.7 fps +24%
Lenovo ThinkPad X1 Carbon Gen 14 21V70075GE
Intel Core Ultra 5 325, Intel Graphics 4 Xe3 Panther Lake iGPU
25.5 fps
Lenovo ThinkPad X1 Carbon Gen 13 21NX008PGE
Intel Core Ultra 5 225U, Intel Graphics 4-Core iGPU (Meteor / Arrow Lake)
24.2 fps -5%

Tableau des FPS en mode « Ultra » de Cyberpunk 2077

051015202530354045Tooltip
Lenovo ThinkPad X1 Carbon Gen 14 21V70075GE Ultra 5 325, Intel Graphics 4 Xe3 PTL: Ø20.1 (19.1-20.4) fps
Lenovo ThinkPad X1 Carbon Gen 13 21NX008PGE Ultra 5 225U, Graphics 4-Core iGPU (Arrow Lake): Ø10.6 (9.66-10.7) fps
Lenovo ThinkPad T14s Gen 7 21YW0022GE Ryzen AI 7 PRO 450, Radeon 860M: Ø16 (14.3-18.3) fps
Asus ExpertBook Ultra B9406CAA Ultra X7 358H, Arc B390 Panther Lake iGPU: Ø46.3 (40.9-47.4) fps
Dynabook Portege Z40L-N Core Ultra 7 258V, Arc 140V: Ø20.9 (18.4-22.9) fps
Dell Pro 14 Premium Core Ultra 7 268V, Arc 140V: Ø26.6 (23-27.4) fps
HP EliteBook X G1a 14 AI Ryzen AI 9 HX PRO 375, Radeon 890M: Ø17.4 (15-18.2) fps
BasMoyenÉlevéUltra
GTA V (2015) 170.2 162.7 52.8 21.9
Dota 2 Reborn (2015) 108.3 95.9 82.1 83.3
Final Fantasy XV Benchmark (2018) 73 37.5 26.8
X-Plane 11.11 (2018) 36.2 29.4 25.5
Strange Brigade (2018) 190.5 68.3 62 52.2
Baldur's Gate 3 (2023) 34.8 26 22.9 22.4
Cyberpunk 2077 (2023) 38.6 29.1 25 20.8

Émissions et consommation d'énergie

Bruit du système

Groupe frigorifique
Groupe frigorifique

Le ThinkPad équipé du Core Ultra 5 325 est un système très silencieux et, en général, vous n’entendez pas le ventilateur lors de charges de travail légères. Si vous sollicitez fortement le processeur, vous pouvez vous attendre à un niveau sonore pouvant atteindre 39 dB(A) en mode « Meilleures performances », ce qui est audible, mais pas gênant. Nous avons mesuré jusqu’à 36 dB(A) en mode « Équilibré » et seulement 29 dB(A) en mode « Meilleure efficacité »; vous disposez donc pratiquement toujours d’un système silencieux. Nous n’avons perçu aucun bruit électronique.

Degré de la nuisance sonore

Au repos
24.8 / 24.8 / 24.8 dB(A)
Fortement sollicité
38.9 / 38.9 dB(A)
  red to green bar
 
 
30 dB
silencieux
40 dB(A)
audible
50 dB(A)
bruyant
 
min: dark, med: mid, max: light   Earthworks M23R, Arta (à 15 cm de distance)   bruit ambiant: 24.8 dB(A)
dB(A) 0102030405060708090Deep BassMiddle BassHigh BassLower RangeMidsHigher MidsLower HighsMid HighsUpper HighsSuper Highs204237.139.32535.53032.23129.927.328.74030.127.728.65031.131.732.86327.526.428.38022.922.525.310024.123.523.312522.818.620.816022.919.920.720023.518.120.225026.422.523.931524.115.2184002413.117.750024.512.217.363024.611.816.580025.712.216.6100028.511.618.5125029.811.518.8160029.911.818200028.611.518250028.911.416.331502712.115.2400025.412.313.9500024.712.713.2630021.712.812.9800017.213.1131000015.413.212.812500141312.51600013.412.412.5SPL38.924.828.6N2.90.61.1median 24.5median 12.7median 17.3Delta2.42.23.2hearing rangehide median Fan NoiseLenovo ThinkPad X1 Carbon Gen 14 21V70075GE
Lenovo ThinkPad X1 Carbon Gen 14 21V70075GE
Ultra 5 325, Intel Graphics 4 Xe3 PTL
Lenovo ThinkPad X1 Carbon Gen 13 21NX008PGE
Ultra 5 225U, Graphics 4-Core iGPU (Arrow Lake)
Lenovo ThinkPad T14s Gen 7 21YW0022GE
Ryzen AI 7 PRO 450, Radeon 860M
Asus ExpertBook Ultra B9406CAA
Ultra X7 358H, Arc B390 Panther Lake iGPU
Dynabook Portege Z40L-N
Core Ultra 7 258V, Arc 140V
Dell Pro 14 Premium
Core Ultra 7 268V, Arc 140V
HP EliteBook X G1a 14 AI
Ryzen AI 9 HX PRO 375, Radeon 890M
Noise
-1%
-1%
4%
4%
0%
4%
arrêt / environnement * (dB)
24.8
25.2
-2%
24.8
-0%
22.9
8%
23.5
5%
23.1
7%
24
3%
Idle Minimum * (dB)
24.8
25.2
-2%
24.8
-0%
23.4
6%
23.6
5%
23.1
7%
24.4
2%
Idle Average * (dB)
24.8
25.2
-2%
24.8
-0%
23.4
6%
23.6
5%
23.1
7%
24.4
2%
Idle Maximum * (dB)
24.8
27.3
-10%
24.8
-0%
23.4
6%
23.6
5%
23.1
7%
24.5
1%
Load Average * (dB)
38.9
27.8
29%
36.7
6%
28.6
26%
37
5%
38.2
2%
25.4
35%
Cyberpunk 2077 ultra * (dB)
38.9
40.9
-5%
41.6
-7%
42.8
-10%
37.8
3%
44.2
-14%
39.3
-1%
Load Maximum * (dB)
38.9
44.3
-14%
41.6
-7%
45.2
-16%
39
-0%
44.2
-14%
43.1
-11%

* ... Moindre est la valeur, meilleures sont les performances
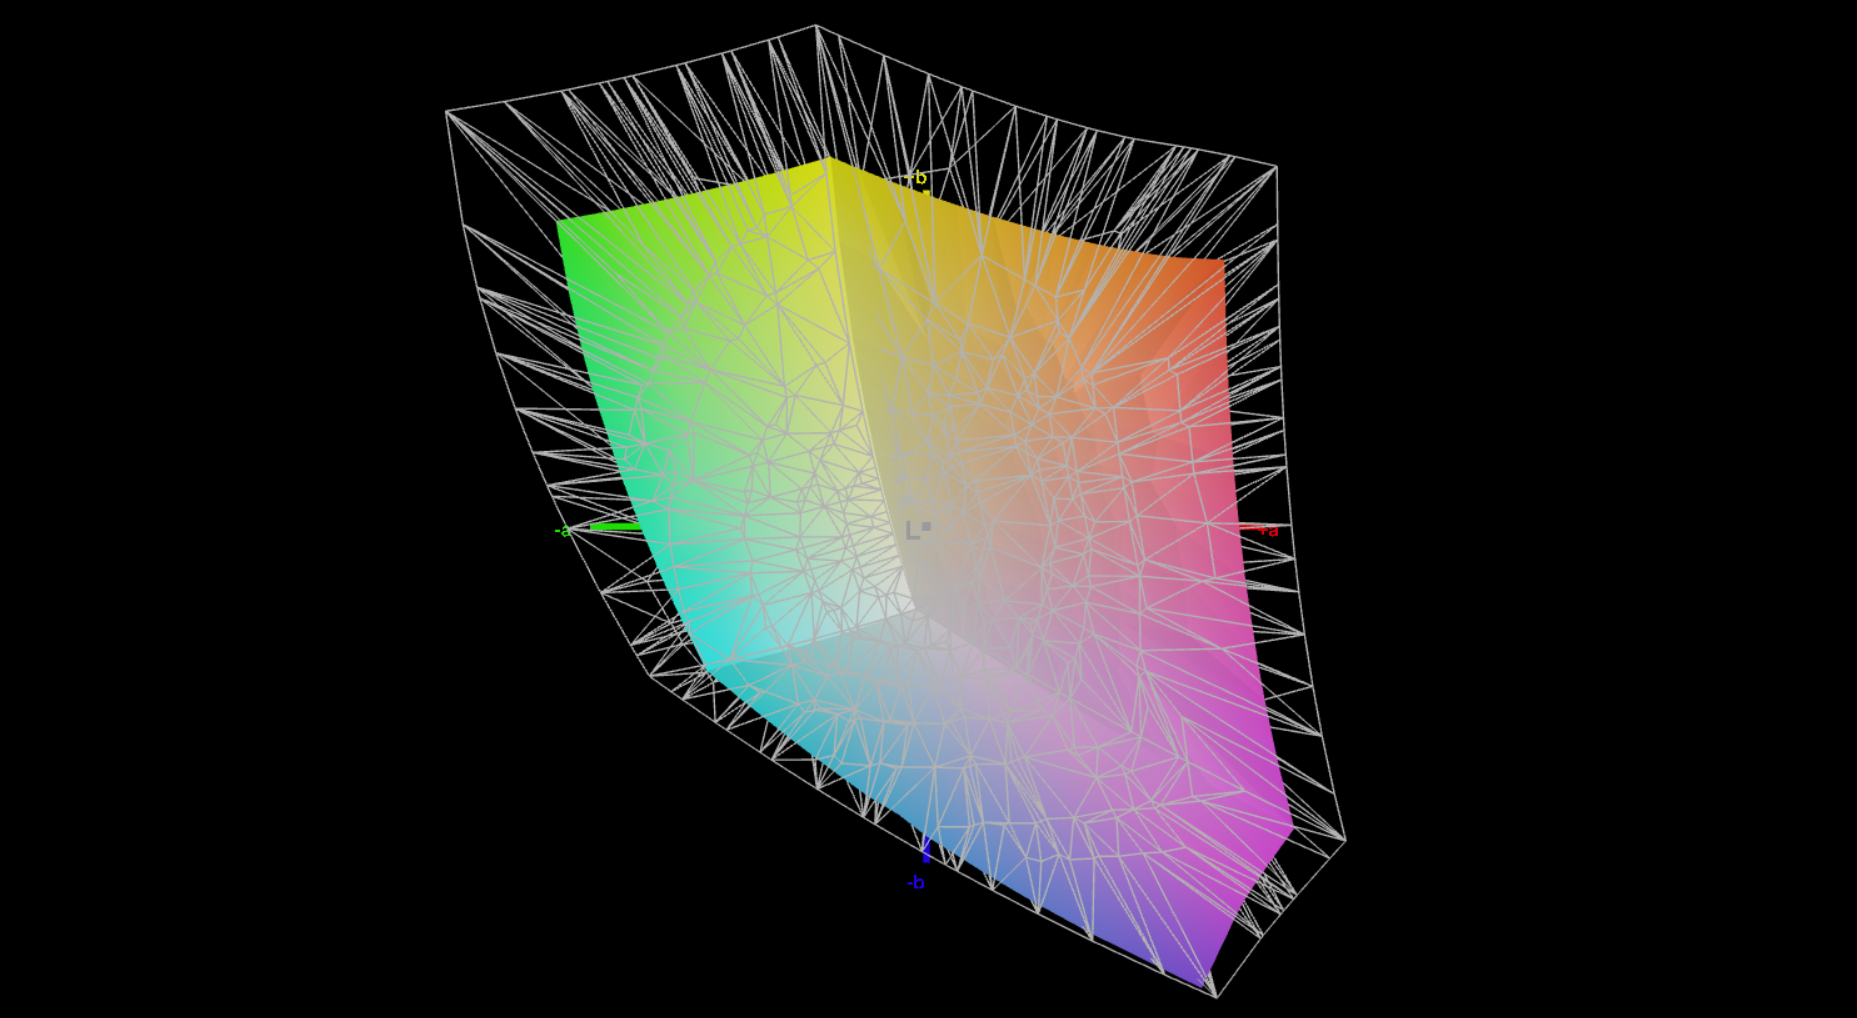
Température

Les températures de surface sont globalement très basses et seuls quelques points à l'arrière atteignent plus de 40 °C en charge, ce qui ne pose absolument aucun problème. Le SoC consomme jusqu’à 57 watts pendant un bref instant au cours du test de résistance, mais sa consommation oscille ensuite entre 30 et 40 watts tout au long du test. Ce n’est pas idéal et nous préférerions une consommation stable.

Test de résistance des données du processeur (CPU) et du processeur graphique intégré (iGPU)
 39.9 °C40.7 °C38.5 °C 
 34.9 °C38.3 °C34 °C 
 28.3 °C28.6 °C28.7 °C 
Maximum: 40.7 °C
Moyenne: 34.7 °C
41.9 °C42.8 °C40.1 °C
34.1 °C37.3 °C33.5 °C
29.9 °C30.8 °C29.2 °C
Maximum: 42.8 °C
Moyenne: 35.5 °C
Alimentation (valeur maximale)  47.1 °C | Température ambiante de la pièce 22 °C | Fluke t3000FC (calibrated), Voltcraft IR-900
(±) La température moyenne de la face supérieure sous charge maximale est de 34.7 °C / 94 F, par rapport à la moyenne de 29.5 °C / 85 F pour les appareils de la classe Office.
(±) La température maximale du côté supérieur est de 40.7 °C / 105 F, par rapport à la moyenne de 34.3 °C / 94 F, allant de 21.2 à 62.5 °C pour la classe Office.
(±) Le fond chauffe jusqu'à un maximum de 42.8 °C / 109 F, contre une moyenne de 36.8 °C / 98 F
(+) En utilisation inactive, la température moyenne du côté supérieur est de 24.7 °C / 76 F, par rapport à la moyenne du dispositif de 29.5 °C / 85 F.
(±) 3: The average temperature for the upper side is 33 °C / 91 F, compared to the average of 29.5 °C / 85 F for the class Office.
(+) Les repose-poignets et le pavé tactile sont plus froids que la température de la peau avec un maximum de 28.7 °C / 83.7 F et sont donc froids au toucher.
(±) La température moyenne de la zone de l'appui-paume de dispositifs similaires était de 27.5 °C / 81.5 F (-1.2 °C / #-2.2 F).
Stress de la carte thermique (en haut)
Stress de la carte thermique (en bas)
Lenovo ThinkPad X1 Carbon Gen 14 21V70075GE
Ultra 5 325, Intel Graphics 4 Xe3 PTL
Lenovo ThinkPad X1 Carbon Gen 13 21NX008PGE
Ultra 5 225U, Graphics 4-Core iGPU (Arrow Lake)
Lenovo ThinkPad T14s Gen 7 21YW0022GE
Ryzen AI 7 PRO 450, Radeon 860M
Asus ExpertBook Ultra B9406CAA
Ultra X7 358H, Arc B390 Panther Lake iGPU
Dynabook Portege Z40L-N
Core Ultra 7 258V, Arc 140V
Dell Pro 14 Premium
Core Ultra 7 268V, Arc 140V
HP EliteBook X G1a 14 AI
Ryzen AI 9 HX PRO 375, Radeon 890M
Heat
-11%
-2%
3%
-23%
7%
8%
Maximum Upper Side * (°C)
40.7
47.2
-16%
42.3
-4%
38.6
5%
41.2
-1%
33
19%
36
12%
Maximum Bottom * (°C)
42.8
44.1
-3%
43.8
-2%
38.4
10%
38
11%
28
35%
34.2
20%
Idle Upper Side * (°C)
24.9
27.1
-9%
25.2
-1%
24.6
1%
35.4
-42%
28
-12%
25
-0%
Idle Bottom * (°C)
25
28.7
-15%
25.5
-2%
26
-4%
39.8
-59%
28.8
-15%
25.6
-2%

* ... Moindre est la valeur, meilleures sont les performances
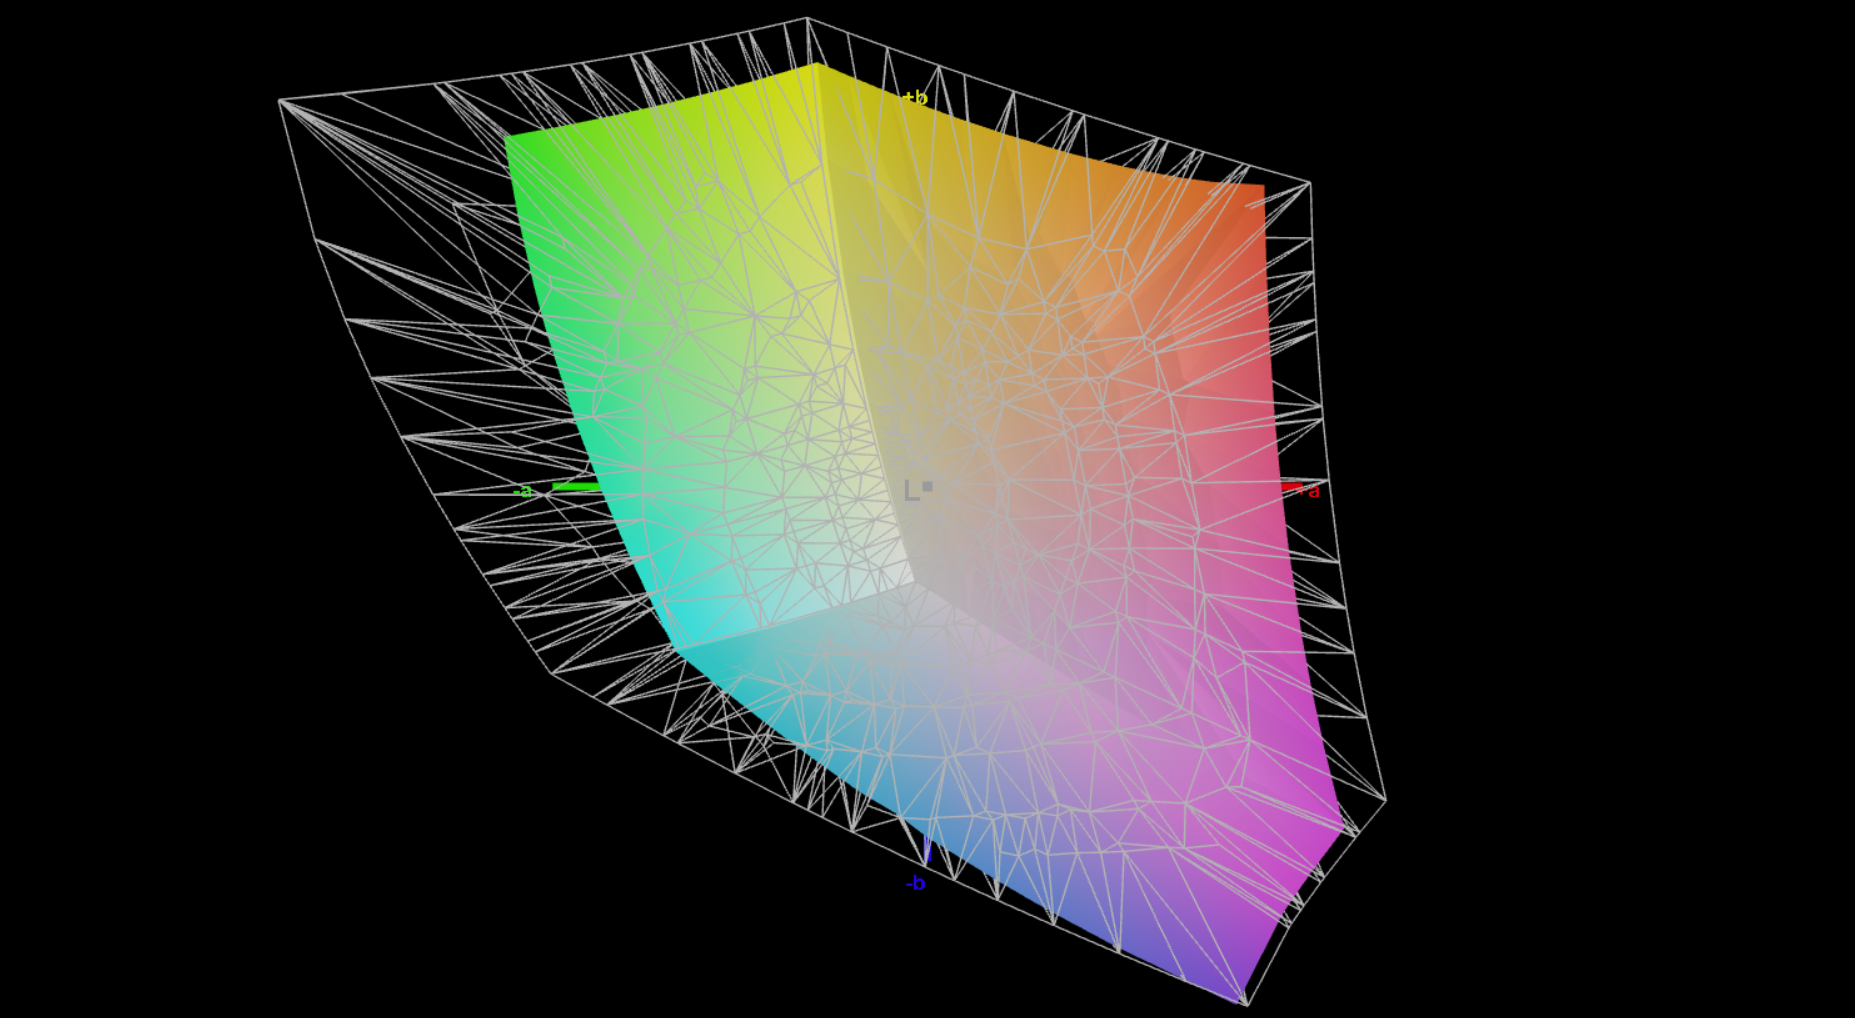
Intervenants

Lenovo a amélioré les performances des haut-parleurs, qui sont désormais encore meilleures que celles du ThinkPad T14s Gen 7 que nous avons récemment testé. Elles sont également à la hauteur de l'excellent système audio de l'Asus ExpertBook Ultra et ne se contentent pas d'être simplement excellentes pour un ordinateur portable de bureau.

dB(A) 0102030405060708090Deep BassMiddle BassHigh BassLower RangeMidsHigher MidsLower HighsMid HighsUpper HighsSuper Highs2037.139.7253032.83127.329.94027.730.15031.733.36326.428.28022.540.710023.551.512518.658.616019.962.720018.167.625022.569.231515.272.940013.170.750012.272.263011.870.480012.272.6100011.675125011.575.7160011.877.2200011.573.8250011.474.5315012.170.3400012.370.4500012.768.3630012.863.9800013.161.41000013.260.6125001359.21600012.454.1SPL24.884.7N0.663median 12.7median 70.3Delta2.25.325.131.227.938.428.835.331.137.227.934.131.135.424.438.623.347.821.253.316.160.515.764.719.866.215.668.61471.91372.614.274.11276.412.28011.881.712.784.912.57912.871.613.466.813.665.714.167.913.874.114.570.313.965.913.861.515.661.525.789.60.776.1median 13.9median 70.31.65.335.935.93027.832.331.133.734.631.935.326.53023.629.722.843.120.951.620.955.321.564.521.766.916.27213.768.512.967.612.370.411.476.11177.211.574.51175.611.275.71277.412.57712.275.612.57012.466.912.567.912.461.112.356.312.749.524.886.50.669.2median 12.5median 69.22.27.635.833.525.725.722.823.221.820.423.122.727.12820.242.11853.514.461.815.568.614.666.613.567.914.272.515.374.612.275.410.275.210.274.69.575.19.777.99.7789.977.610.37510.970.212.173.811.67411.671.212.166.412.563.111.961.211.763.623.486.80.573.6median 11.9median 73.61.84.23537.63525.426.225.425.226.325.222.62222.628.421.128.427.222.927.227.330.727.327.624.327.627.315.927.339.415.139.448.616.648.661.912.861.96513.56565.212.165.266.611.566.66910.76976.710.376.7729.67275.39.675.372.99.972.969.510.269.567.610.467.662.210.762.264.311.264.356.512.156.557.911.957.962.411.962.46412.76459.315.259.354.614.354.682.123.682.150.20.550.2median 64median 11.9median 646.62.36.637.632.637.633.425.933.43324.33331.919.731.934.923.334.935.424.935.449.72549.757.719.957.760.617.660.66613.76667.314.367.365.412.565.466.714.166.770.912.270.973.510.173.579.19.579.181.89.281.880.89.680.881.29.681.280.81080.876.89.876.876.310.276.37010.87072.211.472.278.61278.675.41275.468.511.968.570.21270.264.711.864.759.811.659.889.823.189.884.50.484.5median 72.2median 11.8median 72.26.31.96.335.839.935.830.728.630.730.925.530.929.924.529.934.732.334.731.431.631.434.329.334.342.82842.848.81948.859.823.459.863.223.763.267.916.367.972.516.472.575.714.275.771.212.171.270.91170.977.910.477.9799.87980.59.980.580.79.880.781.31081.378.710.378.775.111.175.168.311.468.368.512.368.570.112.570.167.212.367.270.612.370.671.315.271.371.414.371.489.124.489.177.70.677.7median 71.3median 12.3median 71.34.734.7hearing rangehide median Pink NoiseLenovo ThinkPad X1 Carbon Gen 14 21V70075GELenovo ThinkPad X1 Carbon Gen 13 21NX008PGELenovo ThinkPad T14s Gen 7 21YW0022GEAsus ExpertBook Ultra B9406CAADynabook Portege Z40L-NDell Pro 14 PremiumHP EliteBook X G1a 14 AI
Diagramme de fréquence (les cases peuvent être cochées et décochées pour comparer les appareils)
Lenovo ThinkPad X1 Carbon Gen 14 21V70075GE analyse audio

(+) | les haut-parleurs peuvent jouer relativement fort (84.7# dB)
Basses 100 - 315 Hz
(±) | basse réduite - en moyenne 7.4% inférieure à la médiane
(±) | la linéarité des basses est moyenne (9.3% delta à la fréquence précédente)
Médiums 400 - 2000 Hz
(+) | médiane équilibrée - seulement 3.2% de la médiane
(+) | les médiums sont linéaires (3.4% delta à la fréquence précédente)
Aiguës 2 - 16 kHz
(+) | des sommets équilibrés - à seulement 4.5% de la médiane
(+) | les aigus sont linéaires (3.6% delta à la fréquence précédente)
Globalement 100 - 16 000 Hz
(+) | le son global est linéaire (10.4% différence à la médiane)
Par rapport à la même classe
» 2% de tous les appareils testés de cette catégorie étaient meilleurs, 1% similaires, 98% pires
» Le meilleur avait un delta de 7%, la moyenne était de 21%, le pire était de 53%.
Par rapport à tous les appareils testés
» 5% de tous les appareils testés étaient meilleurs, 1% similaires, 93% pires
» Le meilleur avait un delta de 4%, la moyenne était de 23%, le pire était de 134%.

Lenovo ThinkPad X1 Carbon Gen 13 21NX008PGE analyse audio

(+) | les haut-parleurs peuvent jouer relativement fort (89.6# dB)
Basses 100 - 315 Hz
(±) | basse réduite - en moyenne 10.2% inférieure à la médiane
(±) | la linéarité des basses est moyenne (8.9% delta à la fréquence précédente)
Médiums 400 - 2000 Hz
(±) | médiane supérieure - en moyenne 7.2% supérieure à la médiane
(+) | les médiums sont linéaires (4.9% delta à la fréquence précédente)
Aiguës 2 - 16 kHz
(+) | des sommets équilibrés - à seulement 2.9% de la médiane
(±) | la linéarité des aigus est moyenne (7.6% delta à la fréquence précédente)
Globalement 100 - 16 000 Hz
(+) | le son global est linéaire (12.9% différence à la médiane)
Par rapport à la même classe
» 20% de tous les appareils testés de cette catégorie étaient meilleurs, 5% similaires, 75% pires
» Le meilleur avait un delta de 5%, la moyenne était de 18%, le pire était de 53%.
Par rapport à tous les appareils testés
» 12% de tous les appareils testés étaient meilleurs, 3% similaires, 85% pires
» Le meilleur avait un delta de 4%, la moyenne était de 23%, le pire était de 134%.

Lenovo ThinkPad T14s Gen 7 21YW0022GE analyse audio

(+) | les haut-parleurs peuvent jouer relativement fort (86.5# dB)
Basses 100 - 315 Hz
(±) | basse réduite - en moyenne 11.3% inférieure à la médiane
(±) | la linéarité des basses est moyenne (12.4% delta à la fréquence précédente)
Médiums 400 - 2000 Hz
(+) | médiane équilibrée - seulement 4.5% de la médiane
(+) | les médiums sont linéaires (3.9% delta à la fréquence précédente)
Aiguës 2 - 16 kHz
(±) | sommets plus élevés - en moyenne 5% plus élevés que la médiane
(+) | les aigus sont linéaires (5% delta à la fréquence précédente)
Globalement 100 - 16 000 Hz
(+) | le son global est linéaire (13.3% différence à la médiane)
Par rapport à la même classe
» 7% de tous les appareils testés de cette catégorie étaient meilleurs, 2% similaires, 90% pires
» Le meilleur avait un delta de 7%, la moyenne était de 21%, le pire était de 53%.
Par rapport à tous les appareils testés
» 14% de tous les appareils testés étaient meilleurs, 3% similaires, 83% pires
» Le meilleur avait un delta de 4%, la moyenne était de 23%, le pire était de 134%.

Asus ExpertBook Ultra B9406CAA analyse audio

(+) | les haut-parleurs peuvent jouer relativement fort (86.8# dB)
Basses 100 - 315 Hz
(±) | basse réduite - en moyenne 8.4% inférieure à la médiane
(±) | la linéarité des basses est moyenne (9.3% delta à la fréquence précédente)
Médiums 400 - 2000 Hz
(+) | médiane équilibrée - seulement 2.5% de la médiane
(+) | les médiums sont linéaires (1.5% delta à la fréquence précédente)
Aiguës 2 - 16 kHz
(+) | des sommets équilibrés - à seulement 3.7% de la médiane
(+) | les aigus sont linéaires (5.2% delta à la fréquence précédente)
Globalement 100 - 16 000 Hz
(+) | le son global est linéaire (8.5% différence à la médiane)
Par rapport à la même classe
» 0% de tous les appareils testés de cette catégorie étaient meilleurs, 0% similaires, 99% pires
» Le meilleur avait un delta de 7%, la moyenne était de 21%, le pire était de 53%.
Par rapport à tous les appareils testés
» 2% de tous les appareils testés étaient meilleurs, 1% similaires, 97% pires
» Le meilleur avait un delta de 4%, la moyenne était de 23%, le pire était de 134%.

Dynabook Portege Z40L-N analyse audio

(+) | les haut-parleurs peuvent jouer relativement fort (82.1# dB)
Basses 100 - 315 Hz
(-) | presque aucune basse - en moyenne 19.3% plus bas que la médiane
(±) | la linéarité des basses est moyenne (12.3% delta à la fréquence précédente)
Médiums 400 - 2000 Hz
(±) | médiane supérieure - en moyenne 6.9% supérieure à la médiane
(+) | les médiums sont linéaires (6.1% delta à la fréquence précédente)
Aiguës 2 - 16 kHz
(+) | des sommets équilibrés - à seulement 3% de la médiane
(+) | les aigus sont linéaires (6.8% delta à la fréquence précédente)
Globalement 100 - 16 000 Hz
(±) | la linéarité du son global est moyenne (18.3% de différence avec la médiane)
Par rapport à la même classe
» 33% de tous les appareils testés de cette catégorie étaient meilleurs, 6% similaires, 61% pires
» Le meilleur avait un delta de 7%, la moyenne était de 21%, le pire était de 53%.
Par rapport à tous les appareils testés
» 40% de tous les appareils testés étaient meilleurs, 8% similaires, 52% pires
» Le meilleur avait un delta de 4%, la moyenne était de 23%, le pire était de 134%.

Dell Pro 14 Premium analyse audio

(+) | les haut-parleurs peuvent jouer relativement fort (89.8# dB)
Basses 100 - 315 Hz
(±) | basse réduite - en moyenne 8.2% inférieure à la médiane
(+) | les basses sont linéaires (5.7% delta à la fréquence précédente)
Médiums 400 - 2000 Hz
(±) | médiane supérieure - en moyenne 6.3% supérieure à la médiane
(+) | les médiums sont linéaires (4.3% delta à la fréquence précédente)
Aiguës 2 - 16 kHz
(+) | des sommets équilibrés - à seulement 3.1% de la médiane
(+) | les aigus sont linéaires (6.4% delta à la fréquence précédente)
Globalement 100 - 16 000 Hz
(+) | le son global est linéaire (11.3% différence à la médiane)
Par rapport à la même classe
» 3% de tous les appareils testés de cette catégorie étaient meilleurs, 2% similaires, 95% pires
» Le meilleur avait un delta de 7%, la moyenne était de 21%, le pire était de 53%.
Par rapport à tous les appareils testés
» 7% de tous les appareils testés étaient meilleurs, 2% similaires, 91% pires
» Le meilleur avait un delta de 4%, la moyenne était de 23%, le pire était de 134%.

HP EliteBook X G1a 14 AI analyse audio

(+) | les haut-parleurs peuvent jouer relativement fort (89.1# dB)
Basses 100 - 315 Hz
(±) | basse réduite - en moyenne 12.5% inférieure à la médiane
(±) | la linéarité des basses est moyenne (10.8% delta à la fréquence précédente)
Médiums 400 - 2000 Hz
(±) | médiane supérieure - en moyenne 6% supérieure à la médiane
(+) | les médiums sont linéaires (3.9% delta à la fréquence précédente)
Aiguës 2 - 16 kHz
(+) | des sommets équilibrés - à seulement 3.3% de la médiane
(+) | les aigus sont linéaires (5.1% delta à la fréquence précédente)
Globalement 100 - 16 000 Hz
(+) | le son global est linéaire (11.5% différence à la médiane)
Par rapport à la même classe
» 3% de tous les appareils testés de cette catégorie étaient meilleurs, 2% similaires, 95% pires
» Le meilleur avait un delta de 7%, la moyenne était de 21%, le pire était de 53%.
Par rapport à tous les appareils testés
» 8% de tous les appareils testés étaient meilleurs, 2% similaires, 90% pires
» Le meilleur avait un delta de 4%, la moyenne était de 23%, le pire était de 134%.

Consommation électrique et autonomie de la batterie

Le X1 Carbon, équipé d’un écran tactile IPS à faible consommation, est un système très efficace dont la consommation maximale en veille est inférieure à 5 watts. Nous avons mesuré jusqu’à 64 watts en charge, mais cette valeur chute rapidement à 45-55 watts lors du test de résistance ; l’adaptateur secteur de 65 W est donc suffisant.

Le point fort réside sans conteste dans l’autonomie de la batterie, puisque nous avons mesuré plus de 23 heures lors de notre test Wi-Fi à 150 nits, malgré une capacité de batterie relativement faible de 58 Wh. À luminosité maximale, le test Wi-Fi dure tout de même plus de 14 heures, ce qui surpasse largement tous les concurrents.

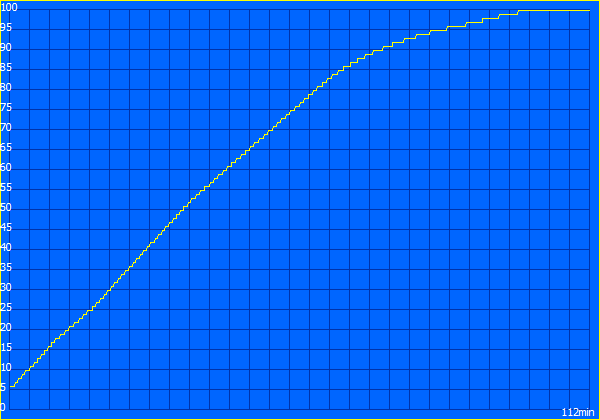
Bloc d'alimentation de 65 W
Facturation
Facturation
Consommation énergétique
Éteint/en veilledarklight 0.22 / 0.64 Watts
Au reposdarkmidlight 1.6 / 4.6 / 4.9 Watts
Fortement sollicité midlight 39.7 / 64.2 Watts
 color bar
Légende: min: dark, med: mid, max: light        Metrahit Energy

Consommation électrique Cyberpunk / Test de résistance

051015202530354045505560Tooltip
Lenovo ThinkPad X1 Carbon Gen 14 21V70075GE; 1280x720 Prime95 28.10 and Furmark 1.25: Ø58.8 (49.5-64.2) Watt
Lenovo ThinkPad X1 Carbon Gen 14 21V70075GE; Idle 150cd/m2: Ø2.81 (2.56-3.76) Watt
Lenovo ThinkPad X1 Carbon Gen 14 21V70075GE; Cyberpunk 2077 FHD ultra no FSR 150cd: Ø45.2 (43.7-47.9) Watt

Consommation électrique d'un écran externe

051015202530354045505560Tooltip
Lenovo ThinkPad X1 Carbon Gen 14 21V70075GE; Prime95 V2810 Stress (external Monitor): Ø54.8 (53-64.3) Watt
Lenovo ThinkPad X1 Carbon Gen 14 21V70075GE; Cinebench R23 Single (external Monitor): Ø18 (2.33-45.4) Watt
Lenovo ThinkPad X1 Carbon Gen 14 21V70075GE; Cinebench R23 Multi (external Monitor): Ø51.8 (49.2-60.2) Watt
Lenovo ThinkPad X1 Carbon Gen 14 21V70075GE; 1280x720 FurMark 1.19 GPU Stress Test (external Monitor): Ø47.4 (44.9-49.9) Watt
Lenovo ThinkPad X1 Carbon Gen 14 21V70075GE; Idle 1min (external Monitor): Ø4.94 (4.66-5.92) Watt
Lenovo ThinkPad X1 Carbon Gen 14 21V70075GE; Cyberpunk 2077 FHD ultra no FSR (external Monitor): Ø46.1 (44.9-49.3) Watt

Autonomie de la batterie

Autonomie
WiFi Websurfing
23h 13min
WiFi Websurfing max. Brightness
14h 14min
Battery Runtime
WiFi Websurfing
Lenovo ThinkPad X1 Carbon Gen 14 21V70075GE
Ultra 5 325, Intel Graphics 4 Xe3 PTL, 58 Wh
23.2 h
Dynabook Portege Z40L-N
Core Ultra 7 258V, Arc 140V, 56 Wh
19.1 h -18%
Lenovo ThinkPad T14s Gen 7 21YW0022GE
Ryzen AI 7 PRO 450, Radeon 860M, 58 Wh
17.4 h -25%
Asus ExpertBook Ultra B9406CAA
Ultra X7 358H, Arc B390 Panther Lake iGPU, 70 Wh
16.1 h -31%
Dell Pro 14 Premium
Core Ultra 7 268V, Arc 140V, 60 Wh
15.2 h -34%
HP EliteBook X G1a 14 AI
Ryzen AI 9 HX PRO 375, Radeon 890M, 74.5 Wh
14.2 h -39%
Lenovo ThinkPad X1 Carbon Gen 13 21NX008PGE
Ultra 5 225U, Graphics 4-Core iGPU (Arrow Lake), 57 Wh
14.1 h -39%
Moyenne de la classe Office
  (3.83 - 31.5, n=77, 2 dernières années)
13.2 h -43%
Lenovo ThinkPad X1 Carbon Gen 13 21NS0010GE
Core Ultra 7 258V, Arc 140V, 57 Wh
11 h -53%
WiFi Websurfing max. Brightness
Lenovo ThinkPad X1 Carbon Gen 14 21V70075GE
Ultra 5 325, Intel Graphics 4 Xe3 PTL, 58 Wh
14.2 h
Lenovo ThinkPad T14s Gen 7 21YW0022GE
Ryzen AI 7 PRO 450, Radeon 860M, 58 Wh
11.5 h -19%
Lenovo ThinkPad X1 Carbon Gen 13 21NS0010GE
Core Ultra 7 258V, Arc 140V, 57 Wh
10.7 h -25%
Moyenne de la classe Office
  (5.7 - 14.9, n=28, 2 dernières années)
9.64 h -32%

Note de Notebookcheck

Lenovo ThinkPad X1 Carbon Gen 14 21V70075GE - 07/25/2026 v8
Andreas Osthoff

Châssis
90 / 98 → 92%
Clavier
92%
Dispositif de pointage
96%
Connectivité
78 / 80 → 98%
Poids
73 / 20-75 → 97%
Autonomie
92%
Écran
80%
Performances en jeu
50 / 75 → 67%
Performances dans les applications
86 / 92 → 93%
AI Performance
89%
Chauffe
93%
Nuisance sonore
89%
Audio
89%
Appareil photo
41 / 75 → 55%
Moyenne
79%
90%
Office - Moyenne compensée
CO2 Emissions
81.5%
Materials
75%
Packaging
100%
Power Use
88.4%
Repairability
50%
Software Updates
50%
Recycle Logo Total Sustainability Score: 74.1%

Comparaison avec les concurrents potentiels

Image
Modèle
Prix
Poids
Épaisseur
Écran
1.
89.9%
Lenovo ThinkPad X1 Carbon Gen 14 21V70075GE
Intel Core Ultra 5 325 ⎘
Intel Graphics 4 Xe3 Panther Lake iGPU ⎘
32 Go Mémoire, 512 Go SSD
Amazon:
1. $1,899.00
Lenovo ThinkPad X1 Carbon Ge...
2. $719.00
Lenovo Thinkpad X1 Carbon Ge...
3. $2,398.99
Lenovo ThinkPad X1 Carbon Bu...
Prix de liste: 2469€
1.1 kg16.8 mm14.00"
1920x1200
162 PPI
IPS
2.
89.1%
Lenovo ThinkPad X1 Carbon Gen 13 21NX008PGE
Intel Core Ultra 5 225U ⎘
Intel Graphics 4-Core iGPU (Meteor / Arrow Lake) ⎘
16 Go Mémoire, 512 Go SSD
Amazon: Prix de liste: 1955 Euro1.2 kg17.5 mm14.00"
1920x1200
162 PPI
IPS LED
3.
89.7%
Lenovo ThinkPad T14s Gen 7 21YW0022GE
AMD Ryzen AI 7 PRO 450 ⎘
AMD Radeon 860M ⎘
64 Go Mémoire, 512 Go SSD
Amazon:
1. $1,399.99
Lenovo ThinkPad T14s Gen 6 2...
2. $849.99
Lenovo ThinkPad E14 Gen 7 Bu...
3. $1,069.99
Lenovo 2026 ThinkPad E14 Gen...
1.2 kg15.9 mm14.00"
1920x1200
162 PPI
IPS
4.
87.6%
Asus ExpertBook Ultra B9406CAA
Intel Core Ultra X7 358H ⎘
Intel Arc B390 12 Xe3 Panther Lake iGPU ⎘
32 Go Mémoire, 2048 Go SSD
Amazon: 1.1 kg15.9 mm14.00"
2880x1800
243 PPI
OLED
5.
86.2%
Dynabook Portege Z40L-N
Intel Core Ultra 7 258V ⎘
Intel Arc Graphics 140V ⎘
32 Go Mémoire, 1024 Go
Amazon:
1. $2,130.95
dynabook Portégé Z40L-N 14...
2. $1,059.00
dynabook Satellite Pro C50-K...
3. $1,209.00
dynabook Tecra A45-M 14” B...
Prix de liste: 2200 USD
961 g18.9 mm14.00"
1920x1200
162 PPI
IPS
6.
86.4%
Dell Pro 14 Premium
Dell Pro 14 Premium
Intel Core Ultra 7 268V ⎘
Intel Arc Graphics 140V ⎘
32 Go Mémoire, 1024 Go SSD
Prix de liste: 2500 USD1.3 kg17.95 mm14.00"
2880x1800
243 PPI
OLED
7.
88.7%
HP EliteBook X G1a 14 AI
AMD Ryzen AI 9 HX PRO 375 ⎘
AMD Radeon 890M ⎘
32 Go Mémoire, 1024 Go SSD
Amazon: Prix de liste: 2200 USD1.5 kg13.2 mm14.00"
1920x1200
162 PPI
IPS

Transparency

La sélection des appareils à examiner est effectuée par notre équipe éditoriale. L'échantillon de test a été prêté à l'auteur par le fabricant ou le détaillant pour les besoins de cet examen. Le prêteur n'a pas eu d'influence sur cette évaluation et le fabricant n'a pas reçu de copie de cette évaluation avant sa publication. Il n'y avait aucune obligation de publier cet article. En tant que média indépendant, Notebookcheck n'est pas soumis à l'autorité des fabricants, des détaillants ou des éditeurs.

Voici comment Notebookcheck teste

Chaque année, Notebookcheck examine de manière indépendante des centaines d'ordinateurs portables et de smartphones en utilisant des procédures standardisées afin de garantir que tous les résultats sont comparables. Nous avons continuellement développé nos méthodes de test depuis environ 20 ans et avons établi des normes industrielles dans le processus. Dans nos laboratoires de test, des équipements de mesure de haute qualité sont utilisés par des techniciens et des rédacteurs expérimentés. Ces tests impliquent un processus de validation en plusieurs étapes. Notre système d'évaluation complexe repose sur des centaines de mesures et de points de référence bien fondés, ce qui garantit l'objectivité.
Google LogoAdd as a preferred source on Google
Mail Logo
> Revues et rapports de ordinateurs portatifs et smartphones, ordiphones > Critiques > Ordinateur portable professionnel phare offrant près de 24 heures d'autonomie : test du Lenovo ThinkPad X1 Carbon Gen 14
Andreas Osthoff, 2026-07-25 (Update: 2026-07-25)