

Verdict - L'un des ordinateurs portables RTX 5070 Ti les plus rapides
L'Erazer Major 16 X1 a révélé peu de défauts notables lors de notre examen. Mis à part les températures élevées au ralenti, les haut-parleurs médiocres et le bruit prononcé du ventilateur en charge (en mode jeu), il n'y a pas d'inconvénients majeurs. Le châssis basé à Tongfang impressionne par sa construction robuste, sa sélection de ports étendue et ses périphériques d'entrée réactifs. L'écran QHD+ est lumineux et offre une excellente précision des couleurs dès la sortie de la boîte. L'alimentation compacte de 250 watts et l'obturateur mécanique de la webcam sont également dignes d'éloges.
Medion ne laisse rien à désirer en termes de performances. Le Core Ultra 7 255HX et le GeForce RTX 5070 Ti garantissent des vitesses élevées et surtout constantes dans les applications et les jeux. Tout bien considéré, nous pouvons recommander en toute confiance le modèle 16 pouces
Points positifs
Points négatifs
Prix et disponibilité
Le Medion Erazer Major 16 X1 MD62736 est disponible à partir d'environ 2 600 € (environ 2 800 USD) chez différents revendeurs en ligne (par exemple, notebooksbilliger.de)
Pour mettre le Major 16 X1 à l'épreuve, nous l'avons confronté à des rivaux de taille : le MSI Katana 17 HX (RTX 5070), le MSI Vector 16 HX AI (RTX 5070 Ti), et la puissante Medion Erazer Beast 18 X1 (RTX 5080). Pour faire bonne mesure, nous avons également inclus l'ancienne génération Erazer Major X20 avec une RTX 4070 dans nos tableaux comparatifs.
Spécifications
Châssis
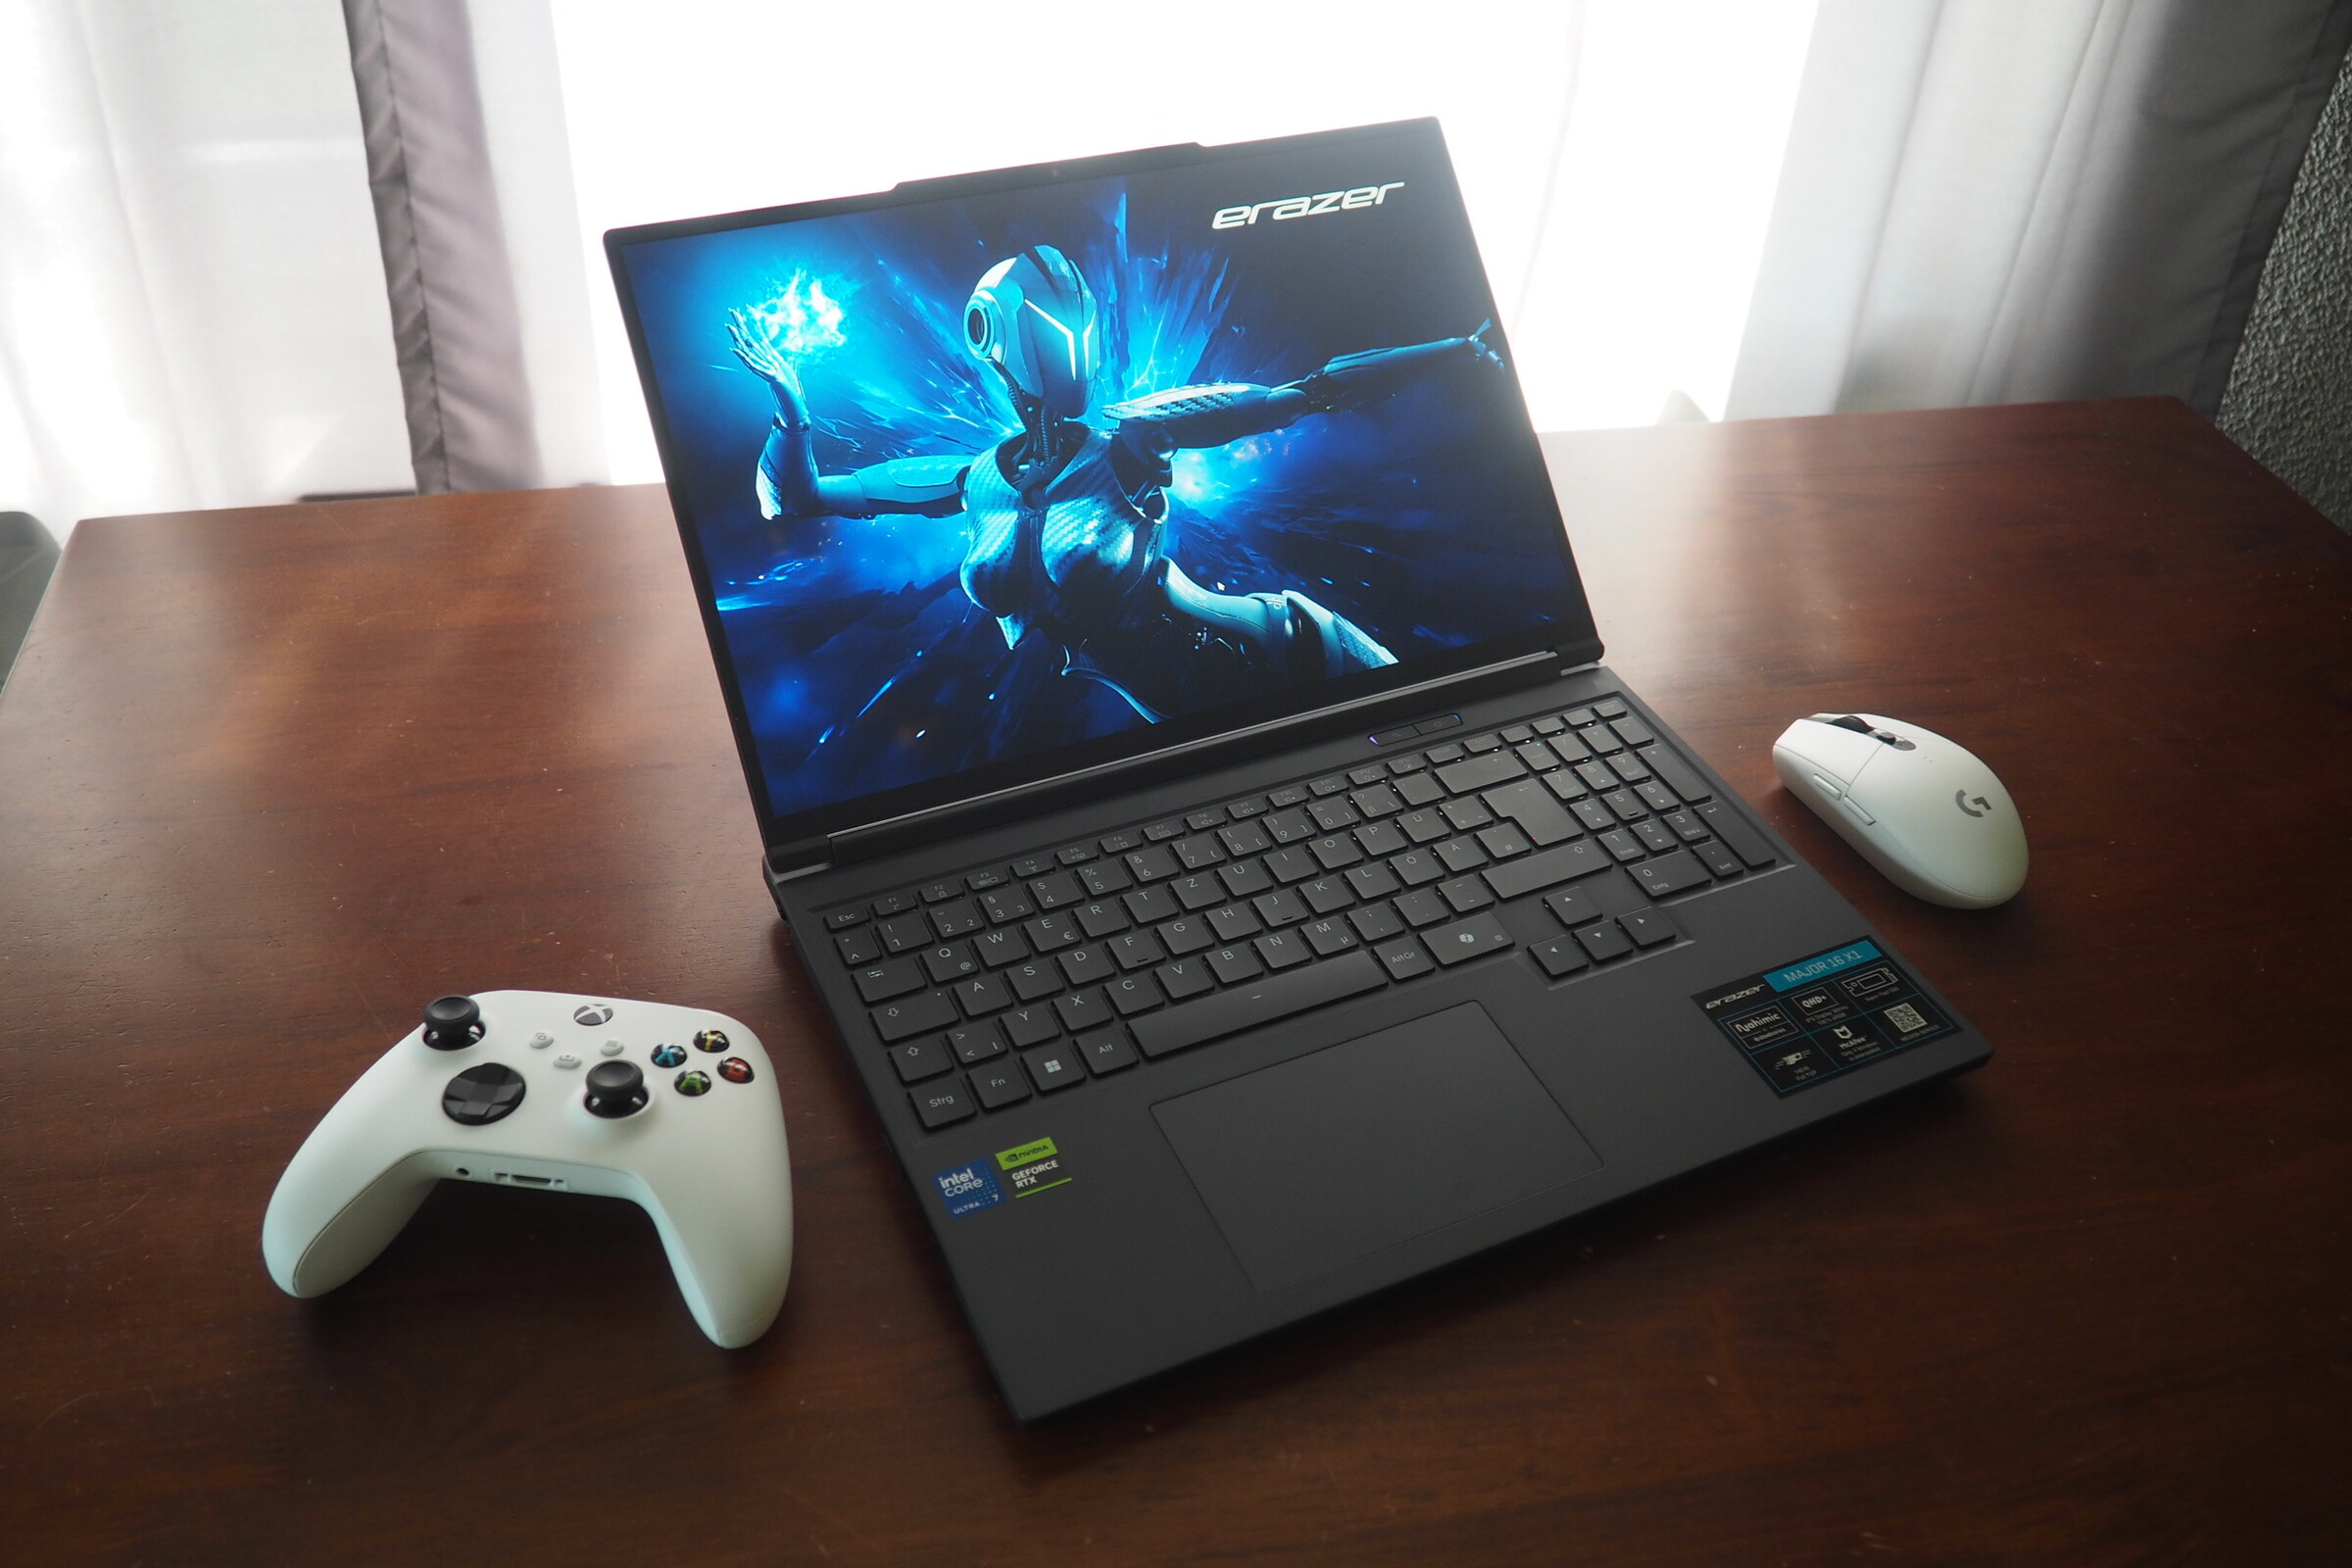
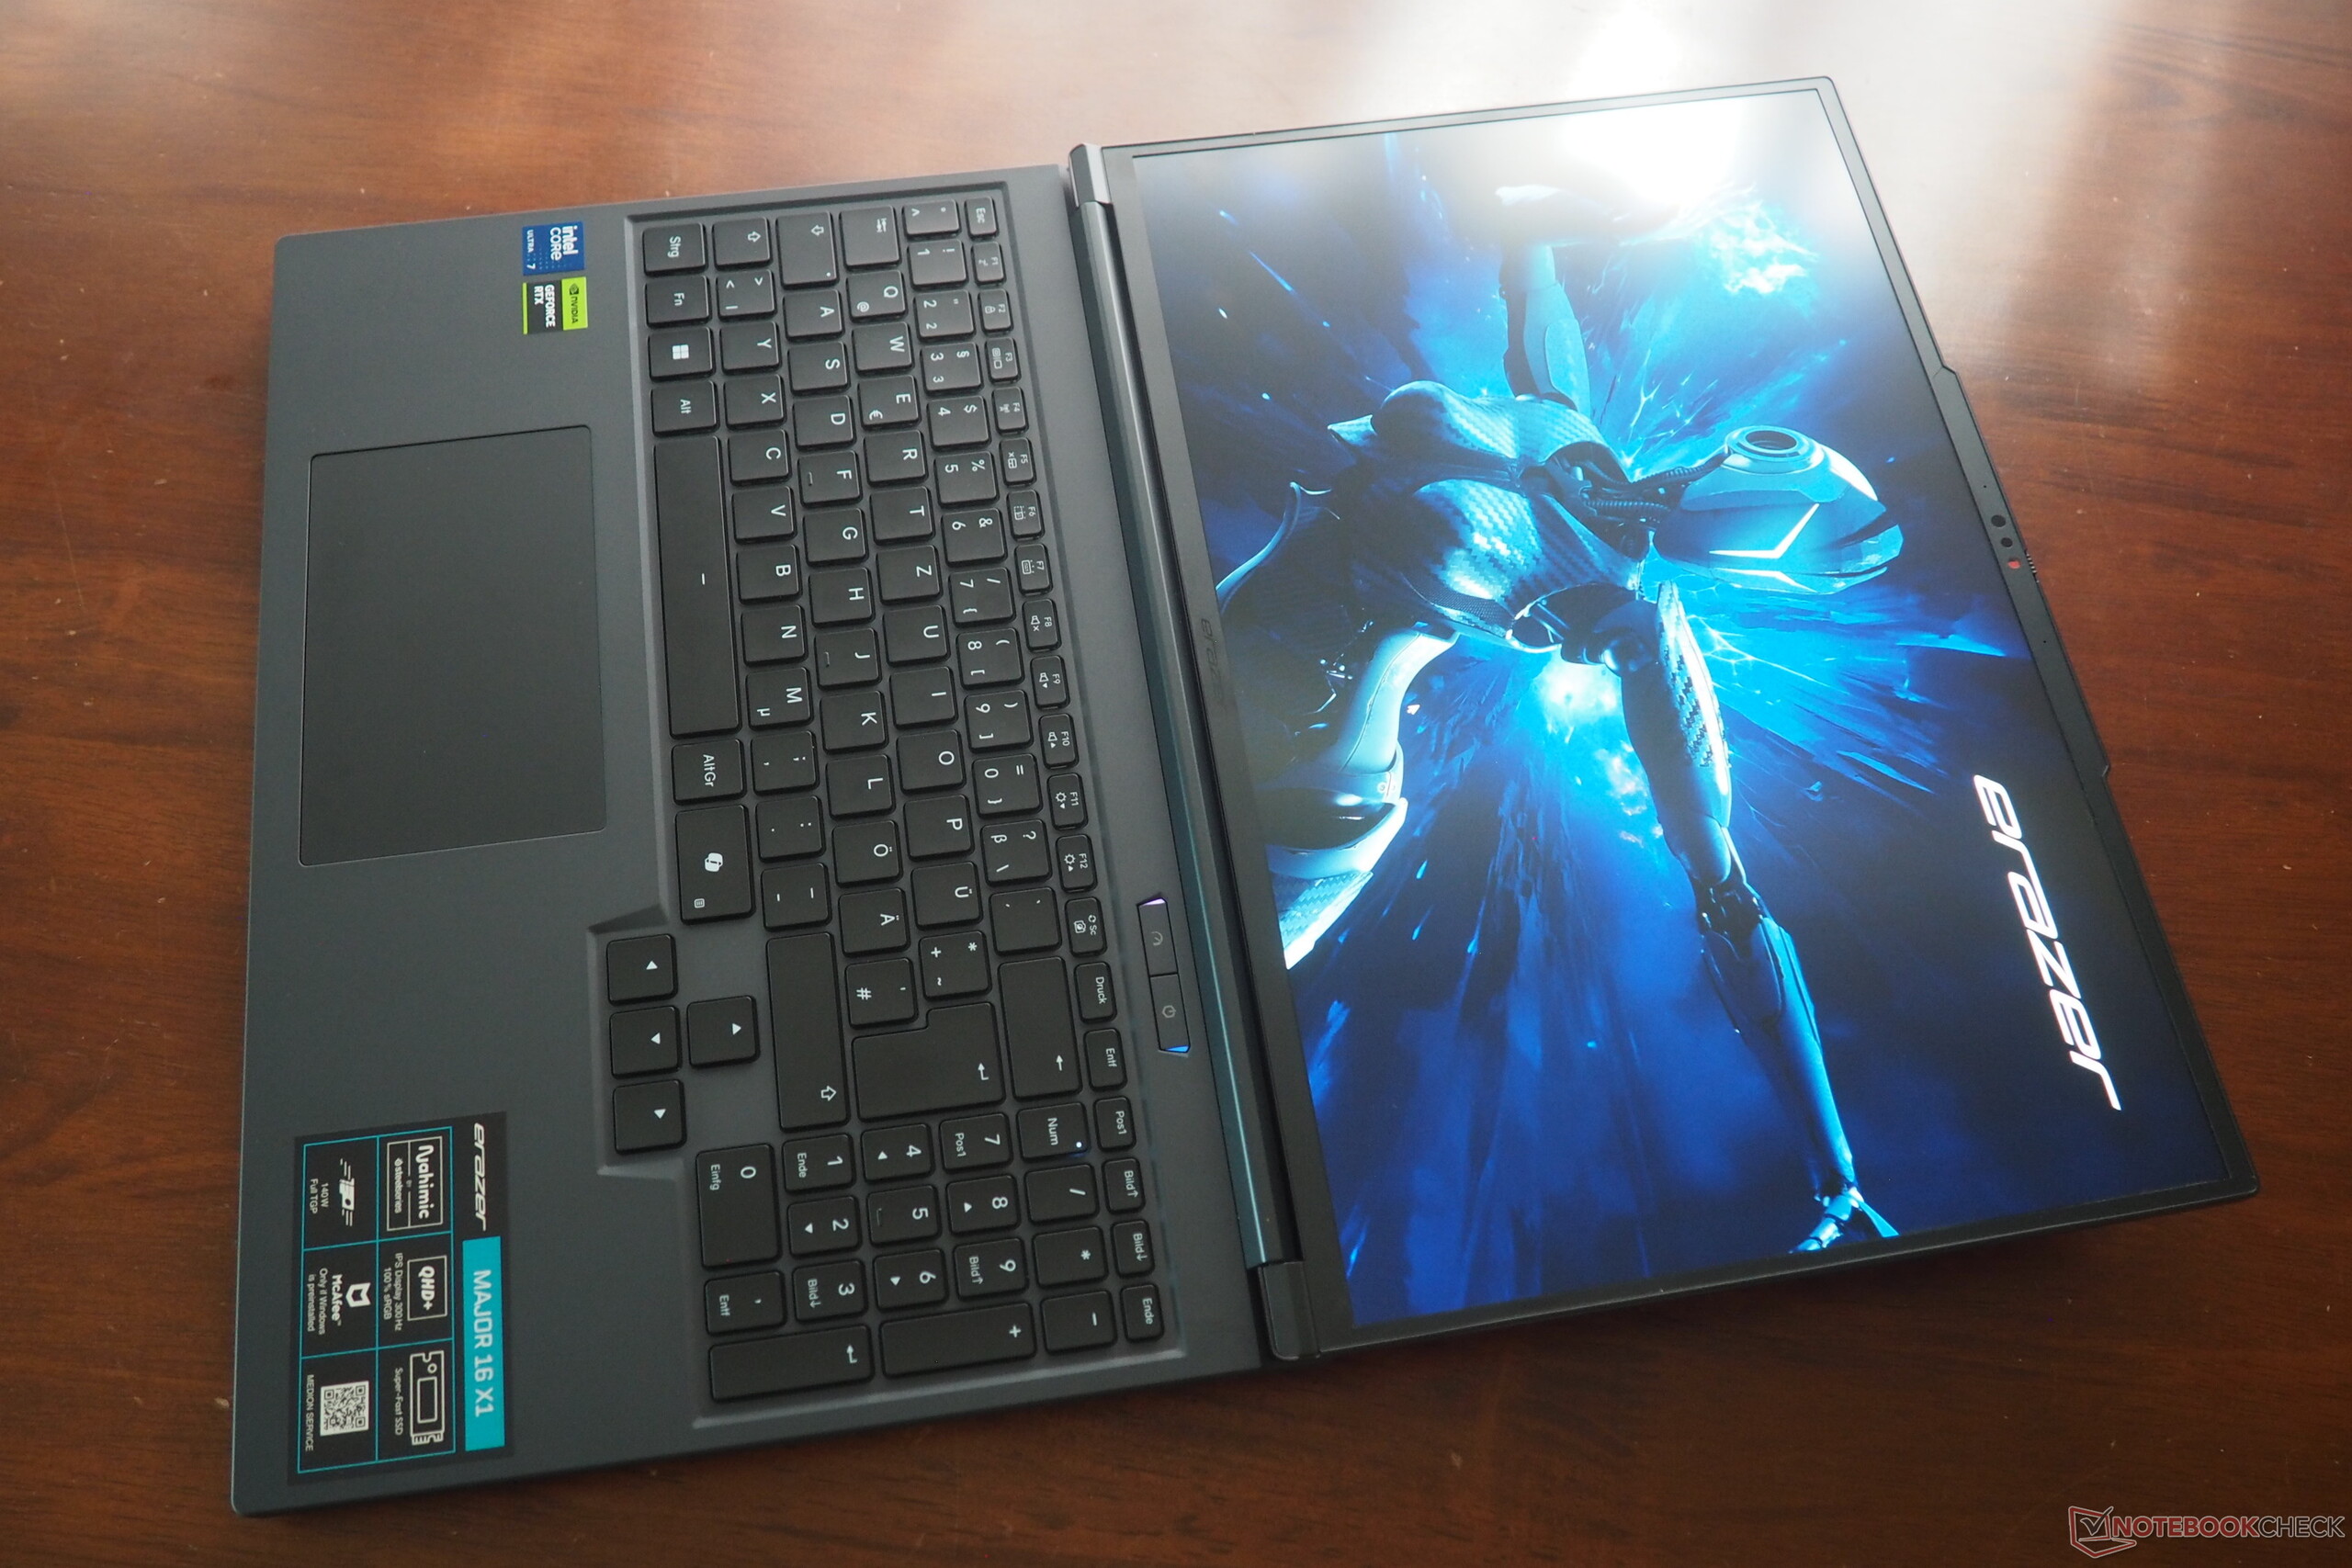
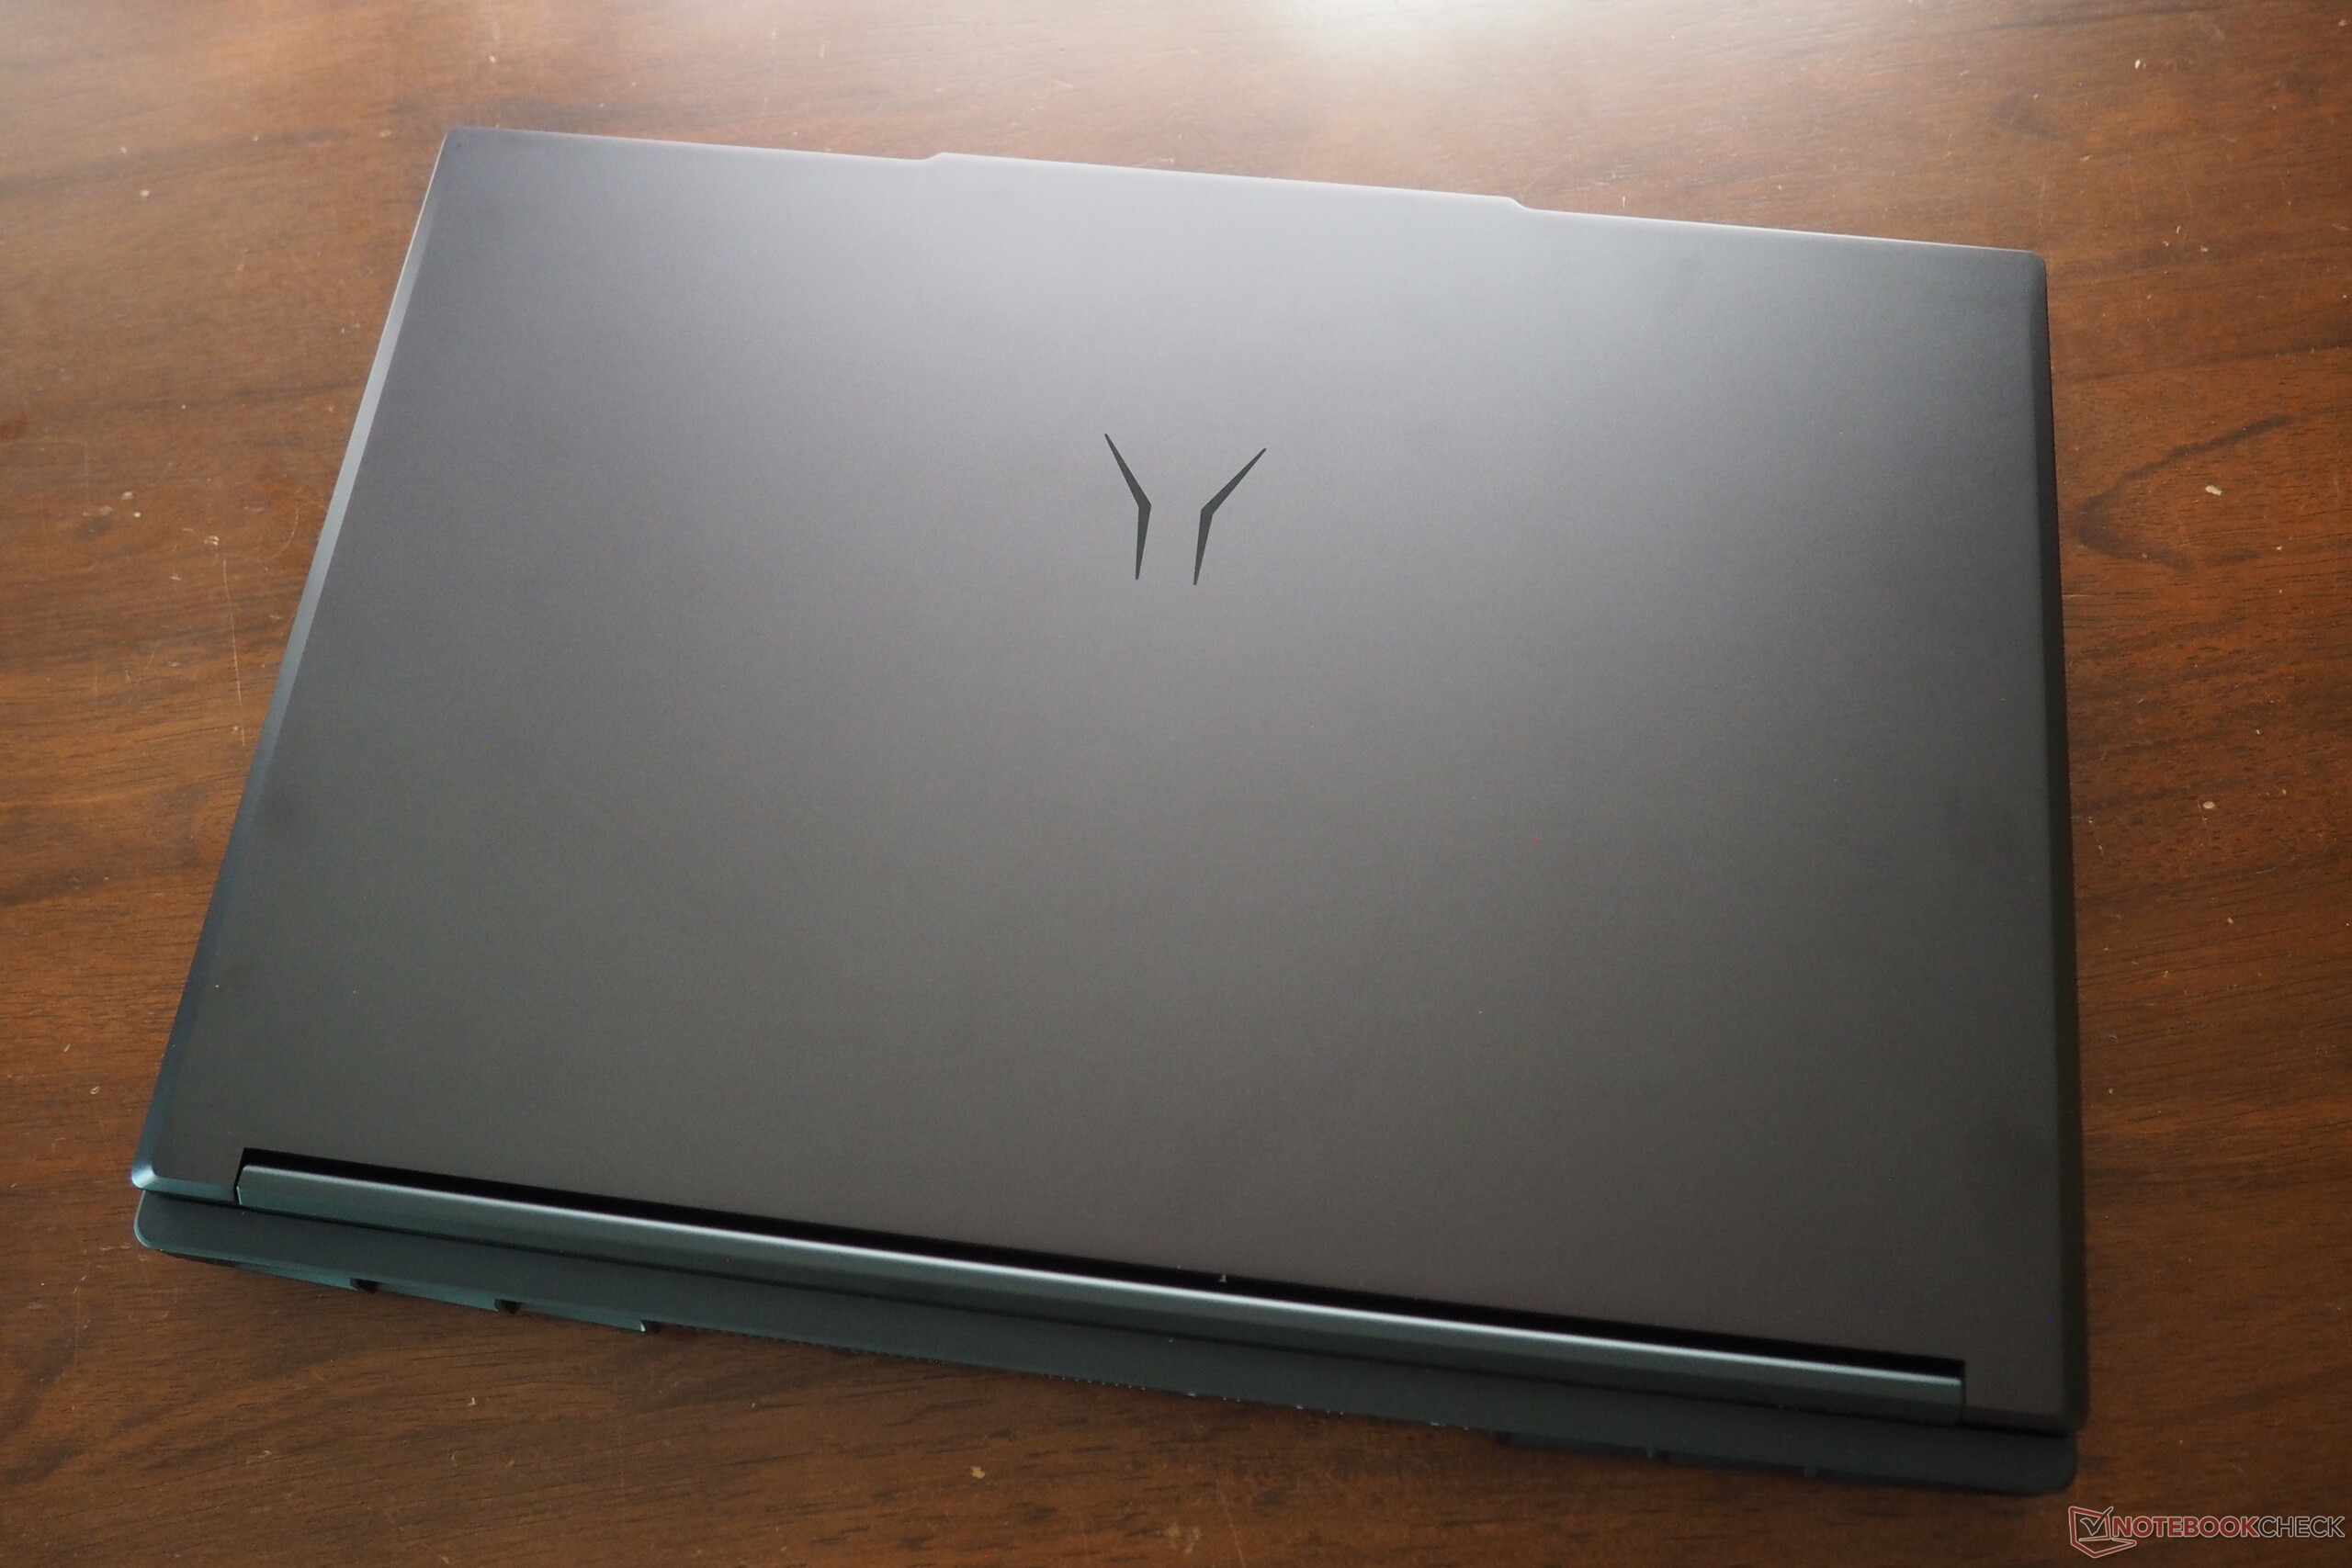
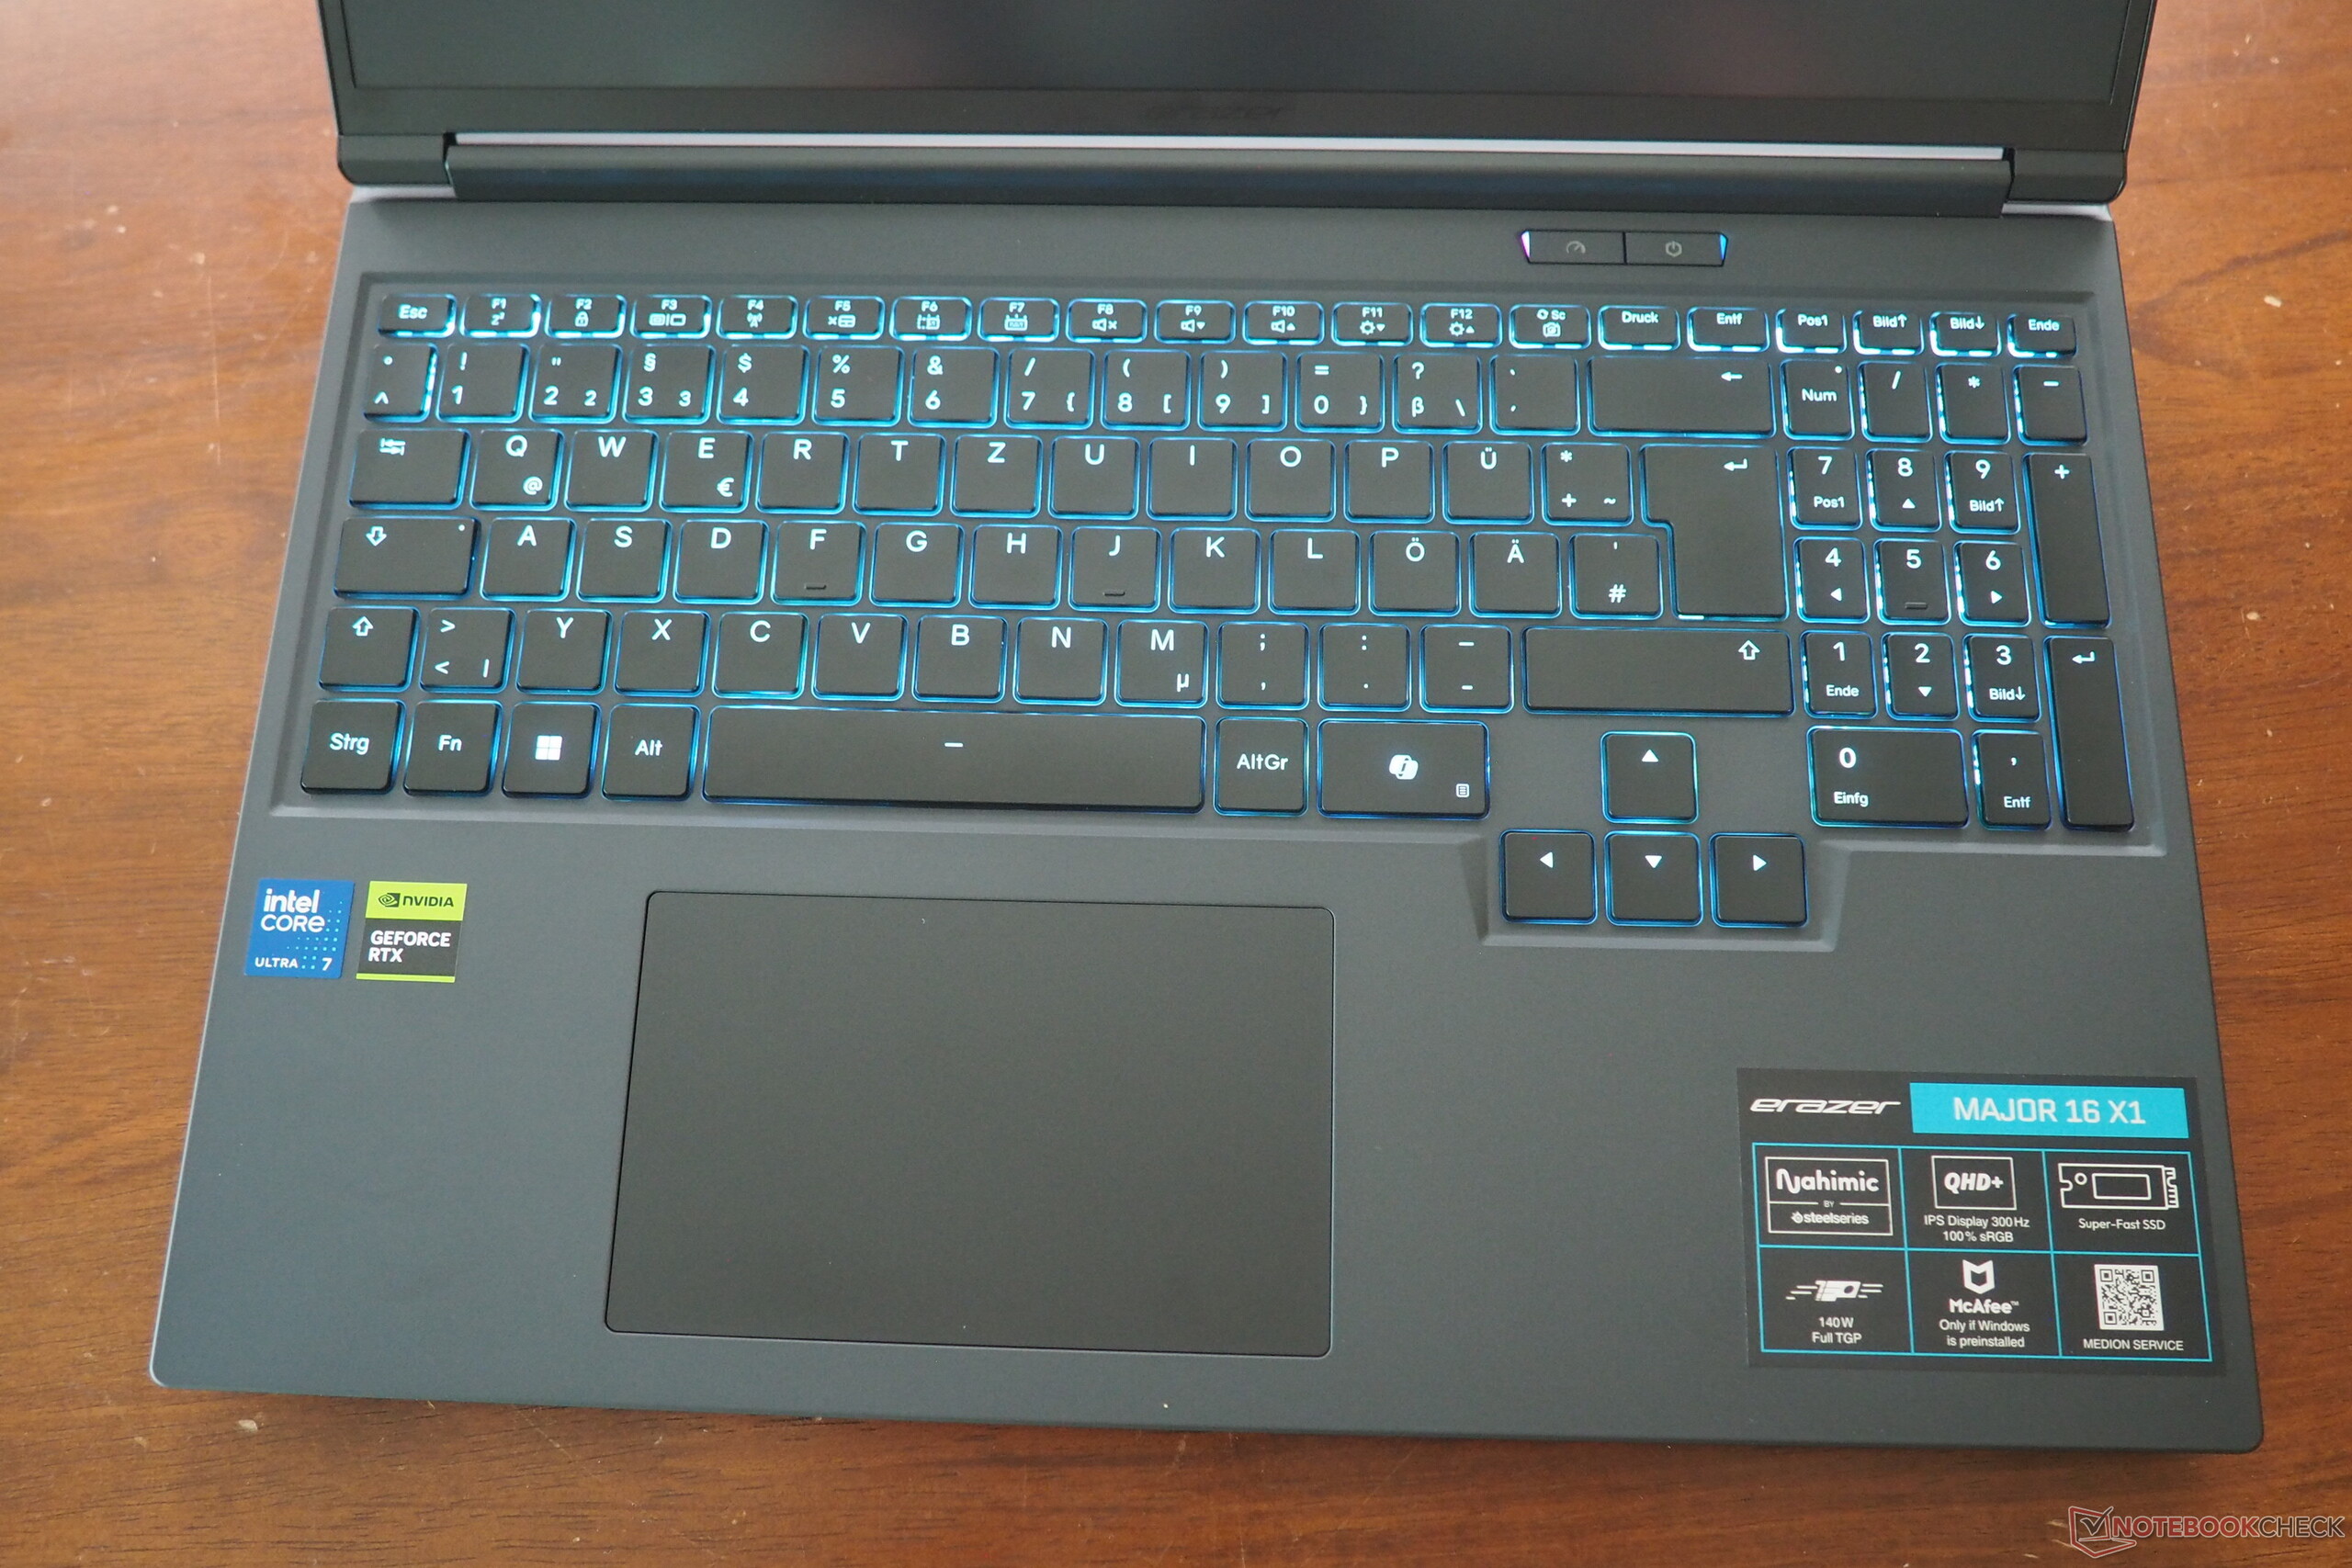
Le châssis du Major 16 X1 diffère sensiblement de celui du Major X20 que nous avons testé en 2023. Medion a opté pour une construction très robuste qui procure une agréable sensation de qualité supérieure, grâce à son couvercle métallique et à sa surface supérieure caoutchoutée. Medion se distingue également par la charnière à 180° de l'écran. La qualité de construction ne laisse aucune place à la critique. Avec un poids d'environ 2,5 kg, l'appareil de 16 pouces est légèrement plus lourd que son prédécesseur, mais un peu plus léger que le Vector 16.

Connectivité et caractéristiques
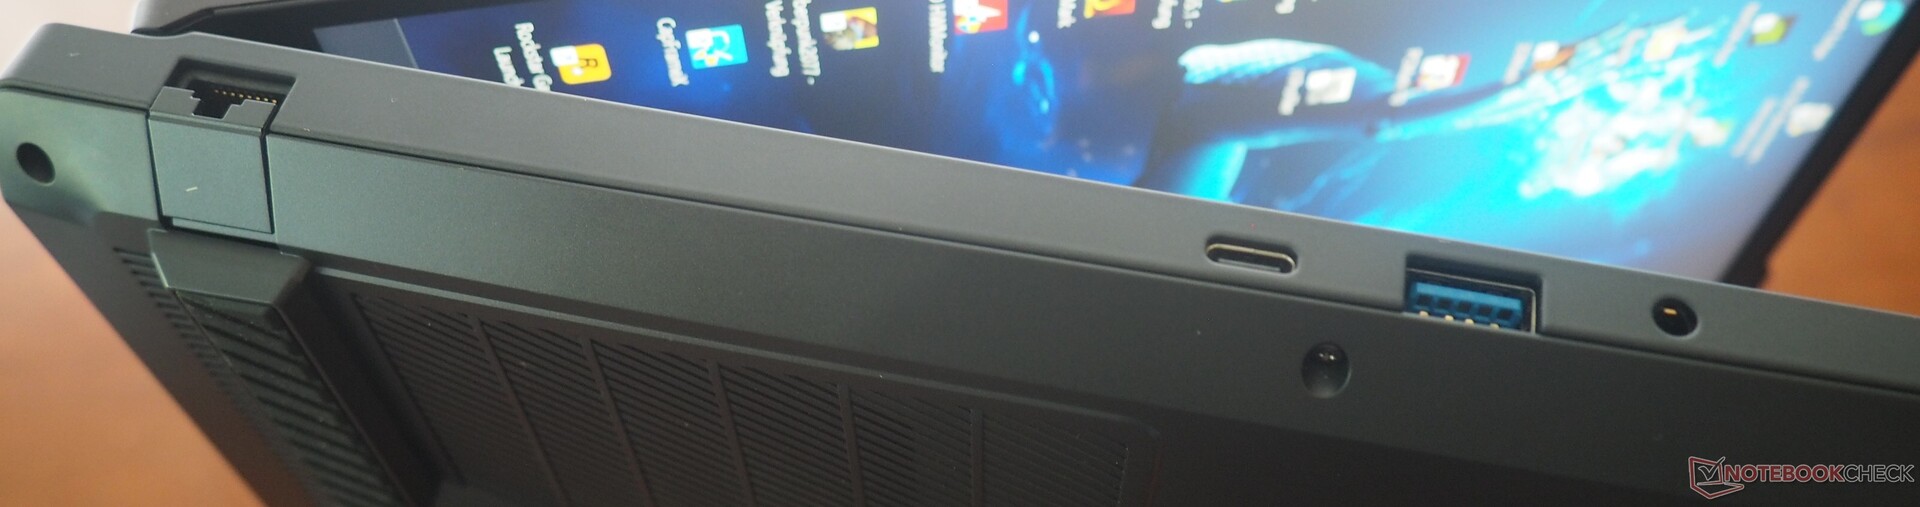
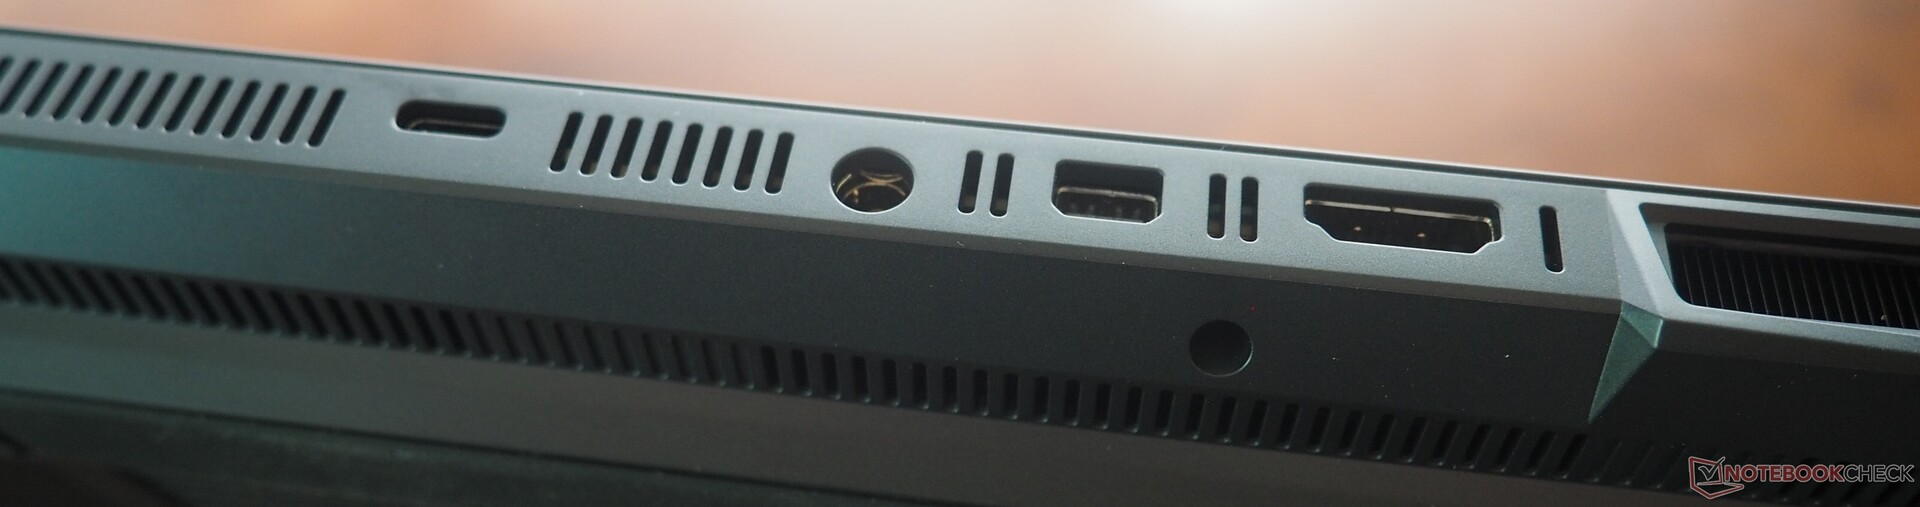
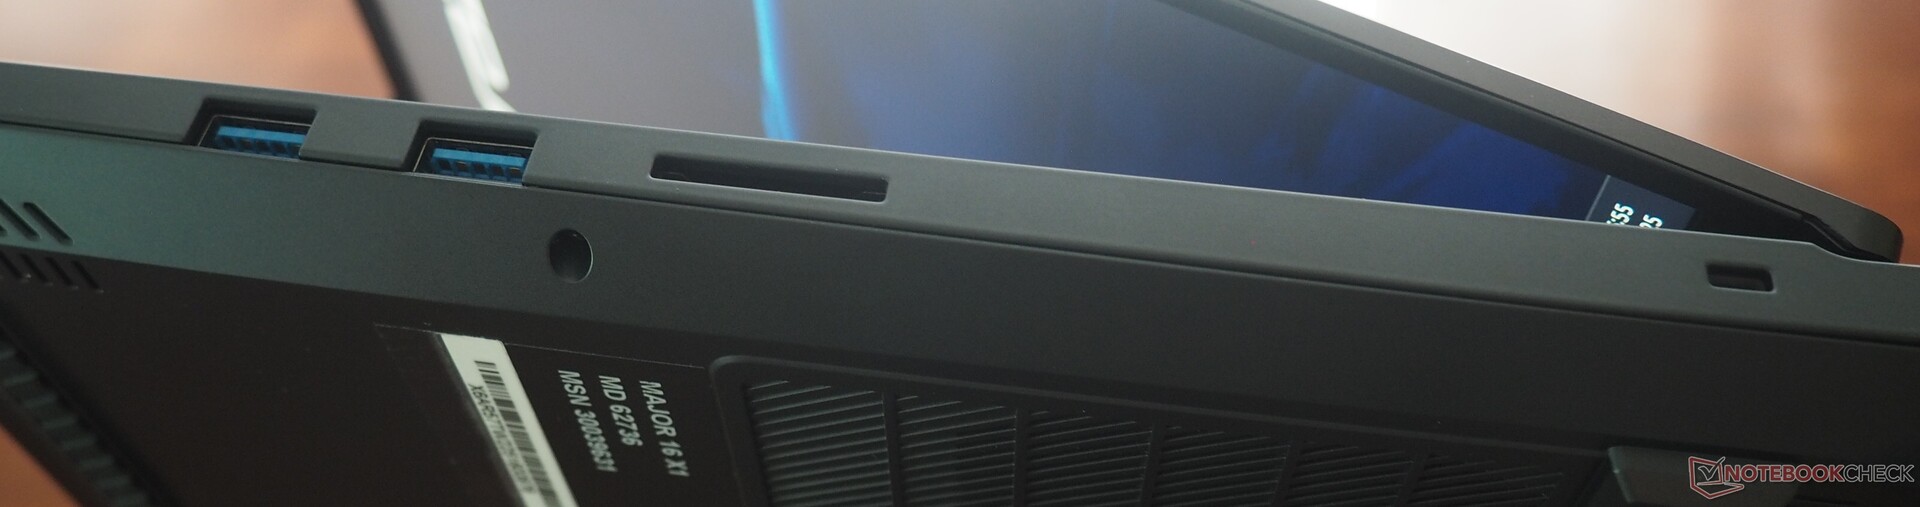
Le Major 16 X1 offre une large gamme de ports. Sur le front USB, il y a quatre ports USB 3.2 Gen1 (3x Type-A, 1x Type-C) et un port USB 3.2 Gen2 Type-C avec Power Delivery et support Thunderbolt 4. Les écrans externes peuvent être connectés via HDMI 2.1 ou DisplayPort 2.1a. Parmi les autres caractéristiques, citons l'Ethernet 2,5 Gbit, un lecteur de cartes SD très rapide, une prise audio combo et un emplacement pour verrou Kensington.
La connectivité sans fil est assurée par le module Wi-Fi 6E AX211 d'Intel, qui fonctionne comme prévu. La webcam Full HD intégrée offre une qualité d'image décente.
Lecteur de carte SD
| SD Card Reader | |
| average JPG Copy Test (av. of 3 runs) | |
| Medion Erazer Major 16 X1 MD62736 (AV PRO microSD 128 GB V60) | |
| Medion Erazer Beast 18 X1 MD62731 (AV PRO microSD 128 GB V60) | |
| Moyenne de la classe Gaming (20 - 204, n=72, 2 dernières années) | |
| MSI Vector 16 HX AI A2XWHG (AV PRO microSD 128 GB V60) | |
| Medion Erazer Major X20 (AV PRO microSD 128 GB V60) | |
| maximum AS SSD Seq Read Test (1GB) | |
| Medion Erazer Major 16 X1 MD62736 (AV PRO microSD 128 GB V60) | |
| Medion Erazer Beast 18 X1 MD62731 (AV PRO microSD 128 GB V60) | |
| Moyenne de la classe Gaming (25.8 - 261, n=71, 2 dernières années) | |
| MSI Vector 16 HX AI A2XWHG (AV PRO microSD 128 GB V60) | |
| Medion Erazer Major X20 (AV PRO microSD 128 GB V60) | |
Communication
Webcam


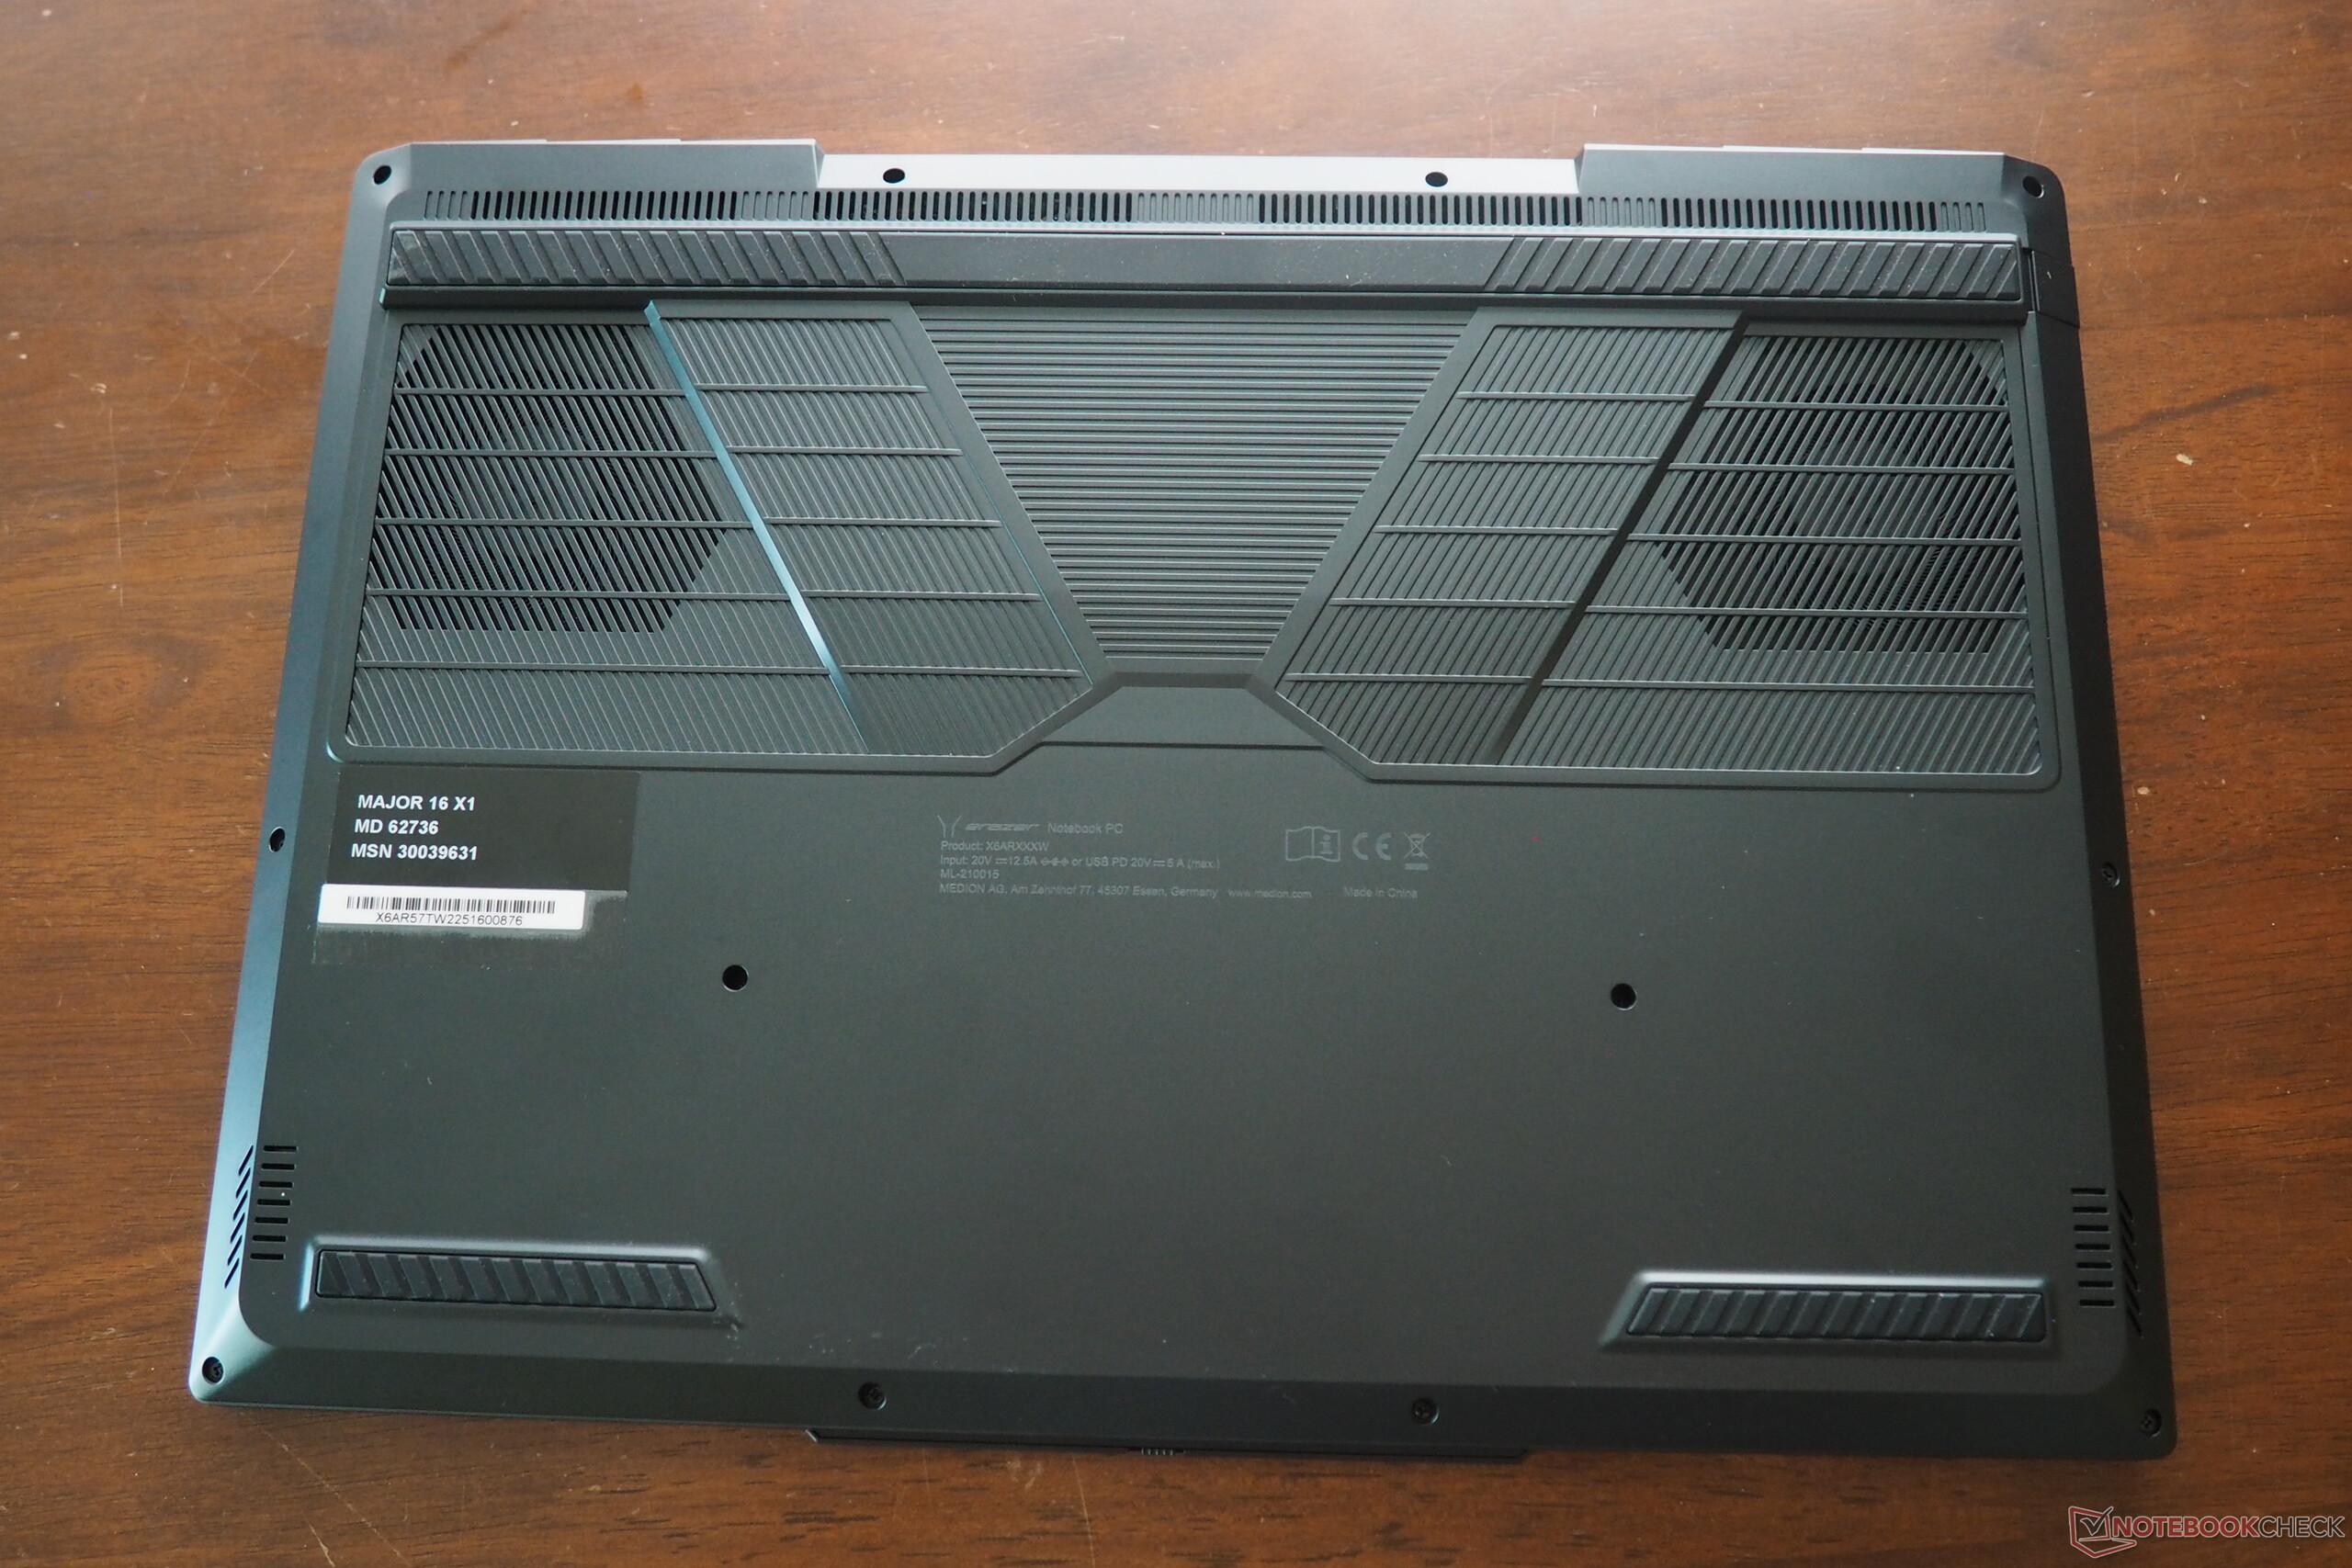
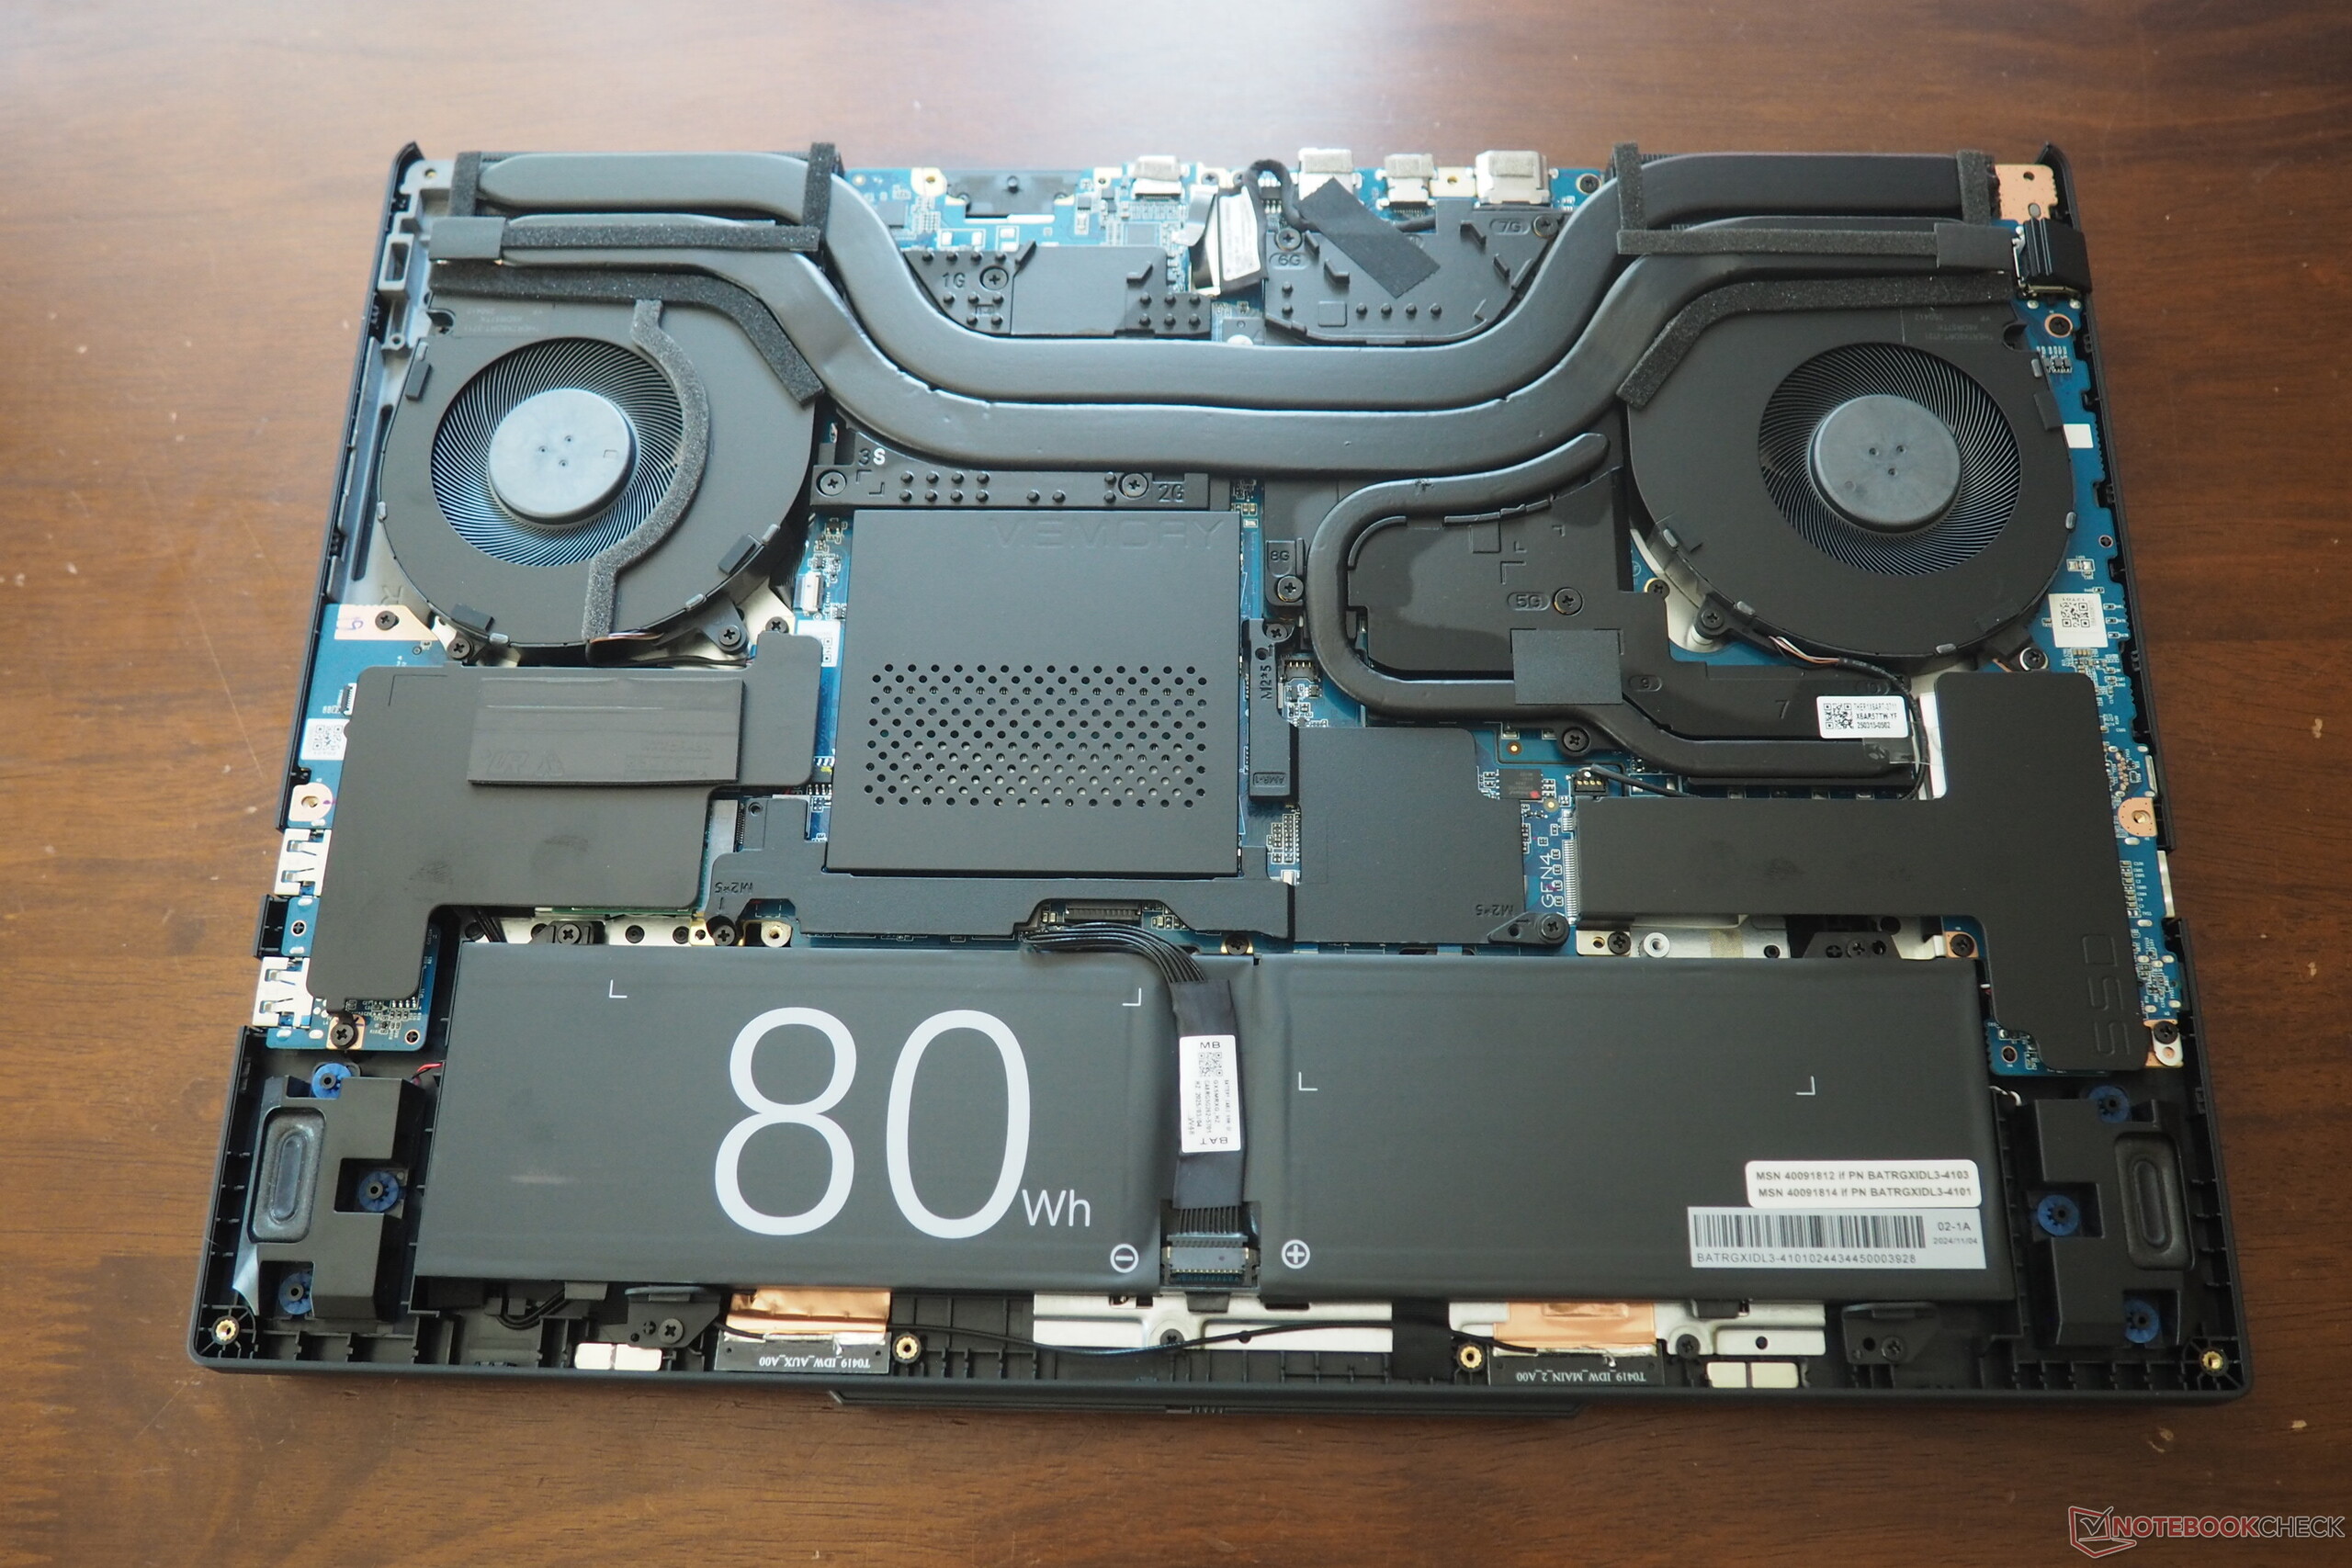
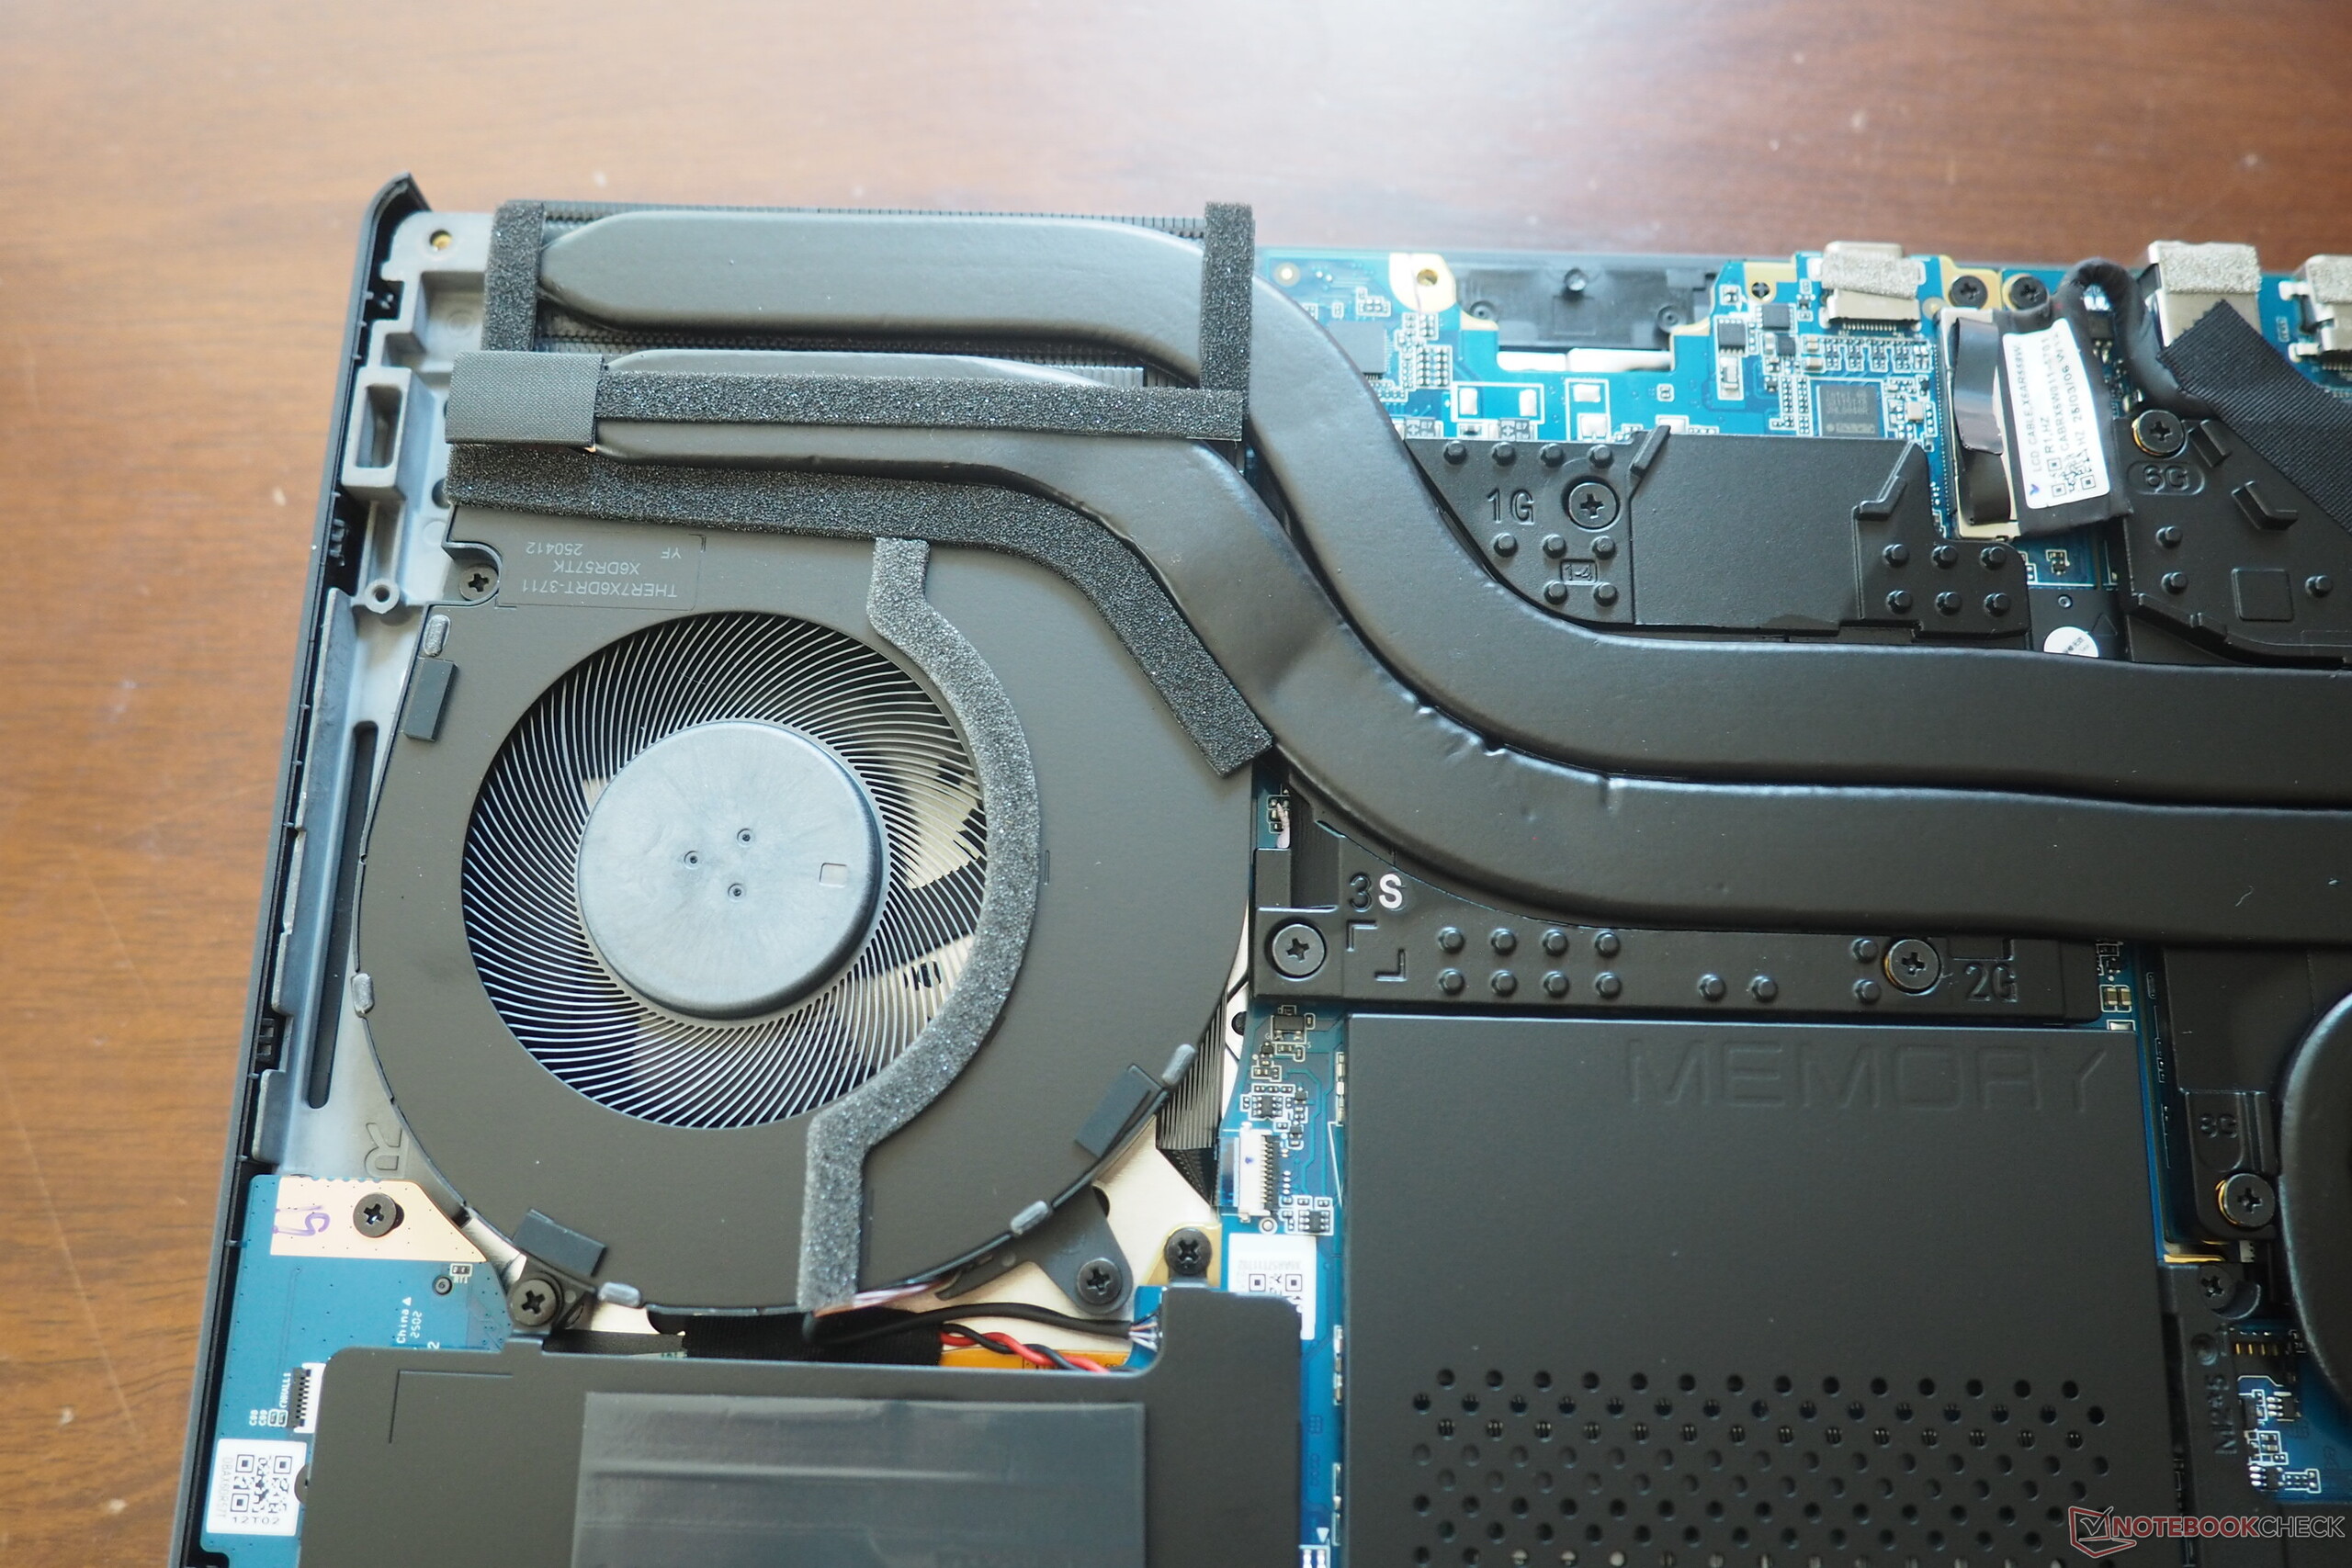
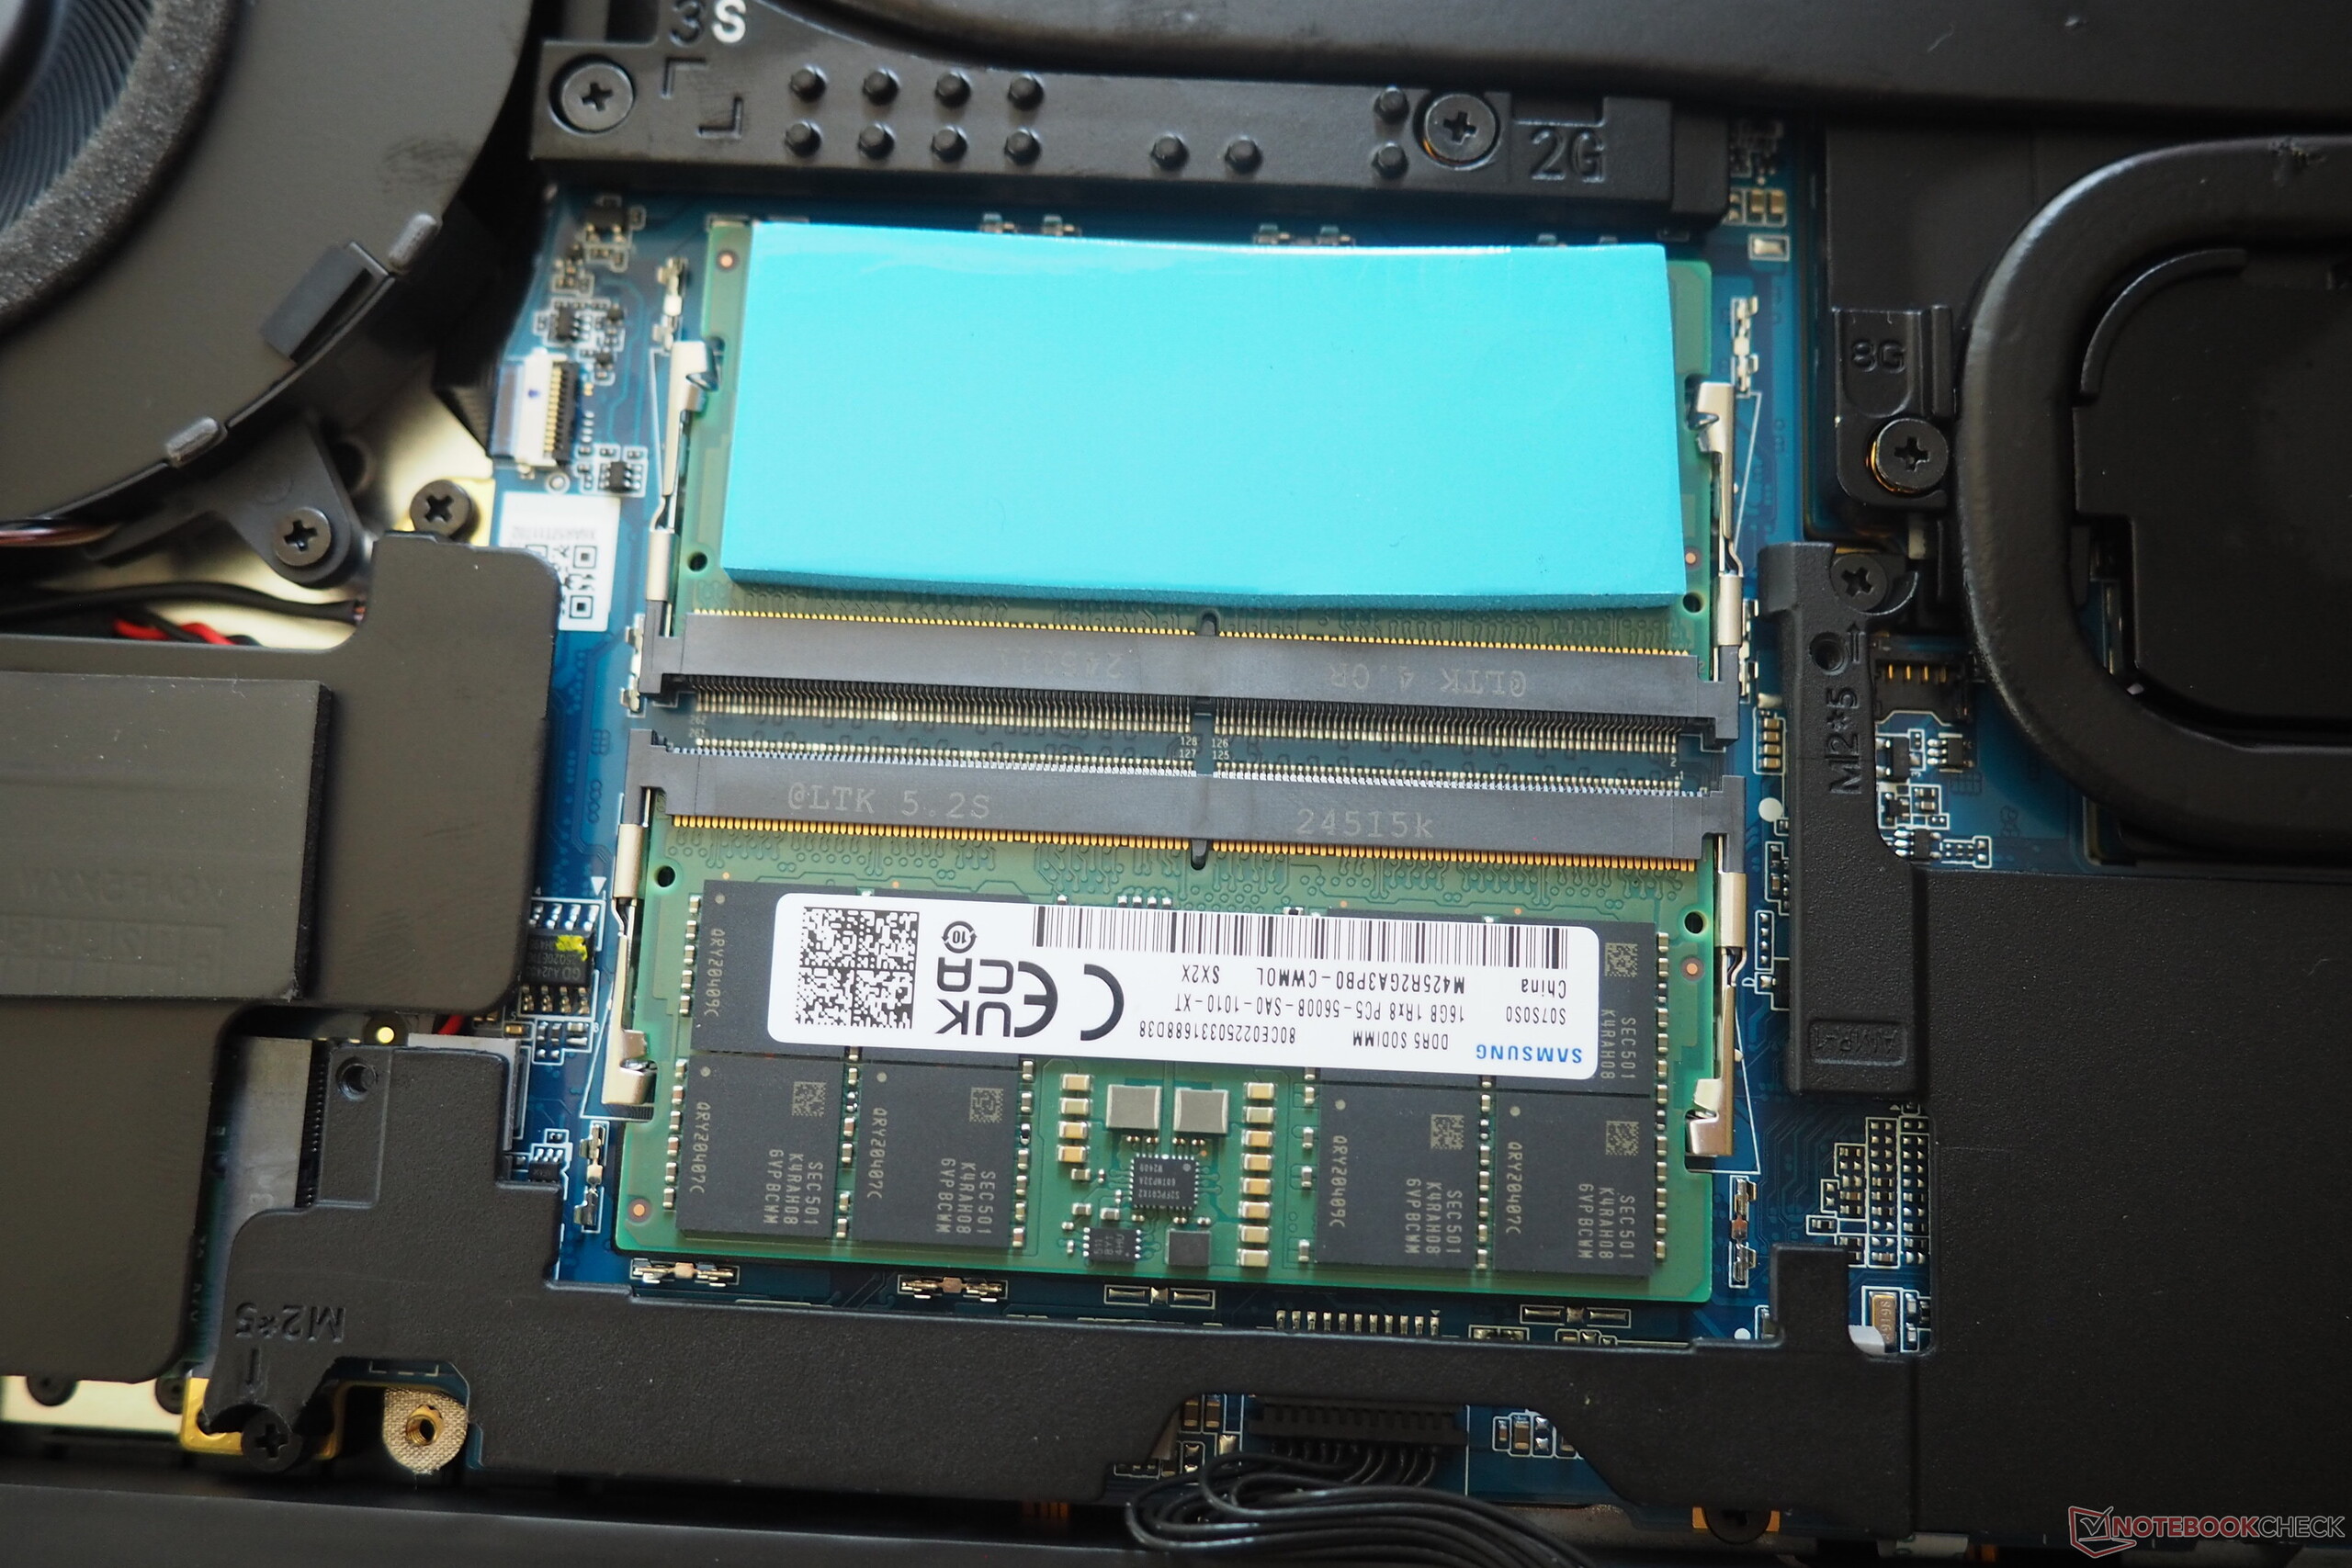
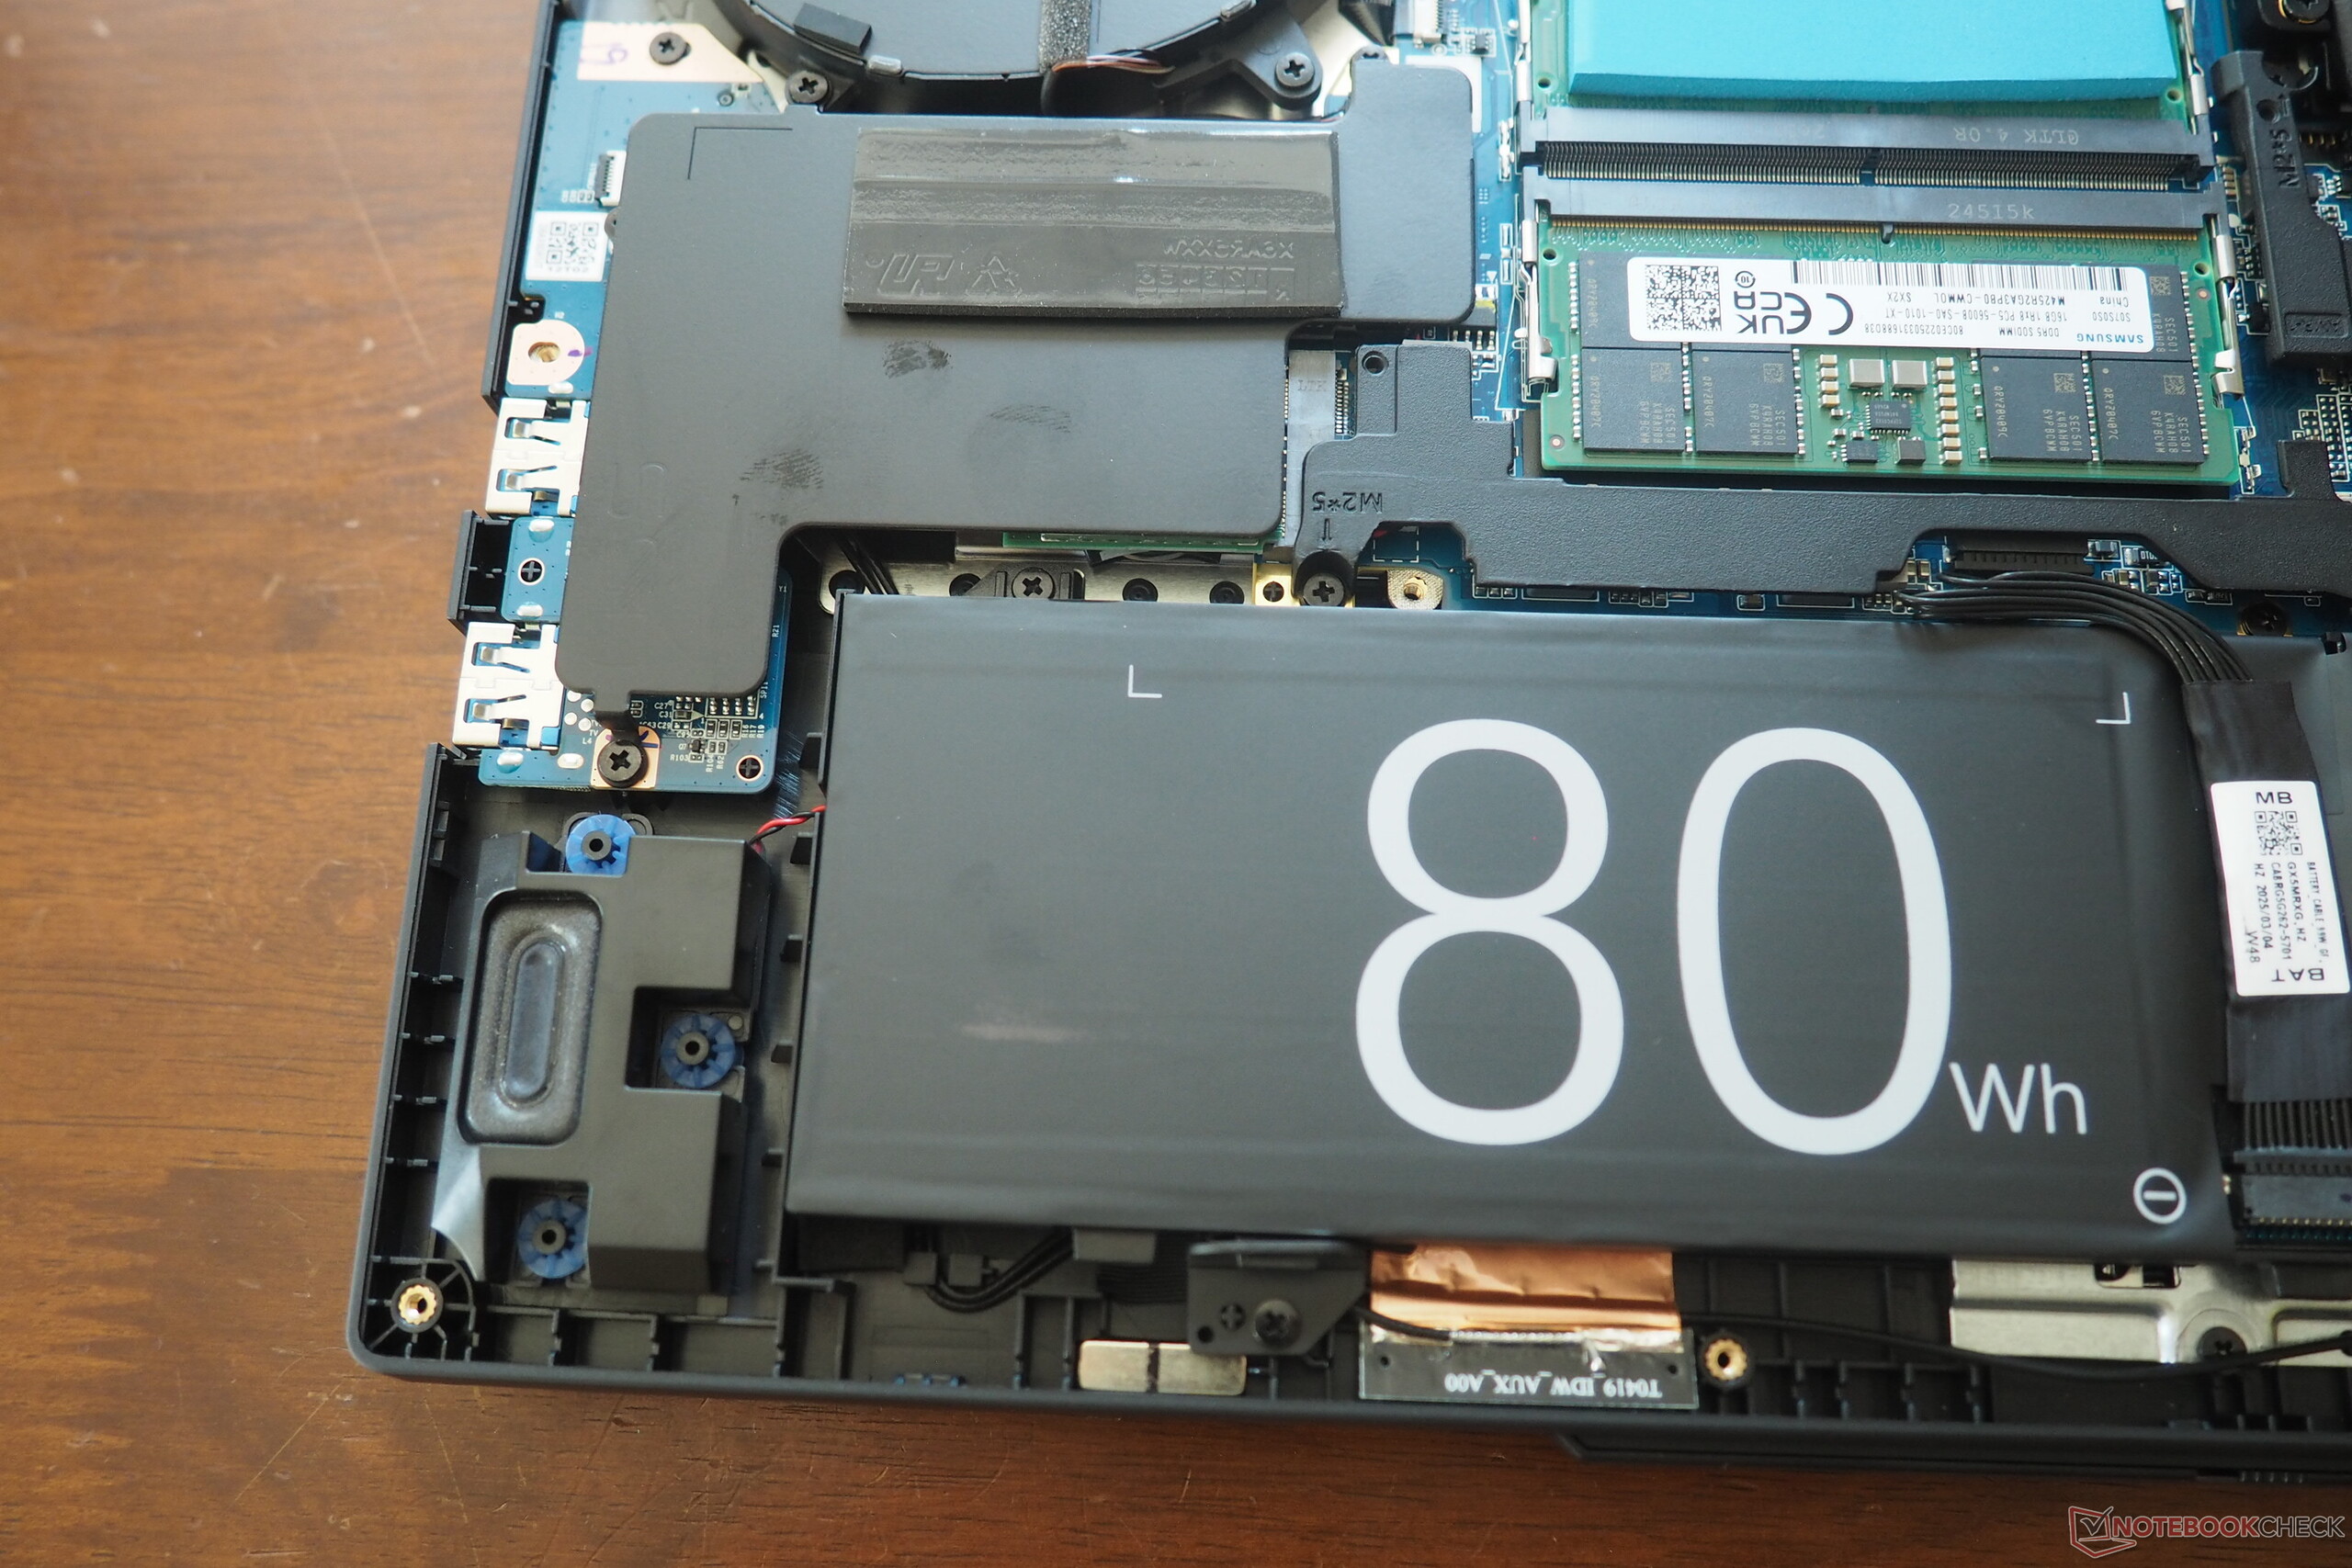
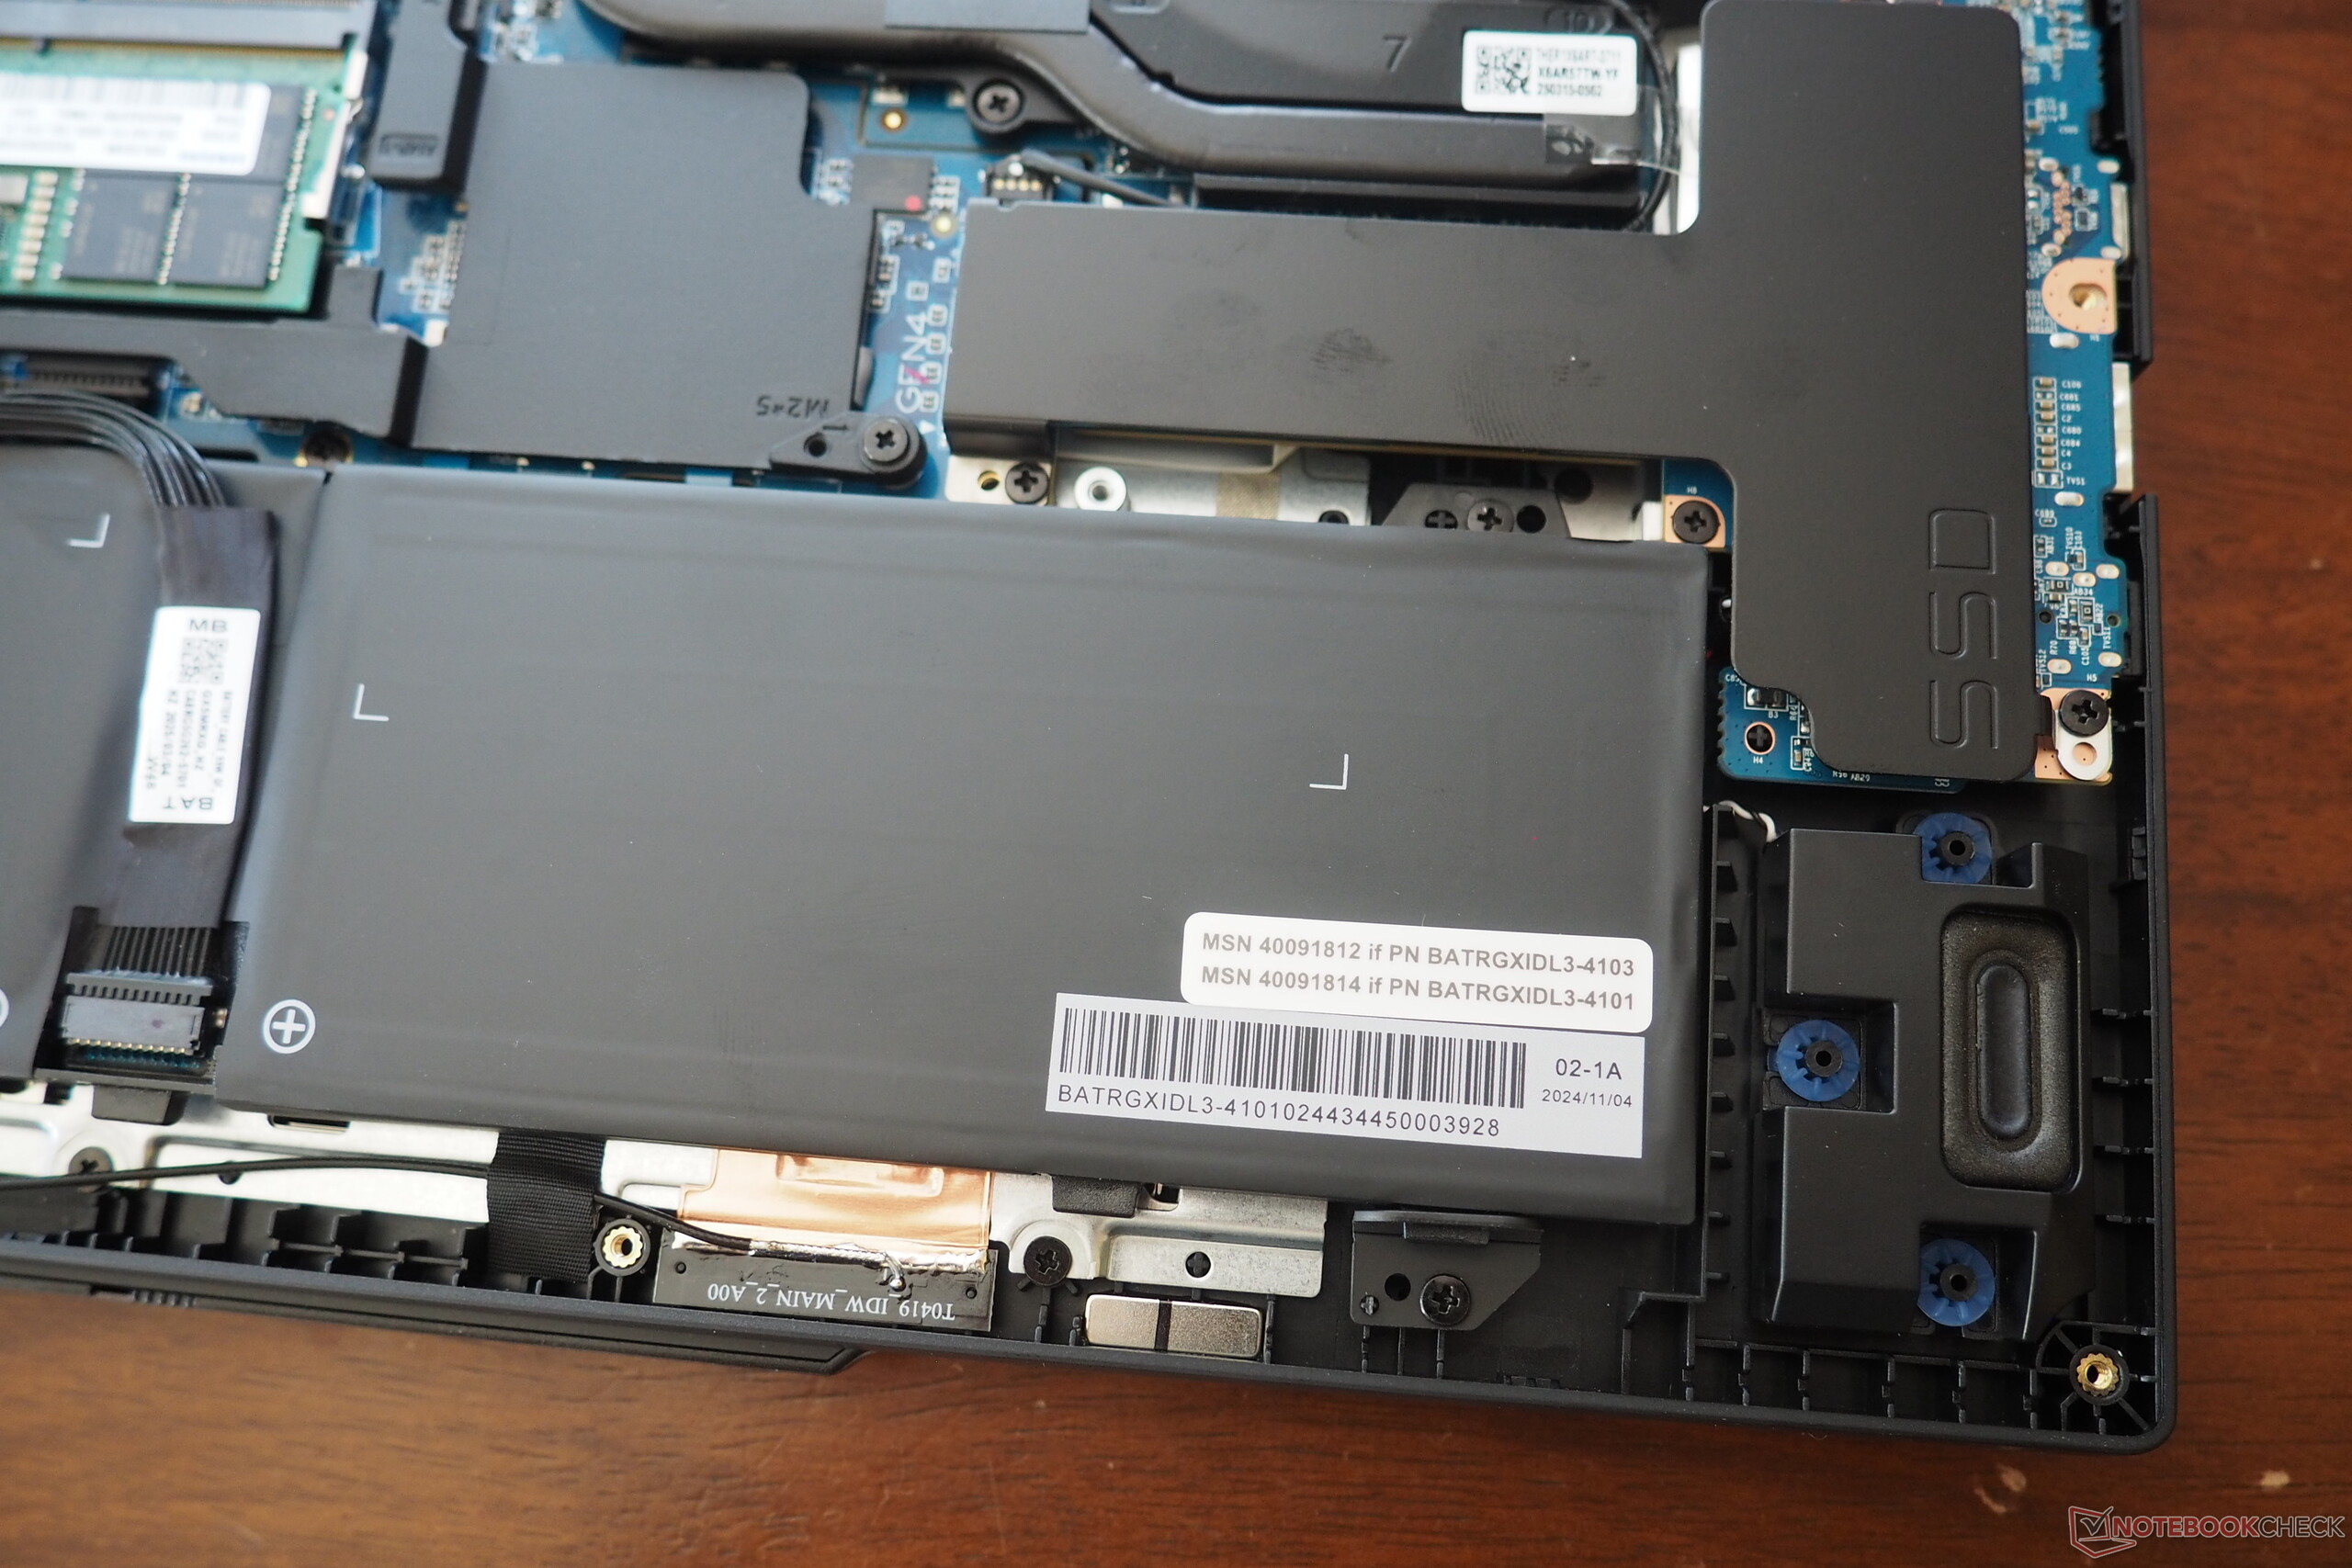
Maintenance

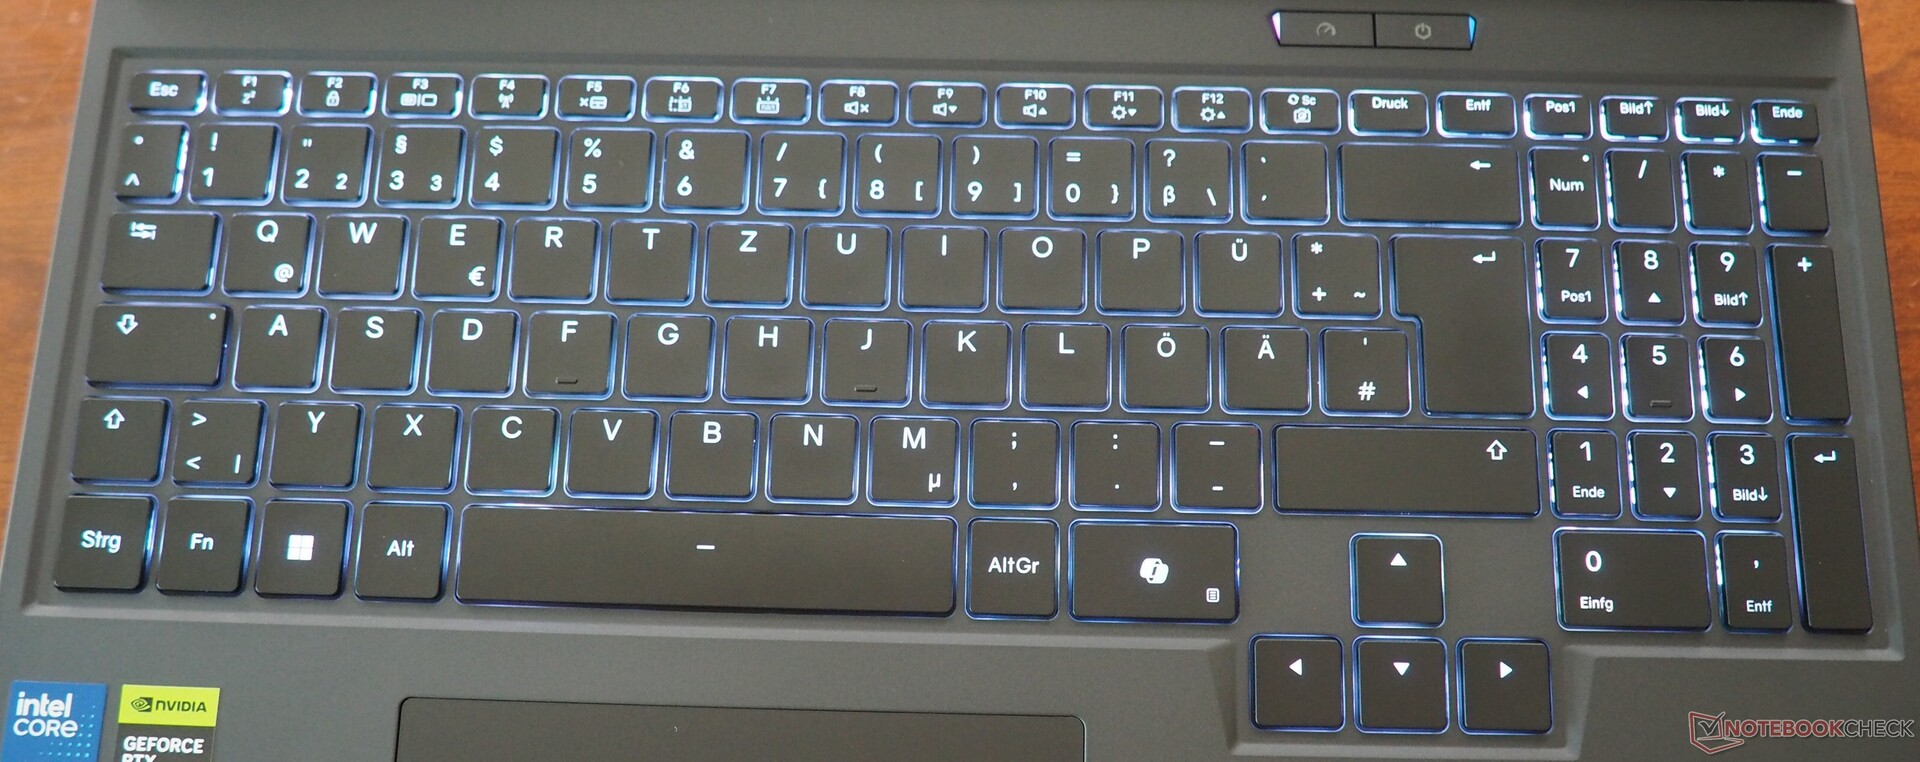
Dispositifs d'entrée
L'un des principaux atouts de l'ordinateur portable Erazer réside dans ses excellents périphériques de saisie. Le clavier impressionne non seulement par son retour tactile satisfaisant et sa disposition bien pensée, mais aussi par ses touches fléchées de taille généreuse et son pavé numérique complet. Une touche de fonction dédiée, située à côté du bouton d'alimentation, permet aux utilisateurs de passer d'un mode de performance à l'autre, chacun étant représenté par une couleur distincte. Le pavé tactile de 12,3 cm x 7,7 cm offre une expérience agréable à l'utilisateur. Precision le mécanisme de clic de la souris et le support multi-touch fonctionnent tous de manière fiable.
Affichage
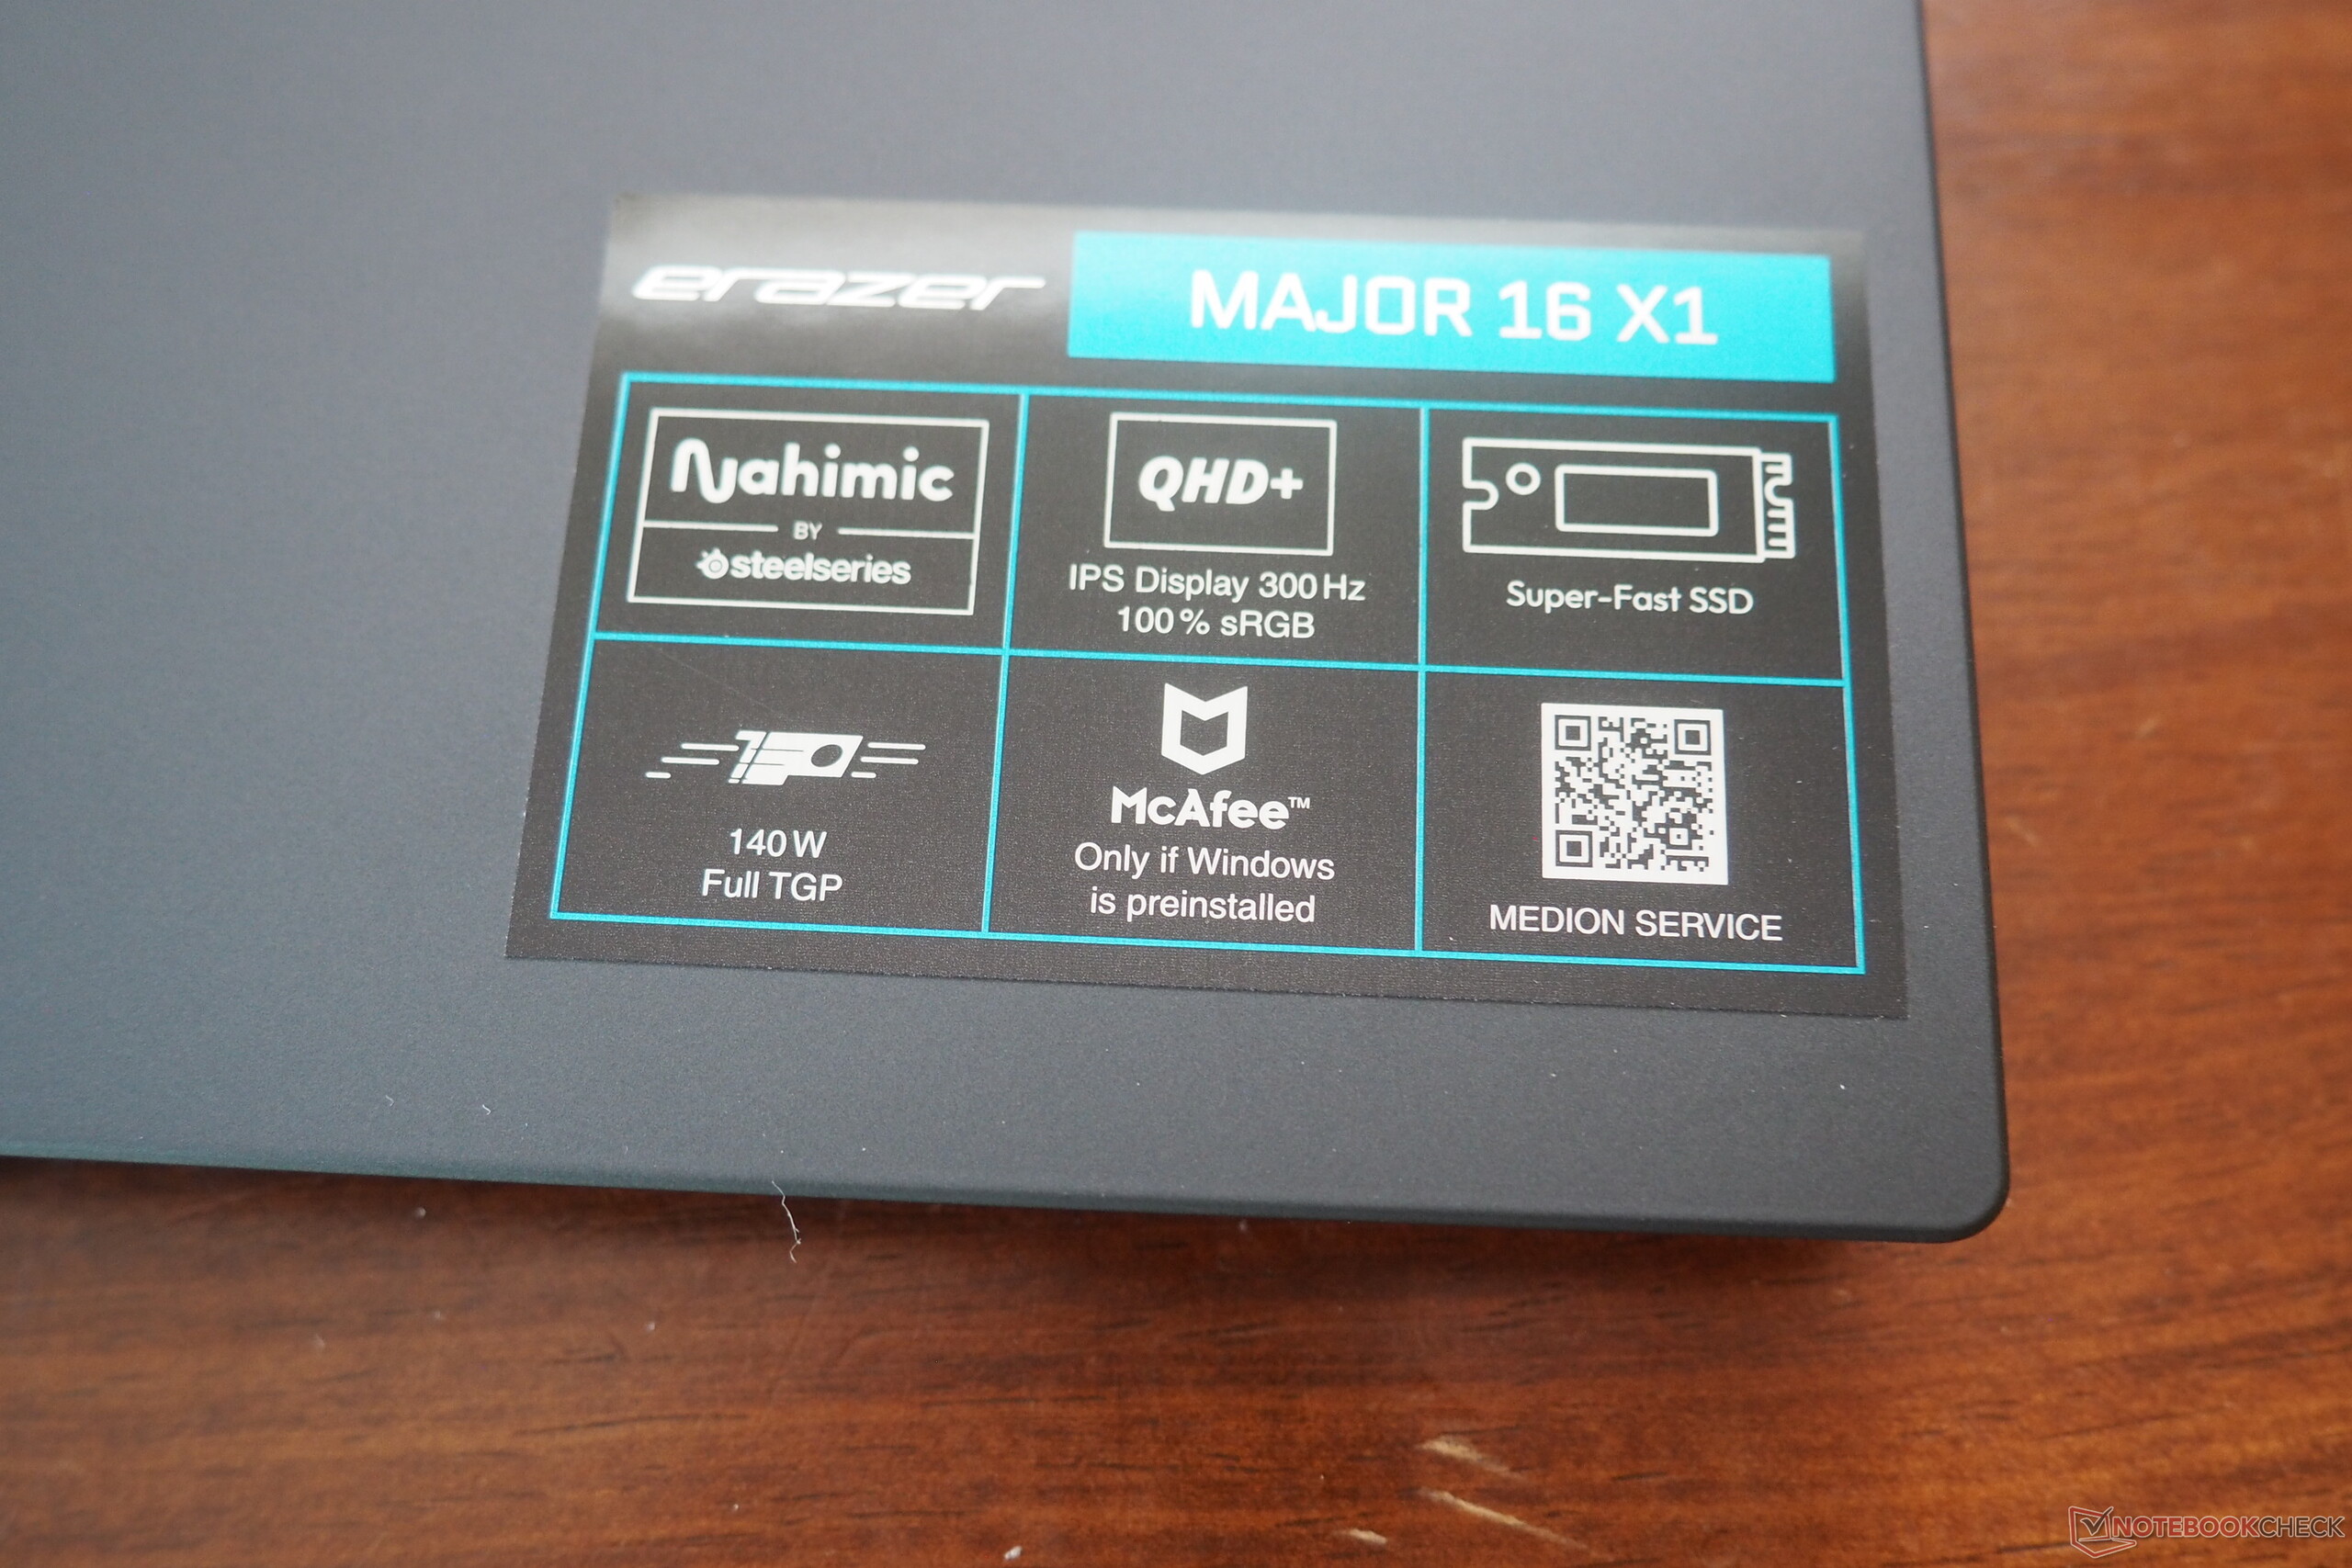
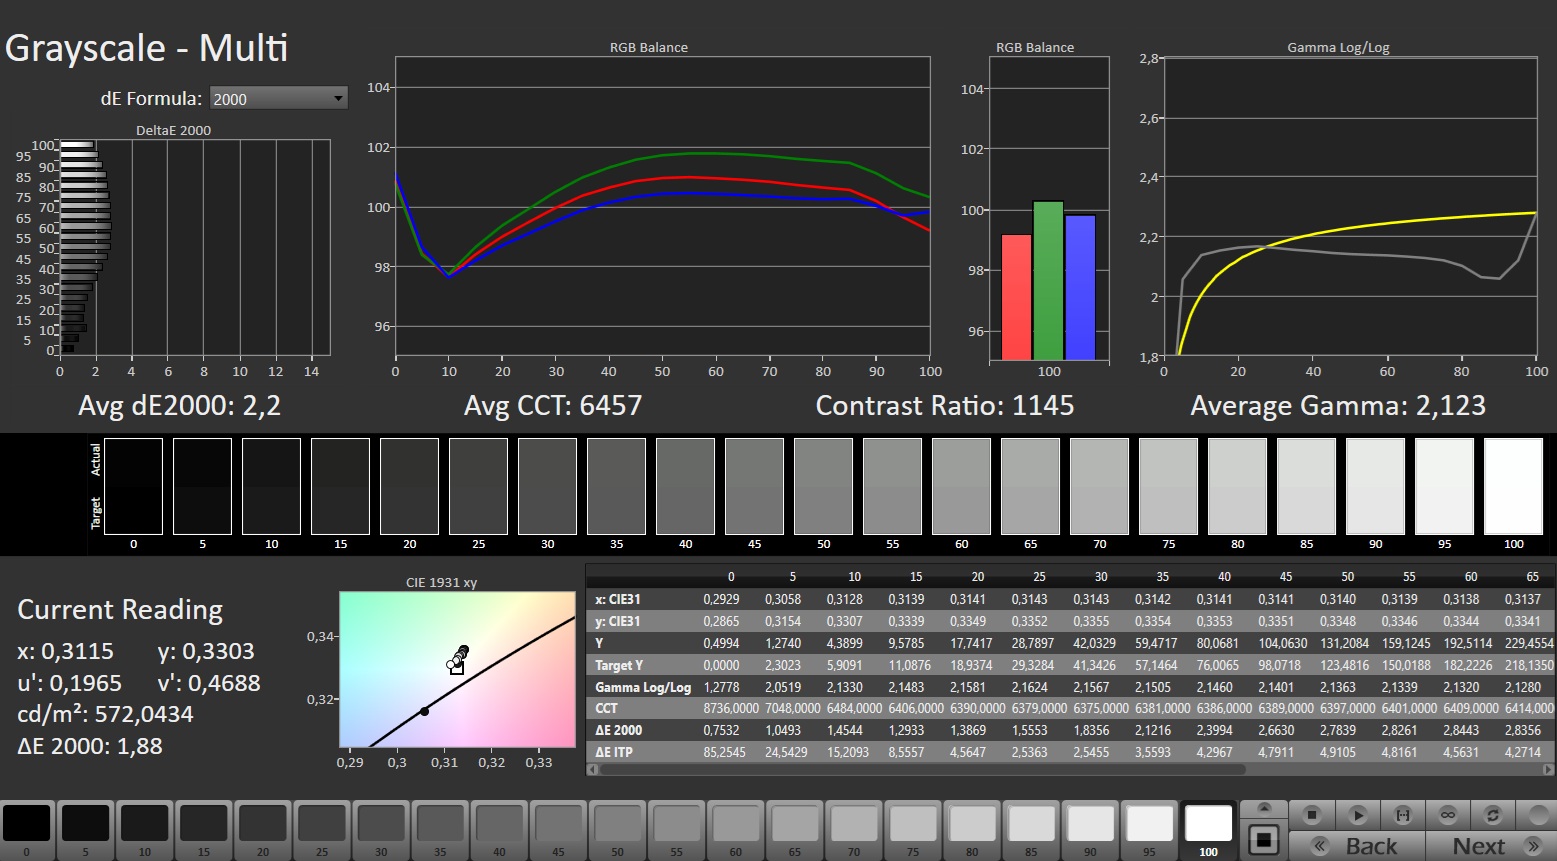
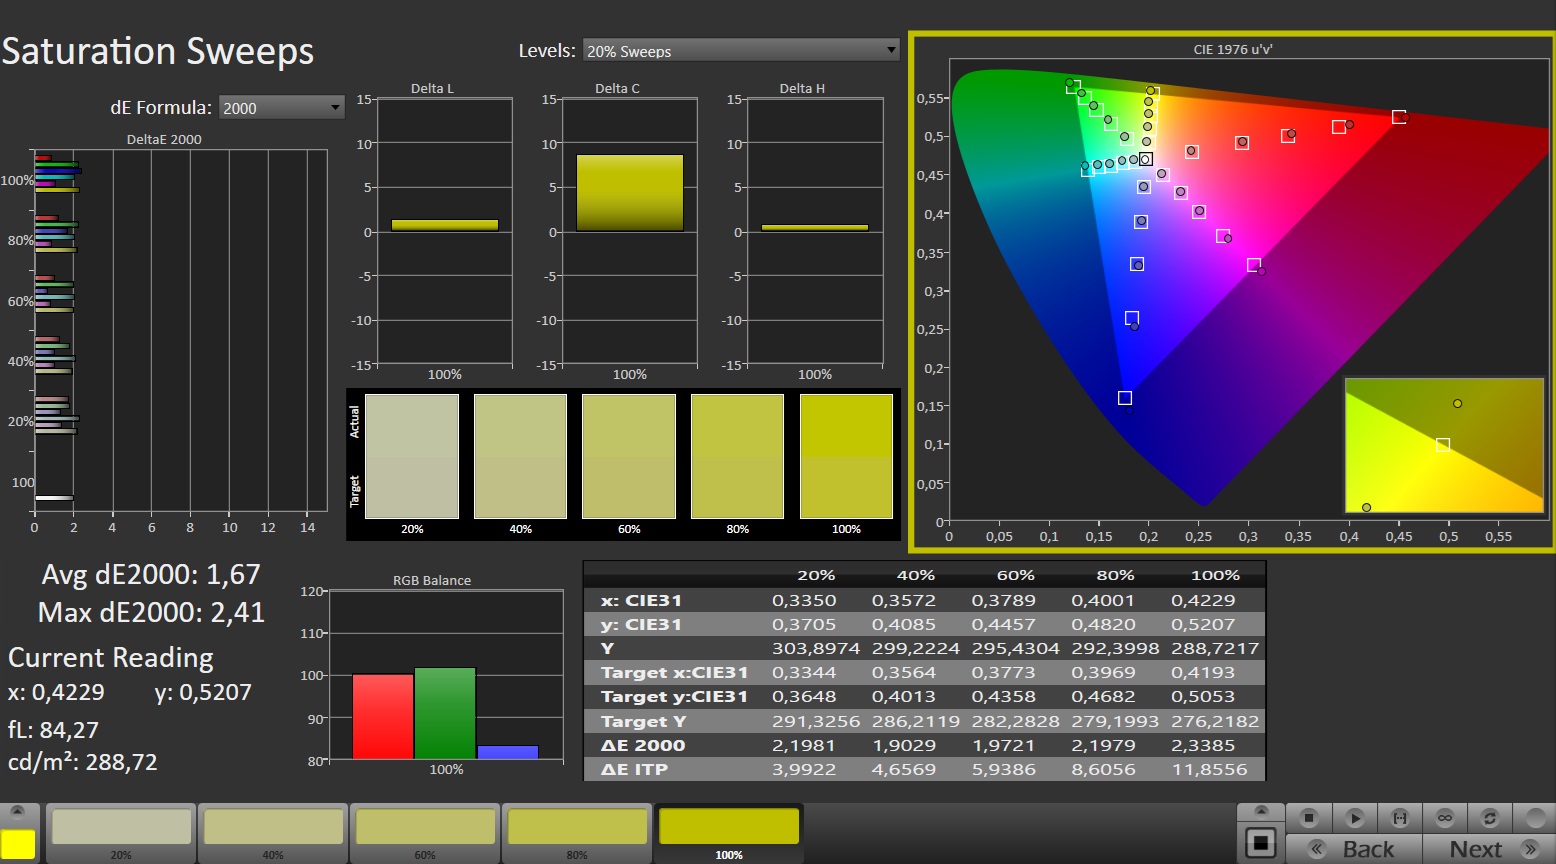
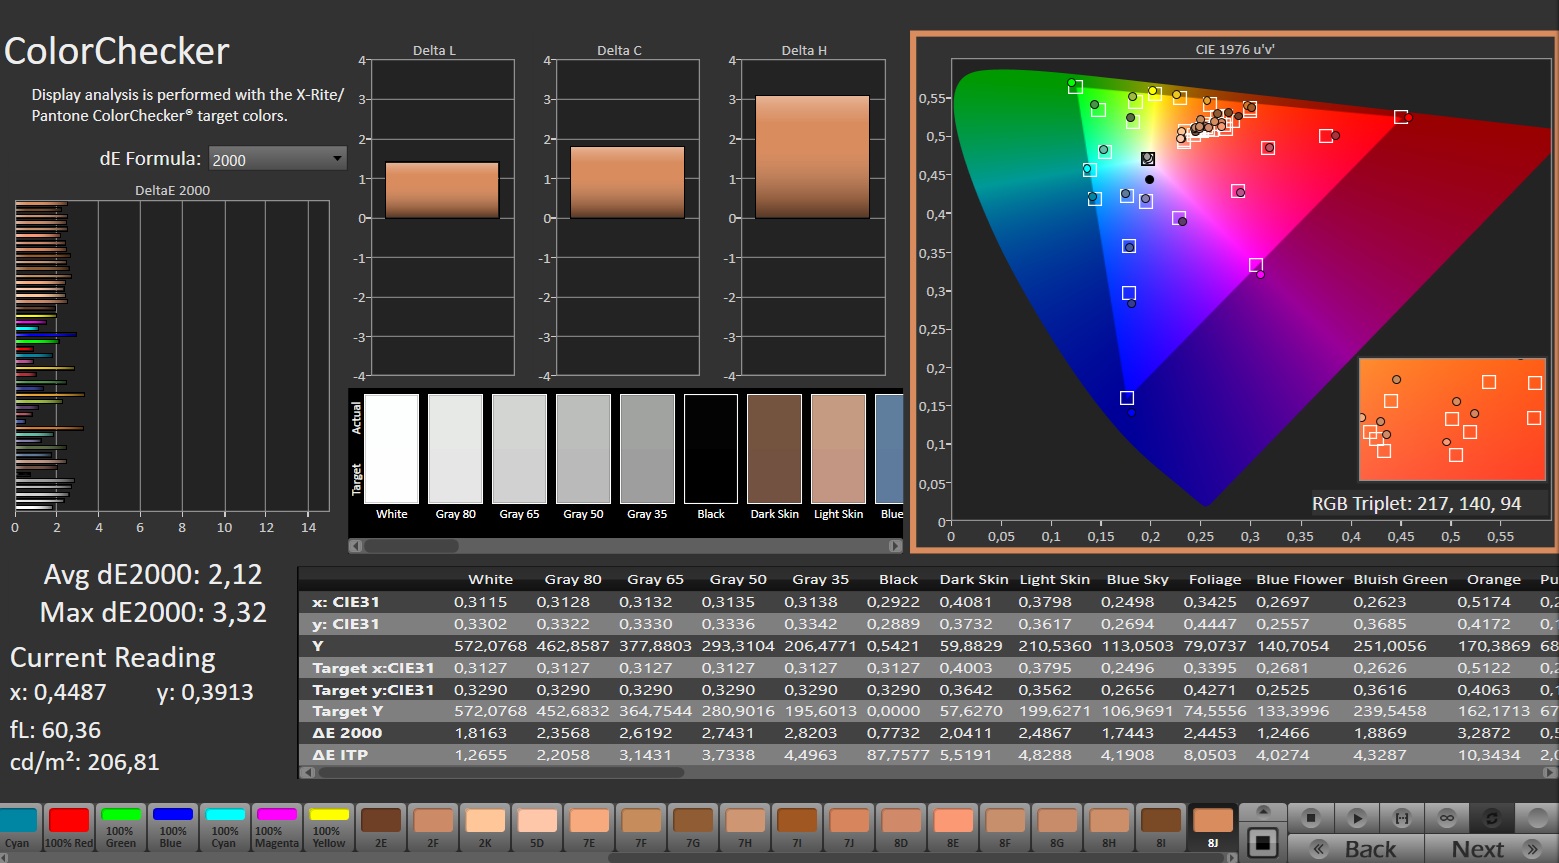
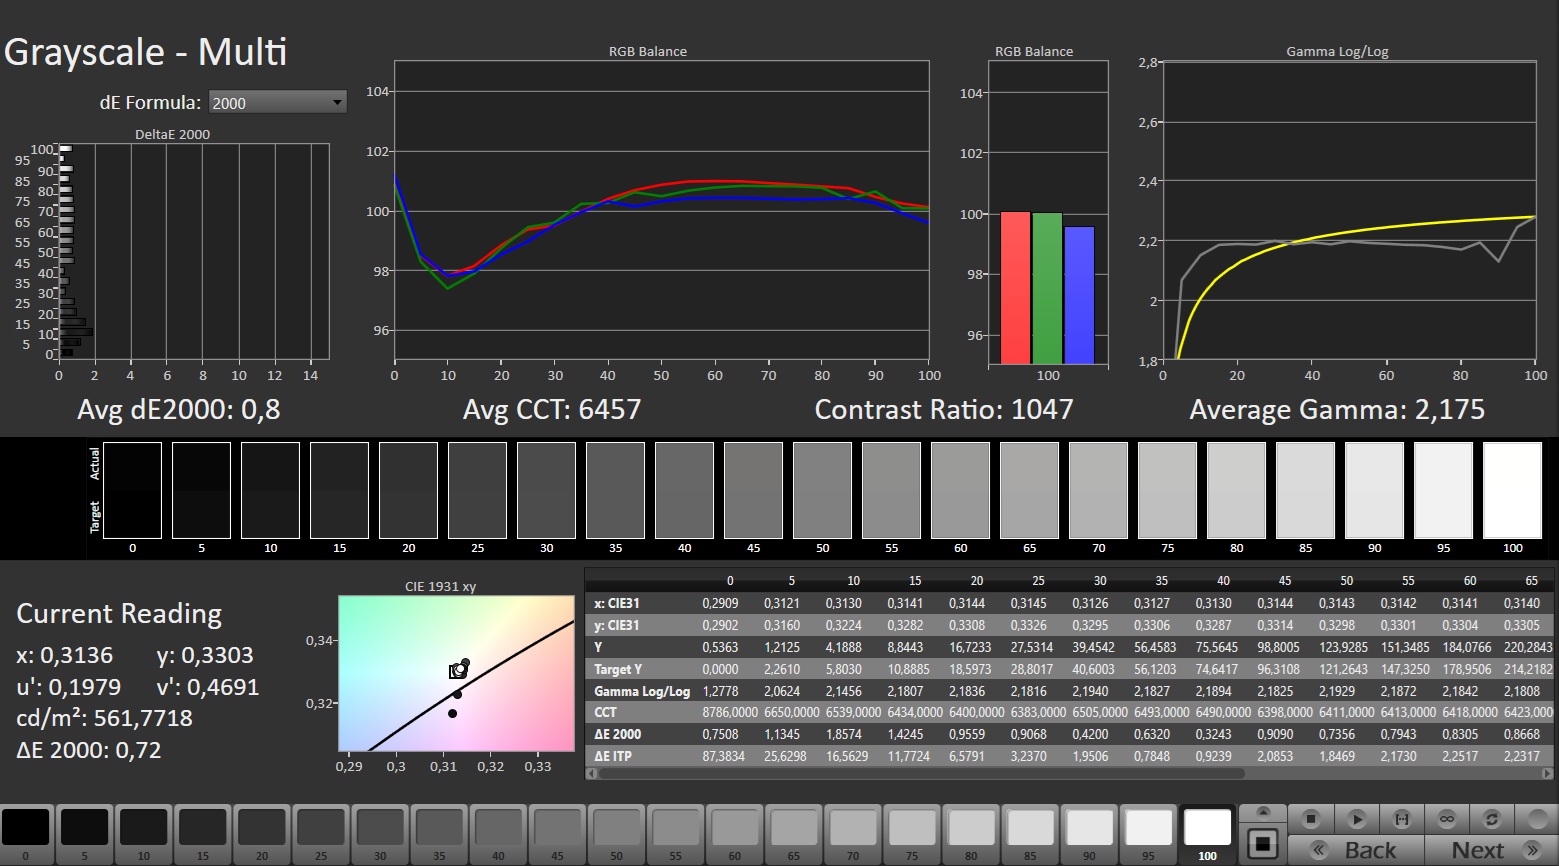
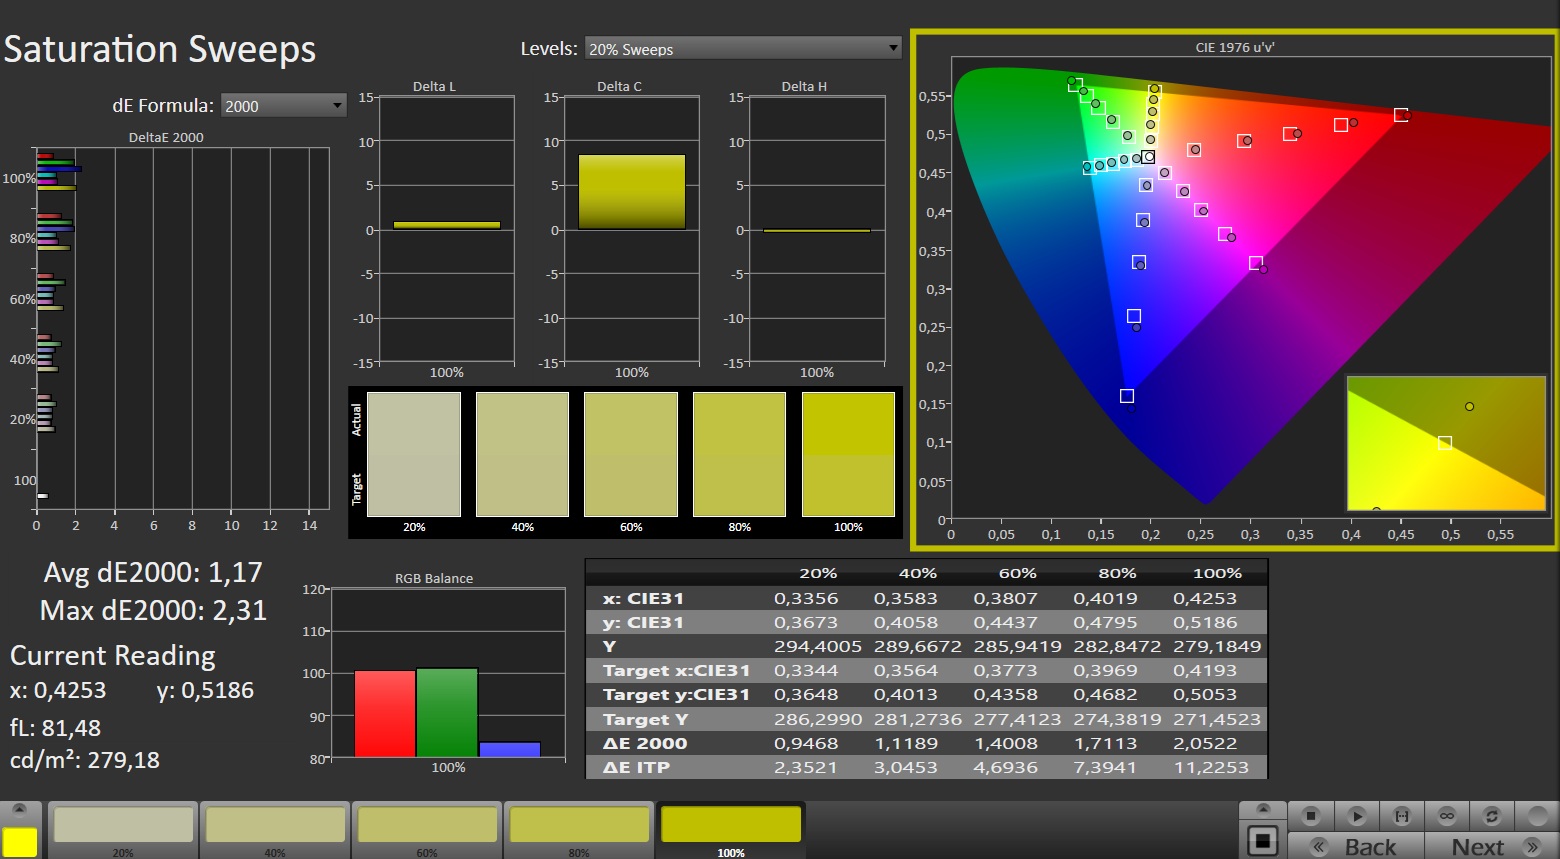
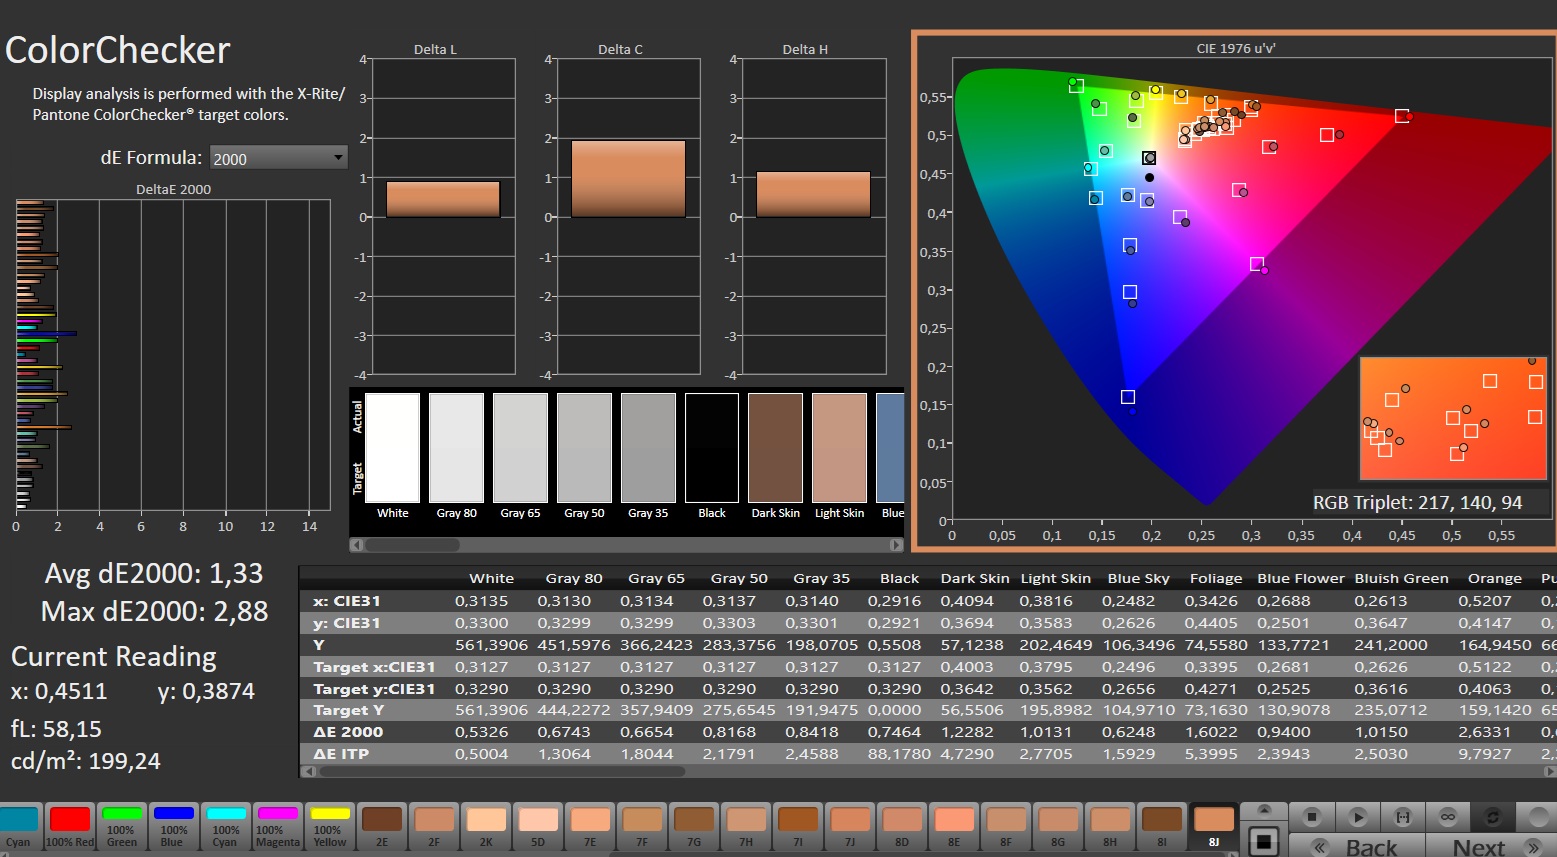
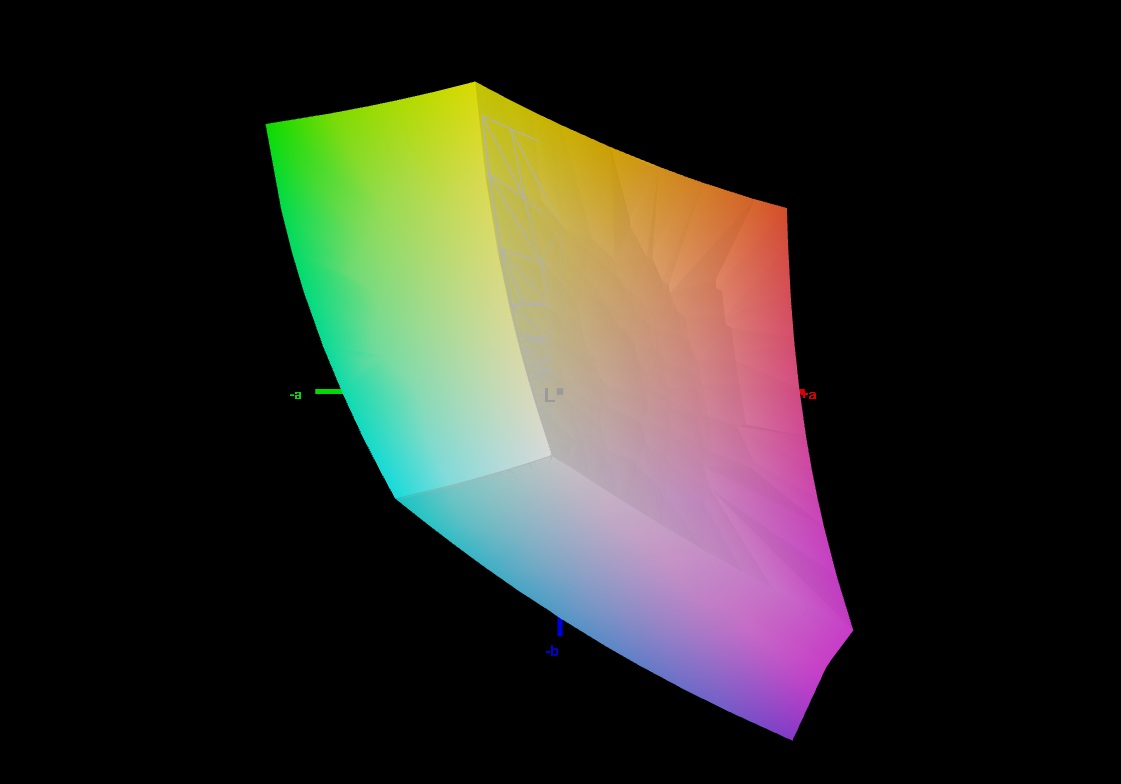
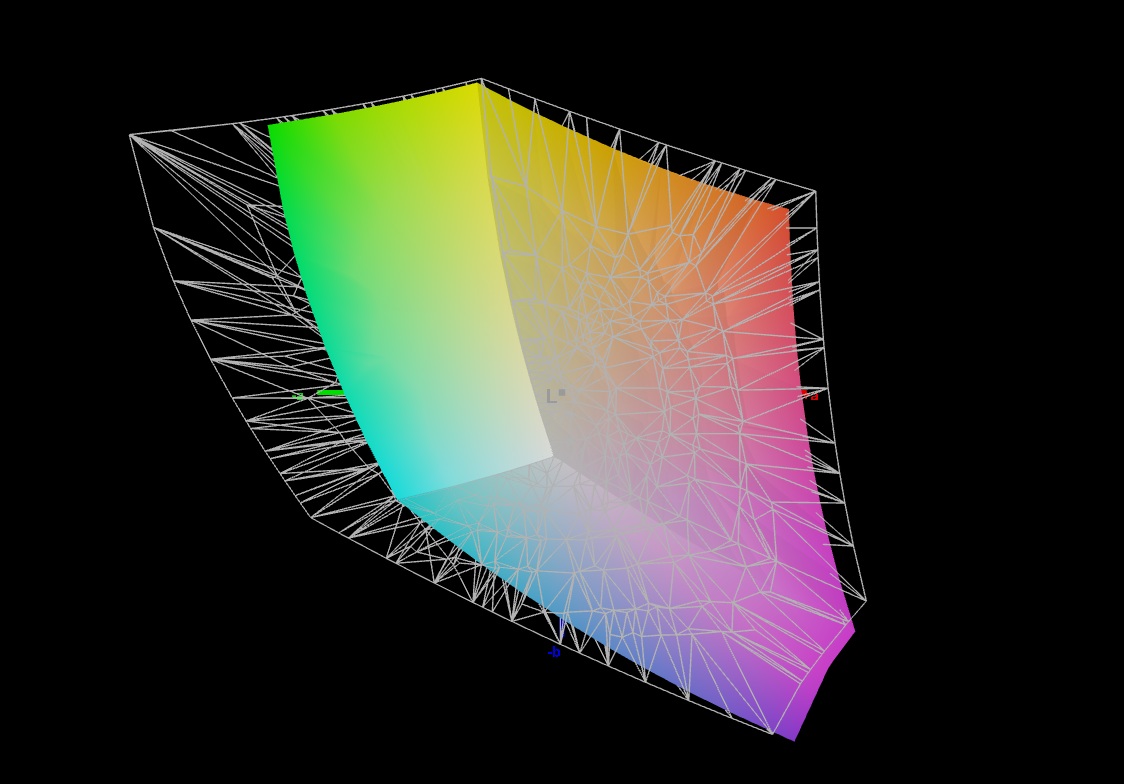
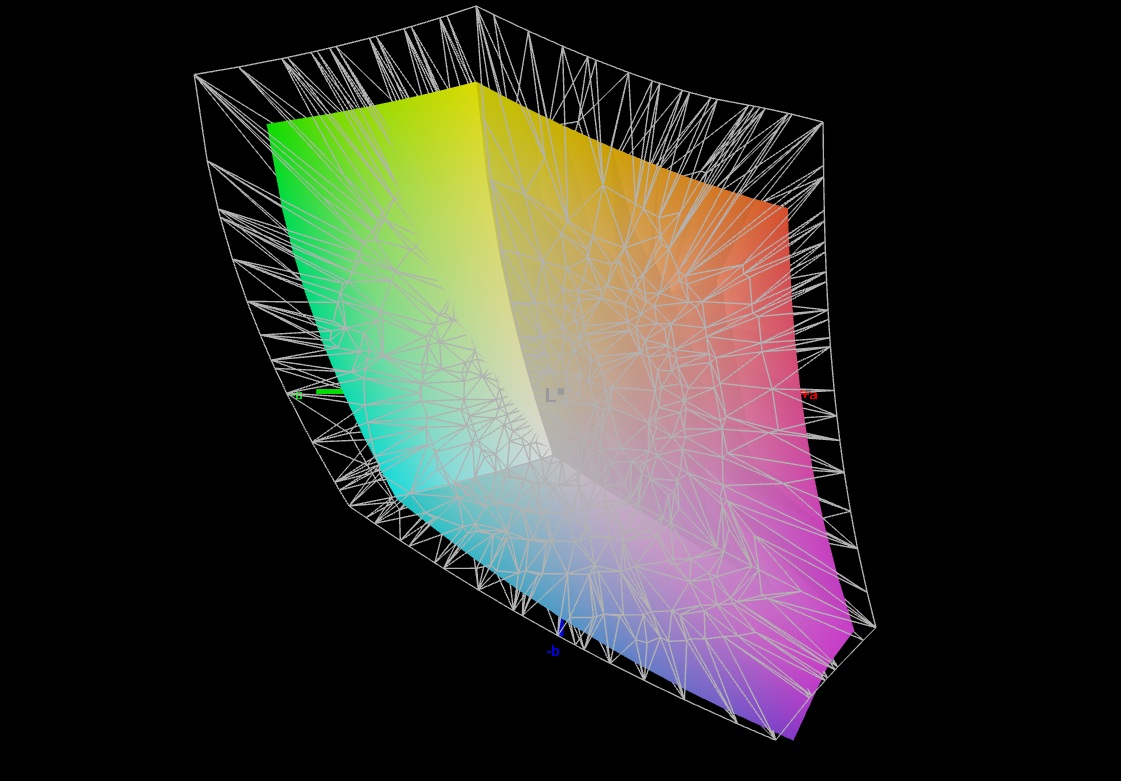
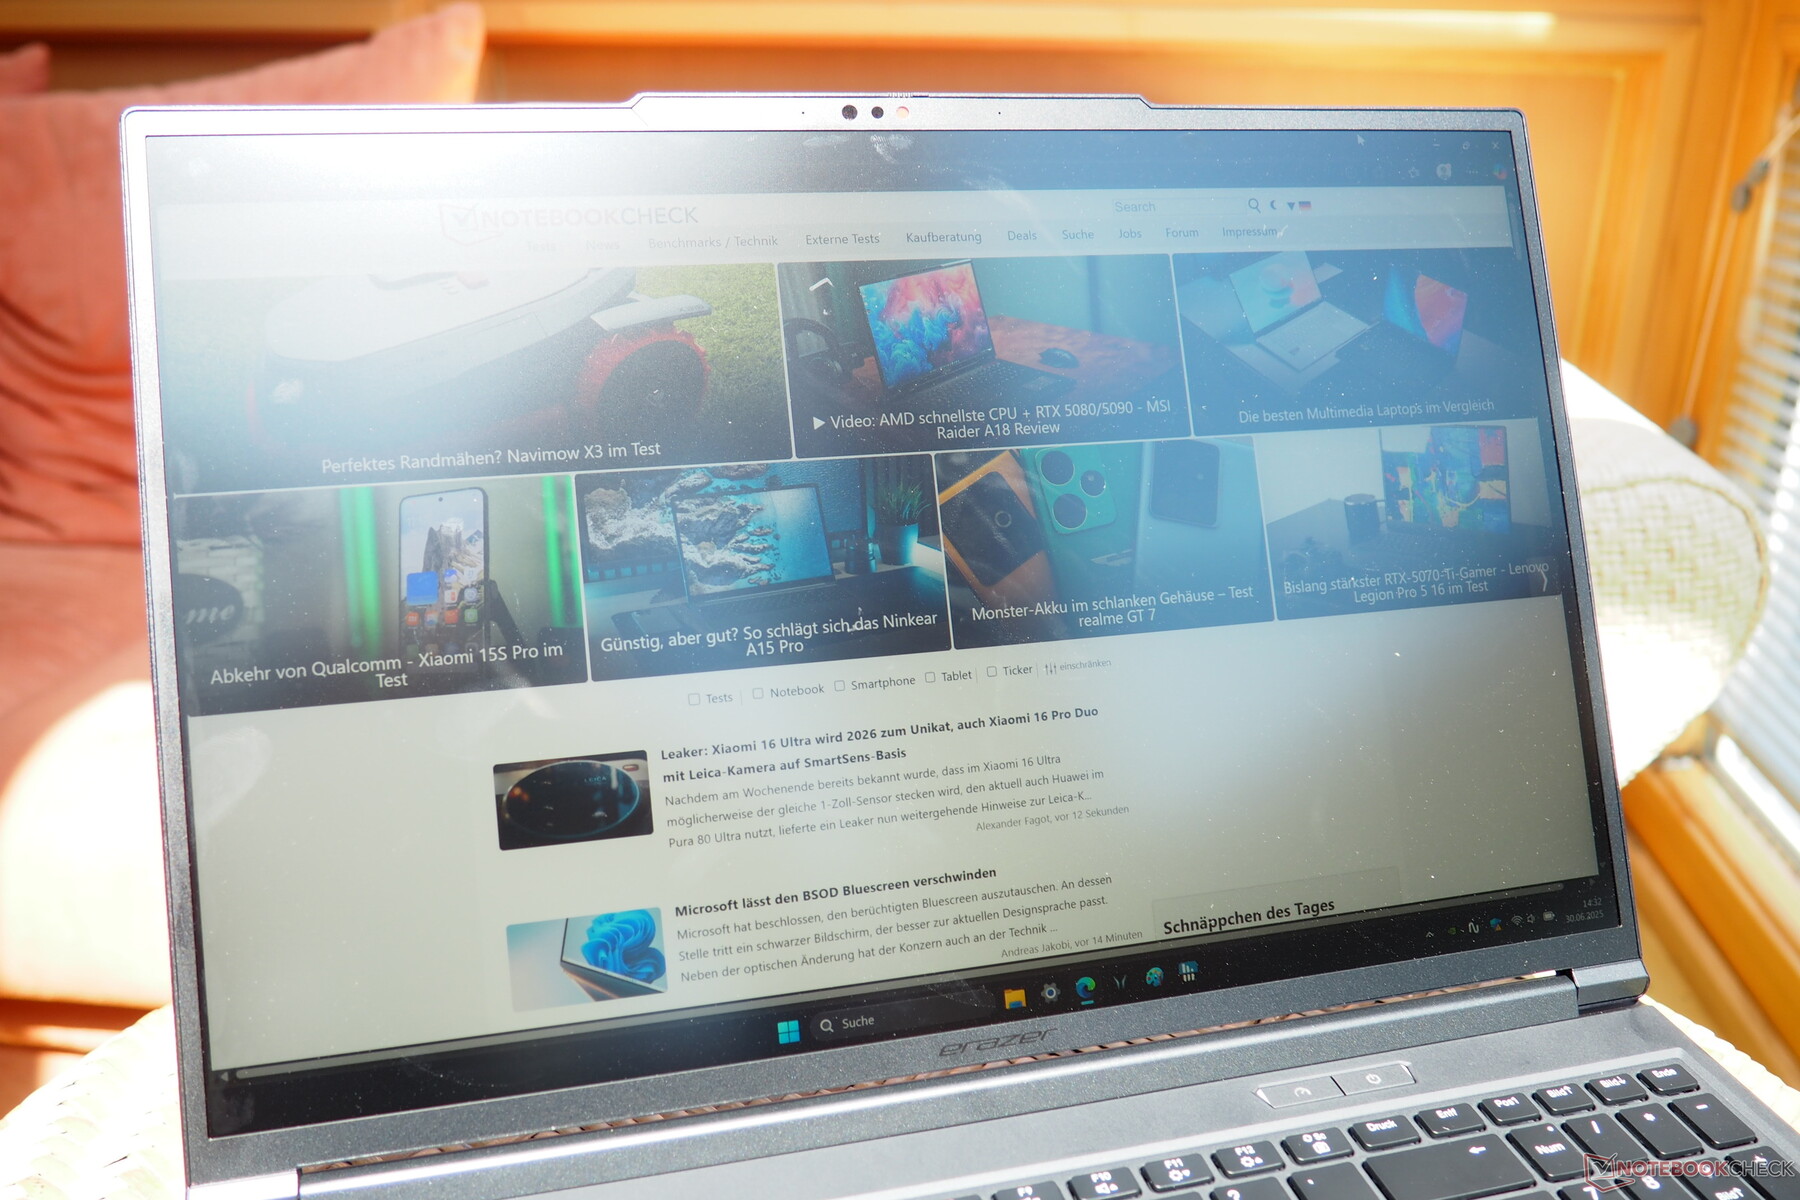
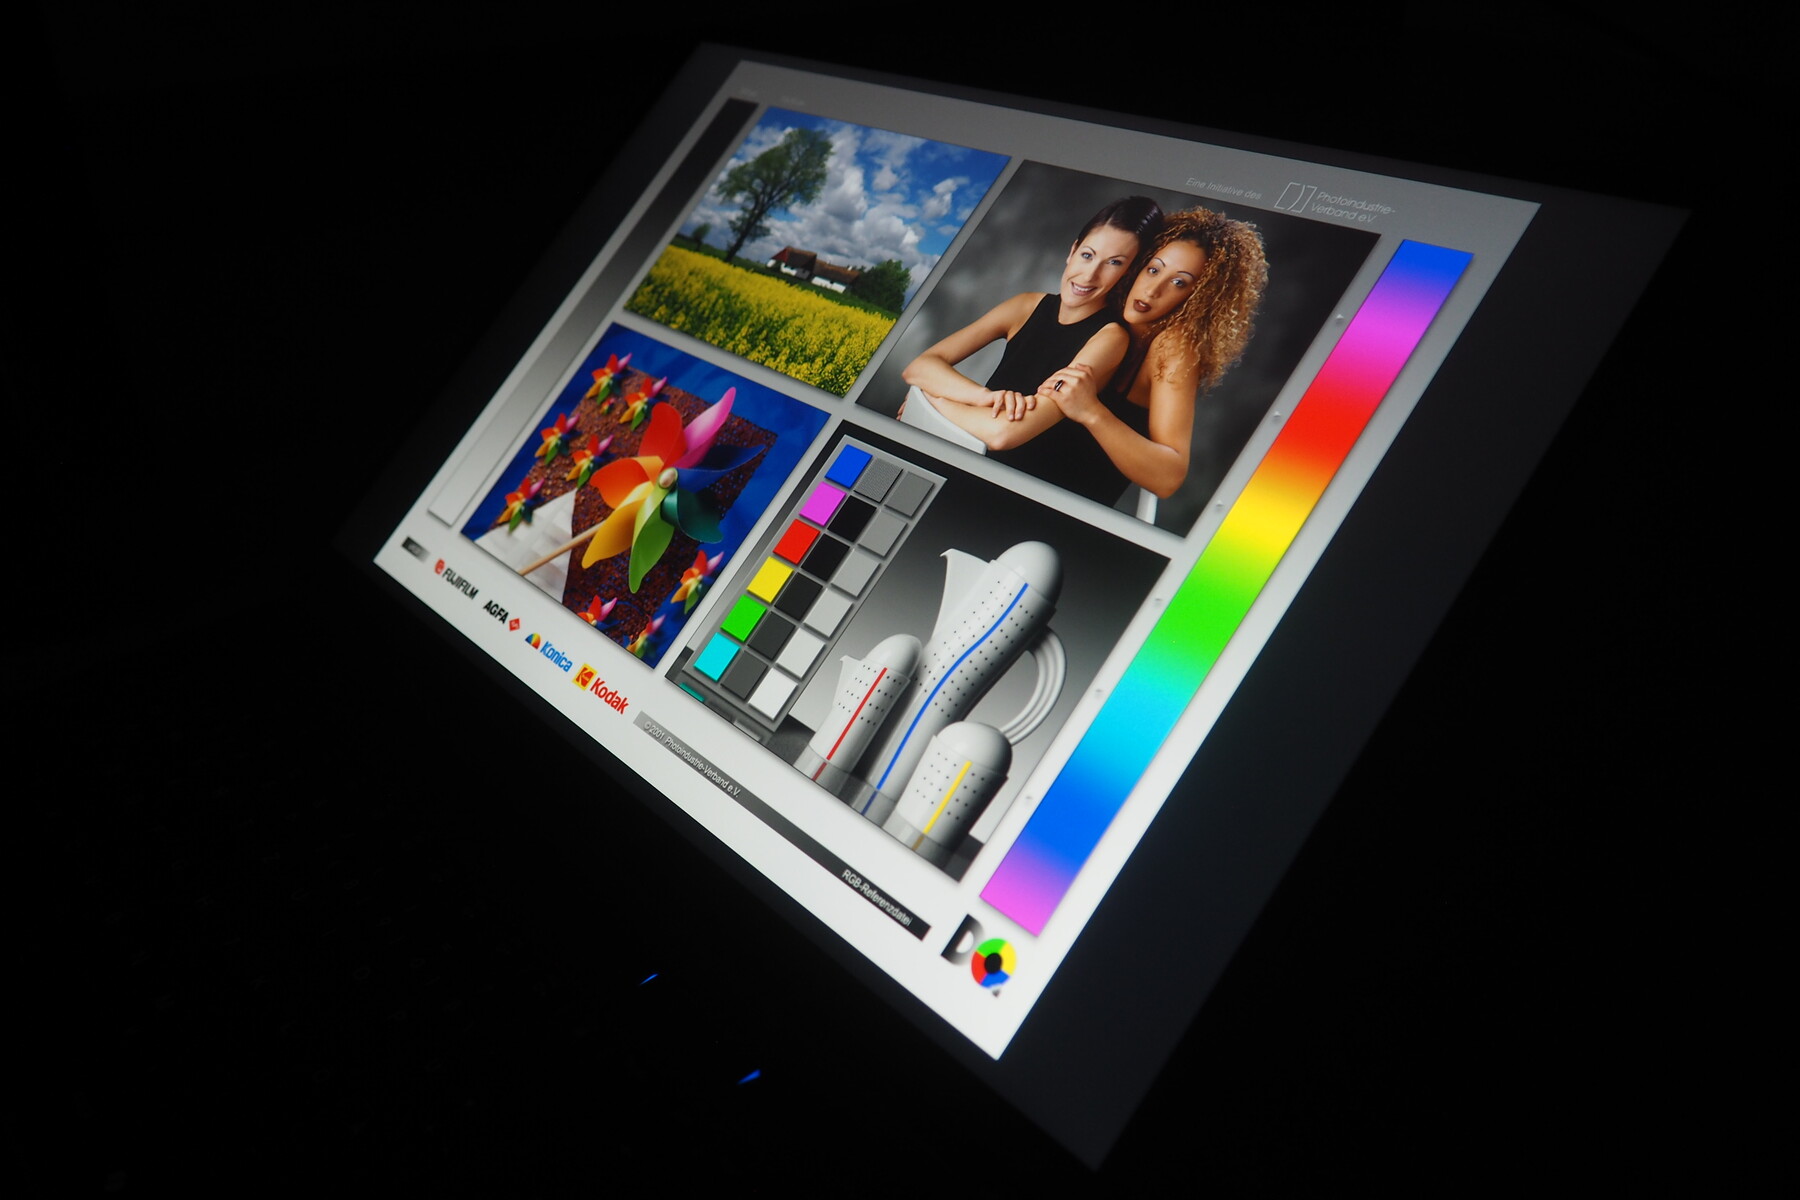
Medion a équipé le Major 16 X1 d'un écran IPS 300 Hz au format 16:10, offrant une résolution de 2 560 × 1 600 pixels. La luminosité moyenne de 539 cd/m² est excellente et surpasse nettement tous les modèles de comparaison. Le contraste, en revanche, n'est que décent à 1 154:1, en raison d'un niveau de noir légèrement élevé de 0,5 cd/m². Les angles de vision sont typiques d'une dalle IPS et les temps de réponse se situent dans une fourchette similaire. La couverture complète de l'espace sRGB est un autre atout, bien que certains concurrents offrent une couverture plus importante dans les espaces de couleurs AdobeRGB ou DCI-P3.
| |||||||||||||||||||||||||
Homogénéité de la luminosité: 85 %
Valeur mesurée au centre, sur batterie: 577 cd/m²
Contraste: 1154:1 (Valeurs des noirs: 0.5 cd/m²)
ΔE Color 2.12 | 0.5-29.43 Ø4.83, calibrated: 1.33
ΔE Greyscale 2.2 | 0.09-98 Ø5.1
73.9% AdobeRGB 1998 (Argyll 2.2.0 3D)
99.8% sRGB (Argyll 2.2.0 3D)
73.2% Display P3 (Argyll 2.2.0 3D)
Gamma: 2.123
| Medion Erazer Major 16 X1 MD62736 NE160QDM-NZL (BOE0D55), IPS, 2560x1600, 16", 300 Hz | Medion Erazer Major X20 BOE CQ NE160QDM-NZ1, IPS, 2560x1600, 16", 240 Hz | MSI Katana 17 HX B14WGK CSOT MNH301CA3-1, IPS, 2560x1440, 17.3", 240 Hz | MSI Vector 16 HX AI A2XWHG B160QAN02.3 (AUO7DB2), IPS, 2560x1600, 16", 240 Hz | Medion Erazer Beast 18 X1 MD62731 BOEhydis NE180QDM-NZ2, IPS, 2560x1600, 18", 240 Hz | |
|---|---|---|---|---|---|
| Display | -4% | 18% | 15% | 16% | |
| Display P3 Coverage | 73.2 | 69.4 -5% | 97.3 33% | 96.6 32% | 97.1 33% |
| sRGB Coverage | 99.8 | 98 -2% | 99.6 0% | 99.8 0% | 99.9 0% |
| AdobeRGB 1998 Coverage | 73.9 | 70.9 -4% | 89 20% | 84.4 14% | 84.7 15% |
| Response Times | -36% | -15% | 21% | 2% | |
| Response Time Grey 50% / Grey 80% * | 10 ? | 13.1 ? -31% | 5.2 ? 48% | 4.3 ? 57% | 5.6 ? 44% |
| Response Time Black / White * | 5.2 ? | 7.3 ? -40% | 9.2 ? -77% | 6 ? -15% | 7.3 ? -40% |
| PWM Frequency | |||||
| Screen | -12% | -5% | -28% | -39% | |
| Brightness middle | 577 | 374 -35% | 296 -49% | 473 -18% | 478 -17% |
| Brightness | 539 | 357 -34% | 272 -50% | 426 -21% | 456 -15% |
| Brightness Distribution | 85 | 92 8% | 87 2% | 85 0% | 89 5% |
| Black Level * | 0.5 | 0.33 34% | 0.27 46% | 0.42 16% | 0.4 20% |
| Contrast | 1154 | 1133 -2% | 1096 -5% | 1126 -2% | 1195 4% |
| Colorchecker dE 2000 * | 2.12 | 2.43 -15% | 1.35 36% | 3.47 -64% | 3.94 -86% |
| Colorchecker dE 2000 max. * | 3.32 | 3.97 -20% | 4.76 -43% | 7.24 -118% | 8.6 -159% |
| Colorchecker dE 2000 calibrated * | 1.33 | 1.4 -5% | 0.78 41% | 1.36 -2% | 0.75 44% |
| Greyscale dE 2000 * | 2.2 | 3.1 -41% | 2.7 -23% | 3.1 -41% | 5.5 -150% |
| Gamma | 2.123 104% | 2.191 100% | 2.201 100% | 2.486 88% | 2.212 99% |
| CCT | 6457 101% | 6194 105% | 6770 96% | 6832 95% | 7059 92% |
| Moyenne finale (programmes/paramètres) | -17% /
-14% | -1% /
-2% | 3% /
-12% | -7% /
-22% |
* ... Moindre est la valeur, meilleures sont les performances
Temps de réponse de l'écran
| ↔ Temps de réponse noir à blanc | ||
|---|---|---|
| 5.2 ms ... hausse ↗ et chute ↘ combinées | ↗ 1.2 ms hausse | 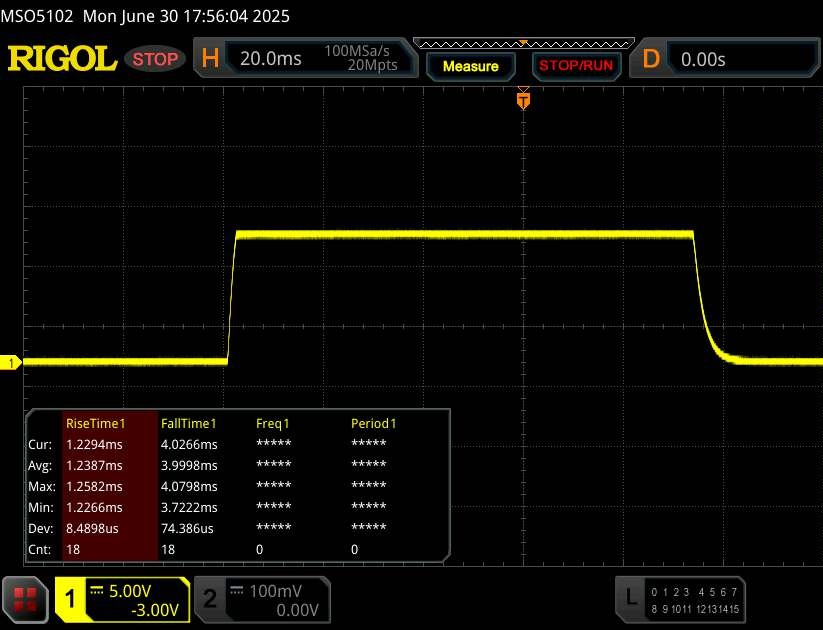 |
| ↘ 4 ms chute | ||
| L'écran montre de très faibles temps de réponse, parfait pour le jeu. En comparaison, tous les appareils testés affichent entre 0.1 (minimum) et 240 (maximum) ms. » 15 % des appareils testés affichent de meilleures performances. Cela signifie que les latences relevées sont meilleures que la moyenne (20.5 ms) de tous les appareils testés. | ||
| ↔ Temps de réponse gris 50% à gris 80% | ||
| 10 ms ... hausse ↗ et chute ↘ combinées | ↗ 3.2 ms hausse | 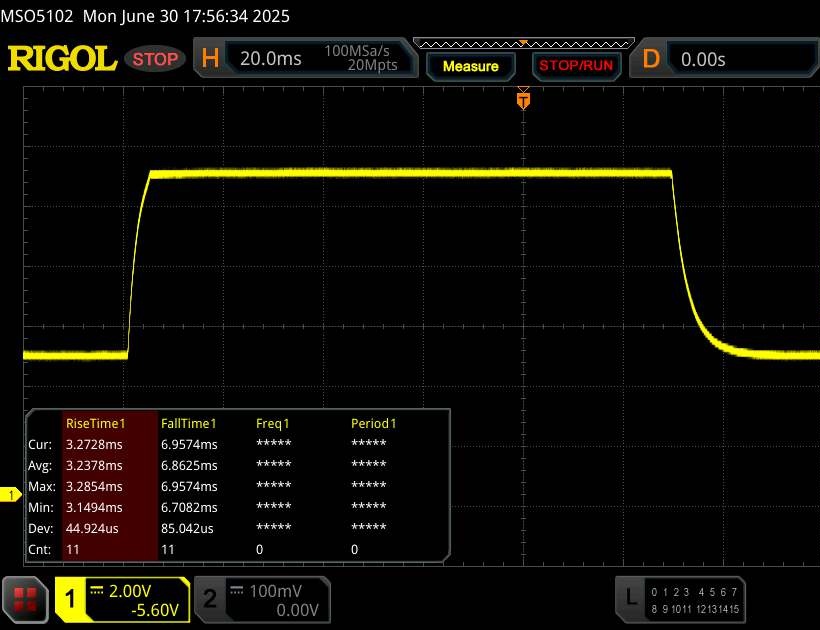 |
| ↘ 6.8 ms chute | ||
| L'écran montre de bons temps de réponse, mais insuffisant pour du jeu compétitif. En comparaison, tous les appareils testés affichent entre 0.165 (minimum) et 636 (maximum) ms. » 21 % des appareils testés affichent de meilleures performances. Cela signifie que les latences relevées sont meilleures que la moyenne (32.1 ms) de tous les appareils testés. | ||
Scintillement / MLI (Modulation de largeur d'impulsion)
| Scintillement / MLI (Modulation de largeur d'impulsion) non décelé | 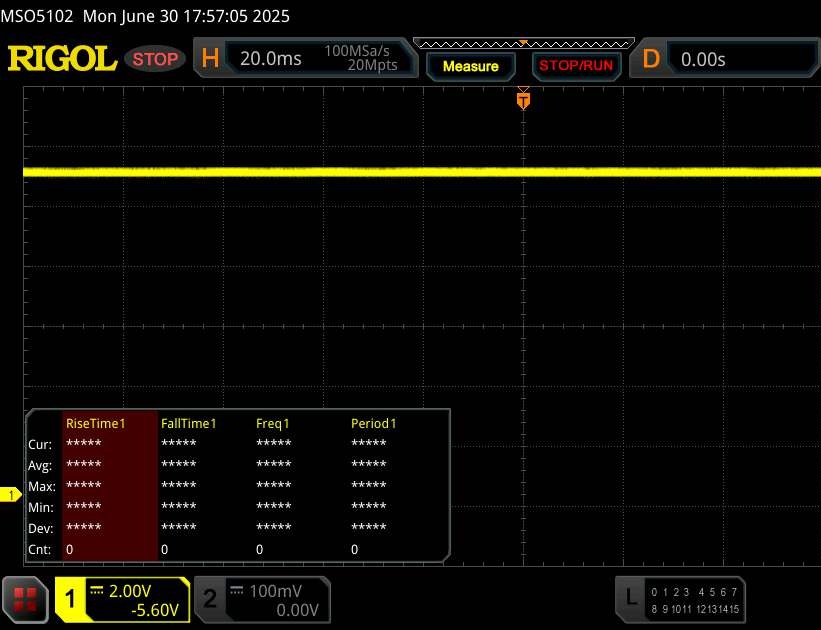 | ||
En comparaison, 53 % des appareils testés n'emploient pas MDI pour assombrir leur écran. Nous avons relevé une moyenne à 8350 (minimum : 5 - maximum : 343500) Hz dans le cas où une MDI était active. | |||
Performance
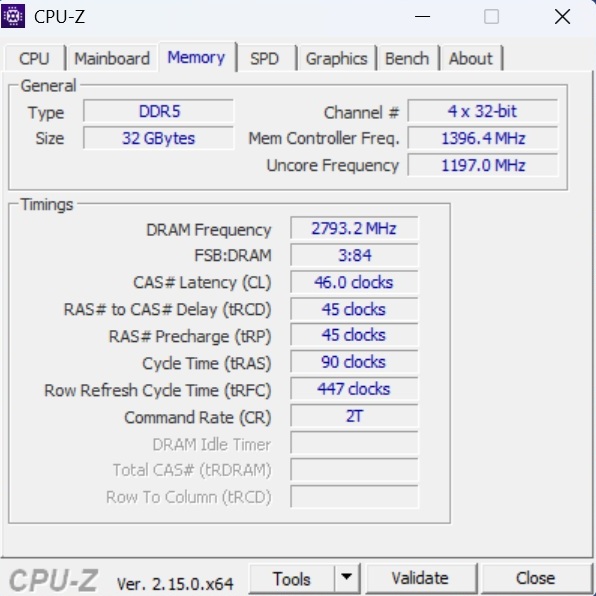
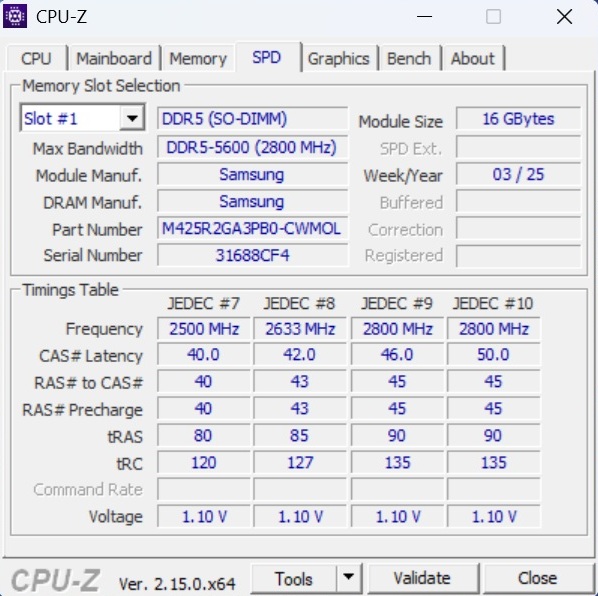
Les performances du Major 16 X1 se situent entre le milieu et le haut de gamme. Le modèle de test (MD62736) est équipé de 32 Go de RAM DDR5 (2x 16 Go), ce qui devrait suffire pour les années à venir. Il en va de même pour le SSD NVMe de 2 To.
Conditions d'essai
Le centre de contrôle Erazer offre trois modes de performance : Silent, Balanced et Gaming. Ces modes diffèrent considérablement en termes de niveaux sonores et de performances globales (voir tableau). Toutes les mesures ont été effectuées en mode Gaming, à l'exception du test de la batterie.
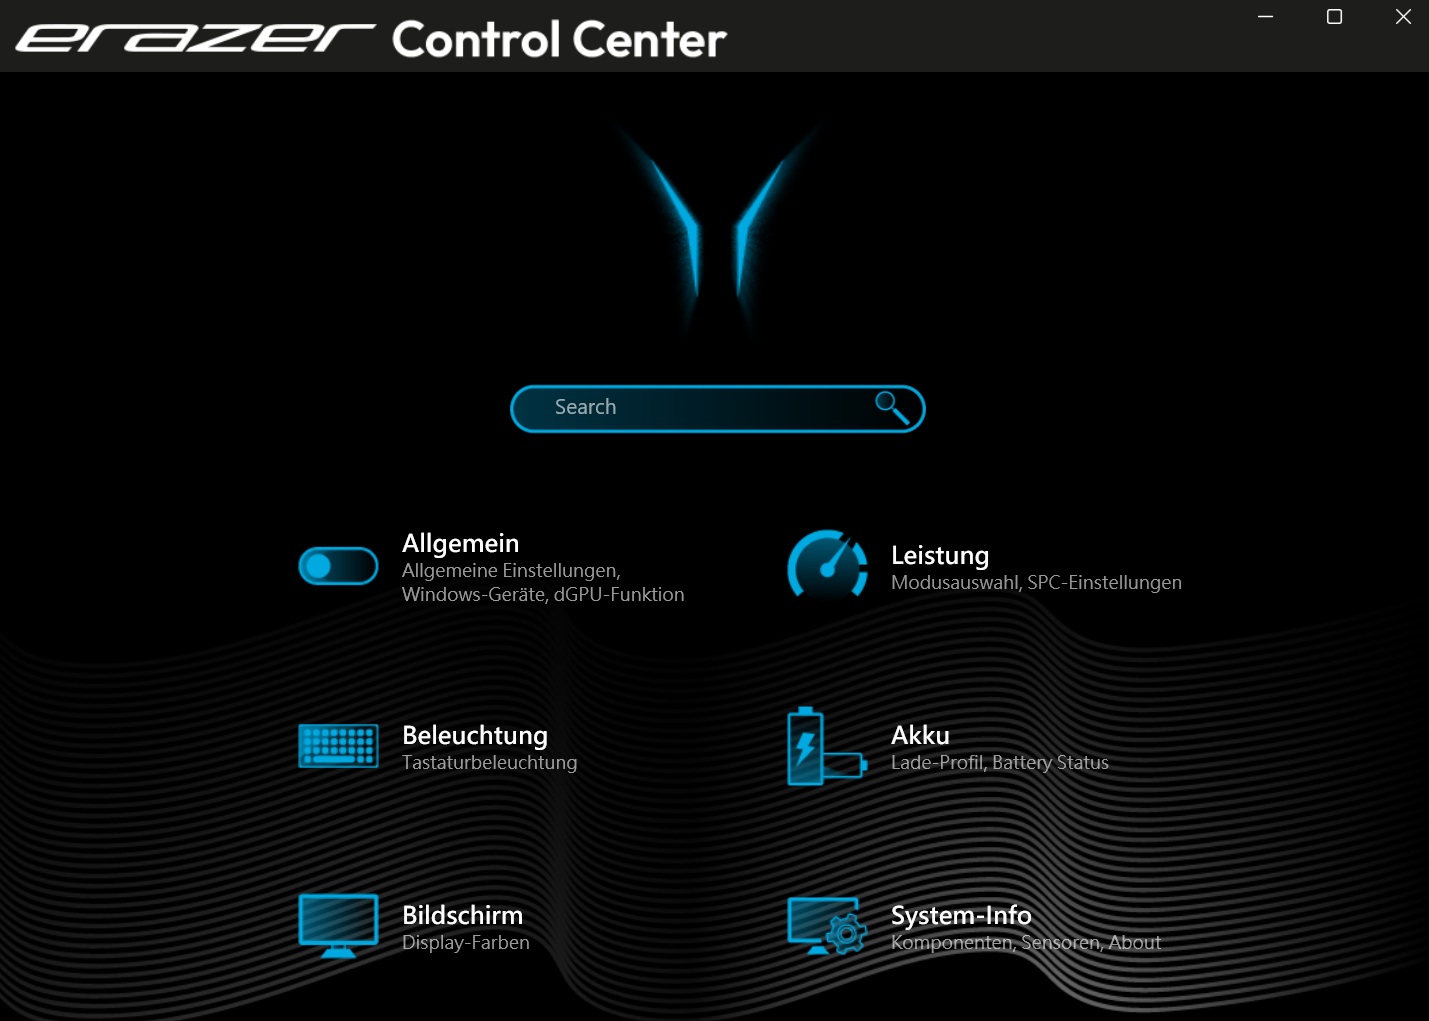
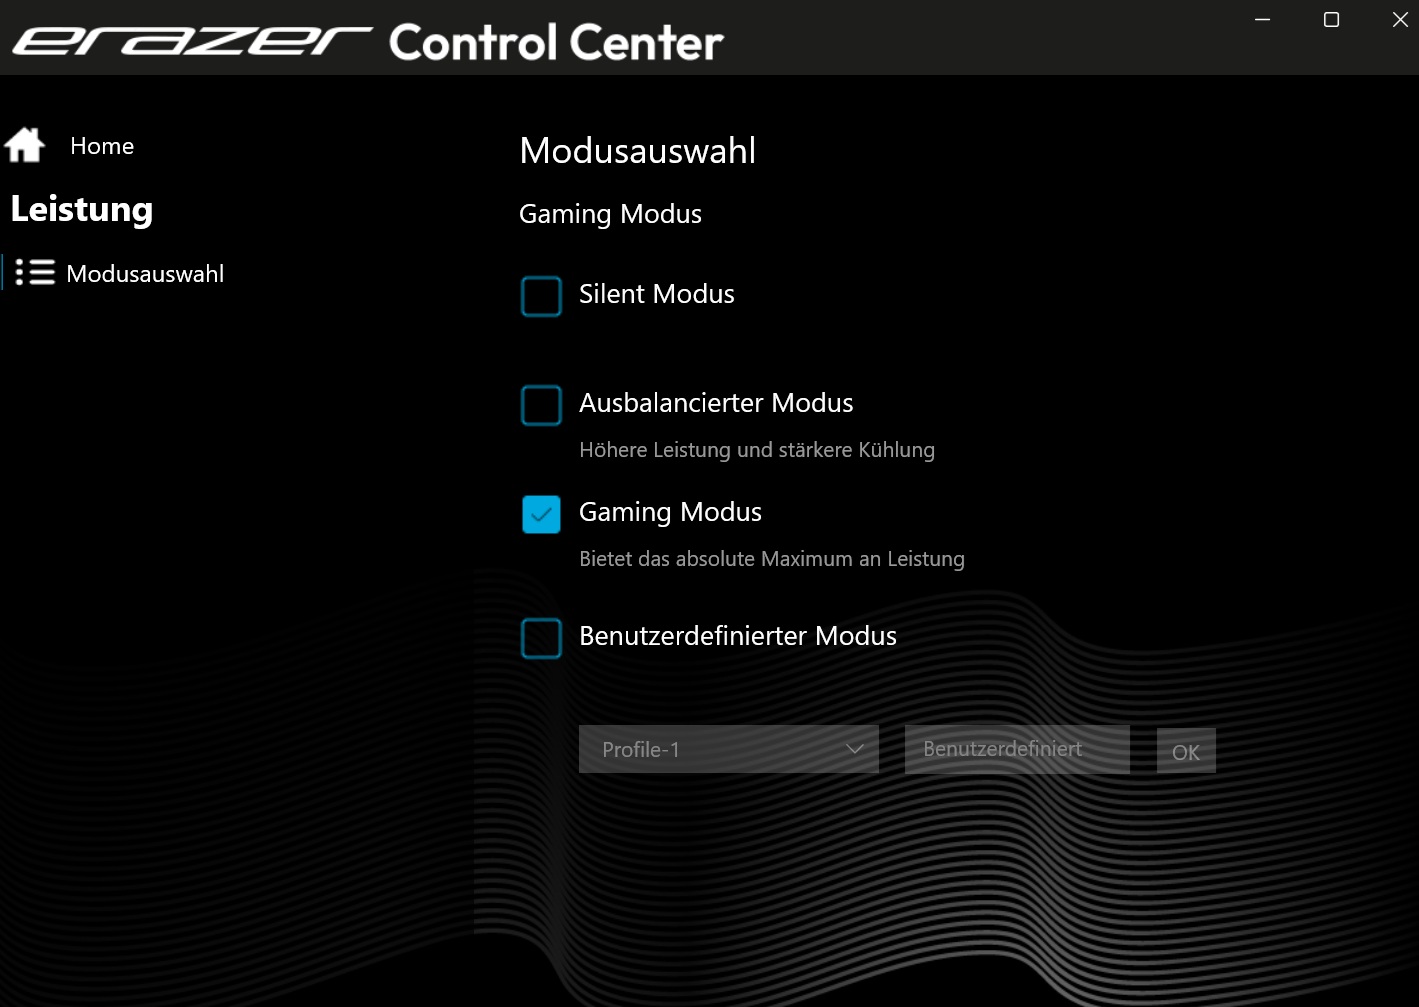
| Medion Control Center mode | Silencieux | Équilibré | Gaming |
| Bruit de Cyberpunk 2077 | 34 dB(A) | 49 dB(A) | 54 dB(A) |
| Performances de Cyberpunk 2077 (FHD/Ultra) | 30 fps verrouillé | 122 fps | 129 fps |
| Score Cinebench R15 multi | 2971 points | 4008 points | 4796 points |
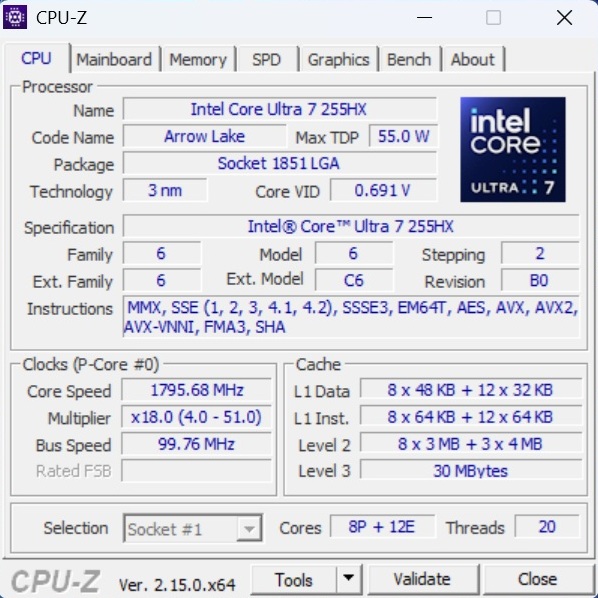
Processeur
Le Core Ultra 7 255HXest une puce rapide à 20 cœurs de la génération Arrow Lake d'Intel (8 cœurs P, 12 cœurs E), construite sur un processus de 3 nm. Le Major 16 X1 obtient de très bons résultats dans nos benchmarks CPU. Il surpasse non seulement l'ancien Major X20 (Core i9-13900HX), mais aussi le Vector 16 HX, qui utilise le même processeur 255HX. L'ordinateur portable fournit également des scores constants tout au long de la boucle Cinebench.
Cinebench R15 multi sustained test
* ... Moindre est la valeur, meilleures sont les performances
AIDA64: FP32 Ray-Trace | FPU Julia | CPU SHA3 | CPU Queen | FPU SinJulia | FPU Mandel | CPU AES | CPU ZLib | FP64 Ray-Trace | CPU PhotoWorxx
| Performance Rating | |
| Medion Erazer Major 16 X1 MD62736 | |
| Moyenne Intel Core Ultra 7 255HX | |
| Medion Erazer Beast 18 X1 MD62731 | |
| Medion Erazer Major X20 | |
| MSI Vector 16 HX AI A2XWHG | |
| Moyenne de la classe Gaming | |
| MSI Katana 17 HX B14WGK | |
| AIDA64 / FP32 Ray-Trace | |
| Medion Erazer Major 16 X1 MD62736 | |
| Moyenne Intel Core Ultra 7 255HX (27732 - 32373, n=2) | |
| Medion Erazer Beast 18 X1 MD62731 | |
| MSI Vector 16 HX AI A2XWHG | |
| Moyenne de la classe Gaming (7192 - 85542, n=141, 2 dernières années) | |
| Medion Erazer Major X20 | |
| MSI Katana 17 HX B14WGK | |
| AIDA64 / FPU Julia | |
| Medion Erazer Major 16 X1 MD62736 | |
| Moyenne Intel Core Ultra 7 255HX (140290 - 163570, n=2) | |
| MSI Vector 16 HX AI A2XWHG | |
| Medion Erazer Beast 18 X1 MD62731 | |
| Medion Erazer Major X20 | |
| Moyenne de la classe Gaming (35040 - 252486, n=141, 2 dernières années) | |
| MSI Katana 17 HX B14WGK | |
| AIDA64 / CPU SHA3 | |
| Medion Erazer Major 16 X1 MD62736 | |
| Medion Erazer Beast 18 X1 MD62731 | |
| Moyenne Intel Core Ultra 7 255HX (6445 - 7513, n=2) | |
| MSI Vector 16 HX AI A2XWHG | |
| Medion Erazer Major X20 | |
| Moyenne de la classe Gaming (1728 - 10389, n=141, 2 dernières années) | |
| MSI Katana 17 HX B14WGK | |
| AIDA64 / CPU Queen | |
| Medion Erazer Major X20 | |
| Medion Erazer Major 16 X1 MD62736 | |
| Moyenne Intel Core Ultra 7 255HX (115802 - 130615, n=2) | |
| Moyenne de la classe Gaming (50699 - 200651, n=141, 2 dernières années) | |
| MSI Vector 16 HX AI A2XWHG | |
| Medion Erazer Beast 18 X1 MD62731 | |
| MSI Katana 17 HX B14WGK | |
| AIDA64 / FPU SinJulia | |
| Medion Erazer Major X20 | |
| Moyenne de la classe Gaming (5020 - 33636, n=141, 2 dernières années) | |
| Medion Erazer Major 16 X1 MD62736 | |
| Moyenne Intel Core Ultra 7 255HX (11066 - 12035, n=2) | |
| Medion Erazer Beast 18 X1 MD62731 | |
| MSI Vector 16 HX AI A2XWHG | |
| MSI Katana 17 HX B14WGK | |
| AIDA64 / FPU Mandel | |
| Medion Erazer Major 16 X1 MD62736 | |
| Moyenne Intel Core Ultra 7 255HX (72938 - 84513, n=2) | |
| MSI Vector 16 HX AI A2XWHG | |
| Medion Erazer Beast 18 X1 MD62731 | |
| Medion Erazer Major X20 | |
| Moyenne de la classe Gaming (17585 - 134044, n=141, 2 dernières années) | |
| MSI Katana 17 HX B14WGK | |
| AIDA64 / CPU AES | |
| Medion Erazer Major X20 | |
| Medion Erazer Major 16 X1 MD62736 | |
| Moyenne de la classe Gaming (19065 - 328679, n=141, 2 dernières années) | |
| Medion Erazer Beast 18 X1 MD62731 | |
| Moyenne Intel Core Ultra 7 255HX (96832 - 112828, n=2) | |
| MSI Vector 16 HX AI A2XWHG | |
| MSI Katana 17 HX B14WGK | |
| AIDA64 / CPU ZLib | |
| Medion Erazer Major X20 | |
| Medion Erazer Beast 18 X1 MD62731 | |
| Medion Erazer Major 16 X1 MD62736 | |
| Moyenne Intel Core Ultra 7 255HX (1510 - 1752, n=2) | |
| MSI Vector 16 HX AI A2XWHG | |
| Moyenne de la classe Gaming (373 - 2531, n=141, 2 dernières années) | |
| MSI Katana 17 HX B14WGK | |
| AIDA64 / FP64 Ray-Trace | |
| Medion Erazer Major 16 X1 MD62736 | |
| Moyenne Intel Core Ultra 7 255HX (15137 - 17617, n=2) | |
| MSI Vector 16 HX AI A2XWHG | |
| Medion Erazer Beast 18 X1 MD62731 | |
| Moyenne de la classe Gaming (3856 - 45446, n=141, 2 dernières années) | |
| Medion Erazer Major X20 | |
| MSI Katana 17 HX B14WGK | |
| AIDA64 / CPU PhotoWorxx | |
| Medion Erazer Major 16 X1 MD62736 | |
| Medion Erazer Beast 18 X1 MD62731 | |
| Moyenne Intel Core Ultra 7 255HX (39697 - 49664, n=2) | |
| Medion Erazer Major X20 | |
| Moyenne de la classe Gaming (10805 - 62916, n=141, 2 dernières années) | |
| MSI Vector 16 HX AI A2XWHG | |
| MSI Katana 17 HX B14WGK | |
Performance du système
En termes de performances du système, le Major 16 X1 occupe la première place du test, juste devant le Beast 18 X1.
PCMark 10: Score | Essentials | Productivity | Digital Content Creation
CrossMark: Overall | Productivity | Creativity | Responsiveness
WebXPRT 3: Overall
WebXPRT 4: Overall
Mozilla Kraken 1.1: Total
| Performance Rating | |
| Medion Erazer Major 16 X1 MD62736 | |
| Medion Erazer Beast 18 X1 MD62731 | |
| Moyenne Intel Core Ultra 7 255HX, Nvidia GeForce RTX 5070 Ti Laptop | |
| Moyenne de la classe Gaming | |
| MSI Vector 16 HX AI A2XWHG | |
| Medion Erazer Major X20 | |
| MSI Katana 17 HX B14WGK | |
| PCMark 10 / Score | |
| Medion Erazer Beast 18 X1 MD62731 | |
| Moyenne de la classe Gaming (5776 - 9852, n=128, 2 dernières années) | |
| Medion Erazer Major 16 X1 MD62736 | |
| Moyenne Intel Core Ultra 7 255HX, Nvidia GeForce RTX 5070 Ti Laptop (7842 - 7858, n=2) | |
| MSI Vector 16 HX AI A2XWHG | |
| Medion Erazer Major X20 | |
| MSI Katana 17 HX B14WGK | |
| PCMark 10 / Essentials | |
| Medion Erazer Major X20 | |
| Moyenne de la classe Gaming (9057 - 12600, n=128, 2 dernières années) | |
| Medion Erazer Major 16 X1 MD62736 | |
| Moyenne Intel Core Ultra 7 255HX, Nvidia GeForce RTX 5070 Ti Laptop (10737 - 10773, n=2) | |
| MSI Vector 16 HX AI A2XWHG | |
| Medion Erazer Beast 18 X1 MD62731 | |
| MSI Katana 17 HX B14WGK | |
| PCMark 10 / Productivity | |
| Moyenne de la classe Gaming (6662 - 14612, n=128, 2 dernières années) | |
| Medion Erazer Major X20 | |
| Medion Erazer Beast 18 X1 MD62731 | |
| MSI Vector 16 HX AI A2XWHG | |
| Moyenne Intel Core Ultra 7 255HX, Nvidia GeForce RTX 5070 Ti Laptop (9270 - 9510, n=2) | |
| Medion Erazer Major 16 X1 MD62736 | |
| MSI Katana 17 HX B14WGK | |
| PCMark 10 / Digital Content Creation | |
| Medion Erazer Beast 18 X1 MD62731 | |
| Moyenne de la classe Gaming (7440 - 19351, n=128, 2 dernières années) | |
| Medion Erazer Major 16 X1 MD62736 | |
| Moyenne Intel Core Ultra 7 255HX, Nvidia GeForce RTX 5070 Ti Laptop (12817 - 13186, n=2) | |
| MSI Vector 16 HX AI A2XWHG | |
| MSI Katana 17 HX B14WGK | |
| Medion Erazer Major X20 | |
| CrossMark / Overall | |
| Medion Erazer Major 16 X1 MD62736 | |
| Moyenne Intel Core Ultra 7 255HX, Nvidia GeForce RTX 5070 Ti Laptop (1944 - 2097, n=2) | |
| MSI Katana 17 HX B14WGK | |
| Moyenne de la classe Gaming (1247 - 2344, n=110, 2 dernières années) | |
| MSI Vector 16 HX AI A2XWHG | |
| Medion Erazer Beast 18 X1 MD62731 | |
| Medion Erazer Major X20 | |
| CrossMark / Productivity | |
| Medion Erazer Major 16 X1 MD62736 | |
| Moyenne Intel Core Ultra 7 255HX, Nvidia GeForce RTX 5070 Ti Laptop (1845 - 1959, n=2) | |
| MSI Katana 17 HX B14WGK | |
| Moyenne de la classe Gaming (1299 - 2211, n=110, 2 dernières années) | |
| MSI Vector 16 HX AI A2XWHG | |
| Medion Erazer Beast 18 X1 MD62731 | |
| Medion Erazer Major X20 | |
| CrossMark / Creativity | |
| Medion Erazer Major 16 X1 MD62736 | |
| Moyenne Intel Core Ultra 7 255HX, Nvidia GeForce RTX 5070 Ti Laptop (2249 - 2400, n=2) | |
| MSI Vector 16 HX AI A2XWHG | |
| Moyenne de la classe Gaming (1275 - 2729, n=110, 2 dernières années) | |
| Medion Erazer Beast 18 X1 MD62731 | |
| Medion Erazer Major X20 | |
| MSI Katana 17 HX B14WGK | |
| CrossMark / Responsiveness | |
| MSI Katana 17 HX B14WGK | |
| Moyenne de la classe Gaming (1030 - 2330, n=110, 2 dernières années) | |
| Medion Erazer Major 16 X1 MD62736 | |
| Medion Erazer Major X20 | |
| Moyenne Intel Core Ultra 7 255HX, Nvidia GeForce RTX 5070 Ti Laptop (1468 - 1713, n=2) | |
| MSI Vector 16 HX AI A2XWHG | |
| Medion Erazer Beast 18 X1 MD62731 | |
| WebXPRT 3 / Overall | |
| Medion Erazer Beast 18 X1 MD62731 | |
| Medion Erazer Major 16 X1 MD62736 | |
| Medion Erazer Major X20 | |
| Moyenne Intel Core Ultra 7 255HX, Nvidia GeForce RTX 5070 Ti Laptop (319 - 325, n=2) | |
| MSI Vector 16 HX AI A2XWHG | |
| Moyenne de la classe Gaming (237 - 532, n=122, 2 dernières années) | |
| MSI Katana 17 HX B14WGK | |
| WebXPRT 4 / Overall | |
| Medion Erazer Beast 18 X1 MD62731 | |
| Medion Erazer Major 16 X1 MD62736 | |
| Moyenne Intel Core Ultra 7 255HX, Nvidia GeForce RTX 5070 Ti Laptop (305 - 306, n=2) | |
| MSI Vector 16 HX AI A2XWHG | |
| Medion Erazer Major X20 | |
| Moyenne de la classe Gaming (176.4 - 341, n=109, 2 dernières années) | |
| MSI Katana 17 HX B14WGK | |
| Mozilla Kraken 1.1 / Total | |
| MSI Katana 17 HX B14WGK | |
| Moyenne de la classe Gaming (397 - 674, n=132, 2 dernières années) | |
| Medion Erazer Major X20 | |
| MSI Vector 16 HX AI A2XWHG | |
| Medion Erazer Major 16 X1 MD62736 | |
| Moyenne Intel Core Ultra 7 255HX, Nvidia GeForce RTX 5070 Ti Laptop (425 - 425, n=2) | |
| Medion Erazer Beast 18 X1 MD62731 | |
* ... Moindre est la valeur, meilleures sont les performances
| PCMark 10 Score | 7858 points | |
Aide | ||
| AIDA64 / Memory Copy | |
| Medion Erazer Beast 18 X1 MD62731 | |
| Medion Erazer Major 16 X1 MD62736 | |
| Moyenne Intel Core Ultra 7 255HX (68939 - 77224, n=2) | |
| Moyenne de la classe Gaming (21750 - 97515, n=141, 2 dernières années) | |
| MSI Vector 16 HX AI A2XWHG | |
| Medion Erazer Major X20 | |
| MSI Katana 17 HX B14WGK | |
| AIDA64 / Memory Read | |
| Medion Erazer Beast 18 X1 MD62731 | |
| Medion Erazer Major 16 X1 MD62736 | |
| Moyenne Intel Core Ultra 7 255HX (82336 - 85818, n=2) | |
| MSI Vector 16 HX AI A2XWHG | |
| Medion Erazer Major X20 | |
| Moyenne de la classe Gaming (22956 - 104349, n=141, 2 dernières années) | |
| MSI Katana 17 HX B14WGK | |
| AIDA64 / Memory Write | |
| Medion Erazer Major 16 X1 MD62736 | |
| Moyenne Intel Core Ultra 7 255HX (66479 - 133486, n=2) | |
| Medion Erazer Beast 18 X1 MD62731 | |
| Moyenne de la classe Gaming (22297 - 133486, n=141, 2 dernières années) | |
| MSI Vector 16 HX AI A2XWHG | |
| Medion Erazer Major X20 | |
| MSI Katana 17 HX B14WGK | |
| AIDA64 / Memory Latency | |
| Medion Erazer Beast 18 X1 MD62731 | |
| Medion Erazer Major 16 X1 MD62736 | |
| Moyenne Intel Core Ultra 7 255HX (106.4 - 110, n=2) | |
| MSI Vector 16 HX AI A2XWHG | |
| Moyenne de la classe Gaming (59.5 - 259, n=141, 2 dernières années) | |
| MSI Katana 17 HX B14WGK | |
| Medion Erazer Major X20 | |
* ... Moindre est la valeur, meilleures sont les performances
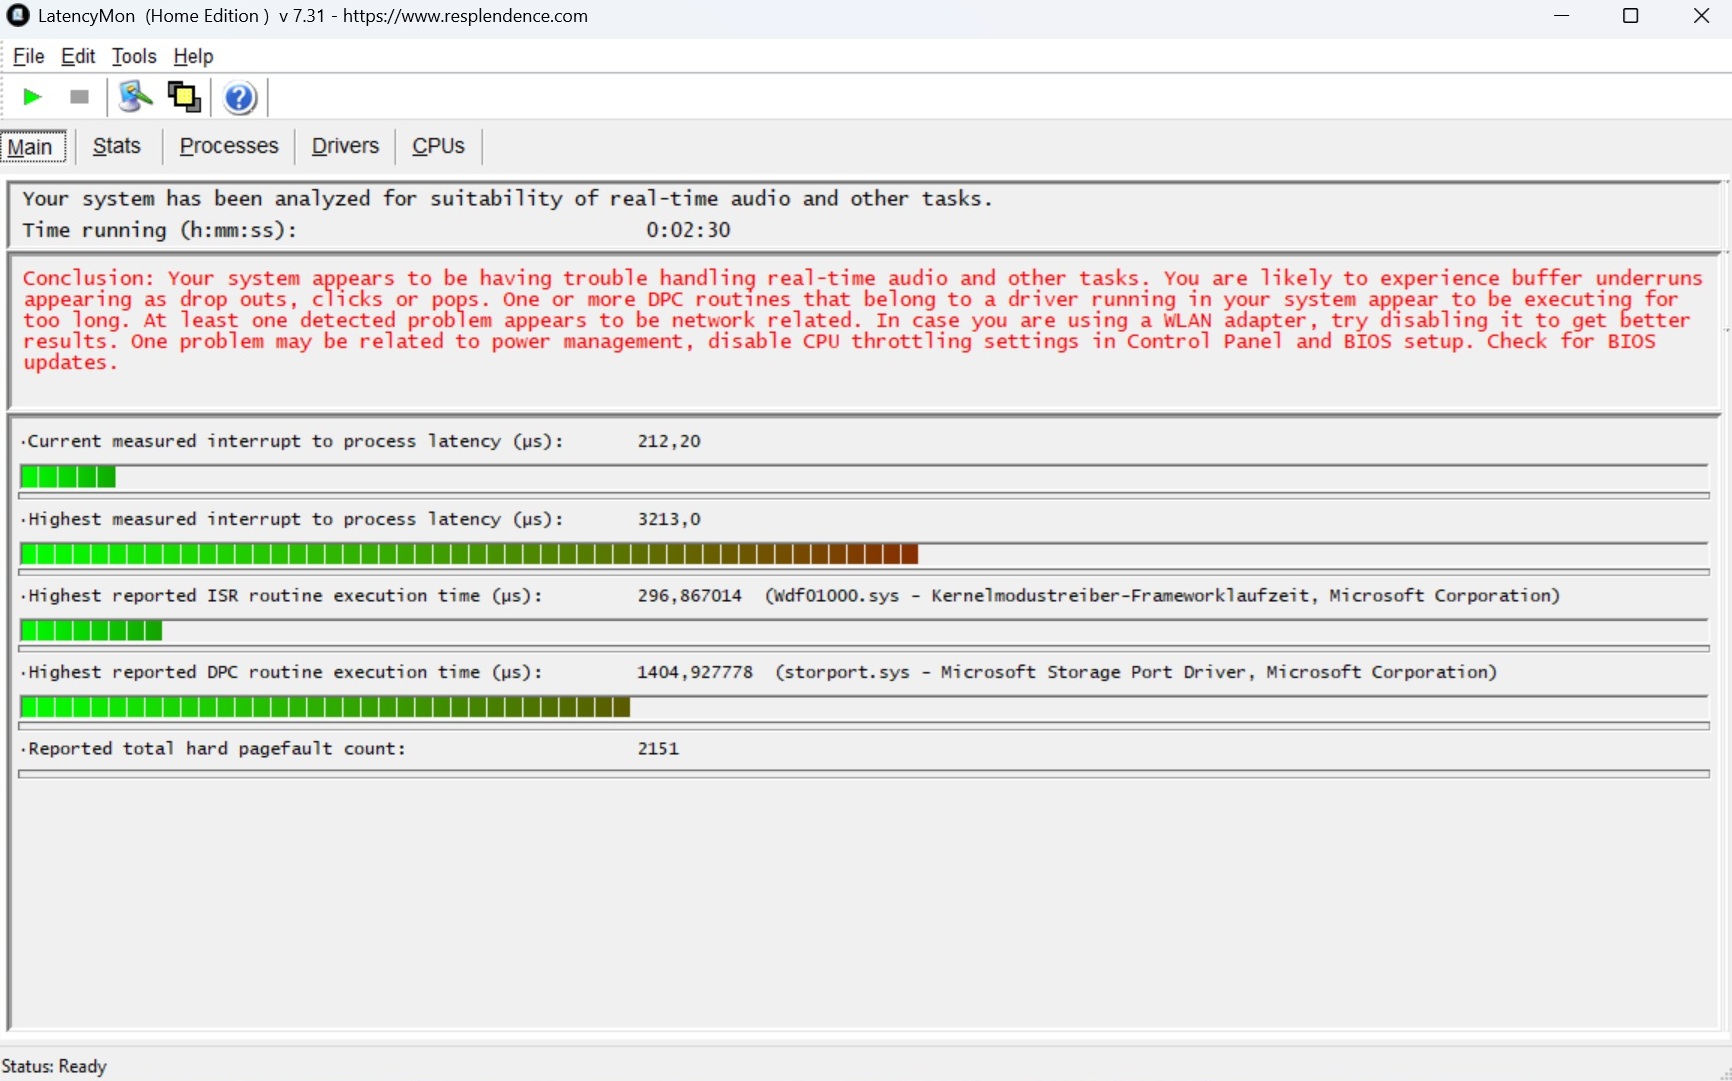
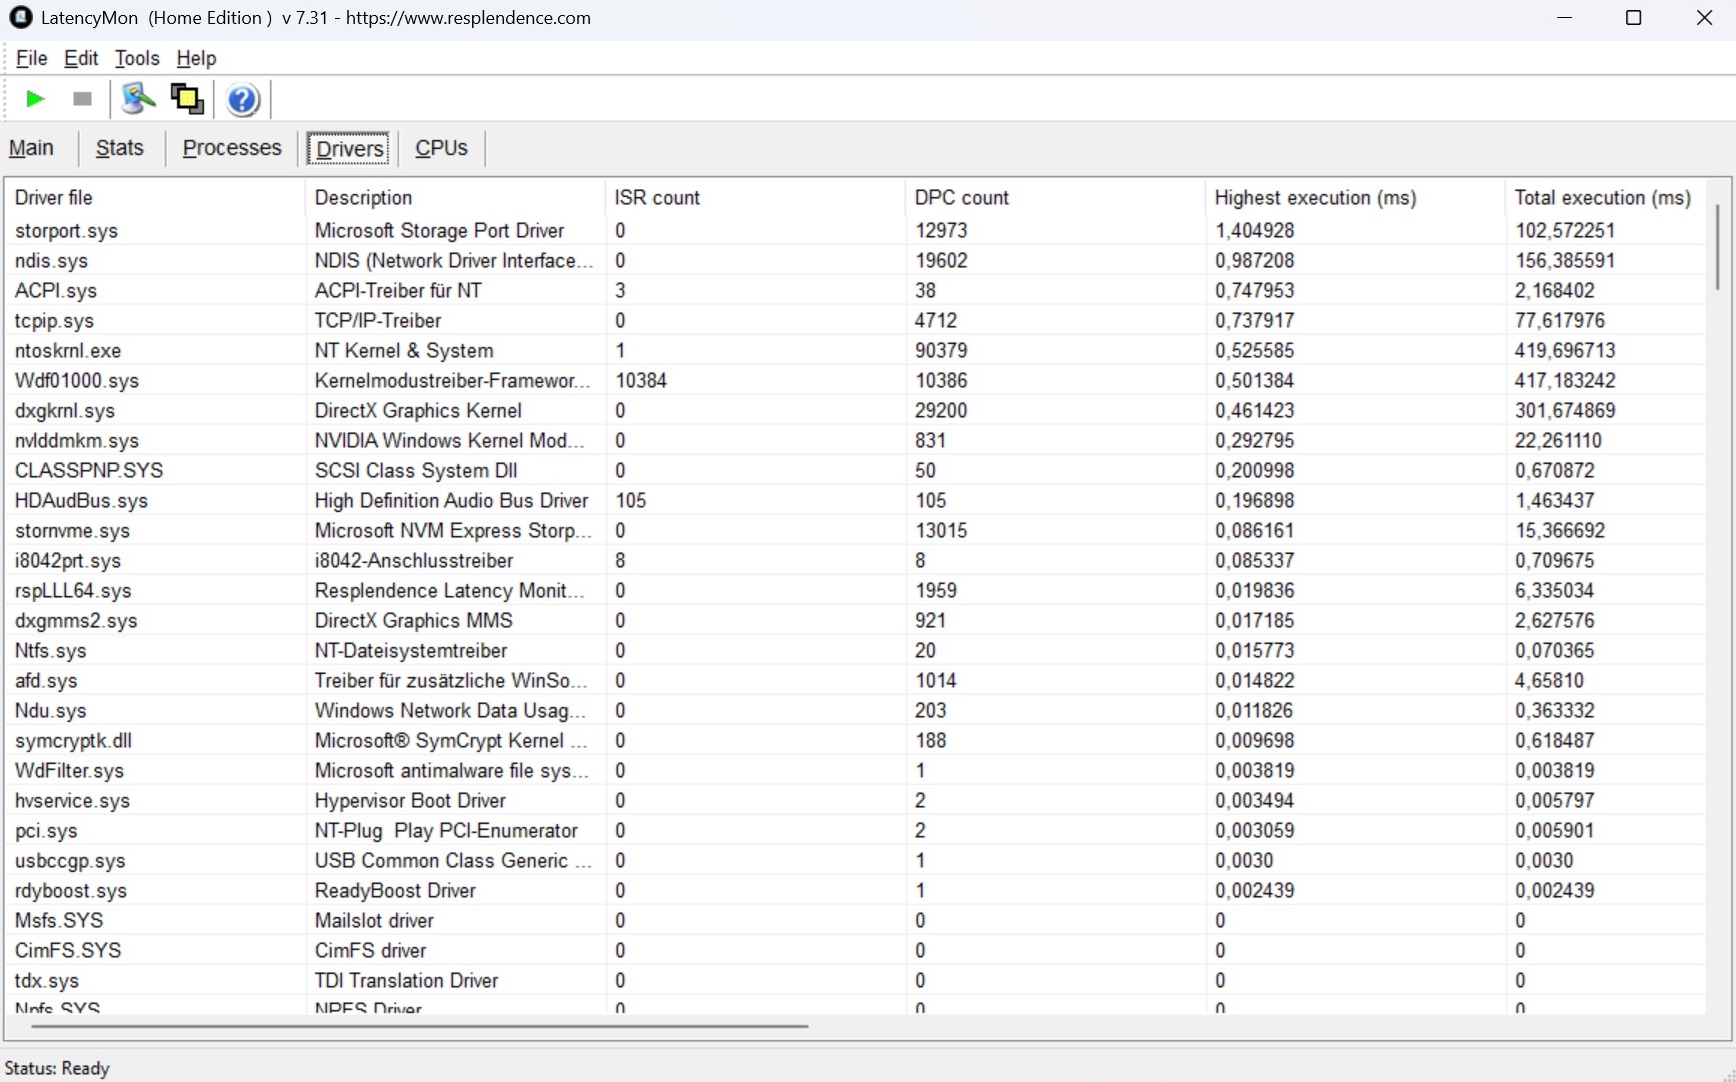
Latences DPC
Comme pour la plupart des ordinateurs portables actuels, les niveaux de latence sont relativement élevés. L'ancien Major X20 était plus performant à cet égard.
| DPC Latencies / LatencyMon - interrupt to process latency (max), Web, Youtube, Prime95 | |
| Medion Erazer Beast 18 X1 MD62731 | |
| MSI Katana 17 HX B14WGK | |
| MSI Vector 16 HX AI A2XWHG | |
| Medion Erazer Major 16 X1 MD62736 | |
| Medion Erazer Major X20 | |
* ... Moindre est la valeur, meilleures sont les performances
Mémoire de masse
Medion équipe le modèle 16 pouces d'un disque SSD très rapide de 2 TB de Phison. Lors des tests de lecture séquentielle, le disque M.2 dépasse même les 10 000 Mo/s par moments. Comme pour les appareils concurrents, il n'y a pas eu de ralentissement notable pendant le test de lecture en boucle.

* ... Moindre est la valeur, meilleures sont les performances
Sustained read performance: DiskSpd read loop, queue depth 8
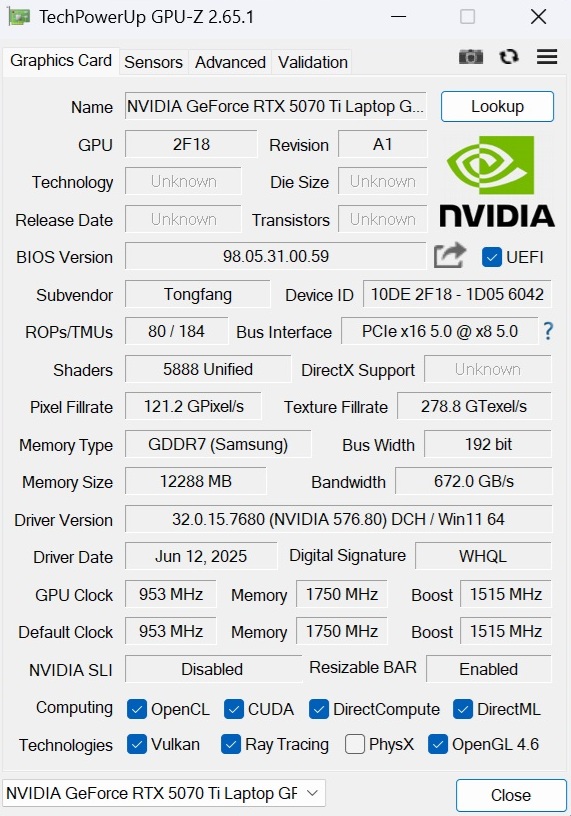
Performance du GPU
Nous avons déjà testé plusieurs fois la carte NVIDIA GeForce RTX 5070 Ti. Le modèle 12 Go basé sur l'architecture Blackwell est très performant dans 3DMark, surpassant la RTX 4070 de la génération précédente d'environ 43 % et la RTX 5070 de la MSI Katana 17 d'environ 35 %. Ses performances sont également légèrement supérieures à la moyenne que nous avons observée jusqu'à présent pour la RTX 5070 Ti. La RTX 5080 de la Beast 18 X1 n'a qu'une avance d'un peu plus de 10%. Pour le Major 16 X1, Medion autorise un TGP de 140 watts, Dynamic Boost inclus.
| 3DMark 11 Performance | 45294 points | |
| 3DMark Cloud Gate Standard Score | 74060 points | |
| 3DMark Fire Strike Score | 39810 points | |
| 3DMark Time Spy Score | 16796 points | |
Aide | ||
* ... Moindre est la valeur, meilleures sont les performances
Performances des jeux
Pour nos tests de jeu, nous nous sommes principalement concentrés sur les performances QHD. Une fois de plus, le modèle 16 pouces offre des taux de rafraîchissement légèrement supérieurs à ceux de la plupart de ses concurrents. La RTX 5080 augmente son avance d'environ 20 %, tandis que la RTX 5070 Ti s'avère près de 40 % plus rapide que la RTX 5070, notamment grâce à sa VRAM plus importante (12 contre 8 Go).
Dans l'ensemble, la Major 16 X1 est capable de faire tourner sans problème presque tous les jeux modernes à 2 560 × 1 440 ou 1 600 pixels avec les réglages maximaux. Seuls les titres extrêmement exigeants ou mal optimisés tels que Oblivion Remastered qu'il n'atteint pas la barre des 40 FPS. Dans ce cas, DLSS 4 et la génération d'images multiples, lorsqu'elle est prise en charge, permettent de remédier efficacement à la situation. Stalker 2 en est un exemple (voir tableau).
| The Elder Scrolls IV Oblivion Remastered | |
| 2560x1440 Ultra Preset AA:T | |
| Medion Erazer Beast 18 X1 MD62731 | |
| Medion Erazer Major 16 X1 MD62736 | |
| Moyenne Nvidia GeForce RTX 5070 Ti Laptop (28 - 30.1, n=2) | |
| Moyenne de la classe Gaming (12.7 - 41.7, n=6, 2 dernières années) | |
| MSI Vector 16 HX AI A2XWHG | |
| MSI Katana 17 HX B14WGK | |
| 2560x1440 Ultra Preset + Quality DLSS | |
| Medion Erazer Beast 18 X1 MD62731 | |
| Medion Erazer Major 16 X1 MD62736 | |
| Moyenne Nvidia GeForce RTX 5070 Ti Laptop (41.9 - 44.7, n=2) | |
| Moyenne de la classe Gaming (25.3 - 59.7, n=6, 2 dernières années) | |
| MSI Vector 16 HX AI A2XWHG | |
| MSI Katana 17 HX B14WGK | |
| Cyberpunk 2077 2.2 Phantom Liberty - 1920x1080 Ultra Preset (FSR off) | |
| Medion Erazer Beast 18 X1 MD62731 | |
| Medion Erazer Major 16 X1 MD62736 | |
| Moyenne Nvidia GeForce RTX 5070 Ti Laptop (104.9 - 135.5, n=8) | |
| MSI Vector 16 HX AI A2XWHG | |
| MSI Katana 17 HX B14WGK | |
| Moyenne de la classe Gaming (6.76 - 166.5, n=119, 2 dernières années) | |
| GTA V - 1920x1080 Highest Settings possible AA:4xMSAA + FX AF:16x | |
| Medion Erazer Major 16 X1 MD62736 | |
| Moyenne Nvidia GeForce RTX 5070 Ti Laptop (124.7 - 161, n=6) | |
| MSI Vector 16 HX AI A2XWHG | |
| Medion Erazer Beast 18 X1 MD62731 | |
| Medion Erazer Major X20 | |
| Moyenne de la classe Gaming (12.1 - 186.9, n=123, 2 dernières années) | |
| MSI Katana 17 HX B14WGK | |
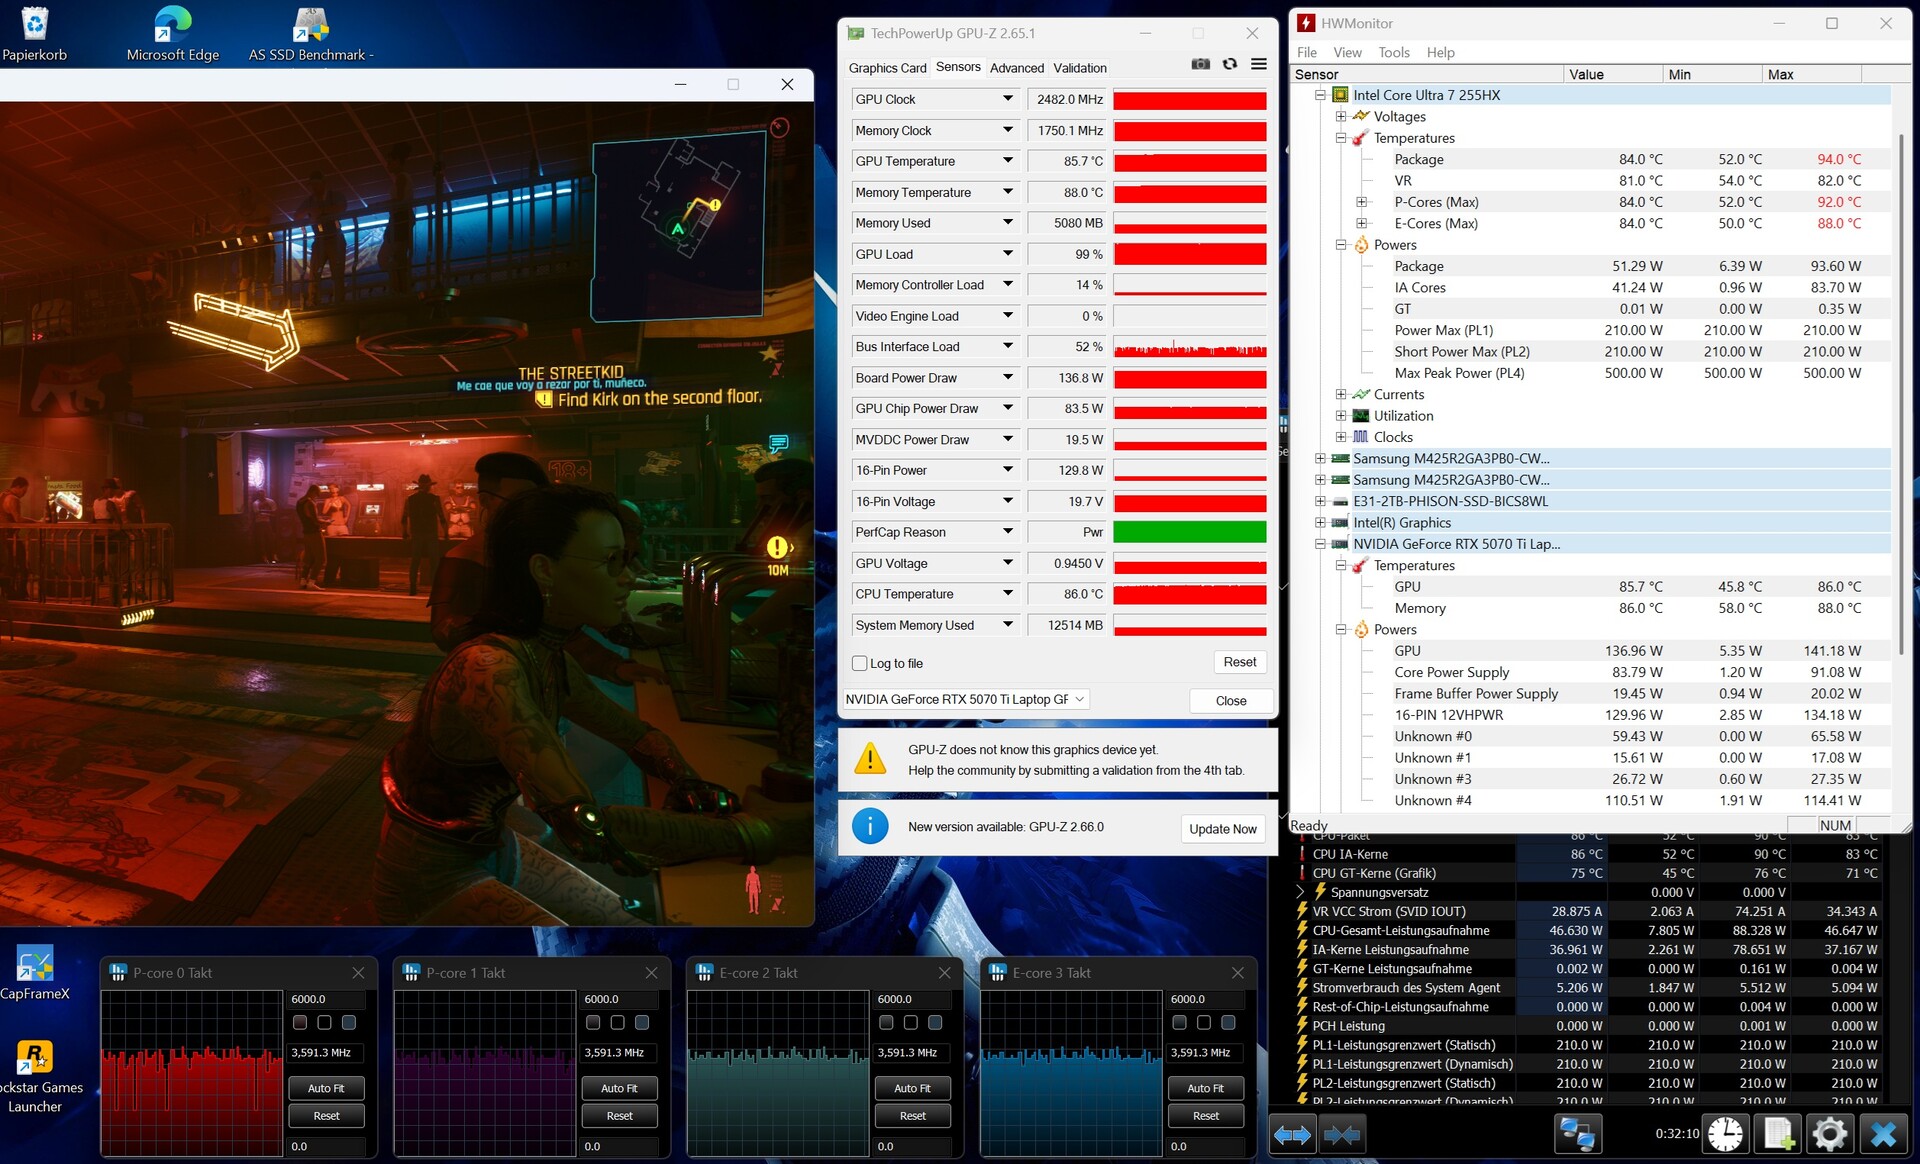
Le test à long terme avec Cyberpunk 2077 n'a réservé aucune surprise : Le taux de rafraîchissement de la Major 16 X1 est resté très constant.
Cyberpunk 2077 ultra FPS chart
| Bas | Moyen | Élevé | Ultra | QHD DLSS | QHD | |
|---|---|---|---|---|---|---|
| GTA V (2015) | 186 | 181 | 149 | 143 | ||
| Dota 2 Reborn (2015) | 213 | 186 | 185.5 | 171.4 | ||
| Final Fantasy XV Benchmark (2018) | 221 | 173.1 | 132.4 | |||
| X-Plane 11.11 (2018) | 144.1 | 123.7 | 101.6 | |||
| Baldur's Gate 3 (2023) | 188 | 161 | 156 | 103 | ||
| Cyberpunk 2077 2.2 Phantom Liberty (2023) | 166.9 | 143.2 | 129 | 80.8 | ||
| Stalker 2 (2024) | 89.8 | 76.6 | 65.5 | 104.6 | 49.9 | |
| Kingdom Come Deliverance 2 (2025) | 153.5 | 126.7 | 88.2 | 86.1 | 62.7 | |
| Civilization 7 (2025) | 212 | 202 | 141.9 | |||
| The Elder Scrolls IV Oblivion Remastered (2025) | 94 | 81.8 | 42.9 | 44.7 | 30.1 | |
| Doom: The Dark Ages (2025) | 94.9 | 86.1 | 85.4 | 82.5 | 59.1 |
Émissions
Émissions sonores
En mode Gaming, l'ordinateur portable 16 pouces devient assez bruyant sous charge : 53 à 54 dB(A) sont clairement audibles et peuvent être gênants, d'où l'intérêt d'utiliser un casque. Cela dit, certains concurrents sont encore plus bruyants, approchant les 60 dB(A). En mode veille, l'ordinateur portable de Medion reste agréablement silencieux, avec une moyenne de 27 dB(A), soit la valeur la plus basse du test.
Degré de la nuisance sonore
| Au repos |
| 26 / 27 / 30 dB(A) |
| Fortement sollicité |
| 53 / 54 dB(A) |
 | ||
30 dB silencieux 40 dB(A) audible 50 dB(A) bruyant |
||
min: | ||
| Medion Erazer Major 16 X1 MD62736 Ultra 7 255HX, GeForce RTX 5070 Ti Laptop | Medion Erazer Major X20 i9-13900HX, NVIDIA GeForce RTX 4070 Laptop GPU | MSI Katana 17 HX B14WGK i7-14650HX, GeForce RTX 5070 Laptop | MSI Vector 16 HX AI A2XWHG Ultra 7 255HX, GeForce RTX 5070 Ti Laptop | Medion Erazer Beast 18 X1 MD62731 Ultra 9 275HX, GeForce RTX 5080 Laptop | |
|---|---|---|---|---|---|
| Noise | -0% | -9% | -6% | -11% | |
| arrêt / environnement * | 25 | 24 4% | 25 -0% | 25 -0% | 25 -0% |
| Idle Minimum * | 26 | 25 4% | 31 -19% | 33 -27% | 25 4% |
| Idle Average * | 27 | 29 -7% | 32 -19% | 34 -26% | 39 -44% |
| Idle Maximum * | 30 | 31 -3% | 34 -13% | 38 -27% | 42 -40% |
| Load Average * | 53 | 50 6% | 50 6% | 46 13% | 52 2% |
| Cyberpunk 2077 ultra * | 54 | 58 -7% | 47 13% | 53 2% | |
| Load Maximum * | 54 | 57 -6% | 59 -9% | 49 9% | 55 -2% |
| Witcher 3 ultra * | 53 |
* ... Moindre est la valeur, meilleures sont les performances
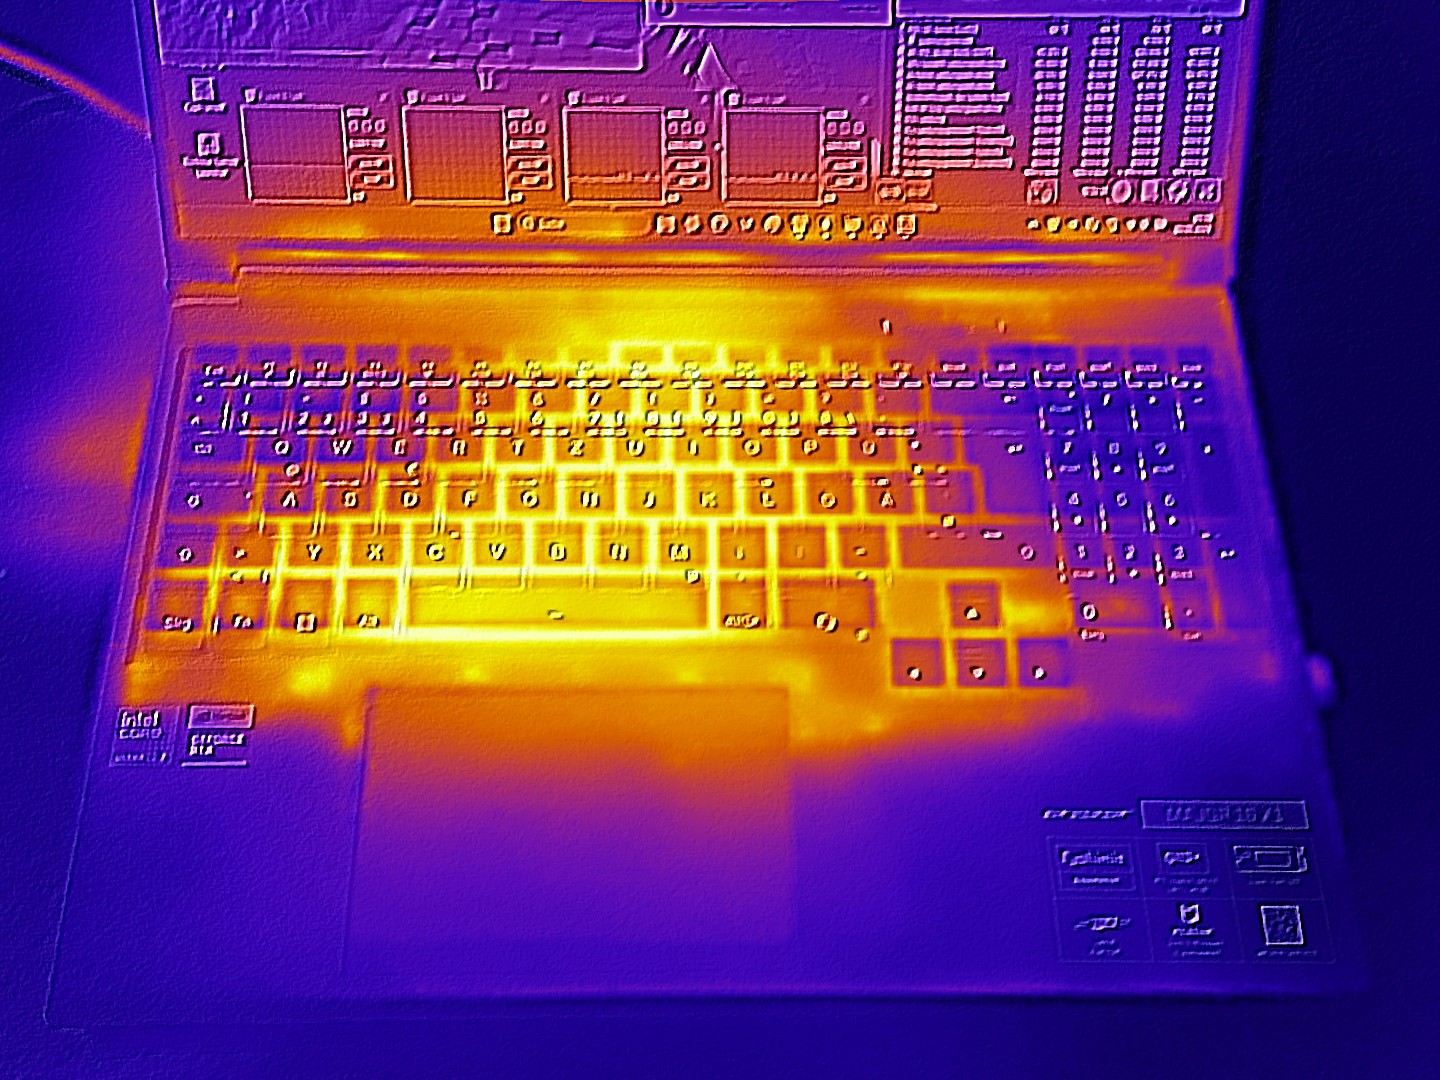
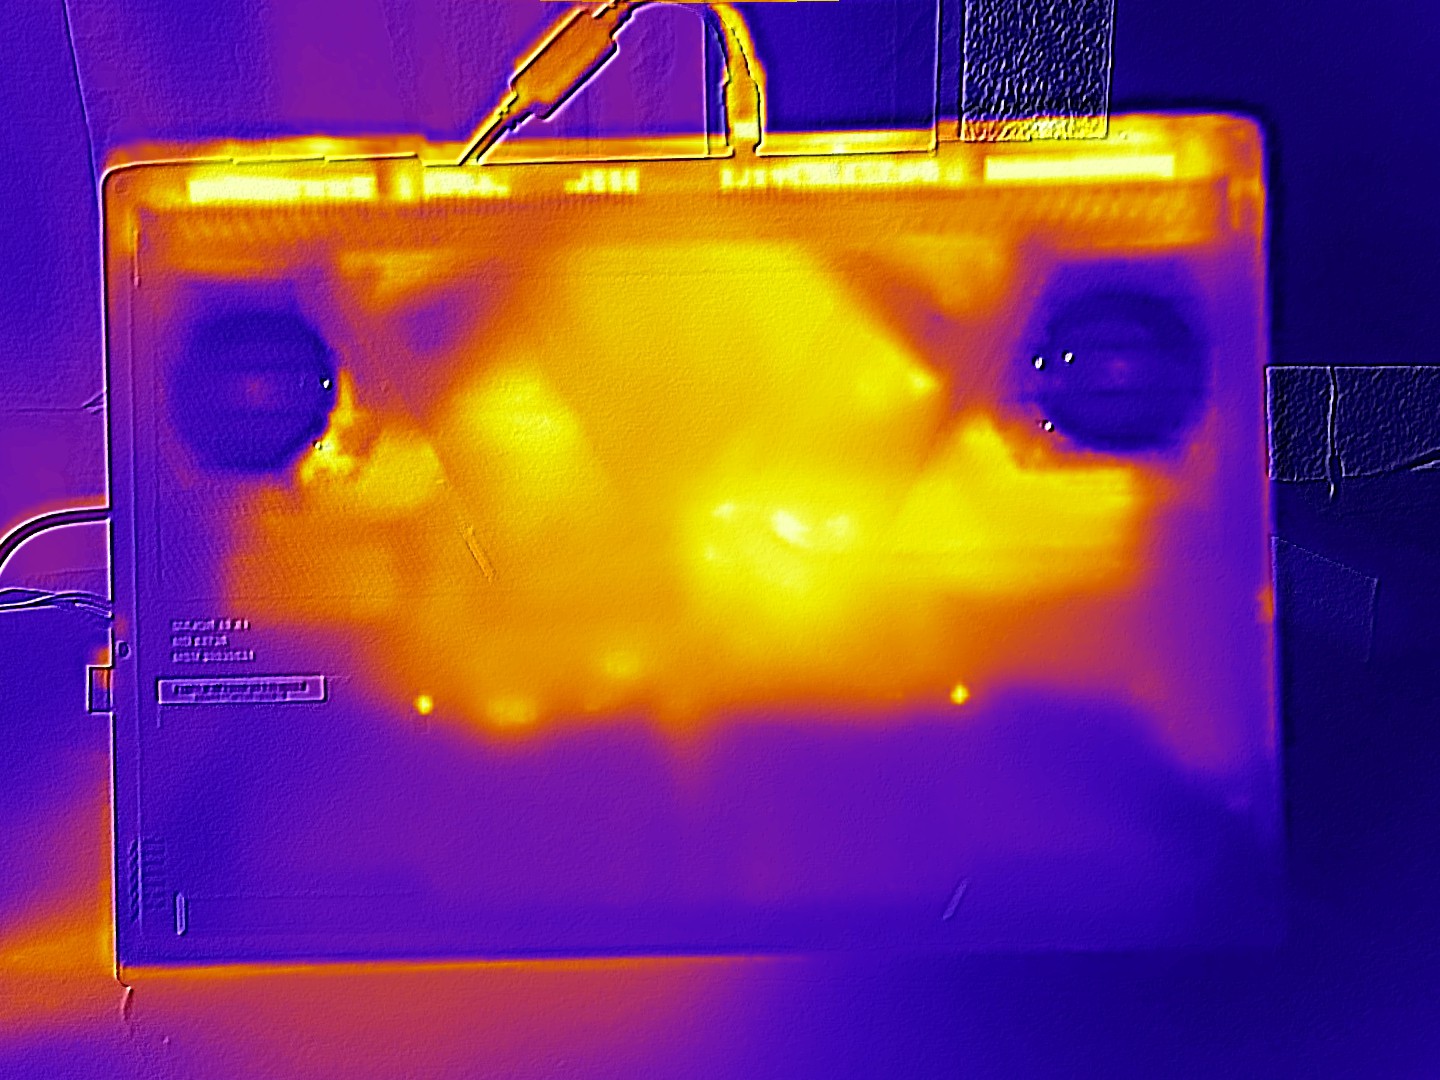
Température
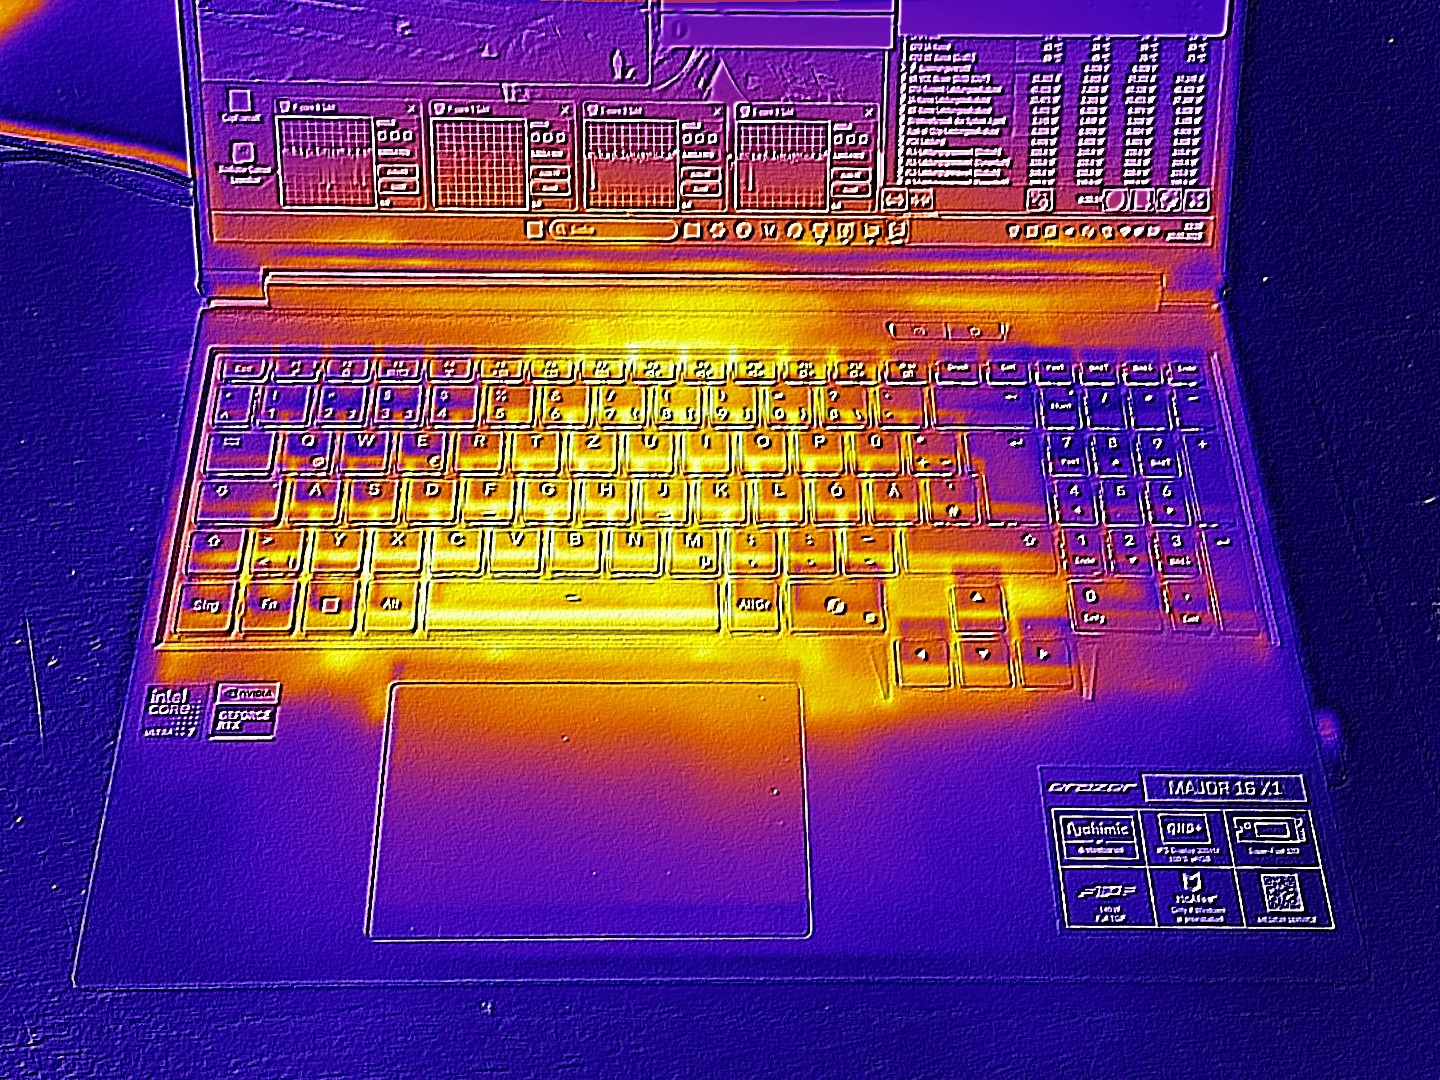
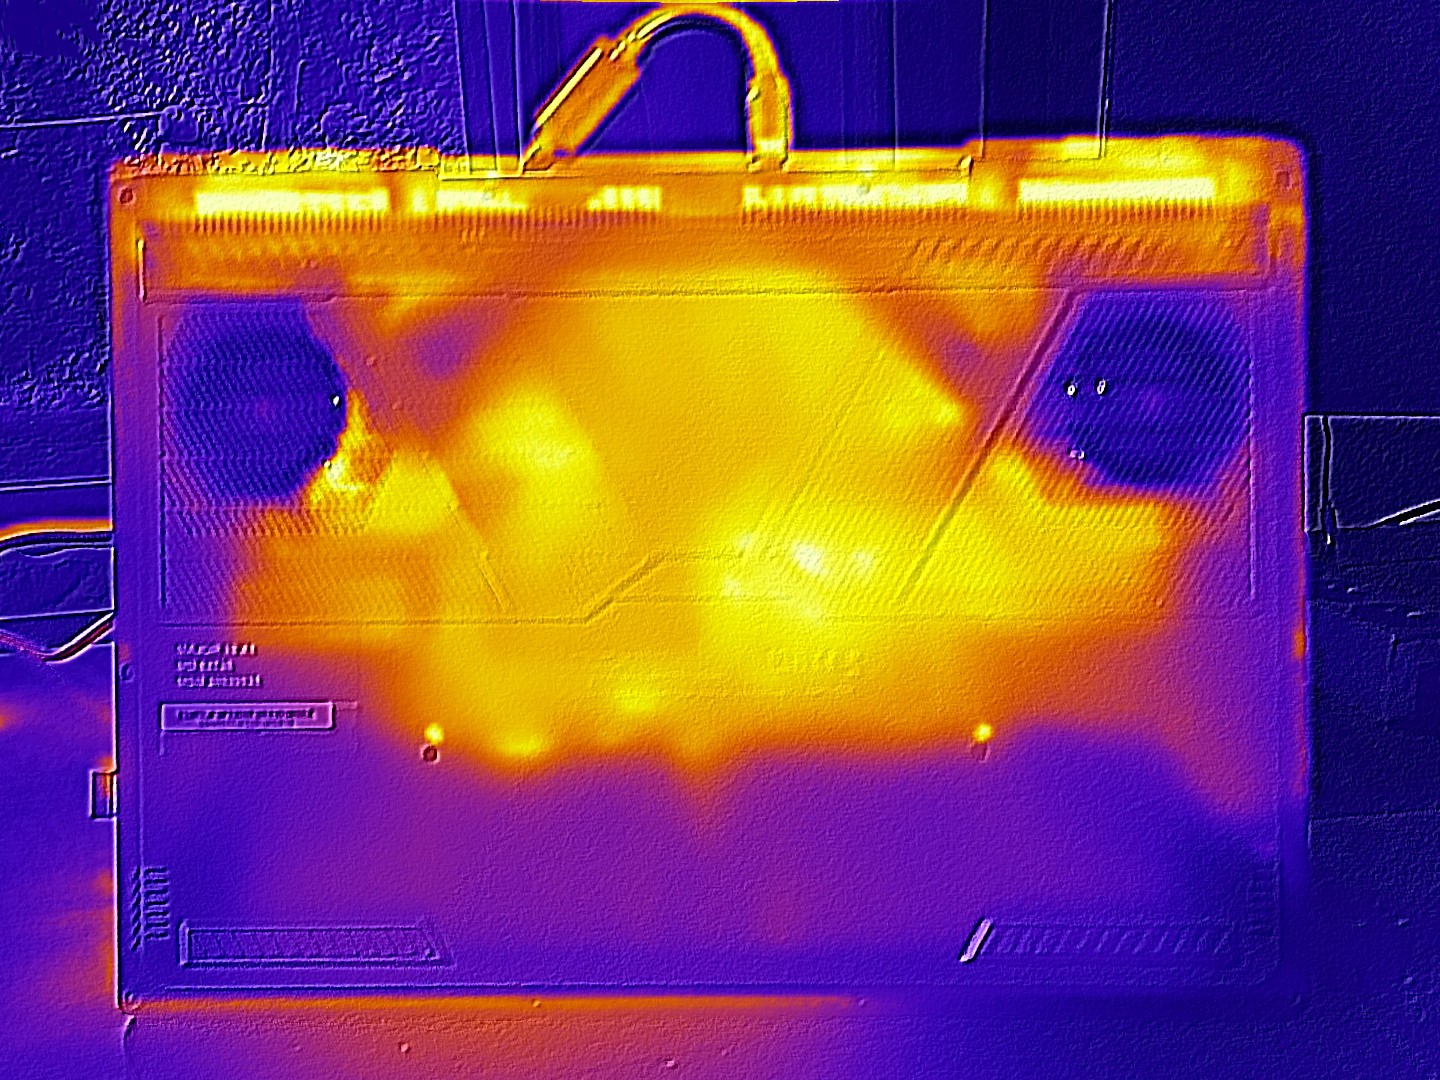
Les températures laissent une impression mitigée. En raison du bruit relativement modéré du ventilateur, les surfaces du châssis se réchauffent déjà sensiblement au ralenti, atteignant environ 34 °C. En charge, les températures grimpent jusqu'à 50 °C dans la moitié arrière du châssis, ce qui est élevé mais reste typique pour un ordinateur portable de jeu. Cela dit, nous aurions préféré une zone d'appui de la paume de la main plus froide.
(-) La température maximale du côté supérieur est de 49 °C / 120 F, par rapport à la moyenne de 40.5 °C / 105 F, allant de 21.2 à 68.8 °C pour la classe Gaming.
(-) Le fond chauffe jusqu'à un maximum de 50 °C / 122 F, contre une moyenne de 43.3 °C / 110 F
(±) En utilisation inactive, la température moyenne du côté supérieur est de 33.6 °C / 92 F, par rapport à la moyenne du dispositif de 33.9 °C / 93 F.
(-) 3: The average temperature for the upper side is 46.3 °C / 115 F, compared to the average of 33.9 °C / 93 F for the class Gaming.
(-) Les repose-poignets et le pavé tactile peuvent devenir très chauds au toucher, avec un maximum de 46 °C / 114.8# F.
(-) La température moyenne de la zone de l'appui-paume de dispositifs similaires était de 28.9 °C / 84 F (-17.1 °C / #-30.8 F).
| Medion Erazer Major 16 X1 MD62736 Ultra 7 255HX, GeForce RTX 5070 Ti Laptop | Medion Erazer Major X20 i9-13900HX, NVIDIA GeForce RTX 4070 Laptop GPU | MSI Katana 17 HX B14WGK i7-14650HX, GeForce RTX 5070 Laptop | MSI Vector 16 HX AI A2XWHG Ultra 7 255HX, GeForce RTX 5070 Ti Laptop | Medion Erazer Beast 18 X1 MD62731 Ultra 9 275HX, GeForce RTX 5080 Laptop | |
|---|---|---|---|---|---|
| Heat | 1% | 1% | 5% | 10% | |
| Maximum Upper Side * | 49 | 46 6% | 52 -6% | 53 -8% | 47 4% |
| Maximum Bottom * | 50 | 49 2% | 56 -12% | 52 -4% | 48 4% |
| Idle Upper Side * | 36 | 37 -3% | 33 8% | 33 8% | 29 19% |
| Idle Bottom * | 37 | 38 -3% | 32 14% | 29 22% | 33 11% |
* ... Moindre est la valeur, meilleures sont les performances
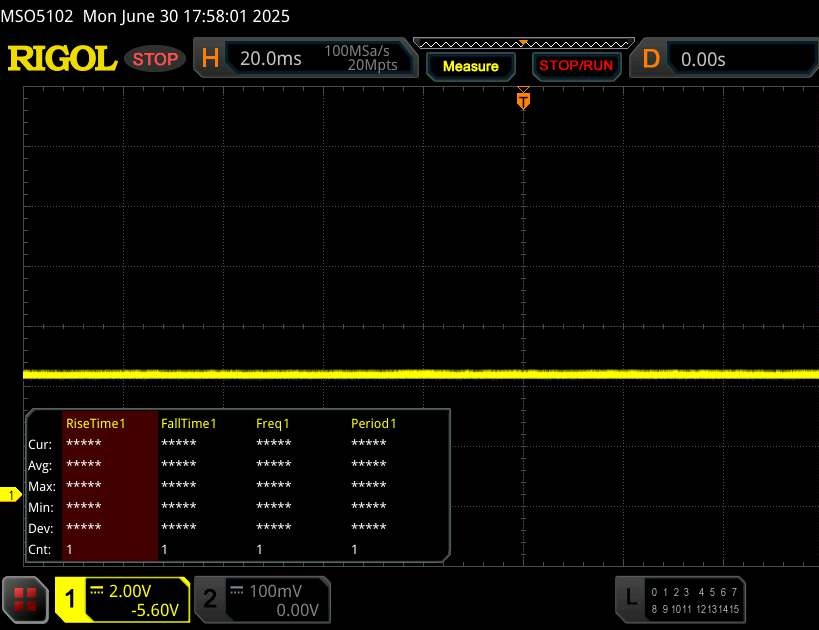
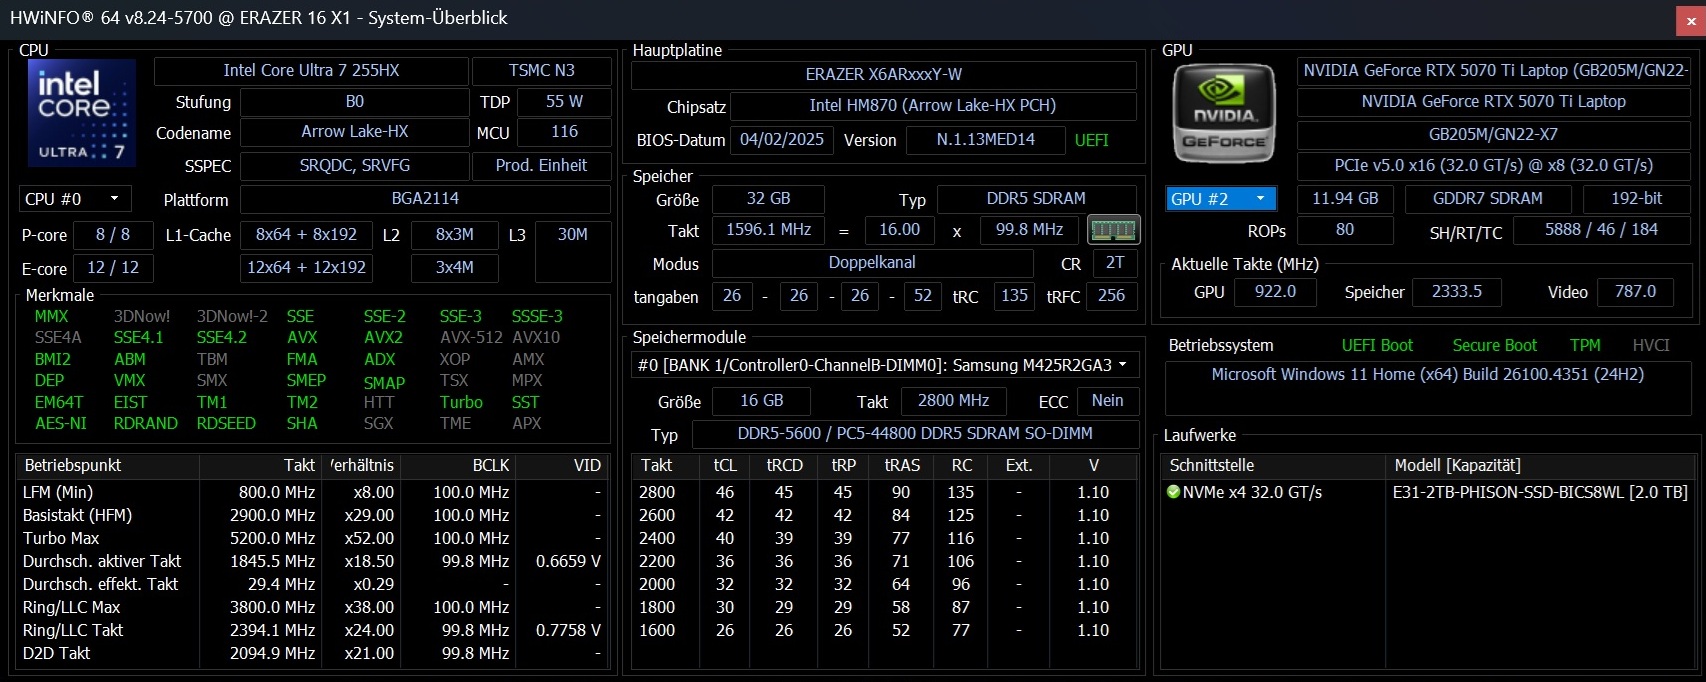
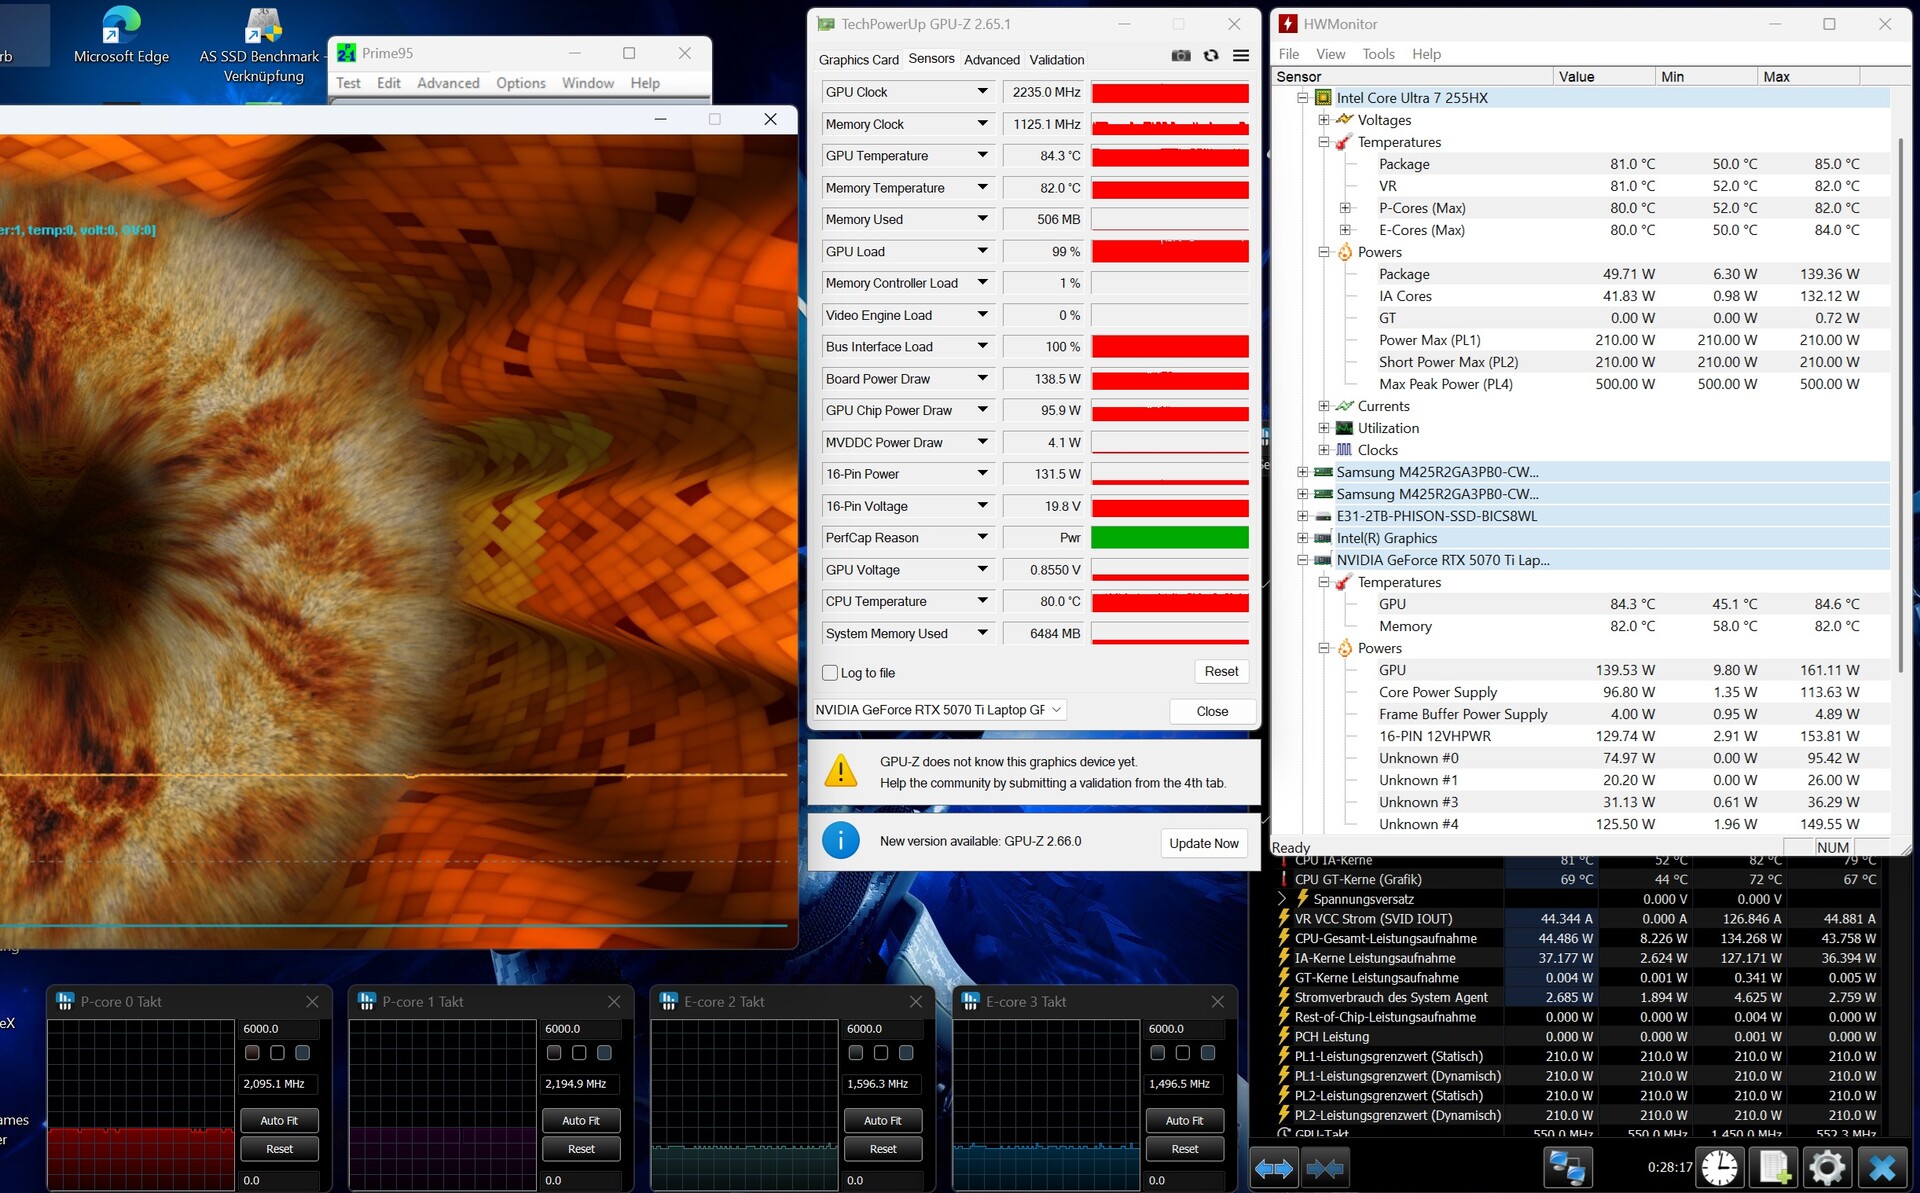
Épreuve d'effort
Dans notre test de stress utilisant Furmark et Prime95, le Core Ultra 7 255HX a atteint environ 81 °C après un certain temps, tandis que la RTX 5070 Ti s'est stabilisée à environ 84 °C. Les températures dans Cyberpunk 2077 étaient similaires (voir la capture d'écran pour référence).
Intervenants
Il est surprenant de constater que la qualité du son a reculé par rapport au modèle précédent. Alors que le Major X20 était très performant dans ce domaine, le Major 16 X1 se contente d'une place dans la moyenne inférieure. Les basses, en particulier, auraient pu être plus profondes et plus puissantes.
Medion Erazer Major 16 X1 MD62736 analyse audio
(+) | les haut-parleurs peuvent jouer relativement fort (82# dB)
Basses 100 - 315 Hz
(-) | presque aucune basse - en moyenne 19.4% plus bas que la médiane
(±) | la linéarité des basses est moyenne (13.5% delta à la fréquence précédente)
Médiums 400 - 2000 Hz
(±) | médiane supérieure - en moyenne 8.4% supérieure à la médiane
(±) | la linéarité des médiums est moyenne (9.1% delta à la fréquence précédente)
Aiguës 2 - 16 kHz
(+) | des sommets équilibrés - à seulement 4.2% de la médiane
(+) | les aigus sont linéaires (6.4% delta à la fréquence précédente)
Globalement 100 - 16 000 Hz
(±) | la linéarité du son global est moyenne (20.8% de différence avec la médiane)
Par rapport à la même classe
» 74% de tous les appareils testés de cette catégorie étaient meilleurs, 4% similaires, 22% pires
» Le meilleur avait un delta de 6%, la moyenne était de 18%, le pire était de 132%.
Par rapport à tous les appareils testés
» 54% de tous les appareils testés étaient meilleurs, 8% similaires, 38% pires
» Le meilleur avait un delta de 4%, la moyenne était de 24%, le pire était de 134%.
Medion Erazer Major X20 analyse audio
(+) | les haut-parleurs peuvent jouer relativement fort (86# dB)
Basses 100 - 315 Hz
(±) | basse réduite - en moyenne 11.9% inférieure à la médiane
(±) | la linéarité des basses est moyenne (9.7% delta à la fréquence précédente)
Médiums 400 - 2000 Hz
(+) | médiane équilibrée - seulement 3.7% de la médiane
(+) | les médiums sont linéaires (4.7% delta à la fréquence précédente)
Aiguës 2 - 16 kHz
(+) | des sommets équilibrés - à seulement 2.3% de la médiane
(+) | les aigus sont linéaires (3.4% delta à la fréquence précédente)
Globalement 100 - 16 000 Hz
(+) | le son global est linéaire (10.4% différence à la médiane)
Par rapport à la même classe
» 6% de tous les appareils testés de cette catégorie étaient meilleurs, 2% similaires, 92% pires
» Le meilleur avait un delta de 6%, la moyenne était de 18%, le pire était de 132%.
Par rapport à tous les appareils testés
» 4% de tous les appareils testés étaient meilleurs, 1% similaires, 94% pires
» Le meilleur avait un delta de 4%, la moyenne était de 24%, le pire était de 134%.
Gestion de l'énergie
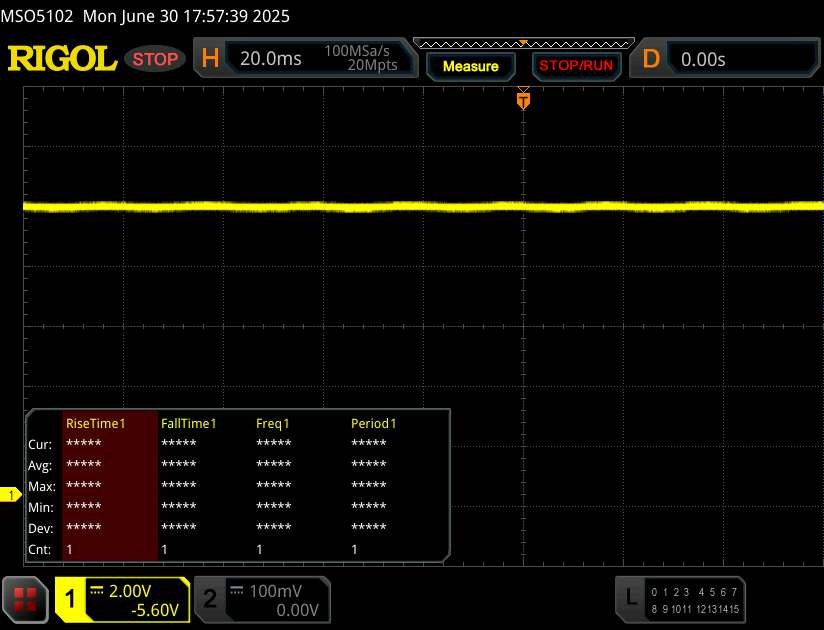
Consommation électrique
La consommation d'énergie est en grande partie insignifiante. Le système consomme entre 18 et 23 watts en veille et entre 110 et 297 watts en charge. Ces valeurs sont typiques d'un appareil de cette classe de performance.
| Éteint/en veille | |
| Au repos | |
| Fortement sollicité |
|
Légende:
min: | |
| Medion Erazer Major 16 X1 MD62736 Ultra 7 255HX, GeForce RTX 5070 Ti Laptop | Medion Erazer Major X20 i9-13900HX, NVIDIA GeForce RTX 4070 Laptop GPU | MSI Katana 17 HX B14WGK i7-14650HX, GeForce RTX 5070 Laptop | MSI Vector 16 HX AI A2XWHG Ultra 7 255HX, GeForce RTX 5070 Ti Laptop | Medion Erazer Beast 18 X1 MD62731 Ultra 9 275HX, GeForce RTX 5080 Laptop | Moyenne de la classe Gaming | |
|---|---|---|---|---|---|---|
| Power Consumption | 7% | 15% | 6% | 12% | 4% | |
| Idle Minimum * | 17.8 | 12 33% | 9.7 46% | 7.1 60% | 7.9 56% | 14.3 ? 20% |
| Idle Average * | 20.7 | 16 23% | 15 28% | 15.9 23% | 11.5 44% | 20.4 ? 1% |
| Idle Maximum * | 23.4 | 26 -11% | 23.7 -1% | 29.5 -26% | 16.6 29% | 27.4 ? -17% |
| Load Average * | 110 | 115 -5% | 126 -15% | 124 -13% | 130 -18% | 107.6 ? 2% |
| Cyberpunk 2077 ultra * | 233 | 205 12% | 222 5% | 253 -9% | ||
| Cyberpunk 2077 ultra external monitor * | 232 | 202 13% | 217 6% | 245 -6% | ||
| Load Maximum * | 297 | 319 -7% | 227 24% | 336 -13% | 330 -11% | 259 ? 13% |
| Witcher 3 ultra * | 191.6 |
* ... Moindre est la valeur, meilleures sont les performances
Power consumption Cyberpunk and stress test
Power consumption with external monitor
Durée de vie de la batterie
Avec une batterie de 80 Wh, ce portable de 16 pouces se situe confortablement entre le Katana 17 (75 Wh) et le Vector 16 (90 Wh). Lors de notre test Wi-Fi, avec une luminosité d'écran réduite à 150 cd/m², le Major 16 X1 a atteint une solide autonomie d'un peu moins de 6,5 heures.
| Medion Erazer Major 16 X1 MD62736 Ultra 7 255HX, GeForce RTX 5070 Ti Laptop, 80 Wh | Medion Erazer Major X20 i9-13900HX, NVIDIA GeForce RTX 4070 Laptop GPU, 62.3 Wh | MSI Katana 17 HX B14WGK i7-14650HX, GeForce RTX 5070 Laptop, 75 Wh | MSI Vector 16 HX AI A2XWHG Ultra 7 255HX, GeForce RTX 5070 Ti Laptop, 90 Wh | Medion Erazer Beast 18 X1 MD62731 Ultra 9 275HX, GeForce RTX 5080 Laptop, 99 Wh | Moyenne de la classe Gaming | |
|---|---|---|---|---|---|---|
| Autonomie de la batterie | -39% | -20% | 10% | 25% | 2% | |
| WiFi v1.3 | 380 | 232 -39% | 305 -20% | 419 10% | 476 25% | 386 ? 2% |
| Reader / Idle | 345 | 572 ? | ||||
| H.264 | 252 | 459 ? | ||||
| Load | 96 | 85.8 ? |
Notebookcheck note globale
Le Medion Erazer Major 16 X1 MD62736 est, dans l'ensemble, un ordinateur portable de jeu de 16 pouces bien conçu et assez puissant.
Medion Erazer Major 16 X1 MD62736
- 07/02/2025 v8
Florian Glaser
 Total Sustainability Score:
 Comparable alternatives
Image | Modèle | Prix | Poids | Épaisseur | Écran |
|---|---|---|---|---|---|
1. 85.2%  | Medion Erazer Major 16 X1 MD62736 Intel Core Ultra 7 255HX ⎘ Nvidia GeForce RTX 5070 Ti Laptop ⎘ 32 Go Mémoire, SSD | Prix de liste: 2600 EUR | 2.5 kg | 2.27 mm | 16.00" 2560x1600 189 PPI IPS |
2. 89% v7 (old)  | Medion Erazer Major X20 Intel Core i9-13900HX ⎘ NVIDIA GeForce RTX 4070 Laptop GPU ⎘ 32 Go Mémoire, 1024 Go SSD | Amazon: 1. $12.99 Vaxson 2-Pack Protector Film... 2. $16.99 [2 Pack] Synvy Film Protecto... 3. $12.98 Puccy 2 Pack Touch Pad Film ... Prix de liste: 2499 Euro | 2.4 kg | 29 mm | 16.00" 2560x1600 189 PPI IPS |
3. 77.3%  | MSI Katana 17 HX B14WGK Intel Core i7-14650HX ⎘ Nvidia GeForce RTX 5070 Laptop ⎘ 16 Go Mémoire, 1024 Go SSD | Amazon: 1. $49.99 230W 200W AC Adapter Replace... Prix de liste: 1800 EUR | 2.7 kg | 28 mm | 17.30" 2560x1440 170 PPI IPS |
4. 84%  | MSI Vector 16 HX AI A2XWHG Intel Core Ultra 7 255HX ⎘ Nvidia GeForce RTX 5070 Ti Laptop ⎘ 16 Go Mémoire, 512 Go SSD | Amazon: 1. $2,524.00 HIDevolution [2025] MSI Vect... 2. $1,899.00 EXCaliberPC (2025 MSI Releas... 3. $2,728.13 MSI Vector 16 HX AI A2XWHG-2... Prix de liste: 2000 EUR | 2.6 kg | 28.6 mm | 16.00" 2560x1600 189 PPI IPS |
5. 82.5%  | Medion Erazer Beast 18 X1 MD62731 Intel Core Ultra 9 275HX ⎘ Nvidia GeForce RTX 5080 Laptop ⎘ 32 Go Mémoire, SSD | Prix de liste: 3700 EUR | 3.6 kg | 30.4 mm | 18.00" 2560x1600 168 PPI IPS |
Transparency
La sélection des appareils à examiner est effectuée par notre équipe éditoriale. L'échantillon de test a été prêté à l'auteur par le fabricant ou le détaillant pour les besoins de cet examen. Le prêteur n'a pas eu d'influence sur cette évaluation et le fabricant n'a pas reçu de copie de cette évaluation avant sa publication. Il n'y avait aucune obligation de publier cet article. Nous n'acceptons jamais de compensation ou de paiement en échange de nos commentaires. En tant que média indépendant, Notebookcheck n'est pas soumis à l'autorité des fabricants, des détaillants ou des éditeurs.
Voici comment Notebookcheck teste
Chaque année, Notebookcheck examine de manière indépendante des centaines d'ordinateurs portables et de smartphones en utilisant des procédures standardisées afin de garantir que tous les résultats sont comparables. Nous avons continuellement développé nos méthodes de test depuis environ 20 ans et avons établi des normes industrielles dans le processus. Dans nos laboratoires de test, des équipements de mesure de haute qualité sont utilisés par des techniciens et des rédacteurs expérimentés. Ces tests impliquent un processus de validation en plusieurs étapes. Notre système d'évaluation complexe repose sur des centaines de mesures et de points de référence bien fondés, ce qui garantit l'objectivité.