|
AMD Ryzen 9 9950X
Ryzen 9 9950X, 4300 MHz | |
Intel Core i9-14900K
i9-14900K, 3200 MHz | |
Intel Core i9-13900K
i9-13900K, 3000 MHz | |
Intel Core Ultra 9 285K
Ultra 9 285K, 3200 MHz | |
AMD Ryzen 9 7950X
R9 7950X, 4500 MHz | |
AMD Ryzen 9 7950X3D
R9 7950X3D, 4200 MHz | |
AMD Ryzen 9 7900X
R9 7900X, 4700 MHz | |
AMD Ryzen 7 9800X3D
R7 9800X3D, 4700 MHz | |
Intel Core i5-14600K
i5-14600K, 3500 MHz | |
AMD Ryzen 7 9700X
Ryzen 7 9700X, 3800 MHz | |
Intel Core i9-12900K
i9-12900K, 3200 MHz | |
Intel Core Ultra 5 245K
Ultra 5 245K, 3600 MHz | |
AMD Ryzen 9 5950X
R9 5950X, 3400 MHz | |
Intel Core i5-13600K
i5-13600K, 3500 MHz | |
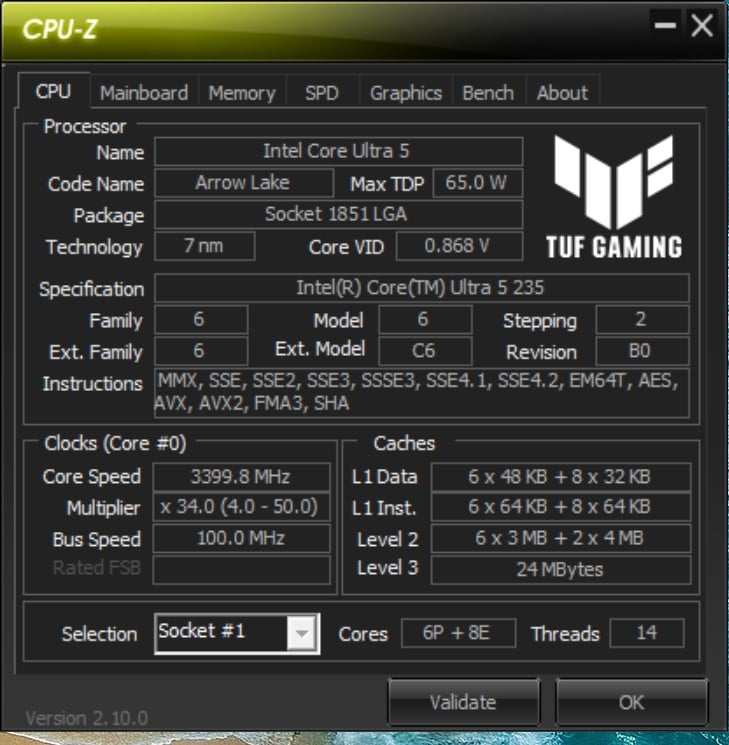
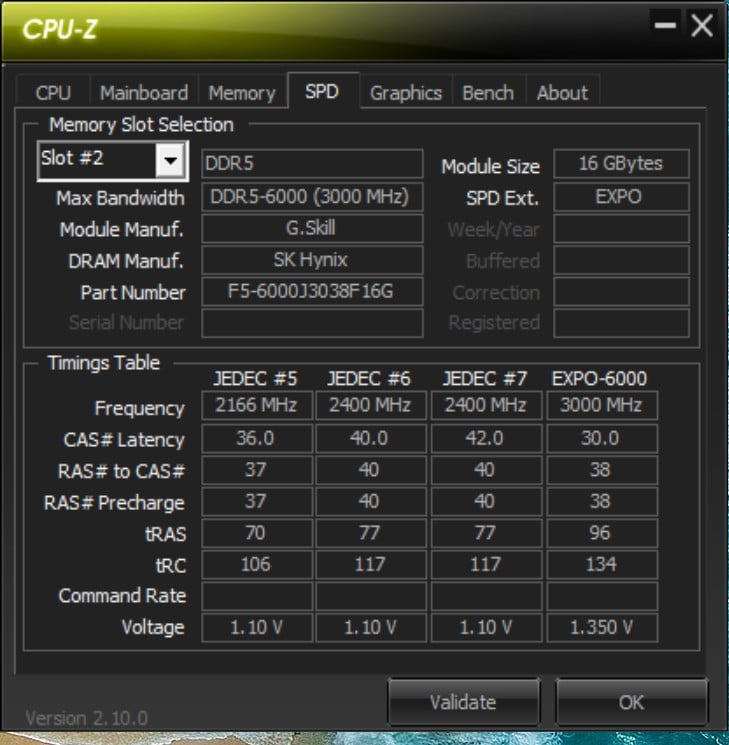
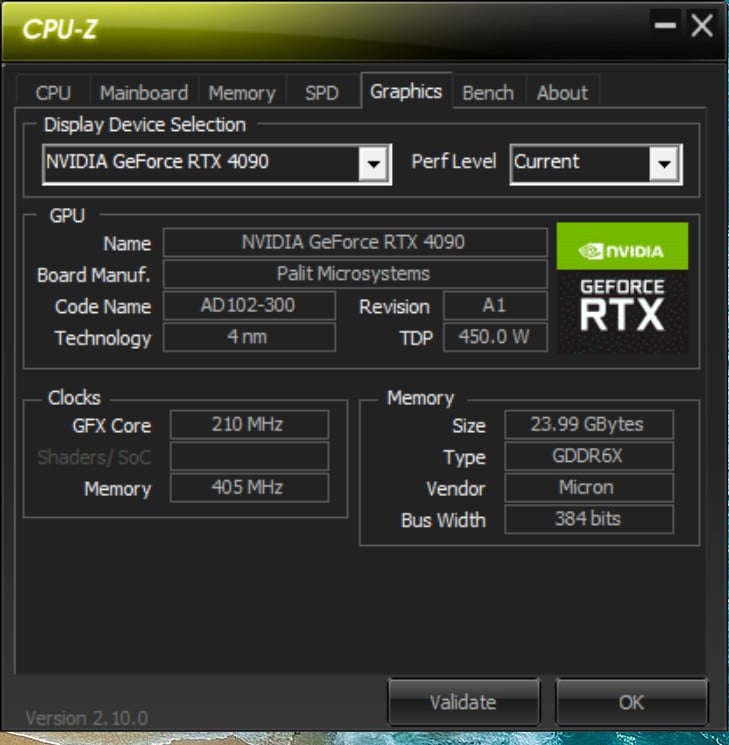
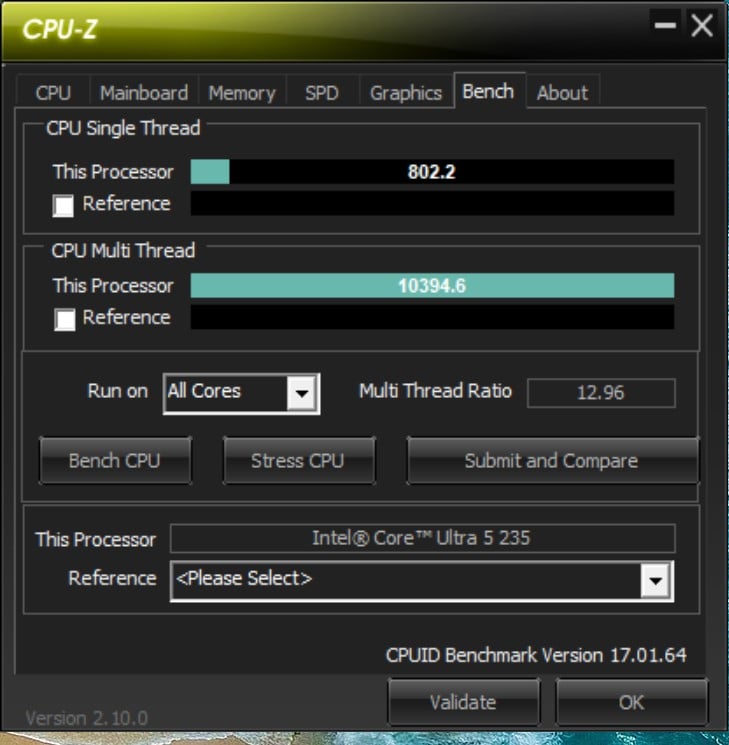
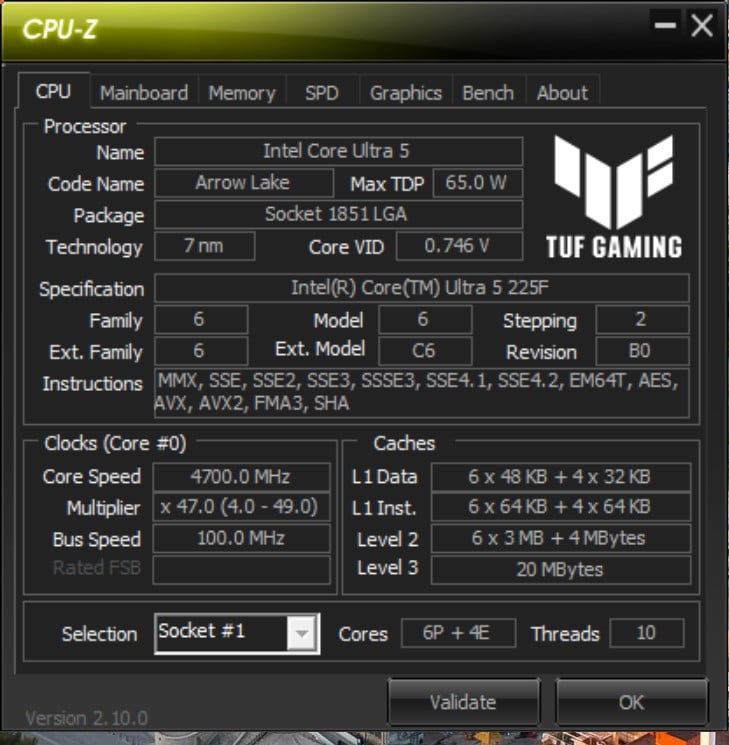
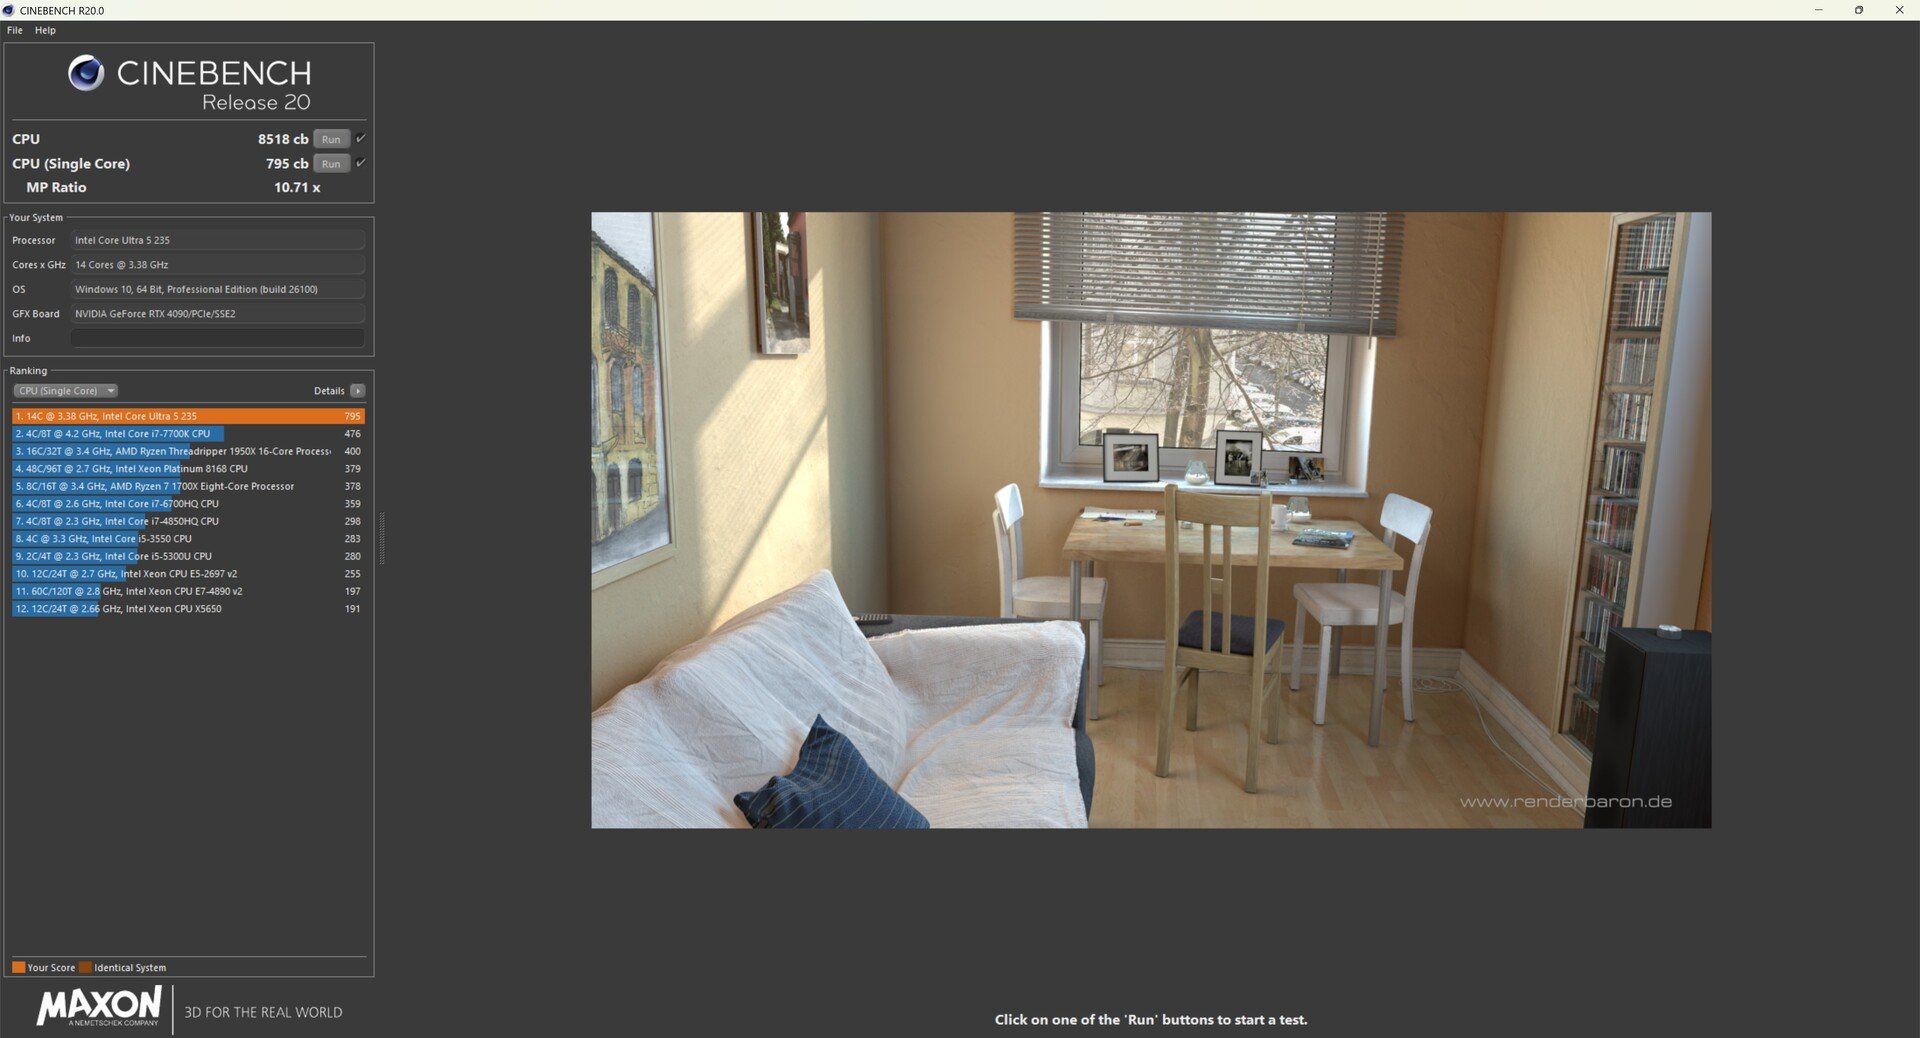
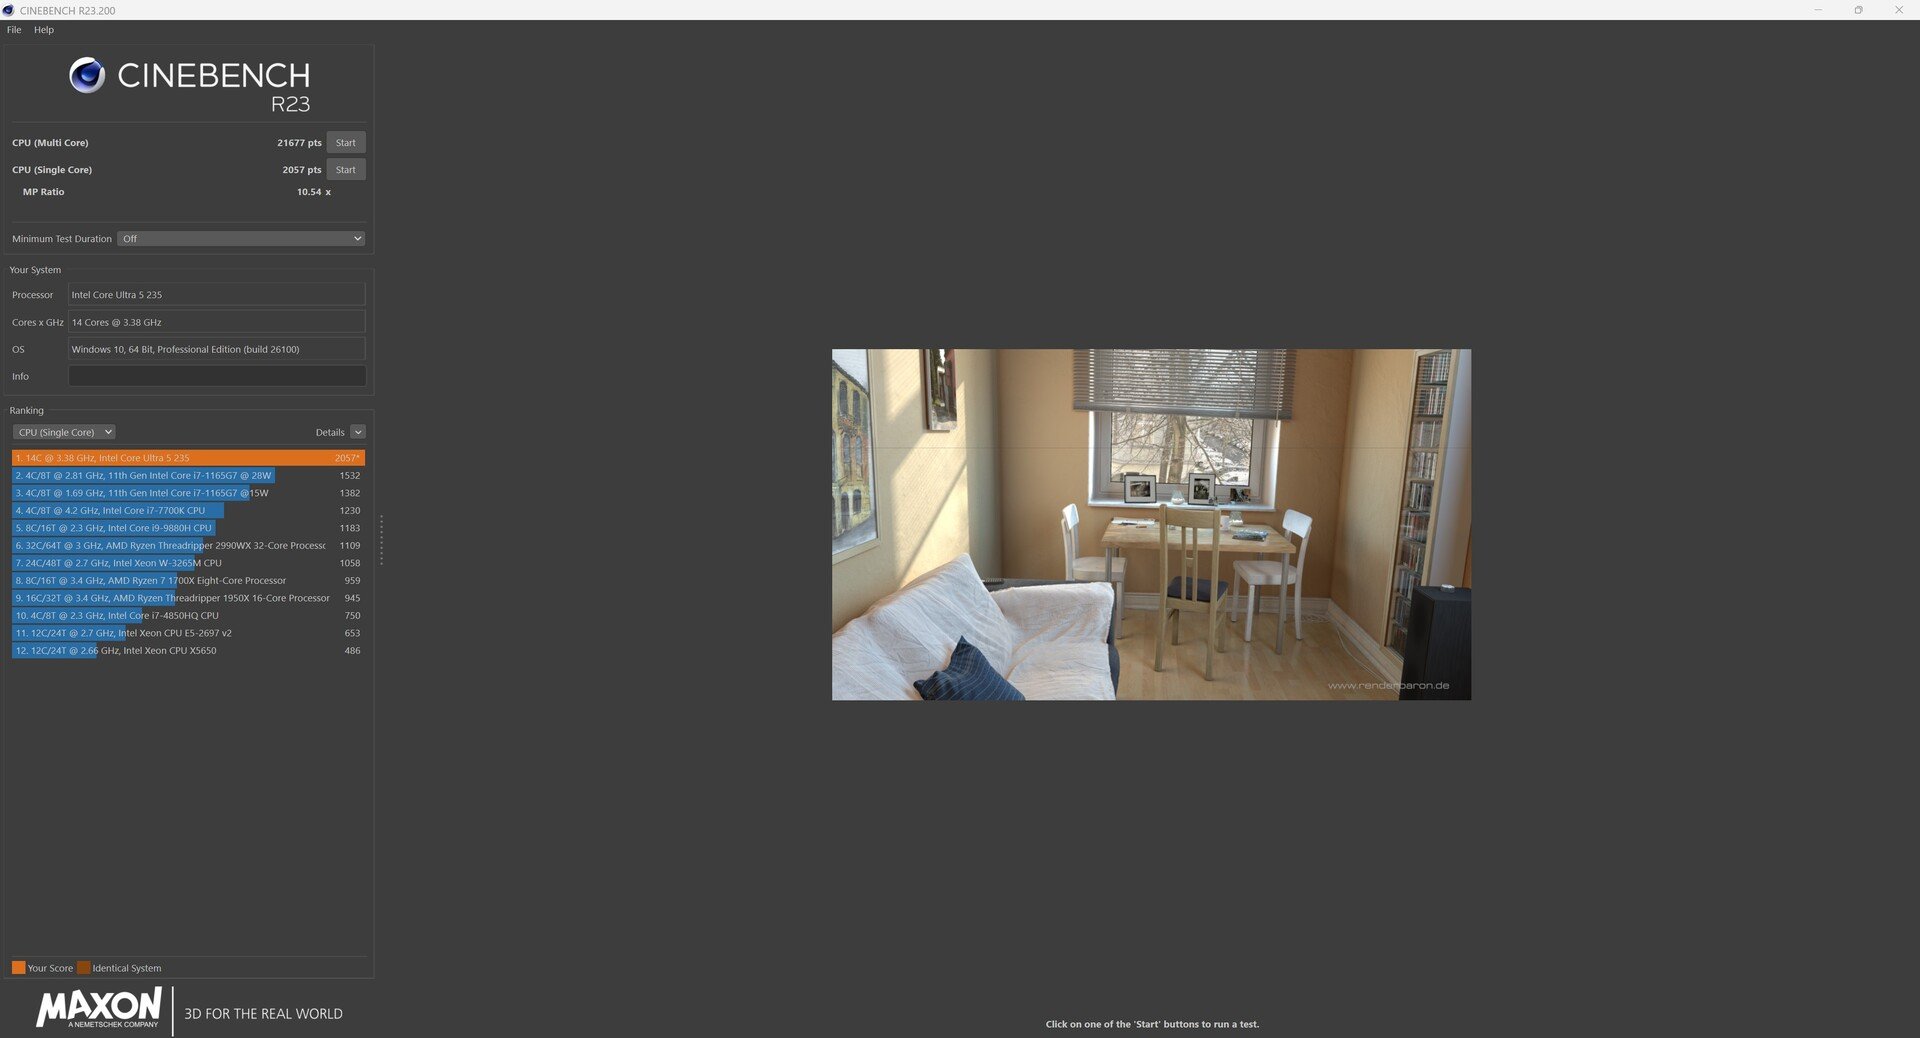
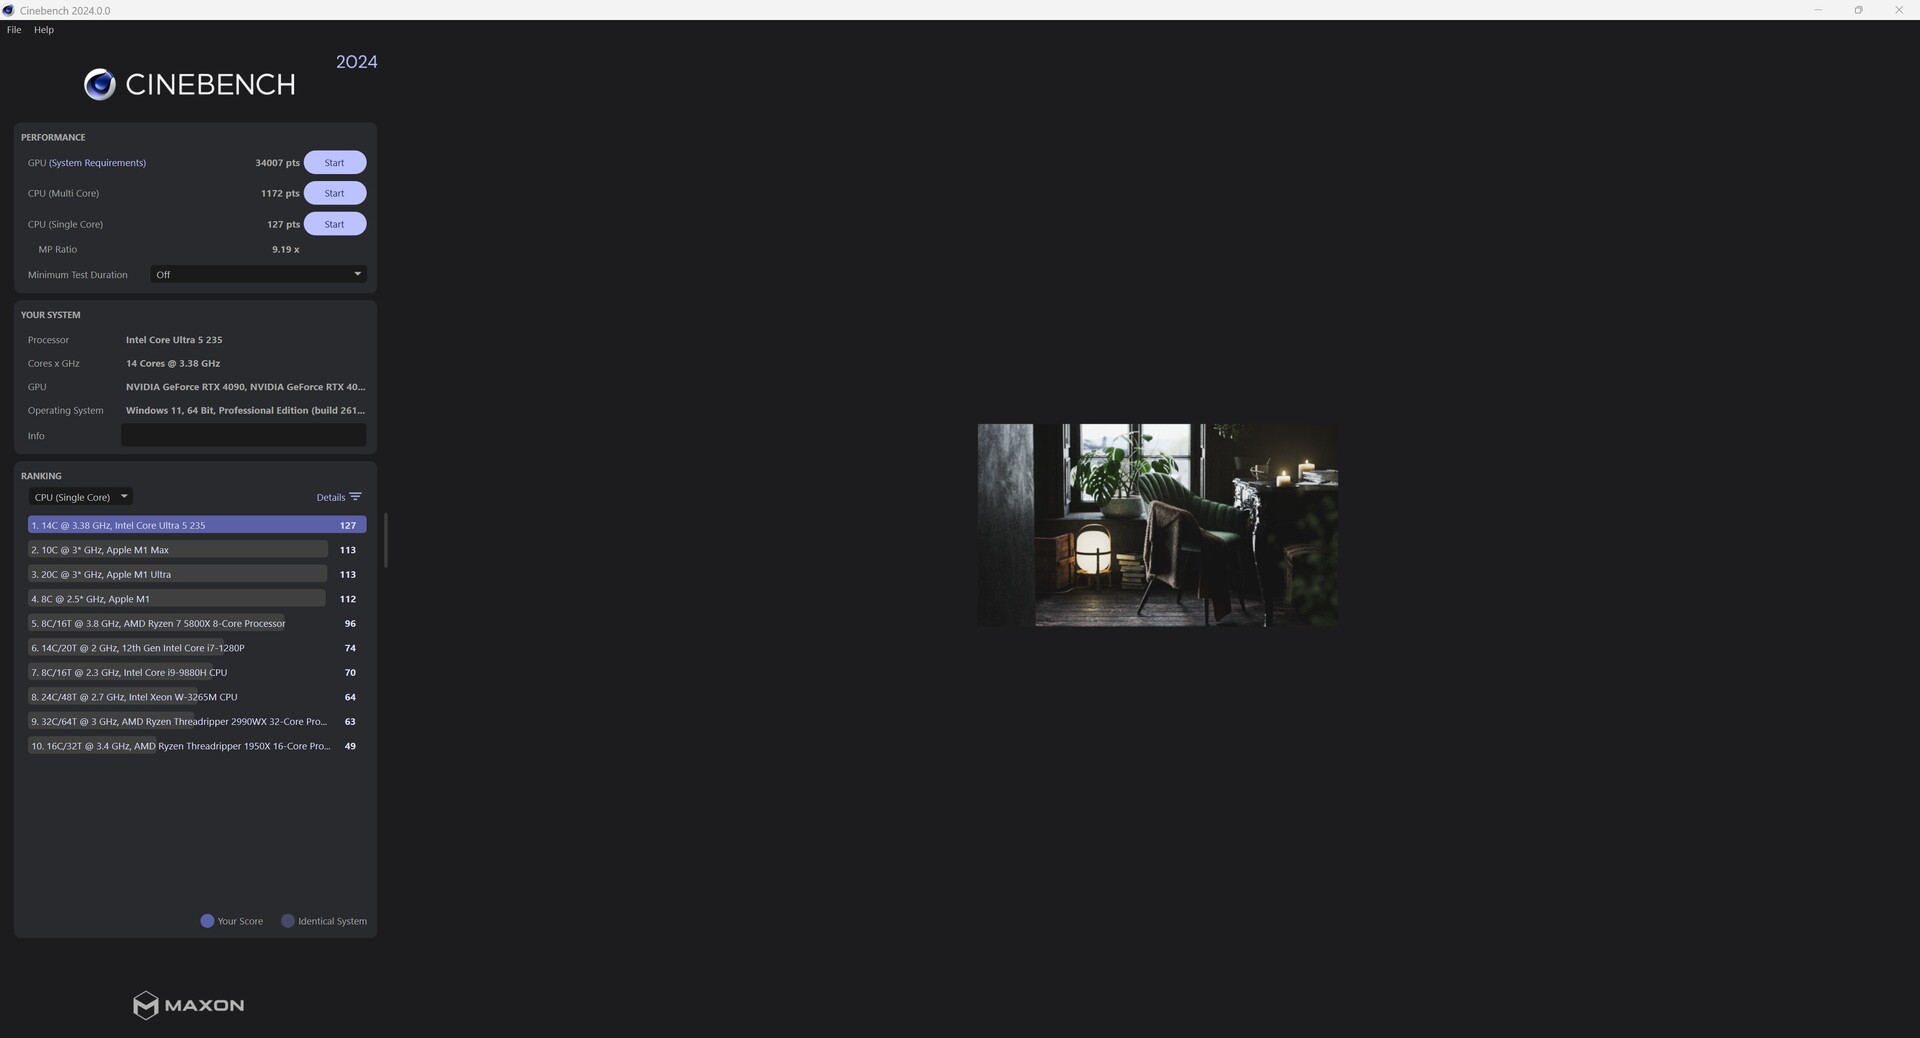
Intel Core Ultra 5 235
Ultra 5 235, 3400 MHz | |
AMD Ryzen 5 9600X
Ryzen 5 9600X, 3900 MHz | |
AMD Ryzen 7 7800X3D
R7 7800X3D, 4200 MHz | |
AMD Ryzen 7 7745HX
R7 7745HX, 3600 MHz | |
AMD Ryzen 5 7600X
R5 7600X, 4700 MHz | |
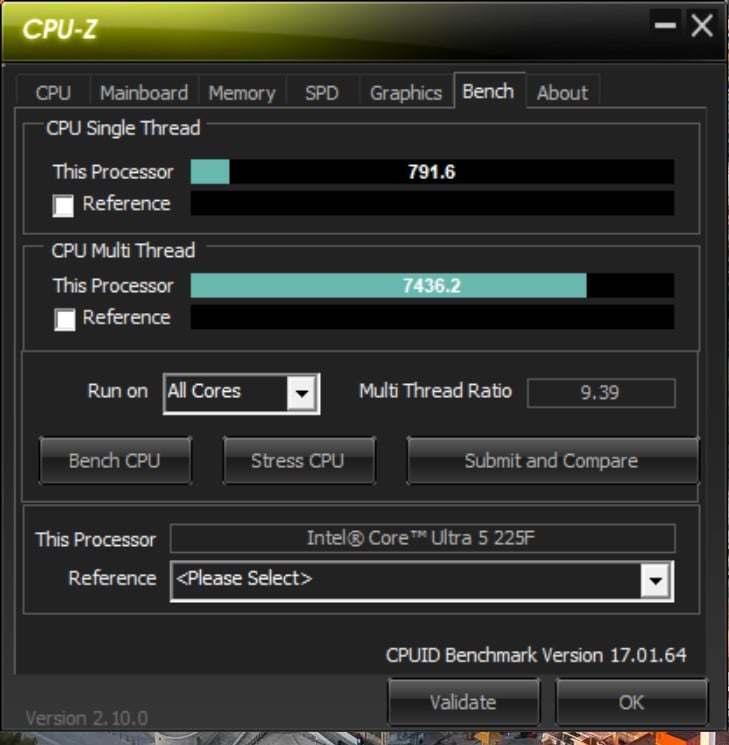
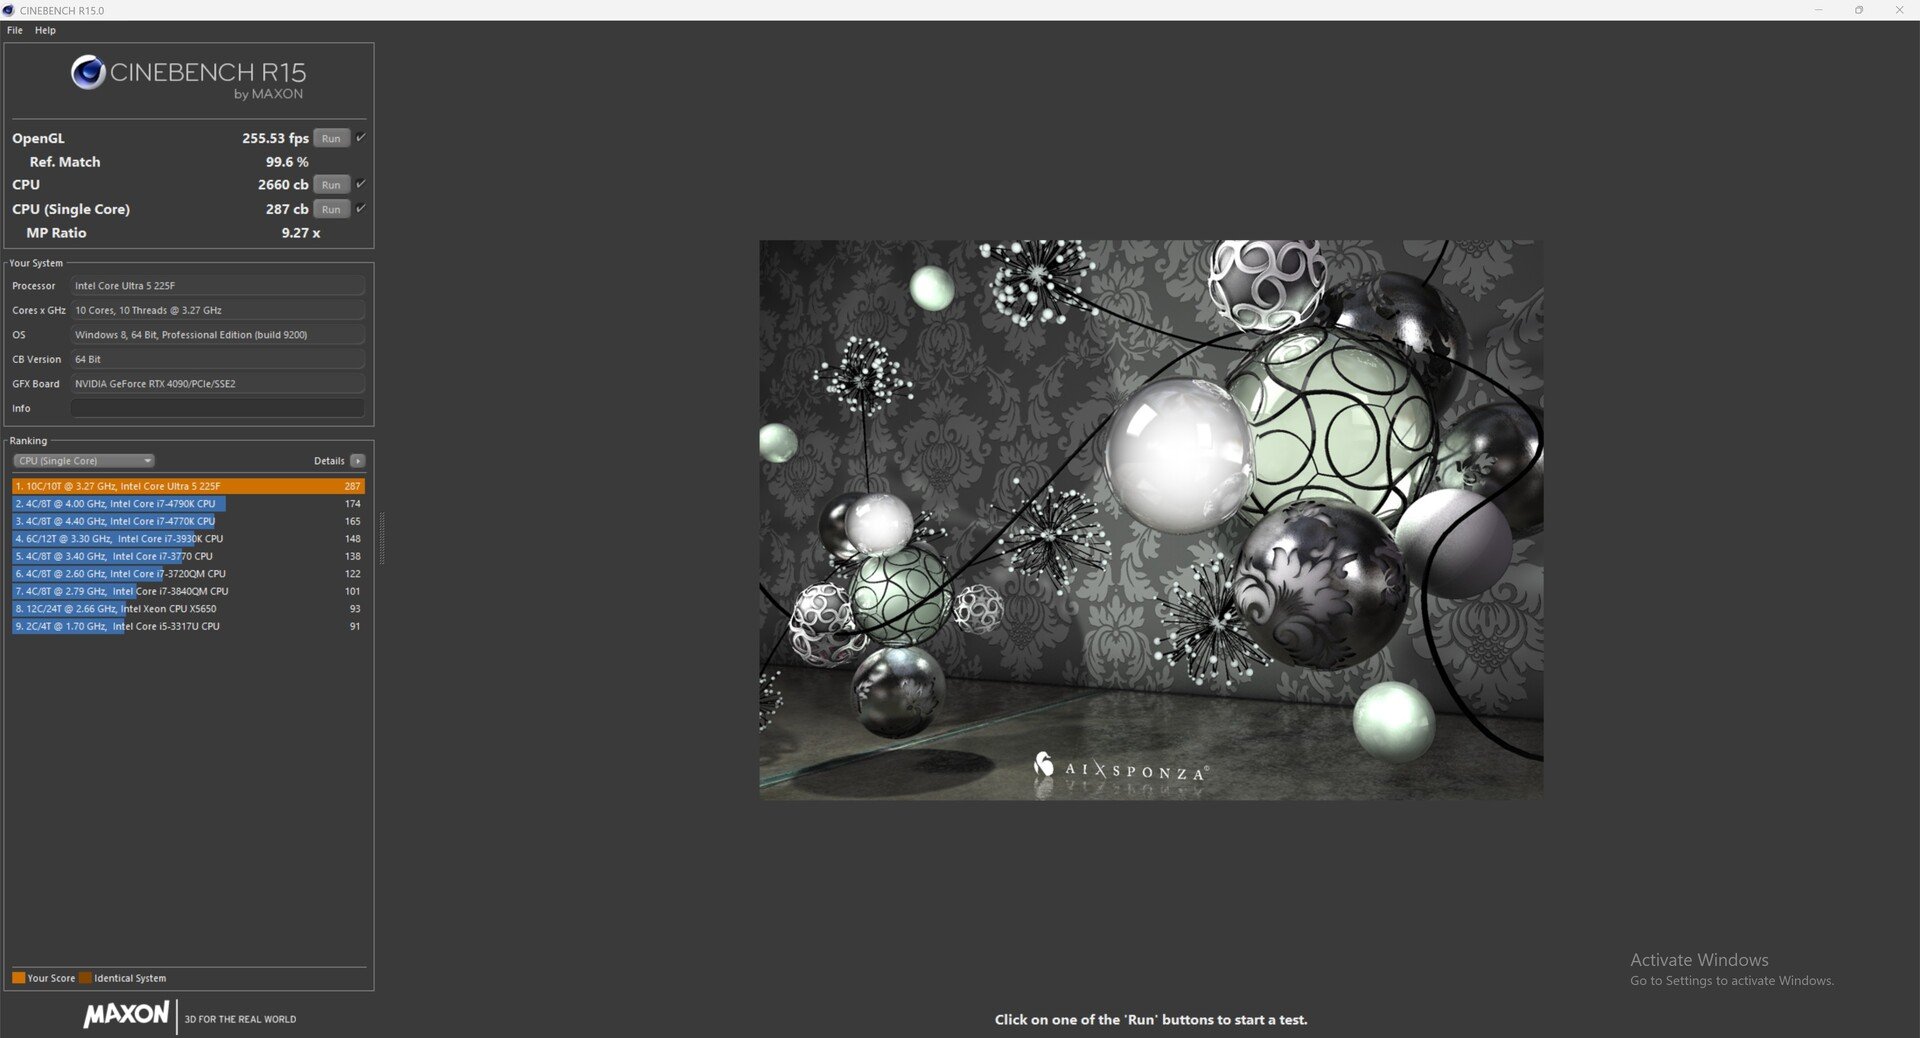
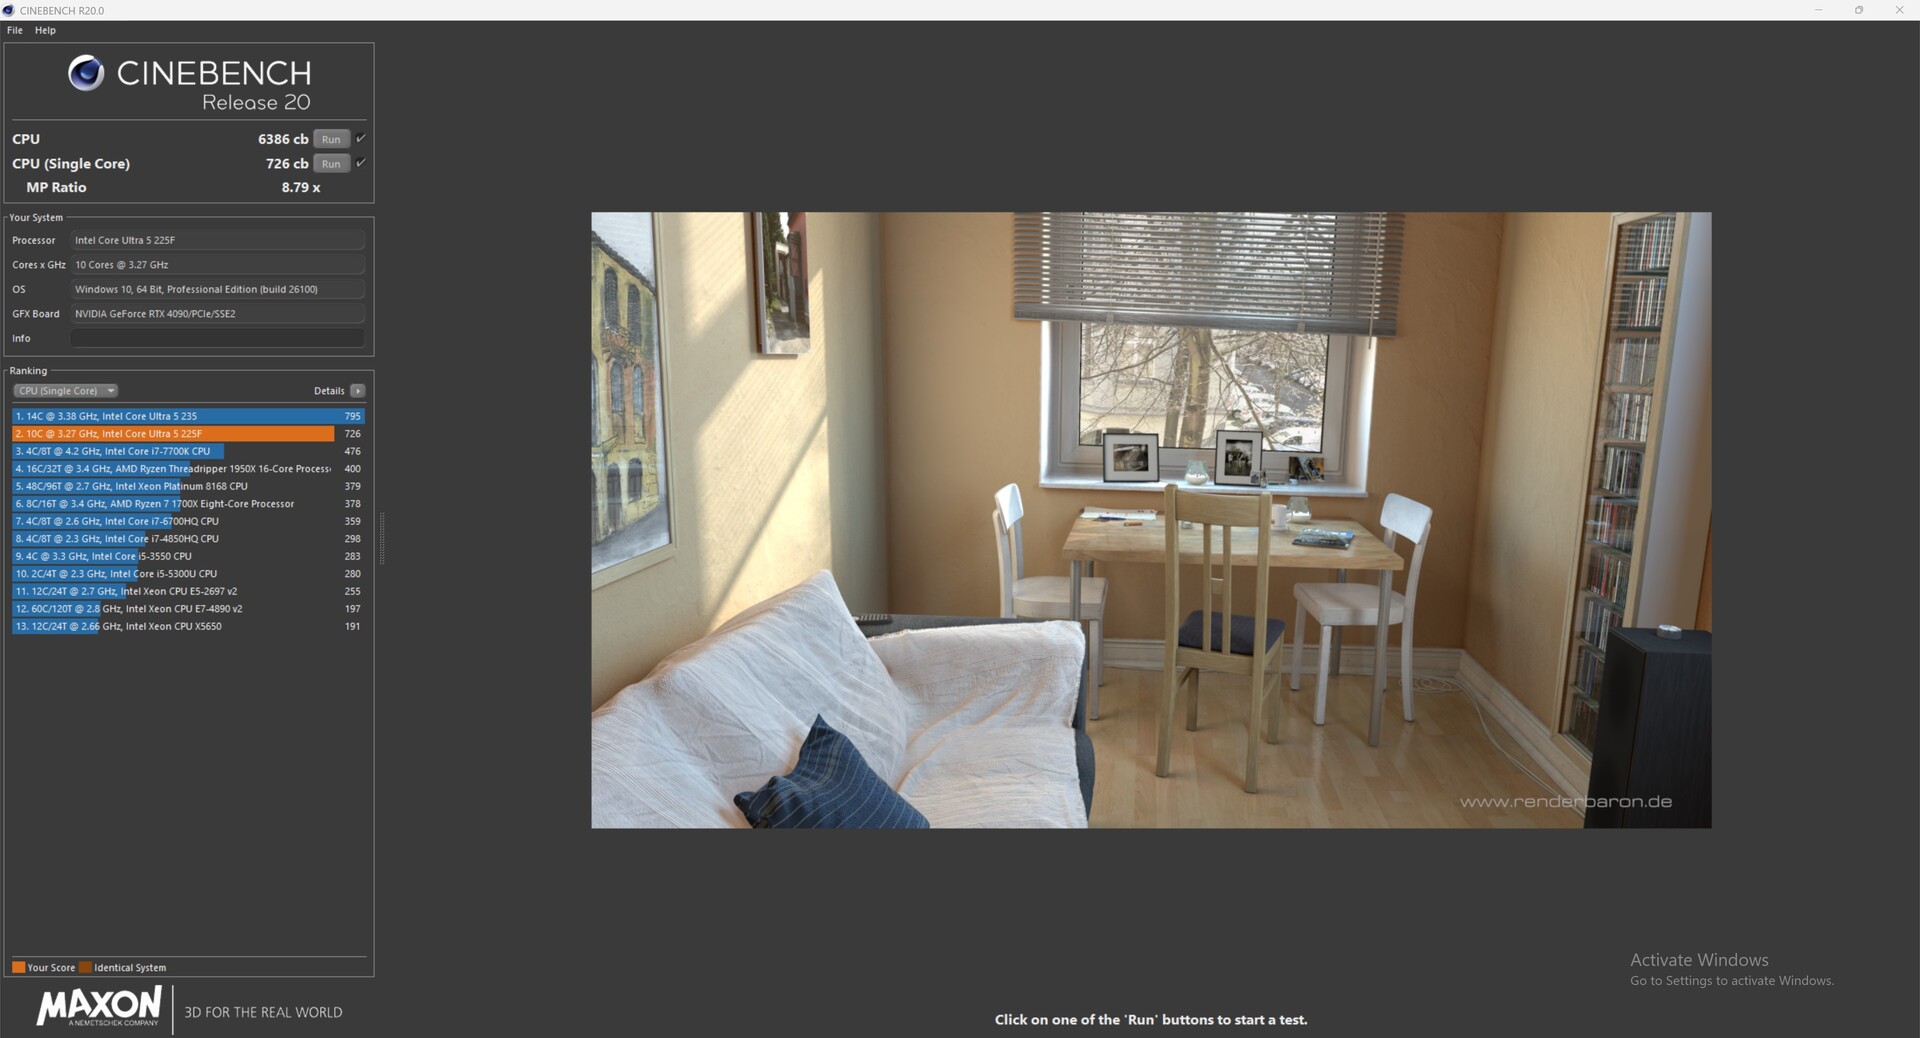
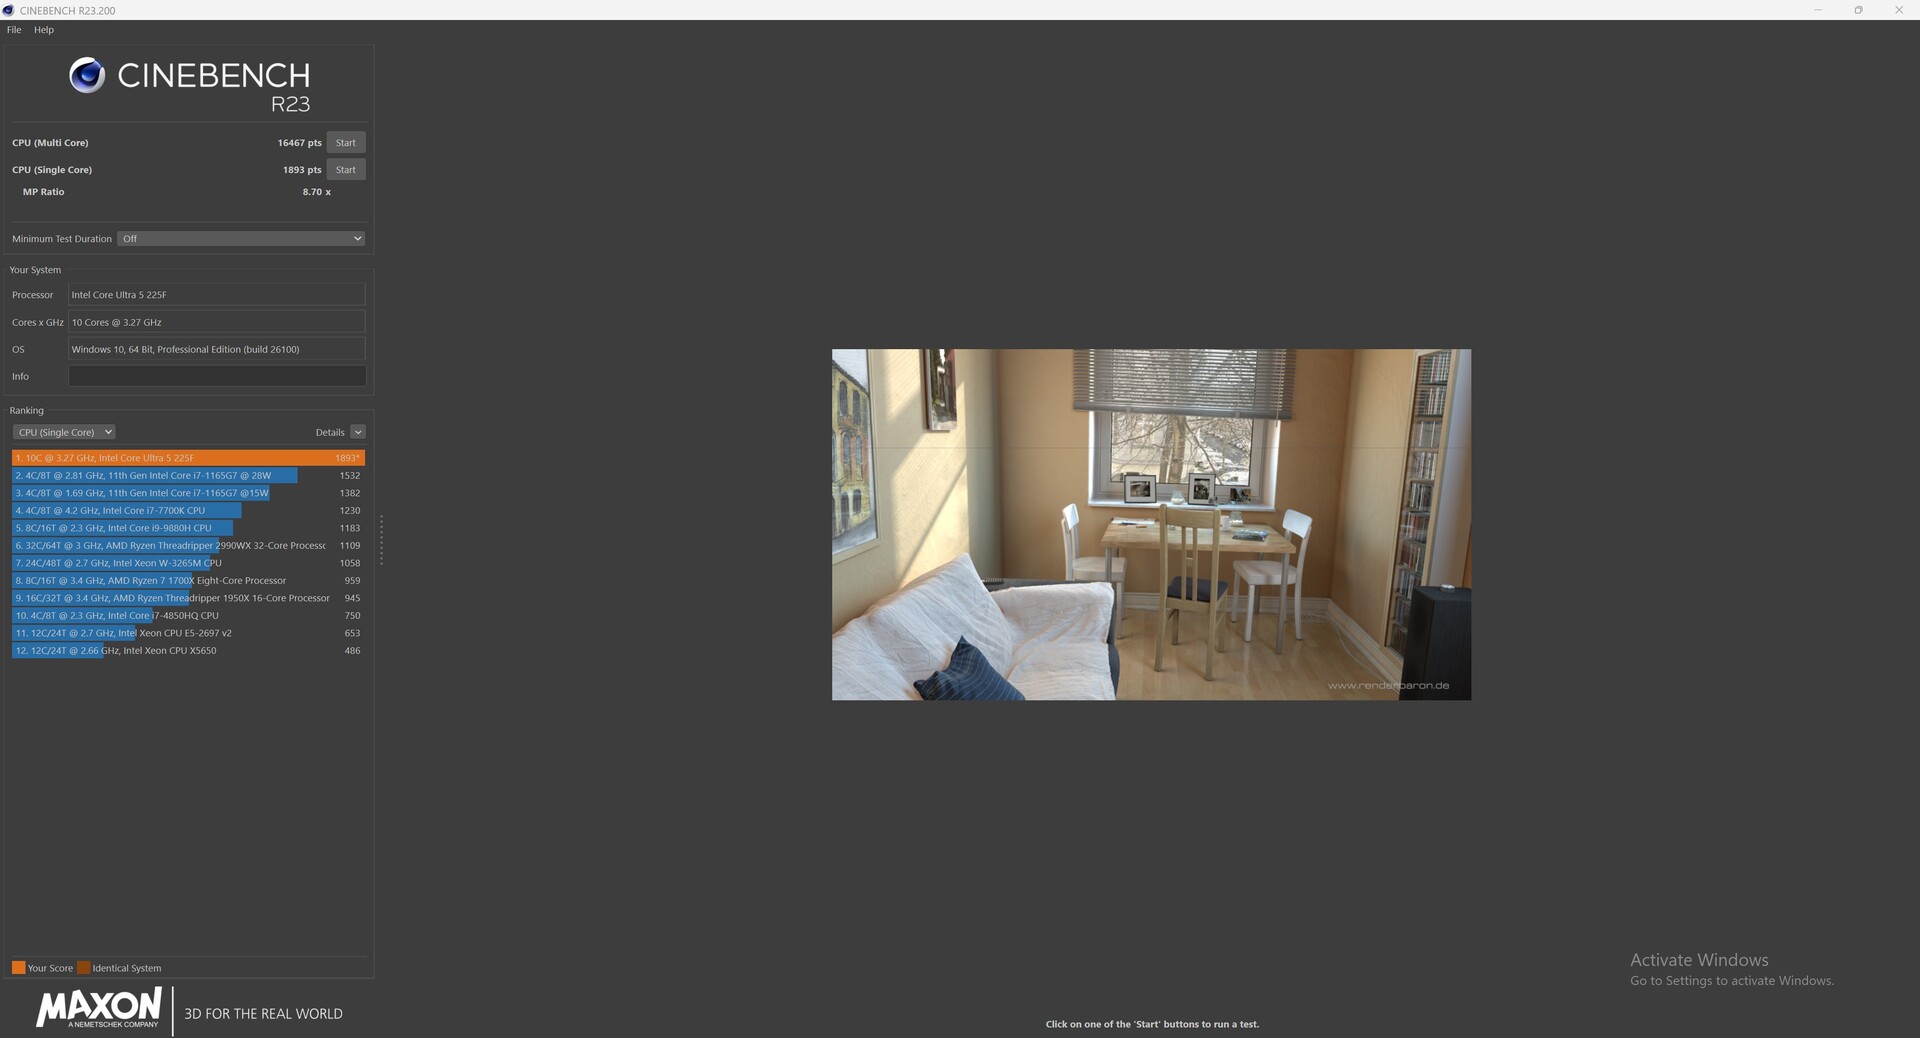
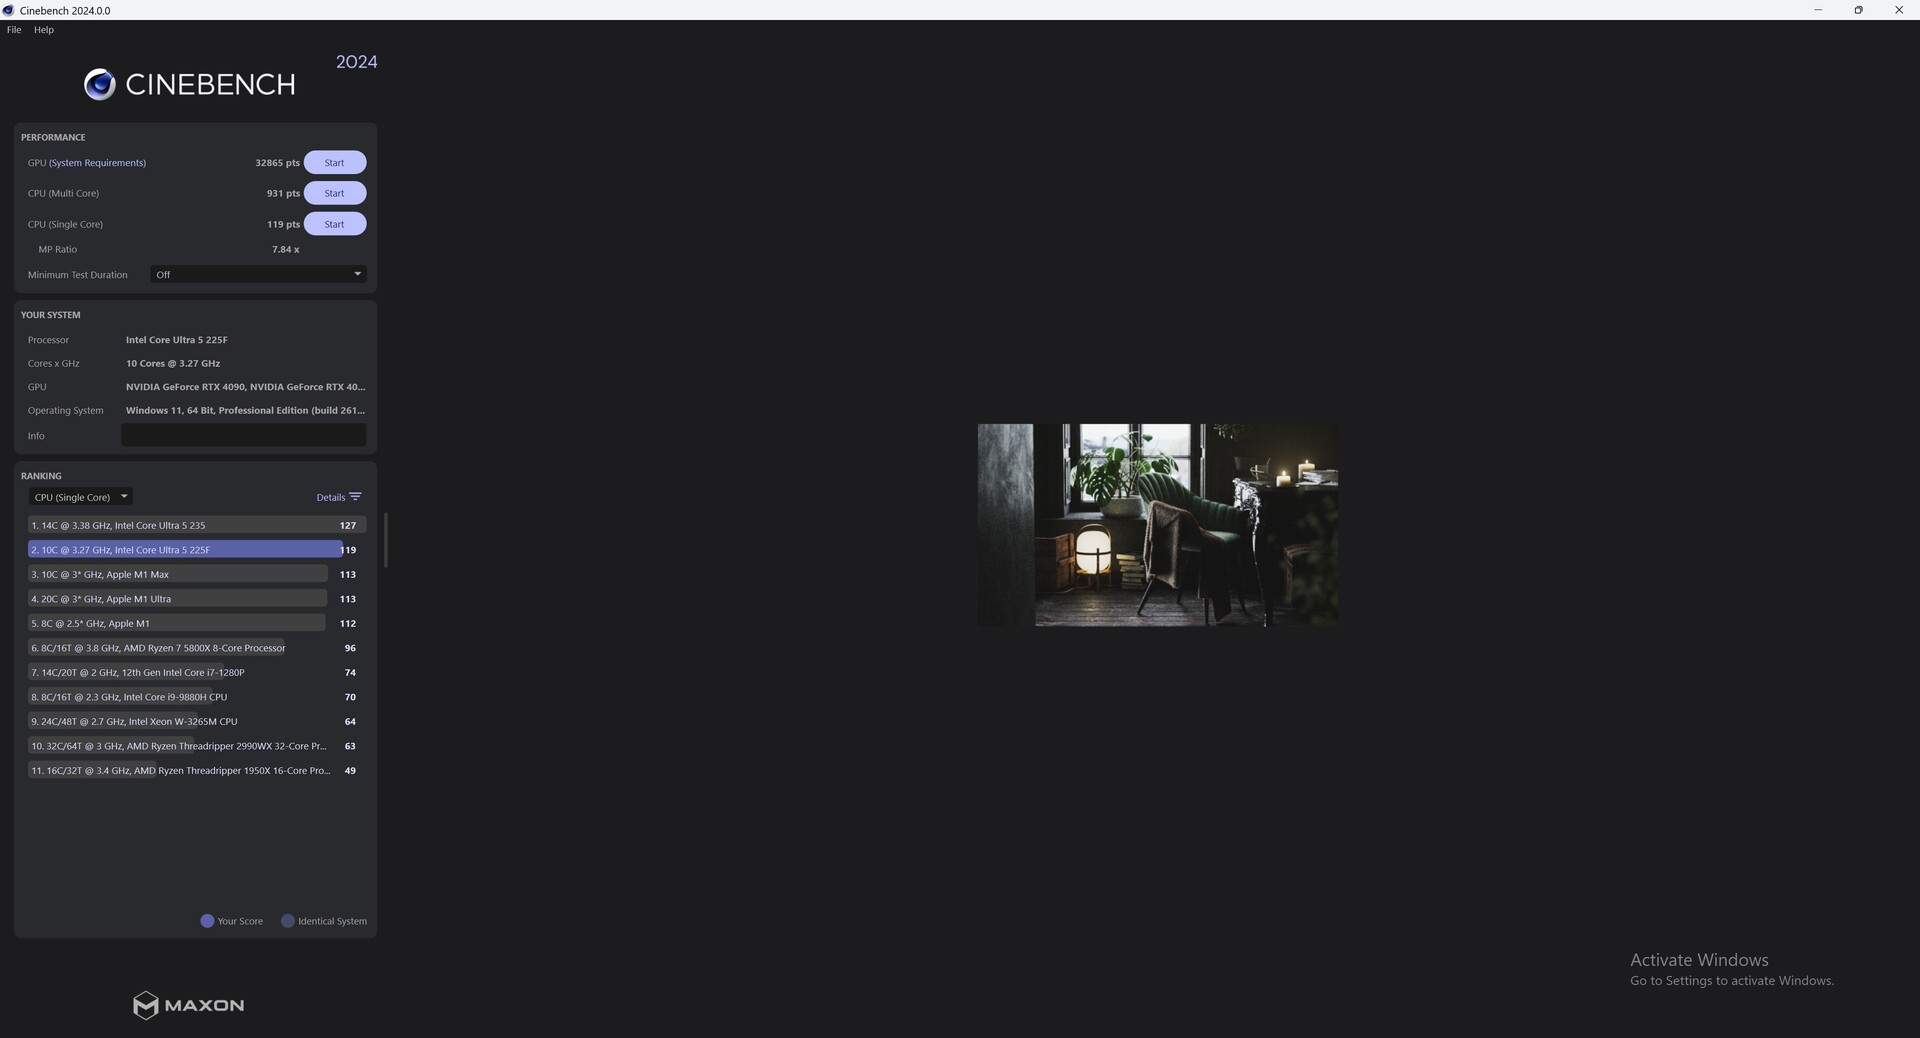
Intel Core Ultra 5 225F
Ultra 5 225F, 3300 MHz | |
Intel Core i5-12600K
i5-12600K, 2800 MHz | |
Intel Core i5-13400
i5-13400, 2500 MHz | |
Intel Core i5-12400F
i5-12400F, 2500 MHz | |
|
|
Intel Core i9-14900K
i9-14900K, 3200 MHz | |
Intel Core Ultra 9 285K
Ultra 9 285K, 3200 MHz | |
Intel Core i9-13900K
i9-13900K, 3000 MHz | |
AMD Ryzen 7 9700X
Ryzen 7 9700X, 3800 MHz | |
AMD Ryzen 9 9950X
Ryzen 9 9950X, 4300 MHz | |
AMD Ryzen 5 9600X
Ryzen 5 9600X, 3900 MHz | |
Intel Core Ultra 5 245K
Ultra 5 245K, 3600 MHz | |
AMD Ryzen 7 9800X3D
R7 9800X3D, 4700 MHz | |
Intel Core i5-14600K
i5-14600K, 3500 MHz | |
Intel Core Ultra 5 235
Ultra 5 235, 3400 MHz | |
AMD Ryzen 9 7950X3D
R9 7950X3D, 4200 MHz | |
AMD Ryzen 9 7950X
R9 7950X, 4500 MHz | |
AMD Ryzen 9 7900X
R9 7900X, 4700 MHz | |
Intel Core i5-13600K
i5-13600K, 3500 MHz | |
Intel Core i9-12900K
i9-12900K, 3200 MHz | |
AMD Ryzen 5 7600X
R5 7600X, 4700 MHz | |
Intel Core i5-12600K
i5-12600K, 2800 MHz | |
Intel Core Ultra 5 225F
Ultra 5 225F, 3300 MHz | |
AMD Ryzen 7 7745HX
R7 7745HX, 3600 MHz | |
AMD Ryzen 7 7800X3D
R7 7800X3D, 4200 MHz | |
Intel Core i5-13400
i5-13400, 2500 MHz | |
Intel Core i5-12400F
i5-12400F, 2500 MHz | |
AMD Ryzen 9 5950X
R9 5950X, 3400 MHz | |
|
Intel Core Ultra 9 285K
Ultra 9 285K, 3200 MHz | |
Intel Core i9-14900K
i9-14900K, 3200 MHz | |
AMD Ryzen 9 9950X
Ryzen 9 9950X, 4300 MHz | |
Intel Core i9-13900K
i9-13900K, 3000 MHz | |
AMD Ryzen 9 7950X
R9 7950X, 4500 MHz | |
AMD Ryzen 9 7950X3D
R9 7950X3D, 4200 MHz | |
AMD Ryzen 9 7900X
R9 7900X, 4700 MHz | |
AMD Ryzen 9 5950X
R9 5950X, 3400 MHz | |
Intel Core i9-12900K
i9-12900K, 3200 MHz | |
Intel Core Ultra 5 245K
Ultra 5 245K, 3600 MHz | |
Intel Core i5-14600K
i5-14600K, 3500 MHz | |
Intel Core i5-13600K
i5-13600K, 3500 MHz | |
AMD Ryzen 7 9800X3D
R7 9800X3D, 4700 MHz | |
Intel Core Ultra 5 235
Ultra 5 235, 3400 MHz | |
AMD Ryzen 7 9700X
Ryzen 7 9700X, 3800 MHz | |
AMD Ryzen 7 7745HX
R7 7745HX, 3600 MHz | |
AMD Ryzen 7 7800X3D
R7 7800X3D, 4200 MHz | |
Intel Core i5-12600K
i5-12600K, 2800 MHz | |
AMD Ryzen 5 9600X
Ryzen 5 9600X, 3900 MHz | |
Intel Core Ultra 5 225F
Ultra 5 225F, 3300 MHz | |
Intel Core i5-13400
i5-13400, 2500 MHz | |
AMD Ryzen 5 7600X
R5 7600X, 4700 MHz | |
Intel Core i5-12400F
i5-12400F, 2500 MHz | |
|
|
Intel Core i9-14900K
i9-14900K, 3200 MHz | |
Intel Core Ultra 9 285K
Ultra 9 285K, 3200 MHz | |
AMD Ryzen 9 9950X
Ryzen 9 9950X, 4300 MHz | |
AMD Ryzen 7 9700X
Ryzen 7 9700X, 3800 MHz | |
AMD Ryzen 5 9600X
Ryzen 5 9600X, 3900 MHz | |
Intel Core i9-13900K
i9-13900K, 3000 MHz | |
Intel Core Ultra 5 245K
Ultra 5 245K, 3600 MHz | |
AMD Ryzen 7 9800X3D
R7 9800X3D, 4700 MHz | |
AMD Ryzen 9 7950X
R9 7950X, 4500 MHz | |
AMD Ryzen 9 7950X3D
R9 7950X3D, 4200 MHz | |
Intel Core Ultra 5 235
Ultra 5 235, 3400 MHz | |
Intel Core i5-14600K
i5-14600K, 3500 MHz | |
AMD Ryzen 9 7900X
R9 7900X, 4700 MHz | |
Intel Core i5-13600K
i5-13600K, 3500 MHz | |
Intel Core i9-12900K
i9-12900K, 3200 MHz | |
AMD Ryzen 5 7600X
R5 7600X, 4700 MHz | |
Intel Core i5-12600K
i5-12600K, 2800 MHz | |
Intel Core Ultra 5 225F
Ultra 5 225F, 3300 MHz | |
AMD Ryzen 7 7745HX
R7 7745HX, 3600 MHz | |
AMD Ryzen 7 7800X3D
R7 7800X3D, 4200 MHz | |
Intel Core i5-13400
i5-13400, 2500 MHz | |
Intel Core i5-12400F
i5-12400F, 2500 MHz | |
AMD Ryzen 9 5950X
R9 5950X, 3400 MHz | |
|
Intel Core Ultra 9 285K
Ultra 9 285K, 3200 MHz | |
AMD Ryzen 9 9950X
Ryzen 9 9950X, 4300 MHz | |
Intel Core i9-14900K
i9-14900K, 3200 MHz | |
Intel Core i9-13900K
i9-13900K, 3000 MHz | |
AMD Ryzen 9 7950X
R9 7950X, 4500 MHz | |
AMD Ryzen 9 7950X3D
R9 7950X3D, 4200 MHz | |
AMD Ryzen 9 7900X
R9 7900X, 4700 MHz | |
AMD Ryzen 9 5950X
R9 5950X, 3400 MHz | |
Intel Core i9-12900K
i9-12900K, 3200 MHz | |
Intel Core Ultra 5 245K
Ultra 5 245K, 3600 MHz | |
Intel Core i5-14600K
i5-14600K, 3500 MHz | |
Intel Core i5-13600K
i5-13600K, 3500 MHz | |
AMD Ryzen 7 9800X3D
R7 9800X3D, 4700 MHz | |
Intel Core Ultra 5 235
Ultra 5 235, 3400 MHz | |
AMD Ryzen 7 9700X
Ryzen 7 9700X, 3800 MHz | |
AMD Ryzen 7 7745HX
R7 7745HX, 3600 MHz | |
AMD Ryzen 7 7800X3D
R7 7800X3D, 4200 MHz | |
AMD Ryzen 5 9600X
Ryzen 5 9600X, 3900 MHz | |
Intel Core i5-12600K
i5-12600K, 2800 MHz | |
Intel Core Ultra 5 225F
Ultra 5 225F, 3300 MHz | |
Intel Core i5-13400
i5-13400, 2500 MHz | |
AMD Ryzen 5 7600X
R5 7600X, 4700 MHz | |
Intel Core i5-12400F
i5-12400F, 2500 MHz | |
|
|
Intel Core Ultra 9 285K
Ultra 9 285K, 3200 MHz | |
AMD Ryzen 7 9700X
Ryzen 7 9700X, 3800 MHz | |
AMD Ryzen 9 9950X
Ryzen 9 9950X, 4300 MHz | |
AMD Ryzen 5 9600X
Ryzen 5 9600X, 3900 MHz | |
Intel Core i9-14900K
i9-14900K, 3200 MHz | |
AMD Ryzen 9 7950X
R9 7950X, 4500 MHz | |
AMD Ryzen 7 9800X3D
R7 9800X3D, 4700 MHz | |
Intel Core i9-13900K
i9-13900K, 3000 MHz | |
AMD Ryzen 9 7950X3D
R9 7950X3D, 4200 MHz | |
AMD Ryzen 9 7900X
R9 7900X, 4700 MHz | |
Intel Core Ultra 5 245K
Ultra 5 245K, 3600 MHz | |
AMD Ryzen 5 7600X
R5 7600X, 4700 MHz | |
Intel Core Ultra 5 235
Ultra 5 235, 3400 MHz | |
Intel Core i5-14600K
i5-14600K, 3500 MHz | |
AMD Ryzen 7 7745HX
R7 7745HX, 3600 MHz | |
AMD Ryzen 7 7800X3D
R7 7800X3D, 4200 MHz | |
Intel Core i5-13600K
i5-13600K, 3500 MHz | |
Intel Core Ultra 5 225F
Ultra 5 225F, 3300 MHz | |
Intel Core i9-12900K
i9-12900K, 3200 MHz | |
Intel Core i5-12600K
i5-12600K, 2800 MHz | |
AMD Ryzen 9 5950X
R9 5950X, 3400 MHz | |
Intel Core i5-13400
i5-13400, 2500 MHz | |
Intel Core i5-12400F
i5-12400F, 2500 MHz | |
|
Intel Core Ultra 9 285K
Ultra 9 285K, 3200 MHz | |
AMD Ryzen 9 9950X
Ryzen 9 9950X, 4300 MHz |
6335 (6262.72min - 6335.13max) Points +74% |
Intel Core i9-14900K
i9-14900K, 3200 MHz | |
AMD Ryzen 9 7950X
R9 7950X, 4500 MHz | |
Intel Core i9-13900K
i9-13900K, 3000 MHz | |
AMD Ryzen 9 7950X3D
R9 7950X3D, 4200 MHz | |
AMD Ryzen 9 7900X
R9 7900X, 4700 MHz | |
AMD Ryzen 9 5950X
R9 5950X, 3400 MHz | |
Intel Core i9-12900K
i9-12900K, 3200 MHz | |
Intel Core Ultra 5 245K
Ultra 5 245K, 3600 MHz | |
AMD Ryzen 7 9800X3D
R7 9800X3D, 4700 MHz | |
Intel Core i5-13600K
i5-13600K, 3500 MHz | |
Intel Core Ultra 5 235
Ultra 5 235, 3400 MHz | |
Intel Core i5-14600K
i5-14600K, 3500 MHz | |
AMD Ryzen 7 9700X
Ryzen 7 9700X, 3800 MHz |
3178 (3067.25min - 3120.37max) Points -13% |
AMD Ryzen 7 7745HX
R7 7745HX, 3600 MHz | |
AMD Ryzen 7 7800X3D
R7 7800X3D, 4200 MHz | |
Intel Core Ultra 5 225F
Ultra 5 225F, 3300 MHz | |
AMD Ryzen 5 9600X
Ryzen 5 9600X, 3900 MHz | |
Intel Core i5-12600K
i5-12600K, 2800 MHz | |
AMD Ryzen 5 7600X
R5 7600X, 4700 MHz | |
Intel Core i5-13400
i5-13400, 2500 MHz | |
Intel Core i5-12400F
i5-12400F, 2500 MHz | |
|
|
Intel Core Ultra 9 285K
Ultra 9 285K, 3200 MHz | |
AMD Ryzen 7 9700X
Ryzen 7 9700X, 3800 MHz | |
AMD Ryzen 9 9950X
Ryzen 9 9950X, 4300 MHz | |
Intel Core i9-14900K
i9-14900K, 3200 MHz | |
AMD Ryzen 5 9600X
Ryzen 5 9600X, 3900 MHz | |
Intel Core i9-13900K
i9-13900K, 3000 MHz | |
AMD Ryzen 9 7950X
R9 7950X, 4500 MHz | |
AMD Ryzen 9 7950X3D
R9 7950X3D, 4200 MHz | |
Intel Core Ultra 5 245K
Ultra 5 245K, 3600 MHz | |
AMD Ryzen 7 9800X3D
R7 9800X3D, 4700 MHz | |
AMD Ryzen 9 7900X
R9 7900X, 4700 MHz | |
Intel Core Ultra 5 235
Ultra 5 235, 3400 MHz | |
AMD Ryzen 5 7600X
R5 7600X, 4700 MHz | |
Intel Core Ultra 5 225F
Ultra 5 225F, 3300 MHz | |
Intel Core i5-14600K
i5-14600K, 3500 MHz | |
AMD Ryzen 7 7745HX
R7 7745HX, 3600 MHz | |
Intel Core i9-12900K
i9-12900K, 3200 MHz | |
Intel Core i5-13600K
i5-13600K, 3500 MHz | |
AMD Ryzen 7 7800X3D
R7 7800X3D, 4200 MHz | |
Intel Core i5-12600K
i5-12600K, 2800 MHz | |
AMD Ryzen 9 5950X
R9 5950X, 3400 MHz | |
Intel Core i5-13400
i5-13400, 2500 MHz | |
Intel Core i5-12400F
i5-12400F, 2500 MHz | |
|
Intel Core Ultra 9 285K
Ultra 9 285K, 3200 MHz | |
AMD Ryzen 9 9950X
Ryzen 9 9950X, 4300 MHz | |
Intel Core i9-14900K
i9-14900K, 3200 MHz | |
Intel Core i9-13900K
i9-13900K, 3000 MHz | |
AMD Ryzen 9 7950X
R9 7950X, 4500 MHz | |
AMD Ryzen 9 7950X3D
R9 7950X3D, 4200 MHz | |
AMD Ryzen 9 7900X
R9 7900X, 4700 MHz | |
AMD Ryzen 9 5950X
R9 5950X, 3400 MHz | |
Intel Core Ultra 5 245K
Ultra 5 245K, 3600 MHz | |
Intel Core i9-12900K
i9-12900K, 3200 MHz | |
Intel Core Ultra 5 235
Ultra 5 235, 3400 MHz | |
Intel Core i5-13600K
i5-13600K, 3500 MHz | |
AMD Ryzen 7 9800X3D
R7 9800X3D, 4700 MHz | |
Intel Core i5-14600K
i5-14600K, 3500 MHz | |
AMD Ryzen 7 9700X
Ryzen 7 9700X, 3800 MHz | |
AMD Ryzen 7 7745HX
R7 7745HX, 3600 MHz | |
AMD Ryzen 7 7800X3D
R7 7800X3D, 4200 MHz | |
Intel Core Ultra 5 225F
Ultra 5 225F, 3300 MHz | |
AMD Ryzen 5 9600X
Ryzen 5 9600X, 3900 MHz | |
Intel Core i5-12600K
i5-12600K, 2800 MHz | |
AMD Ryzen 5 7600X
R5 7600X, 4700 MHz | |
Intel Core i5-13400
i5-13400, 2500 MHz | |
Intel Core i5-12400F
i5-12400F, 2500 MHz | |
|
Intel Core i5-12400F
i5-12400F, 2500 MHz | |
Intel Core Ultra 5 225F
Ultra 5 225F, 3300 MHz | |
Intel Core i5-13400
i5-13400, 2500 MHz | |
AMD Ryzen 5 7600X
R5 7600X, 4700 MHz | |
Intel Core i5-12600K
i5-12600K, 2800 MHz | |
AMD Ryzen 5 9600X
Ryzen 5 9600X, 3900 MHz | |
AMD Ryzen 7 7800X3D
R7 7800X3D, 4200 MHz | |
AMD Ryzen 7 7745HX
R7 7745HX, 3600 MHz | |
Intel Core Ultra 5 235
Ultra 5 235, 3400 MHz | |
AMD Ryzen 7 9700X
Ryzen 7 9700X, 3800 MHz | |
AMD Ryzen 7 9800X3D
R7 9800X3D, 4700 MHz | |
Intel Core Ultra 5 245K
Ultra 5 245K, 3600 MHz | |
Intel Core i5-13600K
i5-13600K, 3500 MHz | |
Intel Core i5-14600K
i5-14600K, 3500 MHz | |
Intel Core i9-12900K
i9-12900K, 3200 MHz | |
AMD Ryzen 9 5950X
R9 5950X, 3400 MHz | |
AMD Ryzen 9 7900X
R9 7900X, 4700 MHz | |
AMD Ryzen 9 7950X3D
R9 7950X3D, 4200 MHz | |
AMD Ryzen 9 7950X
R9 7950X, 4500 MHz | |
Intel Core i9-13900K
i9-13900K, 3000 MHz | |
Intel Core i9-14900K
i9-14900K, 3200 MHz | |
Intel Core Ultra 9 285K
Ultra 9 285K, 3200 MHz | |
AMD Ryzen 9 9950X
Ryzen 9 9950X, 4300 MHz | |
|
|
Intel Core i9-12900K
i9-12900K, 3200 MHz | |
Intel Core i5-12600K
i5-12600K, 2800 MHz | |
Intel Core i5-12400F
i5-12400F, 2500 MHz | |
Intel Core Ultra 5 225F
Ultra 5 225F, 3300 MHz | |
Intel Core i5-13400
i5-13400, 2500 MHz | |
Intel Core Ultra 5 245K
Ultra 5 245K, 3600 MHz | |
Intel Core Ultra 5 235
Ultra 5 235, 3400 MHz | |
AMD Ryzen 5 7600X
R5 7600X, 4700 MHz | |
AMD Ryzen 5 9600X
Ryzen 5 9600X, 3900 MHz | |
AMD Ryzen 9 5950X
R9 5950X, 3400 MHz | |
Intel Core i5-13600K
i5-13600K, 3500 MHz | |
AMD Ryzen 7 7800X3D
R7 7800X3D, 4200 MHz | |
Intel Core i5-14600K
i5-14600K, 3500 MHz | |
AMD Ryzen 7 9700X
Ryzen 7 9700X, 3800 MHz | |
AMD Ryzen 7 7745HX
R7 7745HX, 3600 MHz | |
AMD Ryzen 7 9800X3D
R7 9800X3D, 4700 MHz | |
Intel Core Ultra 9 285K
Ultra 9 285K, 3200 MHz | |
AMD Ryzen 9 9950X
Ryzen 9 9950X, 4300 MHz | |
Intel Core i9-14900K
i9-14900K, 3200 MHz | |
AMD Ryzen 9 7950X3D
R9 7950X3D, 4200 MHz | |
Intel Core i9-13900K
i9-13900K, 3000 MHz | |
AMD Ryzen 9 7900X
R9 7900X, 4700 MHz | |
AMD Ryzen 9 7950X
R9 7950X, 4500 MHz | |
|
Intel Core i5-13400
i5-13400, 2500 MHz | |
Intel Core i5-12600K
i5-12600K, 2800 MHz | |
Intel Core i9-12900K
i9-12900K, 3200 MHz | |
Intel Core i5-13600K
i5-13600K, 3500 MHz | |
Intel Core i5-14600K
i5-14600K, 3500 MHz | |
Intel Core i5-12400F
i5-12400F, 2500 MHz | |
Intel Core Ultra 5 225F
Ultra 5 225F, 3300 MHz | |
Intel Core i9-13900K
i9-13900K, 3000 MHz | |
Intel Core Ultra 5 245K
Ultra 5 245K, 3600 MHz | |
Intel Core Ultra 5 235
Ultra 5 235, 3400 MHz | |
AMD Ryzen 5 7600X
R5 7600X, 4700 MHz | |
Intel Core i9-14900K
i9-14900K, 3200 MHz | |
AMD Ryzen 5 9600X
Ryzen 5 9600X, 3900 MHz | |
AMD Ryzen 9 5950X
R9 5950X, 3400 MHz | |
AMD Ryzen 7 7800X3D
R7 7800X3D, 4200 MHz | |
AMD Ryzen 7 7745HX
R7 7745HX, 3600 MHz | |
AMD Ryzen 7 9700X
Ryzen 7 9700X, 3800 MHz | |
AMD Ryzen 7 9800X3D
R7 9800X3D, 4700 MHz | |
Intel Core Ultra 9 285K
Ultra 9 285K, 3200 MHz | |
AMD Ryzen 9 7900X
R9 7900X, 4700 MHz | |
AMD Ryzen 9 7950X3D
R9 7950X3D, 4200 MHz | |
AMD Ryzen 9 7950X
R9 7950X, 4500 MHz | |
AMD Ryzen 9 9950X
Ryzen 9 9950X, 4300 MHz | |
|
|
Intel Core i9-14900K
i9-14900K, 3200 MHz |
433.5 (424min - 434max) fps +15% |
Intel Core Ultra 9 285K
Ultra 9 285K, 3200 MHz |
422 (421min - 423max) fps +12% |
Intel Core i9-13900K
i9-13900K, 3000 MHz |
412 (410min - 417max) fps +9% |
Intel Core i5-14600K
i5-14600K, 3500 MHz |
411 (410min - 412max) fps +9% |
AMD Ryzen 9 7950X3D
R9 7950X3D, 4200 MHz |
392.5 (391min - 397max) fps +4% |
AMD Ryzen 9 9950X
Ryzen 9 9950X, 4300 MHz |
392 (392min - 393max) fps +4% |
Intel Core Ultra 5 245K
Ultra 5 245K, 3600 MHz |
388.5 (387min - 390max) fps +3% |
Intel Core i5-13600K
i5-13600K, 3500 MHz |
388 (386min - 388max) fps +3% |
AMD Ryzen 9 7950X
R9 7950X, 4500 MHz |
379.5 (378min - 385max) fps 0% |
Intel Core Ultra 5 235
Ultra 5 235, 3400 MHz |
378 (376min - 378max) fps |
AMD Ryzen 9 7900X
R9 7900X, 4700 MHz |
376 (369min - 378max) fps -1% |
AMD Ryzen 7 9700X
Ryzen 7 9700X, 3800 MHz |
376 (374min - 376max) fps -1% |
AMD Ryzen 7 9800X3D
R7 9800X3D, 4700 MHz |
375.5 (375min - 377max) fps -1% |
Intel Core i9-12900K
i9-12900K, 3200 MHz |
368.5 (366min - 369max) fps -3% |
AMD Ryzen 5 7600X
R5 7600X, 4700 MHz |
367 (363min - 371max) fps -3% |
Intel Core Ultra 5 225F
Ultra 5 225F, 3300 MHz |
364.5 (362min - 365max) fps -4% |
AMD Ryzen 5 9600X
Ryzen 5 9600X, 3900 MHz |
364 (361min - 367max) fps -4% |
AMD Ryzen 7 7745HX
R7 7745HX, 3600 MHz |
358.5 (356min - 366max) fps -5% |
AMD Ryzen 7 7800X3D
R7 7800X3D, 4200 MHz |
344 (339min - 346max) fps -9% |
AMD Ryzen 9 5950X
R9 5950X, 3400 MHz |
338.5 (337min - 340max) fps -10% |
Intel Core i5-12600K
i5-12600K, 2800 MHz |
333.5 (332min - 336max) fps -12% |
Intel Core i5-13400
i5-13400, 2500 MHz |
311 (310min - 312max) fps -18% |
Intel Core i5-12400F
i5-12400F, 2500 MHz |
252.5 (249min - 256max) fps -33% |
|
Intel Core Ultra 9 285K
Ultra 9 285K, 3200 MHz |
296.5 (296min - 298max) fps +48% |
Intel Core i9-14900K
i9-14900K, 3200 MHz |
286.5 (285min - 287max) fps +43% |
AMD Ryzen 9 9950X
Ryzen 9 9950X, 4300 MHz |
271 (271min - 272max) fps +35% |
Intel Core i9-13900K
i9-13900K, 3000 MHz |
267 (266min - 271max) fps +33% |
AMD Ryzen 9 7950X
R9 7950X, 4500 MHz |
266.5 (263min - 267max) fps +33% |
AMD Ryzen 9 7950X3D
R9 7950X3D, 4200 MHz |
265.5 (263min - 266max) fps +32% |
AMD Ryzen 9 7900X
R9 7900X, 4700 MHz |
241 (240min - 242max) fps +20% |
AMD Ryzen 9 5950X
R9 5950X, 3400 MHz |
221 (220min - 221max) fps +10% |
Intel Core Ultra 5 245K
Ultra 5 245K, 3600 MHz |
216.5 (215min - 217max) fps +8% |
Intel Core i5-14600K
i5-14600K, 3500 MHz |
209 (208min - 209max) fps +4% |
Intel Core i9-12900K
i9-12900K, 3200 MHz |
206 (206min - 206max) fps +3% |
AMD Ryzen 7 9800X3D
R7 9800X3D, 4700 MHz |
203 (202min - 203max) fps +1% |
Intel Core Ultra 5 235
Ultra 5 235, 3400 MHz |
200.85 (169.7min - 209max) fps |
Intel Core i5-13600K
i5-13600K, 3500 MHz |
199 (198.5min - 199.4max) fps -1% |
AMD Ryzen 7 9700X
Ryzen 7 9700X, 3800 MHz |
176.05 (175.9min - 176.1max) fps -12% |
AMD Ryzen 7 7745HX
R7 7745HX, 3600 MHz |
173.25 (172.2min - 174.1max) fps -14% |
AMD Ryzen 7 7800X3D
R7 7800X3D, 4200 MHz |
169.25 (169.1min - 170max) fps -16% |
AMD Ryzen 5 9600X
Ryzen 5 9600X, 3900 MHz |
154 (153.4min - 154.3max) fps -23% |
Intel Core Ultra 5 225F
Ultra 5 225F, 3300 MHz |
148.9 (135.9min - 157.2max) fps -26% |
Intel Core i5-12600K
i5-12600K, 2800 MHz |
148 (147min - 148max) fps -26% |
AMD Ryzen 5 7600X
R5 7600X, 4700 MHz |
147.8 (147.7min - 147.9max) fps -26% |
Intel Core i5-13400
i5-13400, 2500 MHz |
135.8 (135.7min - 135.9max) fps -32% |
Intel Core i5-12400F
i5-12400F, 2500 MHz |
101.35 (101.1min - 101.5max) fps -50% |
|
AMD Ryzen 9 7900X
R9 7900X, 4700 MHz | |
AMD Ryzen 7 7800X3D
R7 7800X3D, 4200 MHz | |
AMD Ryzen 9 7950X
R9 7950X, 4500 MHz | |
AMD Ryzen 5 7600X
R5 7600X, 4700 MHz | |
Intel Core i9-14900K
i9-14900K, 3200 MHz | |
AMD Ryzen 9 7950X3D
R9 7950X3D, 4200 MHz | |
AMD Ryzen 7 9800X3D
R7 9800X3D, 4700 MHz | |
Intel Core i9-13900K
i9-13900K, 3000 MHz | |
AMD Ryzen 5 9600X
Ryzen 5 9600X, 3900 MHz | |
AMD Ryzen 7 7745HX
R7 7745HX, 3600 MHz | |
AMD Ryzen 9 9950X
Ryzen 9 9950X, 4300 MHz | |
AMD Ryzen 7 9700X
Ryzen 7 9700X, 3800 MHz | |
Intel Core Ultra 9 285K
Ultra 9 285K, 3200 MHz | |
AMD Ryzen 9 5950X
R9 5950X, 3400 MHz | |
Intel Core i5-14600K
i5-14600K, 3500 MHz | |
Intel Core i5-13600K
i5-13600K, 3500 MHz | |
Intel Core i9-12900K
i9-12900K, 3200 MHz | |
Intel Core Ultra 5 245K
Ultra 5 245K, 3600 MHz | |
Intel Core Ultra 5 235
Ultra 5 235, 3400 MHz | |
Intel Core Ultra 5 225F
Ultra 5 225F, 3300 MHz | |
Intel Core i5-13400
i5-13400, 2500 MHz | |
Intel Core i5-12400F
i5-12400F, 2500 MHz | |
Intel Core i5-12600K
i5-12600K, 2800 MHz | |
|
|
AMD Ryzen 9 9950X
Ryzen 9 9950X, 4300 MHz | |
AMD Ryzen 9 7950X
R9 7950X, 4500 MHz | |
Intel Core i9-13900K
i9-13900K, 3000 MHz | |
AMD Ryzen 9 5950X
R9 5950X, 3400 MHz | |
AMD Ryzen 9 7950X3D
R9 7950X3D, 4200 MHz | |
Intel Core i9-14900K
i9-14900K, 3200 MHz | |
Intel Core i5-14600K
i5-14600K, 3500 MHz | |
Intel Core i5-13600K
i5-13600K, 3500 MHz | |
Intel Core i9-12900K
i9-12900K, 3200 MHz | |
AMD Ryzen 7 9800X3D
R7 9800X3D, 4700 MHz | |
AMD Ryzen 7 7745HX
R7 7745HX, 3600 MHz | |
Intel Core Ultra 5 245K
Ultra 5 245K, 3600 MHz | |
AMD Ryzen 7 9700X
Ryzen 7 9700X, 3800 MHz | |
Intel Core Ultra 9 285K
Ultra 9 285K, 3200 MHz | |
Intel Core Ultra 5 235
Ultra 5 235, 3400 MHz | |
AMD Ryzen 7 7800X3D
R7 7800X3D, 4200 MHz | |
AMD Ryzen 9 7900X
R9 7900X, 4700 MHz | |
AMD Ryzen 5 9600X
Ryzen 5 9600X, 3900 MHz | |
AMD Ryzen 5 7600X
R5 7600X, 4700 MHz | |
Intel Core i5-12600K
i5-12600K, 2800 MHz | |
Intel Core i5-13400
i5-13400, 2500 MHz | |
Intel Core Ultra 5 225F
Ultra 5 225F, 3300 MHz | |
Intel Core i5-12400F
i5-12400F, 2500 MHz | |
|
Intel Core i9-14900K
i9-14900K, 3200 MHz | |
AMD Ryzen 9 9950X
Ryzen 9 9950X, 4300 MHz | |
Intel Core i9-13900K
i9-13900K, 3000 MHz | |
Intel Core Ultra 9 285K
Ultra 9 285K, 3200 MHz | |
AMD Ryzen 9 7950X
R9 7950X, 4500 MHz | |
AMD Ryzen 9 7950X3D
R9 7950X3D, 4200 MHz | |
AMD Ryzen 9 5950X
R9 5950X, 3400 MHz | |
Intel Core i9-12900K
i9-12900K, 3200 MHz | |
Intel Core i5-14600K
i5-14600K, 3500 MHz | |
Intel Core i5-13600K
i5-13600K, 3500 MHz | |
Intel Core Ultra 5 245K
Ultra 5 245K, 3600 MHz | |
AMD Ryzen 7 9800X3D
R7 9800X3D, 4700 MHz | |
AMD Ryzen 9 7900X
R9 7900X, 4700 MHz | |
AMD Ryzen 7 9700X
Ryzen 7 9700X, 3800 MHz | |
Intel Core Ultra 5 235
Ultra 5 235, 3400 MHz | |
Intel Core i5-12600K
i5-12600K, 2800 MHz | |
AMD Ryzen 7 7745HX
R7 7745HX, 3600 MHz | |
AMD Ryzen 5 9600X
Ryzen 5 9600X, 3900 MHz | |
AMD Ryzen 7 7800X3D
R7 7800X3D, 4200 MHz | |
Intel Core Ultra 5 225F
Ultra 5 225F, 3300 MHz | |
Intel Core i5-13400
i5-13400, 2500 MHz | |
AMD Ryzen 5 7600X
R5 7600X, 4700 MHz | |
Intel Core i5-12400F
i5-12400F, 2500 MHz | |
|
AMD Ryzen 9 9950X
Ryzen 9 9950X, 4300 MHz | |
Intel Core i9-13900K
i9-13900K, 3000 MHz | |
AMD Ryzen 9 7950X
R9 7950X, 4500 MHz | |
AMD Ryzen 9 7950X3D
R9 7950X3D, 4200 MHz | |
Intel Core i9-14900K
i9-14900K, 3200 MHz | |
AMD Ryzen 9 5950X
R9 5950X, 3400 MHz | |
Intel Core Ultra 9 285K
Ultra 9 285K, 3200 MHz | |
Intel Core i9-12900K
i9-12900K, 3200 MHz | |
Intel Core i5-14600K
i5-14600K, 3500 MHz | |
Intel Core i5-13600K
i5-13600K, 3500 MHz | |
AMD Ryzen 7 9700X
Ryzen 7 9700X, 3800 MHz | |
AMD Ryzen 7 9800X3D
R7 9800X3D, 4700 MHz | |
AMD Ryzen 9 7900X
R9 7900X, 4700 MHz | |
Intel Core Ultra 5 245K
Ultra 5 245K, 3600 MHz | |
AMD Ryzen 7 7745HX
R7 7745HX, 3600 MHz | |
AMD Ryzen 5 9600X
Ryzen 5 9600X, 3900 MHz | |
Intel Core Ultra 5 235
Ultra 5 235, 3400 MHz | |
Intel Core i5-12600K
i5-12600K, 2800 MHz | |
AMD Ryzen 7 7800X3D
R7 7800X3D, 4200 MHz | |
Intel Core i5-13400
i5-13400, 2500 MHz | |
AMD Ryzen 5 7600X
R5 7600X, 4700 MHz | |
Intel Core Ultra 5 225F
Ultra 5 225F, 3300 MHz | |
Intel Core i5-12400F
i5-12400F, 2500 MHz | |
|
|
Intel Core i9-14900K
i9-14900K, 3200 MHz | |
Intel Core Ultra 9 285K
Ultra 9 285K, 3200 MHz | |
AMD Ryzen 9 7950X
R9 7950X, 4500 MHz | |
AMD Ryzen 9 7950X3D
R9 7950X3D, 4200 MHz | |
Intel Core i9-13900K
i9-13900K, 3000 MHz | |
AMD Ryzen 9 9950X
Ryzen 9 9950X, 4300 MHz | |
AMD Ryzen 9 7900X
R9 7900X, 4700 MHz | |
Intel Core i9-12900K
i9-12900K, 3200 MHz | |
Intel Core Ultra 5 245K
Ultra 5 245K, 3600 MHz | |
Intel Core Ultra 5 235
Ultra 5 235, 3400 MHz | |
Intel Core i5-14600K
i5-14600K, 3500 MHz | |
AMD Ryzen 9 5950X
R9 5950X, 3400 MHz | |
Intel Core i5-13600K
i5-13600K, 3500 MHz | |
AMD Ryzen 7 9800X3D
R7 9800X3D, 4700 MHz | |
AMD Ryzen 7 9700X
Ryzen 7 9700X, 3800 MHz | |
AMD Ryzen 7 7800X3D
R7 7800X3D, 4200 MHz | |
Intel Core Ultra 5 225F
Ultra 5 225F, 3300 MHz | |
AMD Ryzen 7 7745HX
R7 7745HX, 3600 MHz | |
Intel Core i5-12600K
i5-12600K, 2800 MHz | |
AMD Ryzen 5 9600X
Ryzen 5 9600X, 3900 MHz | |
Intel Core i5-13400
i5-13400, 2500 MHz | |
AMD Ryzen 5 7600X
R5 7600X, 4700 MHz | |
Intel Core i5-12400F
i5-12400F, 2500 MHz | |
|
AMD Ryzen 9 9950X
Ryzen 9 9950X, 4300 MHz | |
AMD Ryzen 5 9600X
Ryzen 5 9600X, 3900 MHz | |
AMD Ryzen 7 9700X
Ryzen 7 9700X, 3800 MHz | |
AMD Ryzen 7 9800X3D
R7 9800X3D, 4700 MHz | |
Intel Core Ultra 9 285K
Ultra 9 285K, 3200 MHz | |
AMD Ryzen 9 7950X
R9 7950X, 4500 MHz | |
AMD Ryzen 9 7950X3D
R9 7950X3D, 4200 MHz | |
Intel Core i9-13900K
i9-13900K, 3000 MHz | |
AMD Ryzen 9 7900X
R9 7900X, 4700 MHz | |
Intel Core i9-14900K
i9-14900K, 3200 MHz | |
Intel Core Ultra 5 245K
Ultra 5 245K, 3600 MHz | |
AMD Ryzen 5 7600X
R5 7600X, 4700 MHz | |
Intel Core Ultra 5 235
Ultra 5 235, 3400 MHz | |
Intel Core Ultra 5 225F
Ultra 5 225F, 3300 MHz | |
AMD Ryzen 7 7745HX
R7 7745HX, 3600 MHz | |
Intel Core i9-12900K
i9-12900K, 3200 MHz | |
AMD Ryzen 7 7800X3D
R7 7800X3D, 4200 MHz | |
Intel Core i5-14600K
i5-14600K, 3500 MHz | |
Intel Core i5-13600K
i5-13600K, 3500 MHz | |
Intel Core i5-12600K
i5-12600K, 2800 MHz | |
Intel Core i5-13400
i5-13400, 2500 MHz | |
Intel Core i5-12400F
i5-12400F, 2500 MHz | |
AMD Ryzen 9 5950X
R9 5950X, 3400 MHz | |
|
|
Intel Core Ultra 9 285K
Ultra 9 285K, 3200 MHz | |
Intel Core i9-14900K
i9-14900K, 3200 MHz | |
AMD Ryzen 9 7950X
R9 7950X, 4500 MHz | |
Intel Core i9-13900K
i9-13900K, 3000 MHz | |
AMD Ryzen 9 7950X3D
R9 7950X3D, 4200 MHz | |
AMD Ryzen 9 9950X
Ryzen 9 9950X, 4300 MHz | |
AMD Ryzen 9 7900X
R9 7900X, 4700 MHz | |
Intel Core i9-12900K
i9-12900K, 3200 MHz | |
Intel Core Ultra 5 245K
Ultra 5 245K, 3600 MHz | |
Intel Core Ultra 5 235
Ultra 5 235, 3400 MHz | |
Intel Core i5-14600K
i5-14600K, 3500 MHz | |
AMD Ryzen 7 9800X3D
R7 9800X3D, 4700 MHz | |
Intel Core i5-13600K
i5-13600K, 3500 MHz | |
AMD Ryzen 9 5950X
R9 5950X, 3400 MHz | |
AMD Ryzen 7 9700X
Ryzen 7 9700X, 3800 MHz | |
Intel Core Ultra 5 225F
Ultra 5 225F, 3300 MHz | |
AMD Ryzen 7 7800X3D
R7 7800X3D, 4200 MHz | |
AMD Ryzen 7 7745HX
R7 7745HX, 3600 MHz | |
Intel Core i5-12600K
i5-12600K, 2800 MHz | |
AMD Ryzen 5 9600X
Ryzen 5 9600X, 3900 MHz | |
AMD Ryzen 5 7600X
R5 7600X, 4700 MHz | |
Intel Core i5-13400
i5-13400, 2500 MHz | |
Intel Core i5-12400F
i5-12400F, 2500 MHz | |
|
AMD Ryzen 9 9950X
Ryzen 9 9950X, 4300 MHz | |
AMD Ryzen 7 9700X
Ryzen 7 9700X, 3800 MHz | |
AMD Ryzen 5 9600X
Ryzen 5 9600X, 3900 MHz | |
Intel Core Ultra 9 285K
Ultra 9 285K, 3200 MHz | |
AMD Ryzen 7 9800X3D
R7 9800X3D, 4700 MHz | |
Intel Core i9-14900K
i9-14900K, 3200 MHz | |
AMD Ryzen 9 7950X
R9 7950X, 4500 MHz | |
Intel Core i9-13900K
i9-13900K, 3000 MHz | |
AMD Ryzen 9 7900X
R9 7900X, 4700 MHz | |
AMD Ryzen 9 7950X3D
R9 7950X3D, 4200 MHz | |
Intel Core Ultra 5 245K
Ultra 5 245K, 3600 MHz | |
Intel Core Ultra 5 235
Ultra 5 235, 3400 MHz | |
AMD Ryzen 5 7600X
R5 7600X, 4700 MHz | |
Intel Core Ultra 5 225F
Ultra 5 225F, 3300 MHz | |
Intel Core i5-14600K
i5-14600K, 3500 MHz | |
AMD Ryzen 7 7745HX
R7 7745HX, 3600 MHz | |
Intel Core i9-12900K
i9-12900K, 3200 MHz | |
AMD Ryzen 7 7800X3D
R7 7800X3D, 4200 MHz | |
Intel Core i5-13600K
i5-13600K, 3500 MHz | |
Intel Core i5-12600K
i5-12600K, 2800 MHz | |
Intel Core i5-13400
i5-13400, 2500 MHz | |
AMD Ryzen 9 5950X
R9 5950X, 3400 MHz | |
Intel Core i5-12400F
i5-12400F, 2500 MHz | |
|
|
AMD Ryzen 9 9950X
Ryzen 9 9950X, 4300 MHz | |
Intel Core i9-14900K
i9-14900K, 3200 MHz | |
AMD Ryzen 7 9700X
Ryzen 7 9700X, 3800 MHz | |
Intel Core Ultra 9 285K
Ultra 9 285K, 3200 MHz | |
AMD Ryzen 5 9600X
Ryzen 5 9600X, 3900 MHz | |
Intel Core i9-13900K
i9-13900K, 3000 MHz | |
AMD Ryzen 7 9800X3D
R7 9800X3D, 4700 MHz | |
AMD Ryzen 9 7950X
R9 7950X, 4500 MHz | |
AMD Ryzen 9 7950X3D
R9 7950X3D, 4200 MHz | |
AMD Ryzen 9 7900X
R9 7900X, 4700 MHz | |
Intel Core Ultra 5 245K
Ultra 5 245K, 3600 MHz | |
AMD Ryzen 7 7800X3D
R7 7800X3D, 4200 MHz | |
Intel Core Ultra 5 235
Ultra 5 235, 3400 MHz | |
AMD Ryzen 5 7600X
R5 7600X, 4700 MHz | |
Intel Core i5-14600K
i5-14600K, 3500 MHz | |
Intel Core Ultra 5 225F
Ultra 5 225F, 3300 MHz | |
Intel Core i9-12900K
i9-12900K, 3200 MHz | |
Intel Core i5-13600K
i5-13600K, 3500 MHz | |
AMD Ryzen 7 7745HX
R7 7745HX, 3600 MHz | |
Intel Core i5-12600K
i5-12600K, 2800 MHz | |
Intel Core i5-13400
i5-13400, 2500 MHz | |
Intel Core i5-12400F
i5-12400F, 2500 MHz | |
AMD Ryzen 9 5950X
R9 5950X, 3400 MHz | |
|
AMD Ryzen 9 9950X
Ryzen 9 9950X, 4300 MHz | |
Intel Core Ultra 9 285K
Ultra 9 285K, 3200 MHz | |
AMD Ryzen 9 7950X
R9 7950X, 4500 MHz | |
Intel Core i9-14900K
i9-14900K, 3200 MHz | |
AMD Ryzen 9 7950X3D
R9 7950X3D, 4200 MHz | |
Intel Core i9-13900K
i9-13900K, 3000 MHz | |
AMD Ryzen 9 7900X
R9 7900X, 4700 MHz | |
AMD Ryzen 7 9800X3D
R7 9800X3D, 4700 MHz | |
Intel Core Ultra 5 245K
Ultra 5 245K, 3600 MHz | |
Intel Core Ultra 5 235
Ultra 5 235, 3400 MHz | |
Intel Core i5-14600K
i5-14600K, 3500 MHz | |
Intel Core i9-12900K
i9-12900K, 3200 MHz | |
AMD Ryzen 9 5950X
R9 5950X, 3400 MHz | |
Intel Core i5-13600K
i5-13600K, 3500 MHz | |
AMD Ryzen 7 9700X
Ryzen 7 9700X, 3800 MHz | |
AMD Ryzen 7 7800X3D
R7 7800X3D, 4200 MHz | |
AMD Ryzen 7 7745HX
R7 7745HX, 3600 MHz | |
AMD Ryzen 5 9600X
Ryzen 5 9600X, 3900 MHz | |
Intel Core Ultra 5 225F
Ultra 5 225F, 3300 MHz | |
AMD Ryzen 5 7600X
R5 7600X, 4700 MHz | |
Intel Core i5-12600K
i5-12600K, 2800 MHz | |
Intel Core i5-13400
i5-13400, 2500 MHz | |
Intel Core i5-12400F
i5-12400F, 2500 MHz | |
|
AMD Ryzen 7 9800X3D
R7 9800X3D, 4700 MHz | |
AMD Ryzen 9 9950X
Ryzen 9 9950X, 4300 MHz | |
AMD Ryzen 9 7950X3D
R9 7950X3D, 4200 MHz | |
AMD Ryzen 7 7800X3D
R7 7800X3D, 4200 MHz | |
Intel Core i9-13900K
i9-13900K, 3000 MHz | |
Intel Core i9-14900K
i9-14900K, 3200 MHz | |
Intel Core i5-14600K
i5-14600K, 3500 MHz | |
AMD Ryzen 7 9700X
Ryzen 7 9700X, 3800 MHz | |
Intel Core i5-13600K
i5-13600K, 3500 MHz | |
Intel Core Ultra 9 285K
Ultra 9 285K, 3200 MHz | |
AMD Ryzen 9 7900X
R9 7900X, 4700 MHz | |
AMD Ryzen 9 7950X
R9 7950X, 4500 MHz | |
Intel Core i9-12900K
i9-12900K, 3200 MHz | |
Intel Core Ultra 5 245K
Ultra 5 245K, 3600 MHz | |
Intel Core Ultra 5 235
Ultra 5 235, 3400 MHz | |
AMD Ryzen 7 7745HX
R7 7745HX, 3600 MHz | |
AMD Ryzen 5 9600X
Ryzen 5 9600X, 3900 MHz | |
AMD Ryzen 5 7600X
R5 7600X, 4700 MHz | |
AMD Ryzen 9 5950X
R9 5950X, 3400 MHz | |
Intel Core i5-12600K
i5-12600K, 2800 MHz | |
Intel Core i5-13400
i5-13400, 2500 MHz | |
Intel Core Ultra 5 225F
Ultra 5 225F, 3300 MHz | |
Intel Core i5-12400F
i5-12400F, 2500 MHz | |
|
|
AMD Ryzen 9 7950X
R9 7950X, 4500 MHz | |
AMD Ryzen 9 9950X
Ryzen 9 9950X, 4300 MHz | |
AMD Ryzen 9 7950X3D
R9 7950X3D, 4200 MHz | |
Intel Core i9-14900K
i9-14900K, 3200 MHz | |
Intel Core i9-13900K
i9-13900K, 3000 MHz | |
Intel Core Ultra 9 285K
Ultra 9 285K, 3200 MHz | |
AMD Ryzen 9 5950X
R9 5950X, 3400 MHz | |
AMD Ryzen 9 7900X
R9 7900X, 4700 MHz | |
Intel Core i9-12900K
i9-12900K, 3200 MHz | |
Intel Core i5-14600K
i5-14600K, 3500 MHz | |
AMD Ryzen 7 9800X3D
R7 9800X3D, 4700 MHz | |
Intel Core i5-13600K
i5-13600K, 3500 MHz | |
AMD Ryzen 7 7800X3D
R7 7800X3D, 4200 MHz | |
AMD Ryzen 7 7745HX
R7 7745HX, 3600 MHz | |
AMD Ryzen 7 9700X
Ryzen 7 9700X, 3800 MHz | |
Intel Core Ultra 5 245K
Ultra 5 245K, 3600 MHz | |
Intel Core Ultra 5 235
Ultra 5 235, 3400 MHz | |
AMD Ryzen 5 7600X
R5 7600X, 4700 MHz | |
AMD Ryzen 5 9600X
Ryzen 5 9600X, 3900 MHz | |
Intel Core i5-12600K
i5-12600K, 2800 MHz | |
Intel Core i5-13400
i5-13400, 2500 MHz | |
Intel Core Ultra 5 225F
Ultra 5 225F, 3300 MHz | |
Intel Core i5-12400F
i5-12400F, 2500 MHz | |
|
AMD Ryzen 7 9800X3D
R7 9800X3D, 4700 MHz | |
AMD Ryzen 9 7950X
R9 7950X, 4500 MHz | |
AMD Ryzen 9 7950X3D
R9 7950X3D, 4200 MHz | |
AMD Ryzen 9 7900X
R9 7900X, 4700 MHz | |
AMD Ryzen 7 7800X3D
R7 7800X3D, 4200 MHz | |
AMD Ryzen 5 7600X
R5 7600X, 4700 MHz | |
AMD Ryzen 7 9700X
Ryzen 7 9700X, 3800 MHz | |
AMD Ryzen 9 9950X
Ryzen 9 9950X, 4300 MHz | |
AMD Ryzen 5 9600X
Ryzen 5 9600X, 3900 MHz | |
Intel Core i9-14900K
i9-14900K, 3200 MHz | |
Intel Core Ultra 9 285K
Ultra 9 285K, 3200 MHz | |
AMD Ryzen 7 7745HX
R7 7745HX, 3600 MHz | |
Intel Core i9-13900K
i9-13900K, 3000 MHz | |
AMD Ryzen 9 5950X
R9 5950X, 3400 MHz | |
Intel Core i5-14600K
i5-14600K, 3500 MHz | |
Intel Core i9-12900K
i9-12900K, 3200 MHz | |
Intel Core i5-13600K
i5-13600K, 3500 MHz | |
Intel Core Ultra 5 235
Ultra 5 235, 3400 MHz | |
Intel Core Ultra 5 245K
Ultra 5 245K, 3600 MHz | |
Intel Core Ultra 5 225F
Ultra 5 225F, 3300 MHz | |
Intel Core i5-12600K
i5-12600K, 2800 MHz | |
Intel Core i5-13400
i5-13400, 2500 MHz | |
Intel Core i5-12400F
i5-12400F, 2500 MHz | |
|
AMD Ryzen 9 9950X
Ryzen 9 9950X, 4300 MHz | |
Intel Core Ultra 9 285K
Ultra 9 285K, 3200 MHz | |
AMD Ryzen 9 7950X
R9 7950X, 4500 MHz | |
Intel Core i9-14900K
i9-14900K, 3200 MHz | |
Intel Core i9-13900K
i9-13900K, 3000 MHz | |
AMD Ryzen 9 7950X3D
R9 7950X3D, 4200 MHz | |
AMD Ryzen 9 7900X
R9 7900X, 4700 MHz | |
AMD Ryzen 9 5950X
R9 5950X, 3400 MHz | |
AMD Ryzen 7 9800X3D
R7 9800X3D, 4700 MHz | |
Intel Core i5-12600K
i5-12600K, 2800 MHz | |
Intel Core i9-12900K
i9-12900K, 3200 MHz | |
Intel Core Ultra 5 245K
Ultra 5 245K, 3600 MHz | |
Intel Core i5-14600K
i5-14600K, 3500 MHz | |
Intel Core i5-13600K
i5-13600K, 3500 MHz | |
AMD Ryzen 7 9700X
Ryzen 7 9700X, 3800 MHz | |
Intel Core Ultra 5 235
Ultra 5 235, 3400 MHz | |
AMD Ryzen 7 7800X3D
R7 7800X3D, 4200 MHz | |
AMD Ryzen 7 7745HX
R7 7745HX, 3600 MHz | |
AMD Ryzen 5 9600X
Ryzen 5 9600X, 3900 MHz | |
AMD Ryzen 5 7600X
R5 7600X, 4700 MHz | |
Intel Core Ultra 5 225F
Ultra 5 225F, 3300 MHz | |
Intel Core i5-13400
i5-13400, 2500 MHz | |
Intel Core i5-12400F
i5-12400F, 2500 MHz | |
|
Intel Core i5-12400F
i5-12400F, 2500 MHz | |
Intel Core i5-13400
i5-13400, 2500 MHz | |
Intel Core Ultra 5 225F
Ultra 5 225F, 3300 MHz | |
AMD Ryzen 9 5950X
R9 5950X, 3400 MHz | |
Intel Core i5-12600K
i5-12600K, 2800 MHz | |
Intel Core i9-12900K
i9-12900K, 3200 MHz | |
AMD Ryzen 7 7800X3D
R7 7800X3D, 4200 MHz | |
AMD Ryzen 7 7745HX
R7 7745HX, 3600 MHz | |
Intel Core Ultra 5 235
Ultra 5 235, 3400 MHz | |
Intel Core Ultra 5 245K
Ultra 5 245K, 3600 MHz | |
Intel Core Ultra 5 245K
Ultra 5 245K, 3600 MHz | |
Intel Core i5-13600K
i5-13600K, 3500 MHz | |
Intel Core i5-14600K
i5-14600K, 3500 MHz | |
Intel Core Ultra 9 285K
Ultra 9 285K, 3200 MHz | |
AMD Ryzen 5 7600X
R5 7600X, 4700 MHz | |
AMD Ryzen 9 7900X
R9 7900X, 4700 MHz | |
AMD Ryzen 9 7950X3D
R9 7950X3D, 4200 MHz | |
AMD Ryzen 9 7950X
R9 7950X, 4500 MHz | |
Intel Core i9-13900K
i9-13900K, 3000 MHz | |
AMD Ryzen 7 9800X3D
R7 9800X3D, 4700 MHz | |
Intel Core i9-14900K
i9-14900K, 3200 MHz | |
AMD Ryzen 7 9700X
Ryzen 7 9700X, 3800 MHz | |
AMD Ryzen 5 9600X
Ryzen 5 9600X, 3900 MHz | |
AMD Ryzen 9 9950X
Ryzen 9 9950X, 4300 MHz | |
|
Intel Core i5-12600K
i5-12600K, 2800 MHz | |
AMD Ryzen 7 9800X3D
R7 9800X3D, 4700 MHz | |
Intel Core i5-12400F
i5-12400F, 2500 MHz | |
AMD Ryzen 5 9600X
Ryzen 5 9600X, 3900 MHz | |
AMD Ryzen 9 5950X
R9 5950X, 3400 MHz | |
Intel Core Ultra 5 235
Ultra 5 235, 3400 MHz | |
AMD Ryzen 9 9950X
Ryzen 9 9950X, 4300 MHz | |
AMD Ryzen 7 9700X
Ryzen 7 9700X, 3800 MHz | |
Intel Core Ultra 5 245K
Ultra 5 245K, 3600 MHz | |
Intel Core Ultra 5 245K
Ultra 5 245K, 3600 MHz | |
AMD Ryzen 7 7745HX
R7 7745HX, 3600 MHz | |
AMD Ryzen 7 7800X3D
R7 7800X3D, 4200 MHz | |
Intel Core i9-12900K
i9-12900K, 3200 MHz | |
Intel Core Ultra 5 225F
Ultra 5 225F, 3300 MHz | |
Intel Core i5-13400
i5-13400, 2500 MHz | |
AMD Ryzen 9 7950X3D
R9 7950X3D, 4200 MHz | |
AMD Ryzen 5 7600X
R5 7600X, 4700 MHz | |
Intel Core i9-13900K
i9-13900K, 3000 MHz | |
Intel Core Ultra 9 285K
Ultra 9 285K, 3200 MHz | |
AMD Ryzen 9 7950X
R9 7950X, 4500 MHz | |
Intel Core i5-13600K
i5-13600K, 3500 MHz | |
AMD Ryzen 9 7900X
R9 7900X, 4700 MHz | |
Intel Core i9-14900K
i9-14900K, 3200 MHz | |
Intel Core i5-14600K
i5-14600K, 3500 MHz | |
|
AMD Ryzen 9 9950X
Ryzen 9 9950X, 4300 MHz | |
AMD Ryzen 7 9700X
Ryzen 7 9700X, 3800 MHz | |
AMD Ryzen 9 7950X3D
R9 7950X3D, 4200 MHz | |
Intel Core i9-14900K
i9-14900K, 3200 MHz | |
Intel Core Ultra 9 285K
Ultra 9 285K, 3200 MHz | |
AMD Ryzen 9 7900X
R9 7900X, 4700 MHz | |
AMD Ryzen 9 7950X
R9 7950X, 4500 MHz | |
AMD Ryzen 5 9600X
Ryzen 5 9600X, 3900 MHz | |
AMD Ryzen 5 7600X
R5 7600X, 4700 MHz | |
Intel Core i9-13900K
i9-13900K, 3000 MHz | |
Intel Core i5-14600K
i5-14600K, 3500 MHz | |
AMD Ryzen 7 7800X3D
R7 7800X3D, 4200 MHz | |
AMD Ryzen 7 9800X3D
R7 9800X3D, 4700 MHz | |
AMD Ryzen 7 7745HX
R7 7745HX, 3600 MHz | |
Intel Core Ultra 5 245K
Ultra 5 245K, 3600 MHz | |
Intel Core i5-13600K
i5-13600K, 3500 MHz | |
Intel Core Ultra 5 235
Ultra 5 235, 3400 MHz | |
Intel Core i9-12900K
i9-12900K, 3200 MHz | |
Intel Core Ultra 5 225F
Ultra 5 225F, 3300 MHz | |
Intel Core i5-13400
i5-13400, 2500 MHz | |
Intel Core i5-12600K
i5-12600K, 2800 MHz | |
AMD Ryzen 9 5950X
R9 5950X, 3400 MHz | |
Intel Core i5-12400F
i5-12400F, 2500 MHz | |
|
Intel Core i5-12400F
i5-12400F, 2500 MHz | |
AMD Ryzen 9 5950X
R9 5950X, 3400 MHz | |
Intel Core i5-13400
i5-13400, 2500 MHz | |
Intel Core i5-12600K
i5-12600K, 2800 MHz | |
AMD Ryzen 7 7800X3D
R7 7800X3D, 4200 MHz | |
Intel Core i9-12900K
i9-12900K, 3200 MHz | |
AMD Ryzen 7 7745HX
R7 7745HX, 3600 MHz | |
Intel Core i5-13600K
i5-13600K, 3500 MHz | |
Intel Core Ultra 5 225F
Ultra 5 225F, 3300 MHz | |
Intel Core i5-14600K
i5-14600K, 3500 MHz | |
AMD Ryzen 5 7600X
R5 7600X, 4700 MHz | |
AMD Ryzen 9 7950X3D
R9 7950X3D, 4200 MHz | |
Intel Core Ultra 5 235
Ultra 5 235, 3400 MHz | |
AMD Ryzen 9 7950X
R9 7950X, 4500 MHz | |
Intel Core i9-13900K
i9-13900K, 3000 MHz | |
AMD Ryzen 9 7900X
R9 7900X, 4700 MHz | |
Intel Core Ultra 5 245K
Ultra 5 245K, 3600 MHz | |
Intel Core i9-14900K
i9-14900K, 3200 MHz | |
AMD Ryzen 7 9800X3D
R7 9800X3D, 4700 MHz | |
Intel Core Ultra 9 285K
Ultra 9 285K, 3200 MHz | |
AMD Ryzen 5 9600X
Ryzen 5 9600X, 3900 MHz | |
AMD Ryzen 7 9700X
Ryzen 7 9700X, 3800 MHz | |
AMD Ryzen 9 9950X
Ryzen 9 9950X, 4300 MHz | |
|
|
Intel Core i9-14900K
i9-14900K, 3200 MHz | |
Intel Core i9-13900K
i9-13900K, 3000 MHz | |
Intel Core Ultra 9 285K
Ultra 9 285K, 3200 MHz | |
AMD Ryzen 9 9950X
Ryzen 9 9950X, 4300 MHz | |
AMD Ryzen 9 7950X3D
R9 7950X3D, 4200 MHz | |
AMD Ryzen 9 7900X
R9 7900X, 4700 MHz | |
AMD Ryzen 9 7950X
R9 7950X, 4500 MHz | |
Intel Core i5-14600K
i5-14600K, 3500 MHz | |
AMD Ryzen 7 9800X3D
R7 9800X3D, 4700 MHz | |
AMD Ryzen 9 5950X
R9 5950X, 3400 MHz | |
Intel Core i9-12900K
i9-12900K, 3200 MHz | |
Intel Core Ultra 5 245K
Ultra 5 245K, 3600 MHz | |
AMD Ryzen 7 9700X
Ryzen 7 9700X, 3800 MHz | |
Intel Core Ultra 5 235
Ultra 5 235, 3400 MHz | |
Intel Core i5-13600K
i5-13600K, 3500 MHz | |
AMD Ryzen 5 9600X
Ryzen 5 9600X, 3900 MHz | |
AMD Ryzen 7 7800X3D
R7 7800X3D, 4200 MHz | |
Intel Core Ultra 5 225F
Ultra 5 225F, 3300 MHz | |
AMD Ryzen 5 7600X
R5 7600X, 4700 MHz | |
Intel Core i5-12600K
i5-12600K, 2800 MHz | |
Intel Core i5-13400
i5-13400, 2500 MHz | |
Intel Core i5-12400F
i5-12400F, 2500 MHz | |
AMD Ryzen 7 7745HX
R7 7745HX, 3600 MHz | |
|
Intel Core i9-14900K
i9-14900K, 3200 MHz | |
Intel Core i9-13900K
i9-13900K, 3000 MHz | |
Intel Core i5-14600K
i5-14600K, 3500 MHz | |
Intel Core i9-12900K
i9-12900K, 3200 MHz | |
Intel Core Ultra 9 285K
Ultra 9 285K, 3200 MHz | |
AMD Ryzen 9 7950X3D
R9 7950X3D, 4200 MHz | |
Intel Core i5-13600K
i5-13600K, 3500 MHz | |
AMD Ryzen 9 7900X
R9 7900X, 4700 MHz | |
AMD Ryzen 9 7950X
R9 7950X, 4500 MHz | |
AMD Ryzen 7 9800X3D
R7 9800X3D, 4700 MHz | |
Intel Core Ultra 5 235
Ultra 5 235, 3400 MHz | |
AMD Ryzen 9 9950X
Ryzen 9 9950X, 4300 MHz | |
Intel Core Ultra 5 245K
Ultra 5 245K, 3600 MHz | |
AMD Ryzen 7 9700X
Ryzen 7 9700X, 3800 MHz | |
AMD Ryzen 7 7800X3D
R7 7800X3D, 4200 MHz | |
Intel Core i5-12600K
i5-12600K, 2800 MHz | |
AMD Ryzen 9 5950X
R9 5950X, 3400 MHz | |
Intel Core i5-13400
i5-13400, 2500 MHz | |
Intel Core Ultra 5 225F
Ultra 5 225F, 3300 MHz | |
AMD Ryzen 7 7745HX
R7 7745HX, 3600 MHz | |
AMD Ryzen 5 9600X
Ryzen 5 9600X, 3900 MHz | |
AMD Ryzen 5 7600X
R5 7600X, 4700 MHz | |
Intel Core i5-12400F
i5-12400F, 2500 MHz | |
|
Intel Core i5-12400F
i5-12400F, 2500 MHz | |
Intel Core i5-13400
i5-13400, 2500 MHz | |
AMD Ryzen 7 9800X3D
R7 9800X3D, 4700 MHz | |
Intel Core Ultra 5 225F
Ultra 5 225F, 3300 MHz | |
Intel Core Ultra 5 235
Ultra 5 235, 3400 MHz | |
AMD Ryzen 5 9600X
Ryzen 5 9600X, 3900 MHz | |
AMD Ryzen 7 9700X
Ryzen 7 9700X, 3800 MHz | |
AMD Ryzen 5 7600X
R5 7600X, 4700 MHz | |
Intel Core i5-12600K
i5-12600K, 2800 MHz | |
AMD Ryzen 9 9950X
Ryzen 9 9950X, 4300 MHz | |
Intel Core Ultra 5 245K
Ultra 5 245K, 3600 MHz | |
AMD Ryzen 7 7800X3D
R7 7800X3D, 4200 MHz | |
AMD Ryzen 9 5950X
R9 5950X, 3400 MHz | |
Intel Core i9-12900K
i9-12900K, 3200 MHz | |
AMD Ryzen 7 7745HX
R7 7745HX, 3600 MHz | |
Intel Core Ultra 9 285K
Ultra 9 285K, 3200 MHz | |
Intel Core i5-13600K
i5-13600K, 3500 MHz | |
Intel Core i5-14600K
i5-14600K, 3500 MHz | |
AMD Ryzen 9 7900X
R9 7900X, 4700 MHz | |
AMD Ryzen 9 7950X3D
R9 7950X3D, 4200 MHz | |
AMD Ryzen 9 7950X
R9 7950X, 4500 MHz | |
Intel Core i9-13900K
i9-13900K, 3000 MHz | |
Intel Core i9-14900K
i9-14900K, 3200 MHz | |
|
Intel Core i5-12400F
i5-12400F, 2500 MHz | |
Intel Core i5-13400
i5-13400, 2500 MHz | |
AMD Ryzen 7 9800X3D
R7 9800X3D, 4700 MHz | |
Intel Core Ultra 5 225F
Ultra 5 225F, 3300 MHz | |
Intel Core Ultra 5 235
Ultra 5 235, 3400 MHz | |
Intel Core i5-12600K
i5-12600K, 2800 MHz | |
AMD Ryzen 5 9600X
Ryzen 5 9600X, 3900 MHz | |
AMD Ryzen 7 9700X
Ryzen 7 9700X, 3800 MHz | |
Intel Core Ultra 5 245K
Ultra 5 245K, 3600 MHz | |
AMD Ryzen 5 7600X
R5 7600X, 4700 MHz | |
AMD Ryzen 9 9950X
Ryzen 9 9950X, 4300 MHz | |
Intel Core i9-12900K
i9-12900K, 3200 MHz | |
AMD Ryzen 7 7800X3D
R7 7800X3D, 4200 MHz | |
AMD Ryzen 9 5950X
R9 5950X, 3400 MHz | |
Intel Core i5-13600K
i5-13600K, 3500 MHz | |
AMD Ryzen 7 7745HX
R7 7745HX, 3600 MHz | |
Intel Core Ultra 9 285K
Ultra 9 285K, 3200 MHz | |
Intel Core i5-14600K
i5-14600K, 3500 MHz | |
AMD Ryzen 9 7950X
R9 7950X, 4500 MHz | |
AMD Ryzen 9 7900X
R9 7900X, 4700 MHz | |
Intel Core i9-13900K
i9-13900K, 3000 MHz | |
AMD Ryzen 9 7950X3D
R9 7950X3D, 4200 MHz | |
Intel Core i9-14900K
i9-14900K, 3200 MHz | |
* ... Moindre est la valeur, meilleures sont les performances