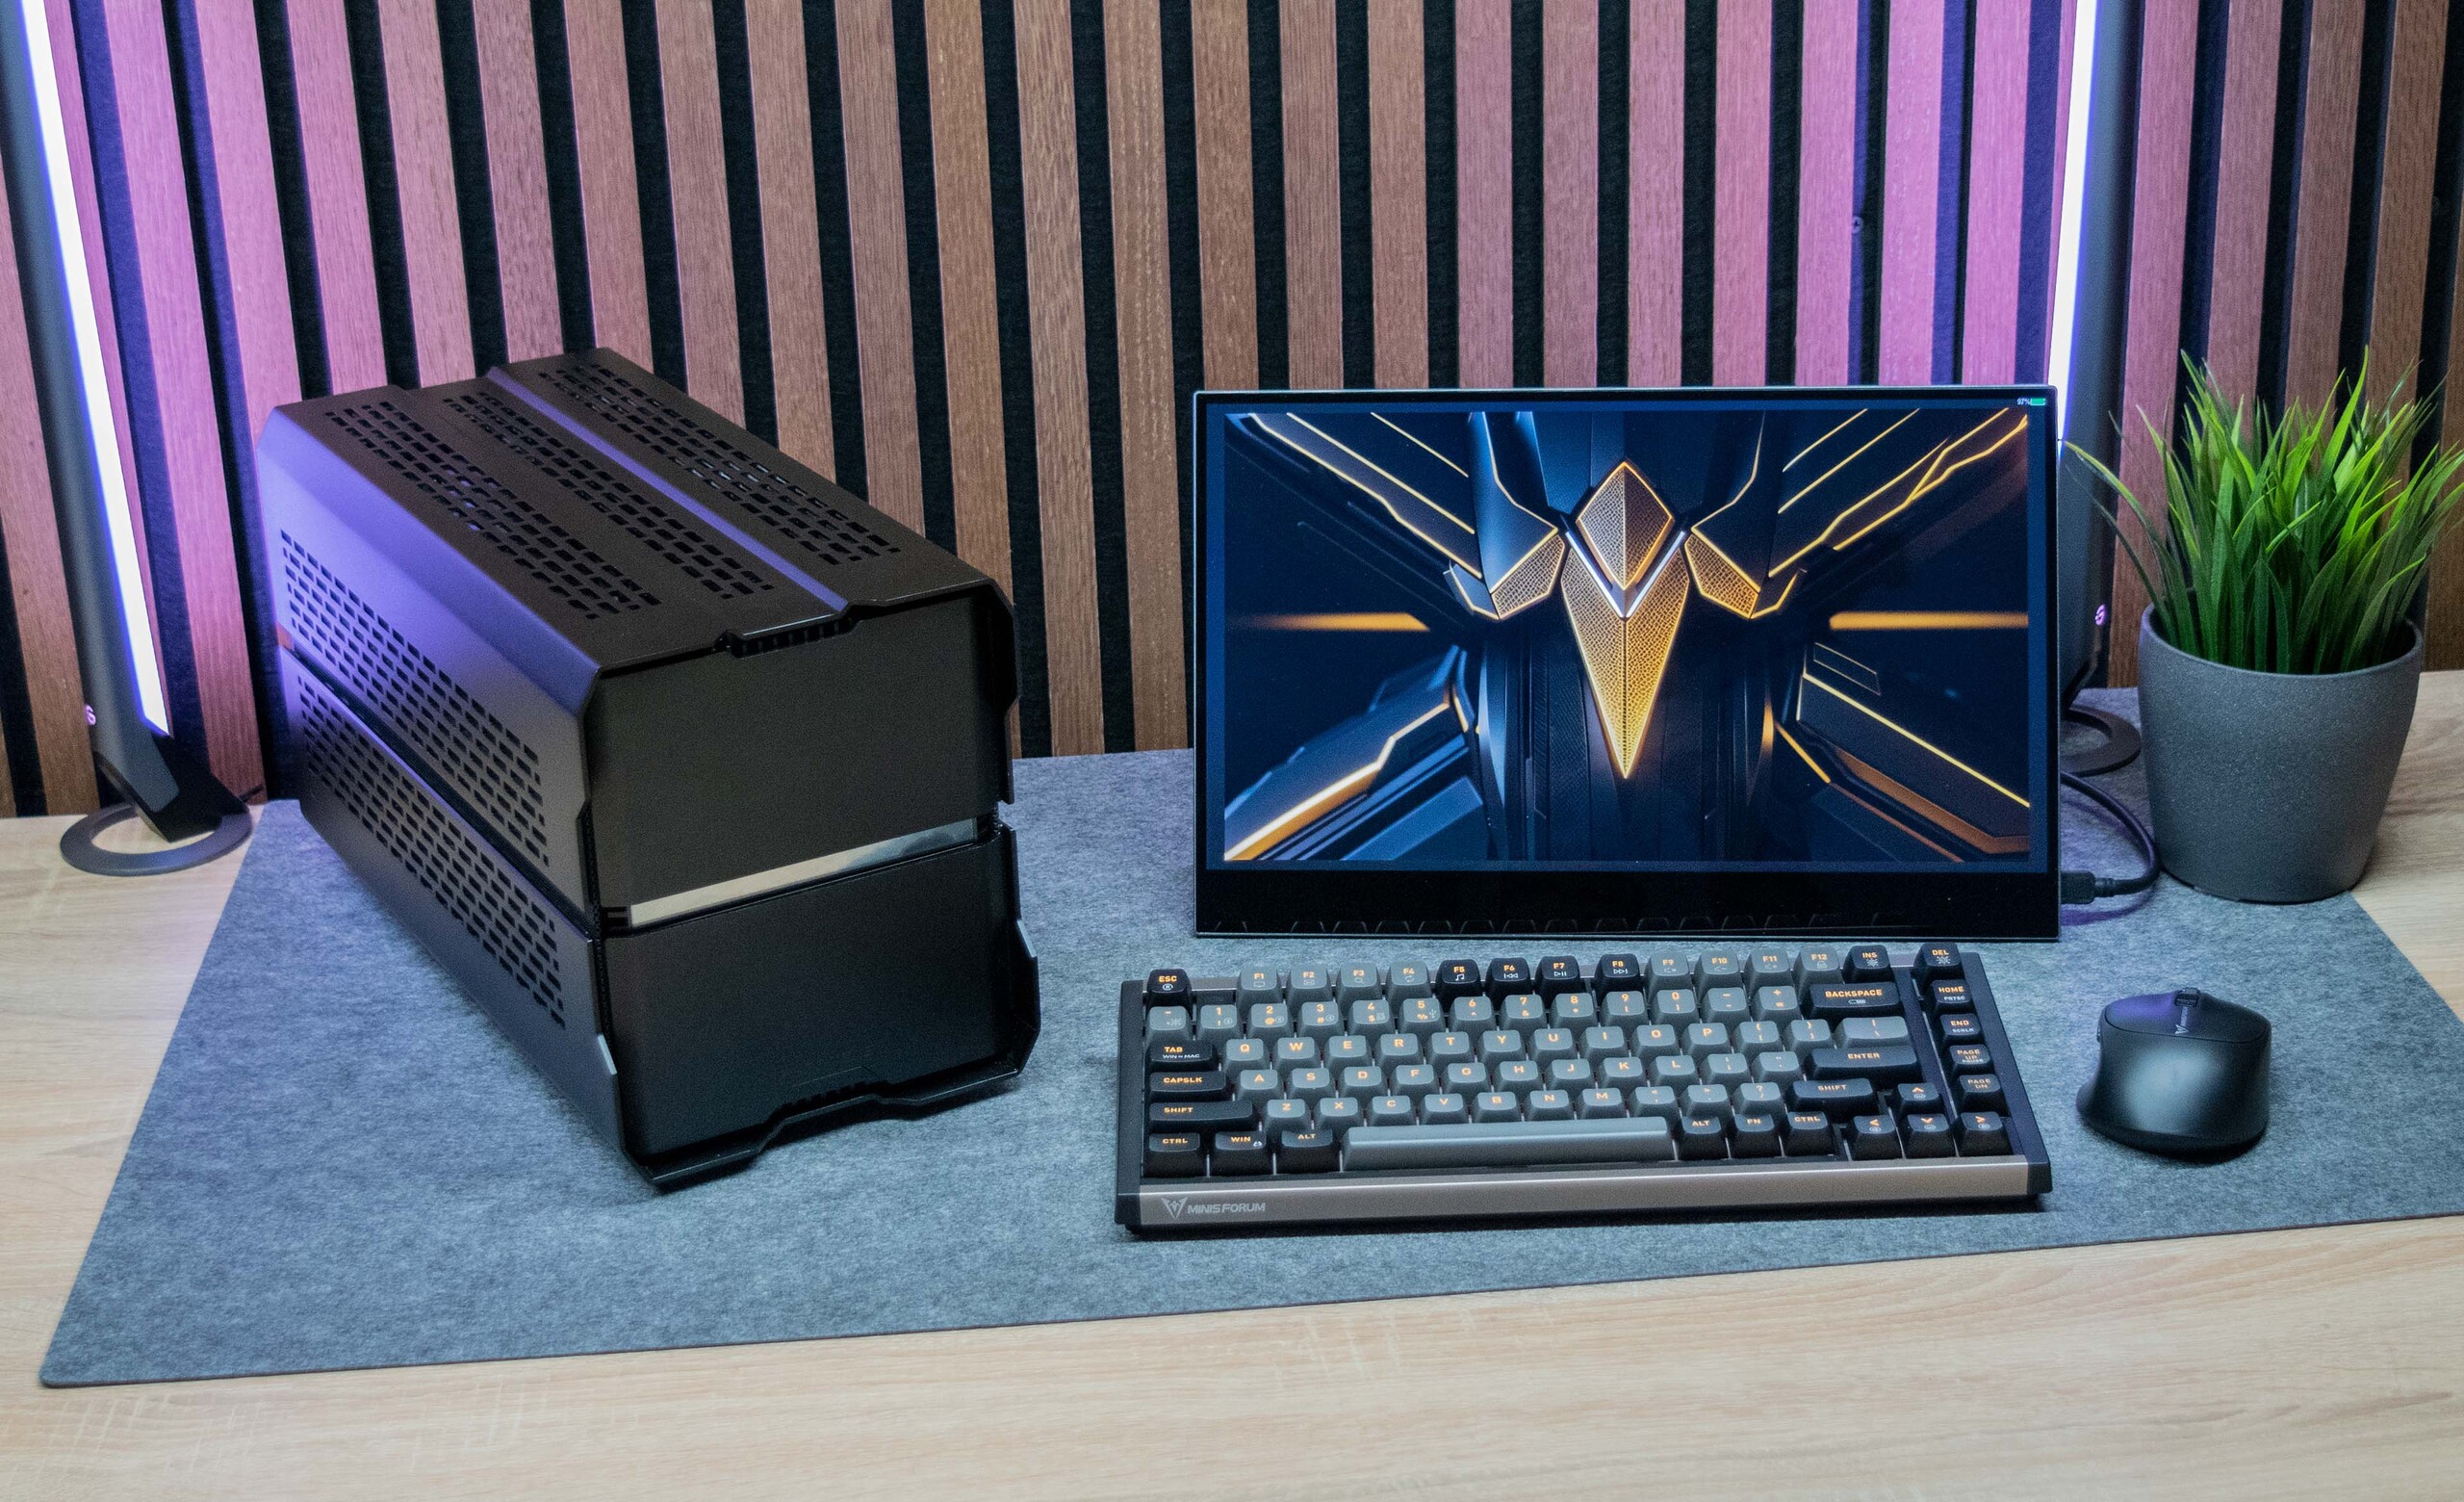
Test de la Minisforum BD770i : carte mère mini-ITX avec Ryzen 7 7745HX pour les petits PC de jeu
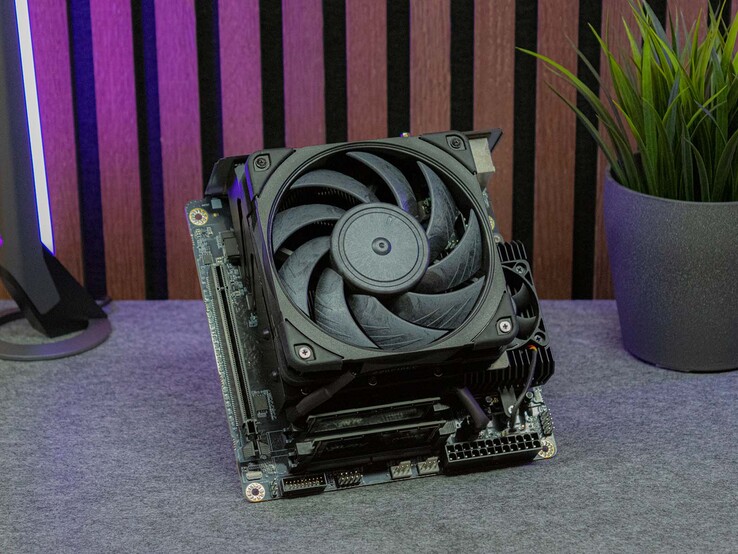
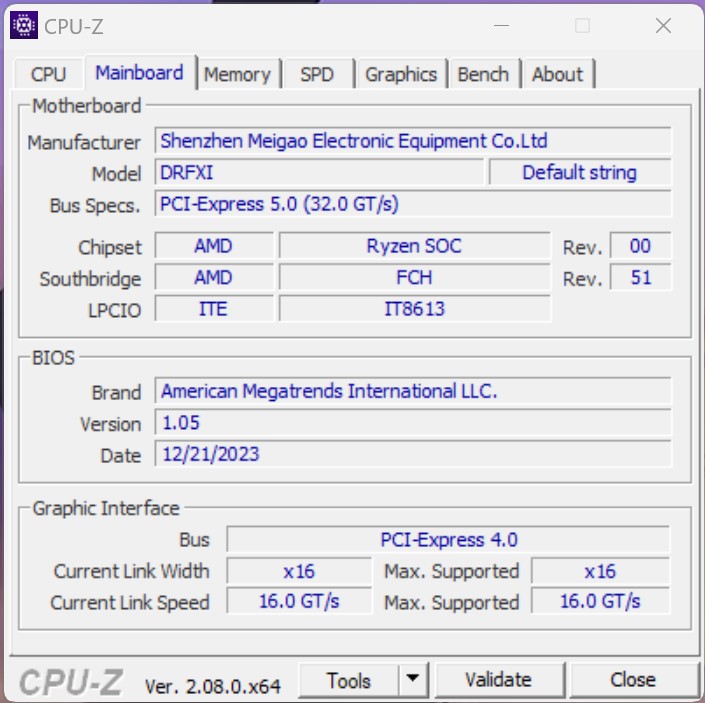
Minisforum, réputé pour ses mini-PC, s'engage sur un nouveau terrain avec la Minisforum BD770i en proposant une carte mère avec CPU soudé. Respectant le standard ITX comme facteur de forme, cette carte mère est compatible avec la plupart des boîtiers PC. Compte tenu de sa compacité, elle est susceptible de trouver des applications dans les très petits boîtiers Mini-ITX.
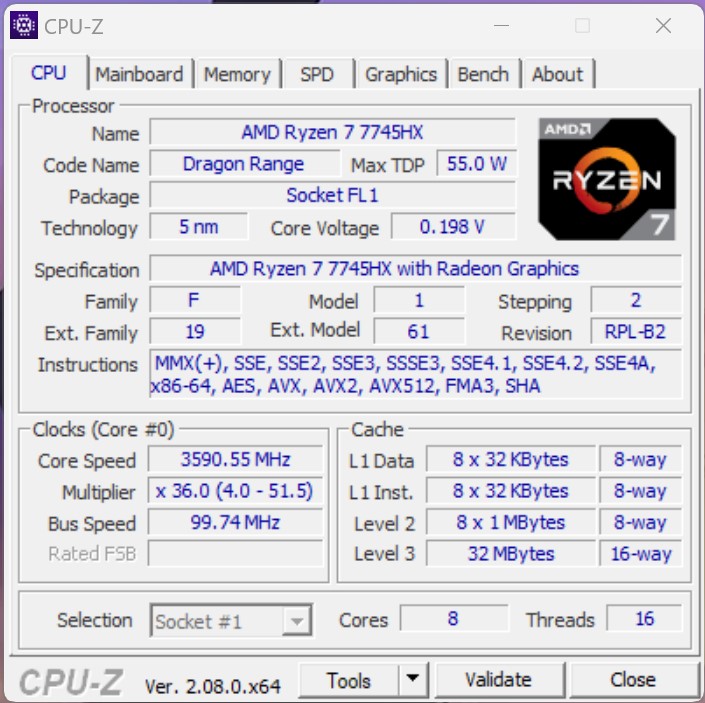
La BD770i est équipée d'un processeur
AMD Ryzen 7 7745HX doté de huit cœurs Zen4. Ce SoC est censé offrir des performances suffisantes pour gérer des tâches complexes. Nous nous sommes penchés sur les performances de jeu avec un processeur Nvidia RTX Nvidia GeForce RTX 4090la carte graphique peut fonctionner à plein régime grâce à l'emplacement PCIe x16. Minisforum propose actuellement cinq cartes mères différentes, chacune équipée d'un processeur issu du secteur des ordinateurs portables. Dans l'aperçu suivant, nous avons rassemblé des informations sur ces appareils, en soulignant leurs principales spécifications.Comparaison des cartes mères du Minisforum
| Nom | BD790i | BD770i | AR900i | AR650i | AD650i |
| CPU | AMD Ryzen 9 7945HX | AMD Ryzen 7 7745HX | Processeur Intel Core i9-13900HX | Intel Core i7-13650HX | Processeur Intel Core i7-13650HX |
| Cœurs / Threads | 16 / 32 | 8/ 16 | 24 / 32 | 14 / 20 | 14 / 20 |
| GPU | AMD Radeon 610M | AMD Radeon 610M | Intel UHD Graphics | Intel UHD Graphics | Intel UHD Graphics |
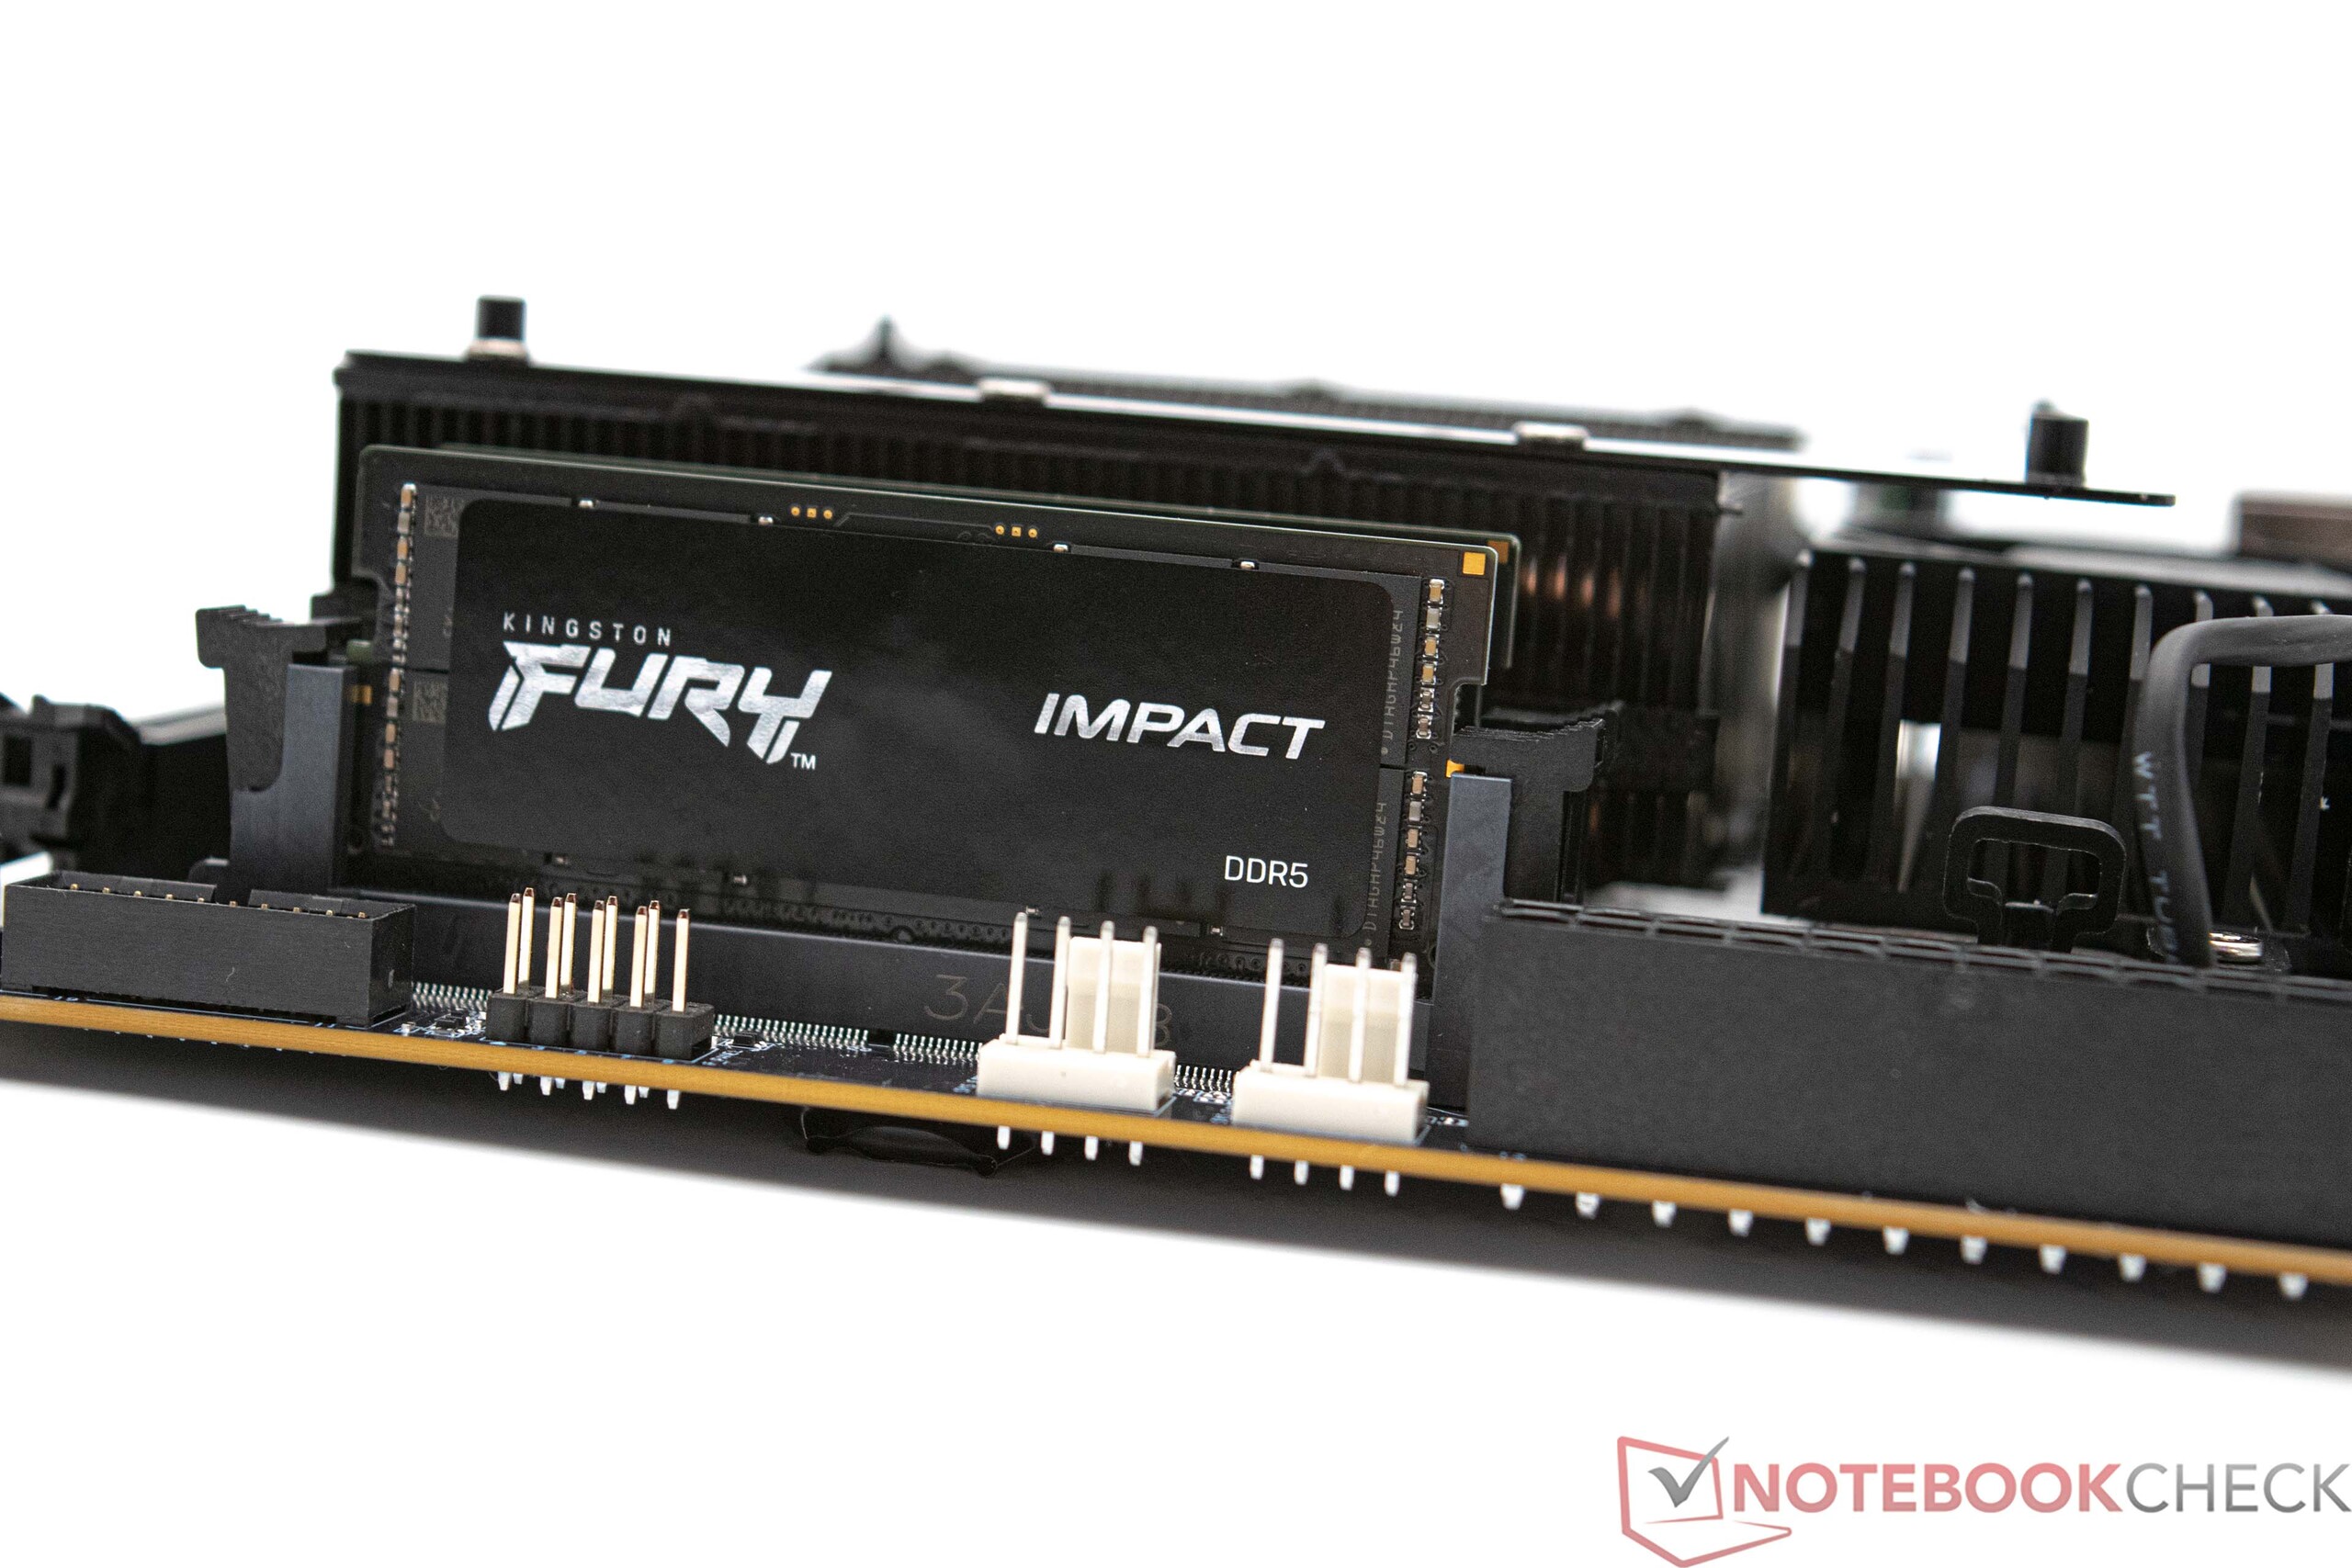
| Types de mémoire | DDR5-5200 SODIMM | DDR5-5200SODIMM | DDR5-5600 SODIMM | DDR5-5600 SODIMM | DDR5-5600 SODIMM |
| Taille maximale de la mémoire | 96GB | 64GB | 64 GB | 64 GB | 64 GB |
Minisforum BD770i et le système de test en détail

Cas et configuration de l'essai
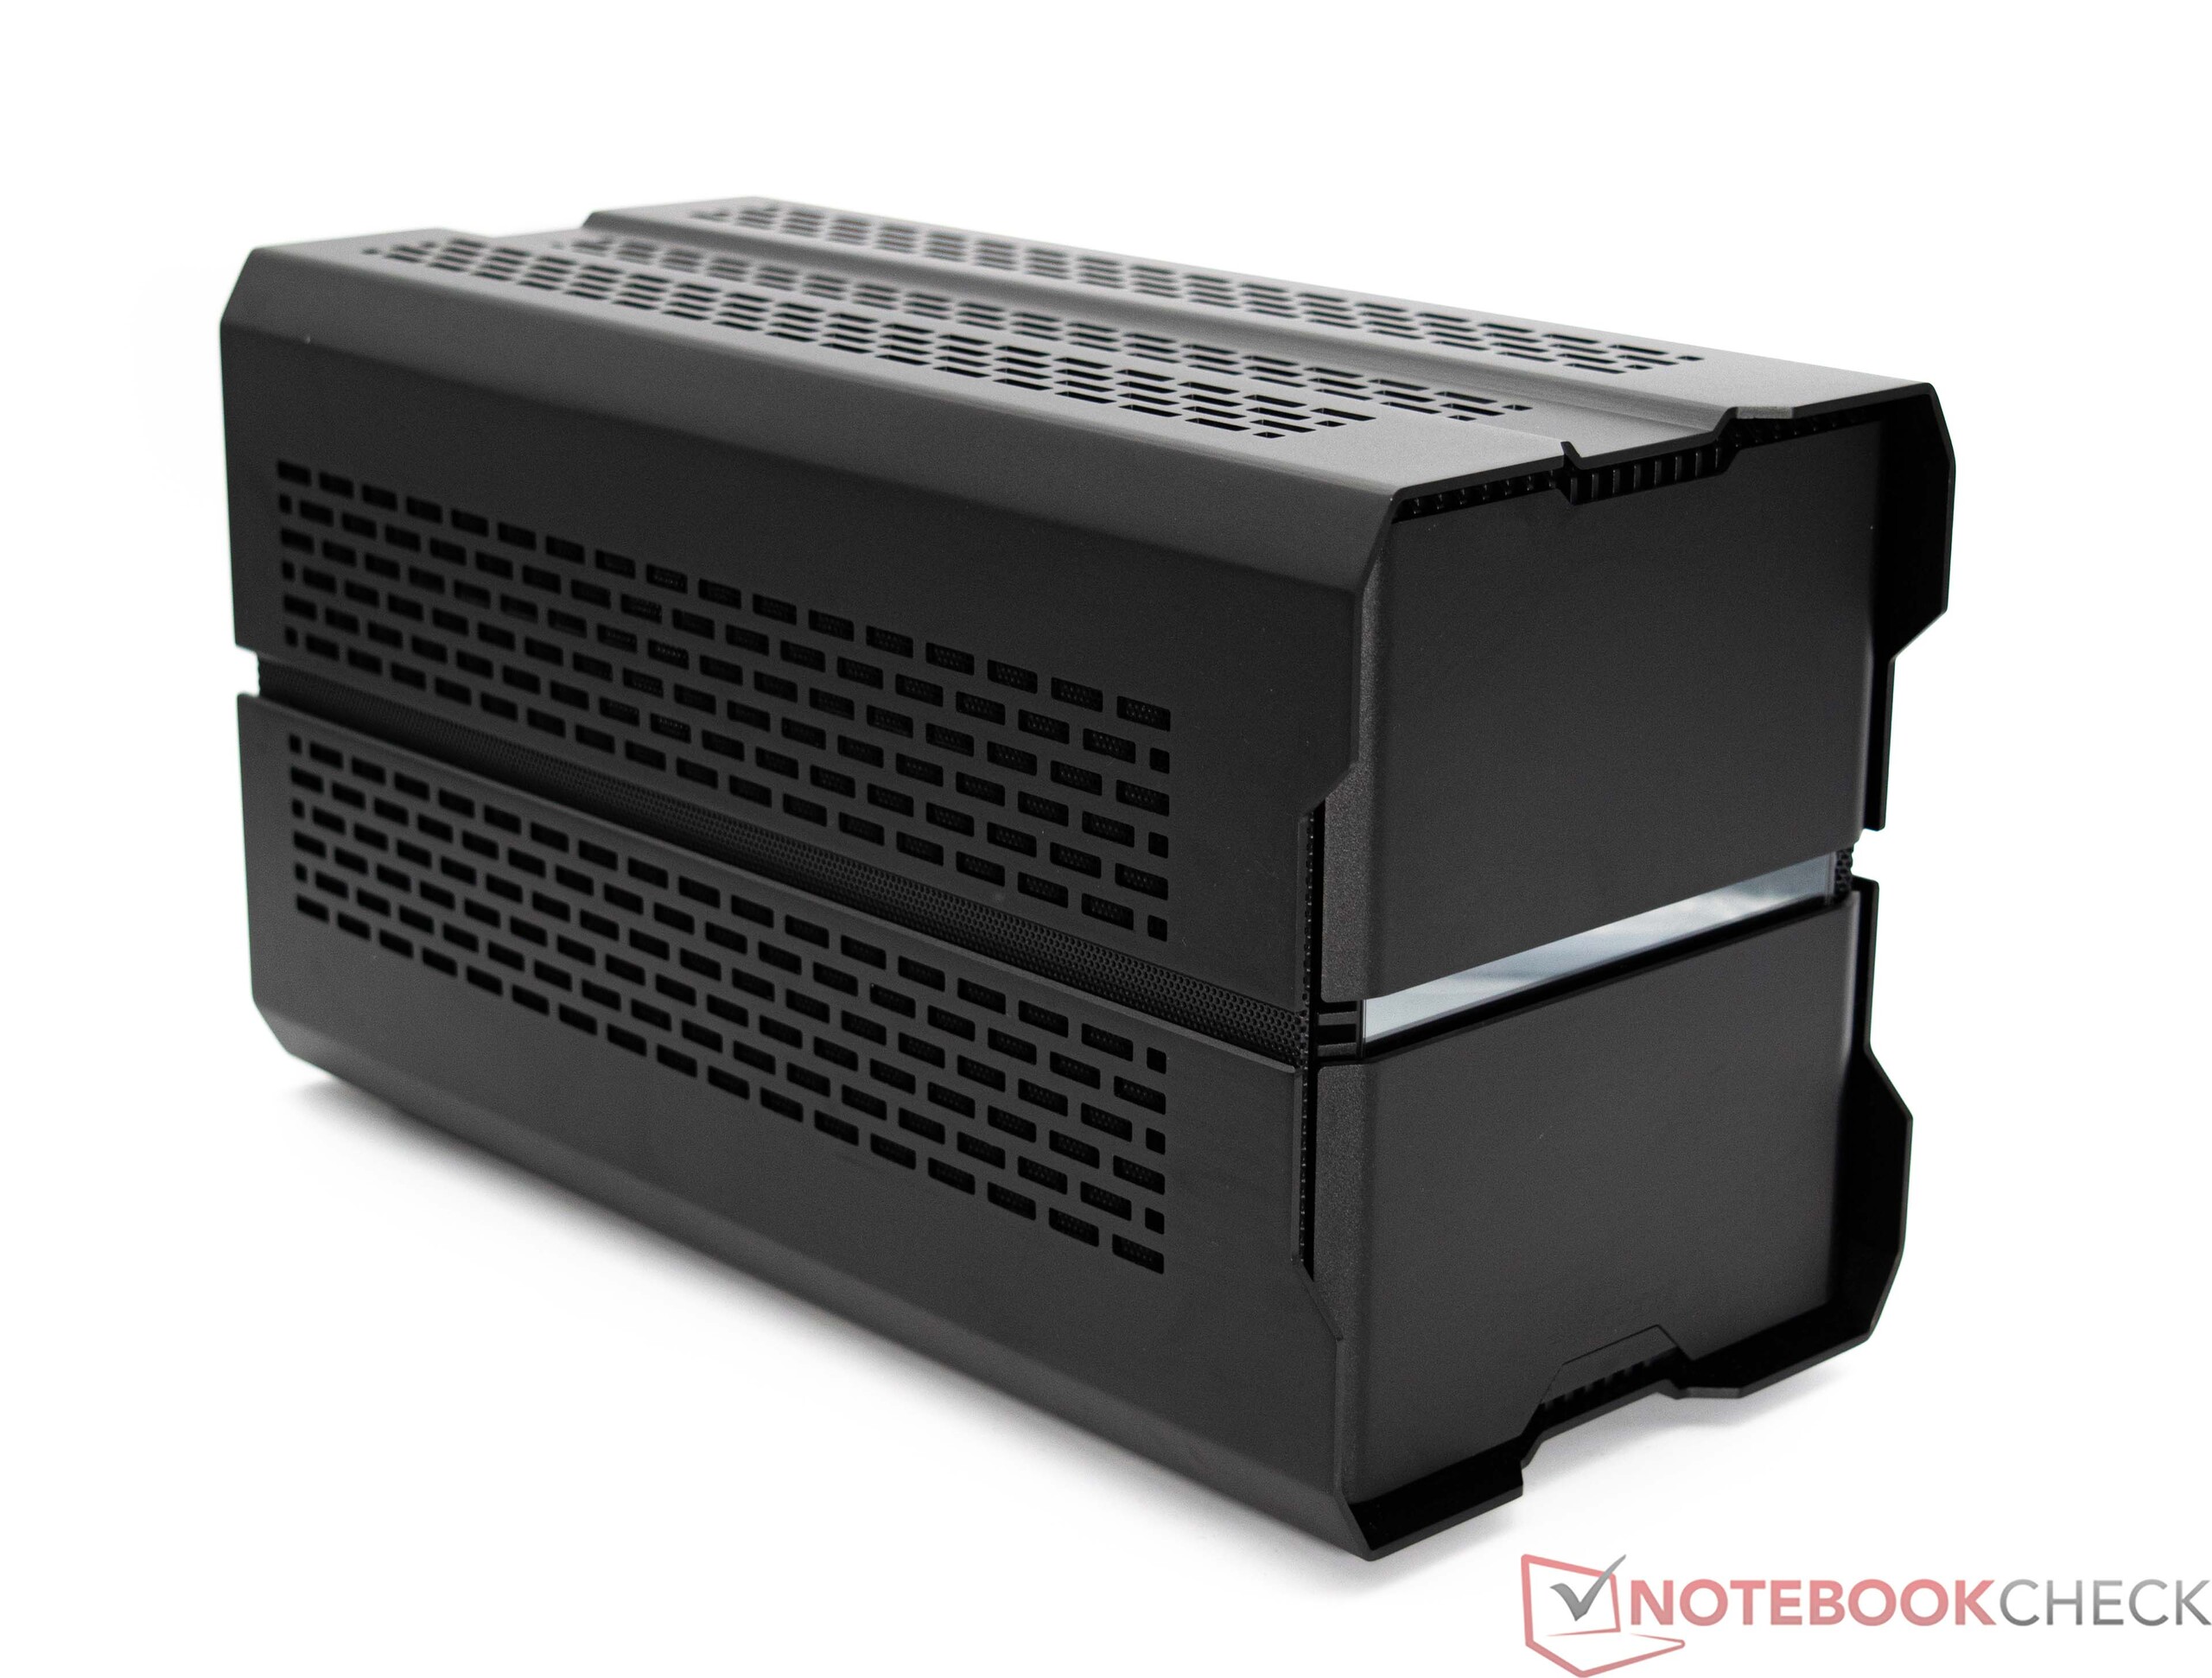
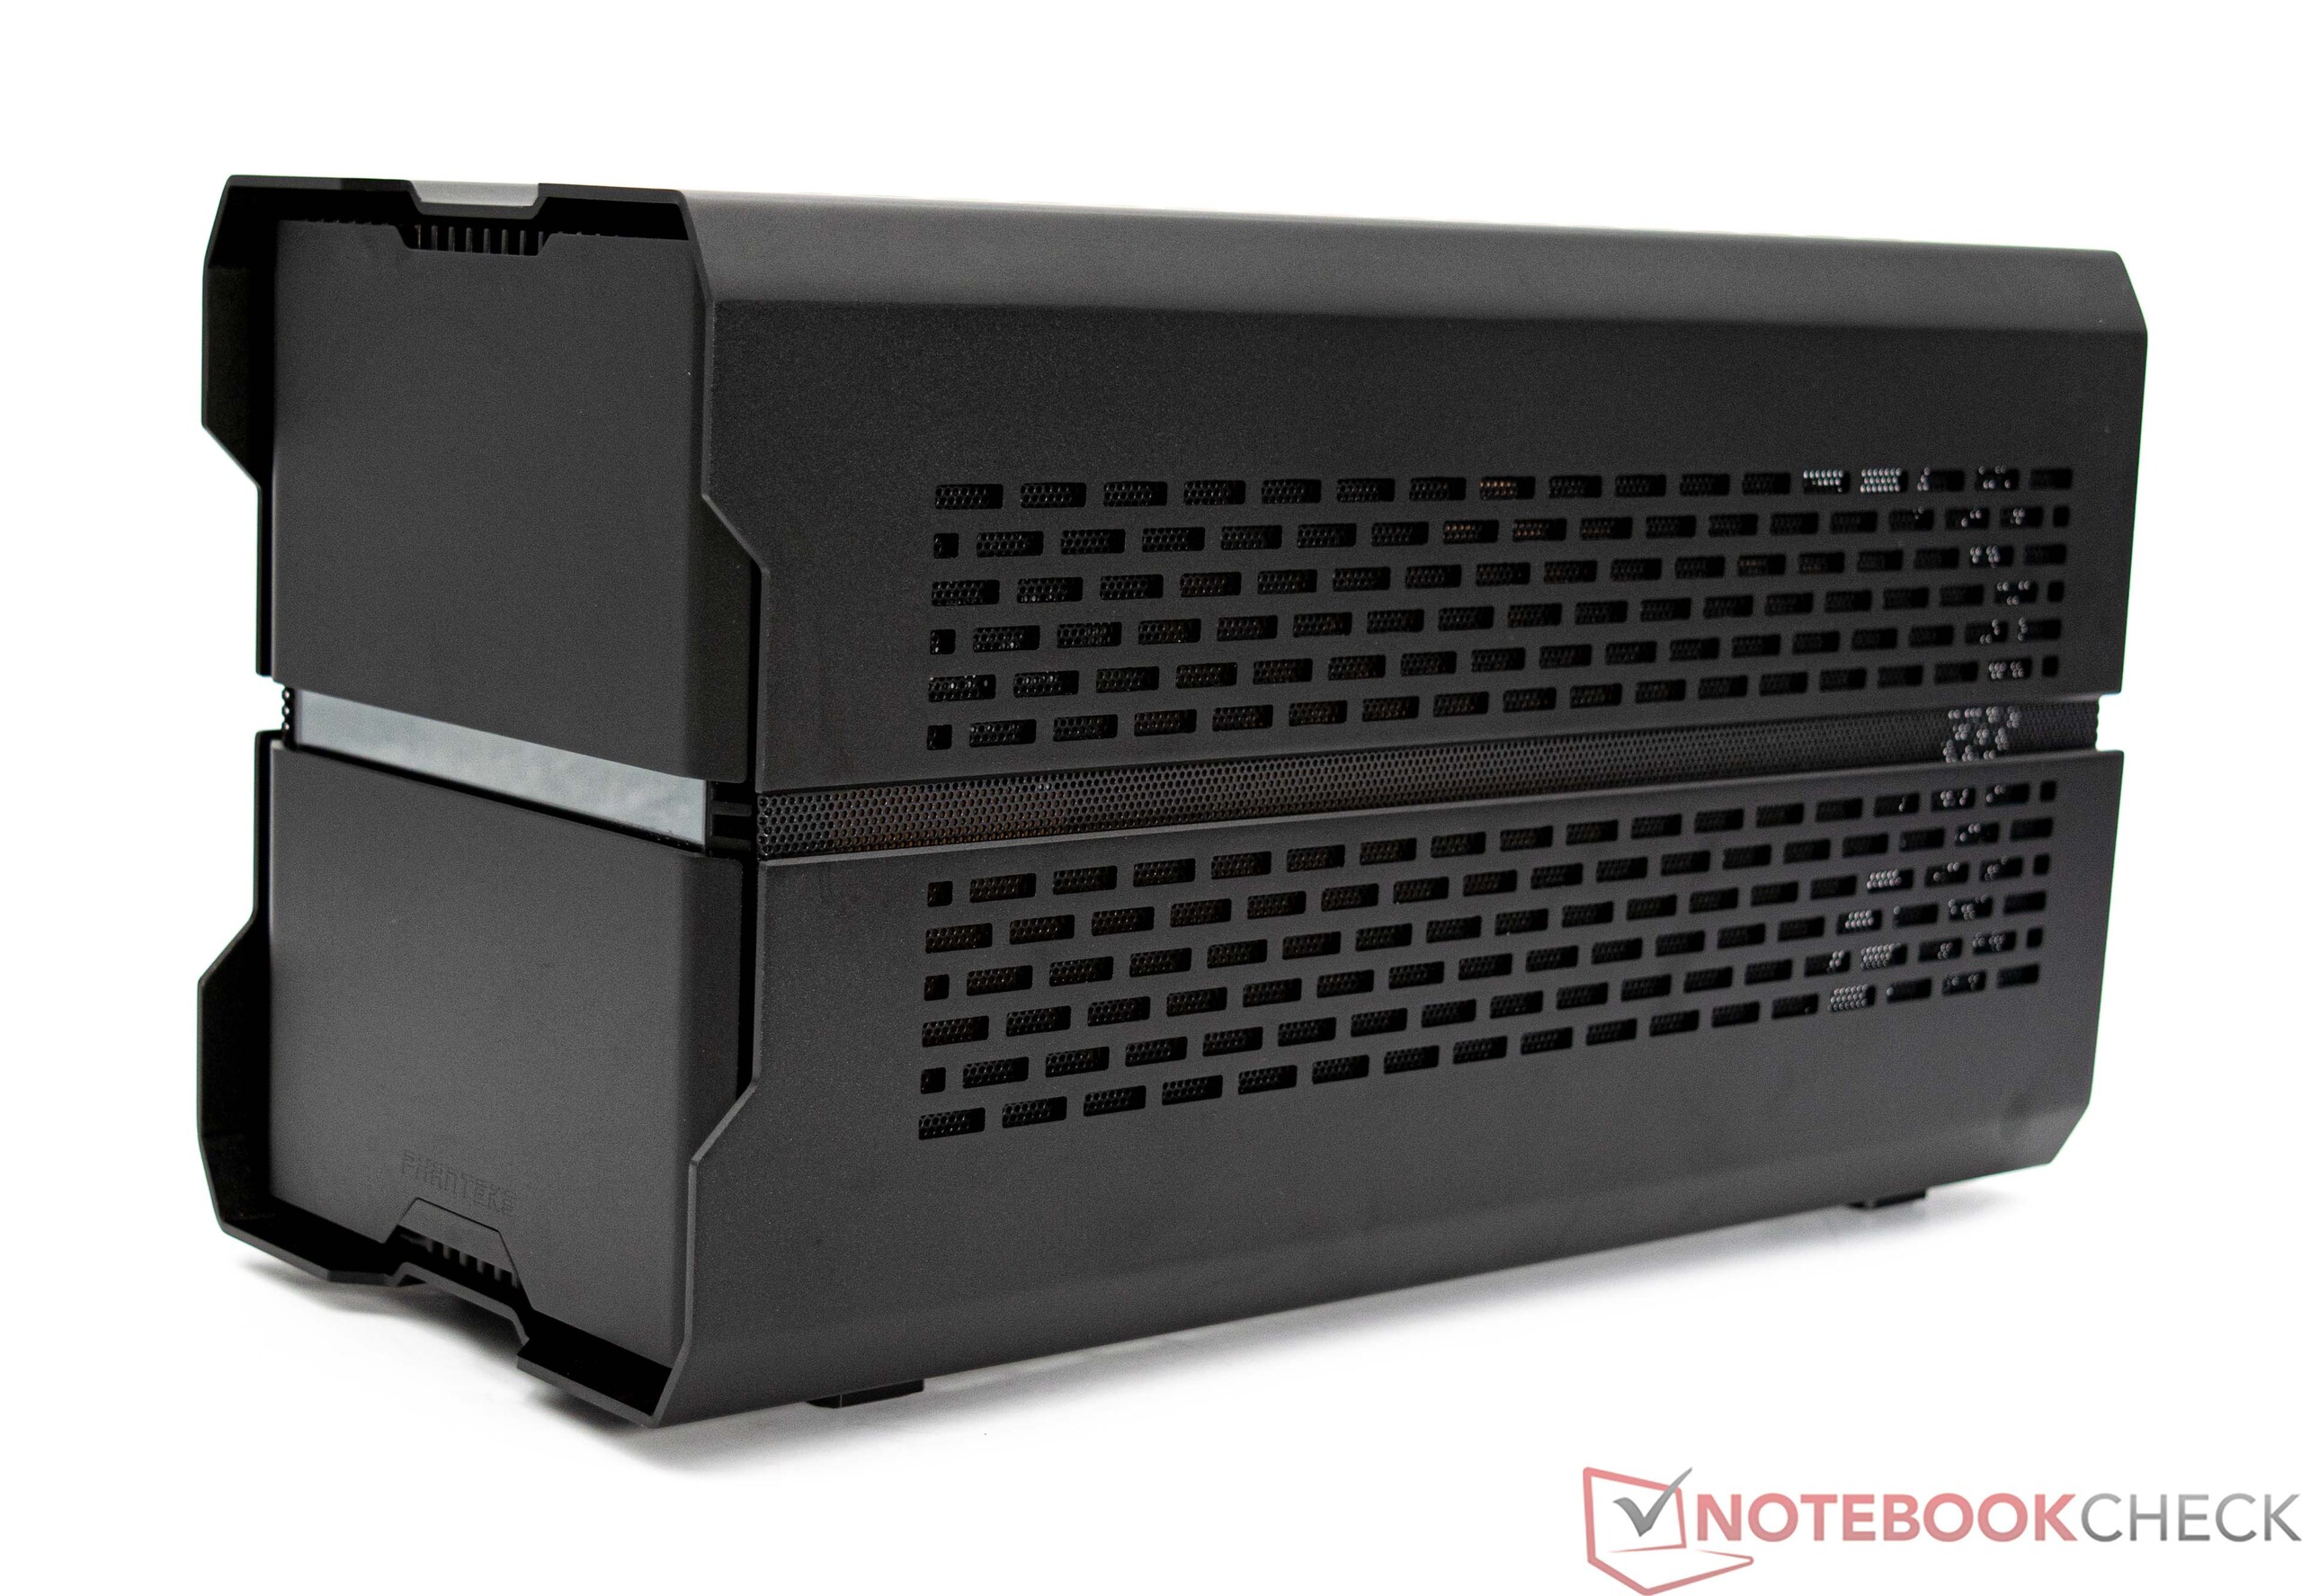
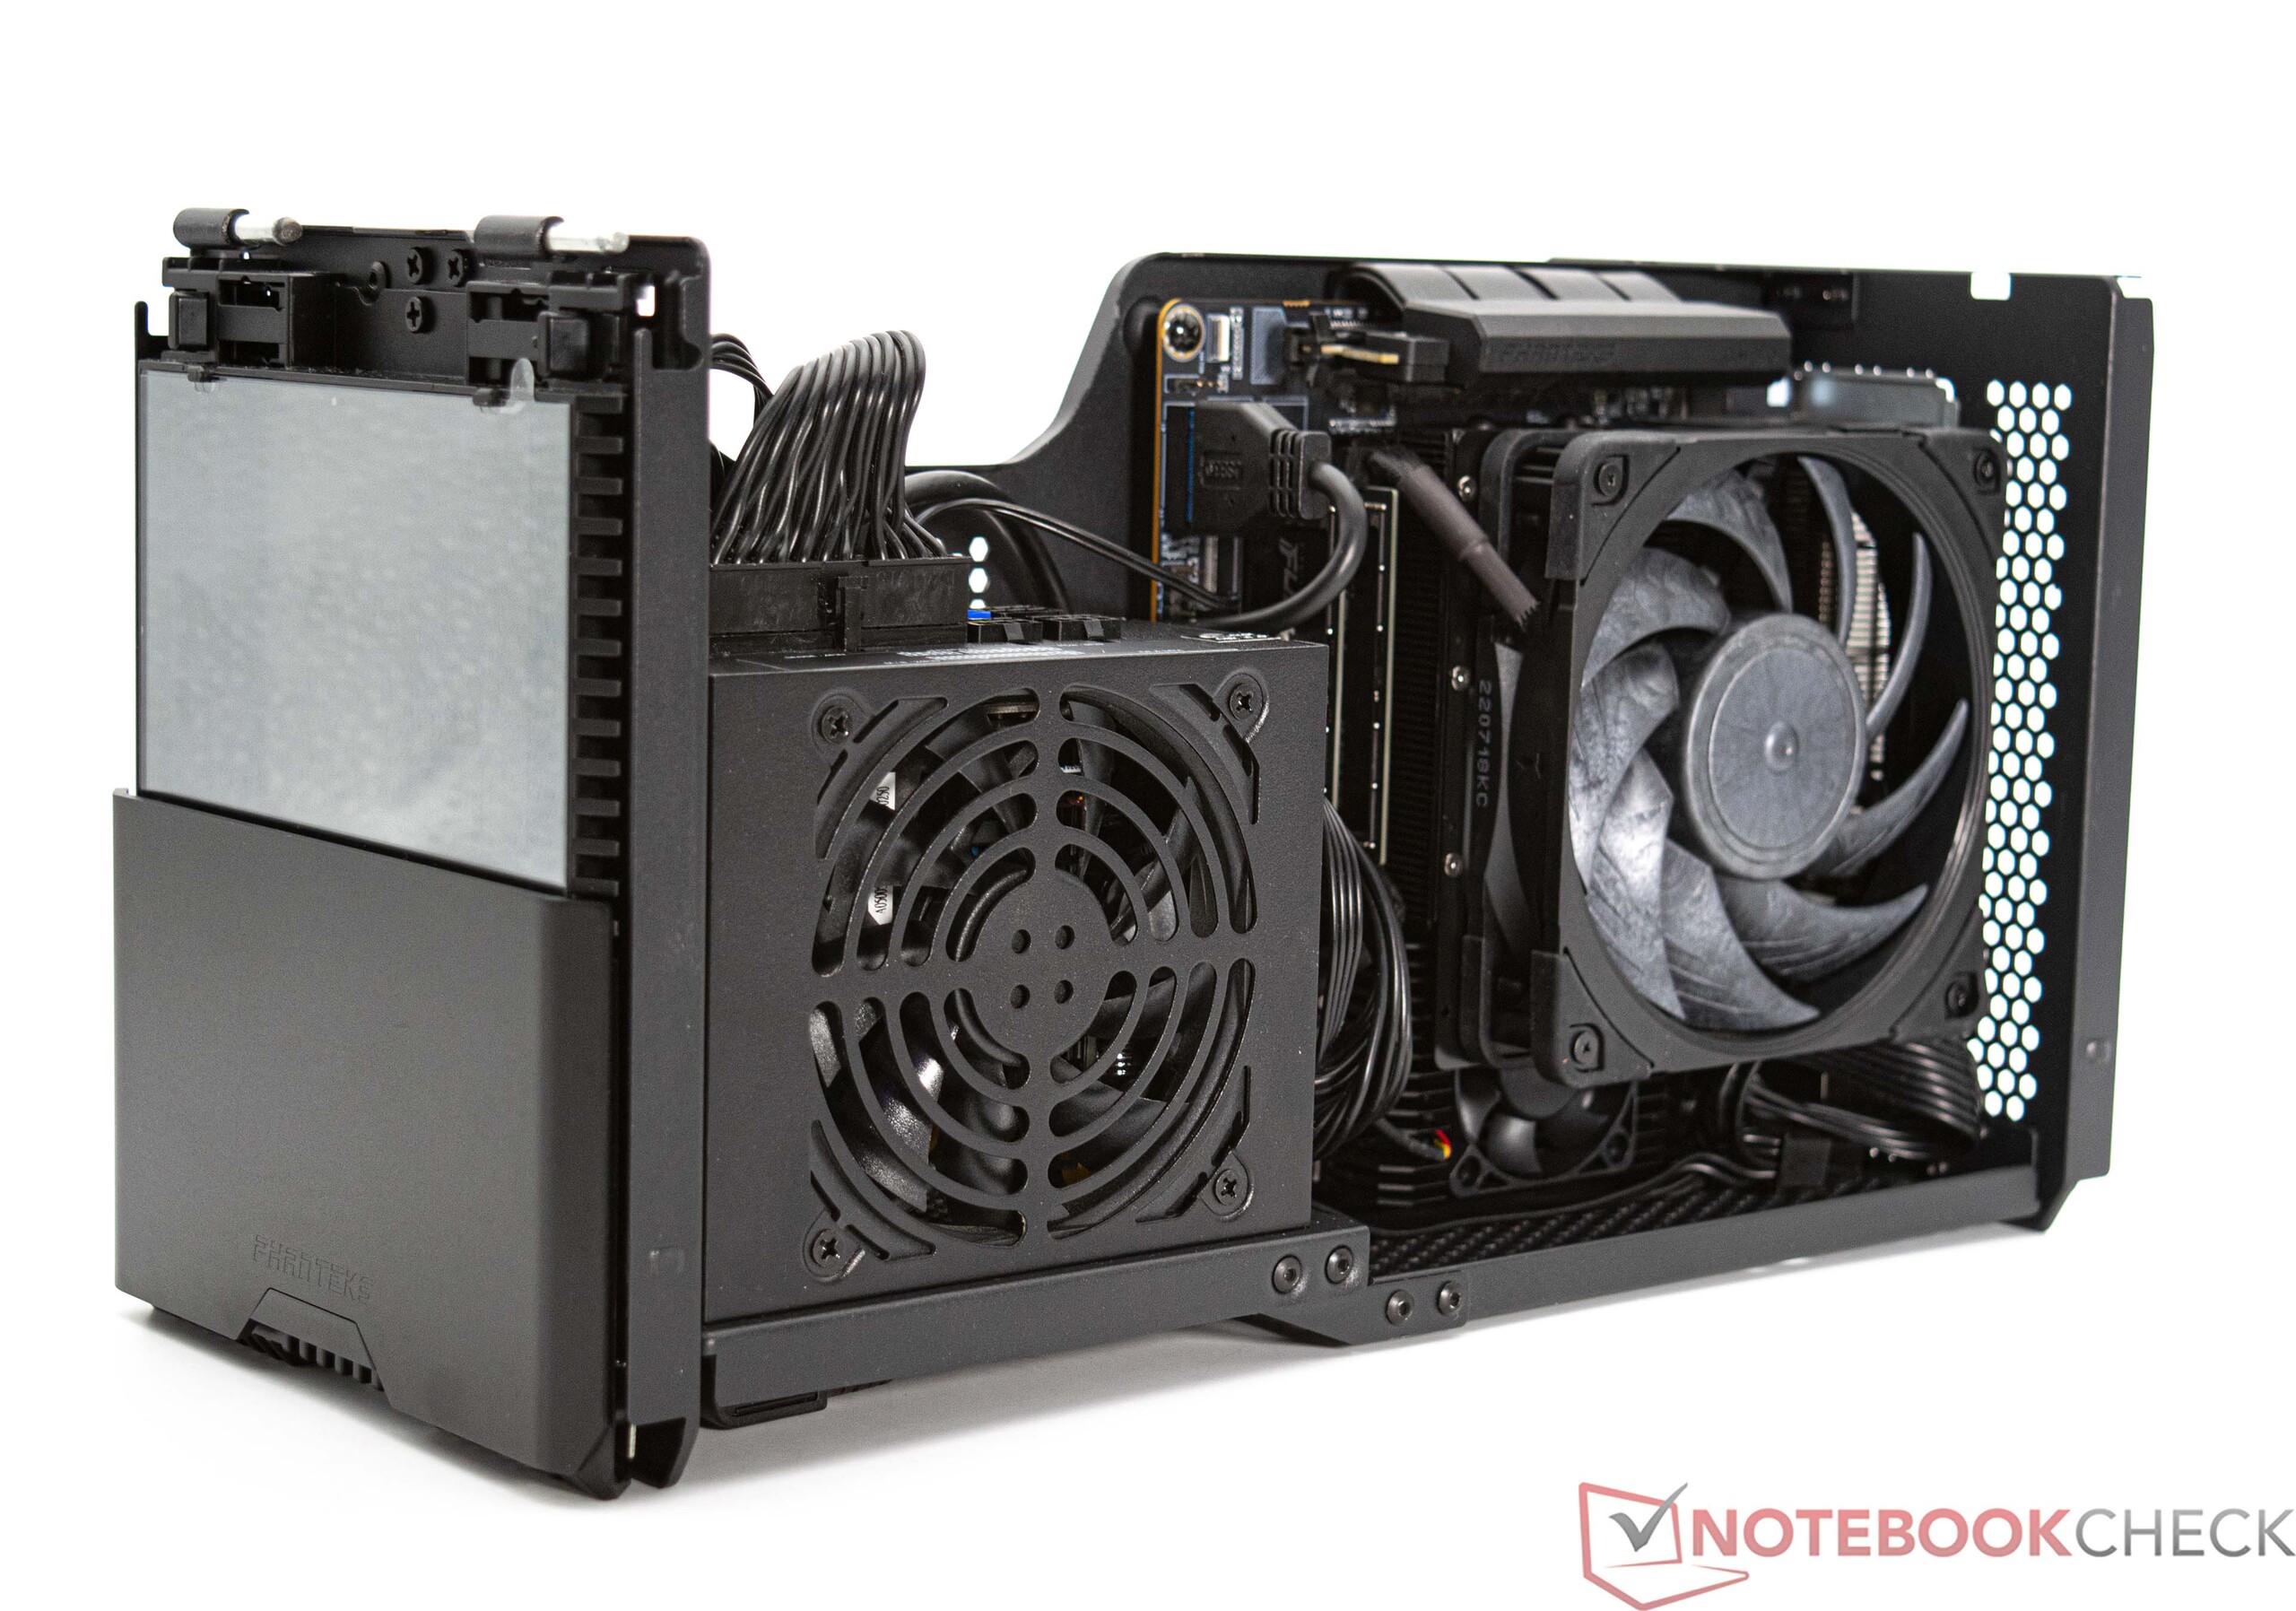
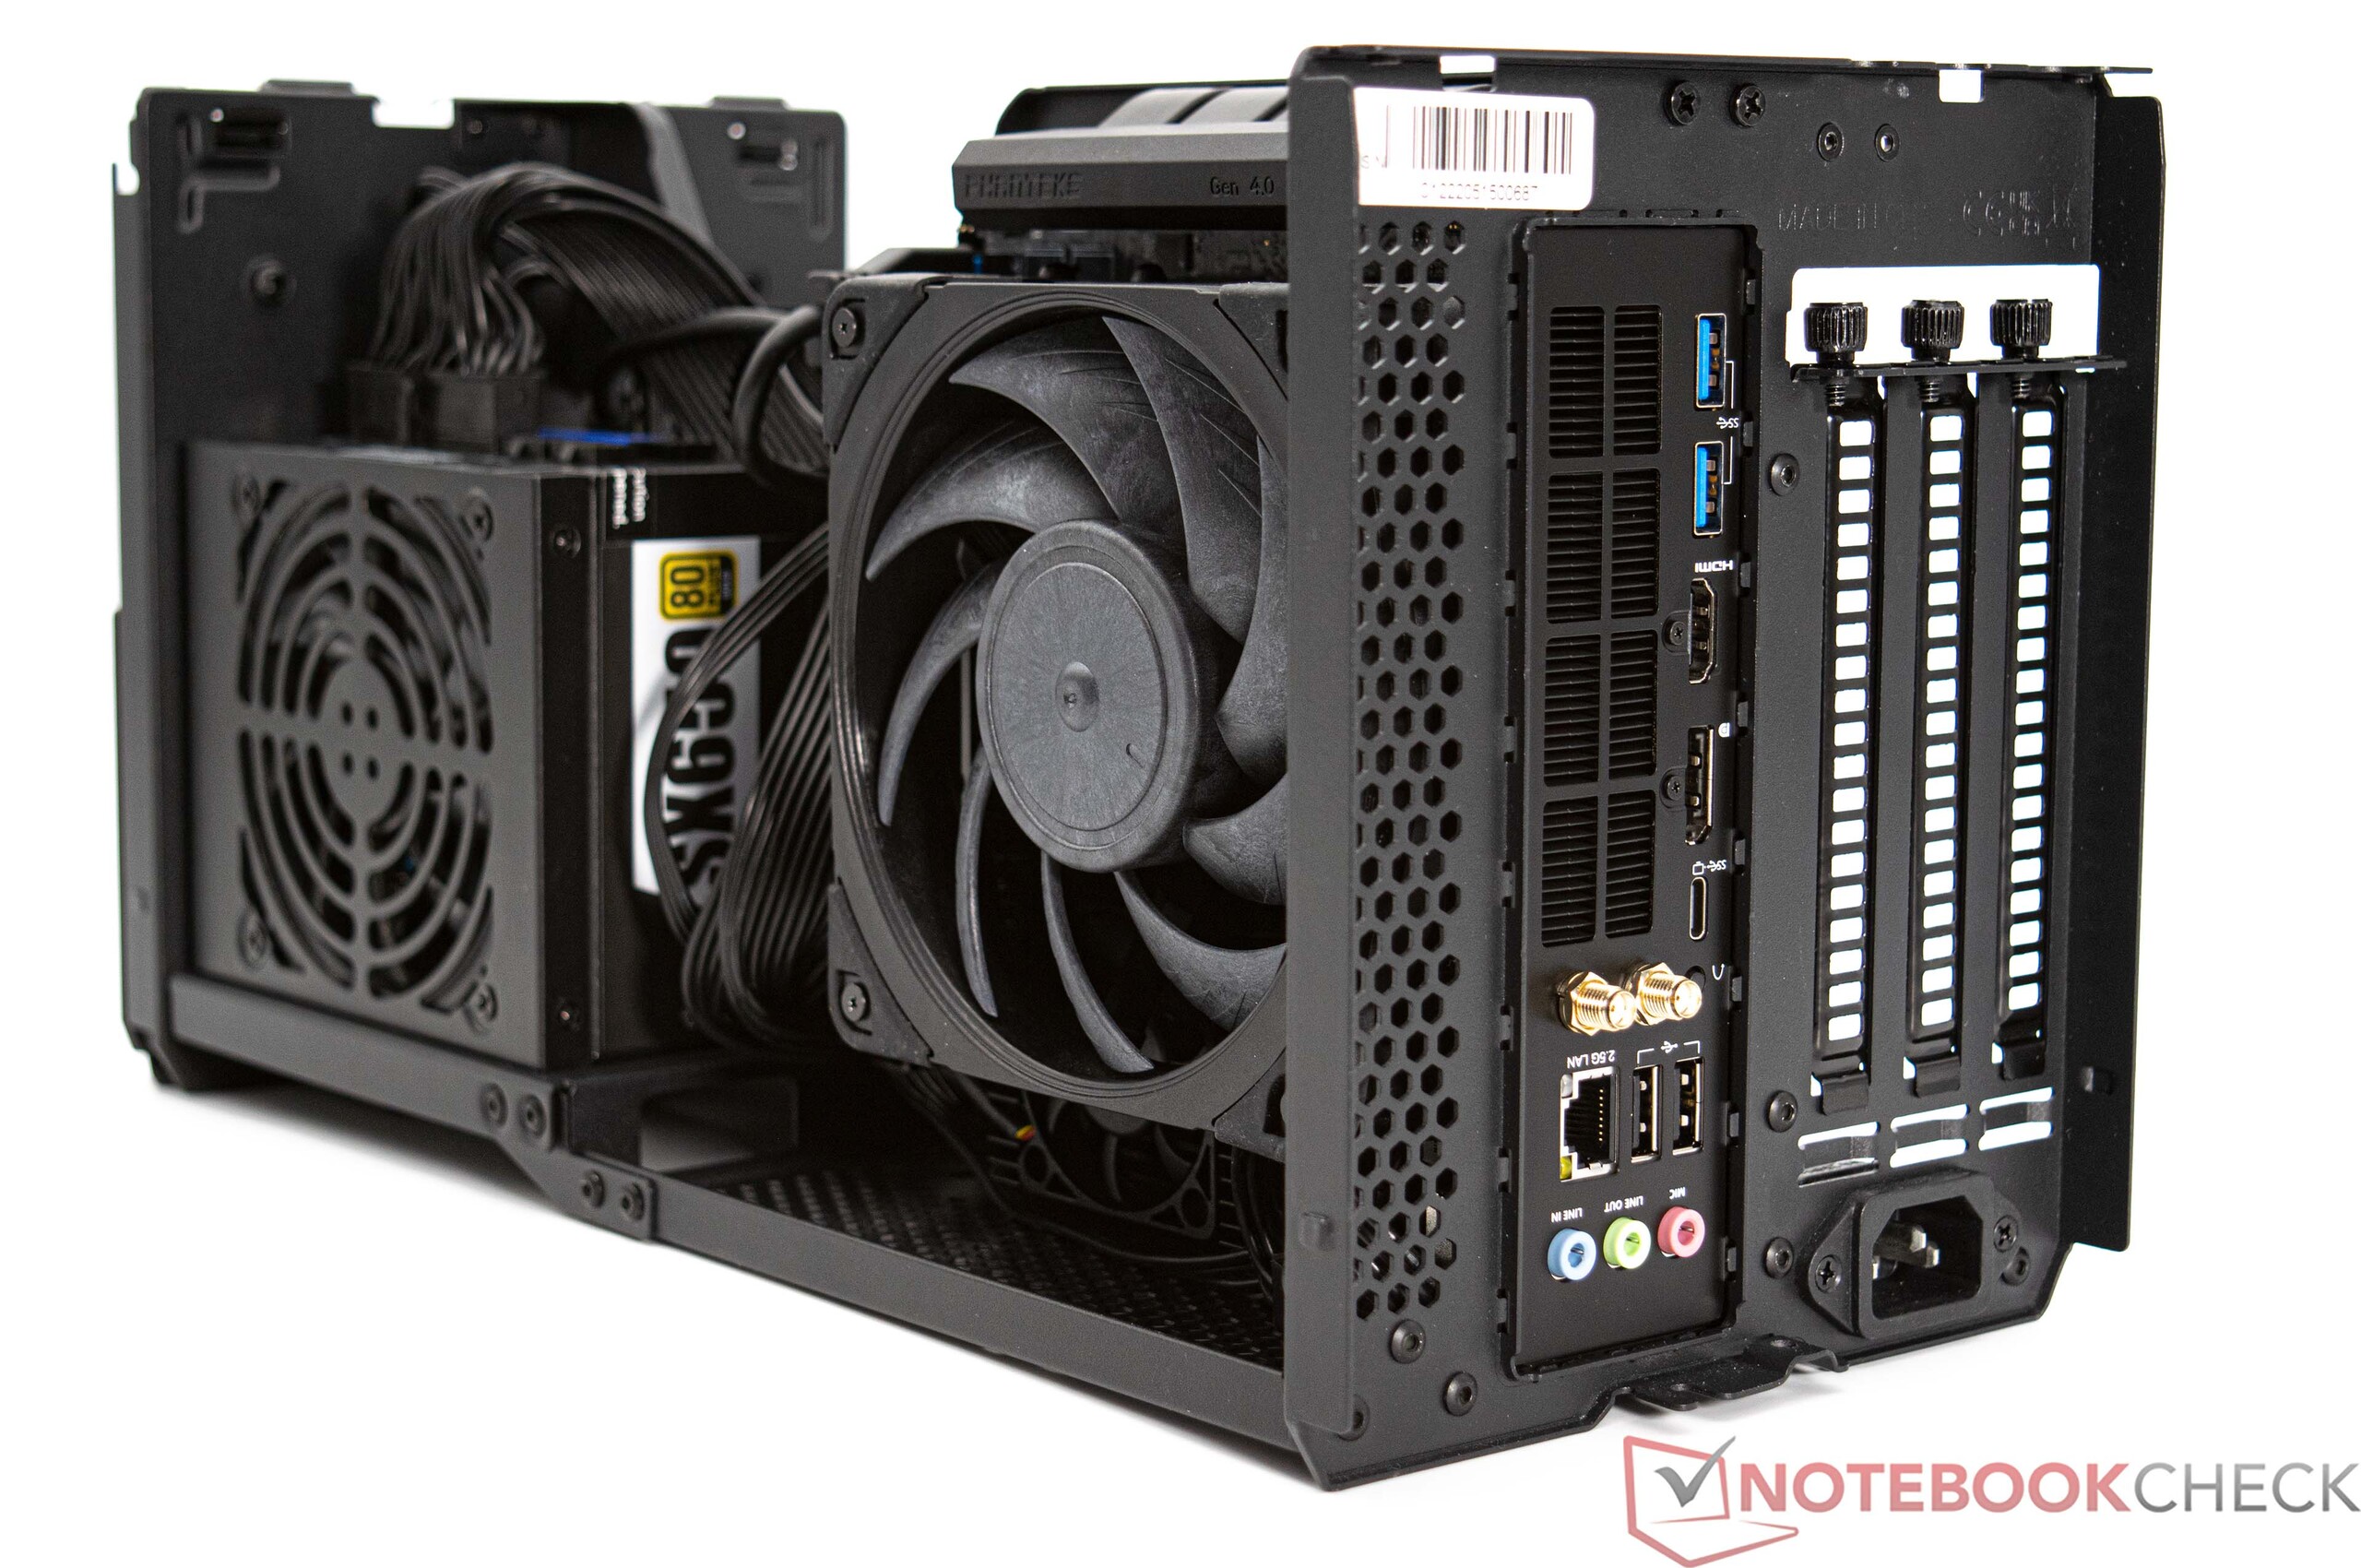
Afin de garantir l'authenticité du test, nous avons choisi de réaliser tous les tests sans carte graphique dédiée. Nous avons utilisé le boîtier Phanteks Enthoo Evolv Shift XT, choisi pour son design compact, afin de fournir une base solide.
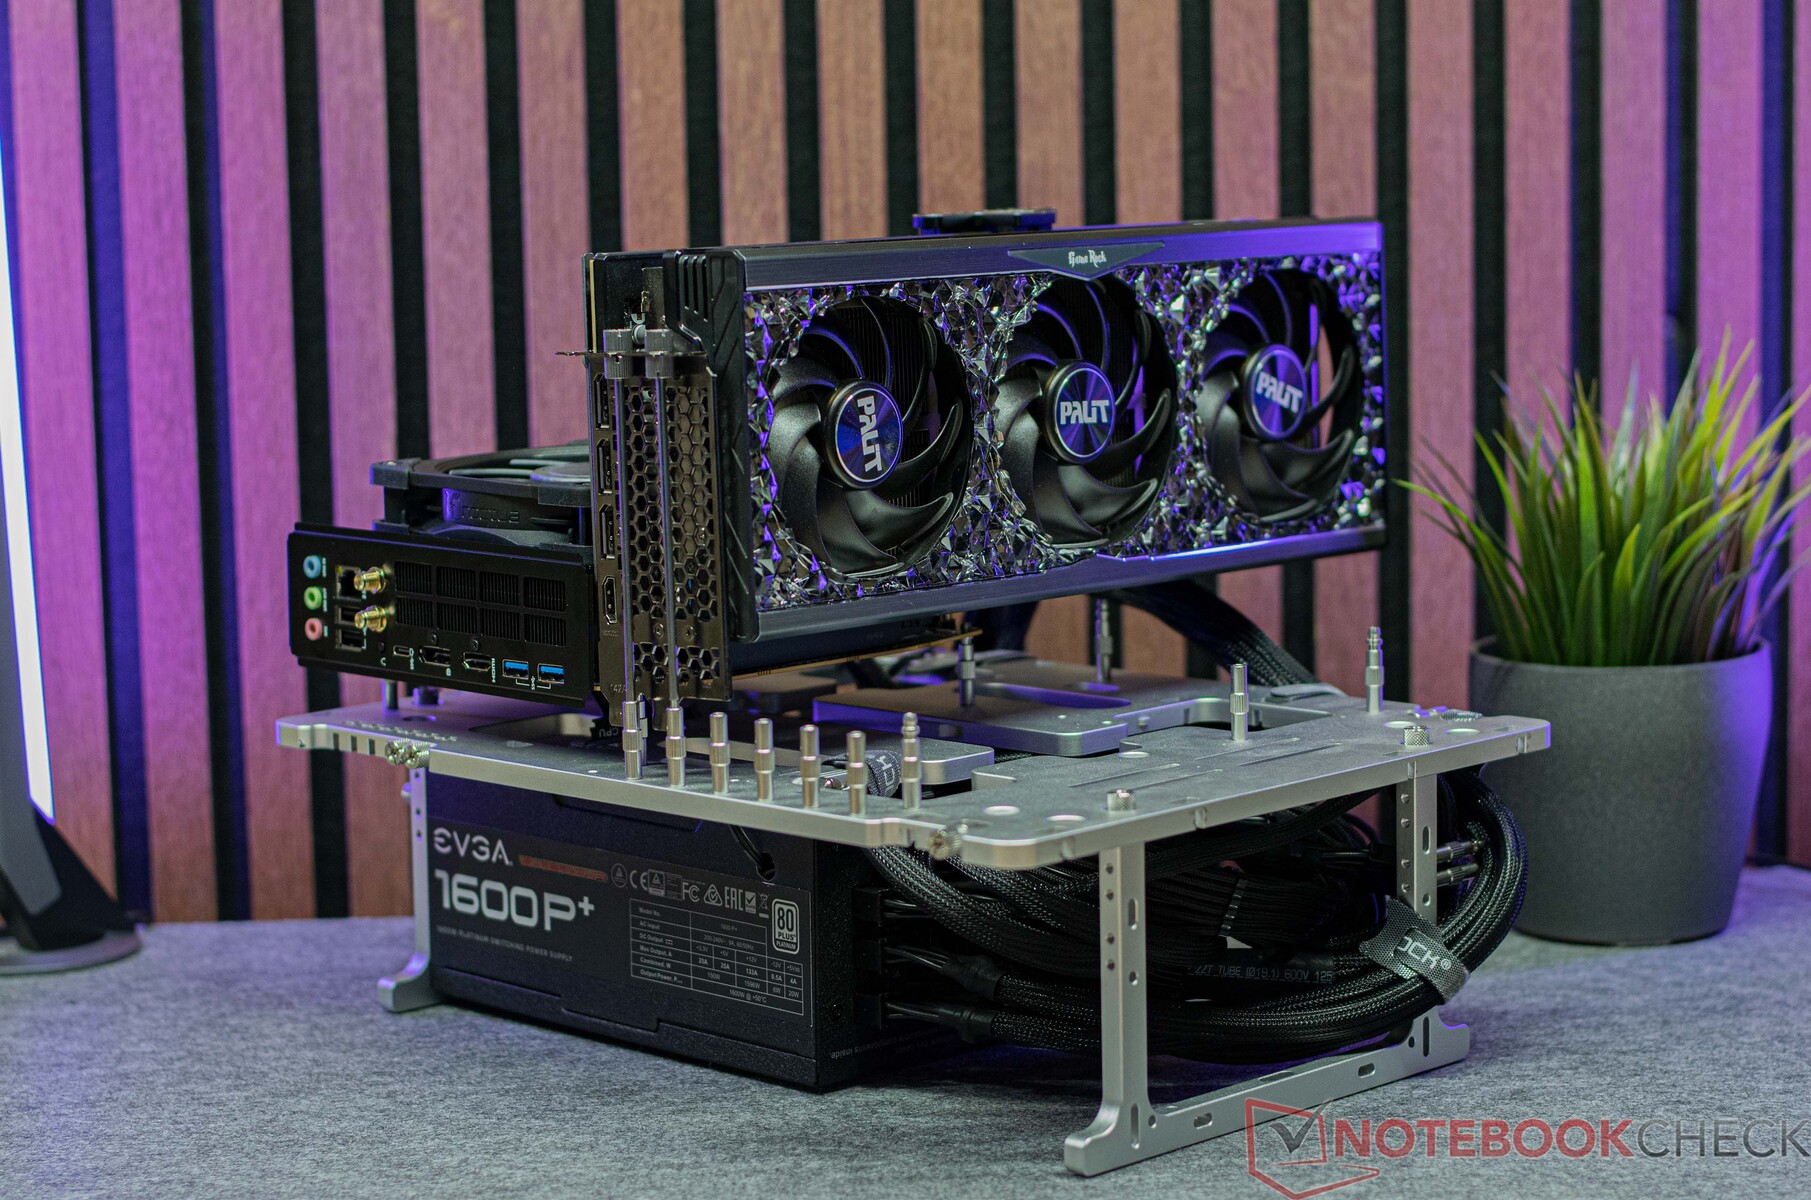
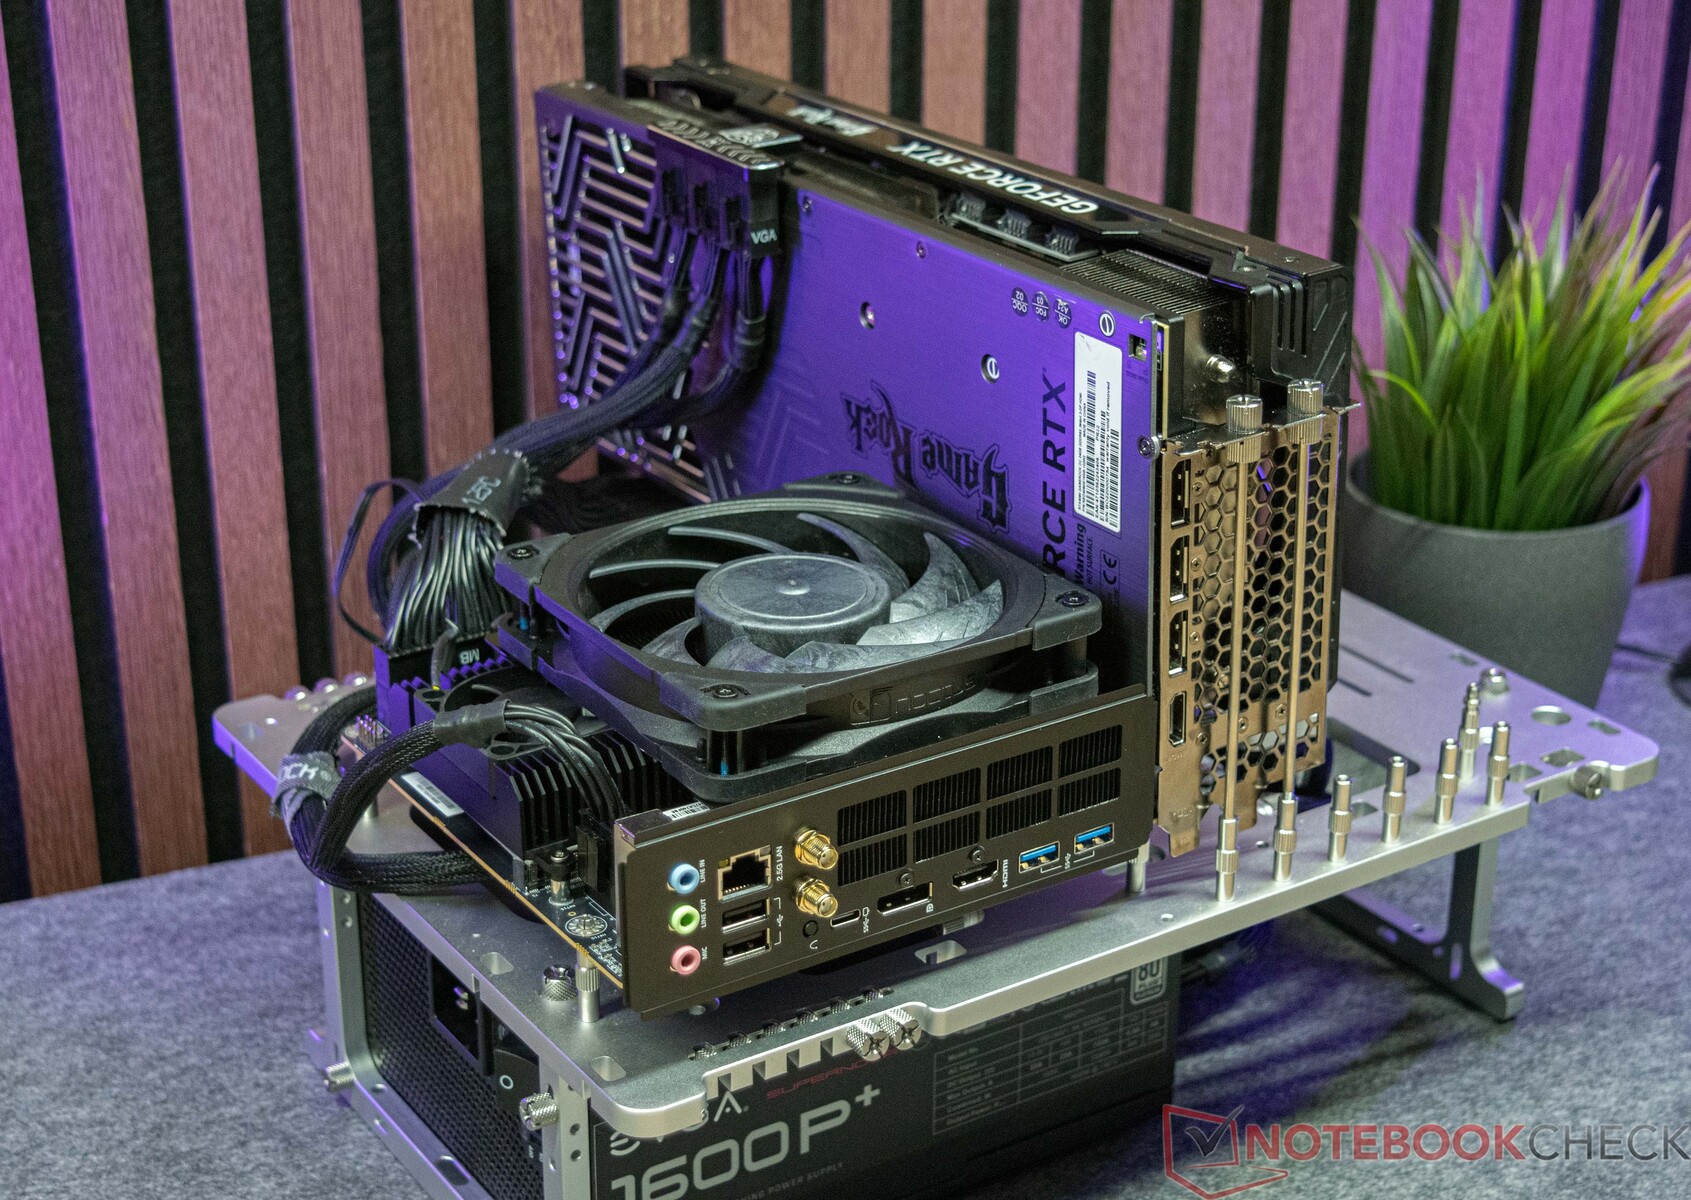
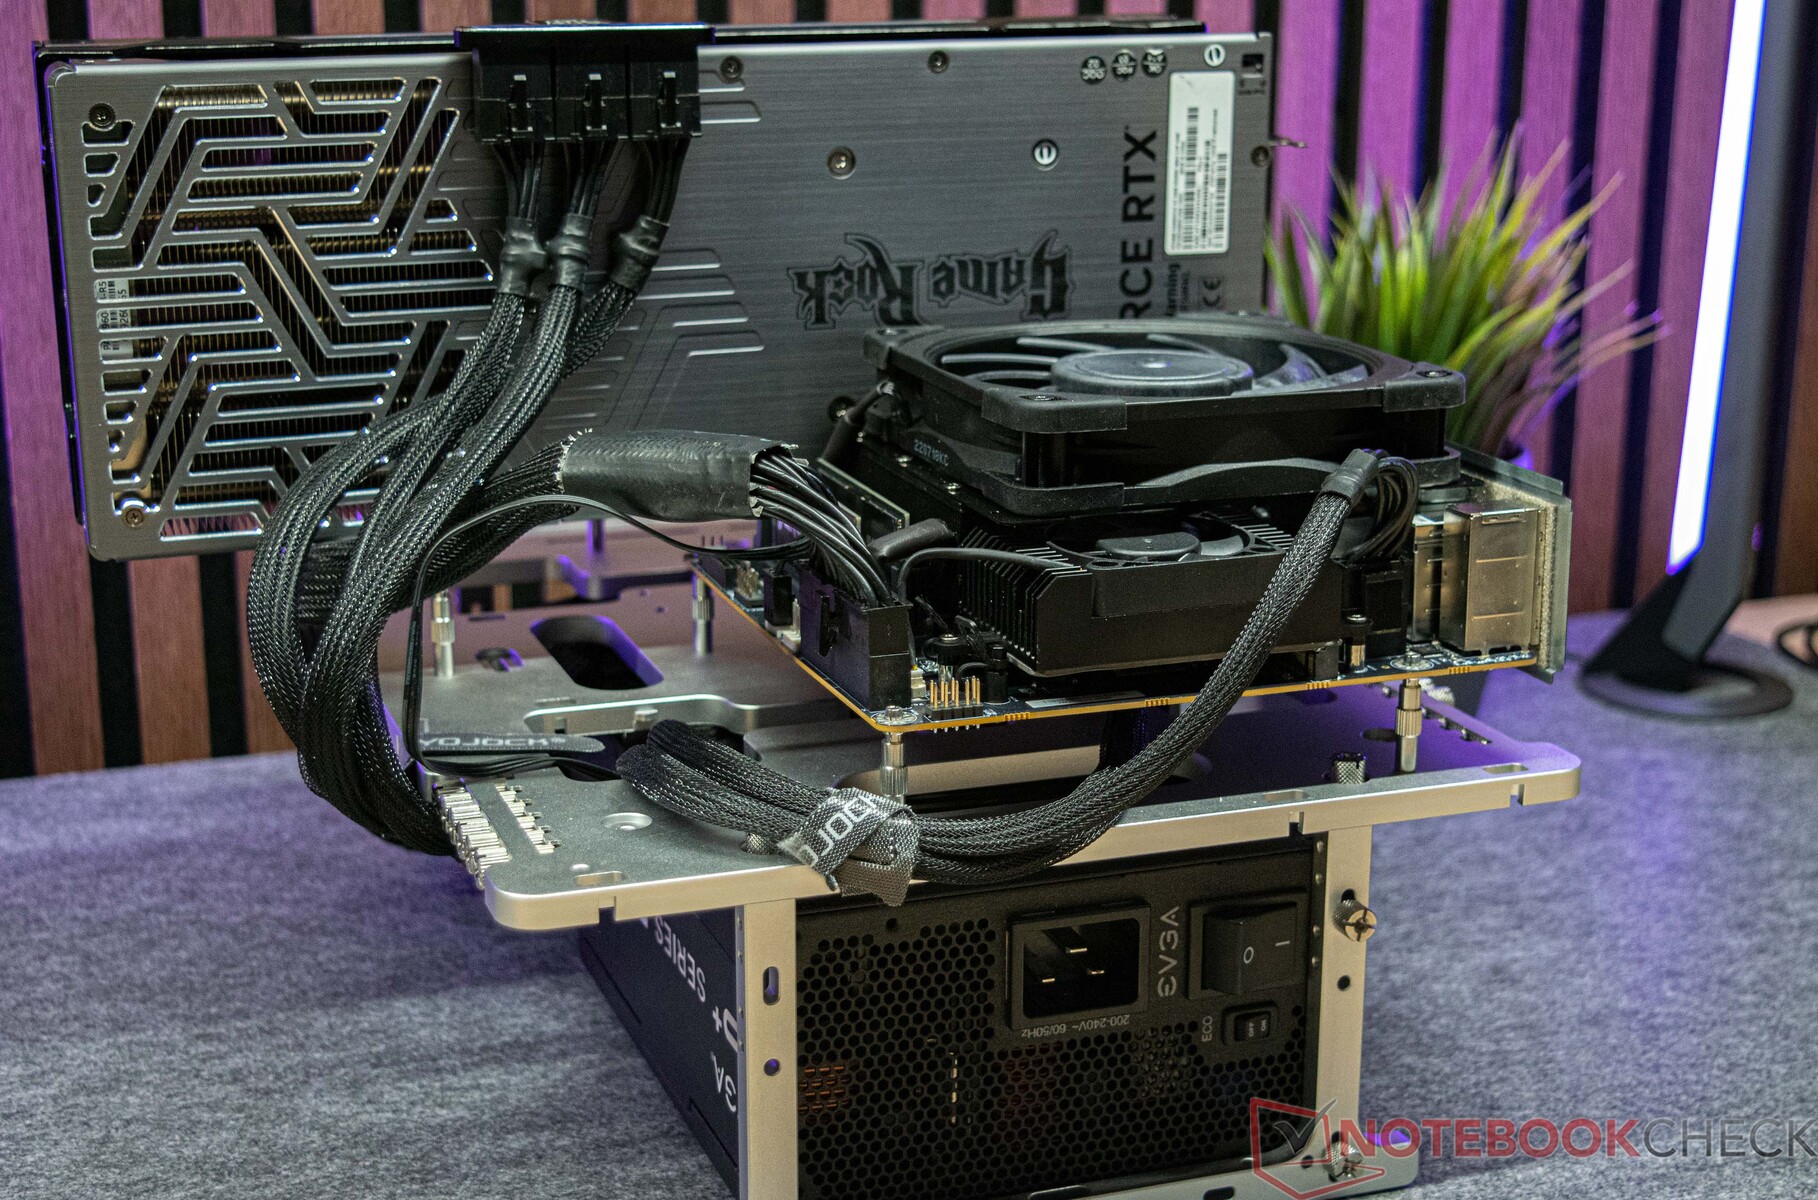
De plus, pour la comparaison des performances impliquant une carte graphique dédiée, nous avons évalué le Minisforum BD770i aux côtés du Palit GeForce RTX 4090 GameRock OC dans une configuration ouverte. La taille de la carte graphique a empêché son installation dans le boîtier Phanteks Enthoo Evolv Shift XT. Le boîtier peut accueillir des cartes graphiques dont la longueur ne dépasse pas 32,4 centimètres.
Contenu de la livraison
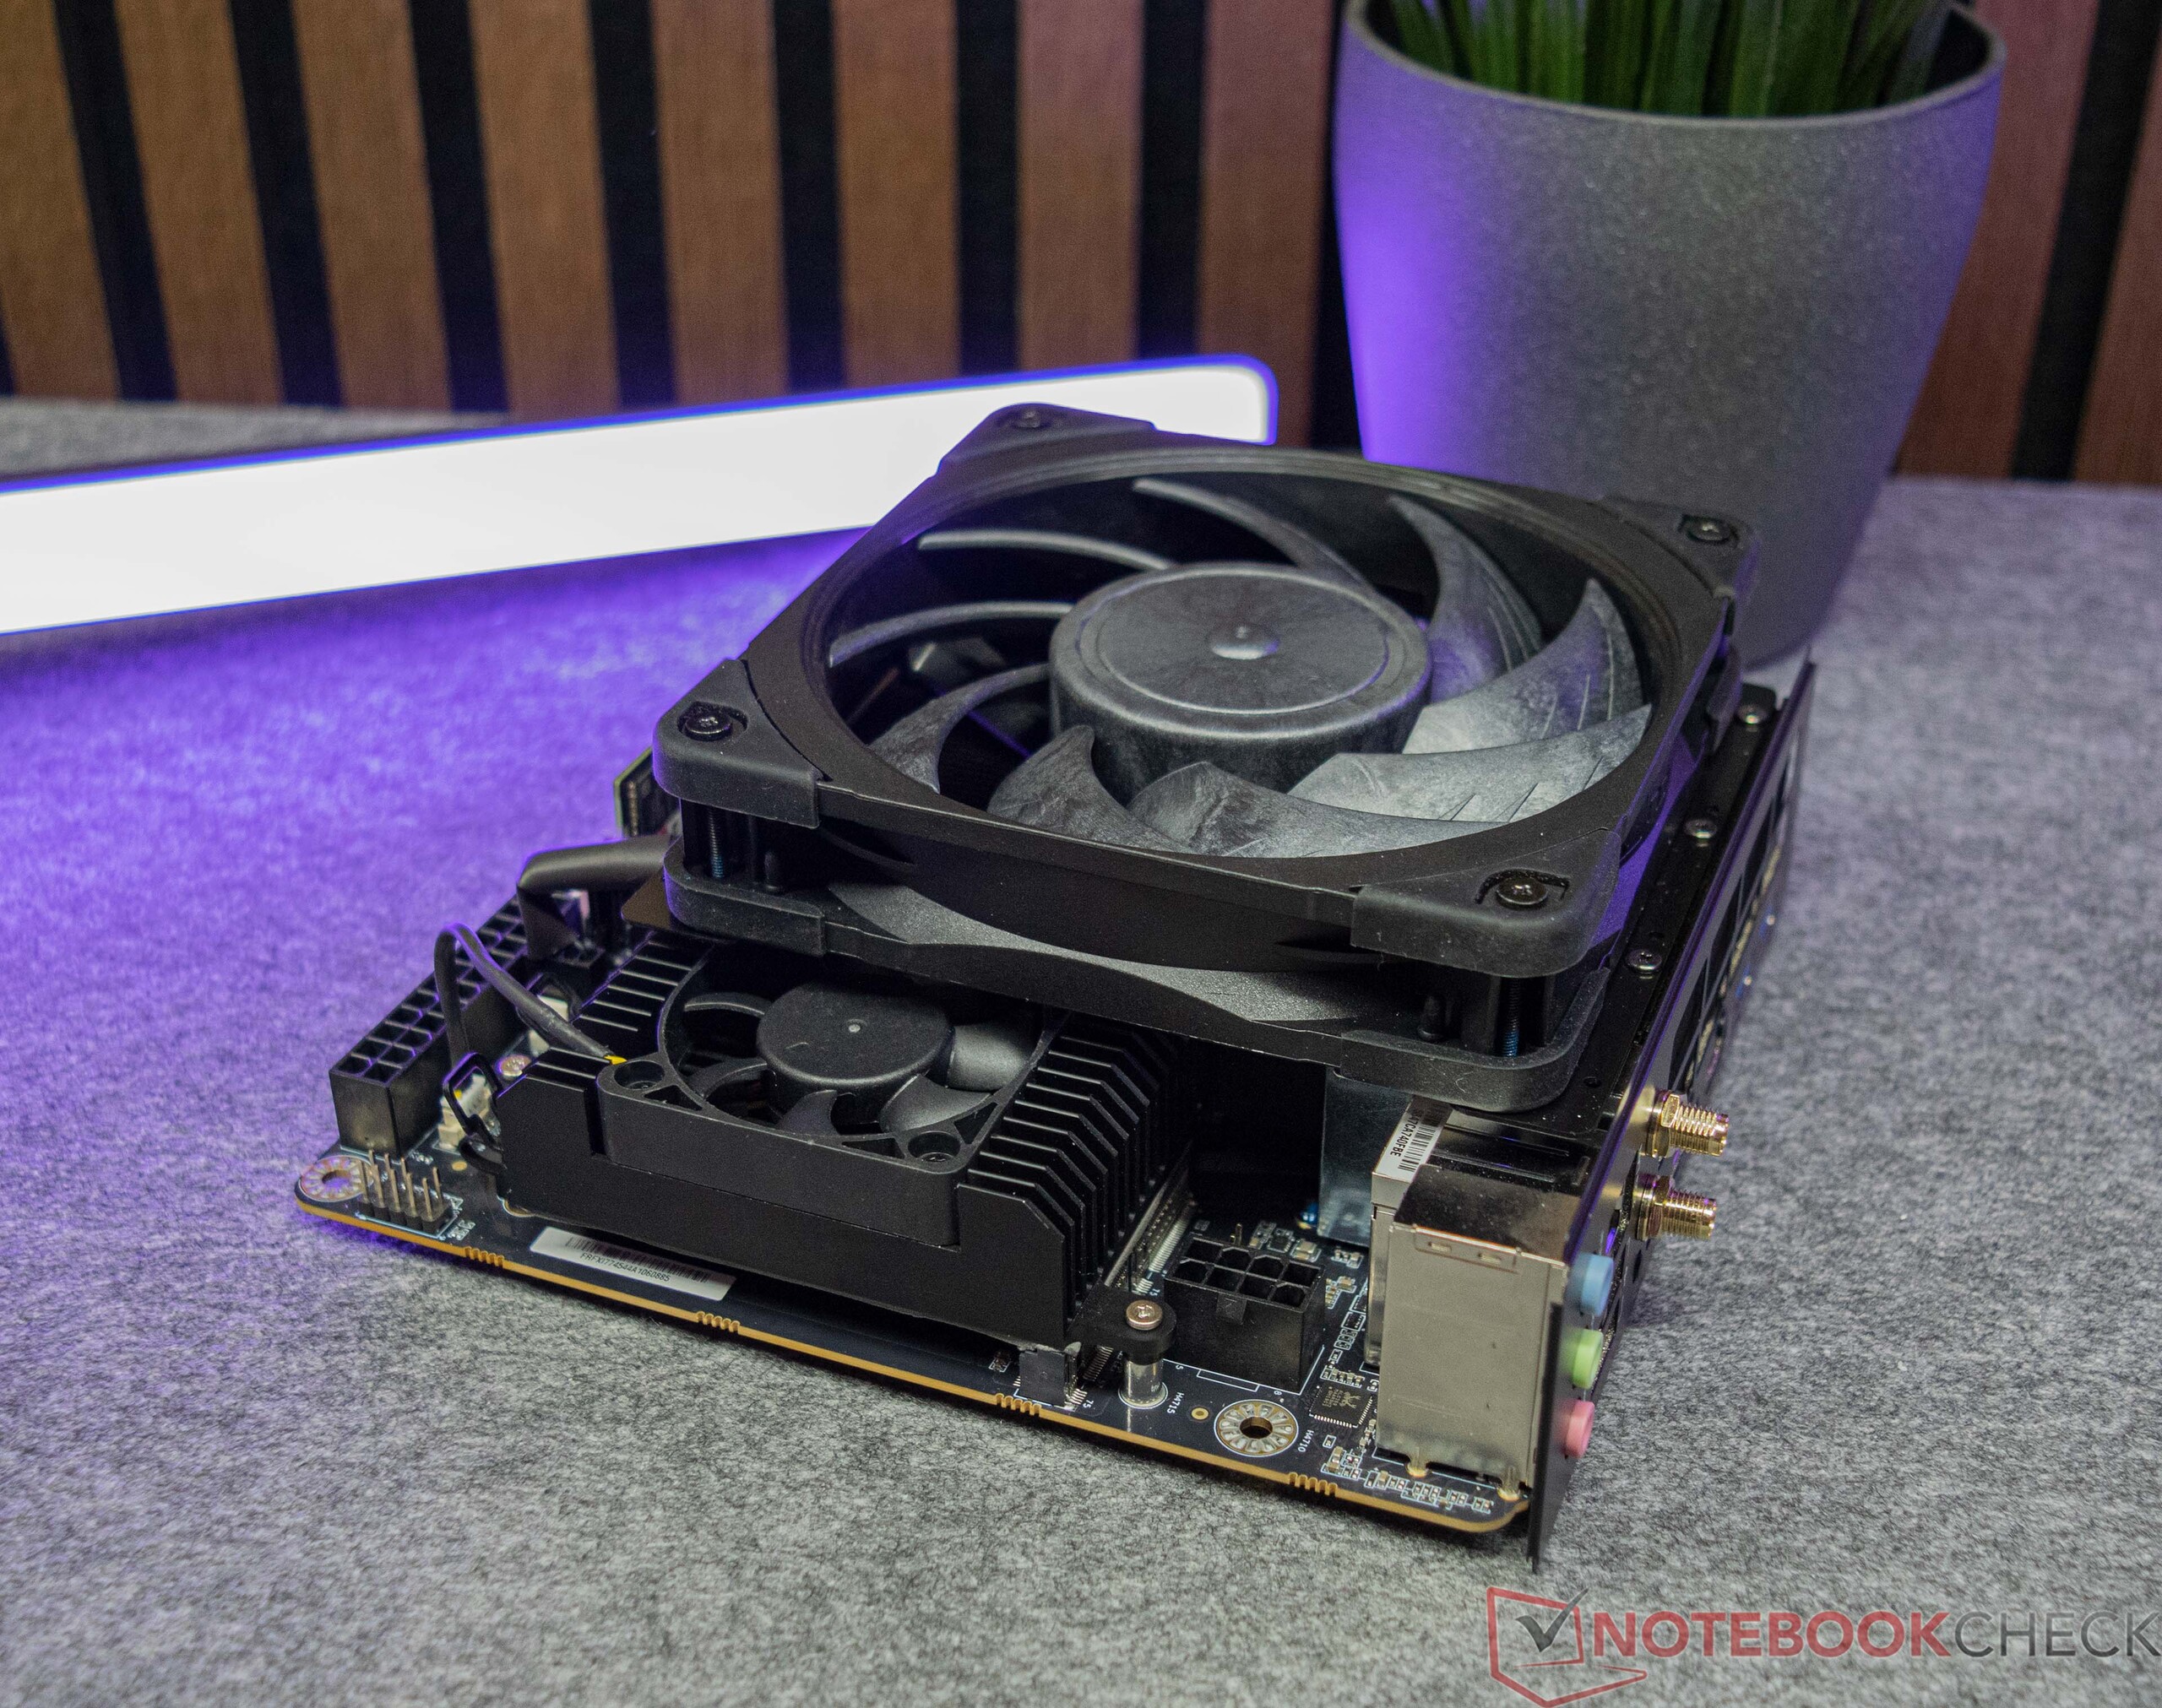
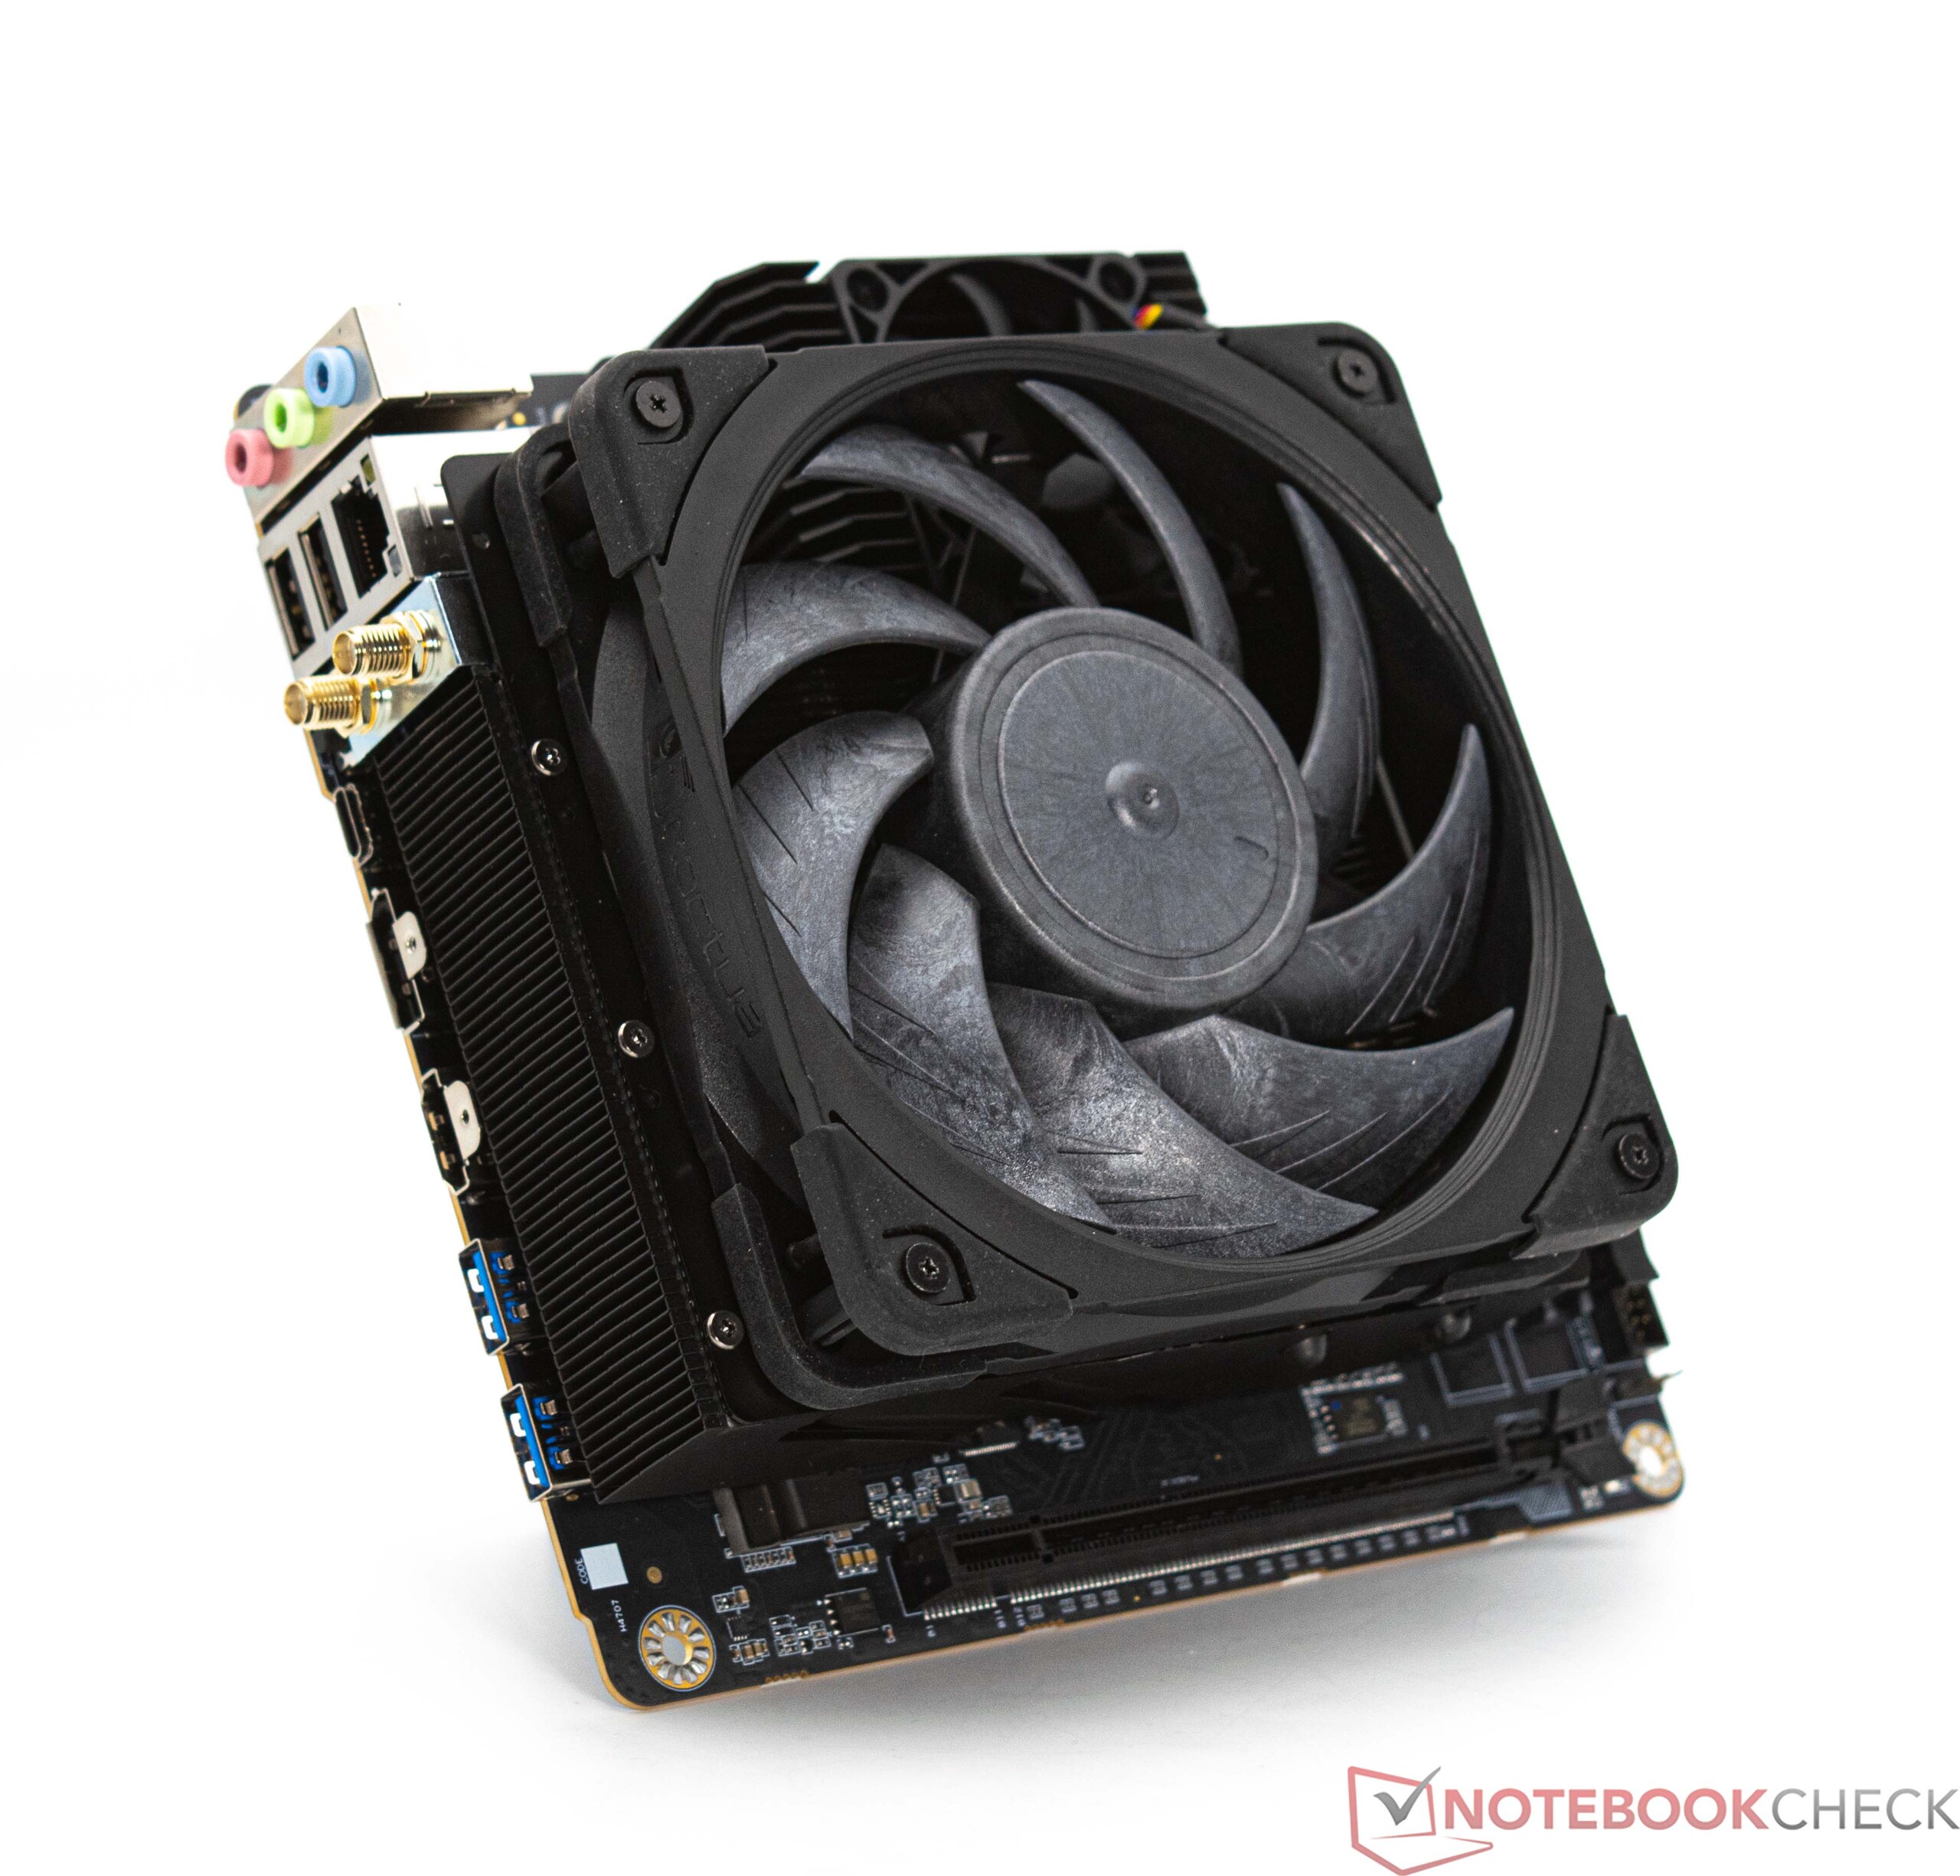
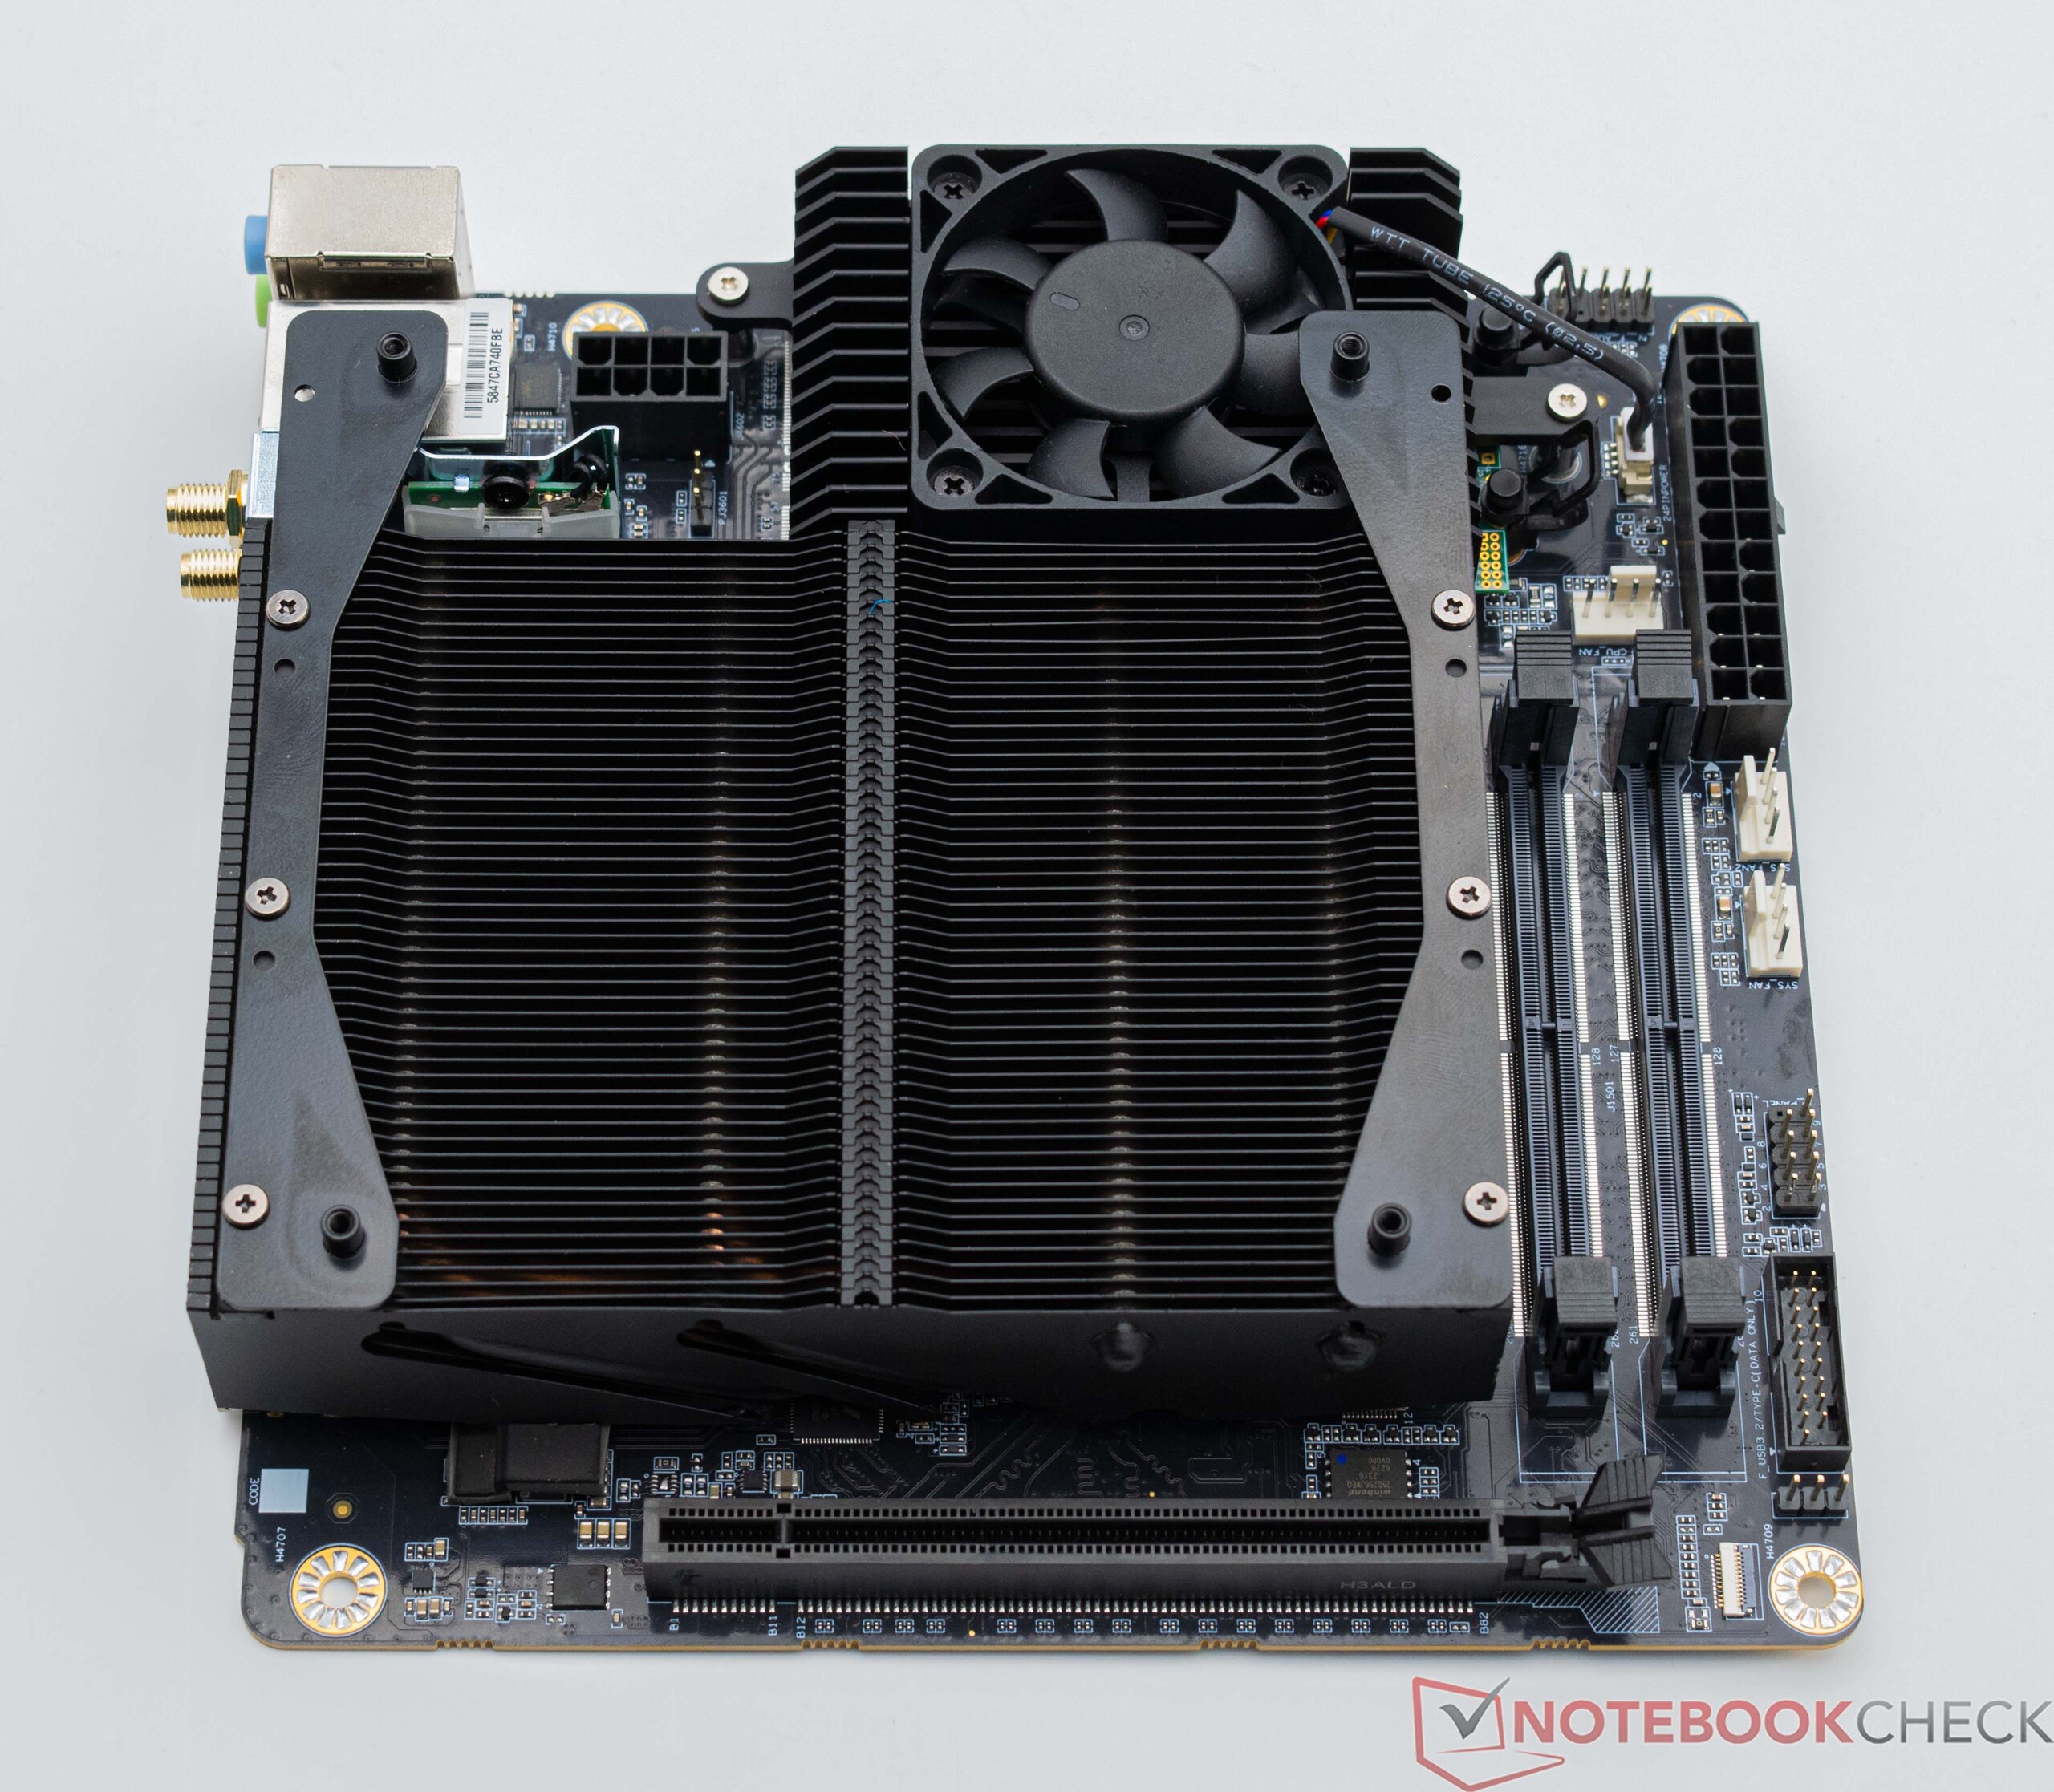
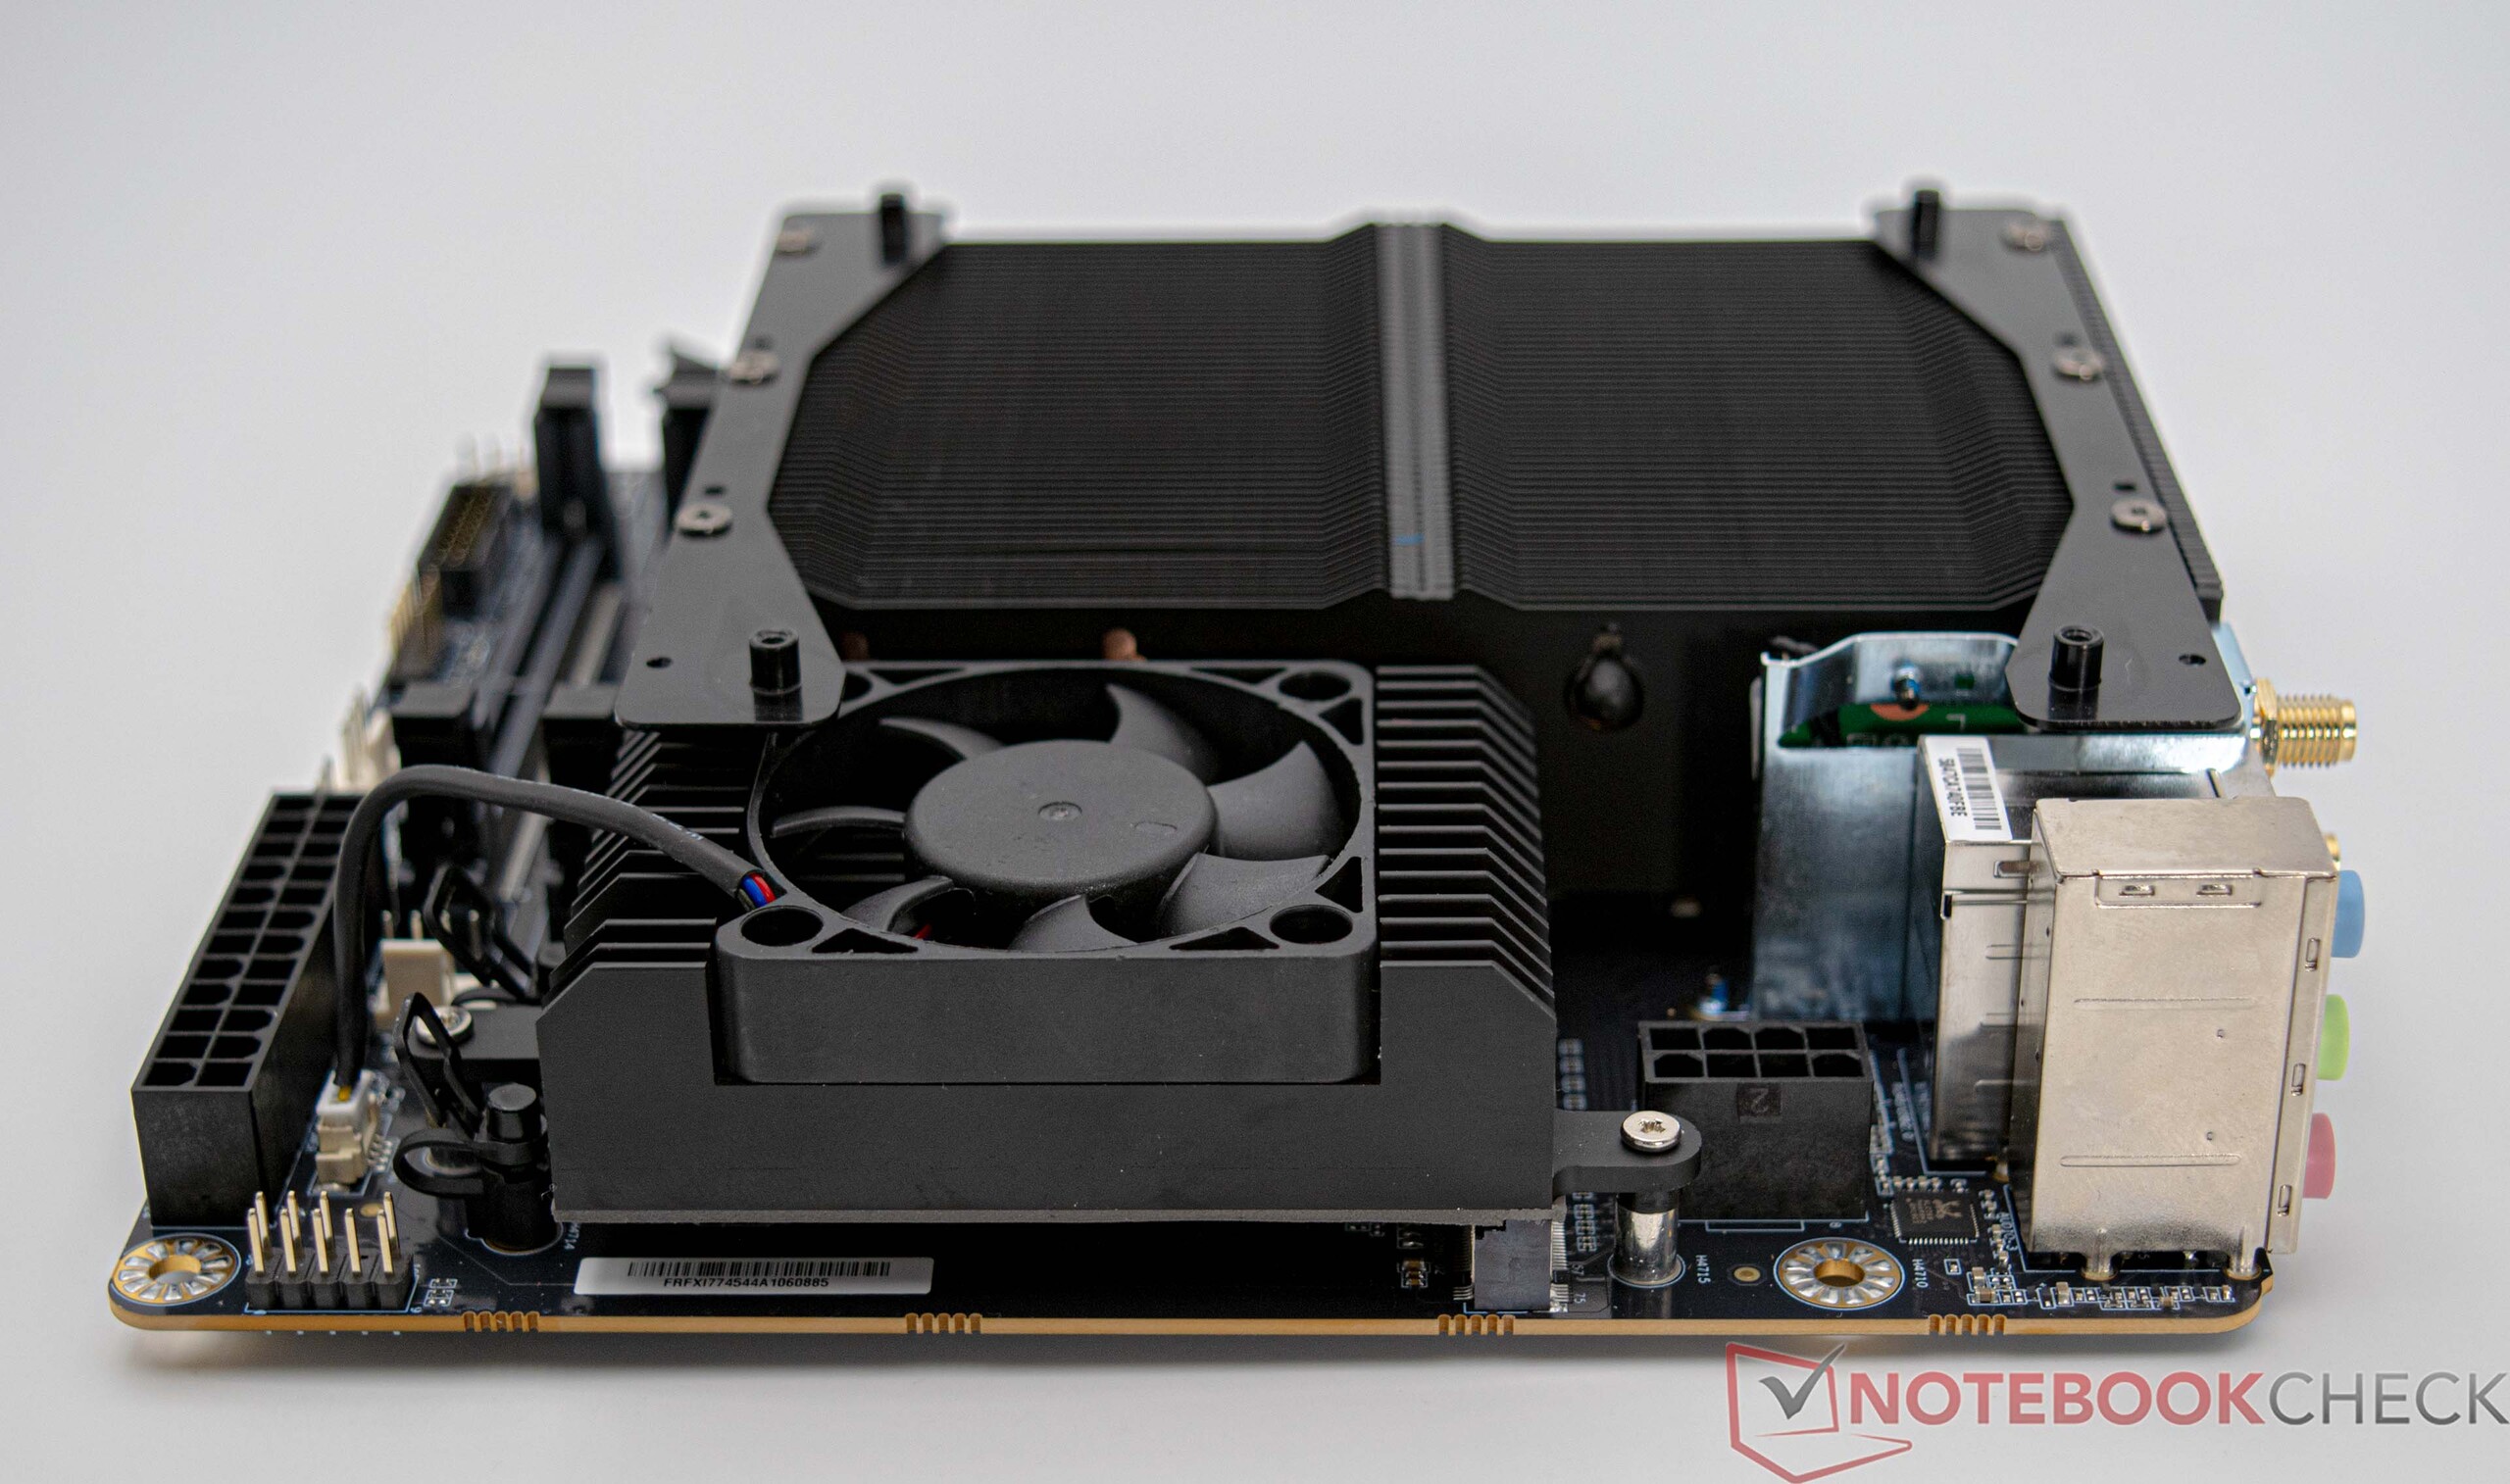
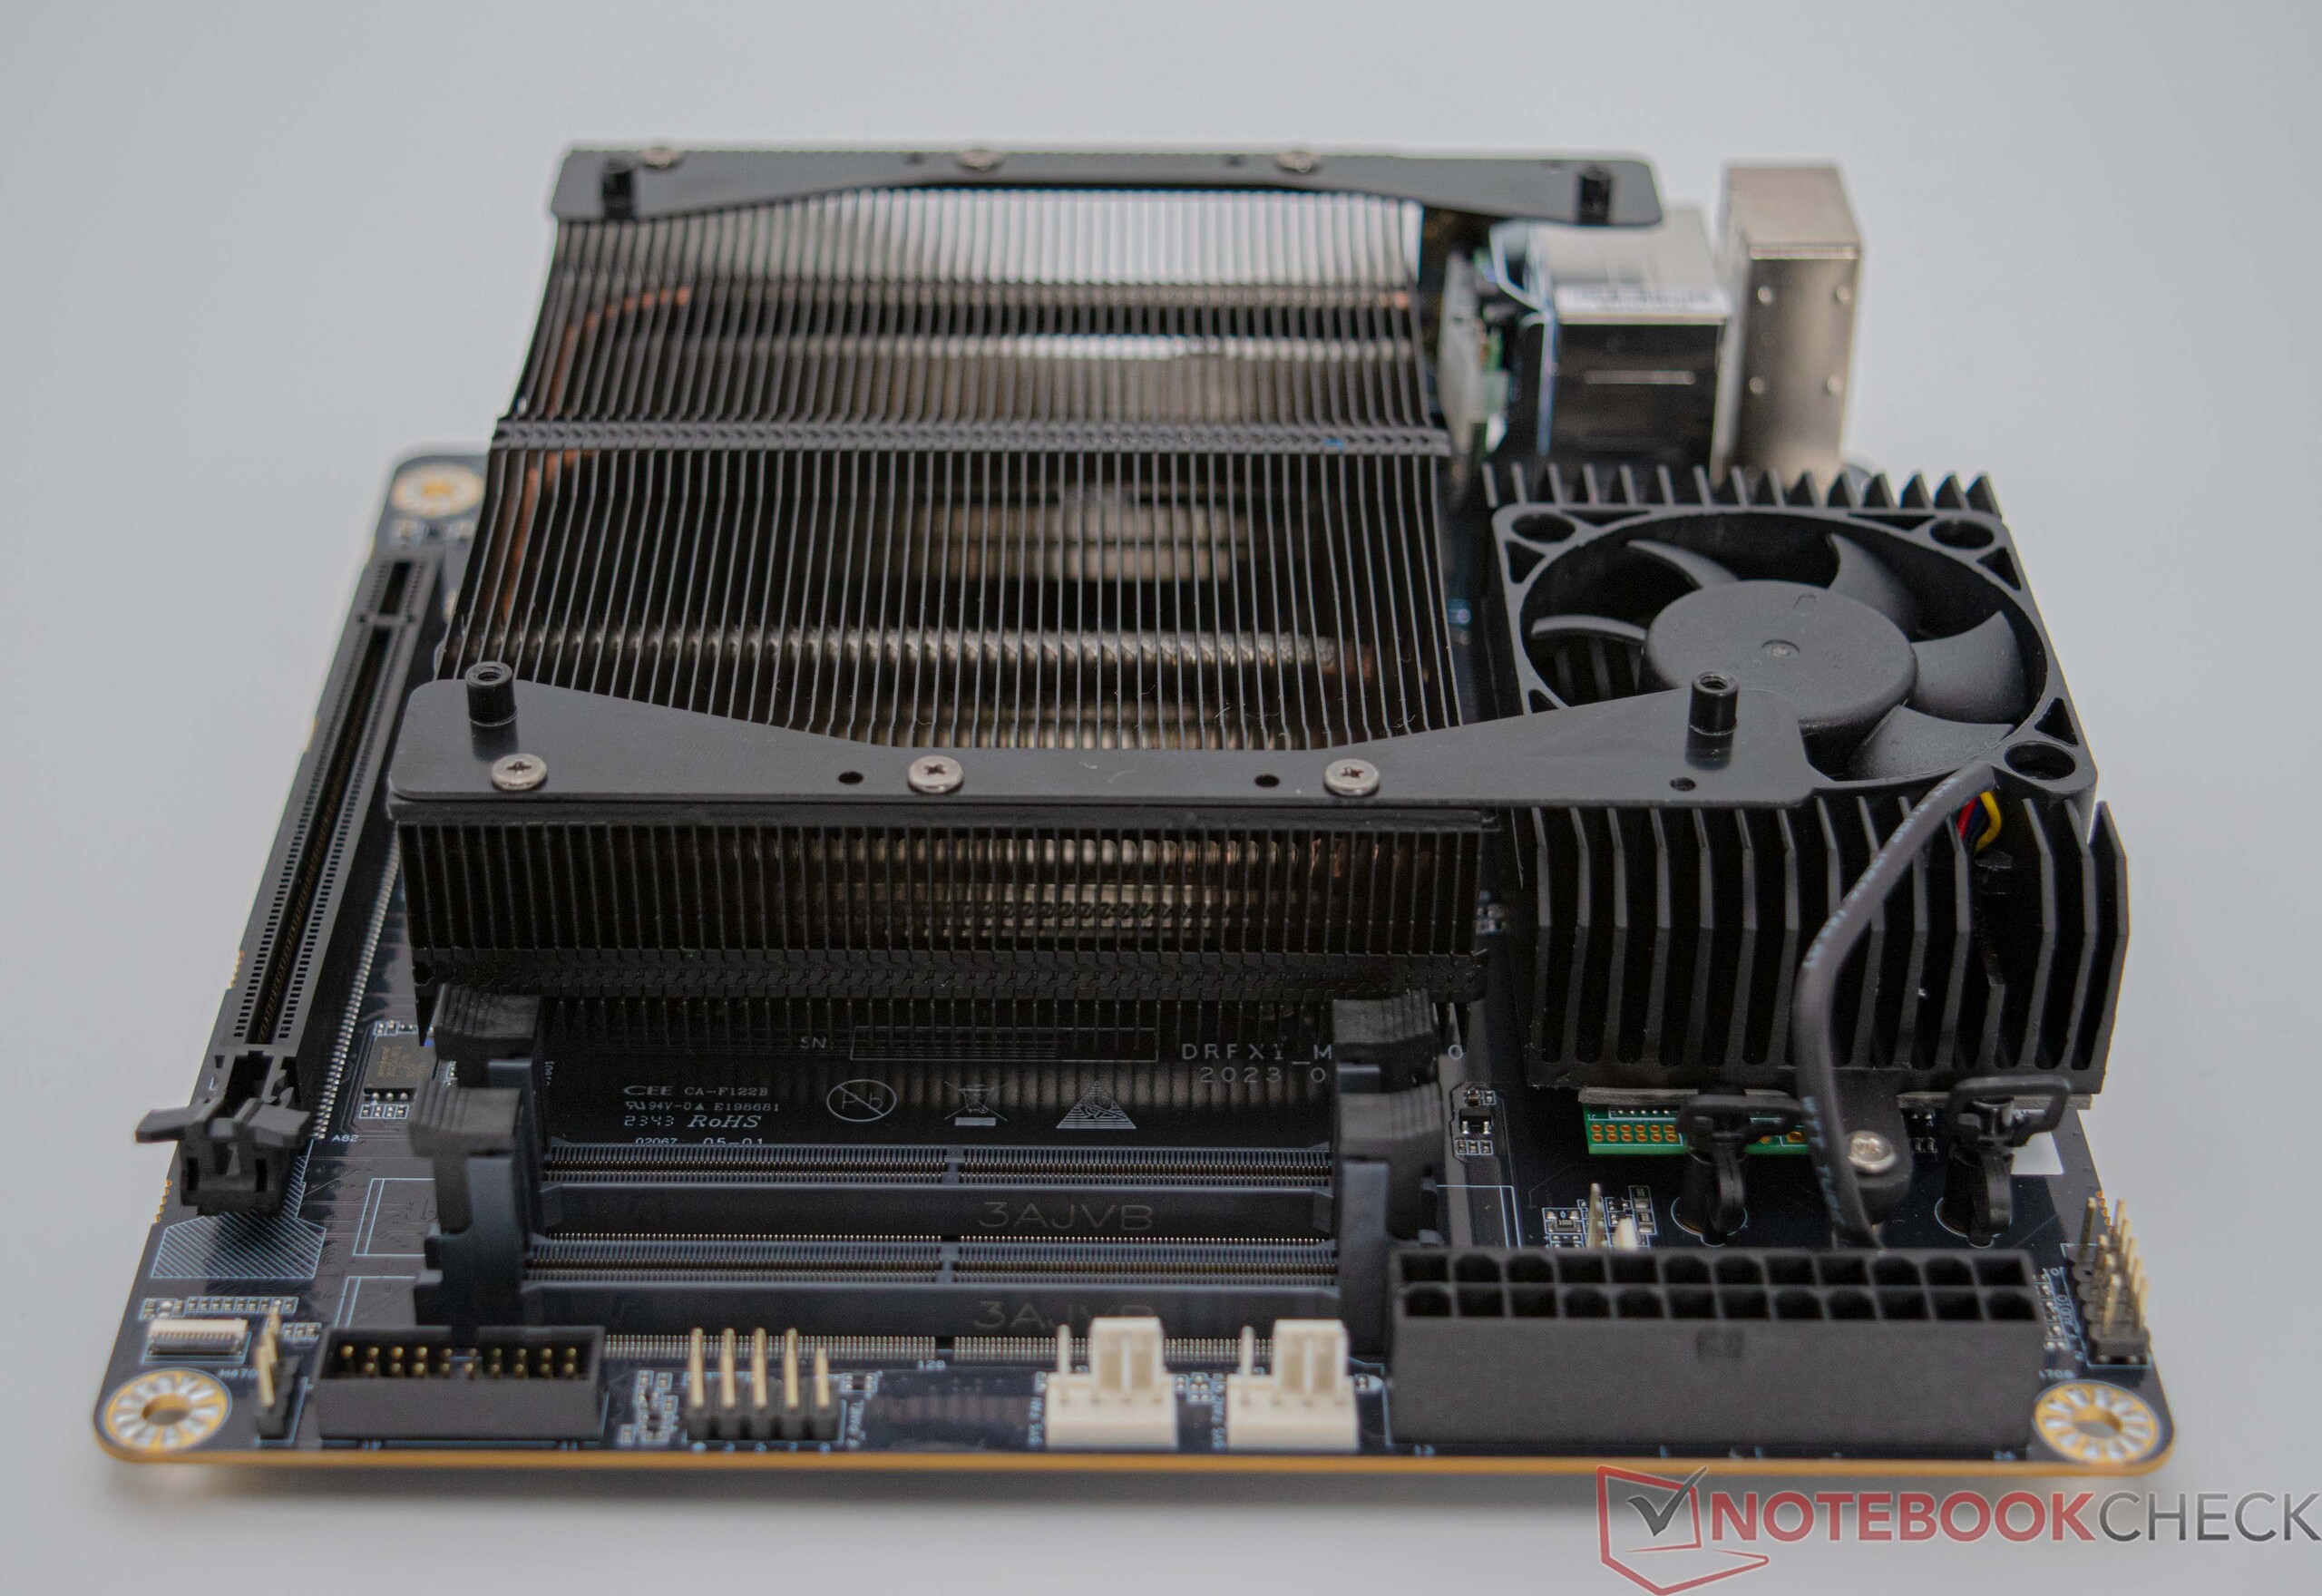
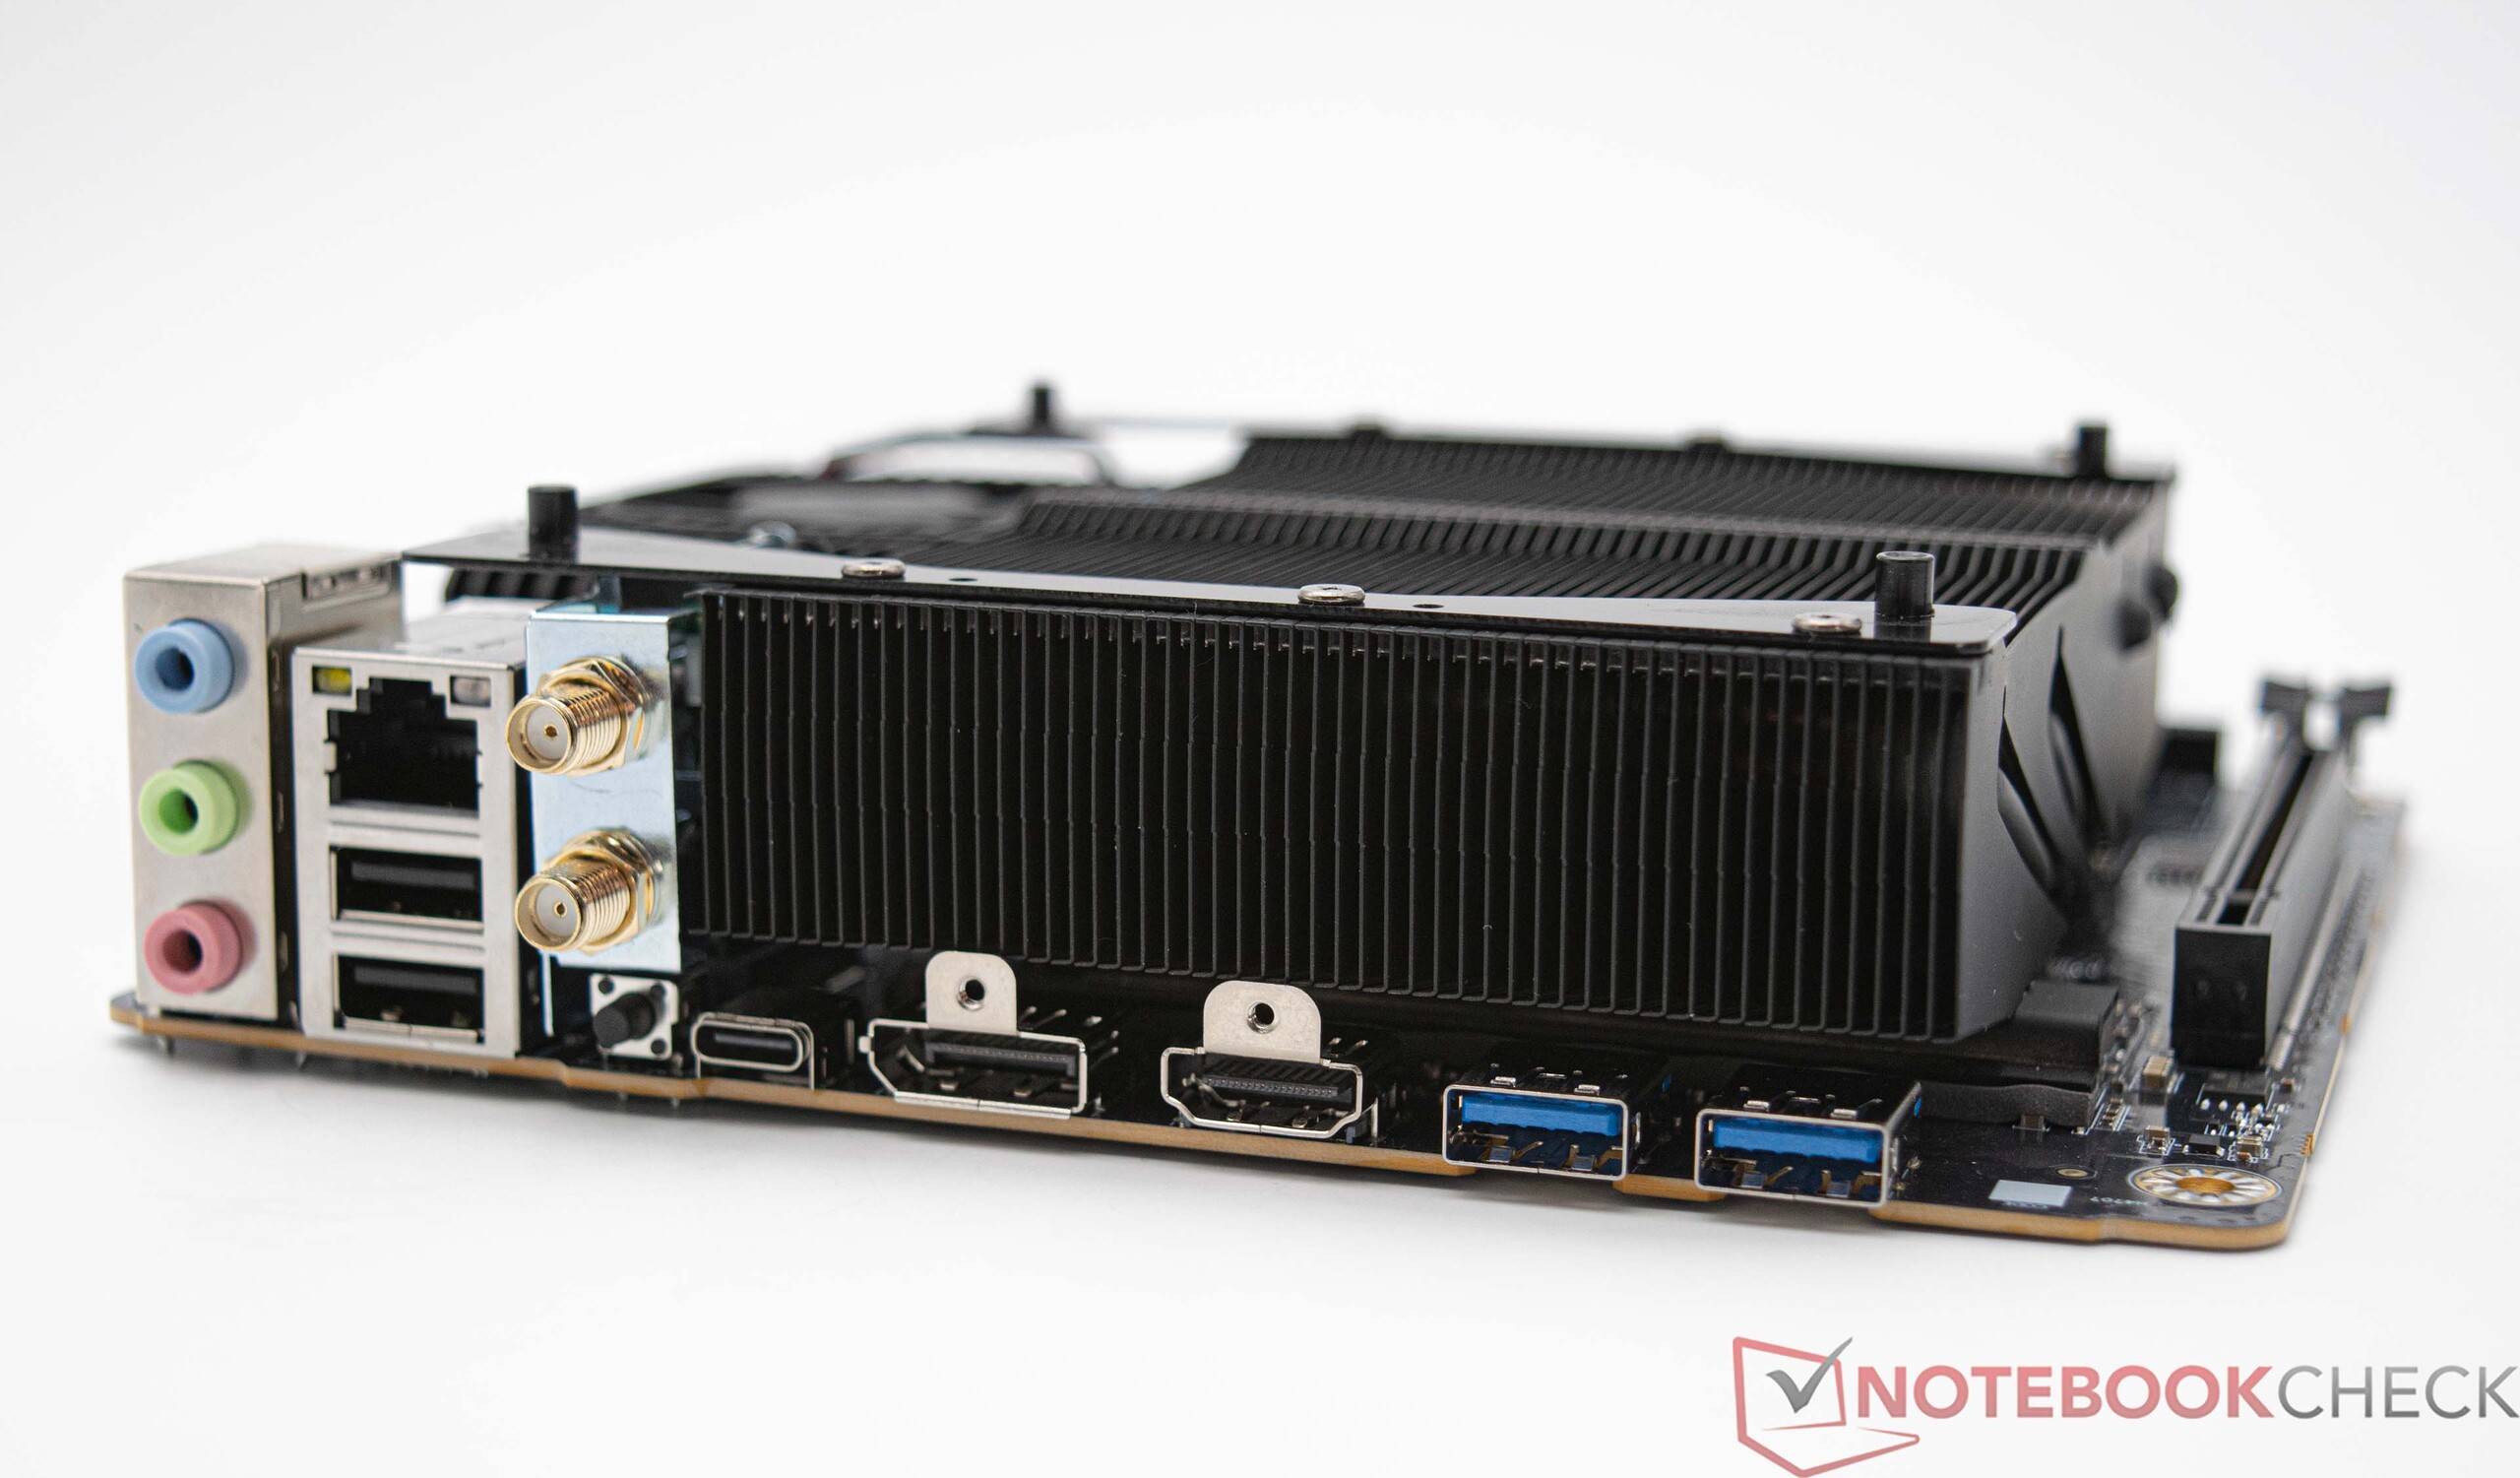
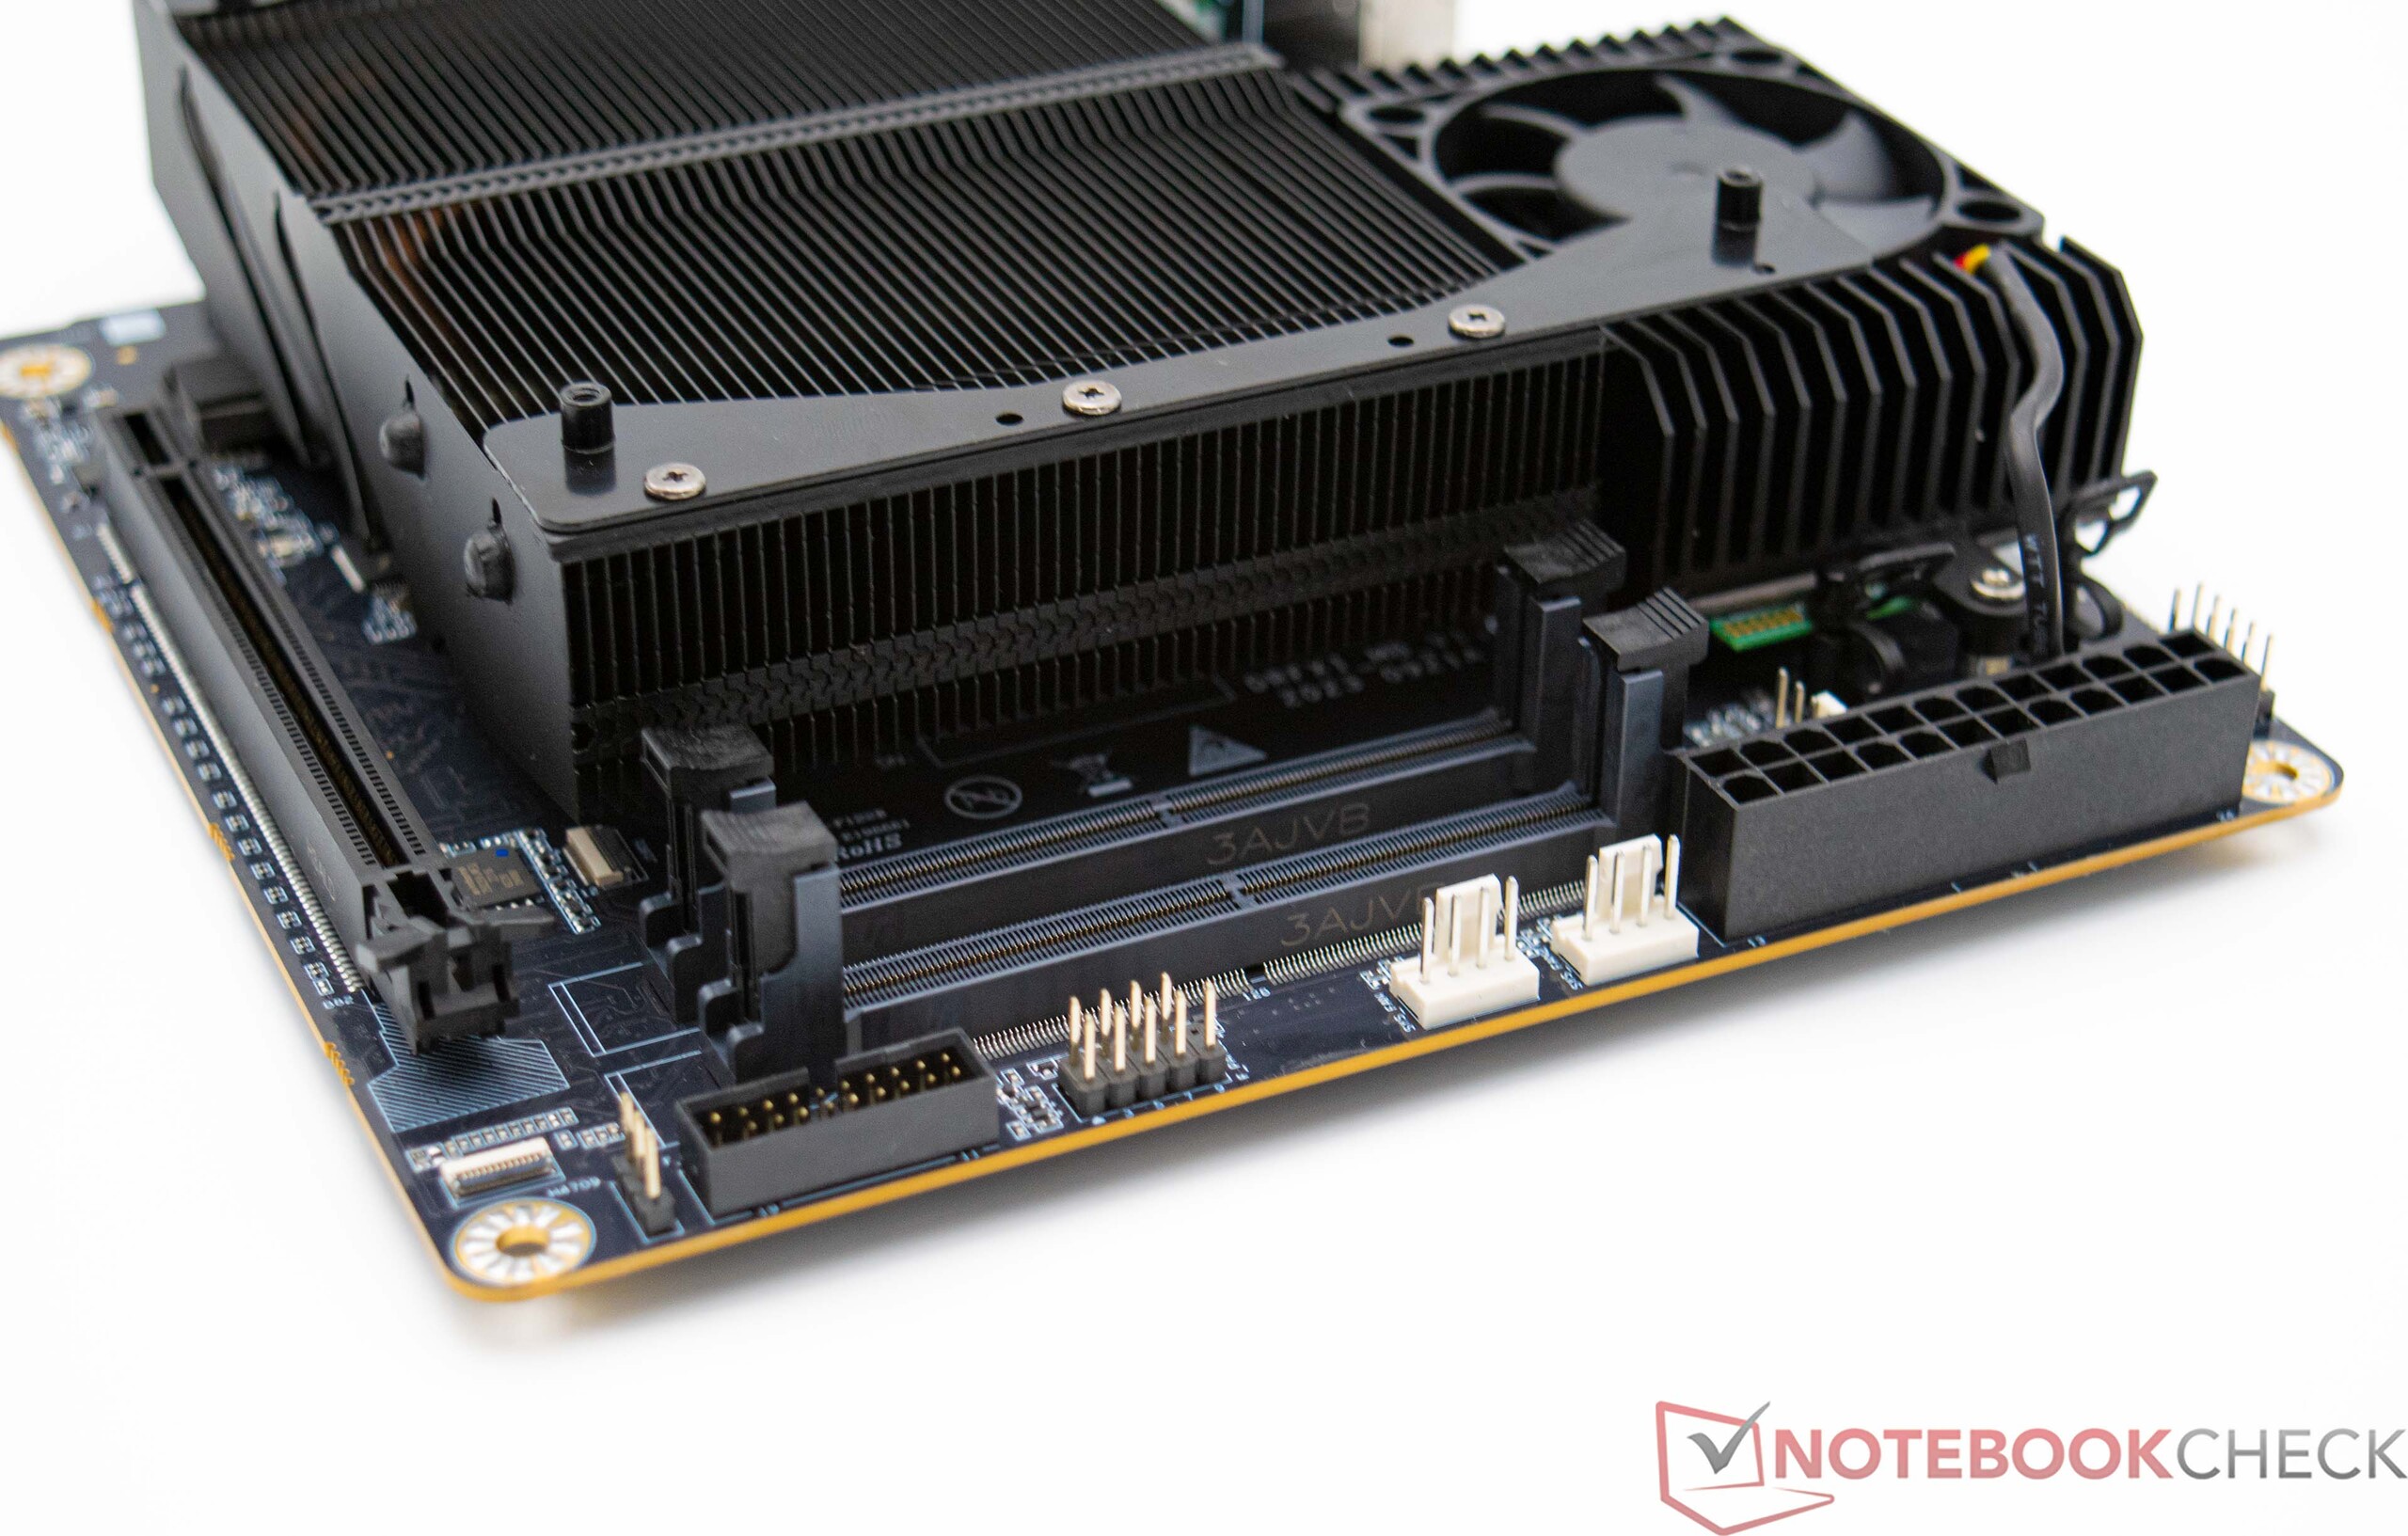
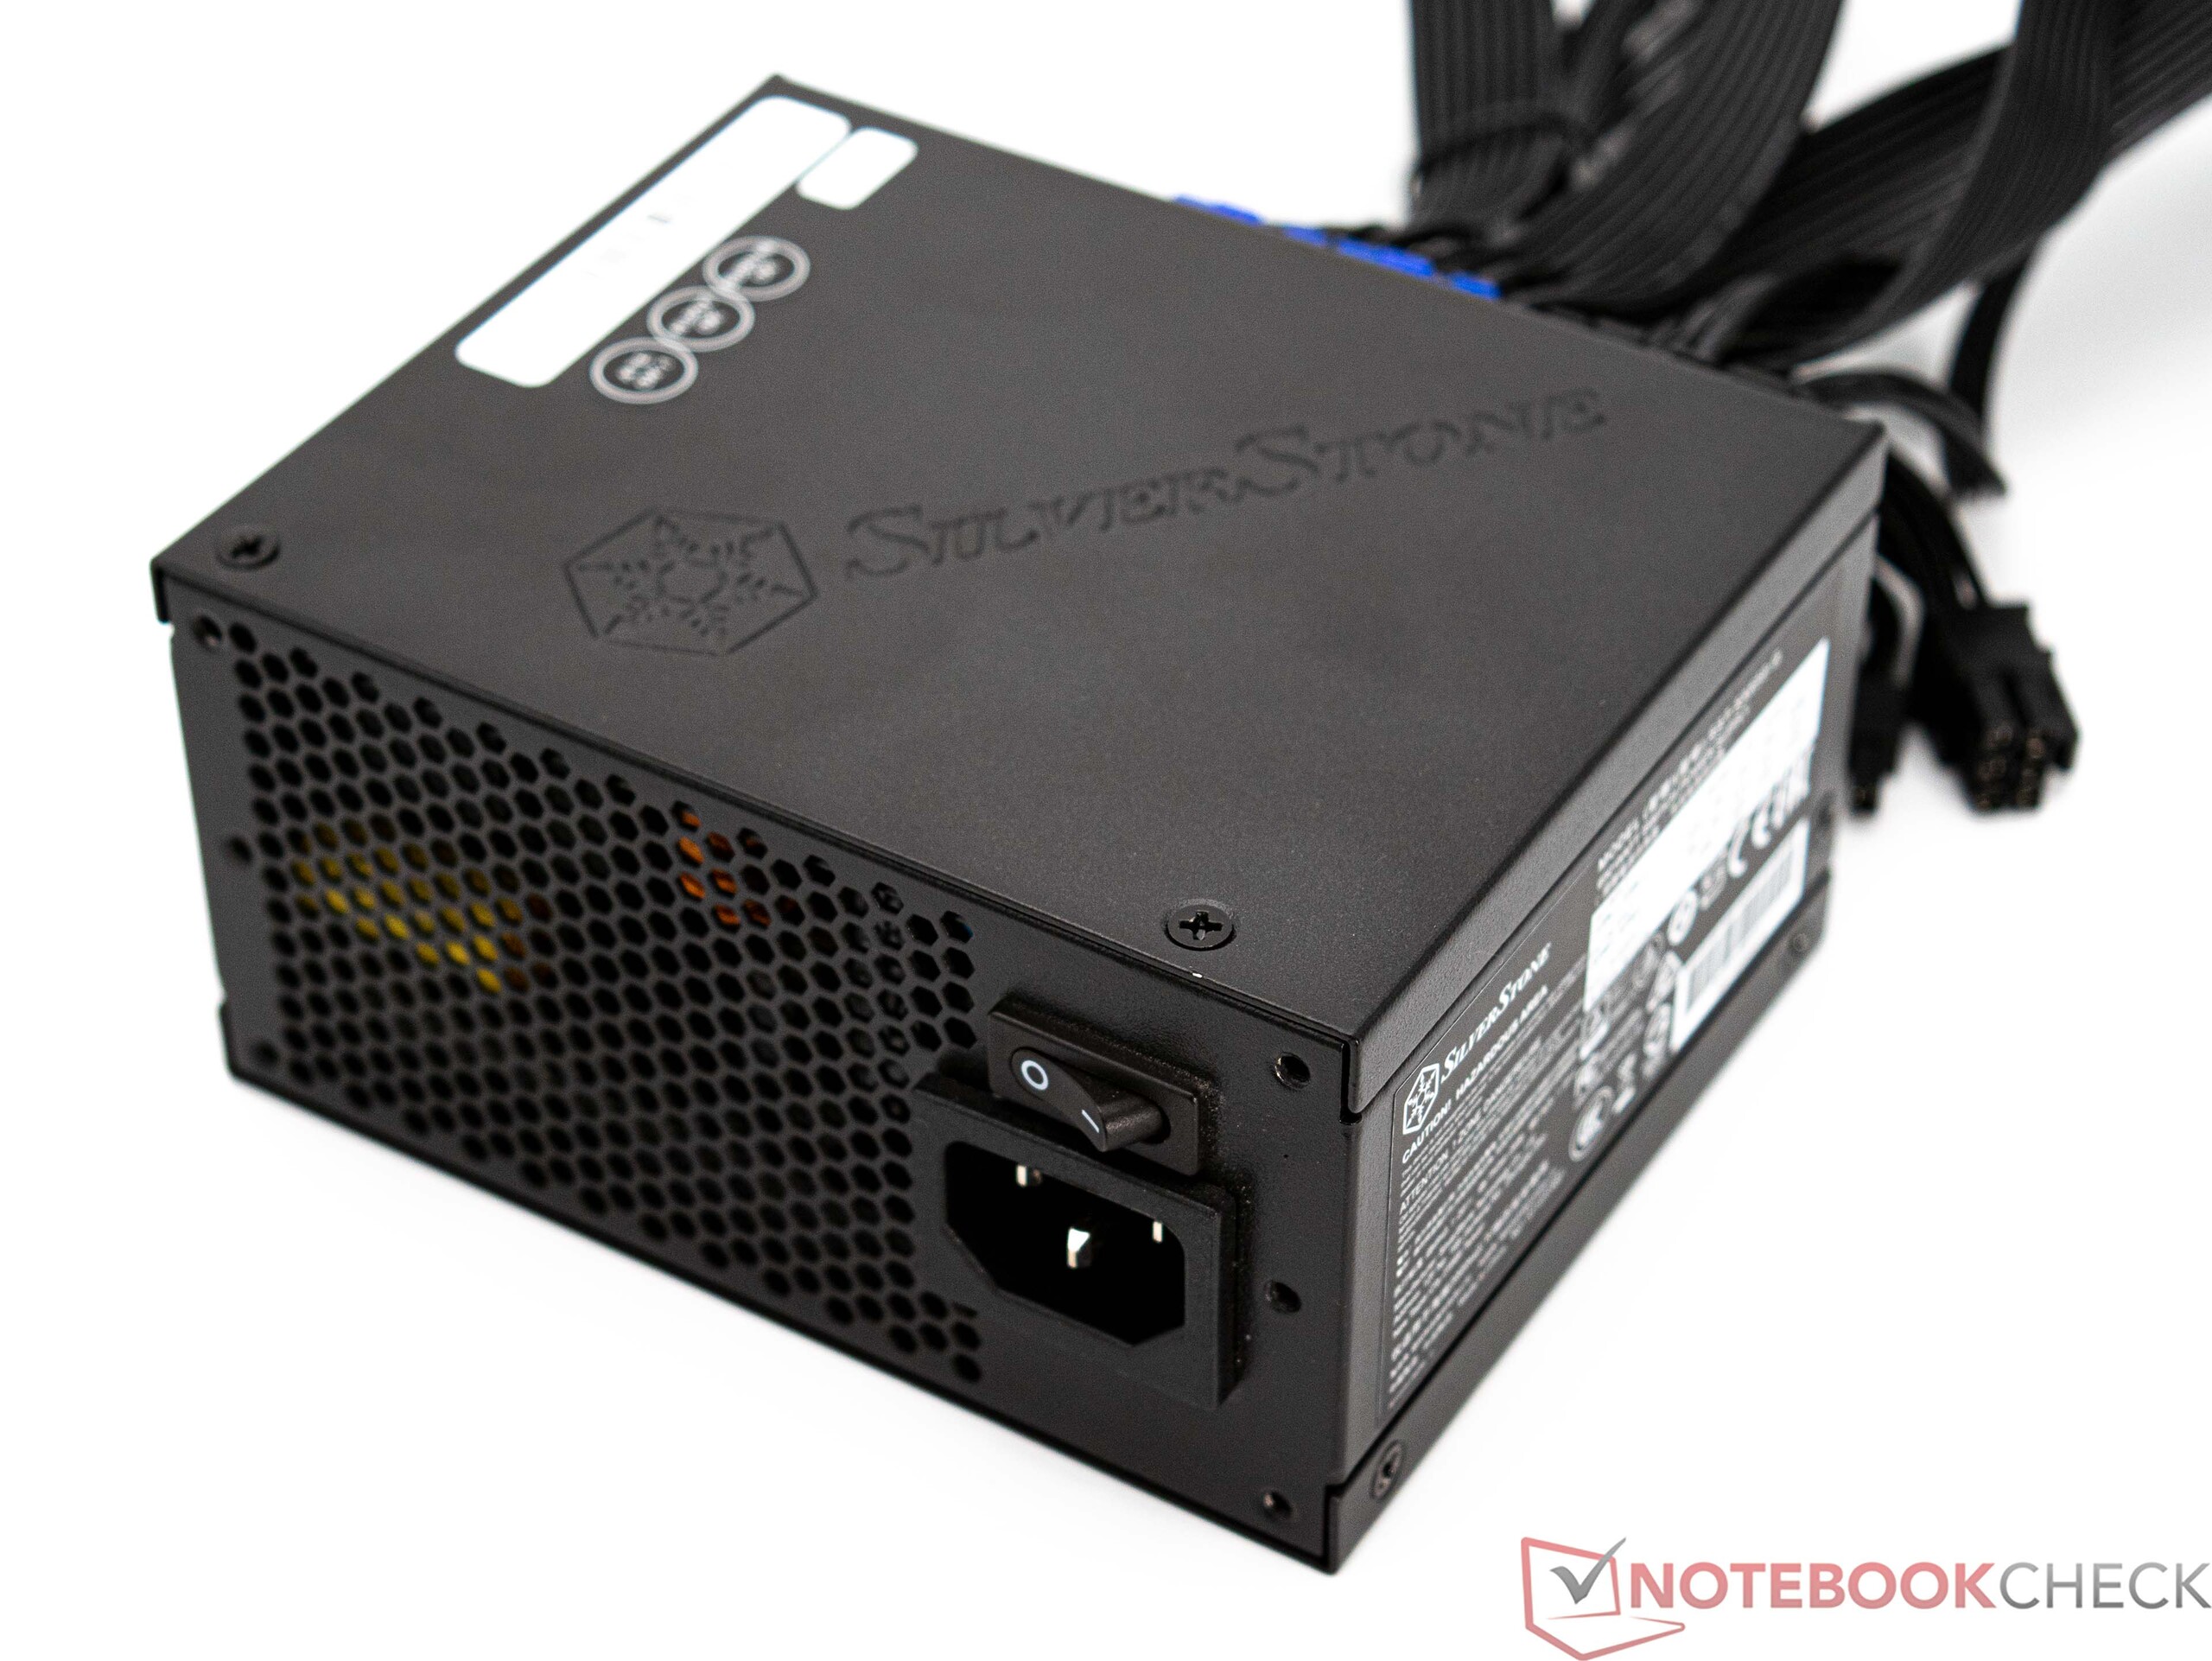
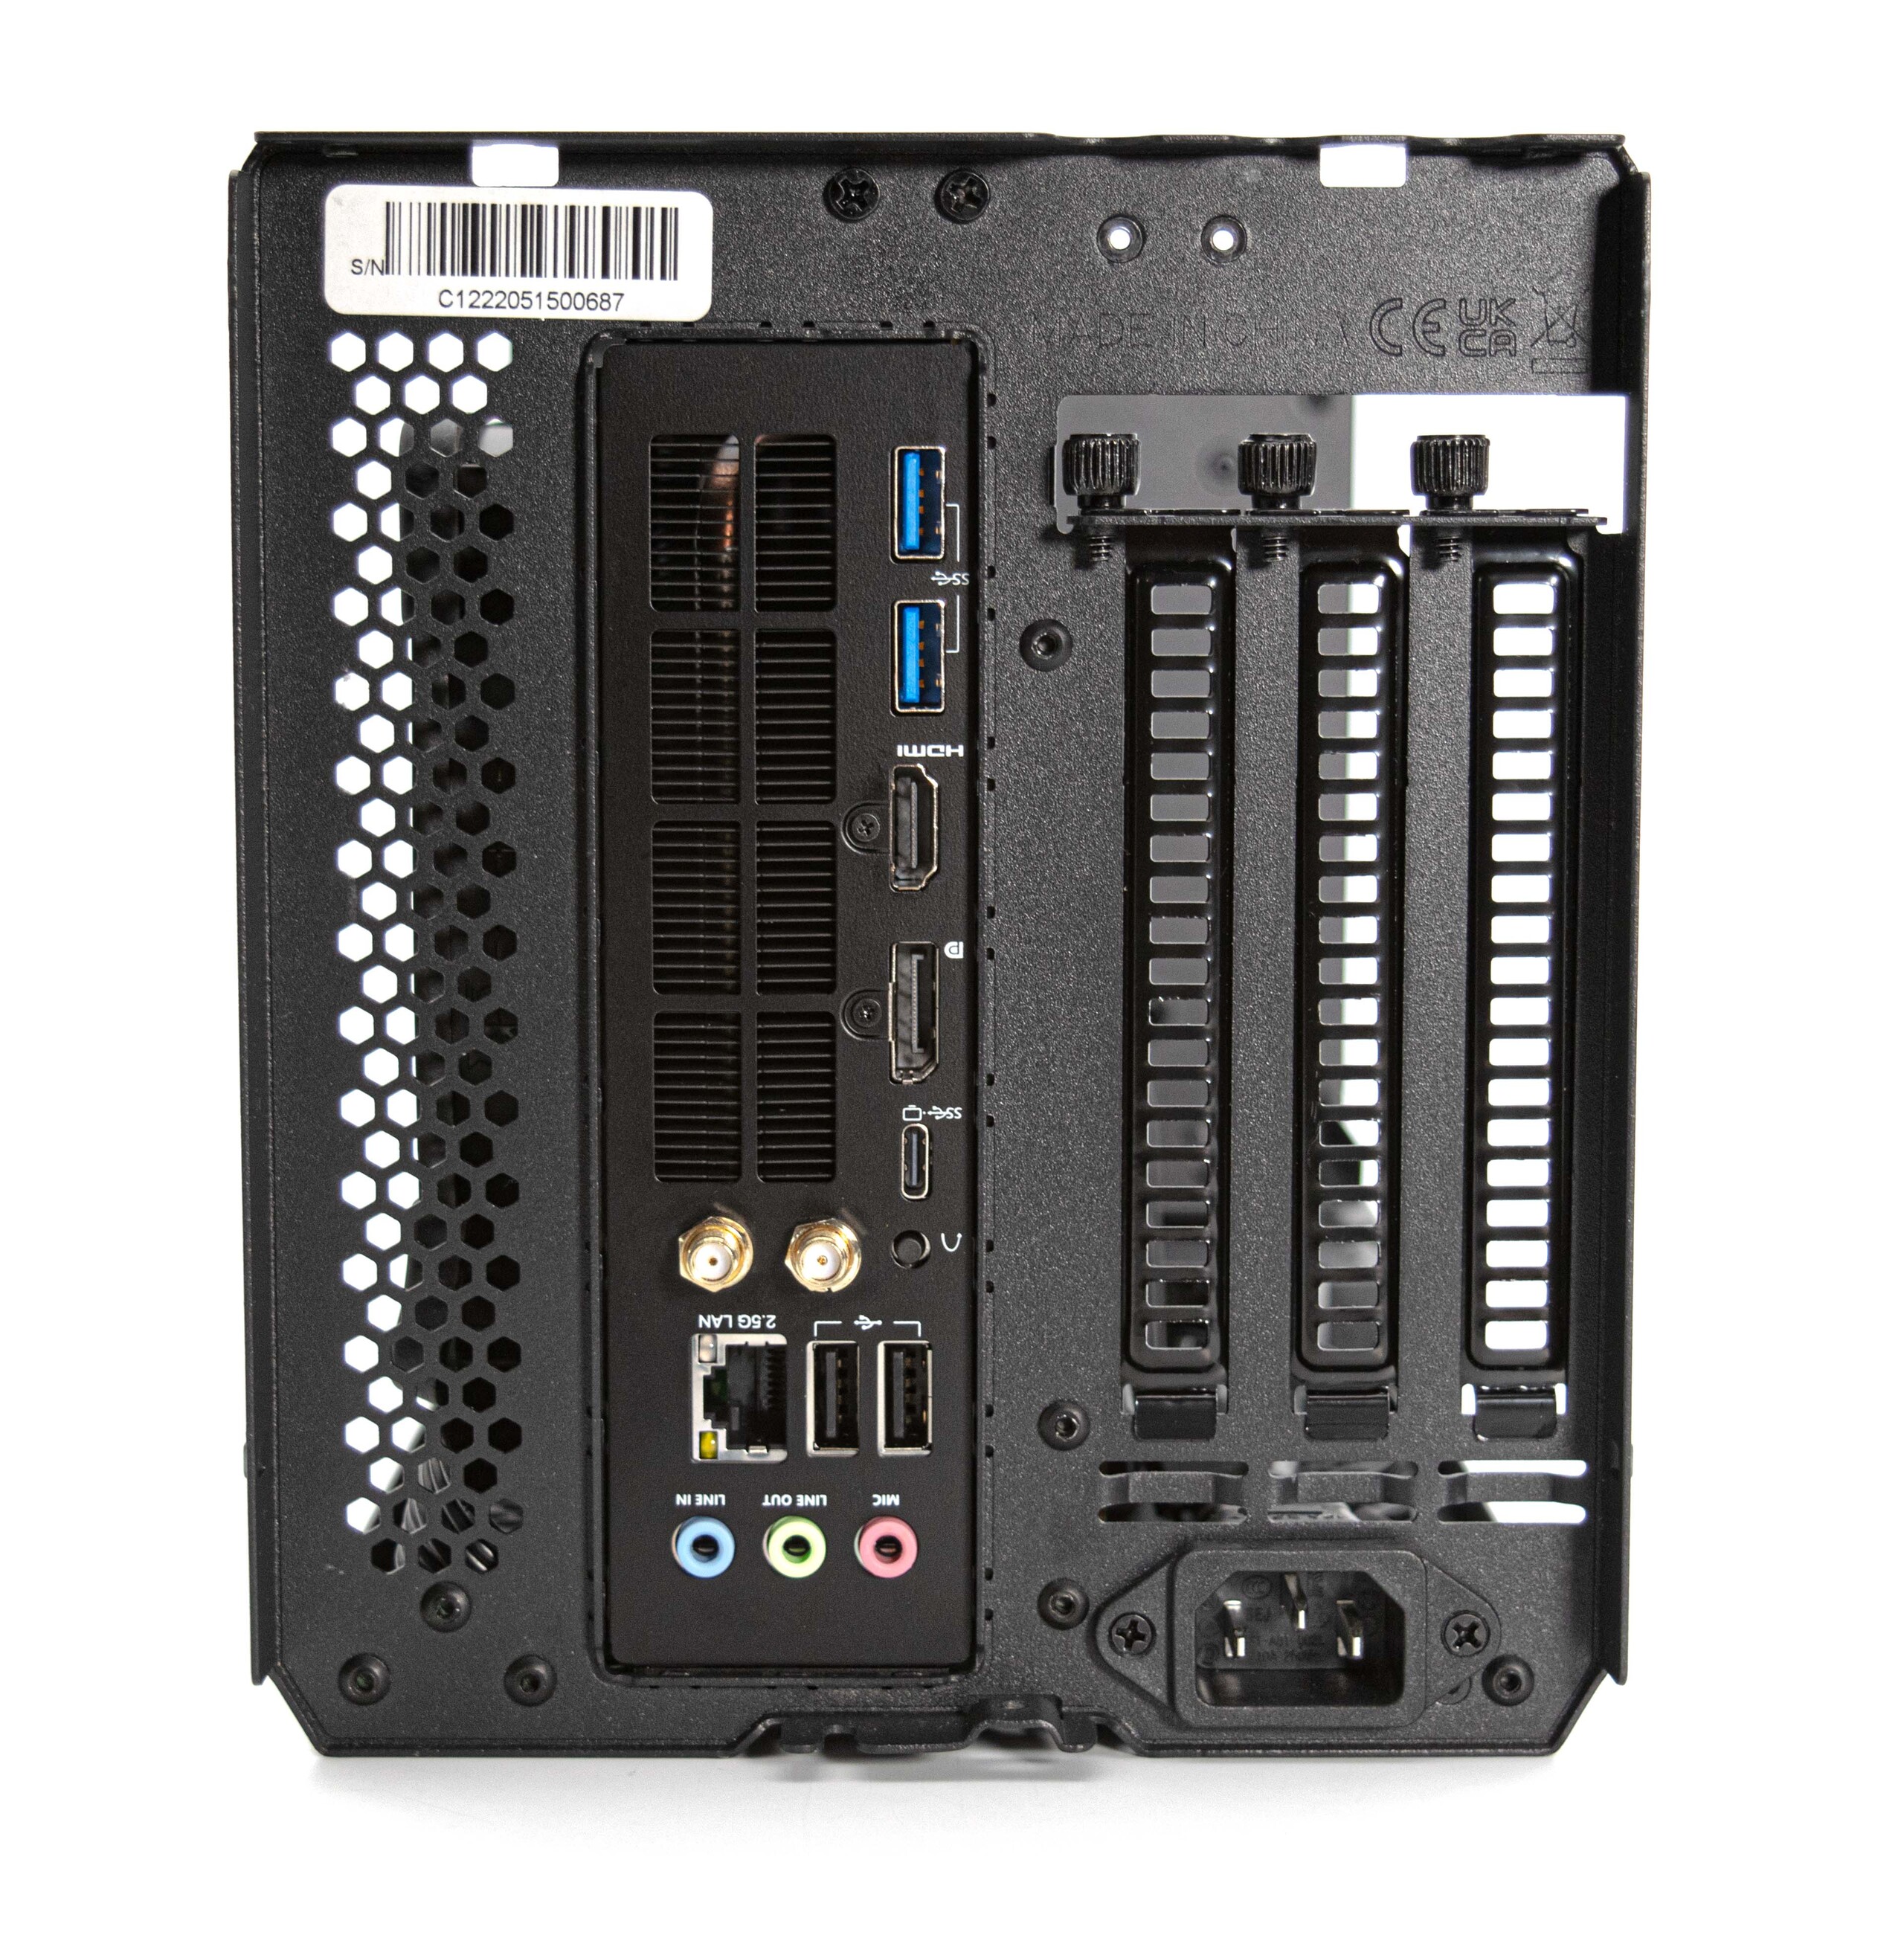
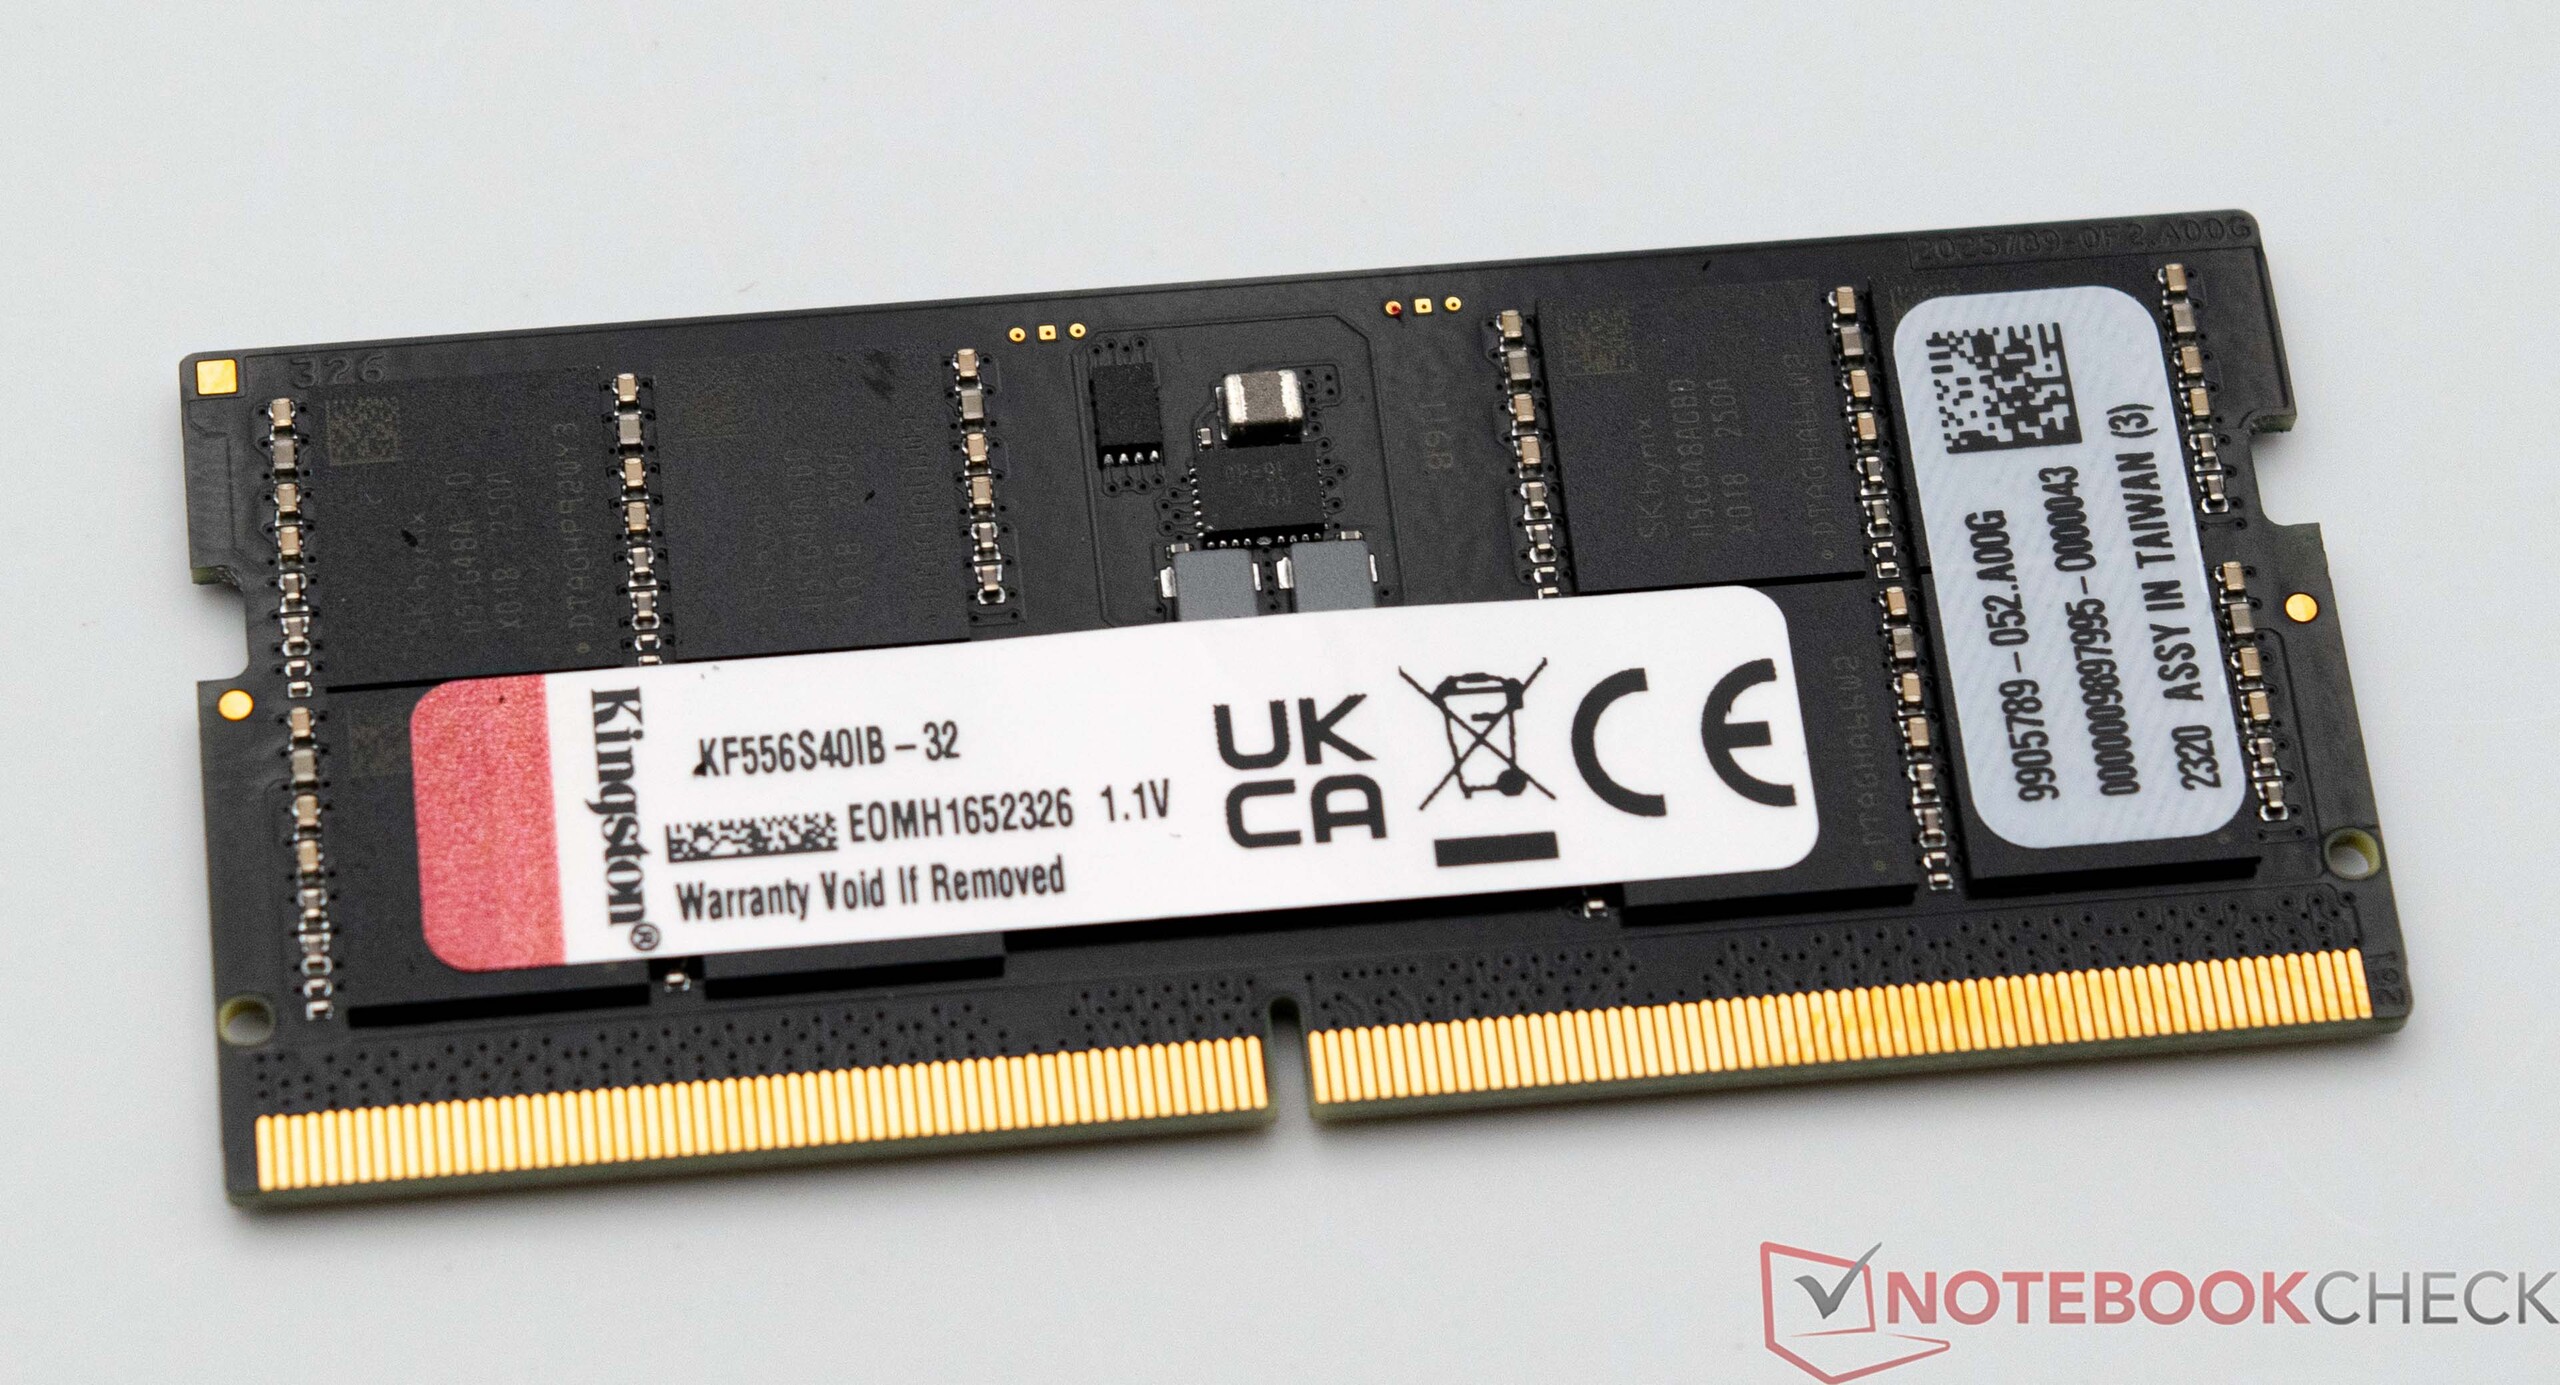
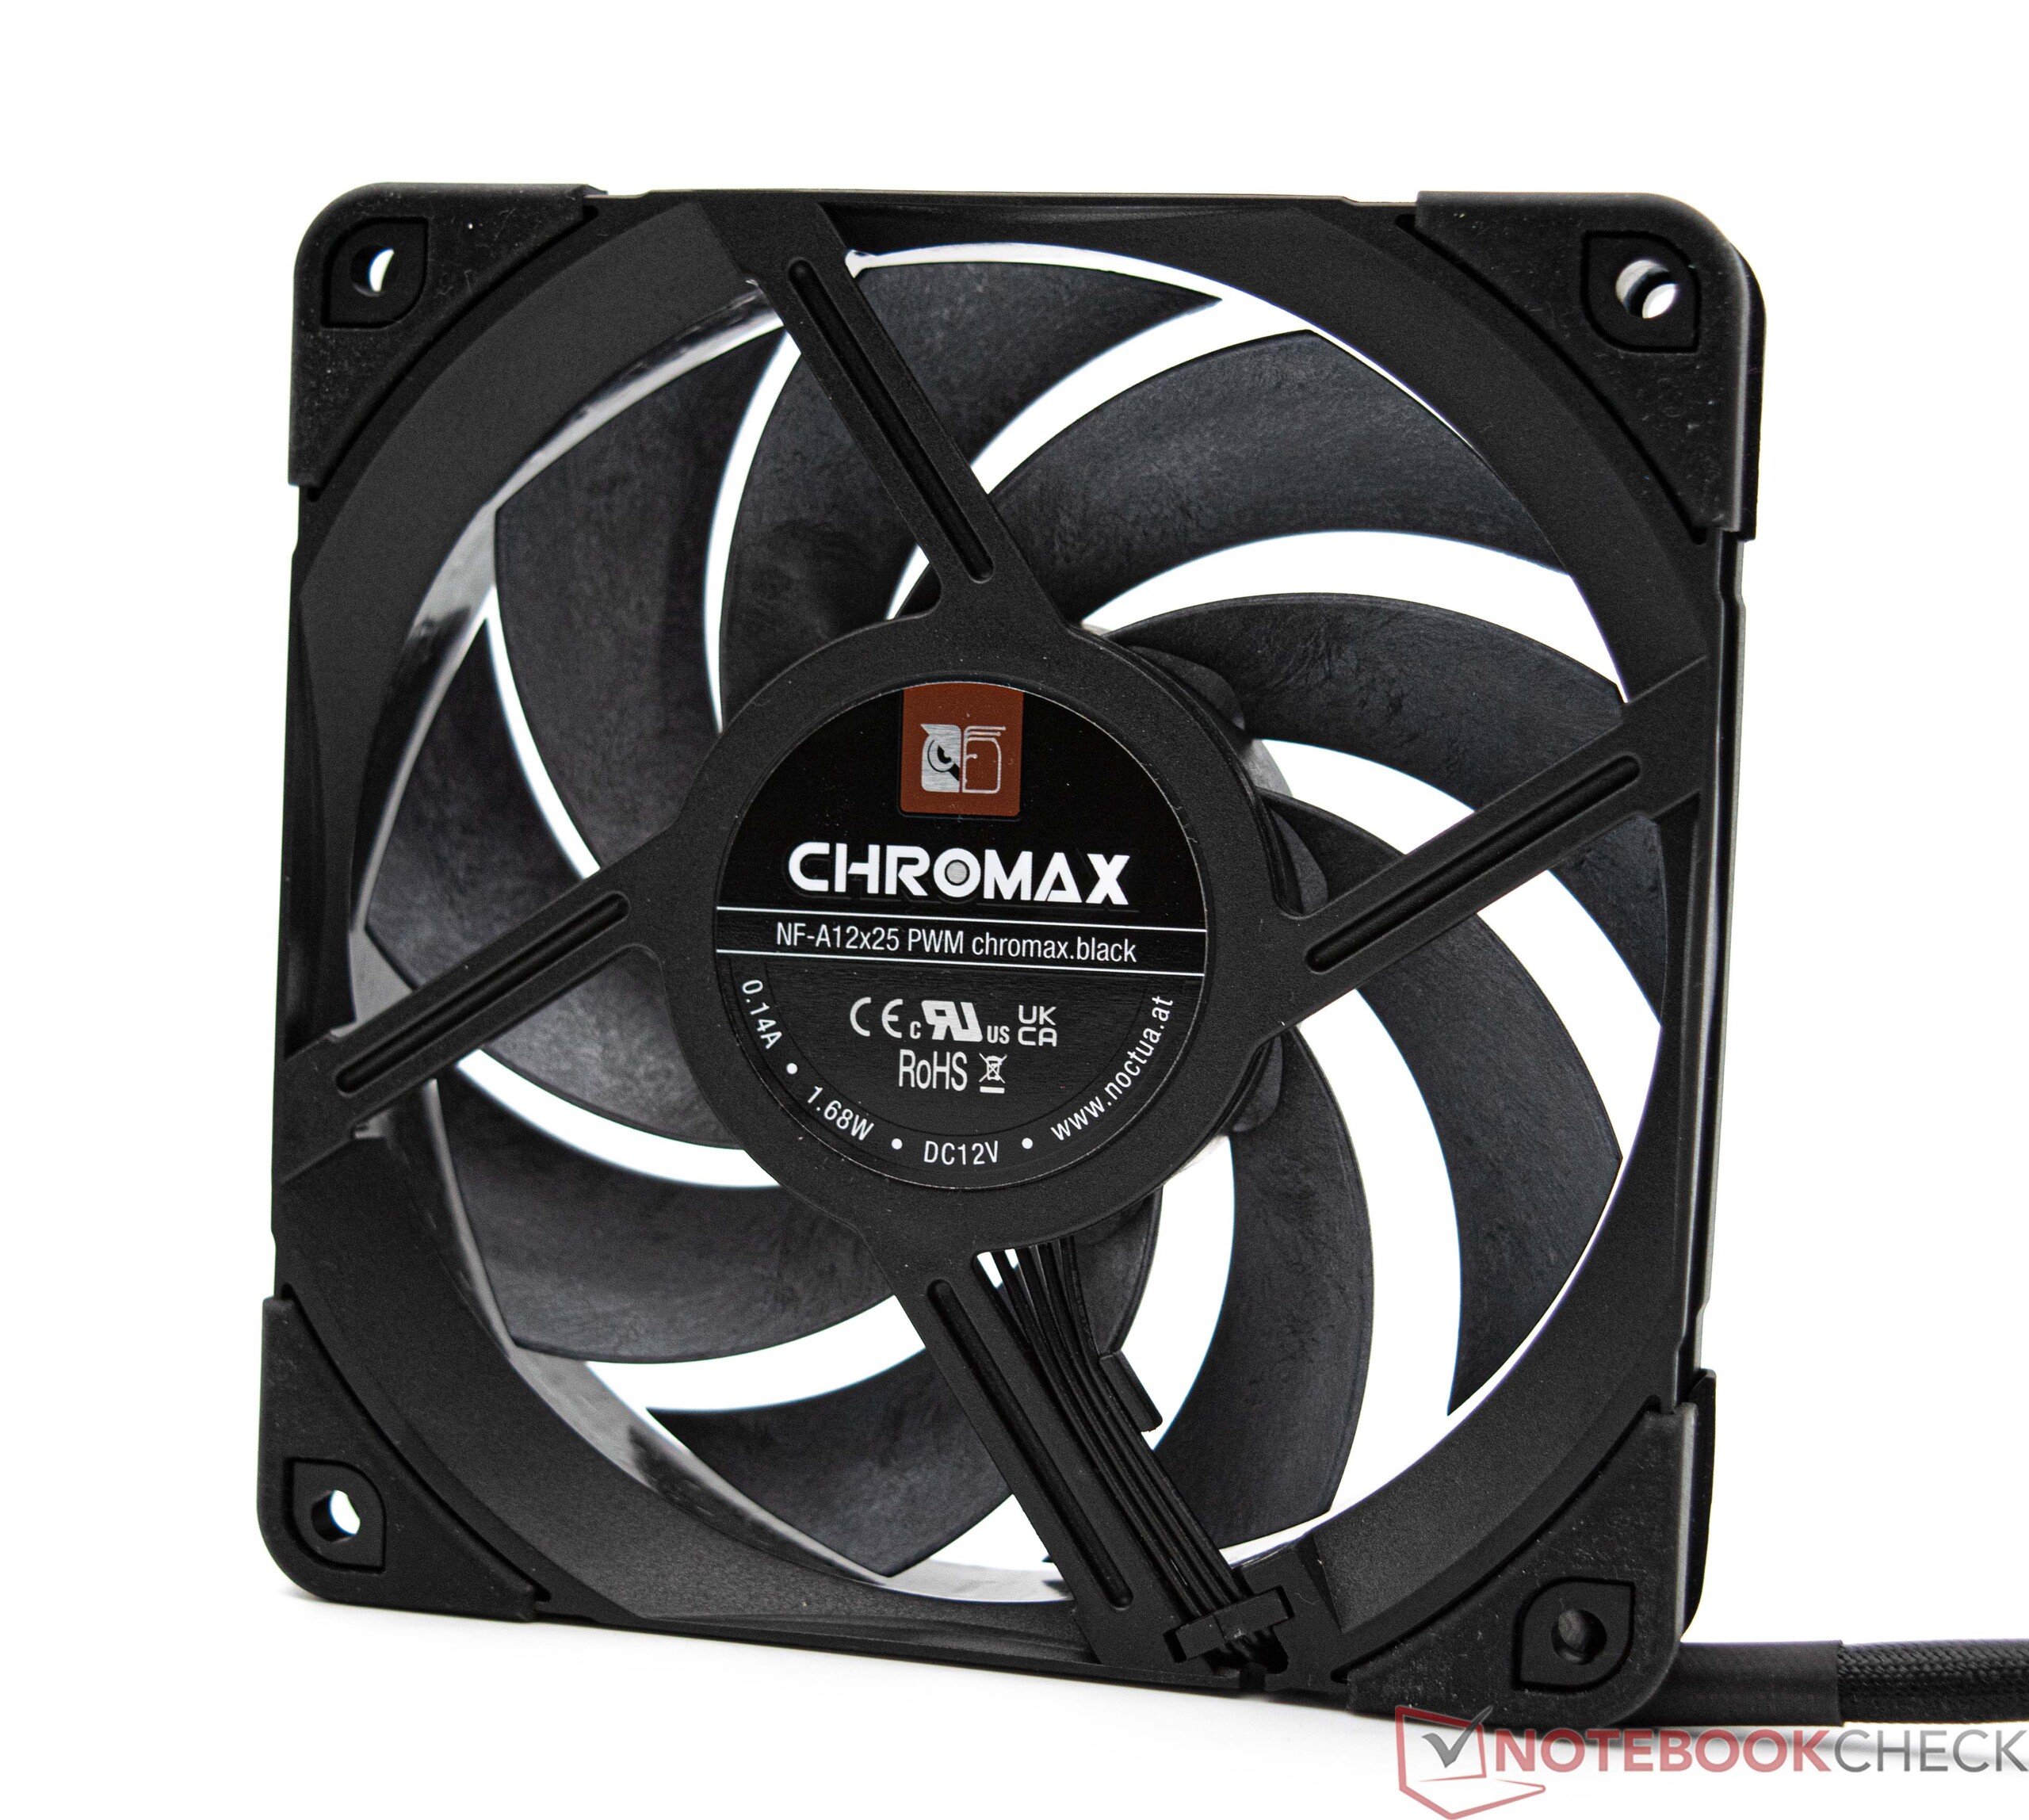
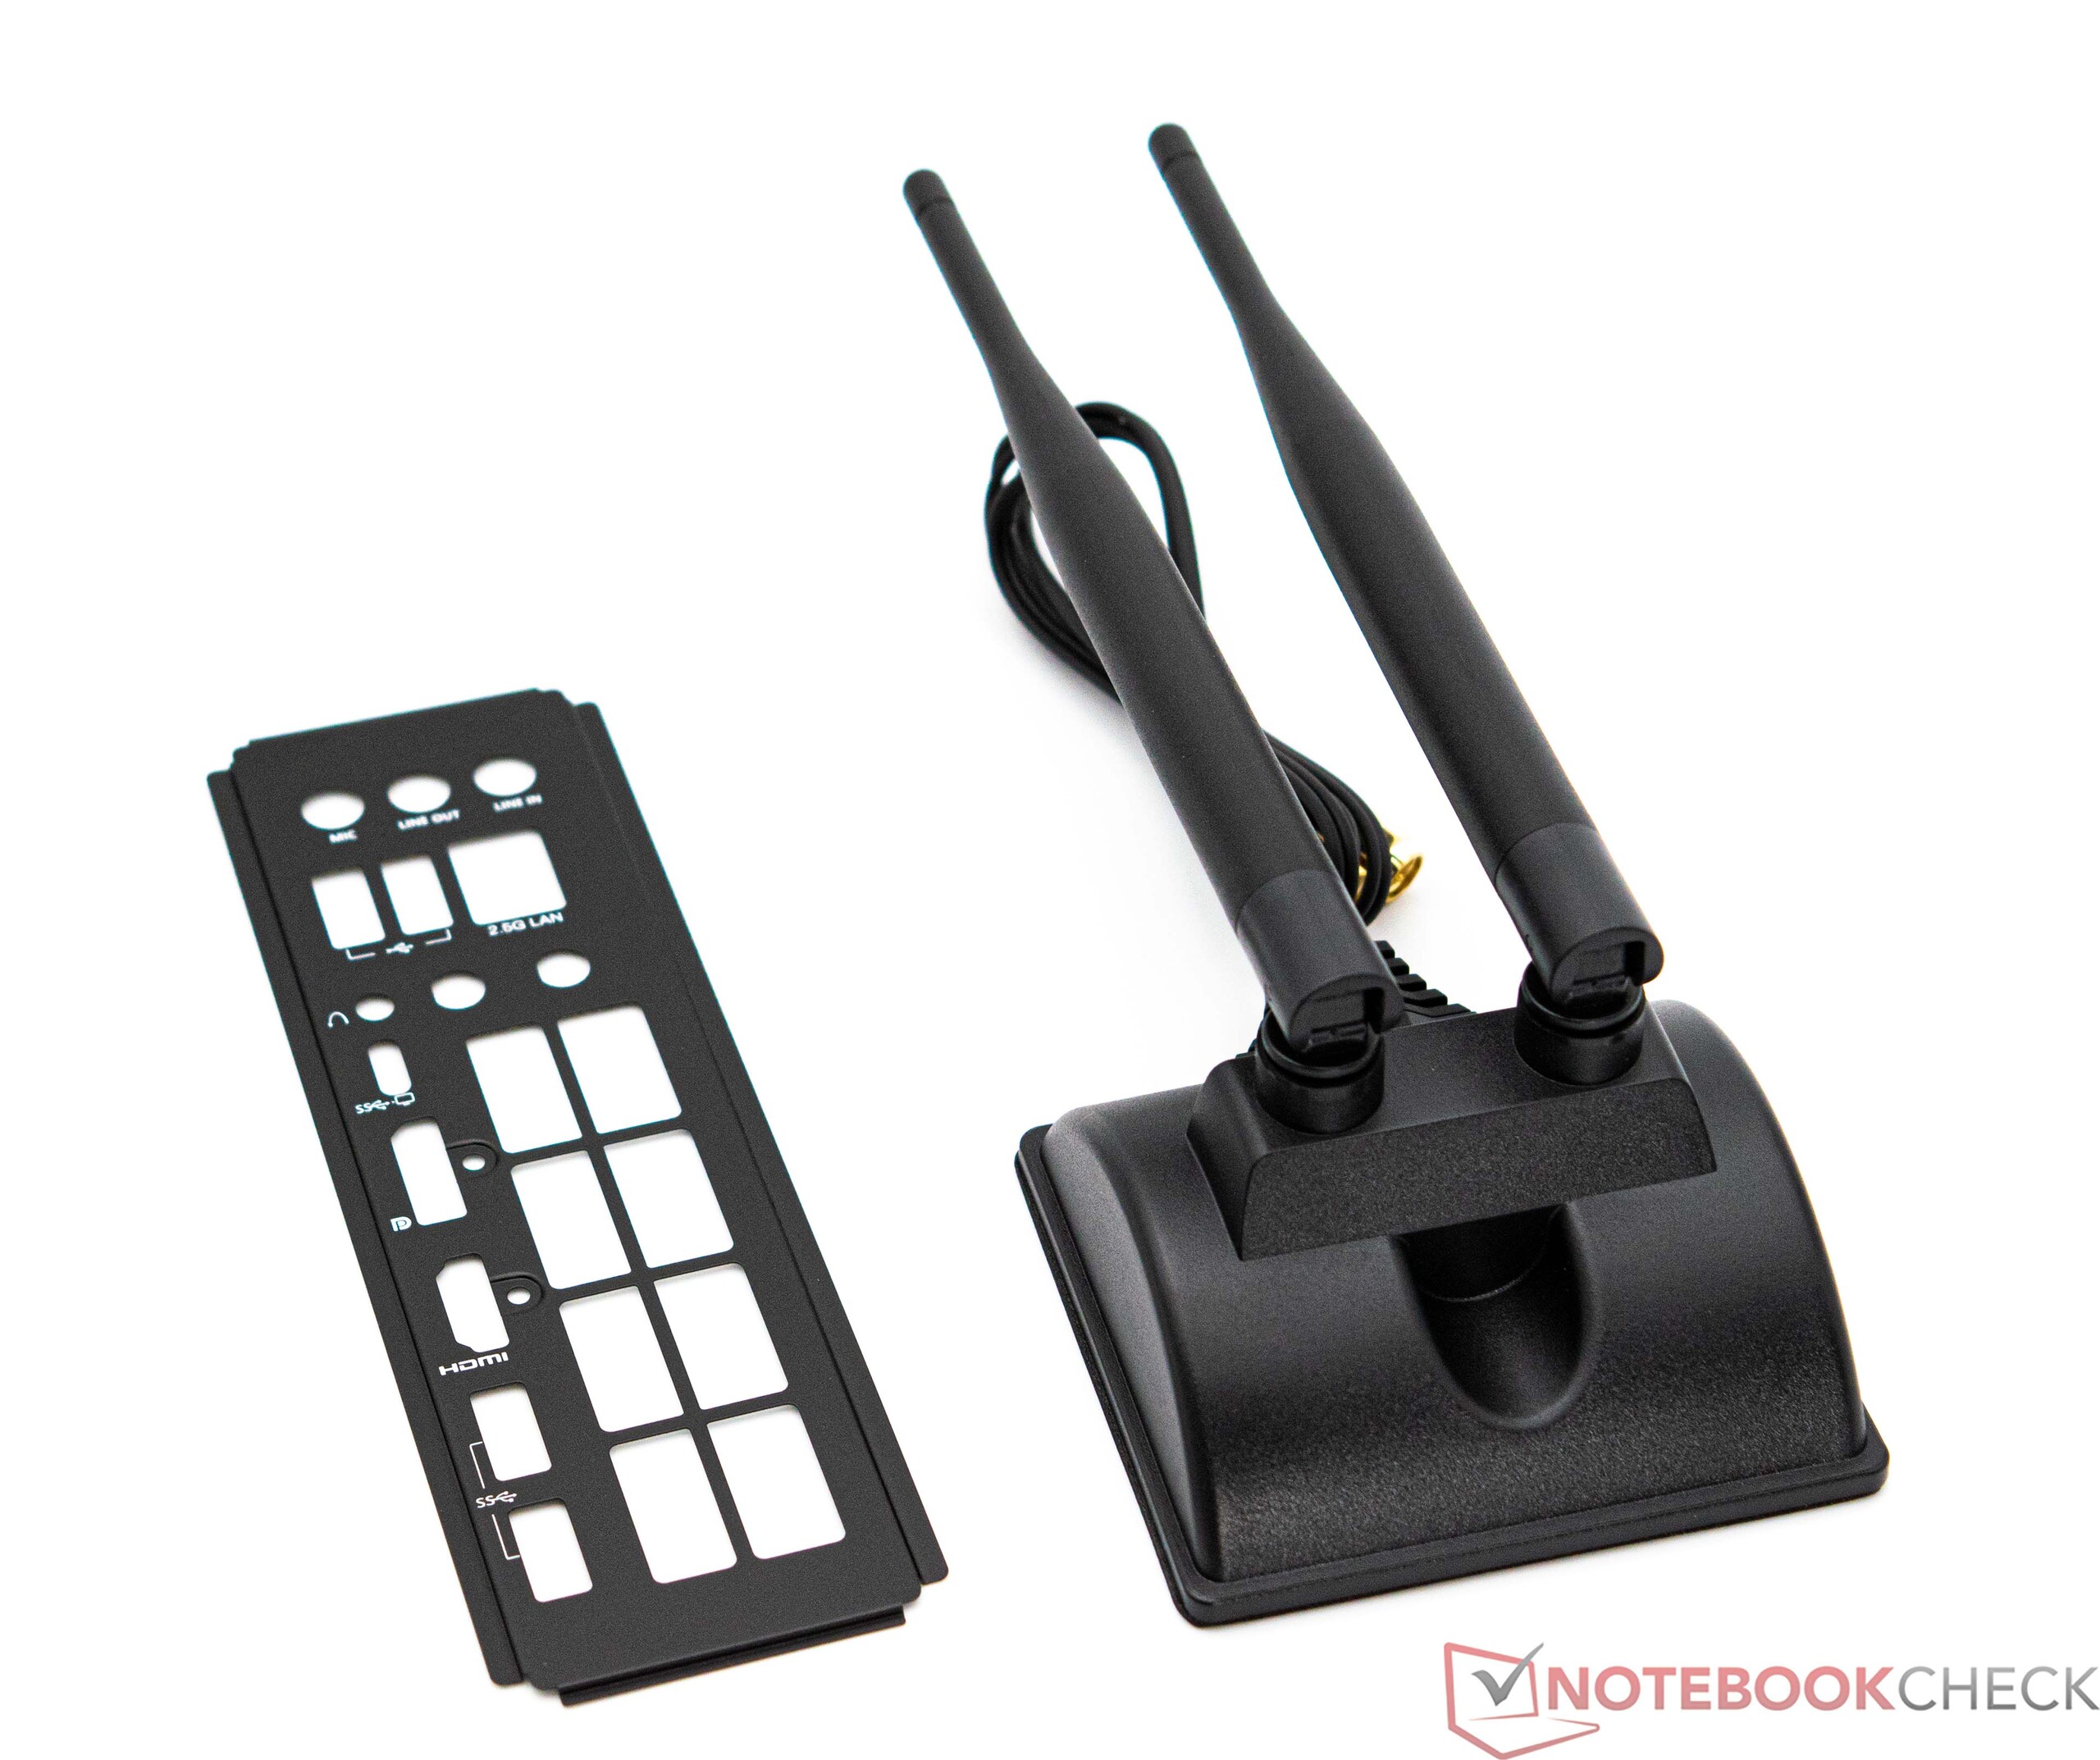
La livraison comprend la carte mère Minisforum BD770i avec un dissipateur thermique SoC déjà installé. En outre, une antenne WLAN relativement grande avec un support magnétique et le bouclier IO correspondant sont également inclus. D'autres pièces sont nécessaires pour faire fonctionner le Minisforum BD770i. Le fabricant ne propose pas de ventilateur de 120 millimètres, ni de RAM ou de SSD préinstallés. En outre, une alimentation PC appropriée est nécessaire ; elle doit être petite et au format SFX pour s'adapter au boîtier Phanteks Enthoo Evolv Shift XT. Le Minisforum BD770i constitue donc une base solide pour un PC de bricolage compact dans un format miniature.


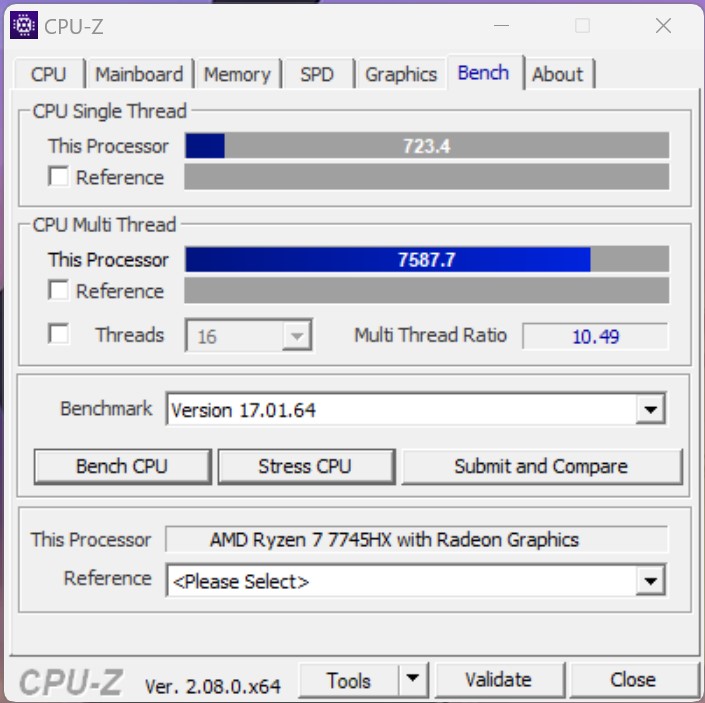
Benchmark des processeurs
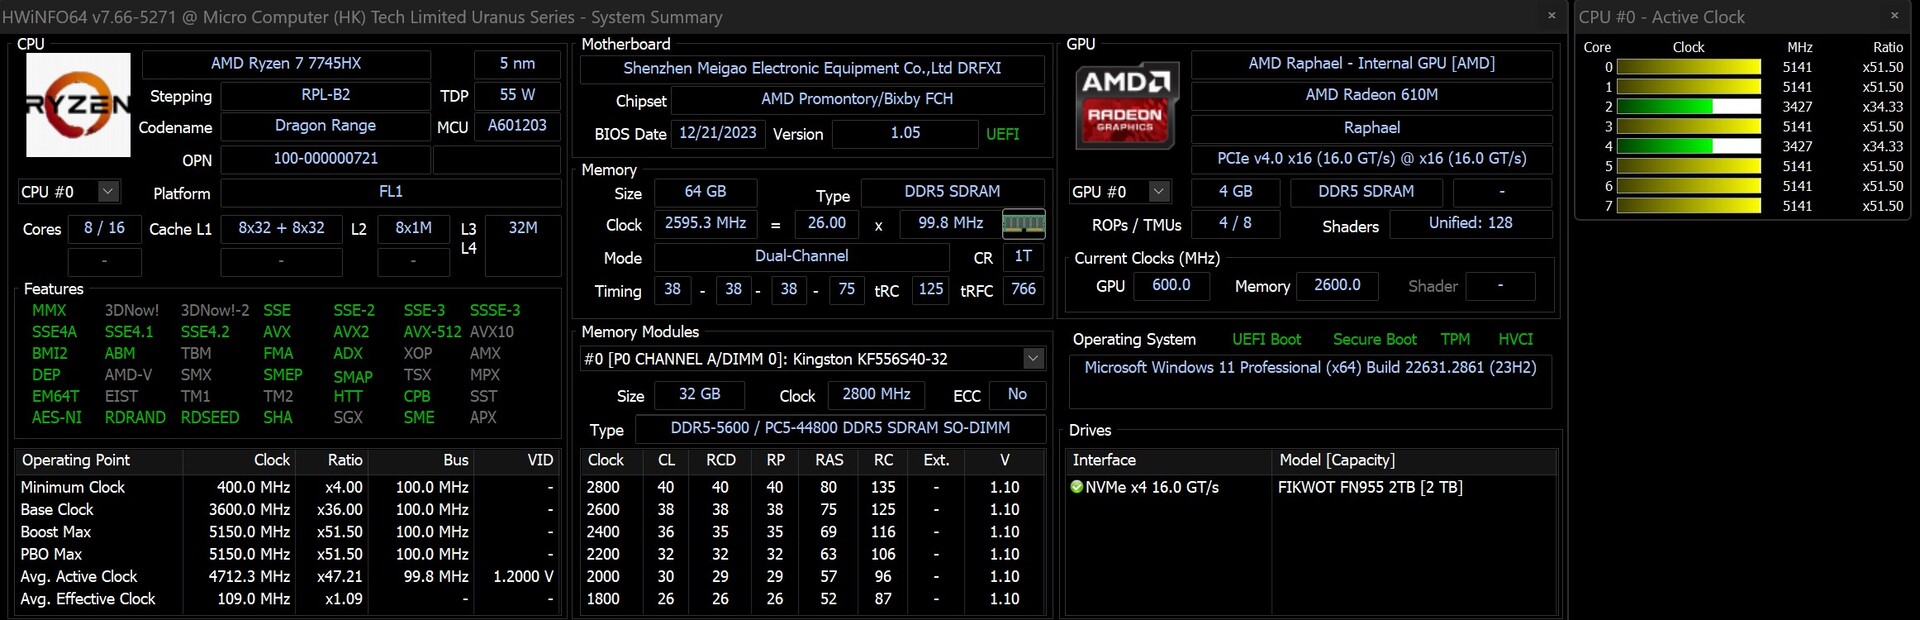
Équipé du processeur AMD Ryzen 7 7745HXla carte mère Minisforum BD770i dispose d'un SoC moderne, même s'il ne s'agit pas des derniers processeurs AMD. Néanmoins, le SoC installé se distingue par ses huit cœurs Zen4 capables de traiter 16 threads. L'excellent refroidissement garantit des performances élevées et constantes, et les limites thermiques ne sont pas aussi sévères que dans les ordinateurs portables ou les mini-PC. Dans notre évaluation des performances, l'AMD Ryzen 7 7745HX a suivi de près l'AMD Ryzen 7 7800X AMD Ryzen 7 7800X3D. Par rapport à Intel, il a surpassé un Core i5-12600Kbien qu'un Intel Core i5-13600K soit légèrement plus performant. Nous avons apprécié la stratégie consistant à intégrer un processeur mobile dans un PC de bureau traditionnel, car ces processeurs sont généralement plus faciles à refroidir tout en offrant des performances remarquables. Même un Intel Core i5-14600K n'obtient qu'une avance de dix pour cent dans l'évaluation des performances. Cela met en évidence l'évolution positive des performances des SoC mobiles dotés d'un système de refroidissement efficace. Lors des tests individuels, l'AMD Ryzen 7 7745HX peut ne pas atteindre les performances des modèles phares bien connus en raison de son nombre de cœurs inférieur.
La comparaison entre l'AMD Ryzen 7 7840HX et l'AMD Ryzen 7 7745HX est particulièrement intéressante AMD Ryzen 7 7840HS et de l'AMD AMD Ryzen 9 7940HSqui ont tous deux été évalués dans les mini-PC du Minisforum (Minisforum EliteMini UM780 XTX et Minisforum Venus Series UM790 Pro). Il ne faut pas oublier que les deux modèles HS consomment un peu moins d'énergie. Néanmoins, il devient évident que les SoC mobiles peuvent offrir des performances nettement supérieures avec un refroidissement efficace. Cela nécessite des paramètres UEFI appropriés qui permettent au processeur de recevoir une puissance plus soutenue, si les conditions thermiques le permettent. Le BD770i de Minisforum ne limite pas artificiellement les valeurs, et la limite de puissance peut être ajustée manuellement. Dans l'état par défaut, nous avons documenté une consommation stable de 75 watts pour l'AMD Ryzen 7 7745HX.
Pour d'autres comparaisons et benchmarks, veuillez vous référer à notre tableau comparatif des CPU Processeurs mobiles - indice de référence .
| Performance rating - Percent | |
| Intel Core i9-14900K | |
| Intel Core i9-13900K | |
| AMD Ryzen 9 7950X | |
| AMD Ryzen 9 7950X3D | |
| AMD Ryzen 9 7900X | |
| Intel Core i5-14600K | |
| Intel Core i9-12900K | |
| AMD Ryzen 9 5950X | |
| Intel Core i5-13600K | |
| AMD Ryzen 7 7800X3D | |
| AMD Ryzen 7 7745HX | |
| AMD Ryzen 5 7600X | |
| Intel Core i5-12600K | |
| AMD Ryzen 7 7840HS | |
| AMD Ryzen 9 7940HS | |
| Intel Core i5-13400 | |
| Intel Core i5-12400F | |
| Cinebench R15 | |
| CPU Single 64Bit | |
| Intel Core i9-14900K | |
| AMD Ryzen 9 7950X | |
| Intel Core i9-13900K | |
| AMD Ryzen 9 7950X3D | |
| AMD Ryzen 9 7900X | |
| AMD Ryzen 5 7600X | |
| Intel Core i5-14600K | |
| AMD Ryzen 7 7745HX | |
| AMD Ryzen 7 7800X3D | |
| Intel Core i5-13600K | |
| Intel Core i9-12900K | |
| AMD Ryzen 9 7940HS | |
| AMD Ryzen 7 7840HS | |
| Intel Core i5-12600K | |
| AMD Ryzen 9 5950X | |
| Intel Core i5-13400 | |
| Intel Core i5-12400F | |
| CPU Multi 64Bit | |
| Intel Core i9-14900K | |
| AMD Ryzen 9 7950X | |
| Intel Core i9-13900K | |
| AMD Ryzen 9 7950X3D | |
| AMD Ryzen 9 7900X | |
| AMD Ryzen 9 5950X | |
| Intel Core i9-12900K | |
| Intel Core i5-13600K | |
| Intel Core i5-14600K | |
| AMD Ryzen 7 7745HX | |
| AMD Ryzen 7 7800X3D | |
| AMD Ryzen 9 7940HS | |
| AMD Ryzen 7 7840HS | |
| Intel Core i5-12600K | |
| AMD Ryzen 5 7600X | |
| Intel Core i5-13400 | |
| Intel Core i5-12400F | |
| Cinebench R20 | |
| CPU (Single Core) | |
| Intel Core i9-14900K | |
| Intel Core i9-13900K | |
| AMD Ryzen 9 7950X | |
| AMD Ryzen 9 7950X3D | |
| Intel Core i5-14600K | |
| AMD Ryzen 9 7900X | |
| Intel Core i5-13600K | |
| Intel Core i9-12900K | |
| AMD Ryzen 5 7600X | |
| Intel Core i5-12600K | |
| AMD Ryzen 7 7745HX | |
| AMD Ryzen 9 7940HS | |
| AMD Ryzen 7 7800X3D | |
| AMD Ryzen 7 7840HS | |
| Intel Core i5-13400 | |
| Intel Core i5-12400F | |
| AMD Ryzen 9 5950X | |
| CPU (Multi Core) | |
| Intel Core i9-14900K | |
| Intel Core i9-13900K | |
| AMD Ryzen 9 7950X | |
| AMD Ryzen 9 7950X3D | |
| AMD Ryzen 9 7900X | |
| AMD Ryzen 9 5950X | |
| Intel Core i9-12900K | |
| Intel Core i5-14600K | |
| Intel Core i5-13600K | |
| AMD Ryzen 7 7745HX | |
| AMD Ryzen 7 7800X3D | |
| Intel Core i5-12600K | |
| AMD Ryzen 9 7940HS | |
| AMD Ryzen 7 7840HS | |
| Intel Core i5-13400 | |
| AMD Ryzen 5 7600X | |
| Intel Core i5-12400F | |
| Cinebench R23 | |
| Single Core | |
| Intel Core i9-14900K | |
| Intel Core i9-13900K | |
| Intel Core i5-14600K | |
| AMD Ryzen 9 7950X3D | |
| AMD Ryzen 9 7950X | |
| AMD Ryzen 9 7900X | |
| Intel Core i5-13600K | |
| Intel Core i9-12900K | |
| AMD Ryzen 5 7600X | |
| Intel Core i5-12600K | |
| AMD Ryzen 7 7745HX | |
| AMD Ryzen 7 7800X3D | |
| AMD Ryzen 9 7940HS | |
| Intel Core i5-13400 | |
| AMD Ryzen 7 7840HS | |
| Intel Core i5-12400F | |
| AMD Ryzen 9 5950X | |
| Multi Core | |
| Intel Core i9-14900K | |
| Intel Core i9-13900K | |
| AMD Ryzen 9 7950X | |
| AMD Ryzen 9 7950X3D | |
| AMD Ryzen 9 7900X | |
| AMD Ryzen 9 5950X | |
| Intel Core i9-12900K | |
| Intel Core i5-14600K | |
| Intel Core i5-13600K | |
| AMD Ryzen 7 7745HX | |
| AMD Ryzen 7 7800X3D | |
| Intel Core i5-12600K | |
| AMD Ryzen 9 7940HS | |
| AMD Ryzen 7 7840HS | |
| Intel Core i5-13400 | |
| AMD Ryzen 5 7600X | |
| Intel Core i5-12400F | |
| Cinebench R11.5 | |
| CPU Single 64Bit | |
| Intel Core i9-14900K | |
| Intel Core i9-13900K | |
| AMD Ryzen 9 7950X | |
| AMD Ryzen 9 7950X3D | |
| AMD Ryzen 9 7900X | |
| AMD Ryzen 5 7600X | |
| Intel Core i5-14600K | |
| AMD Ryzen 7 7745HX | |
| Intel Core i9-12900K | |
| Intel Core i5-13600K | |
| AMD Ryzen 9 7940HS | |
| AMD Ryzen 7 7800X3D | |
| AMD Ryzen 7 7840HS | |
| Intel Core i5-12600K | |
| AMD Ryzen 9 5950X | |
| Intel Core i5-13400 | |
| Intel Core i5-12400F | |
| CPU Multi 64Bit | |
| Intel Core i9-14900K | |
| Intel Core i9-13900K | |
| AMD Ryzen 9 7950X | |
| AMD Ryzen 9 7950X3D | |
| AMD Ryzen 9 7900X | |
| AMD Ryzen 9 5950X | |
| Intel Core i9-12900K | |
| Intel Core i5-13600K | |
| Intel Core i5-14600K | |
| AMD Ryzen 7 7745HX | |
| AMD Ryzen 7 7800X3D | |
| AMD Ryzen 9 7940HS | |
| AMD Ryzen 7 7840HS | |
| Intel Core i5-12600K | |
| AMD Ryzen 5 7600X | |
| Intel Core i5-13400 | |
| Intel Core i5-12400F | |
| Cinebench R10 | |
| Rendering Single CPUs 64Bit | |
| Intel Core i9-14900K | |
| Intel Core i9-13900K | |
| Intel Core i5-14600K | |
| AMD Ryzen 9 7900X | |
| AMD Ryzen 9 7950X | |
| Intel Core i5-13600K | |
| Intel Core i9-12900K | |
| AMD Ryzen 5 7600X | |
| Intel Core i5-12600K | |
| AMD Ryzen 7 7745HX | |
| AMD Ryzen 9 7940HS | |
| AMD Ryzen 7 7800X3D | |
| AMD Ryzen 7 7840HS | |
| Intel Core i5-13400 | |
| Intel Core i5-12400F | |
| AMD Ryzen 9 5950X | |
| AMD Ryzen 9 7950X3D | |
| Rendering Multiple CPUs 64Bit | |
| Intel Core i9-14900K | |
| Intel Core i9-13900K | |
| AMD Ryzen 9 7950X | |
| AMD Ryzen 9 7900X | |
| Intel Core i5-14600K | |
| Intel Core i9-12900K | |
| Intel Core i5-13600K | |
| AMD Ryzen 9 5950X | |
| AMD Ryzen 7 7745HX | |
| AMD Ryzen 7 7800X3D | |
| AMD Ryzen 5 7600X | |
| Intel Core i5-12600K | |
| AMD Ryzen 9 7940HS | |
| AMD Ryzen 7 7840HS | |
| Intel Core i5-13400 | |
| AMD Ryzen 9 7950X3D | |
| Intel Core i5-12400F | |
| Blender - v2.79 BMW27 CPU | |
| Intel Core i5-12400F | |
| Intel Core i5-13400 | |
| AMD Ryzen 5 7600X | |
| AMD Ryzen 7 7840HS | |
| Intel Core i5-12600K | |
| AMD Ryzen 9 7940HS | |
| AMD Ryzen 7 7800X3D | |
| AMD Ryzen 7 7745HX | |
| Intel Core i5-13600K | |
| Intel Core i5-14600K | |
| Intel Core i9-12900K | |
| AMD Ryzen 9 5950X | |
| AMD Ryzen 9 7900X | |
| AMD Ryzen 9 7950X3D | |
| AMD Ryzen 9 7950X | |
| Intel Core i9-13900K | |
| Intel Core i9-14900K | |
| wPrime 2.10 | |
| 32m | |
| Intel Core i9-12900K | |
| Intel Core i5-12600K | |
| Intel Core i5-12400F | |
| Intel Core i5-13400 | |
| AMD Ryzen 5 7600X | |
| AMD Ryzen 9 7940HS | |
| AMD Ryzen 7 7840HS | |
| AMD Ryzen 9 5950X | |
| Intel Core i5-13600K | |
| AMD Ryzen 7 7800X3D | |
| Intel Core i5-14600K | |
| AMD Ryzen 7 7745HX | |
| Intel Core i9-14900K | |
| AMD Ryzen 9 7950X3D | |
| Intel Core i9-13900K | |
| AMD Ryzen 9 7900X | |
| AMD Ryzen 9 7950X | |
| 1024m | |
| Intel Core i5-13400 | |
| Intel Core i5-12600K | |
| Intel Core i9-12900K | |
| Intel Core i5-13600K | |
| Intel Core i5-14600K | |
| Intel Core i5-12400F | |
| Intel Core i9-13900K | |
| AMD Ryzen 5 7600X | |
| Intel Core i9-14900K | |
| AMD Ryzen 7 7840HS | |
| AMD Ryzen 9 7940HS | |
| AMD Ryzen 9 5950X | |
| AMD Ryzen 7 7800X3D | |
| AMD Ryzen 7 7745HX | |
| AMD Ryzen 9 7900X | |
| AMD Ryzen 9 7950X3D | |
| AMD Ryzen 9 7950X | |
| X264 HD Benchmark 4.0 | |
| Pass 1 | |
| Intel Core i9-14900K | |
| Intel Core i9-13900K | |
| Intel Core i5-14600K | |
| AMD Ryzen 9 7950X3D | |
| Intel Core i5-13600K | |
| AMD Ryzen 9 7950X | |
| AMD Ryzen 9 7900X | |
| Intel Core i9-12900K | |
| AMD Ryzen 5 7600X | |
| AMD Ryzen 7 7745HX | |
| AMD Ryzen 7 7800X3D | |
| AMD Ryzen 9 5950X | |
| Intel Core i5-12600K | |
| Intel Core i5-13400 | |
| AMD Ryzen 9 7940HS | |
| AMD Ryzen 7 7840HS | |
| Intel Core i5-12400F | |
| Pass 2 | |
| Intel Core i9-14900K | |
| Intel Core i9-13900K | |
| AMD Ryzen 9 7950X | |
| AMD Ryzen 9 7950X3D | |
| AMD Ryzen 9 7900X | |
| AMD Ryzen 9 5950X | |
| Intel Core i5-14600K | |
| Intel Core i9-12900K | |
| Intel Core i5-13600K | |
| AMD Ryzen 7 7745HX | |
| AMD Ryzen 7 7800X3D | |
| AMD Ryzen 9 7940HS | |
| AMD Ryzen 7 7840HS | |
| Intel Core i5-12600K | |
| AMD Ryzen 5 7600X | |
| Intel Core i5-13400 | |
| Intel Core i5-12400F | |
| WinRAR - Result | |
| AMD Ryzen 9 7900X | |
| AMD Ryzen 7 7800X3D | |
| AMD Ryzen 9 7950X | |
| AMD Ryzen 5 7600X | |
| Intel Core i9-14900K | |
| AMD Ryzen 9 7950X3D | |
| Intel Core i9-13900K | |
| AMD Ryzen 7 7745HX | |
| AMD Ryzen 9 5950X | |
| Intel Core i5-14600K | |
| Intel Core i5-13600K | |
| Intel Core i9-12900K | |
| Intel Core i5-13400 | |
| Intel Core i5-12400F | |
| AMD Ryzen 7 7840HS | |
| AMD Ryzen 9 7940HS | |
| Intel Core i5-12600K | |
| Geekbench 5.5 | |
| Multi-Core | |
| Intel Core i9-14900K | |
| AMD Ryzen 9 7950X | |
| AMD Ryzen 9 7950X3D | |
| Intel Core i9-13900K | |
| AMD Ryzen 9 7900X | |
| Intel Core i9-12900K | |
| Intel Core i5-14600K | |
| AMD Ryzen 9 5950X | |
| Intel Core i5-13600K | |
| AMD Ryzen 7 7800X3D | |
| AMD Ryzen 7 7745HX | |
| Intel Core i5-12600K | |
| AMD Ryzen 7 7840HS | |
| Intel Core i5-13400 | |
| AMD Ryzen 5 7600X | |
| AMD Ryzen 9 7940HS | |
| Intel Core i5-12400F | |
| Single-Core | |
| AMD Ryzen 9 7950X | |
| AMD Ryzen 9 7950X3D | |
| Intel Core i9-13900K | |
| AMD Ryzen 9 7900X | |
| Intel Core i9-14900K | |
| AMD Ryzen 5 7600X | |
| AMD Ryzen 7 7745HX | |
| Intel Core i9-12900K | |
| AMD Ryzen 7 7800X3D | |
| Intel Core i5-14600K | |
| AMD Ryzen 9 7940HS | |
| Intel Core i5-13600K | |
| AMD Ryzen 7 7840HS | |
| Intel Core i5-12600K | |
| Intel Core i5-13400 | |
| Intel Core i5-12400F | |
| AMD Ryzen 9 5950X | |
| Geekbench 5.0 | |
| 5.0 Multi-Core | |
| Intel Core i9-14900K | |
| AMD Ryzen 9 7950X | |
| Intel Core i9-13900K | |
| AMD Ryzen 9 7950X3D | |
| AMD Ryzen 9 7900X | |
| Intel Core i9-12900K | |
| Intel Core i5-14600K | |
| Intel Core i5-13600K | |
| AMD Ryzen 9 5950X | |
| AMD Ryzen 7 7800X3D | |
| AMD Ryzen 7 7745HX | |
| Intel Core i5-12600K | |
| AMD Ryzen 7 7840HS | |
| AMD Ryzen 5 7600X | |
| Intel Core i5-13400 | |
| AMD Ryzen 9 7940HS | |
| Intel Core i5-12400F | |
| 5.0 Single-Core | |
| Intel Core i9-14900K | |
| AMD Ryzen 9 7950X | |
| Intel Core i9-13900K | |
| AMD Ryzen 9 7900X | |
| AMD Ryzen 9 7950X3D | |
| AMD Ryzen 5 7600X | |
| Intel Core i5-14600K | |
| AMD Ryzen 7 7745HX | |
| Intel Core i9-12900K | |
| AMD Ryzen 7 7800X3D | |
| Intel Core i5-13600K | |
| AMD Ryzen 7 7840HS | |
| AMD Ryzen 9 7940HS | |
| Intel Core i5-12600K | |
| Intel Core i5-13400 | |
| AMD Ryzen 9 5950X | |
| Intel Core i5-12400F | |
| Geekbench 4.4 | |
| 64 Bit Single-Core Score | |
| Intel Core i9-14900K | |
| Intel Core i9-13900K | |
| AMD Ryzen 9 7950X | |
| AMD Ryzen 9 7950X3D | |
| AMD Ryzen 9 7900X | |
| AMD Ryzen 7 7800X3D | |
| AMD Ryzen 5 7600X | |
| Intel Core i5-14600K | |
| Intel Core i9-12900K | |
| Intel Core i5-13600K | |
| AMD Ryzen 7 7745HX | |
| Intel Core i5-12600K | |
| AMD Ryzen 7 7840HS | |
| AMD Ryzen 9 7940HS | |
| Intel Core i5-13400 | |
| Intel Core i5-12400F | |
| AMD Ryzen 9 5950X | |
| 64 Bit Multi-Core Score | |
| AMD Ryzen 9 7950X | |
| Intel Core i9-14900K | |
| AMD Ryzen 9 7950X3D | |
| Intel Core i9-13900K | |
| AMD Ryzen 9 7900X | |
| Intel Core i5-14600K | |
| Intel Core i9-12900K | |
| AMD Ryzen 9 5950X | |
| Intel Core i5-13600K | |
| AMD Ryzen 7 7800X3D | |
| AMD Ryzen 7 7745HX | |
| AMD Ryzen 7 7840HS | |
| AMD Ryzen 5 7600X | |
| Intel Core i5-12600K | |
| AMD Ryzen 9 7940HS | |
| Intel Core i5-13400 | |
| Intel Core i5-12400F | |
| 3DMark 11 - 1280x720 Performance Physics | |
| AMD Ryzen 9 7950X3D | |
| AMD Ryzen 7 7800X3D | |
| Intel Core i9-13900K | |
| Intel Core i9-14900K | |
| Intel Core i5-14600K | |
| Intel Core i5-13600K | |
| AMD Ryzen 9 7900X | |
| AMD Ryzen 9 7950X | |
| Intel Core i9-12900K | |
| AMD Ryzen 7 7745HX | |
| AMD Ryzen 5 7600X | |
| AMD Ryzen 9 5950X | |
| Intel Core i5-12600K | |
| Intel Core i5-13400 | |
| AMD Ryzen 7 7840HS | |
| AMD Ryzen 9 7940HS | |
| Intel Core i5-12400F | |
| 7-Zip 18.03 | |
| 7z b 4 | |
| AMD Ryzen 9 7950X | |
| AMD Ryzen 9 7950X3D | |
| Intel Core i9-14900K | |
| Intel Core i9-13900K | |
| AMD Ryzen 9 5950X | |
| AMD Ryzen 9 7900X | |
| Intel Core i9-12900K | |
| Intel Core i5-14600K | |
| Intel Core i5-13600K | |
| AMD Ryzen 7 7800X3D | |
| AMD Ryzen 7 7745HX | |
| AMD Ryzen 7 7840HS | |
| AMD Ryzen 9 7940HS | |
| AMD Ryzen 5 7600X | |
| Intel Core i5-12600K | |
| Intel Core i5-13400 | |
| Intel Core i5-12400F | |
| 7z b 4 -mmt1 | |
| AMD Ryzen 9 7950X | |
| AMD Ryzen 9 7950X3D | |
| AMD Ryzen 9 7900X | |
| AMD Ryzen 7 7800X3D | |
| AMD Ryzen 5 7600X | |
| Intel Core i9-14900K | |
| AMD Ryzen 7 7745HX | |
| Intel Core i9-13900K | |
| AMD Ryzen 9 5950X | |
| Intel Core i5-14600K | |
| AMD Ryzen 9 7940HS | |
| Intel Core i9-12900K | |
| AMD Ryzen 7 7840HS | |
| Intel Core i5-13600K | |
| Intel Core i5-12600K | |
| Intel Core i5-13400 | |
| Intel Core i5-12400F | |
| HWBOT x265 Benchmark v2.2 - 4k Preset | |
| AMD Ryzen 9 7950X | |
| Intel Core i9-14900K | |
| Intel Core i9-13900K | |
| AMD Ryzen 9 7950X3D | |
| AMD Ryzen 9 7900X | |
| AMD Ryzen 9 5950X | |
| Intel Core i5-12600K | |
| Intel Core i9-12900K | |
| Intel Core i5-14600K | |
| Intel Core i5-13600K | |
| AMD Ryzen 7 7800X3D | |
| AMD Ryzen 7 7745HX | |
| AMD Ryzen 5 7600X | |
| AMD Ryzen 7 7840HS | |
| AMD Ryzen 9 7940HS | |
| Intel Core i5-13400 | |
| Intel Core i5-12400F | |
| R Benchmark 2.5 - Overall mean | |
| Intel Core i5-12400F | |
| Intel Core i5-13400 | |
| AMD Ryzen 9 5950X | |
| Intel Core i5-12600K | |
| AMD Ryzen 7 7840HS | |
| Intel Core i9-12900K | |
| AMD Ryzen 9 7940HS | |
| AMD Ryzen 7 7800X3D | |
| AMD Ryzen 7 7745HX | |
| Intel Core i5-13600K | |
| Intel Core i5-14600K | |
| AMD Ryzen 5 7600X | |
| AMD Ryzen 9 7900X | |
| AMD Ryzen 9 7950X3D | |
| AMD Ryzen 9 7950X | |
| Intel Core i9-13900K | |
| Intel Core i9-14900K | |
| LibreOffice - 20 Documents To PDF | |
| Intel Core i5-12600K | |
| AMD Ryzen 7 7840HS | |
| Intel Core i5-12400F | |
| AMD Ryzen 9 7940HS | |
| AMD Ryzen 9 5950X | |
| AMD Ryzen 7 7745HX | |
| AMD Ryzen 7 7800X3D | |
| Intel Core i9-12900K | |
| Intel Core i5-13400 | |
| AMD Ryzen 9 7950X3D | |
| AMD Ryzen 5 7600X | |
| Intel Core i9-13900K | |
| AMD Ryzen 9 7950X | |
| Intel Core i5-13600K | |
| AMD Ryzen 9 7900X | |
| Intel Core i9-14900K | |
| Intel Core i5-14600K | |
| WebXPRT 3 - Overall | |
| AMD Ryzen 9 7950X3D | |
| Intel Core i9-14900K | |
| AMD Ryzen 9 7900X | |
| AMD Ryzen 9 7950X | |
| AMD Ryzen 5 7600X | |
| Intel Core i9-13900K | |
| Intel Core i5-14600K | |
| AMD Ryzen 7 7800X3D | |
| AMD Ryzen 7 7745HX | |
| Intel Core i5-13600K | |
| AMD Ryzen 7 7840HS | |
| Intel Core i9-12900K | |
| Intel Core i5-13400 | |
| AMD Ryzen 9 7940HS | |
| Intel Core i5-12600K | |
| AMD Ryzen 9 5950X | |
| Intel Core i5-12400F | |
| Mozilla Kraken 1.1 - Total | |
| Intel Core i5-12400F | |
| AMD Ryzen 9 5950X | |
| Intel Core i5-13400 | |
| AMD Ryzen 7 7840HS | |
| Intel Core i5-12600K | |
| AMD Ryzen 7 7800X3D | |
| AMD Ryzen 9 7940HS | |
| Intel Core i9-12900K | |
| AMD Ryzen 7 7745HX | |
| Intel Core i5-13600K | |
| Intel Core i5-14600K | |
| AMD Ryzen 5 7600X | |
| AMD Ryzen 9 7950X3D | |
| AMD Ryzen 9 7950X | |
| Intel Core i9-13900K | |
| AMD Ryzen 9 7900X | |
| Intel Core i9-14900K | |
| 3DMark | |
| 1920x1080 Fire Strike Physics | |
| Intel Core i9-14900K | |
| Intel Core i9-13900K | |
| AMD Ryzen 9 7950X3D | |
| AMD Ryzen 9 7900X | |
| AMD Ryzen 9 7950X | |
| Intel Core i5-14600K | |
| AMD Ryzen 9 5950X | |
| Intel Core i9-12900K | |
| Intel Core i5-13600K | |
| AMD Ryzen 7 7800X3D | |
| AMD Ryzen 5 7600X | |
| Intel Core i5-12600K | |
| AMD Ryzen 7 7840HS | |
| AMD Ryzen 9 7940HS | |
| Intel Core i5-13400 | |
| Intel Core i5-12400F | |
| AMD Ryzen 7 7745HX | |
| 2560x1440 Time Spy CPU | |
| Intel Core i9-14900K | |
| Intel Core i9-13900K | |
| Intel Core i5-14600K | |
| Intel Core i9-12900K | |
| AMD Ryzen 9 7950X3D | |
| Intel Core i5-13600K | |
| AMD Ryzen 9 7900X | |
| AMD Ryzen 9 7950X | |
| AMD Ryzen 7 7800X3D | |
| Intel Core i5-12600K | |
| AMD Ryzen 9 5950X | |
| Intel Core i5-13400 | |
| AMD Ryzen 7 7840HS | |
| AMD Ryzen 7 7745HX | |
| AMD Ryzen 9 7940HS | |
| AMD Ryzen 5 7600X | |
| Intel Core i5-12400F | |
* ... Moindre est la valeur, meilleures sont les performances
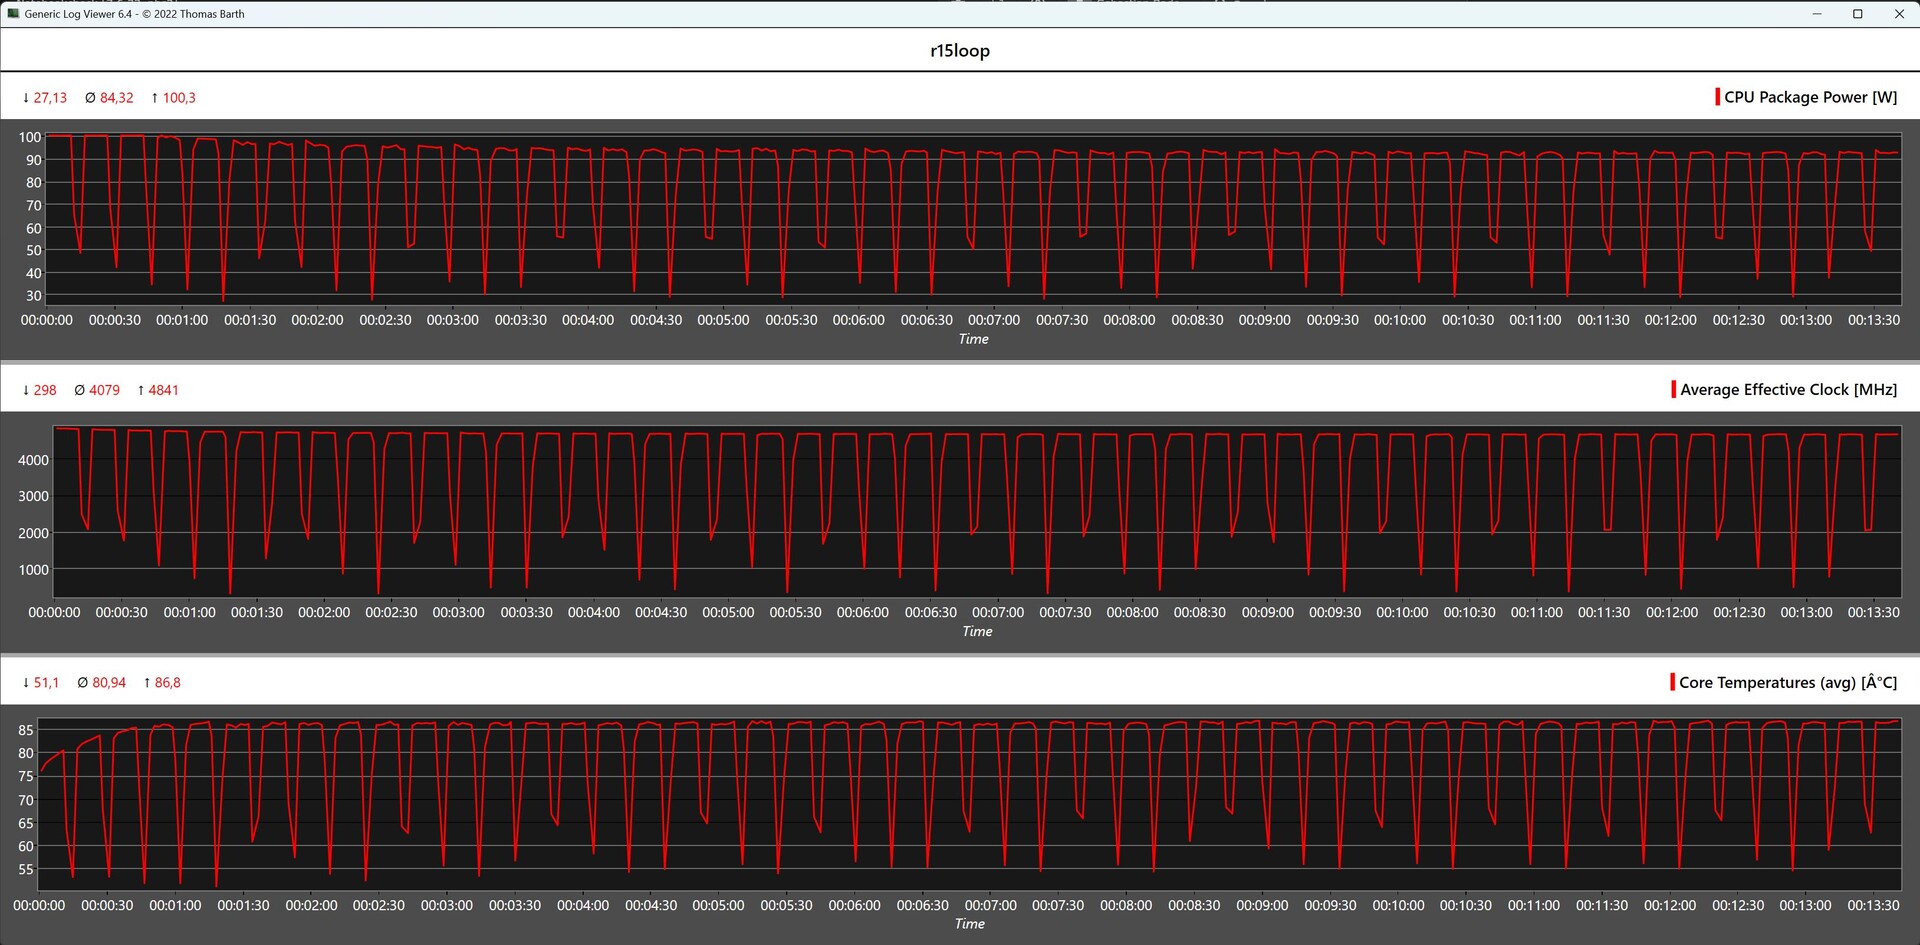
Résultats Cinebench AMD Ryzen 7 7745HX
Le test Cinebench R15 Multi continuous donne un premier aperçu des performances de la solution de refroidissement installée. Dans l'ensemble, l'AMD Ryzen 7 7745HX affiche des performances relativement stables. Avec un score moyen de 2 867 points, notre échantillon de test a obtenu un résultat exceptionnel dans ce scénario. Il surpasse notamment le résultat obtenu par l'AMD Ryzen 7 7840HS dans cette mesure.
Performance du système
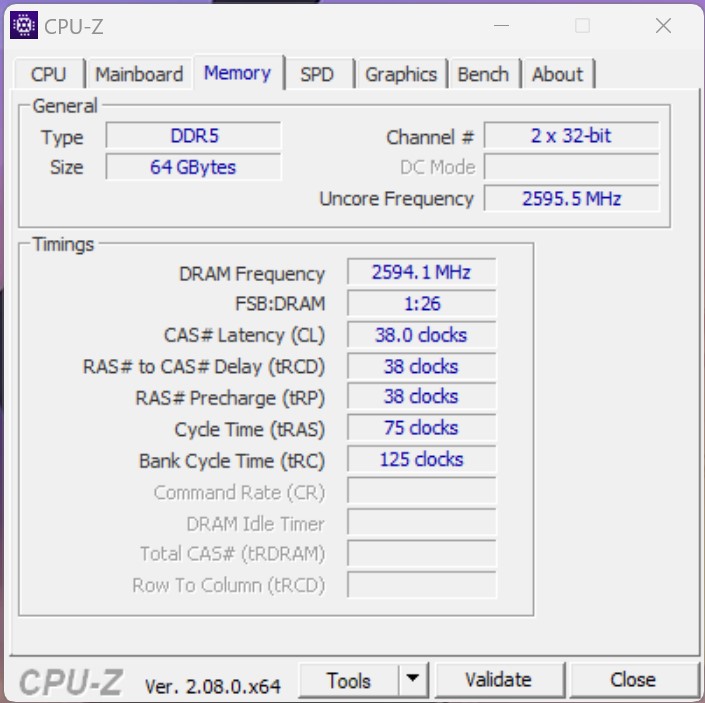
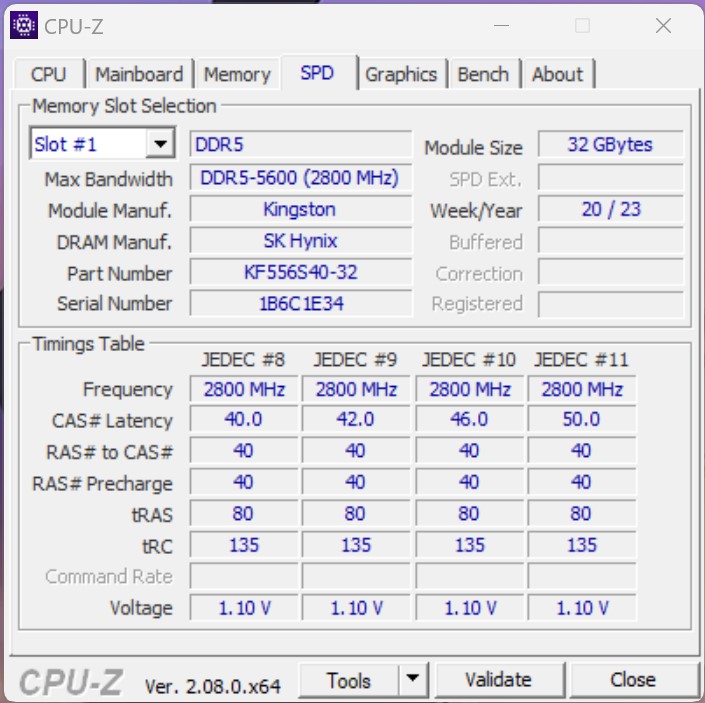
En ce qui concerne les performances du système, nous avons brièvement décrit notre expérience subjective avec le système de test Minisforum BD770i : Les performances du système étaient constamment élevées, les 8 cœurs natifs gérant efficacement les applications exigeantes. Associé au SSD NVMe rapide et à la RAM DDR5, il a assuré une vitesse opérationnelle rapide. Cette observation s'est vérifiée pour tous les systèmes de comparaison mentionnés ici. Aucune combinaison n'a présenté de lacunes significatives, et les différences étaient principalement mesurables. Le système Minisforum BD770i s'est classé dans la moyenne inférieure, une position partagée avec les deux mini-PC de Minisforum. Bien que ces appareils n'aient pas la même puissance qu'un système de bureau haut de gamme, il est essentiel de noter que cette comparaison était quelque peu injuste. Cependant, l'inclusion de ces appareils dans l'aperçu a fourni un meilleur contexte pour évaluer les performances du Minisforum BD770i avec l'AMD Ryzen 7 7745HX.
| Performance rating - Percent | |
| AMD Ryzen 9 7950X3D, AMD Ryzen 9 7950X3D -1! | |
| NVIDIA GeForce RTX 3090 Founders Edition, AMD Ryzen 9 7950X | |
| AMD Ryzen 9 7900X, AMD Ryzen 9 7900X | |
| Palit GeForce RTX 4090 GameRock OC, Intel Core i9-14900K | |
| AMD Ryzen 5 7600X, AMD Ryzen 5 7600X | |
| Intel Core i9-13900K, Intel Core i9-13900K | |
| Intel Core i5-13600K, Intel Core i5-13600K | |
| Intel Core i5-14600K, Intel Core i5-14600K | |
| AMD Ryzen 7 7800X3D, AMD Ryzen 7 7800X3D | |
| AMD Ryzen 9 5950X, AMD Ryzen 9 5950X | |
| Intel Core i9-12900K, Intel Core i9-12900K | |
| Intel Core i5-13400, Intel Core i5-13400 | |
| Intel Core i5-12600K, Intel Core i5-12600K | |
| Minisforum BD770i, AMD Ryzen 7 7745HX | |
| Minisforum EliteMini UM780 XTX, AMD Ryzen 7 7840HS | |
| Minisforum Venus Series UM790 Pro, AMD Ryzen 9 7940HS | |
| Intel Core i5-12400F, Intel Core i5-12400F | |
| CrossMark / Overall | |
| Palit GeForce RTX 4090 GameRock OC, Palit GeForce RTX 4090 GameRock OC, Intel Core i9-14900K | |
| Intel Core i9-13900K, Intel Core i9-13900K, Intel Core i9-13900K | |
| NVIDIA GeForce RTX 3090 Founders Edition, NVIDIA GeForce RTX 3090 Founders Edition, AMD Ryzen 9 7950X | |
| AMD Ryzen 9 7900X, AMD Ryzen 9 7900X, AMD Ryzen 9 7900X | |
| Intel Core i5-14600K, Intel Core i5-14600K, Intel Core i5-14600K | |
| Intel Core i5-13600K, Intel Core i5-13600K, Intel Core i5-13600K | |
| AMD Ryzen 5 7600X, AMD Ryzen 5 7600X, AMD Ryzen 5 7600X | |
| AMD Ryzen 7 7800X3D, AMD Ryzen 7 7800X3D, AMD Ryzen 7 7800X3D | |
| AMD Ryzen 9 7950X3D, AMD Ryzen 9 7950X3D, AMD Ryzen 9 7950X3D | |
| Minisforum BD770i, AMD Ryzen 7 7745HX | |
| Intel Core i5-13400, Intel Core i5-13400, Intel Core i5-13400 | |
| Intel Core i5-12400F, Intel Core i5-12400F, Intel Core i5-12400F | |
| Minisforum EliteMini UM780 XTX, AMD Ryzen 7 7840HS | |
| Minisforum Venus Series UM790 Pro, AMD Ryzen 9 7940HS | |
| AMD Ryzen 9 5950X, AMD Ryzen 9 5950X, AMD Ryzen 9 5950X | |
| CrossMark / Productivity | |
| Palit GeForce RTX 4090 GameRock OC, Palit GeForce RTX 4090 GameRock OC, Intel Core i9-14900K | |
| Intel Core i9-13900K, Intel Core i9-13900K, Intel Core i9-13900K | |
| NVIDIA GeForce RTX 3090 Founders Edition, NVIDIA GeForce RTX 3090 Founders Edition, AMD Ryzen 9 7950X | |
| AMD Ryzen 9 7900X, AMD Ryzen 9 7900X, AMD Ryzen 9 7900X | |
| Intel Core i5-14600K, Intel Core i5-14600K, Intel Core i5-14600K | |
| Intel Core i5-13600K, Intel Core i5-13600K, Intel Core i5-13600K | |
| AMD Ryzen 5 7600X, AMD Ryzen 5 7600X, AMD Ryzen 5 7600X | |
| AMD Ryzen 7 7800X3D, AMD Ryzen 7 7800X3D, AMD Ryzen 7 7800X3D | |
| Minisforum BD770i, AMD Ryzen 7 7745HX | |
| AMD Ryzen 9 7950X3D, AMD Ryzen 9 7950X3D, AMD Ryzen 9 7950X3D | |
| Intel Core i5-13400, Intel Core i5-13400, Intel Core i5-13400 | |
| Minisforum Venus Series UM790 Pro, AMD Ryzen 9 7940HS | |
| Intel Core i5-12400F, Intel Core i5-12400F, Intel Core i5-12400F | |
| Minisforum EliteMini UM780 XTX, AMD Ryzen 7 7840HS | |
| AMD Ryzen 9 5950X, AMD Ryzen 9 5950X, AMD Ryzen 9 5950X | |
| CrossMark / Creativity | |
| Palit GeForce RTX 4090 GameRock OC, Palit GeForce RTX 4090 GameRock OC, Intel Core i9-14900K | |
| NVIDIA GeForce RTX 3090 Founders Edition, NVIDIA GeForce RTX 3090 Founders Edition, AMD Ryzen 9 7950X | |
| Intel Core i9-13900K, Intel Core i9-13900K, Intel Core i9-13900K | |
| AMD Ryzen 9 7900X, AMD Ryzen 9 7900X, AMD Ryzen 9 7900X | |
| Intel Core i5-14600K, Intel Core i5-14600K, Intel Core i5-14600K | |
| AMD Ryzen 9 7950X3D, AMD Ryzen 9 7950X3D, AMD Ryzen 9 7950X3D | |
| AMD Ryzen 7 7800X3D, AMD Ryzen 7 7800X3D, AMD Ryzen 7 7800X3D | |
| AMD Ryzen 5 7600X, AMD Ryzen 5 7600X, AMD Ryzen 5 7600X | |
| Intel Core i5-13600K, Intel Core i5-13600K, Intel Core i5-13600K | |
| Minisforum BD770i, AMD Ryzen 7 7745HX | |
| Minisforum EliteMini UM780 XTX, AMD Ryzen 7 7840HS | |
| Intel Core i5-13400, Intel Core i5-13400, Intel Core i5-13400 | |
| Minisforum Venus Series UM790 Pro, AMD Ryzen 9 7940HS | |
| Intel Core i5-12400F, Intel Core i5-12400F, Intel Core i5-12400F | |
| AMD Ryzen 9 5950X, AMD Ryzen 9 5950X, AMD Ryzen 9 5950X | |
| CrossMark / Responsiveness | |
| Intel Core i9-13900K, Intel Core i9-13900K, Intel Core i9-13900K | |
| Palit GeForce RTX 4090 GameRock OC, Palit GeForce RTX 4090 GameRock OC, Intel Core i9-14900K | |
| Intel Core i5-13600K, Intel Core i5-13600K, Intel Core i5-13600K | |
| NVIDIA GeForce RTX 3090 Founders Edition, NVIDIA GeForce RTX 3090 Founders Edition, AMD Ryzen 9 7950X | |
| AMD Ryzen 9 7900X, AMD Ryzen 9 7900X, AMD Ryzen 9 7900X | |
| AMD Ryzen 5 7600X, AMD Ryzen 5 7600X, AMD Ryzen 5 7600X | |
| Intel Core i5-14600K, Intel Core i5-14600K, Intel Core i5-14600K | |
| AMD Ryzen 7 7800X3D, AMD Ryzen 7 7800X3D, AMD Ryzen 7 7800X3D | |
| Minisforum BD770i, AMD Ryzen 7 7745HX | |
| Intel Core i5-13400, Intel Core i5-13400, Intel Core i5-13400 | |
| Intel Core i5-12400F, Intel Core i5-12400F, Intel Core i5-12400F | |
| AMD Ryzen 9 7950X3D, AMD Ryzen 9 7950X3D, AMD Ryzen 9 7950X3D | |
| Minisforum Venus Series UM790 Pro, AMD Ryzen 9 7940HS | |
| Minisforum EliteMini UM780 XTX, AMD Ryzen 7 7840HS | |
| AMD Ryzen 9 5950X, AMD Ryzen 9 5950X, AMD Ryzen 9 5950X | |
| AIDA64 / Memory Copy | |
| Palit GeForce RTX 4090 GameRock OC | |
| Palit GeForce RTX 4090 GameRock OC | |
| Intel Core i5-14600K | |
| Intel Core i9-13900K | |
| AMD Ryzen 9 7950X3D | |
| Intel Core i9-12900K | |
| NVIDIA GeForce RTX 3090 Founders Edition | |
| Intel Core i5-13400 | |
| Intel Core i5-13600K | |
| Intel Core i5-12400F | |
| Intel Core i5-12600K | |
| Moyenne de la classe Desktop (54743 - 98416, n=21, 2 dernières années) | |
| AMD Ryzen 9 7900X | |
| Minisforum EliteMini UM780 XTX | |
| AMD Ryzen 7 7800X3D | |
| Minisforum Venus Series UM790 Pro | |
| AMD Ryzen 5 7600X | |
| AMD Ryzen 9 5950X | |
| Minisforum BD770i | |
| Moyenne AMD Ryzen 7 7745HX (50007 - 53867, n=2) | |
| AIDA64 / Memory Read | |
| Palit GeForce RTX 4090 GameRock OC | |
| Palit GeForce RTX 4090 GameRock OC | |
| Intel Core i5-14600K | |
| Intel Core i9-13900K | |
| Intel Core i9-12900K | |
| AMD Ryzen 9 7950X3D | |
| NVIDIA GeForce RTX 3090 Founders Edition | |
| Intel Core i5-13400 | |
| Intel Core i5-12600K | |
| Intel Core i5-13600K | |
| Moyenne de la classe Desktop (58375 - 110448, n=21, 2 dernières années) | |
| AMD Ryzen 9 7900X | |
| Intel Core i5-12400F | |
| AMD Ryzen 9 5950X | |
| AMD Ryzen 7 7800X3D | |
| Minisforum EliteMini UM780 XTX | |
| Minisforum Venus Series UM790 Pro | |
| AMD Ryzen 5 7600X | |
| Minisforum BD770i | |
| Moyenne AMD Ryzen 7 7745HX (50703 - 54278, n=2) | |
| AIDA64 / Memory Write | |
| AMD Ryzen 7 7800X3D | |
| Minisforum EliteMini UM780 XTX | |
| AMD Ryzen 9 7950X3D | |
| Intel Core i5-14600K | |
| Palit GeForce RTX 4090 GameRock OC | |
| Palit GeForce RTX 4090 GameRock OC | |
| AMD Ryzen 5 7600X | |
| NVIDIA GeForce RTX 3090 Founders Edition | |
| Minisforum Venus Series UM790 Pro | |
| Moyenne de la classe Desktop (60635 - 93889, n=21, 2 dernières années) | |
| AMD Ryzen 9 7900X | |
| Intel Core i9-13900K | |
| Intel Core i5-13400 | |
| Intel Core i5-12600K | |
| Intel Core i5-12400F | |
| Intel Core i9-12900K | |
| Intel Core i5-13600K | |
| Minisforum BD770i | |
| Moyenne AMD Ryzen 7 7745HX (54587 - 70803, n=2) | |
| AMD Ryzen 9 5950X | |
| AIDA64 / Memory Latency | |
| Minisforum EliteMini UM780 XTX | |
| Moyenne de la classe Desktop (68.5 - 168, n=21, 2 dernières années) | |
| Minisforum Venus Series UM790 Pro | |
| Moyenne AMD Ryzen 7 7745HX (80.7 - 86.5, n=2) | |
| Intel Core i5-13600K | |
| Minisforum BD770i | |
| Intel Core i5-12400F | |
| Intel Core i5-13400 | |
| Intel Core i9-13900K | |
| Palit GeForce RTX 4090 GameRock OC | |
| Palit GeForce RTX 4090 GameRock OC | |
| Intel Core i5-14600K | |
| AMD Ryzen 7 7800X3D | |
| AMD Ryzen 9 5950X | |
| AMD Ryzen 9 7950X3D | |
| AMD Ryzen 5 7600X | |
| AMD Ryzen 9 7900X | |
| NVIDIA GeForce RTX 3090 Founders Edition | |
* ... Moindre est la valeur, meilleures sont les performances
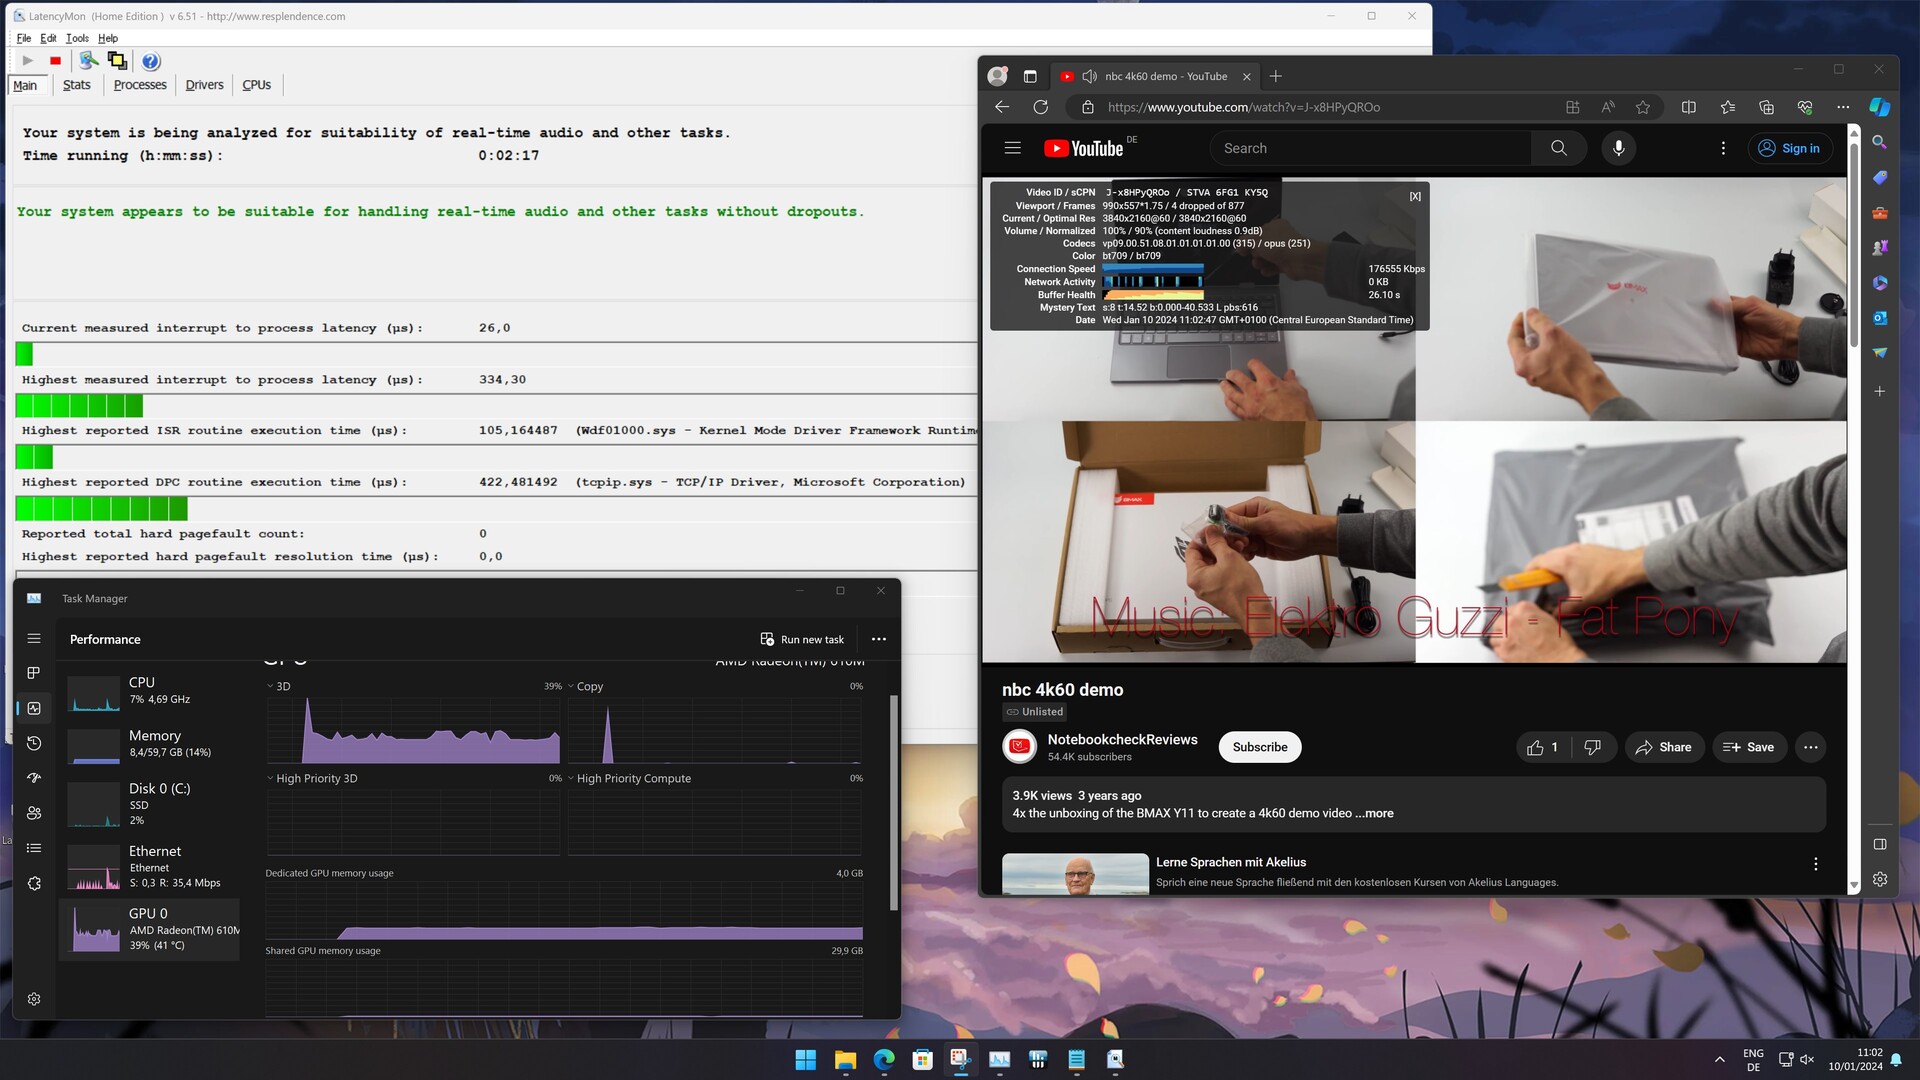
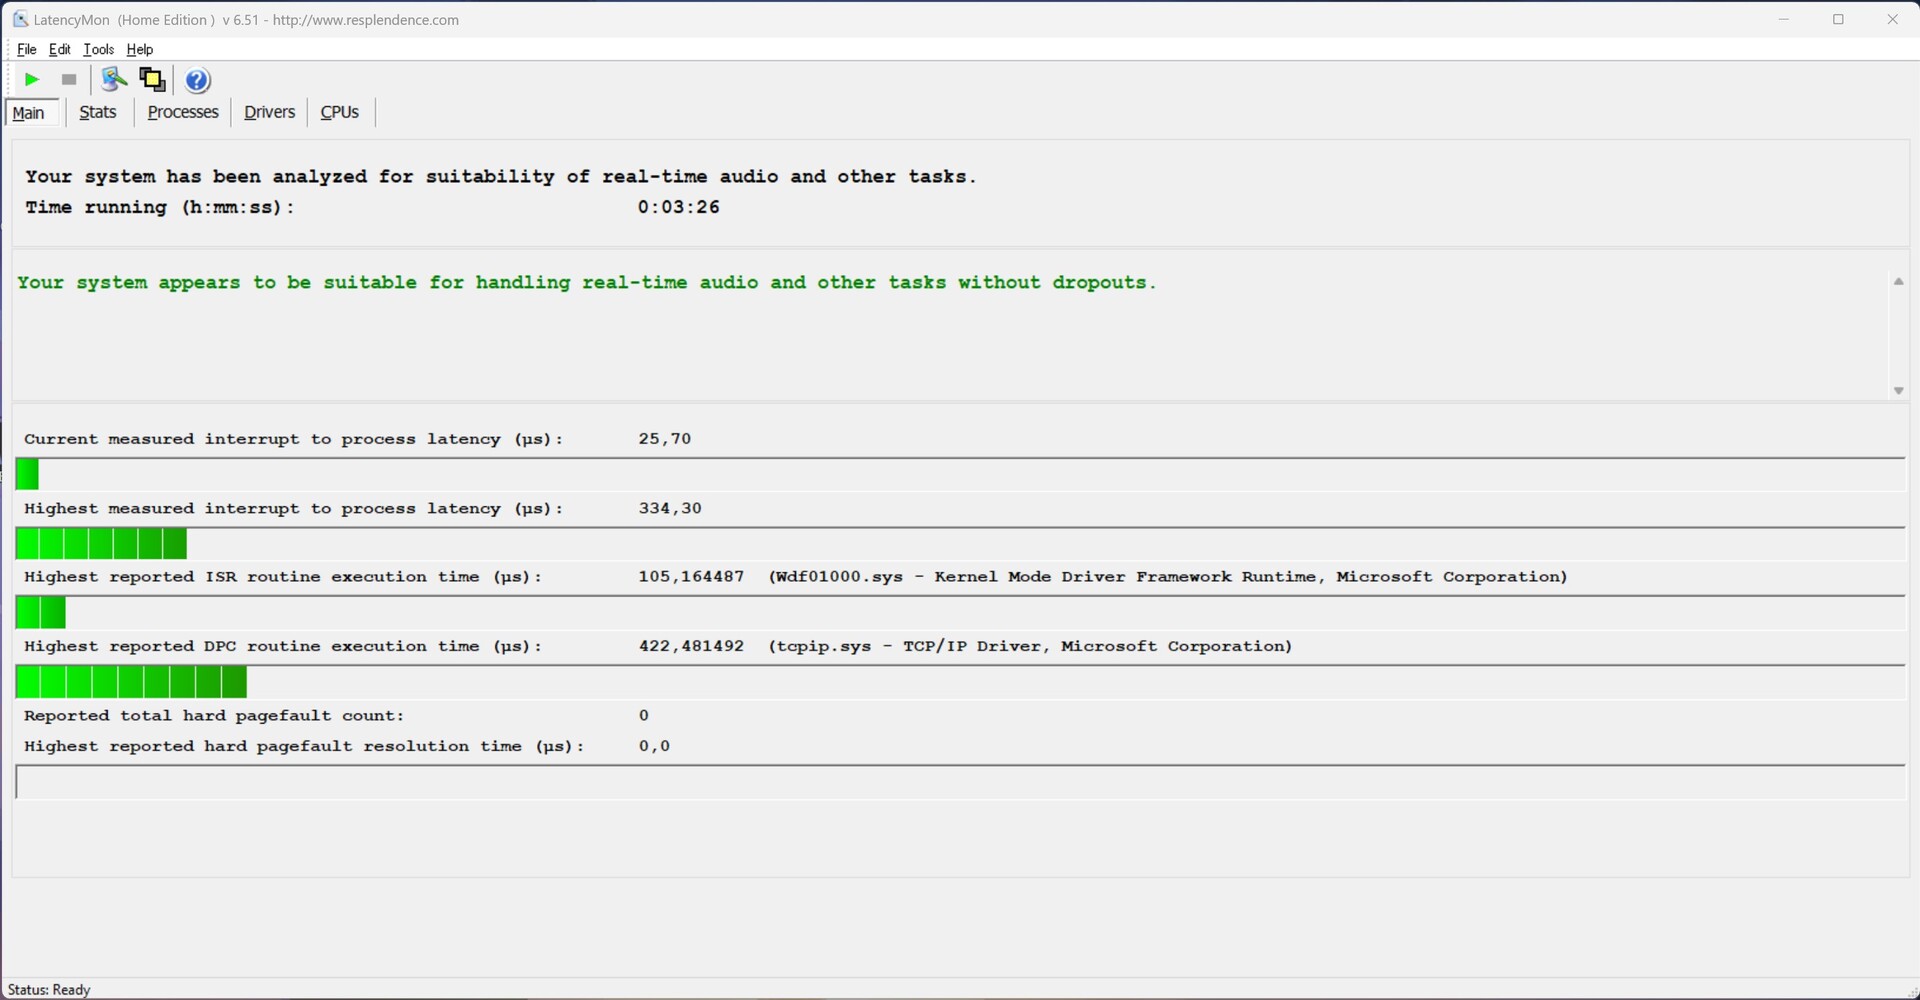
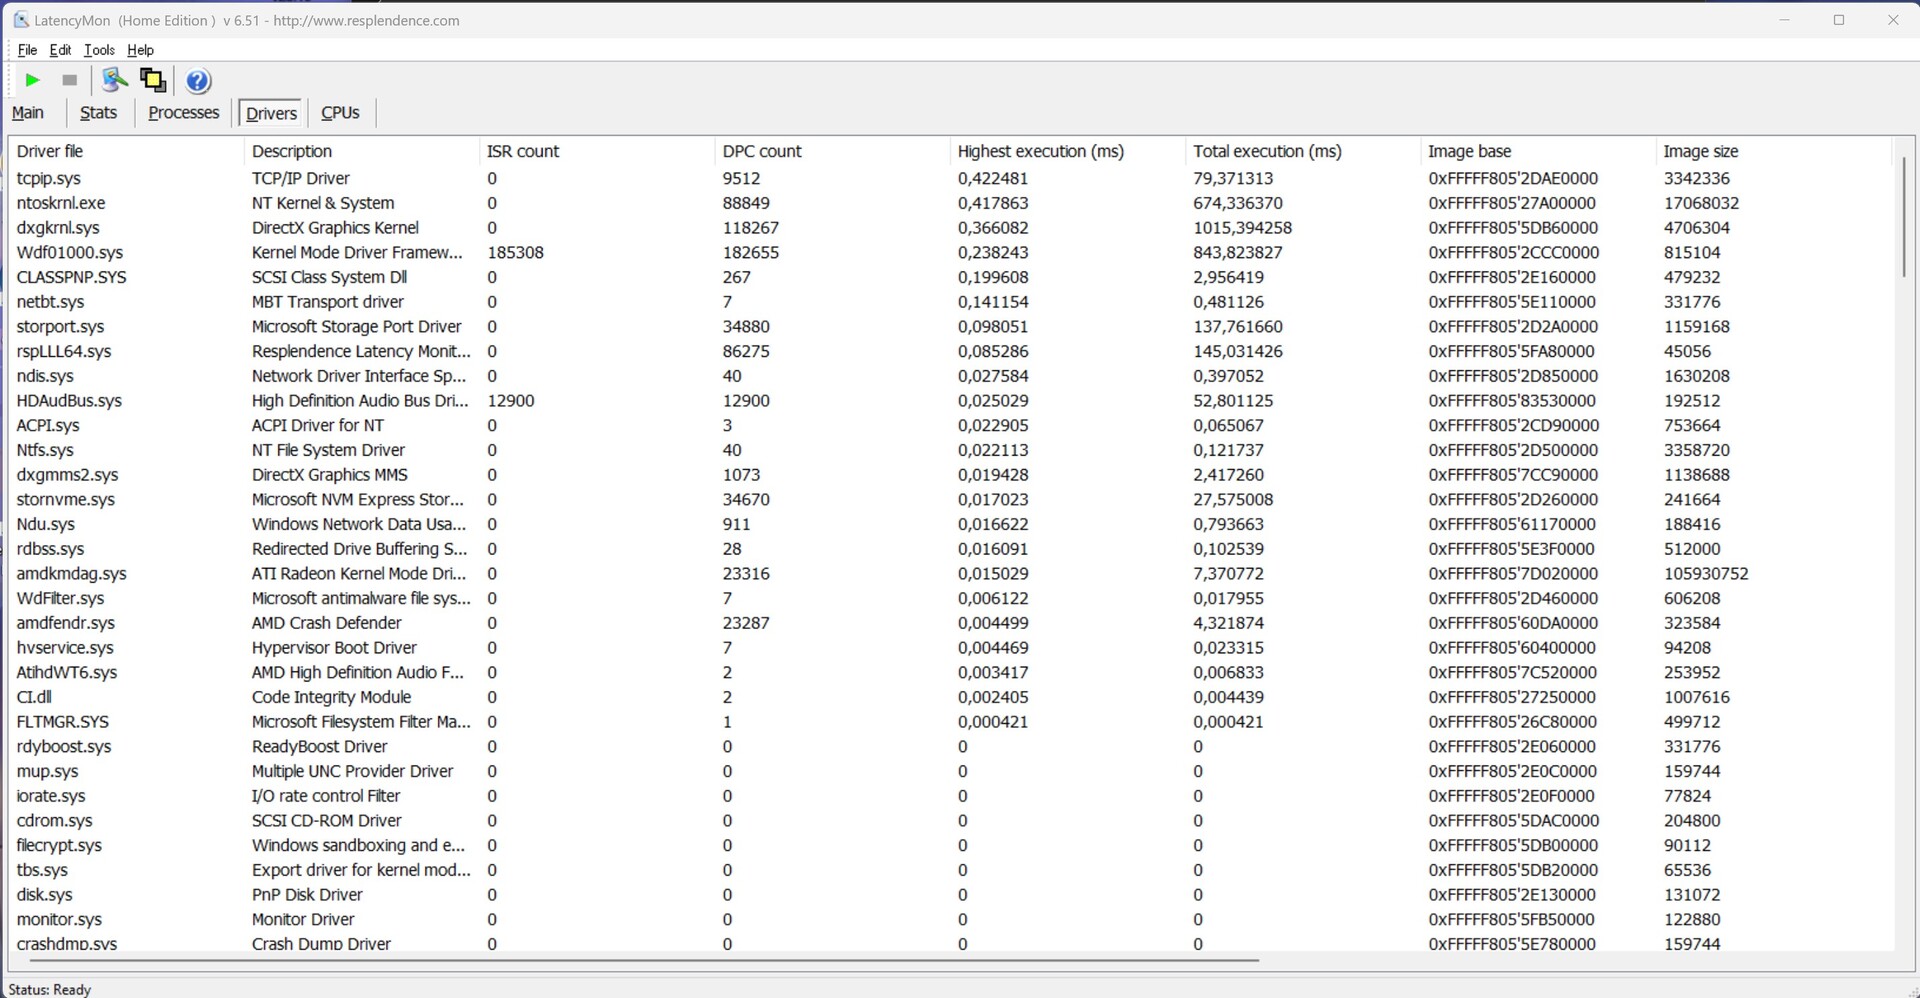
Latence DPC
Dans notre système de test construit autour du Minisforum BD770i, nous avons observé des latences très faibles. Qu'il s'agisse d'une simple navigation sur Internet ou de la lecture d'une vidéo de test 4K, même le test de stress Prime95 n'a pas entraîné de latences élevées. Par conséquent, la carte mère Minisforum BD770i est bien adaptée à la création de systèmes de streaming compacts et silencieux pour le salon.
| DPC Latencies / LatencyMon - interrupt to process latency (max), Web, Youtube, Prime95 | |
| Minisforum EliteMini UM780 XTX | |
| Minisforum Venus Series UM790 Pro | |
| Minisforum BD770i | |
* ... Moindre est la valeur, meilleures sont les performances
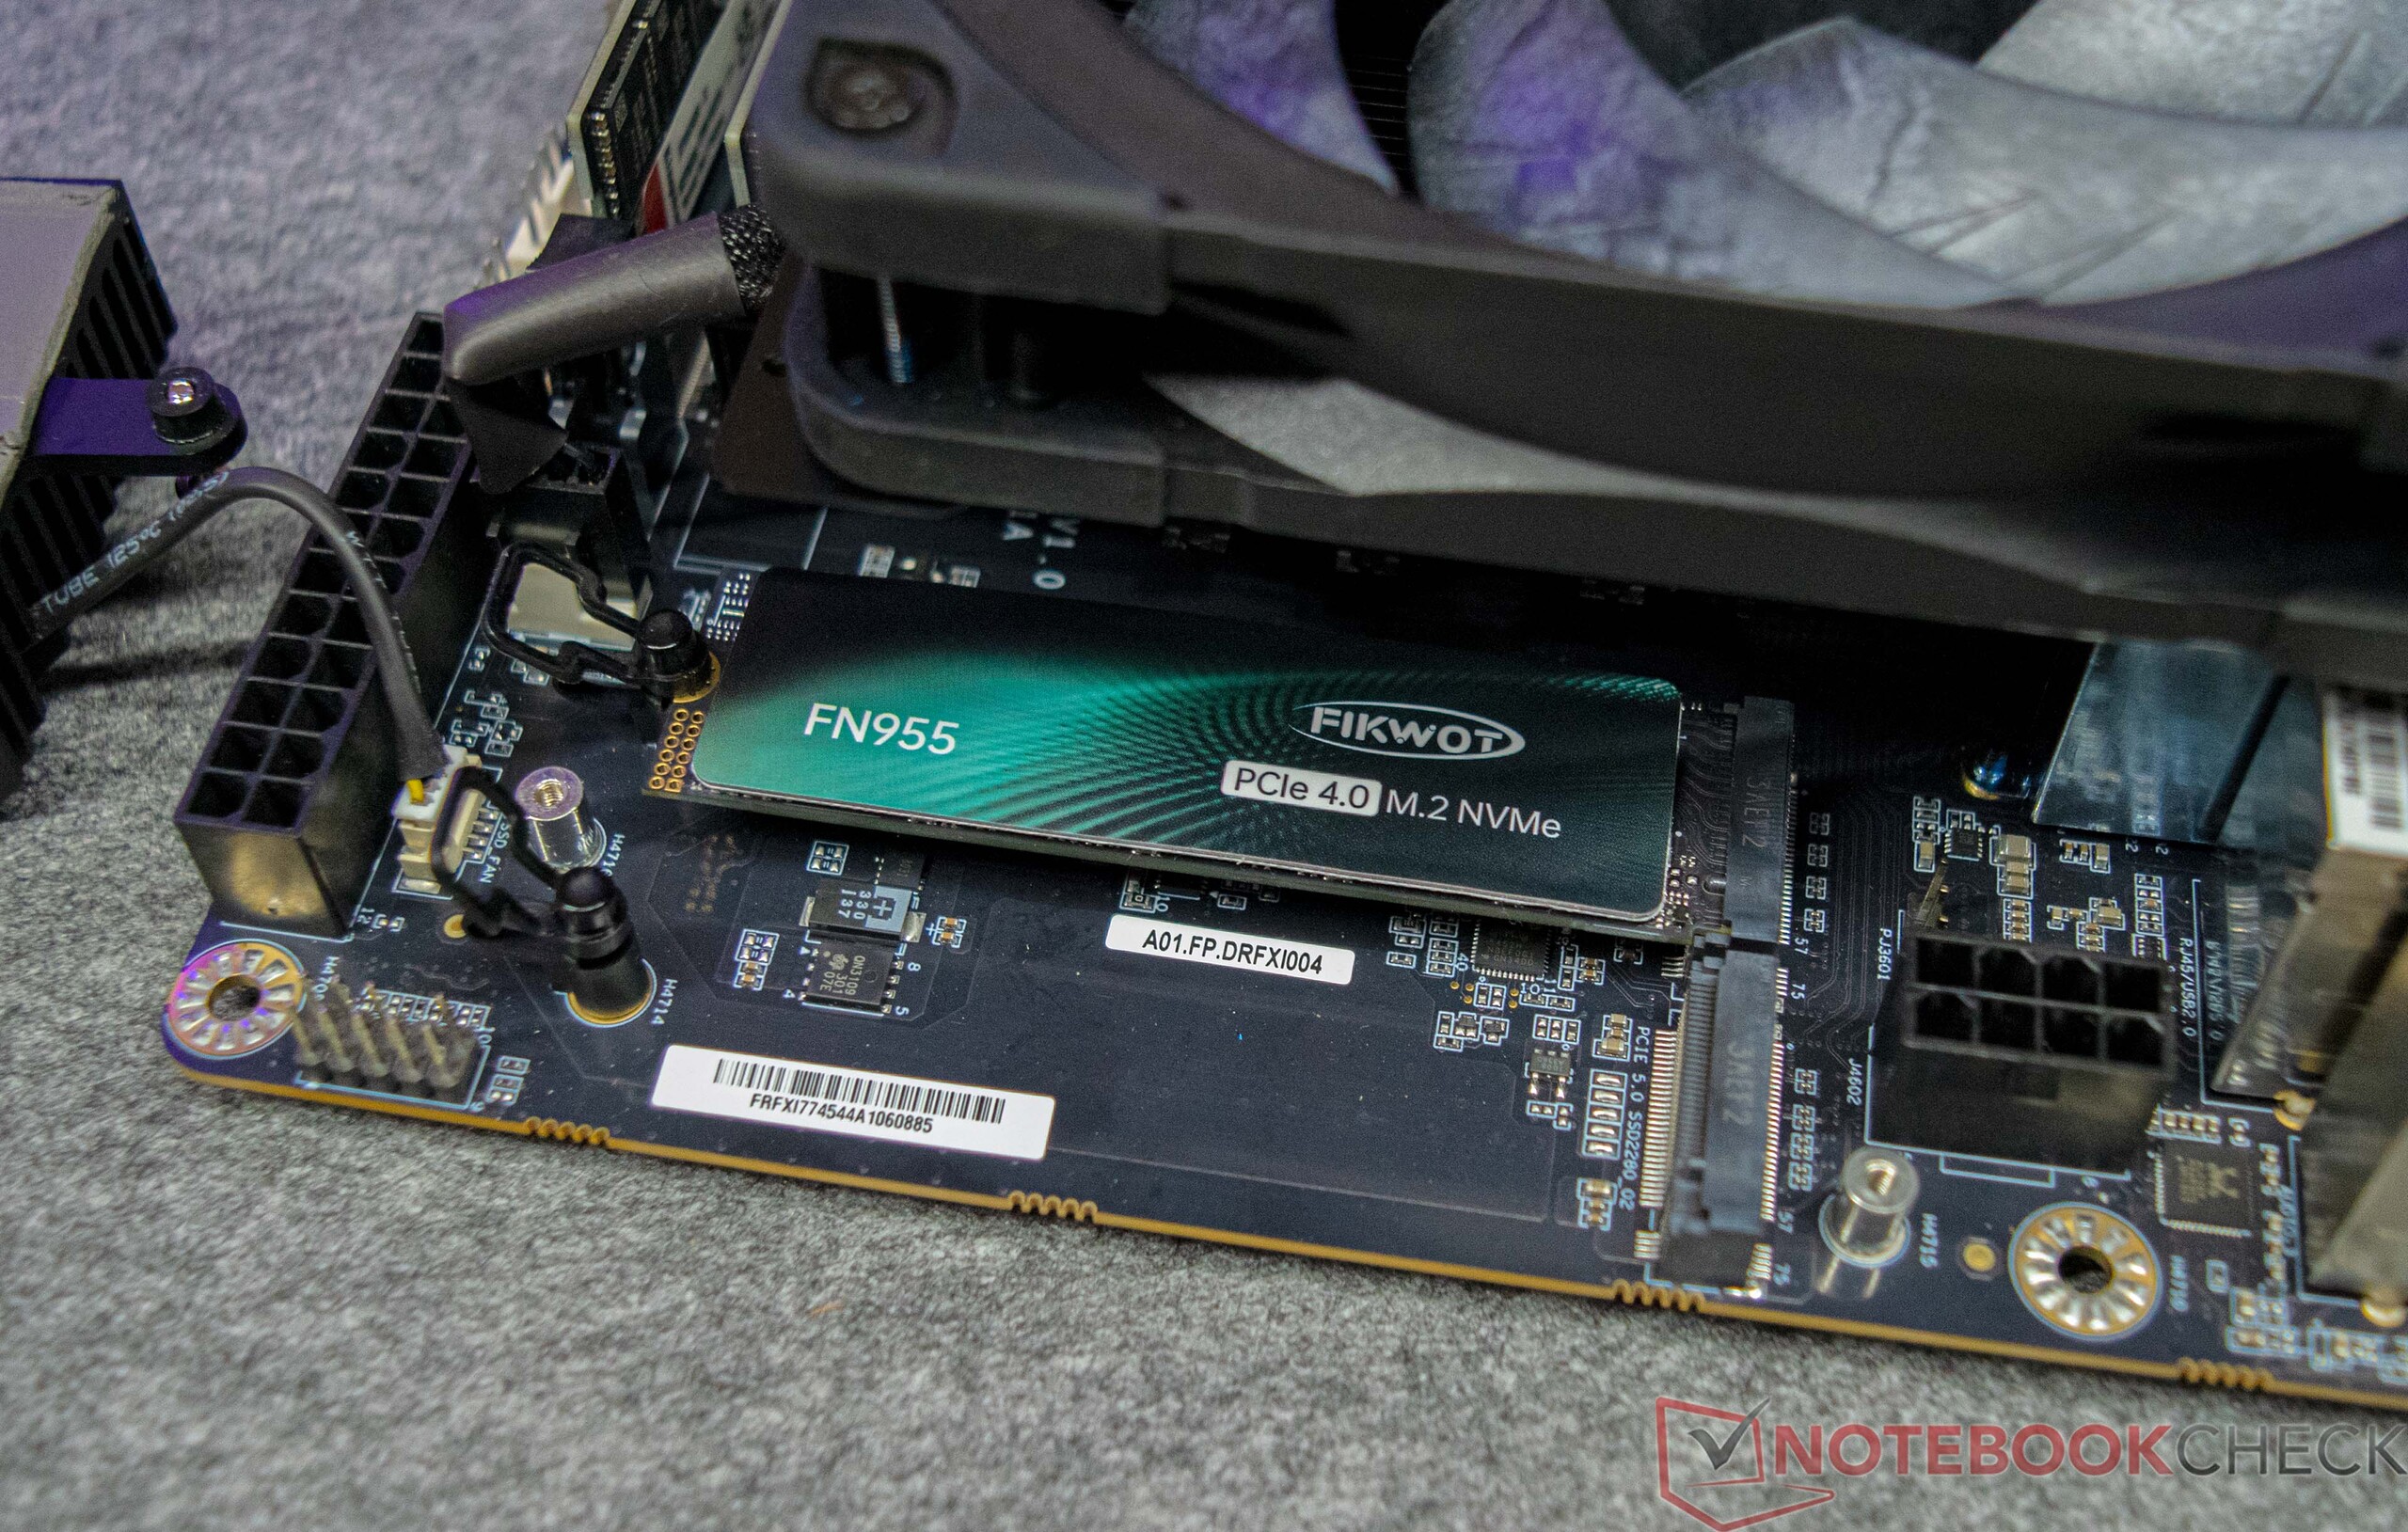
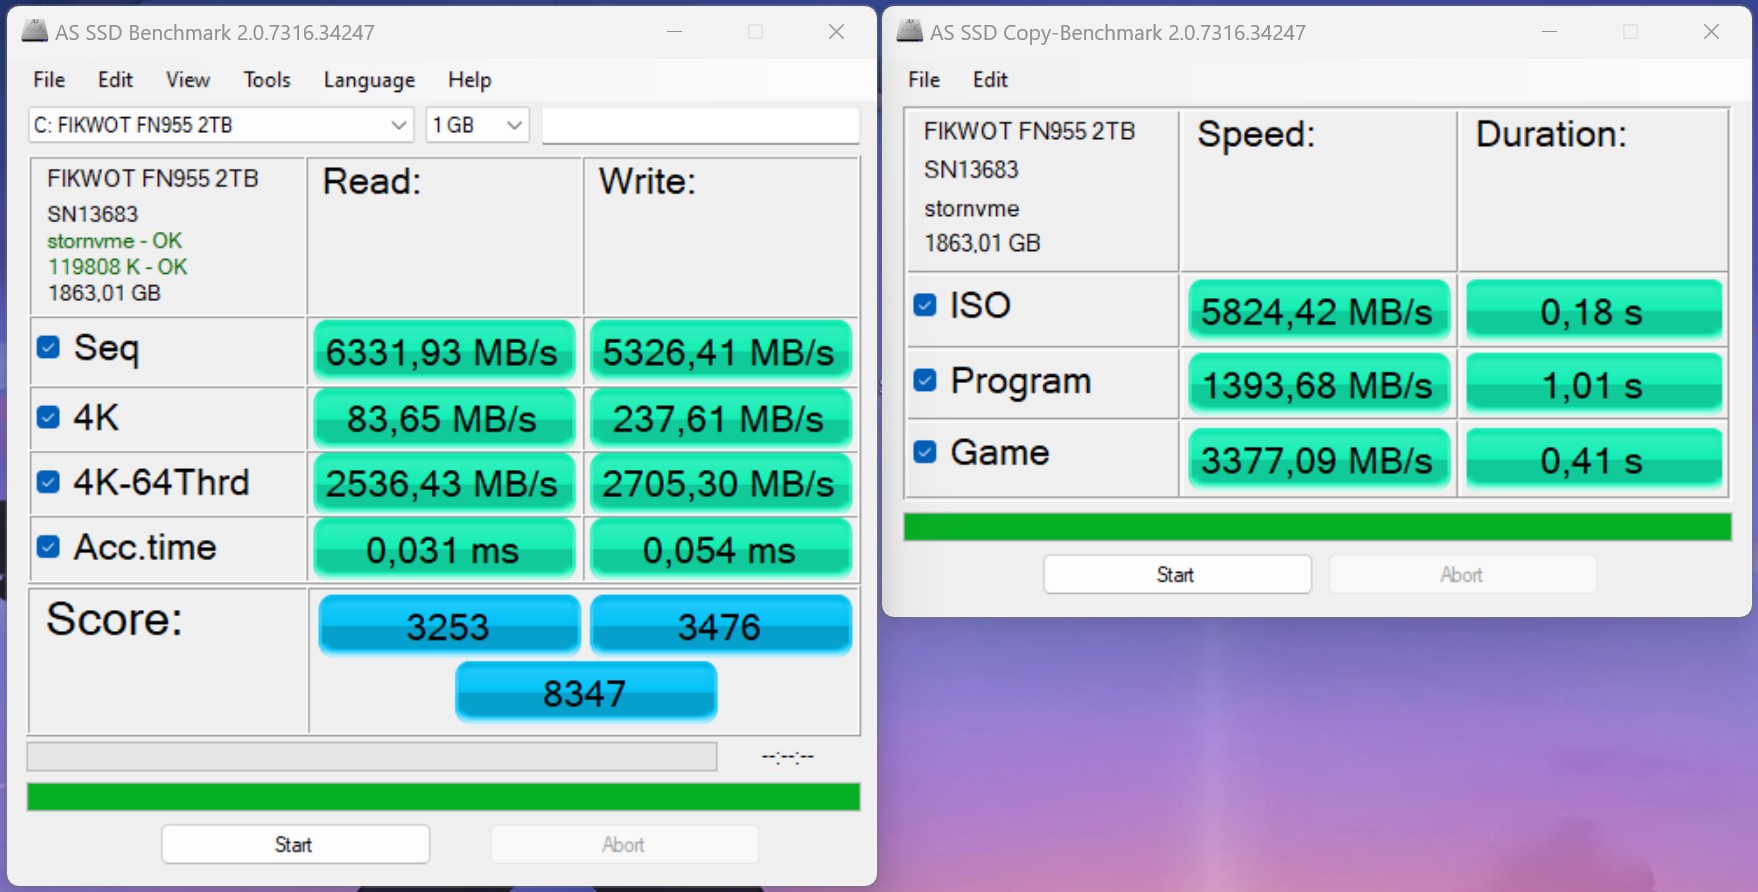
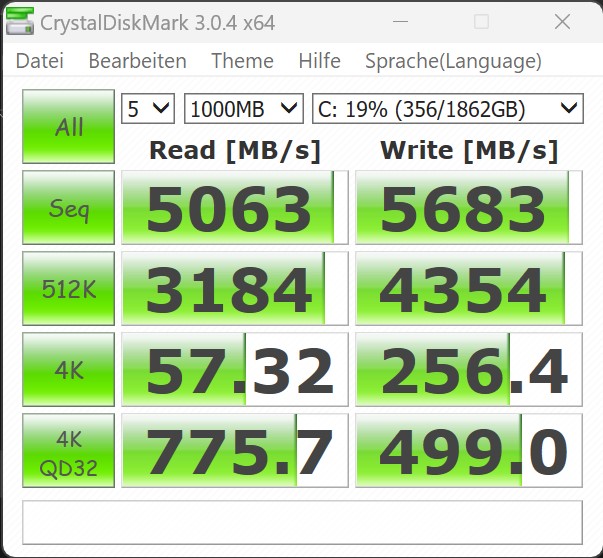
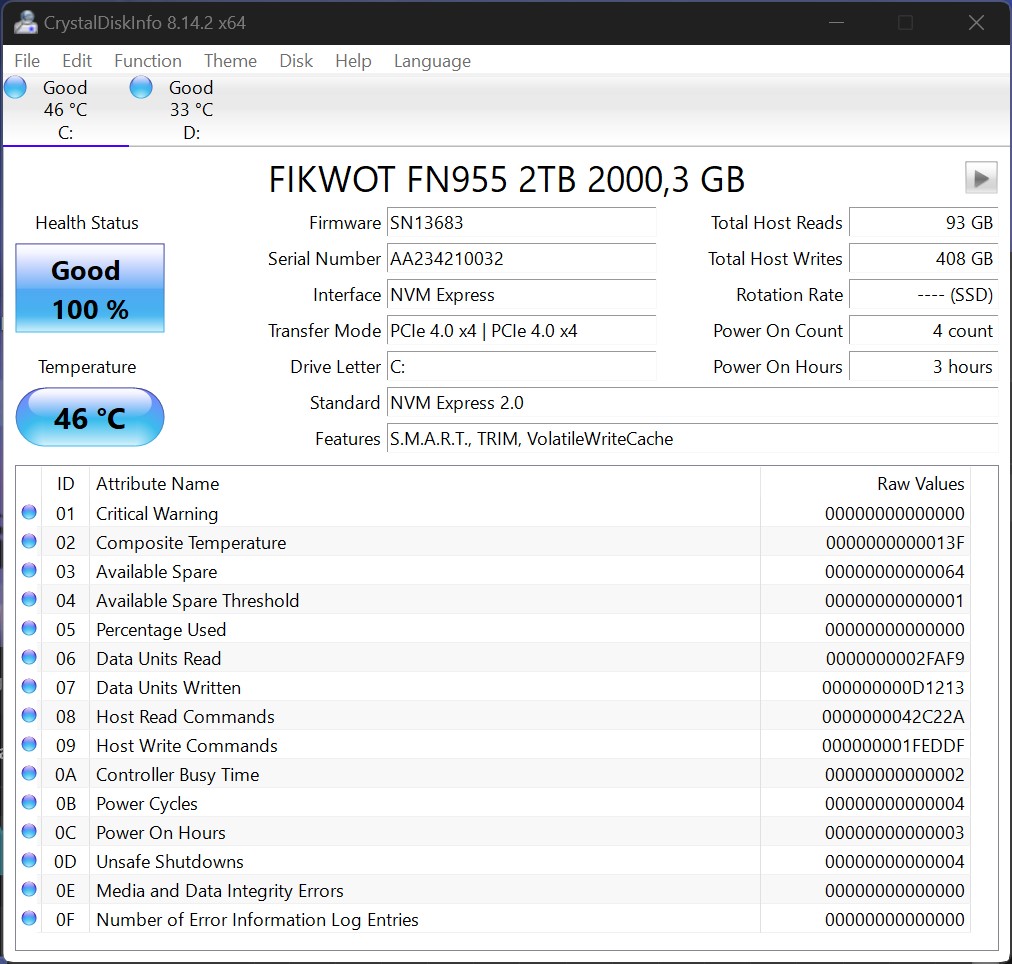
Dispositifs de stockage
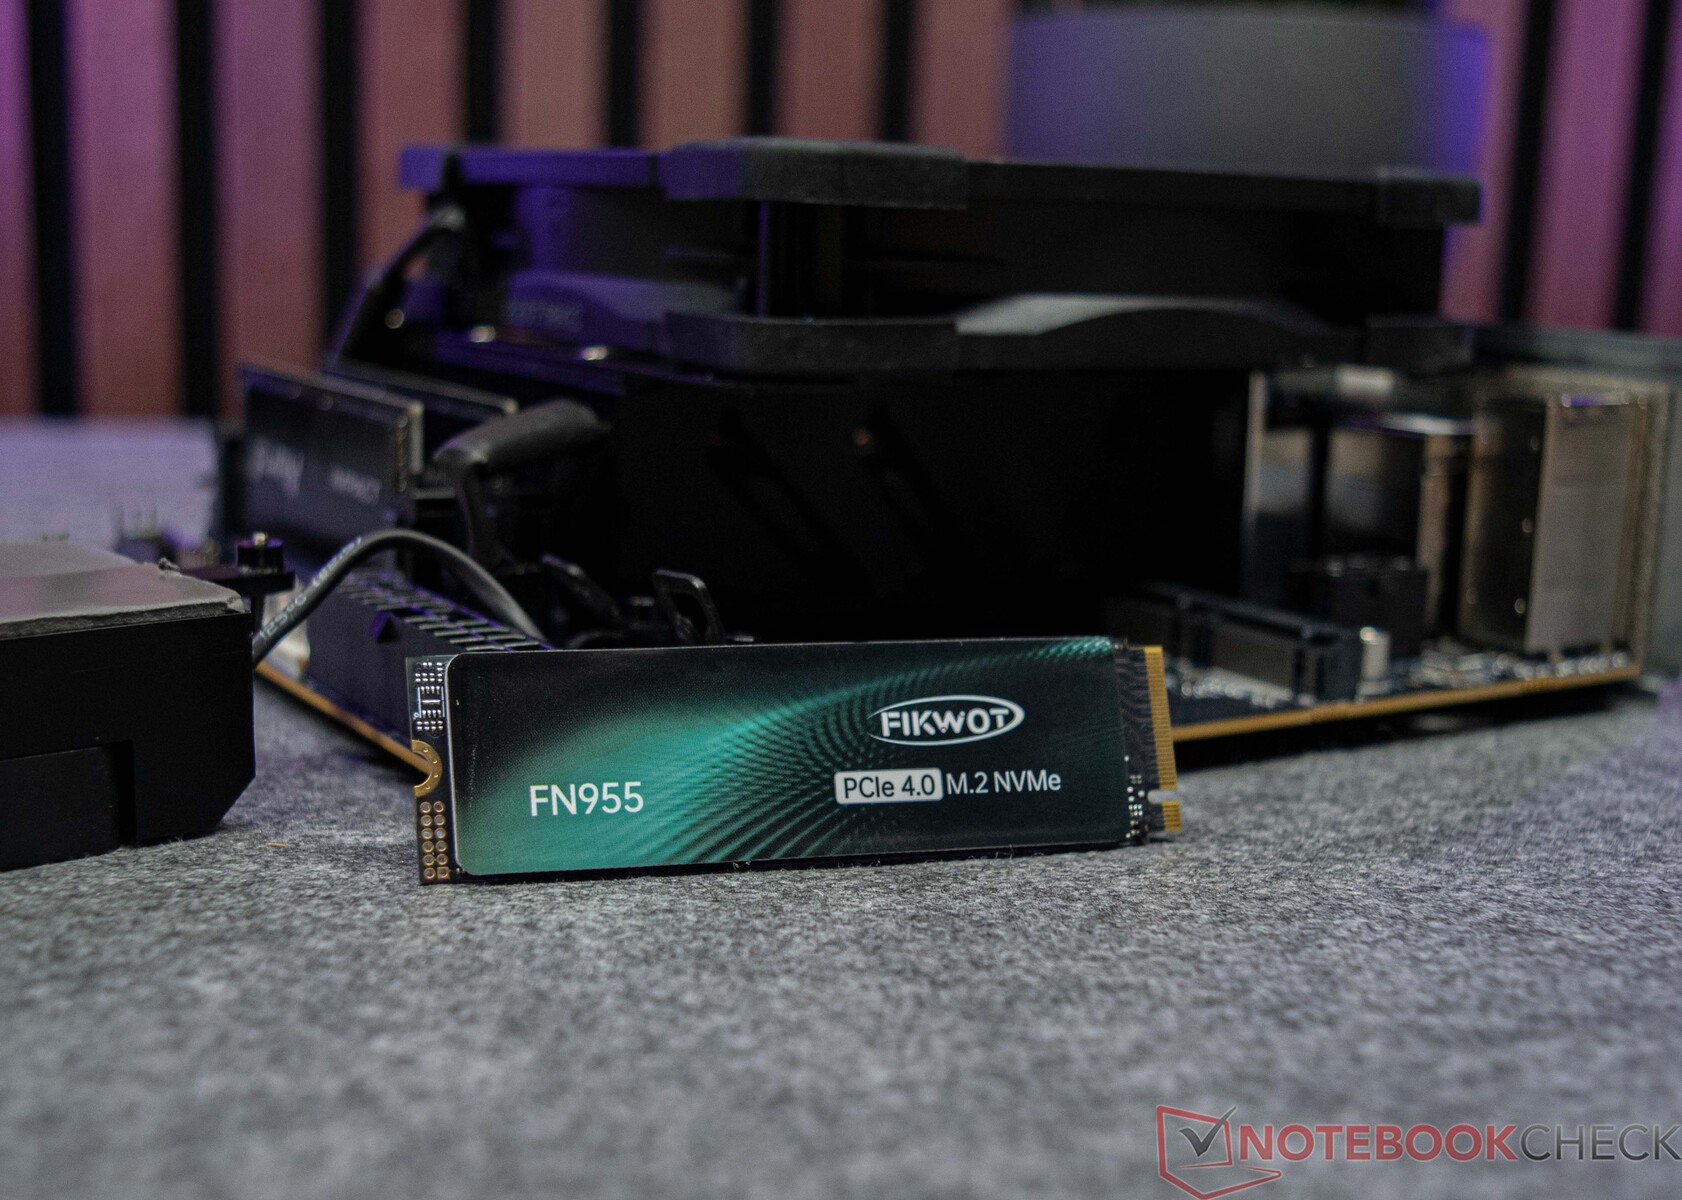
Comme indiqué précédemment, Minisforum fournit la carte mère BD770i sans stockage de masse intégré. Pour nos tests, nous avons utilisé un disque SSD de 2 To relativement abordable du fabricant Fikwot. Ce modèle utilise l'interface M.2 et se connecte via PCIe 4.0 x4, ce qui permet d'obtenir d'excellents taux de transfert. La carte mère prend en charge jusqu'à deux périphériques de stockage de masse et est compatible avec la dernière norme PCI 5.0. Les SSD peuvent également être équipés d'un système de refroidissement actif, particulièrement utile pour les SSD PCIe 5.0. Tout au long de nos tests, notre SSD n'a présenté aucun problème thermique sous charge et a maintenu des performances constantes.
Pour d'autres comparaisons et benchmarks, veuillez vous référer à notre tableau de comparaison.
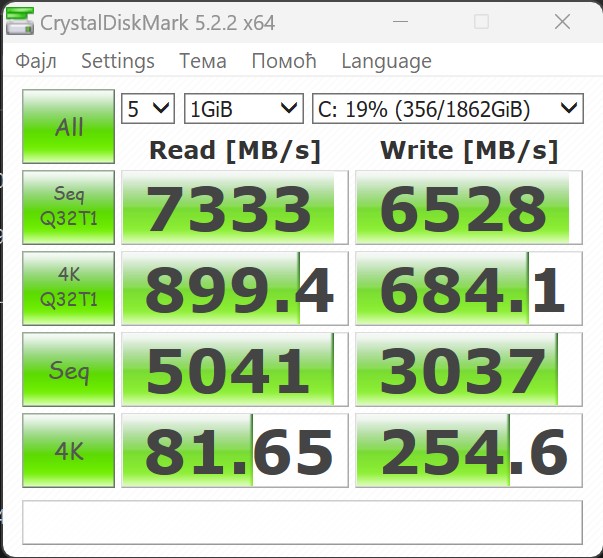


"Reading continuous performance: DiskSpd Read Loop, Queue Depth 8 "
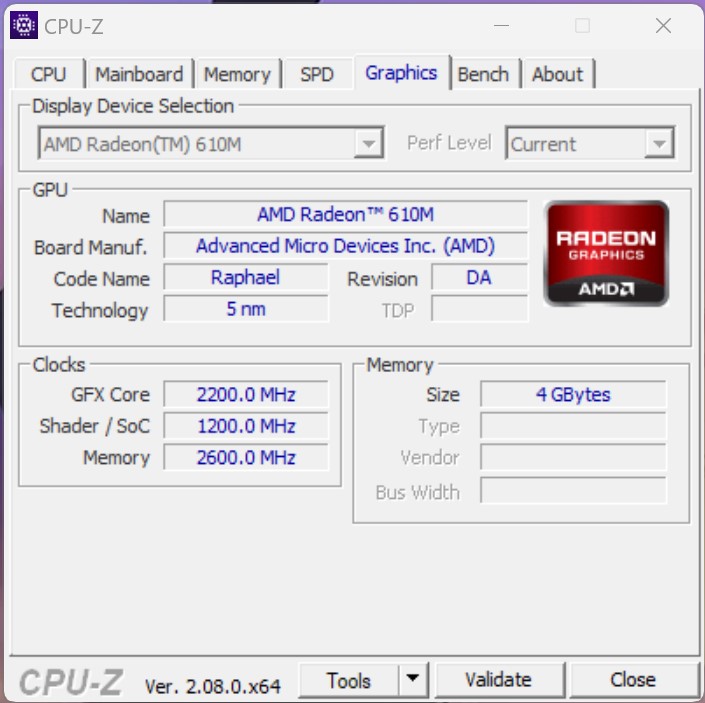
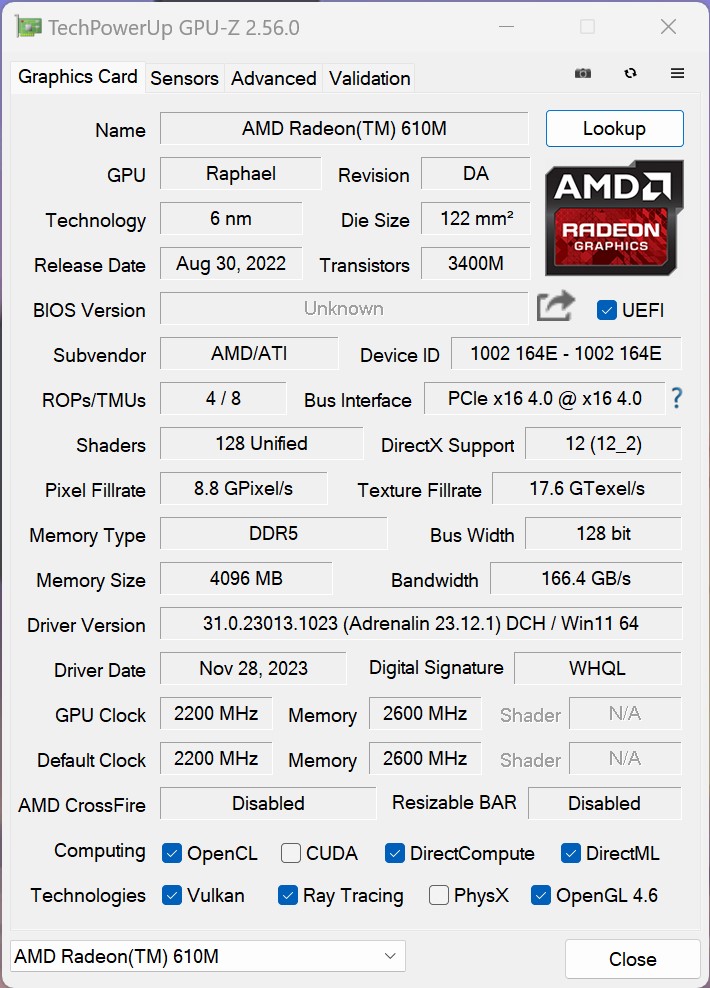
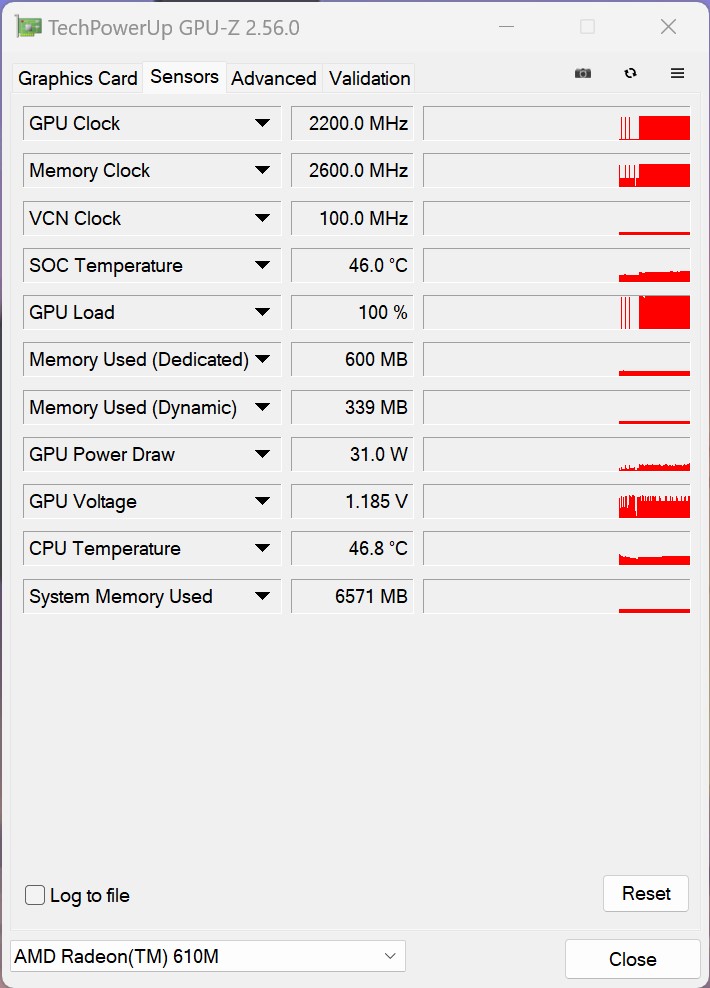
Carte graphique - AMD Radeon 610M comme iGPU
Le AMD Ryzen 7 7745HX est équipé d'une AMD Radeon 610M iGPU. Cependant, cet iGPU est basé sur l'architecture RDNA2 et n'offre que 2 unités de calcul (CU), ce qui donne un total de 128 unités de shaders pour les calculs 3D. Dans notre comparaison moyenne, l'iGPU du Minisforum BD770i a dépassé celle d'un ordinateur portable conventionnel, mais s'est limitée à des tâches graphiques simples. Les attentes au-delà d'une simple sortie d'images doivent être modérées étant donné les limites de cette solution graphique d'entrée de gamme.
Pour d'autres comparaisons et benchmarks, veuillez vous référer à notre Tableau de comparaison des GPU.
| Performance rating - Percent | |
| Minisforum EliteMini UM780 XTX | |
| Minisforum Venus Series UM790 Pro | |
| Minisforum Mars Series MC560 | |
| NiPoGi AD08 | |
| Acemagic AD15 | |
| Minisforum BD770i | |
| Moyenne AMD Radeon 610M | |
| Performance rating - Percent | |
| NiPoGi AD08 | |
| Minisforum EliteMini UM780 XTX | |
| Minisforum Venus Series UM790 Pro | |
| Moyenne AMD Radeon 610M | |
| Acemagic AD15 | |
| Minisforum Mars Series MC560 | |
| Minisforum BD770i | |
| Unigine Valley 1.0 | |
| 1920x1080 Extreme HD DirectX AA:x8 | |
| Minisforum EliteMini UM780 XTX | |
| Minisforum Venus Series UM790 Pro | |
| Minisforum Mars Series MC560 | |
| NiPoGi AD08 | |
| Minisforum BD770i | |
| Moyenne AMD Radeon 610M (9.8 - 10, n=4) | |
| Acemagic AD15 | |
| 1920x1080 Extreme HD Preset OpenGL AA:x8 | |
| Minisforum EliteMini UM780 XTX | |
| Minisforum Venus Series UM790 Pro | |
| NiPoGi AD08 | |
| Minisforum Mars Series MC560 | |
| Acemagic AD15 | |
| Minisforum BD770i | |
| Moyenne AMD Radeon 610M (9.1 - 9.6, n=4) | |
| Affinity Photo 2 - Combined (Single / Multi GPU) | |
| NiPoGi AD08 | |
| Moyenne AMD Radeon 610M (889 - 5750, n=4) | |
| Acemagic AD15 | |
| Minisforum EliteMini UM780 XTX | |
| Minisforum Mars Series MC560 | |
| Minisforum Venus Series UM790 Pro | |
| Minisforum BD770i | |
| 3DMark 06 Standard Score | 20555 points | |
| 3DMark Vantage P Result | 12092 points | |
| 3DMark 11 Performance | 3873 points | |
| 3DMark Ice Storm Standard Score | 41556 points | |
| 3DMark Cloud Gate Standard Score | 14629 points | |
| 3DMark Fire Strike Score | 2156 points | |
| 3DMark Fire Strike Extreme Score | 530 points | |
| 3DMark Time Spy Score | 740 points | |
Aide | ||
Performances de jeu - AMD Radeon 610M
Seul un nombre limité d'applications 3D peut bénéficier des performances de l'AMD Radeon 610M, comme le démontrent les benchmarks synthétiques. Ceci est également évident dans les tests de jeu. Le GPU intégré (iGPU) ne peut générer des taux de trame décents qu'avec les paramètres graphiques les plus bas et une résolution de seulement 1 280 x 720 pixels. Les deux mini-PC équipés de la AMD Radeon 780m iGPU offrent des performances nettement supérieures, mais même dans ces cas, le système atteint rapidement ses limites lorsqu'il s'agit de jouer à des jeux modernes. Toutes les cartes graphiques actuelles peuvent être facilement connectées via l'interface PCI Express.
Pour un aperçu complet des performances de l'iGPU par rapport à d'autres cartes graphiques, veuillez consulter notre Liste de jeux GPU.
| The Witcher 3 | |
| 1024x768 Low Graphics & Postprocessing (Classer selon les valeurs) | |
| Minisforum EliteMini UM780 XTX | |
| Minisforum Venus Series UM790 Pro | |
| Minisforum BD770i | |
| NiPoGi AD08 | |
| Acemagic AD15 | |
| Minisforum Mars Series MC560 | |
| 1920x1080 High Graphics & Postprocessing (Nvidia HairWorks Off) (Classer selon les valeurs) | |
| Minisforum EliteMini UM780 XTX | |
| Minisforum Venus Series UM790 Pro | |
| Minisforum BD770i | |
| NiPoGi AD08 | |
| Acemagic AD15 | |
| Minisforum Mars Series MC560 | |
| Borderlands 3 | |
| 1280x720 Very Low Overall Quality (DX11) (Classer selon les valeurs) | |
| Minisforum EliteMini UM780 XTX | |
| Minisforum Venus Series UM790 Pro | |
| Minisforum BD770i | |
| NiPoGi AD08 | |
| Acemagic AD15 | |
| Minisforum Mars Series MC560 | |
| 1920x1080 High Overall Quality (DX11) (Classer selon les valeurs) | |
| Minisforum EliteMini UM780 XTX | |
| Minisforum Venus Series UM790 Pro | |
| Minisforum BD770i | |
| NiPoGi AD08 | |
| Acemagic AD15 | |
| Minisforum Mars Series MC560 | |
| GTA V | |
| 1024x768 Lowest Settings possible (Classer selon les valeurs) | |
| Minisforum EliteMini UM780 XTX | |
| Minisforum Venus Series UM790 Pro | |
| Minisforum BD770i | |
| NiPoGi AD08 | |
| Acemagic AD15 | |
| Minisforum Mars Series MC560 | |
| 1920x1080 High/On (Advanced Graphics Off) AA:2xMSAA + FX AF:8x (Classer selon les valeurs) | |
| Minisforum EliteMini UM780 XTX | |
| Minisforum Venus Series UM790 Pro | |
| Minisforum BD770i | |
| NiPoGi AD08 | |
| Acemagic AD15 | |
| Minisforum Mars Series MC560 | |
| Tiny Tina's Wonderlands | |
| 1280x720 Lowest Preset (DX12) (Classer selon les valeurs) | |
| Minisforum EliteMini UM780 XTX | |
| Minisforum Venus Series UM790 Pro | |
| Minisforum BD770i | |
| Acemagic AD15 | |
| Minisforum Mars Series MC560 | |
| 1920x1080 High Preset (DX12) (Classer selon les valeurs) | |
| Minisforum EliteMini UM780 XTX | |
| Minisforum Venus Series UM790 Pro | |
| Minisforum BD770i | |
| Acemagic AD15 | |
| Minisforum Mars Series MC560 | |
| Metro Exodus | |
| 1280x720 Low Quality AF:4x (Classer selon les valeurs) | |
| Minisforum EliteMini UM780 XTX | |
| Minisforum Venus Series UM790 Pro | |
| Minisforum BD770i | |
| NiPoGi AD08 | |
| 1920x1080 High Quality AF:16x (Classer selon les valeurs) | |
| Minisforum EliteMini UM780 XTX | |
| Minisforum Venus Series UM790 Pro | |
| Minisforum BD770i | |
| NiPoGi AD08 | |
| Shadow of the Tomb Raider | |
| 1280x720 Lowest Preset (Classer selon les valeurs) | |
| Minisforum EliteMini UM780 XTX | |
| Minisforum Venus Series UM790 Pro | |
| Minisforum BD770i | |
| NiPoGi AD08 | |
| Acemagic AD15 | |
| 1920x1080 High Preset AA:SM (Classer selon les valeurs) | |
| Minisforum EliteMini UM780 XTX | |
| Minisforum Venus Series UM790 Pro | |
| Minisforum BD770i | |
| NiPoGi AD08 | |
| Acemagic AD15 | |
| Bas | Moyen | Élevé | Ultra | |
|---|---|---|---|---|
| GTA V (2015) | 134.5 | 101.9 | 23.1 | 10.5 |
| The Witcher 3 (2015) | 44 | 26.2 | 13.5 | 8.49 |
| Final Fantasy XV Benchmark (2018) | 26.8 | 12.3 | 8.79 | |
| X-Plane 11.11 (2018) | 44.7 | 26.2 | 22.9 | |
| Far Cry 5 (2018) | 34 | 15 | 14 | 13 |
| Strange Brigade (2018) | 67.7 | 21.4 | 17 | |
| Shadow of the Tomb Raider (2018) | 40 | 14 | 12.6 | 10.5 |
| Far Cry New Dawn (2019) | 35 | 17 | 16 | 14 |
| Metro Exodus (2019) | 28.4 | 11.8 | 8.4 | 6.95 |
| Borderlands 3 (2019) | 40.3 | 14.9 | 9.04 | 6.48 |
| Tiny Tina's Wonderlands (2022) | 18.1 | 14.5 | 9.24 | 6.92 |
Minisforum BD770i avec Nvidia GeForce RTX 4090
Si vous avez l'intention d'utiliser la carte mère Minisforum BD770i comme base d'un système de jeu, vous pouvez le faire sans hésitation. La carte AMD Ryzen 7 7745HX dispose de réserves de performances suffisantes pour rivaliser avec les systèmes actuels. Dans les benchmarks synthétiques, notre système de test a même réussi à se hisser à la troisième place. Cependant, en raison de la taille de la carte graphique, nous avons dû utiliser le Minisforum BD770i dans une configuration ouverte pour ces tests, car la RTX 4090 d'AMD Ryzen 7 7745HX n'a pas été utilisée Pait GeForce RTX 4090 Gamerock OC est trop grande pour le boîtier Phanteks Enthoo Evolv Shift XT.
En ce qui concerne les benchmarks de jeu, il est crucial de faire une distinction : lorsque vous déterminez la performance pure du CPU, il est essentiel de rester dans la limite du CPU. Dans ce scénario, le AMD Ryzen 7 7745HX est au même niveau qu'un Intel Core i7-13700, et même le Intel Core i7-13700K ne peut pas le surpasser. Le classement de notre échantillon de test reste cohérent à des niveaux de détail plus élevés et avec des paramètres maximums. La carte mère Minisforum BD770i continue de rivaliser avec l'Intel Core i7-13700, et lorsque l'on examine les différents tests séparément, l'AMD Ryzen 7 7745HX, associée à la Palit GeForce RTX 4090 Gamerock OC, peut rivaliser avec les modèles de pointe dans certains cas. Tous les titres actuels peuvent être joués en 2.160p sans perte de détails dans cette configuration.
Tous les systèmes listés dans ce comparatif ont été testés avec la même carte graphique, à savoir la Palit GeForce RTX 4090 Gamerock OC.
Une remarque importante lorsque vous utilisez une Nvidia GeForce RTX 4090 :
Notre échantillon de test du Minisforum BD770i n'était pas équipé du BIOS le plus récent lors du test. Par conséquent, la carte graphique n'était connectée qu'avec PCIe 4.0 x1. La version 1.05 est la seule qui permette à la carte graphique de fonctionner avec une largeur de bande maximale ; vous pouvez la trouver sur le site web de support. Le processus de mise à jour du BIOS peut être lancé directement à partir de Windows.
| Performance rating - Percent | |
| NVIDIA GeForce RTX 4090, Intel Core i9-14900K | |
| NVIDIA GeForce RTX 4090, Intel Core i5-14600K | |
| NVIDIA GeForce RTX 4090, AMD Ryzen 7 7745HX | |
| NVIDIA GeForce RTX 4090, AMD Ryzen 9 7950X | |
| NVIDIA GeForce RTX 4090, AMD Ryzen 7 7800X3D | |
| NVIDIA GeForce RTX 4090, Intel Core i7-13700 | |
| NVIDIA GeForce RTX 4090, Intel Core i7-12700 | |
| NVIDIA GeForce RTX 4090, Intel Core i5-13400 | |
| NVIDIA GeForce RTX 4090, Intel Core i5-12400F -6! | |
| 3DMark 11 - 1280x720 Performance GPU | |
| NVIDIA GeForce RTX 4090, AMD Ryzen 7 7745HX | |
| NVIDIA GeForce RTX 4090, AMD Ryzen 7 7800X3D | |
| NVIDIA GeForce RTX 4090, Intel Core i5-14600K | |
| NVIDIA GeForce RTX 4090, AMD Ryzen 9 7950X | |
| NVIDIA GeForce RTX 4090, Intel Core i7-13700 | |
| NVIDIA GeForce RTX 4090, Intel Core i7-12700 | |
| NVIDIA GeForce RTX 4090, Intel Core i5-13400 | |
| NVIDIA GeForce RTX 4090, Intel Core i9-14900K | |
| NVIDIA GeForce RTX 4090, Intel Core i5-12400F | |
| 3DMark | |
| 2560x1440 Time Spy Graphics | |
| NVIDIA GeForce RTX 4090, AMD Ryzen 7 7745HX | |
| NVIDIA GeForce RTX 4090, Intel Core i5-14600K | |
| NVIDIA GeForce RTX 4090, Intel Core i9-14900K | |
| NVIDIA GeForce RTX 4090, AMD Ryzen 7 7800X3D | |
| NVIDIA GeForce RTX 4090, Intel Core i7-13700 | |
| NVIDIA GeForce RTX 4090, AMD Ryzen 9 7950X | |
| NVIDIA GeForce RTX 4090, Intel Core i7-12700 | |
| NVIDIA GeForce RTX 4090, Intel Core i5-13400 | |
| NVIDIA GeForce RTX 4090, Intel Core i5-12400F | |
| 1920x1080 Fire Strike Graphics | |
| NVIDIA GeForce RTX 4090, AMD Ryzen 7 7745HX | |
| NVIDIA GeForce RTX 4090, Intel Core i5-14600K | |
| NVIDIA GeForce RTX 4090, Intel Core i5-12400F | |
| NVIDIA GeForce RTX 4090, Intel Core i7-12700 | |
| NVIDIA GeForce RTX 4090, Intel Core i7-13700 | |
| NVIDIA GeForce RTX 4090, Intel Core i5-13400 | |
| NVIDIA GeForce RTX 4090, AMD Ryzen 7 7800X3D | |
| NVIDIA GeForce RTX 4090, AMD Ryzen 9 7950X | |
| NVIDIA GeForce RTX 4090, Intel Core i9-14900K | |
| 3840x2160 Fire Strike Ultra Graphics | |
| NVIDIA GeForce RTX 4090, AMD Ryzen 7 7800X3D | |
| NVIDIA GeForce RTX 4090, AMD Ryzen 7 7745HX | |
| NVIDIA GeForce RTX 4090, Intel Core i5-14600K | |
| NVIDIA GeForce RTX 4090, Intel Core i7-13700 | |
| NVIDIA GeForce RTX 4090, Intel Core i5-13400 | |
| NVIDIA GeForce RTX 4090, AMD Ryzen 9 7950X | |
| NVIDIA GeForce RTX 4090, Intel Core i9-14900K | |
| NVIDIA GeForce RTX 4090, Intel Core i7-12700 | |
| NVIDIA GeForce RTX 4090, Intel Core i5-12400F | |
| Unigine Superposition | |
| 1280x720 720p Low | |
| NVIDIA GeForce RTX 4090, Intel Core i9-14900K | |
| NVIDIA GeForce RTX 4090, AMD Ryzen 7 7800X3D | |
| NVIDIA GeForce RTX 4090, AMD Ryzen 9 7950X | |
| NVIDIA GeForce RTX 4090, AMD Ryzen 7 7745HX | |
| NVIDIA GeForce RTX 4090, Intel Core i7-13700 | |
| NVIDIA GeForce RTX 4090, Intel Core i5-14600K | |
| NVIDIA GeForce RTX 4090, Intel Core i7-12700 | |
| NVIDIA GeForce RTX 4090, Intel Core i5-13400 | |
| NVIDIA GeForce RTX 4090, Intel Core i5-12400F | |
| 1920x1080 1080p High | |
| NVIDIA GeForce RTX 4090, Intel Core i9-14900K | |
| NVIDIA GeForce RTX 4090, AMD Ryzen 7 7800X3D | |
| NVIDIA GeForce RTX 4090, AMD Ryzen 9 7950X | |
| NVIDIA GeForce RTX 4090, AMD Ryzen 7 7745HX | |
| NVIDIA GeForce RTX 4090, Intel Core i7-13700 | |
| NVIDIA GeForce RTX 4090, Intel Core i5-14600K | |
| NVIDIA GeForce RTX 4090, Intel Core i7-12700 | |
| NVIDIA GeForce RTX 4090, Intel Core i5-13400 | |
| NVIDIA GeForce RTX 4090, Intel Core i5-12400F | |
| 1920x1080 1080p Extreme | |
| NVIDIA GeForce RTX 4090, AMD Ryzen 7 7800X3D | |
| NVIDIA GeForce RTX 4090, AMD Ryzen 7 7745HX | |
| NVIDIA GeForce RTX 4090, Intel Core i5-14600K | |
| NVIDIA GeForce RTX 4090, Intel Core i9-14900K | |
| NVIDIA GeForce RTX 4090, AMD Ryzen 9 7950X | |
| NVIDIA GeForce RTX 4090, Intel Core i7-13700 | |
| NVIDIA GeForce RTX 4090, Intel Core i5-13400 | |
| NVIDIA GeForce RTX 4090, Intel Core i7-12700 | |
| NVIDIA GeForce RTX 4090, Intel Core i5-12400F | |
| 3840x2160 4k Optimized | |
| NVIDIA GeForce RTX 4090, AMD Ryzen 9 7950X | |
| NVIDIA GeForce RTX 4090, Intel Core i7-13700 | |
| NVIDIA GeForce RTX 4090, Intel Core i9-14900K | |
| NVIDIA GeForce RTX 4090, Intel Core i5-14600K | |
| NVIDIA GeForce RTX 4090, AMD Ryzen 7 7800X3D | |
| NVIDIA GeForce RTX 4090, AMD Ryzen 7 7745HX | |
| NVIDIA GeForce RTX 4090, Intel Core i7-12700 | |
| NVIDIA GeForce RTX 4090, Intel Core i5-13400 | |
| NVIDIA GeForce RTX 4090, Intel Core i5-12400F | |
| 7680x4320 8k Optimized | |
| NVIDIA GeForce RTX 4090, AMD Ryzen 9 7950X | |
| NVIDIA GeForce RTX 4090, Intel Core i7-13700 | |
| NVIDIA GeForce RTX 4090, Intel Core i7-12700 | |
| NVIDIA GeForce RTX 4090, Intel Core i5-13400 | |
| NVIDIA GeForce RTX 4090, Intel Core i5-12400F | |
| NVIDIA GeForce RTX 4090, Intel Core i9-14900K | |
| NVIDIA GeForce RTX 4090, Intel Core i5-14600K | |
| NVIDIA GeForce RTX 4090, AMD Ryzen 7 7800X3D | |
| NVIDIA GeForce RTX 4090, AMD Ryzen 7 7745HX | |
| Unigine Valley 1.0 | |
| 1920x1080 Extreme HD DirectX AA:x8 | |
| NVIDIA GeForce RTX 4090, Intel Core i9-14900K | |
| NVIDIA GeForce RTX 4090, Intel Core i5-14600K | |
| NVIDIA GeForce RTX 4090, AMD Ryzen 9 7950X | |
| NVIDIA GeForce RTX 4090, Intel Core i7-13700 | |
| NVIDIA GeForce RTX 4090, AMD Ryzen 7 7745HX | |
| NVIDIA GeForce RTX 4090, AMD Ryzen 7 7800X3D | |
| NVIDIA GeForce RTX 4090, Intel Core i7-12700 | |
| NVIDIA GeForce RTX 4090, Intel Core i5-13400 | |
| NVIDIA GeForce RTX 4090, Intel Core i5-12400F | |
| 1920x1080 Extreme HD Preset OpenGL AA:x8 | |
| NVIDIA GeForce RTX 4090, Intel Core i9-14900K | |
| NVIDIA GeForce RTX 4090, Intel Core i5-14600K | |
| NVIDIA GeForce RTX 4090, Intel Core i7-13700 | |
| NVIDIA GeForce RTX 4090, AMD Ryzen 9 7950X | |
| NVIDIA GeForce RTX 4090, AMD Ryzen 7 7745HX | |
| NVIDIA GeForce RTX 4090, AMD Ryzen 7 7800X3D | |
| NVIDIA GeForce RTX 4090, Intel Core i7-12700 | |
| NVIDIA GeForce RTX 4090, Intel Core i5-13400 | |
| NVIDIA GeForce RTX 4090, Intel Core i5-12400F | |
| Unigine Heaven 4.0 | |
| Extreme Preset OpenGL | |
| NVIDIA GeForce RTX 4090, Intel Core i9-14900K | |
| NVIDIA GeForce RTX 4090, AMD Ryzen 7 7745HX | |
| NVIDIA GeForce RTX 4090, Intel Core i5-14600K | |
| NVIDIA GeForce RTX 4090, AMD Ryzen 9 7950X | |
| NVIDIA GeForce RTX 4090, Intel Core i7-13700 | |
| NVIDIA GeForce RTX 4090, AMD Ryzen 7 7800X3D | |
| NVIDIA GeForce RTX 4090, Intel Core i7-12700 | |
| NVIDIA GeForce RTX 4090, Intel Core i5-13400 | |
| NVIDIA GeForce RTX 4090, Intel Core i5-12400F | |
| Extreme Preset DX11 | |
| NVIDIA GeForce RTX 4090, AMD Ryzen 9 7950X | |
| NVIDIA GeForce RTX 4090, Intel Core i9-14900K | |
| NVIDIA GeForce RTX 4090, AMD Ryzen 7 7745HX | |
| NVIDIA GeForce RTX 4090, Intel Core i5-14600K | |
| NVIDIA GeForce RTX 4090, AMD Ryzen 7 7800X3D | |
| NVIDIA GeForce RTX 4090, Intel Core i7-13700 | |
| NVIDIA GeForce RTX 4090, Intel Core i7-12700 | |
| NVIDIA GeForce RTX 4090, Intel Core i5-13400 | |
| NVIDIA GeForce RTX 4090, Intel Core i5-12400F | |
| ComputeMark v2.1 | |
| 1024x600 Normal, Score | |
| NVIDIA GeForce RTX 4090, AMD Ryzen 7 7745HX | |
| NVIDIA GeForce RTX 4090, Intel Core i5-14600K | |
| NVIDIA GeForce RTX 4090, AMD Ryzen 9 7950X | |
| NVIDIA GeForce RTX 4090, Intel Core i9-14900K | |
| NVIDIA GeForce RTX 4090, Intel Core i7-12700 | |
| NVIDIA GeForce RTX 4090, AMD Ryzen 7 7800X3D | |
| NVIDIA GeForce RTX 4090, Intel Core i5-13400 | |
| NVIDIA GeForce RTX 4090, Intel Core i7-13700 | |
| 1024x600 Normal, Fluid 3DTex | |
| NVIDIA GeForce RTX 4090, AMD Ryzen 7 7800X3D | |
| NVIDIA GeForce RTX 4090, Intel Core i5-14600K | |
| NVIDIA GeForce RTX 4090, Intel Core i7-13700 | |
| NVIDIA GeForce RTX 4090, Intel Core i5-13400 | |
| NVIDIA GeForce RTX 4090, Intel Core i7-12700 | |
| NVIDIA GeForce RTX 4090, AMD Ryzen 9 7950X | |
| NVIDIA GeForce RTX 4090, AMD Ryzen 7 7745HX | |
| NVIDIA GeForce RTX 4090, Intel Core i9-14900K | |
| 1024x600 Normal, Fluid 2DTexArr | |
| NVIDIA GeForce RTX 4090, AMD Ryzen 7 7745HX | |
| NVIDIA GeForce RTX 4090, Intel Core i5-14600K | |
| NVIDIA GeForce RTX 4090, Intel Core i9-14900K | |
| NVIDIA GeForce RTX 4090, AMD Ryzen 9 7950X | |
| NVIDIA GeForce RTX 4090, Intel Core i7-12700 | |
| NVIDIA GeForce RTX 4090, Intel Core i7-13700 | |
| NVIDIA GeForce RTX 4090, AMD Ryzen 7 7800X3D | |
| NVIDIA GeForce RTX 4090, Intel Core i5-13400 | |
| 1024x600 Normal, Mandel Vector | |
| NVIDIA GeForce RTX 4090, AMD Ryzen 7 7745HX | |
| NVIDIA GeForce RTX 4090, Intel Core i5-14600K | |
| NVIDIA GeForce RTX 4090, AMD Ryzen 9 7950X | |
| NVIDIA GeForce RTX 4090, Intel Core i9-14900K | |
| NVIDIA GeForce RTX 4090, Intel Core i7-13700 | |
| NVIDIA GeForce RTX 4090, Intel Core i7-12700 | |
| NVIDIA GeForce RTX 4090, AMD Ryzen 7 7800X3D | |
| NVIDIA GeForce RTX 4090, Intel Core i5-13400 | |
| 1024x600 Normal, Mandel Scalar | |
| NVIDIA GeForce RTX 4090, AMD Ryzen 7 7745HX | |
| NVIDIA GeForce RTX 4090, Intel Core i5-14600K | |
| NVIDIA GeForce RTX 4090, Intel Core i9-14900K | |
| NVIDIA GeForce RTX 4090, AMD Ryzen 7 7800X3D | |
| NVIDIA GeForce RTX 4090, AMD Ryzen 9 7950X | |
| NVIDIA GeForce RTX 4090, Intel Core i7-12700 | |
| NVIDIA GeForce RTX 4090, Intel Core i7-13700 | |
| NVIDIA GeForce RTX 4090, Intel Core i5-13400 | |
| 1024x600 Normal, QJuliaRayTrace | |
| NVIDIA GeForce RTX 4090, AMD Ryzen 7 7745HX | |
| NVIDIA GeForce RTX 4090, Intel Core i5-14600K | |
| NVIDIA GeForce RTX 4090, AMD Ryzen 9 7950X | |
| NVIDIA GeForce RTX 4090, Intel Core i9-14900K | |
| NVIDIA GeForce RTX 4090, Intel Core i5-13400 | |
| NVIDIA GeForce RTX 4090, Intel Core i7-12700 | |
| NVIDIA GeForce RTX 4090, Intel Core i7-13700 | |
| NVIDIA GeForce RTX 4090, AMD Ryzen 7 7800X3D | |
| Performance rating - Percent | |
| AMD Ryzen 7 7800X3D | |
| AMD Ryzen 9 7950X3D | |
| Intel Core i9-14900K | |
| AMD Ryzen 9 7950X | |
| AMD Ryzen 5 7600X | |
| Intel Core i9-13900K | |
| Intel Core i7-13700K | |
| Intel Core i7-13700 | |
| AMD Ryzen 7 7745HX | |
| Intel Core i7-12700 | |
| Intel Core i5-13400 | |
| F1 22 - 1280x720 Ultra Low Preset AA:T AF:16x | |
| AMD Ryzen 7 7800X3D | |
| Intel Core i9-14900K | |
| AMD Ryzen 9 7950X3D | |
| AMD Ryzen 9 7950X | |
| AMD Ryzen 5 7600X | |
| Intel Core i9-13900K | |
| AMD Ryzen 7 7745HX | |
| Intel Core i7-13700K | |
| Intel Core i7-13700 | |
| Intel Core i7-12700 | |
| Intel Core i5-13400 | |
| Far Cry 5 - 1280x720 Low Preset AA:T | |
| AMD Ryzen 7 7800X3D | |
| AMD Ryzen 9 7950X3D | |
| Intel Core i9-14900K | |
| Intel Core i9-13900K | |
| Intel Core i7-13700K | |
| AMD Ryzen 5 7600X | |
| AMD Ryzen 9 7950X | |
| Intel Core i7-13700 | |
| AMD Ryzen 7 7745HX | |
| Intel Core i7-12700 | |
| Intel Core i5-13400 | |
| X-Plane 11.11 - 1280x720 low (fps_test=1) | |
| Intel Core i9-13900K | |
| Intel Core i9-14900K | |
| AMD Ryzen 9 7950X3D | |
| Intel Core i7-13700K | |
| AMD Ryzen 9 7950X | |
| AMD Ryzen 7 7800X3D | |
| Intel Core i7-13700 | |
| AMD Ryzen 5 7600X | |
| AMD Ryzen 7 7745HX | |
| Intel Core i7-12700 | |
| Intel Core i5-13400 | |
| Final Fantasy XV Benchmark - 1280x720 Lite Quality | |
| AMD Ryzen 7 7745HX | |
| Intel Core i9-13900K | |
| AMD Ryzen 9 7950X | |
| AMD Ryzen 5 7600X | |
| Intel Core i7-13700 | |
| Intel Core i7-13700K | |
| AMD Ryzen 7 7800X3D | |
| Intel Core i9-14900K | |
| AMD Ryzen 9 7950X3D | |
| Intel Core i7-12700 | |
| Intel Core i5-13400 | |
| Dota 2 Reborn - 1280x720 min (0/3) fastest | |
| AMD Ryzen 7 7800X3D | |
| AMD Ryzen 9 7950X3D | |
| AMD Ryzen 9 7950X | |
| Intel Core i9-14900K | |
| Intel Core i9-13900K | |
| AMD Ryzen 5 7600X | |
| AMD Ryzen 7 7745HX | |
| Intel Core i7-13700K | |
| Intel Core i7-13700 | |
| Intel Core i7-12700 | |
| Intel Core i5-13400 | |
| The Witcher 3 - 1024x768 Low Graphics & Postprocessing | |
| AMD Ryzen 9 7950X3D | |
| AMD Ryzen 7 7800X3D | |
| Intel Core i9-14900K | |
| AMD Ryzen 9 7950X | |
| Intel Core i9-13900K | |
| AMD Ryzen 5 7600X | |
| AMD Ryzen 7 7745HX | |
| Intel Core i7-13700K | |
| Intel Core i7-13700 | |
| Intel Core i7-12700 | |
| Intel Core i5-13400 | |
| GTA V - 1024x768 Lowest Settings possible | |
| AMD Ryzen 7 7800X3D | |
| AMD Ryzen 9 7950X | |
| AMD Ryzen 9 7950X3D | |
| AMD Ryzen 5 7600X | |
| Intel Core i9-14900K | |
| Intel Core i9-13900K | |
| Intel Core i7-13700 | |
| Intel Core i7-13700K | |
| AMD Ryzen 7 7745HX | |
| Intel Core i7-12700 | |
| Intel Core i5-13400 | |
| Borderlands 3 - 1280x720 Very Low Overall Quality (DX11) | |
| AMD Ryzen 7 7800X3D | |
| AMD Ryzen 9 7950X3D | |
| Intel Core i9-14900K | |
| Intel Core i9-13900K | |
| AMD Ryzen 9 7950X | |
| AMD Ryzen 5 7600X | |
| Intel Core i7-13700 | |
| Intel Core i7-13700K | |
| AMD Ryzen 7 7745HX | |
| Intel Core i7-12700 | |
| Intel Core i5-13400 | |
| Far Cry New Dawn - 1280x720 Low Preset | |
| AMD Ryzen 7 7800X3D | |
| AMD Ryzen 9 7950X3D | |
| Intel Core i9-14900K | |
| Intel Core i9-13900K | |
| Intel Core i7-13700 | |
| Intel Core i7-13700K | |
| AMD Ryzen 9 7950X | |
| AMD Ryzen 5 7600X | |
| Intel Core i7-12700 | |
| AMD Ryzen 7 7745HX | |
| Intel Core i5-13400 | |
| Shadow of the Tomb Raider - 1280x720 Lowest Preset | |
| AMD Ryzen 7 7800X3D | |
| AMD Ryzen 9 7950X3D | |
| AMD Ryzen 9 7950X | |
| Intel Core i9-14900K | |
| AMD Ryzen 5 7600X | |
| Intel Core i9-13900K | |
| AMD Ryzen 7 7745HX | |
| Intel Core i7-13700 | |
| Intel Core i7-13700K | |
| Intel Core i7-12700 | |
| Intel Core i5-13400 | |
| Tiny Tina's Wonderlands - 1280x720 Lowest Preset (DX12) | |
| AMD Ryzen 7 7800X3D | |
| Intel Core i9-14900K | |
| AMD Ryzen 9 7950X3D | |
| AMD Ryzen 9 7950X | |
| AMD Ryzen 5 7600X | |
| Intel Core i9-13900K | |
| AMD Ryzen 7 7745HX | |
| Intel Core i7-13700 | |
| Intel Core i7-13700K | |
| Intel Core i7-12700 | |
| Intel Core i5-13400 | |
| Strange Brigade - 1280x720 lowest AF:1 | |
| AMD Ryzen 5 7600X | |
| Intel Core i9-14900K | |
| AMD Ryzen 7 7800X3D | |
| AMD Ryzen 9 7950X | |
| Intel Core i9-13900K | |
| AMD Ryzen 7 7745HX | |
| AMD Ryzen 9 7950X3D | |
| Intel Core i7-13700K | |
| Intel Core i7-13700 | |
| Intel Core i7-12700 | |
| Intel Core i5-13400 | |
| Metro Exodus - 1280x720 Low Quality AF:4x | |
| AMD Ryzen 7 7800X3D | |
| Intel Core i9-14900K | |
| AMD Ryzen 5 7600X | |
| AMD Ryzen 9 7950X | |
| AMD Ryzen 9 7950X3D | |
| AMD Ryzen 7 7745HX | |
| Intel Core i7-13700 | |
| Intel Core i9-13900K | |
| Intel Core i7-13700K | |
| Intel Core i7-12700 | |
| Intel Core i5-13400 | |
| F1 2020 - 1280x720 Ultra Low Preset | |
| AMD Ryzen 7 7800X3D | |
| Intel Core i9-14900K | |
| AMD Ryzen 9 7950X3D | |
| AMD Ryzen 9 7950X | |
| AMD Ryzen 5 7600X | |
| AMD Ryzen 7 7745HX | |
| Intel Core i9-13900K | |
| Intel Core i7-13700K | |
| Intel Core i7-13700 | |
| Intel Core i7-12700 | |
| Intel Core i5-13400 | |
| F1 2021 - 1280x720 Ultra Low Preset | |
| AMD Ryzen 7 7800X3D | |
| Intel Core i9-14900K | |
| AMD Ryzen 5 7600X | |
| AMD Ryzen 9 7950X3D | |
| AMD Ryzen 9 7950X | |
| Intel Core i9-13900K | |
| AMD Ryzen 7 7745HX | |
| Intel Core i7-13700K | |
| Intel Core i7-13700 | |
| Intel Core i7-12700 | |
| Intel Core i5-13400 | |
| Performance rating - Percent | |
| AMD Ryzen 7 7800X3D | |
| AMD Ryzen 9 7950X3D | |
| Intel Core i9-14900K | |
| AMD Ryzen 9 7950X | |
| AMD Ryzen 5 7600X | |
| Intel Core i9-13900K | |
| Intel Core i7-13700K | |
| Intel Core i7-13700 | |
| AMD Ryzen 7 7745HX | |
| Intel Core i7-12700 | |
| Intel Core i5-13400 | |
| F1 22 | |
| 3840x2160 Ultra High Preset AA:T AF:16x | |
| AMD Ryzen 7 7745HX | |
| AMD Ryzen 7 7800X3D | |
| Intel Core i9-14900K | |
| AMD Ryzen 5 7600X | |
| AMD Ryzen 9 7950X | |
| Intel Core i7-13700K | |
| AMD Ryzen 9 7950X3D | |
| Intel Core i7-13700 | |
| Intel Core i7-12700 | |
| Intel Core i5-13400 | |
| Intel Core i9-13900K | |
| 2560x1440 Ultra High Preset AA:T AF:16x | |
| AMD Ryzen 7 7800X3D | |
| Intel Core i9-14900K | |
| AMD Ryzen 7 7745HX | |
| AMD Ryzen 9 7950X3D | |
| AMD Ryzen 5 7600X | |
| AMD Ryzen 9 7950X | |
| Intel Core i9-13900K | |
| Intel Core i7-13700K | |
| Intel Core i7-13700 | |
| Intel Core i7-12700 | |
| Intel Core i5-13400 | |
| 1920x1080 Ultra High Preset AA:T AF:16x | |
| AMD Ryzen 7 7800X3D | |
| Intel Core i9-14900K | |
| AMD Ryzen 5 7600X | |
| AMD Ryzen 9 7950X3D | |
| AMD Ryzen 9 7950X | |
| Intel Core i9-13900K | |
| AMD Ryzen 7 7745HX | |
| Intel Core i7-13700K | |
| Intel Core i7-13700 | |
| Intel Core i7-12700 | |
| Intel Core i5-13400 | |
| Far Cry 5 | |
| 3840x2160 Ultra Preset AA:T | |
| AMD Ryzen 7 7800X3D | |
| Intel Core i9-14900K | |
| Intel Core i9-13900K | |
| AMD Ryzen 9 7950X3D | |
| AMD Ryzen 9 7950X | |
| AMD Ryzen 5 7600X | |
| Intel Core i7-13700K | |
| Intel Core i7-13700 | |
| Intel Core i7-12700 | |
| AMD Ryzen 7 7745HX | |
| Intel Core i5-13400 | |
| 2560x1440 Ultra Preset AA:T | |
| AMD Ryzen 7 7800X3D | |
| AMD Ryzen 9 7950X3D | |
| Intel Core i9-14900K | |
| Intel Core i9-13900K | |
| AMD Ryzen 5 7600X | |
| AMD Ryzen 9 7950X | |
| Intel Core i7-13700K | |
| Intel Core i7-13700 | |
| AMD Ryzen 7 7745HX | |
| Intel Core i7-12700 | |
| Intel Core i5-13400 | |
| 1920x1080 Ultra Preset AA:T | |
| AMD Ryzen 7 7800X3D | |
| AMD Ryzen 9 7950X3D | |
| Intel Core i9-14900K | |
| Intel Core i9-13900K | |
| AMD Ryzen 9 7950X | |
| AMD Ryzen 5 7600X | |
| Intel Core i7-13700 | |
| Intel Core i7-13700K | |
| Intel Core i7-12700 | |
| AMD Ryzen 7 7745HX | |
| Intel Core i5-13400 | |
| Final Fantasy XV Benchmark | |
| 3840x2160 High Quality | |
| Intel Core i9-14900K | |
| Intel Core i9-13900K | |
| AMD Ryzen 9 7950X | |
| AMD Ryzen 7 7745HX | |
| AMD Ryzen 5 7600X | |
| AMD Ryzen 7 7800X3D | |
| Intel Core i7-13700 | |
| AMD Ryzen 9 7950X3D | |
| Intel Core i7-13700K | |
| Intel Core i7-12700 | |
| Intel Core i5-13400 | |
| 2560x1440 High Quality | |
| AMD Ryzen 7 7800X3D | |
| Intel Core i9-14900K | |
| Intel Core i9-13900K | |
| AMD Ryzen 9 7950X | |
| AMD Ryzen 9 7950X3D | |
| AMD Ryzen 5 7600X | |
| Intel Core i7-13700K | |
| Intel Core i7-13700 | |
| AMD Ryzen 7 7745HX | |
| Intel Core i7-12700 | |
| Intel Core i5-13400 | |
| 1920x1080 High Quality | |
| Intel Core i9-14900K | |
| AMD Ryzen 9 7950X | |
| AMD Ryzen 7 7800X3D | |
| Intel Core i9-13900K | |
| AMD Ryzen 9 7950X3D | |
| Intel Core i7-13700K | |
| AMD Ryzen 5 7600X | |
| Intel Core i7-13700 | |
| AMD Ryzen 7 7745HX | |
| Intel Core i7-12700 | |
| Intel Core i5-13400 | |
| Dota 2 Reborn | |
| 3840x2160 ultra (3/3) best looking | |
| AMD Ryzen 7 7800X3D | |
| AMD Ryzen 9 7950X3D | |
| AMD Ryzen 9 7950X | |
| Intel Core i9-13900K | |
| Intel Core i9-14900K | |
| AMD Ryzen 5 7600X | |
| Intel Core i7-13700K | |
| Intel Core i7-13700 | |
| AMD Ryzen 7 7745HX | |
| Intel Core i7-12700 | |
| Intel Core i5-13400 | |
| 1920x1080 ultra (3/3) best looking | |
| AMD Ryzen 7 7800X3D | |
| AMD Ryzen 9 7950X3D | |
| AMD Ryzen 9 7950X | |
| Intel Core i9-13900K | |
| Intel Core i9-14900K | |
| AMD Ryzen 5 7600X | |
| Intel Core i7-13700K | |
| Intel Core i7-13700 | |
| AMD Ryzen 7 7745HX | |
| Intel Core i7-12700 | |
| Intel Core i5-13400 | |
| The Witcher 3 | |
| 3840x2160 High Graphics & Postprocessing (Nvidia HairWorks Off) | |
| AMD Ryzen 5 7600X | |
| Intel Core i9-14900K | |
| AMD Ryzen 9 7950X | |
| Intel Core i5-13400 | |
| Intel Core i7-13700 | |
| Intel Core i7-12700 | |
| AMD Ryzen 7 7800X3D | |
| Intel Core i7-13700K | |
| AMD Ryzen 7 7745HX | |
| AMD Ryzen 9 7950X3D | |
| Intel Core i9-13900K | |
| 1920x1080 Ultra Graphics & Postprocessing (HBAO+) | |
| Intel Core i9-13900K | |
| AMD Ryzen 9 7950X | |
| AMD Ryzen 7 7800X3D | |
| Intel Core i9-14900K | |
| AMD Ryzen 5 7600X | |
| Intel Core i7-13700K | |
| Intel Core i7-13700 | |
| AMD Ryzen 9 7950X3D | |
| Intel Core i7-12700 | |
| AMD Ryzen 7 7745HX | |
| Intel Core i5-13400 | |
| GTA V | |
| 3840x2160 Highest AA:4xMSAA + FX AF:16x | |
| AMD Ryzen 7 7800X3D | |
| Intel Core i9-14900K | |
| Intel Core i9-13900K | |
| AMD Ryzen 9 7950X | |
| AMD Ryzen 9 7950X3D | |
| Intel Core i7-13700K | |
| AMD Ryzen 5 7600X | |
| Intel Core i7-13700 | |
| AMD Ryzen 7 7745HX | |
| Intel Core i7-12700 | |
| Intel Core i5-13400 | |
| 2560x1440 Highest AA:4xMSAA + FX AF:16x | |
| AMD Ryzen 7 7800X3D | |
| Intel Core i9-14900K | |
| Intel Core i9-13900K | |
| AMD Ryzen 9 7950X | |
| AMD Ryzen 9 7950X3D | |
| Intel Core i7-13700K | |
| Intel Core i7-13700 | |
| AMD Ryzen 5 7600X | |
| AMD Ryzen 7 7745HX | |
| Intel Core i7-12700 | |
| Intel Core i5-13400 | |
| 1920x1080 Highest AA:4xMSAA + FX AF:16x | |
| AMD Ryzen 7 7800X3D | |
| Intel Core i9-14900K | |
| Intel Core i9-13900K | |
| AMD Ryzen 9 7950X | |
| AMD Ryzen 9 7950X3D | |
| Intel Core i7-13700K | |
| AMD Ryzen 5 7600X | |
| Intel Core i7-13700 | |
| AMD Ryzen 7 7745HX | |
| Intel Core i7-12700 | |
| Intel Core i5-13400 | |
| Borderlands 3 | |
| 3840x2160 Badass Overall Quality (DX11) | |
| Intel Core i7-13700K | |
| Intel Core i9-14900K | |
| AMD Ryzen 7 7800X3D | |
| AMD Ryzen 9 7950X3D | |
| Intel Core i9-13900K | |
| AMD Ryzen 9 7950X | |
| AMD Ryzen 5 7600X | |
| Intel Core i7-13700 | |
| AMD Ryzen 7 7745HX | |
| Intel Core i7-12700 | |
| Intel Core i5-13400 | |
| 2560x1440 Badass Overall Quality (DX11) | |
| AMD Ryzen 7 7800X3D | |
| AMD Ryzen 9 7950X3D | |
| Intel Core i9-14900K | |
| AMD Ryzen 9 7950X | |
| Intel Core i9-13900K | |
| AMD Ryzen 5 7600X | |
| Intel Core i7-13700K | |
| Intel Core i7-13700 | |
| AMD Ryzen 7 7745HX | |
| Intel Core i7-12700 | |
| Intel Core i5-13400 | |
| 1920x1080 Badass Overall Quality (DX11) | |
| AMD Ryzen 9 7950X3D | |
| AMD Ryzen 7 7800X3D | |
| Intel Core i9-14900K | |
| AMD Ryzen 9 7950X | |
| Intel Core i9-13900K | |
| AMD Ryzen 5 7600X | |
| Intel Core i7-13700K | |
| Intel Core i7-13700 | |
| AMD Ryzen 7 7745HX | |
| Intel Core i7-12700 | |
| Intel Core i5-13400 | |
| Far Cry New Dawn | |
| 3840x2160 Ultra Preset | |
| AMD Ryzen 7 7800X3D | |
| AMD Ryzen 9 7950X3D | |
| Intel Core i9-14900K | |
| Intel Core i9-13900K | |
| AMD Ryzen 9 7950X | |
| Intel Core i7-13700 | |
| Intel Core i7-13700K | |
| AMD Ryzen 5 7600X | |
| Intel Core i7-12700 | |
| AMD Ryzen 7 7745HX | |
| Intel Core i5-13400 | |
| 2560x1440 Ultra Preset | |
| AMD Ryzen 7 7800X3D | |
| AMD Ryzen 9 7950X3D | |
| Intel Core i9-14900K | |
| Intel Core i9-13900K | |
| AMD Ryzen 9 7950X | |
| Intel Core i7-13700K | |
| AMD Ryzen 5 7600X | |
| Intel Core i7-13700 | |
| Intel Core i7-12700 | |
| AMD Ryzen 7 7745HX | |
| Intel Core i5-13400 | |
| 1920x1080 Ultra Preset | |
| AMD Ryzen 7 7800X3D | |
| AMD Ryzen 9 7950X3D | |
| Intel Core i9-14900K | |
| Intel Core i9-13900K | |
| AMD Ryzen 9 7950X | |
| Intel Core i7-13700K | |
| AMD Ryzen 5 7600X | |
| Intel Core i7-13700 | |
| Intel Core i7-12700 | |
| AMD Ryzen 7 7745HX | |
| Intel Core i5-13400 | |
| Shadow of the Tomb Raider | |
| 3840x2160 Highest Preset AA:T | |
| Intel Core i9-14900K | |
| Intel Core i7-13700K | |
| AMD Ryzen 7 7800X3D | |
| Intel Core i7-13700 | |
| AMD Ryzen 9 7950X3D | |
| AMD Ryzen 5 7600X | |
| AMD Ryzen 7 7745HX | |
| AMD Ryzen 9 7950X | |
| Intel Core i9-13900K | |
| Intel Core i7-12700 | |
| Intel Core i5-13400 | |
| 2560x1440 Highest Preset AA:T | |
| AMD Ryzen 7 7800X3D | |
| AMD Ryzen 9 7950X3D | |
| Intel Core i9-14900K | |
| Intel Core i9-13900K | |
| AMD Ryzen 9 7950X | |
| AMD Ryzen 5 7600X | |
| Intel Core i7-13700K | |
| Intel Core i7-13700 | |
| AMD Ryzen 7 7745HX | |
| Intel Core i7-12700 | |
| Intel Core i5-13400 | |
| 1920x1080 Highest Preset AA:T | |
| AMD Ryzen 7 7800X3D | |
| AMD Ryzen 9 7950X3D | |
| Intel Core i9-14900K | |
| AMD Ryzen 9 7950X | |
| Intel Core i9-13900K | |
| AMD Ryzen 5 7600X | |
| Intel Core i7-13700K | |
| Intel Core i7-13700 | |
| AMD Ryzen 7 7745HX | |
| Intel Core i7-12700 | |
| Intel Core i5-13400 | |
| Tiny Tina's Wonderlands | |
| 3840x2160 Badass Preset (DX12) | |
| Intel Core i9-14900K | |
| AMD Ryzen 9 7950X3D | |
| AMD Ryzen 7 7745HX | |
| AMD Ryzen 5 7600X | |
| AMD Ryzen 9 7950X | |
| Intel Core i7-13700 | |
| Intel Core i9-13900K | |
| AMD Ryzen 7 7800X3D | |
| Intel Core i7-12700 | |
| Intel Core i5-13400 | |
| Intel Core i7-13700K | |
| 2560x1440 Badass Preset (DX12) | |
| AMD Ryzen 9 7950X3D | |
| Intel Core i9-14900K | |
| AMD Ryzen 7 7800X3D | |
| AMD Ryzen 9 7950X | |
| AMD Ryzen 7 7745HX | |
| AMD Ryzen 5 7600X | |
| Intel Core i7-13700K | |
| Intel Core i9-13900K | |
| Intel Core i7-13700 | |
| Intel Core i7-12700 | |
| Intel Core i5-13400 | |
| 1920x1080 Badass Preset (DX12) | |
| AMD Ryzen 7 7800X3D | |
| Intel Core i9-14900K | |
| AMD Ryzen 9 7950X3D | |
| AMD Ryzen 9 7950X | |
| AMD Ryzen 5 7600X | |
| AMD Ryzen 7 7745HX | |
| Intel Core i9-13900K | |
| Intel Core i7-13700 | |
| Intel Core i7-13700K | |
| Intel Core i7-12700 | |
| Intel Core i5-13400 | |
| Strange Brigade | |
| 3840x2160 ultra AA:ultra AF:16 | |
| Intel Core i9-14900K | |
| AMD Ryzen 7 7800X3D | |
| AMD Ryzen 7 7745HX | |
| Intel Core i7-13700K | |
| AMD Ryzen 9 7950X3D | |
| Intel Core i7-12700 | |
| AMD Ryzen 5 7600X | |
| Intel Core i7-13700 | |
| AMD Ryzen 9 7950X | |
| Intel Core i9-13900K | |
| Intel Core i5-13400 | |
| 2560x1440 ultra AA:ultra AF:16 | |
| Intel Core i9-14900K | |
| AMD Ryzen 7 7800X3D | |
| AMD Ryzen 5 7600X | |
| AMD Ryzen 7 7745HX | |
| AMD Ryzen 9 7950X | |
| Intel Core i9-13900K | |
| AMD Ryzen 9 7950X3D | |
| Intel Core i7-13700K | |
| Intel Core i7-13700 | |
| Intel Core i7-12700 | |
| Intel Core i5-13400 | |
| 1920x1080 ultra AA:ultra AF:16 | |
| Intel Core i9-14900K | |
| AMD Ryzen 5 7600X | |
| AMD Ryzen 7 7800X3D | |
| AMD Ryzen 9 7950X | |
| Intel Core i9-13900K | |
| AMD Ryzen 7 7745HX | |
| AMD Ryzen 9 7950X3D | |
| Intel Core i7-13700K | |
| Intel Core i7-13700 | |
| Intel Core i7-12700 | |
| Intel Core i5-13400 | |
| Metro Exodus | |
| 3840x2160 Ultra Quality AF:16x | |
| Intel Core i9-14900K | |
| AMD Ryzen 7 7800X3D | |
| AMD Ryzen 9 7950X | |
| AMD Ryzen 9 7950X3D | |
| Intel Core i9-13900K | |
| AMD Ryzen 5 7600X | |
| Intel Core i7-13700 | |
| Intel Core i7-13700K | |
| AMD Ryzen 7 7745HX | |
| Intel Core i7-12700 | |
| Intel Core i5-13400 | |
| 2560x1440 Ultra Quality AF:16x | |
| AMD Ryzen 7 7800X3D | |
| Intel Core i9-14900K | |
| AMD Ryzen 9 7950X | |
| AMD Ryzen 5 7600X | |
| AMD Ryzen 7 7745HX | |
| AMD Ryzen 9 7950X3D | |
| Intel Core i9-13900K | |
| Intel Core i7-13700 | |
| Intel Core i7-13700K | |
| Intel Core i7-12700 | |
| Intel Core i5-13400 | |
| 1920x1080 Ultra Quality AF:16x | |
| AMD Ryzen 7 7800X3D | |
| Intel Core i9-14900K | |
| AMD Ryzen 9 7950X | |
| AMD Ryzen 7 7745HX | |
| AMD Ryzen 5 7600X | |
| AMD Ryzen 9 7950X3D | |
| Intel Core i9-13900K | |
| Intel Core i7-13700 | |
| Intel Core i7-13700K | |
| Intel Core i7-12700 | |
| Intel Core i5-13400 | |
| F1 2020 | |
| 3840x2160 Ultra High Preset AA:T AF:16x | |
| Intel Core i9-14900K | |
| AMD Ryzen 9 7950X3D | |
| AMD Ryzen 7 7800X3D | |
| AMD Ryzen 7 7745HX | |
| AMD Ryzen 9 7950X | |
| Intel Core i9-13900K | |
| AMD Ryzen 5 7600X | |
| Intel Core i7-13700K | |
| Intel Core i7-13700 | |
| Intel Core i7-12700 | |
| Intel Core i5-13400 | |
| 2560x1440 Ultra High Preset AA:T AF:16x | |
| AMD Ryzen 7 7800X3D | |
| Intel Core i9-14900K | |
| AMD Ryzen 9 7950X3D | |
| AMD Ryzen 9 7950X | |
| Intel Core i9-13900K | |
| AMD Ryzen 5 7600X | |
| AMD Ryzen 7 7745HX | |
| Intel Core i7-13700K | |
| Intel Core i7-13700 | |
| Intel Core i7-12700 | |
| Intel Core i5-13400 | |
| 1920x1080 Ultra High Preset AA:T AF:16x | |
| AMD Ryzen 7 7800X3D | |
| AMD Ryzen 9 7950X3D | |
| Intel Core i9-14900K | |
| AMD Ryzen 5 7600X | |
| AMD Ryzen 9 7950X | |
| AMD Ryzen 7 7745HX | |
| Intel Core i9-13900K | |
| Intel Core i7-13700K | |
| Intel Core i7-13700 | |
| Intel Core i7-12700 | |
| Intel Core i5-13400 | |
| F1 2021 | |
| 3840x2160 Ultra High Preset + Raytracing AA:T AF:16x | |
| AMD Ryzen 7 7800X3D | |
| AMD Ryzen 7 7745HX | |
| AMD Ryzen 5 7600X | |
| AMD Ryzen 9 7950X3D | |
| Intel Core i9-14900K | |
| AMD Ryzen 9 7950X | |
| Intel Core i7-13700K | |
| Intel Core i7-13700 | |
| Intel Core i9-13900K | |
| Intel Core i7-12700 | |
| Intel Core i5-13400 | |
| 2560x1440 Ultra High Preset + Raytracing AA:T AF:16x | |
| AMD Ryzen 7 7800X3D | |
| Intel Core i9-14900K | |
| AMD Ryzen 5 7600X | |
| AMD Ryzen 9 7950X3D | |
| AMD Ryzen 9 7950X | |
| Intel Core i7-13700K | |
| Intel Core i7-13700 | |
| AMD Ryzen 7 7745HX | |
| Intel Core i7-12700 | |
| Intel Core i5-13400 | |
| Intel Core i9-13900K | |
| 1920x1080 Ultra High Preset + Raytracing AA:T AF:16x | |
| AMD Ryzen 7 7800X3D | |
| Intel Core i9-14900K | |
| AMD Ryzen 5 7600X | |
| Intel Core i9-13900K | |
| AMD Ryzen 9 7950X | |
| AMD Ryzen 9 7950X3D | |
| Intel Core i7-13700K | |
| Intel Core i7-13700 | |
| AMD Ryzen 7 7745HX | |
| Intel Core i7-12700 | |
| Intel Core i5-13400 | |
Power consumption with external monitor
| Bas | Moyen | Élevé | Ultra | QHD | 4K DLSS | 4K | |
|---|---|---|---|---|---|---|---|
| GTA V (2015) | 187.6 | 186.9 | 183.7 | 142.9 | 142.6 | 183.6 | |
| The Witcher 3 (2015) | 692 | 608 | 566 | 291 | 255 | 277 | |
| Dota 2 Reborn (2015) | 252 | 222 | 218 | 195.2 | 192.8 | ||
| Final Fantasy XV Benchmark (2018) | 237 | 236 | 217 | 212 | 160.2 | ||
| X-Plane 11.11 (2018) | 195.9 | 164.5 | 127.3 | 106.7 | |||
| Far Cry 5 (2018) | 205 | 176 | 168 | 155 | 157 | 152 | |
| Strange Brigade (2018) | 676 | 553 | 548 | 541 | 517 | 287 | |
| Shadow of the Tomb Raider (2018) | 275 | 253 | 246 | 254 | 242 | 186.4 | |
| Far Cry New Dawn (2019) | 170 | 148 | 143 | 128 | 128 | 124 | |
| Metro Exodus (2019) | 287 | 271 | 239 | 199.4 | 182.8 | 135.8 | |
| Borderlands 3 (2019) | 203 | 179.9 | 162.4 | 154.7 | 153.2 | 127.9 | |
| F1 2020 (2020) | 529 | 408 | 431 | 392 | 383 | 287 | |
| Death Stranding (2020) | 238 | 237 | 234 | 230 | 227 | 197.7 | |
| Horizon Zero Dawn (2020) | 290 | 268 | 250 | 237 | 230 | 208 | 165 |
| F1 2021 (2021) | 589 | 567 | 483 | 253 | 252 | 207 | |
| Forza Horizon 5 (2021) | 359 | 281 | 278 | 201 | 187 | 161 | |
| God of War (2022) | 230 | 233 | 229 | 205 | 179.7 | 127.1 | |
| GRID Legends (2022) | 229 | 205 | 190.1 | 184.2 | 181.8 | 173.9 | |
| Tiny Tina's Wonderlands (2022) | 393 | 333 | 295 | 279 | 229 | 130.8 | |
| F1 22 (2022) | 375 | 391 | 363 | 191.4 | 159.5 | 84.9 | |
| The Callisto Protocol (2022) | 211.1 | 199.9 | 196.8 | 185.5 | 179.2 | 149.6 | |
| High On Life (2023) | 343 | 325 | 292 | 278 | 224 | 109.9 | |
| The Witcher 3 v4 (2023) | 259 | 219 | 191.6 | 180.1 | 176.9 | 160.4 | |
| Dead Space Remake (2023) | 194.3 | 194.1 | 186.1 | 184.9 | 170.6 | 97.9 | |
| Returnal (2023) | 199 | 199 | 196 | 193 | 170 | 113 | |
| Atomic Heart (2023) | 258 | 214 | 190 | 177.9 | 164.6 | 105.6 | |
| Company of Heroes 3 (2023) | 312.3 | 284.6 | 268.8 | 267.4 | 236.3 | 195.4 | |
| The Last of Us (2023) | 182.3 | 171.4 | 170.3 | 166.5 | 142.5 | 123.9 | 82.2 |
| F1 23 (2023) | 384 | 401 | 379 | 174.6 | 153.2 | 133.2 | 80.7 |
| Starfield (2023) | 164 | 162.7 | 152.6 | 144.5 | 122.7 | 82.1 | |
| Lies of P (2023) | 315 | 296 | 276 | 257 | 245 | 224 | 165.8 |
| Cyberpunk 2077 (2023) | 203 | 201 | 185.5 | 170.7 | 152 | 75.9 | |
| Assassin's Creed Mirage (2023) | 253 | 244 | 232 | 166 | 160 | 144 | 130 |
| Total War Pharaoh (2023) | 544.4 | 319.5 | 211.7 | 163.1 | 162.8 | 150 | |
| Lords of the Fallen (2023) | 160.8 | 154.8 | 147.8 | 122.1 | 93.9 | 93.2 | 55.4 |
| EA Sports WRC (2023) | 224 | 147.3 | 138.3 | 134.7 | 131.7 | 123.2 | 120.7 |
| Call of Duty Modern Warfare 3 2023 (2023) | 246 | 245 | 244 | 243 | 230 | 164 | |
| Avatar Frontiers of Pandora (2023) | 236 | 224 | 201 | 169 | 126 | 113 | 68 |
| The Finals (2023) | 302 | 268 | 261 | 270 | 257 | 223 | 140.4 |
Consommation électrique et températures
Minisforum fournit la carte mère BD770i avec un système de refroidissement heatpipe préinstallé. Cependant, les utilisateurs ont la possibilité de choisir un ventilateur de 120 millimètres pour l'installation. Il convient de noter que des variations de température peuvent se produire avec différents ventilateurs par rapport à notre ventilateur Noctua NF-A12x25. Dans l'ensemble, nous n'avons que peu de critiques à formuler sur l'unité de refroidissement. Le SoC et les convertisseurs de tension de la carte mère bénéficient d'un refroidissement direct, ce qui signifie qu'il n'est pas possible d'installer d'autres refroidisseurs. Les températures de l'AMD Ryzen 7 7745HX se situent juste au-dessus de 90 °C dans les systèmes fermés et ouverts. Ce résultat est acceptable pour un processeur mobile, car les spécifications d'AMD permettent au processeur d'atteindre des températures allant jusqu'à 100 °C avant de voir ses performances diminuer. Même lors de tests de stress prolongés, nous n'avons pas atteint les 100 °C.
L'une des caractéristiques du Minisforum BD770i est sa consommation d'énergie. Nous n'avons enregistré que 127,5 watts dans le test Cinebench R15 Multi, ce qui se traduit par une efficacité exceptionnelle, surpassant les autres systèmes de bureau en comparaison. Dans les scénarios de jeu, où une part importante de l'énergie est utilisée pour les performances de la carte graphique, nous avons obtenu un résultat relativement bon avec une moyenne de 495 watts. L'efficacité de l'AMD Ryzen 7 7745HX est comparable à celle de l'AMD Ryzen 7 7800X3D. Cependant, en termes d'efficacité en mode jeu, l'AMD Ryzen 7 7745HX surpasse l'AMD Ryzen 7 7800X3D. Sans l'utilisation d'une carte graphique dédiée, le système de test a fonctionné de manière beaucoup plus économique, nécessitant une moyenne de seulement 60 watts en mode jeu.
En ce qui concerne le fonctionnement général et les niveaux de bruit, nous avons observé que le bloc d'alimentation installé est audible dans notre configuration de test. Nous n'avons détecté aucune mesure influencée par l'adaptateur installé, que ce soit au ralenti ou en charge. Le petit ventilateur préinstallé pour le refroidissement actif du SSD fonctionne très silencieusement et reste inaudible depuis un boîtier fermé. Les paramètres du BIOS de la carte mère Minisforum BD770i offrent des options de réglage limitées. Les utilisateurs peuvent régler la puissance du CPU par paliers prédéfinis (45, 55 et 75 watts) et ajuster la température maximale du CPU à n'importe quelle valeur. Par rapport à des fabricants de cartes mères réputés, la carte mère Minisforum BD770i offre des options de réglage plus limitées. La possibilité d'ajuster la courbe du ventilateur pourrait être un ajout précieux pour les utilisateurs qui préfèrent la flexibilité à l'expérimentation des limites de puissance et de température du SoC.
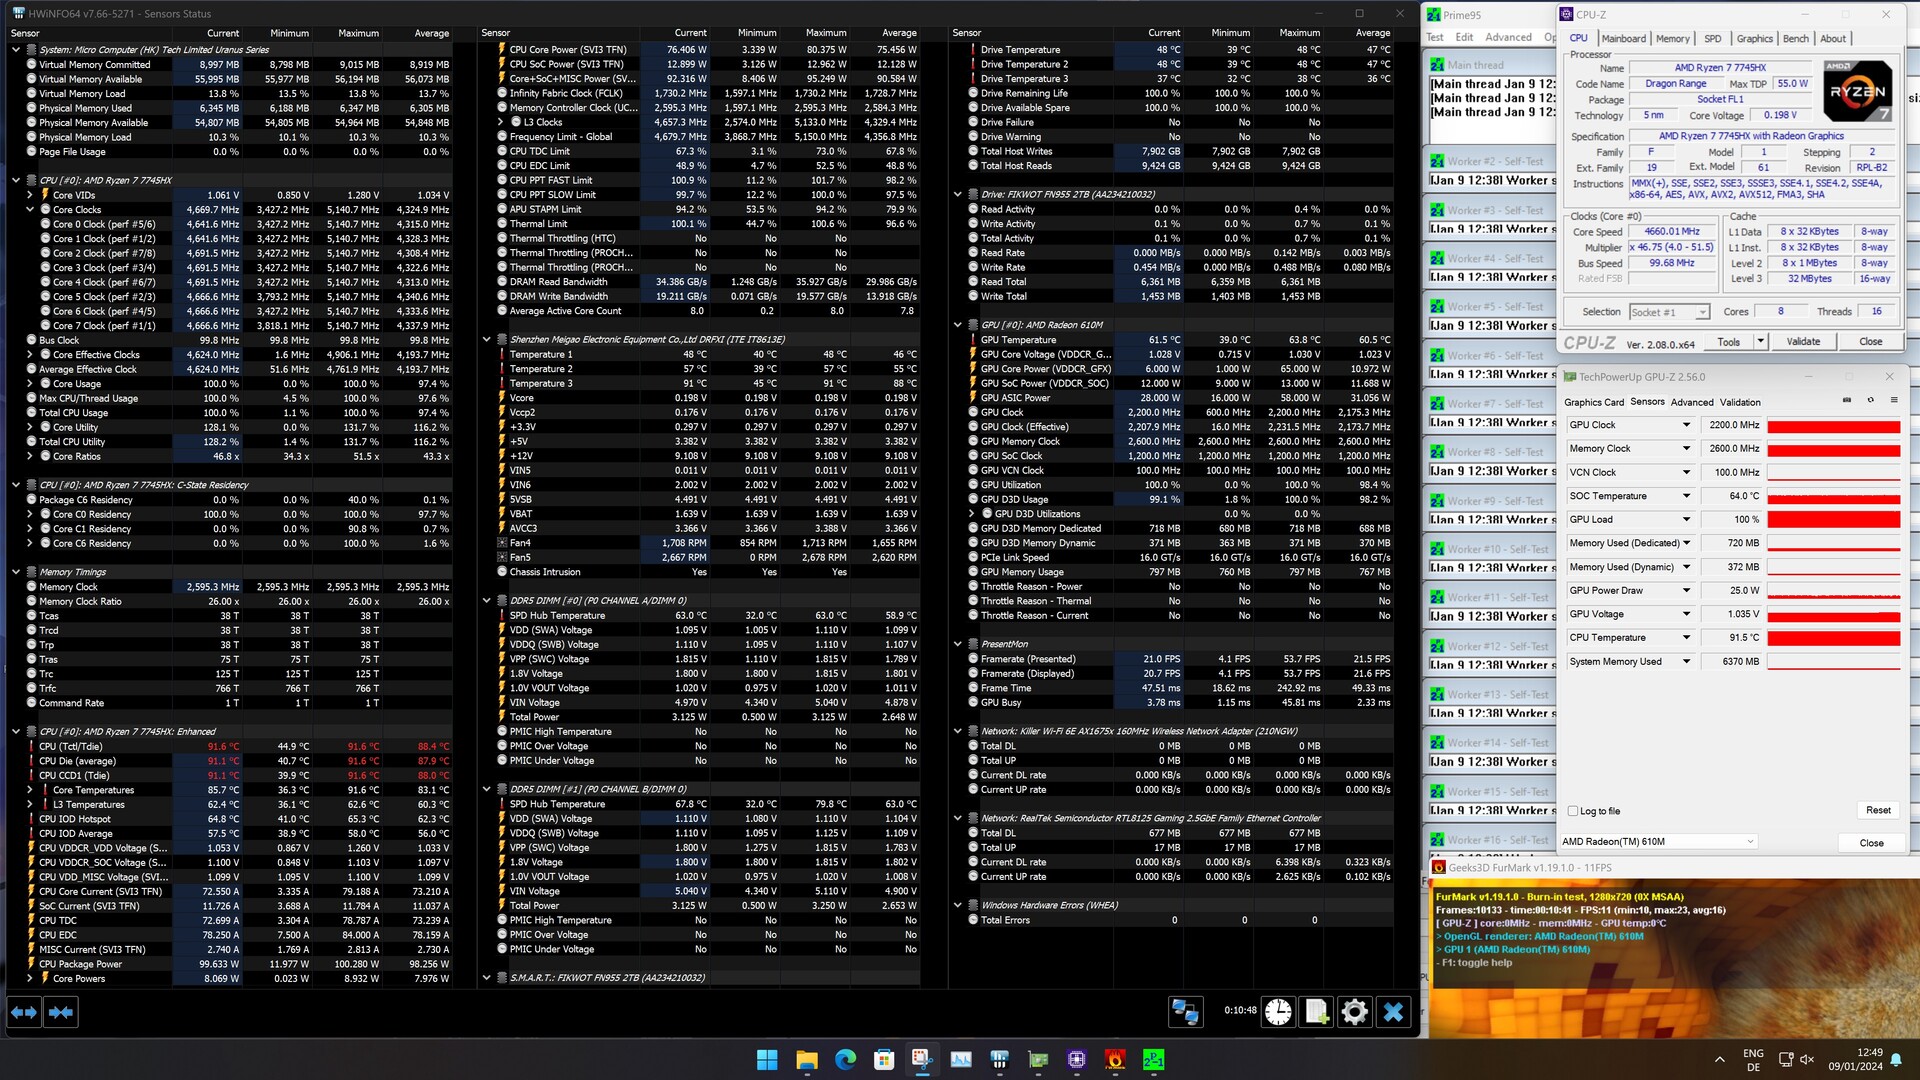
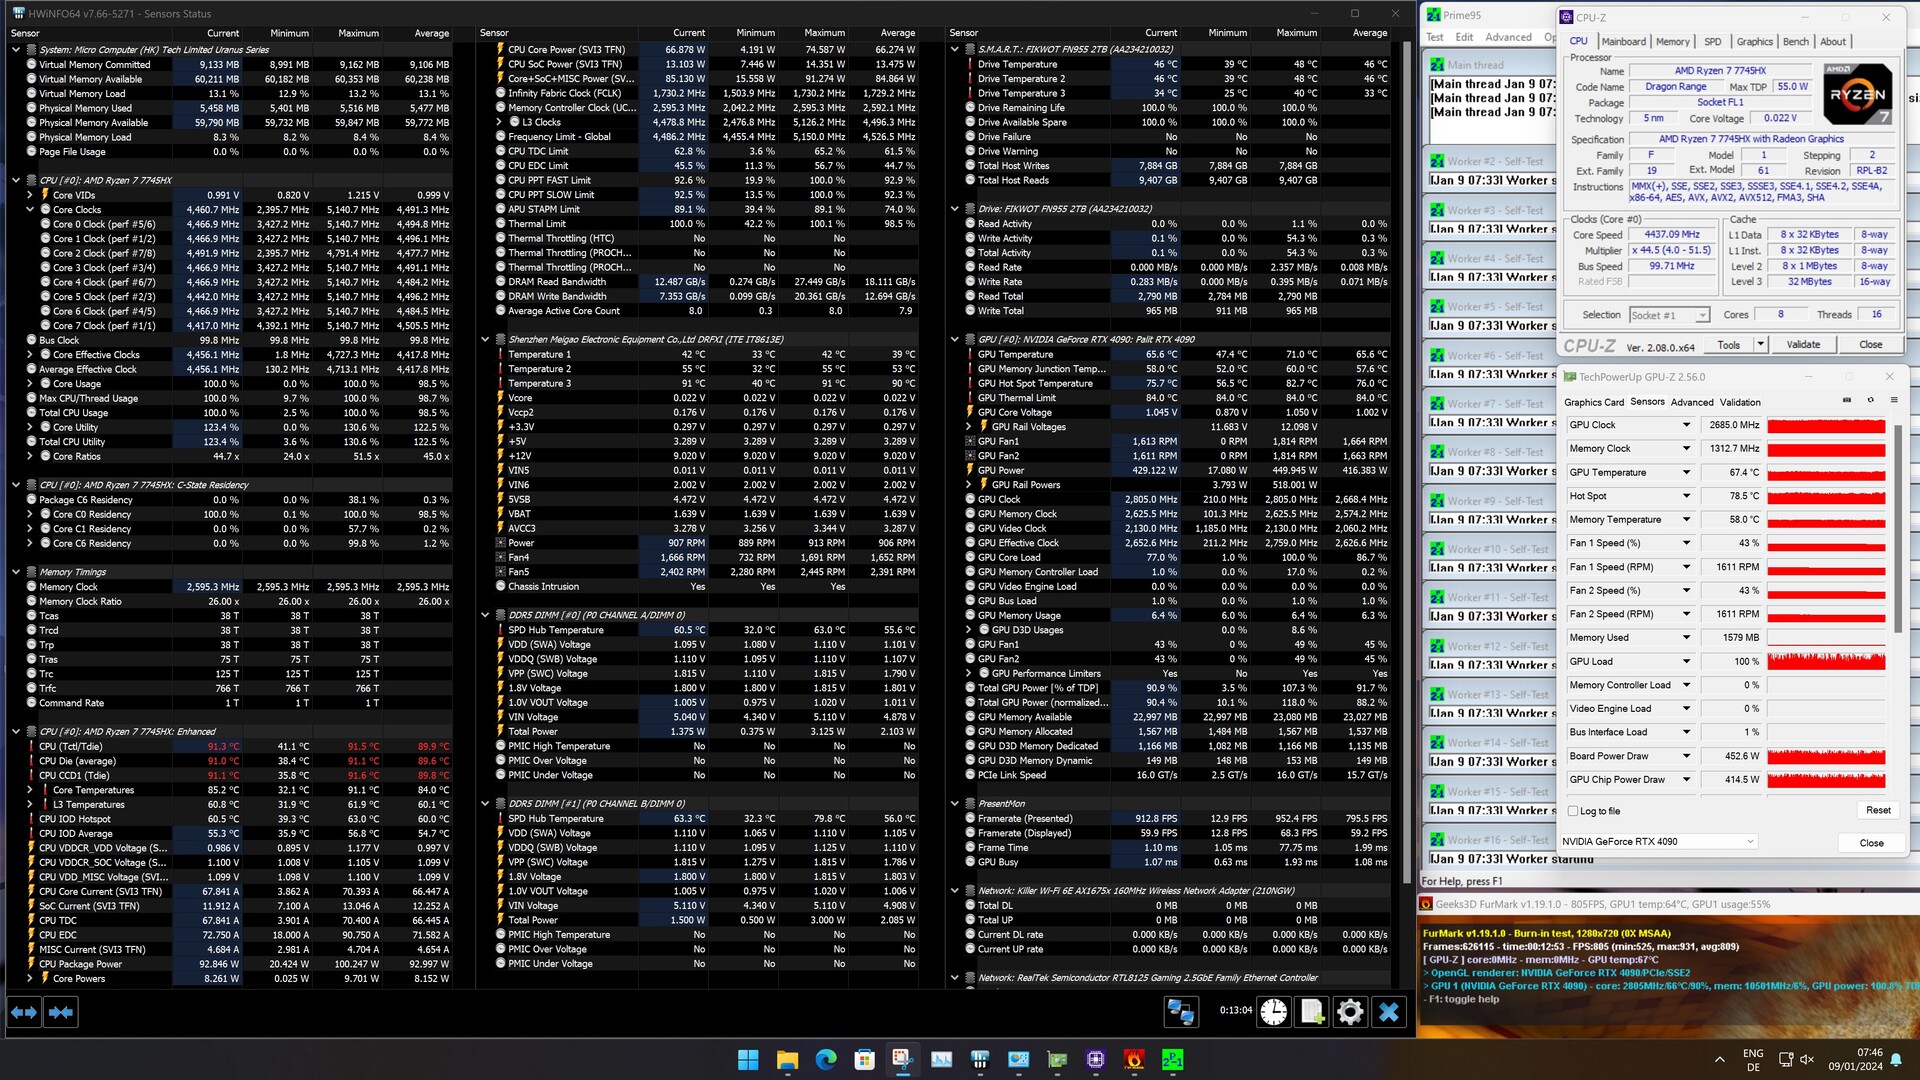
| Power Consumption / Cinebench R15 Multi (external Monitor) | |
| Intel Core i9-14900K | |
| Intel Core i9-13900K | |
| AMD Ryzen 9 7950X (Idle: 95.2 W) | |
| Intel Core i7-13700K | |
| Intel Core i5-14600K | |
| Intel Core i5-13600K | |
| Intel Core i7-12700 | |
| AMD Ryzen 9 7950X3D | |
| AMD Ryzen 7 7800X3D | |
| Intel Core i5-13400 | |
| Intel Core i5-12400F | |
| AMD Ryzen 7 7745HX | |
| Power Consumption / Prime95 V2810 Stress (external Monitor) | |
| Intel Core i9-14900K | |
| Intel Core i9-13900K | |
| Intel Core i5-14600K | |
| Intel Core i7-13700K | |
| Intel Core i5-13600K | |
| AMD Ryzen 9 7950X (Idle: 95.2 W) | |
| Intel Core i7-12700 | |
| AMD Ryzen 9 7950X3D | |
| Intel Core i5-12400F | |
| Intel Core i5-13400 | |
| AMD Ryzen 7 7800X3D | |
| AMD Ryzen 7 7745HX | |
| Power Consumption / Cinebench R23 Multi (external Monitor) | |
| Intel Core i9-14900K | |
| AMD Ryzen 9 7950X (95.2) | |
| Intel Core i5-14600K | |
| AMD Ryzen 9 7950X3D | |
| AMD Ryzen 7 7800X3D | |
| AMD Ryzen 7 7745HX | |
| Power Consumption / Cinebench R23 Single (external Monitor) | |
| AMD Ryzen 7 7800X3D | |
| AMD Ryzen 9 7950X (95.2) | |
| Intel Core i9-14900K | |
| Intel Core i5-14600K | |
| AMD Ryzen 7 7745HX | |
| Power Consumption / Cinebench R15 Multi Efficiency (external Monitor) | |
| AMD Ryzen 7 7745HX | |
| AMD Ryzen 9 7950X3D | |
| AMD Ryzen 9 7950X | |
| AMD Ryzen 7 7800X3D | |
| Intel Core i9-13900K | |
| Intel Core i5-13600K | |
| Intel Core i9-14900K | |
| Intel Core i5-14600K | |
* ... Moindre est la valeur, meilleures sont les performances
| Power Consumption / The Witcher 3 ultra (external Monitor) | |
| Intel Core i5-14600K | |
| Intel Core i9-14900K | |
| Intel Core i7-13700 | |
| Intel Core i7-13700K | |
| AMD Ryzen 9 7950X | |
| AMD Ryzen 9 7950X3D | |
| Intel Core i9-13900K | |
| Intel Core i7-12700 | |
| Intel Core i5-13400 | |
| AMD Ryzen 7 7800X3D | |
| AMD Ryzen 7 7745HX | |
| Intel Core i5-12400F | |
| AMD Ryzen 7 7745HX | |
| Power Consumption / Witcher 3 ultra Efficiency (external Monitor) | |
| AMD Ryzen 7 7800X3D | |
| Intel Core i5-12400F | |
| Intel Core i9-13900K | |
| AMD Ryzen 9 7950X | |
| Intel Core i7-12700 | |
| AMD Ryzen 9 7950X3D | |
| AMD Ryzen 7 7745HX | |
| Intel Core i7-13700K | |
| Intel Core i7-13700 | |
| Intel Core i9-14900K | |
| Intel Core i5-14600K | |
| Intel Core i5-13400 | |
| AMD Ryzen 7 7745HX | |
* ... Moindre est la valeur, meilleures sont les performances
Power consumption with external monitor
Points positifs
Points négatifs
Verdict - La puissante AMD Ryzen 7 7745HX
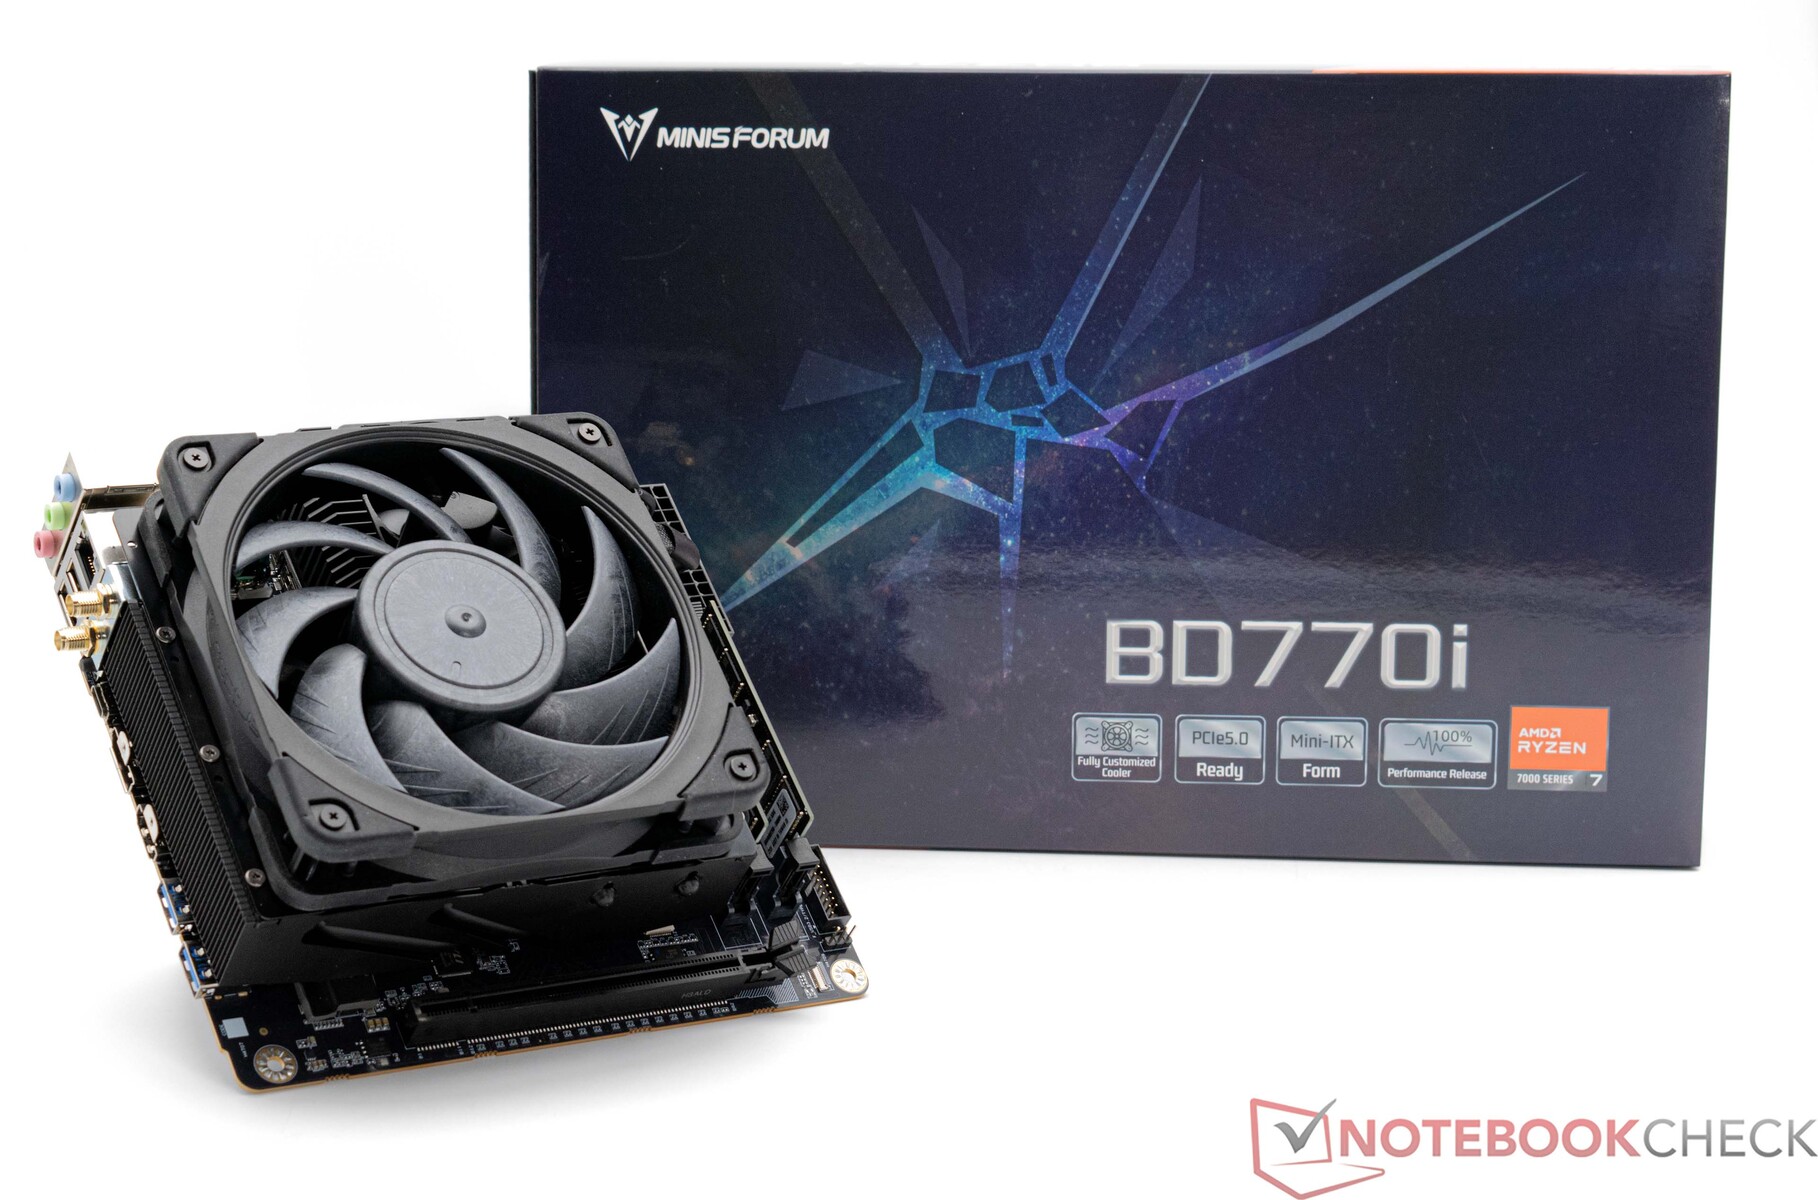
Le Minisforum BD770i du fabricant chinois de systèmes, connu pour ses PC compacts, constitue une excellente base pour la construction d'appareils très efficaces. Avec le BD770i, Minisforum s'adresse aux clients intéressés par l'auto-assemblage de leurs systèmes, car le pack ne comprend que la carte mère avec un processeur installé de façon permanente et un refroidisseur à caloducs pré-assemblé. Cela permet de créer des systèmes économiques pour une utilisation bureautique quotidienne ou des configurations de jeu puissantes en incorporant une carte graphique dédiée.
Doté du processeur AMD Ryzen 7 7745HX, le Minisforum BD770i offre de solides performances et prend en charge les futures cartes graphiques grâce à sa connexion PCIe 5.0.
La stratégie consistant à intégrer un processeur mobile dans un ordinateur de bureau a fait ses preuves. La distribution efficace de l'énergie, sans étranglement thermique, garantit une efficacité remarquable grâce à la faible consommation d'énergie. Même comparée aux processeurs X3D actuels d'AMD, réputés pour leur efficacité exceptionnelle, la carte mère Minisforum BD770i tient la route.
Bien que le prix initial de ~399 $ puisse sembler élevé, si l'on considère sa classe de performance par rapport à un système de bureau conventionnel, la carte mère Minisforum BD770i pourrait être un choix convaincant. Il convient particulièrement aux utilisateurs qui ne prévoient pas de mettre à niveau leur processeur ultérieurement. Néanmoins, il est important de noter qu'il s'agit d'une sorte de système barebone, ce qui implique des coûts supplémentaires pour rendre l'appareil pleinement opérationnel.
Prix et disponibilité
Minisforum vend le BD770i via Amazon, où la carte mère peut également être achetée pour 399 $.
Transparency
La sélection des appareils à examiner est effectuée par notre équipe éditoriale. L'échantillon d'essai a été remis gratuitement à l'auteur par le fabricant à des fins d'évaluation. Cet examen n'a pas été influencé par des tiers et le fabricant n'a pas reçu de copie de cet examen avant sa publication. Il n'y avait aucune obligation de publier cet article. En tant que média indépendant, Notebookcheck n'est pas soumis à l'autorité des fabricants, des détaillants ou des éditeurs.
Voici comment Notebookcheck teste
Chaque année, Notebookcheck examine de manière indépendante des centaines d'ordinateurs portables et de smartphones en utilisant des procédures standardisées afin de garantir que tous les résultats sont comparables. Nous avons continuellement développé nos méthodes de test depuis environ 20 ans et avons établi des normes industrielles dans le processus. Dans nos laboratoires de test, des équipements de mesure de haute qualité sont utilisés par des techniciens et des rédacteurs expérimentés. Ces tests impliquent un processus de validation en plusieurs étapes. Notre système d'évaluation complexe repose sur des centaines de mesures et de points de référence bien fondés, ce qui garantit l'objectivité.
