Notebookcheck Logo

Test de l'AMD Ryzen 9 7945HX3D Zen4 - Le processeur de jeu mobile le plus puissant grâce au 3D V-Cache

Meilleures performances en 1080p et QHD. Dans le domaine des PC de bureau, les processeurs AMD avec cache 3D existent depuis un certain temps, mais l'annonce du Ryzen 9 7945HX3D marque l'arrivée sur le marché du premier processeur mobile avec cache 3D V. Selon AMD, il s'agit désormais du processeur de jeu le plus rapide - que nous avons analysé. Selon AMD, il s'agit désormais du processeur de jeu le plus rapide que nous ayons analysé.

Début avril, nous avons pu tester le nouveau processeur mobile Processeur mobile Ryzen 9 7945HXqui est un concurrent direct de la puce haut de gamme d'Intel, leCore i9-13980HX. Les résultats ont été concluants, puisque ses performances multicœurs étaient supérieures - mais c'est son efficacité qui a été la véritable vedette. Alors que les CPU Intel consomment jusqu'à 170 watts, le Ryzen 9 7945HX offre des performances comparables tout en ne consommant que 80 à 100 watts.

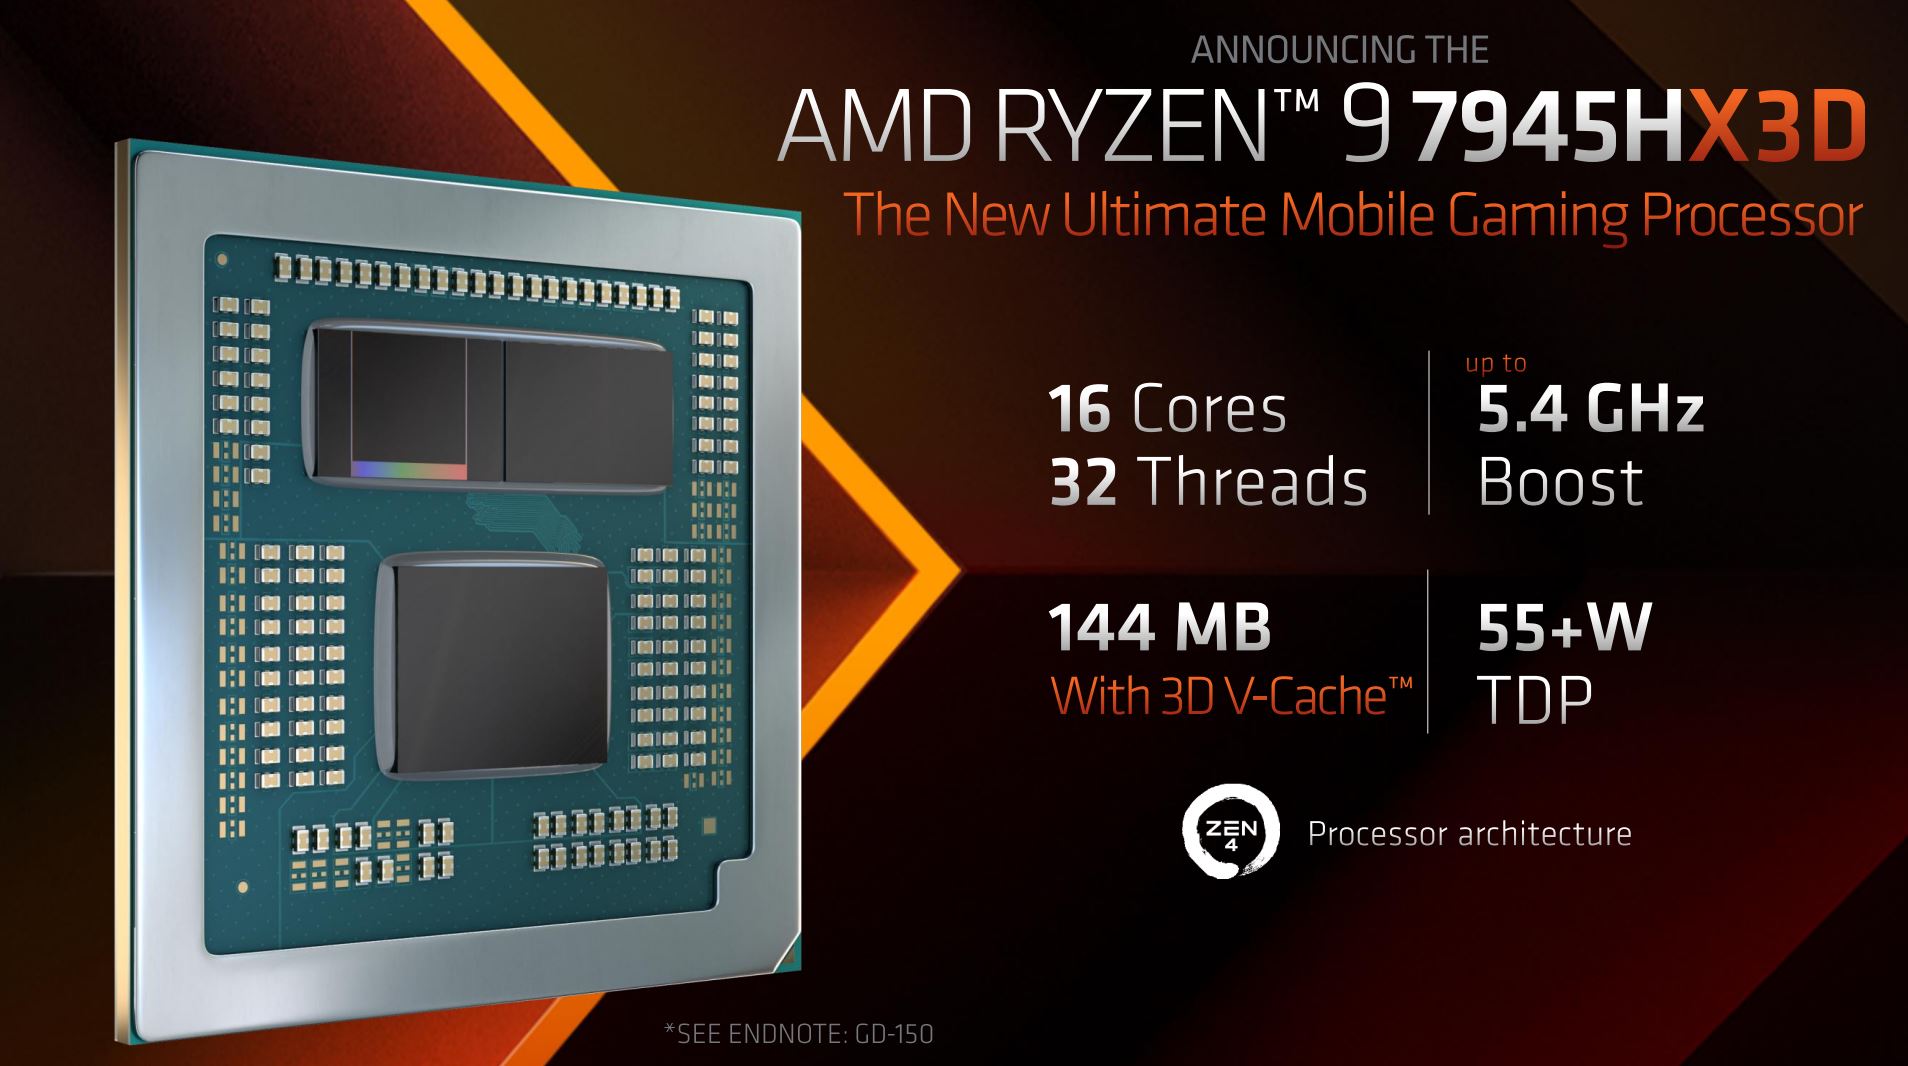
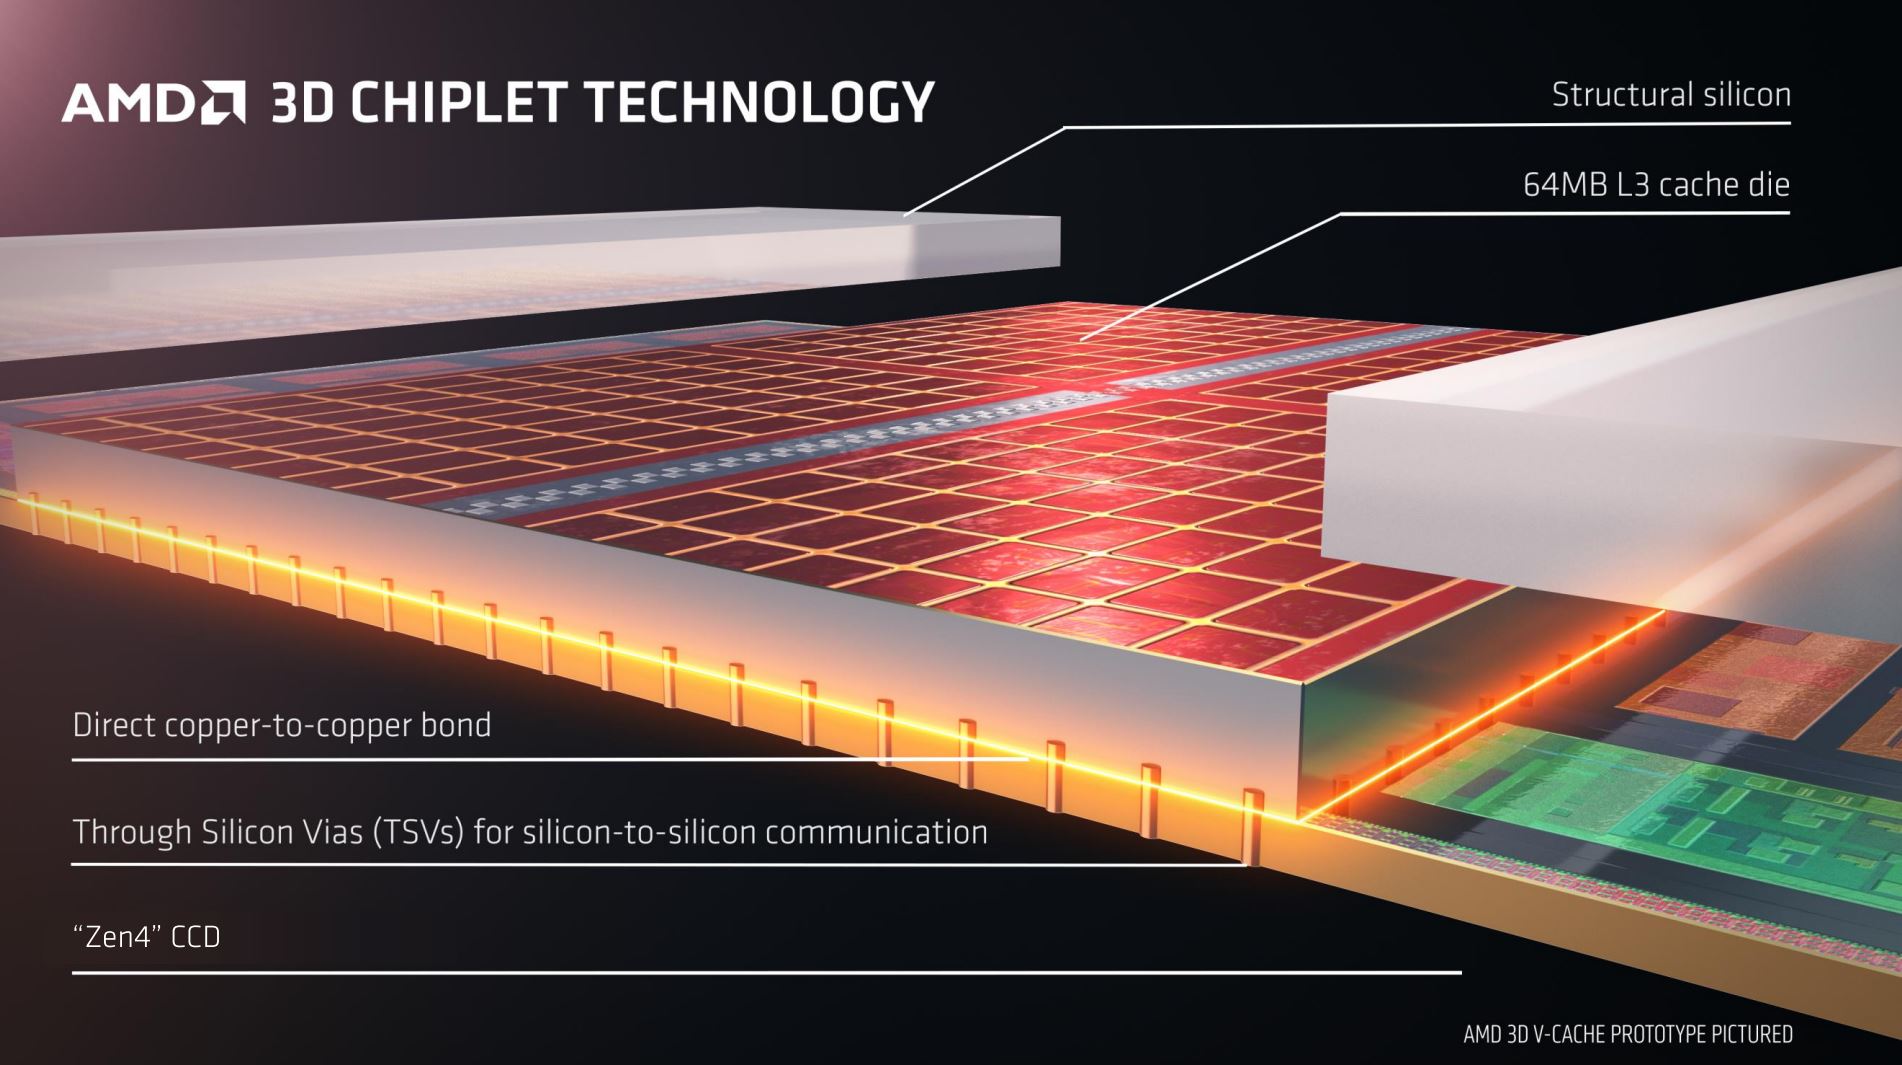
AMD propose déjà des processeurs de bureau avec 3D V-Cache depuis l'année dernière et maintenant, le Ryzen 9 7945HX3D est le premier processeur mobile qui dispose de cette technologie. Hormis le nouveau 3D V-Cache (64 Mo supplémentaires), ses spécifications sont identiques à celles du Ryzen 9 7945HX classique, c'est-à-dire qu'il dispose de 16 cœurs/32 threads avec une horloge maximale de 5,4 GHz. Dans le cas du 7945HX3D, son cache normal (80 Mo de cache L2/L3) a été augmenté de 64 Mo de cache L3. Le module de cache supplémentaire est situé directement sur le CCD Zen4, qui est légèrement plus fin que le CCD Zen4 normal, ce qui permet d'obtenir une hauteur de construction identique. Outre le cache supplémentaire, le Zen4 CCD dispose également d'un silicone structurel qui permet à l'unité de refroidissement d'occuper toute la surface, ce qui est censé améliorer les performances, en particulier à des fréquences d'images élevées, puisque le temps d'accès peut être réduit et que les nouvelles données peuvent être fournies plus rapidement.

3D V-Cache (source : AMD)

AMD affirme également que le 3D V-Cache a un effet positif sur les valeurs TDP basses selon des tests internes et a comparé 70 et 40 watts avec et sans 3D V-Cache. Cependant, nous ne pouvons pas le vérifier avec nos systèmes de test. Le Ryzen 9 7945HX3D n'est actuellement disponible que dans le nouveau Asus ROG Strix SCAR 17 X3D.

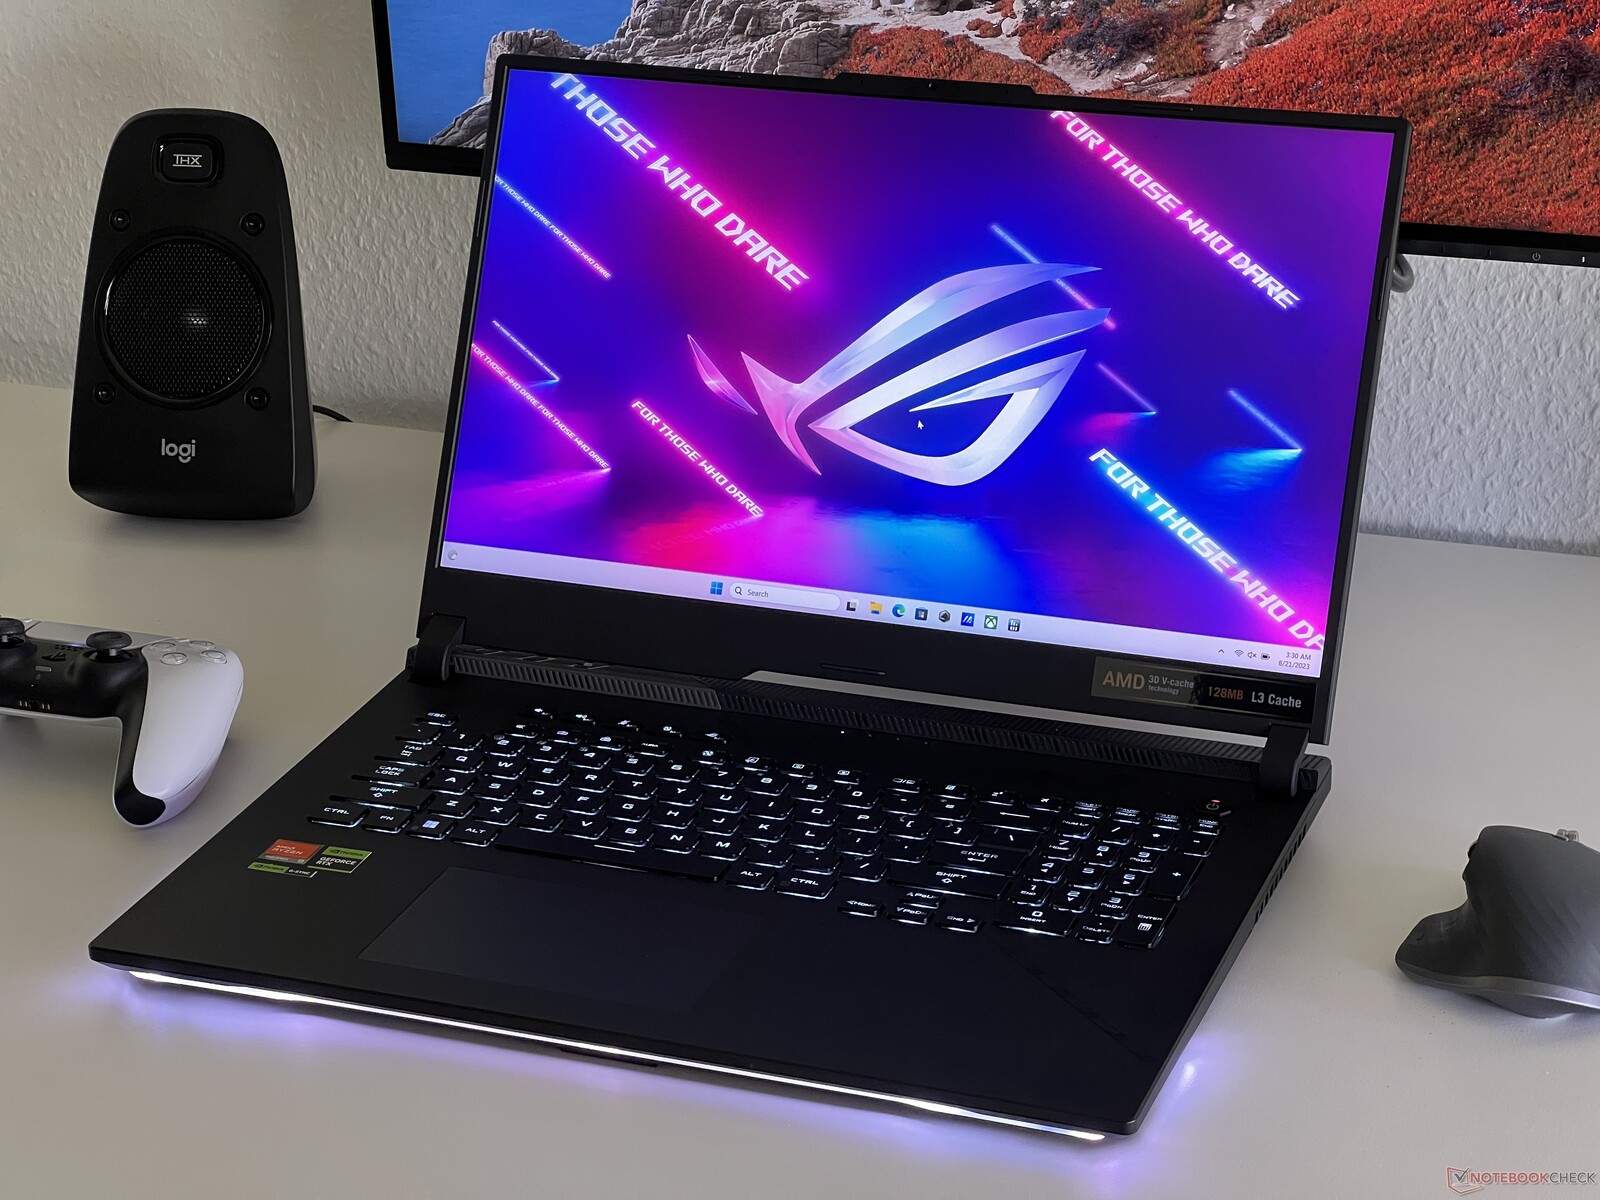
Système de test - Asus ROG Strix SCAR 17 X3D

Asus ROG Strix SCAR 17 X3D

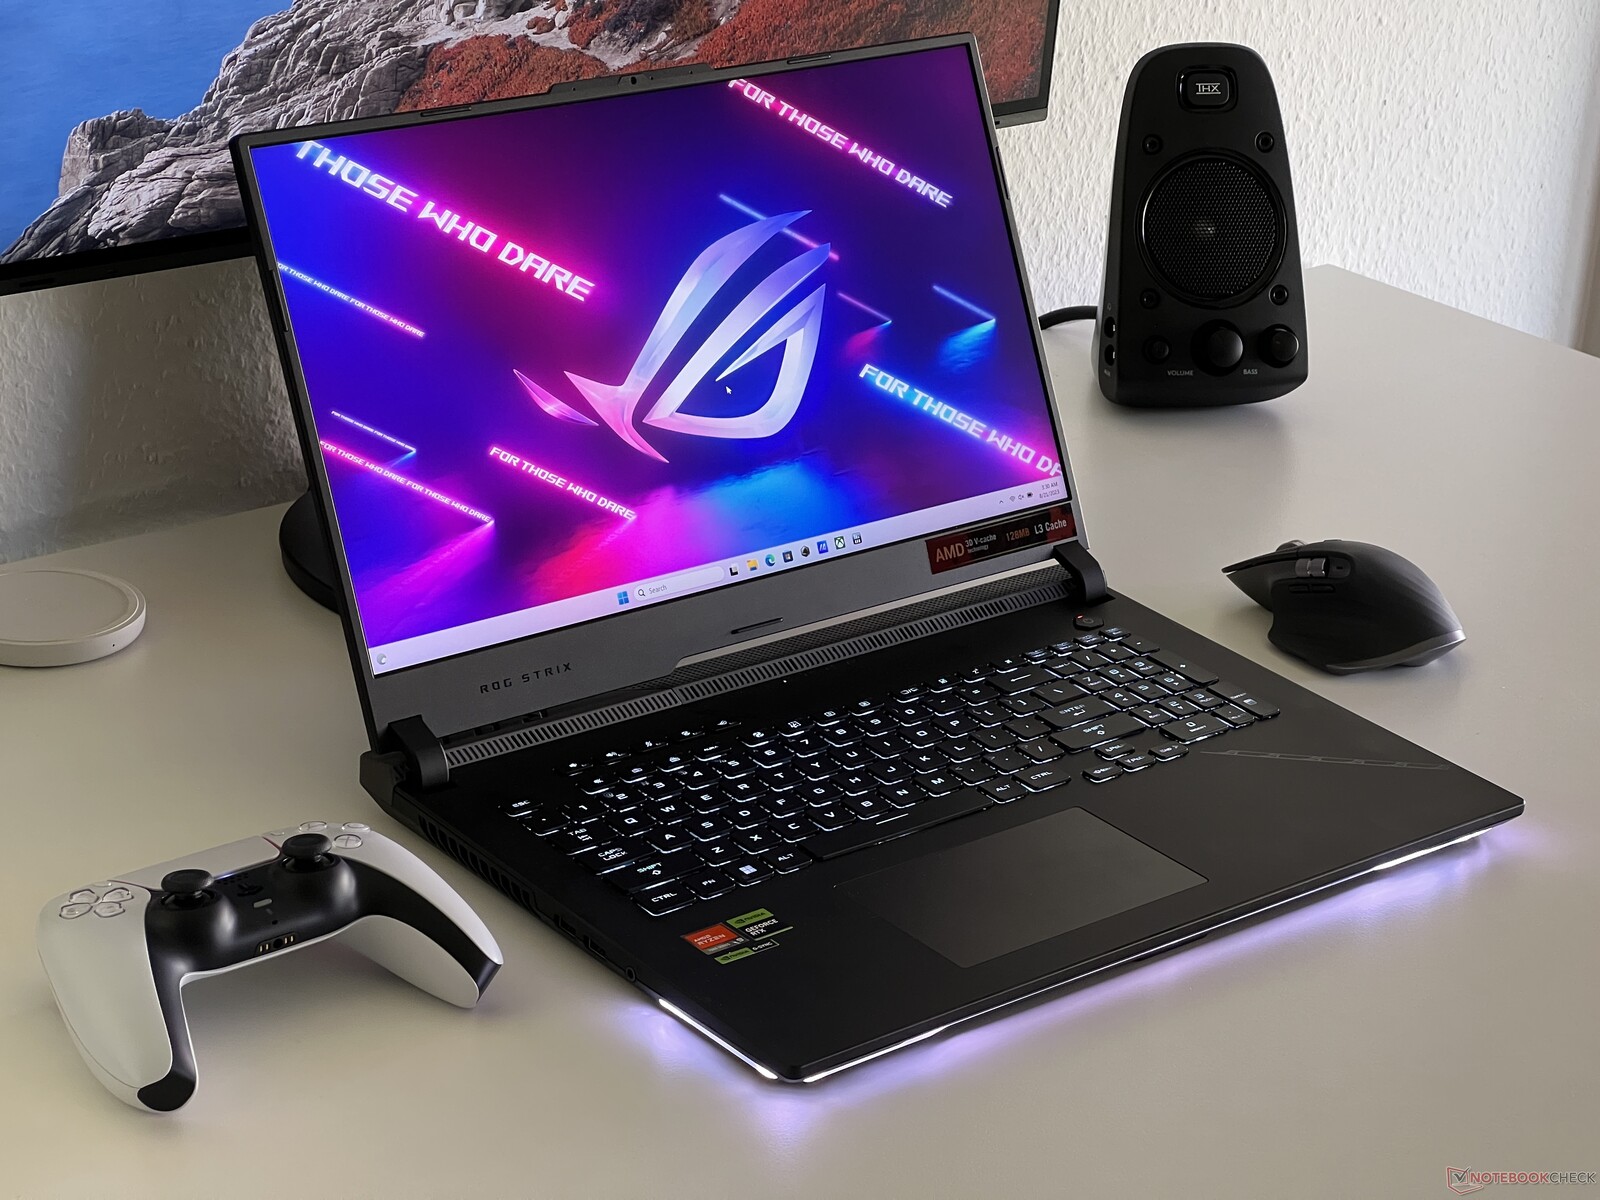
Le ROG Strix SCAR 17 X3D d'Asus est actuellement le seul ordinateur portable de jeu doté de la nouvelle technologie Ryzen 9 7945HX3D Ryzen 9 7945HX3Dsur le marché. Nous avons déjà testé le SCAR 17 avec la version normale du Ryzen 9 7945HXX3D.Ryzen 9 7945HXet outre son processeur, sa configuration avec laGeForce RTX 4090 Laptopet le panneau QHD 240-Hz est identique. En raison de la texture de la surface du nouveau processeur, Asus ne peut plus utiliser de métal liquide pour dissiper la chaleur, ce qui se voit dans les valeurs maximales de consommation d'énergie. Le Ryzen 9 7945HX3D consomme 115 watts pendant une courte période, puis 100 watts.

Remarque : pour nos mesures d'efficacité, nous avons utilisé les taux de consommation d'un moniteur externe afin d'exclure l'influence de l'écran interne. Comme nous l'avons déjà vu sur le dernier ROG Strix SCAR 17, toutes les sorties d'affichage fonctionnent via le GPU dédié qui, par conséquent, est toujours actif dès que vous utilisez un moniteur externe. Bien sûr, cela a un effet sur les mesures dans une certaine mesure, en particulier lorsqu'il s'agit de son efficacité à un seul cœur.

Performance d'un seul cœur

Ses performances à cœur unique sont pratiquement identiques à celles de la Ryzen 9 7945HX classique et sont considérablement plus rapides que celles des anciens modèles Zen3 tels que laRyzen 9 6900HX. LeCore i9-13900HXd'Intel est également comparable - seul leCore i9-13980HXbénéficie au total de son turbo à cœur unique.

CPU Performance Rating: Percent
Cinebench R23: Single Core
Cinebench R20: CPU (Single Core)
Cinebench R15: CPU Single 64Bit
7-Zip 18.03: 7z b 4 -mmt1
Geekbench 5.5: Single-Core
CPU Performance Rating
Intel Core i9-13980HX
MSI Titan GT77 HX 13VI
98.5 pt
AMD Ryzen 9 7945HX3D
Asus ROG Strix Scar 17 G733PYV-LL053X
96 pt
Intel Core i9-13950HX
MSI Titan GT77 HX 13VI
95.4 pt
AMD Ryzen 9 7945HX
Asus Zephyrus Duo 16 GX650PY-NM006W
95.2 pt
Intel Core i9-13900HX
Lenovo Legion Pro 7 16IRX8H
94.7 pt
AMD Ryzen 9 7945HX
Asus ROG Strix G17 G713PI
94.6 pt
Intel Core i9-13900HX
SCHENKER XMG Neo 16 Raptor Lake
93 pt
AMD Ryzen 9 7945HX
Asus ROG Strix G17 G713PI
91.8 pt
Intel Core i9-13950HX
Razer Blade 16 Early 2023
88.2 pt
Intel Core i9-12900HX
MSI Titan GT77 12UHS
87.9 pt
AMD Ryzen 9 6900HX
SCHENKER XMG Neo 17 M22
75.3 pt
AMD Ryzen 9 6900HX
Asus ROG Zephyrus Duo 16 GX650RX
74.9 pt
Apple M2 Max -1!
Apple MacBook Pro 16 2023 M2 Max
74.9 pt
Cinebench R23 / Single Core
Intel Core i9-13980HX
MSI Titan GT77 HX 13VI
2169 Points +12%
Intel Core i9-13950HX
MSI Titan GT77 HX 13VI
2100 Points +9%
Intel Core i9-13900HX
SCHENKER XMG Neo 16 Raptor Lake
2055 Points +6%
Intel Core i9-13900HX
Lenovo Legion Pro 7 16IRX8H
2043 Points +6%
Intel Core i9-13950HX
Razer Blade 16 Early 2023
2029 Points +5%
AMD Ryzen 9 7945HX
Asus Zephyrus Duo 16 GX650PY-NM006W
1940 Points 0%
AMD Ryzen 9 7945HX
Asus ROG Strix G17 G713PI (Turbo Mode)
1936 Points 0%
AMD Ryzen 9 7945HX3D
Asus ROG Strix Scar 17 G733PYV-LL053X
1935 Points
Intel Core i9-12900HX
MSI Titan GT77 12UHS
1913 Points -1%
AMD Ryzen 9 7945HX
Asus ROG Strix G17 G713PI
1863 Points -4%
Apple M2 Max
Apple MacBook Pro 16 2023 M2 Max
1625 Points -16%
AMD Ryzen 9 6900HX
Asus ROG Zephyrus Duo 16 GX650RX
1566 Points -19%
AMD Ryzen 9 6900HX
SCHENKER XMG Neo 17 M22
1557 Points -20%
Cinebench R20 / CPU (Single Core)
Intel Core i9-13980HX
MSI Titan GT77 HX 13VI
825 Points +9%
Intel Core i9-13950HX
MSI Titan GT77 HX 13VI
803 Points +6%
Intel Core i9-13900HX
Lenovo Legion Pro 7 16IRX8H
788 Points +4%
Intel Core i9-13900HX
SCHENKER XMG Neo 16 Raptor Lake
756 Points 0%
AMD Ryzen 9 7945HX
Asus Zephyrus Duo 16 GX650PY-NM006W
756 Points 0%
AMD Ryzen 9 7945HX3D
Asus ROG Strix Scar 17 G733PYV-LL053X
755 Points
AMD Ryzen 9 7945HX
Asus ROG Strix G17 G713PI (Turbo Mode)
753 Points 0%
Intel Core i9-13950HX
Razer Blade 16 Early 2023
742 Points -2%
Intel Core i9-12900HX
MSI Titan GT77 12UHS
738 Points -2%
AMD Ryzen 9 7945HX
Asus ROG Strix G17 G713PI
712 Points -6%
AMD Ryzen 9 6900HX
SCHENKER XMG Neo 17 M22
605 Points -20%
AMD Ryzen 9 6900HX
Asus ROG Zephyrus Duo 16 GX650RX
595 Points -21%
Apple M2 Max
Apple MacBook Pro 16 2023 M2 Max
460 Points -39%
Cinebench R15 / CPU Single 64Bit
Intel Core i9-13980HX
MSI Titan GT77 HX 13VI
312 Points 0%
AMD Ryzen 9 7945HX3D
Asus ROG Strix Scar 17 G733PYV-LL053X
311 Points
AMD Ryzen 9 7945HX
Asus Zephyrus Duo 16 GX650PY-NM006W
307 Points -1%
Intel Core i9-13900HX
Lenovo Legion Pro 7 16IRX8H
301 Points -3%
AMD Ryzen 9 7945HX
Asus ROG Strix G17 G713PI (Turbo Mode)
301 Points -3%
Intel Core i9-13950HX
MSI Titan GT77 HX 13VI
300 Points -4%
Intel Core i9-13900HX
SCHENKER XMG Neo 16 Raptor Lake
295 Points -5%
Intel Core i9-13900HX
SCHENKER XMG Neo 16 Raptor Lake
294 Points -5%
AMD Ryzen 9 7945HX
Asus ROG Strix G17 G713PI
294 Points -5%
Intel Core i9-12900HX
MSI Titan GT77 12UHS
278 Points -11%
Intel Core i9-13950HX
Razer Blade 16 Early 2023
274 Points -12%
AMD Ryzen 9 6900HX
Asus ROG Zephyrus Duo 16 GX650RX
249 Points -20%
AMD Ryzen 9 6900HX
SCHENKER XMG Neo 17 M22
248 Points -20%
Apple M2 Max
Apple MacBook Pro 16 2023 M2 Max
239 Points -23%
7-Zip 18.03 / 7z b 4 -mmt1
AMD Ryzen 9 7945HX3D
Asus ROG Strix Scar 17 G733PYV-LL053X
7573 MIPS
AMD Ryzen 9 7945HX
Asus ROG Strix G17 G713PI (Turbo Mode)
7379 MIPS -3%
AMD Ryzen 9 7945HX
Asus ROG Strix G17 G713PI
7332 MIPS -3%
AMD Ryzen 9 7945HX
Asus Zephyrus Duo 16 GX650PY-NM006W
7319 MIPS -3%
Intel Core i9-13900HX
Lenovo Legion Pro 7 16IRX8H
7035 MIPS -7%
Intel Core i9-13980HX
MSI Titan GT77 HX 13VI
7018 MIPS -7%
Intel Core i9-13950HX
MSI Titan GT77 HX 13VI
6897 MIPS -9%
Intel Core i9-13900HX
SCHENKER XMG Neo 16 Raptor Lake
6800 MIPS -10%
Intel Core i9-13950HX
Razer Blade 16 Early 2023
6445 MIPS -15%
Intel Core i9-12900HX
MSI Titan GT77 12UHS
6256 MIPS -17%
AMD Ryzen 9 6900HX
SCHENKER XMG Neo 17 M22
5872 MIPS -22%
AMD Ryzen 9 6900HX
Asus ROG Zephyrus Duo 16 GX650RX
5727 MIPS -24%
Geekbench 5.5 / Single-Core
Intel Core i9-13980HX
MSI Titan GT77 HX 13VI
2139 Points 0%
AMD Ryzen 9 7945HX3D
Asus ROG Strix Scar 17 G733PYV-LL053X
2133 Points
AMD Ryzen 9 7945HX
Asus Zephyrus Duo 16 GX650PY-NM006W
2132 Points 0%
AMD Ryzen 9 7945HX
Asus ROG Strix G17 G713PI (Turbo Mode)
2103 Points -1%
AMD Ryzen 9 7945HX
Asus ROG Strix G17 G713PI
2053 Points -4%
Intel Core i9-13950HX
MSI Titan GT77 HX 13VI
2043 Points -4%
Intel Core i9-13900HX
Lenovo Legion Pro 7 16IRX8H
2025 Points -5%
Intel Core i9-13900HX
SCHENKER XMG Neo 16 Raptor Lake
2023 Points -5%
Apple M2 Max
Apple MacBook Pro 16 2023 M2 Max
1978 Points -7%
Intel Core i9-12900HX
MSI Titan GT77 12UHS
1923 Points -10%
Intel Core i9-13950HX
Razer Blade 16 Early 2023
1805 Points -15%
AMD Ryzen 9 6900HX
Asus ROG Zephyrus Duo 16 GX650RX
1594 Points -25%
AMD Ryzen 9 6900HX
SCHENKER XMG Neo 17 M22
1590 Points -25%
CPU Performance Rating: Percent
Cinebench R23: Single Core
Cinebench R20: CPU (Single Core)
Cinebench R15: CPU Single 64Bit
7-Zip 18.03: 7z b 4 -mmt1
Geekbench 5.5: Single-Core

Lorsque l'on examine les résultats, il ne faut pas oublier que le cœur AMD Zen4 consomme environ 27 watts en charge simple, tandis que le cœur de performance des nouveaux CPU Raptor Lake HX consomme entre 34 et 36 watts. Cela signifie que l'efficacité pure du CPU d'AMD est meilleure que celle d'Intel. Le fait que le GPU dédié de Nvidia était actif pour nos mesures de consommation d'énergie à l'aide d'un moniteur externe a bien sûr faussé nos résultats - il est important de garder cela à l'esprit. Toutefois, par souci d'exhaustivité, nous avons tout de même inclus ces valeurs. Vous pourriez en fait considérer cela comme un point positif, car même avec son dGPU activé, notre appareil de test avec le nouveau Ryzen 9 7945HX3D était au même niveau que les puces Intel Raptor Lake HX, qui avaient un iGPU inactif pendant les mesures.

Power Consumption / Cinebench R23 Single Power Efficiency - external Monitor
Apple M2 Max
Apple MacBook Pro 16 2023 M2 Max
71.9 Points per Watt +167%
Intel Core i9-13950HX
MSI Titan GT77 HX 13VI
28.5 Points per Watt +6%
AMD Ryzen 9 7945HX
Asus ROG Strix G17 G713PI
28.2 Points per Watt +5%
Intel Core i9-12900HX
MSI Titan GT77 12UHS
27.8 Points per Watt +3%
AMD Ryzen 9 7945HX3D
Asus ROG Strix Scar 17 G733PYV-LL053X
26.9 Points per Watt
AMD Ryzen 9 7945HX
Asus ROG Strix G17 G713PI
26.8 Points per Watt 0%
AMD Ryzen 9 7945HX
Asus Zephyrus Duo 16 GX650PY-NM006W
26.4 Points per Watt -2%
Power Consumption / Cinebench R23 Single (external Monitor)
Intel Core i9-13950HX
MSI Titan GT77 HX 13VI
73.8 (69.8min, 70.2P1 - 100.2max) Watt * -3%
AMD Ryzen 9 7945HX
Asus Zephyrus Duo 16 GX650PY-NM006W
73.4 (69.8min, 69.9P1 - 99.9max) Watt * -2%
AMD Ryzen 9 7945HX
Asus ROG Strix G17 G713PI (Turbo Mode)
72.2 (62.6min, 63.8P1 - 92.5max) Watt * -0%
AMD Ryzen 9 7945HX3D
Asus ROG Strix Scar 17 G733PYV-LL053X
71.9 (70.8min, 71P1 - 86max) Watt *
Intel Core i9-12900HX
MSI Titan GT77 12UHS
68.7 (63.7min, 64.8P1 - 87.6max) Watt * +4%
AMD Ryzen 9 7945HX
Asus ROG Strix G17 G713PI
66.1 (57.7min, 58.2P1 - 93.6max) Watt * +8%
Apple M2 Max
Apple MacBook Pro 16 2023 M2 Max
22.6 (17.4min, 18.2P1 - 29.7max) Watt * +69%

* ... Moindre est la valeur, meilleures sont les performances

Performance multicœur

Lors du test multi-cœur, nous avons constaté que son refroidissement était un peu faible - ici, le nouveau Ryzen 9 7945HX3D a évité de justesse de pouvoir rivaliser avec les modèles équipés du Ryzen 9 7945HX normal. Au total, le nouveau processeur Zen4 avec 3D V-Cache devance toujours ses concurrents d'Intel qui, en outre, consomment plus d'énergie. Toutefois, si vous avez besoin d'une performance maximale du processeur, vous devriez opter pour un appareil équipé du Ryzen 9 7945HX normal, qui utilise du métal liquide.

CPU Performance Rating: Percent
Cinebench R23: Multi Core
Cinebench R20: CPU (Multi Core)
Cinebench R15: CPU Multi 64Bit
Blender: v2.79 BMW27 CPU
7-Zip 18.03: 7z b 4
Geekbench 5.5: Multi-Core
CPU Performance Rating
AMD Ryzen 9 7945HX
Asus ROG Strix G17 G713PI
91.8 pt
AMD Ryzen 9 7945HX
Asus Zephyrus Duo 16 GX650PY-NM006W
90.5 pt
AMD Ryzen 9 7945HX3D
Asus ROG Strix Scar 17 G733PYV-LL053X
89.4 pt
Intel Core i9-13950HX
MSI Titan GT77 HX 13VI
87.3 pt
Intel Core i9-13980HX
MSI Titan GT77 HX 13VI
86.3 pt
Intel Core i9-13900HX
Lenovo Legion Pro 7 16IRX8H
82.5 pt
AMD Ryzen 9 7945HX
Asus ROG Strix G17 G713PI
81.4 pt
Intel Core i9-13900HX
SCHENKER XMG Neo 16 Raptor Lake
80.3 pt
Intel Core i9-13950HX
Razer Blade 16 Early 2023
72.1 pt
Intel Core i9-12900HX
MSI Titan GT77 12UHS
60.7 pt
Apple M2 Max -2!
Apple MacBook Pro 16 2023 M2 Max
45.4 pt
AMD Ryzen 9 6900HX
Asus ROG Zephyrus Duo 16 GX650RX
35.9 pt
Cinebench R23 / Multi Core
AMD Ryzen 9 7945HX
Asus Zephyrus Duo 16 GX650PY-NM006W
34521 (32987.6min - 34521.3max) Points +5%
AMD Ryzen 9 7945HX
Asus ROG Strix G17 G713PI (Turbo Mode)
34202 Points +4%
Intel Core i9-13950HX
MSI Titan GT77 HX 13VI
33277 Points +2%
Intel Core i9-13980HX
MSI Titan GT77 HX 13VI
33052 Points +1%
AMD Ryzen 9 7945HX3D
Asus ROG Strix Scar 17 G733PYV-LL053X
32782 Points
AMD Ryzen 9 7945HX
Asus ROG Strix G17 G713PI
32379 Points -1%
Intel Core i9-13900HX
Lenovo Legion Pro 7 16IRX8H
30162 Points -8%
Intel Core i9-13900HX
SCHENKER XMG Neo 16 Raptor Lake
28707 (26191.7min - 28706.8max) Points -12%
Intel Core i9-13900HX
SCHENKER XMG Neo 16 Raptor Lake
28010 (26406.1min - 28009.8max) Points -15%
Intel Core i9-13900HX
SCHENKER XMG Neo 16 Raptor Lake
26703 Points -19%
Intel Core i9-13950HX
Razer Blade 16 Early 2023
26736 (22394.1min - 26736.1max) Points -18%
Intel Core i9-12900HX
MSI Titan GT77 12UHS
22982 Points -30%
Apple M2 Max
Apple MacBook Pro 16 2023 M2 Max
14767 Points -55%
AMD Ryzen 9 6900HX
Asus ROG Zephyrus Duo 16 GX650RX
14085 Points -57%
Cinebench R20 / CPU (Multi Core)
AMD Ryzen 9 7945HX
Asus ROG Strix G17 G713PI (Turbo Mode)
13769 Points +6%
AMD Ryzen 9 7945HX
Asus Zephyrus Duo 16 GX650PY-NM006W
13457 Points +3%
AMD Ryzen 9 7945HX3D
Asus ROG Strix Scar 17 G733PYV-LL053X
13033 Points
Intel Core i9-13950HX
MSI Titan GT77 HX 13VI
12648 Points -3%
Intel Core i9-13980HX
MSI Titan GT77 HX 13VI
12437 Points -5%
Intel Core i9-13900HX
Lenovo Legion Pro 7 16IRX8H
11500 Points -12%
Intel Core i9-13900HX
SCHENKER XMG Neo 16 Raptor Lake
11289 Points -13%
AMD Ryzen 9 7945HX
Asus ROG Strix G17 G713PI
10025 Points -23%
Intel Core i9-13950HX
Razer Blade 16 Early 2023
8697 Points -33%
Intel Core i9-12900HX
MSI Titan GT77 12UHS
8667 Points -33%
AMD Ryzen 9 6900HX
Asus ROG Zephyrus Duo 16 GX650RX
5489 Points -58%
Apple M2 Max
Apple MacBook Pro 16 2023 M2 Max
4044 Points -69%
Cinebench R15 / CPU Multi 64Bit
AMD Ryzen 9 7945HX
Asus ROG Strix G17 G713PI (Turbo Mode)
5663 Points +1%
AMD Ryzen 9 7945HX3D
Asus ROG Strix Scar 17 G733PYV-LL053X
5600 (5177.32min - 5599.89max) Points
AMD Ryzen 9 7945HX
Asus Zephyrus Duo 16 GX650PY-NM006W
5554 (5255.55min - 5554.01max) Points -1%
Intel Core i9-13950HX
MSI Titan GT77 HX 13VI
5227 (4889.98min - 5226.71max) Points -7%
AMD Ryzen 9 7945HX
Asus ROG Strix G17 G713PI
5205 (4749.47min - 5204.94max) Points -7%
Intel Core i9-13980HX
MSI Titan GT77 HX 13VI
5172 (4917.63min - 5171.97max) Points -8%
Intel Core i9-13900HX
SCHENKER XMG Neo 16 Raptor Lake
4913 Points -12%
Intel Core i9-13900HX
SCHENKER XMG Neo 16 Raptor Lake
4875 (4298.3min - 4875.08max) Points -13%
Intel Core i9-13900HX
Lenovo Legion Pro 7 16IRX8H
4819 (4429.68min - 4819.28max) Points -14%
Intel Core i9-13950HX
Razer Blade 16 Early 2023
4529 (4463.29min - 4528.99max) Points -19%
Intel Core i9-12900HX
MSI Titan GT77 12UHS
3570 (3259.45min - 3569.52max) Points -36%
AMD Ryzen 9 6900HX
Asus ROG Zephyrus Duo 16 GX650RX
2292 Points -59%
Apple M2 Max
Apple MacBook Pro 16 2023 M2 Max
2074 (2068.47min, 2068.57P1 - 2081.27max) Points -63%
Blender / v2.79 BMW27 CPU
AMD Ryzen 9 6900HX
Asus ROG Zephyrus Duo 16 GX650RX
220 Seconds * -132%
Intel Core i9-12900HX
MSI Titan GT77 12UHS
147 Seconds * -55%
Intel Core i9-13950HX
Razer Blade 16 Early 2023
114 Seconds * -20%
Intel Core i9-13900HX
SCHENKER XMG Neo 16 Raptor Lake
111 Seconds * -17%
Intel Core i9-13900HX
Lenovo Legion Pro 7 16IRX8H
105 Seconds * -11%
Intel Core i9-13980HX
MSI Titan GT77 HX 13VI
101 Seconds * -6%
Intel Core i9-13950HX
MSI Titan GT77 HX 13VI
100 Seconds * -5%
AMD Ryzen 9 7945HX
Asus ROG Strix G17 G713PI
100 Seconds * -5%
AMD Ryzen 9 7945HX
Asus ROG Strix G17 G713PI (Turbo Mode)
95 Seconds * -0%
AMD Ryzen 9 7945HX3D
Asus ROG Strix Scar 17 G733PYV-LL053X
95 Seconds *
AMD Ryzen 9 7945HX
Asus Zephyrus Duo 16 GX650PY-NM006W
93 Seconds * +2%
7-Zip 18.03 / 7z b 4
AMD Ryzen 9 7945HX
Asus ROG Strix G17 G713PI (Turbo Mode)
140471 MIPS +3%
AMD Ryzen 9 7945HX3D
Asus ROG Strix Scar 17 G733PYV-LL053X
136201 MIPS
AMD Ryzen 9 7945HX
Asus Zephyrus Duo 16 GX650PY-NM006W
135927 MIPS 0%
Intel Core i9-13950HX
MSI Titan GT77 HX 13VI
127295 MIPS -7%
Intel Core i9-13980HX
MSI Titan GT77 HX 13VI
125720 MIPS -8%
AMD Ryzen 9 7945HX
Asus ROG Strix G17 G713PI
123364 MIPS -9%
Intel Core i9-13900HX
Lenovo Legion Pro 7 16IRX8H
122254 MIPS -10%
Intel Core i9-13900HX
SCHENKER XMG Neo 16 Raptor Lake
118715 MIPS -13%
Intel Core i9-13950HX
Razer Blade 16 Early 2023
109330 MIPS -20%
Intel Core i9-12900HX
MSI Titan GT77 12UHS
86234 MIPS -37%
AMD Ryzen 9 6900HX
Asus ROG Zephyrus Duo 16 GX650RX
64457 MIPS -53%
Geekbench 5.5 / Multi-Core
Intel Core i9-13900HX
Lenovo Legion Pro 7 16IRX8H
21058 Points +6%
Intel Core i9-13900HX
SCHENKER XMG Neo 16 Raptor Lake
20784 Points +5%
Intel Core i9-13950HX
MSI Titan GT77 HX 13VI
20634 Points +4%
Intel Core i9-13980HX
MSI Titan GT77 HX 13VI
20329 Points +2%
AMD Ryzen 9 7945HX
Asus ROG Strix G17 G713PI (Turbo Mode)
19954 Points 0%
AMD Ryzen 9 7945HX3D
Asus ROG Strix Scar 17 G733PYV-LL053X
19875 Points
AMD Ryzen 9 7945HX
Asus Zephyrus Duo 16 GX650PY-NM006W
19583 Points -1%
AMD Ryzen 9 7945HX
Asus ROG Strix G17 G713PI
18372 Points -8%
Intel Core i9-13950HX
Razer Blade 16 Early 2023
18152 Points -9%
Intel Core i9-12900HX
MSI Titan GT77 12UHS
16250 Points -18%
Apple M2 Max
Apple MacBook Pro 16 2023 M2 Max
15348 Points -23%
AMD Ryzen 9 6900HX
Asus ROG Zephyrus Duo 16 GX650RX
10167 Points -49%
CPU Performance Rating: Percent
Cinebench R23: Multi Core
Cinebench R20: CPU (Multi Core)
Cinebench R15: CPU Multi 64Bit
Blender: v2.79 BMW27 CPU
7-Zip 18.03: 7z b 4
Geekbench 5.5: Multi-Core

* ... Moindre est la valeur, meilleures sont les performances

Lorsque l'on regarde son efficacité, il faut encore une fois se rappeler que le GPU dédié était actif. En raison de sa consommation totale plus élevée, l'influence est moins importante que lors des tests à cœur unique. Le nouveau Ryzen 9 7945HX3D a devancé les deux CPU 7945HX en mode turbo, ce qui est le seul résultat des limites de puissance plus basses. S'ils avaient tous deux des limites de puissance identiques (par exemple 100 watts), l'efficacité des deux modèles serait comparable. On voit ici l'avantage d'AMD sur Intel, dont les processeurs ont besoin de plus d'énergie pour offrir des performances similaires. Apple avec son processeurM2 Maxavec son processeur M2 Max, AMD est légèrement plus performant, mais au total, il offre des performances maximales nettement inférieures.

Power Consumption / Cinebench R23 Multi Power Efficiency - external Monitor
Apple M2 Max
Apple MacBook Pro 16 2023 M2 Max
233 Points per Watt +13%
AMD Ryzen 9 7945HX3D
Asus ROG Strix Scar 17 G733PYV-LL053X
207 Points per Watt
AMD Ryzen 9 7945HX
Asus Zephyrus Duo 16 GX650PY-NM006W
194.4 Points per Watt -6%
AMD Ryzen 9 7945HX
Asus ROG Strix G17 G713PI
191.1 Points per Watt -8%
Intel Core i9-13950HX
Razer Blade 16 Early 2023 RTX 4090
144.1 Points per Watt -30%
Intel Core i9-13950HX
MSI Titan GT77 HX 13VI
135.3 Points per Watt -35%
Intel Core i9-12900HX
MSI Titan GT77 12UHS
122.6 Points per Watt -41%
Power Consumption / Cinebench R23 Multi (external Monitor)
Intel Core i9-13950HX
MSI Titan GT77 HX 13VI
246 (227min, 227P1 - 264max) Watt * -55%
Intel Core i9-13950HX
Razer Blade 16 Early 2023 RTX 4090
197.3 (191.9min, 192.7P1 - 200max) Watt * -24%
Intel Core i9-12900HX
MSI Titan GT77 12UHS
187.5 (166.8min, 167.1P1 - 230max) Watt * -18%
Intel Core i9-13900HX
SCHENKER XMG Neo 16 E23
182.4 (172.3min, 172.3P1 - 207max) Watt * -15%
AMD Ryzen 9 7945HX
Asus ROG Strix G17 G713PI (Turbo Mode)
179 (171.5min, 171.8P1 - 181.3max) Watt * -13%
AMD Ryzen 9 7945HX
Asus Zephyrus Duo 16 GX650PY-NM006W
177.6 (166.7min, 166.8P1 - 187.3max) Watt * -12%
AMD Ryzen 9 7945HX3D
Asus ROG Strix Scar 17 G733PYV-LL053X
158.5 (149.9min, 150.4P1 - 171.1max) Watt *
Intel Core i7-13700HX
Aorus 15X ASF
148.3 (116.3min, 116.3P1 - 185.2max) Watt * +6%
Apple M2 Max
Apple MacBook Pro 16 2023 M2 Max
63.5 (61.8min, 62.1P1 - 67.8max) Watt * +60%

* ... Moindre est la valeur, meilleures sont les performances

Performance avec des limites de puissance plus basses

Nous avons pu fixer de nouvelles limites de puissance pour le processeur via le mode manuel du logiciel Armoury Crate de l'appareil de test - malheureusement, nous avons été plus limités sur le 7945HX3D. En raison de son refroidissement plus faible, le processeur n'a même pas pu terminer la courte exécution de Cinebench R23 avec une limite fixe de 115 watts - de plus, cette fois, l'application n'a autorisé qu'une valeur minimale de 65 watts. Les deux résultats à 100 watts et 80 watts étaient à peu près au même niveau que le Ryzen 9 7945HX normal. On peut donc dire que le Ryzen 9 7945HX3D offre de meilleures performances à 80 watts que l'Intel Core i9-13980HX à 150 watts.

Cinebench R23 Multi
Limite de puissance Core i9-13900HX Core i9-13950HX Core i9-13980HX Ryzen 9 7945HX Ryzen 9 7945HX3D
170 watts 31,958 31,903
150 watts 30,655 30,623
130 watts 28 239 29 141 29 281 34 202
115 watts 27 369 28 199 28 073 33 361
100 watts 25 942 26 653 26 507 32 947 32 977
80 watts 23,216 23,950 23,766 30,907 30,804
55 watts 18 843 19 772 19 478 26 045

Performances de jeu 1080p

Passons maintenant aux benchmarks de jeux, où nous avons d'abord examiné la résolution Full HD. Ici, la nouvelle Ryzen 9 7945HX3D a vraiment été en mesure de montrer ses avantages dans un certain nombre de jeux - nous avons même noté qu'elle menait parfois par deux points de pourcentage à chiffres. Dans Far Cry 5, nous avons noté une amélioration de 36 % par rapport au Ryzen 9 7945HX normal et aux CPU HX d'Intel. Dans certains jeux, nous n'avons mesuré aucune amélioration, comme dans The Witcher 3 et Call of Duty Modern Warfare 2.

The Witcher 3 - 1920x1080 Ultra Graphics & Postprocessing (HBAO+)
Alienware m18 R1
Intel Core i9-13980HX, NVIDIA GeForce RTX 4090 Laptop GPU
213.9 (205min) fps +3%
Asus ROG Strix Scar 17 G733PYV-LL053X
AMD Ryzen 9 7945HX3D, NVIDIA GeForce RTX 4090 Laptop GPU
207 fps
SCHENKER Key 17 Pro (Early 23)
Intel Core i9-13900HX, NVIDIA GeForce RTX 4090 Laptop GPU
206 (176min) fps 0%
Asus ROG Strix Scar 17 G733PY-XS96
AMD Ryzen 9 7945HX, NVIDIA GeForce RTX 4090 Laptop GPU
203.8 (186min) fps -2%
Lenovo Legion Pro 7 RTX4090
Intel Core i9-13900HX, NVIDIA GeForce RTX 4090 Laptop GPU
200 (174min) fps -3%
MSI Titan GT77 HX 13VI
Intel Core i9-13950HX, NVIDIA GeForce RTX 4090 Laptop GPU
198.9 (190min, 191P1) fps -4%
Lenovo Legion Pro 5 16ARX8
AMD Ryzen 7 7745HX, NVIDIA GeForce RTX 4070 Laptop GPU
119.8 (114min) fps -42%
Moyenne de la classe Gaming
  (8.61 - 216, n=228, 2 dernières années)
117.2 fps -43%
GTA V - 1920x1080 Highest Settings possible AA:4xMSAA + FX AF:16x
Asus ROG Strix Scar 17 G733PYV-LL053X
AMD Ryzen 9 7945HX3D, NVIDIA GeForce RTX 4090 Laptop GPU
167.7 (1.87min, 111.1P1) fps
Alienware m18 R1
Intel Core i9-13980HX, NVIDIA GeForce RTX 4090 Laptop GPU
149 (3.13min, 111.1P1) fps -11%
Lenovo Legion Pro 7 RTX4090
Intel Core i9-13900HX, NVIDIA GeForce RTX 4090 Laptop GPU
143.6 (4.39min, 100P1) fps -14%
SCHENKER Key 17 Pro (Early 23)
Intel Core i9-13900HX, NVIDIA GeForce RTX 4090 Laptop GPU
142.3 (4.44min, 100P1) fps -15%
Asus ROG Strix Scar 18 2023 G834JY-N6005W
Intel Core i9-13980HX, NVIDIA GeForce RTX 4090 Laptop GPU
141.3 (4.69min, 100P1) fps -16%
MSI Titan GT77 HX 13VI
Intel Core i9-13950HX, NVIDIA GeForce RTX 4090 Laptop GPU
140.9 (3.54min, 83.3P1) fps -16%
Lenovo Legion Pro 5 16ARX8
AMD Ryzen 7 7745HX, NVIDIA GeForce RTX 4070 Laptop GPU
119.9 (3.81min, 76.9P1) fps -29%
Asus ROG Strix Scar 17 G733PY-XS96
AMD Ryzen 9 7945HX, NVIDIA GeForce RTX 4090 Laptop GPU
112.6 (4.54min, 71.4P1) fps -33%
Moyenne de la classe Gaming
  (6.38 - 167.7, n=219, 2 dernières années)
107.6 fps -36%
Final Fantasy XV Benchmark - 1920x1080 High Quality
Alienware m18 R1
Intel Core i9-13980HX, NVIDIA GeForce RTX 4090 Laptop GPU
194.8 fps +8%
MSI Titan GT77 HX 13VI
Intel Core i9-13950HX, NVIDIA GeForce RTX 4090 Laptop GPU
187.4 fps +4%
SCHENKER Key 17 Pro (Early 23)
Intel Core i9-13900HX, NVIDIA GeForce RTX 4090 Laptop GPU
183.1 fps +2%
Lenovo Legion Pro 7 RTX4090
Intel Core i9-13900HX, NVIDIA GeForce RTX 4090 Laptop GPU
181.2 fps +1%
Asus ROG Strix Scar 17 G733PYV-LL053X
AMD Ryzen 9 7945HX3D, NVIDIA GeForce RTX 4090 Laptop GPU
180 fps
Asus ROG Strix Scar 18 2023 G834JY-N6005W
Intel Core i9-13980HX, NVIDIA GeForce RTX 4090 Laptop GPU
177.6 fps -1%
Asus ROG Strix Scar 17 G733PY-XS96
AMD Ryzen 9 7945HX, NVIDIA GeForce RTX 4090 Laptop GPU
163.9 fps -9%
Lenovo Legion Pro 5 16ARX8
AMD Ryzen 7 7745HX, NVIDIA GeForce RTX 4070 Laptop GPU
119.9 fps -33%
Moyenne de la classe Gaming
  (9.13 - 194.9, n=229, 2 dernières années)
111.5 fps -38%
Strange Brigade - 1920x1080 ultra AA:ultra AF:16
Asus ROG Strix Scar 17 G733PYV-LL053X
AMD Ryzen 9 7945HX3D, NVIDIA GeForce RTX 4090 Laptop GPU
420 (64.7min, 302P1) fps
SCHENKER Key 17 Pro (Early 23)
Intel Core i9-13900HX, NVIDIA GeForce RTX 4090 Laptop GPU
378 (20.6min, 257P1) fps -10%
MSI Titan GT77 HX 13VI
Intel Core i9-13950HX, NVIDIA GeForce RTX 4090 Laptop GPU
373 (29.9min, 272P1) fps -11%
Alienware m18 R1
Intel Core i9-13980HX, NVIDIA GeForce RTX 4090 Laptop GPU
373 (73.3min, 273P1) fps -11%
Asus ROG Strix Scar 18 2023 G834JY-N6005W
Intel Core i9-13980HX, NVIDIA GeForce RTX 4090 Laptop GPU
366 (29.1min, 263P1) fps -13%
Lenovo Legion Pro 7 RTX4090
Intel Core i9-13900HX, NVIDIA GeForce RTX 4090 Laptop GPU
347 (87.7min, 252P1) fps -17%
Lenovo Legion Pro 5 16ARX8
AMD Ryzen 7 7745HX, NVIDIA GeForce RTX 4070 Laptop GPU
223 (89min, 167.8P1) fps -47%
Moyenne de la classe Gaming
  (14.6 - 421, n=227, 2 dernières années)
207 fps -51%
Dota 2 Reborn - 1920x1080 ultra (3/3) best looking
Asus ROG Strix Scar 17 G733PYV-LL053X
AMD Ryzen 9 7945HX3D, NVIDIA GeForce RTX 4090 Laptop GPU
220 (175min) fps
Alienware m18 R1
Intel Core i9-13980HX, NVIDIA GeForce RTX 4090 Laptop GPU
194.2 (157.6min) fps -12%
Asus ROG Strix Scar 18 2023 G834JY-N6005W
Intel Core i9-13980HX, NVIDIA GeForce RTX 4090 Laptop GPU
190.2 (160.9min) fps -14%
MSI Titan GT77 HX 13VI
Intel Core i9-13950HX, NVIDIA GeForce RTX 4090 Laptop GPU
185.9 (157.5min) fps -15%
SCHENKER Key 17 Pro (Early 23)
Intel Core i9-13900HX, NVIDIA GeForce RTX 4090 Laptop GPU
182.5 (149.3min) fps -17%
Lenovo Legion Pro 7 RTX4090
Intel Core i9-13900HX, NVIDIA GeForce RTX 4090 Laptop GPU
182.1 (154.2min) fps -17%
Lenovo Legion Pro 5 16ARX8
AMD Ryzen 7 7745HX, NVIDIA GeForce RTX 4070 Laptop GPU
182 (152.8min) fps -17%
Moyenne de la classe Gaming
  (26.9 - 220, n=239, 2 dernières années)
143 fps -35%
Asus ROG Strix Scar 17 G733PY-XS96
AMD Ryzen 9 7945HX, NVIDIA GeForce RTX 4090 Laptop GPU
139 (118.5min) fps -37%
X-Plane 11.11 - 1920x1080 high (fps_test=3)
Asus ROG Strix Scar 17 G733PYV-LL053X
AMD Ryzen 9 7945HX3D, NVIDIA GeForce RTX 4090 Laptop GPU
166.2 fps
Alienware m18 R1
Intel Core i9-13980HX, NVIDIA GeForce RTX 4090 Laptop GPU
143.5 fps -14%
Asus ROG Strix Scar 18 2023 G834JY-N6005W
Intel Core i9-13980HX, NVIDIA GeForce RTX 4090 Laptop GPU
142.8 fps -14%
SCHENKER Key 17 Pro (Early 23)
Intel Core i9-13900HX, NVIDIA GeForce RTX 4090 Laptop GPU
136.6 fps -18%
Lenovo Legion Pro 7 RTX4090
Intel Core i9-13900HX, NVIDIA GeForce RTX 4090 Laptop GPU
136.4 fps -18%
MSI Titan GT77 HX 13VI
Intel Core i9-13950HX, NVIDIA GeForce RTX 4090 Laptop GPU
134.2 fps -19%
MSI Titan GT77 HX 13VI
Intel Core i9-13950HX, NVIDIA GeForce RTX 4090 Laptop GPU
134.1 fps -19%
Lenovo Legion Pro 5 16ARX8
AMD Ryzen 7 7745HX, NVIDIA GeForce RTX 4070 Laptop GPU
117.8 fps -29%
Moyenne de la classe Gaming
  (12.4 - 166.2, n=244, 2 dernières années)
102.2 fps -39%
Asus ROG Strix Scar 17 G733PY-XS96
AMD Ryzen 9 7945HX, NVIDIA GeForce RTX 4090 Laptop GPU
94.3 fps -43%
Shadow of the Tomb Raider - 1920x1080 Highest Preset AA:T
Asus ROG Strix Scar 17 G733PYV-LL053X
AMD Ryzen 9 7945HX3D, NVIDIA GeForce RTX 4090 Laptop GPU
271 fps
Asus ROG Strix Scar 17 G733PY-XS96
AMD Ryzen 9 7945HX, NVIDIA GeForce RTX 4090 Laptop GPU
228 fps -16%
MSI Titan GT77 HX 13VI
Intel Core i9-13950HX, NVIDIA GeForce RTX 4090 Laptop GPU
214 fps -21%
Lenovo Legion Pro 5 16ARX8
AMD Ryzen 7 7745HX, NVIDIA GeForce RTX 4070 Laptop GPU
168 fps -38%
Moyenne de la classe Gaming
  (27 - 271, n=30, 2 dernières années)
161.3 fps -40%
Asus ROG Strix Scar 18 2023 G834JY-N6005W
Intel Core i9-13980HX, NVIDIA GeForce RTX 4090 Laptop GPU
143.7 fps -47%
F1 22 - 1920x1080 Ultra High Preset AA:T AF:16x
Alienware m18 R1
Intel Core i9-13980HX, NVIDIA GeForce RTX 4090 Laptop GPU
144.7 (124min, 94P1) fps +6%
MSI Titan GT77 HX 13VI
Intel Core i9-13950HX, NVIDIA GeForce RTX 4090 Laptop GPU
138.2 (118min, 84P1) fps +2%
Asus ROG Strix Scar 17 G733PYV-LL053X
AMD Ryzen 9 7945HX3D, NVIDIA GeForce RTX 4090 Laptop GPU
135.9 (118min, 98P1) fps
Lenovo Legion Pro 7 RTX4090
Intel Core i9-13900HX, NVIDIA GeForce RTX 4090 Laptop GPU
129.2 (105min, 83P1) fps -5%
Asus ROG Strix Scar 18 2023 G834JY-N6005W
Intel Core i9-13980HX, NVIDIA GeForce RTX 4090 Laptop GPU
124.5 (107min, 87P1) fps -8%
Asus ROG Strix Scar 17 G733PY-XS96
AMD Ryzen 9 7945HX, NVIDIA GeForce RTX 4090 Laptop GPU
116.3 (86min, 73P1) fps -14%
Lenovo Legion Pro 5 16ARX8
AMD Ryzen 7 7745HX, NVIDIA GeForce RTX 4070 Laptop GPU
84.1 (71min, 59P1) fps -38%
Moyenne de la classe Gaming
  (13 - 144.7, n=109, 2 dernières années)
80.1 fps -41%
Far Cry 5 - 1920x1080 Ultra Preset AA:T
Asus ROG Strix Scar 17 G733PYV-LL053X
AMD Ryzen 9 7945HX3D, NVIDIA GeForce RTX 4090 Laptop GPU
218 fps
MSI Titan GT77 HX 13VI
Intel Core i9-13950HX, NVIDIA GeForce RTX 4090 Laptop GPU
160 fps -27%
Asus ROG Strix Scar 18 2023 G834JY-N6005W
Intel Core i9-13980HX, NVIDIA GeForce RTX 4090 Laptop GPU
158 (117min) fps -28%
Asus ROG Strix Scar 17 G733PY-XS96
AMD Ryzen 9 7945HX, NVIDIA GeForce RTX 4090 Laptop GPU
145 (106min) fps -33%
Moyenne de la classe Gaming
  (14 - 218, n=126, 2 dernières années)
126.3 fps -42%
Far Cry 6 - 1920x1080 Ultra Graphics Quality + HD Textures AA:T
Asus ROG Strix Scar 17 G733PYV-LL053X
AMD Ryzen 9 7945HX3D, NVIDIA GeForce RTX 4090 Laptop GPU
167 fps
MSI Titan GT77 HX 13VI
Intel Core i9-13950HX, NVIDIA GeForce RTX 4090 Laptop GPU
144 fps -14%
Asus ROG Strix Scar 17 G733PY-XS96
AMD Ryzen 9 7945HX, NVIDIA GeForce RTX 4090 Laptop GPU
112 (91min) fps -33%
Lenovo Legion Pro 5 16ARX8
AMD Ryzen 7 7745HX, NVIDIA GeForce RTX 4070 Laptop GPU
110 (74min) fps -34%
Moyenne de la classe Gaming
  (14.7 - 167, n=35, 2 dernières années)
98.8 fps -41%
Call of Duty Modern Warfare 2 2022 - 1920x1080 Extreme Quality Preset AA:T2X Filmic SM
Asus ROG Strix Scar 17 G733PYV-LL053X
AMD Ryzen 9 7945HX3D, NVIDIA GeForce RTX 4090 Laptop GPU
182 fps
Asus ROG Strix Scar 17 G733PY-XS96
AMD Ryzen 9 7945HX, NVIDIA GeForce RTX 4090 Laptop GPU
180 (103min) fps -1%
MSI Titan GT77 HX 13VI
Intel Core i9-13950HX, NVIDIA GeForce RTX 4090 Laptop GPU
176 fps -3%
Asus ROG Strix Scar 18 2023 G834JY-N6005W
Intel Core i9-13980HX, NVIDIA GeForce RTX 4090 Laptop GPU
170 (98P1) fps -7%
Moyenne de la classe Gaming
  (15 - 182, n=39, 2 dernières années)
114.2 fps -37%
Lenovo Legion Pro 5 16ARX8
AMD Ryzen 7 7745HX, NVIDIA GeForce RTX 4070 Laptop GPU
108 (61min) fps -41%
Cyberpunk 2077 1.6 - 1920x1080 Ultra Preset
Asus ROG Strix Scar 17 G733PYV-LL053X
AMD Ryzen 9 7945HX3D, NVIDIA GeForce RTX 4090 Laptop GPU
157 fps
MSI Titan GT77 HX 13VI
Intel Core i9-13950HX, NVIDIA GeForce RTX 4090 Laptop GPU
135 fps -14%
Asus ROG Strix Scar 17 G733PY-XS96
AMD Ryzen 9 7945HX, NVIDIA GeForce RTX 4090 Laptop GPU
133.8 (57.7min) fps -15%
Alienware m18 R1
Intel Core i9-13980HX, NVIDIA GeForce RTX 4090 Laptop GPU
127.92 (32.4min) fps -19%
Asus ROG Strix Scar 18 2023 G834JY-N6005W
Intel Core i9-13980HX, NVIDIA GeForce RTX 4090 Laptop GPU
119.7 (69min) fps -24%
Lenovo Legion Pro 5 16ARX8
AMD Ryzen 7 7745HX, NVIDIA GeForce RTX 4070 Laptop GPU
98.9 (35.5min) fps -37%
Moyenne de la classe Gaming
  (16.7 - 159.7, n=102, 2 dernières années)
86.7 fps -45%

Performances de jeu QHD

En résolution QHD, le nouveau processeur a également montré quelques avantages, bien qu'ils ne soient pas aussi importants qu'en 1080p. En général, le Ryzen 9 7945HX3D offre toujours de meilleures performances que ses concurrents, avec parfois des pourcentages à deux chiffres.

Shadow of the Tomb Raider - 2560x1440 Highest Preset AA:T
Asus ROG Strix Scar 17 G733PYV-LL053X
NVIDIA GeForce RTX 4090 Laptop GPU, R9 7945HX3D, SK hynix PC801 HFS001TEJ9X101N
199 fps
Asus ROG Strix Scar 17 G733PY-XS96
NVIDIA GeForce RTX 4090 Laptop GPU, R9 7945HX, SK hynix PC801 HFS001TEJ9X101N
190 fps -5%
MSI Titan GT77 HX 13VI
NVIDIA GeForce RTX 4090 Laptop GPU, i9-13950HX, Samsung PM9A1 MZVL22T0HBLB
187 fps -6%
Lenovo Legion Pro 7 RTX4090
NVIDIA GeForce RTX 4090 Laptop GPU, i9-13900HX, Samsung PM9A1 MZVL21T0HCLR
185 fps -7%
Far Cry 5 - 2560x1440 Ultra Preset AA:T
Asus ROG Strix Scar 17 G733PYV-LL053X
NVIDIA GeForce RTX 4090 Laptop GPU, R9 7945HX3D, SK hynix PC801 HFS001TEJ9X101N
194 fps
MSI Titan GT77 HX 13VI
NVIDIA GeForce RTX 4090 Laptop GPU, i9-13950HX, Samsung PM9A1 MZVL22T0HBLB
159 fps -18%
Asus ROG Strix Scar 17 G733PY-XS96
NVIDIA GeForce RTX 4090 Laptop GPU, R9 7945HX, SK hynix PC801 HFS001TEJ9X101N
142 (104min - 189max) fps -27%
Far Cry 6 - 2560x1440 Ultra Graphics Quality + HD Textures AA:T
Asus ROG Strix Scar 17 G733PYV-LL053X
NVIDIA GeForce RTX 4090 Laptop GPU, R9 7945HX3D, SK hynix PC801 HFS001TEJ9X101N
146 fps
MSI Titan GT77 HX 13VI
NVIDIA GeForce RTX 4090 Laptop GPU, i9-13950HX, Samsung PM9A1 MZVL22T0HBLB
135 fps -8%
Asus ROG Strix Scar 17 G733PY-XS96
NVIDIA GeForce RTX 4090 Laptop GPU, R9 7945HX, SK hynix PC801 HFS001TEJ9X101N
109 (88min - 120max) fps -25%
Final Fantasy XV Benchmark - 2560x1440 High Quality
MSI Titan GT77 HX 13VI
NVIDIA GeForce RTX 4090 Laptop GPU, i9-13950HX, Samsung PM9A1 MZVL22T0HBLB
162.9 fps +8%
Alienware m18 R1
NVIDIA GeForce RTX 4090 Laptop GPU, i9-13980HX, SK hynix PC801 HFS001TEJ9X101N
159.5 fps +5%
SCHENKER Key 17 Pro (Early 23)
NVIDIA GeForce RTX 4090 Laptop GPU, i9-13900HX, Samsung 990 Pro 2 TB MZVL72T0HDLB
156.4 fps +3%
Lenovo Legion Pro 7 RTX4090
NVIDIA GeForce RTX 4090 Laptop GPU, i9-13900HX, Samsung PM9A1 MZVL21T0HCLR
154 fps +2%
Asus ROG Strix Scar 17 G733PYV-LL053X
NVIDIA GeForce RTX 4090 Laptop GPU, R9 7945HX3D, SK hynix PC801 HFS001TEJ9X101N
151.2 fps
Asus ROG Strix Scar 17 G733PY-XS96
NVIDIA GeForce RTX 4090 Laptop GPU, R9 7945HX, SK hynix PC801 HFS001TEJ9X101N
151 fps 0%
GTA V - 2560x1440 Highest Settings possible AA:4xMSAA + FX AF:16x
Asus ROG Strix Scar 17 G733PYV-LL053X
NVIDIA GeForce RTX 4090 Laptop GPU, R9 7945HX3D, SK hynix PC801 HFS001TEJ9X101N
160.6 (2.82min, 111.1P1 - 363max) fps
Alienware m18 R1
NVIDIA GeForce RTX 4090 Laptop GPU, i9-13980HX, SK hynix PC801 HFS001TEJ9X101N
145.5 (2.46min, 111.1P1 - 281max) fps -9%
SCHENKER Key 17 Pro (Early 23)
NVIDIA GeForce RTX 4090 Laptop GPU, i9-13900HX, Samsung 990 Pro 2 TB MZVL72T0HDLB
141.5 (28.6min, 100P1 - 268max) fps -12%
MSI Titan GT77 HX 13VI
NVIDIA GeForce RTX 4090 Laptop GPU, i9-13950HX, Samsung PM9A1 MZVL22T0HBLB
138.5 (3.45min, 76.9P1 - 256max) fps -14%
Lenovo Legion Pro 7 RTX4090
NVIDIA GeForce RTX 4090 Laptop GPU, i9-13900HX, Samsung PM9A1 MZVL21T0HCLR
137.7 (3.84min, 90.9P1 - 304max) fps -14%
Asus ROG Strix Scar 17 G733PY-XS96
NVIDIA GeForce RTX 4090 Laptop GPU, R9 7945HX, SK hynix PC801 HFS001TEJ9X101N
114.8 (5.12min, 71.4P1 - 204max) fps -29%
F1 22 - 2560x1440 Ultra High Preset AA:T AF:16x
Alienware m18 R1
NVIDIA GeForce RTX 4090 Laptop GPU, i9-13980HX, SK hynix PC801 HFS001TEJ9X101N
92.2 (79min, 74P1 - 106max) fps 0%
Asus ROG Strix Scar 17 G733PY-XS96
NVIDIA GeForce RTX 4090 Laptop GPU, R9 7945HX, SK hynix PC801 HFS001TEJ9X101N
92.1 (75min, 60P1 - 107max) fps 0%
Asus ROG Strix Scar 17 G733PYV-LL053X
NVIDIA GeForce RTX 4090 Laptop GPU, R9 7945HX3D, SK hynix PC801 HFS001TEJ9X101N
91.8 (78min, 76P1 - 105max) fps
MSI Titan GT77 HX 13VI
NVIDIA GeForce RTX 4090 Laptop GPU, i9-13950HX, Samsung PM9A1 MZVL22T0HBLB
90.1 (78min, 71P1 - 104max) fps -2%
Lenovo Legion Pro 7 RTX4090
NVIDIA GeForce RTX 4090 Laptop GPU, i9-13900HX, Samsung PM9A1 MZVL21T0HCLR
85.2 (72min, 40P1 - 96max) fps -7%
Call of Duty Modern Warfare 2 2022 - 2560x1440 Extreme Quality Preset AA:T2X Filmic SM
Asus ROG Strix Scar 17 G733PYV-LL053X
NVIDIA GeForce RTX 4090 Laptop GPU, R9 7945HX3D, SK hynix PC801 HFS001TEJ9X101N
136 fps
MSI Titan GT77 HX 13VI
NVIDIA GeForce RTX 4090 Laptop GPU, i9-13950HX, Samsung PM9A1 MZVL22T0HBLB
135 fps -1%
Asus ROG Strix Scar 17 G733PY-XS96
NVIDIA GeForce RTX 4090 Laptop GPU, R9 7945HX, SK hynix PC801 HFS001TEJ9X101N
135 (69min) fps -1%
Lenovo Legion Pro 7 RTX4090
NVIDIA GeForce RTX 4090 Laptop GPU, i9-13900HX, Samsung PM9A1 MZVL21T0HCLR
132 (67min) fps -3%
Cyberpunk 2077 1.6 - 2560x1440 Ultra Preset
Asus ROG Strix Scar 17 G733PYV-LL053X
NVIDIA GeForce RTX 4090 Laptop GPU, R9 7945HX3D, SK hynix PC801 HFS001TEJ9X101N
116 fps
Asus ROG Strix Scar 17 G733PY-XS96
NVIDIA GeForce RTX 4090 Laptop GPU, R9 7945HX, SK hynix PC801 HFS001TEJ9X101N
104.3 (34.5min - 159.2max) fps -10%
Alienware m18 R1
NVIDIA GeForce RTX 4090 Laptop GPU, i9-13980HX, SK hynix PC801 HFS001TEJ9X101N
102.16 (48.9min - 193.9max) fps -12%
Lenovo Legion Pro 7 RTX4090
NVIDIA GeForce RTX 4090 Laptop GPU, i9-13900HX, Samsung PM9A1 MZVL21T0HCLR
100.93 (30.73min - 162.33max) fps -13%
MSI Titan GT77 HX 13VI
NVIDIA GeForce RTX 4090 Laptop GPU, i9-13950HX, Samsung PM9A1 MZVL22T0HBLB
98 fps -16%

Performances de jeu 4K

En résolution 4K, le nouveau Ryzen 9 7945HX3D n'offre aucun avantage par rapport au Ryzen 9 7945HX classique ou aux processeurs mobiles HX d'Intel, bien que tous les modèles affichent des performances très similaires.

Shadow of the Tomb Raider - 3840x2160 Highest Preset AA:T
Lenovo Legion Pro 7 RTX4090
NVIDIA GeForce RTX 4090 Laptop GPU, i9-13900HX, Samsung PM9A1 MZVL21T0HCLR
120 fps +15%
Asus ROG Strix Scar 17 G733PY-XS96
NVIDIA GeForce RTX 4090 Laptop GPU, R9 7945HX, SK hynix PC801 HFS001TEJ9X101N
104 fps 0%
Asus ROG Strix Scar 17 G733PYV-LL053X
NVIDIA GeForce RTX 4090 Laptop GPU, R9 7945HX3D, SK hynix PC801 HFS001TEJ9X101N
104 fps
MSI Titan GT77 HX 13VI
NVIDIA GeForce RTX 4090 Laptop GPU, i9-13950HX, Samsung PM9A1 MZVL22T0HBLB
103 fps -1%
Far Cry 5 - 3840x2160 Ultra Preset AA:T
MSI Titan GT77 HX 13VI
NVIDIA GeForce RTX 4090 Laptop GPU, i9-13950HX, Samsung PM9A1 MZVL22T0HBLB
113 fps +3%
Asus ROG Strix Scar 17 G733PYV-LL053X
NVIDIA GeForce RTX 4090 Laptop GPU, R9 7945HX3D, SK hynix PC801 HFS001TEJ9X101N
110 fps
Asus ROG Strix Scar 17 G733PY-XS96
NVIDIA GeForce RTX 4090 Laptop GPU, R9 7945HX, SK hynix PC801 HFS001TEJ9X101N
108 (97min - 124max) fps -2%
Far Cry 6 - 3840x2160 Ultra Graphics Quality + HD Textures AA:T
MSI Titan GT77 HX 13VI
NVIDIA GeForce RTX 4090 Laptop GPU, i9-13950HX, Samsung PM9A1 MZVL22T0HBLB
89 fps +1%
Asus ROG Strix Scar 17 G733PYV-LL053X
NVIDIA GeForce RTX 4090 Laptop GPU, R9 7945HX3D, SK hynix PC801 HFS001TEJ9X101N
88 fps
Asus ROG Strix Scar 17 G733PY-XS96
NVIDIA GeForce RTX 4090 Laptop GPU, R9 7945HX, SK hynix PC801 HFS001TEJ9X101N
82 (73min - 89max) fps -7%
Final Fantasy XV Benchmark - 3840x2160 High Quality
MSI Titan GT77 HX 13VI
NVIDIA GeForce RTX 4090 Laptop GPU, i9-13950HX, Samsung PM9A1 MZVL22T0HBLB
94.7 fps +11%
Asus ROG Strix Scar 17 G733PY-XS96
NVIDIA GeForce RTX 4090 Laptop GPU, R9 7945HX, SK hynix PC801 HFS001TEJ9X101N
93.3 fps +10%
Alienware m18 R1
NVIDIA GeForce RTX 4090 Laptop GPU, i9-13980HX, SK hynix PC801 HFS001TEJ9X101N
92.6 fps +9%
SCHENKER Key 17 Pro (Early 23)
NVIDIA GeForce RTX 4090 Laptop GPU, i9-13900HX, Samsung 990 Pro 2 TB MZVL72T0HDLB
91.9 fps +8%
Lenovo Legion Pro 7 RTX4090
NVIDIA GeForce RTX 4090 Laptop GPU, i9-13900HX, Samsung PM9A1 MZVL21T0HCLR
91.7 fps +8%
Asus ROG Strix Scar 17 G733PYV-LL053X
NVIDIA GeForce RTX 4090 Laptop GPU, R9 7945HX3D, SK hynix PC801 HFS001TEJ9X101N
85 fps
GTA V - 3840x2160 High/On (Advanced Graphics Off) AA:FX AF:8x
Asus ROG Strix Scar 17 G733PYV-LL053X
NVIDIA GeForce RTX 4090 Laptop GPU, R9 7945HX3D, SK hynix PC801 HFS001TEJ9X101N
182.7 (1.878min, 125P1 - 564max) fps
Alienware m18 R1
NVIDIA GeForce RTX 4090 Laptop GPU, i9-13980HX, SK hynix PC801 HFS001TEJ9X101N
176.4 (1.959min, 111.1P1 - 452max) fps -3%
MSI Titan GT77 HX 13VI
NVIDIA GeForce RTX 4090 Laptop GPU, i9-13950HX, Samsung PM9A1 MZVL22T0HBLB
175.7 (2.91min, 111.1P1 - 424max) fps -4%
Lenovo Legion Pro 7 RTX4090
NVIDIA GeForce RTX 4090 Laptop GPU, i9-13900HX, Samsung PM9A1 MZVL21T0HCLR
173.6 (2.41min, 111.1P1 - 427max) fps -5%
Asus ROG Strix Scar 17 G733PY-XS96
NVIDIA GeForce RTX 4090 Laptop GPU, R9 7945HX, SK hynix PC801 HFS001TEJ9X101N
170.5 (3.62min, 111.1P1 - 289max) fps -7%
SCHENKER Key 17 Pro (Early 23)
NVIDIA GeForce RTX 4090 Laptop GPU, i9-13900HX, Samsung 990 Pro 2 TB MZVL72T0HDLB
167.9 (3.06min, 111.1P1 - 495max) fps -8%
F1 22 - 3840x2160 Ultra High Preset AA:T AF:16x
Lenovo Legion Pro 7 RTX4090
NVIDIA GeForce RTX 4090 Laptop GPU, i9-13900HX, Samsung PM9A1 MZVL21T0HCLR
45.9 (39min, 37P1 - 53max) fps +2%
Asus ROG Strix Scar 17 G733PY-XS96
NVIDIA GeForce RTX 4090 Laptop GPU, R9 7945HX, SK hynix PC801 HFS001TEJ9X101N
45.8 (39min, 38P1 - 52max) fps +2%
Alienware m18 R1
NVIDIA GeForce RTX 4090 Laptop GPU, i9-13980HX, SK hynix PC801 HFS001TEJ9X101N
45.5 (38min, 37P1 - 52max) fps +1%
Asus ROG Strix Scar 17 G733PYV-LL053X
NVIDIA GeForce RTX 4090 Laptop GPU, R9 7945HX3D, SK hynix PC801 HFS001TEJ9X101N
45 (38min, 38P1 - 51max) fps
MSI Titan GT77 HX 13VI
NVIDIA GeForce RTX 4090 Laptop GPU, i9-13950HX, Samsung PM9A1 MZVL22T0HBLB
44.9 (38min, 37P1 - 52max) fps 0%
Call of Duty Modern Warfare 2 2022 - 3840x2160 Extreme Quality Preset AA:T2X Filmic SM
MSI Titan GT77 HX 13VI
NVIDIA GeForce RTX 4090 Laptop GPU, i9-13950HX, Samsung PM9A1 MZVL22T0HBLB
85 fps +2%
Asus ROG Strix Scar 17 G733PYV-LL053X
NVIDIA GeForce RTX 4090 Laptop GPU, R9 7945HX3D, SK hynix PC801 HFS001TEJ9X101N
83 fps
Asus ROG Strix Scar 17 G733PY-XS96
NVIDIA GeForce RTX 4090 Laptop GPU, R9 7945HX, SK hynix PC801 HFS001TEJ9X101N
82 (39min) fps -1%
Lenovo Legion Pro 7 RTX4090
NVIDIA GeForce RTX 4090 Laptop GPU, i9-13900HX, Samsung PM9A1 MZVL21T0HCLR
82 (38min) fps -1%
Cyberpunk 2077 1.6 - 3840x2160 Ultra Preset
MSI Titan GT77 HX 13VI
NVIDIA GeForce RTX 4090 Laptop GPU, i9-13950HX, Samsung PM9A1 MZVL22T0HBLB
56 fps +10%
Asus ROG Strix Scar 17 G733PYV-LL053X
NVIDIA GeForce RTX 4090 Laptop GPU, R9 7945HX3D, SK hynix PC801 HFS001TEJ9X101N
51 fps
Lenovo Legion Pro 7 RTX4090
NVIDIA GeForce RTX 4090 Laptop GPU, i9-13900HX, Samsung PM9A1 MZVL21T0HCLR
50.05 (28.38min - 104.95max) fps -2%
Alienware m18 R1
NVIDIA GeForce RTX 4090 Laptop GPU, i9-13980HX, SK hynix PC801 HFS001TEJ9X101N
49.99 (36.8min - 91.2max) fps -2%
Asus ROG Strix Scar 17 G733PY-XS96
NVIDIA GeForce RTX 4090 Laptop GPU, R9 7945HX, SK hynix PC801 HFS001TEJ9X101N
48.6 (32.3min - 68.3max) fps -5%

Verdict - Le Ryzen 9 7945HX3D est le processeur de jeu le plus rapide

L'AMD Ryzen 9 7945HX3D dans le nouveau Asus ROG Strix SCAR 17 X3D

Après avoir effectué nos tests, il est clair que le nouveau Ryzen 9 7945HX3D d'AMD est le processeur de jeu le plus rapide. Son V-Cache 3D supplémentaire se fait particulièrement remarquer en résolution Full HD et offre un avantage considérable (parfois des pourcentages à deux chiffres) dans de nombreux jeux par rapport au Ryzen 9 7945HX normal et aux processeurs HX mobiles d'Intel. Il s'agit d'une performance remarquable, mais on peut se demander si les utilisateurs d'un ordinateur portable de jeu haut de gamme joueront vraiment à des jeux en résolution 1080p. Par exemple, l'Asus ROG Strix SCAR 17 est équipé d'un écran QHD et bien que nous ayons noté un avantage dans quelques jeux, la différence par rapport aux autres processeurs est de plus en plus faible. Les jeux en 4K au plus tard n'offrent aucune amélioration.

Le nouveau processeur AMD Ryzen 9 7945HX3D est le processeur de jeu mobile le plus rapide du marché qui offre en plus le 3D V-Cache et qui a un avantage particulièrement important sur ses concurrents lorsqu'il s'agit de jouer en résolution 1080p. Son avantage devient déjà plus limité en résolution QHD.

Dans l'ensemble, la performance pure du processeur est identique à celle du Ryzen 9 7945HX et son efficacité multicœur est phénoménale par rapport aux processeurs HX d'Intel. Même avec une limite de puissance fixe de 80 watts, le Ryzen est toujours plus rapide que le Core i9-13980HX d'Intel à 150 watts. Il en va de même pour le Ryzen 9 7945HX sans 3D V-Cache. Le nouveau processeur présente toutefois un inconvénient : En raison de la texture de la surface du processeur HX3D, aucun métal liquide ne peut être utilisé. Le SCAR 17 avec le Ryzen 9 7945HX normal est un peu plus performant en ce qui concerne les performances maximales du processeur.

Please share our article, every link counts!
> Revues et rapports de ordinateurs portatifs et smartphones, ordiphones > Critiques > Test de l'AMD Ryzen 9 7945HX3D Zen4 - Le processeur de jeu mobile le plus puissant grâce au 3D V-Cache
Redaktion, 2023-08-23 (Update: 2023-08-23)