Test de l'Asus ROG Strix Scar 17 SE : PC portable de jeu entièrement équipé avec RTX 3080 Ti
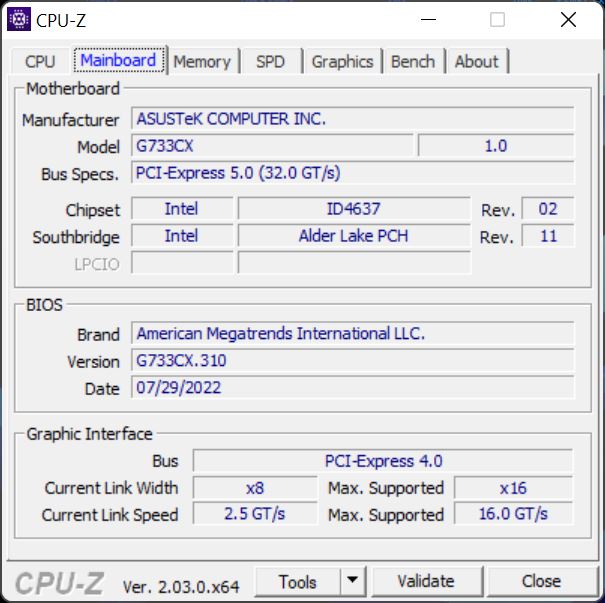
Le ROG Strix Scar SE est le fleuron des jeux d'Asus, et en 2022 également, il est à nouveau équipé des composants les plus rapides actuellement disponibles sur le marché. Nous testons le modèle haut de gamme G733CX avec le Core i9-12950HX d'Intel, la RTX 3080 Ti de Nvidia GeForce, deux SSD de 2 To de Samsung et un écran QHD rapide avec un taux de rafraîchissement de 240 Hz. Le prix est également haut de gamme, puisque le PDSF de notre unité de test s'élève à 3 999 euros (~4 129 dollars).
Comparaison avec les concurrents potentiels
Note | Date | Modèle | Poids | Épaisseur | Taille | Résolution | Prix |
|---|---|---|---|---|---|---|---|
| 86.9 % v7 (old) | 11/22 | Asus ROG Strix Scar 17 SE G733CX-LL014W i9-12950HX, GeForce RTX 3080 Ti Laptop GPU | 2.9 kg | 28.3 mm | 17.30" | 2560x1440 | |
| 88.9 % v7 (old) | 09/22 | Lenovo Legion 7 16IAX7-82TD004SGE i9-12900HX, GeForce RTX 3080 Ti Laptop GPU | 2.6 kg | 20 mm | 16.00" | 2560x1600 | |
| 88.3 % v7 (old) | 08/22 | MSI Titan GT77 12UHS i9-12900HX, GeForce RTX 3080 Ti Laptop GPU | 3.3 kg | 23 mm | 17.30" | 1920x1080 | |
| 87.6 % v7 (old) | 09/22 | Schenker XMG Neo 17 M22 R9 6900HX, GeForce RTX 3080 Ti Laptop GPU | 2.8 kg | 27 mm | 17.00" | 2560x1600 | |
| 89.2 % v7 (old) | 05/22 | Alienware x17 R2 P48E i9-12900HK, GeForce RTX 3080 Ti Laptop GPU | 3.1 kg | 20.9 mm | 17.30" | 1920x1080 |
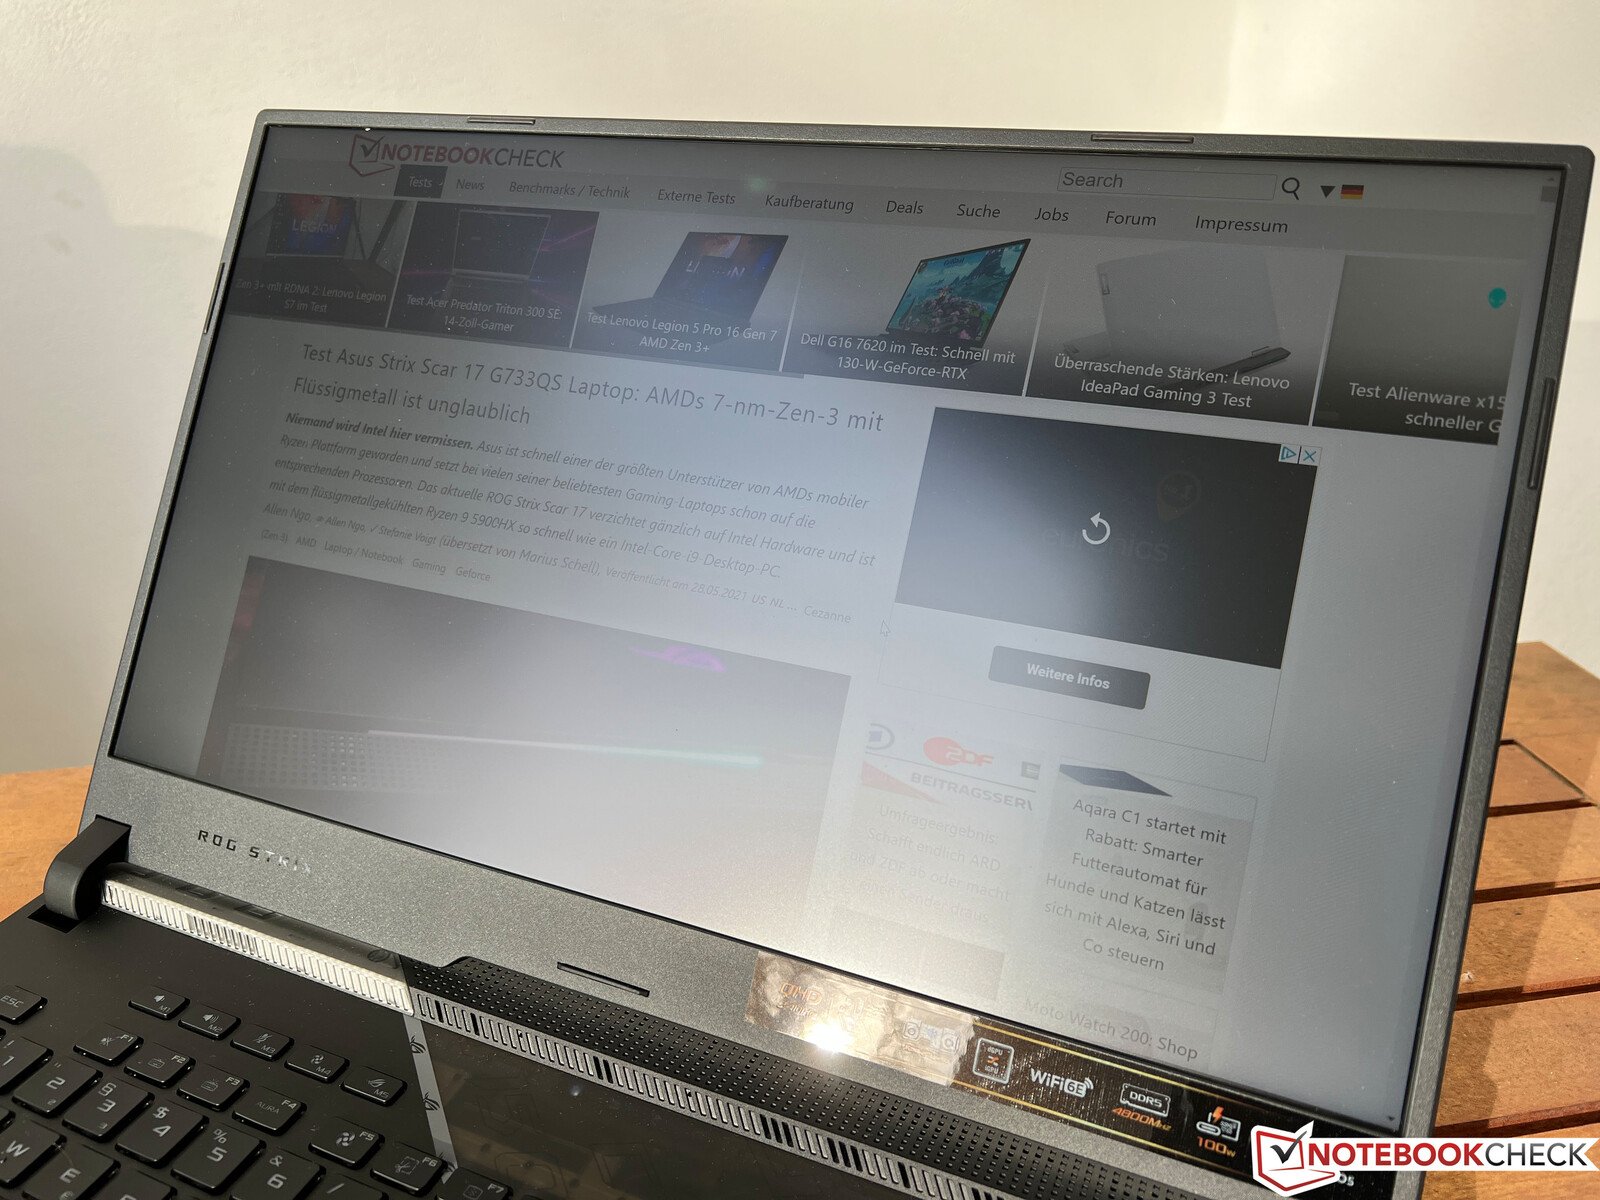
Mallette - Ordinateur portable de jeu avec un design qui se démarque et un éclairage étendu
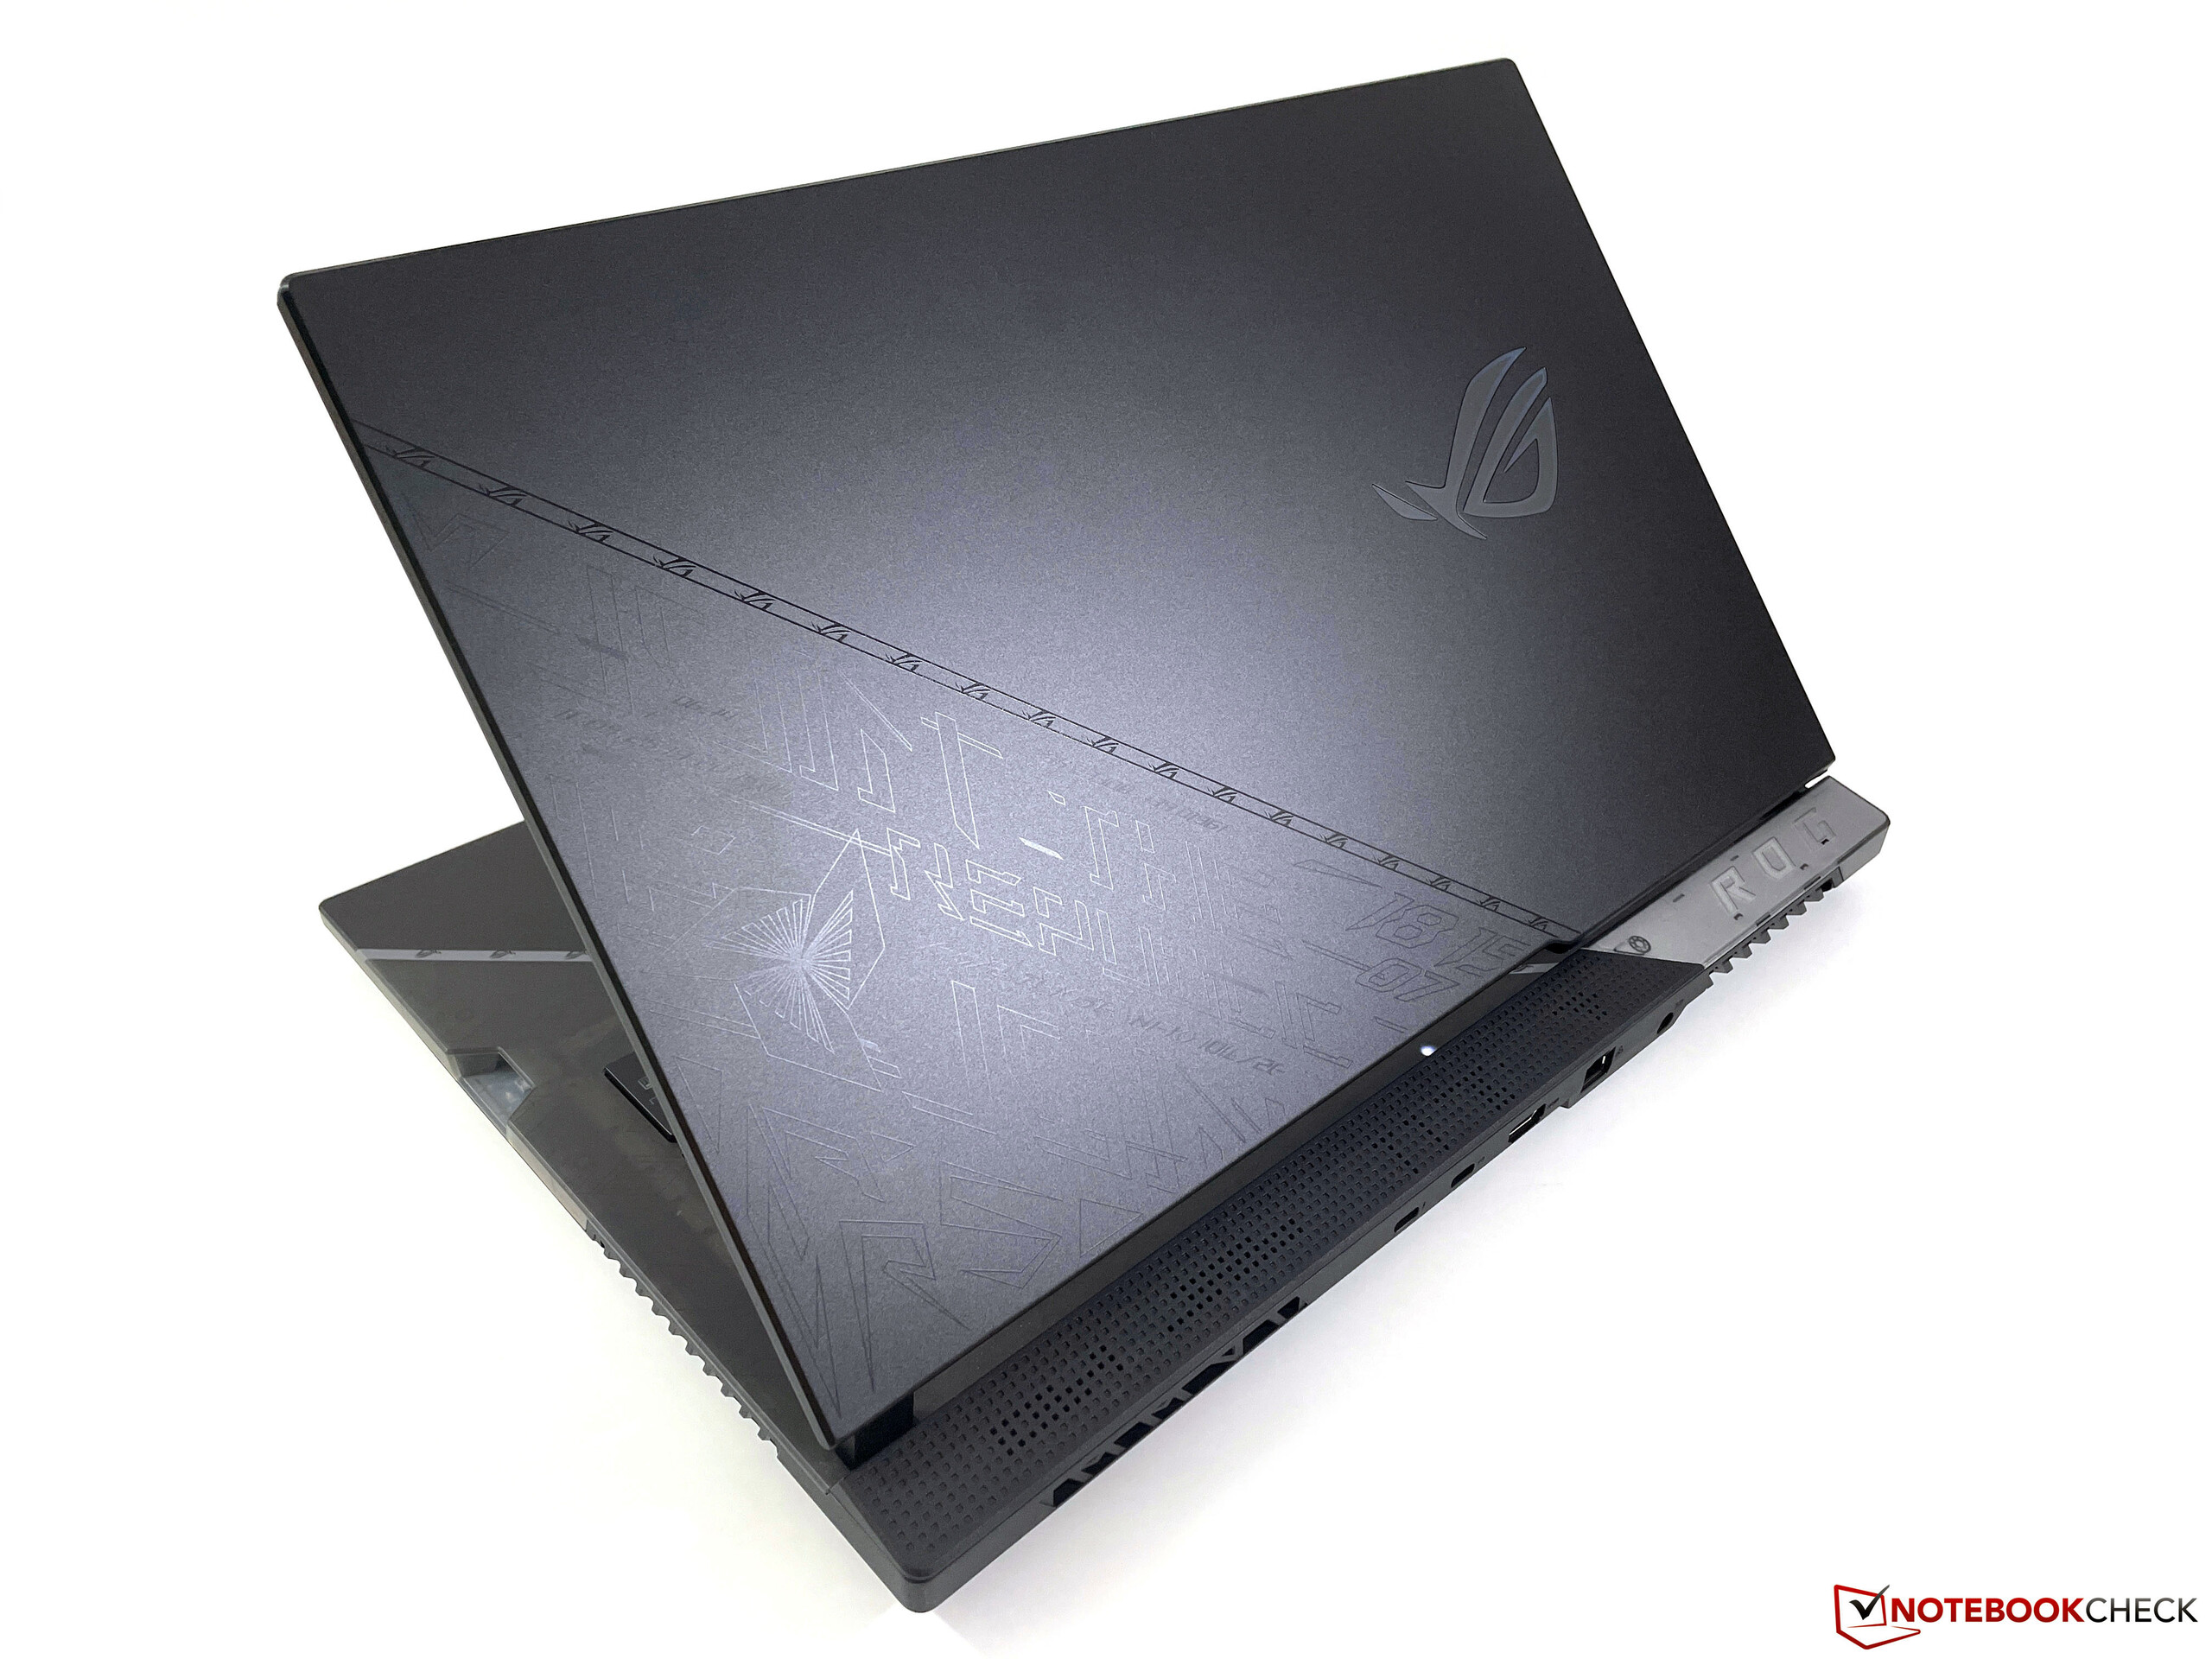
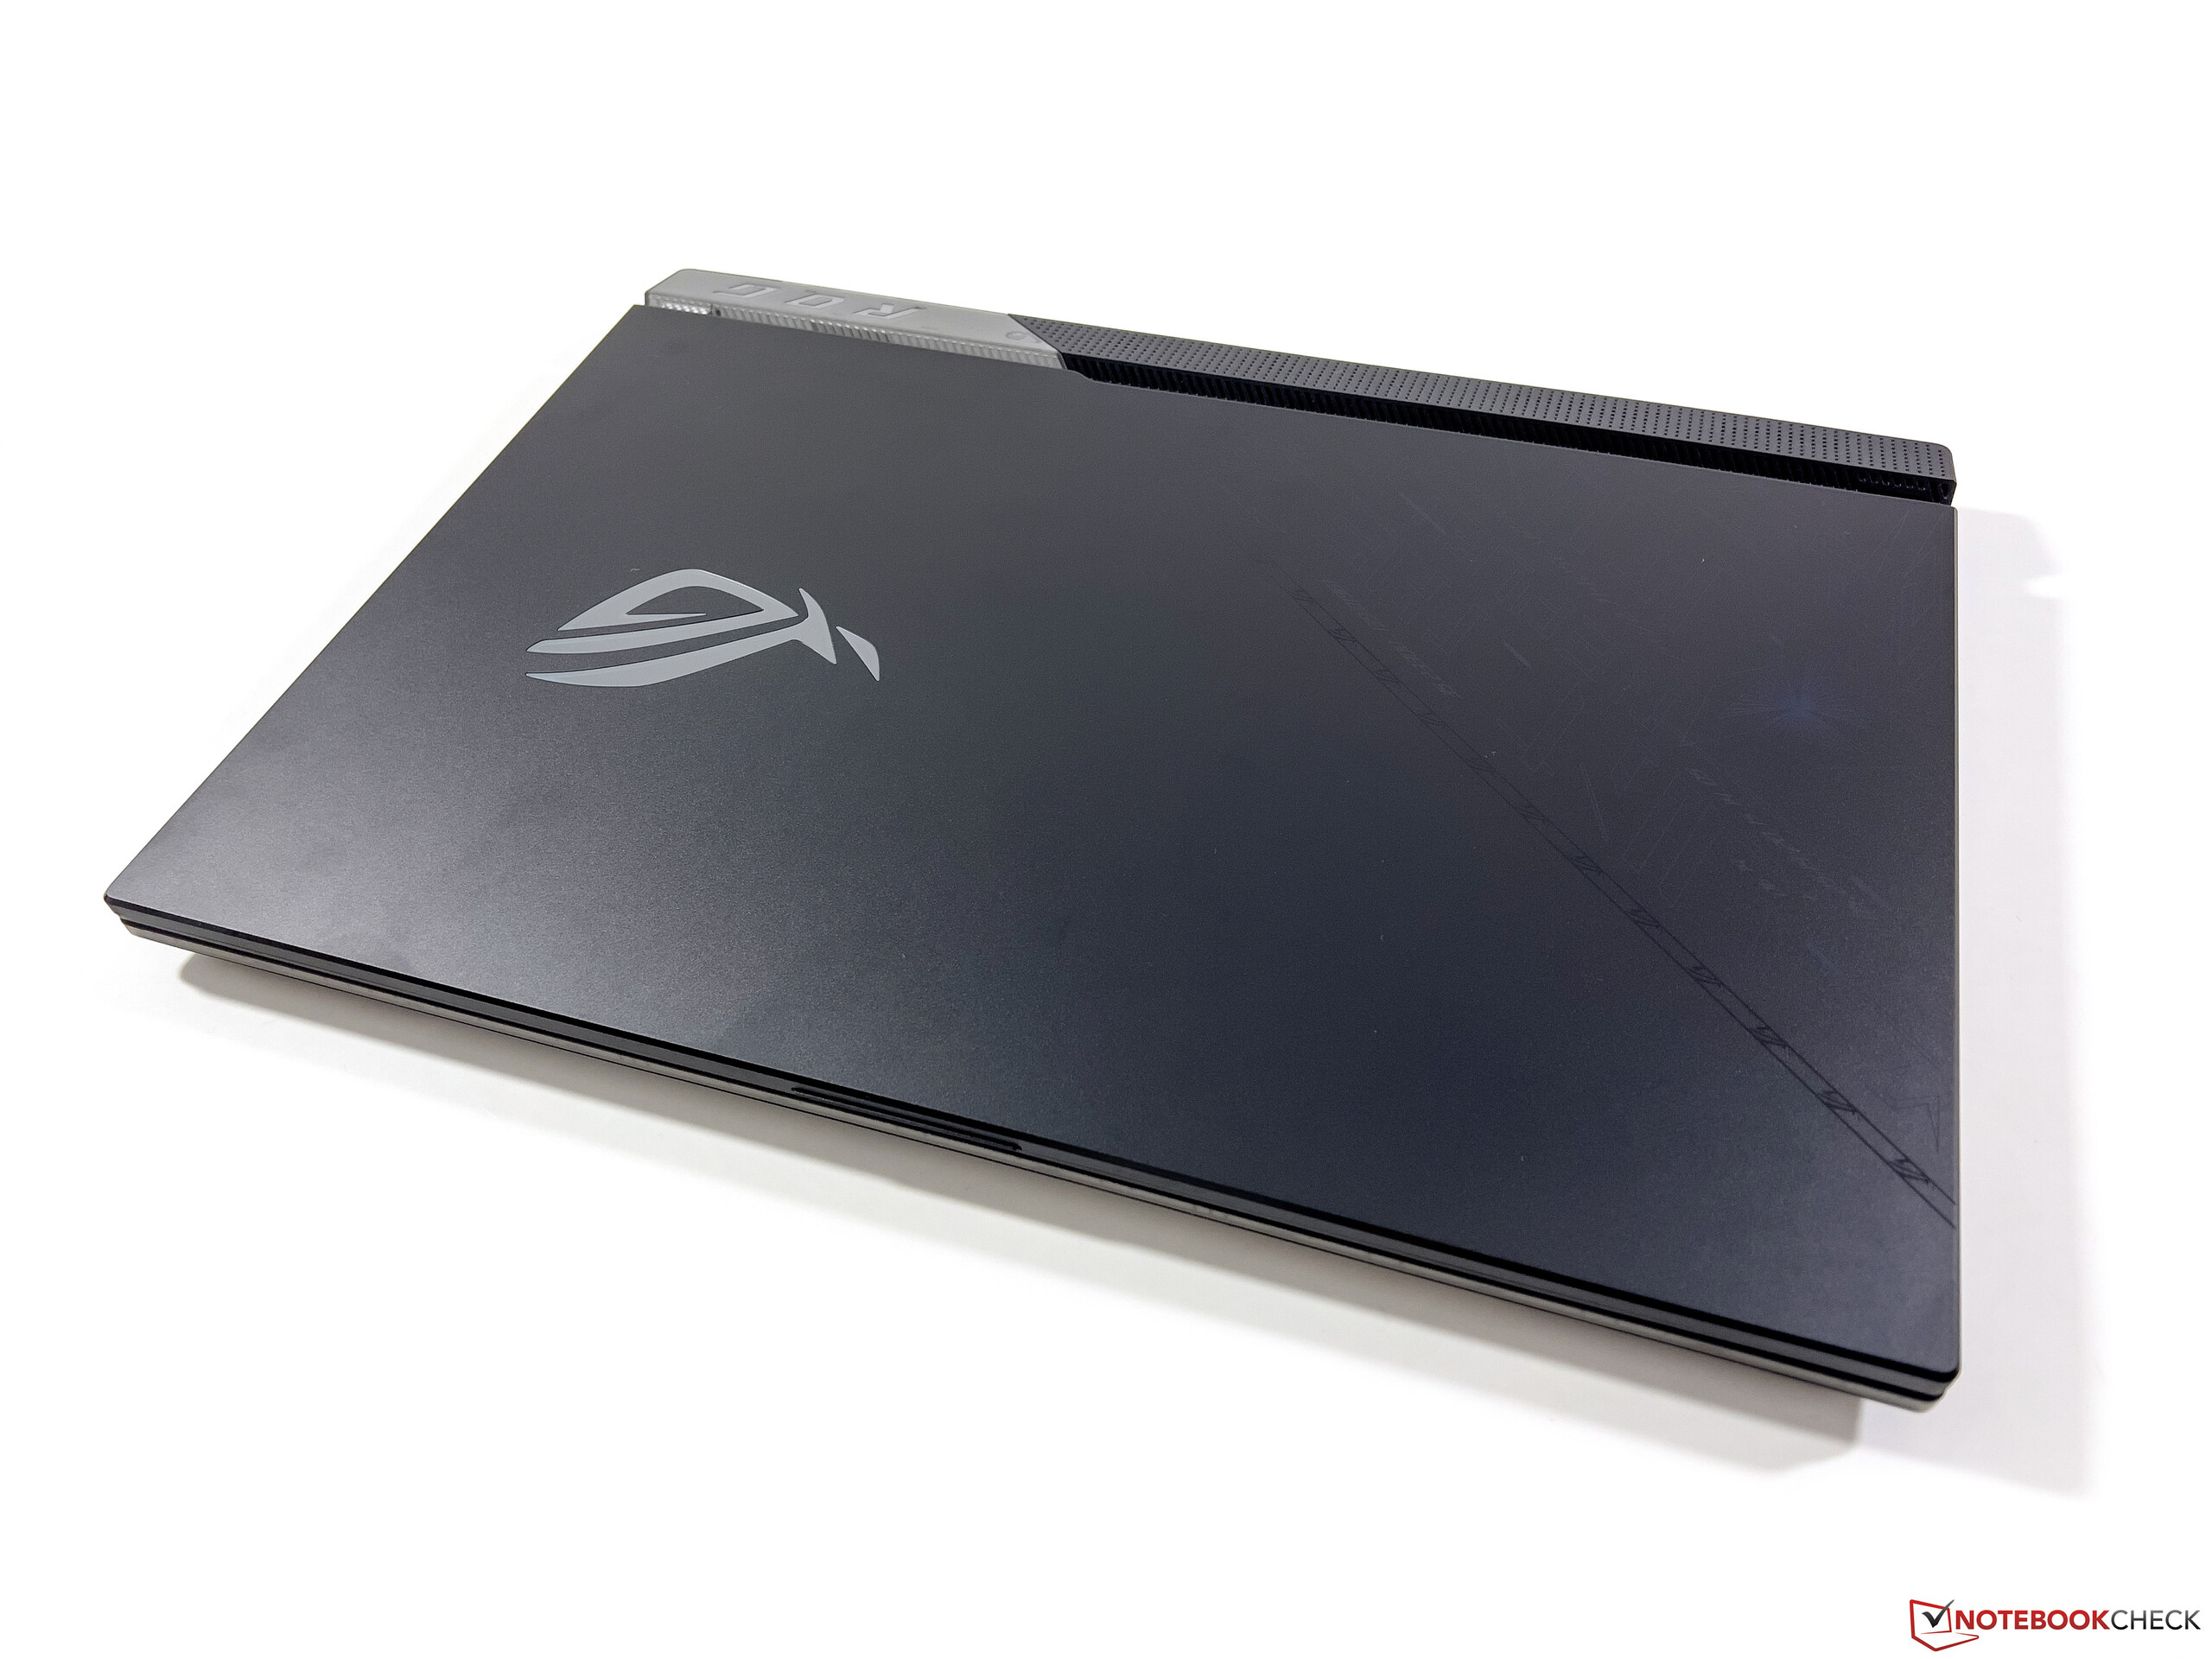
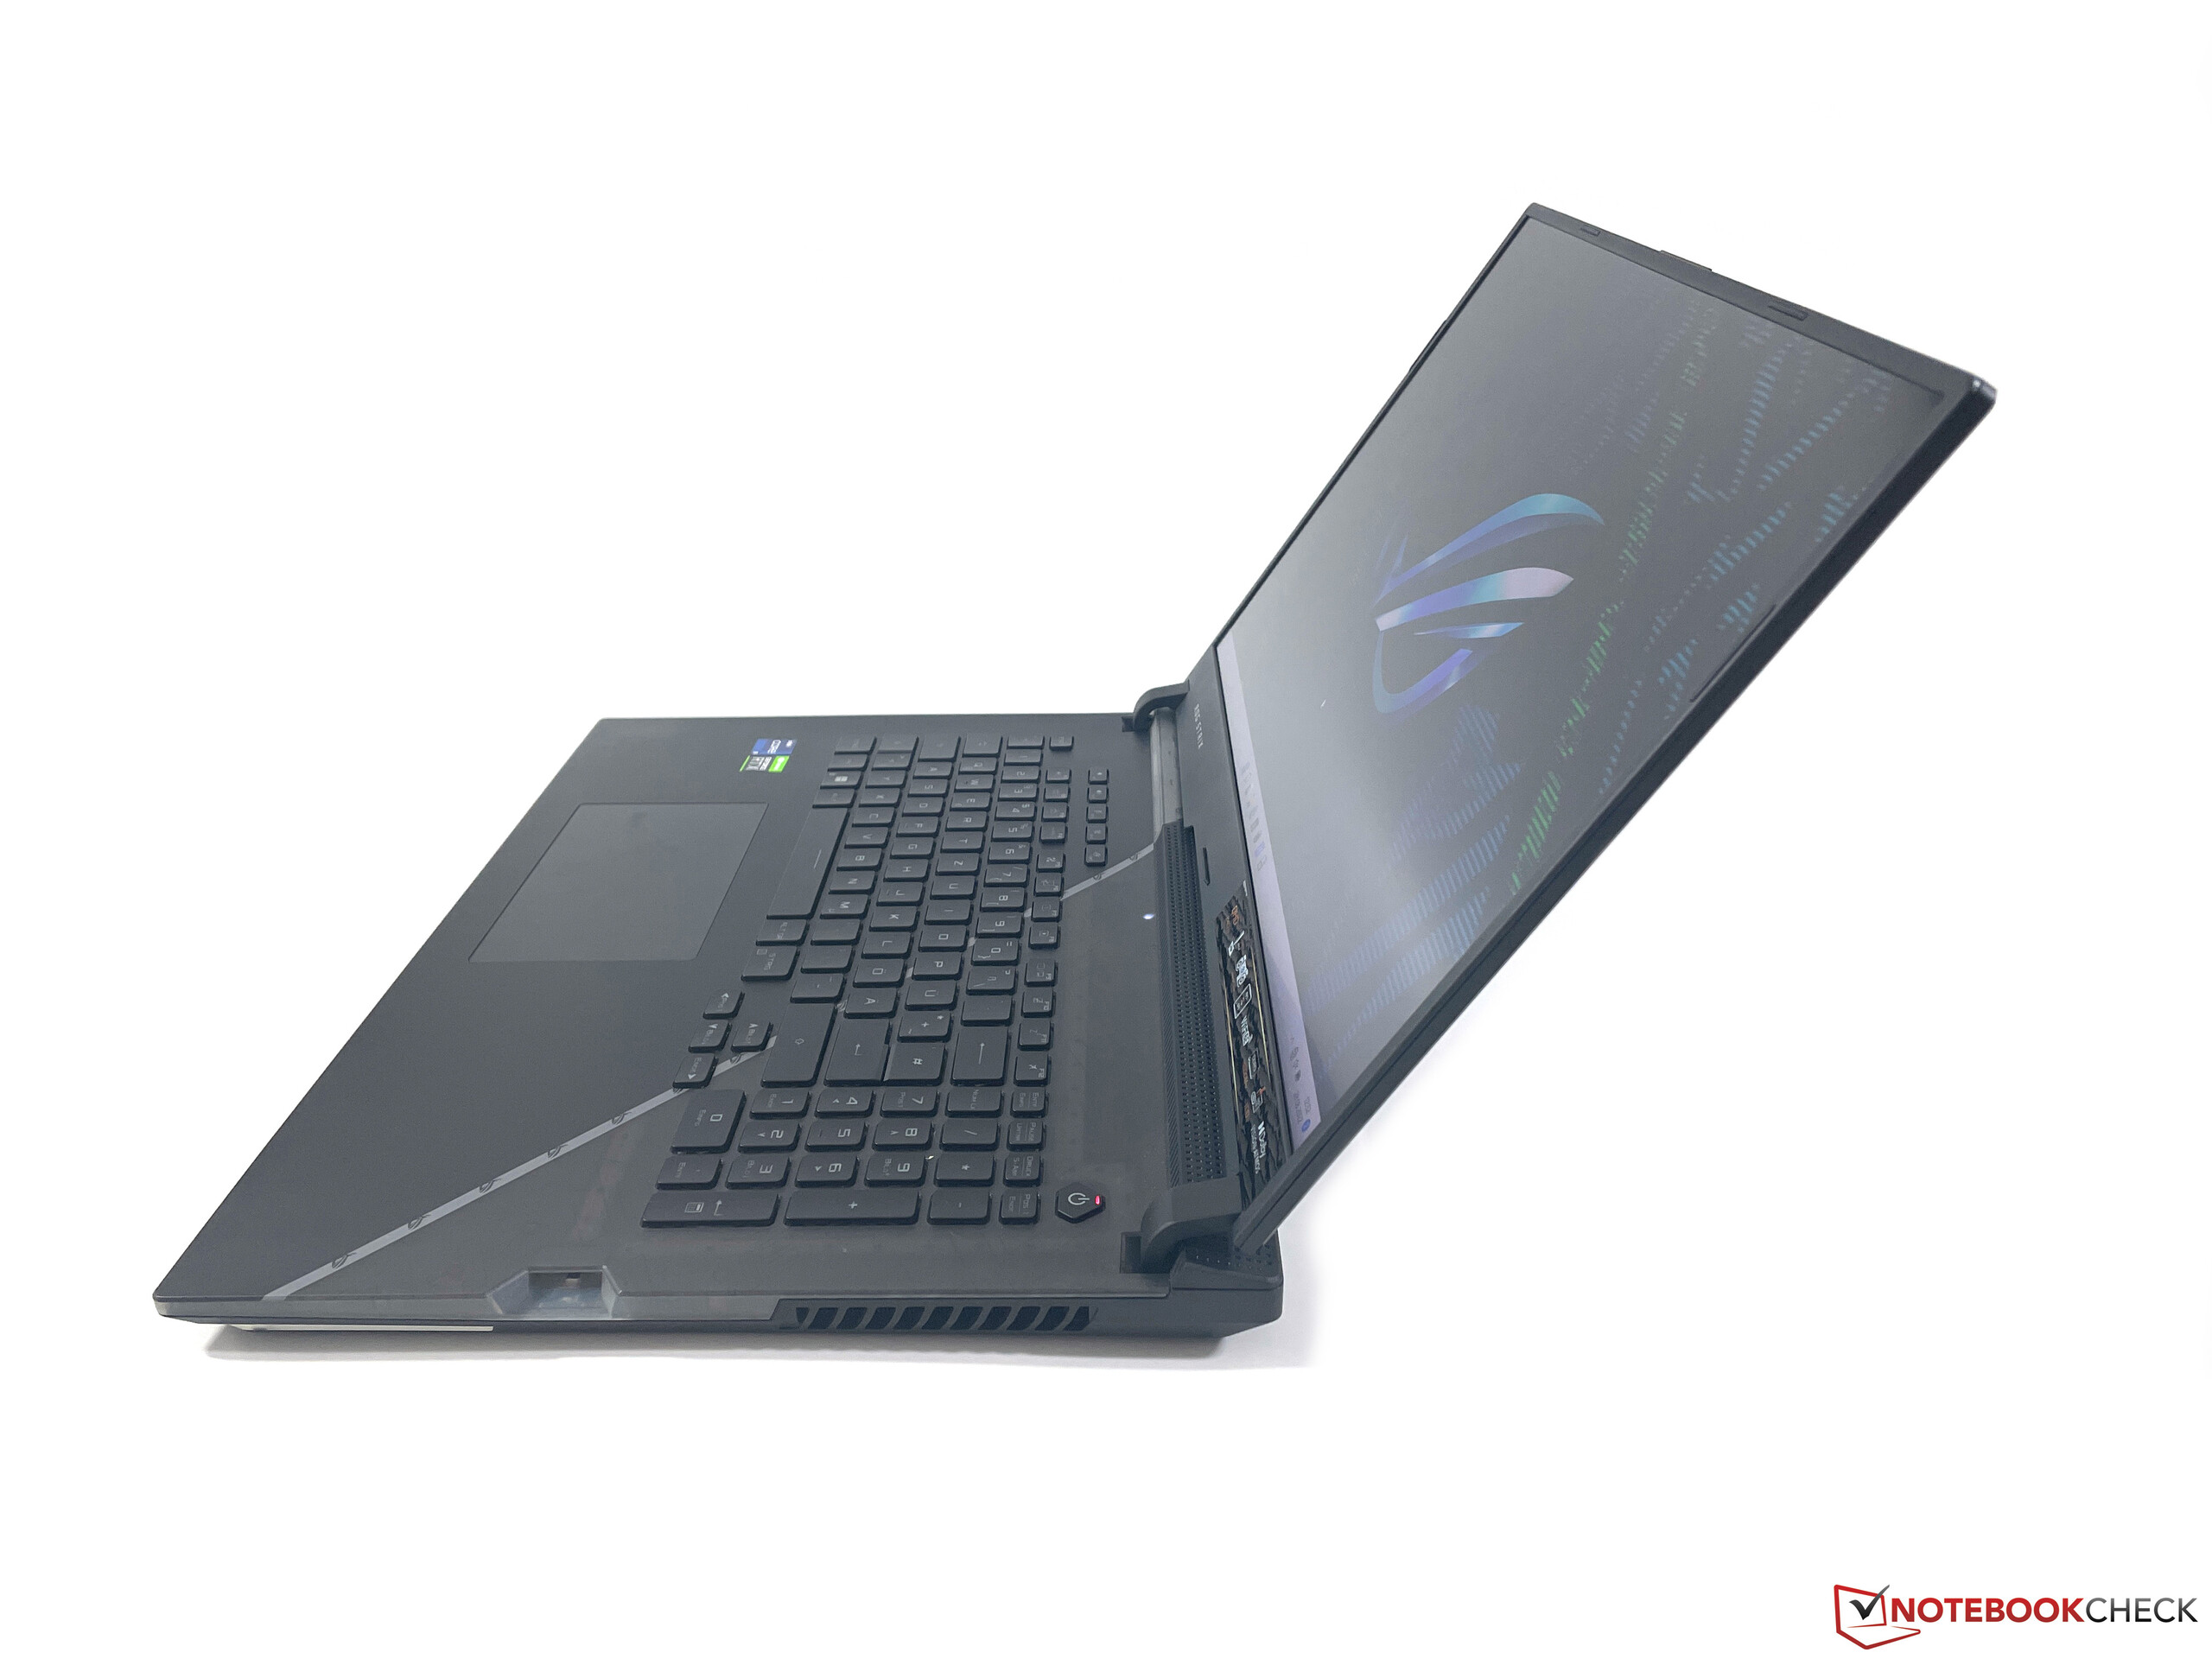
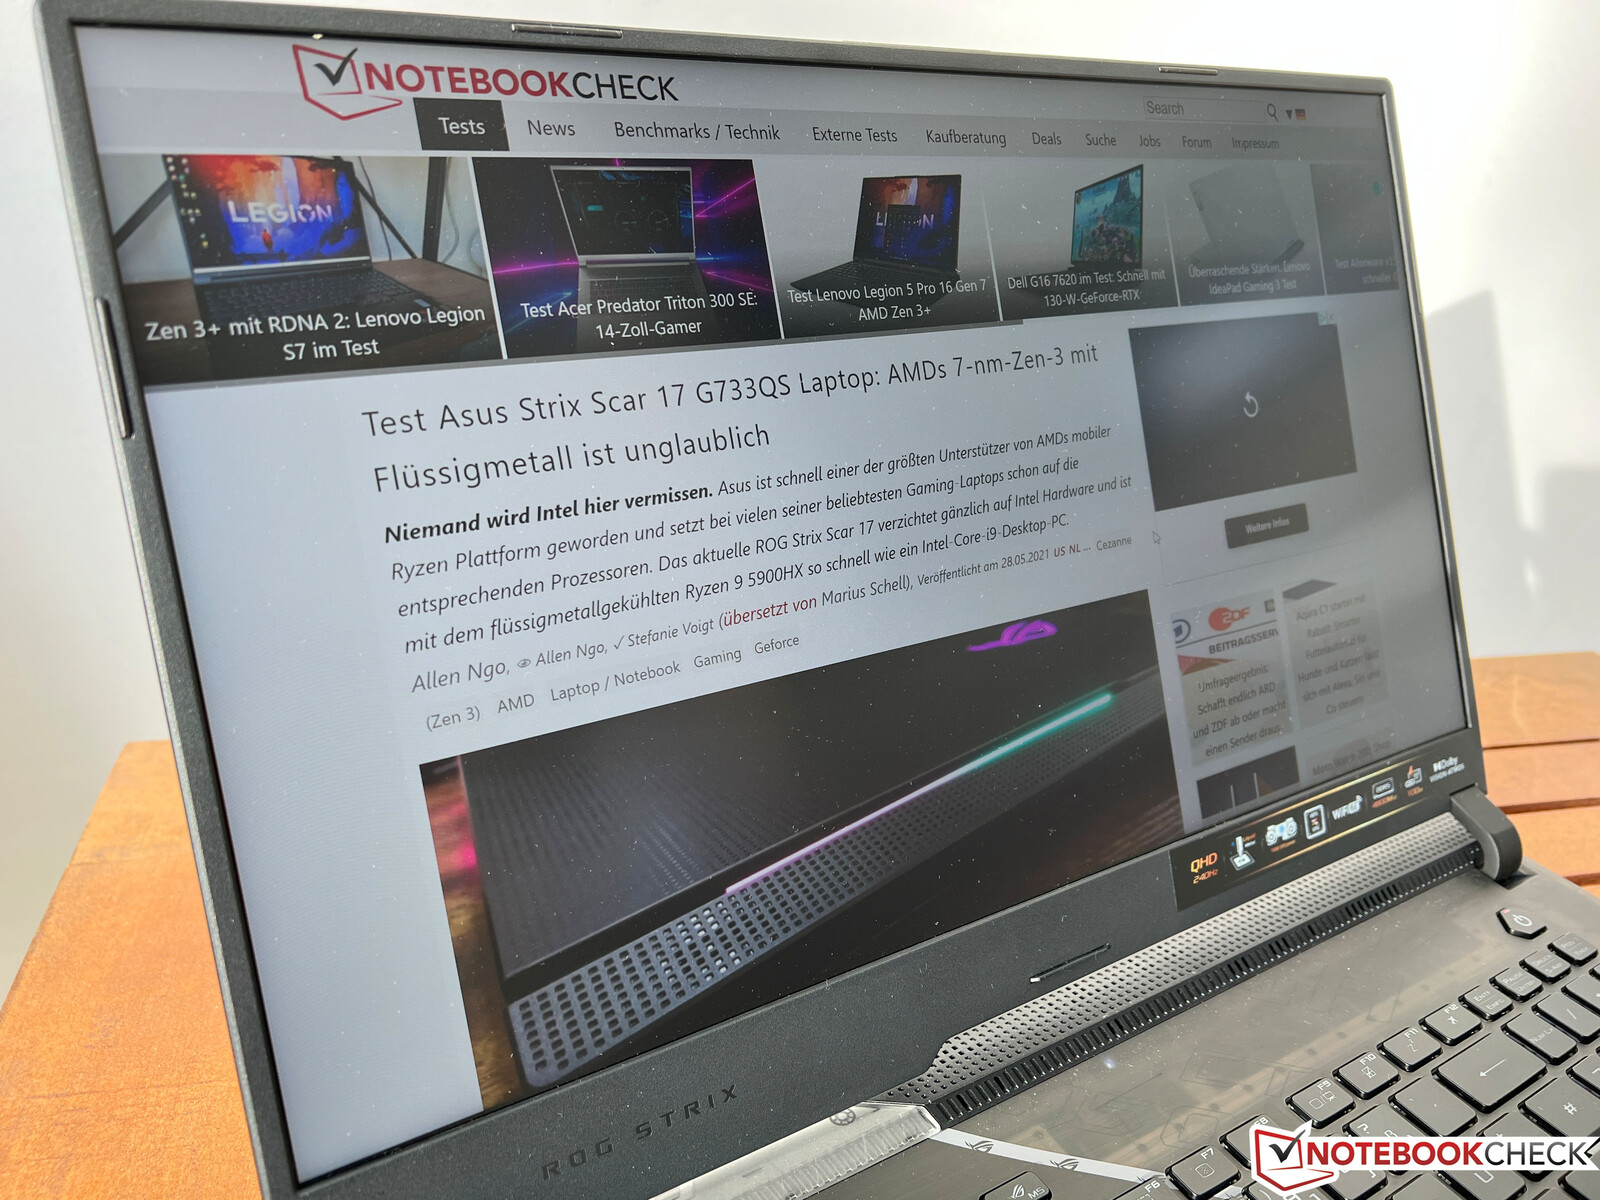
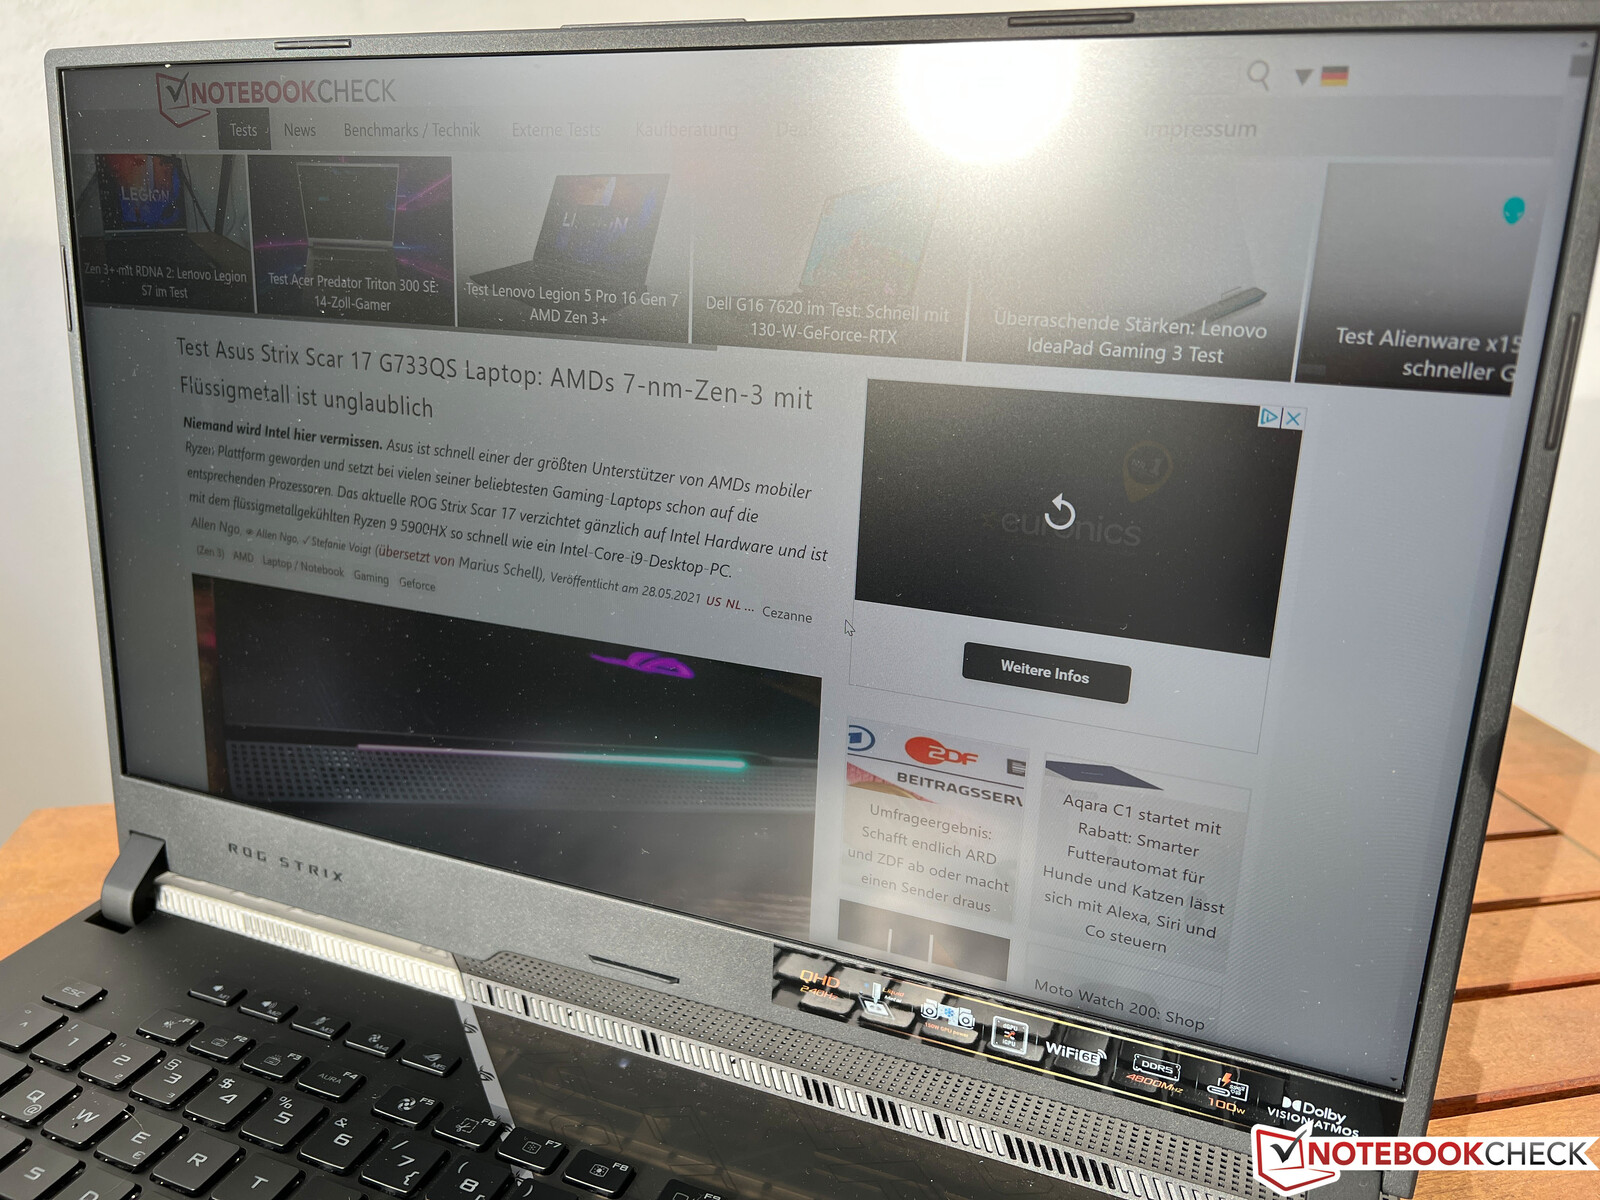
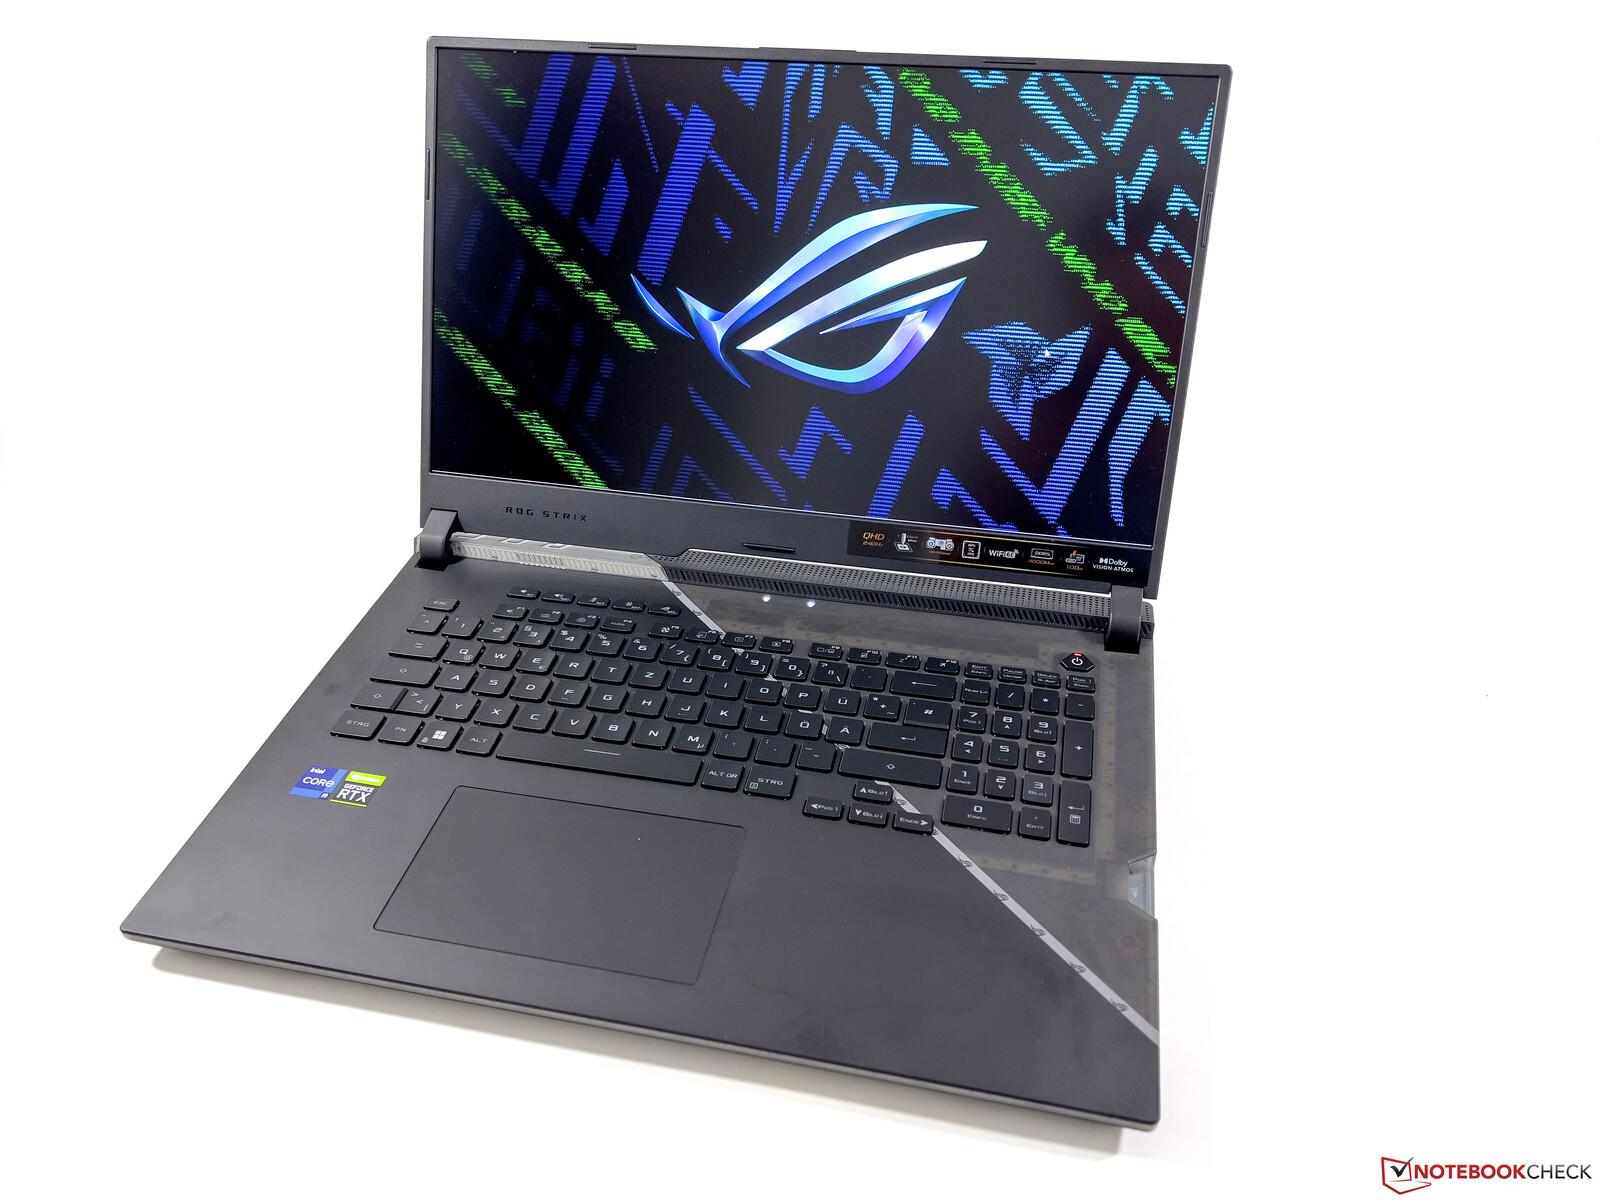
Le ROG Strix Scar 17 est clairement un ordinateur portable de jeu qui ne cache pas du tout ses ambitions. Le boîtier est en grande partie identique au g733QS de l'année dernièreet une partie de l'unité de base est à nouveau transparente. En outre, il y a des éléments largement éclairés et quelques éléments de design ou gadgets supplémentaires, comme l'écriture spéciale sur le couvercle qui ne devient visible que lorsque vous l'éclairez avec une lampe UV
La qualité du boîtier en plastique est bonne dans l'ensemble, même si les surfaces restent sujettes aux traces de doigts et que l'on peut entendre un léger grincement occasionnel lors de l'ouverture de l'écran, par exemple. La stabilité de l'unité de base épaisse est décente, mais vous pouvez toujours appuyer légèrement sur l'unité de base dans la zone centrale du clavier. Bien que le couvercle d'écran relativement mince fasse du bon travail, la charnière n'est toujours pas en mesure d'empêcher un léger flottement après le déplacement de l'ordinateur portable, par exemple.
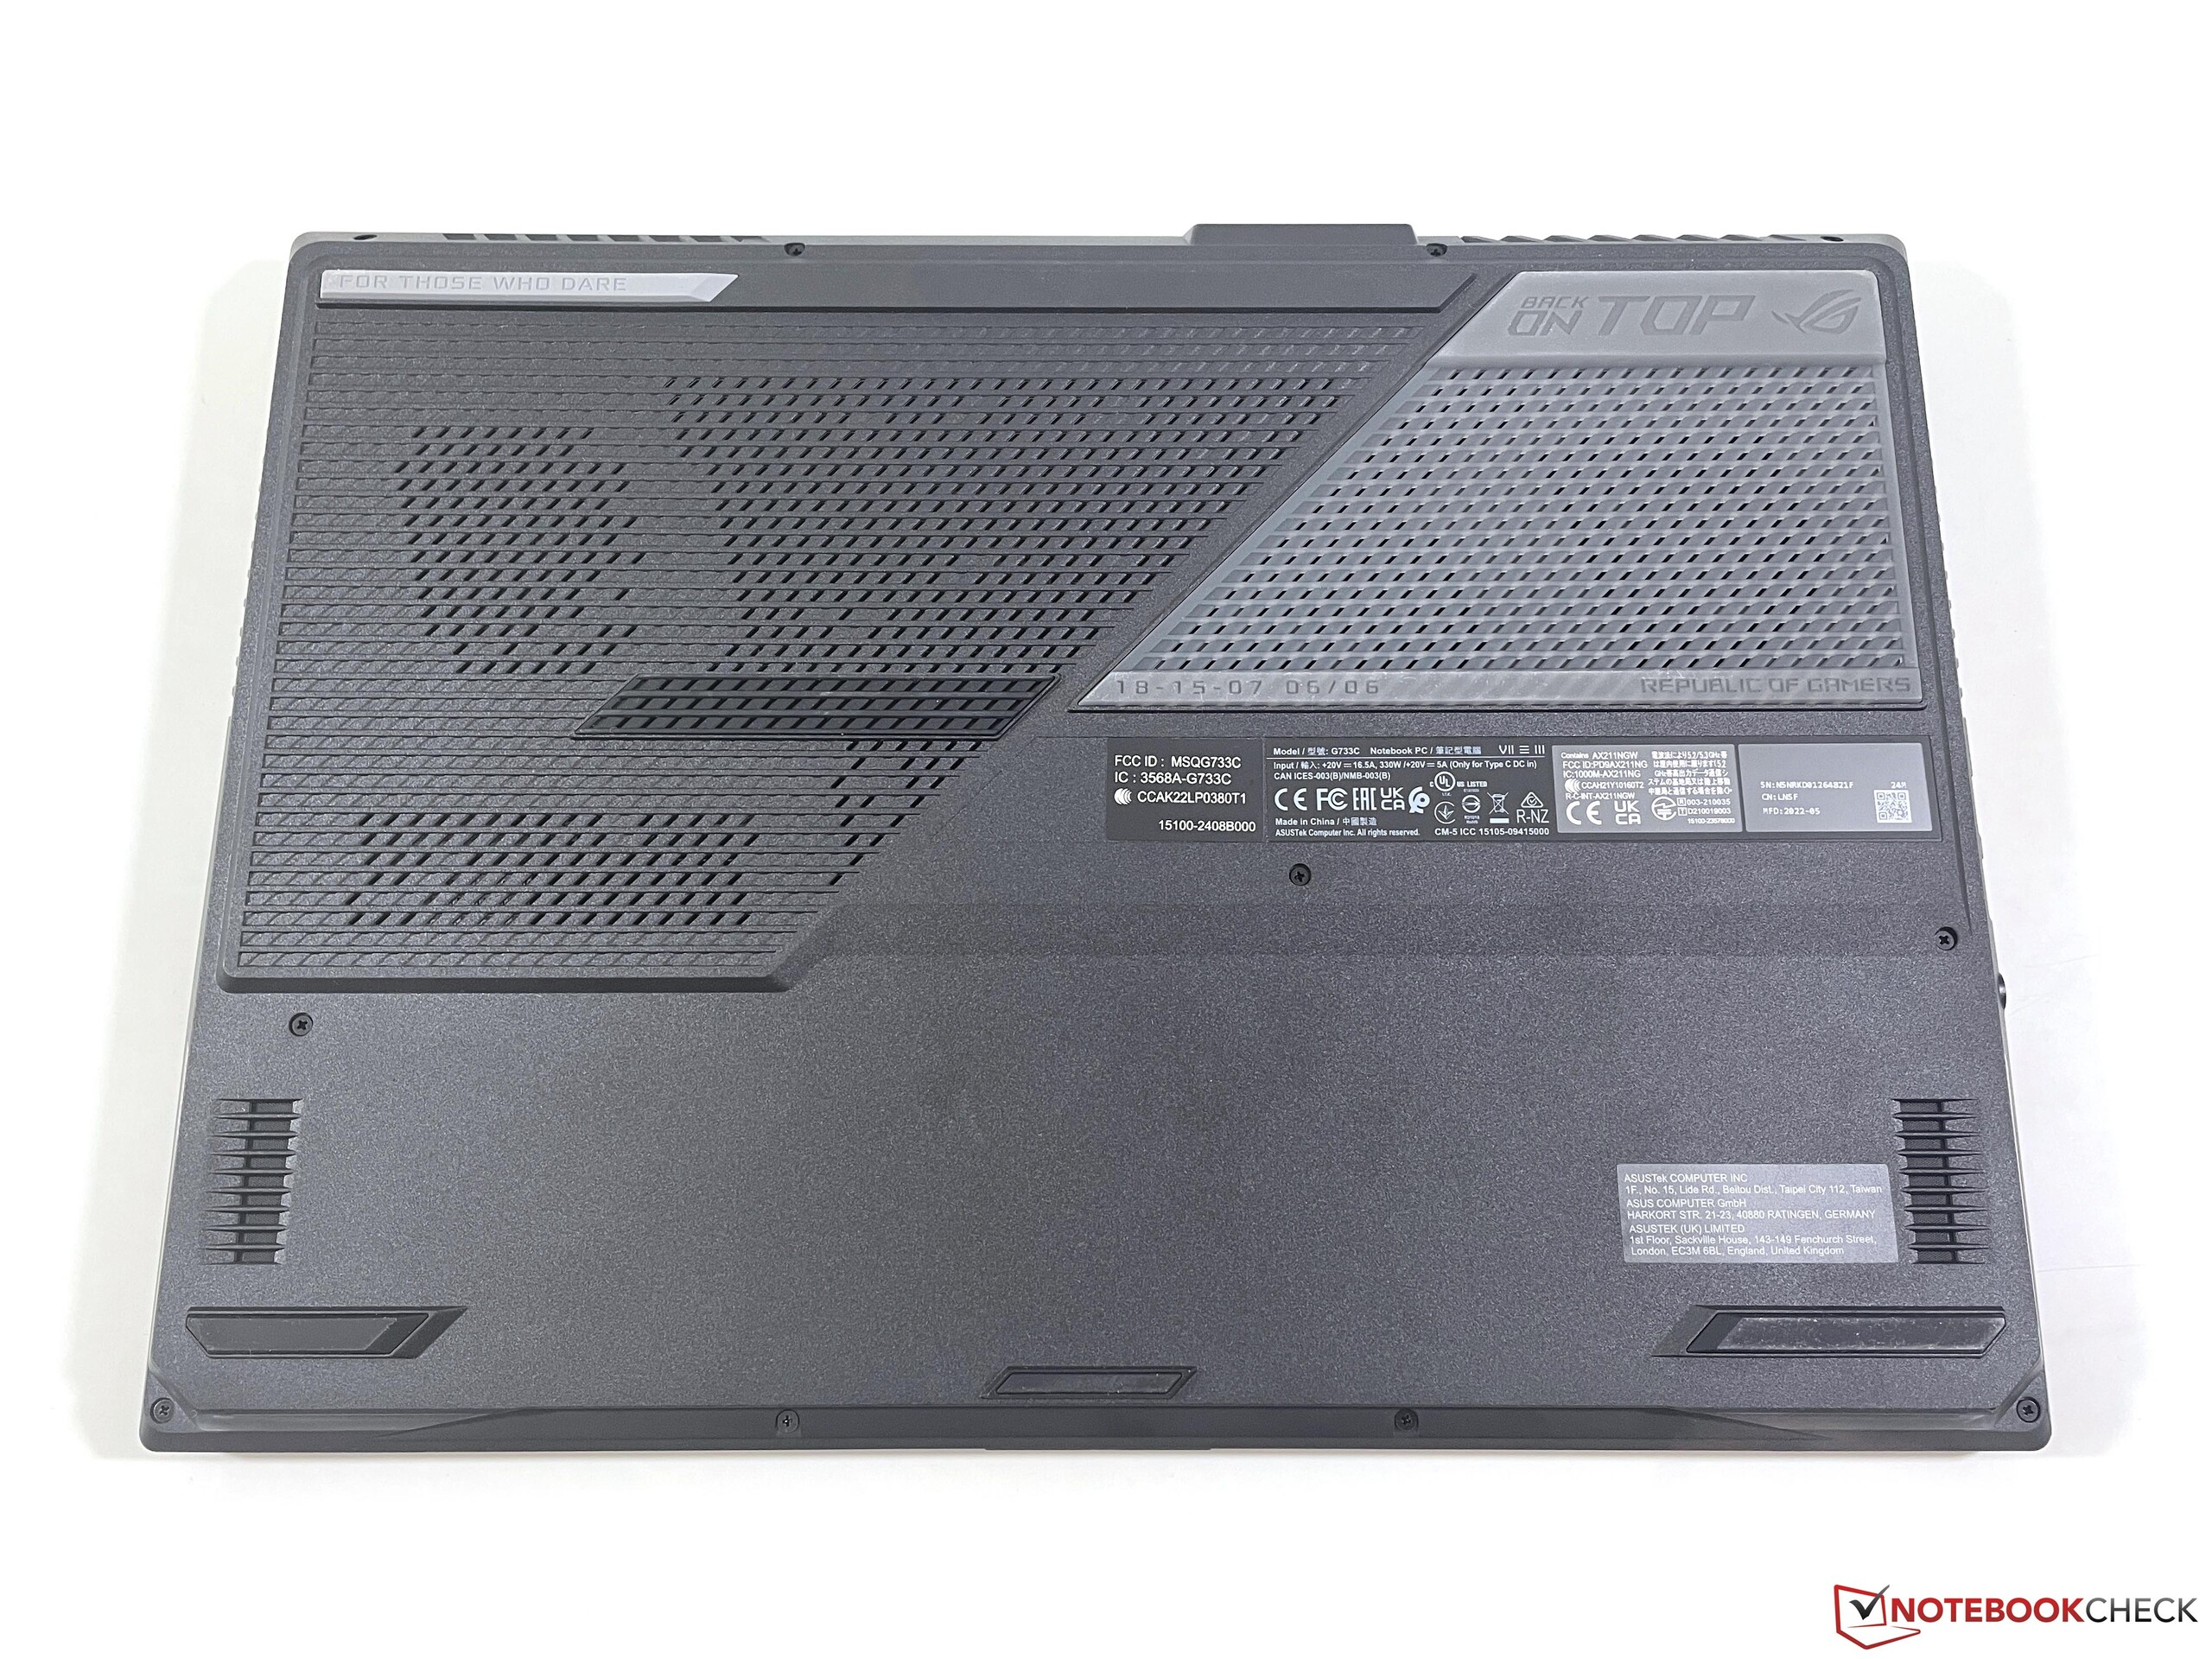
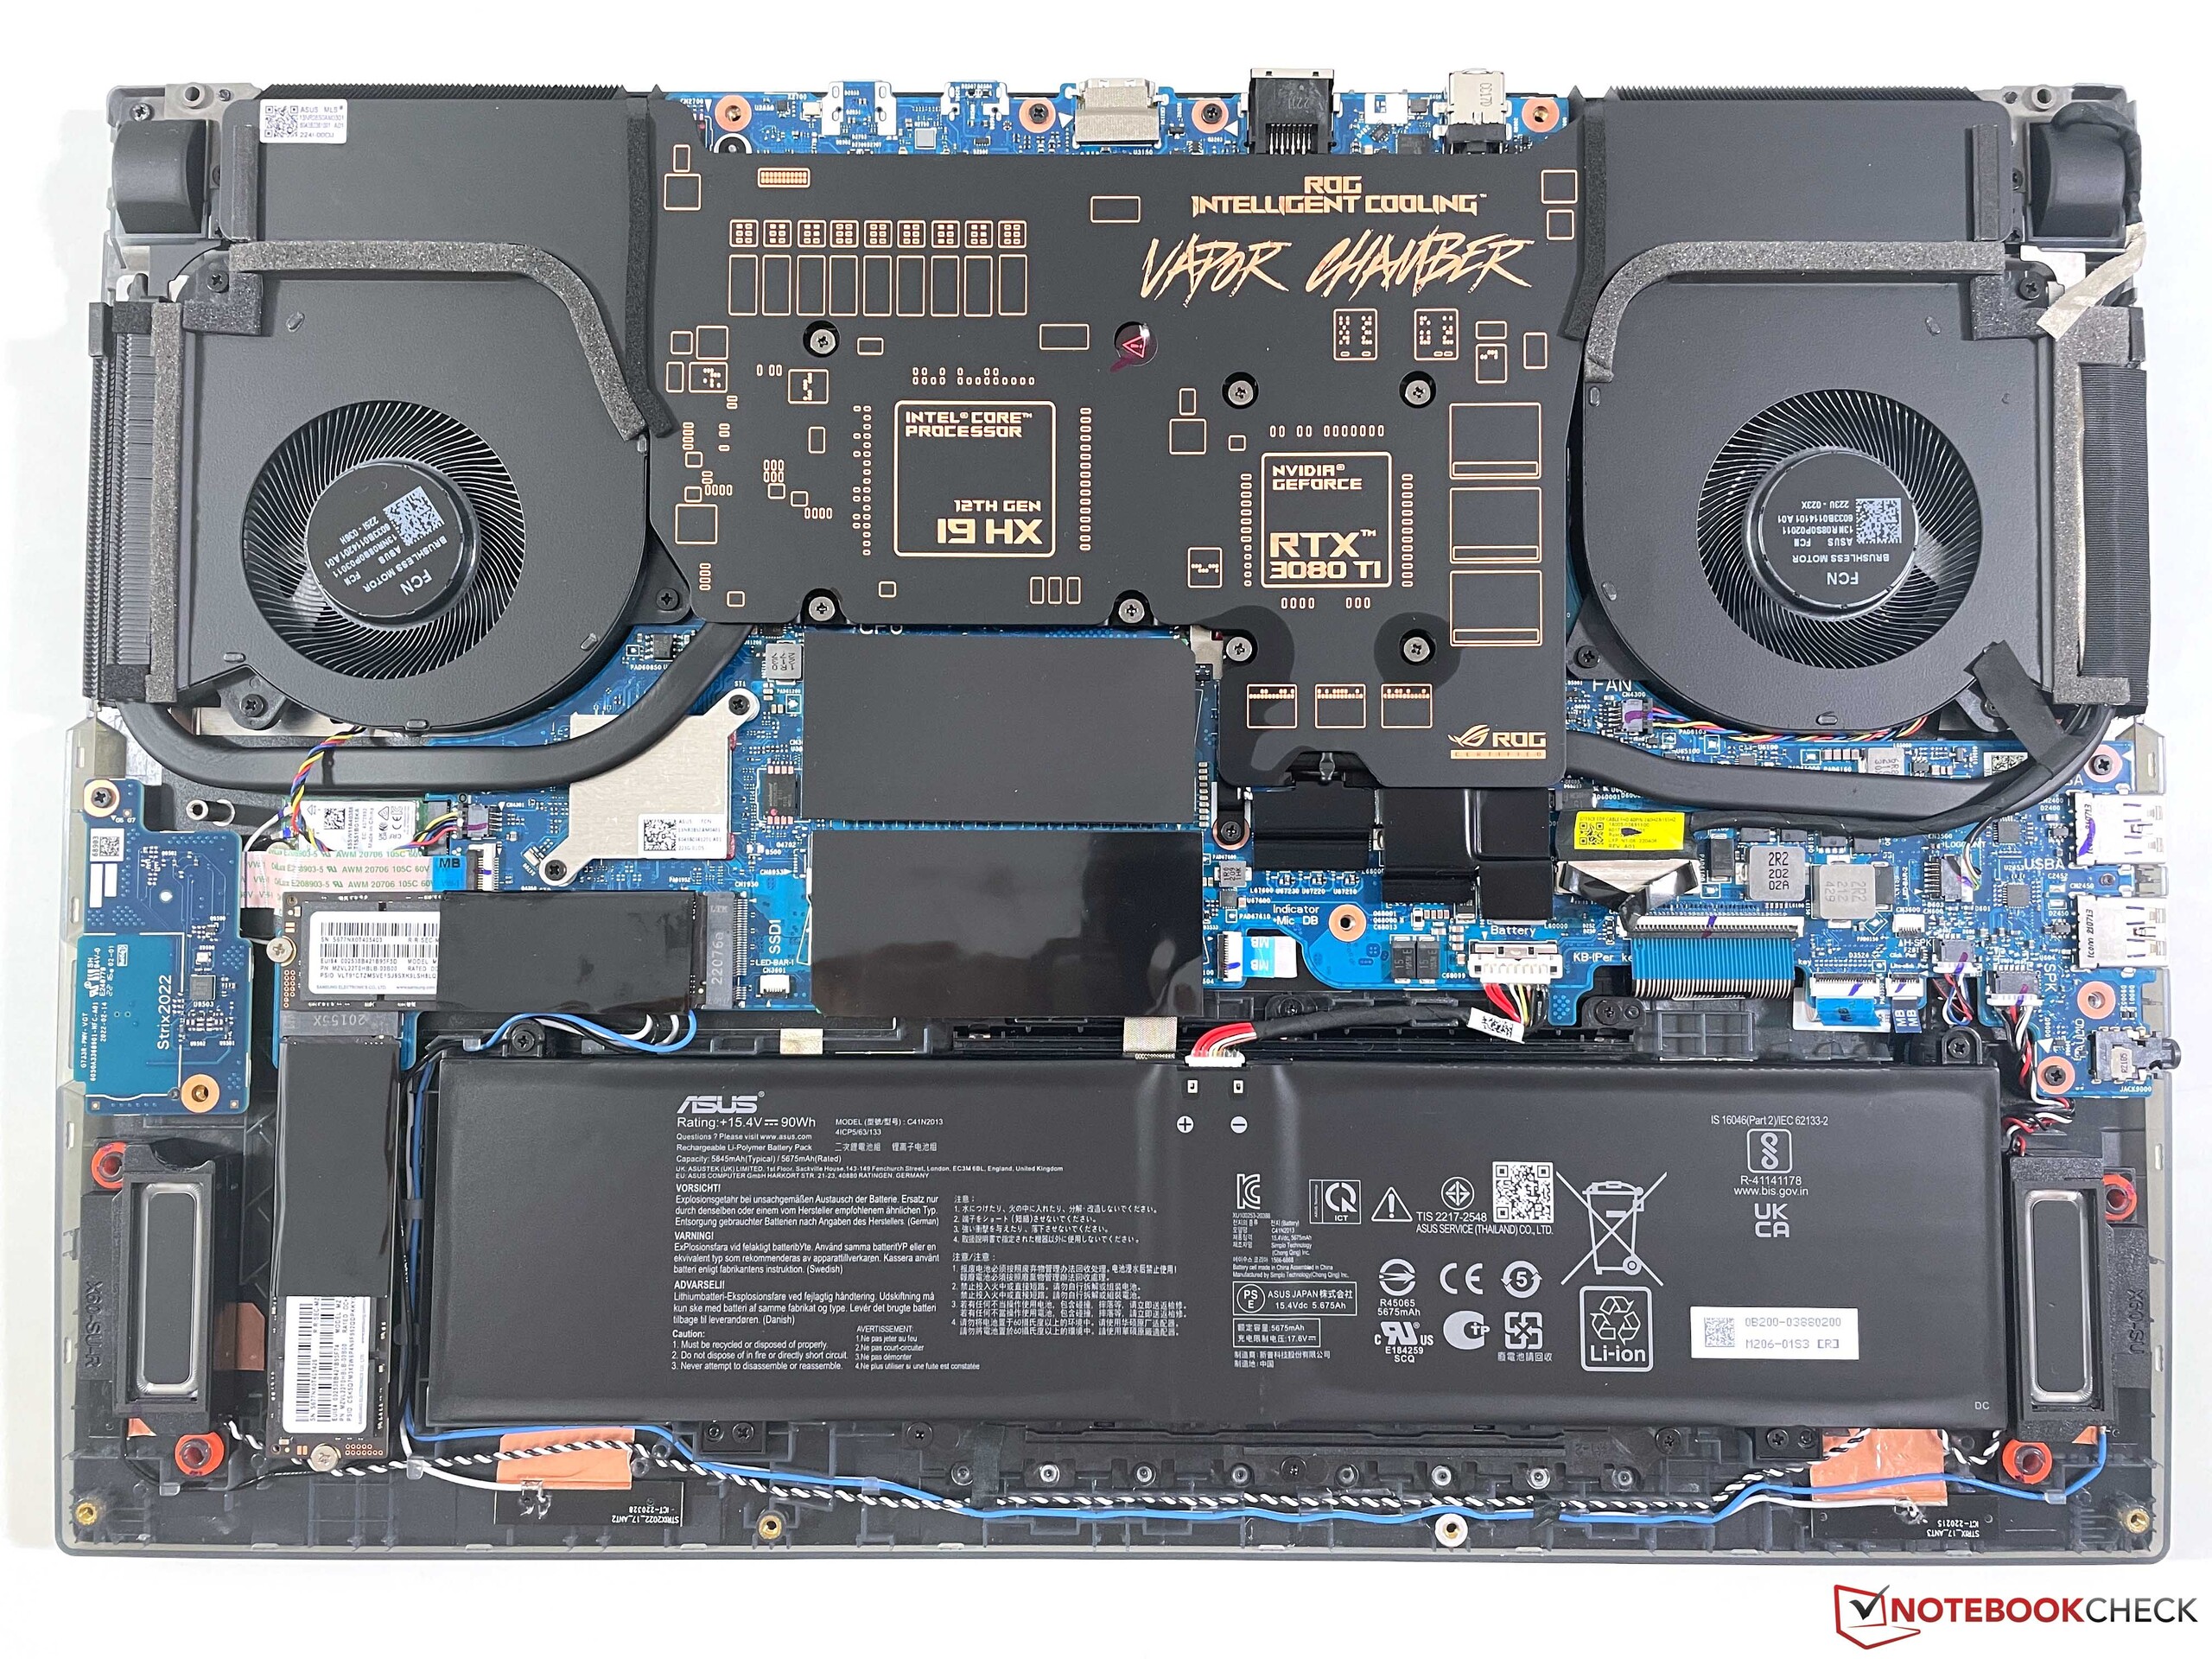
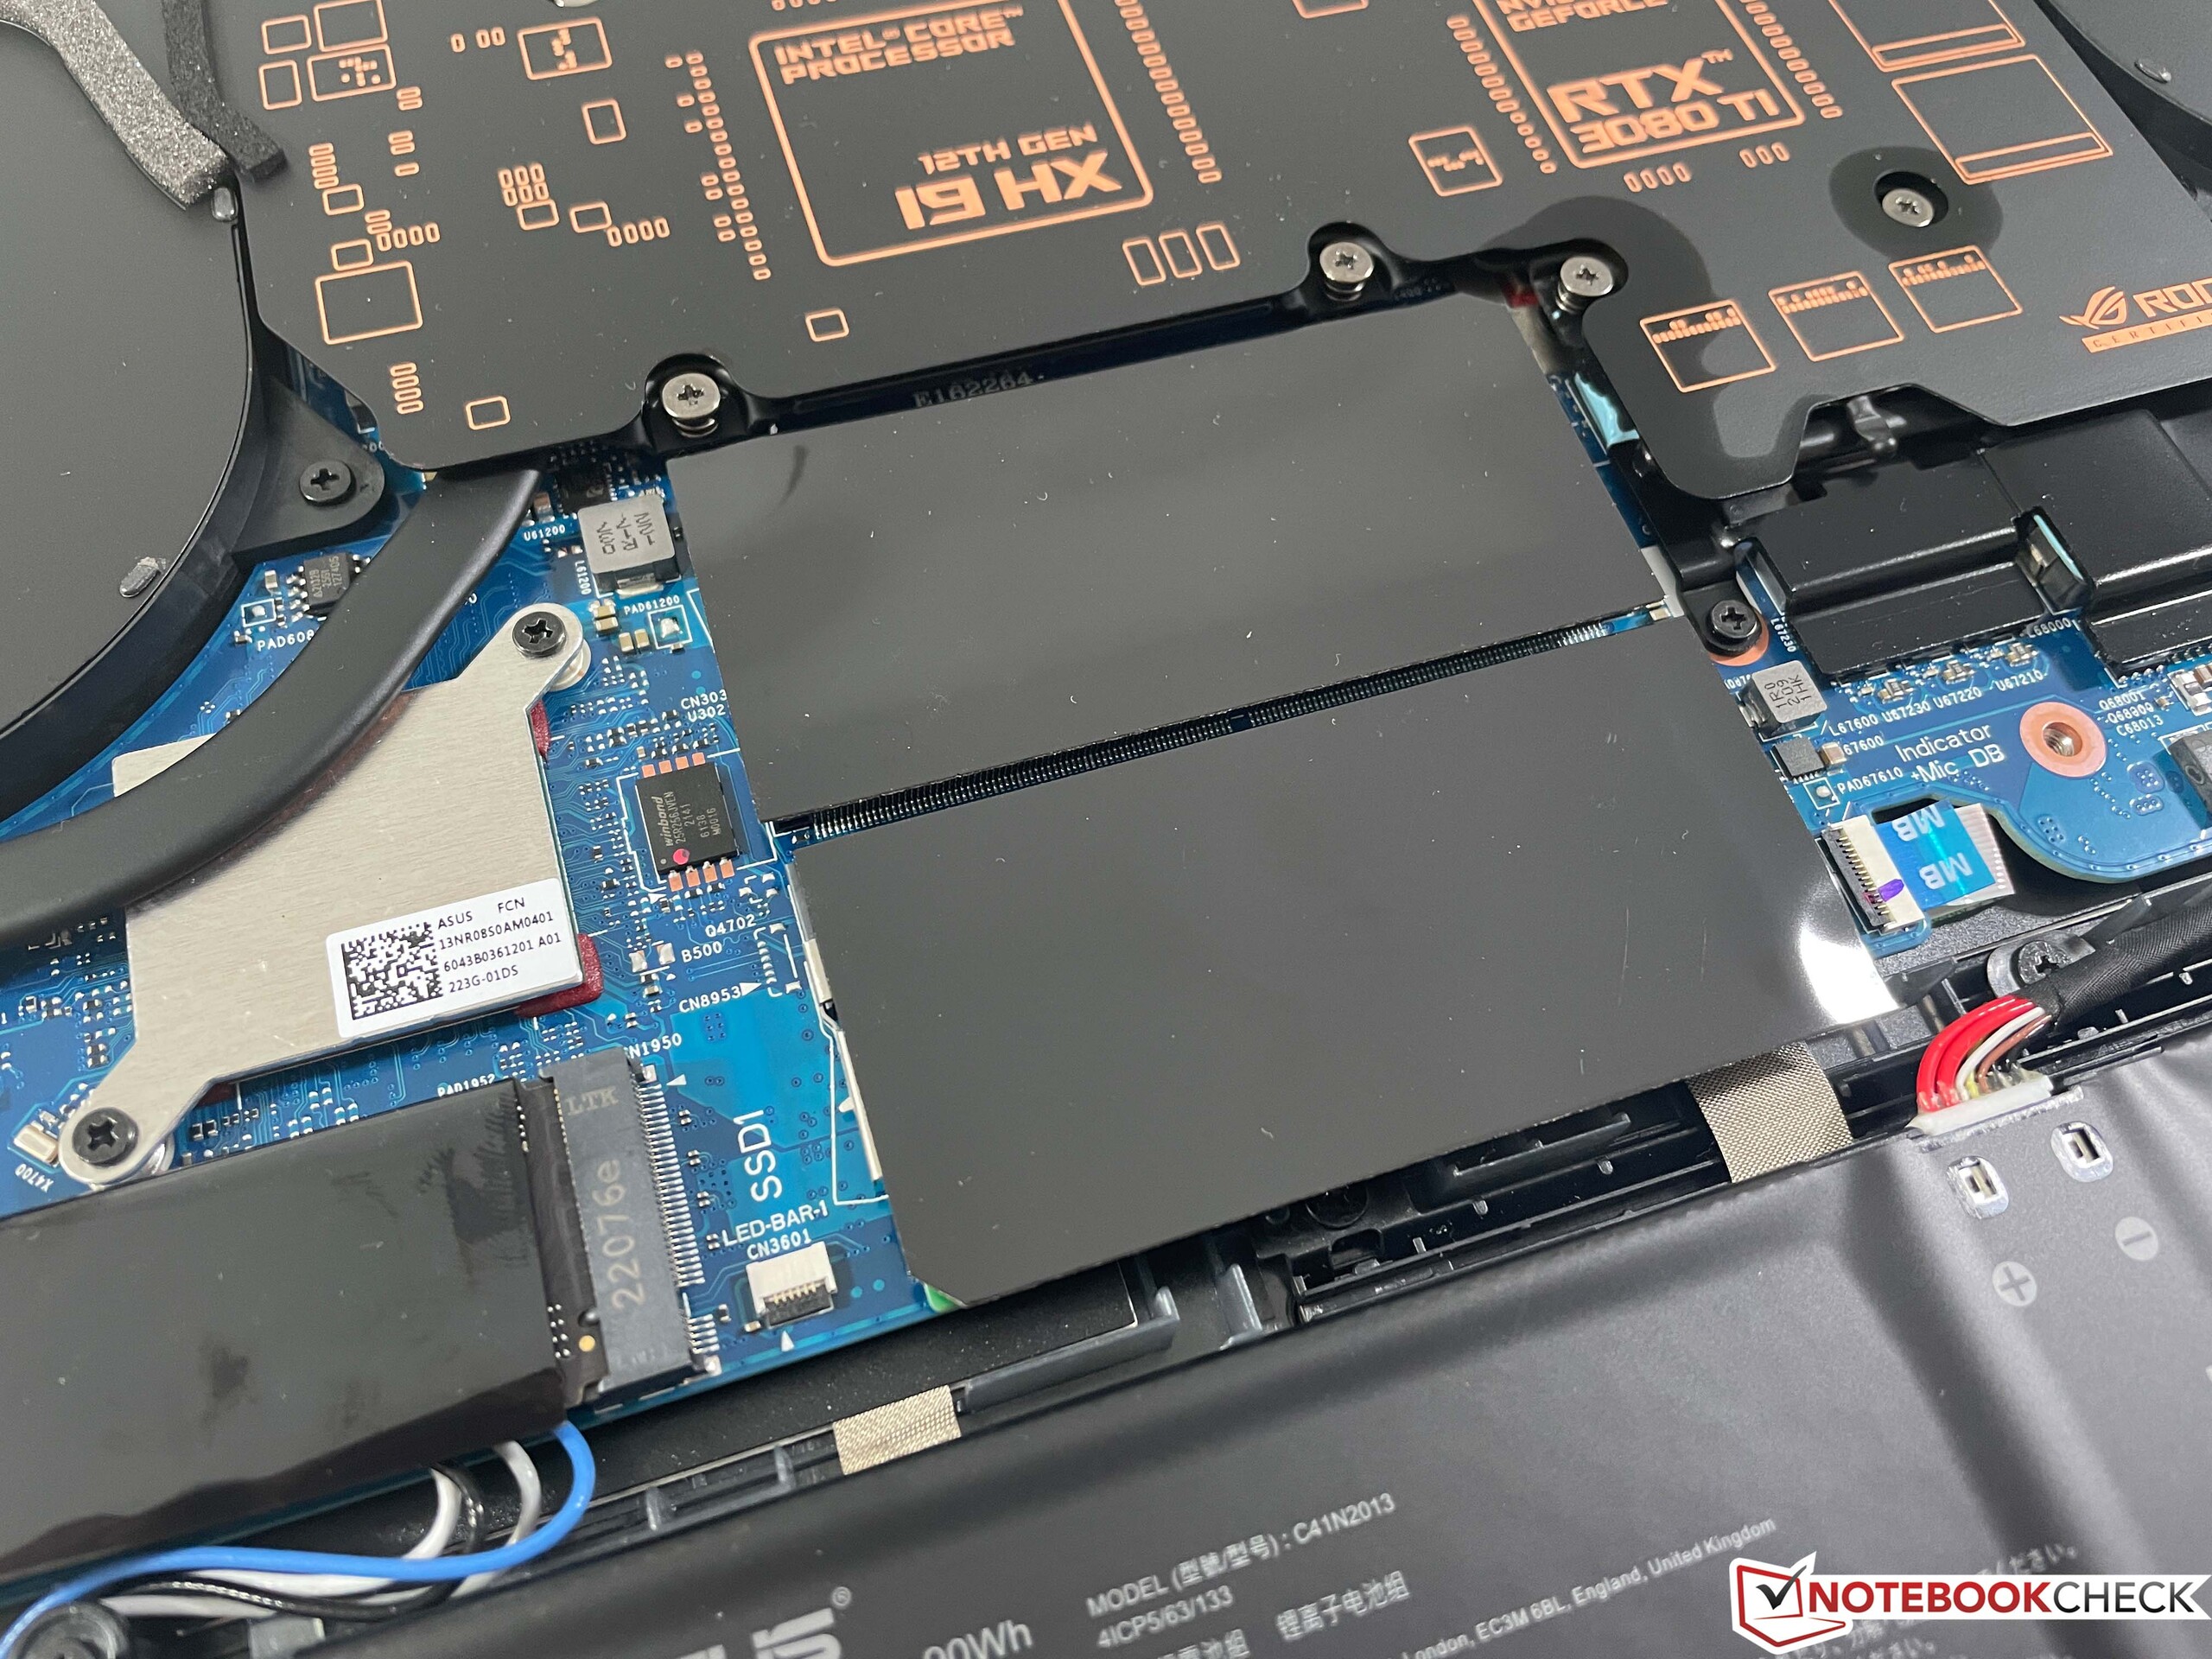
Même si le couvercle inférieur du boîtier peut être retiré, il faut être prudent. L'éclairage étant intégré à la pièce, il faut d'abord débrancher deux petits câbles plats, avant de pouvoir retirer le couvercle. Avec un accès aux ventilateurs, aux deux SSD, aux deux modules de RAM et au module WLAN, les possibilités de maintenance sont bonnes.
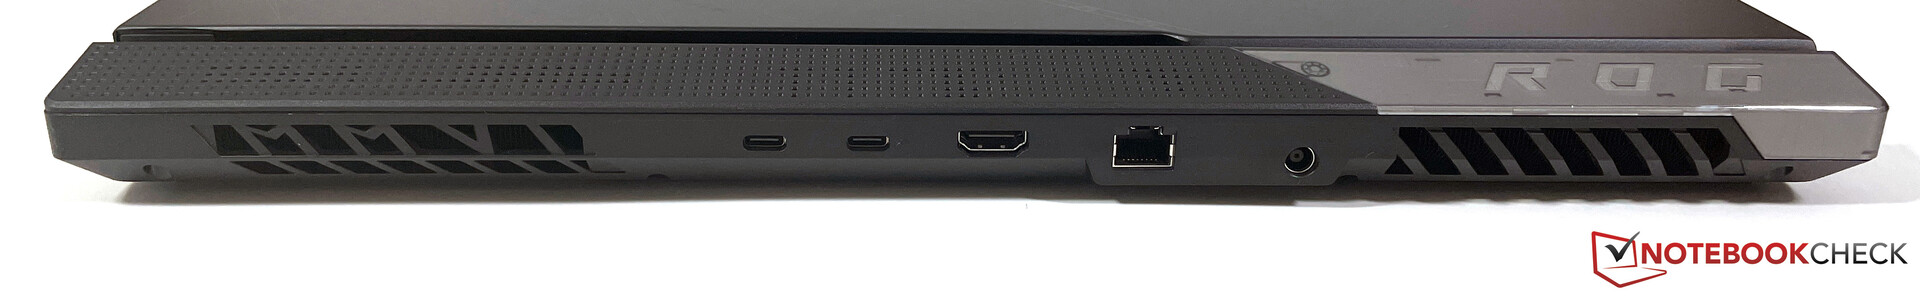
Équipement - ROG Strix Scar 17 avec HDMI 2.1 et Wi-Fi 6E
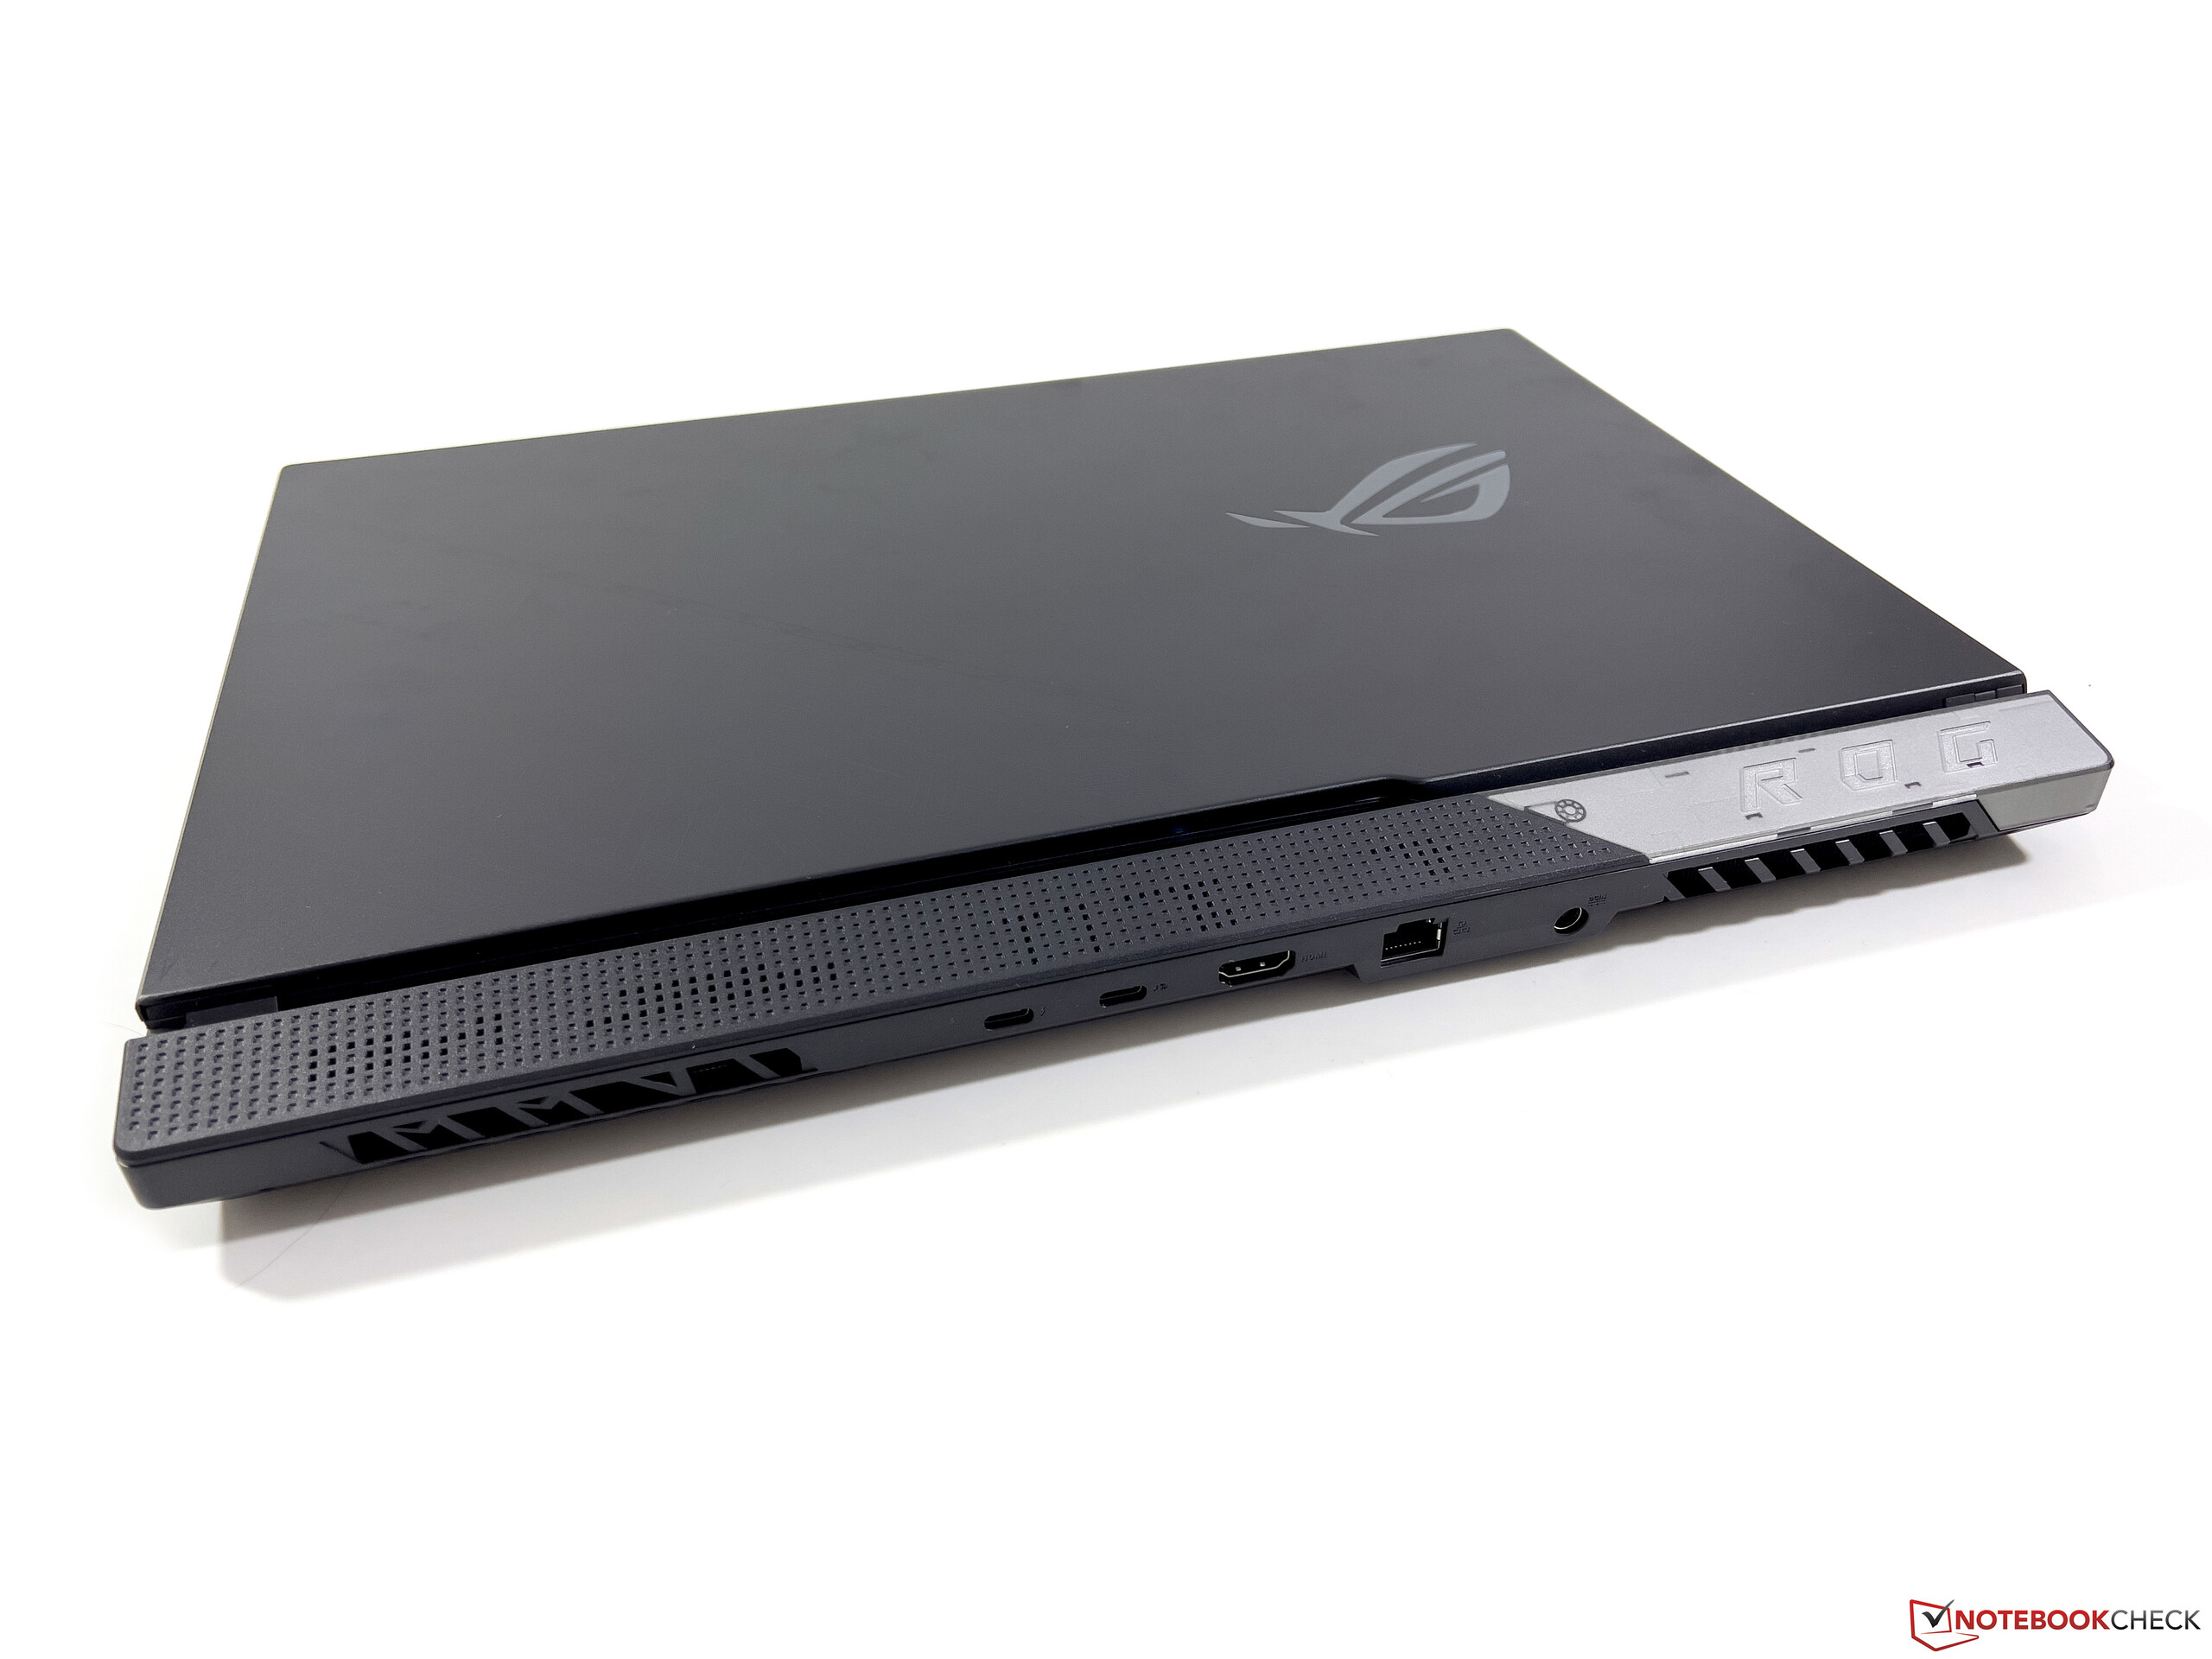
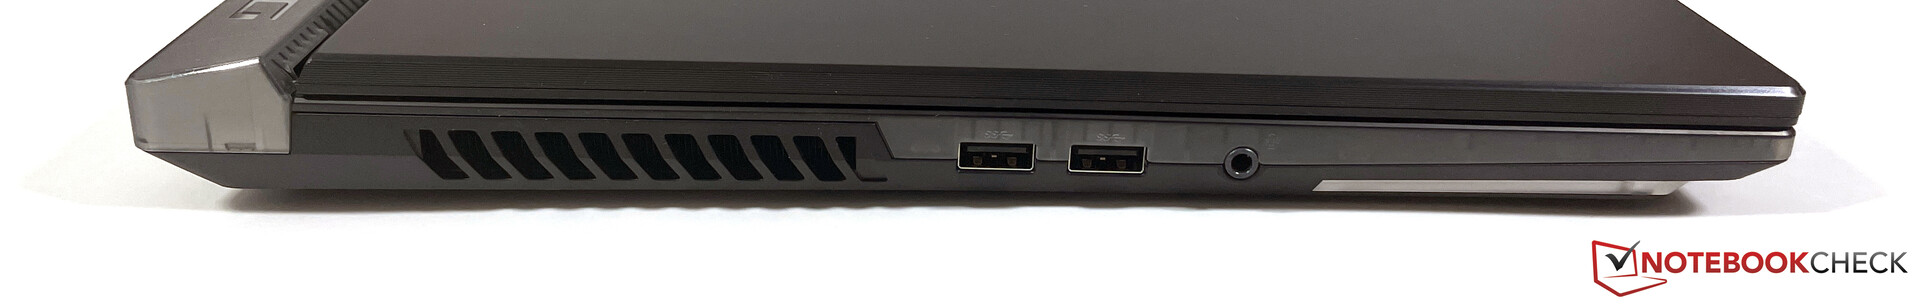
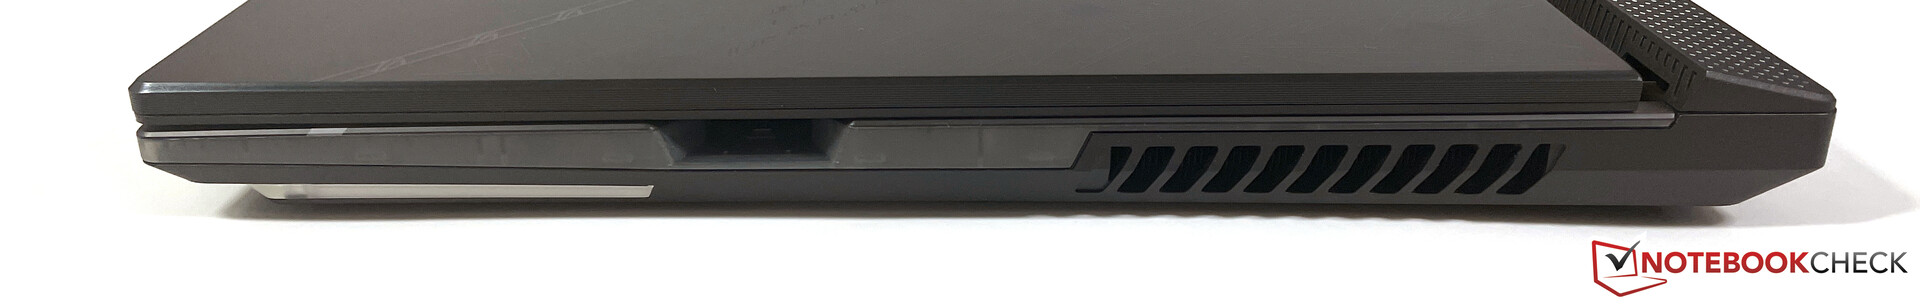
En plus d'une connexion Thunderbolt, le G733CX offre un port HDMI 2.1, et le port USB à l'arrière peut également être utilisé pour la recharge sur la route (max. 100 watts). La plupart des connexions se trouvent à l'arrière, et vous ne trouverez que deux ports USB-A ordinaires et le port audio 3,5 mm sur le côté gauche. Le côté droit offre également un emplacement pour Asus Keystone, qui vous permet de stocker les paramètres et les données du système.
La performance WLAN avec Intel AX211 est très bonne, et nous avons également pu nous connecter au réseau 6-GHz de notre routeur de référence Asus sans aucun problème. Une connexion Ethernet de 2,5 Gbit/s est également disponible pour les connexions filaires. Les utilisateurs du ROG Strix Scar 17 doivent se passer de webcam, mais si nécessaire, le fabricant propose une webcam externe correspondante (ROG Eye S).
Périphériques d'entrée - Asus avec un bon clavier
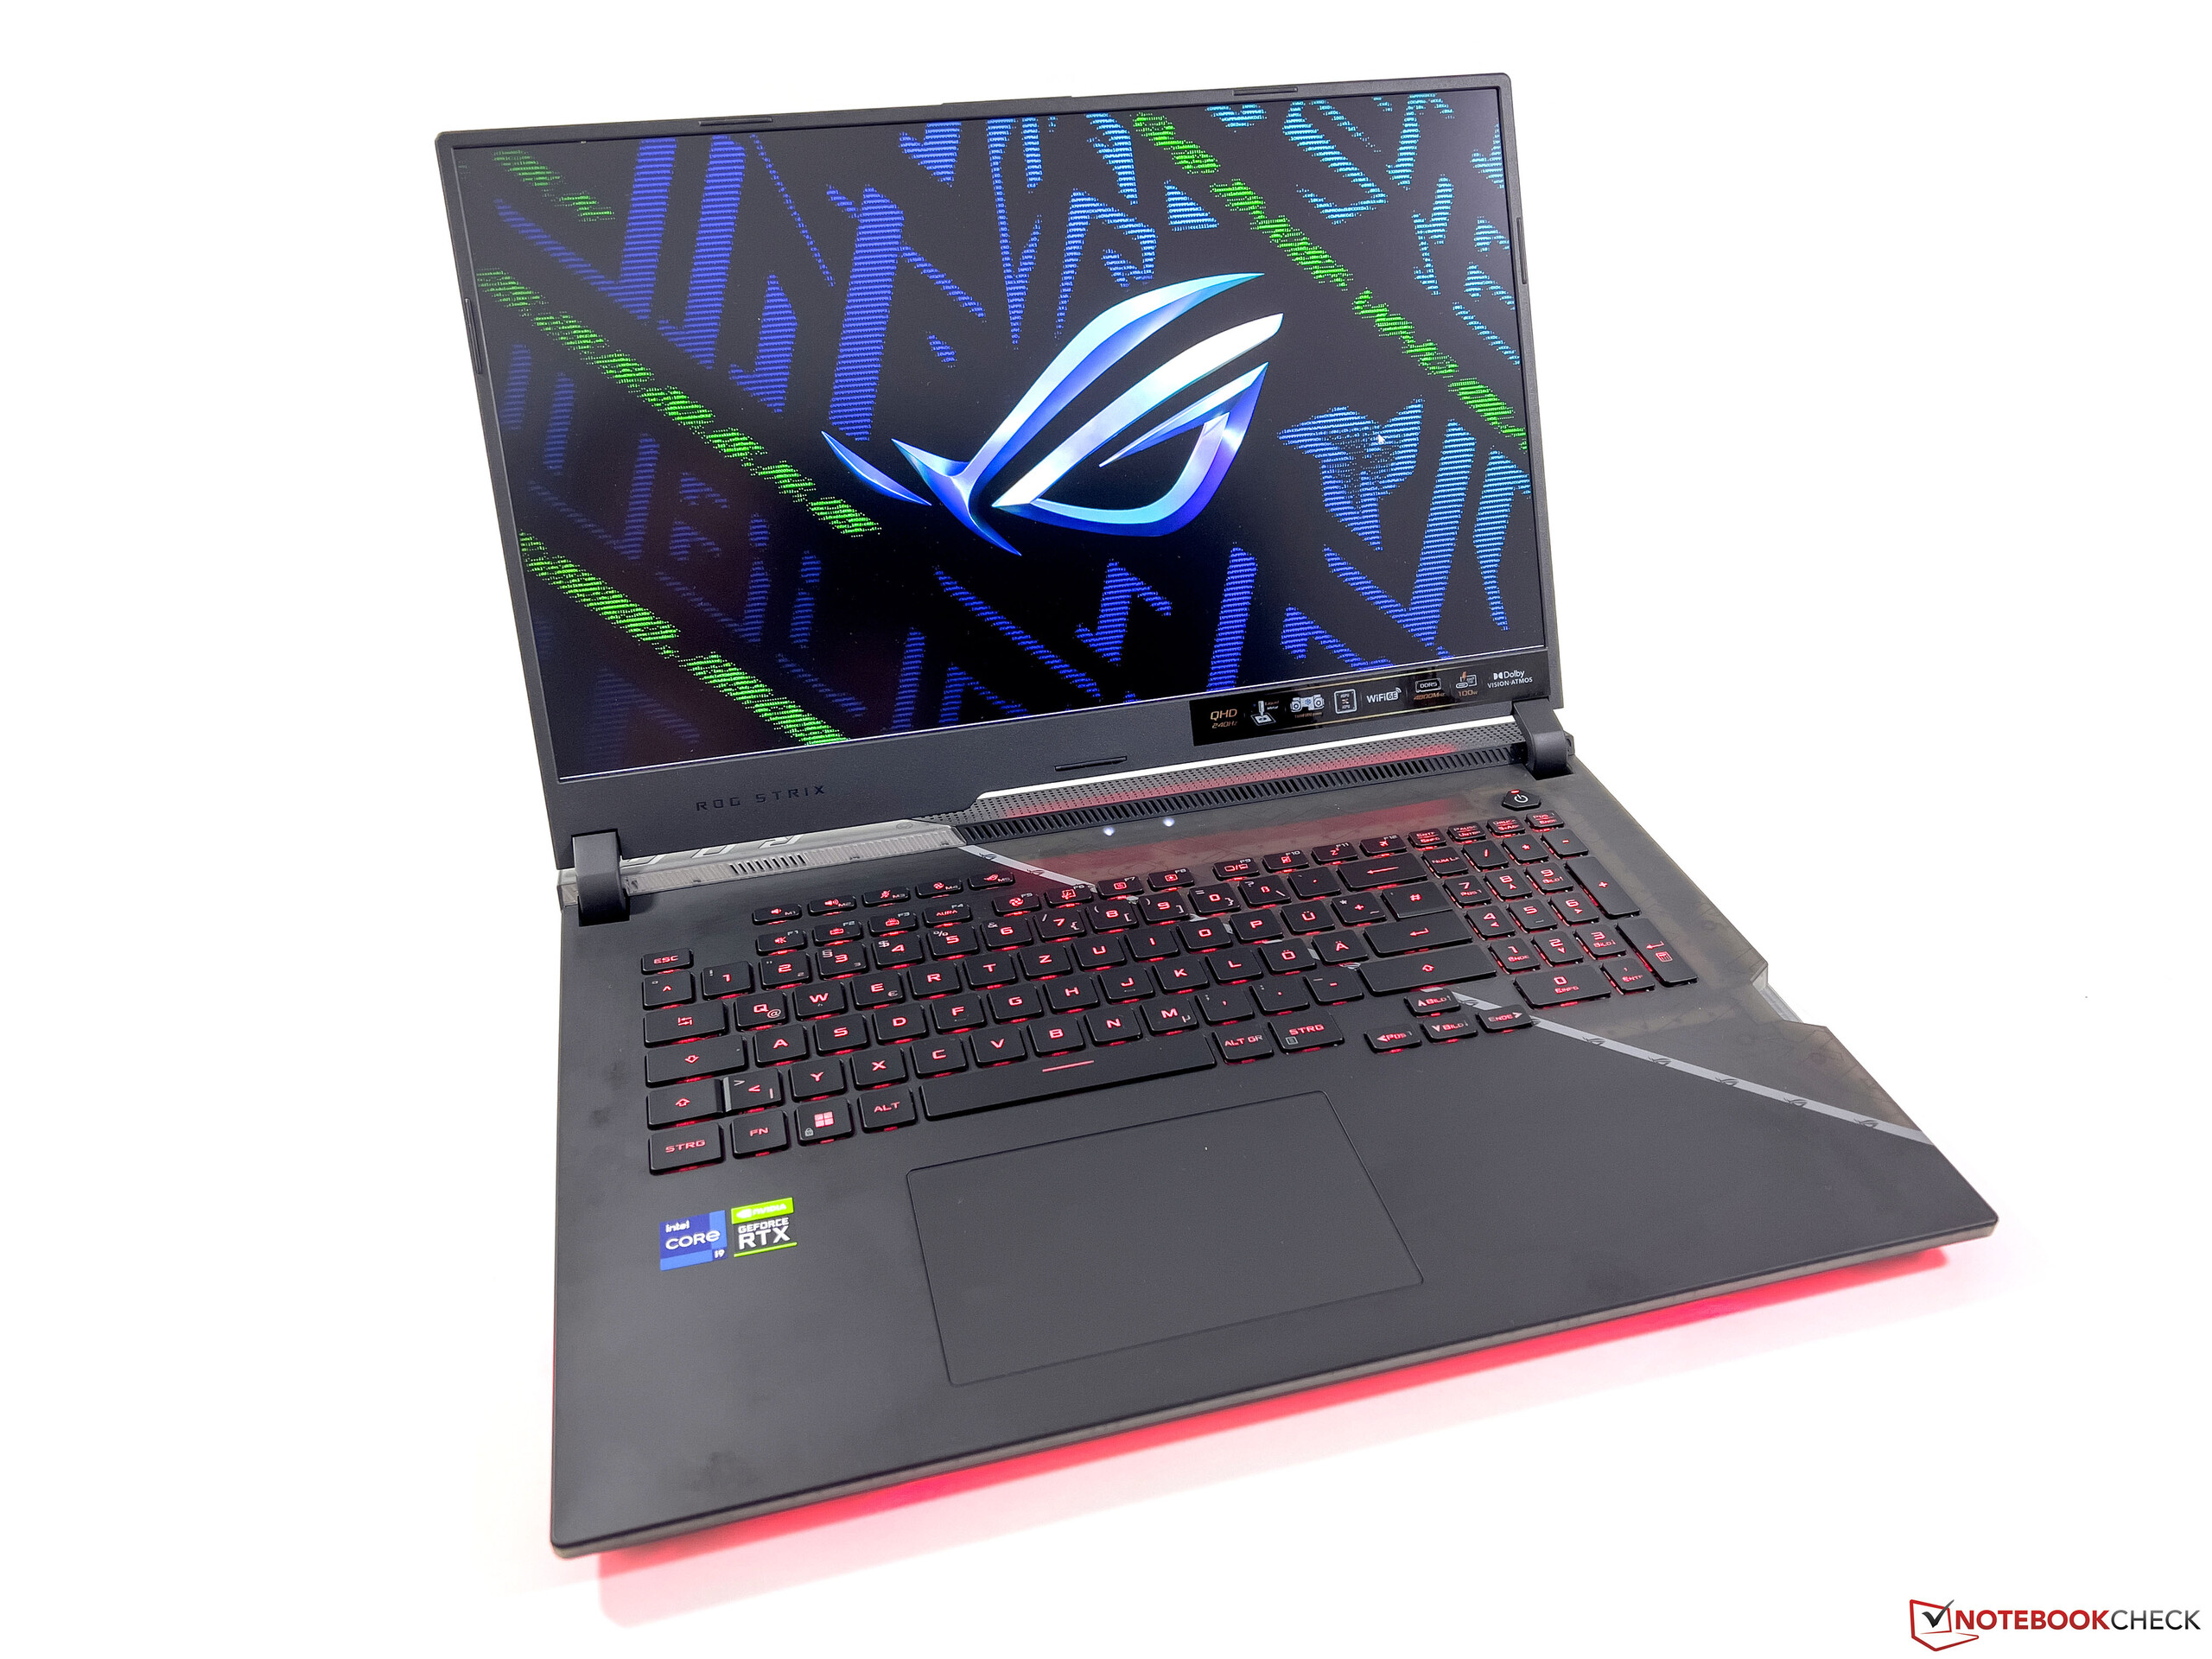
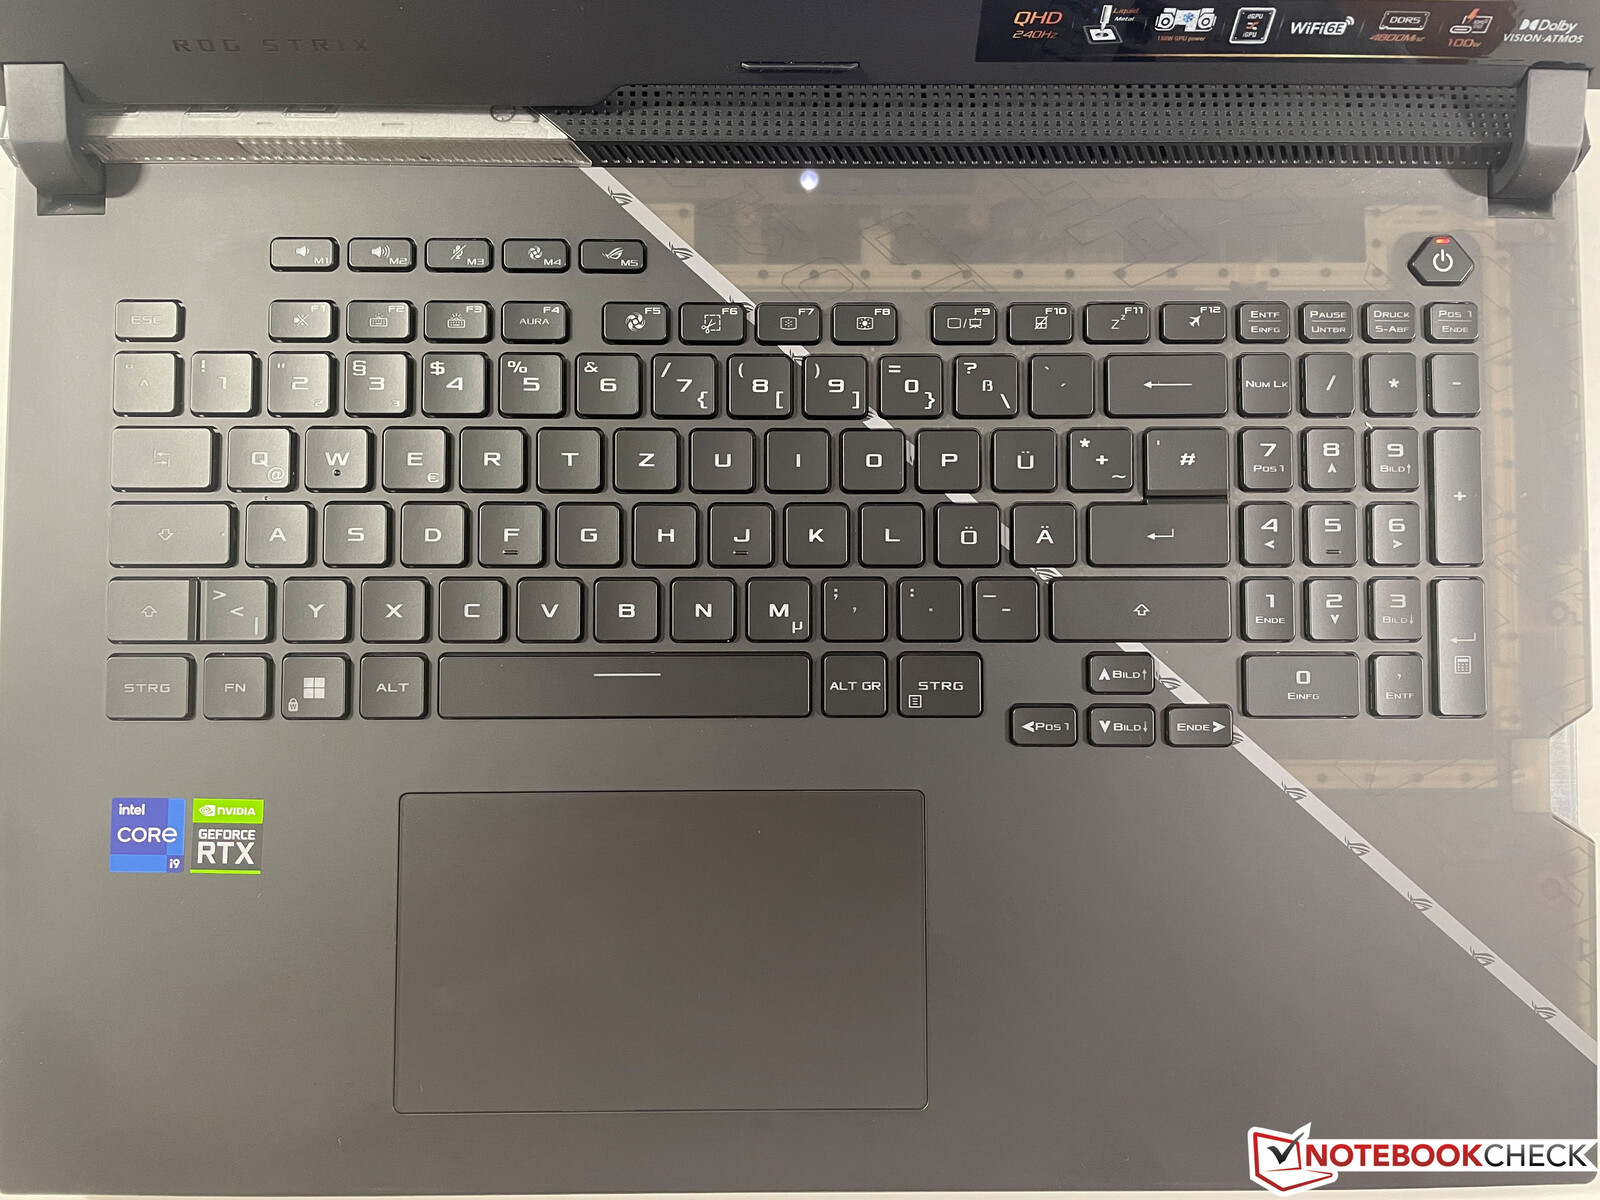
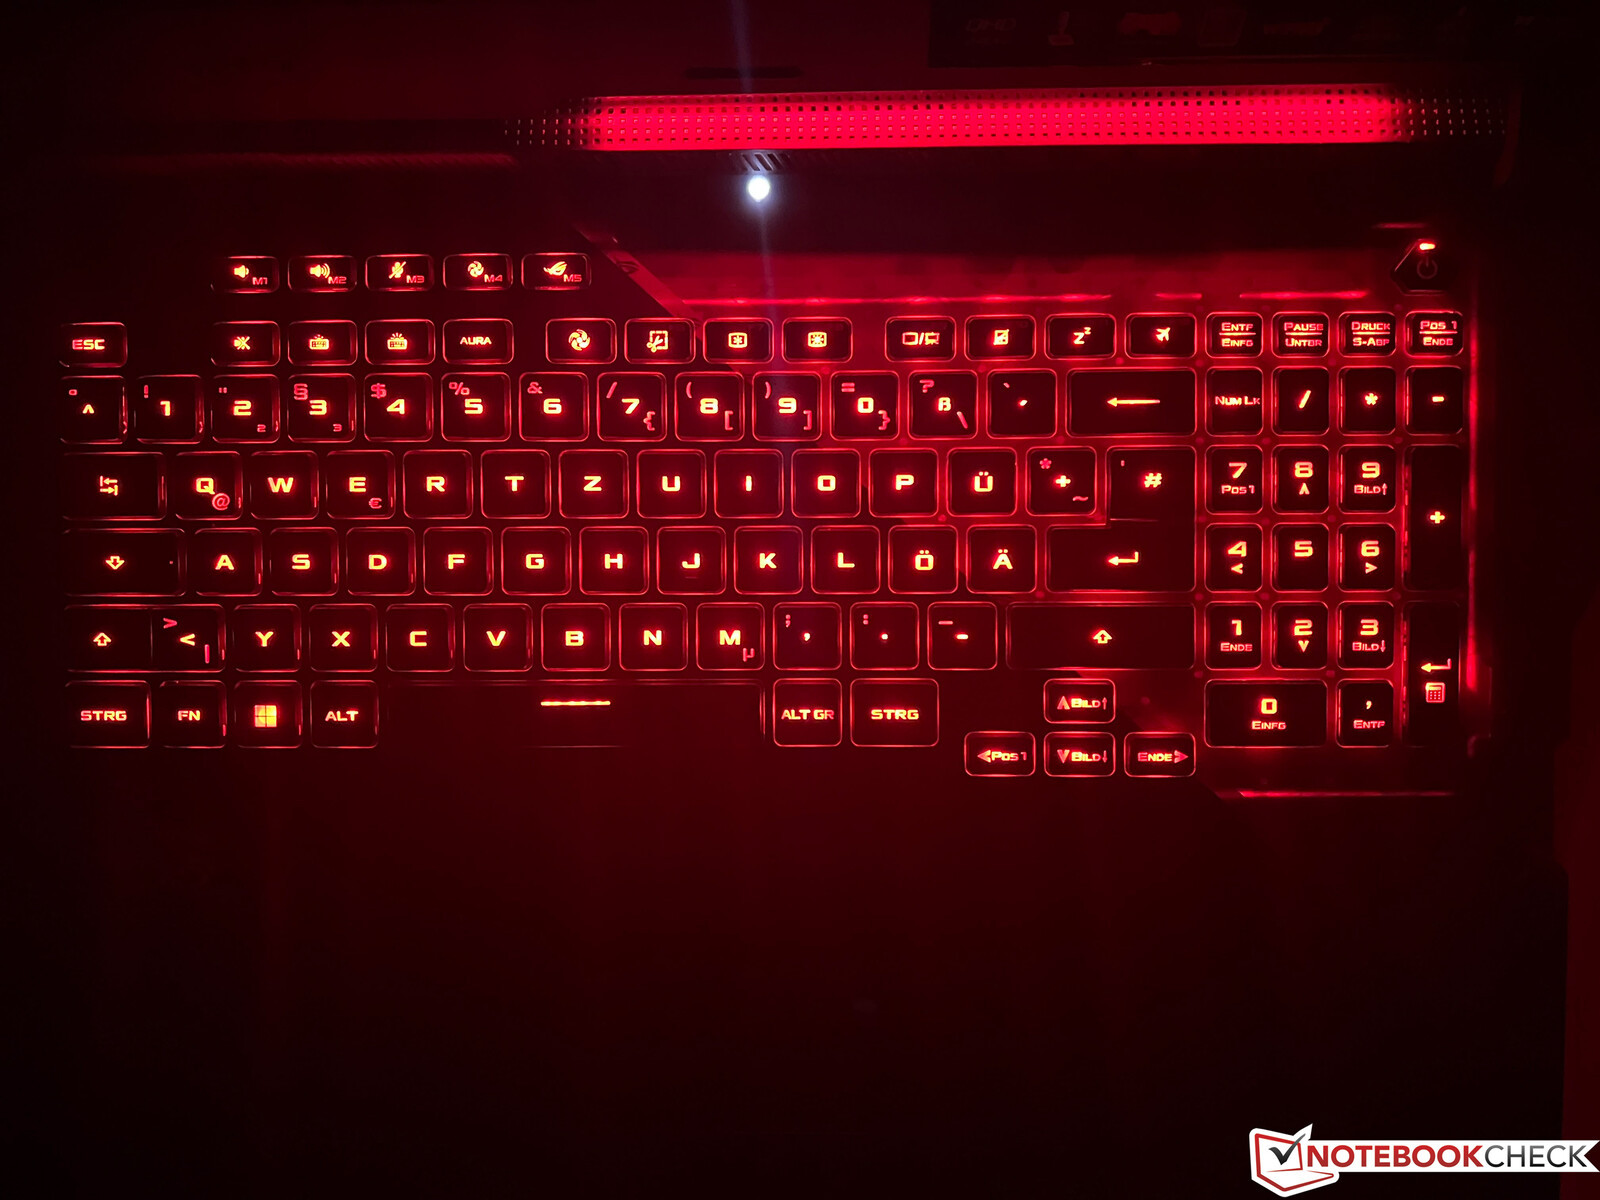
Asus a de nouveau modifié la disposition du clavier, en utilisant désormais une disposition plus conventionnelle avec des touches spéciales plus petites. Il y a également un bloc numérique "normal", ce qui signifie également que les touches fléchées ont été légèrement déplacées vers la gauche et sont maintenant plus petites. Cela ne plaira pas à tous les utilisateurs. Cependant, la qualité du clavier est très bonne avec le moyeu long de 2 mm, et vous pouvez vous déchaîner sur l'éclairage, qui vous permet de configurer chaque touche séparément, y compris les modes spécifiques aux jeux via la technologie AuraSync. Le grand ClickPad offre de bonnes caractéristiques de glissement et fonctionne de manière fiable, mais il est également assez bruyant lorsque vous appuyez dessus.
Affichage - QHD avec 240 Hz
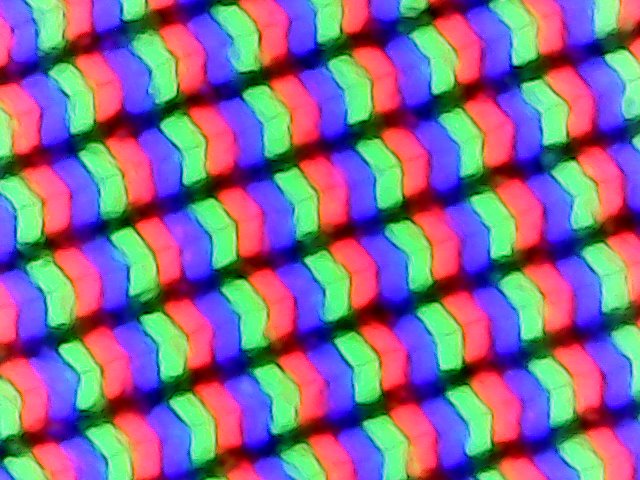
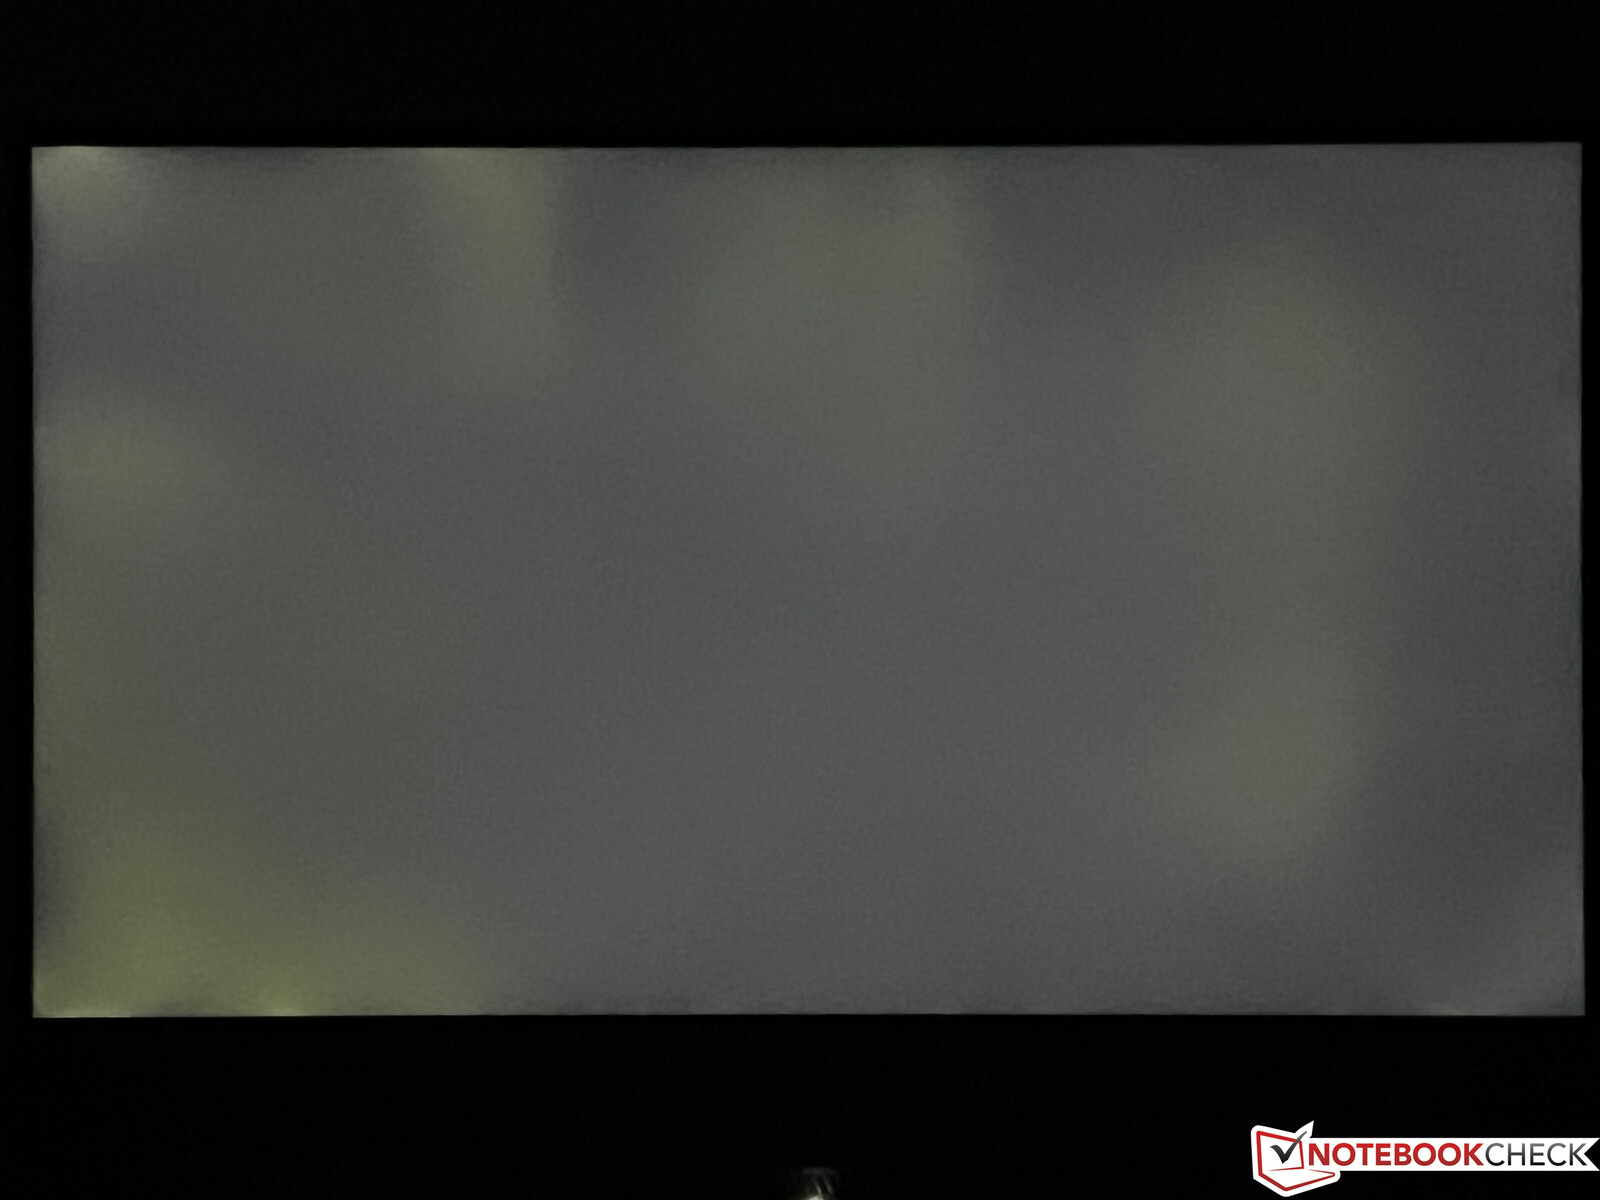
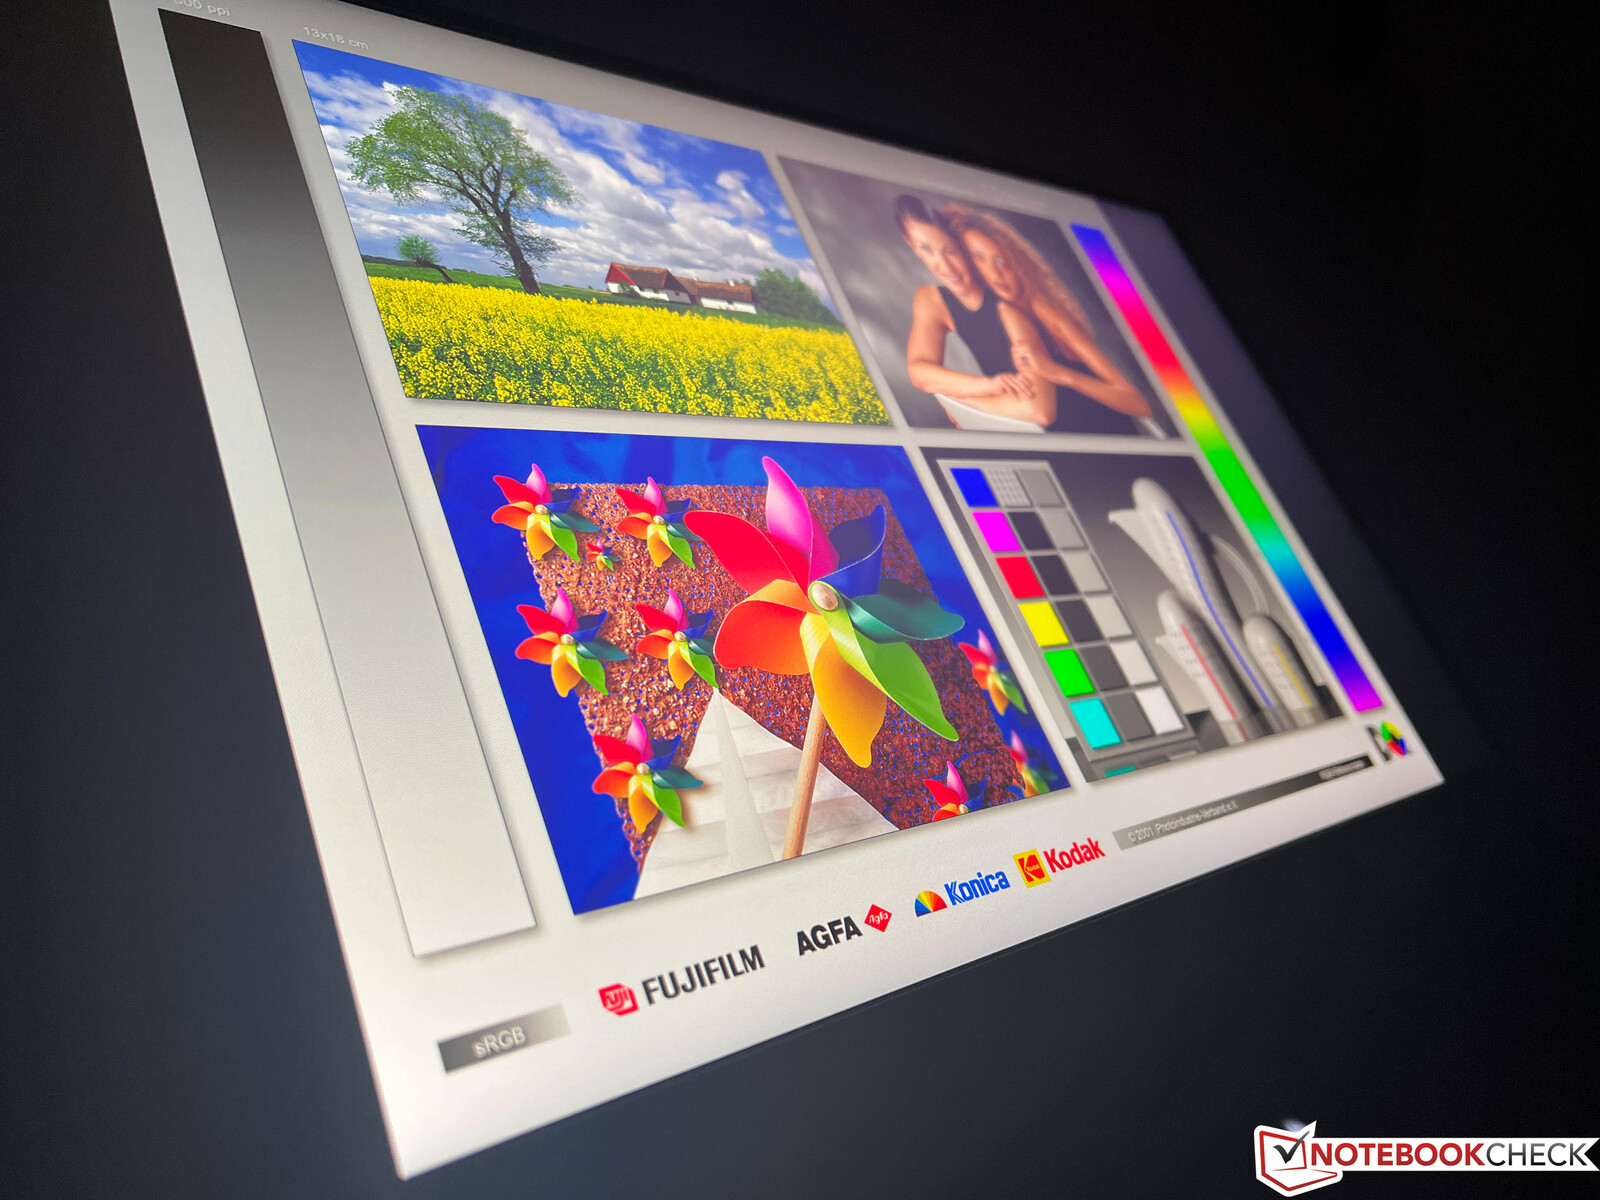
En plus de l'écran Full-HD avec 360 Hz que nous avons testé dans le scar 17 G733QS de l'année dernièreasus propose également une dalle QHD avec un taux de rafraîchissement de 240 Hz, qui est la dalle de notre unité de test. L'impression subjective de l'image de la dalle IPS mate (2560 x 1440 pixels, 16:9) est très bonne, et en plus de Dolby Vision HDR, Adaptive Sync est également pris en charge. Les temps de réponse sont extrêmement rapides, et le PWM n'est pas utilisé. La luminosité est d'environ 300 cd/m² en moyenne, ce qui est également le même niveau que la dalle Full-HD avec 360 Hz. En revanche, la valeur du noir est un peu élevée, ce qui se traduit également par un taux de contraste médiocre d'environ 1 000:1.
| |||||||||||||||||||||||||
Homogénéité de la luminosité: 87 %
Valeur mesurée au centre, sur batterie: 320 cd/m²
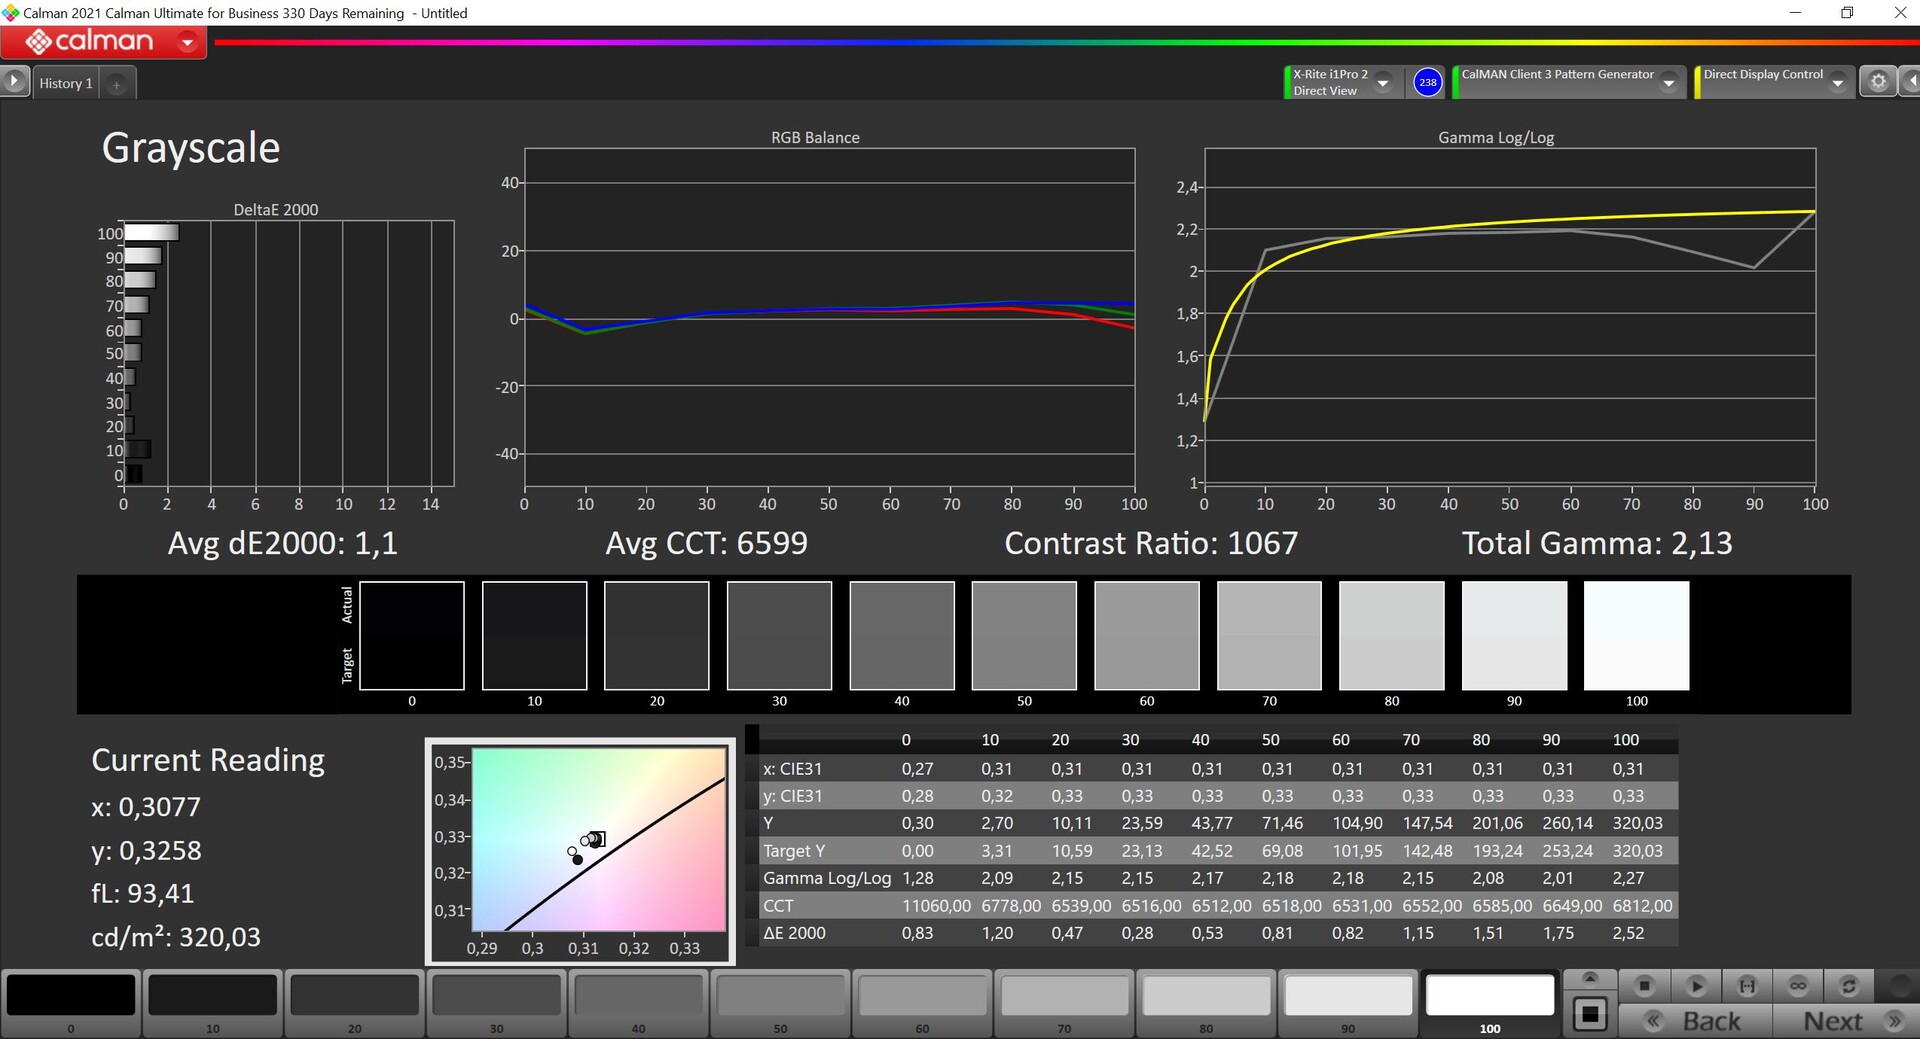
Contraste: 1067:1 (Valeurs des noirs: 0.3 cd/m²)
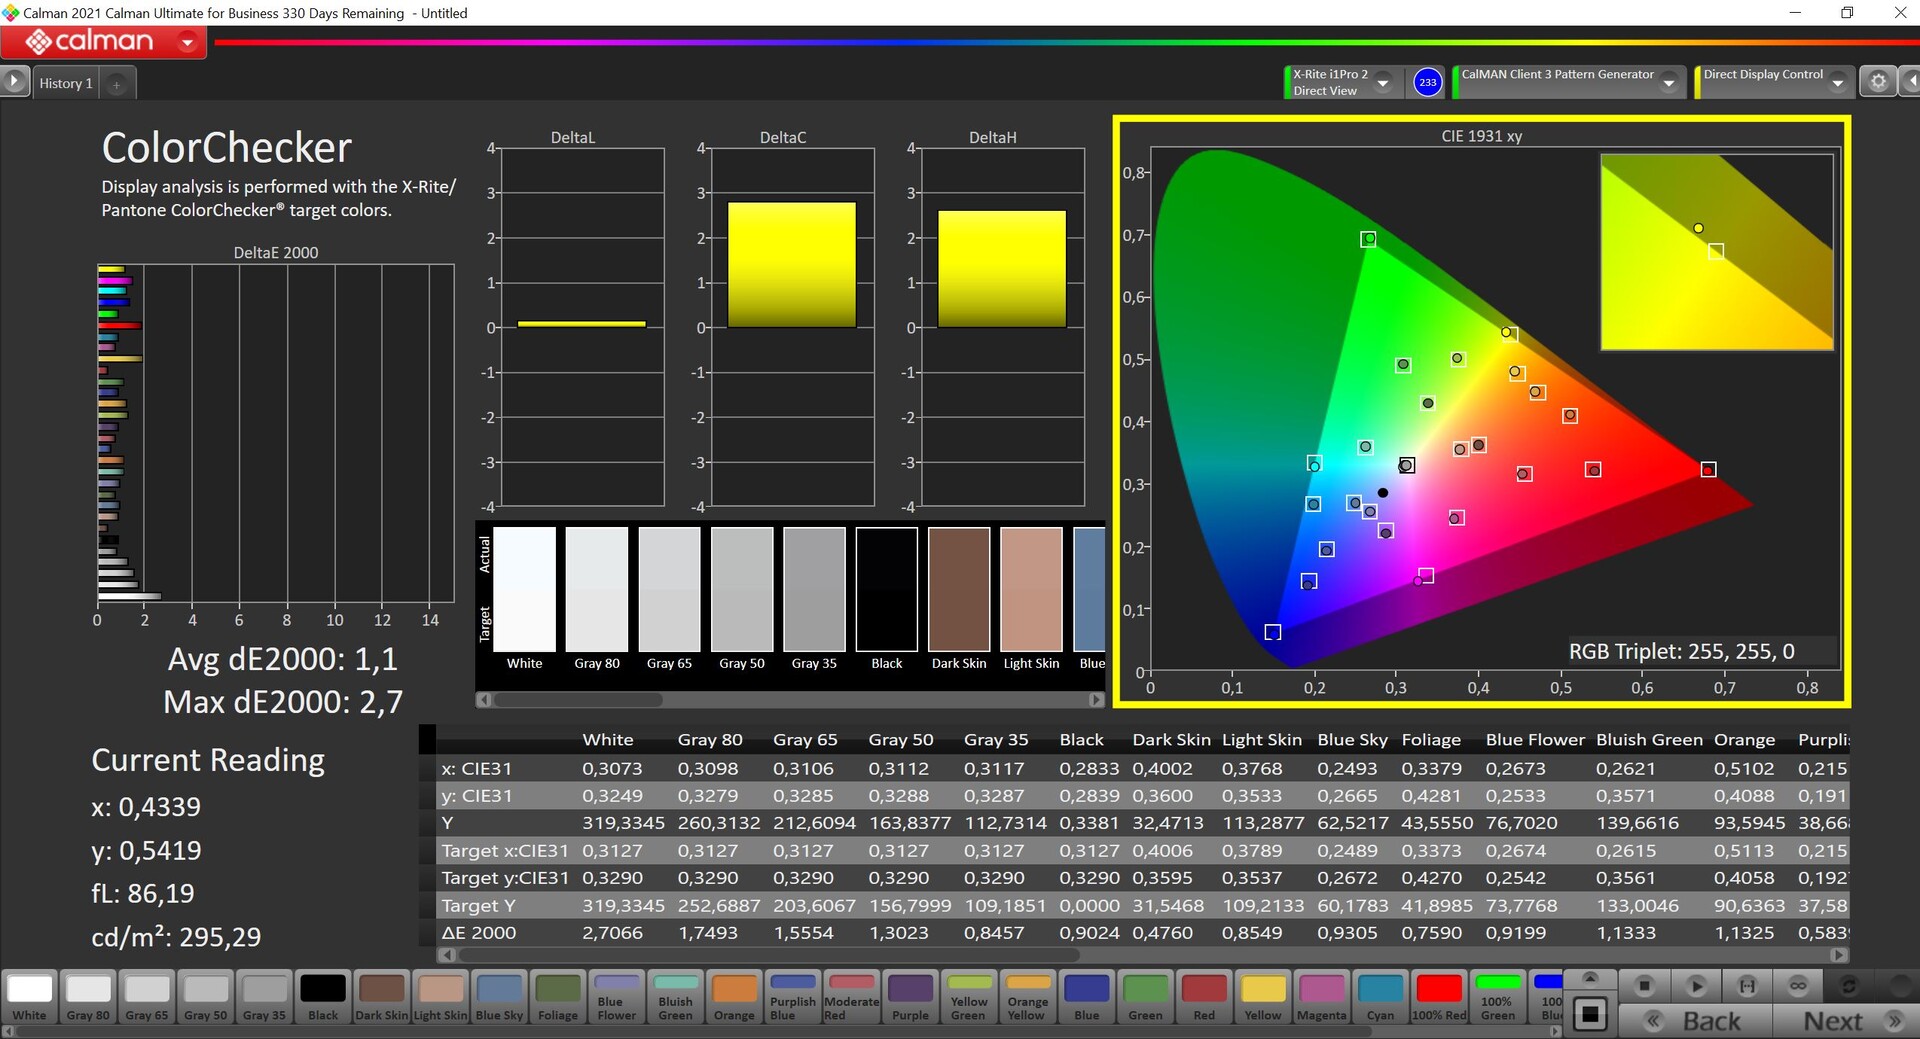
ΔE ColorChecker Calman: 1.1 | ∀{0.5-29.43 Ø4.73}
ΔE Greyscale Calman: 1.1 | ∀{0.09-98 Ø4.97}
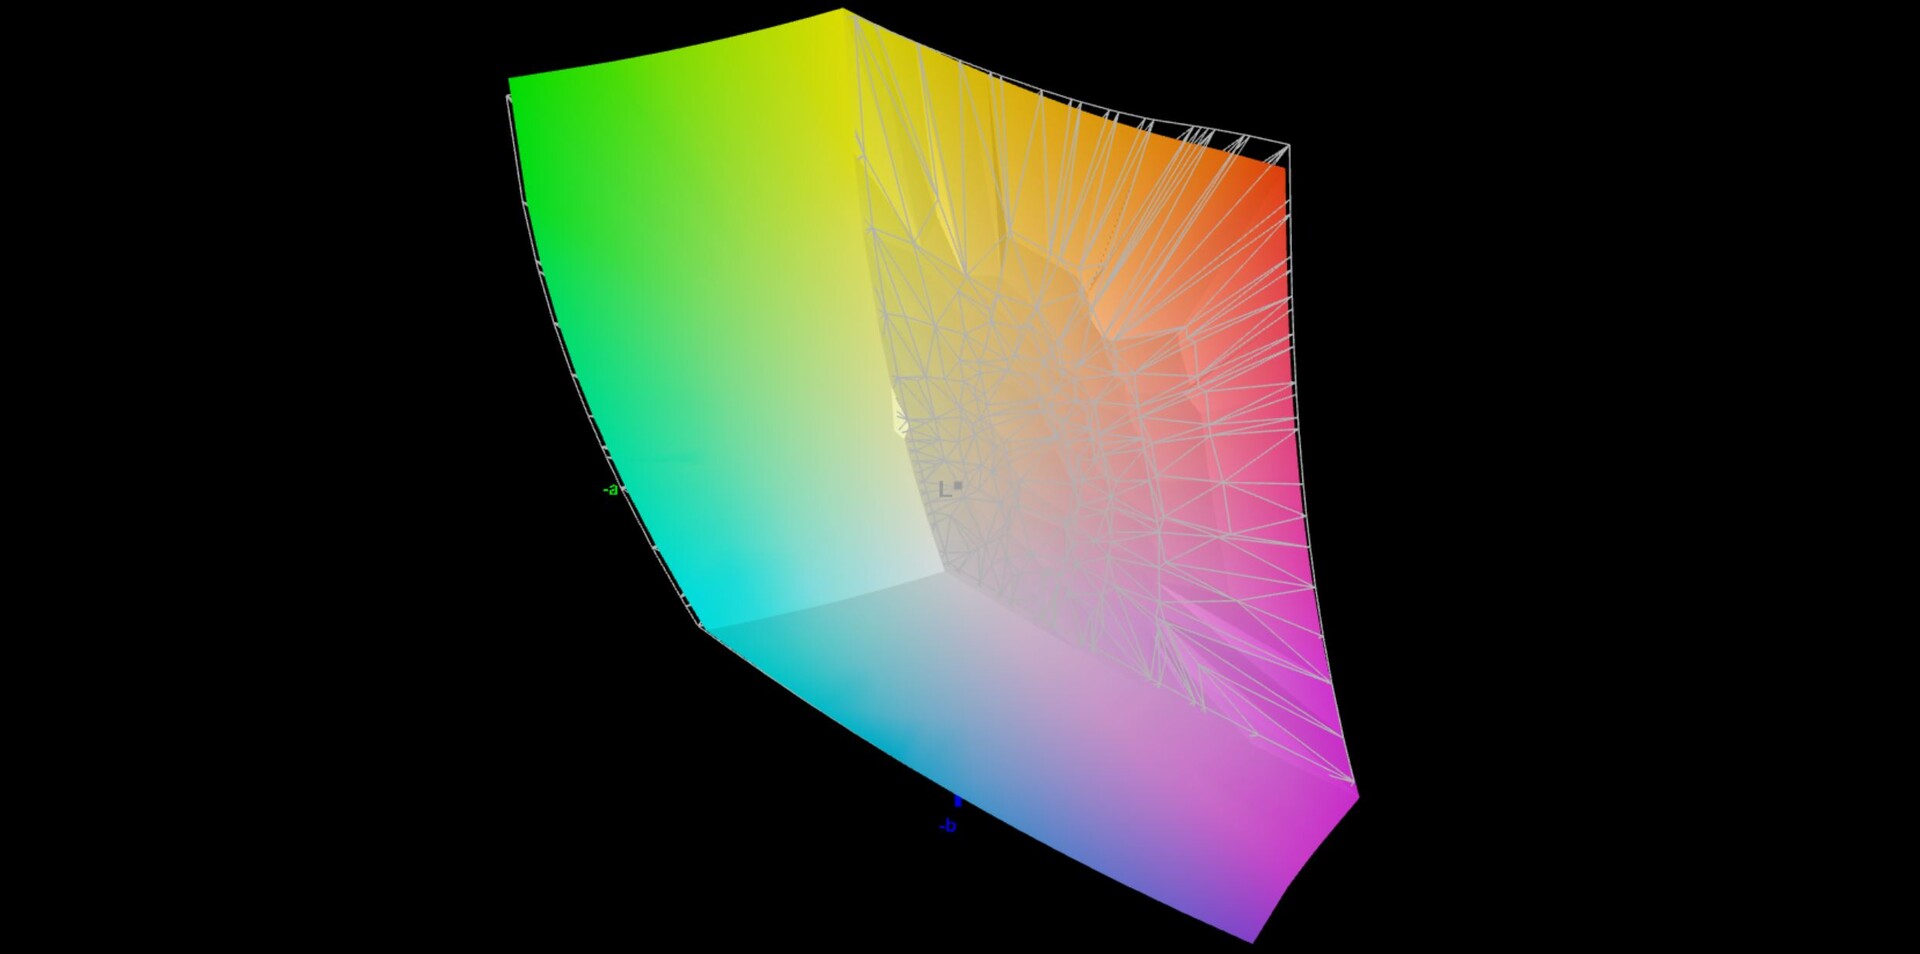
84.8% AdobeRGB 1998 (Argyll 3D)
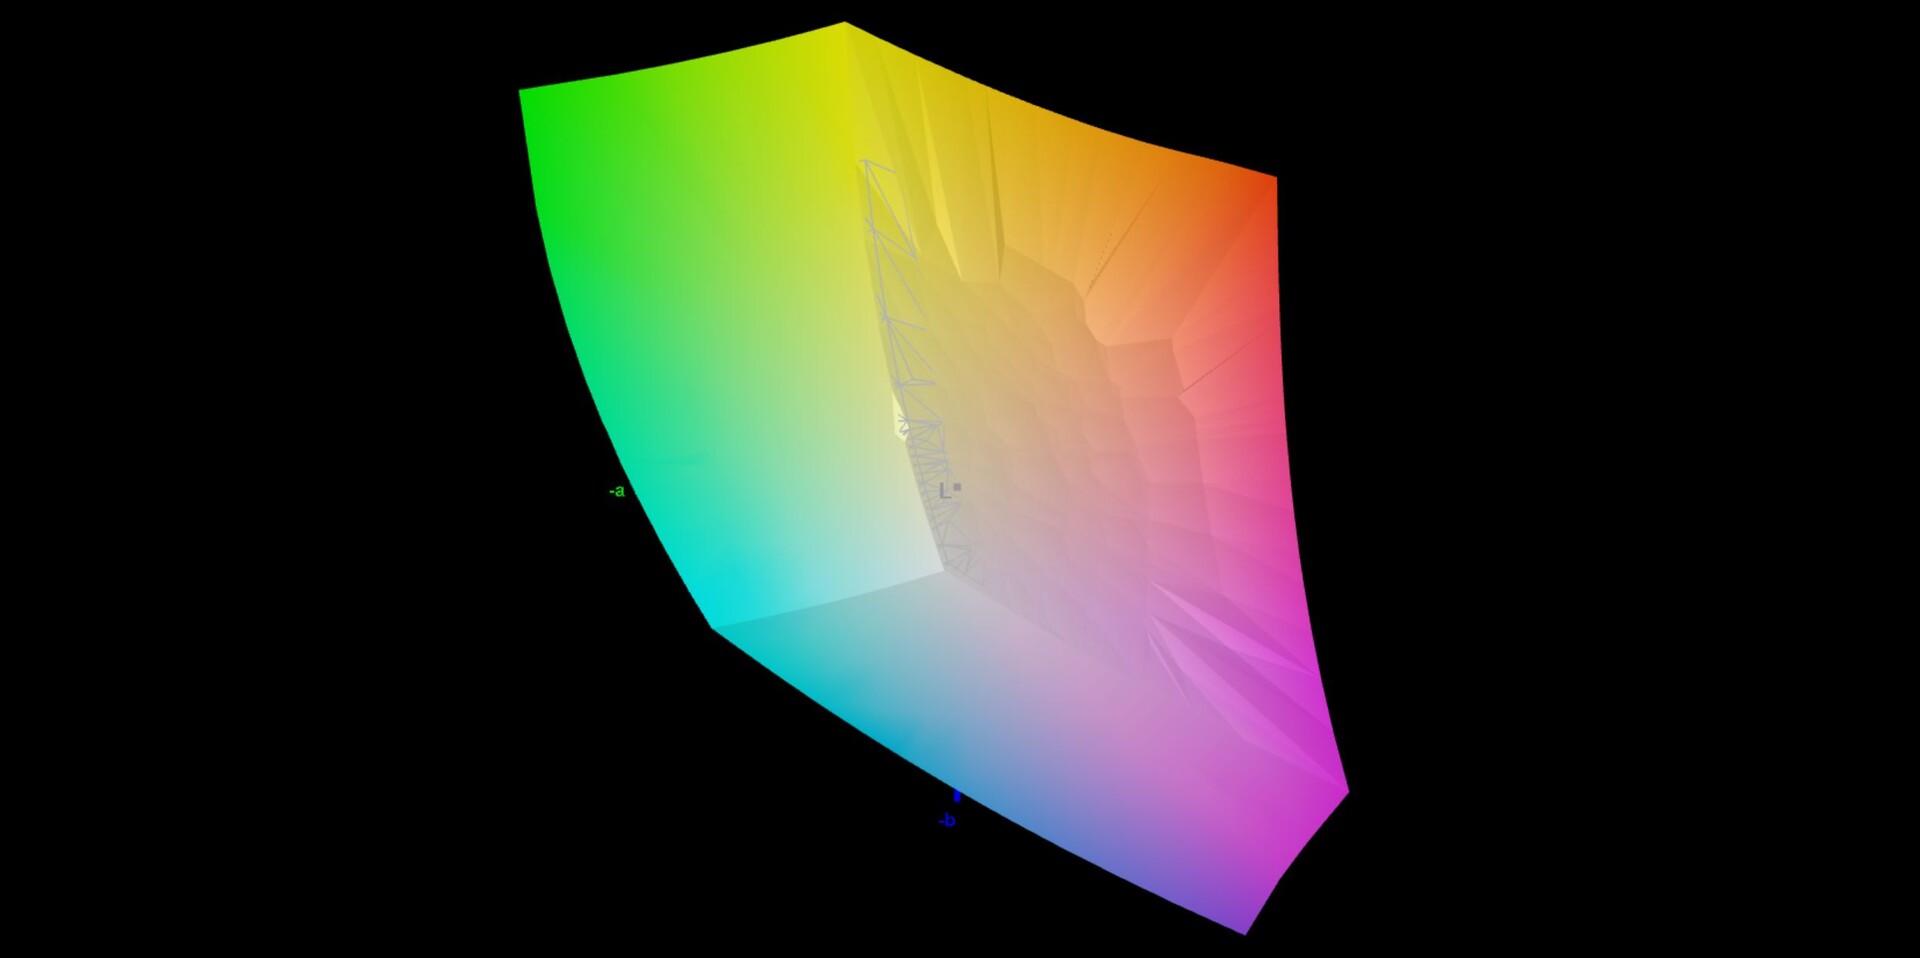
99.9% sRGB (Argyll 3D)
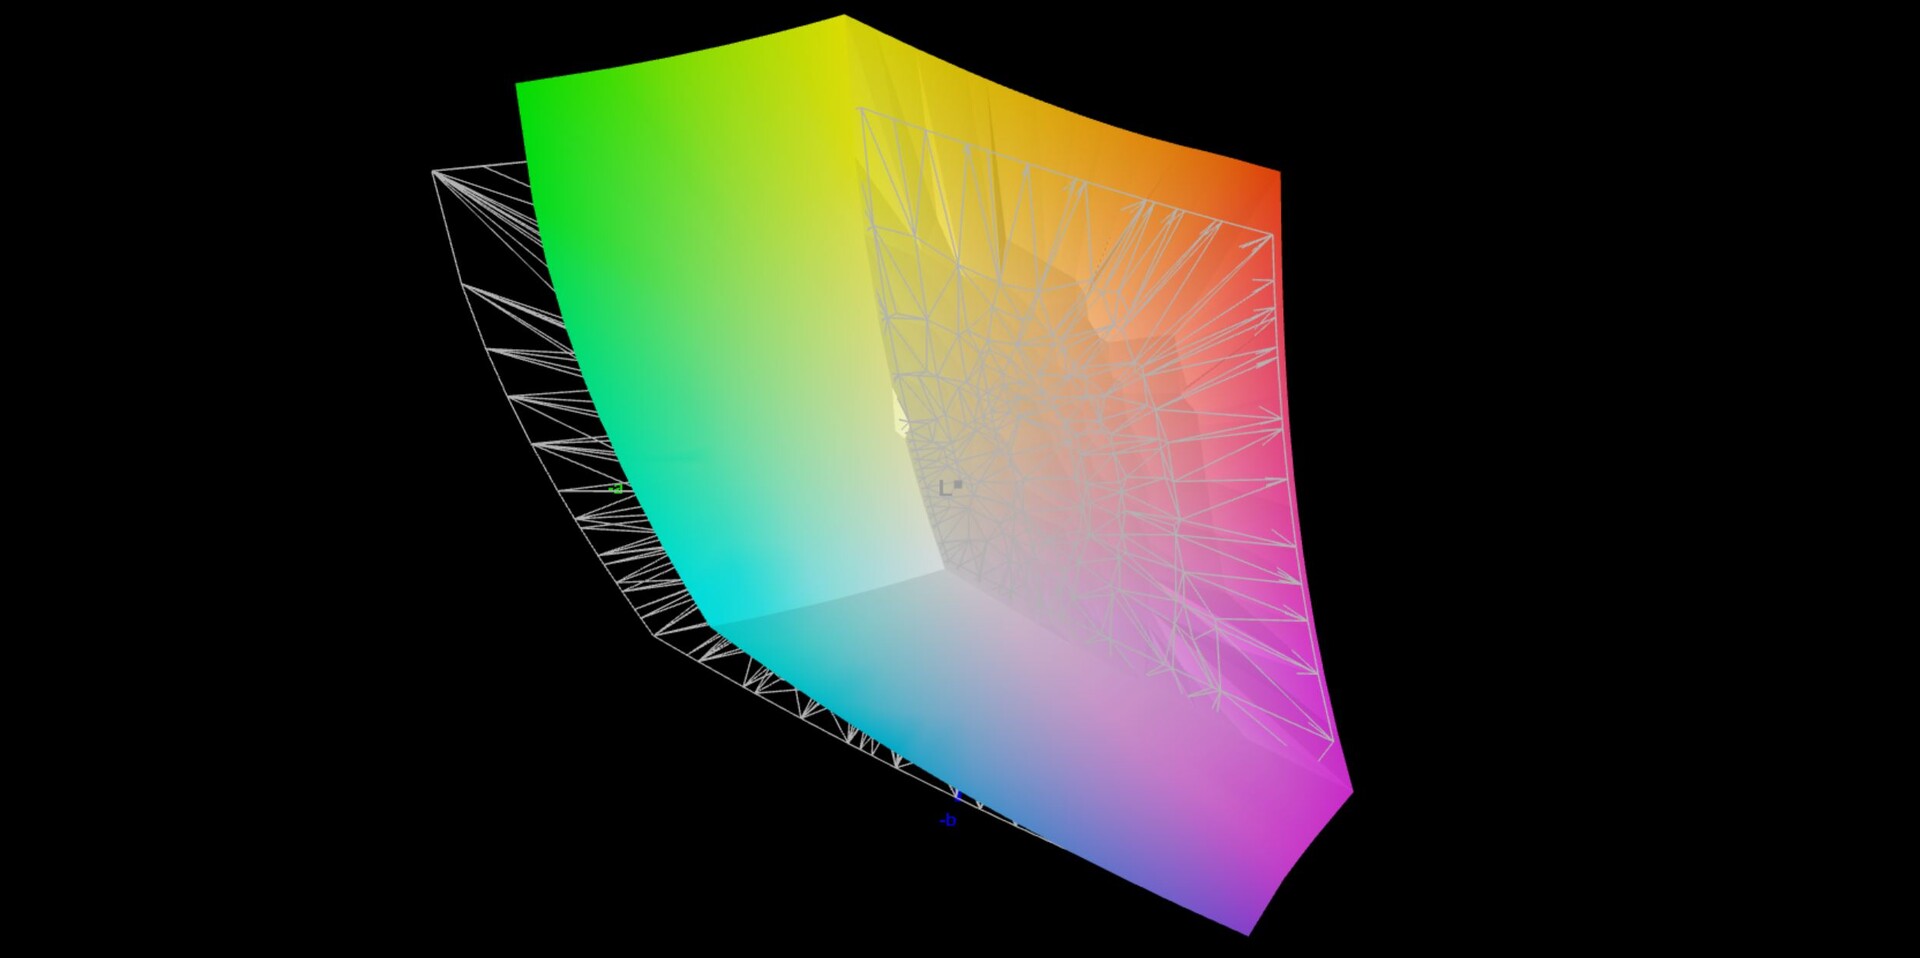
97.1% Display P3 (Argyll 3D)
Gamma: 2.13
CCT: 6599 K
| Asus ROG Strix Scar 17 SE G733CX-LL014W NE173QHM-NZ2, IPS, 2560x1440, 17.3" | Lenovo Legion 7 16IAX7-82TD004SGE NE160QDM-NY1, IPS, 2560x1600, 16" | MSI Titan GT77 12UHS Sharp SHP1544 LQ173M1JW08, IPS-Level, 1920x1080, 17.3" | Schenker XMG Neo 17 M22 BOE0A99, IPS, 2560x1600, 17" | Alienware x17 R2 P48E AU Optronics B173HAN, IPS, 1920x1080, 17.3" | Asus Strix Scar 17 G733QSA-XS99 AU Optronics B173HAN05.4, IPS, 1920x1080, 17.3" | |
|---|---|---|---|---|---|---|
| Display | -16% | -14% | -16% | -8% | -14% | |
| Display P3 Coverage (%) | 97.1 | 69.3 -29% | 70.8 -27% | 69 -29% | 79.2 -18% | 71 -27% |
| sRGB Coverage (%) | 99.9 | 98.2 -2% | 98.9 -1% | 99.8 0% | 99.8 0% | 99.4 -1% |
| AdobeRGB 1998 Coverage (%) | 84.8 | 70.8 -17% | 73 -14% | 69.6 -18% | 79.6 -6% | 72.2 -15% |
| Response Times | -38% | 48% | -25% | -55% | -12% | |
| Response Time Grey 50% / Grey 80% * (ms) | 5.7 ? | 12.6 ? -121% | 3.03 ? 47% | 10.8 ? -89% | 12.4 ? -118% | 6.6 ? -16% |
| Response Time Black / White * (ms) | 10.1 ? | 5.6 ? 45% | 5.28 ? 48% | 6.1 ? 40% | 9.2 ? 9% | 10.8 ? -7% |
| PWM Frequency (Hz) | ||||||
| Screen | -41% | -63% | -9% | -89% | -25% | |
| Brightness middle (cd/m²) | 320 | 547 71% | 280 -12% | 415 30% | 365.4 14% | 303.8 -5% |
| Brightness (cd/m²) | 303 | 523 73% | 275 -9% | 399 32% | 344 14% | 292 -4% |
| Brightness Distribution (%) | 87 | 88 1% | 79 -9% | 90 3% | 85 -2% | 85 -2% |
| Black Level * (cd/m²) | 0.3 | 0.44 -47% | 0.4 -33% | 0.43 -43% | 0.29 3% | 0.23 23% |
| Contrast (:1) | 1067 | 1243 16% | 700 -34% | 965 -10% | 1260 18% | 1321 24% |
| Colorchecker dE 2000 * | 1.1 | 2.1 -91% | 2.1 -91% | 1.44 -31% | 3.17 -188% | 1.87 -70% |
| Colorchecker dE 2000 max. * | 2.7 | 7 -159% | 5.83 -116% | 2.33 14% | 7.69 -185% | 3.26 -21% |
| Greyscale dE 2000 * | 1.1 | 3.2 -191% | 3.3 -200% | 1.8 -64% | 5.3 -382% | 2.7 -145% |
| Gamma | 2.13 103% | 2.23 99% | 2.13 103% | 2.132 103% | 2.18 101% | 2.26 97% |
| CCT | 6599 98% | 6979 93% | 7060 92% | 6327 103% | 5879 111% | 6436 101% |
| Colorchecker dE 2000 calibrated * | 0.9 | 1.58 | 0.89 | 0.51 | 1.45 | |
| Color Space (Percent of AdobeRGB 1998) (%) | 65.6 | |||||
| Color Space (Percent of sRGB) (%) | 99.4 | |||||
| Moyenne finale (programmes/paramètres) | -32% /
-35% | -10% /
-35% | -17% /
-13% | -51% /
-65% | -17% /
-20% |
* ... Moindre est la valeur, meilleures sont les performances
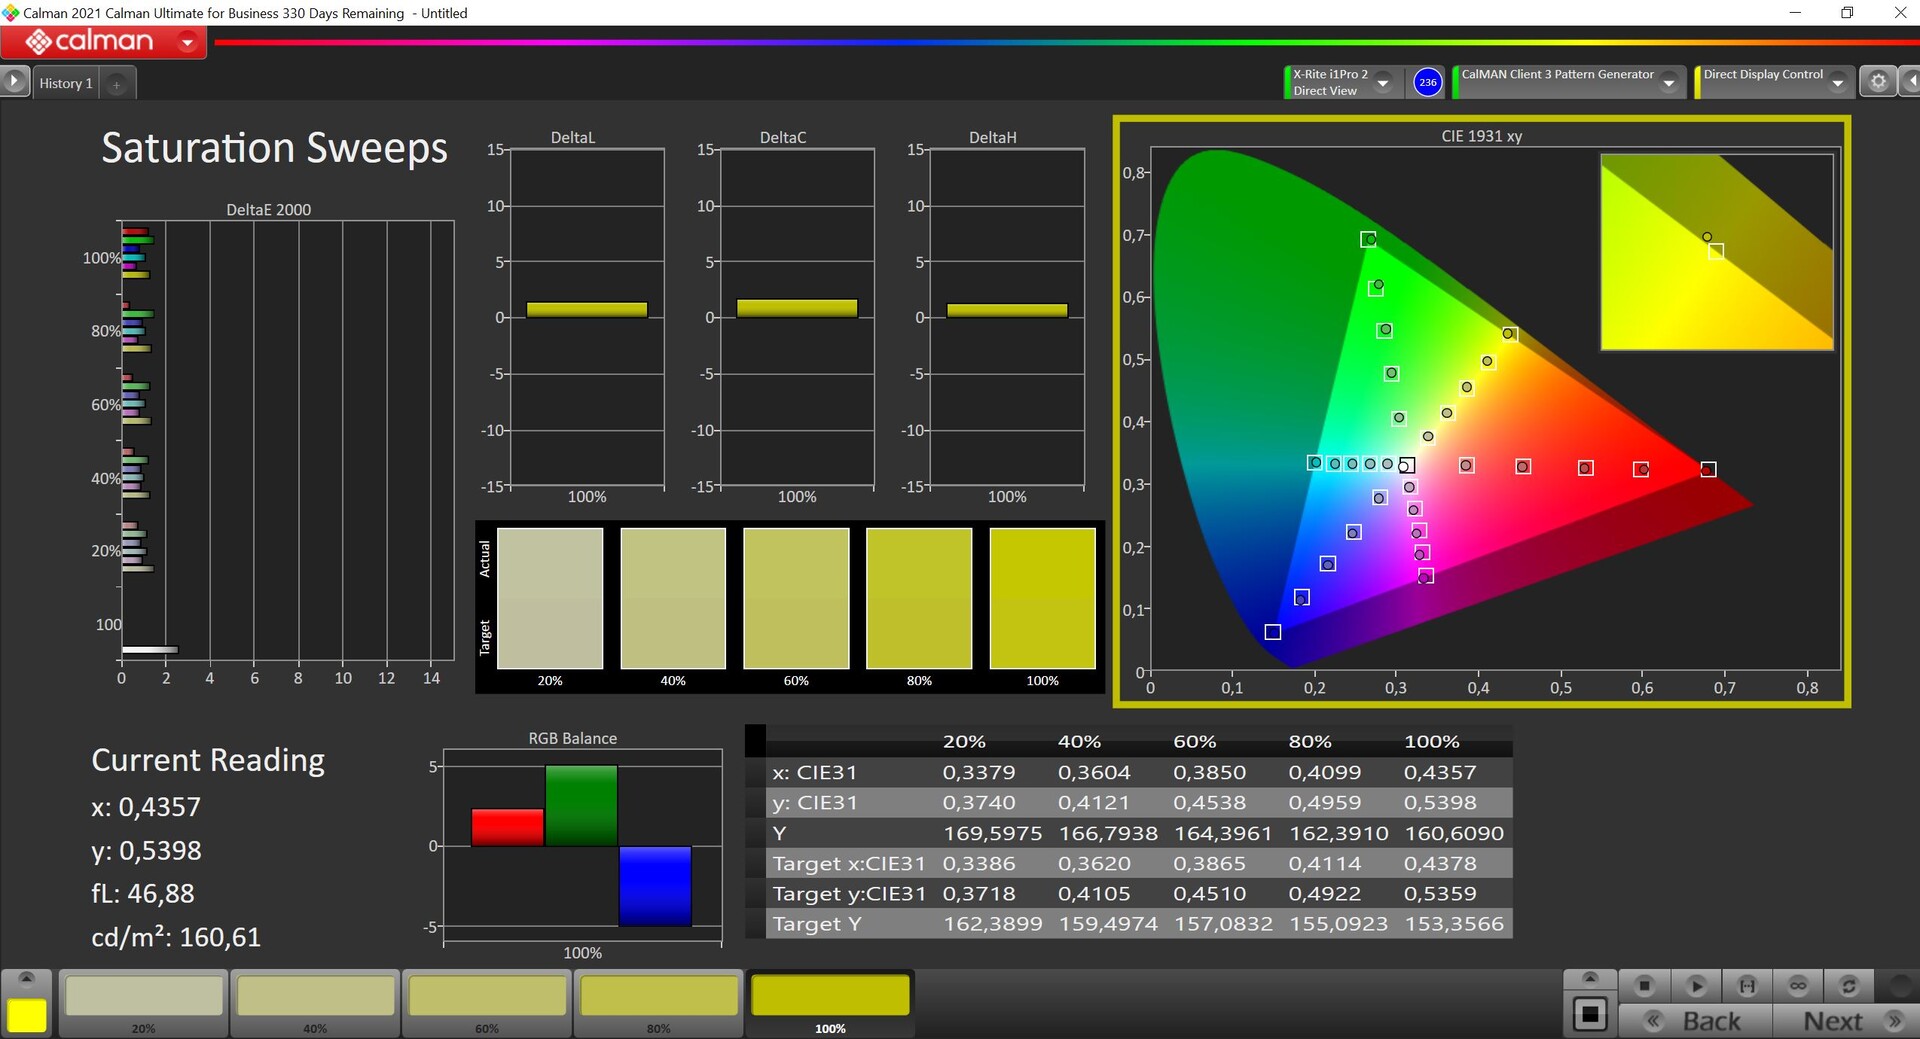
L'écran couvre l'espace couleur P3, et notre analyse avec le logiciel professionnel CalMAN montre que l'écran est déjà très précis dans l'état de livraison. Il n'y a pas non plus de teinte de couleur, et notre propre calibration n'a pas conduit à une amélioration supplémentaire, nous ne vous proposons donc pas de profil ici. Ce panneau QHD est adapté au traitement des images et des vidéos sans aucune limite.
Temps de réponse de l'écran
| ↔ Temps de réponse noir à blanc | ||
|---|---|---|
| 10.1 ms ... hausse ↗ et chute ↘ combinées | ↗ 5 ms hausse | 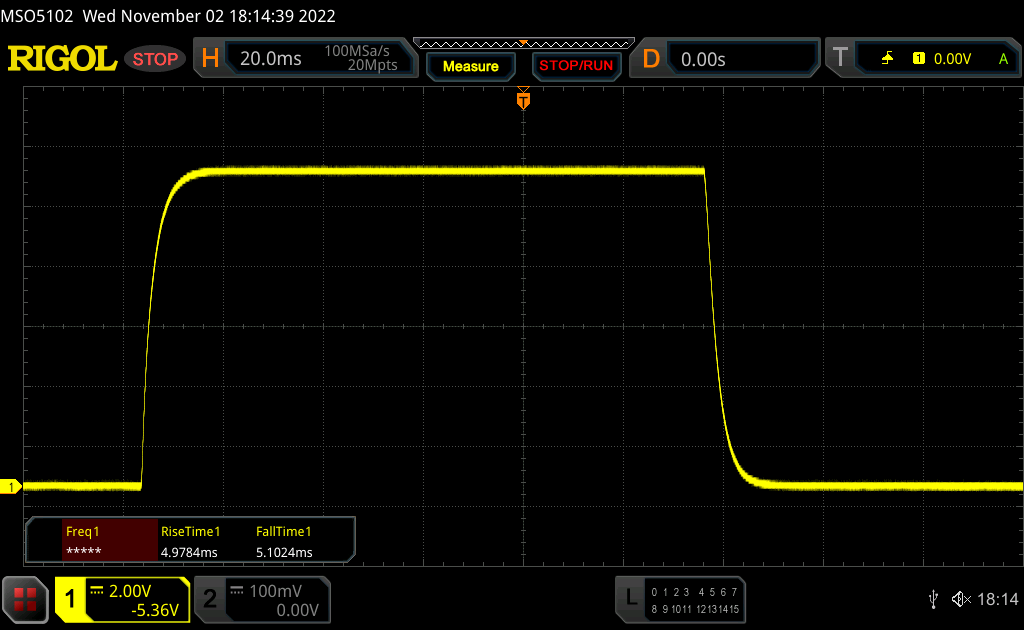 |
| ↘ 5.1 ms chute | ||
| L'écran montre de bons temps de réponse, mais insuffisant pour du jeu compétitif. En comparaison, tous les appareils testés affichent entre 0.1 (minimum) et 240 (maximum) ms. » 28 % des appareils testés affichent de meilleures performances. Cela signifie que les latences relevées sont meilleures que la moyenne (19.9 ms) de tous les appareils testés. | ||
| ↔ Temps de réponse gris 50% à gris 80% | ||
| 5.7 ms ... hausse ↗ et chute ↘ combinées | ↗ 2.7 ms hausse | 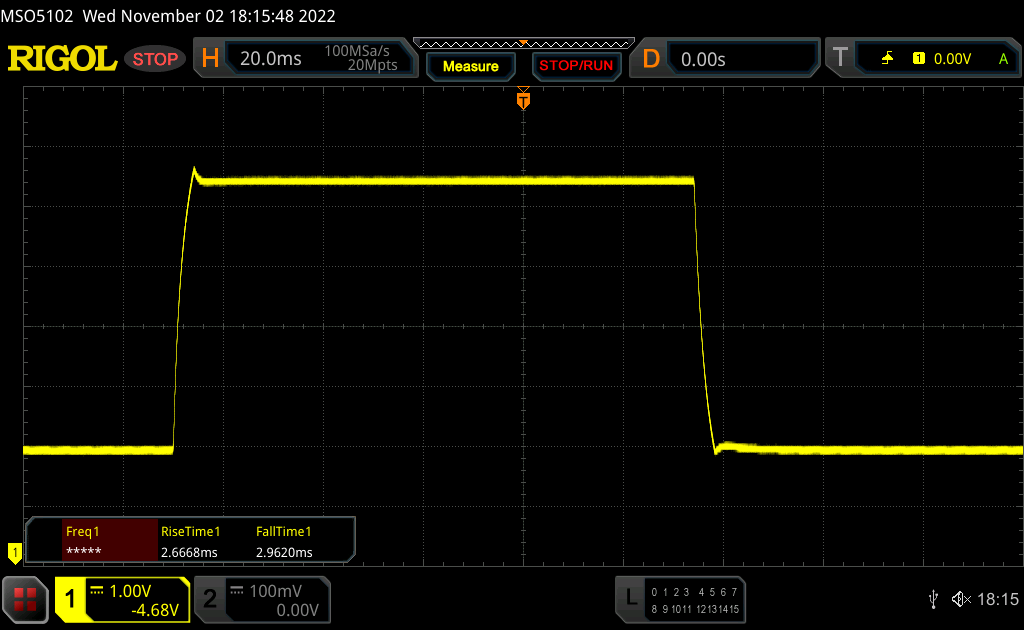 |
| ↘ 3 ms chute | ||
| L'écran montre de très faibles temps de réponse, parfait pour le jeu. En comparaison, tous les appareils testés affichent entre 0.165 (minimum) et 636 (maximum) ms. » 18 % des appareils testés affichent de meilleures performances. Cela signifie que les latences relevées sont meilleures que la moyenne (31.1 ms) de tous les appareils testés. | ||
Scintillement / MLI (Modulation de largeur d'impulsion)
| Scintillement / MLI (Modulation de largeur d'impulsion) non décelé | 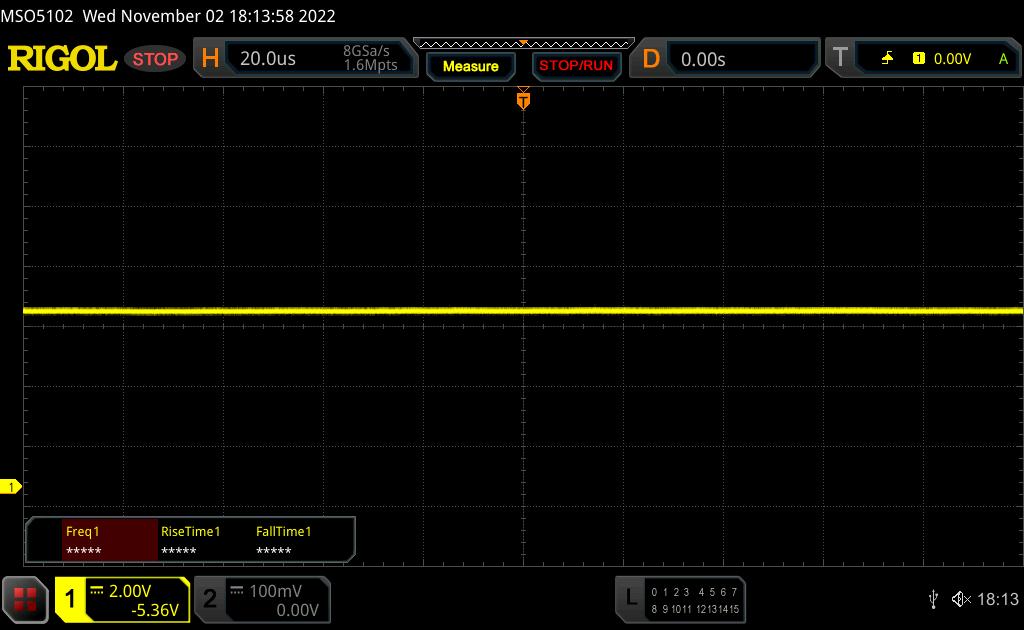 | ||
En comparaison, 52 % des appareils testés n'emploient pas MDI pour assombrir leur écran. Nous avons relevé une moyenne à 7798 (minimum : 5 - maximum : 343500) Hz dans le cas où une MDI était active. | |||
Performances - Intel HX avec les freins appliqués
Conditions d'essai
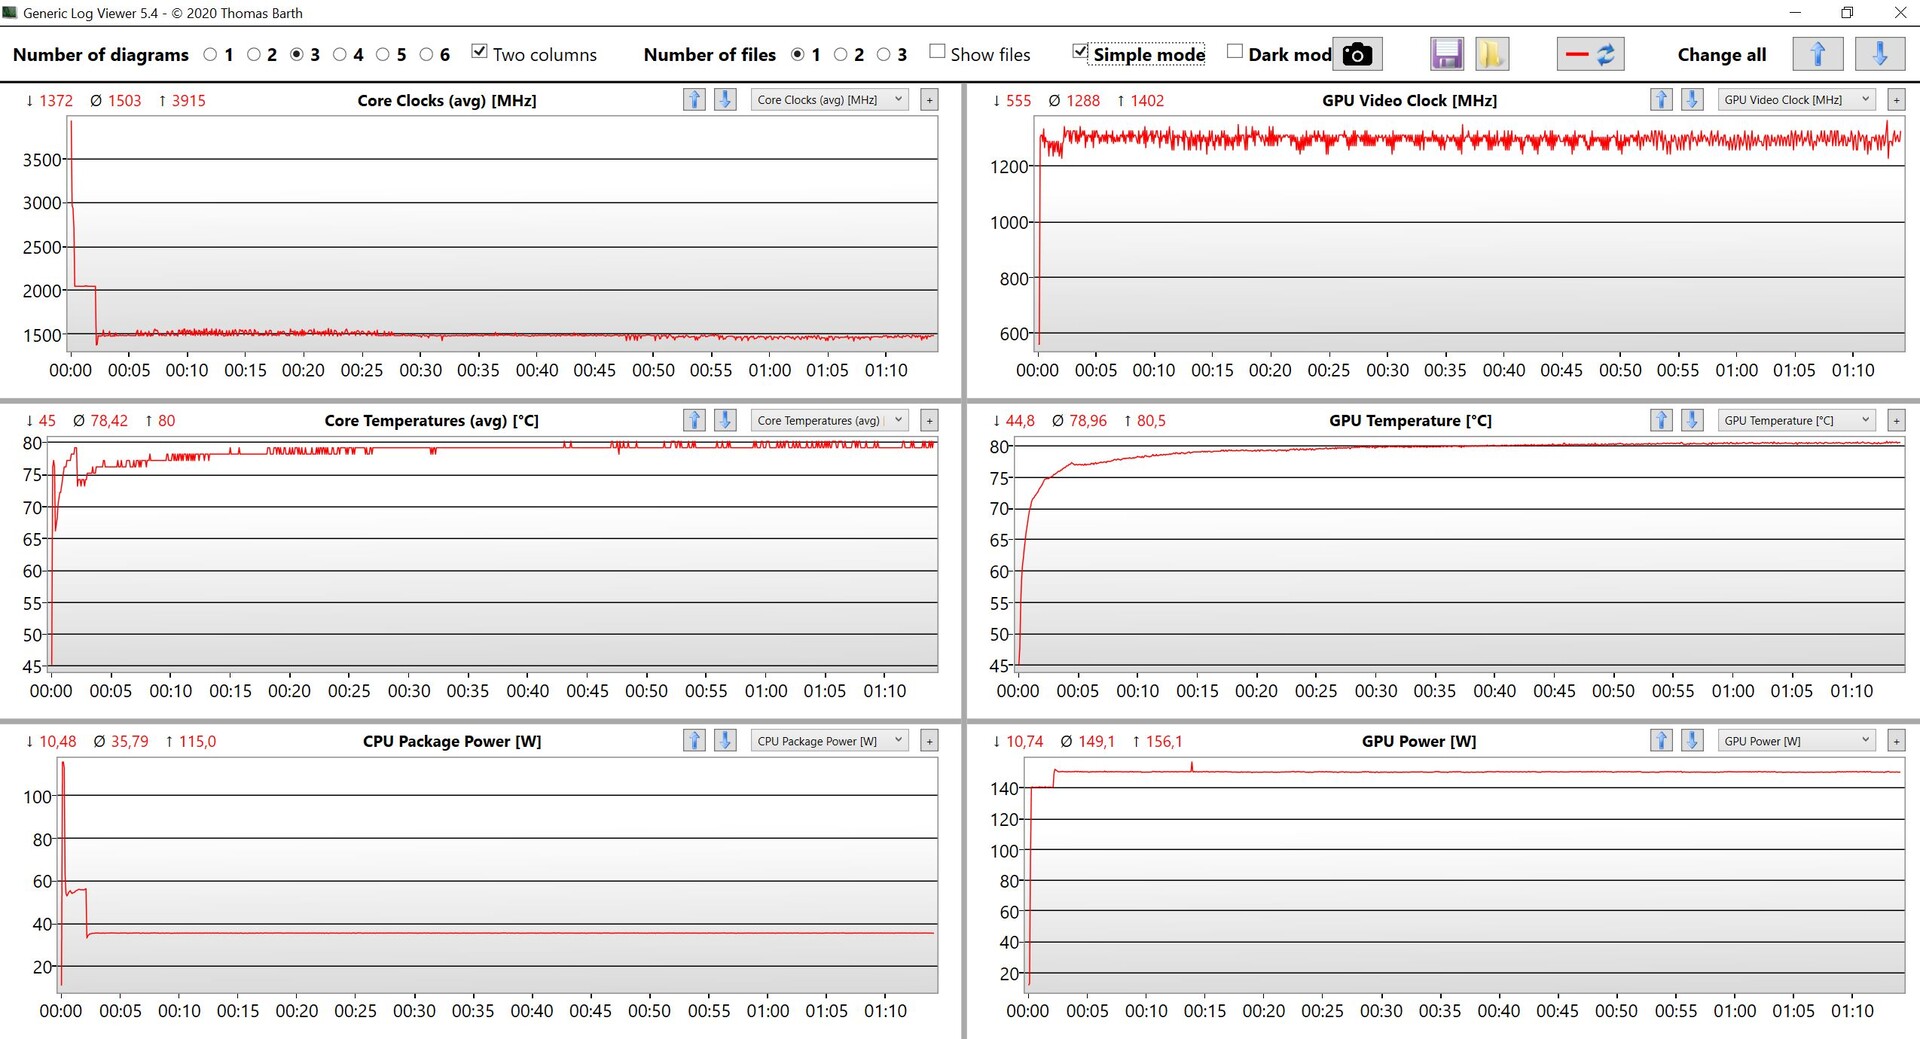
Le logiciel ROG offre de nombreuses options de configuration et de profils d'alimentation. Par exemple, vous pouvez désactiver complètement le GPU intégré (MUX) ou définir manuellement les valeurs de puissance pour le CPU et le GPU. Pour nos benchmarks et nos mesures ci-dessous, nous utilisons le profil Performance, car il met déjà à disposition la totalité des performances du GPU. Bien que les performances du CPU soient même légèrement supérieures en mode Turbo, cela ne justifie pas, à notre avis, le bruit nettement plus élevé du ventilateur.
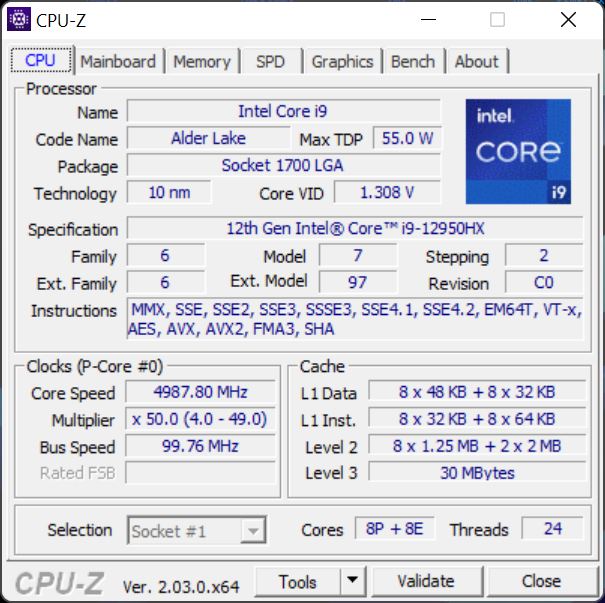
Processeur - Core i9-12950HX
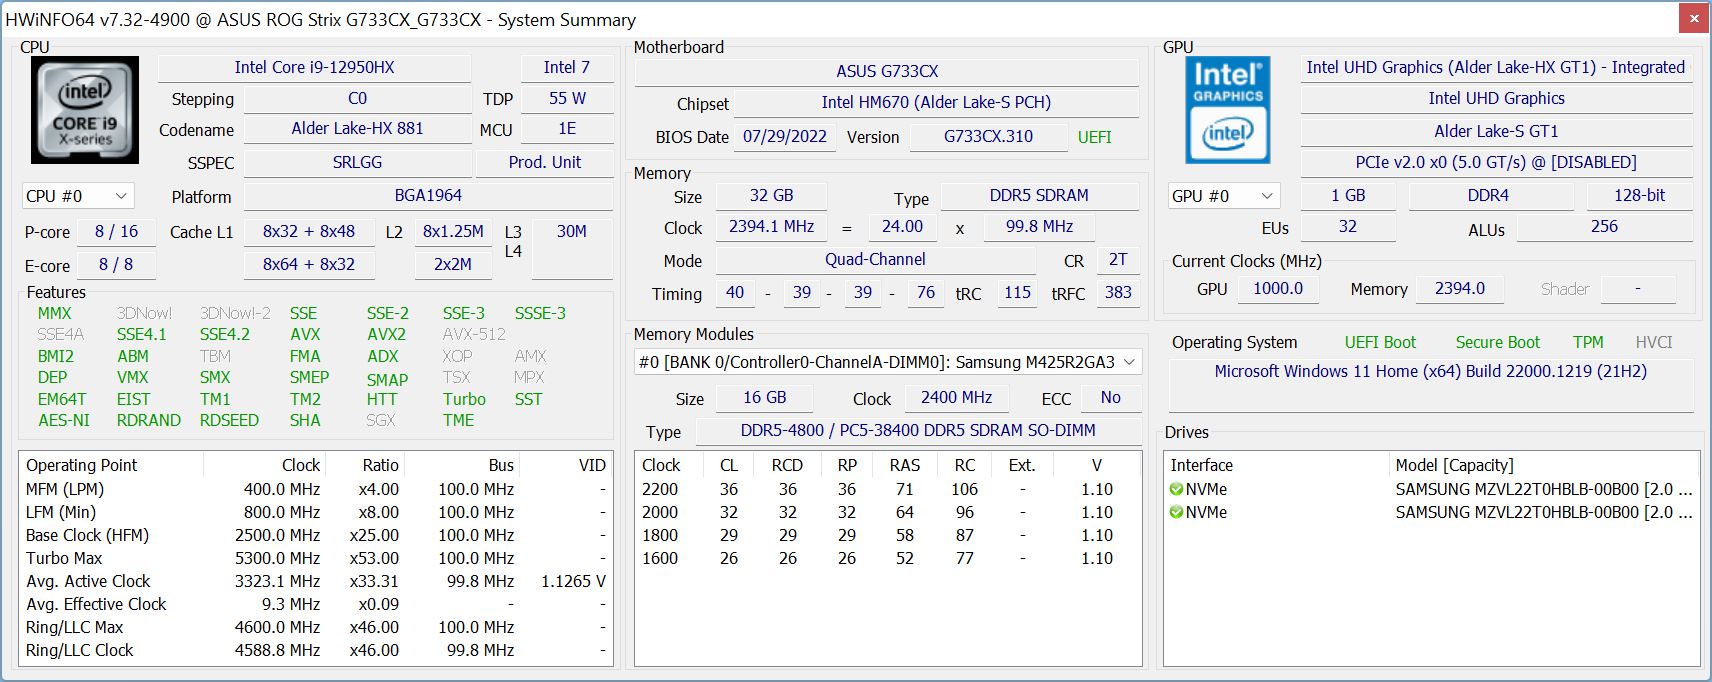
Le siteIntel Core i9-12950HX est actuellement le processeur mobile le plus rapide d'Intel. Bien qu'il soit capable de consommer jusqu'à 175 watts, il reste loin de cette valeur dans notre unité de test. Au lieu de cela, nous voyons une consommation maximale de 115 watts (même en mode Turbo), et à un certain point la valeur se stabilise à 70 watts (105 watts en mode Turbo). Bien que les performances du processeur ne soient pas mauvaises du tout, vous pourriez également les obtenir avec un Core i9 ordinaire, et la prime supplémentaire pour la puce HX ne vaut pas la dépense supplémentaire
En fonctionnement sur batterie, la consommation d'énergie est limitée à 35 watts, ce qui entraîne une réduction des performances multicœurs d'environ 40 %. Vous pouvez trouver des benchmarks CPU supplémentaires dans notre section technique correspondante.
Cinebench R15 Multi Constant Load Test
Cinebench R23: Multi Core | Single Core
Cinebench R20: CPU (Multi Core) | CPU (Single Core)
Cinebench R15: CPU Multi 64Bit | CPU Single 64Bit
Blender: v2.79 BMW27 CPU
7-Zip 18.03: 7z b 4 | 7z b 4 -mmt1
Geekbench 5.5: Multi-Core | Single-Core
HWBOT x265 Benchmark v2.2: 4k Preset
LibreOffice : 20 Documents To PDF
R Benchmark 2.5: Overall mean
| CPU Performance rating | |
| Moyenne de la classe Gaming | |
| Lenovo Legion 7 16IAX7-82TD004SGE | |
| MSI Titan GT77 12UHS | |
| Asus ROG Strix Scar 17 SE G733CX-LL014W | |
| Moyenne Intel Core i9-12950HX | |
| Alienware x17 R2 P48E | |
| Schenker XMG Neo 17 M22 | |
| Asus Strix Scar 17 G733QSA-XS99 | |
| Cinebench R23 / Multi Core | |
| Moyenne de la classe Gaming (10488 - 40970, n=112, 2 dernières années) | |
| MSI Titan GT77 12UHS | |
| Lenovo Legion 7 16IAX7-82TD004SGE | |
| Asus ROG Strix Scar 17 SE G733CX-LL014W | |
| Moyenne Intel Core i9-12950HX (16277 - 23113, n=7) | |
| Alienware x17 R2 P48E | |
| Schenker XMG Neo 17 M22 | |
| Asus Strix Scar 17 G733QSA-XS99 | |
| Cinebench R23 / Single Core | |
| Moyenne de la classe Gaming (1166 - 2356, n=112, 2 dernières années) | |
| Lenovo Legion 7 16IAX7-82TD004SGE | |
| MSI Titan GT77 12UHS | |
| Alienware x17 R2 P48E | |
| Asus ROG Strix Scar 17 SE G733CX-LL014W | |
| Moyenne Intel Core i9-12950HX (1465 - 1922, n=7) | |
| Schenker XMG Neo 17 M22 | |
| Asus Strix Scar 17 G733QSA-XS99 | |
| Cinebench R20 / CPU (Multi Core) | |
| Moyenne de la classe Gaming (4029 - 16108, n=111, 2 dernières années) | |
| MSI Titan GT77 12UHS | |
| Lenovo Legion 7 16IAX7-82TD004SGE | |
| Moyenne Intel Core i9-12950HX (6625 - 8777, n=7) | |
| Asus ROG Strix Scar 17 SE G733CX-LL014W | |
| Alienware x17 R2 P48E | |
| Schenker XMG Neo 17 M22 | |
| Asus Strix Scar 17 G733QSA-XS99 | |
| Cinebench R20 / CPU (Single Core) | |
| Moyenne de la classe Gaming (442 - 895, n=111, 2 dernières années) | |
| Lenovo Legion 7 16IAX7-82TD004SGE | |
| Asus ROG Strix Scar 17 SE G733CX-LL014W | |
| MSI Titan GT77 12UHS | |
| Alienware x17 R2 P48E | |
| Moyenne Intel Core i9-12950HX (703 - 741, n=7) | |
| Schenker XMG Neo 17 M22 | |
| Asus Strix Scar 17 G733QSA-XS99 | |
| Cinebench R15 / CPU Multi 64Bit | |
| Moyenne de la classe Gaming (1578 - 6271, n=111, 2 dernières années) | |
| MSI Titan GT77 12UHS | |
| Lenovo Legion 7 16IAX7-82TD004SGE | |
| Asus ROG Strix Scar 17 SE G733CX-LL014W | |
| Moyenne Intel Core i9-12950HX (2464 - 3530, n=7) | |
| Alienware x17 R2 P48E | |
| Schenker XMG Neo 17 M22 | |
| Asus Strix Scar 17 G733QSA-XS99 | |
| Cinebench R15 / CPU Single 64Bit | |
| Moyenne de la classe Gaming (188.8 - 343, n=111, 2 dernières années) | |
| Lenovo Legion 7 16IAX7-82TD004SGE | |
| MSI Titan GT77 12UHS | |
| Asus ROG Strix Scar 17 SE G733CX-LL014W | |
| Alienware x17 R2 P48E | |
| Moyenne Intel Core i9-12950HX (167 - 276, n=7) | |
| Schenker XMG Neo 17 M22 | |
| Asus Strix Scar 17 G733QSA-XS99 | |
| Blender / v2.79 BMW27 CPU | |
| Asus Strix Scar 17 G733QSA-XS99 | |
| Schenker XMG Neo 17 M22 | |
| Asus ROG Strix Scar 17 SE G733CX-LL014W | |
| Alienware x17 R2 P48E | |
| Moyenne Intel Core i9-12950HX (138 - 193, n=7) | |
| Moyenne de la classe Gaming (80 - 330, n=109, 2 dernières années) | |
| Lenovo Legion 7 16IAX7-82TD004SGE | |
| MSI Titan GT77 12UHS | |
| 7-Zip 18.03 / 7z b 4 | |
| Moyenne de la classe Gaming (33491 - 148086, n=110, 2 dernières années) | |
| Lenovo Legion 7 16IAX7-82TD004SGE | |
| MSI Titan GT77 12UHS | |
| Moyenne Intel Core i9-12950HX (65637 - 85019, n=7) | |
| Asus ROG Strix Scar 17 SE G733CX-LL014W | |
| Alienware x17 R2 P48E | |
| Schenker XMG Neo 17 M22 | |
| Asus Strix Scar 17 G733QSA-XS99 | |
| 7-Zip 18.03 / 7z b 4 -mmt1 | |
| Moyenne de la classe Gaming (4199 - 7436, n=110, 2 dernières années) | |
| Lenovo Legion 7 16IAX7-82TD004SGE | |
| MSI Titan GT77 12UHS | |
| Asus ROG Strix Scar 17 SE G733CX-LL014W | |
| Moyenne Intel Core i9-12950HX (6022 - 6318, n=7) | |
| Schenker XMG Neo 17 M22 | |
| Alienware x17 R2 P48E | |
| Asus Strix Scar 17 G733QSA-XS99 | |
| Geekbench 5.5 / Multi-Core | |
| Moyenne de la classe Gaming (6460 - 27010, n=110, 2 dernières années) | |
| Lenovo Legion 7 16IAX7-82TD004SGE | |
| MSI Titan GT77 12UHS | |
| Asus ROG Strix Scar 17 SE G733CX-LL014W | |
| Moyenne Intel Core i9-12950HX (14028 - 16009, n=7) | |
| Alienware x17 R2 P48E | |
| Schenker XMG Neo 17 M22 | |
| Asus Strix Scar 17 G733QSA-XS99 | |
| Geekbench 5.5 / Single-Core | |
| Moyenne de la classe Gaming (986 - 2474, n=110, 2 dernières années) | |
| MSI Titan GT77 12UHS | |
| Moyenne Intel Core i9-12950HX (1847 - 1945, n=7) | |
| Alienware x17 R2 P48E | |
| Lenovo Legion 7 16IAX7-82TD004SGE | |
| Asus ROG Strix Scar 17 SE G733CX-LL014W | |
| Schenker XMG Neo 17 M22 | |
| Asus Strix Scar 17 G733QSA-XS99 | |
| HWBOT x265 Benchmark v2.2 / 4k Preset | |
| Moyenne de la classe Gaming (11.5 - 44.3, n=110, 2 dernières années) | |
| MSI Titan GT77 12UHS | |
| Lenovo Legion 7 16IAX7-82TD004SGE | |
| Asus ROG Strix Scar 17 SE G733CX-LL014W | |
| Moyenne Intel Core i9-12950HX (18.6 - 26.5, n=7) | |
| Alienware x17 R2 P48E | |
| Schenker XMG Neo 17 M22 | |
| Asus Strix Scar 17 G733QSA-XS99 | |
| LibreOffice / 20 Documents To PDF | |
| Schenker XMG Neo 17 M22 | |
| Moyenne de la classe Gaming (19 - 88.8, n=110, 2 dernières années) | |
| Asus Strix Scar 17 G733QSA-XS99 | |
| Alienware x17 R2 P48E | |
| Moyenne Intel Core i9-12950HX (34.7 - 45.4, n=7) | |
| MSI Titan GT77 12UHS | |
| Asus ROG Strix Scar 17 SE G733CX-LL014W | |
| Lenovo Legion 7 16IAX7-82TD004SGE | |
| R Benchmark 2.5 / Overall mean | |
| Asus Strix Scar 17 G733QSA-XS99 | |
| Schenker XMG Neo 17 M22 | |
| Moyenne Intel Core i9-12950HX (0.4251 - 0.4515, n=7) | |
| Alienware x17 R2 P48E | |
| Moyenne de la classe Gaming (0.3439 - 0.759, n=111, 2 dernières années) | |
| Asus ROG Strix Scar 17 SE G733CX-LL014W | |
| Lenovo Legion 7 16IAX7-82TD004SGE | |
| MSI Titan GT77 12UHS | |
* ... Moindre est la valeur, meilleures sont les performances
AIDA64: FP32 Ray-Trace | FPU Julia | CPU SHA3 | CPU Queen | FPU SinJulia | FPU Mandel | CPU AES | CPU ZLib | FP64 Ray-Trace | CPU PhotoWorxx
| Performance rating | |
| Moyenne de la classe Gaming | |
| MSI Titan GT77 12UHS | |
| Asus ROG Strix Scar 17 SE G733CX-LL014W | |
| Moyenne Intel Core i9-12950HX | |
| Schenker XMG Neo 17 M22 | |
| Asus Strix Scar 17 G733QSA-XS99 | |
| Lenovo Legion 7 16IAX7-82TD004SGE | |
| Alienware x17 R2 P48E | |
| AIDA64 / FP32 Ray-Trace | |
| Moyenne de la classe Gaming (10227 - 85542, n=109, 2 dernières années) | |
| MSI Titan GT77 12UHS | |
| Moyenne Intel Core i9-12950HX (15499 - 22868, n=7) | |
| Asus ROG Strix Scar 17 SE G733CX-LL014W | |
| Schenker XMG Neo 17 M22 | |
| Asus Strix Scar 17 G733QSA-XS99 | |
| Lenovo Legion 7 16IAX7-82TD004SGE | |
| Alienware x17 R2 P48E | |
| AIDA64 / FPU Julia | |
| Moyenne de la classe Gaming (51376 - 238426, n=109, 2 dernières années) | |
| MSI Titan GT77 12UHS | |
| Asus Strix Scar 17 G733QSA-XS99 | |
| Schenker XMG Neo 17 M22 | |
| Moyenne Intel Core i9-12950HX (77846 - 115907, n=7) | |
| Asus ROG Strix Scar 17 SE G733CX-LL014W | |
| Lenovo Legion 7 16IAX7-82TD004SGE | |
| Alienware x17 R2 P48E | |
| AIDA64 / CPU SHA3 | |
| Moyenne de la classe Gaming (2180 - 9817, n=109, 2 dernières années) | |
| MSI Titan GT77 12UHS | |
| Lenovo Legion 7 16IAX7-82TD004SGE | |
| Asus ROG Strix Scar 17 SE G733CX-LL014W | |
| Moyenne Intel Core i9-12950HX (3426 - 5069, n=7) | |
| Alienware x17 R2 P48E | |
| Asus Strix Scar 17 G733QSA-XS99 | |
| Schenker XMG Neo 17 M22 | |
| AIDA64 / CPU Queen | |
| Moyenne de la classe Gaming (49785 - 173351, n=100, 2 dernières années) | |
| Alienware x17 R2 P48E | |
| Asus ROG Strix Scar 17 SE G733CX-LL014W | |
| Moyenne Intel Core i9-12950HX (102752 - 104726, n=7) | |
| Asus Strix Scar 17 G733QSA-XS99 | |
| MSI Titan GT77 12UHS | |
| Schenker XMG Neo 17 M22 | |
| Lenovo Legion 7 16IAX7-82TD004SGE | |
| AIDA64 / FPU SinJulia | |
| Moyenne de la classe Gaming (4424 - 33636, n=109, 2 dernières années) | |
| Lenovo Legion 7 16IAX7-82TD004SGE | |
| MSI Titan GT77 12UHS | |
| Schenker XMG Neo 17 M22 | |
| Asus Strix Scar 17 G733QSA-XS99 | |
| Moyenne Intel Core i9-12950HX (10134 - 12823, n=7) | |
| Asus ROG Strix Scar 17 SE G733CX-LL014W | |
| Alienware x17 R2 P48E | |
| AIDA64 / FPU Mandel | |
| Moyenne de la classe Gaming (25115 - 128721, n=109, 2 dernières années) | |
| Asus Strix Scar 17 G733QSA-XS99 | |
| Schenker XMG Neo 17 M22 | |
| MSI Titan GT77 12UHS | |
| Moyenne Intel Core i9-12950HX (37146 - 57340, n=7) | |
| Asus ROG Strix Scar 17 SE G733CX-LL014W | |
| Lenovo Legion 7 16IAX7-82TD004SGE | |
| Alienware x17 R2 P48E | |
| AIDA64 / CPU AES | |
| MSI Titan GT77 12UHS | |
| Asus ROG Strix Scar 17 SE G733CX-LL014W | |
| Schenker XMG Neo 17 M22 | |
| Asus Strix Scar 17 G733QSA-XS99 | |
| Lenovo Legion 7 16IAX7-82TD004SGE | |
| Moyenne Intel Core i9-12950HX (72599 - 181128, n=7) | |
| Alienware x17 R2 P48E | |
| Moyenne de la classe Gaming (39258 - 247074, n=109, 2 dernières années) | |
| AIDA64 / CPU ZLib | |
| Moyenne de la classe Gaming (574 - 2531, n=109, 2 dernières années) | |
| Lenovo Legion 7 16IAX7-82TD004SGE | |
| MSI Titan GT77 12UHS | |
| Asus ROG Strix Scar 17 SE G733CX-LL014W | |
| Alienware x17 R2 P48E | |
| Moyenne Intel Core i9-12950HX (996 - 1417, n=7) | |
| Asus Strix Scar 17 G733QSA-XS99 | |
| Schenker XMG Neo 17 M22 | |
| AIDA64 / FP64 Ray-Trace | |
| Moyenne de la classe Gaming (5509 - 45446, n=109, 2 dernières années) | |
| MSI Titan GT77 12UHS | |
| Moyenne Intel Core i9-12950HX (8455 - 12432, n=7) | |
| Asus ROG Strix Scar 17 SE G733CX-LL014W | |
| Asus Strix Scar 17 G733QSA-XS99 | |
| Schenker XMG Neo 17 M22 | |
| Lenovo Legion 7 16IAX7-82TD004SGE | |
| Alienware x17 R2 P48E | |
| AIDA64 / CPU PhotoWorxx | |
| Moyenne de la classe Gaming (12271 - 89891, n=109, 2 dernières années) | |
| Asus ROG Strix Scar 17 SE G733CX-LL014W | |
| MSI Titan GT77 12UHS | |
| Moyenne Intel Core i9-12950HX (35479 - 42655, n=7) | |
| Lenovo Legion 7 16IAX7-82TD004SGE | |
| Alienware x17 R2 P48E | |
| Schenker XMG Neo 17 M22 | |
| Asus Strix Scar 17 G733QSA-XS99 | |
Performance du système
L'impression subjective de performance est excellente, ce qui est également confirmé par les bons résultats des tests de référence. Nous ne remarquons aucun problème au cours des tests.
CrossMark: Overall | Productivity | Creativity | Responsiveness
| PCMark 10 / Score | |
| Lenovo Legion 7 16IAX7-82TD004SGE | |
| Moyenne de la classe Gaming (5828 - 11574, n=95, 2 dernières années) | |
| MSI Titan GT77 12UHS | |
| Alienware x17 R2 P48E | |
| Asus ROG Strix Scar 17 SE G733CX-LL014W | |
| Moyenne Intel Core i9-12950HX, NVIDIA GeForce RTX 3080 Ti Laptop GPU (n=1) | |
| Asus Strix Scar 17 G733QSA-XS99 | |
| Schenker XMG Neo 17 M22 | |
| PCMark 10 / Essentials | |
| Alienware x17 R2 P48E | |
| Lenovo Legion 7 16IAX7-82TD004SGE | |
| MSI Titan GT77 12UHS | |
| Moyenne de la classe Gaming (8810 - 12600, n=99, 2 dernières années) | |
| Asus Strix Scar 17 G733QSA-XS99 | |
| Asus ROG Strix Scar 17 SE G733CX-LL014W | |
| Moyenne Intel Core i9-12950HX, NVIDIA GeForce RTX 3080 Ti Laptop GPU (n=1) | |
| Schenker XMG Neo 17 M22 | |
| PCMark 10 / Productivity | |
| Lenovo Legion 7 16IAX7-82TD004SGE | |
| Moyenne de la classe Gaming (6845 - 18766, n=97, 2 dernières années) | |
| MSI Titan GT77 12UHS | |
| Alienware x17 R2 P48E | |
| Asus ROG Strix Scar 17 SE G733CX-LL014W | |
| Moyenne Intel Core i9-12950HX, NVIDIA GeForce RTX 3080 Ti Laptop GPU (n=1) | |
| Asus Strix Scar 17 G733QSA-XS99 | |
| Schenker XMG Neo 17 M22 | |
| PCMark 10 / Digital Content Creation | |
| Lenovo Legion 7 16IAX7-82TD004SGE | |
| Moyenne de la classe Gaming (7602 - 19657, n=97, 2 dernières années) | |
| MSI Titan GT77 12UHS | |
| Alienware x17 R2 P48E | |
| Asus ROG Strix Scar 17 SE G733CX-LL014W | |
| Moyenne Intel Core i9-12950HX, NVIDIA GeForce RTX 3080 Ti Laptop GPU (n=1) | |
| Asus Strix Scar 17 G733QSA-XS99 | |
| Schenker XMG Neo 17 M22 | |
| CrossMark / Overall | |
| Lenovo Legion 7 16IAX7-82TD004SGE | |
| Asus ROG Strix Scar 17 SE G733CX-LL014W | |
| Moyenne Intel Core i9-12950HX, NVIDIA GeForce RTX 3080 Ti Laptop GPU (n=1) | |
| MSI Titan GT77 12UHS | |
| Moyenne de la classe Gaming (1366 - 2409, n=97, 2 dernières années) | |
| Alienware x17 R2 P48E | |
| Schenker XMG Neo 17 M22 | |
| CrossMark / Productivity | |
| Lenovo Legion 7 16IAX7-82TD004SGE | |
| MSI Titan GT77 12UHS | |
| Asus ROG Strix Scar 17 SE G733CX-LL014W | |
| Moyenne Intel Core i9-12950HX, NVIDIA GeForce RTX 3080 Ti Laptop GPU (n=1) | |
| Moyenne de la classe Gaming (1386 - 2254, n=97, 2 dernières années) | |
| Alienware x17 R2 P48E | |
| Schenker XMG Neo 17 M22 | |
| CrossMark / Creativity | |
| Asus ROG Strix Scar 17 SE G733CX-LL014W | |
| Moyenne Intel Core i9-12950HX, NVIDIA GeForce RTX 3080 Ti Laptop GPU (n=1) | |
| Lenovo Legion 7 16IAX7-82TD004SGE | |
| MSI Titan GT77 12UHS | |
| Moyenne de la classe Gaming (1343 - 2729, n=97, 2 dernières années) | |
| Alienware x17 R2 P48E | |
| Schenker XMG Neo 17 M22 | |
| CrossMark / Responsiveness | |
| Lenovo Legion 7 16IAX7-82TD004SGE | |
| MSI Titan GT77 12UHS | |
| Asus ROG Strix Scar 17 SE G733CX-LL014W | |
| Moyenne Intel Core i9-12950HX, NVIDIA GeForce RTX 3080 Ti Laptop GPU (n=1) | |
| Moyenne de la classe Gaming (1226 - 2334, n=97, 2 dernières années) | |
| Alienware x17 R2 P48E | |
| Schenker XMG Neo 17 M22 | |
| PCMark 10 Score | 7208 points | |
Aide | ||
| AIDA64 / Memory Copy | |
| Moyenne de la classe Gaming (21750 - 129946, n=109, 2 dernières années) | |
| MSI Titan GT77 12UHS | |
| Lenovo Legion 7 16IAX7-82TD004SGE | |
| Asus ROG Strix Scar 17 SE G733CX-LL014W | |
| Moyenne Intel Core i9-12950HX (59731 - 64732, n=7) | |
| Alienware x17 R2 P48E | |
| Schenker XMG Neo 17 M22 | |
| Asus Strix Scar 17 G733QSA-XS99 | |
| AIDA64 / Memory Read | |
| Moyenne de la classe Gaming (22956 - 118858, n=109, 2 dernières années) | |
| Lenovo Legion 7 16IAX7-82TD004SGE | |
| Asus ROG Strix Scar 17 SE G733CX-LL014W | |
| Moyenne Intel Core i9-12950HX (59744 - 70359, n=7) | |
| MSI Titan GT77 12UHS | |
| Alienware x17 R2 P48E | |
| Schenker XMG Neo 17 M22 | |
| Asus Strix Scar 17 G733QSA-XS99 | |
| AIDA64 / Memory Write | |
| Moyenne de la classe Gaming (22297 - 135096, n=109, 2 dernières années) | |
| Asus ROG Strix Scar 17 SE G733CX-LL014W | |
| Lenovo Legion 7 16IAX7-82TD004SGE | |
| Moyenne Intel Core i9-12950HX (57750 - 67899, n=7) | |
| MSI Titan GT77 12UHS | |
| Schenker XMG Neo 17 M22 | |
| Alienware x17 R2 P48E | |
| Asus Strix Scar 17 G733QSA-XS99 | |
| AIDA64 / Memory Latency | |
| Moyenne de la classe Gaming (75.3 - 259, n=109, 2 dernières années) | |
| Alienware x17 R2 P48E | |
| Schenker XMG Neo 17 M22 | |
| MSI Titan GT77 12UHS | |
| Moyenne Intel Core i9-12950HX (84.5 - 92.2, n=7) | |
| Lenovo Legion 7 16IAX7-82TD004SGE | |
| Asus ROG Strix Scar 17 SE G733CX-LL014W | |
| Asus Strix Scar 17 G733QSA-XS99 | |
* ... Moindre est la valeur, meilleures sont les performances
Latences DPC
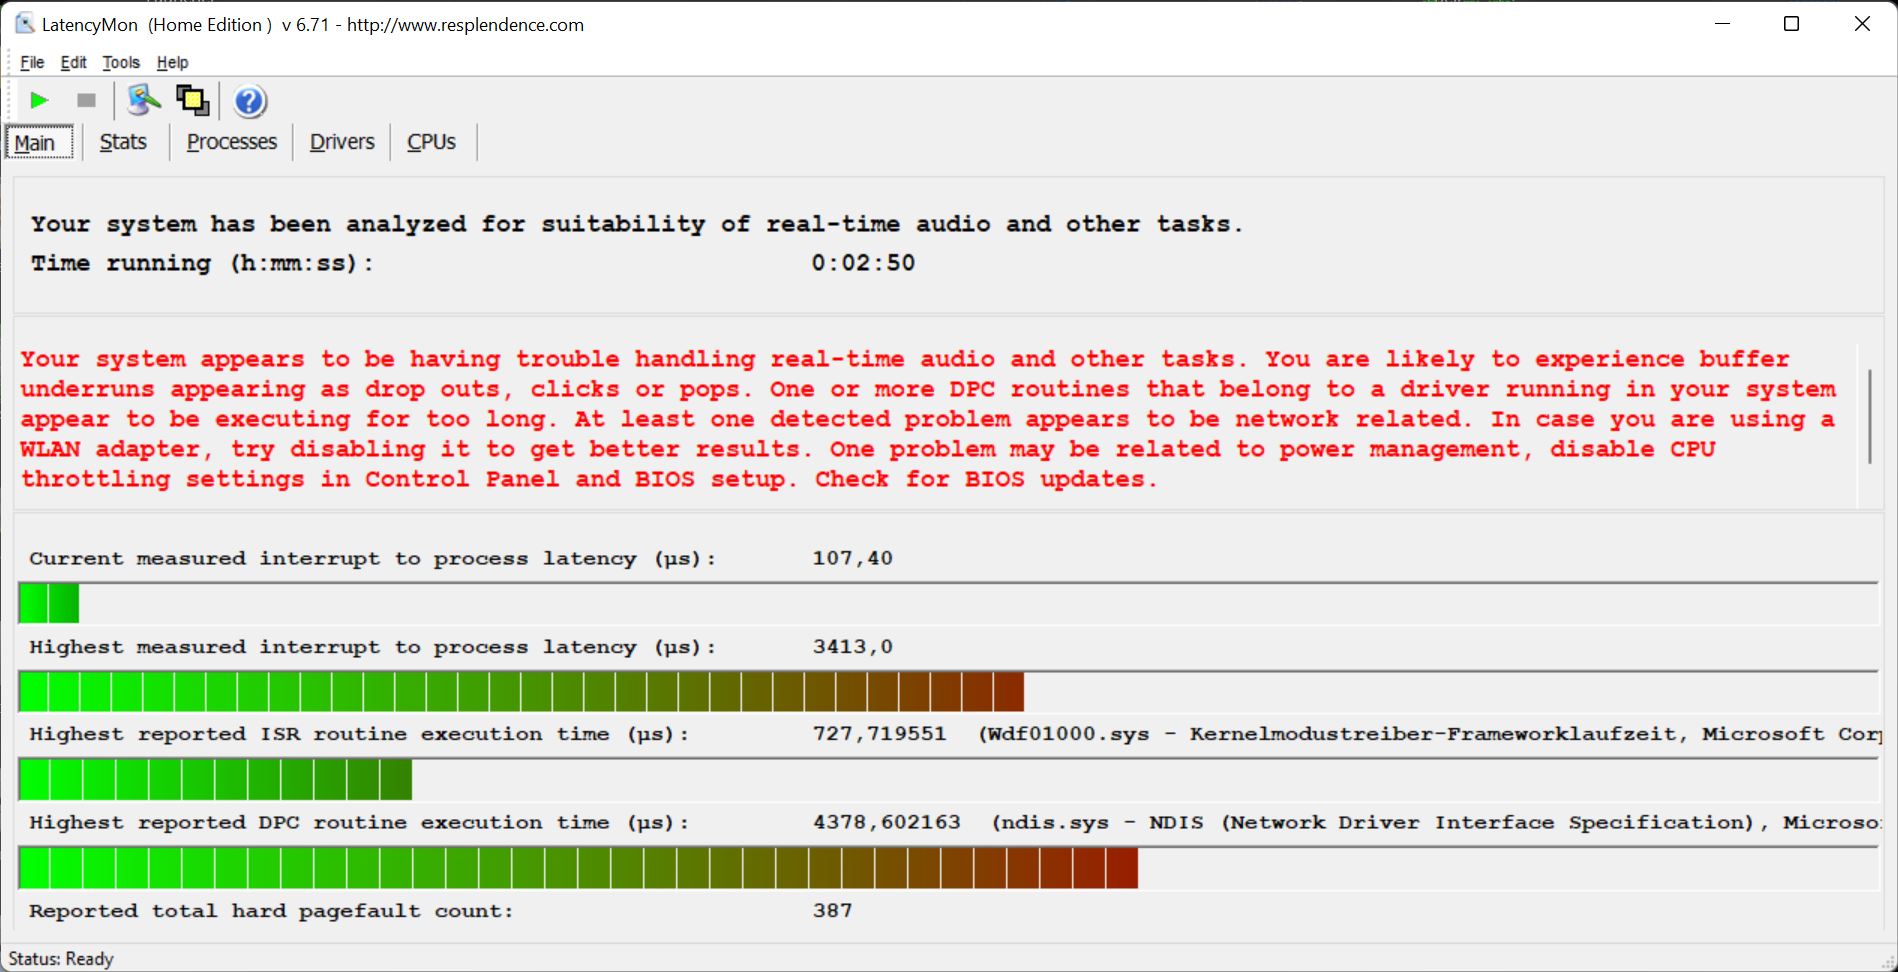
Dans notre test de latence standardisé (navigation sur Internet, vidéo YouTube 4K, charge du processeur), notre unité de test avec sa version BIOS présente quelques problèmes, elle n'est donc pas adaptée au traitement vidéo et audio en temps réel.
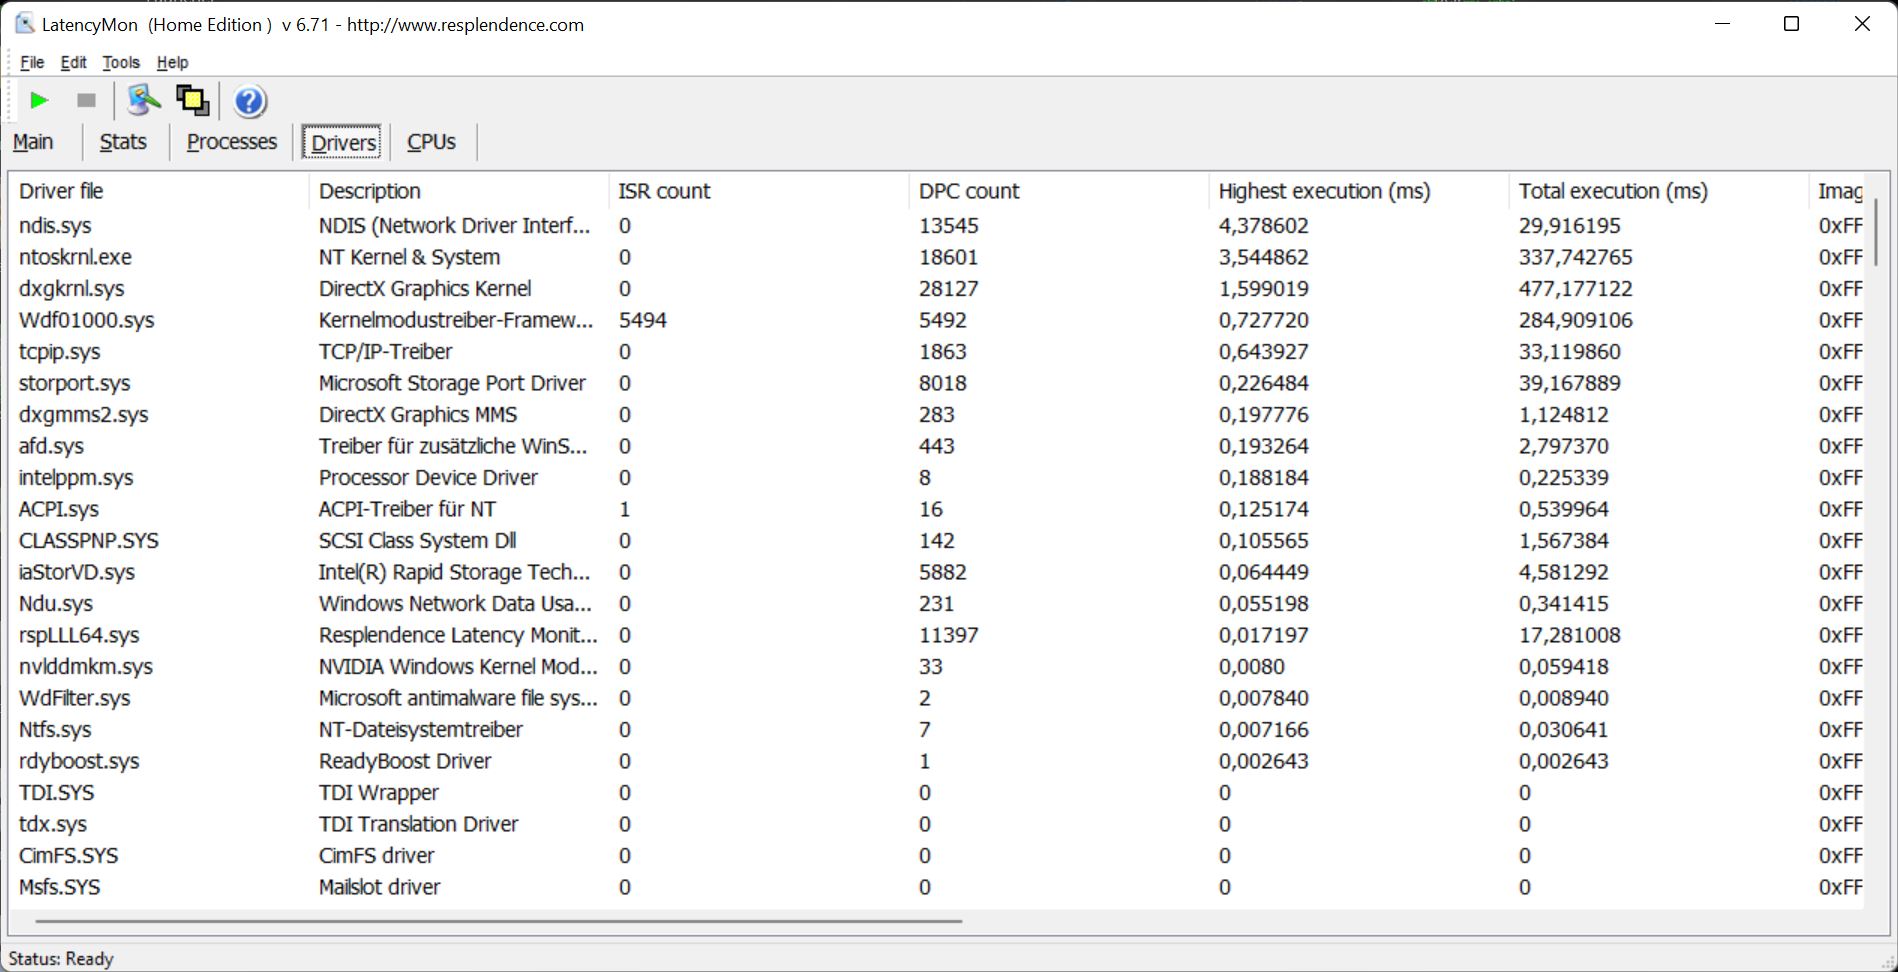
| DPC Latencies / LatencyMon - interrupt to process latency (max), Web, Youtube, Prime95 | |
| Schenker XMG Neo 17 M22 | |
| Asus ROG Strix Scar 17 SE G733CX-LL014W | |
| MSI Titan GT77 12UHS | |
| MSI Titan GT77 12UHS | |
| Lenovo Legion 7 16IAX7-82TD004SGE | |
| Alienware x17 R2 P48E | |
| Asus Strix Scar 17 G733QSA-XS99 | |
* ... Moindre est la valeur, meilleures sont les performances
Solution de stockage
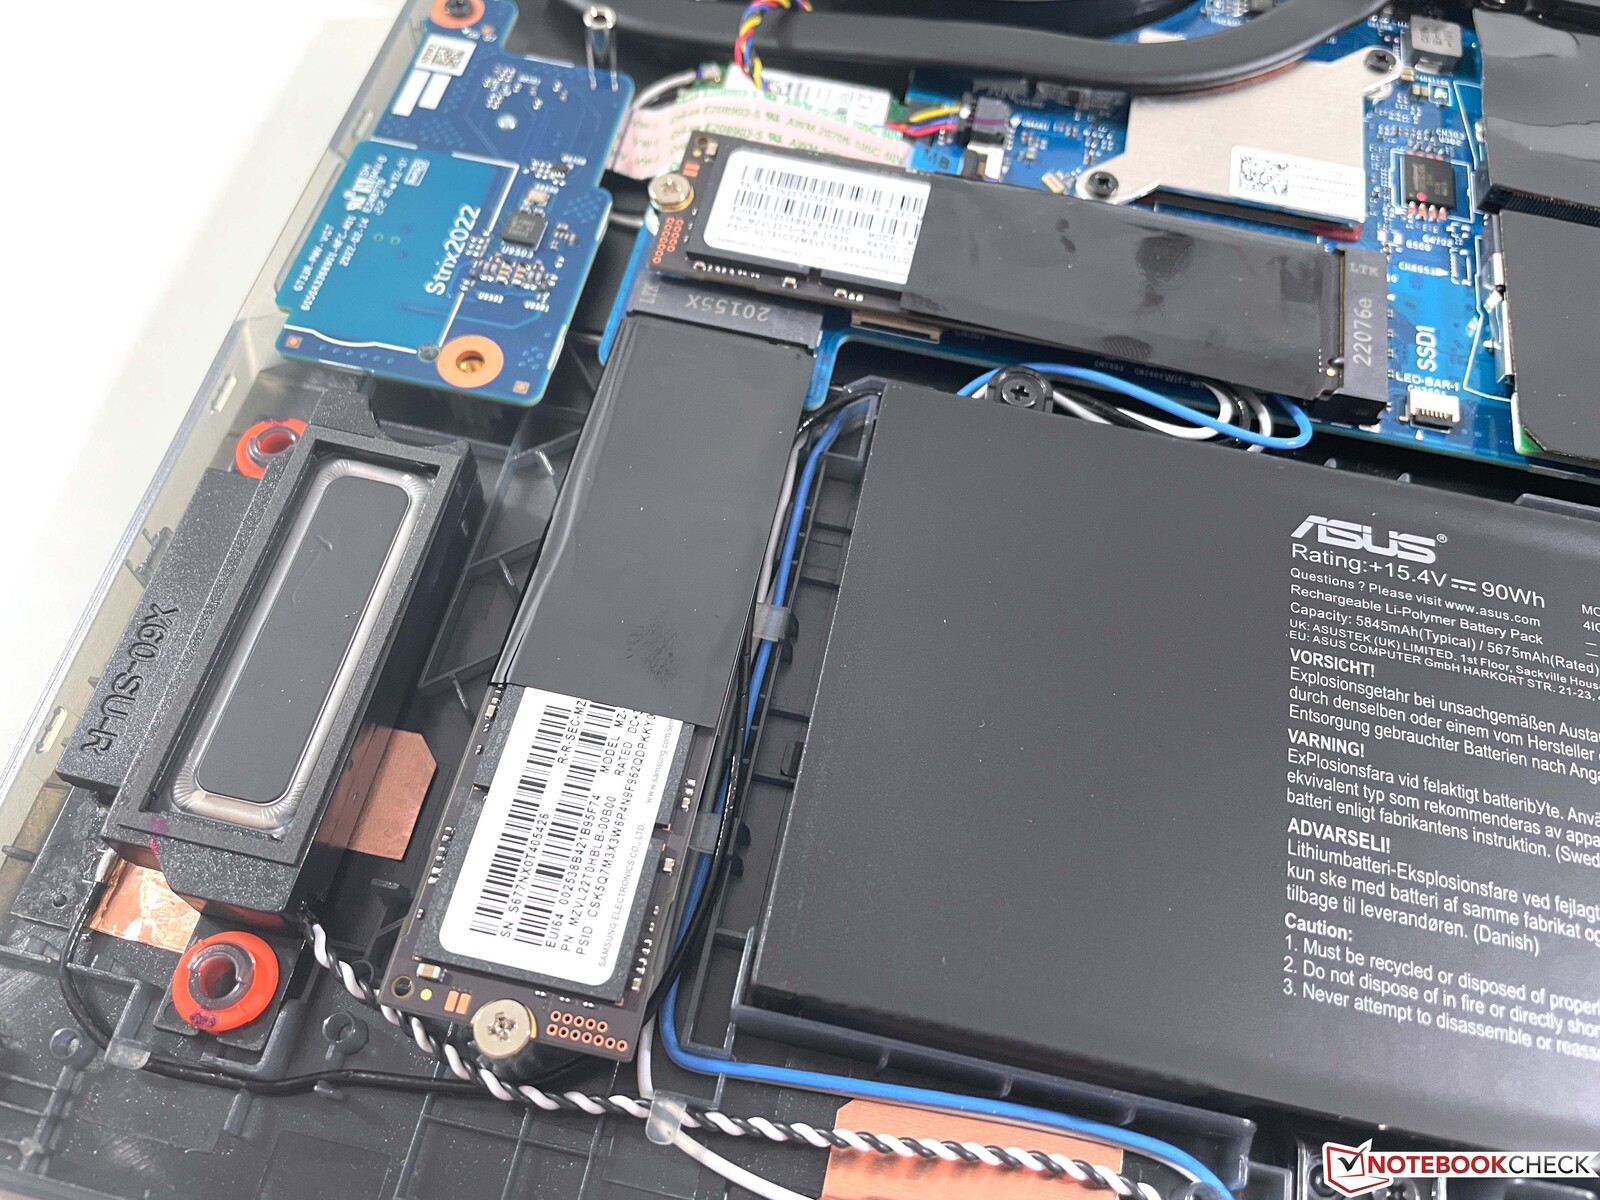
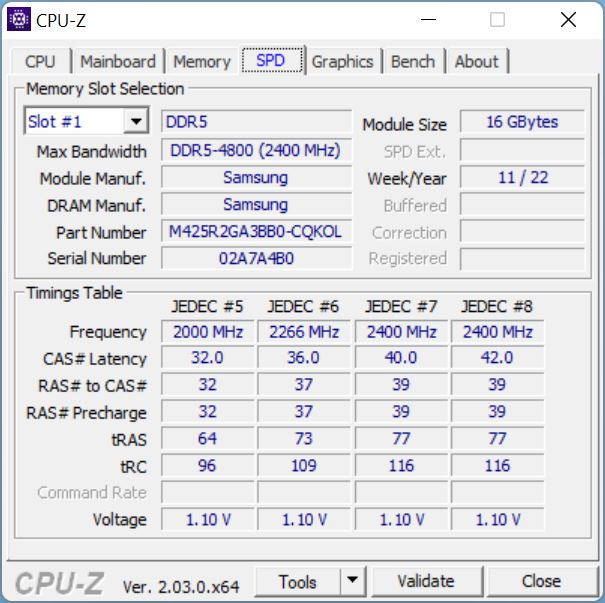
Asus utilise ici deux disques SSD rapides de 2 To de Samsung (PM91A) dans une configuration RAID 0. Cela permet des taux de transfert extrêmement élevés de plus de 10 Go/s. Cependant, les performances ne restent pas stables sous une charge constante, mais chutent massivement. Mais cela ne devrait pas poser de problème pour les jeux quotidiens. Vous pouvez trouver d'autres benchmarks SSD ici.

* ... Moindre est la valeur, meilleures sont les performances
Disk Throttling: DiskSpd Read Loop, Queue Depth 8
Carte graphique
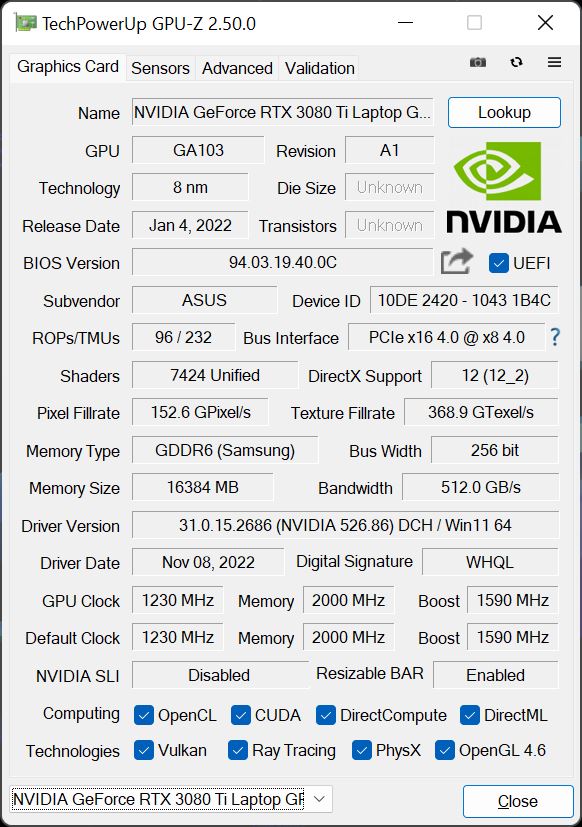
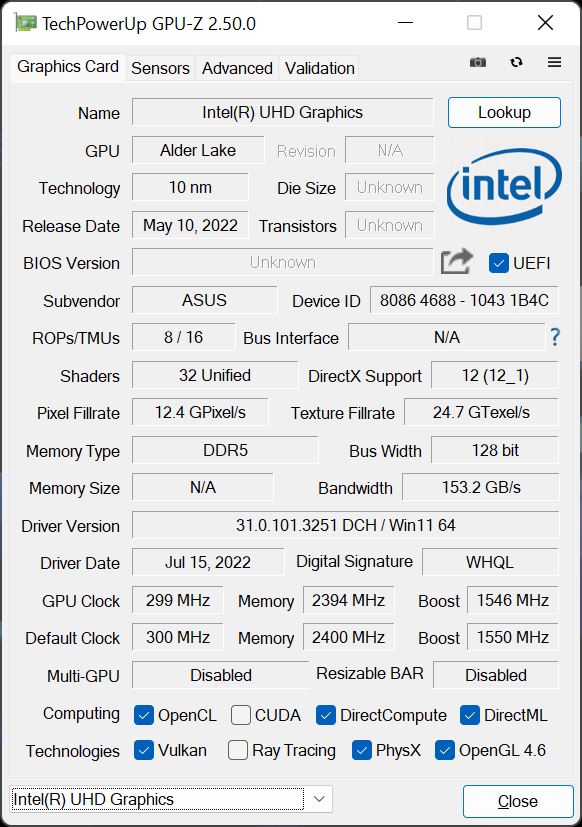
Asus utilise laGeForce RTX 3080 Ti avec un TGP de 150 watts, et le GPU est également capable d'utiliser 25 watts supplémentaires de Dynamic Boost du processeur. Il atteint également cette valeur (175 watts) en mode Performance, il n'est donc pas nécessaire d'utiliser le mode Turbo. Il existe également un MUX qui permet de désactiver complètement le GPU intégré (nécessite un redémarrage), ce qui améliore les latences pendant les jeux mais n'a pas beaucoup d'effet sur les performances graphiques elles-mêmes
Les performances graphiques se situent dans le groupe des meilleures performances et sont également supérieures aux valeurs moyennes pour la RTX 3080 Ti dans notre base de données. En outre, les performances graphiques restent parfaitement stables. Le test de stress 3DMark Time Spy est passé sans problème, et il n'y a pas non plus de baisse de performance dans notre test de charge constante The Witcher 3. La performance de jeu est facilement suffisante pour un maximum de détails dans la résolution native QHD, même dans les jeux exigeants.
En fonctionnement sur batterie, le GPU est autorisé à consommer un maximum de 44 watts, ce qui correspond à une baisse de performance d'environ 70 %. Vous pouvez trouver d'autres benchmarks GPU ici.
| 3DMark 11 Performance | 35997 points | |
| 3DMark Fire Strike Score | 28793 points | |
| 3DMark Time Spy Score | 12904 points | |
Aide | ||
| Blender / v3.3 Classroom OPTIX/RTX | |
| Moyenne NVIDIA GeForce RTX 3080 Ti Laptop GPU (20 - 28, n=13) | |
| Lenovo Legion 7 16IAX7-82TD004SGE | |
| Asus ROG Strix Scar 17 SE G733CX-LL014W | |
| MSI Titan GT77 12UHS | |
| Moyenne de la classe Gaming (9 - 32, n=111, 2 dernières années) | |
| Blender / v3.3 Classroom CUDA | |
| Lenovo Legion 7 16IAX7-82TD004SGE | |
| Moyenne NVIDIA GeForce RTX 3080 Ti Laptop GPU (32 - 41, n=13) | |
| Asus ROG Strix Scar 17 SE G733CX-LL014W | |
| Moyenne de la classe Gaming (15 - 228, n=111, 2 dernières années) | |
| MSI Titan GT77 12UHS | |
| Blender / v3.3 Classroom CPU | |
| Asus ROG Strix Scar 17 SE G733CX-LL014W | |
| Moyenne NVIDIA GeForce RTX 3080 Ti Laptop GPU (261 - 429, n=13) | |
| Lenovo Legion 7 16IAX7-82TD004SGE | |
| MSI Titan GT77 12UHS | |
| Moyenne de la classe Gaming (122 - 565, n=107, 2 dernières années) | |
* ... Moindre est la valeur, meilleures sont les performances
| The Witcher 3 - 1920x1080 Ultra Graphics & Postprocessing (HBAO+) | |
| Moyenne de la classe Gaming (95 - 240, n=8, 2 dernières années) | |
| MSI Titan GT77 12UHS | |
| Alienware x17 R2 P48E | |
| Schenker XMG Neo 17 M22 | |
| Asus ROG Strix Scar 17 SE G733CX-LL014W | |
| Lenovo Legion 7 16IAX7-82TD004SGE | |
| Moyenne NVIDIA GeForce RTX 3080 Ti Laptop GPU (30 - 130.6, n=43) | |
| Asus Strix Scar 17 G733QSA-XS99 | |
The Witcher 3 FPS Chart
| Bas | Moyen | Élevé | Ultra | QHD | |
|---|---|---|---|---|---|
| GTA V (2015) | 186.8 | 180.7 | 126.7 | 114.1 | |
| The Witcher 3 (2015) | 118.8 | ||||
| Dota 2 Reborn (2015) | 211 | 191 | 180.8 | 169.8 | |
| Final Fantasy XV Benchmark (2018) | 173.3 | 156.2 | 118.5 | 92.8 | |
| X-Plane 11.11 (2018) | 165.3 | 143.5 | 116.2 | ||
| Strange Brigade (2018) | 236 | 211 | 157.7 | ||
| F1 2021 (2021) | 236 | 211 | 132.8 | 106.2 | |
| Cyberpunk 2077 1.6 (2022) | 103 | 101 | 98 | 87 | 56 |
| F1 22 (2022) | 235 | 235 | 199.7 | 78.9 | 52.9 |
| Call of Duty Modern Warfare 2 2022 (2022) | 135 | 109 | 107 | 78 |
Émissions et gestion de l'énergie
Niveaux de bruit
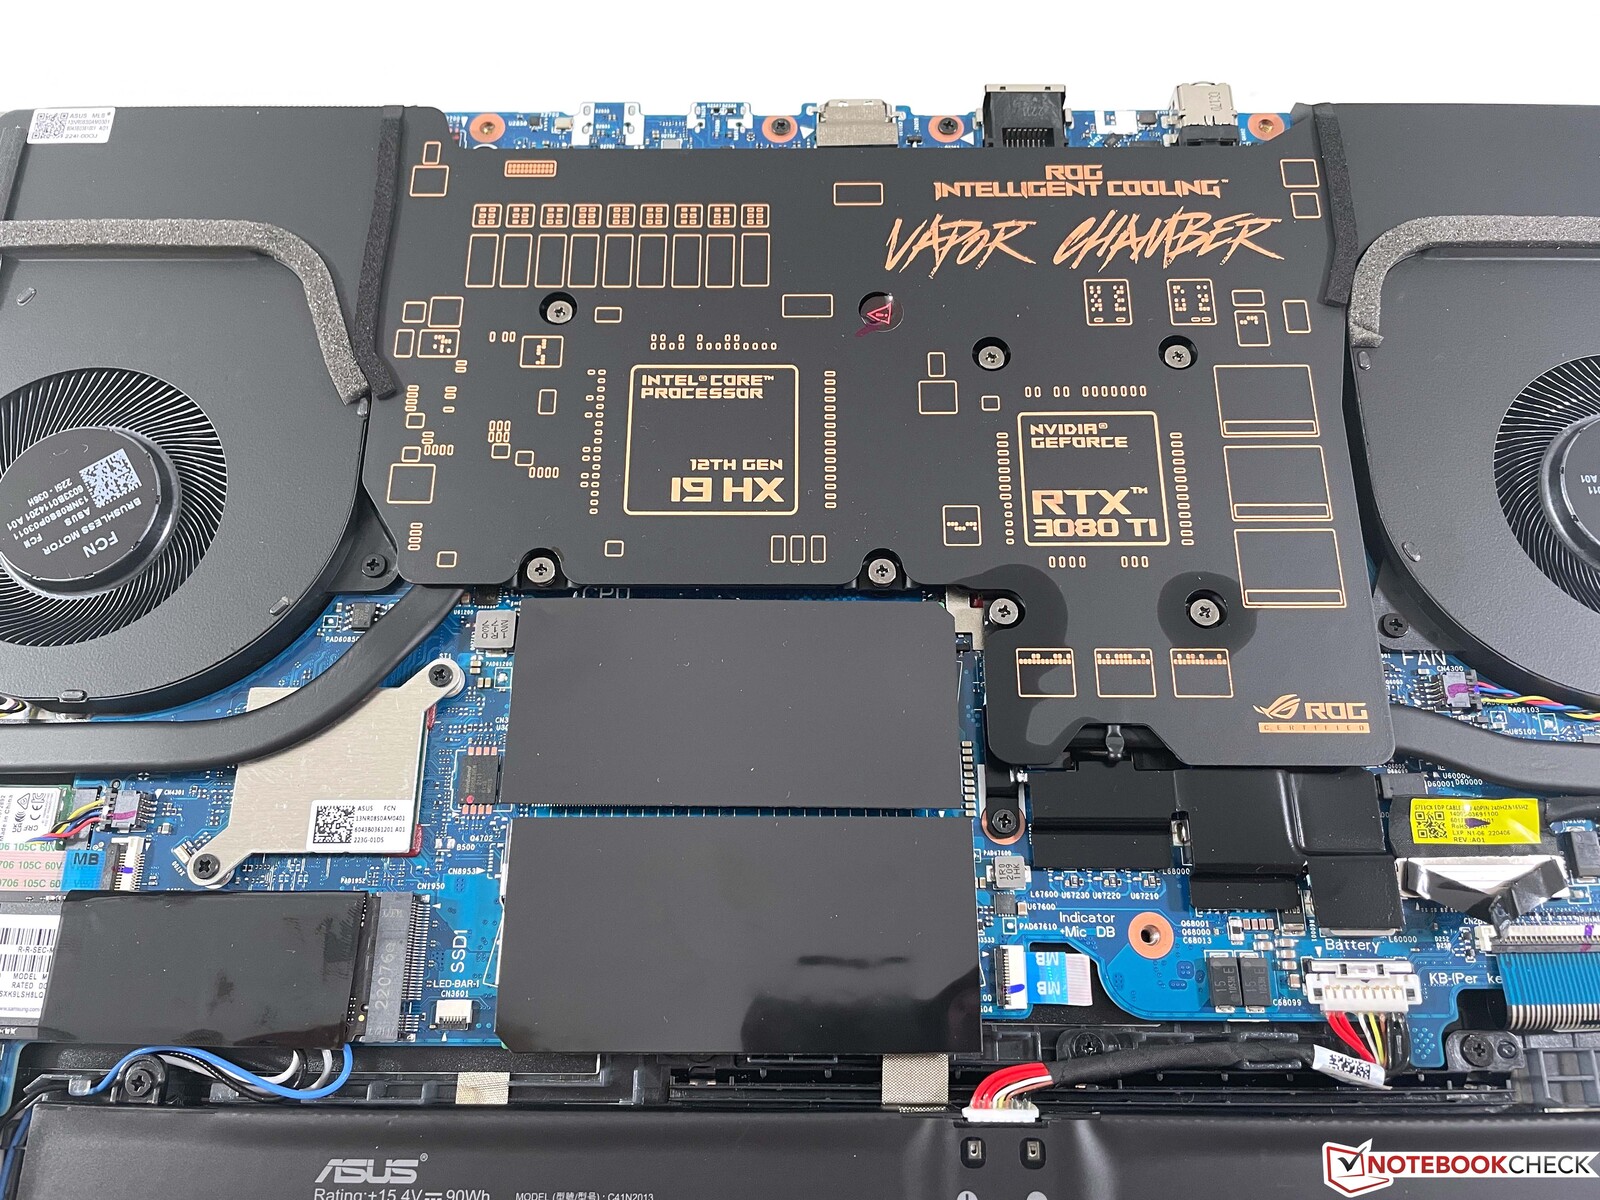
Asus utilise ici un système de refroidissement à chambre à vapeur. En mode Performance, l'appareil reste également relativement silencieux, et nous sommes en mesure de mesurer un maximum de 46 dB(A) pendant le test de stress ainsi que pendant le jeu. Cela reste bien sûr perceptible, mais notre appareil de test est tout de même nettement plus silencieux que ses concurrents. En mode Turbo, la performance de jeu est à peine plus élevée, mais les deux ventilateurs en marche produisent un fort 54 dB(A). En mode de repos, les ventilateurs restent souvent éteints, mais nous remarquons presque toujours quelques bruits électroniques discrets. En charge, il y a également un gémissement audible de la bobine provenant du GPU, nous le supposons.
Degré de la nuisance sonore
| Au repos |
| 23.9 / 23.9 / 23.9 dB(A) |
| Fortement sollicité |
| 34.3 / 45.9 dB(A) |
 | ||
30 dB silencieux 40 dB(A) audible 50 dB(A) bruyant |
||
min: | ||
| Asus ROG Strix Scar 17 SE G733CX-LL014W GeForce RTX 3080 Ti Laptop GPU, i9-12950HX, Samsung PM9A1 MZVL22T0HBLB | Lenovo Legion 7 16IAX7-82TD004SGE GeForce RTX 3080 Ti Laptop GPU, i9-12900HX, Micron 3400 1TB MTFDKBA1T0TFH | MSI Titan GT77 12UHS GeForce RTX 3080 Ti Laptop GPU, i9-12900HX, Samsung PM9A1 MZVL21T0HCLR | Schenker XMG Neo 17 M22 GeForce RTX 3080 Ti Laptop GPU, R9 6900HX, Samsung SSD 980 Pro 1TB MZ-V8P1T0BW | Alienware x17 R2 P48E GeForce RTX 3080 Ti Laptop GPU, i9-12900HK, 2x Samsung PM9A1 1TB (RAID 0) | Asus Strix Scar 17 G733QSA-XS99 GeForce RTX 3080 Laptop GPU, R9 5900HX, 2x Samsung PM981a MZVLB1T0HBLR (RAID 0) | |
|---|---|---|---|---|---|---|
| Noise | -19% | -9% | -27% | 1% | -4% | |
| arrêt / environnement * (dB) | 23.9 | 24.5 -3% | 21.9 8% | 26 -9% | 22.7 5% | 25 -5% |
| Idle Minimum * (dB) | 23.9 | 24.5 -3% | 24.53 -3% | 26 -9% | 23.1 3% | 25.2 -5% |
| Idle Average * (dB) | 23.9 | 30 -26% | 24.53 -3% | 29 -21% | 23.1 3% | 25.2 -5% |
| Idle Maximum * (dB) | 23.9 | 32.5 -36% | 24.53 -3% | 40 -67% | 23.1 3% | 25.2 -5% |
| Load Average * (dB) | 34.3 | 43.9 -28% | 46.25 -35% | 47 -37% | 31.9 7% | 30.7 10% |
| Load Maximum * (dB) | 45.9 | 54.2 -18% | 54.25 -18% | 54 -18% | 52.5 -14% | 51.3 -12% |
| Witcher 3 ultra * (dB) | 48.8 | 56.86 | 52 | 52.5 | 51.3 |
* ... Moindre est la valeur, meilleures sont les performances
Température
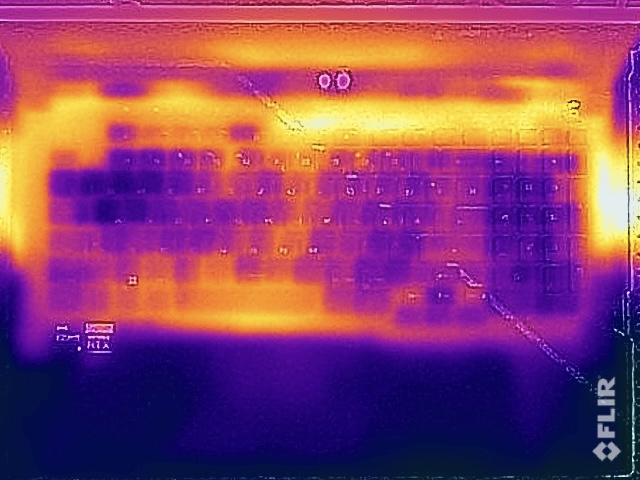
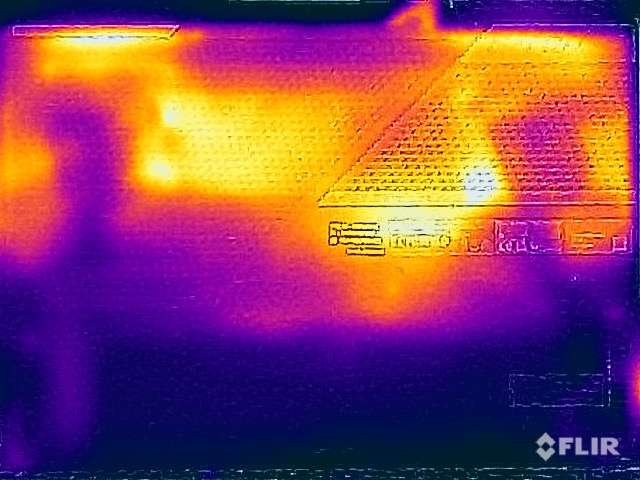
Malgré les ventilateurs relativement silencieux, les températures de surface ne donnent aucune raison de s'inquiéter. Même si nous mesurons plus de 50 °C dans certains endroits isolés sous charge, le clavier reste très frais et il n'y a aucune limitation pendant le jeu
Pendant le test de stress, le GPU reçoit un traitement préférentiel, fonctionnant de manière stable à 150 watts dès que le processeur s'est stabilisé à environ 36 watts. Il n'y a pas de réduction des performances juste après le test de stress.
(-) La température maximale du côté supérieur est de 48.8 °C / 120 F, par rapport à la moyenne de 40.4 °C / 105 F, allant de 21.2 à 68.8 °C pour la classe Gaming.
(-) Le fond chauffe jusqu'à un maximum de 52.4 °C / 126 F, contre une moyenne de 43.2 °C / 110 F
(+) En utilisation inactive, la température moyenne du côté supérieur est de 28.6 °C / 83 F, par rapport à la moyenne du dispositif de 33.9 °C / 93 F.
(±) En jouant à The Witcher 3, la température moyenne du côté supérieur est de 35.1 °C / 95 F, alors que la moyenne de l'appareil est de 33.9 °C / 93 F.
(+) Les repose-poignets et le pavé tactile sont plus froids que la température de la peau avec un maximum de 26 °C / 78.8 F et sont donc froids au toucher.
(+) La température moyenne de la zone de l'appui-paume de dispositifs similaires était de 28.8 °C / 83.8 F (+2.8 °C / #5 F).
| Asus ROG Strix Scar 17 SE G733CX-LL014W Intel Core i9-12950HX, NVIDIA GeForce RTX 3080 Ti Laptop GPU | Lenovo Legion 7 16IAX7-82TD004SGE Intel Core i9-12900HX, NVIDIA GeForce RTX 3080 Ti Laptop GPU | MSI Titan GT77 12UHS Intel Core i9-12900HX, NVIDIA GeForce RTX 3080 Ti Laptop GPU | Schenker XMG Neo 17 M22 AMD Ryzen 9 6900HX, NVIDIA GeForce RTX 3080 Ti Laptop GPU | Alienware x17 R2 P48E Intel Core i9-12900HK, NVIDIA GeForce RTX 3080 Ti Laptop GPU | Asus Strix Scar 17 G733QSA-XS99 AMD Ryzen 9 5900HX, NVIDIA GeForce RTX 3080 Laptop GPU | |
|---|---|---|---|---|---|---|
| Heat | -8% | -3% | 1% | 7% | 4% | |
| Maximum Upper Side * (°C) | 48.8 | 44.4 9% | 40.8 16% | 49 -0% | 49.6 -2% | 40 18% |
| Maximum Bottom * (°C) | 52.4 | 60.8 -16% | 52.4 -0% | 52 1% | 42.4 19% | 39.8 24% |
| Idle Upper Side * (°C) | 30.4 | 33.8 -11% | 34.6 -14% | 30 1% | 29.2 4% | 34.6 -14% |
| Idle Bottom * (°C) | 34.1 | 38.8 -14% | 38.4 -13% | 33 3% | 32 6% | 38.4 -13% |
* ... Moindre est la valeur, meilleures sont les performances
Haut-parleurs
Le système audio se compose de quatre modules au total qui produisent un son puissant et spacieux. Même si les haut-parleurs ne sont pas les plus puissants du marché, la qualité est globalement très bonne. Cependant, en raison du fort bruit du ventilateur pendant les jeux, nous recommandons tout de même un casque.
Asus ROG Strix Scar 17 SE G733CX-LL014W analyse audio
(±) | le niveau sonore du haut-parleur est moyen mais bon (73.3# dB)
Basses 100 - 315 Hz
(±) | basse réduite - en moyenne 6.2% inférieure à la médiane
(±) | la linéarité des basses est moyenne (7.5% delta à la fréquence précédente)
Médiums 400 - 2000 Hz
(+) | médiane équilibrée - seulement 2% de la médiane
(+) | les médiums sont linéaires (3.9% delta à la fréquence précédente)
Aiguës 2 - 16 kHz
(+) | des sommets équilibrés - à seulement 3.5% de la médiane
(±) | la linéarité des aigus est moyenne (9.3% delta à la fréquence précédente)
Globalement 100 - 16 000 Hz
(+) | le son global est linéaire (13.6% différence à la médiane)
Par rapport à la même classe
» 20% de tous les appareils testés de cette catégorie étaient meilleurs, 7% similaires, 73% pires
» Le meilleur avait un delta de 6%, la moyenne était de 18%, le pire était de 132%.
Par rapport à tous les appareils testés
» 15% de tous les appareils testés étaient meilleurs, 4% similaires, 82% pires
» Le meilleur avait un delta de 4%, la moyenne était de 24%, le pire était de 134%.
MSI Titan GT77 12UHS analyse audio
(+) | les haut-parleurs peuvent jouer relativement fort (83.4# dB)
Basses 100 - 315 Hz
(-) | presque aucune basse - en moyenne 71.8% plus bas que la médiane
(+) | les basses sont linéaires (0% delta à la fréquence précédente)
Médiums 400 - 2000 Hz
(-) | presque pas de médiane - en moyenne 71.8% inférieure à la médiane
(+) | les médiums sont linéaires (0% delta à la fréquence précédente)
Aiguës 2 - 16 kHz
(-) | presque aucun sommet - en moyenne 71.8% plus bas que la médiane
(+) | les aigus sont linéaires (0% delta à la fréquence précédente)
Globalement 100 - 16 000 Hz
(-) | le son global n'est pas linéaire (107.7% de différence à la médiane)
Par rapport à la même classe
» 100% de tous les appareils testés de cette catégorie étaient meilleurs, 0% similaires, 0% pires
» Le meilleur avait un delta de 6%, la moyenne était de 18%, le pire était de 132%.
Par rapport à tous les appareils testés
» 96% de tous les appareils testés étaient meilleurs, 0% similaires, 4% pires
» Le meilleur avait un delta de 4%, la moyenne était de 24%, le pire était de 134%.
Consommation d'énergie
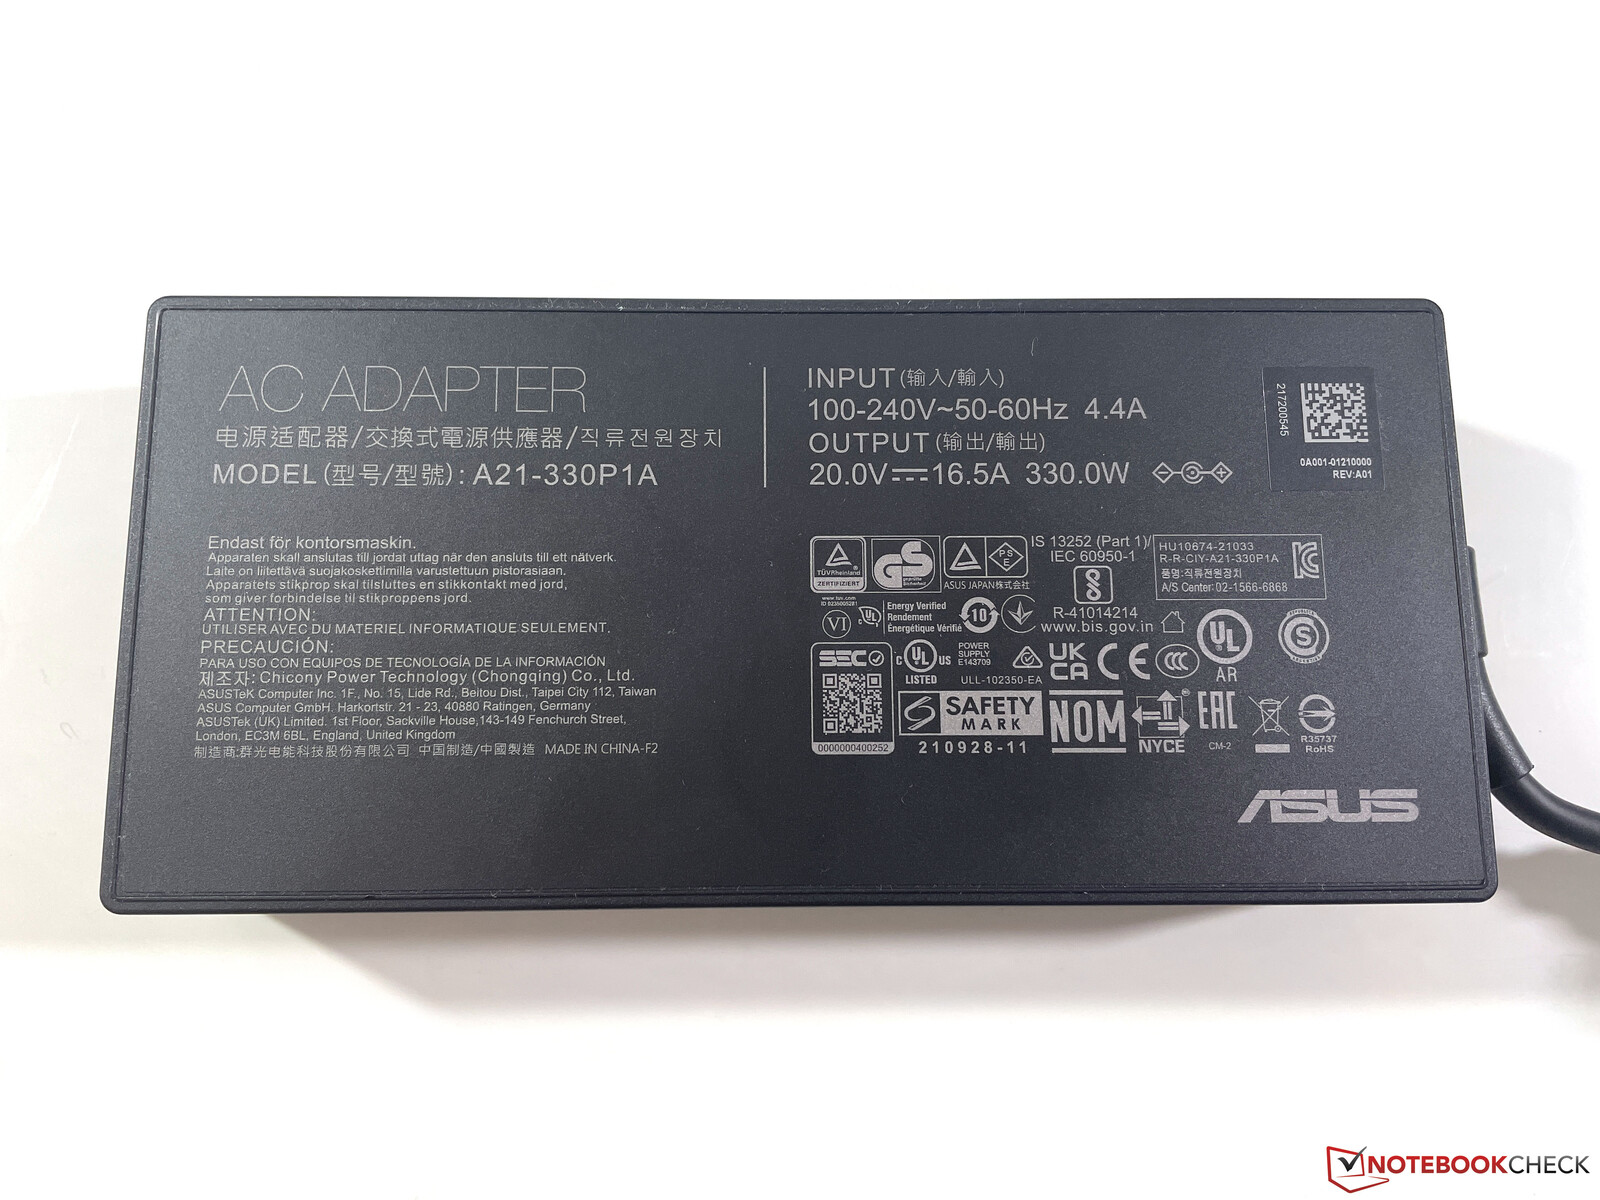
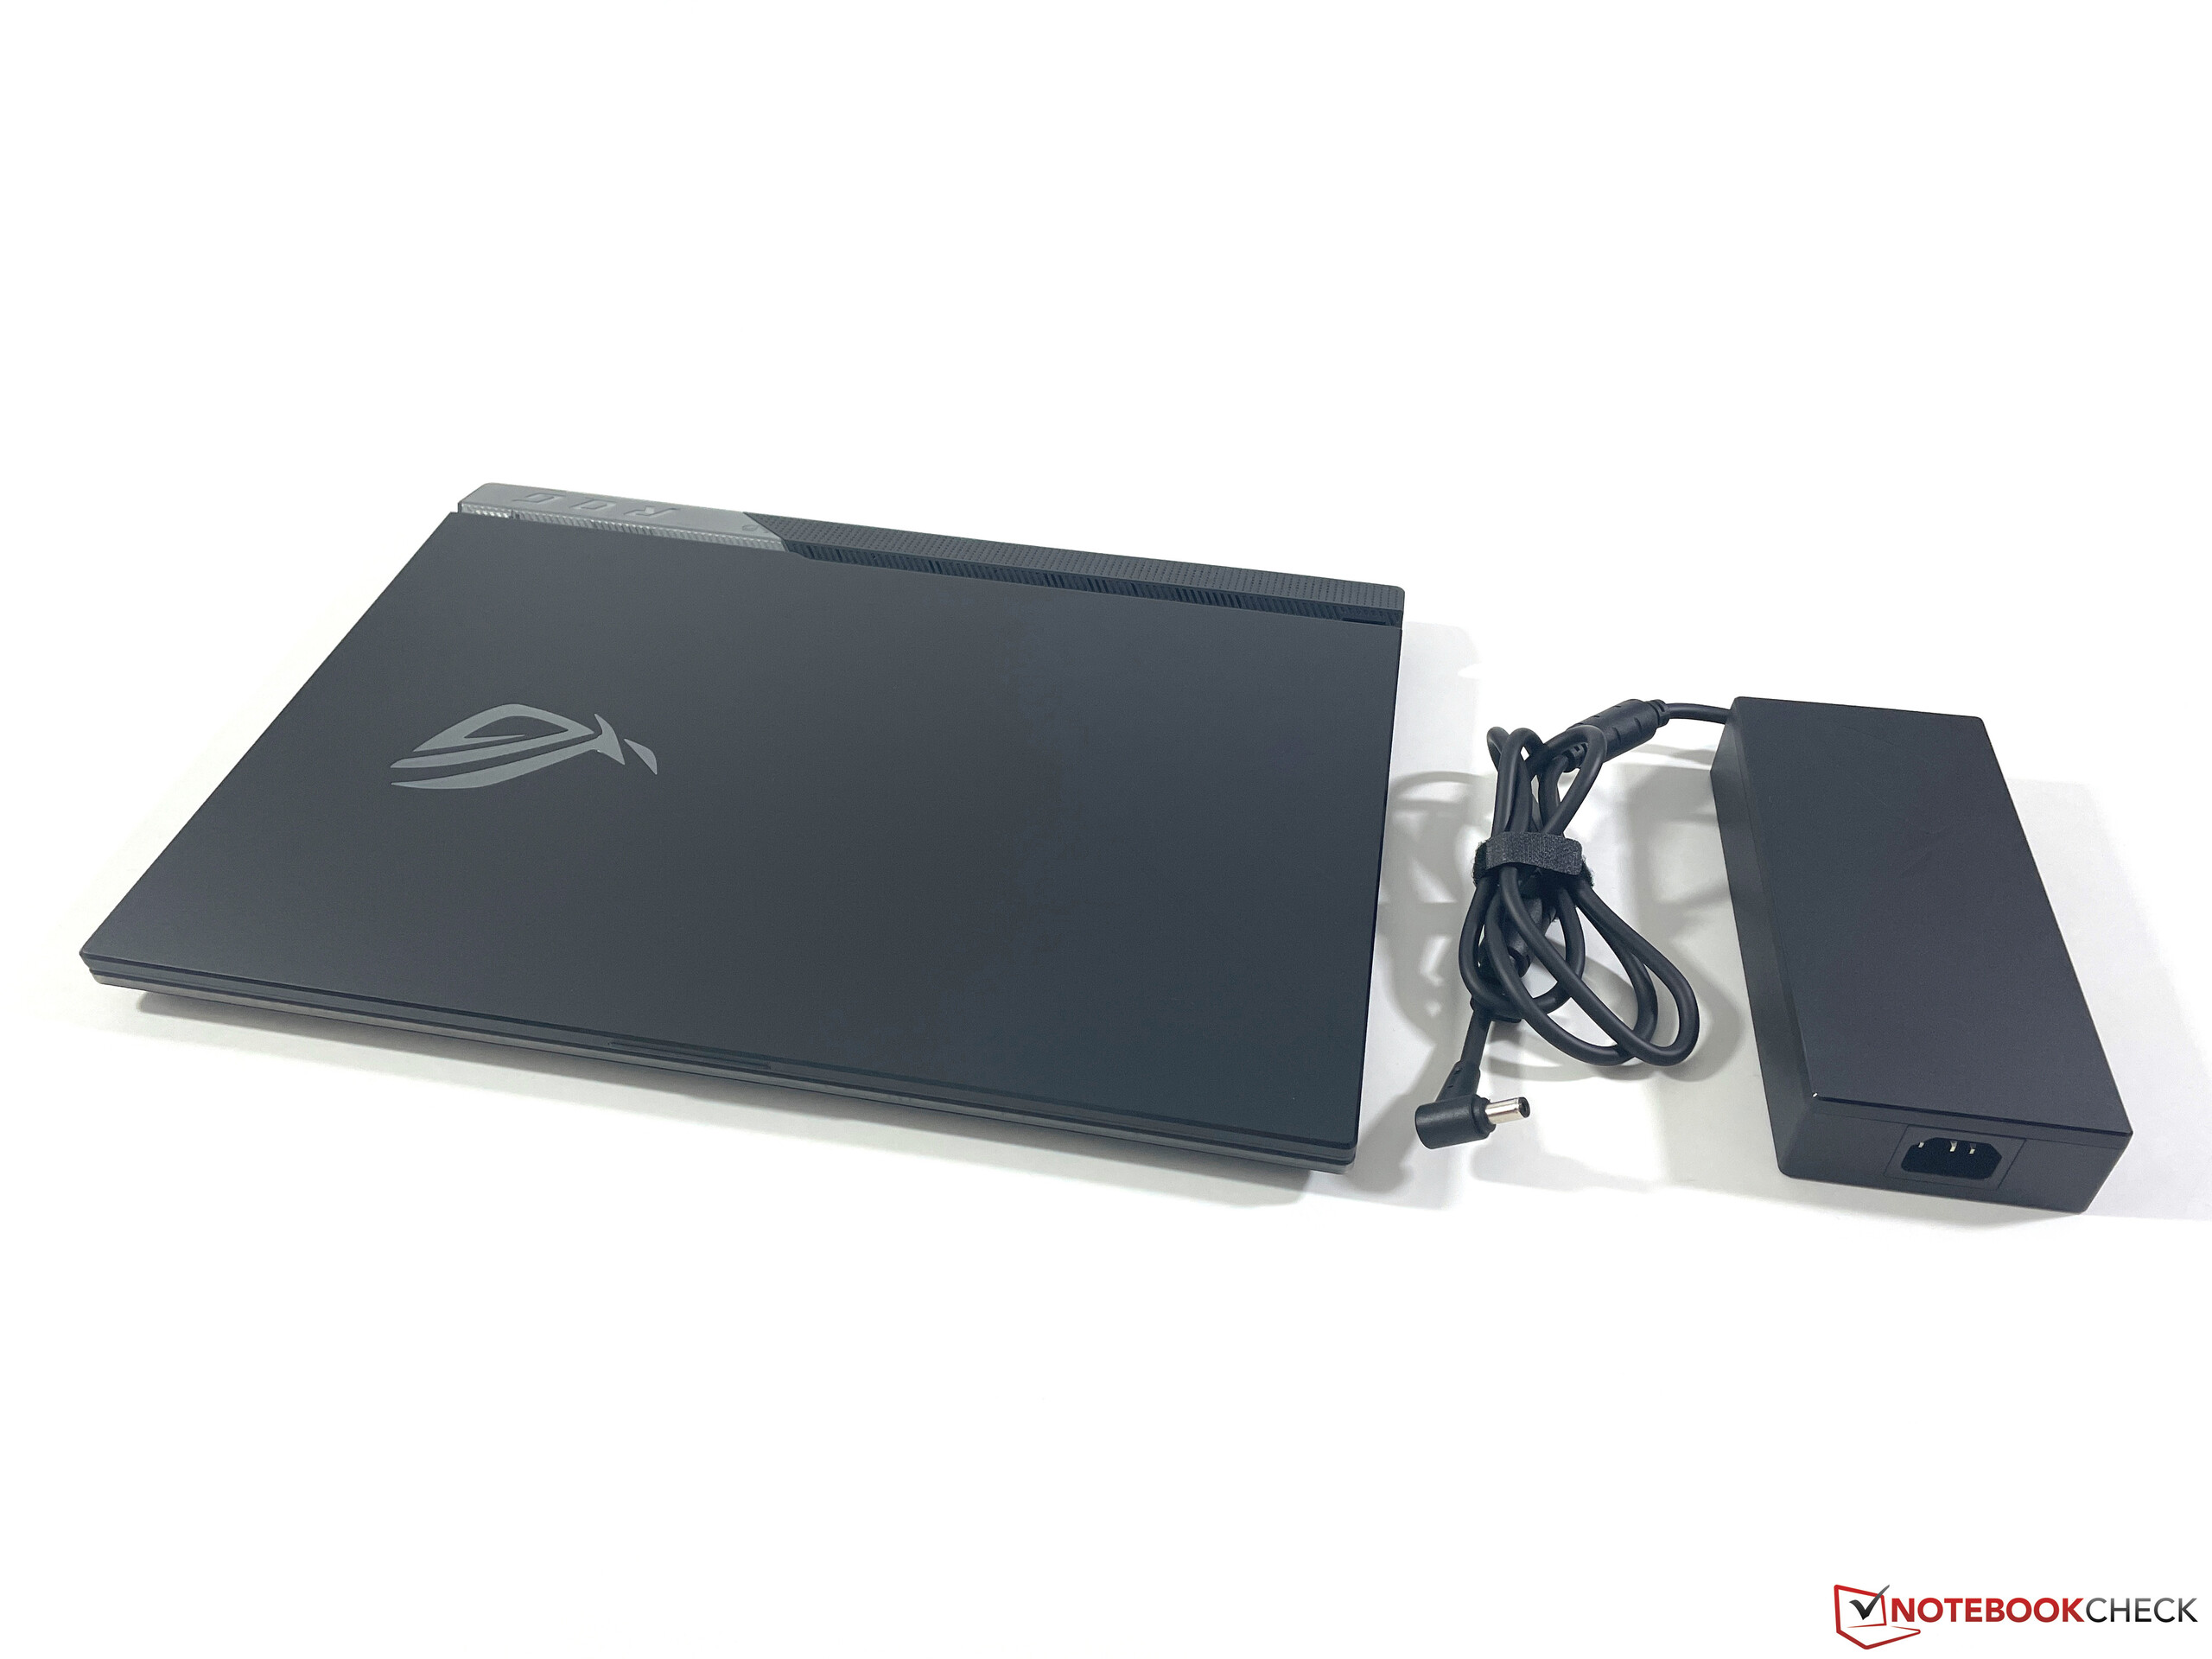
Le ROG Strix Scar 17 SE n'est pas un ordinateur portable très efficace, ce qui n'est pas très surprenant compte tenu de la puissance du matériel. Nous mesurons déjà jusqu'à 27 watts en mode veille, et en jouant, la valeur passe à environ 230 watts. L'alimentation de 330 watts est donc suffisamment importante. La consommation en veille est également assez élevée avec 2,6 watts, mais cela est dû aux effets lumineux activés par défaut.
| Éteint/en veille | |
| Au repos | |
| Fortement sollicité |
|
Légende:
min: | |
Power Consumption The Witcher 3 / Stress Test
Power Consumption With External Monitor
Autonomie de la batterie
Lors de notre test d'autonomie WLAN à 150 cd/m², ce qui correspond à 48 % de la luminosité maximale, notre appareil de test n'a duré qu'environ 4 heures. Compte tenu des valeurs de consommation élevées, ce n'est pas très surprenant. Certains concurrents durent ici nettement plus longtemps, si vous avez besoin de combler les temps loin de la prise de courant. Le jeu est possible pendant environ une heure, mais seulement avec une réduction significative des performances. Il faut environ 100 minutes pour recharger complètement la batterie de 90 Wh, 80 % de la capacité étant déjà disponible après environ 53 minutes.
Points positifs
Points négatifs
Verdict - Un ordinateur portable rapide et entièrement équipé pour les jeux
L'actuel Asus ROG Strix Scar 17 SE offre vraiment tout ce que le cœur d'un joueur désire. Un écran QHD rapide à 240 Hz associé à la RTX 3080 Ti de GeForce, qui offre également une puissance suffisante pour la résolution native dans un maximum de détails. Bien que la performance du processeur soit également bonne pour un ordinateur portable de jeu, le potentiel du processeur HX ne peut pas être utilisé pleinement. Vous devriez donc vous épargner la prime supplémentaire pour le processeur plus puissant et choisir simplement un Core i9 ordinaire
Les autres avantages sont les couleurs très précises, si vous devez travailler directement sur le traitement vidéo, par exemple, les températures de surface modérées et les ventilateurs relativement silencieux pendant le jeu. Bien qu'un mode Turbo soit disponible, qui devient aussi significativement plus bruyant, cela n'a pas beaucoup d'impact sur les performances de jeu, donc ce n'est pas utile à notre avis
Le nouveau Asus ROG Strix Scar 17 SE offre beaucoup de performances et de fonctionnalités de jeu, mais vous devriez économiser sur la prime supplémentaire pour le processeur Intel HX.
Les concurrents sur le marché du jeu offrent des spécifications de performance similaires, mais aussi des écrans plus lumineux dans des pièces et des boîtiers moins flashy. En outre, les bruits électroniques peuvent devenir gênants à la longue.
Prix et disponibilité
Notre configuration de test du ROG Strix Scar 17 SE est disponible sur Amazon pour 3899 $et une configuration plus petite avec le Core i9-12900H ordinaire est également disponible sur le site pour 2278 $.
Asus ROG Strix Scar 17 SE G733CX-LL014W
- 11/18/2022 v7 (old)
Andreas Osthoff
Price comparison

