Test de l'Impact Display Solutions IMP-3713-V2-16-500 : le PC sans ventilateur
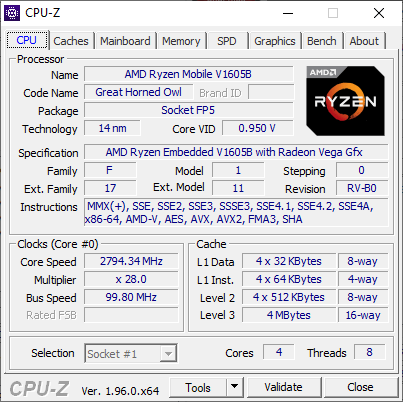
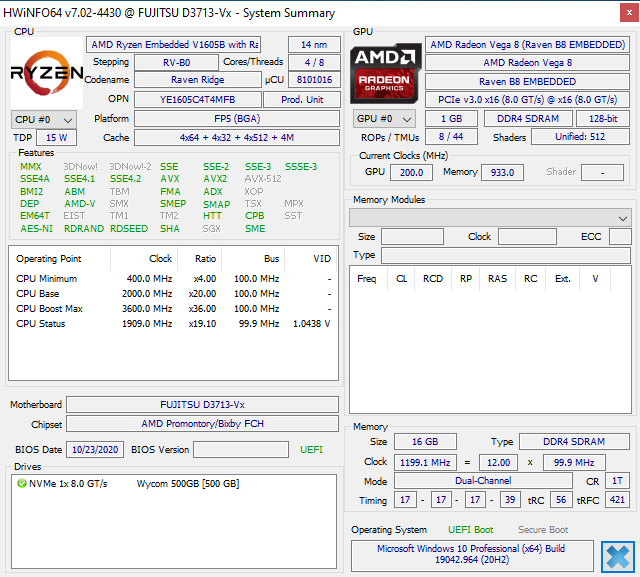
Impact Components est spécialisé dans la construction de PC industriels avec du matériel et des cartes mères spécialisés. Certains modèles sont équipés d'un système de refroidissement actif, tandis que l'unité testée ici est sans ventilateur. Nous allons tester le système pour voir comment un châssis refroidi passivement peut gérer un CPU AMD Ryzen Embedded V1605B à faible puissance de 12 à 25 W
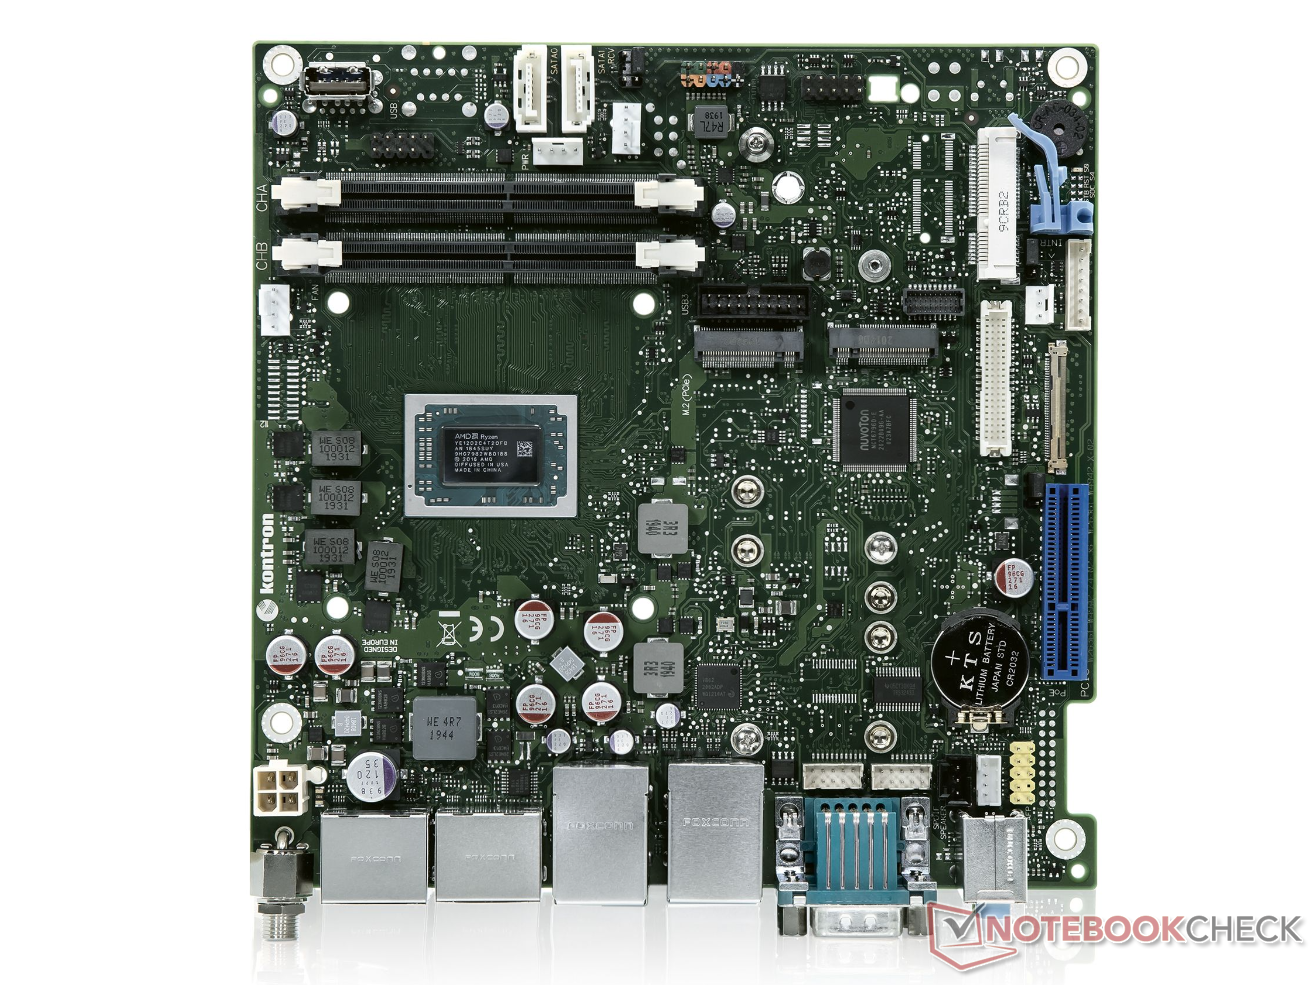
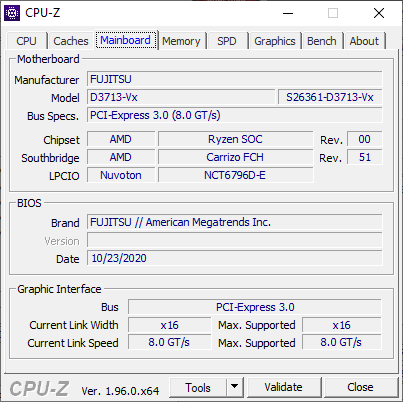
Des spécifications plus détaillées sur le PC et sa carte mère D3713-V/R mITX peuvent être trouvées via leur respectifs pages produits.
Cas
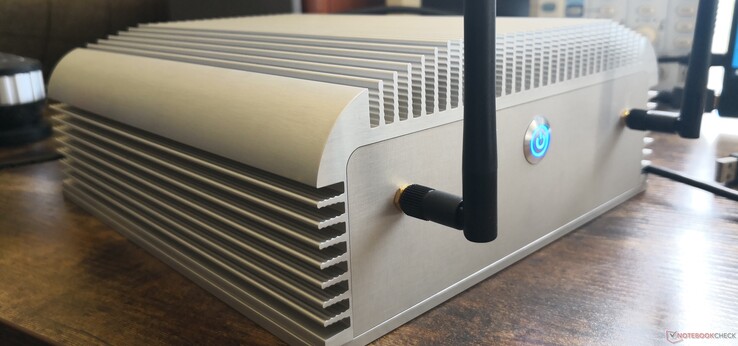
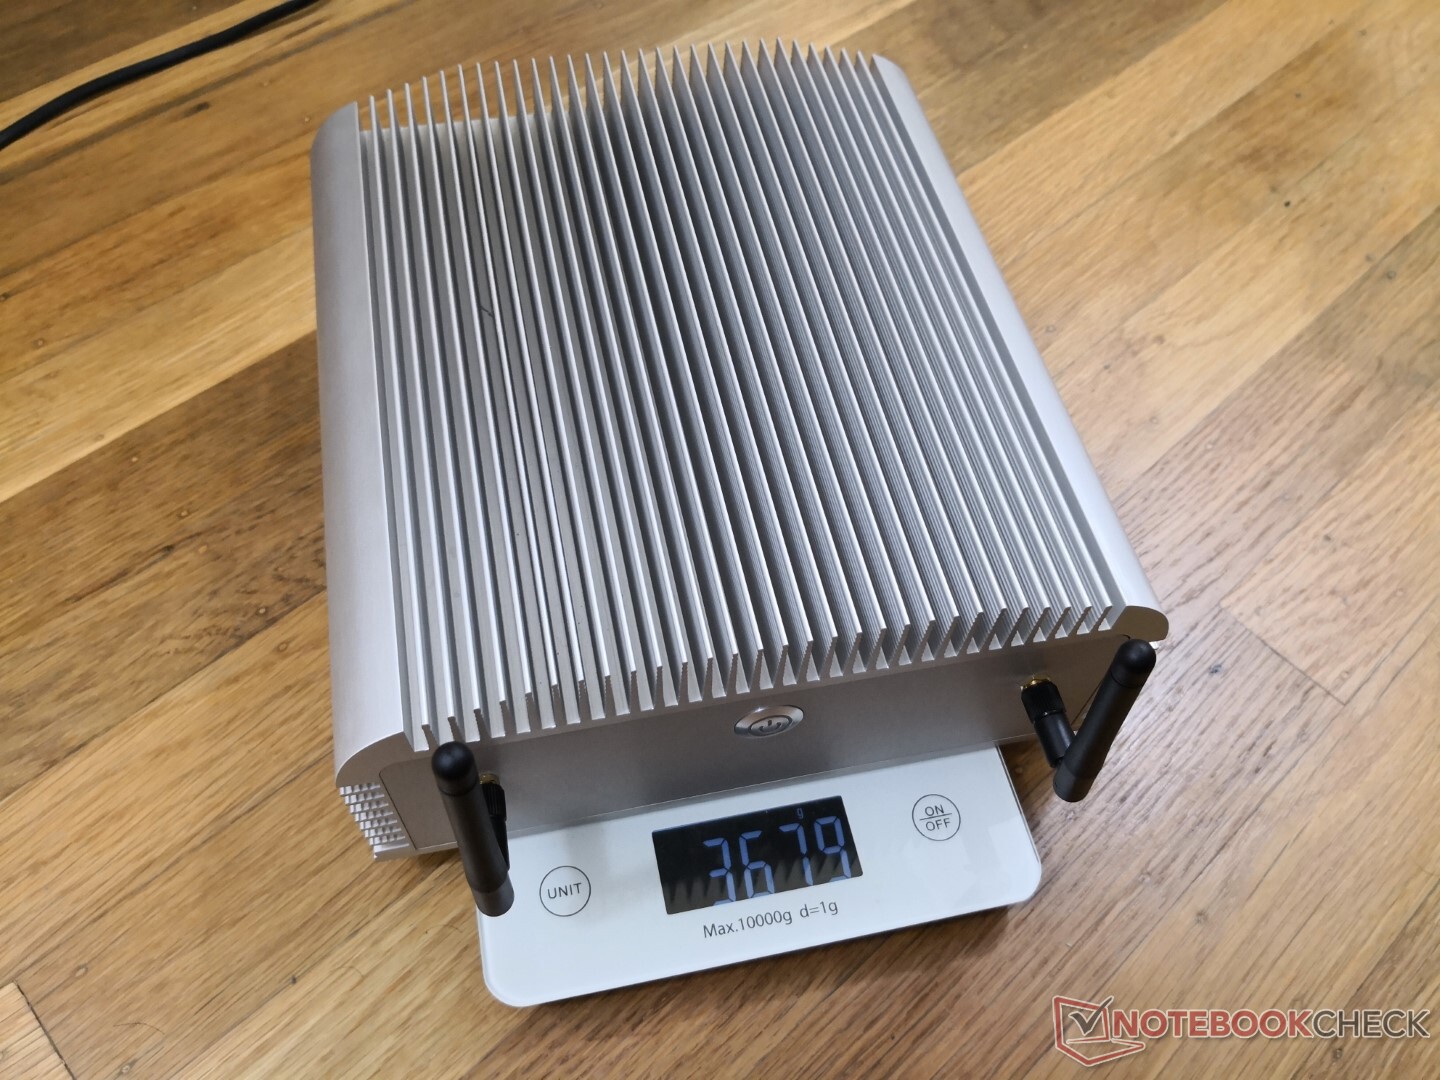
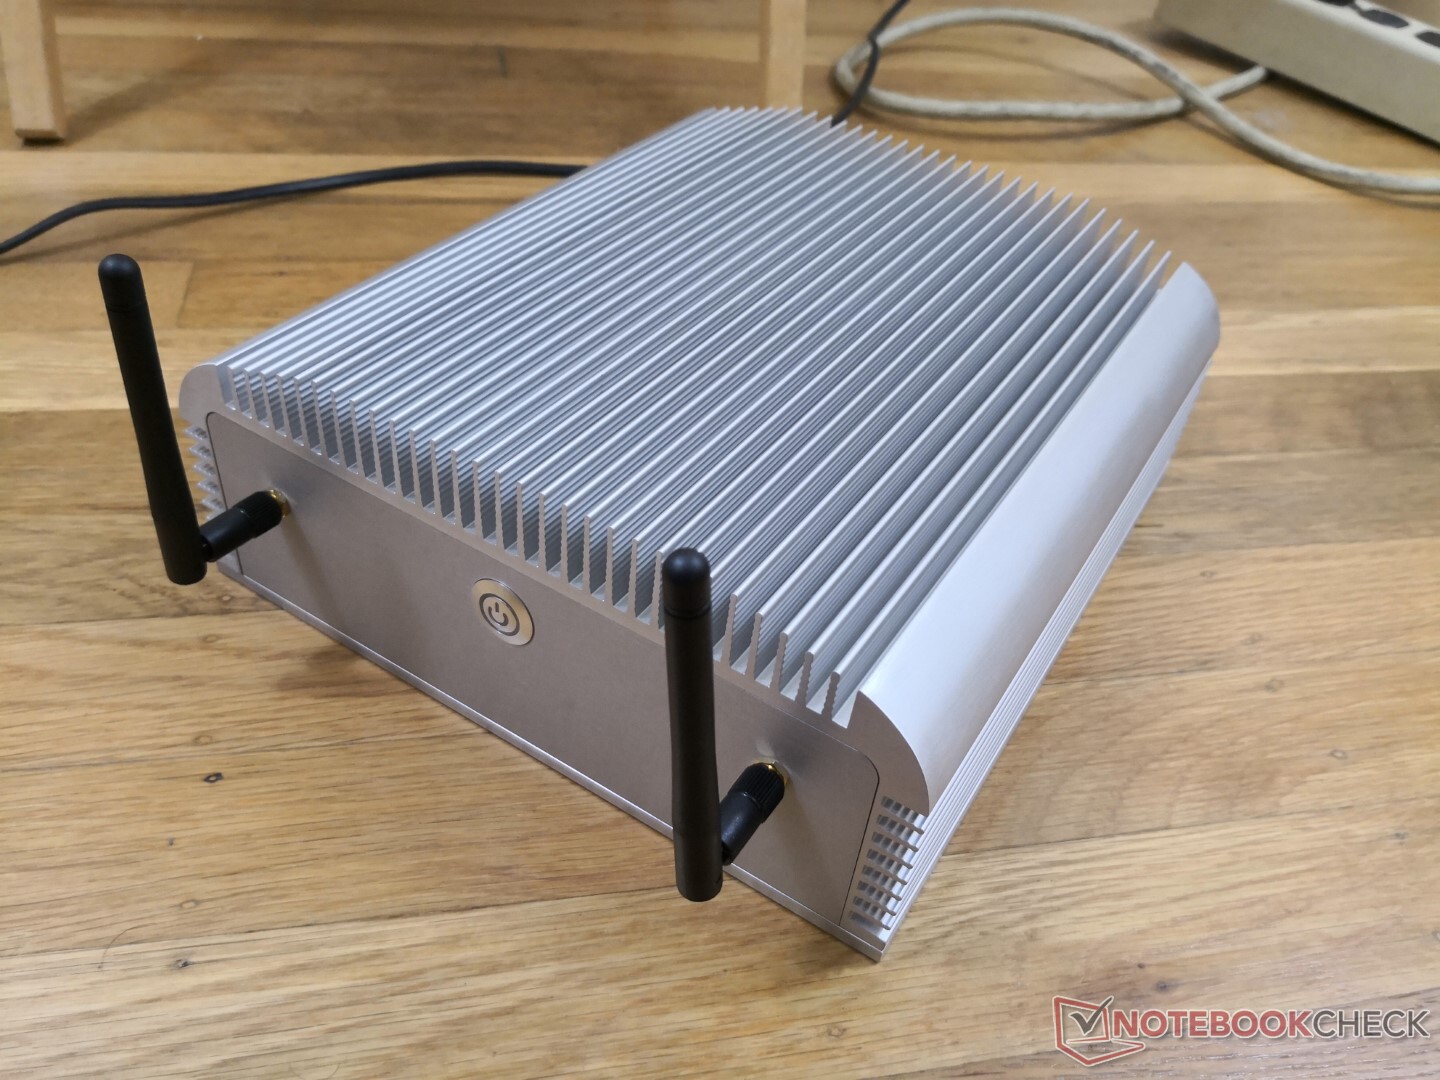
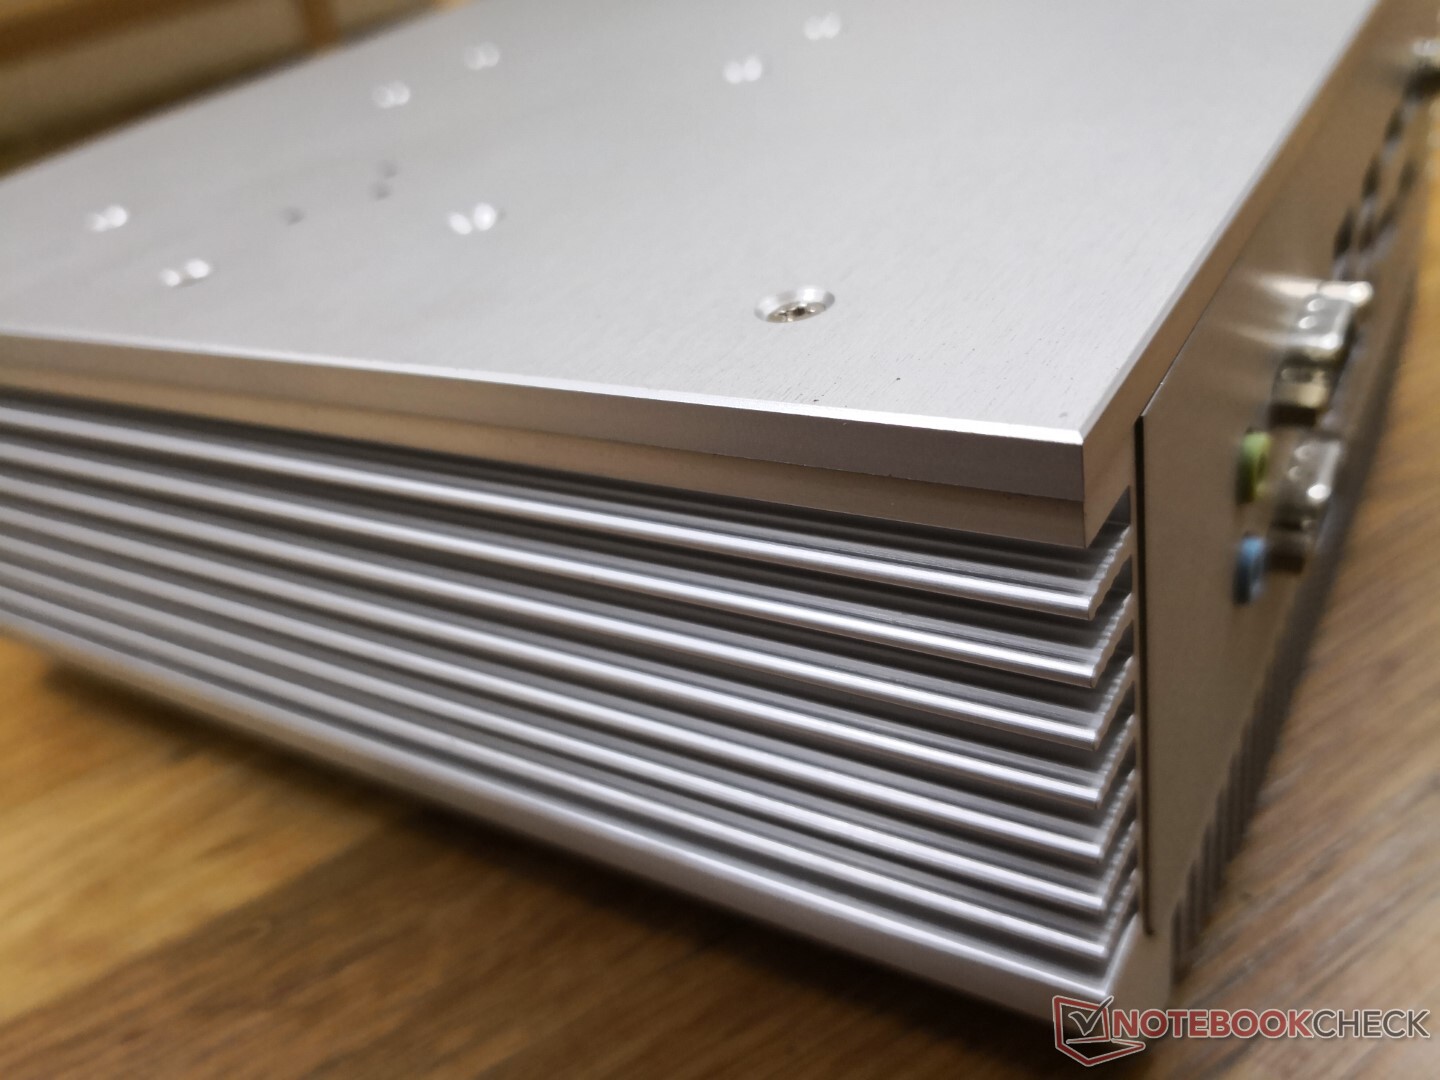
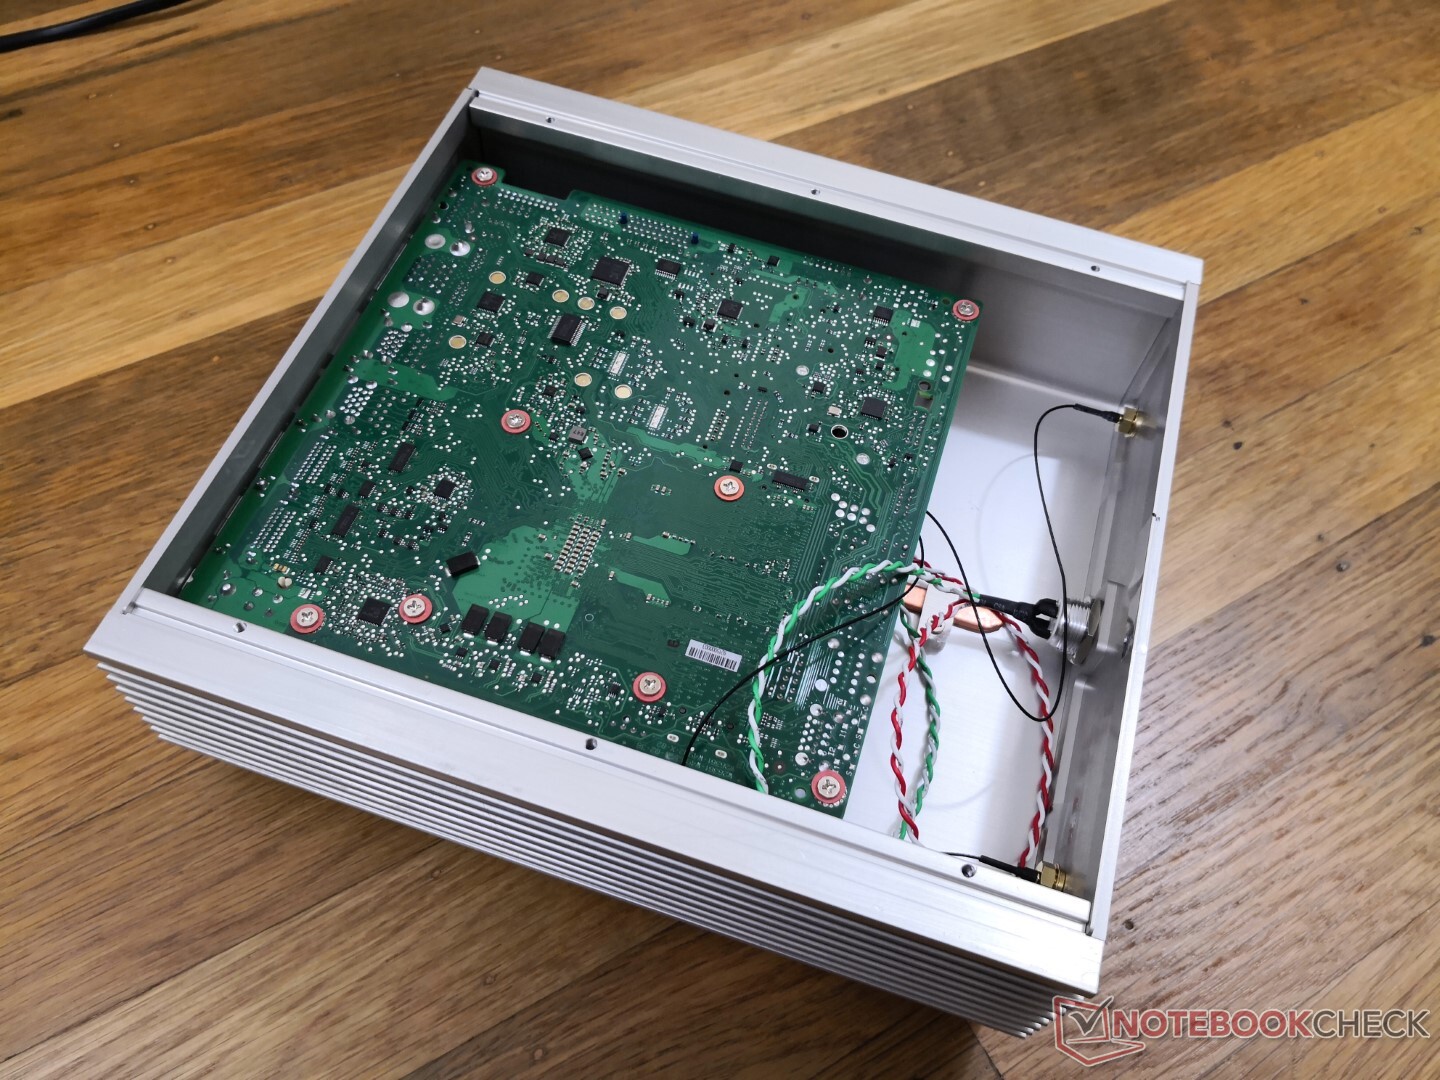
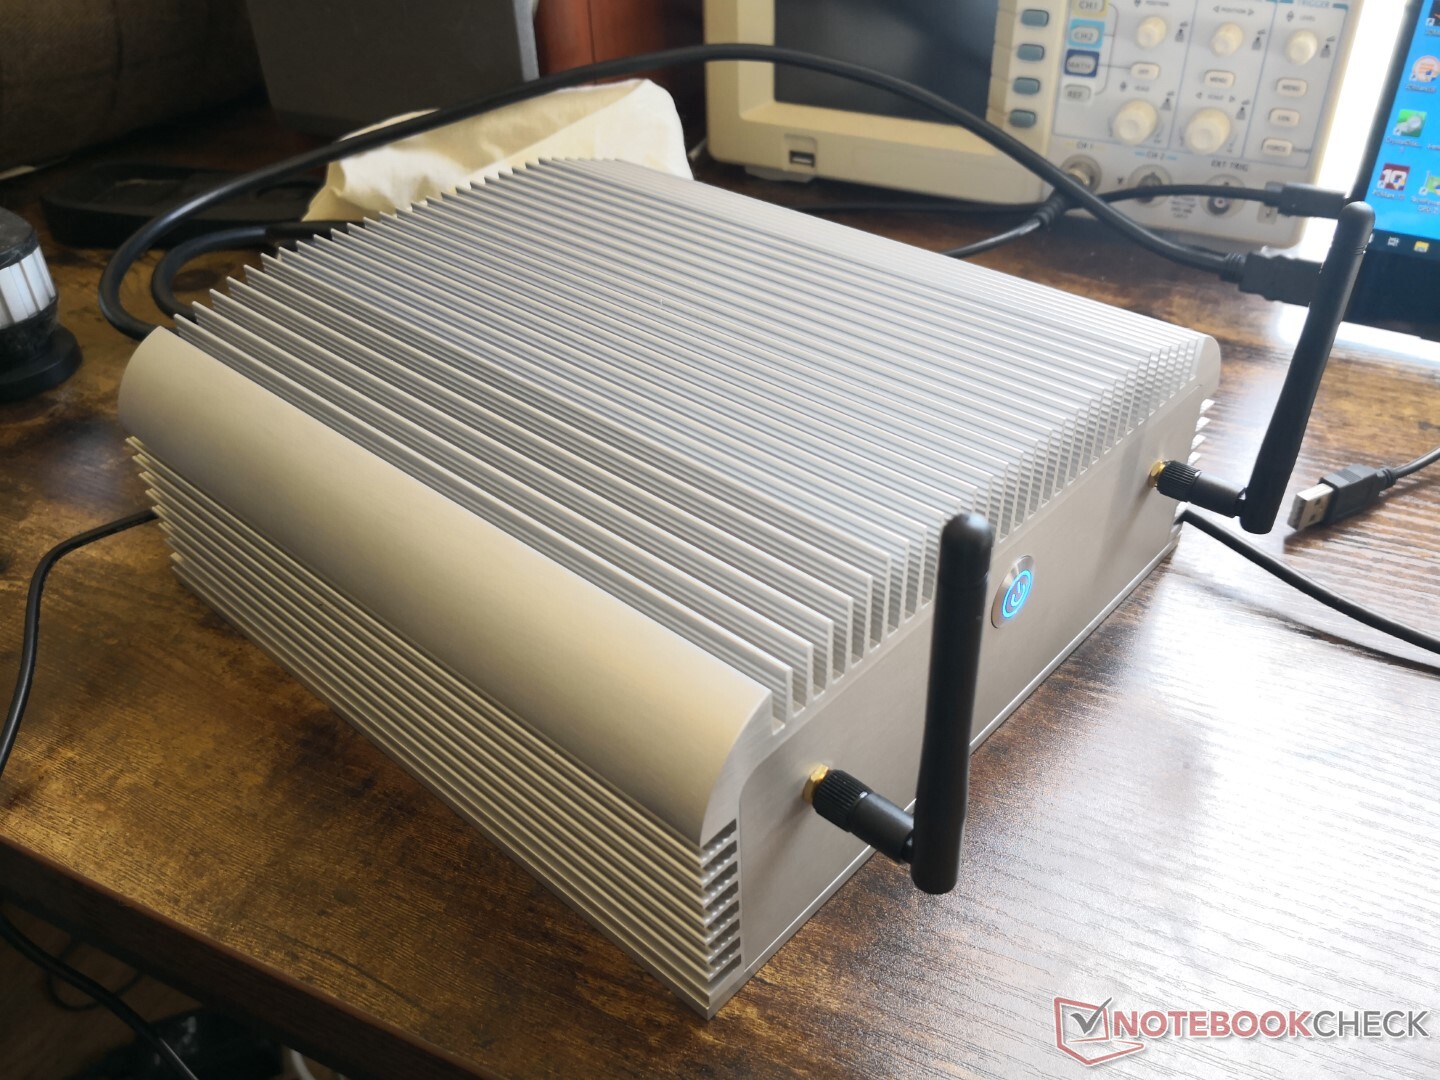
L'ensemble du boîtier est en aluminium anodisé de haut en bas et certifié IP50 pour la protection contre la poussière mais pas contre l'eau. Il est nettement plus grand et plus lourd que leIMP-3654-B1-R que nous avons vérifié au début de l'année dernière, ce qui devrait, nous l'espérons, conduire à un meilleur refroidissement et à une meilleure absorption thermique.
Connectivité
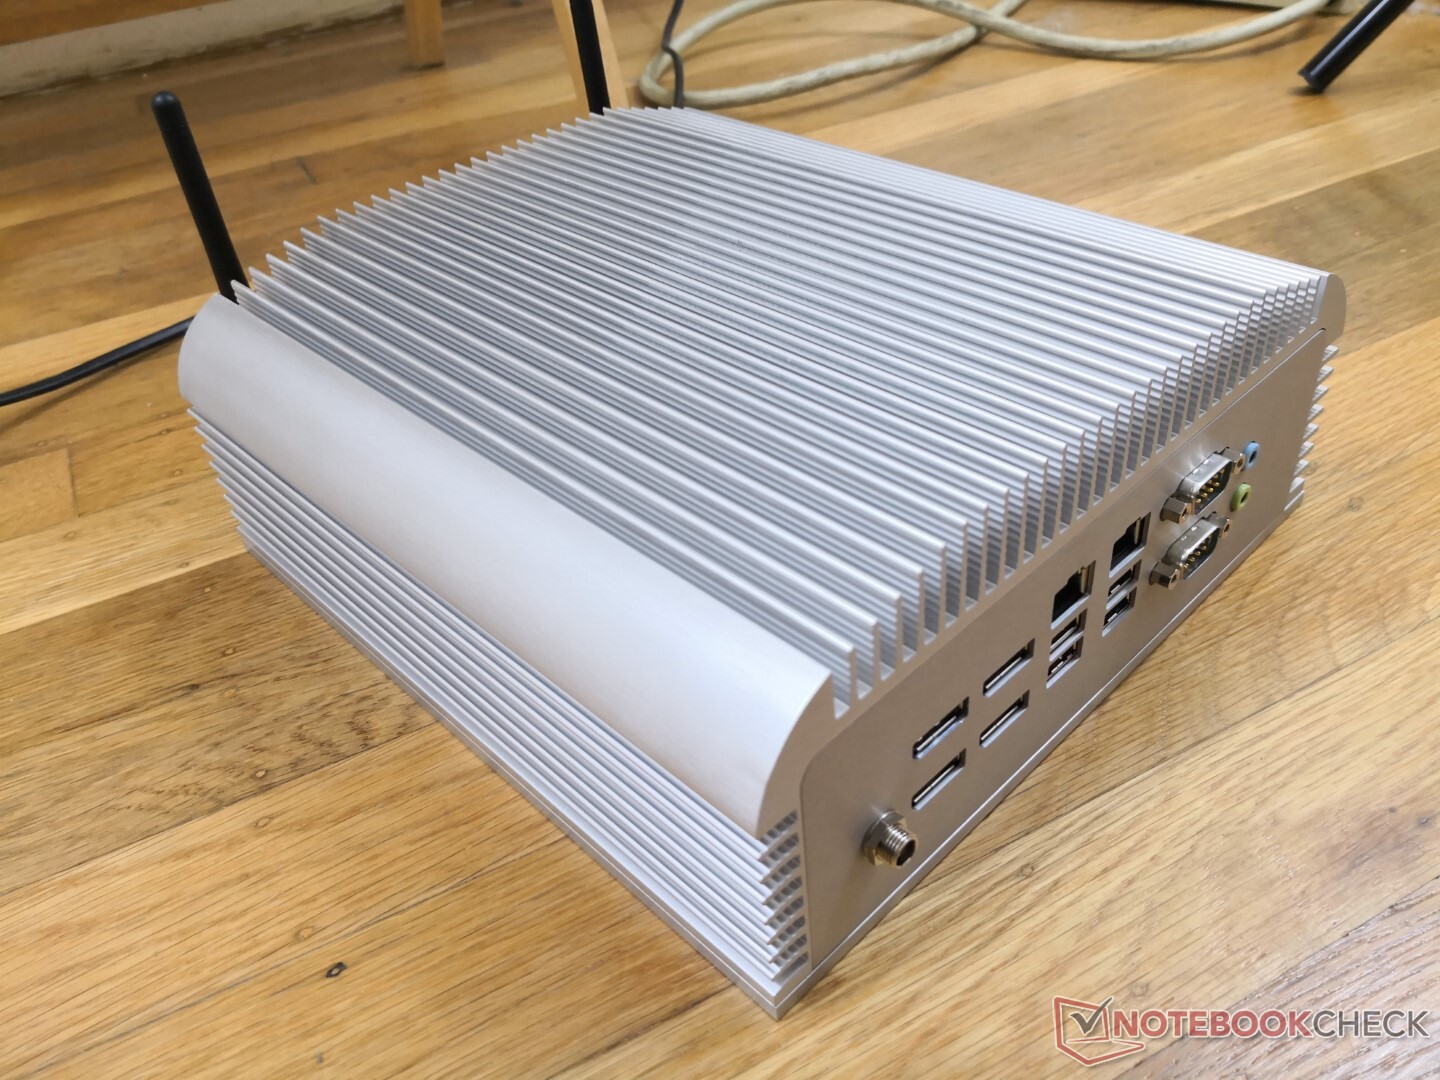
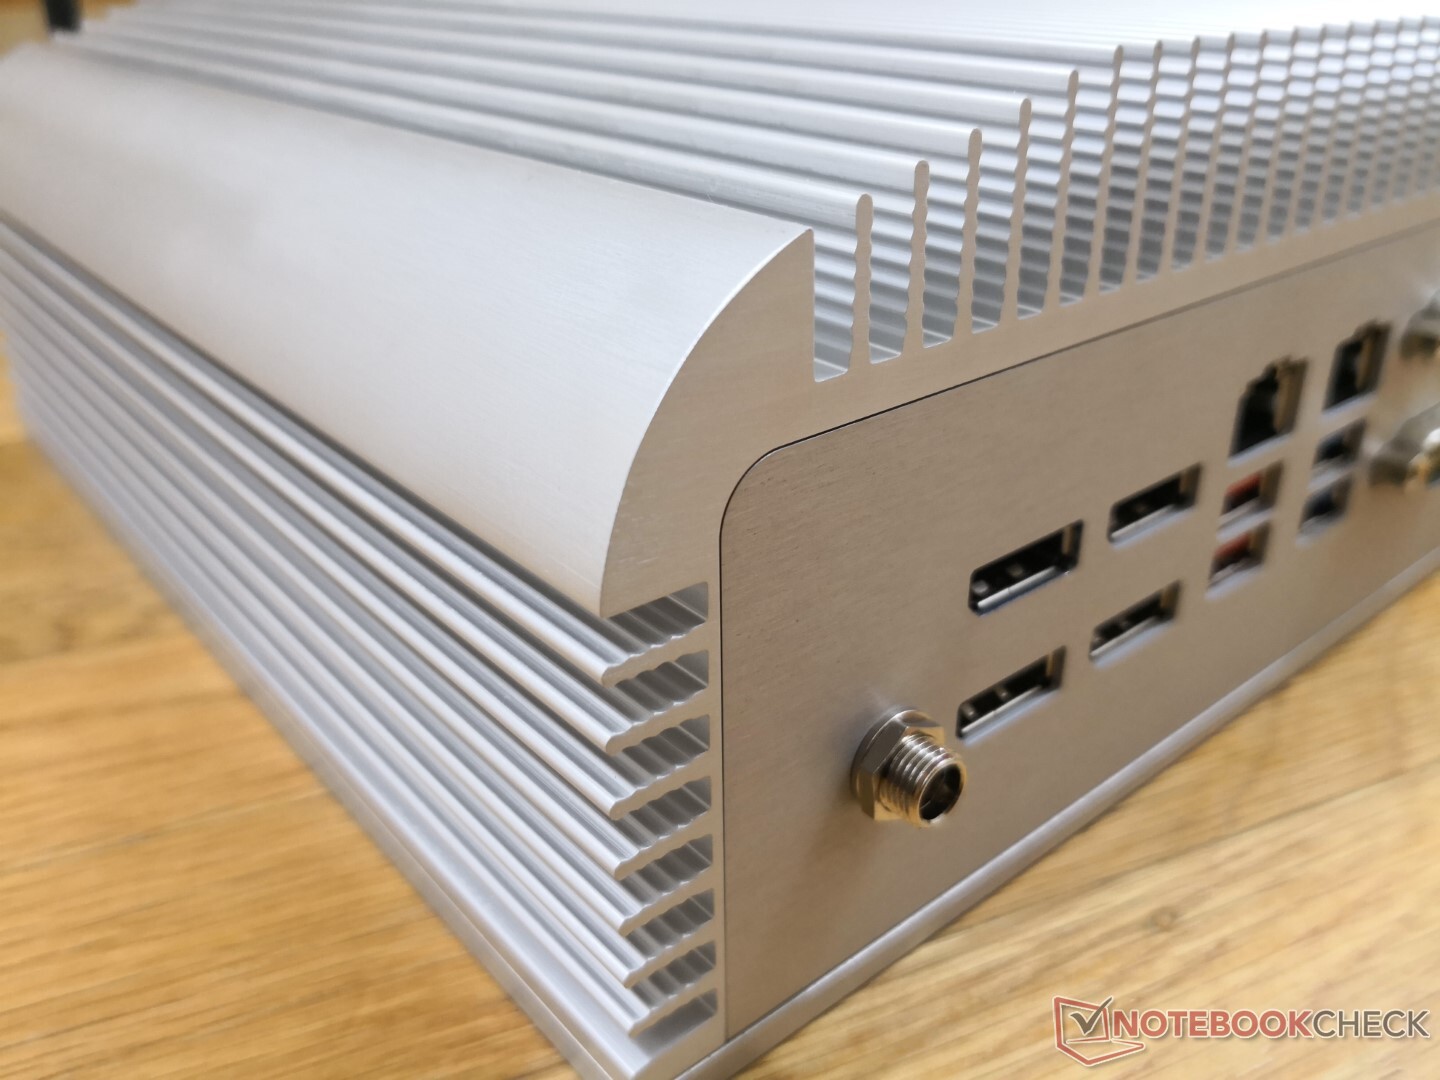
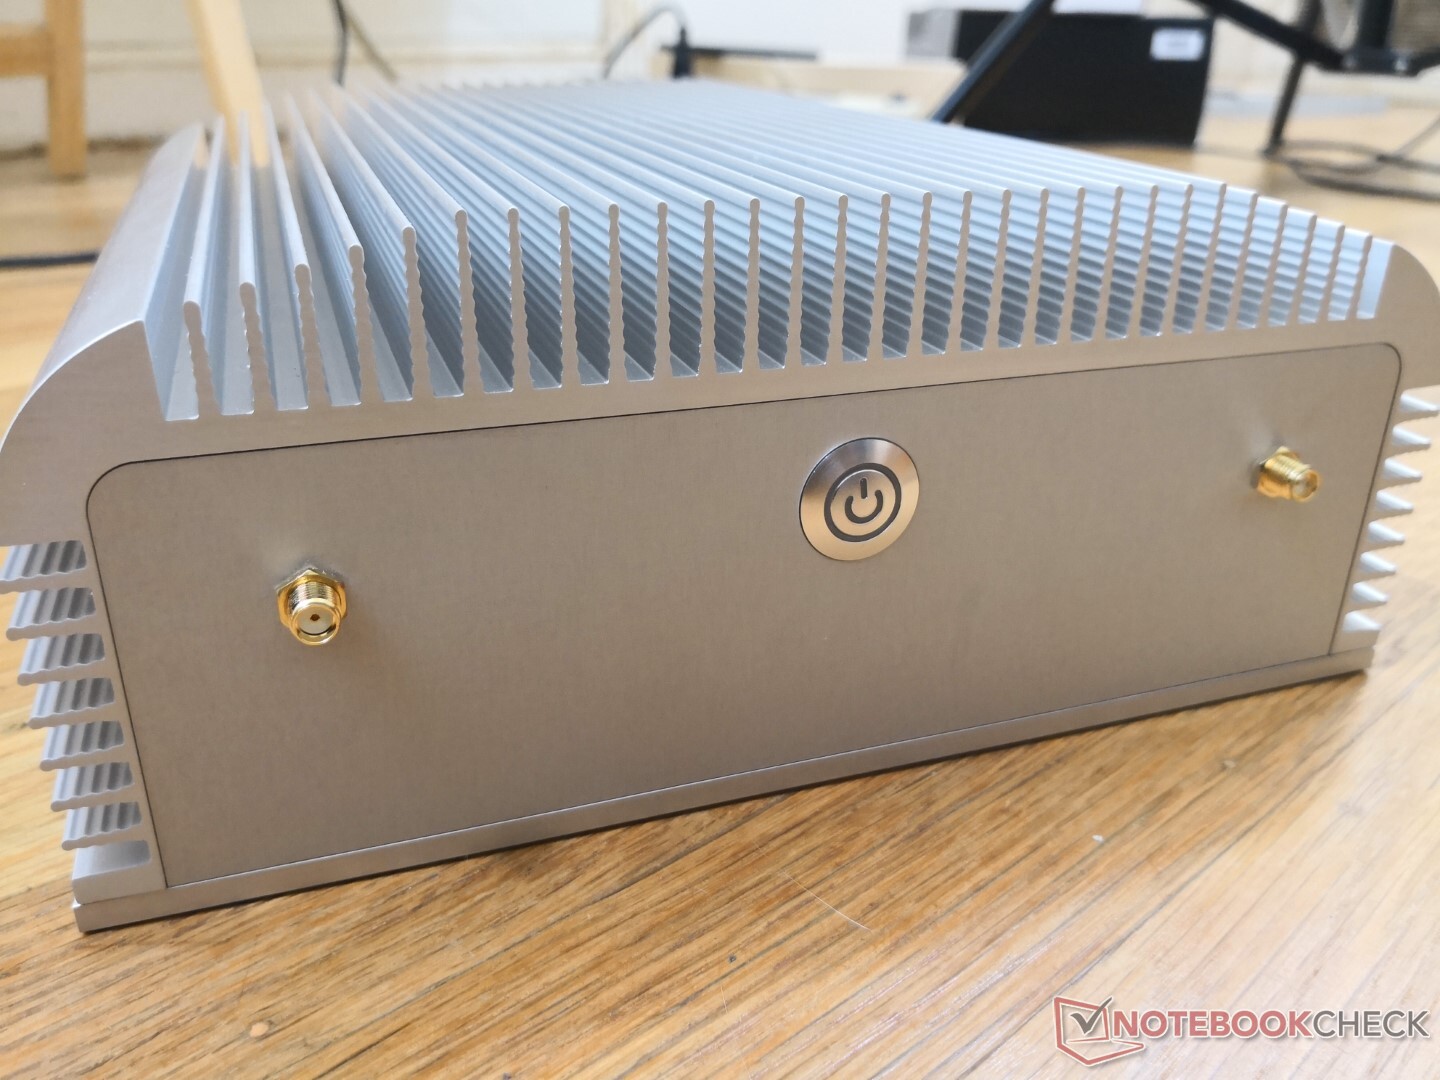
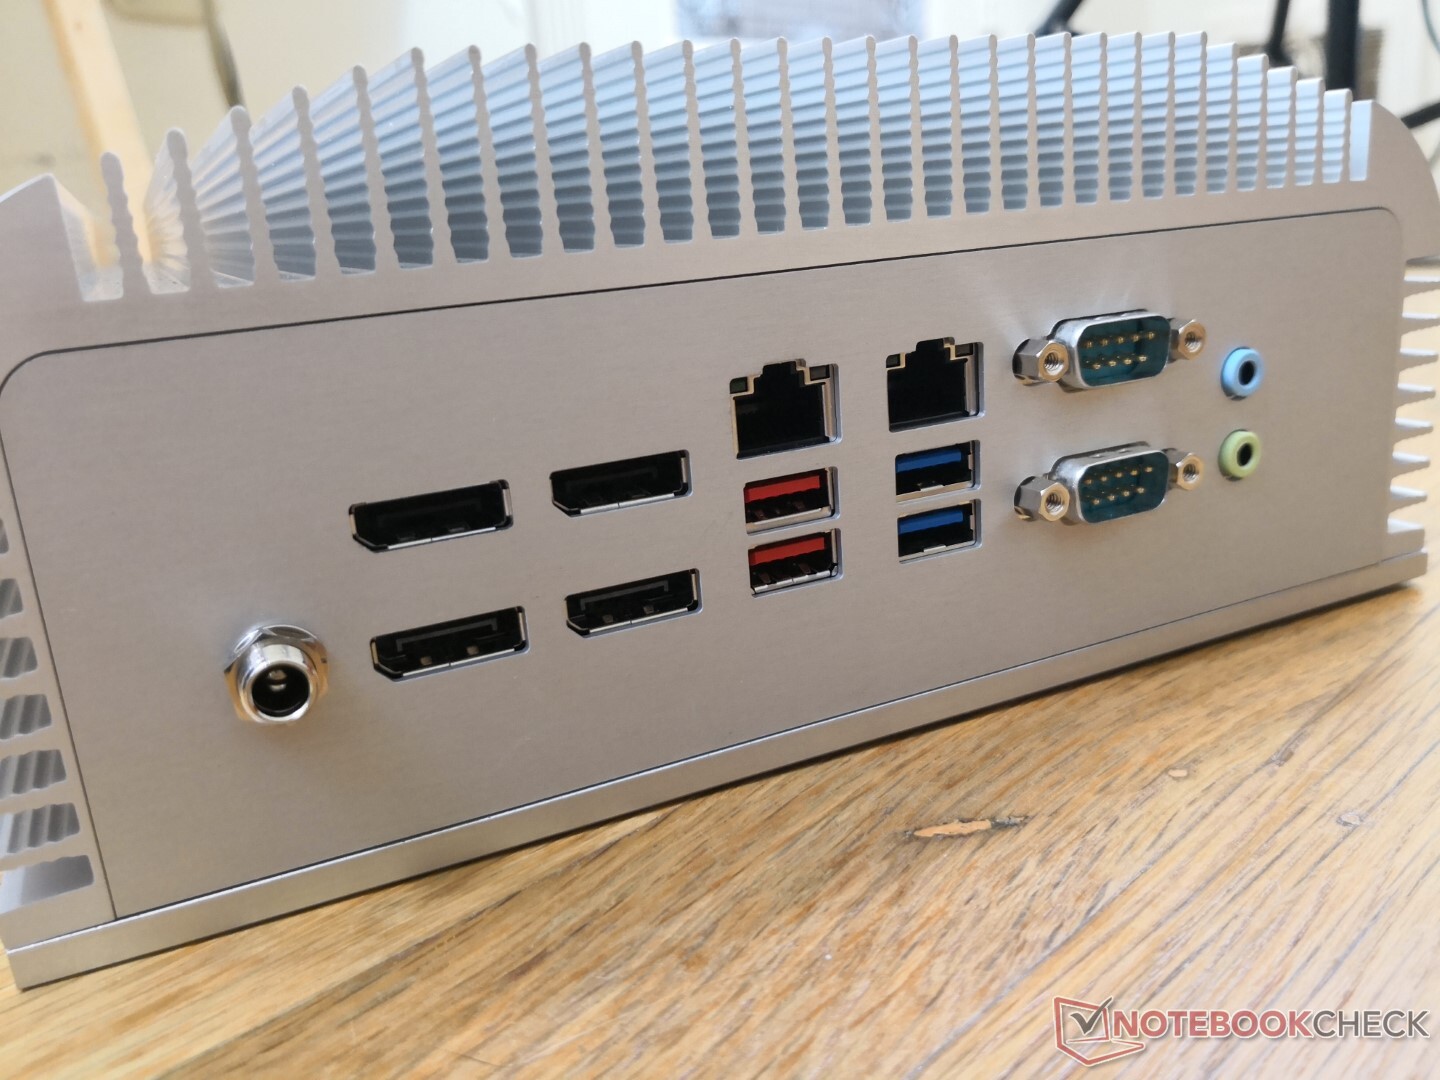
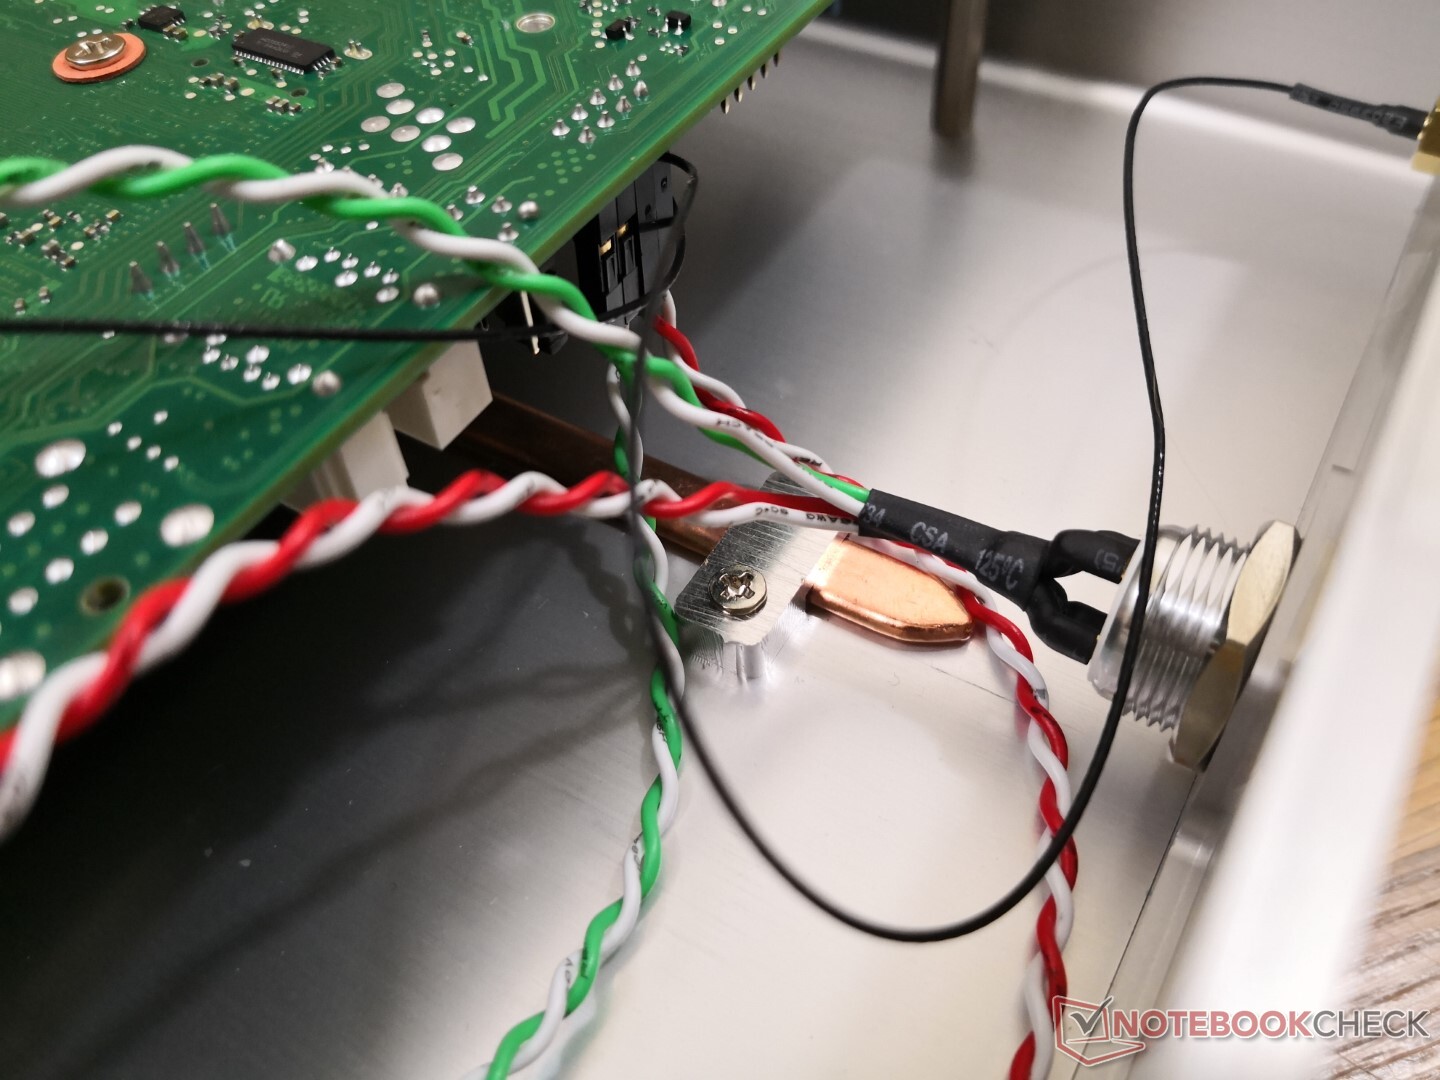
Les deux antennes se fixent à l'avant de l'appareil plutôt qu'à l'arrière. Il est ennuyeux de constater qu'il n'y a pas de port HDMI ou USB-C.
Communication
Modules de communication filaire et sans fil intégrés, solutions alternatives disponibles (UMTS) ?, Irrégularités (réception radio) ?
| Networking | |
| iperf3 transmit AX12 | |
| Intel NUC11PHKi7C | |
| Impact Display Solutions IMP-3713-V2-16-500 | |
| Intel NUC11PAQi7 | |
| Zotac ZBox MI643 | |
| Impact Display Solutions IMP-3654-B1-R Core i9-9900T | |
| iperf3 receive AX12 | |
| Impact Display Solutions IMP-3713-V2-16-500 | |
| Intel NUC11PHKi7C | |
| Intel NUC11PAQi7 | |
| Impact Display Solutions IMP-3654-B1-R Core i9-9900T | |
| Zotac ZBox MI643 | |
Maintenance
Le panneau inférieur s'enlève facilement à l'aide d'un simple tournevis Philips pour révéler le dessous de la carte mère. L'accès au reste de la carte mère, cependant, nécessite un démontage supplémentaire.
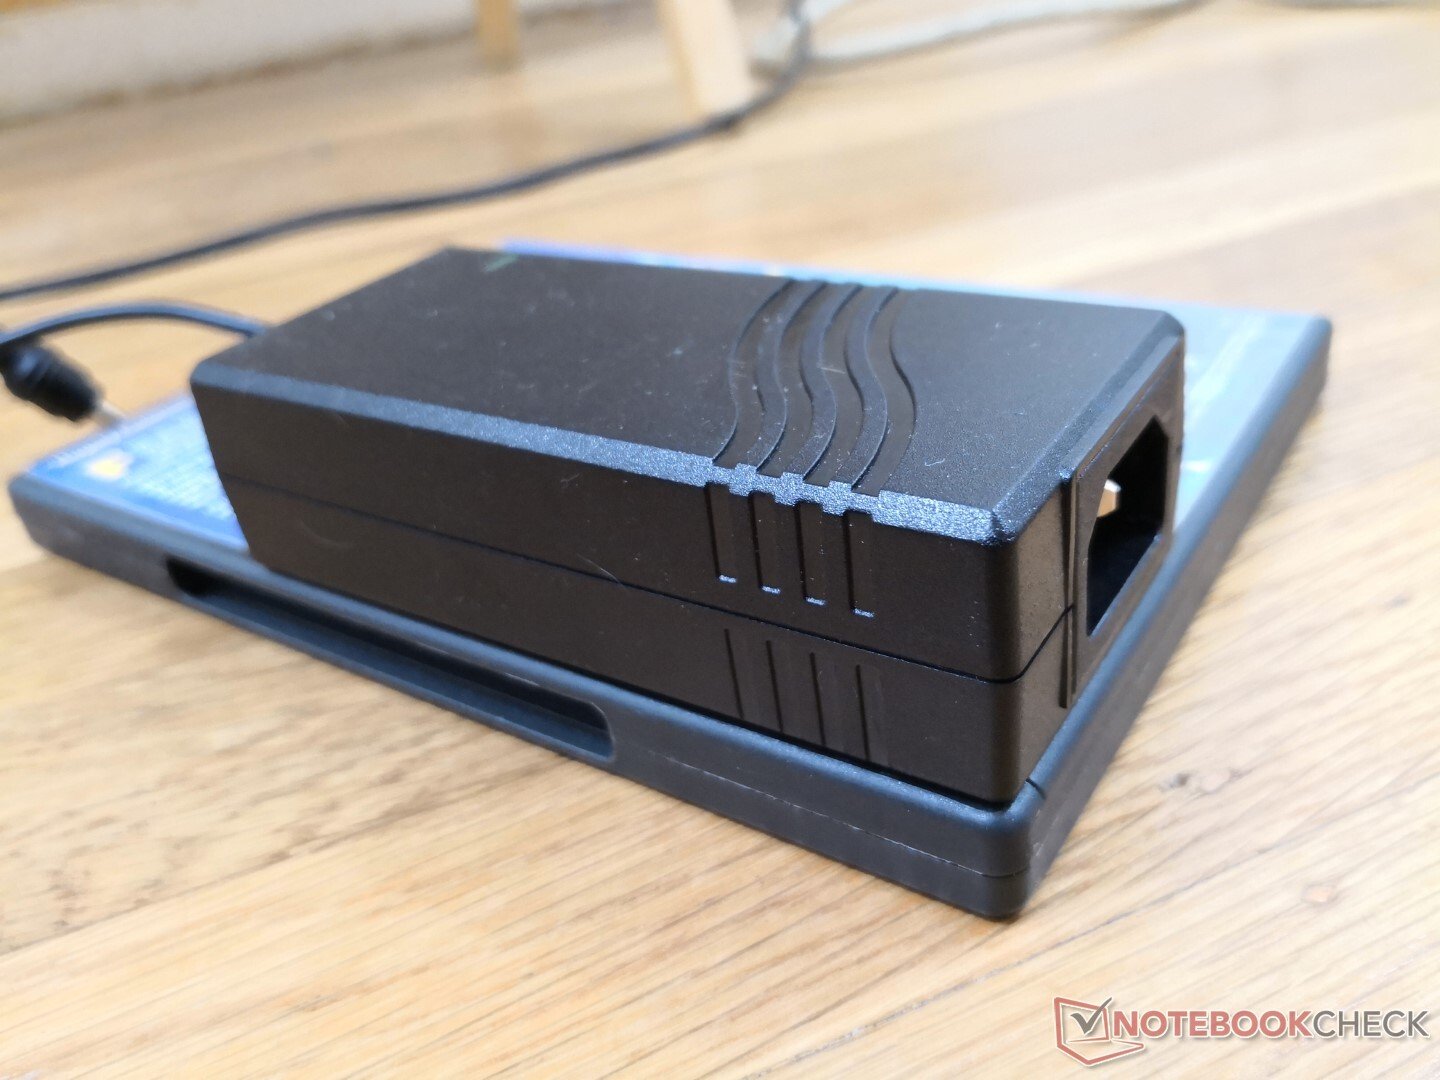
Accessoires et garantie
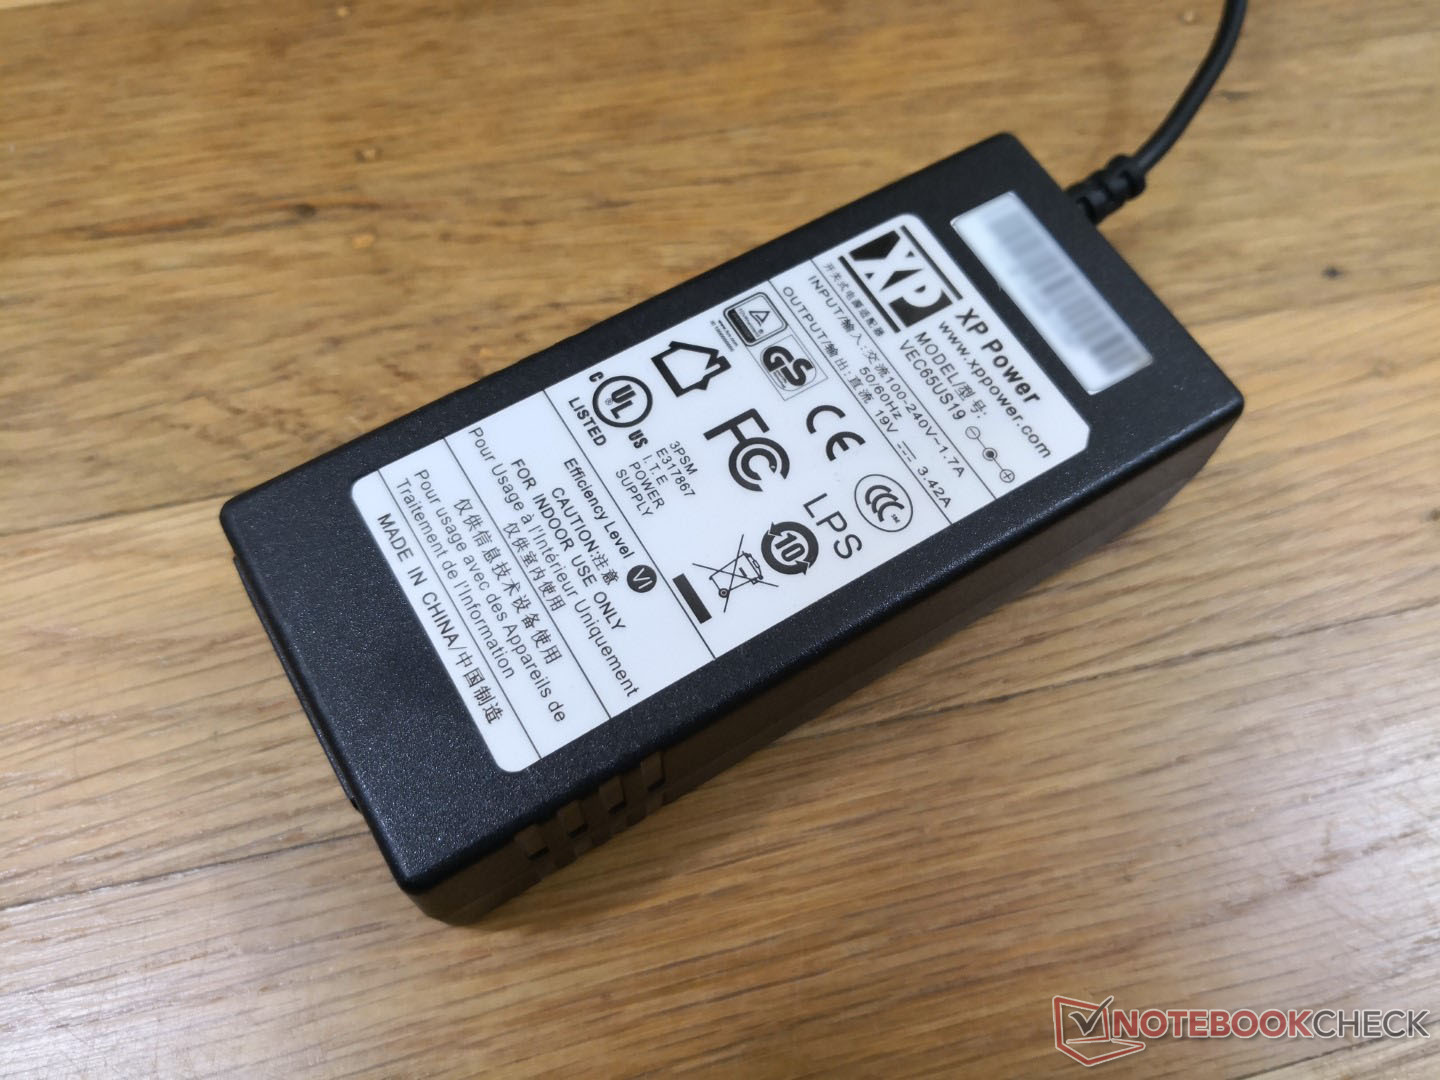
La boîte comprend deux antennes ainsi qu'un adaptateur secteur. La garantie standard limitée d'un an du fabricant s'applique.
Performance
Processeur
Les performances brutes du CPU sont environ 14 % et 22 % plus lentes que celles des modèles Ryzen 3 4300U dans les charges de travail multithread et single-thread, respectivement, pour représenter un processeur d'entrée de gamme.
Cinebench R23: Multi Core | Single Core
Cinebench R15: CPU Multi 64Bit | CPU Single 64Bit
Blender: v2.79 BMW27 CPU
7-Zip 18.03: 7z b 4 -mmt1 | 7z b 4
Geekbench 5.5: Single-Core | Multi-Core
HWBOT x265 Benchmark v2.2: 4k Preset
LibreOffice : 20 Documents To PDF
R Benchmark 2.5: Overall mean
| Cinebench R23 / Multi Core | |
| Intel NUC11PAQi7 | |
| Intel NUC11PHKi7C | |
| Intel NUC11TNKi5 | |
| Honor MagicBook Pro 10210U | |
| Impact Display Solutions IMP-3713-V2-16-500 | |
| Cinebench R23 / Single Core | |
| Intel NUC11PHKi7C | |
| Intel NUC11TNKi5 | |
| Honor MagicBook Pro 10210U | |
| Impact Display Solutions IMP-3713-V2-16-500 | |
Cinebench R23: Multi Core | Single Core
Cinebench R15: CPU Multi 64Bit | CPU Single 64Bit
Blender: v2.79 BMW27 CPU
7-Zip 18.03: 7z b 4 -mmt1 | 7z b 4
Geekbench 5.5: Single-Core | Multi-Core
HWBOT x265 Benchmark v2.2: 4k Preset
LibreOffice : 20 Documents To PDF
R Benchmark 2.5: Overall mean
* ... Moindre est la valeur, meilleures sont les performances
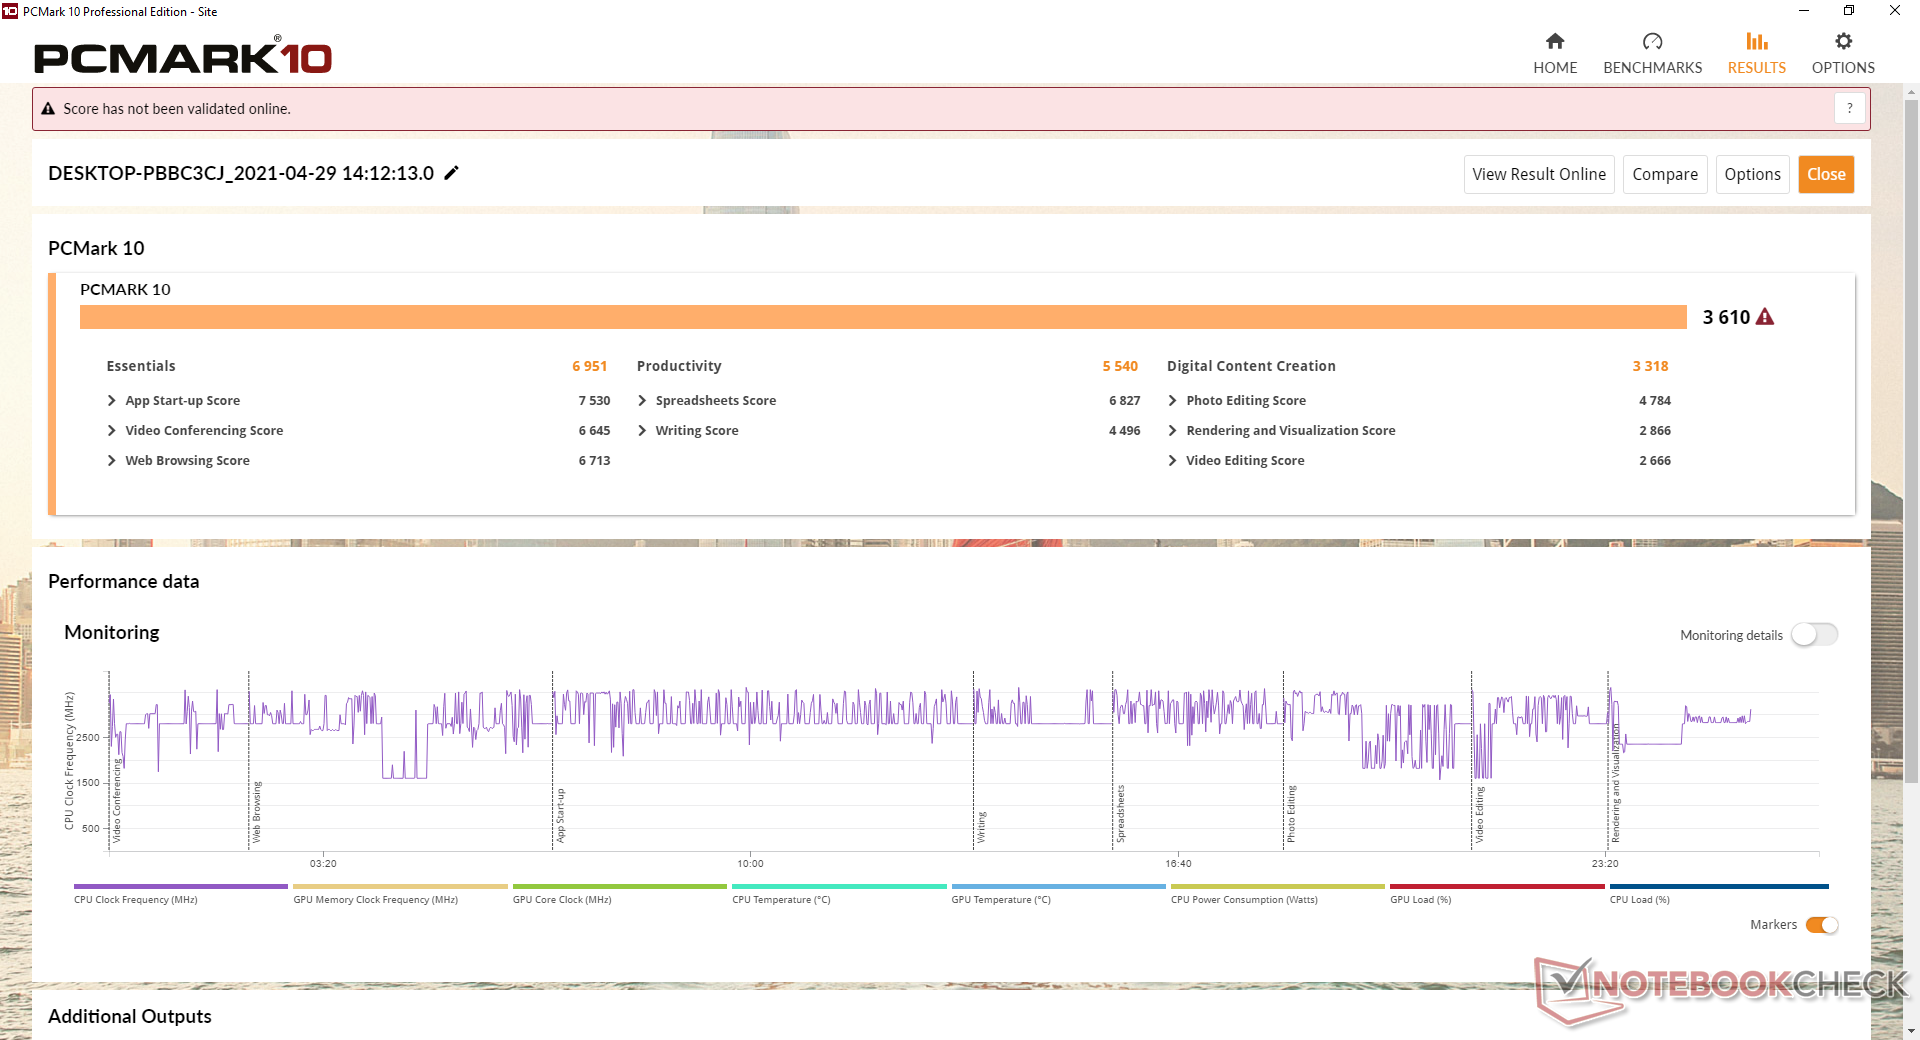
Performance du système
| PCMark 10 | |
| Score | |
| Intel NUC11PHKi7C | |
| Intel NUC11PAQi7 | |
| Zotac ZBox MI643 | |
| Impact Display Solutions IMP-3654-B1-R Core i9-9900T | |
| Impact Display Solutions IMP-3713-V2-16-500 | |
| Essentials | |
| Intel NUC11PAQi7 | |
| Zotac ZBox MI643 | |
| Intel NUC11PHKi7C | |
| Impact Display Solutions IMP-3654-B1-R Core i9-9900T | |
| Impact Display Solutions IMP-3713-V2-16-500 | |
| Productivity | |
| Intel NUC11PHKi7C | |
| Intel NUC11PAQi7 | |
| Impact Display Solutions IMP-3654-B1-R Core i9-9900T | |
| Zotac ZBox MI643 | |
| Impact Display Solutions IMP-3713-V2-16-500 | |
| Digital Content Creation | |
| Intel NUC11PHKi7C | |
| Intel NUC11PAQi7 | |
| Impact Display Solutions IMP-3654-B1-R Core i9-9900T | |
| Impact Display Solutions IMP-3713-V2-16-500 | |
| Zotac ZBox MI643 | |
| PCMark 10 Score | 3610 points | |
Aide | ||
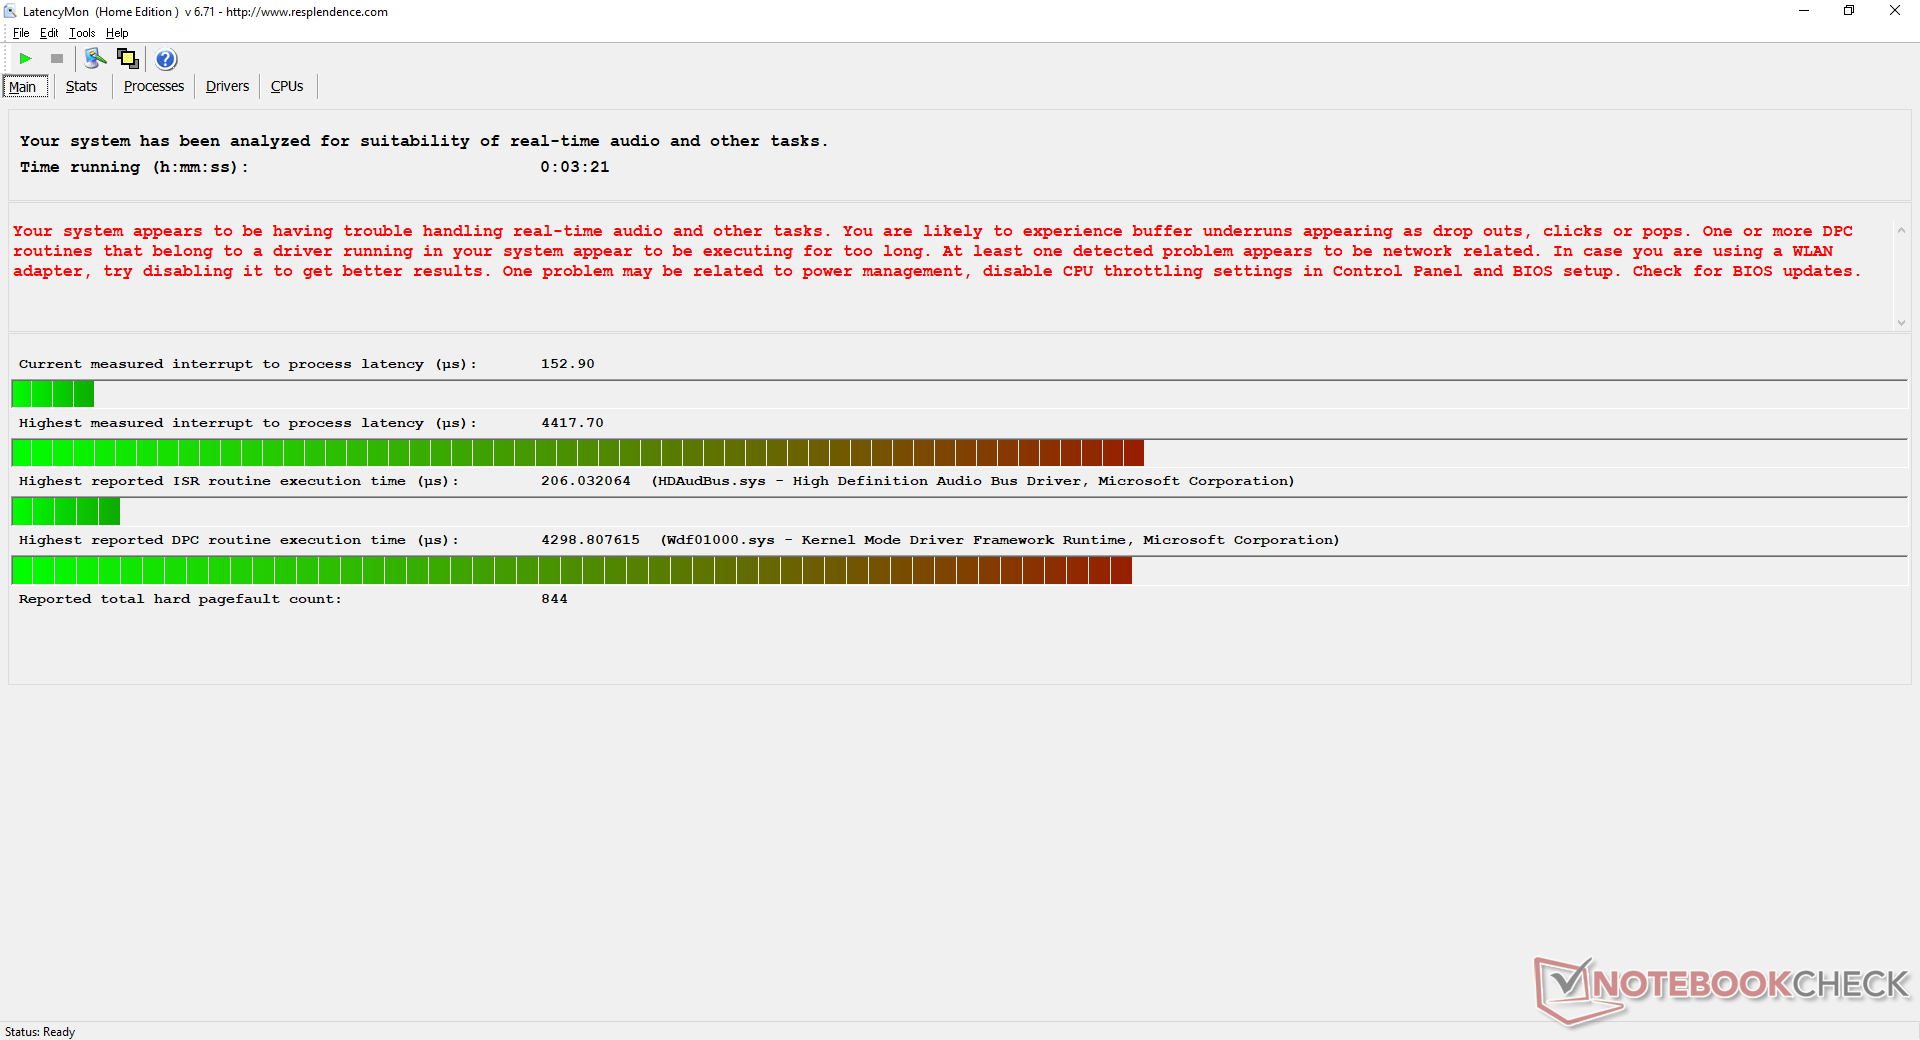
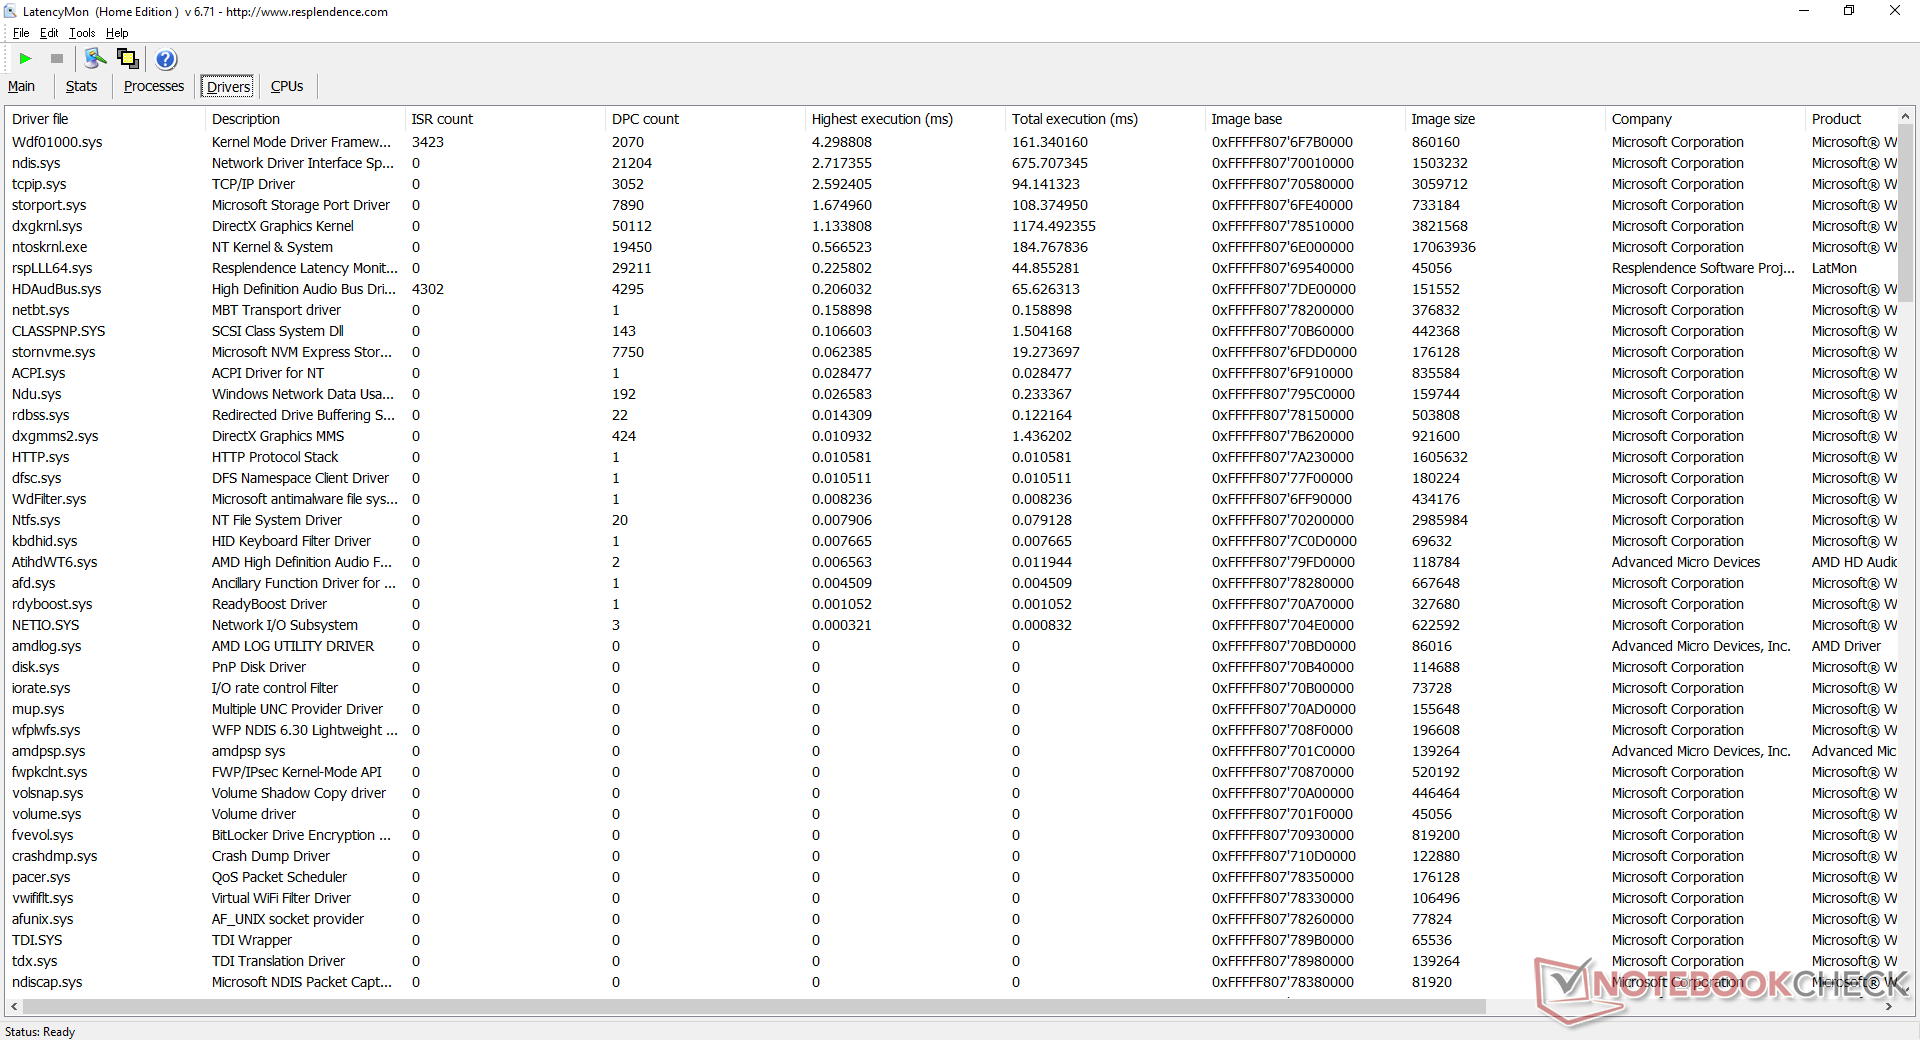
Latence DPC
LatencyMon montre des problèmes de latence DPC lors de l'ouverture de plusieurs onglets sur notre page d'accueil ou lorsque le CPU est sollicité à fond sous Prime95. La lecture 4K UHD à 60 FPS est autrement fluide avec seulement quatre images perdues pendant notre test vidéo d'une minute.
| DPC Latencies / LatencyMon - interrupt to process latency (max), Web, Youtube, Prime95 | |
| Impact Display Solutions IMP-3713-V2-16-500 | |
| HP Envy 13-ba0001ng | |
| Intel NUC11PAQi7 | |
* ... Moindre est la valeur, meilleures sont les performances
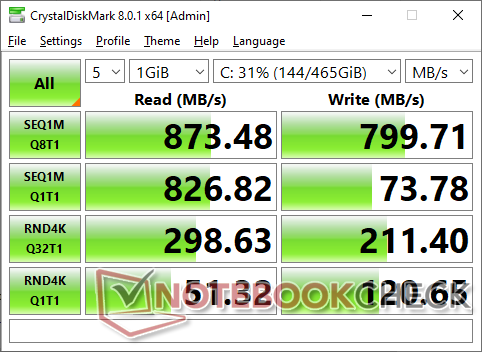
Périphériques de stockage
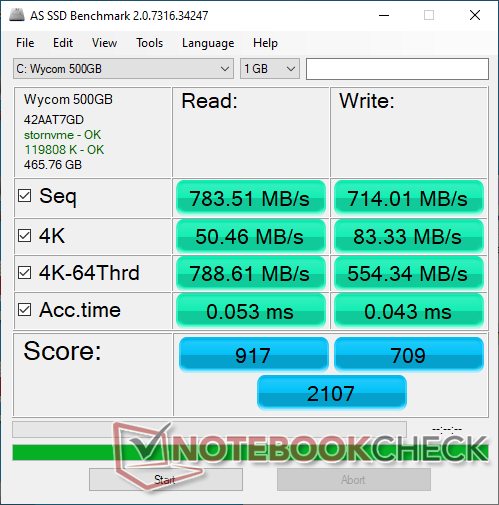
Le SSD Wycom de 500 Go avec contrôleur Silicon Motion SM2262EN offre des taux de transfert plus rapides que le SATA III, mais il reste bien en deçà de la plupart des autres SSD NVMe. Les taux de lecture et d'écriture séquentielles se situent entre 800 et 900 Mo/s, alors que la plupart des disques NVMe sont au moins deux fois plus rapides.
Jusqu'à deux SSD M.2 sont pris en charge par la carte mère, mais seul l'un des deux emplacements est entièrement PCIe x4, l'autre étant PCIe x2.
| Impact Display Solutions IMP-3713-V2-16-500 | Impact Display Solutions IMP-3654-B1-R Core i9-9900T EDGE NextGen SSD 1TB | HP Envy 13-ba0001ng Intel SSD 660p SSDPEKNW512G8 | LG Gram 17 17Z90N-V.AA77G Samsung PM981a MZVLB1T0HBLR | |
|---|---|---|---|---|
| AS SSD | -39% | 17% | 79% | |
| Seq Read (MB/s) | 784 | 1218 55% | 1587 102% | 2722 247% |
| Seq Write (MB/s) | 714 | 1306 83% | 709 -1% | 2649 271% |
| 4K Read (MB/s) | 50.5 | 25.97 -49% | 52 3% | 52.2 3% |
| 4K Write (MB/s) | 83.3 | 43.25 -48% | 144 73% | 132.4 59% |
| 4K-64 Read (MB/s) | 789 | 578 -27% | 322.8 -59% | 886 12% |
| 4K-64 Write (MB/s) | 554 | 520 -6% | 835 51% | 1074 94% |
| Access Time Read * (ms) | 0.053 | 0.118 -123% | 0.103 -94% | 0.041 23% |
| Access Time Write * (ms) | 0.043 | 0.286 -565% | 0.045 -5% | 0.03 30% |
| Score Read (Points) | 917 | 726 -21% | 533 -42% | 1211 32% |
| Score Write (Points) | 709 | 694 -2% | 1050 48% | 1471 107% |
| Score Total (Points) | 2107 | 1800 -15% | 1832 -13% | 3309 57% |
| Copy ISO MB/s (MB/s) | 1007 | 2082 107% | 1483 47% | 2096 108% |
| Copy Program MB/s (MB/s) | 386.3 | 422.8 9% | 730 89% | 395.6 2% |
| Copy Game MB/s (MB/s) | 705 | 1072 52% | 943 34% | 1096 55% |
| CrystalDiskMark 5.2 / 6 | 85% | 78% | 174% | |
| Write 4K (MB/s) | 36.03 | 111.8 210% | 146.3 306% | 162.8 352% |
| Read 4K (MB/s) | 58.5 | 56.8 -3% | 55.7 -5% | 51 -13% |
| Write Seq (MB/s) | 764 | 1148 50% | 949 24% | 2078 172% |
| Read Seq (MB/s) | 838 | 1522 82% | 1494 78% | 1991 138% |
| Write 4K Q32T1 (MB/s) | 210.7 | 399.7 90% | 408.5 94% | 440.1 109% |
| Read 4K Q32T1 (MB/s) | 298.9 | 570 91% | 304 2% | 450.1 51% |
| Write Seq Q32T1 (MB/s) | 798 | 1375 72% | 984 23% | 2998 276% |
| Read Seq Q32T1 (MB/s) | 879 | 1626 85% | 1779 102% | 3562 305% |
| Moyenne finale (programmes/paramètres) | 23% /
6% | 48% /
39% | 127% /
113% |
* ... Moindre est la valeur, meilleures sont les performances

Disk Throttling: DiskSpd Read Loop, Queue Depth 8
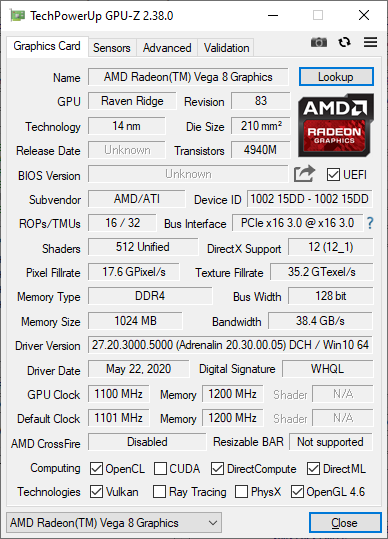
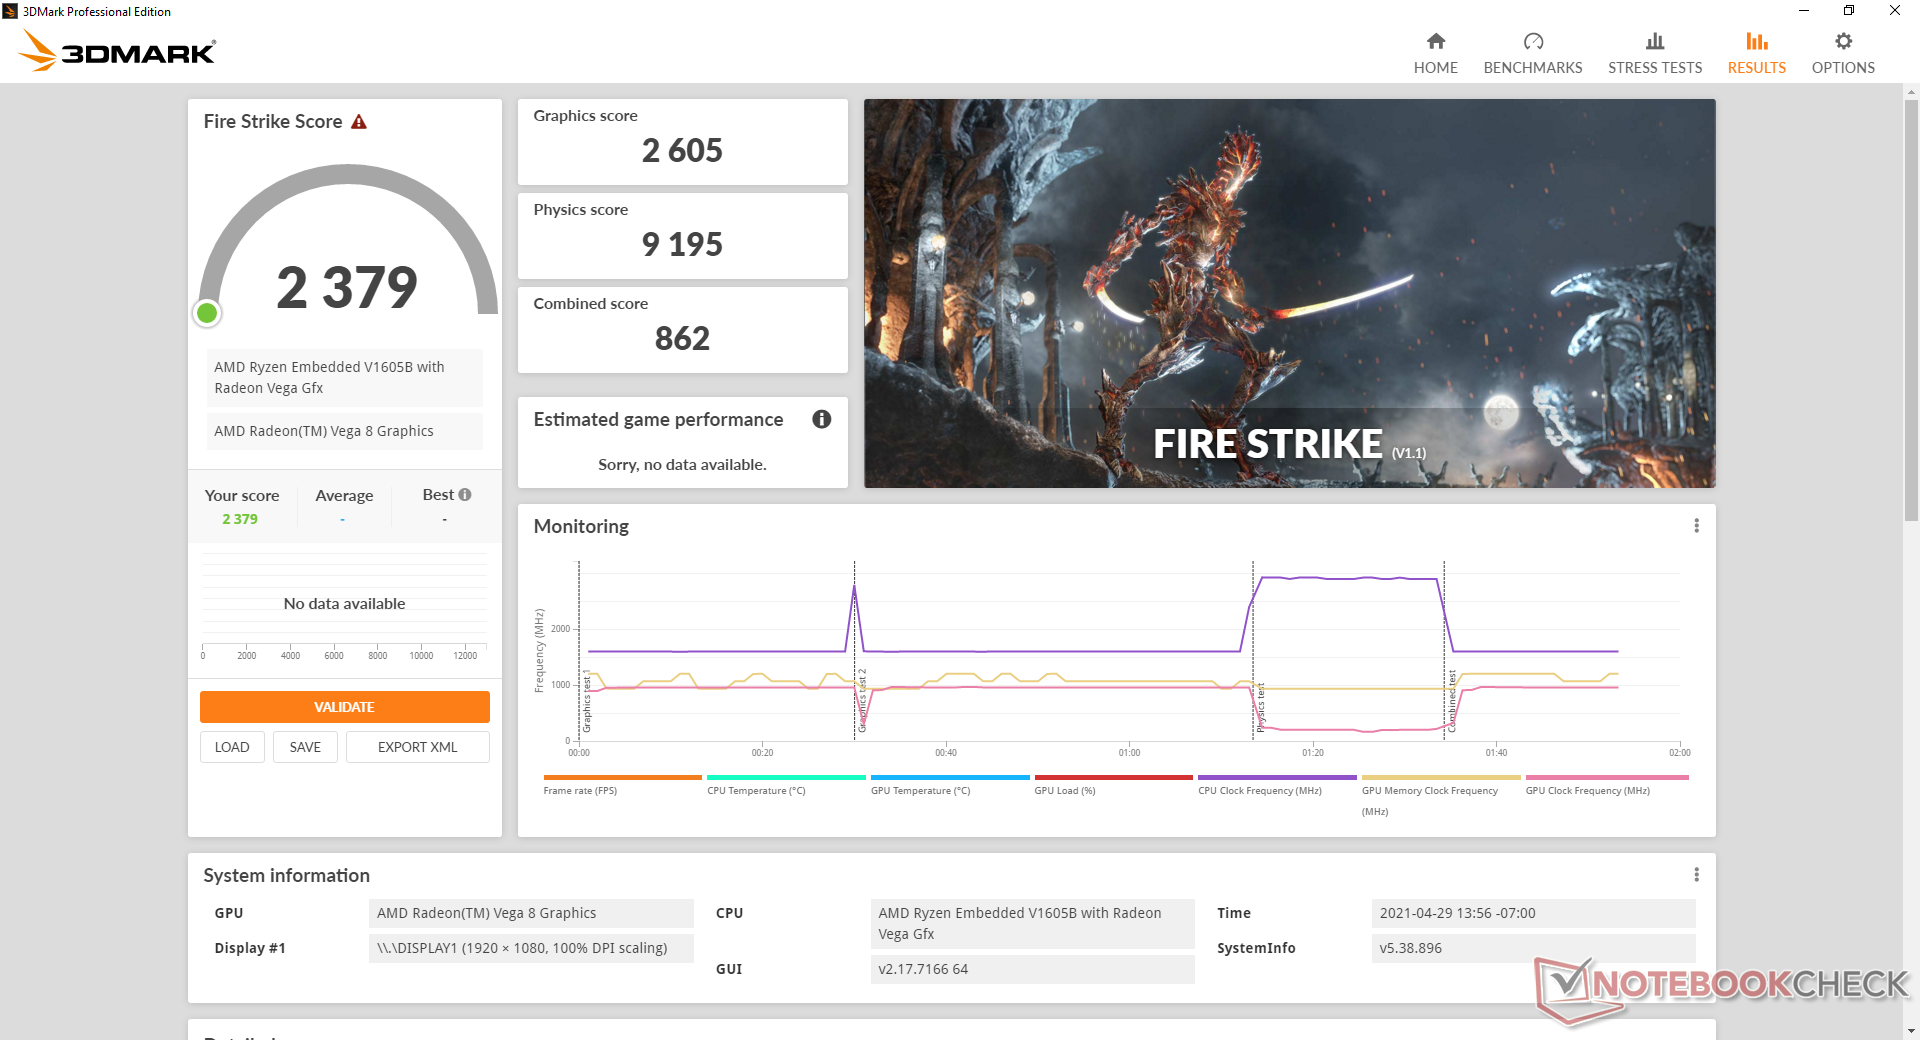
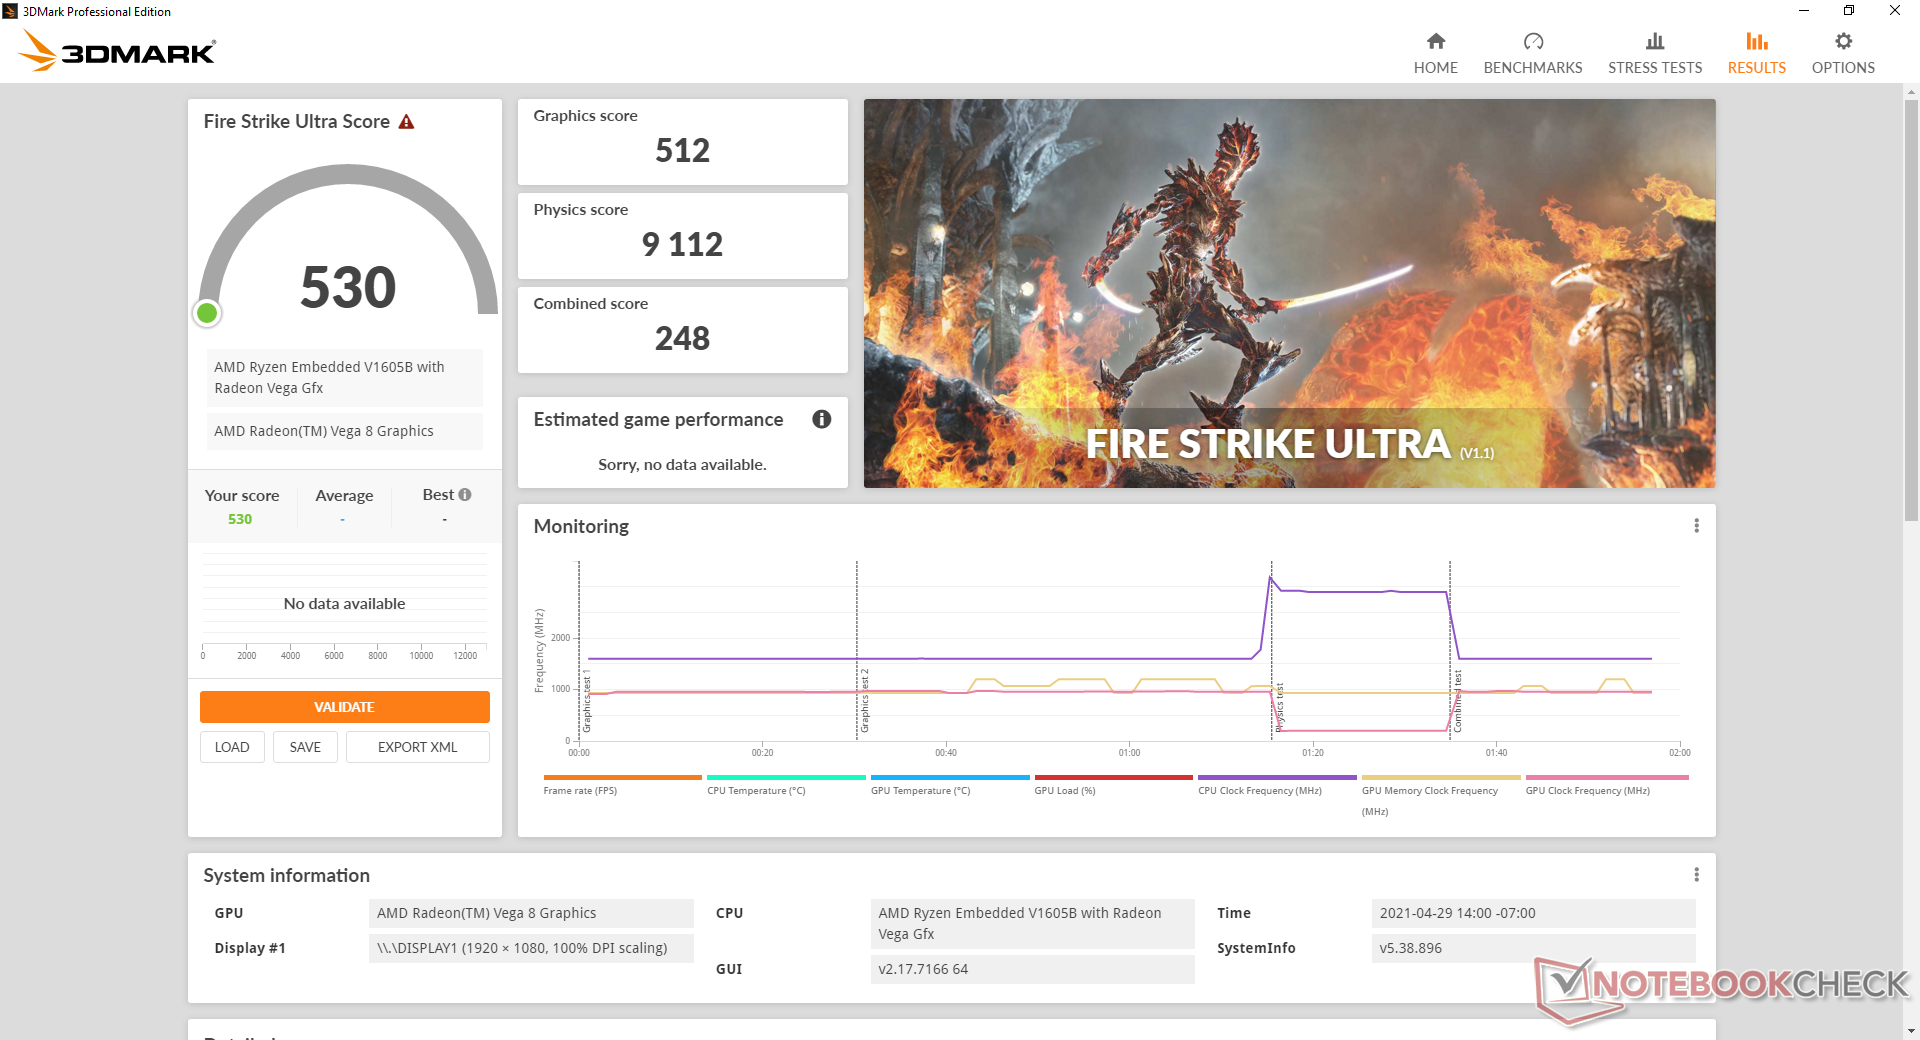
Performances du GPU
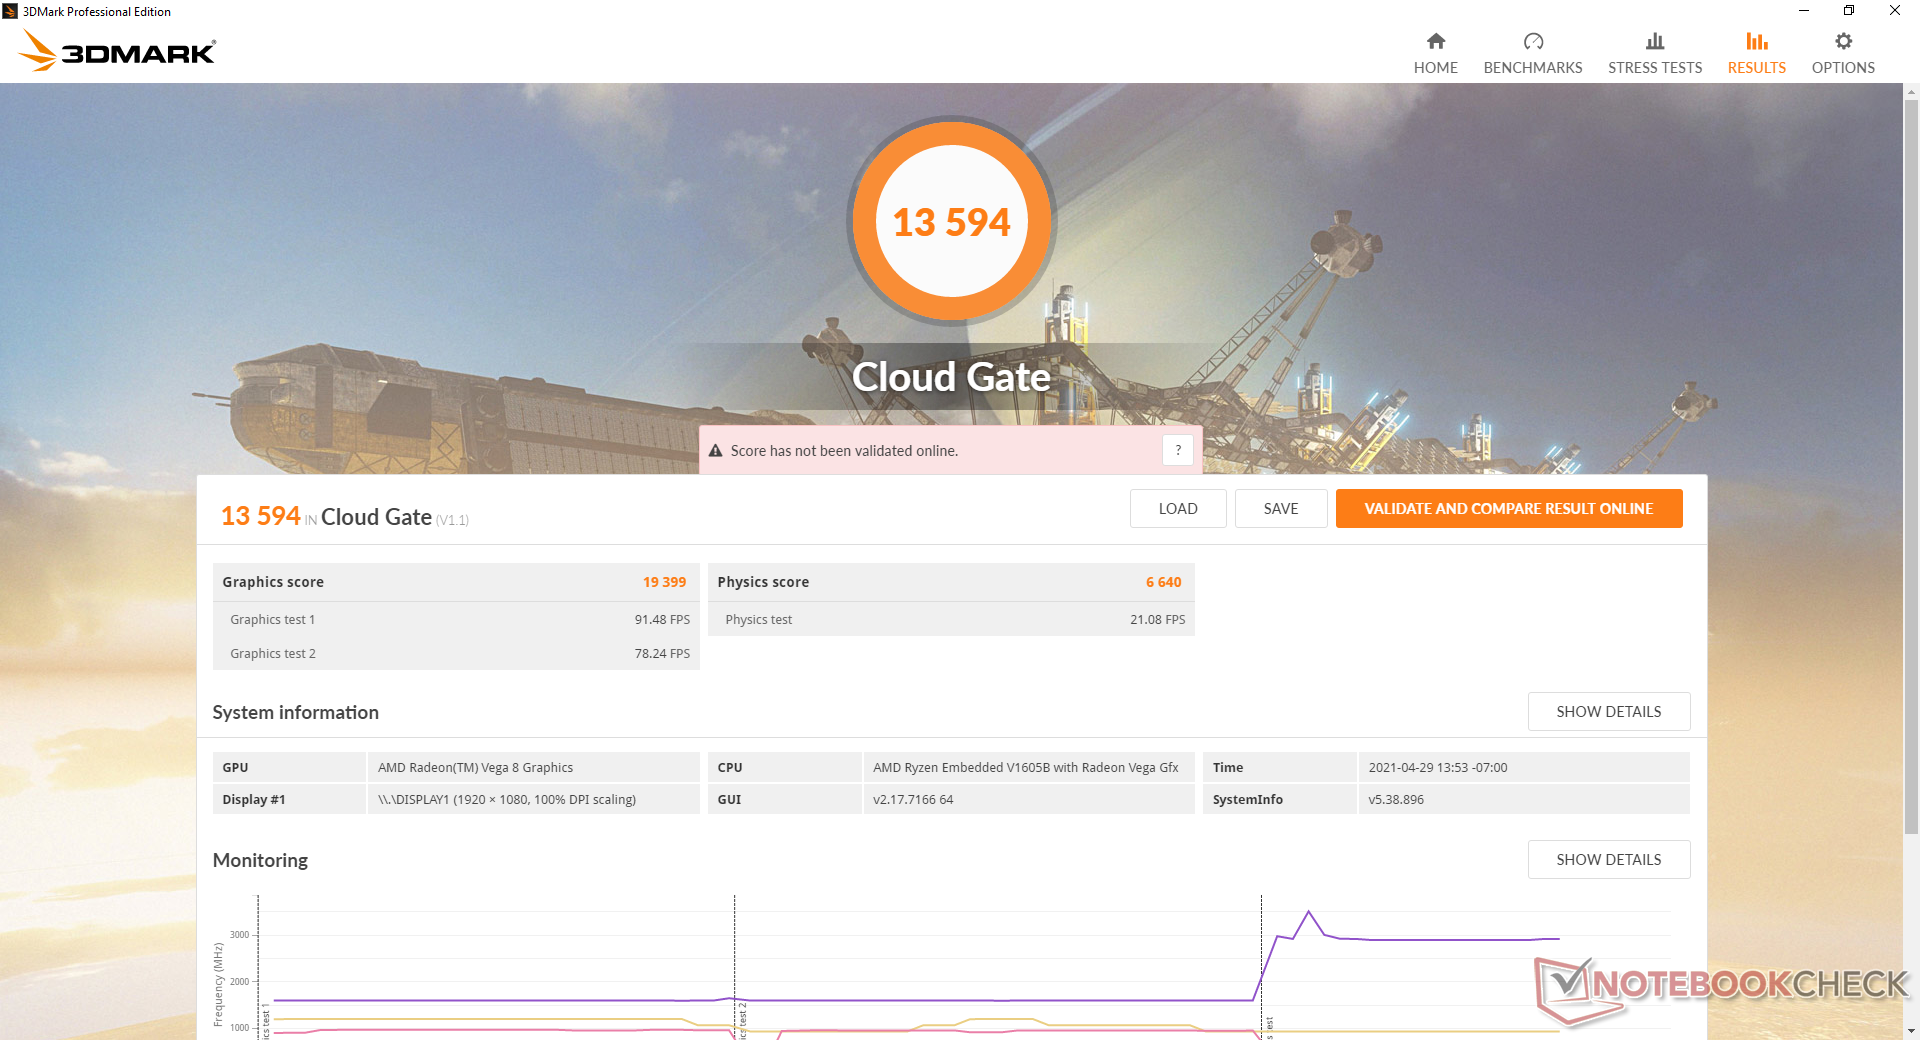
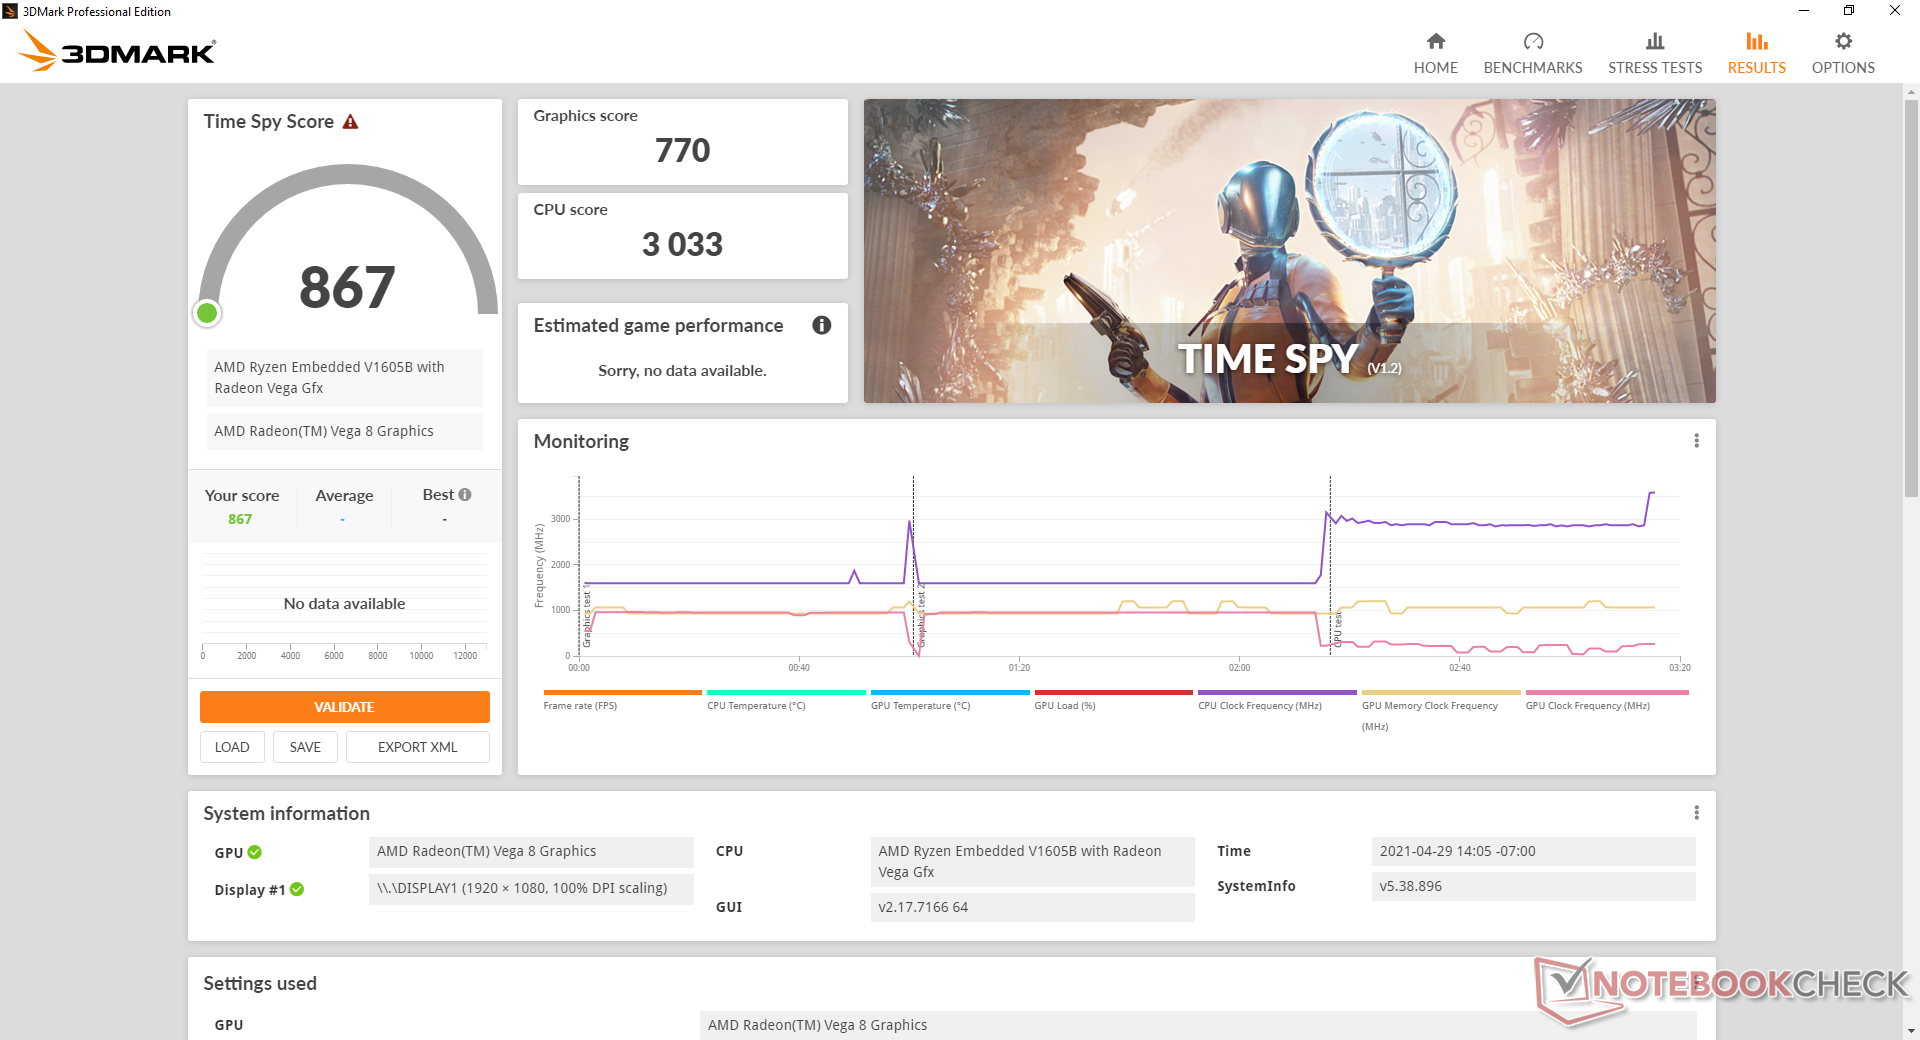
Les performances de la Radeon RX Vega 8 intégrée sont conformes à ce que l'on attend d'elle lorsqu'on la compare aux ordinateurs portables équipés de CPU Ryzen 2000U ou 3000U. Bien qu'il s'agisse d'une énorme amélioration par rapport à l'ancien processeur Intel UHD 620 la plupart des solutions actuelles Core i7 Iris Xe actuels surclasseront notre PC sans ventilateur de 30 à 50 %.
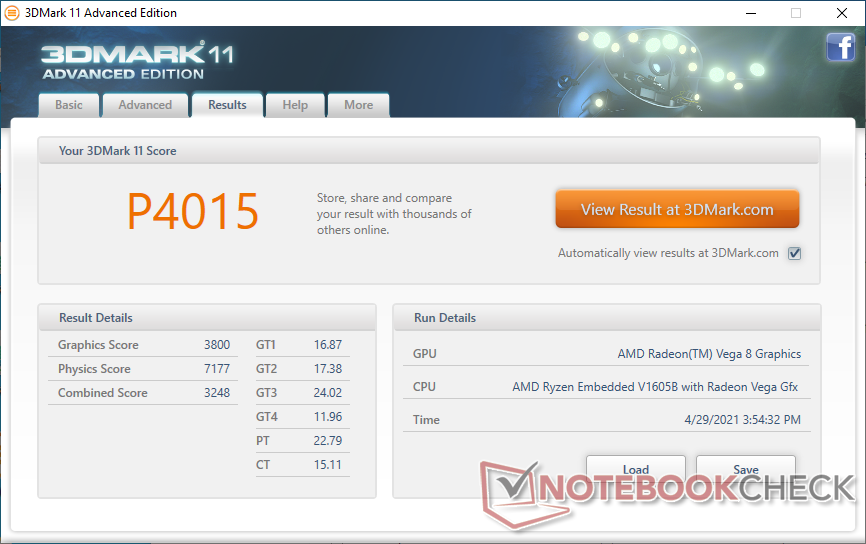
| 3DMark 11 Performance | 4015 points | |
| 3DMark Cloud Gate Standard Score | 13594 points | |
| 3DMark Fire Strike Score | 2379 points | |
| 3DMark Time Spy Score | 867 points | |
Aide | ||
| Bas | Moyen | Élevé | Ultra | |
|---|---|---|---|---|
| The Witcher 3 (2015) | 23 | |||
| Dota 2 Reborn (2015) | 76.6 | 65.9 | 44.4 | 41.4 |
| Final Fantasy XV Benchmark (2018) | 26.4 | 13.6 | 9.22 | |
| X-Plane 11.11 (2018) | 21.2 | 21.2 | 15.9 |
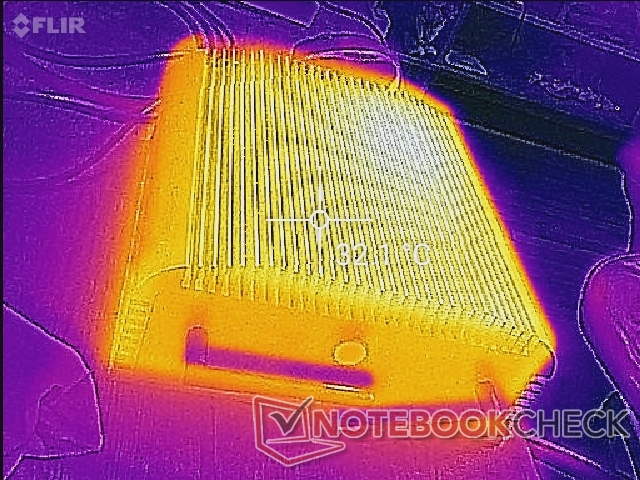
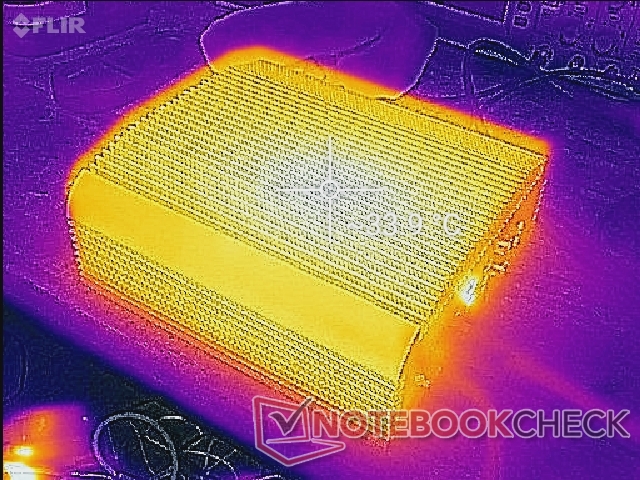
Emissions
Température
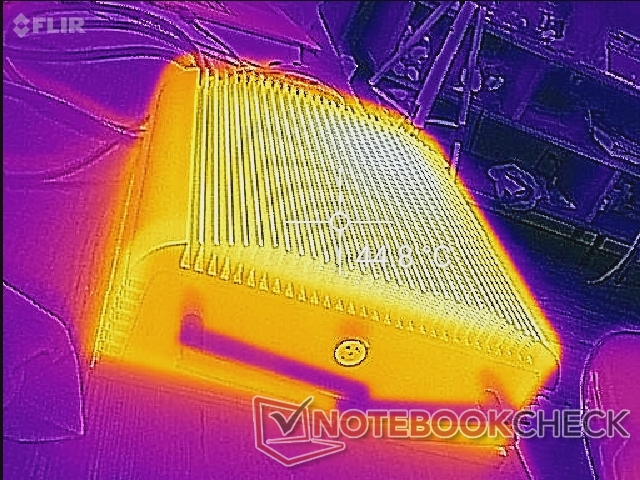
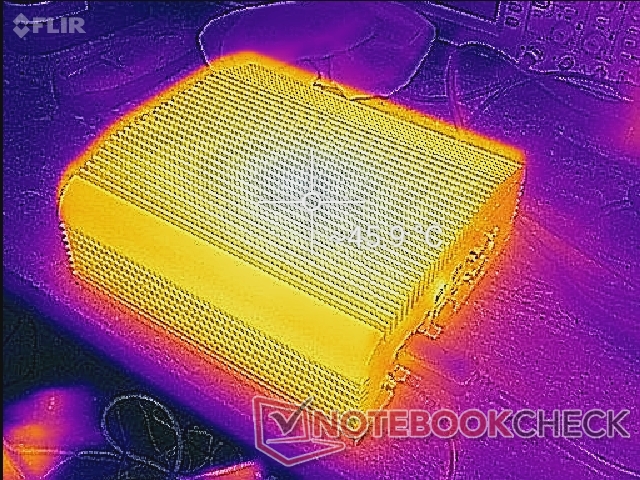
Les températures de surface atteignent 46°C après une charge extrême de plus d'une heure.
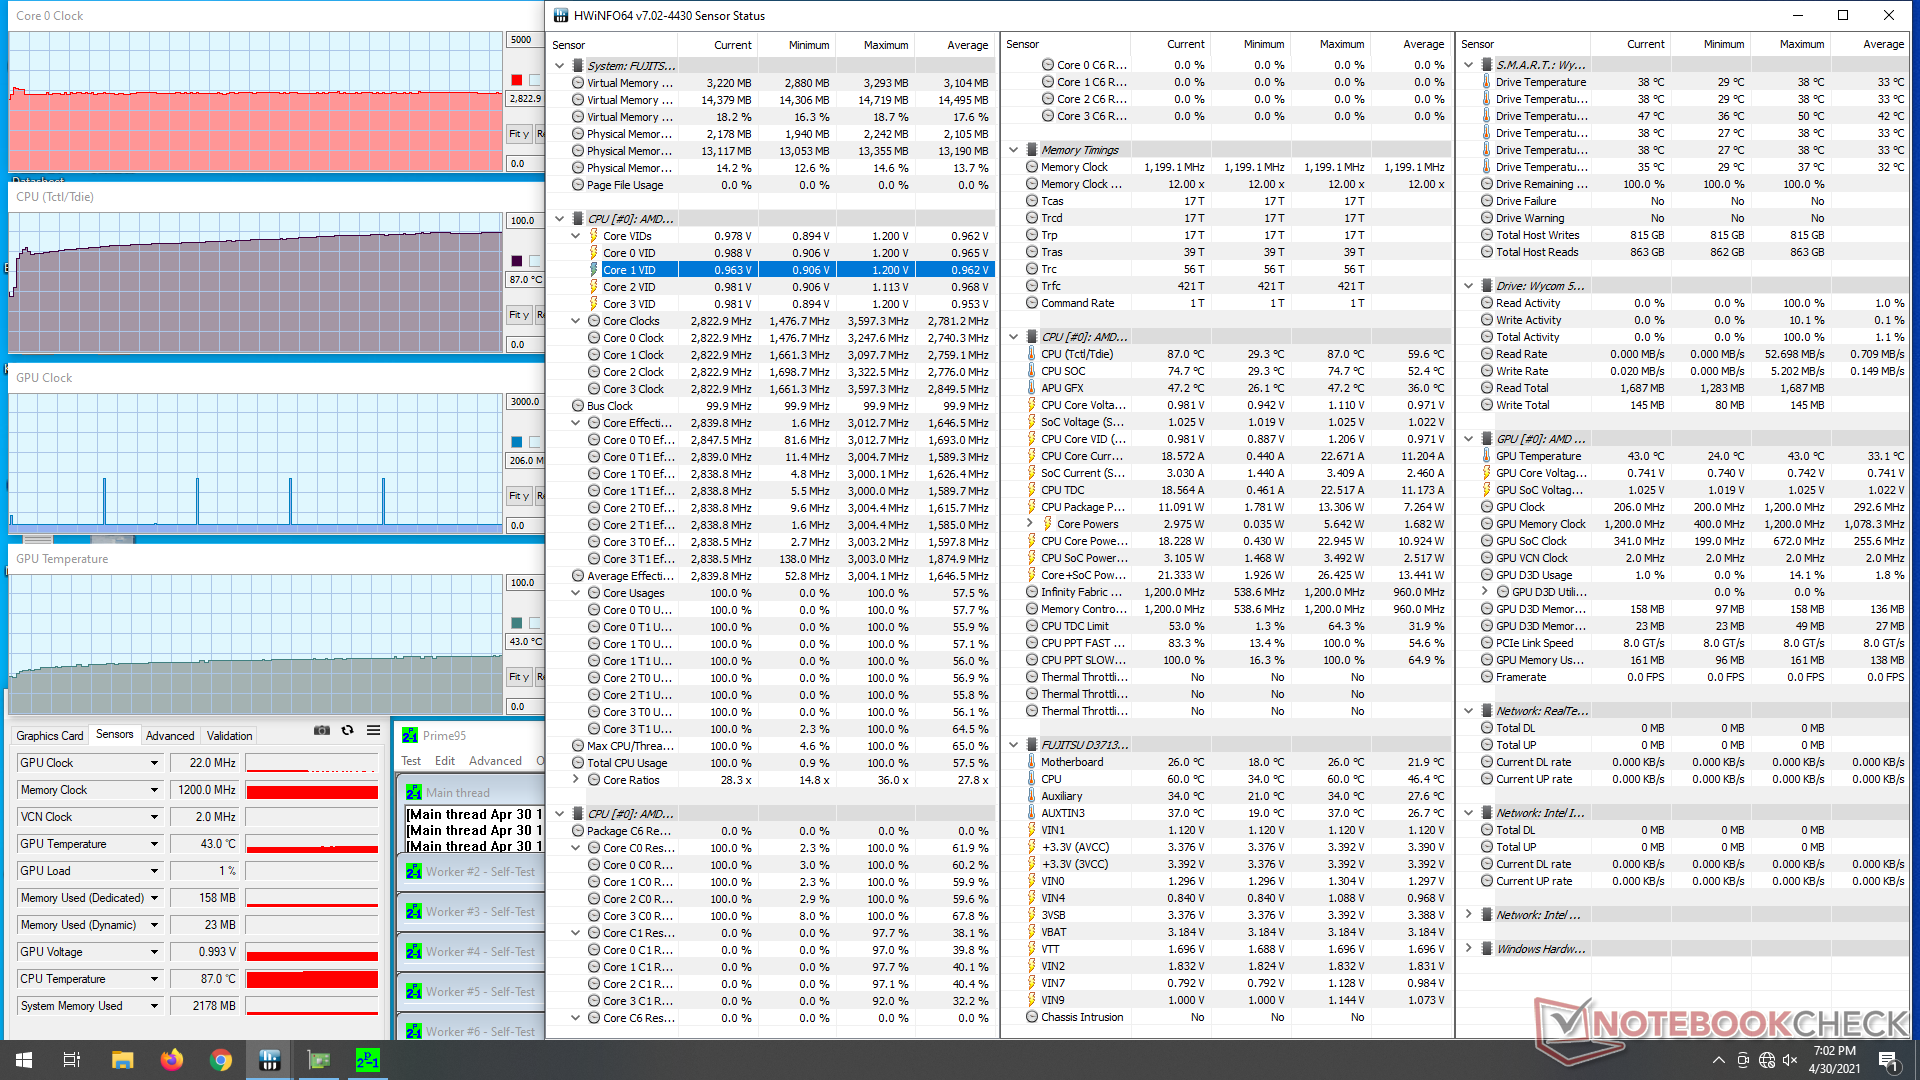
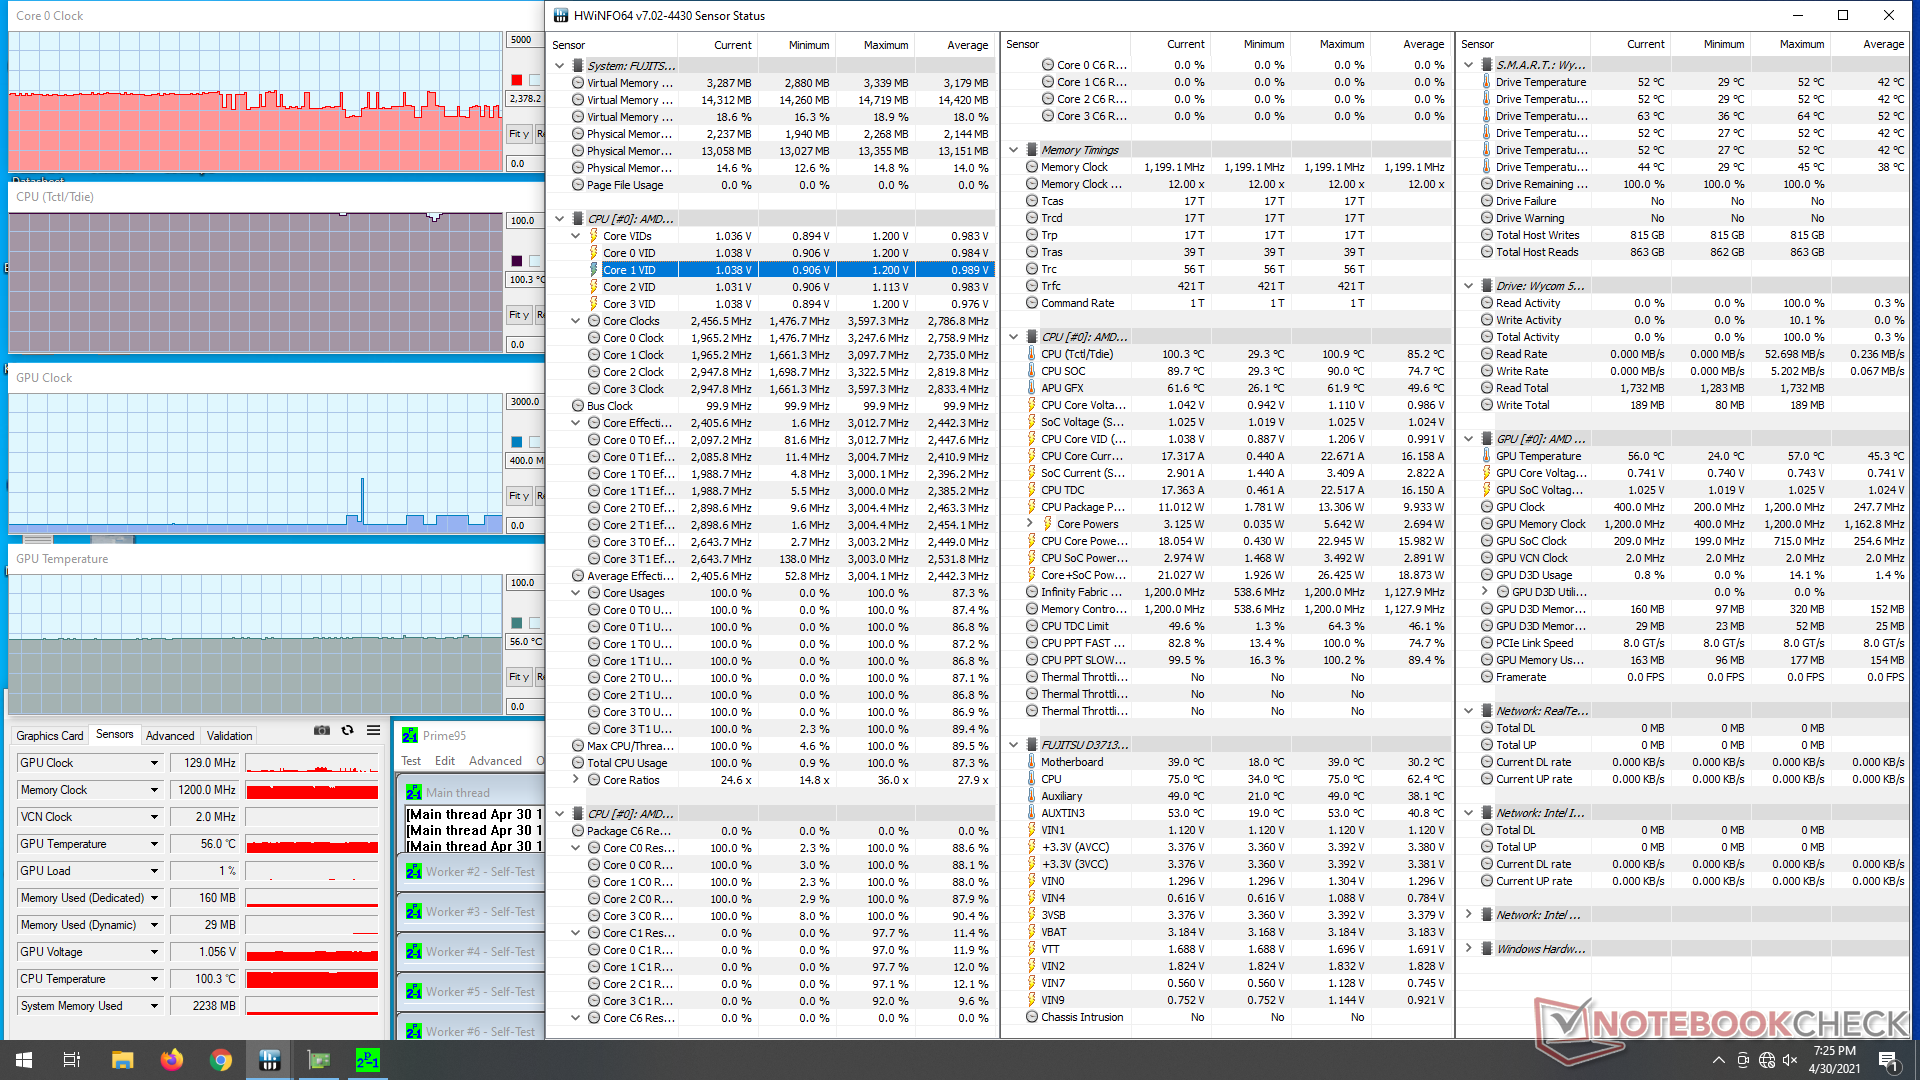
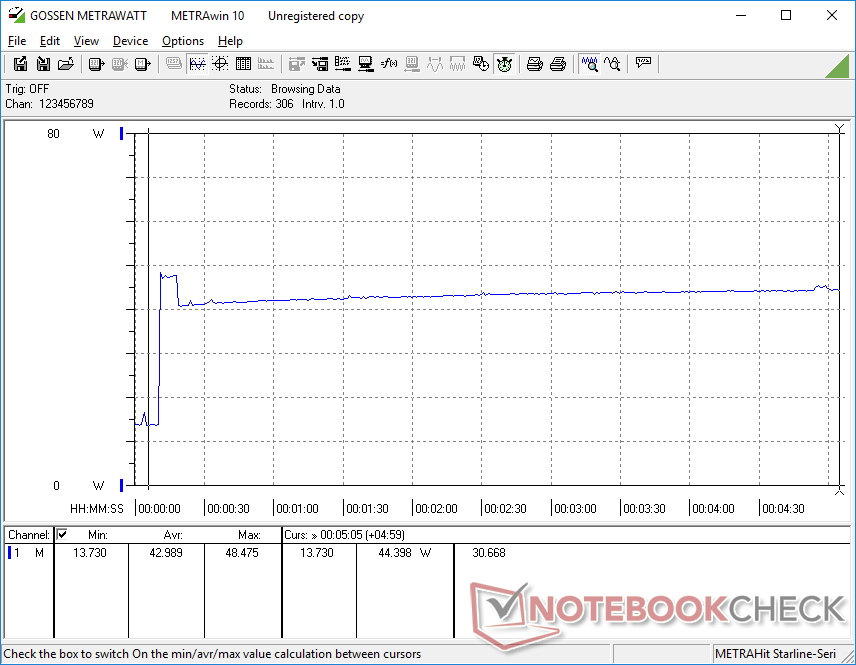
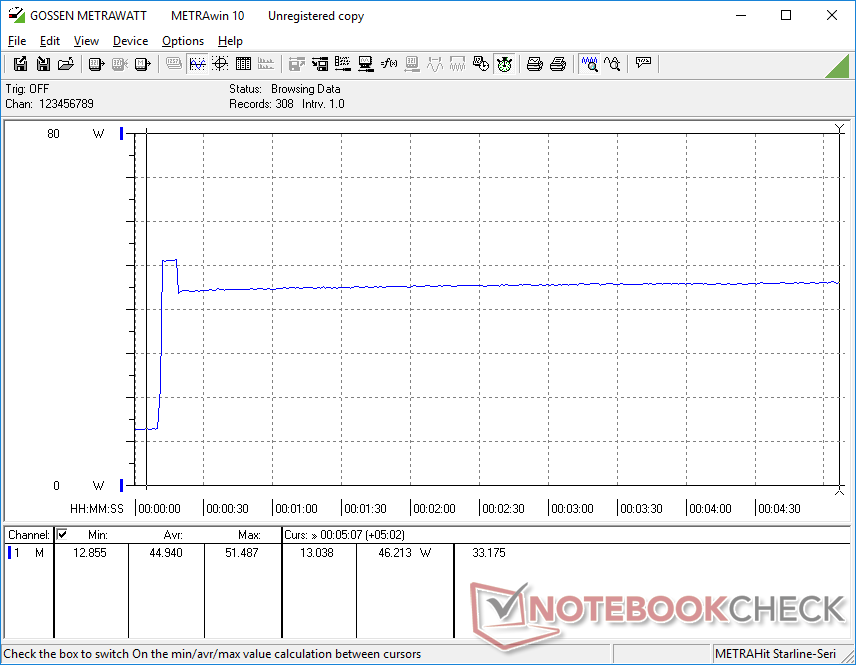
Test de stress
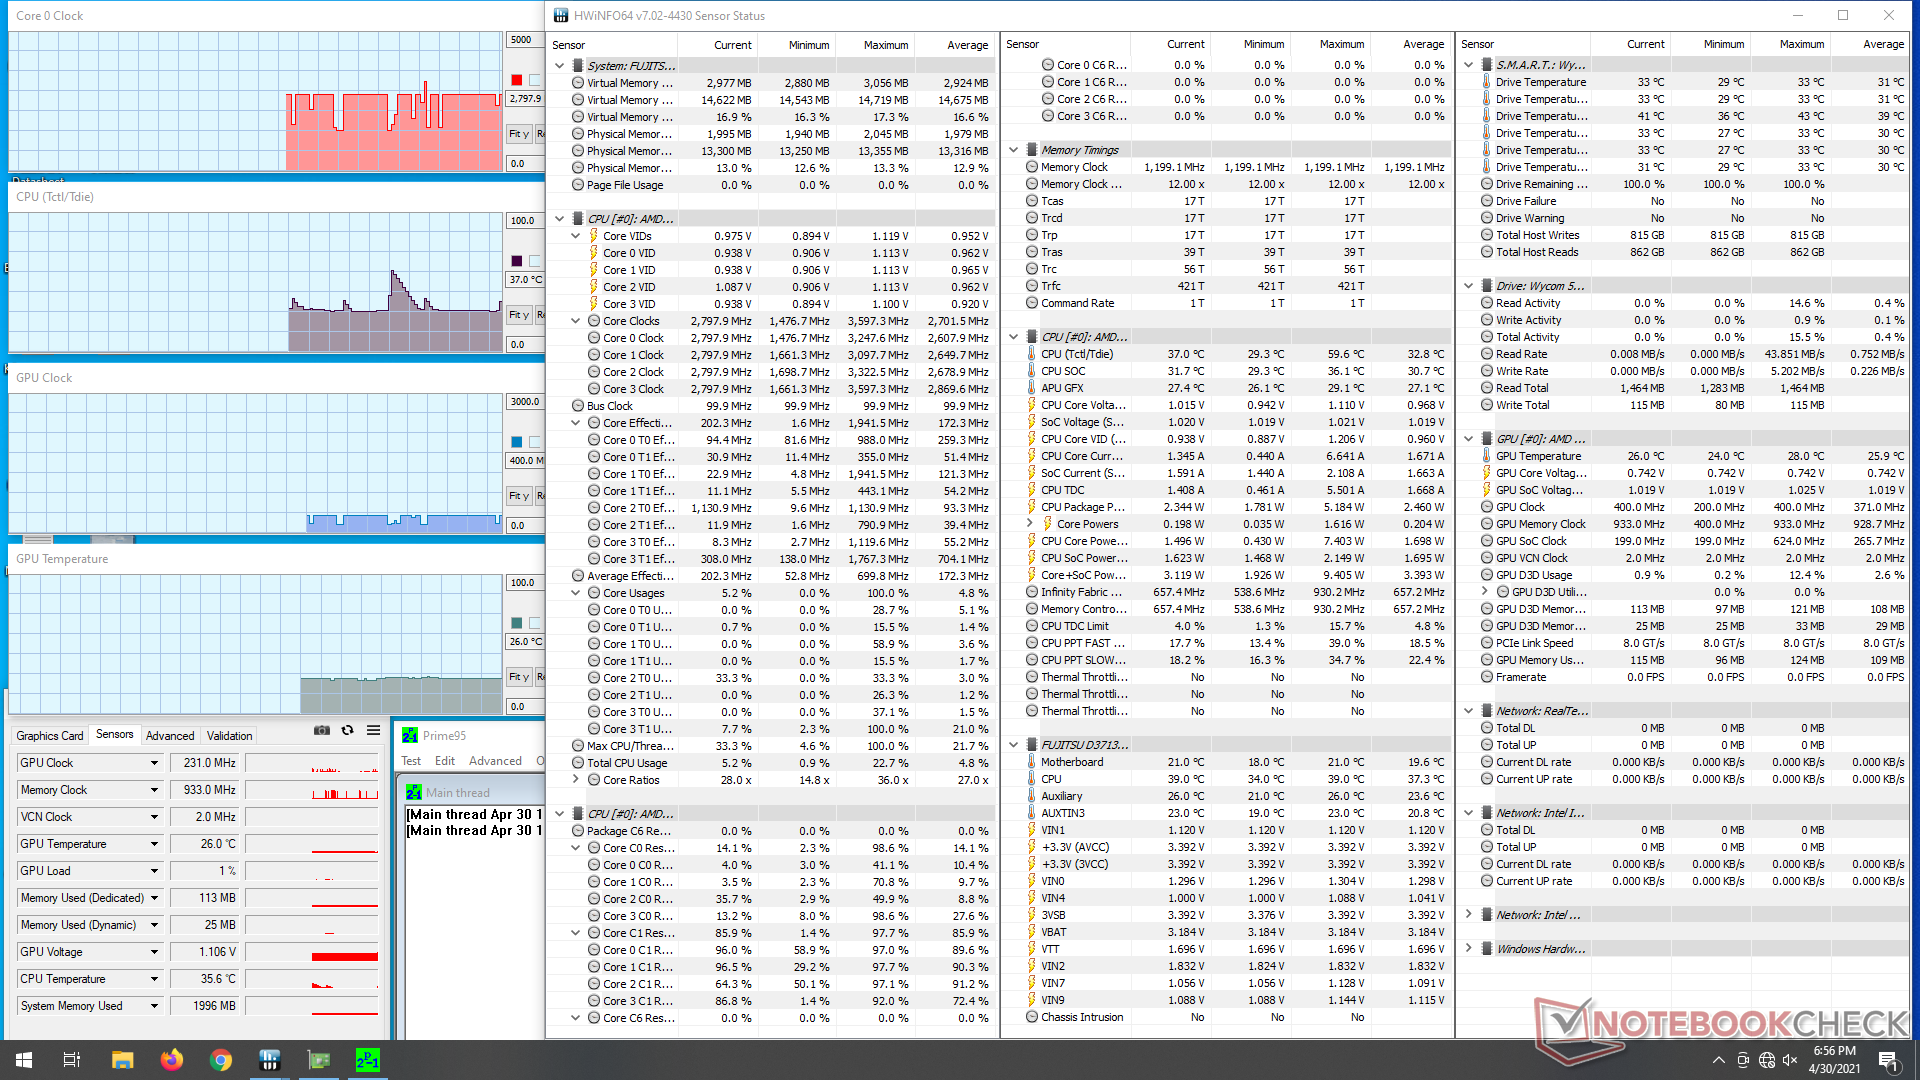
Lors de l'exécution de Prime95 pour solliciter le processeur, les fréquences d'horloge ont augmenté jusqu'à 2,9 GHz pendant quelques secondes avant de baisser légèrement et de se stabiliser à 2,8 GHz. Après environ 20 minutes, cependant, la température du cœur finit par atteindre 100 C, ce qui oblige les fréquences d'horloge à chuter beaucoup plus rapidement dans la plage de 1,8 GHz à 2,4 GHz, comme le montrent les captures d'écran ci-dessous
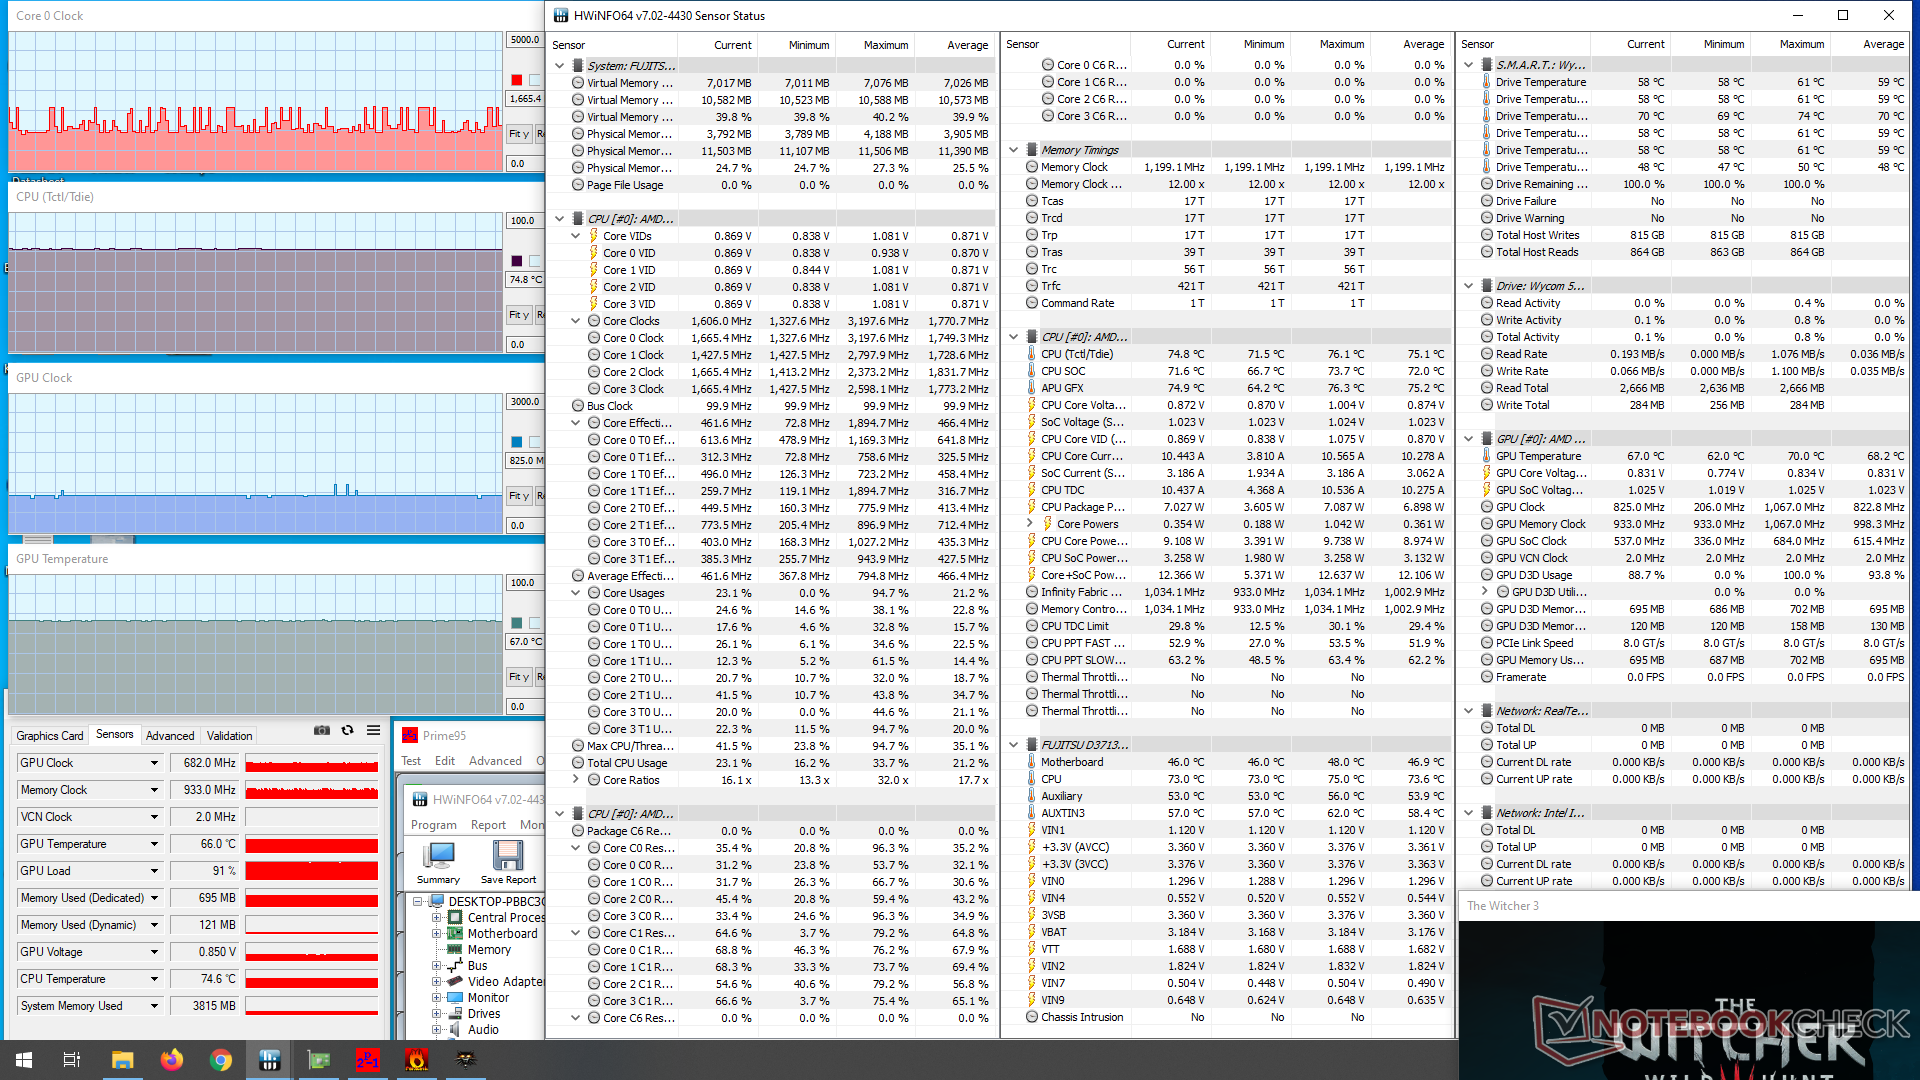
L'exécution de Witcher 3 est plus représentatif des charges du monde réel. Dans ce scénario, la température du cœur reste stable à 75 C.
| Fréquence CPU(GHz) | Fréquence GPU(MHz) | Températuremoyennedu CPU (°C) |
| Système au repos | - | - |
| Prime95 Stress | 1.8 - 2.4 | -- |
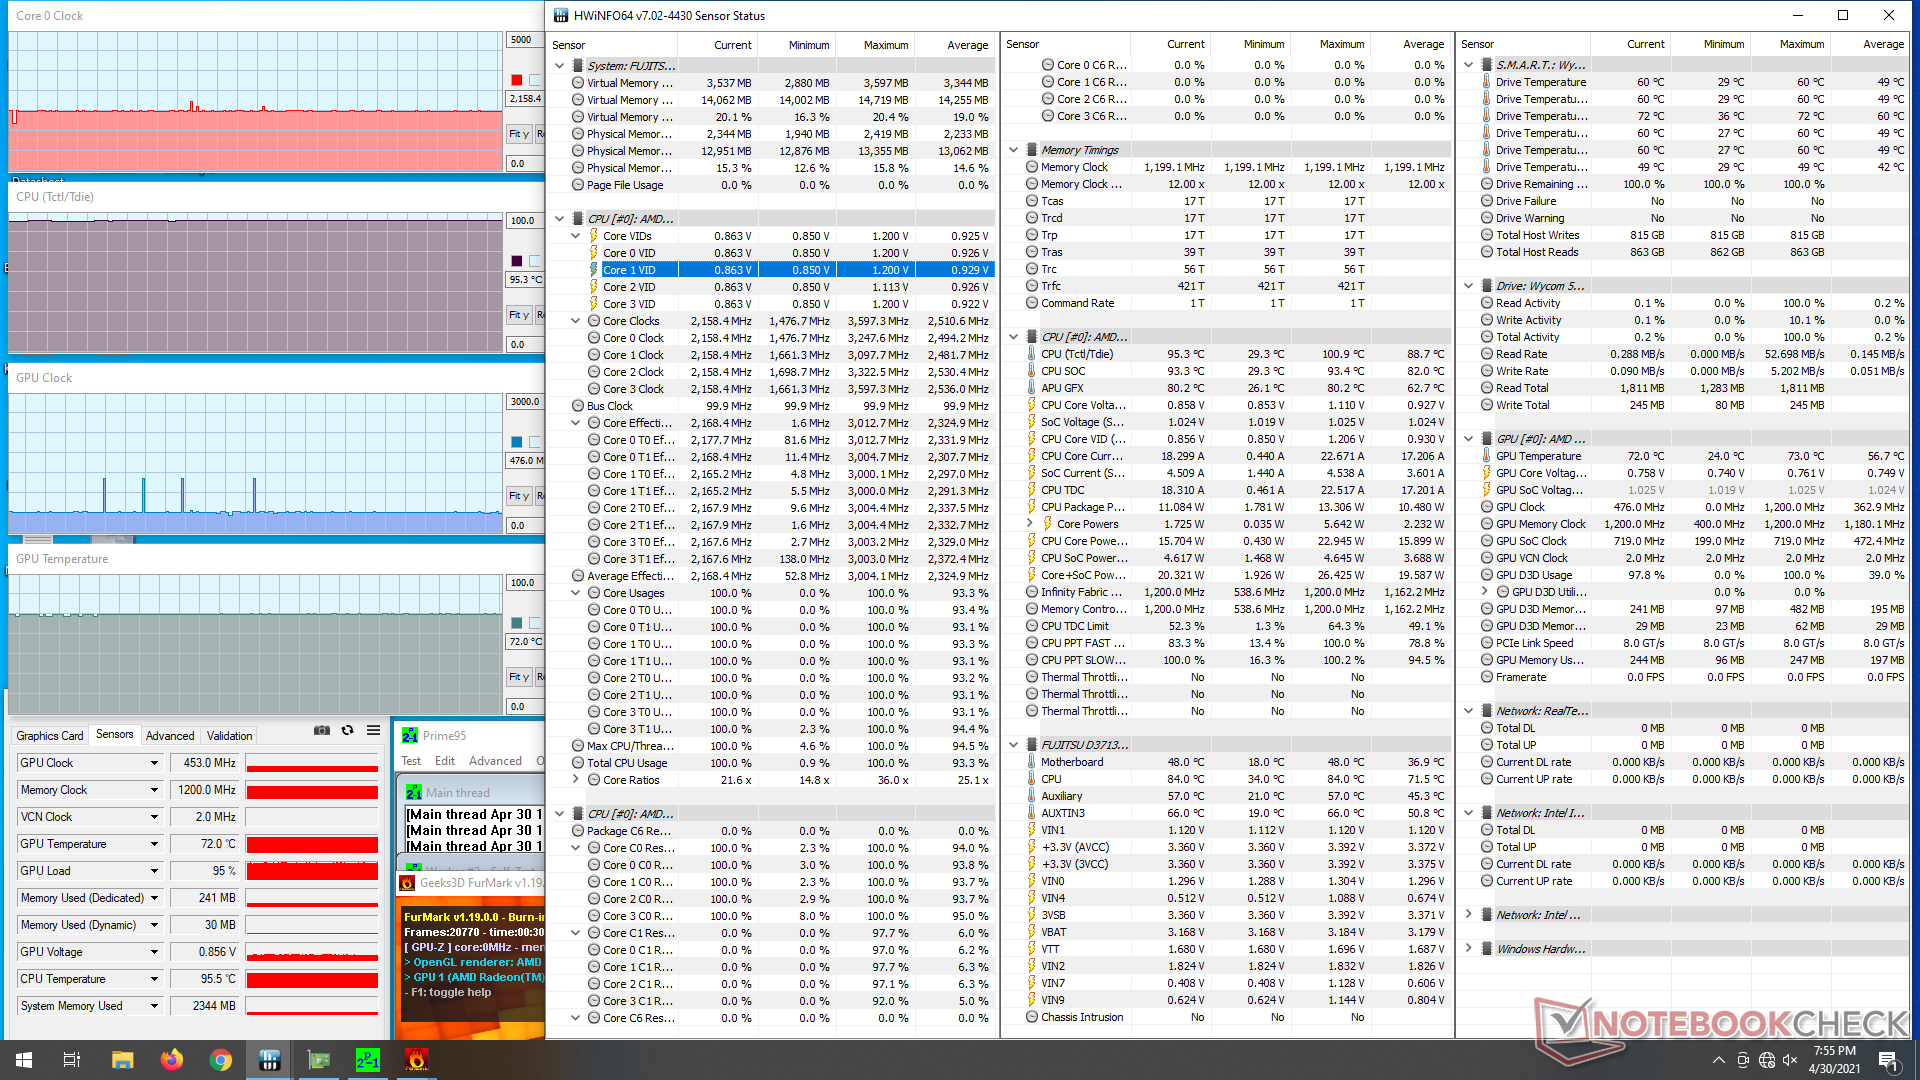
| Prime95+ FurMark Stress | 2.1 | 453 |
| Witcher 3 Stress | 1.7 - 2.1 | 682 |
Energy Management
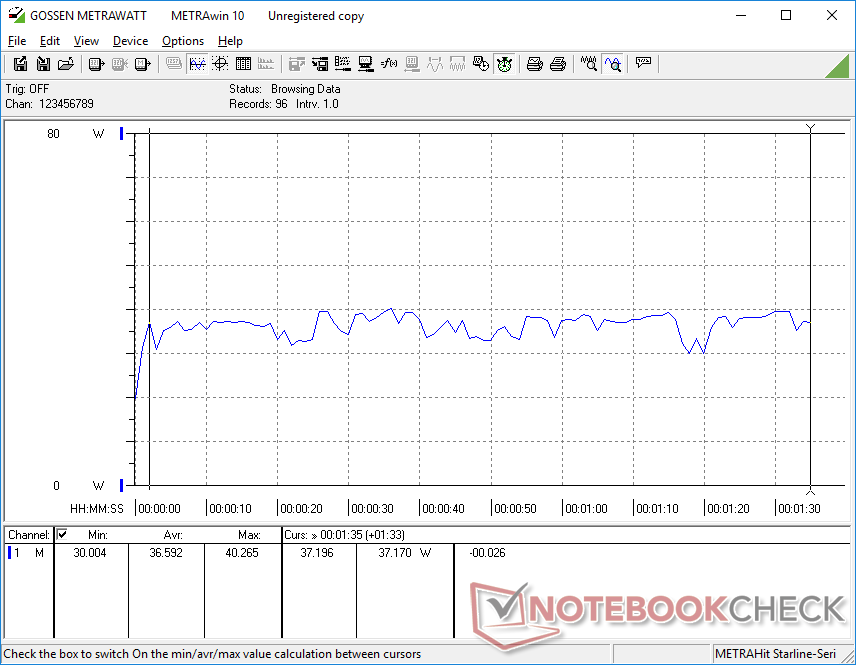
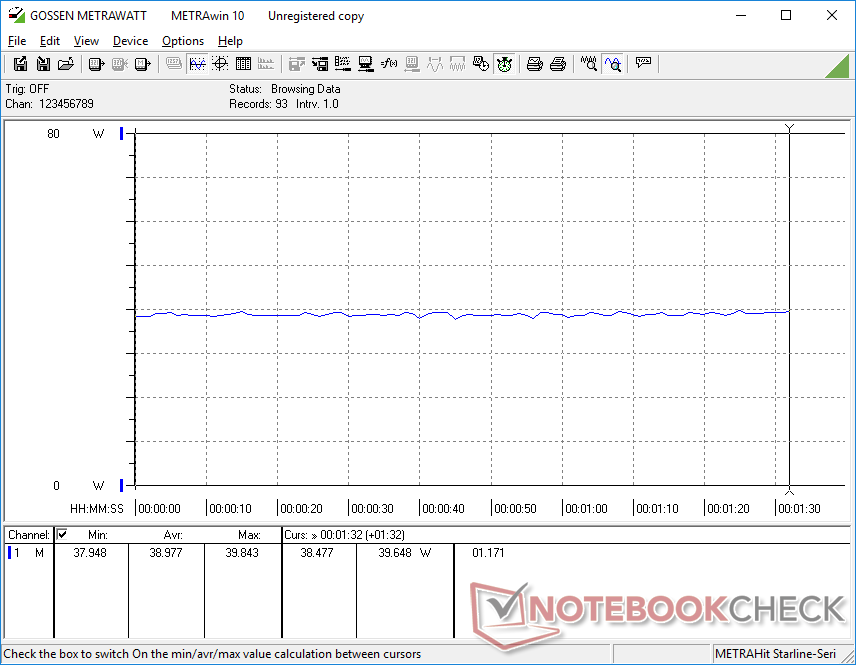
Consommation d'énergie
Le rendement par watt est légèrement inférieur à celui des mini-PC fonctionnant sur la dernière plate-forme Intel de 11e génération. La marche au ralenti sur le bureau, par exemple, consomme entre 11 et 13 W, contre à peine la moitié pour le Intel NUC11PAQi7. Les charges plus élevées, comme les jeux, consomment environ 36 à 39 W, contre 31 à 39 W sur le NUC susmentionné, même si les performances du GPU de notre PC AMD sont nettement plus faibles.
| Éteint/en veille | |
| Au repos | |
| Fortement sollicité |
|
Légende:
min: | |
| Impact Display Solutions IMP-3713-V2-16-500 Ryzen V1605B, Vega 8, , , x, | Impact Display Solutions IMP-3654-B1-R Core i9-9900T i9-9900T, UHD Graphics 630, EDGE NextGen SSD 1TB, , x, | Intel NUC11PHKi7C i7-1165G7, GeForce RTX 2060 Mobile, Samsung SSD 980 Pro 500GB MZ-V8P500BW, , x, | Intel NUC11PAQi7 i7-1165G7, Iris Xe G7 96EUs, Samsung SSD 980 Pro 500GB MZ-V8P500BW, , x, | Zotac ZBox MI643 i5-10210U, UHD Graphics 620, Lexar NM610 1TB, , x, | |
|---|---|---|---|---|---|
| Power Consumption | 8% | -143% | 19% | 14% | |
| Idle Minimum * (Watt) | 11.5 | 6.6 43% | 5.8 50% | 5.6 51% | 7.5 35% |
| Idle Average * (Watt) | 12 | 8.3 31% | 5.9 51% | 5.6 53% | 9.2 23% |
| Idle Maximum * (Watt) | 12.4 | 8.8 29% | 20.7 -67% | 6 52% | 9.6 23% |
| Load Average * (Watt) | 36.6 | 46.2 -26% | 130.8 -257% | 31.4 14% | 34.4 6% |
| Witcher 3 ultra * (Watt) | 39 | 154.4 -296% | 39 -0% | ||
| Load Maximum * (Watt) | 51.5 | 69.7 -35% | 225.2 -337% | 80.5 -56% | 60.6 -18% |
* ... Moindre est la valeur, meilleures sont les performances
Points positifs
Points négatifs
Verdict
Prime95 montre que le refroidissement passif du châssis n'est pas suffisant pour supporter pleinement les fréquences d'horloge Turbo du CPU pendant de longues périodes. Les fréquences d'horloge peuvent commencer à 2,9 GHz avant de tomber inévitablement à 1,8 GHz lorsque la température du cœur atteint inévitablement 100 C. Il semble que même un dissipateur thermique massif en aluminium ne soit pas capable de faire fonctionner le CPU ULV à des performances maximales indéfiniment. Lenovo propose son propre Mini PC sans ventilateur basé sur Intel qui est beaucoup plus petit que notre unité AMD, mais avec moins de fonctionnalités extensibles
Prix et disponibilité
Les devis sont disponibles directement auprès de Impact Components
Price comparison

